UNITED STATES
SECURITIES AND EXCHANGE COMMISSION
Washington, D.C. 20549
FORM N-CSR
CERTIFIED SHAREHOLDER REPORT OF REGISTERED
MANAGEMENT INVESTMENT COMPANIES
Investment Company Act File Number: 811-06650
Lord abbett research fund, inc.
(Exact name of Registrant as specified in charter)
90 Hudson Street, Jersey City, NJ 07302
(Address of principal executive offices) (Zip code)
Thomas R. Phillips, Esq., Vice President & Assistant Secretary
90 Hudson Street, Jersey City, NJ 07302
(Name and address of agent for service)
Registrant’s telephone number, including area code: (800) 201-6984
Date of fiscal year end: 11/30
Date of reporting period: 11/30/2013
| Item 1: | Report(s) to Shareholders. |

2 0 1 3
L O R D A B B E T T
A N N U A L
R E P O R T
Lord Abbett
Calibrated Dividend Growth Fund
For the fiscal year ended November 30, 2013
Lord Abbett Research Fund
Lord Abbett Calibrated Dividend Growth Fund
Annual Report
For the fiscal year ended November 30, 2013

Daria L. Foster, Director, President and Chief Executive Officer of the Lord Abbett Funds, and E. Thayer Bigelow, Independent Chairman of the Lord Abbett Funds.
Dear Shareholders: We are pleased to provide you with this overview of the performance of Lord Abbett Calibrated Dividend Growth Fund for the fiscal year ended November 30, 2013. On this page and the following pages, we discuss the major factors that influenced fiscal year performance. For detailed and more timely information about the Fund, please visit our Website at www.lordabbett.com, where you also can access the quarterly commentaries that provide updates on the Fund’s performance and other portfolio related updates.
Thank you for investing in Lord Abbett mutual funds. We value the trust that you place in us and look forward to serving your investment needs in the years to come.
Best regards.

Daria L. Foster
Director, President and Chief Executive Officer
For the fiscal year ended November 30, 2013, Lord Abbett Calibrated Dividend Growth Fund returned 26.09%, reflecting performance at the net asset value (NAV) of Class A shares, with all distributions reinvested, compared to its benchmark, the S&P 500® Index,1 which returned 30.30% over the same period.
Global equity markets rose during the 12-month period amid an ongoing housing recovery in the Unites States, rising corporate profits, accommodative
1
monetary policies, and economic stabilization in Europe. The equity market advance came in the face of a series of disruptive congressional showdowns, a two-week partial government shutdown, and concerns about growth in the largest emerging market economies. The Fund’s focus on dividend growth stocks, which have been less volatile than the broad market over the 10-year period ended on November 30, 2013, resulted in a portfolio with a lower risk profile than the S&P 500® Index as measured by the Fund’s portfolio beta. This positioning detracted from performance relative to the index as higher-risk stocks performed better than lower-risk stocks during the period.
The Fund’s position in International Business Machines, a global technology and business services firm, detracted from relative performance. The broad-based economic reform currently underway in China was challenging for the firm, as the reforms led to weak demand for hardware and lengthened sales cycles. Shares of Caterpiller, Inc., the world’s largest manufacturer of construction equipment, underperformed the index return as weak demand for mining equipment led to disappointing operating results. The Fund’s overweight position in Coca-Cola Co., the global leader in the carbonated soft drink market, detracted from relative performance. The stock underperformed as consumers within developed markets have been shifting away from carbonated beverages in favor of healthier alternatives.
Shares of 3M Co., a diversified industrial and technology company, outperformed the index return during the period and contributed to relative performance. Management’s strategic investments in research and development have led to improvements in organic growth, particularly within emerging economies. The Fund’s overweight position in Walgreen Co., which operates pharmacies under the Walgreen, Duane Reade, and drugstore.com brands, contributed to relative performance during the period. Walgreen’s sales exceeded expectations during the period, and investors reacted positively to a partnership with a large drug wholesaler. The Fund’s position in defense contractor Lockheed Martin Corp. also contributed to relative performance. Despite military budget cuts, the firm’s missile and fire control unit generated better-than-expected sales, and the firm continued to return capital to shareholders with share buybacks and dividend increases.
The Fund’s portfolio is actively managed and, therefore, its holdings and the weightings of a particular issuer or particular sector as a percentage of portfolio assets are subject to change. Sectors may include many industries.
2
1 The S&P 500® Index is widely regarded as the standard for measuring large cap U.S. stock market performance and includes a representative sample of leading companies in leading industries.
Unless otherwise specified, indexes reflect total return, with all dividends reinvested. Indexes are unmanaged, do not reflect the deduction of fees or expenses, and are not available for direct investment.
Important Performance and Other Information
Performance data quoted in the following pages reflect past performance and are no guarantee of future results. Current performance may be higher or lower than the performance quoted. The investment return and principal value of an investment in the Fund will fluctuate so that shares, on any given day or when redeemed, may be worth more or less than their original cost. You can obtain performance data current to the most recent month end by calling Lord Abbett at 888-522-2388 or referring to www.lordabbett.com.
Except where noted, comparative Fund performance does not account for the deduction of sales charges and would be different if sales charges were included. The Fund offers classes of shares with distinct pricing options. For a full description of the differences in pricing alternatives, please see the Fund’s prospectus.
During certain periods shown, expense waivers and reimbursements were in place. Without such expense waivers and reimbursements, the Fund’s returns would have been lower.
The annual commentary above discusses the views of the Fund’s management and various portfolio holdings of the Fund as of November 30, 2013. These views and portfolio holdings may have changed after this date. Information provided in the commentary is not a recommendation to buy or sell securities. Because the Fund’s portfolio is actively managed and may change significantly, the Fund may no longer own the securities described above or may have otherwise changed its positions in the securities. For more recent information about the Fund’s portfolio holdings, please visit www.lordabbett.com.
A Note about Risk: See Notes to Financial Statements for a discussion of investment risks. For a more detailed discussion of the risks associated with the Fund, please see the Fund’s prospectus.
Mutual funds are not insured by the FDIC, are not deposits or other obligations of, or guaranteed by, banks, and are subject to investment risks including possible loss of principal amount invested.
3
Investment Comparison
Below is a comparison of a $10,000 investment in Class A shares with the same investment in both the S&P 500® Index and the S&P 900® 10-Year Dividend Growth Index, assuming reinvestment of all dividends and distributions. The performance of other classes will be greater than or less than the performance shown in the graph below due to different sales loads and expenses applicable to such classes. The graph and performance table below do not reflect the deduction of taxes that a shareholder would pay on Fund distributions or the redemption of Fund shares. During certain periods, expenses of the Fund have been waived or reimbursed by Lord Abbett; without such waiver or reimbursement of expenses, the Fund’s returns would have been lower. Past performance is no guarantee of future results.
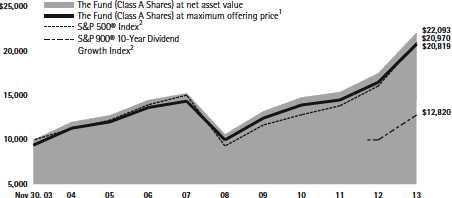
The S&P 900 10-Year Dividend Growth Index is a custom index that, along with changes in the Fund’s investment strategy, the Fund began disclosing in its prospectus effective September 27, 2012. The graph shows the index’s performance from that date.
Average Annual Total Returns at Maximum Applicable
Sales Charge for the Periods Ended November 30, 2013
| | | | 1 Year | | 5 Years | | 10 Years | | Life of
Class |
| Class A3 | | | | 18.86 | % | | | 14.41 | % | | | 7.61 | % | | | — | |
| Class B4 | | | | 20.14 | % | | | 14.77 | % | | | 7.69 | % | | | — | |
| Class C5 | | | | 24.14 | % | | | 15.02 | % | | | 7.54 | % | | | — | |
| Class F6 | | | | 26.31 | % | | | 16.07 | % | | | — | | | | 5.99 | % |
| Class I7 | | | | 26.41 | % | | | 16.17 | % | | | 8.61 | % | | | — | |
| Class P8 | | | | 25.81 | % | | | 15.64 | % | | | 8.13 | % | | | — | |
| Class R29 | | | | 25.64 | % | | | 15.51 | % | | | — | | | | 5.59 | % |
| Class R310 | | | | 25.79 | % | | | 15.60 | % | | | — | | | | 5.57 | % |
1 Reflects the deduction of the maximum initial sales charge of 5.75%.
2 Performance for each unmanaged index does not reflect any fees or expenses. The performance of each index is not necessarily representative of the Fund’s performance.
3 Total return, which is the percentage change in net asset value, after deduction of the maximum initial sales charge of 5.75% applicable to Class A shares, with all dividends and distributions reinvested for the periods shown ended November 30, 2013, is calculated using the SEC-required uniform method to compute such return.
4 Performance reflects the deduction of a CDSC of 5% for 1 year, 2% for 5 years and 0% for 10 years. Class B shares automatically convert to Class A shares after approximately 8 years. (There is no initial sales charge for automatic conversions.)
5 The 1% CDSC for Class C shares normally applies before the first anniversary of the purchase date. Performance for other periods is at net asset value.
6 Class F shares commenced operations and performance for the Class began on September 28, 2007. Performance is at net asset value.
7 Performance is at net asset value.
8 Performance is at net asset value.
9 Class R2 shares commenced operations and performance for the Class began on September 28, 2007. Performance is at net asset value.
10 Class R3 shares commenced operations and performance for the Class began on September 28, 2007. Performance is at net asset value.
4
Expense Example
As a shareholder of the Fund, you incur two types of costs: (1) transaction costs, including sales charges (loads) on purchase payments (these charges vary among the share classes); and (2) ongoing costs, including management fees; distribution and service (12b-1) fees (these charges vary among the share classes); and other Fund expenses. This Example is intended to help you understand your ongoing costs (in dollars) of investing in the Fund and to compare these costs with the ongoing costs of investing in other mutual funds.
The Example is based on an investment of $1,000 invested at the beginning of the period and held for the entire period (June 1, 2013 through November 30, 2013).
Actual Expenses
For each class of the Fund, the first line of the table on the following page provides information about actual account values and actual expenses. You may use the information in this line, together with the amount you invested, to estimate the expenses that you paid over the period. Simply divide your account value by $1,000 (for example, an $8,600 account value divided by $1,000 = 8.6), then multiply the result by the number in the first line under the heading titled “Expenses Paid During Period 6/1/13 – 11/30/13” to estimate the expenses you paid on your account during this period.
Hypothetical Example for Comparison Purposes
For each class of the Fund, the second line of the table on the following page provides information about hypothetical account values and hypothetical expenses based on the Fund’s actual expense ratio and an assumed rate of return of 5% per year before expenses, which is not the Fund’s actual return. The hypothetical account values and expenses may not be used to estimate the actual ending account balance or expenses you paid for the period. You may use this information to compare the ongoing costs of investing in the Fund and other funds. To do so, compare this 5% hypothetical example with the 5% hypothetical examples that appear in the shareholder reports of the other funds.
5
Please note that the expenses shown in the table are meant to highlight your ongoing costs only and do not reflect any transactional costs, such as sales charges (loads). Therefore, the second line of the table is useful in comparing ongoing costs only, and will not help you determine the relative total costs of owning different funds. In addition, if these transactional costs were included, your costs would have been higher.
| | | Beginning
Account
Value | | Ending
Account
Value | | Expenses
Paid During
Period† |
| | | 6/1/13 | | 11/30/13 | | 6/1/13 -
11/30/13 |
| Class A | | | | | | | | | | | | |
| Actual | | $ | 1,000.00 | | | $ | 1,113.80 | | | $ | 4.50 | |
| Hypothetical (5% Return Before Expenses) | | $ | 1,000.00 | | | $ | 1,020.81 | | | $ | 4.31 | |
| Class B | | | | | | | | | | | | |
| Actual | | $ | 1,000.00 | | | $ | 1,109.50 | | | $ | 8.46 | |
| Hypothetical (5% Return Before Expenses) | | $ | 1,000.00 | | | $ | 1,017.04 | | | $ | 8.09 | |
| Class C | | | | | | | | | | | | |
| Actual | | $ | 1,000.00 | | | $ | 1,109.80 | | | $ | 8.46 | |
| Hypothetical (5% Return Before Expenses) | | $ | 1,000.00 | | | $ | 1,017.09 | | | $ | 8.09 | |
| Class F | | | | | | | | | | | | |
| Actual | | $ | 1,000.00 | | | $ | 1,114.80 | | | $ | 3.71 | |
| Hypothetical (5% Return Before Expenses) | | $ | 1,000.00 | | | $ | 1,021.57 | | | $ | 3.55 | |
| Class I | | | | | | | | | | | | |
| Actual | | $ | 1,000.00 | | | $ | 1,115.30 | | | $ | 3.18 | |
| Hypothetical (5% Return Before Expenses) | | $ | 1,000.00 | | | $ | 1,022.07 | | | $ | 3.04 | |
| Class P | | | | | | | | | | | | |
| Actual | | $ | 1,000.00 | | | $ | 1,113.00 | | | $ | 5.56 | |
| Hypothetical (5% Return Before Expenses) | | $ | 1,000.00 | | | $ | 1,019.80 | | | $ | 5.32 | |
| Class R2 | | | | | | | | | | | | |
| Actual | | $ | 1,000.00 | | | $ | 1,112.00 | | | $ | 6.35 | |
| Hypothetical (5% Return Before Expenses) | | $ | 1,000.00 | | | $ | 1,019.06 | | | $ | 6.07 | |
| Class R3 | | | | | | | | | | | | |
| Actual | | $ | 1,000.00 | | | $ | 1,112.10 | | | $ | 5.82 | |
| Hypothetical (5% Return Before Expenses) | | $ | 1,000.00 | | | $ | 1,019.58 | | | $ | 5.57 | |
| † | For each class of the Fund, net expenses are equal to the annualized expense ratio for such class (0.85% for Class A, 1.60% for Classes B and C, 0.70% for Class F, 0.60% for Class I, 1.05% for Class P, 1.20% for Class R2 and 1.10% for Class R3) multiplied by the average account value over the period, multiplied by 183/365 (to reflect one-half year period). |
Portfolio Holdings Presented by Sector
November 30, 2013
| Sector* | | %** |
| Consumer Discretionary | | | 13.12 | % |
| Consumer Staples | | | 19.88 | % |
| Energy | | | 10.25 | % |
| Financials | | | 6.43 | % |
| Health Care | | | 10.76 | % |
| Industrials | | | 19.74 | % |
| Sector* | | %** |
| Information Technology | | | 4.98 | % |
| Materials | | | 8.03 | % |
| Telecommunication Services | | | 1.77 | % |
| Utilities | | | 4.57 | % |
| Repurchase Agreement | | | 0.47 | % |
| Total | | | 100.00 | % |
* A sector may comprise several industries.
** Represents percent of total investments.
6
Schedule of Investments
November 30, 2013
| Investments | | Shares | | Fair
Value
(000) | |
| COMMON STOCKS 99.29% | | | | | |
| | | | | | |
| Aerospace & Defense 5.69% | | | | | |
| Lockheed Martin Corp. | | 219,061 | | $ | 31,035 | |
| United Technologies Corp. | | 787,300 | | | 87,280 | |
| Total | | | | | 118,315 | |
| | | | | | | |
| Air Freight & Logistics 1.40% | | | | | | |
| C.H. Robinson Worldwide, Inc. | | 373,064 | | | 21,873 | |
| FedEx Corp. | | 52,035 | | | 7,217 | |
| Total | | | | | 29,090 | |
| | | | | | | |
| Beverages 5.89% | | | | | | |
| Coca-Cola Co. (The) | | 1,688,379 | | | 67,856 | |
| PepsiCo, Inc. | | 645,902 | | | 54,553 | |
| Total | | | | | 122,409 | |
| | | | | | | |
| Capital Markets 2.03% | | | | | | |
| Eaton Vance Corp. | | 239,202 | | | 10,001 | |
| Franklin Resources, Inc. | | 526,957 | | | 29,188 | |
| SEI Investments Co. | | 90,279 | | | 3,032 | |
| Total | | | | | 42,221 | |
| | | | | | | |
| Chemicals 7.77% | | | | | | |
| Albemarle Corp. | | 161,842 | | | 11,120 | |
| International Flavors & Fragrances, Inc. | | 77,900 | | | 6,882 | |
| Monsanto Co. | | 537,749 | | | 60,943 | |
| PPG Industries, Inc. | | 168,468 | | | 31,008 | |
| Praxair, Inc. | | 233,937 | | | 29,537 | |
| RPM International, Inc. | | 168,159 | | | 6,659 | |
| Sherwin-Williams Co. (The) | | 64,600 | | | 11,824 | |
| Valspar Corp. (The) | | 50,766 | | | 3,585 | |
| Total | | | | | 161,558 | |
| | | | | | | |
| Commercial Banks 0.11% | | | | | | |
| Commerce Bancshares, Inc. | | 49,264 | | | 2,223 | |
| | | | | | | |
| Commercial Services & Supplies 0.17% | | | | | | |
| Cintas Corp. | | 64,596 | | | 3,585 | |
| Investments | | Shares | | Fair
Value
(000) | |
| Communications Equipment 0.97% | | | | | |
| Harris Corp. | | 67,900 | | $ | 4,380 | |
| QUALCOMM, Inc. | | 215,926 | | | 15,888 | |
| Total | | | | | 20,268 | |
| | | | | | | |
| Containers & Packaging 0.25% | | | | | | |
| AptarGroup, Inc. | | 40,868 | | | 2,653 | |
| Bemis Co., Inc. | | 63,211 | | | 2,467 | |
| Total | | | | | 5,120 | |
| | | | | | | |
| Distributors 0.40% | | | | | | |
| Genuine Parts Co. | | 100,000 | | | 8,284 | |
| | | | | | | |
| Diversified Financial Services 0.46% | | | | | | |
| McGraw Hill Financial, Inc. | | 129,194 | | | 9,625 | |
| | | | | | | |
| Diversified Telecommunication Services 1.66% | | | | | | |
| AT&T, Inc. | | 981,764 | | | 34,568 | |
| | | | | | | |
| Electric: Utilities 3.45% | | | | | | |
| NextEra Energy, Inc. | | 184,967 | | | 15,646 | |
| Northeast Utilities | | 301,622 | | | 12,391 | |
| PPL Corp. | | 558,569 | | | 17,154 | |
| Southern Co. (The) | | 656,022 | | | 26,654 | |
| Total | | | | | 71,845 | |
| | | | | | | |
| Electrical Equipment 1.48% | | | | | | |
| Emerson Electric Co. | | 458,488 | | | 30,714 | |
| | | | | | | |
| Energy Equipment & Services 0.33% | | | | | | |
| Helmerich & Payne, Inc. | | 88,108 | | | 6,784 | |
| | | | | | | |
| Food & Staples Retailing 5.07% | | | | | | |
| Wal-Mart Stores, Inc. | | 997,571 | | | 80,813 | |
| Walgreen Co. | | 414,819 | | | 24,558 | |
| Total | | | | | 105,371 | |
| | | | | | | |
| Food Products 1.44% | | | | | | |
| Bunge Ltd. | | 199,471 | | | 15,982 | |
| Flowers Foods, Inc. | | 201,500 | | | 4,378 | |
| Hormel Foods Corp. | | 84,843 | | | 3,820 | |
| McCormick & Co., Inc. | | 84,800 | | | 5,851 | |
| Total | | | | | 30,031 | |
| | See Notes to Financial Statements. | 7 |
Schedule of Investments (continued)
November 30, 2013
| Investments | | Shares | | Fair
Value
(000) | |
| Gas Utilities 0.40% | | | | | |
| National Fuel Gas Co. | | 52,641 | | $ | 3,552 | |
| UGI Corp. | | 117,800 | | | 4,743 | |
| Total | | | | | 8,295 | |
| | | | | | | |
| Health Care Equipment & Supplies 4.29% | | | | | | |
| Becton, Dickinson & Co. | | 212,780 | | | 23,106 | |
| C.R. Bard, Inc. | | 142,097 | | | 19,734 | |
| Medtronic, Inc. | | 494,703 | | | 28,356 | |
| Stryker Corp. | | 242,700 | | | 18,062 | |
| Total | | | | | 89,258 | |
| | | | | | | |
| Health Care Providers & Services 1.15% | | | | | | |
| Cardinal Health, Inc. | | 369,252 | | | 23,854 | |
| | | | | | | |
| Hotels, Restaurants & Leisure 3.64% | | | | | | |
| McDonald’s Corp. | | 777,126 | | | 75,669 | |
| | | | | | | |
| Household Durables 0.13% | | | | | | |
| Leggett & Platt, Inc. | | 87,633 | | | 2,647 | |
| | | | | | | |
| Household Products 6.44% | | | | | | |
| Colgate-Palmolive Co. | | 926,048 | | | 60,943 | |
| Kimberly-Clark Corp. | | 466,215 | | | 50,892 | |
| Procter & Gamble Co. (The) | | 260,977 | | | 21,980 | |
| Total | | | | | 133,815 | |
| | | | | | | |
| Industrial Conglomerates 4.15% | | | | | | |
| 3M Co. | | 624,410 | | | 83,365 | |
| Carlisle Cos., Inc. | | 39,625 | | | 2,913 | |
| Total | | | | | 86,278 | |
| | | | | | | |
| Information Technology Services 3.49% | | | | | | |
| Automatic Data Processing, Inc. | | 62,166 | | | 4,975 | |
| International Business | | | | | | |
| Machines Corp. | | 376,750 | | | 67,694 | |
| Total | | | | | 72,669 | |
| | | | | | | |
| Insurance 4.13% | | | | | | |
| ACE Ltd. (Switzerland)(a) | | 377,221 | | | 38,771 | |
| Aflac, Inc. | | 487,465 | | | 32,353 | |
| Brown & Brown, Inc. | | 72,600 | | | 2,296 | |
| Chubb Corp. (The) | | 48,100 | | | 4,639 | |
| Investments | | Shares | | Fair
Value
(000) | |
| Cincinnati Financial Corp. | | 39,575 | | $ | 2,074 | |
| HCC Insurance Holdings, Inc. | | 62,035 | | | 2,852 | |
| W.R. Berkley Corp. | | 68,278 | | | 2,990 | |
| Total | | | | | 85,975 | |
| | | | | | | |
| Leisure Equipment & Products 0.29% | | | | | | |
| Polaris Industries, Inc. | | 45,609 | | | 6,087 | |
| | | | | | | |
| Machinery 5.48% | | | | | | |
| Caterpillar, Inc. | | 657,205 | | | 55,599 | |
| CLARCOR, Inc. | | 35,070 | | | 2,123 | |
| Donaldson Co., Inc. | | 84,968 | | | 3,546 | |
| Dover Corp. | | 26,100 | | | 2,368 | |
| Graco, Inc. | | 47,931 | | | 3,702 | |
| Illinois Tool Works, Inc. | | 162,688 | | | 12,947 | |
| Lincoln Electric Holdings, Inc. | | 56,531 | | | 4,041 | |
| Nordson Corp. | | 58,094 | | | 4,190 | |
| Stanley Black & Decker, Inc. | | 171,000 | | | 13,917 | |
| Valmont Industries, Inc. | | 79,600 | | | 11,519 | |
| Total | | | | | 113,952 | |
| | | | | | | |
| Multi-Line Retail 1.99% | | | | | | |
| Family Dollar Stores, Inc. | | 324,719 | | | 22,656 | |
| Target Corp. | | 293,672 | | | 18,774 | |
| Total | | | | | 41,430 | |
| | | | | | | |
| Multi-Utilities 0.58% | | | | | | |
| MDU Resources Group, Inc. | | 118,585 | | | 3,518 | |
| SCANA Corp. | | 180,751 | | | 8,526 | |
| Total | | | | | 12,044 | |
| | | | | | | |
| Oil, Gas & Consumable Fuels 9.90% | | | | | | |
| Chevron Corp. | | 294,562 | | | 36,066 | |
| Energen Corp. | | 39,100 | | | 2,822 | |
| EOG Resources, Inc. | | 179,317 | | | 29,587 | |
| Exxon Mobil Corp. | | 404,083 | | | 37,774 | |
| Murphy Oil Corp. | | 283,282 | | | 18,393 | |
| Occidental Petroleum Corp. | | 855,197 | | | 81,210 | |
| Total | | | | | 205,852 | |
| 8 | See Notes to Financial Statements. | |
Schedule of Investments (continued)
November 30, 2013
| Investments | | Shares | | Fair
Value
(000) | |
| Pharmaceuticals 5.29% | | | | | |
| AbbVie, Inc. | | 1,317,907 | | $ | 63,852 | |
| Johnson & Johnson | | 488,123 | | | 46,206 | |
| Total | | | | | 110,058 | |
| | | | | | | |
| Road & Rail 0.87% | | | | | | |
| Norfolk Southern Corp. | | 207,518 | | | 18,197 | |
| | | | | | | |
| Semiconductors & Semiconductor Equipment 0.36% | | | | | | |
| Linear Technology Corp. | | 57,287 | | | 2,437 | |
| Microchip Technology, Inc. | | 115,867 | | | 5,016 | |
| Total | | | | | 7,453 | |
| | | | | | | |
| Software 0.14% | | | | | | |
| FactSet Research Systems, | | | | | | |
| Inc. | | 24,960 | | | 2,821 | |
| | | | | | | |
| Specialty Retail 3.44% | | | | | | |
| Lowe’s Cos., Inc. | | 462,575 | | | 21,963 | |
| Ross Stores, Inc. | | 344,844 | | | 26,367 | |
| TJX Cos., Inc. (The) | | 370,105 | | | 23,272 | |
| Total | | | | | 71,602 | |
| | | | | | | |
| Textiles, Apparel & Luxury Goods 2.06% | | | | | | |
| NIKE, Inc. Class B | | 236,110 | | | 18,686 | |
| VF Corp. | | 103,016 | | | 24,165 | |
| Total | | | | | 42,851 | |
| | | | | | | |
| Thrifts & Mortgage Finance 0.15% | | | | | | |
| People’s United Financial, Inc. | | 199,854 | | | 3,026 | |
| | | | | | | |
| Tobacco 1.00% | | | | | | |
| Altria Group, Inc. | | 561,915 | | | 20,780 | |
| Investments | | Shares | | Fair
Value
(000) | |
| Trading Companies & Distributors 1.12% | | | | | |
| W.W. Grainger, Inc. | | 74,341 | | $ | 19,174 | |
| Watsco, Inc. | | 43,736 | | | 4,197 | |
| Total | | | | | 23,371 | |
| | | | | | | |
| Water Utilities 0.13% | | | | | | |
| Aqua America, Inc. | | 108,811 | | | 2,619 | |
| | | | | | | |
| Wireless Telecommunication Services 0.10% | | | | | | |
| Telephone & Data Systems, Inc. | | 73,621 | | | 2,047 | |
| Total Common Stocks | | | | | | |
| (cost $1,784,240,433) | | | | | 2,064,661 | |
| | | | | | | |
| | | Principal
Amount
(000) | | | | |
| SHORT-TERM INVESTMENT 0.47% | | | | | | |
| | | | | | | |
| Repurchase Agreement | | | | | | |
Repurchase Agreement
dated 11/29/2013, Zero
Coupon due 12/2/2013
with Fixed Income Clearing
Corp. collateralized by
$9,495,000 of Federal Home
Loan Bank at 5.25% due
6/18/2014; value: $9,981,619;
proceeds: $9,782,749
(cost $9,782,749) |
|
$9,783 |
|
|
9,783 |
|
Total Investments in Securities 99.76%
(cost $1,794,023,182) | | | | | 2,074,444 | |
| Cash and Other Assets in Excess of Liabilities(b) 0.24% | | | | | 4,901 | |
| Net Assets 100.00% | | | | $ | 2,079,345 | |
| (a) | | Foreign security traded in U.S. dollars. |
| (b) | | Cash and Other Assets in Excess of Liabilities include net unrealized appreciation on futures contracts as follows on the next page: |
| | See Notes to Financial Statements. | 9 |
Schedule of Investments (concluded)
November 30, 2013
Open Futures Contracts at November 30, 2013:
| Type | | Expiration | | Contracts | | Position | | | Fair Value | | | Unrealized
Appreciation | |
| E-Mini S&P 500 Index | | December 2013 | | 91 | | Long | | | $8,208,655 | | | $385,663 | |
| | | | | | | | | | | | | | |
The following is a summary of the inputs used as of November 30, 2013 in valuing the Fund’s investments carried at fair value(1):
| Investment Type(2)(3) | | Level 1
(000) | | | Level 2
(000) | | | Level 3
(000) | | | Total
(000) | |
| Common Stocks | | $ | 2,064,661 | | | $ | — | | | | $– | | | $ | 2,064,661 | |
| Repurchase Agreement | | | — | | | | 9,783 | | | | — | | | | 9,783 | |
| Total | | $ | 2,064,661 | | | $ | 9,783 | | | | $– | | | $ | 2,074,444 | |
| | | | | | | | | | | | | | | | | |
| Other Financial Instruments | | | | | | | | | | | | | | | | |
| Futures Contracts | | | | | | | | | | | | | | | | |
| Assets | | $ | 386 | | | $ | — | | | | $– | | | $ | 386 | |
| Liabilities | | | — | | | | — | | | | — | | | | — | |
| Total | | $ | 386 | | | $ | — | | | | $– | | | $ | 386 | |
| (1) | | Refer to note 2(i) for a description of fair value measurements and the three-tier hierarchy of inputs. |
| (2) | | See Schedule of Investments for fair values in each industry and identification of foreign issuers and/or geography. |
| (3) | | There were no level transfers during the fiscal year ended November 30, 2013. |
| 10 | See Notes to Financial Statements. | |
This page is intentionally left blank.
Statement of Assets and Liabilities
November 30, 2013
| ASSETS: | | | |
| Investments in securities, at fair value (cost $1,794,023,182) | | $ | 2,074,444,024 | |
| Deposits with brokers for futures collateral | | | 373,100 | |
| Receivables: | | | | |
| Investment securities sold | | | 26,682,074 | |
| Dividends | | | 5,570,493 | |
| Capital shares sold | | | 2,784,398 | |
| From advisor (See Note 3) | | | 405,020 | |
| Prepaid expenses and other assets | | | 92,635 | |
| Total assets | | | 2,110,351,744 | |
| LIABILITIES: | | | | |
| Payables: | | | | |
| Investment securities purchased | | | 25,863,372 | |
| Capital shares reacquired | | | 2,746,571 | |
| Management fee | | | 1,085,101 | |
| 12b-1 distribution fees | | | 591,027 | |
| Directors’ fees | | | 273,475 | |
| Fund administration | | | 68,196 | |
| Variation margin | | | 944 | |
| Accrued expenses | | | 377,637 | |
| Total liabilities | | | 31,006,323 | |
| Net Assets | | $ | 2,079,345,421 | |
| COMPOSITION OF NET ASSETS: | | | | |
| Paid-in capital | | $ | 1,751,013,657 | |
| Undistributed net investment income | | | 3,535,370 | |
| Accumulated net realized gain on investments, futures contracts and foreign currency related transactions | | | 43,989,090 | |
| Net unrealized appreciation on investments, futures contracts and translation of assets and liabilities denominated in foreign currencies | | | 280,807,304 | |
| Net Assets | | $ | 2,079,345,421 | |
| 12 | See Notes to Financial Statements. | |
Statement of Assets and Liabilities (concluded)
November 30, 2013
| Net assets by class: | | | | |
| Class A Shares | | $ | 1,646,617,147 | |
| Class B Shares | | $ | 43,235,159 | |
| Class C Shares | | $ | 232,350,196 | |
| Class F Shares | | $ | 96,398,378 | |
| Class I Shares | | $ | 34,361,005 | |
| Class P Shares | | $ | 2,355,292 | |
| Class R2 Shares | | $ | 2,441,551 | |
| Class R3 Shares | | $ | 21,586,693 | |
| Outstanding shares by class: | | | | |
| Class A Shares (300 million shares of common stock authorized, $.001 par value) | | | 105,773,343 | |
| Class B Shares (30 million shares of common stock authorized, $.001 par value) | | | 2,800,461 | |
| Class C Shares (20 million shares of common stock authorized, $.001 par value) | | | 15,049,512 | |
| Class F Shares (30 million shares of common stock authorized, $.001 par value) | | | 6,196,125 | |
| Class I Shares (100 million shares of common stock authorized, $.001 par value) | | | 2,194,289 | |
| Class P Shares (20 million shares of common stock authorized, $.001 par value) | | | 150,814 | |
| Class R2 Shares (30 million shares of common stock authorized, $.001 par value) | | | 156,033 | |
| Class R3 Shares (30 million shares of common stock authorized, $.001 par value) | | | 1,390,968 | |
Net asset value, offering and redemption price per share
(Net assets divided by outstanding shares): | | | | |
| Class A Shares-Net asset value | | | $15.57 | |
Class A Shares-Maximum offering price
(Net asset value plus sales charge of 5.75%) | | | $16.52 | |
| Class B Shares-Net asset value | | | $15.44 | |
| Class C Shares-Net asset value | | | $15.44 | |
| Class F Shares-Net asset value | | | $15.56 | |
| Class I Shares-Net asset value | | | $15.66 | |
| Class P Shares-Net asset value | | | $15.62 | |
| Class R2 Shares-Net asset value | | | $15.65 | |
| Class R3 Shares-Net asset value | | | $15.52 | |
| | See Notes to Financial Statements. | 13 |
Statement of Operations
For the Year Ended November 30, 2013
| Investment income: | | | | |
| Dividends | | $ | 30,664,627 | |
| Interest | | | 394 | |
| Total investment income | | | 30,665,021 | |
| Expenses: | | | | |
| Management fee | | | 8,574,507 | |
| 12b-1 distribution plan-Class A | | | 2,493,783 | |
| 12b-1 distribution plan-Class B | | | 289,757 | |
| 12b-1 distribution plan-Class C | | | 1,025,387 | |
| 12b-1 distribution plan-Class F | | | 43,916 | |
| 12b-1 distribution plan-Class P | | | 6,469 | |
| 12b-1 distribution plan-Class R2 | | | 2,323 | |
| 12b-1 distribution plan-Class R3 | | | 25,546 | |
| Shareholder servicing | | | 1,475,656 | |
| Fund administration | | | 475,330 | |
| Registration | | | 119,656 | |
| Reports to shareholders | | | 117,128 | |
| Custody | | | 91,631 | |
| Professional | | | 65,666 | |
| Directors’ fees | | | 39,729 | |
| Other | | | 41,115 | |
| Gross expenses | | | 14,887,599 | |
| Expense reductions (See Note 8) | | | (1,160 | ) |
| Management fee waived (See Note 3) | | | (3,869,304 | ) |
| Net expenses | | | 11,017,135 | |
| Net investment income | | | 19,647,886 | |
| Net realized and unrealized gain: | | | | |
| Net realized gain on investments, futures contracts and foreign currency related transactions | | | 107,366,696 | |
| Net change in unrealized appreciation/depreciation on investments, futures contracts and translation of assets and liabilities denominated in foreign currencies | | | 139,884,012 | |
| Net realized and unrealized gain | | | 247,250,708 | |
| Net Increase in Net Assets Resulting From Operations | | $ | 266,898,594 | |
| 14 | See Notes to Financial Statements. | |
Statements of Changes in Net Assets
| INCREASE (DECREASE) IN NET ASSETS | | For the Year Ended
November 30, 2013 | | For the Year Ended
November 30, 2012 | |
| Operations: | | | | | | | |
| Net investment income | | $ | 19,647,886 | | $ | 23,942,336 | |
| Net realized gain on investments, futures contracts and foreign currency related transactions | | | 107,366,696 | | | 153,162,034 | |
| Net change in unrealized appreciation/depreciation on investments, futures contracts and translation of assets and liabilities denominated in foreign currencies | | | 139,884,012 | | | (40,266,513 | ) |
| Net increase in net assets resulting from operations | | | 266,898,594 | | | 136,837,857 | |
| Distributions to shareholders from: | | | | | | | |
| Net investment income | | | | | | | |
| Class A | | | (22,898,774 | ) | | (24,704,883 | ) |
| Class B | | | (511,054 | ) | | (769,658 | ) |
| Class C | | | (1,473,734 | ) | | (1,225,364 | ) |
| Class F | | | (828,581 | ) | | (326,769 | ) |
| Class I | | | (174,137 | ) | | (597,765 | ) |
| Class P | | | (33,659 | ) | | (47,633 | ) |
| Class R2 | | | (5,122 | ) | | (2,817 | ) |
| Class R3 | | | (100,195 | ) | | (90,373 | ) |
| Total distributions to shareholders | | | (26,025,256 | ) | | (27,765,262 | ) |
| Capital share transactions (Net of share conversions) (See Note 12): | | | | | | | |
| Net proceeds from sales of shares | | | 439,706,623 | | | 146,642,458 | |
| Net proceeds from reorganizations (See Note 13) | | | 650,352,193 | | | — | |
| Reinvestment of distributions | | | 25,046,233 | | | 27,051,584 | |
| Cost of shares reacquired | | | (241,730,526 | ) | | (427,231,118 | ) |
| Net increase (decrease) in net assets resulting from capital share transactions | | | 873,374,523 | | | (253,537,076 | ) |
| Net increase (decrease) in net assets | | | 1,114,247,861 | | | (144,464,481 | ) |
| NET ASSETS: | | | | | | | |
| Beginning of year | | $ | 965,097,560 | | $ | 1,109,562,041 | |
| End of year | | $ | 2,079,345,421 | | $ | 965,097,560 | |
| Undistributed net investment income | | $ | 3,535,370 | | $ | 10,010,383 | |
| | See Notes to Financial Statements. | 15 |
Financial Highlights
| | | Class A Shares |
| | | Year Ended 11/30 |
| | | 2013 | | 2012 | | 2011 | | 2010 | | 2009 | |
| Per Share Operating Performance | | | | | | | | | | | | | | | | |
| Net asset value, beginning of year | | | $12.66 | | | $11.43 | | | $11.26 | | | $10.35 | | | $ 8.66 | |
| Investment operations: | | | | | | | | | | | | | | | | |
| Net investment income(a) | | | .24 | | | .29 | | | .29 | | | .28 | | | .34 | |
| Net realized and unrealized gain | | | 3.00 | | | 1.27 | | | .17 | | | .93 | | | 1.72 | |
| Total from investment operations | | | 3.24 | | | 1.56 | | | .46 | | | 1.21 | | | 2.06 | |
| Distributions to shareholders from: | | | | | | | | | | | | | | | | |
| Net investment income | | | (.33 | ) | | (.33 | ) | | (.29 | ) | | (.30 | ) | | (.37 | ) |
| Net asset value, end of year | | | $15.57 | | | $12.66 | | | $11.43 | | | $11.26 | | | $10.35 | |
| Total Return(b) | | | 26.09 | % | | 13.77 | % | | 4.03 | % | | 11.90 | % | | 24.58 | % |
| Ratios to Average Net Assets: | | | | | | | | | | | | | | | | |
| Expenses, excluding expense reductions and including management fee waived | | | .85 | % | | 1.23 | % | | 1.30 | % | | 1.31 | % | | 1.37 | % |
| Expenses, including expense reductions and management fee waived | | | .85 | % | | 1.23 | % | | 1.30 | % | | 1.31 | % | | 1.37 | % |
| Expenses, excluding expense reductions and management fee waived | | | 1.18 | % | | 1.31 | % | | 1.30 | % | | 1.31 | % | | 1.37 | % |
| Net investment income | | | 1.73 | % | | 2.33 | % | | 2.45 | % | | 2.64 | % | | 3.66 | % |
| | | | | | | | | | | | | | | | | |
| Supplemental Data: | | | | | | | | | | | | | | | | |
| Net assets, end of year (000) | | $ | 1,646,617 | | $ | 848,026 | | $ | 898,508 | | $ | 933,371 | | $ | 974,791 | |
| Portfolio turnover rate | | | 54.87 | %(c) | | 102.89 | % | | 22.87 | % | | 29.52 | % | | 52.24 | % |
| (a) | Calculated using average shares outstanding during the year. |
| (b) | Total return does not consider the effects of sales loads and assumes the reinvestment of all distributions. |
| (c) | Excludes purchases and sales of securities in connection with the acquisition of Lord Abbett Classic Stock Fund on November 22, 2013. |
| 16 | See Notes to Financial Statements. | |
Financial Highlights (continued)
| | | Class B Shares |
| | | Year Ended 11/30 |
| | | 2013 | | 2012 | | 2011 | | 2010 | | 2009 | |
| Per Share Operating Performance | | | | | | | | | | | | | | | | |
| Net asset value, beginning of year | | | $12.55 | | | $11.33 | | | $11.16 | | | $10.26 | | | $ 8.59 | |
| Investment operations: | | | | | | | | | | | | | | | | |
| Net investment income(a) | | | .14 | | | .20 | | | .21 | | | .21 | | | .27 | |
| Net realized and unrealized gain | | | 2.97 | | | 1.26 | | | .17 | | | .92 | | | 1.71 | |
| Total from investment operations | | | 3.11 | | | 1.46 | | | .38 | | | 1.13 | | | 1.98 | |
| Distributions to shareholders from: | | | | | | | | | | | | | | | | |
| Net investment income | | | (.22 | ) | | (.24 | ) | | (.21 | ) | | (.23 | ) | | (.31 | ) |
| Net asset value, end of year | | | $15.44 | | | $12.55 | | | $11.33 | | | $11.16 | | | $10.26 | |
| Total Return(b) | | | 25.14 | % | | 13.04 | % | | 3.36 | % | | 11.17 | % | | 23.75 | % |
| Ratios to Average Net Assets: | | | | | | | | | | | | | | | | |
| Expenses, excluding expense reductions and including management fee waived | | | 1.60 | % | | 1.90 | % | | 1.95 | % | | 1.96 | % | | 2.02 | % |
| Expenses, including expense reductions and management fee waived | | | 1.60 | % | | 1.90 | % | | 1.95 | % | | 1.96 | % | | 2.02 | % |
| Expenses, excluding expense reductions and management fee waived | | | 1.93 | % | | 1.98 | % | | 1.95 | % | | 1.96 | % | | 2.02 | % |
| Net investment income | | | 1.00 | % | | 1.67 | % | | 1.78 | % | | 1.99 | % | | 3.00 | % |
| | | | | | | | | | | | | | | | | |
| Supplemental Data: | | | | | | | | | | | | | | | | |
| Net assets, end of year (000) | | $ | 43,235 | | $ | 31,891 | | $ | 39,643 | | $ | 48,714 | | $ | 53,941 | |
| Portfolio turnover rate | | | 54.87 | %(c) | | 102.89 | % | | 22.87 | % | | 29.52 | % | | 52.24 | % |
| (a) | Calculated using average shares outstanding during the year. |
| (b) | Total return does not consider the effects of sales loads and assumes the reinvestment of all distributions. |
| (c) | Excludes purchases and sales of securities in connection with the acquisition of Lord Abbett Classic Stock Fund on November 22, 2013. |
| | See Notes to Financial Statements. | 17 |
Financial Highlights (continued)
| | | Class C Shares | |
| | | Year Ended 11/30 | |
| | | 2013 | | 2012 | | 2011 | | 2010 | | 2009 | |
| Per Share Operating Performance | | | | | | | | | | | | | | | | |
| Net asset value, beginning of year | | | $12.57 | | | $11.35 | | | $11.18 | | | $10.28 | | | $ 8.60 | |
| Investment operations: | | | | | | | | | | | | | | | | |
| Net investment income(a) | | | .14 | | | .20 | | | .21 | | | .21 | | | .28 | |
| Net realized and unrealized gain | | | 2.97 | | | 1.27 | | | .17 | | | .92 | | | 1.71 | |
| Total from investment operations | | | 3.11 | | | 1.47 | | | .38 | | | 1.13 | | | 1.99 | |
| Distributions to shareholders from: | | | | | | | | | | | | | | | | |
| Net investment income | | | (.24 | ) | | (.25 | ) | | (.21 | ) | | (.23 | ) | | (.31 | ) |
| Net asset value, end of year | | | $15.44 | | | $12.57 | | | $11.35 | | | $11.18 | | | $10.28 | |
| Total Return(b) | | | 25.14 | % | | 13.06 | % | | 3.39 | % | | 11.15 | % | | 23.82 | % |
| Ratios to Average Net Assets: | | | | | | | | | | | | | | | | |
Expenses, excluding expense
reductions and including
management fee waived | | | 1.60 | % | | 1.88 | % | | 1.94 | % | | 1.96 | % | | 2.02 | % |
Expenses, including expense
reductions and management
fee waived | | | 1.60 | % | | 1.88 | % | | 1.94 | % | | 1.96 | % | | 2.02 | % |
Expenses, excluding expense
reductions and management
fee waived | | | 1.91 | % | | 1.98 | % | | 1.95 | % | | 1.96 | % | | 2.02 | % |
| Net investment income | | | .97 | % | | 1.67 | % | | 1.82 | % | | 1.99 | % | | 3.02 | % |
| | | | | | | | | | | | | | | | | |
| Supplemental Data: | | | | | | | | | | | | | | | | |
| Net assets, end of year (000) | | $ | 232,350 | | $ | 61,096 | | $ | 57,695 | | $ | 56,383 | | $ | 59,267 | |
| Portfolio turnover rate | | | 54.87 | %(c) | | 102.89 | % | | 22.87 | % | | 29.52 | % | | 52.24 | % |
| (a) | Calculated using average shares outstanding during the year. |
| (b) | Total return does not consider the effects of sales loads and assumes the reinvestment of all distributions. |
| (c) | Excludes purchases and sales of securities in connection with the acquisition of Lord Abbett Classic Stock Fund on November 22, 2013. |
| 18 | See Notes to Financial Statements. | |
Financial Highlights (continued)
| | | Class F Shares | |
| | | Year Ended 11/30 | |
| | | 2013 | | 2012 | | 2011 | | 2010 | | 2009 | |
| Per Share Operating Performance | | | | | | | | | | | | | | | | |
| Net asset value, beginning of year | | | $12.65 | | | $11.43 | | | $11.25 | | | $10.34 | | | $ 8.65 | |
| Investment operations: | | | | | | | | | | | | | | | | |
| Net investment income(a) | | | .27 | | | .31 | | | .32 | | | .31 | | | .34 | |
| Net realized and unrealized gain | | | 2.99 | | | 1.27 | | | .18 | | | .93 | | | 1.75 | |
| Total from investment operations | | | 3.26 | | | 1.58 | | | .50 | | | 1.24 | | | 2.09 | |
| Distributions to shareholders from: | | | | | | | | | | | | | | | | |
| Net investment income | | | (.35 | ) | | (.36 | ) | | (.32 | ) | | (.33 | ) | | (.40 | ) |
| Net asset value, end of year | | | $15.56 | | | $12.65 | | | $11.43 | | | $11.25 | | | $10.34 | |
| Total Return(b) | | | 26.31 | % | | 13.97 | % | | 4.39 | % | | 12.09 | % | | 25.05 | % |
| Ratios to Average Net Assets: | | | | | | | | | | | | | | | | |
Expenses, excluding expense
reductions and including
management fee waived | | | .70 | % | | .98 | % | | 1.05 | % | | 1.06 | % | | 1.11 | % |
Expenses, including expense
reductions and management
fee waived | | | .70 | % | | .98 | % | | 1.05 | % | | 1.06 | % | | 1.11 | % |
Expenses, excluding expense
reductions and management
fee waived | | | 1.02 | % | | 1.08 | % | | 1.06 | % | | 1.06 | % | | 1.11 | % |
| Net investment income | | | 1.86 | % | | 2.57 | % | | 2.70 | % | | 2.91 | % | | 3.66 | % |
| | | | | | | | | | | | | | | | | |
| Supplemental Data: | | | | | | | | | | | | | | | | |
| Net assets, end of year (000) | | $ | 96,398 | | $ | 14,857 | | $ | 8,251 | | $ | 7,395 | | $ | 4,238 | |
| Portfolio turnover rate | | | 54.87 | %(c) | | 102.89 | % | | 22.87 | % | | 29.52 | % | | 52.24 | % |
| (a) | Calculated using average shares outstanding during the year. |
| (b) | Total return assumes the reinvestment of all distributions. |
| (c) | Excludes purchases and sales of securities in connection with the acquisition of Lord Abbett Classic Stock Fund on November 22, 2013. |
| | See Notes to Financial Statements. | 19 |
Financial Highlights (continued)
| | | | Class I Shares | |
| | | | | | | Year Ended 11/30 | | | | |
| | | 2013 | | 2012 | | 2011 | | 2010 | | 2009 | |
| Per Share Operating Performance | | | | | | | | | | | | | | | | |
| Net asset value, beginning of year | | | $12.73 | | | $11.50 | | | $11.33 | | | $10.41 | | | $ 8.70 | |
| Investment operations: | | | | | | | | | | | | | | | | |
| Net investment income(a) | | | .30 | | | .30 | | | .32 | | | .32 | | | .36 | |
| Net realized and unrealized gain | | | 3.00 | | | 1.30 | | | .18 | | | .94 | | | 1.75 | |
| Total from investment operations | | | 3.30 | | | 1.60 | | | .50 | | | 1.26 | | | 2.11 | |
| Distributions to shareholders from: | | | | | | | | | | | | | | | | |
| Net investment income | | | (.37 | ) | | (.37 | ) | | (.33 | ) | | (.34 | ) | | (.40 | ) |
| Net asset value, end of year | | | $15.66 | | | $12.73 | | | $11.50 | | | $11.33 | | | $10.41 | |
| Total Return(b) | | | 26.41 | % | | 14.08 | % | | 4.37 | % | | 12.33 | % | | 25.13 | % |
| Ratios to Average Net Assets: | | | | | | | | | | | | | | | | |
Expenses, excluding expense
reductions and including
management fee waived | | | .60 | % | | .97 | % | | .95 | % | | .96 | % | | 1.01 | % |
Expenses, including expense
reductions and management
fee waived | | | .60 | % | | .97 | % | | .95 | % | | .96 | % | | 1.01 | % |
Expenses, excluding expense
reductions and management
fee waived | | | .92 | % | | .98 | % | | .95 | % | | .96 | % | | 1.01 | % |
| Net investment income | | | 2.06 | % | | 2.54 | % | | 2.72 | % | | 2.98 | % | | 3.91 | % |
| | | | | | | | | | | | | | | | | |
| Supplemental Data: | | | | | | | | | | | | | | | | |
| Net assets, end of year (000) | | | $34,361 | | | $ 3,497 | | | $100,317 | | | $337,978 | | | $309,336 | |
| Portfolio turnover rate | | | 54.87 | %(c) | | 102.89 | % | | 22.87 | % | | 29.52 | % | | 52.24 | % |
| (a) | Calculated using average shares outstanding during the year. |
| (b) | Total return assumes the reinvestment of all distributions. |
| (c) | Excludes purchases and sales of securities in connection with the acquisition of Lord Abbett Classic Stock Fund on November 22, 2013. |
| 20 | See Notes to Financial Statements. | |
Financial Highlights (continued)
| | | Class P Shares | |
| | | Year Ended 11/30 | |
| | | 2013 | | 2012 | | 2011 | | 2010 | | 2009 | |
| Per Share Operating Performance | | | | | | | | | | | | | | | | |
| Net asset value, beginning of year | | | $12.70 | | | $11.46 | | | $11.29 | | | $10.38 | | | $ 8.68 | |
| Investment operations: | | | | | | | | | | | | | | | | |
| Net investment income(a) | | | .22 | | | .27 | | | .28 | | | .27 | | | .33 | |
| Net realized and unrealized gain | | | 3.00 | | | 1.28 | | | .16 | | | .93 | | | 1.73 | |
| Total from investment operations | | | 3.22 | | | 1.55 | | | .44 | | | 1.20 | | | 2.06 | |
| Distributions to shareholders from: | | | | | | | | | | | | | | | | |
| Net investment income | | | (.30 | ) | | (.31 | ) | | (.27 | ) | | (.29 | ) | | (.36 | ) |
| Net asset value, end of year | | | $15.62 | | | $12.70 | | | $11.46 | | | $11.29 | | | $10.38 | |
| Total Return(b) | | | 25.81 | % | | 13.60 | % | | 4.00 | % | | 11.75 | % | | 24.52 | % |
| Ratios to Average Net Assets: | | | | | | | | | | | | | | | | |
Expenses, excluding expense
reductions and including
management fee waived | | | 1.05 | % | | 1.35 | % | | 1.40 | % | | 1.41 | % | | 1.46 | % |
Expenses, including expense
reductions and management
fee waived | | | 1.05 | % | | 1.35 | % | | 1.40 | % | | 1.41 | % | | 1.46 | % |
Expenses, excluding expense
reductions and management
fee waived | | | 1.38 | % | | 1.43 | % | | 1.41 | % | | 1.41 | % | | 1.46 | % |
| Net investment income | | | 1.55 | % | | 2.22 | % | | 2.35 | % | | 2.54 | % | | 3.54 | % |
| | | | | | | | | | | | | | | | | |
| Supplemental Data: | | | | | | | | | | | | | | | | |
| Net assets, end of year (000) | | $ | 2,355 | | $ | 1,638 | | $ | 1,910 | | $ | 2,191 | | $ | 2,906 | |
| Portfolio turnover rate | | | 54.87 | %(c) | | 102.89 | % | | 22.87 | % | | 29.52 | % | | 52.24 | % |
| (a) | Calculated using average shares outstanding during the year. |
| (b) | Total return assumes the reinvestment of all distributions. |
| (c) | Excludes purchases and sales of securities in connection with the acquisition of Lord Abbett Classic Stock Fund on November 22, 2013. |
| | See Notes to Financial Statements. | 21 |
Financial Highlights (continued)
| | | Class R2 Shares | |
| | | Year Ended 11/30 | |
| | | 2013 | | 2012 | | 2011 | | 2010 | | 2009 | |
| Per Share Operating Performance | | | | | | | | | | | | | | | | |
| Net asset value, beginning of year | | | $12.73 | | | $11.49 | | | $11.31 | | | $10.40 | | | $8.70 | |
| Investment operations: | | | | | | | | | | | | | | | | |
| Net investment income(a) | | | .23 | | | .26 | | | .28 | | | .26 | | | .31 | |
| Net realized and unrealized gain | | | 2.98 | | | 1.28 | | | .15 | | | .92 | | | 1.75 | |
| Total from investment operations | | | 3.21 | | | 1.54 | | | .43 | | | 1.18 | | | 2.06 | |
| Distributions to shareholders from: | | | | | | | | | | | | | | | | |
| Net investment income | | | (.29 | ) | | (.30 | ) | | (.25 | ) | | (.27 | ) | | (.36 | ) |
| Net asset value, end of year | | | $15.65 | | | $12.73 | | | $11.49 | | | $11.31 | | | $10.40 | |
| Total Return(b) | | | 25.64 | % | | 13.46 | % | | 3.90 | % | | 11.56 | % | | 24.47 | % |
| Ratios to Average Net Assets: | | | | | | | | | | | | | | | | |
Expenses, excluding expense
reductions and including
management fee waived | | | 1.20 | % | | 1.46 | % | | 1.54 | % | | 1.55 | % | | 1.49 | % |
Expenses, including expense
reductions and management
fee waived | | | 1.20 | % | | 1.46 | % | | 1.54 | % | | 1.55 | % | | 1.49 | % |
Expenses, excluding expense
reductions and management
fee waived | | | 1.52 | % | | 1.55 | % | | 1.55 | % | | 1.56 | % | | 1.49 | % |
| Net investment income | | | 1.57 | % | | 2.10 | % | | 2.43 | % | | 2.39 | % | | 3.34 | % |
| | | | | | | | | | | | | | | | | |
| Supplemental Data: | | | | | | | | | | | | | | | | |
| Net assets, end of year (000) | | $ | 2,442 | | $ | 112 | | $ | 103 | | $ | 30 | | $ | 29 | |
| Portfolio turnover rate | | | 54.87 | %(c) | | 102.89 | % | | 22.87 | % | | 29.52 | % | | 52.24 | % |
| (a) | Calculated using average shares outstanding during the year. |
| (b) | Total return assumes the reinvestment of all distributions. |
| (c) | Excludes purchases and sales of securities in connection with the acquisition of Lord Abbett Classic Stock Fund on November 22, 2013. |
| 22 | See Notes to Financial Statements. | |
Financial Highlights (concluded)
| | | | Class R3 Shares |
| | | | Year Ended 11/30 |
| | | 2013 | | | 2012 | | | 2011 | | | 2010 | | | 2009 | |
| Per Share Operating Performance | | | | | | | | | | | | | | | | | | | | |
| Net asset value, beginning of year | | | $12.62 | | | | $11.40 | | | | $11.24 | | | | $10.33 | | | | $ 8.65 | |
| Investment operations: | | | | | | | | | | | | | | | | | | | | |
| Net investment income(a) | | | .22 | | | | .26 | | | | .28 | | | | .27 | | | | .29 | |
| Net realized and unrealized gain | | | 2.98 | | | | 1.27 | | | | .15 | | | | .93 | | | | 1.76 | |
| Total from investment operations | | | 3.20 | | | | 1.53 | | | | .43 | | | | 1.20 | | | | 2.05 | |
| Distributions to shareholders from: | | | | | | | | | | | | | | | | | | | | |
| Net investment income | | | (.30 | ) | | | (.31 | ) | | | (.27 | ) | | | (.29 | ) | | | (.37 | ) |
| Net asset value, end of year | | | $15.52 | | | | $12.62 | | | | $11.40 | | | | $11.24 | | | | $10.33 | |
| Total Return(b) | | | 25.79 | % | | | 13.57 | % | | | 3.91 | % | | | 11.73 | % | | | 24.46 | % |
| Ratios to Average Net Assets: | | | | | | | | | | | | | | | | | | | | |
| Expenses, excluding expense reductions and including management fee waived | | | 1.10 | % | | | 1.38 | % | | | 1.45 | % | | | 1.45 | % | | | 1.50 | % |
| Expenses, including expense reductions and management fee waived | | | 1.10 | % | | | 1.38 | % | | | 1.45 | % | | | 1.45 | % | | | 1.50 | % |
| Expenses, excluding expense reductions and management fee waived | | | 1.42 | % | | | 1.48 | % | | | 1.45 | % | | | 1.46 | % | | | 1.50 | % |
| Net investment income | | | 1.57 | % | | | 2.15 | % | | | 2.35 | % | | | 2.49 | % | | | 3.03 | % |
| | | | | | | | | | | | | | | | | | | | | |
| Supplemental Data: | | | | | | | | | | | | | | | | | | | | |
| Net assets, end of year (000) | | $21,587 | | | $3,980 | | | $3,135 | | | $2,116 | | | $341 | |
| Portfolio turnover rate | | | 54.87 | %(c) | | | 102.89 | % | | | 22.87 | % | | | 29.52 | % | | | 52.24 | % |
| (a) | Calculated using average shares outstanding during the year. |
| (b) | Total return assumes the reinvestment of all distributions. |
| (c) | Excludes purchases and sales of securities in connection with the acquisition of Lord Abbett Classic Stock Fund on November 22, 2013. |
| | See Notes to Financial Statements. | 23 |
Notes to Financial Statements
Lord Abbett Research Fund, Inc. (the “Company”) is registered under the Investment Company Act of 1940, as amended (the “Act”), as a diversified, open-end management investment company and was incorporated under Maryland law on April 6, 1992. The Company currently consists of three separate funds. This report covers one of the funds and its classes: Lord Abbett Calibrated Dividend Growth Fund (the “Fund”).
The Fund’s investment objective is to seek current income and capital appreciation. The Fund has eight classes of shares: Class A, B, C, F, I, P, R2 and R3, each with different expenses and dividends. A front-end sales charge is normally added to the net asset value (“NAV”) for Class A shares. There is no front-end sales charge in the case of Class B, C, F, I, P, R2 and R3 shares, although there may be a contingent deferred sales charge (“CDSC”) in certain cases as follows: Class A shares purchased without a sales charge and redeemed before the first day of the month in which the one-year anniversary of the purchase falls (subject to certain exceptions as set forth in the Fund’s prospectus); Class B shares redeemed before the sixth anniversary of purchase; and Class C shares redeemed before the first anniversary of purchase. Class B shares will automatically convert to Class A shares on the 25th day of the month (or, if the 25th day is not a business day, the next business day thereafter) following the eighth anniversary of the day on which the purchase order was accepted. The Fund no longer issues Class B shares for purchase. The Fund’s Class P shares are closed to substantially all investors, with certain exceptions as set forth in the Fund’s prospectus.
On November 22, 2013, Calibrated Dividend Growth Fund acquired the net assets of Lord Abbett Classic Stock Fund (“Classic Stock Fund”), which was another fund managed by the Company. Refer to Note 13 Reorganization for additional information.
The preparation of the financial statements in conformity with accounting principles generally accepted in the United States of America requires management to make certain estimates and assumptions that affect the reported amounts of assets and liabilities and disclosure of contingent assets and liabilities at the date of the financial statements and the reported amounts of increases and decreases in net assets from operations during the reporting period. Actual results could differ from those estimates.
| 2. | SIGNIFICANT ACCOUNTING POLICIES |
| (a) | Investment Valuation–Under procedures approved by the Fund’s Board of Directors (the “Board”), Lord, Abbett & Co. LLC (“Lord Abbett”), the Fund’s investment manager, has formed a Pricing Committee to administer the pricing and valuation of portfolio investments and to ensure that prices utilized reasonably reflect fair value. Among other things, these procedures allow the Fund to utilize independent pricing services, quotations from securities and financial instrument dealers and other market sources to determine fair value. |
| | |
| | Securities actively traded on any recognized U.S. or non-U.S. exchange or on The NASDAQ Stock Market LLC are valued at the last sale price or official closing price on the exchange or system on which they are principally traded. Events occurring after the close of trading on non-U.S. exchanges may result in adjustments to the valuation of foreign securities to reflect their fair value as of the close of regular trading on the New York Stock Exchange LLC. The Fund may rely on an independent fair valuation service in adjusting the valuations of foreign securities. Unlisted equity securities are valued at the last quoted sale price or, if no sale price is available, at the mean between the most recently quoted bid and asked prices. Exchange |
24
Notes to Financial Statements (continued)
| | traded options and futures contracts are valued at the last sale price in the market where they are principally traded. If no sale has occurred, the mean between the most recently quoted bid and asked prices is used. |
| | |
| | Securities for which prices are not readily available are valued at fair value as determined by the Pricing Committee and approved by the Board. The Pricing Committee considers a number of factors, including observable and unobservable inputs, when arriving at fair value. The Pricing Committee may use related or comparable assets or liabilities, recent transactions, market multiples, book values and other relevant information to determine fair value of portfolio investments. The Board or a designated committee thereof regularly reviews fair value determinations made by the Pricing Committee and employs techniques such as reviewing related market activity, reviewing inputs and assumptions, and retrospectively comparing prices of subsequent purchases and sales transactions to fair value determinations made by the Pricing Committee. |
| | |
| | Short-term securities with 60 days or less remaining to maturity are valued using the amortized cost method, which approximates fair value. |
| | |
| (b) | Security Transactions–Security transactions are recorded as of the date that the securities are purchased or sold (trade date). Realized gains and losses on sales of portfolio securities are calculated using the identified-cost method. Realized and unrealized gains (losses) are allocated to each class of shares based upon the relative proportion of net assets at the beginning of the day. |
| | |
| (c) | Investment Income–Dividend income is recorded on the ex-dividend date. Interest income is recorded on the accrual basis as earned. Discounts are accreted and premiums are amortized using the effective interest method and are included in Interest income on the Statement of Operations. Withholding taxes on foreign dividends have been provided for in accordance with the applicable country’s tax rules and rates. Investment income is allocated to each class of shares based upon the relative proportion of net assets at the beginning of the day. |
| | |
| (d) | Income Taxes–It is the policy of the Fund to meet the requirements of Subchapter M of the Internal Revenue Code applicable to regulated investment companies and to distribute substantially all taxable income and capital gains to its shareholders. Therefore, no income tax provision is required. |
| | |
| | The Fund files U.S. federal and various state and local tax returns. No income tax returns are currently under examination. The statute of limitations on the Fund’s filed U.S. federal tax returns remains open for the fiscal years ended November 30, 2010 through November 30, 2013. The statutes of limitations on the Company’s state and local tax returns may remain open for an additional year depending upon the jurisdiction. |
| | |
| (e) | Expenses–Expenses incurred by the Company that do not specifically relate to an individual fund are generally allocated to the funds within the Company on a pro rata basis by relative net assets. Expenses, excluding class-specific expenses, are allocated to each class of shares based upon the relative proportion of net assets at the beginning of the day. Class A, B, C, F, P, R2 and R3 shares bear their class-specific share of all expenses and fees relating to the Fund’s 12b-1 Distribution Plan. |
| | |
| (f) | Foreign Transactions–The books and records of the Fund are maintained in U.S. dollars and transactions denominated in foreign currencies are recorded in the Fund’s records at the rate |
25
Notes to Financial Statements (continued)
| | prevailing when earned or recorded. Asset and liability accounts that are denominated in foreign currencies are adjusted daily to reflect current exchange rates and any unrealized gain (loss) is included in Net change in unrealized appreciation/depreciation on investments, futures contracts and translation of assets and liabilities denominated in foreign currencies on the Fund’s Statement of Operations. The resultant exchange gains and losses upon settlement of such transactions are included in Net realized gain on investments, futures contracts and foreign currency related transactions on the Fund’s Statement of Operations. The Fund does not isolate that portion of the results of operations arising as a result of changes in the foreign exchange rates from the changes in market prices of the securities. |
| | |
| | The Fund uses foreign currency exchange contracts to facilitate transactions in foreign-denominated securities. Losses from these transactions may arise from changes in the value of the foreign currency or if the counterparties do not perform under the contracts’ terms. |
| | |
| (g) | Futures Contracts–The Fund may purchase and sell index futures contracts to manage cash, or as a substitute position for holding the underlying asset on which the instrument is based. At the time of entering into a futures transaction, an investor is required to deposit and maintain a specified amount of cash or eligible securities called “initial margin.” Subsequent payments made or received by the Fund called “variation margin” are made on a daily basis as the market price of the futures contract fluctuates. The Fund will record an unrealized gain (loss) based on the amount of variation margin. When a contract is closed, a realized gain (loss) is recorded equal to the difference between the opening and closing value of the contract. As of November 30, 2013, the Fund had open futures contracts. |
| | |
| (h) | Repurchase Agreements–The Fund may enter into repurchase agreements with respect to securities. A repurchase agreement is a transaction in which a fund acquires a security and simultaneously commits to resell that security to the seller (a bank or securities dealer) at an agreed-upon price on an agreed-upon date. The Fund requires at all times that the repurchase agreement be collateralized by cash, or by securities of the U.S. Government, its agencies, its instrumentalities, or U.S. Government sponsored enterprises having a value equal to, or in excess of, the value of the repurchase agreement (including accrued interest). If the seller of the agreement defaults on its obligation to repurchase the underlying securities at a time when the fair value of these securities has declined, the Fund may incur a loss upon disposition of the securities. |
| | |
| (i) | Fair Value Measurements–Fair value is defined as the price that the Fund would receive upon selling an investment or transferring a liability in an orderly transaction to an independent buyer in the principal or most advantageous market of the investment. A three-tier hierarchy is used to maximize the use of observable market data and minimize the use of unobservable inputs and to establish classification of fair value measurements for disclosure purposes. Inputs refer broadly to the assumptions that market participants would use in pricing the asset or liability, including assumptions about risk—for example, the risk inherent in a particular valuation technique used to measure fair value (such as a pricing model) and/or the risk inherent in the inputs to the valuation technique. Inputs may be observable or unobservable. Observable inputs reflect the assumptions market participants would use in pricing the asset or liability. Observable inputs are based on market data obtained from sources independent of the reporting entity. Unobservable inputs reflect the reporting entity’s own assumptions about the assumptions market participants would use in pricing the asset or liability. Unobservable inputs are based on the best information available in the circumstances. |
26
Notes to Financial Statements (continued)
| | The three-tier hierarchy of inputs is summarized in the three broad Levels listed below: |
| | • | Level 1 – | unadjusted quoted prices in active markets for identical investments; |
| | • | Level 2 – | other significant observable inputs (including quoted prices for similar investments, interest rates, prepayment speeds, credit risk, etc.); and |
| | • | Level 3 – | significant unobservable inputs (including the Fund’s own assumptions in determining the fair value of investments). |
| | A summary of inputs used in valuing the Fund’s investments and other financial instruments as of November 30, 2013 and, if applicable, Level 1/Level 2 transfers and Level 3 rollforwards for the fiscal year then ended is included in the Fund’s Schedule of Investments. |
| | |
| | Changes in valuation techniques may result in transfers into or out of an assigned level within the three-tier hierarchy. All transfers between different levels within the three-tier hierarchy are deemed to have occurred as of the beginning of the reporting period. The inputs or methodology used for valuing securities are not necessarily an indication of the risk associated with investing in those securities. |
| 3. | MANAGEMENT FEE AND OTHER TRANSACTIONS WITH AFFILIATES |
Management Fee
The Company has a management agreement with Lord Abbett, pursuant to which Lord Abbett supplies the Fund with investment management services and executive and other personnel, provides office space and pays for ordinary and necessary office and clerical expenses relating to research and statistical work and supervision of the Fund’s investment portfolio.
The management fee is based on the Fund’s average daily net assets at the following annual rate:
| | | Effective
October 1, 2013 | | | Prior to
October 1, 2013 | |
| First $1 billion | | .65 | % | | .75 | % |
| Next $1 billion | | .60 | % | | .70 | % |
| Over $2 billion | | .55 | % | | .65 | % |
For the fiscal year ended November 30, 2013, the effective management fee, net of waivers, was at an annualized rate of .40% of the Fund’s average daily net assets.
In addition, Lord Abbett provides certain administrative services to the Fund pursuant to an Administrative Services Agreement in return for a fee at an annual rate of .04% of the Fund’s average daily net assets.
For the fiscal year ended November 30, 2013 and continuing through March 31, 2015, Lord Abbett has contractually agreed to waive all or a portion of its management fee and, waive all or a portion of its administrative fee and, if necessary, reimburse the Fund’s other expenses to the extent necessary so that the total net annual operating expenses for each class, excluding 12b-1 fees, do not exceed an annual rate of 0.60%. This agreement may be terminated only upon the approval of the Board.
12b-1 Distribution Plan
The Fund has adopted a distribution plan with respect to Class A, B, C, F, P, R2 and R3 shares pursuant to Rule 12b-1 under the Act, which provides for the payment of ongoing distribution and service fees to Lord Abbett Distributor LLC (the “Distributor”), an affiliate of Lord Abbett. The following annual rates have been approved by the Board pursuant to the plan:
27
Notes to Financial Statements (continued)
| Fees* | | Class A | | Class B | | Class C | | Class F | | Class P | | Class R2 | | Class R3 |
| Service | | .25 | % | | .25 | % | | .25 | % | | — | | | .25 | % | | .25 | % | | .25 | % |
| Distribution | | — | | | .75 | % | | .75 | % | | .10 | % | | .20 | % | | .35 | % | | .25 | % |
| * | The Fund may designate a portion of the aggregate fee as attributable to service activities for purposes of calculating Financial Industry Regulatory Authority, Inc. (“FINRA”) sales charge limitations. |
Class I shares do not have a distribution plan.
Commissions
Distributor received the following commissions on sales of shares of the Fund, after concessions were paid to authorized dealers, for the fiscal year ended November 30, 2013:
Distributor
Commissions | | Dealers’
Concessions |
| $724,433 | | $3,925,494 |
Distributor received CDSCs of $13,467 and $5,716 for Class A and Class C shares, respectively, for the fiscal year ended November 30, 2013.
A Director and certain of the Fund’s officers have an interest in Lord Abbett.
| 4. | DISTRIBUTIONS AND CAPITAL LOSS CARRYFORWARDS |
Dividends from net investment income, if any, are declared and paid at least quarterly. Taxable net realized gains from investment transactions, reduced by allowable capital loss carryforwards, if any, are declared and distributed to shareholders at least annually. The capital loss carryforward amount, if any, is available to offset future net capital gains. Dividends and distributions to shareholders are recorded on the ex-dividend date. The amounts of dividends and distributions from net investment income and net realized capital gains are determined in accordance with federal income tax regulations, which may differ from accounting principles generally accepted in the United States of America. These book/tax differences are either considered temporary or permanent in nature. To the extent these differences are permanent in nature, such amounts are reclassified within the components of net assets based on their federal tax basis treatment; temporary differences do not require reclassification. Dividends and distributions, which exceed earnings and profits for tax purposes, are reported as a tax return of capital.
Subsequent to the Fund’s fiscal year ended November 30, 2013, a long-term capital gain distribution of approximately $47,547,000 was declared by the Fund on December 11, 2013. The distribution was paid on December 18, 2013 to shareholders of record on December 17, 2013.
The tax character of distributions paid during the fiscal years ended November 30, 2013 and 2012 was as follows:
| | | Year Ended
11/30/2013 | | Year Ended
11/30/2012 |
| Distributions paid from: | | | | |
| Ordinary income | | $26,025,256 | | $27,765,262 |
| Total distributions paid | | $26,025,256 | | $27,765,262 |
28
Notes to Financial Statements (continued)
As of November 30, 2013, the components of accumulated gains on a tax-basis were as follows:
| Undistributed ordinary income - net | | $ | 3,808,845 | |
| Undistributed long-term capital gains | | $ | 47,534,383 | |
| Total undistributed earnings | | $ | 51,343,228 | |
| Temporary differences | | | (273,475 | ) |
| Unrealized gains - net | | | 277,262,011 | |
| Total accumulated gains - net | | $ | 328,331,764 | |
As of November 30, 2013, the aggregate unrealized security gains and losses based on cost for U.S. federal income tax purposes were as follows:
| Tax cost | | $ | 1,797,182,812 | |
| Gross unrealized gain | | | 289,734,805 | |
| Gross unrealized loss | | | (12,473,593 | ) |
| Net unrealized security gain | | $ | 277,261,212 | |
The difference between book-basis and tax-basis unrealized gains (losses) is attributable to the tax treatment of wash sales.
Permanent items identified during the fiscal year ended November 30, 2013 have been reclassified among the components of net assets based on their tax basis treatment as follows:
Undistributed Net
Investment Income | | Accumulated
Net Realized
Gain | |
| $21,051 | | $(21,051 | ) |
The permanent differences are primarily attributable to the tax treatment of certain distributions received.
| 5. | PORTFOLIO SECURITIES TRANSACTIONS |
Purchases and sales of investment securities (excluding short-term investments) for the fiscal year ended November 30, 2013 were as follows:
| Purchases | | Sales |
| $873,058,441 | | $669,400,117 |
There were no purchases or sales of U.S. Government securities for the fiscal year ended November 30, 2013.
| 6. | DISCLOSURES ABOUT DERIVATIVE INSTRUMENTS AND HEDGING ACTIVITIES |
The Fund entered into E-Mini S&P 500 Index futures contracts for the fiscal year ended November 30, 2013 (as described in note 2(g)) to manage cash. The Fund bears the risk that the underlying index will move unexpectedly, in which case the Fund may realize a loss. There is minimal counterparty credit risk to the Fund since futures are exchange traded and the exchange’s clearinghouse, as counterparty to all exchange traded futures, guarantees futures against default.
Realized gains of $212,399 and unrealized appreciation of $385,663 are included on the Statement of Operations related to futures contracts under the captions Net realized gain on investments, futures contracts and foreign currency related transactions and Net change in unrealized appreciation/depreciation on investments, futures contracts and translation of assets and liabilities denominated in foreign currencies, respectively. The average number of futures contracts throughout the period was 25.
29
Notes to Financial Statements (continued)
| 7. | DIRECTORS’ REMUNERATION |
The Company’s officers and a Director, who are associated with Lord Abbett, do not receive any compensation from the Company for serving in such capacities. Independent Directors’ fees are allocated among all Lord Abbett-sponsored funds based on the net assets of each fund. There is an equity-based plan available to all Independent Directors under which Independent Directors must defer receipt of a portion of, and may elect to defer receipt of an additional portion of Directors’ fees. The deferred amounts are treated as though equivalent dollar amounts had been invested in the funds. Such amounts and earnings accrued thereon are included in Directors’ fees on the Statement of Operations and in Directors’ fees payable on the Statement of Assets and Liabilities and are not deductible for U.S. federal income tax purposes until such amounts are paid.
The Company has entered into an arrangement with its transfer agent and custodian, whereby credits realized as a result of uninvested cash balances are used to reduce a portion of the Fund’s expenses.
During the fiscal year ended November 30, 2013, the Fund and certain other funds managed by Lord Abbett (the “participating funds”) participated in an unsecured revolving credit facility (“Facility”) with State Street Bank and Trust Company (“SSB”). The Facility is to be used for temporary or emergency purposes as an additional source of liquidity to fund redemptions of investor shares. The Board considers annual renewal of the Facility under terms that depend on market conditions at the time of the renewal. The amounts available under the Facility are (i) the lesser of either $250,000,000 or 33.33% of total assets per participating fund and (ii) $350,000,000 in the aggregate for all participating funds. The annual fee to maintain the Facility is .09% of the amount available under the Facility. Each participating fund pays its pro rata share based on the net assets of each participating fund. This amount is included in Other expenses on the Fund’s Statement of Operations. Any borrowings under this Facility will bear interest at current market rates as set forth in the credit agreement.
Effective July 1, 2013, the Fund and participating funds renewed the Facility through June 30, 2014 under the same terms as described above.
During the fiscal year ended November 30, 2013, a participating fund also managed by Lord Abbett utilized the Facility and fully repaid its borrowings on June 13, 2013. As of November 30, 2013, there were no loans outstanding pursuant to this Facility.
| 10. | CUSTODIAN AND ACCOUNTING AGENT |
SSB is the Company’s custodian and accounting agent. SSB performs custodial, accounting and recordkeeping functions relating to portfolio transactions and calculating the Fund’s NAV.
30
Notes to Financial Statements (continued)
The Fund is subject to the general risks and considerations associated with equity investing. The Fund invests primarily in equity securities of large and mid-sized company stocks that have a history of growing their dividends, but there is no guarantee that a company will pay a dividend. The value of the Fund’s investments in equity securities will fluctuate in response to general economic conditions and to the changes in the prospects of particular companies and/or sectors in the economy. If the Fund’s fundamental research and quantitative analysis fail to produce the intended result, the Fund may suffer losses or underperform its benchmark or other funds with the same investment objective or similar strategies, even in a risking market.
Large and mid-sized company stocks each may perform differently than the market as a whole and other types of stocks. This is because different types of stocks tend to shift in and out of favor depending on market and economic conditions. Mid-sized company stocks may be less able to weather economic shifts or other adverse developments than those of larger, more established companies.
The Fund’s exposure to foreign companies and markets presents increased market, liquidity, currency, political and other risks.
These factors can affect the Fund’s performance.
| 12. | SUMMARY OF CAPITAL TRANSACTIONS |
Transactions in shares of capital stock were as follows:
| | | | | | Year Ended | | | | | | Year Ended | |
| | | November 30, 2013 | | | November 30, 2012 | |
| Class A Shares | | Shares | | | Amount | | | Shares | | | Amount | |
| Shares sold | | | 18,776,456 | | | $ | 265,167,284 | | | | 9,786,518 | | | $ | 119,298,611 | |
| Converted from Class B* | | | 647,078 | | | | 9,035,149 | | | | 443,964 | | | | 5,481,067 | |
| Reinvestment of distributions | | | 1,693,594 | | | | 22,571,926 | | | | 2,017,555 | | | | 24,395,455 | |
| Shares reacquired | | | (13,920,362 | ) | | | (194,884,921 | ) | | | (23,862,375 | ) | | | (294,327,940 | ) |
Shares issued in reorganization
(See Note 13) | | | 31,586,334 | | | | 493,694,394 | | | | — | | | | — | |
| Increase (decrease) | | | 38,783,100 | | | $ | 595,583,832 | | | | (11,614,338 | ) | | $ | (145,152,807 | ) |
| | | | | | | | | | | | | | | | | |
| Class B Shares | | | | | | | | | | | | | | | | |
| Shares sold | | | 117,606 | | | $ | 1,630,353 | | | | 132,932 | | | $ | 1,591,225 | |
| Reinvestment of distributions | | | 38,359 | | | | 496,541 | | | | 62,397 | | | | 746,199 | |
| Shares reacquired | | | (398,516 | ) | | | (5,502,368 | ) | | | (704,111 | ) | | | (8,576,564 | ) |
| Converted to Class A* | | | (652,456 | ) | | | (9,035,149 | ) | | | (447,770 | ) | | | (5,481,067 | ) |
Shares issued in reorganization
(See Note 13) | | | 1,154,451 | | | | 17,893,987 | | | | — | | | | — | |
| Increase (decrease) | | | 259,444 | | | $ | 5,483,364 | | | | (956,552 | ) | | $ | (11,720,207 | ) |
| | | | | | | | | | | | | | | | | |
| Class C Shares | | | | | | | | | | | | | | | | |
| Shares sold | | | 6,626,070 | | | $ | 93,835,239 | | | | 1,023,093 | | | $ | 12,467,625 | |
| Reinvestment of distributions | | | 89,325 | | | | 1,188,324 | | | | 80,045 | | | | 961,424 | |
| Shares reacquired | | | (1,156,378 | ) | | | (16,238,713 | ) | | | (1,323,484 | ) | | | (16,061,981 | ) |
Shares issued in reorganization
(See Note 13) | | | 4,629,695 | | | | 71,760,278 | | | | — | | | | — | |
| Increase (decrease) | | | 10,188,712 | | | $ | 150,545,128 | | | | (220,346 | ) | | $ | (2,632,932 | ) |
31
Notes to Financial Statements (continued)
| | | | | | Year Ended | | | | | | Year Ended | |
| | | November 30, 2013 | | | November 30, 2012 | |
| Class F Shares | | Shares | | | Amount | | | Shares | | | Amount | |
| Shares sold | | | 4,925,079 | | | $ | 69,448,973 | | | | 799,173 | | | $ | 9,734,827 | |
| Reinvestment of distributions | | | 46,803 | | | | 642,930 | | | | 21,868 | | | | 266,301 | |
| Shares reacquired | | | (1,549,935 | ) | | | (22,035,211 | ) | | | (368,922 | ) | | | (4,489,802 | ) |
Shares issued in reorganization
(See Note 13) | | | 1,599,938 | | | | 24,991,028 | | | | — | | | | — | |
| Increase | | | 5,021,885 | | | $ | 73,047,720 | | | | 452,119 | | | $ | 5,511,326 | |
| | | | | | | | | | | | | | | | | |
| Class I Shares | | | | | | | | | | | | | | | | |
| Shares sold | | | 482,888 | | | $ | 6,713,487 | | | | 169,278 | | | $ | 2,129,225 | |
| Reinvestment of distributions | | | 821 | | | | 11,823 | | | | 47,277 | | | | 543,683 | |
| Shares reacquired | | | (69,203 | ) | | | (1,020,073 | ) | | | (8,664,123 | ) | | | (102,242,419 | ) |
Shares issued in reorganization
(See Note 13) | | | 1,505,148 | | | | 23,660,924 | | | | — | | | | — | |
| Increase (decrease) | | | 1,919,654 | | | $ | 29,366,161 | | | | (8,447,568 | ) | | $ | (99,569,511 | ) |
| | | | | | | | | | | | | | | | | |
| Class P Shares | | | | | | | | | | | | | | | | |
| Shares sold | | | 11,690 | | | $ | 167,117 | | | | 17,479 | | | $ | 214,388 | |
| Reinvestment of distributions | | | 2,546 | | | | 33,659 | | | | 3,935 | | | | 47,633 | |
| Shares reacquired | | | (56,859 | ) | | | (786,499 | ) | | | (59,024 | ) | | | (724,221 | ) |
Shares issued in reorganization
(See Note 13) | | | 64,410 | | | | 1,009,958 | | | | — | | | | — | |
| Increase (decrease) | | | 21,787 | | | $ | 424,235 | | | | (37,610 | ) | | $ | (462,200 | ) |
| | | | | | | | | | | | | | | | | |
| Class R2 Shares | | | | | | | | | | | | | | | | |
| Shares sold | | | 24,958 | | | $ | 339,790 | | | | 3,413 | | | $ | 41,890 | |
| Reinvestment of distributions | | | 70 | | | | 968 | | | | 56 | | | | 679 | |
| Shares reacquired | | | (3,880 | ) | | | (55,182 | ) | | | (3,601 | ) | | | (43,946 | ) |
Shares issued in reorganization
(See Note 13) | | | 126,070 | | | | 1,980,559 | | | | — | | | | — | |
| Increase (decrease) | | | 147,218 | | | $ | 2,266,135 | | | | (132 | ) | | $ | (1,377 | ) |
| | | | | | | | | | | | | | | | | |
| Class R3 Shares | | | | | | | | | | | | | | | | |
| Shares sold | | | 168,776 | | | $ | 2,404,380 | | | | 95,790 | | | $ | 1,164,667 | |
| Reinvestment of distributions | | | 7,535 | | | | 100,062 | | | | 7,458 | | | | 90,210 | |
| Shares reacquired | | | (86,563 | ) | | | (1,207,559 | ) | | | (62,854 | ) | | | (764,245 | ) |
Shares issued in reorganization
(See Note 13) | | | 985,948 | | | | 15,361,065 | | | | — | | | | — | |
| Increase | | | 1,075,696 | | | $ | 16,657,948 | | | | 40,394 | | | $ | 490,632 | |
| * | Automatic conversion of Class B shares occurs on the 25th day of the month (or, if the 25th is not a business day, the next business day thereafter) following the eighth anniversary of the day on which the purchase order was accepted. |
As of the close of business on November 22, 2013, the Fund acquired the net assets of Classic Stock Fund pursuant to a plan of reorganization approved by Classic Stock Fund’s shareholders on November 8, 2013. The reorganization permitted Classic Stock Fund shareholders to pursue a substantially similar investment goal, but as part of a larger fund with a lower expense ratio. The
32
Notes to Financial Statements (concluded)
acquisition was accomplished by a tax-free exchange whereas holders of 23,633,500 shares of Classic Stock Fund outstanding on November 22, 2013 received 41,651,994 shares (valued at $650,352,193) of the Fund. Classic Stock Fund’s net assets at the date of the acquisition, including $115,759,472 of unrealized appreciation, $118,694 of distributions in excess of net investment income, and $1,160,711 of accumulated net realized losses, were combined with those of the Fund. The cost basis of securities received from Classic Stock Fund was carried forward.
The total net assets of the Fund immediately before the transfer were $1,436,419,664. Total net assets of Classic Stock Fund immediately before the transfer were $650,352,193. Total net assets of the Fund immediately after the transfer were $2,086,771,857.
The following table illustrates share conversion ratios of the reorganization on November 22, 2013:
| | Conversion |
| Class | Ratio |
| A | 1.777153 |
| B | 1.684206 |
| C | 1.684265 |
| F | 1.767125 |
| I | 1.767131 |
| P | 1.790855 |
| R2 | 1.756423 |
| R3 | 1.758074 |
Had the acquisition been completed on December 1, 2012, the beginning of the Fund’s current reporting period, the Fund’s condensed pro forma results of operations for the fiscal year ended November 30, 2013 would be as follows:
| Net investment income | $ | 28,148,727 |
| Net realized and unrealized gain | | 530,422,952 |
| Net increase in net assets resulting from operations | | 558,571,679 |
The combined investment portfolios have been managed as a single integrated portfolio since the acquisition was completed. Revenue and earnings of Classic Stock Fund’s portfolio holdings have been included in the Fund’s Statement of Operations since the date of acquisition.
| 14. | RECENT ACCOUNTING STANDARD |
In December 2011, the Financial Accounting Standards Board (“FASB”) issued Accounting Standards Update No. 2011–11 “Disclosures about Offsetting Assets and Liabilities” (“ASU 2011–11”). This disclosure requirement is intended to help investors and other financial statement users better assess the effect or potential effect of offsetting arrangements on a fund’s financial position. ASU 2011–11 requires entities to disclose both gross and net information about both instruments and transactions eligible for offset in the statement of assets and liabilities; and disclose instruments and transactions subject to an agreement similar to a master netting agreement. In addition, in January 2013, FASB issued Accounting Standards Update No. 2013–01 “Clarifying the Scope of Disclosures about Offsetting Assets and Liabilities” (“ASU 2013–01”), specifying exactly which transactions are subject to disclosures about offsetting. ASU 2011–11 and ASU 2013–01 are effective for public entities for interim and annual periods beginning on or after January 1, 2013. Management is currently evaluating the impact the adoption of ASU 2011–11 and ASU 2013–01 will have on the Fund’s financial statement disclosures.
33
Report of Independent Registered Public Accounting Firm
To the Board of Directors of Lord Abbett Research Fund, Inc. and the Shareholders of Lord Abbett Calibrated Dividend Growth Fund:
We have audited the accompanying statement of assets and liabilities, including the schedule of investments, of the Lord Abbett Calibrated Dividend Growth Fund, one of the three funds constituting the Lord Abbett Research Fund, Inc. (the “Company”) as of November 30, 2013, and the related statement of operations for the year then ended, the statements of changes in net assets for each of the two years in the period then ended, and the financial highlights for each of the five years in the period then ended. These financial statements and financial highlights are the responsibility of the Company’s management. Our responsibility is to express an opinion on these financial statements and financial highlights based on our audits.
We conducted our audits in accordance with the standards of the Public Company Accounting Oversight Board (United States). Those standards require that we plan and perform the audit to obtain reasonable assurance about whether the financial statements and financial highlights are free of material misstatement. The Company is not required to have, nor were we engaged to perform, an audit of its internal control over financial reporting. Our audits included consideration of internal control over financial reporting as a basis for designing audit procedures that are appropriate in the circumstances, but not for the purpose of expressing an opinion on the effectiveness of the Company’s internal control over financial reporting. Accordingly, we express no such opinion. An audit also includes examining, on a test basis, evidence supporting the amounts and disclosures in the financial statements, assessing the accounting principles used and significant estimates made by management, as well as evaluating the overall financial statement presentation. Our procedures included confirmation of securities owned as of November 30, 2013, by correspondence with the custodian and brokers; where replies were not received from brokers, we performed other auditing procedures. We believe that our audits provide a reasonable basis for our opinion.
In our opinion, such financial statements and financial highlights referred to above present fairly, in all material respects, the financial position of Lord Abbett Calibrated Dividend Growth Fund of the Lord Abbett Research Fund, Inc. as of November 30, 2013, the results of its operations for the year then ended, the changes in its net assets for each of the two years in the period then ended, and the financial highlights for each of the five years in the period then ended, in conformity with accounting principles generally accepted in the United States of America.
DELOITTE & TOUCHE LLP
New York, New York
January 29, 2014
34
Basic Information About Management
The Board is responsible for the management of the business and affairs of the Company in accordance with the laws of the State of Maryland. The Board elects officers who are responsible for the day-to-day operations of the Fund and who execute policies authorized by the Board. The Board also approves an investment adviser to the Fund and continues to monitor the cost and quality of the services the investment adviser provides, and annually considers whether to renew the contract with the adviser. Generally, each Director holds office until his/her successor is elected and qualified or until his/her earlier resignation or removal, as provided in the Company’s organizational documents.
Lord Abbett, a Delaware limited liability company, is the Company’s investment adviser. Designated Lord Abbett personnel are responsible for the day-to-day management of the Fund.
Interested Director
Ms. Foster is affiliated with Lord Abbett and is an “interested person” of the Company as defined in the Act. Ms. Foster is a director/trustee and officer of each of the 12 Lord Abbett-sponsored funds, which consist of 55 portfolios or series.
Name, Address and
Year of Birth | | Current Position and
Length of Service
with the Company | | Principal Occupation and Other Directorships
During the Past Five Years |
Daria L. Foster
Lord, Abbett & Co. LLC
90 Hudson Street
Jersey City, NJ 07302
(1954) | | Director and President since 2006; Chief Executive Officer since 2012 | | Principal Occupation: Managing Partner of Lord Abbett (since 2007), and was formerly Director of Marketing and Client Service, joined Lord Abbett in 1990. |
| | | | | Other Directorships: None. |
Independent Directors
The following Independent Directors also are directors/trustees of each of the 12 Lord Abbett-sponsored funds, which consist of 55 portfolios or series.
Name, Address and
Year of Birth | | Current Position and
Length of Service
with the Company | | Principal Occupation and Other Directorships
During the Past Five Years |
E. Thayer Bigelow
Lord, Abbett & Co. LLC
c/o Legal Dept.
90 Hudson Street
Jersey City, NJ 07302
(1941) | | Director since 1996; Chairman since 2013 | | Principal Occupation: Managing General Partner, Bigelow Media, LLC (since 2000); Senior Adviser, Time Warner Inc. (1998 – 2000).
Other Directorships: Currently serves as director of Crane Co. (since 1984) and Huttig Building Products Inc. (since 1998). Previously served as a director of R.H. Donnelley Inc. (2009 – 2010). |
| | | | | |
Robert B. Calhoun, Jr.
Lord, Abbett & Co. LLC
c/o Legal Dept.
90 Hudson Street
Jersey City, NJ 07302
(1942) | | Director since 1998 | | Principal Occupation: Senior Advisor of Monitor Clipper Partners, a private equity investment fund (since 1997); President of Clipper Asset Management Corp. (1991 – 2009).
Other Directorships: Previously served as a director of Interstate Bakeries Corp. (1991 – 2008). |
35
Basic Information About Management (continued)
Name, Address and
Year of Birth | | Current Position and
Length of Service
with the Company | | Principal Occupation and Other Directorships
During the Past Five Years |
Evelyn E. Guernsey
Lord, Abbett & Co. LLC
c/o Legal Dept.
90 Hudson Street
Jersey City, NJ 07302
(1955) | | Director since 2011 | | Principal Occupation: CEO, Americas of J.P. Morgan Asset Management (2004 – 2010).
Other Directorships: None. |
| | | | | |
Julie A. Hill
Lord, Abbett & Co. LLC
c/o Legal Dept.
90 Hudson Street
Jersey City, NJ 07302
(1946) | | Director since 2004 | | Principal Occupation: Owner and CEO of The Hill Company, a business consulting firm (since 1998).
Other Directorships: Currently serves as director of WellPoint, Inc., a health benefits company (since 1994). Previously served as a director of Lend Lease Corporation Limited, an international retail and residential property group (2006 – 2012). |
| | | | | |
Franklin W. Hobbs
Lord, Abbett & Co. LLC
c/o Legal Dept.
90 Hudson Street
Jersey City, NJ 07302
(1947) | | Director since 2001 | | Principal Occupation: Advisor of One Equity Partners, a private equity firm (since 2004).
Other Directorships: Currently serves as director and Chairman of the Board of Ally Financial Inc., a financial services firm (since 2009), and as director of Molson Coors Brewing Company (since 2002). |
| | | | | |
James M. McTaggart
Lord, Abbett & Co. LLC
c/o Legal Dept.
90 Hudson Street
Jersey City, NJ 07302
(1947) | | Director since 2012 | | Principal Occupation: Independent management advisor and consultant (since 2012); Vice President, CRA International, Inc. (doing business as Charles River Associates), a global management consulting firm (2009 – 2012); Founder and Chairman of Marakon Associates, Inc., a strategy consulting firm (1978 – 2009); and Officer and Director of Trinsum Group, a holding company (2007 – 2009).
Other Directorships: Currently serves as director of Blyth, Inc., a home products company (since 2004). |
| | | | | |
James L.L. Tullis
Lord, Abbett & Co. LLC
c/o Legal Dept.
90 Hudson Street
Jersey City, NJ 07302
(1947) | | Director since 2006 | | Principal Occupation: CEO of Tullis-Dickerson and Co. Inc., a venture capital management firm (since 1990); CEO of Tullis Health Investors Inc. (since 2012).
Other Directorships: Currently serves as director of Crane Co. (since 1998). Previously served as a director of Synageva BioPharma Corp., a biopharmaceutical company (2009 – 2011). |
Officers
None of the officers listed below have received compensation from the Company. All of the officers of the Company also may be officers of the other Lord Abbett-sponsored funds and maintain offices at 90 Hudson Street, Jersey City, NJ 07302. Unless otherwise indicated, the position(s) and title(s) listed under the “Principal Occupation During the Past Five Years” column indicate each officer’s position(s) and title(s) with Lord Abbett.
36
Basic Information About Management (continued)
Name and
Year of Birth | | Current Position
with the Company | | Length of Service
of Current
Position | | Principal Occupation
During the Past Five Years |
Daria L. Foster
(1954) | | President and Chief Executive Officer | | Elected as President in 2006 and Chief Executive Officer in 2012 | | Managing Partner of Lord Abbett (since 2007), and was formerly Director of Marketing and Client Service, joined Lord Abbett in 1990. |
| | | | | | | |
Robert I. Gerber
(1954) | | Executive Vice President | | Elected in 2007 | | Partner and Chief Investment Officer (since 2007), joined Lord Abbett in 1997 as Director of Taxable Fixed Income Management. |
| | | | | | | |
Thomas B. Maher
(1967) | | Executive Vice President | | Elected in 2013 | | Partner and Portfolio Manager, joined Lord Abbett in 2003. |
| | | | | | | |
Justin C. Maurer
(1969) | | Executive Vice President | | Elected in 2013 | | Partner and Portfolio Manager, joined Lord Abbett in 2001. |
| | | | | | | |
Walter H. Prahl
(1958) | | Executive Vice President | | Elected in 2012 | | Partner and Director, joined Lord Abbett in 1997. |
| | | | | | | |
Frederick J. Ruvkun
(1957) | | Executive Vice President | | Elected in 2012 | | Partner and Director, joined Lord Abbett in 2006. |
| | | | | | | |
Paul J. Volovich
(1973) | | Executive Vice President | | Elected in 2004 | | Partner and Director, joined Lord Abbett in 1997. |
| | | | | | | |
Joan A. Binstock
(1954) | | Chief Financial Officer and Vice President | | Elected in 1999 | | Partner and Chief Financial and Operations Officer, joined Lord Abbett in 1999. |
| | | | | | | |
John K. Forst
(1960) | | Vice President and Assistant Secretary | | Elected in 2005 | | Partner and Deputy General Counsel, joined Lord Abbett in 2004. |
| | | | | | | |
Lawrence H. Kaplan
(1957) | | Chief Compliance Officer, Vice President and Secretary | | Elected as Vice President and Secretary in 1997 and Chief Compliance Officer in 2013 | | Partner, General Counsel, and Chief Compliance Officer, joined Lord Abbett in 1997. |
| | | | | | | |
David J. Linsen
(1974) | | Vice President | | Elected in 2008 | | Partner and Director, joined Lord Abbett in 2001. |
| | | | | | | |
A. Edward Oberhaus, III
(1959) | | Vice President | | Elected in 1996 | | Partner and Director, joined Lord Abbett in 1983. |
37
Basic Information About Management (concluded)
Name and
Year of Birth | | Current Position
with the Company | | Length of Service
of Current
Position | | Principal Occupation
During the Past Five Years |
Thomas R. Phillips
(1960) | | Vice President and Assistant Secretary | | Elected in 2008 | | Partner and Deputy General Counsel, joined Lord Abbett in 2006. |
| | | | | | | |
Lawrence B. Stoller
(1963) | | Vice President and Assistant Secretary | | Elected in 2007 | | Partner and Senior Deputy General Counsel, joined Lord Abbett in 2007. |
| | | | | | | |
Scott S. Wallner
(1955) | | AML Compliance Officer | | Elected in 2011 | | Assistant General Counsel, joined Lord Abbett in 2004. |
| | | | | | | |
Bernard J. Grzelak
(1971) | | Treasurer | | Elected in 2003 | | Partner and Director of Fund Administration, joined Lord Abbett in 2003. |
Please call 888-522-2388 for a copy of the statement of additional information, which contains further information about the Company’s Directors. It is available free upon request.
38
Householding
The Company has adopted a policy that allows it to send only one copy of the Fund’s prospectus, proxy material, annual report and semiannual report to certain shareholders residing at the same “household.” This reduces Fund expenses, which benefits you and other shareholders. If you need additional copies or do not want your mailings to be “householded,” please call Lord Abbett at 888-522-2388 or send a written request with your name, the name of your fund or funds and your account number or numbers to Lord Abbett Family of Funds, P.O. Box 219336, Kansas City, MO 64121.
Proxy Voting Policies, Procedures and Records
A description of the policies and procedures that Lord Abbett uses to vote proxies related to the Fund’s portfolio securities, and information on how Lord Abbett voted the Fund’s proxies during the 12-month period ended June 30 are available without charge, upon request, (i) by calling 888-522-2388; (ii) on Lord Abbett’s Website at www.lordabbett.com; and (iii) on the Securities and Exchange Commission’s (“SEC”) Website at www.sec.gov.
Shareholder Reports and Quarterly Portfolio Disclosure
The Fund is required to file its complete schedule of portfolio holdings with the SEC for its first and third fiscal quarters on Form N-Q. Copies of the filings are available without charge, upon request on the SEC’s Website at www.sec.gov and may be available by calling Lord Abbett at 888-522-2388. You can also obtain copies of Form N-Q by visiting the SEC’s Public Reference Room in Washington, DC (information on the operation of the Public Reference Room may be obtained by calling 800-SEC-0330).
| | | |
| | Tax Information | |
| | | |
| | 84% of the ordinary income distributions paid by the Fund during the fiscal year ended November 30, 2013 is qualified dividend income. For corporate shareholders, only 81% of the Fund’s ordinary income distributions qualified for the dividends received deduction. | |
| | | |
| | For foreign shareholders, 22% of the distributions paid by the Fund represents interest related dividends. | |
| | | |
39


| This report, when not used for the general information of shareholders of the Fund, is to be distributed only if preceded or accompanied by a current fund prospectus. | | | | |
| | | Lord Abbett Research Fund, Inc. | | |
Abbett mutual fund shares are distributed by
LORD ABBETT DISTRIBUTOR LLC. | | Lord Abbett Calibrated Dividend Growth Fund | | CDG-2-1113
(01/14) |

2013
L O R D A B B E T T
A N N U A L
R E P O RT

Lord Abbett
Growth Opportunities Fund
For the fiscal year ended November 30, 2013

Table of Contents
Lord Abbett Research Fund
Lord Abbett Growth Opportunities Fund
Annual Report
For the fiscal year ended November 30, 2013

Daria L. Foster, Director, President and Chief Executive Officer of the Lord Abbett Funds, and E. Thayer Bigelow, Independent Chairman of the Lord Abbett Funds.
Dear Shareholders: We are pleased to provide you with this overview of the performance of Lord Abbett Growth Opportunities Fund for the fiscal year ended November 30, 2013. On this page and the following pages, we discuss the major factors that influenced fiscal year performance. For detailed and more timely information about the Fund, please visit our Website at www.lordabbett.com, where you also can access the quarterly commentaries that provide updates on the Fund’s performance and other portfolio related updates.
Thank you for investing in Lord Abbett mutual funds. We value the trust that you place in us and look forward to serving your investment needs in the years to come.
Best regards,

Daria L. Foster
Director, President and Chief Executive Officer
For the fiscal year ended November 30, 2013, the Fund returned 34.16%, reflecting performance at the net asset value (NAV) of Class A shares, with all distributions reinvested, compared to its benchmark, the Russell Midcap® Growth Index,1 which returned 33.91% over the same period.
Equity markets made considerable gains in the trailing 12-month period. Following the conclusion of the U.S. presidential election in November and the last-minute resolution of the “fiscal cliff” in December, equity markets shook off challenges and marched significantly
1
higher. By November, broad market equity indexes had achieved new highs.
We have been encouraged by the strength and nature of the stock market rally during the period, and are pleased with the Fund’s ability to outperform in this environment. Security selection within the financials sector was a notable contributor to relative Fund performance. IntercontinentalExchange Group, Inc., a network of regulated exchanges and clearing houses for financial and commodity markets, contributed to relative Fund performance within the sector. Shares of the company have moved higher throughout the year. Investors have benefited from increasing trading volume and the company’s recent purchase of the New York Stock Exchange. Asset manager Affiliated Managers Group, Inc. was also among the strongest contributors to relative Fund performance within the sector, as net asset flows continued to support strong revenue growth.
Within the health care sector, the Fund’s overweight and security selection also contributed to relative Fund performance. Actavis plc, a specialty pharmaceutical company that manufactures brand and biosimilar drugs, contributed to relative Fund performance within the sector. Shares rose after the company announced the purchase of specialty drug maker Warner Chilcott. Perrigo Co., a global health care supplier of drugs and infant formulas, also contributed to relative Fund performance. Sales rose more than 21% from the year-ago quarter in October 2013, sending Perrigo’s shares to all-time highs in the last month of the period.
Security selection within the energy sector detracted from relative Fund performance. Laredo Petroleum Holdings, Inc. and Cabot Oil and Gas Corp., developers of oil and natural gas, were among the largest detractors within the sector. Shares of Laredo Petroleum Holdings, Inc. declined after management reported production volumes lower than initially anticipated. Shares of Cabot Oil and Gas Corp. fell after a disappointing quarterly report; sales fell short of expectations.
Within the information technology sector, security selection was a detractor from relative Fund performance. Teradata Corp., a provider of data-warehousing solutions, was among the notable detractors from relative Fund performance within the sector. The company reported earnings and guidance below expectations, noting a softer than anticipated international business environment. Rackspace Hosting, Inc., a provider of cloud computing services, also saw its shares decline during the period. Although the company’s third quarter report indicated revenues had growth from the previous year, earnings fell short of estimates due to higher than anticipated expenses.
The Fund’s portfolio is actively managed and, therefore, its holdings and the weightings of a particular issuer or particular sector as a percentage of portfolio assets are subject to change. Sectors may include many industries.
2
1 The Russell Midcap® Growth Index measures the performance of those Russell Midcap companies with higher price-to-book ratios and higher forecasted growth values. The stocks are also members of the Russell 1000 Growth index.
Unless otherwise specified, indexes reflect total return, with all dividends reinvested. Indexes are unmanaged, do not reflect the deduction of fees or expenses, and are not available for direct investment.
Important Performance and Other Information
Performance data quoted in the following pages reflect past performance and are no guarantee of future results. Current performance may be higher or lower than the performance quoted. The investment return and principal value of an investment in the Fund will fluctuate so that shares, on any given day or when redeemed, may be worth more or less than their original cost. You can obtain performance data current to the most recent month end by calling Lord Abbett at 888-522-2388 or referring to www.lordabbett.com.
Except where noted, comparative Fund performance does not account for the deduction of sales charges and would be different if sales charges were included. The Fund offers classes of shares with distinct pricing options. For a full description of the differences in pricing alternatives, please see the Fund’s prospectus.
During certain periods shown, expense waivers and reimbursements were in place. Without such expense waivers and reimbursements, the Fund’s returns would have been lower.
The annual commentary above discusses the views of the Fund’s management and various portfolio holdings of the Fund as of November 30, 2013. These views and portfolio holdings may have changed after this date. Information provided in the commentary is not a recommendation to buy or sell securities. Because the Fund’s portfolio is actively managed and may change significantly, the Fund may no longer own the securities described above or may have otherwise changed its positions in the securities. For more recent information about the Fund’s portfolio holdings, please visit www.lordabbett.com.
A Note about Risk: See Notes to Financial Statements for a discussion of investment risks. For a more detailed discussion of the risks associated with the Fund, please see the Fund’s prospectus.
Mutual funds are not insured by the FDIC, are not deposits or other obligations of, or guaranteed by, banks, and are subject to investment risks including possible loss of principal amount invested.
3
Investment Comparison
Below is a comparison of a $10,000 investment in Class A shares with the same investment in both the Russell Midcap® Growth Index and the Russell Midcap® Index, assuming reinvestment of all dividends and distributions. The performance of other classes will be greater than or less than the performance shown in the graph below due to different sales loads and expenses applicable to such classes. The graph and performance table below do not reflect the deduction of taxes that a shareholder would pay on Fund distributions or the redemption of Fund shares. During certain periods, expenses of the Fund have been waived or reimbursed by Lord Abbett; without such waiver or reimbursement of expenses, the Fund’s returns would have been lower. Past performance is no guarantee of future results.

Average Annual Total Returns at Maximum Applicable
Sales Charge for the Periods Ended November 30, 2013
| | | 1 Year | | 5 Years | | 10 Years | | Life of Class |
| Class A3 | | 26.44% | | 18.41% | | 8.03% | | — |
| Class B4 | | 28.40% | | 18.86% | | 8.12% | | — |
| Class C5 | | 32.34% | | 19.07% | | 7.99% | | — |
| Class F6 | | 34.54% | | 20.13% | | — | | 7.34% |
| Class I7 | | 34.67% | | 20.24% | | 9.07% | | — |
| Class P7 | | 34.04% | | 19.71% | | 8.58% | | — |
| Class R28 | | 33.87% | | 19.52% | | — | | 6.82% |
| Class R39 | | 34.01% | | 19.67% | | — | | 6.94% |
1 Reflects the deduction of the maximum initial sales charge of 5.75%.
2 Performance for each unmanaged index does not reflect any fees or expenses. The performance of each index is not necessarily representative of the Fund’s performance.
3 Total return, which is the percentage change in net asset value, after deduction of the maximum initial sales charge of 5.75% applicable to Class A shares, with all dividends and distributions reinvested for the periods shown ended November 30, 2013, is calculated using the SEC-required uniform method to compute such return.
4 Performance reflects the deduction of a CDSC of 5% for 1 year, 2% for 5 years and 0% for 10 years. Class B shares automatically convert to Class A shares after approximately 8 years. (There is no initial sales charge for automatic conversions.) All returns for periods greater than 8 years reflect this conversion.
5 The 1% CDSC for Class C shares normally applies before the first anniversary of the purchase date. Performance for other periods is at net asset value.
6 Class F shares commenced operations and performance for the Class began on September 28, 2007. Performance is at net asset value.
7 Performance is at net asset value.
8 Class R2 shares commenced operations and performance for the Class began on September 28, 2007. Performance is at net asset value.
9 Class R3 shares commenced operations and performance for the Class began on September 28, 2007. Performance is at net asset value.
4
Expense Example
As a shareholder of the Fund, you incur two types of costs: (1) transaction costs, including sales charges (loads) on purchase payments (these charges vary among the share classes); and (2) ongoing costs, including management fees; distribution and service (12b-1) fees (these charges vary among the share classes); and other Fund expenses. This Example is intended to help you understand your ongoing costs (in dollars) of investing in the Fund and to compare these costs with the ongoing costs of investing in other mutual funds.
The Example is based on an investment of $1,000 invested at the beginning of the period and held for the entire period (June 1, 2013 through November 30, 2013).
Actual Expenses
For each class of the Fund, the first line of the table on the following page provides information about actual account values and actual expenses. You may use the information in this line, together with the amount you invested, to estimate the expenses that you paid over the period. Simply divide your account value by $1,000 (for example, an $8,600 account value divided by $1,000 = 8.6), then multiply the result by the number in the first line under the heading titled “Expenses Paid During Period 6/1/13 – 11/30/13” to estimate the expenses you paid on your account during this period.
Hypothetical Example for Comparison Purposes
For each class of the Fund, the second line of the table on the following page provides information about hypothetical account values and hypothetical expenses based on the Fund’s actual expense ratio and an assumed rate of return of 5% per year before expenses, which is not the Fund’s actual return. The hypothetical account values and expenses may not be used to estimate the actual ending account balance or expenses you paid for the period. You may use this information to compare the ongoing costs of investing in the Fund and other funds. To do so, compare this 5% hypothetical example with the 5% hypothetical examples that appear in the shareholder reports of the other funds.
5
Please note that the expenses shown in the table are meant to highlight your ongoing costs only and do not reflect any transactional costs, such as sales charges (loads). Therefore, the second line of the table is useful in comparing ongoing costs only, and will not help you determine the relative total costs of owning different funds. In addition, if these transactional costs were included, your costs would have been higher.
| | | Beginning | | Ending | | Expenses | |
| | | Account | | Account | | Paid During | |
| | | Value | | Value | | Period† | |
| | | | | | | 6/1/13 - | |
| | | 6/1/13 | | 11/30/13 | | 11/30/13 | |
| Class A | | | | | | | | | | | | |
| Actual | | | $1,000.00 | | $ | 1,139.20 | | | $ | 7.56 | | |
| Hypothetical (5% Return Before Expenses) | | | $1,000.00 | | $ | 1,018.02 | | | $ | 7.13 | | |
| Class B | | | | | | | | | | | | |
| Actual | | | $1,000.00 | | $ | 1,136.40 | | | $ | 10.98 | | |
| Hypothetical (5% Return Before Expenses) | | | $1,000.00 | | $ | 1,014.79 | | | $ | 10.35 | | |
| Class C | | | | | | | | | | | | |
| Actual | | | $1,000.00 | | $ | 1,135.90 | | | $ | 10.92 | | |
| Hypothetical (5% Return Before Expenses) | | | $1,000.00 | | $ | 1,014.84 | | | $ | 10.30 | | |
| Class F | | | | | | | | | | | | |
| Actual | | | $1,000.00 | | $ | 1,140.90 | | | $ | 6.23 | | |
| Hypothetical (5% Return Before Expenses) | | | $1,000.00 | | $ | 1,019.27 | | | $ | 5.87 | | |
| Class I | | | | | | | | | | | | |
| Actual | | | $1,000.00 | | $ | 1,141.40 | | | $ | 5.69 | | |
| Hypothetical (5% Return Before Expenses) | | | $1,000.00 | | $ | 1,019.77 | | | $ | 5.37 | | |
| Class P | | | | | | | | | | | | |
| Actual | | | $1,000.00 | | $ | 1,139.00 | | | $ | 8.10 | | |
| Hypothetical (5% Return Before Expenses) | | | $1,000.00 | | $ | 1,017.51 | | | $ | 7.64 | | |
| Class R2 | | | | | | | | | | | | |
| Actual | | | $1,000.00 | | $ | 1,138.30 | | | $ | 8.90 | | |
| Hypothetical (5% Return Before Expenses) | | | $1,000.00 | | $ | 1,016.76 | | | $ | 8.39 | | |
| Class R3 | | | | | | | | | | | | |
| Actual | | | $1,000.00 | | $ | 1,138.60 | | | $ | 8.31 | | |
| Hypothetical (5% Return Before Expenses) | | | $1,000.00 | | $ | 1,017.28 | | | $ | 7.84 | | |
| † | For each class of the Fund, net expenses are equal to the annualized expense ratio for such class (1.41% for Class A, 2.05% for Class B, 2.04% for Class C, 1.16% for Class F, 1.06% for Class I, 1.51% for Class P, 1.66% for Class R2 and 1.55% for Class R3) multiplied by the average account value over the period, multiplied by 183/365 (to reflect one-half year period). |
Portfolio Holdings Presented by Sector
November 30, 2013
| Sector* | | %** | | |
| Consumer Discretionary | | 29.33% | | |
| Consumer Staples | | 4.07% | | |
| Energy | | 3.57% | | |
| Financials | | 9.35% | | |
| Health Care | | 16.59% | | |
| | | | | |
| Sector* | | %** | | |
| Industrials | | 18.42% | | |
| Information Technology | | 15.81% | | |
| Materials | | 1.27% | | |
| Telecommunication Services | | 1.26% | | |
| Repurchase Agreement | | 0.33% | | |
| Total | | 100.00% | | |
| * | A sector may comprise several industries. |
| ** | Represents percent of total investments. |
6
Schedule of Investments
November 30, 2013
| | | | | | Fair | |
| | | | | | Value | |
| Investments | | Shares | | | (000) | |
| COMMON STOCKS 99.90% | | | | | | | | |
| | | | | | | | | |
| Aerospace & Defense 1.55% | | | | | | | | |
| B/E Aerospace, Inc.* | | | 118,097 | | | $ | 10,274 | |
| | | | | | | | | |
| Airlines 1.28% | | | | | | | | |
| United Continental Holdings, Inc.* | | | 215,922 | | | | 8,475 | |
| | | | | | | | | |
| Auto Components 1.51% | | | | | | | | |
| BorgWarner, Inc. | | | 93,370 | | | | 10,006 | |
| | | | | | | | | |
| Automobiles 1.42% | | | | | | | | |
| Harley-Davidson, Inc. | | | 140,880 | | | | 9,442 | |
| | | | | | | | | |
| Biotechnology 2.97% | | | | | | | | |
| Alkermes plc (Ireland)*(a) | | | 102,837 | | | | 4,153 | |
| BioMarin Pharmaceutical, Inc.* | | | 65,613 | | | | 4,618 | |
| Incyte Corp.* | | | 76,203 | | | | 3,551 | |
| Isis Pharmaceuticals, Inc.* | | | 29,349 | | | | 1,138 | |
| Medivation, Inc.* | | | 46,110 | | | | 2,905 | |
| Pharmacyclics, Inc.* | | | 26,920 | | | | 3,352 | |
| Total | | | | | | | 19,717 | |
| | | | | | | | | |
| Building Products 2.55% | | | | | | | | |
| A.O. Smith Corp. | | | 65,869 | | | | 3,567 | |
| Fortune Brands Home & Security, Inc. | | | 155,171 | | | | 6,765 | |
| Lennox International, Inc. | | | 80,451 | | | | 6,629 | |
| Total | | | | | | | 16,961 | |
| | | | | | | | | |
| Capital Markets 3.08% | | | | | | | | |
| Affiliated Managers Group, Inc.* | | | 60,721 | | | | 12,159 | |
| Artisan Partners Asset Management, Inc. | | | 49,887 | | | | 3,079 | |
| Invesco Ltd. | | | 150,300 | | | | 5,238 | |
| Total | | | | | | | 20,476 | |
| | | | | | | | | |
| Chemicals 0.67% | | | | | | | | |
| Celanese Corp. Series A | | | 79,666 | | | | 4,472 | |
| | | | | | | | | |
| Commercial Banks 1.00% | | | | | | | | |
| First Republic Bank | | | 129,577 | | | | 6,621 | |
| | | | | | Fair | |
| | | | | | Value | |
| Investments | | Shares | | | (000) | |
| Communications Equipment 0.60% | | | | | | | | |
| Ruckus Wireless, Inc.* | | | 305,481 | | | $ | 3,984 | |
| | | | | | | | | |
| Computers & Peripherals 0.50% | | | | | | | | |
| NCR Corp.* | | | 95,186 | | | | 3,327 | |
| | | | | | | | | |
| Construction & Engineering 0.73% | | | | | | | | |
| KBR, Inc. | | | 143,084 | | | | 4,841 | |
| | | | | | | | | |
| Containers & Packaging 0.60% | | | | | | | | |
| Ball Corp. | | | 79,305 | | | | 3,964 | |
| | | | | | | | | |
| Distributors 1.64% | | | | | | | | |
| LKQ Corp.* | | | 329,758 | | | | 10,932 | |
| | | | | | | | | |
| Diversified Financial Services 4.08% | | | | | | | | |
| CBOE Holdings, Inc. | | | 118,723 | | | | 6,207 | |
| IntercontinentalExchange Group, Inc.* | | | 66,514 | | | | 14,187 | |
| Moody’s Corp. | | | 89,865 | | | | 6,706 | |
| Total | | | | | | | 27,100 | |
| | | | | | | | | |
| Electrical Equipment 3.25% | | | | | | | | |
| AMETEK, Inc. | | | 193,375 | | | | 9,518 | |
| Hubbell, Inc. Class B | | | 46,421 | | | | 5,009 | |
| Rockwell Automation, Inc. | | | 61,982 | | | | 7,040 | |
| Total | | | | | | | 21,567 | |
| | | | | | | | | |
| Electronic Equipment, Instruments & Components 0.99% | | | | | | | | |
| IPG Photonics Corp. | | | 36,649 | | | | 2,658 | |
| Trimble Navigation Ltd.* | | | 122,978 | | | | 3,923 | |
| Total | | | | | | | 6,581 | |
| | | | | | | | | |
| Energy Equipment & Services 0.77% | | | | | | | | |
| Oceaneering International, Inc. | | | 65,889 | | | | 5,086 | |
| | | | | | | | | |
| Food & Staples Retailing 1.77% | | | | | | | | |
| Kroger Co. (The) | | | 186,537 | | | | 7,788 | |
| United Natural Foods, Inc.* | | | 57,530 | | | | 3,961 | |
| Total | | | | | | | 11,749 | |
| | See Notes to Financial Statements. | 7 |
Schedule of Investments (continued)
November 30, 2013
| | | | | | Fair | |
| | | | | | Value | |
| Investments | | Shares | | | (000) | |
| Food Products 2.31% | | | | | | | | |
| Flowers Foods, Inc. | | | 182,031 | | | $ | 3,956 | |
| Hain Celestial Group, Inc. (The)* | | | 73,992 | | | | 6,118 | |
| WhiteWave Foods Co. Class A* | | | 248,394 | | | | 5,283 | |
| Total | | | | | | | 15,357 | |
| | | | | | | | | |
| Health Care Equipment & Supplies 1.29% | | | | | | | | |
| C.R. Bard, Inc. | | | 61,919 | | | | 8,599 | |
| | | | | | | | | |
| Health Care Providers & Services 4.10% | | | | | | | | |
| Cardinal Health, Inc. | | | 59,341 | | | | 3,834 | |
| DaVita HealthCare Partners, Inc.* | | | 46,673 | | | | 2,779 | |
| Envision Healthcare Holdings, Inc.* | | | 120,561 | | | | 3,571 | |
| Henry Schein, Inc.* | | | 53,222 | | | | 6,067 | |
| Team Health Holdings, Inc.* | | | 59,065 | | | | 2,760 | |
| Universal Health Services, Inc. Class B | | | 100,017 | | | | 8,245 | |
| Total | | | | | | | 27,256 | |
| | | | | | | | | |
| Health Care Technology 1.34% | | | | | | | | |
| Cerner Corp.* | | | 154,862 | | | | 8,900 | |
| | | | | | | | | |
| Hotels, Restaurants & Leisure 5.74% | | | | | | | | |
| Chipotle Mexican Grill, Inc.* | | | 17,767 | | | | 9,307 | |
| Dunkin’ Brands Group, Inc. | | | 195,244 | | | | 9,563 | |
| Starwood Hotels & Resorts Worldwide, Inc. | | | 94,391 | | | | 7,030 | |
| Wyndham Worldwide Corp. | | | 77,802 | | | | 5,579 | |
| Wynn Resorts Ltd. | | | 40,282 | | | | 6,682 | |
| Total | | | | | | | 38,161 | |
| | | | | | | | | |
| Household Durables 1.26% | | | | | | | | |
| Mohawk Industries, Inc.* | | | 59,715 | | | | 8,361 | |
| | | | | | | | | |
| Information Technology Services 3.86% | | | | | | | | |
| Alliance Data Systems Corp.* | | | 44,256 | | | | 10,721 | |
| FleetCor Technologies, Inc.* | | | 60,556 | | | | 7,375 | |
| Vantiv, Inc. Class A* | | | 249,459 | | | | 7,559 | |
| Total | | | | | | | 25,655 | |
| | | | | | Fair | |
| | | | | | Value | |
| Investments | | Shares | | | (000) | |
| Insurance 1.22% | | | | | | | | |
| Hartford Financial Services Group, Inc. (The) | | | 46,879 | | | $ | 1,670 | |
| Lincoln National Corp. | | | 125,247 | | | | 6,429 | |
| Total | | | | | | | 8,099 | |
| | | | | | | | | |
| Internet & Catalog Retail 2.27% | | | | | | | | |
| Groupon, Inc.* | | | 324,658 | | | | 2,938 | |
| Netflix, Inc.* | | | 16,863 | | | | 6,169 | |
| TripAdvisor, Inc.* | | | 64,655 | | | | 5,710 | |
| zulily, Inc. Class A* | | | 8,395 | | | | 294 | |
| Total | | | | | | | 15,111 | |
| | | | | | | | | |
| Internet Software & Services 2.94% | | | | | | | | |
| Akamai Technologies, Inc.* | | | 93,670 | | | | 4,189 | |
| Pandora Media, Inc.* | | | 239,144 | | | | 6,792 | |
| Twitter, Inc.* | | | 81,187 | | | | 3,375 | |
| VeriSign, Inc.* | | | 91,049 | | | | 5,177 | |
| Total | | | | | | | 19,533 | |
| | | | | | | | | |
| Leisure Equipment & Products 2.36% | | | | | | | | |
| Hasbro, Inc. | | | 133,765 | | | | 7,199 | |
| Polaris Industries, Inc. | | | 63,819 | | | | 8,518 | |
| Total | | | | | | | 15,717 | |
| | | | | | | | | |
| Life Sciences Tools & Services 2.45% | | | | | | | | |
| Agilent Technologies, Inc. | | | 108,446 | | | | 5,809 | |
| Illumina, Inc.* | | | 73,641 | | | | 7,217 | |
| Waters Corp.* | | | 32,739 | | | | 3,259 | |
| Total | | | | | | | 16,285 | |
| | | | | | | | | |
| Machinery 5.67% | | | | | | | | |
| Flowserve Corp. | | | 130,450 | | | | 9,312 | |
| IDEX Corp. | | | 138,315 | | | | 9,866 | |
| Ingersoll-Rand plc (Ireland)(a) | | | 87,038 | | | | 6,216 | |
| SPX Corp. | | | 58,665 | | | | 5,552 | |
| WABCO Holdings, Inc.* | | | 75,687 | | | | 6,706 | |
| Total | | | | | | | 37,652 | |
| | | | | | | | | |
| Media 1.10% | | | | | | | | |
| Scripps Networks Interactive, Inc. Class A | | | 97,881 | | | | 7,301 | |
| 8 | See Notes to Financial Statements. | |
Schedule of Investments (continued)
November 30, 2013
| | | | | | Fair | |
| | | | | | Value | |
| Investments | | Shares | | | (000) | |
| Multi-Line Retail 1.27% | | | | | | | | |
| Dollar General Corp.* | | | 147,896 | | | $ | 8,421 | |
| | | | | | | | | |
| Oil, Gas & Consumable Fuels 2.81% | | | | | | | | |
| Concho Resources, Inc.* | | | 47,659 | | | | 4,953 | |
| Diamondback Energy, Inc.* | | | 26,380 | | | | 1,312 | |
| EQT Corp. | | | 59,423 | | | | 5,058 | |
| Laredo Petroleum Holdings, Inc.* | | | 99,973 | | | | 2,698 | |
| Range Resources Corp. | | | 60,309 | | | | 4,683 | |
| Total | | | | | | | 18,704 | |
| | | | | | | | | |
| Pharmaceuticals 4.47% | | | | | | | | |
| Actavis plc* | | | 68,627 | | | | 11,191 | |
| Mylan, Inc.* | | | 156,992 | | | | 6,928 | |
| Perrigo Co. | | | 74,393 | | | | 11,597 | |
| Total | | | | | | | 29,716 | |
| | | | | | | | | |
| Professional Services 1.67% | | | | | | | | |
| Towers Watson & Co. Class A | | | 49,474 | | | | 5,571 | |
| Verisk Analytics, Inc. Class A* | | | 85,259 | | | | 5,551 | |
| Total | | | | | | | 11,122 | |
| | | | | | | | | |
| Road & Rail 0.96% | | | | | | | | |
| Kansas City Southern | | | 52,480 | | | | 6,351 | |
| | | | | | | | | |
| Semiconductors & Semiconductor Equipment 2.60% | | | | | | | | |
| Avago Technologies Ltd. (Singapore)(a) | | | 166,350 | | | | 7,441 | |
| Micron Technology, Inc.* | | | 230,157 | | | | 4,856 | |
| NXP Semiconductors NV (Netherlands)*(a) | | | 117,182 | | | | 4,980 | |
| Total | | | | | | | 17,277 | |
| | | | | | Fair | |
| | | | | | Value | |
| Investments | | Shares | | | (000) | |
| Software 5.38% | | | | | | | | |
| Autodesk, Inc.* | | | 58,752 | | | $ | 2,658 | |
| Concur Technologies, Inc.* | | | 39,551 | | | | 3,840 | |
| Electronic Arts, Inc.* | | | 182,921 | | | | 4,057 | |
| Qlik Technologies, Inc.* | | | 68,923 | | | | 1,729 | |
| Red Hat, Inc.* | | | 113,119 | | | | 5,300 | |
| ServiceNow, Inc.* | | | 155,380 | | | | 8,252 | |
| Splunk, Inc.* | | | 58,826 | | | | 4,245 | |
| TIBCO Software, Inc.* | | | 233,177 | | | | 5,636 | |
| Total | | | | | | | 35,717 | |
| | | | | | | | | |
| Specialty Retail 6.23% | | | | | | | | |
| Dick’s Sporting Goods, Inc. | | | 112,141 | | | | 6,338 | |
| GNC Holdings, Inc. Class A | | | 167,055 | | | | 10,053 | |
| Ross Stores, Inc. | | | 121,511 | | | | 9,291 | |
| Tiffany & Co. | | | 67,331 | | | | 6,002 | |
| Tractor Supply Co. | | | 132,504 | | | | 9,701 | |
| Total | | | | | | | 41,385 | |
| | | | | | | | | |
| Textiles, Apparel & Luxury Goods 3.57% | | | | | | | | |
| Michael Kors Holdings Ltd. (Hong Kong)*(a) | | | 87,188 | | | | 7,110 | |
| Ralph Lauren Corp. | | | 38,446 | | | | 6,737 | |
| VF Corp. | | | 42,101 | | | | 9,876 | |
| Total | | | | | | | 23,723 | |
| | | | | | | | | |
| Trading Companies & Distributors 0.81% | | | | | | | | |
| WESCO International, Inc.* | | | 62,729 | | | | 5,393 | |
| | | | | | | | | |
| Wireless Telecommunication Services 1.26% | | | | | | | | |
| SBA Communications Corp. Class A* | | | 98,474 | | | | 8,387 | |
Total Common Stocks
(cost $514,319,338) | | | | | | $ | 663,758 | |
| | See Notes to Financial Statements. | 9 |
Schedule of Investments (concluded)
November 30, 2013
| | | Principal | | | Fair | |
| | | Amount | | | Value | |
| Investments | | (000) | | | (000) | |
| SHORT-TERM INVESTMENT 0.33% | | | | | | | | |
| | | | | | | | | |
| Repurchase Agreement | | | | | | | | |
Repurchase Agreement dated 11/29/2013, Zero Coupon due 12/2/2013 with Fixed Income Clearing Corp. collateralized by $2,110,000 of Federal Home Loan Bank at 5.25% due 6/18/2014; value: $2,218,138; proceeds: $2,172,190
(cost $2,172,190) | | $ | 2,172 | | | $ | 2,172 | |
Total Investments in Securities 100.23%
(cost $516,491,528) | | | | | | | 665,930 | |
| Liabilities in Excess of Cash and Other Assets (0.23)% | | | | | | | (1,504 | ) |
| Net Assets 100.00% | | | | | | $ | 664,426 | |
| * | | Non-income producing security. |
| (a) | | Foreign security traded in U.S. dollars. |
The following is a summary of the inputs used as of November 30, 2013 in valuing the Fund’s investments carried at fair value(1):
| | | Level 1 | | | Level 2 | | | Level 3 | | | Total | |
| Investment Type(2)(3) | | (000) | | | (000) | | | (000) | | | (000) | |
| Common Stocks | | $ | 663,758 | | | $ | — | | | | $— | | | $ | 663,758 | |
| Repurchase Agreement | | | — | | | | 2,172 | | | | — | | | | 2,172 | |
| Total | | $ | 663,758 | | | $ | 2,172 | | | | $— | | | $ | 665,930 | |
| (1) | | Refer to note 2(h) for a description of fair value measurements and the three-tier hierarchy of inputs. |
| (2) | | See Schedule of Investments for fair values in each industry and identification of foreign issuers and/or geography. |
| (3) | | There were no level transfers during the fiscal year ended November 30, 2013. |
| 10 | See Notes to Financial Statements. | |
This page is intentionally left blank.
Statement of Assets and Liabilities
November 30, 2013
| ASSETS: | | | | |
| Investments in securities, at fair value (cost $516,491,528) | | $ | 65,929,941 | |
| Cash | | | 755,256 | |
| Receivables: | | | | |
| Investment securities sold | | | 5,072,431 | |
| Dividends | | | 489,292 | |
| Capital shares sold | | | 303,913 | |
| Prepaid expenses and other assets | | | 50,748 | |
| Total assets | | | 672,601,581 | |
| LIABILITIES: | | | | |
| Payables: | | | | |
| Investment securities purchased | | | 6,590,355 | |
| Capital shares reacquired | | | 618,848 | |
| Management fee | | | 407,286 | |
| 12b-1 distribution fees | | | 213,623 | |
| Directors’ fees | | | 93,107 | |
| Fund administration | | | 21,722 | |
| To affiliate (See Note 3) | | | 8,085 | |
| Distributions payable | | | 637 | |
| Accrued expenses | | | 221,820 | |
| Total liabilities | | | 8,175,483 | |
| NET ASSETS | | $ | 664,426,098 | |
| COMPOSITION OF NET ASSETS: | | | | |
| Paid-in capital | | $ | 406,018,862 | |
| Accumulated net investment loss | | | (93,107 | ) |
| Accumulated net realized gain on investments | | | 109,061,930 | |
| Net unrealized appreciation on investments | | | 149,438,413 | |
| Net Assets | | $ | 664,426,098 | |
| 12 | See Notes to Financial Statements. | |
Statement of Assets and Liabilities (concluded)
November 30, 2013
| Net assets by class: | | | | |
| Class A Shares | | $ | 428,573,343 | |
| Class B Shares | | $ | 16,020,090 | |
| Class C Shares | | $ | 62,814,648 | |
| Class F Shares | | $ | 17,738,831 | |
| Class I Shares | | $ | 99,818,875 | |
| Class P Shares | | $ | 4,723,324 | |
| Class R2 Shares | | $ | 1,435,979 | |
| Class R3 Shares | | $ | 33,301,008 | |
| Outstanding shares by class: | | | | |
| Class A Shares (100 million shares of common stock authorized, $.001 par value) | | | 16,672,945 | |
| Class B Shares (30 million shares of common stock authorized, $.001 par value) | | | 712,108 | |
| Class C Shares (20 million shares of common stock authorized, $.001 par value) | | | 2,792,845 | |
| Class F Shares (30 million shares of common stock authorized, $.001 par value) | | | 678,264 | |
| Class I Shares (30 million shares of common stock authorized, $.001 par value) | | | 3,637,004 | |
| Class P Shares (20 million shares of common stock authorized, $.001 par value) | | | 185,273 | |
| Class R2 Shares (30 million shares of common stock authorized, $.001 par value) | | | 56,822 | |
| Class R3 Shares (30 million shares of common stock authorized, $.001 par value) | | | 1,307,370 | |
| Net asset value, offering and redemption price per share | | | | |
| (Net assets divided by outstanding shares): | | | | |
| Class A Shares-Net asset value | | | $25.70 | |
| Class A Shares-Maximum offering price | | | | |
| (Net asset value plus sales charge of 5.75%) | | | $27.27 | |
| Class B Shares-Net asset value | | | $22.50 | |
| Class C Shares-Net asset value | | | $22.49 | |
| Class F Shares-Net asset value | | | $26.15 | |
| Class I Shares-Net asset value | | | $27.45 | |
| Class P Shares-Net asset value | | | $25.49 | |
| Class R2 Shares-Net asset value | | | $25.27 | |
| Class R3 Shares-Net asset value | | | $25.47 | |
| See Notes to Financial Statements. | 13 |
Statement of Operations
For the Year Ended November 30, 2013
| Investment income: | | | |
| Dividends | | $ | 5,391,748 | |
| Total investment income | | | 5,391,748 | |
| Expenses: | | | | |
| Management fee | | | 4,521,224 | |
| 12b-1 distribution plan-Class A | | | 1,368,215 | |
| 12b-1 distribution plan-Class B | | | 172,575 | |
| 12b-1 distribution plan-Class C | | | 561,492 | |
| 12b-1 distribution plan-Class F | | | 15,877 | |
| 12b-1 distribution plan-Class P | | | 20,786 | |
| 12b-1 distribution plan-Class R2 | | | 8,524 | |
| 12b-1 distribution plan-Class R3 | | | 165,971 | |
| Shareholder servicing | | | 1,226,240 | |
| Fund administration | | | 241,132 | |
| Reports to shareholders | | | 96,051 | |
| Registration | | | 87,906 | |
| Subsidy (See Note 3) | | | 73,385 | |
| Professional | | | 51,381 | |
| Custody | | | 27,421 | |
| Directors’ fees | | | 20,723 | |
| Other | | | 21,999 | |
| Gross expenses | | | 8,680,902 | |
| Expense reductions (See Note 7) | | | (689 | ) |
| Net expenses | | | 8,680,213 | |
| Net investment loss | | | (3,288,465 | ) |
| Net realized and unrealized gain: | | | | |
| Net realized gain on investments | | | 118,626,384 | |
| Net change in unrealized appreciation/depreciation on investments | | | 60,797,930 | |
| Net realized and unrealized gain | | | 179,424,314 | |
| Net Increase in Net Assets Resulting From Operations | | $ | 176,135,849 | |
| 14 | See Notes to Financial Statements. | |
Statements of Changes in Net Assets
| | | For the Year Ended | | | For the Year Ended | |
| INCREASE (DECREASE) IN NET ASSETS | | November 30, 2013 | | | November 30, 2012 | |
| Operations: | | | | | | | | |
| Net investment loss | | $ | (3,288,465 | ) | | $ | (3,151,720 | ) |
| Net realized gain on investments | | | 118,626,384 | | | | 4,522,726 | |
| Net change in unrealized appreciation/depreciation on investments | | | 60,797,930 | | | | 36,142,849 | |
| Net increase in net assets resulting from operations | | | 176,135,849 | | | | 37,513,855 | |
| Distributions to shareholders from: | | | | | | | | |
| Net realized gain | | | | | | | | |
| Class A | | | (71,093 | ) | | | (57,249,604 | ) |
| Class B | | | (4,257 | ) | | | (4,741,520 | ) |
| Class C | | | (11,827 | ) | | | (9,503,812 | ) |
| Class F | | | (2,702 | ) | | | (2,098,553 | ) |
| Class I | | | (14,292 | ) | | | (8,753,376 | ) |
| Class P | | | (1,010 | ) | | | (1,190,196 | ) |
| Class R2 | | | (305 | ) | | | (246,617 | ) |
| Class R3 | | | (6,481 | ) | | | (4,051,050 | ) |
| Total distributions to shareholders | | | (111,967 | ) | | | (87,834,728 | ) |
| Capital share transactions (Net of share conversions) (See Note 11): | | | | | |
| Net proceeds from sales of shares | | | 80,204,766 | | | | 152,188,571 | |
| Reinvestment of distributions | | | 106,849 | | | | 80,781,206 | |
| Cost of shares reacquired | | | (143,148,401 | ) | | | (220,478,222 | ) |
| Net increase (decrease) in net assets resulting from capital share transactions | | | (62,836,786 | ) | | | 12,491,555 | |
| Net increase (decrease) in net assets | | | 113,187,096 | | | | (37,829,318 | ) |
| NET ASSETS: | | | | | | | | |
| Beginning of year | | $ | 551,239,002 | | | $ | 589,068,320 | |
| End of year | | $ | 664,426,098 | | | $ | 551,239,002 | |
| Accumulated net investment loss | | $ | (93,107 | ) | | $ | (3,298,671 | ) |
| | See Notes to Financial Statements. | 15 |
Financial Highlights
| | | Class A Shares | |
| | | Year Ended 11/30 | |
| | | | 2013 | | | 2012 | | | 2011 | | | 2010 | | | 2009 | |
| Per Share Operating Performance | | | | | | | | | | | | | | | | |
| Net asset value, beginning of year | | | $19.16 | | | $21.30 | | | $21.44 | | | $17.13 | | | $12.93 | |
| Investment operations: | | | | | | | | | | | | | | | | |
| Net investment loss(a) | | | (.12 | ) | | (.09 | ) | | (.14 | ) | | (.12 | ) | | (.08 | ) |
| Net realized and unrealized gain | | | 6.66 | | | 1.12 | | | — | | | 4.43 | | | 4.84 | |
| Total from investment operations | | | 6.54 | | | 1.03 | | | (.14 | ) | | 4.31 | | | 4.76 | |
| Distributions to shareholders from: | | | | | | | | | | | | | | | | |
| Net realized gain | | | — | (b) | | (3.17 | ) | | — | | | — | | | (.56 | ) |
| Net asset value, end of year | | | $25.70 | | | $19.16 | | | $21.30 | | | $21.44 | | | $17.13 | |
| Total Return(c) | | | 34.16 | % | | 6.96 | % | | (.65 | )% | | 25.16 | % | | 38.43 | % |
| Ratios to Average Net Assets: | | | | | | | | | | | | | | | | |
| Expenses, excluding expense reductions and including management fee waived and expenses reimbursed | | | 1.40 | % | | 1.42 | % | | 1.45 | % | | 1.47 | % | | 1.55 | % |
| Expenses, including expense reductions, management fee waived and expenses reimbursed | | | 1.40 | % | | 1.42 | % | | 1.45 | % | | 1.47 | % | | 1.55 | % |
| Expenses, excluding expense reductions, management fee waived and expenses reimbursed | | | 1.40 | % | | 1.44 | % | | 1.46 | % | | 1.50 | % | | 1.61 | % |
| Net investment loss | | | (.51 | )% | | (.48 | )% | | (.64 | )% | | (.61 | )% | | (.57 | )% |
| | | | | | | | | | | | | | | | | |
| Supplemental Data: | | | | | | | | | | | | | | | | |
| Net assets, end of year (000) | | | $428,573 | | | $351,427 | | | $389,211 | | | $454,561 | | | $414,930 | |
| Portfolio turnover rate | | | 118.03 | % | | 145.62 | % | | 121.66 | % | | 103.81 | % | | 80.21 | % |
| (a) | Calculated using average shares outstanding during the year. |
| (b) | Amount is less than $.01. |
| (c) | Total return does not consider the effects of sales loads and assumes the reinvestment of all distributions. |
| 16 | See Notes to Financial Statements. | |
Financial Highlights (continued)
| | | Class B Shares | |
| | | Year Ended 11/30 | |
| | | | 2013 | | | 2012 | | | 2011 | | | 2010 | | | 2009 | |
| Per Share Operating Performance | | | | | | | | | | | | |
| Net asset value, beginning of year | | | $16.88 | | | $19.27 | | | $19.52 | | | $15.70 | | | $11.97 | |
| Investment operations: | | | | | | | | | | | | | | | | |
| Net investment loss(a) | | | (.22 | ) | | (.19 | ) | | (.26 | ) | | (.22 | ) | | (.16 | ) |
| Net realized and unrealized gain | | | 5.84 | | | .97 | | | .01 | | | 4.04 | | | 4.45 | |
| Total from investment operations | | | 5.62 | | | .78 | | | (.25 | ) | | 3.82 | | | 4.29 | |
| Distributions to shareholders from: | | | | | | | | | | | | | | | | |
| Net realized gain | | | — | (b) | | (3.17 | ) | | — | | | — | | | (.56 | ) |
| Net asset value, end of year | | | $22.50 | | | $16.88 | | | $19.27 | | | $19.52 | | | $15.70 | |
| Total Return(c) | | | 33.40 | % | | 6.22 | % | | (1.28 | )% | | 24.33 | % | | 37.55 | % |
| Ratios to Average Net Assets: | | | | | | | | | | | | | | | | |
| Expenses, excluding expense reductions and including management fee waived and expenses reimbursed | | | 2.05 | % | | 2.07 | % | | 2.09 | % | | 2.12 | % | | 2.20 | % |
| Expenses, including expense reductions, management fee waived and expenses reimbursed | | | 2.05 | % | | 2.07 | % | | 2.09 | % | | 2.12 | % | | 2.20 | % |
| Expenses, excluding expense reductions, management fee waived and expenses reimbursed | | | 2.05 | % | | 2.09 | % | | 2.11 | % | | 2.15 | % | | 2.27 | % |
| Net investment loss | | | (1.12 | )% | | (1.14 | )% | | (1.27 | )% | | (1.28 | )% | | (1.22 | )% |
| | | | | | | | | | | | | | | | | |
| Supplemental Data: | | | | | | | | | | | | | | | | |
| Net assets, end of year (000) | | | $16,020 | | | $18,614 | | | $29,129 | | | $43,822 | | | $51,703 | |
| Portfolio turnover rate | | | 118.03 | % | | 145.62 | % | | 121.66 | % | | 103.81 | % | | 80.21 | % |
| (a) | Calculated using average shares outstanding during the year. |
| (b) | Amount is less than $.01. |
| (c) | Total return does not consider the effects of sales loads and assumes the reinvestment of all distributions. |
| | See Notes to Financial Statements. | 17 |
Financial Highlights (continued)
| | | Class C Shares | |
| | | Year Ended 11/30 | |
| | | | 2013 | | | 2012 | | | 2011 | | | 2010 | | | 2009 | |
| Per Share Operating Performance | | | | | | | | | | | | | | | | |
| Net asset value, beginning of year | | | $16.87 | | | $19.26 | | | $19.51 | | | $15.69 | | | $11.96 | |
| Investment operations: | | | | | | | | | | | | | | | | |
| Net investment loss(a) | | | (.23 | ) | | (.19 | ) | | (.26 | ) | | (.22 | ) | | (.16 | ) |
| Net realized and unrealized gain | | | 5.85 | | | .97 | | | .01 | | | 4.04 | | | 4.45 | |
| Total from investment operations | | | 5.62 | | | .78 | | | (.25 | ) | | 3.82 | | | 4.29 | |
| Distributions to shareholders from: | | | | | | | | | | | | | | | | |
| Net realized gain | | | — | (b) | | (3.17 | ) | | — | | | — | | | (.56 | ) |
| Net asset value, end of year | | | $22.49 | | | $16.87 | | | $19.26 | | | $19.51 | | | $15.69 | |
| Total Return(c) | | | 33.34 | % | | 6.28 | % | | (1.28 | )% | | 24.35 | % | | 37.58 | % |
| Ratios to Average Net Assets: | | | | | | | | | | | | | | | | |
| Expenses, excluding expense reductions and including management fee waived and expenses reimbursed | | | 2.04 | % | | 2.06 | % | | 2.06 | % | | 2.12 | % | | 2.20 | % |
| Expenses, including expense reductions, management fee waived and expenses reimbursed | | | 2.04 | % | | 2.06 | % | | 2.06 | % | | 2.12 | % | | 2.20 | % |
| Expenses, excluding expense reductions, management fee waived and expenses reimbursed | | | 2.04 | % | | 2.08 | % | | 2.08 | % | | 2.15 | % | | 2.26 | % |
| Net investment loss | | | (1.15 | )% | | (1.12 | )% | | (1.25 | )% | | (1.27 | )% | | (1.22 | )% |
| | | | | | | | | | | | | | | | | |
| Supplemental Data: | | | | | | | | | | | | | | | | |
| Net assets, end of year (000) | | | $62,815 | | | $51,427 | | | $58,336 | | | $64,376 | | | $63,732 | |
| Portfolio turnover rate | | | 118.03 | % | | 145.62 | % | | 121.66 | % | | 103.81 | % | | 80.21 | % |
| (a) | Calculated using average shares outstanding during the year. |
| (b) | Amount is less than $0.01. |
| (c) | Total return does not consider the effects of sales loads and assumes the reinvestment of all distributions. |
| 18 | See Notes to Financial Statements. | |
Financial Highlights (continued)
| | | Class F Shares | |
| | | Year Ended 11/30 | |
| | | | 2013 | | | 2012 | | | 2011 | | | 2010 | | | 2009 | |
| Per Share Operating Performance | | | | | | | | | | | | |
| Net asset value, beginning of year | | | $19.44 | | | $21.52 | | | $21.61 | | | $17.22 | | | $12.96 | |
| Investment operations: | | | | | | | | | | | | | | | | |
| Net investment loss(a) | | | (.06 | ) | | (.04 | ) | | (.09 | ) | | (.06 | ) | | (.05 | ) |
| Net realized and unrealized gain | | | 6.77 | | | 1.13 | | | — | | | 4.45 | | | 4.87 | |
| Total from investment operations | | | 6.71 | | | 1.09 | | | (.09 | ) | | 4.39 | | | 4.82 | |
| Distributions to shareholders from: | | | | | | | | | | | | | | | | |
| Net realized gain | | | — | (b) | | (3.17 | ) | | — | | | — | | | (.56 | ) |
| Net asset value, end of year | | | $26.15 | | | $19.44 | | | $21.52 | | | $21.61 | | | $17.22 | |
| Total Return(c) | | | 34.54 | % | | 7.20 | % | | (.42 | )% | | 25.49 | % | | 38.82 | % |
| Ratios to Average Net Assets: | | | | | | | | | | | | | | | | |
| Expenses, excluding expense reductions and including management fee waived and expenses reimbursed | | | 1.15 | % | | 1.17 | % | | 1.20 | % | | 1.21 | % | | 1.30 | % |
| Expenses, including expense reductions, management fee waived and expenses reimbursed | | | 1.15 | % | | 1.17 | % | | 1.20 | % | | 1.21 | % | | 1.30 | % |
| Expenses, excluding expense reductions, management fee waived and expenses reimbursed | | | 1.15 | % | | 1.19 | % | | 1.22 | % | | 1.24 | % | | 1.34 | % |
| Net investment loss | | | (.27 | )% | | (.23 | )% | | (.41 | )% | | (.32 | )% | | (.35 | )% |
| | | | | | | | | | | | | | | | | |
| Supplemental Data: | | | | | | | | | | | | | | | | |
| Net assets, end of year (000) | | | $17,739 | | | $13,652 | | | $14,594 | | | $11,051 | | | $2,362 | |
| Portfolio turnover rate | | | 118.03 | % | | 145.62 | % | | 121.66 | % | | 103.81 | % | | 80.21 | % |
| (a) | Calculated using average shares outstanding during the year. |
| (b) | Amount is less than $.01. |
| (c) | Total return assumes the reinvestment of all distributions. |
| | See Notes to Financial Statements. | 19 |
Financial Highlights (continued)
| | | Class I Shares |
| | | Year Ended 11/30 |
| | | | 2013 | | | 2012 | | | 2011 | | | 2010 | | | 2009 | |
| Per Share Operating Performance | | | | | | | | | | | |
| Net asset value, beginning of year | | | $20.38 | | | $22.38 | | | $22.45 | | | $17.87 | | | $13.42 | |
| Investment operations: | | | | | | | | | | | | | | | | |
| Net investment loss(a) | | | (.04 | ) | | (.04 | ) | | (.07 | ) | | (.05 | ) | | (.03 | ) |
| Net realized and unrealized gain | | | 7.11 | | | 1.21 | | | — | | | 4.63 | | | 5.04 | |
| Total from investment operations | | | 7.07 | | | 1.17 | | | (.07 | ) | | 4.58 | | | 5.01 | |
| Distributions to shareholders from: | | | | | | | | | | | | | | | | |
| Net realized gain | | | — | (b) | | (3.17 | ) | | — | | | — | | | (.56 | ) |
| Net asset value, end of year | | | $27.45 | | | $20.38 | | | $22.38 | | | $22.45 | | | $17.87 | |
| Total Return(c) | | | 34.67 | % | | 7.29 | % | | (.31 | )% | | 25.63 | % | | 38.91 | % |
| Ratios to Average Net Assets: | | | | | | | | | | | | | | | | |
| Expenses, excluding expense reductions and including management fee waived and expenses reimbursed | | | 1.06 | % | | 1.07 | % | | 1.10 | % | | 1.11 | % | | 1.20 | % |
| Expenses, including expense reductions, management fee waived and expenses reimbursed | | | 1.06 | % | | 1.07 | % | | 1.10 | % | | 1.11 | % | | 1.20 | % |
| Expenses, excluding expense reductions, management fee waived and expenses reimbursed | | | 1.06 | % | | 1.09 | % | | 1.12 | % | | 1.15 | % | | 1.25 | % |
| Net investment loss | | | (.16 | )% | | (.18 | )% | | (.30 | )% | | (.25 | )% | | (.22 | )% |
| | | | | | | | | | | | | | | | | |
| Supplemental Data: | | | | | | | | | | | | | | | | |
| Net assets, end of year (000) | | | $99,819 | | | $78,051 | | | $61,928 | | | $54,970 | | | $42,775 | |
| Portfolio turnover rate | | | 118.03 | % | | 145.62 | % | | 121.66 | % | | 103.81 | % | | 80.21 | % |
| (a) | Calculated using average shares outstanding during the year. |
| (b) | Amount is less than $.01. |
| (c) | Total return assumes the reinvestment of all distributions. |
| 20 | See Notes to Financial Statements. | |
Financial Highlights (continued)
| | | Class P Shares |
| | | Year Ended 11/30 |
| | | | 2013 | | | 2012 | | | 2011 | | | 2010 | | | 2009 | |
| Per Share Operating Performance | | | | | | | | | | | | | | | | |
| Net asset value, beginning of year | | | $19.02 | | | $21.19 | | | $21.35 | | | $17.07 | | | $12.90 | |
| Investment operations: | | | | | | | | | | | | | | | | |
| Net investment loss(a) | | | (.13 | ) | | (.11 | ) | | (.17 | ) | | (.14 | ) | | (.09 | ) |
| Net realized and unrealized gain | | | 6.60 | | | 1.11 | | | .01 | | | 4.42 | | | 4.82 | |
| Total from investment operations | | | 6.47 | | | 1.00 | | | (.16 | ) | | 4.28 | | | 4.73 | |
| Distributions to shareholders from: | | | | | | | | | | | | | | | | |
| Net realized gain | | | — | (b) | | (3.17 | ) | | — | | | — | | | (.56 | ) |
| Net asset value, end of year | | | $25.49 | | | $19.02 | | | $21.19 | | | $21.35 | | | $17.07 | |
| Total Return(c) | | | 34.04 | % | | 6.83 | % | | (.75 | )% | | 25.07 | % | | 38.28 | % |
| Ratios to Average Net Assets: | | | | | | | | | | | | | | | | |
| Expenses, excluding expense reductions and including management fee waived and expenses reimbursed | | | 1.51 | % | | 1.53 | % | | 1.55 | % | | 1.57 | % | | 1.65 | % |
| Expenses, including expense reductions, management fee waived and expenses reimbursed | | | 1.51 | % | | 1.53 | % | | 1.55 | % | | 1.57 | % | | 1.65 | % |
| Expenses, excluding expense reductions, management fee waived and expenses reimbursed | | | 1.51 | % | | 1.54 | % | | 1.57 | % | | 1.60 | % | | 1.72 | % |
| Net investment loss | | | (.57 | )% | | (.60 | )% | | (.74 | )% | | (.73 | )% | | (.66 | )% |
| | | | | | | | | | | | | | | | | |
| Supplemental Data: | | | | | | | | | | | | | | | | |
| Net assets, end of year (000) | | | $4,723 | | | $5,017 | | | $8,074 | | | $8,477 | | | $9,185 | |
| Portfolio turnover rate | | | 118.03 | % | | 145.62 | % | | 121.66 | % | | 103.81 | % | | 80.21 | % |
| (a) | Calculated using average shares outstanding during the year. |
| (b) | Amount is less than $.01. |
| (c) | Total return assumes the reinvestment of all distributions. |
| | See Notes to Financial Statements. | 21 |
Financial Highlights (continued)
| | | Class R2 Shares |
| | | Year Ended 11/30 |
| | | | 2013 | | | 2012 | | | 2011 | | | 2010 | | | 2009 | |
| Per Share Operating Performance | | | | | | | | | | | | | | | | |
| Net asset value, beginning of year | | | $18.88 | | | $21.09 | | | $21.28 | | | $17.04 | | | $12.90 | |
| Investment operations: | | | | | | | | | | | | | | | | |
| Net investment loss(a) | | | (.16 | ) | | (.14 | ) | | (.21 | ) | | (.16 | ) | | (.13 | ) |
| Net realized and unrealized gain | | | 6.55 | | | 1.10 | | | .02 | | | 4.40 | | | 4.83 | |
| Total from investment operations | | | 6.39 | | | .96 | | | (.19 | ) | | 4.24 | | | 4.70 | |
| Distributions to shareholders from: | | | | | | | | | | | | | | | | |
| Net realized gain | | | — | (b) | | (3.17 | ) | | — | | | — | | | (.56 | ) |
| Net asset value, end of year | | | $25.27 | | | $18.88 | | | $21.09 | | | $21.28 | | | $17.04 | |
| Total Return(c) | | | 33.87 | % | | 6.70 | % | | (.94 | )% | | 24.88 | % | | 38.04 | % |
| Ratios to Average Net Assets: | | | | | | | | | | | | | | | | |
| Expenses, excluding expense reductions and including management fee waived and expenses reimbursed | | | 1.66 | % | | 1.67 | % | | 1.70 | % | | 1.71 | % | | 1.80 | % |
| Expenses, including expense reductions, management fee waived and expenses reimbursed | | | 1.66 | % | | 1.67 | % | | 1.70 | % | | 1.71 | % | | 1.80 | % |
| Expenses, excluding expense reductions, management fee waived and expenses reimbursed | | | 1.66 | % | | 1.69 | % | | 1.72 | % | | 1.75 | % | | 1.83 | % |
| Net investment loss | | | (.73 | )% | | (.74 | )% | | (.92 | )% | | (.86 | )% | | (.84 | )% |
| | | | | | | | | | | | | | | | | |
| Supplemental Data: | | | | | | | | | | | | | | | | |
| Net assets, end of year (000) | | | $1,436 | | | $1,515 | | | $1,505 | | | $1,330 | | | $1,118 | |
| Portfolio turnover rate | | | 118.03 | % | | 145.62 | % | | 121.66 | % | | 103.81 | % | | 80.21 | % |
| (a) | Calculated using average shares outstanding during the year. |
| (b) | Amount is less than $.01. |
| (c) | Total return assumes the reinvestment of all distributions. |
| 22 | See Notes to Financial Statements. | |
Financial Highlights (concluded)
| | | Class R3 Shares |
| | | Year Ended 11/30 |
| | | | 2013 | | | 2012 | | | 2011 | | | 2010 | | | 2009 | |
| Per Share Operating Performance | | | | | | | | | | | | | | | | |
| Net asset value, beginning of year | | | $19.01 | | | $21.19 | | | $21.36 | | | $17.09 | | | $12.91 | |
| Investment operations: | | | | | | | | | | | | | | | | |
| Net investment loss(a) | | | (.15 | ) | | (.12 | ) | | (.18 | ) | | (.13 | ) | | (.12 | ) |
| Net realized and unrealized gain | | | 6.61 | | | 1.11 | | | .01 | | | 4.40 | | | 4.86 | |
| Total from investment operations | | | 6.46 | | | .99 | | | (.17 | ) | | 4.27 | | | 4.74 | |
| Distributions to shareholders from: | | | | | | | | | | | | | | | | |
| Net realized gain | | | — | (b) | | (3.17 | ) | | — | | | — | | | (.56 | ) |
| Net asset value, end of year | | | $25.47 | | | $19.01 | | | $21.19 | | | $21.36 | | | $17.09 | |
| Total Return(c) | | | 34.01 | % | | 6.78 | % | | (.80 | )% | | 24.99 | % | | 38.33 | % |
| Ratios to Average Net Assets: | | | | | | | | | | | | | | | | |
| Expenses, excluding expense reductions and including management fee waived and expenses reimbursed | | | 1.55 | % | | 1.57 | % | | 1.59 | % | | 1.60 | % | | 1.70 | % |
| Expenses, including expense reductions, management fee waived and expenses reimbursed | | | 1.55 | % | | 1.57 | % | | 1.59 | % | | 1.60 | % | | 1.70 | % |
| Expenses, excluding expense reductions, management fee waived and expenses reimbursed | | | 1.55 | % | | 1.58 | % | | 1.61 | % | | 1.64 | % | | 1.72 | % |
| Net investment loss | | | (.65 | )% | | (.63 | )% | | (.81 | )% | | (.70 | )% | | (.76 | )% |
| | | | | | | | | | | | | | | | | |
| Supplemental Data: | | | | | | | | | | | | | | | | |
| Net assets, end of year (000) | | | $33,301 | | | $31,535 | | | $26,291 | | | $14,684 | | | $2,182 | |
| Portfolio turnover rate | | | 118.03 | % | | 145.62 | % | | 121.66 | % | | 103.81 | % | | 80.21 | % |
| (a) | Calculated using average shares outstanding during the year. |
| (b) | Amount is less than $.01. |
| (c) | Total return assumes the reinvestment of all distributions. |
| See Notes to Financial Statements. | 23 |
Notes to Financial Statements
Lord Abbett Research Fund, Inc. (the “Company”) is registered under the Investment Company Act of 1940, as amended (the “Act”), as a diversified, open-end management investment company and was incorporated under Maryland law on April 6, 1992. The Company currently consists of three separate funds. This report covers one of the funds and its classes: Lord Abbett Growth Opportunities Fund (the “Fund”).
The Fund’s investment objective is capital appreciation. The Fund has eight classes of shares: Class A, B, C, F, I, P, R2 and R3, each with different expenses and dividends. A front-end sales charge is normally added to the net asset value (“NAV”) for Class A shares. There is no front-end sales charge in the case of Class B, C, F, I, P, R2 and R3 shares, although there may be a contingent deferred sales charge (“CDSC”) in certain cases as follows: Class A shares purchased without a sales charge and redeemed before the first day of the month in which the one-year anniversary of the purchase falls (subject to certain exceptions as set forth in the Fund’s prospectus); Class B shares redeemed before the sixth anniversary of purchase; and Class C shares redeemed before the first anniversary of purchase. Class B shares will automatically convert to Class A shares on the 25th day of the month (or, if the 25th day is not a business day, the next business day thereafter) following the eighth anniversary of the day on which the purchase order was accepted. The Fund no longer issues Class B shares for purchase. The Fund’s Class P shares are closed to substantially all investors, with certain exceptions as set forth in the Fund’s prospectus.
The preparation of the financial statements in conformity with accounting principles generally accepted in the United States of America requires management to make certain estimates and assumptions that affect the reported amounts of assets and liabilities and disclosure of contingent assets and liabilities at the date of the financial statements and the reported amounts of increases and decreases in net assets from operations during the reporting period. Actual results could differ from those estimates.
| 2. | SIGNIFICANT ACCOUNTING POLICIES |
| | |
| (a) | Investment Valuation–Under procedures approved by the Fund’s Board of Directors (the “Board”), Lord, Abbett & Co. LLC (“Lord Abbett”), the Fund’s investment manager, has formed a Pricing Committee to administer the pricing and valuation of portfolio investments and to ensure that prices utilized reasonably reflect fair value. Among other things, these procedures allow the Fund to utilize independent pricing services, quotations from securities and financial instrument dealers and other market sources to determine fair value. |
| | |
| | Securities actively traded on any recognized U.S. or non-U.S. exchange or on The NASDAQ Stock Market LLC are valued at the last sale price or official closing price on the exchange or system on which they are principally traded. Events occurring after the close of trading on non-U.S. exchanges may result in adjustments to the valuation of foreign securities to reflect their fair value as of the close of regular trading on the New York Stock Exchange LLC. The Fund may rely on an independent fair valuation service in adjusting the valuations of foreign securities. Unlisted equity securities are valued at the last quoted sale price or, if no sale price is available, at the mean between the most recently quoted bid and asked prices. |
| | |
| | Securities for which prices are not readily available are valued at fair value as determined by the Pricing Committee and approved by the Board. The Pricing Committee considers a number of factors, including observable and unobservable inputs, when arriving at fair value. The |
24
Notes to Financial Statements (continued)
| | Pricing Committee may use related or comparable assets or liabilities, recent transactions, market multiples, book values and other relevant information to determine fair value of portfolio investments. The Board or a designated committee thereof regularly reviews fair value determinations made by the Pricing Committee and employs techniques such as reviewing related market activity, reviewing inputs and assumptions, and retrospectively comparing prices of subsequent purchases and sales transactions to fair value determinations made by the Pricing Committee. |
| | |
| | Short-term securities with 60 days or less remaining to maturity are valued using the amortized cost method, which approximates fair value. |
| | |
| (b) | Security Transactions–Security transactions are recorded as of the date that the securities are purchased or sold (trade date). Realized gains and losses on sales of portfolio securities are calculated using the identified-cost method. Realized and unrealized gains (losses) are allocated to each class of shares based upon the relative proportion of net assets at the beginning of the day. |
| | |
| (c) | Investment Income–Dividend income is recorded on the ex-dividend date. Interest income is recorded on the accrual basis as earned. Discounts are accreted and premiums are amortized using the effective interest method and are included in Interest income on the Statement of Operations. Withholding taxes on foreign dividends have been provided for in accordance with the applicable country’s tax rules and rates. Investment income is allocated to each class of shares based upon the relative proportion of net assets at the beginning of the day. |
| | |
| (d) | Income Taxes–It is the policy of the Fund to meet the requirements of Subchapter M of the Internal Revenue Code applicable to regulated investment companies and to distribute substantially all taxable income and capital gains to its shareholders. Therefore, no income tax provision is required. |
| | |
| | The Fund files U.S. federal and various state and local tax returns. No income tax returns are currently under examination. The statute of limitations on the Fund’s filed U.S. federal tax returns remains open for the fiscal years ended November 30, 2010 through November 30, 2013. The statutes of limitations on the Company’s state and local tax returns may remain open for an additional year depending upon the jurisdiction. |
| | |
| (e) | Expenses–Expenses incurred by the Company that do not specifically relate to an individual fund are generally allocated to the funds within the Company on a pro rata basis by relative net assets. Expenses, excluding class-specific expenses, are allocated to each class of shares based upon the relative proportion of net assets at the beginning of the day. Class A, B, C, F, P, R2 and R3 shares bear their class-specific share of all expenses and fees relating to the Fund’s 12b-1 Distribution Plan. |
| | |
| (f) | Foreign Transactions–The books and records of the Fund are maintained in U.S. dollars and transactions denominated in foreign currencies are recorded in the Fund’s records at the rate prevailing when earned or recorded. Asset and liability accounts that are denominated in foreign currencies are adjusted daily to reflect current exchange rates and any unrealized gain (loss) is included in Net change in unrealized appreciation/depreciation on investments on the Fund’s Statement of Operations. The resultant exchange gains and losses upon settlement of such transactions are included in Net realized gain on investments on the Fund’s Statement of Operations. The Fund does not isolate that portion of the results of operations arising as a result of changes in the foreign exchange rates from the changes in market prices of the securities. |
25
Notes to Financial Statements (continued)
| (g) | Repurchase Agreements–The Fund may enter into repurchase agreements with respect to securities. A repurchase agreement is a transaction in which a fund acquires a security and simultaneously commits to resell that security to the seller (a bank or securities dealer) at an agreed-upon price on an agreed-upon date. The Fund requires at all times that the repurchase agreement be collateralized by cash, or by securities of the U.S. Government, its agencies, its instrumentalities, or U.S. Government sponsored enterprises having a value equal to, or in excess of, the value of the repurchase agreement (including accrued interest). If the seller of the agreement defaults on its obligation to repurchase the underlying securities at a time when the fair value of these securities has declined, the Fund may incur a loss upon disposition of the securities. |
| | |
| (h) | Fair Value Measurements–Fair value is defined as the price that the Fund would receive upon selling an investment or transferring a liability in an orderly transaction to an independent buyer in the principal or most advantageous market of the investment. A three-tier hierarchy is used to maximize the use of observable market data and minimize the use of unobservable inputs and to establish classification of fair value measurements for disclosure purposes. Inputs refer broadly to the assumptions that market participants would use in pricing the asset or liability, including assumptions about risk—for example, the risk inherent in a particular valuation technique used to measure fair value (such as a pricing model) and/or the risk inherent in the inputs to the valuation technique. Inputs may be observable or unobservable. Observable inputs reflect the assumptions market participants would use in pricing the asset or liability. Observable inputs are based on market data obtained from sources independent of the reporting entity. Unobservable inputs reflect the reporting entity’s own assumptions about the assumptions market participants would use in pricing the asset or liability. Unobservable inputs are based on the best information available in the circumstances. The three-tier hierarchy of inputs is summarized in the three broad Levels listed below: |
| | • | Level 1 – | unadjusted quoted prices in active markets for identical investments; |
| | | | |
| | • | Level 2 – | other significant observable inputs (including quoted prices for similar investments, interest rates, prepayment speeds, credit risk, etc.); and |
| | | | |
| | • | Level 3 – | significant unobservable inputs (including the Fund’s own assumptions in determining the fair value of investments). |
| | A summary of inputs used in valuing the Fund’s investments as of November 30, 2013 and, if applicable, Level 1/Level 2 transfers and Level 3 rollforwards for the fiscal year then ended is included in the Fund’s Schedule of Investments. |
| | |
| | Changes in valuation techniques may result in transfers into or out of an assigned level within the three-tier hierarchy. All transfers between different levels within the three-tier hierarchy are deemed to have occurred as of the beginning of the reporting period. The inputs or methodology used for valuing securities are not necessarily an indication of the risk associated with investing in those securities. |
| 3. | MANAGEMENT FEE AND OTHER TRANSACTIONS WITH AFFILIATES |
Management Fee
The Company has a management agreement with Lord Abbett, pursuant to which Lord Abbett supplies the Fund with investment management services and executive and other personnel, provides office space and pays for ordinary and necessary office and clerical expenses relating to research and statistical work and supervision of the Fund’s investment portfolio.
26
Notes to Financial Statements (continued)
The Fund’s management fee is based on the Fund’s average daily net assets. Effective April 1, 2013, the management agreement was amended, resulting in the following annual rates:
| | | Effective
April 1, 2013 | | | Prior to
April 1, 2013 | |
| First $1 billion | | .75 | % | | .75 | % |
| Next $1 billion | | .65 | % | | .70 | % |
| Next $1 billion | | .60 | % | | .65 | % |
| Over $3 billion | | .58 | % | | .60 | % |
In addition, Lord Abbett provides certain administrative services to the Fund pursuant to an Administrative Services Agreement in return for a fee at an annual rate of .04% of the Fund’s average daily net assets.
Effective April 1, 2013, and continuing through March 31, 2014, Lord Abbett has contractually agreed to waive all or a portion of its management fee and, if necessary, waive all or a portion of its administrative fee and reimburse the Fund’s other expenses to the extent necessary so that the total net annual operating expenses for each class, excluding 12b-1 fees, do not exceed an annual rate of 1.05%. This agreement may be terminated only upon the approval of the Board.
Prior to April 1, 2013, Lord Abbett had contractually agreed to waive all or a portion of its management fee and, if necessary, reimburse the Fund’s other expenses to the extent necessary so that the net annual operating expenses for each class, excluding 12b-1 fees, did not exceed an annual rate of 1.10%. This agreement expired at the inception of the new agreement described in the preceding paragraph.
For the fiscal year ended November 30, 2013, the effective management fee, net of waivers, was at an annualized rate of .75% of the Fund’s average daily net assets.
The Fund, along with certain other funds managed by Lord Abbett (collectively, the “Underlying Funds”), has entered into a Servicing Arrangement with Lord Abbett Diversified Equity Strategy Fund of Lord Abbett Investment Trust (a “Fund of Funds”), pursuant to which the Underlying Fund pays a portion of the expenses (excluding management fees and distribution and service fees) of the applicable Fund of Funds in proportion to the average daily value of the Underlying Fund shares owned by each Fund of Funds. Amounts paid pursuant to the Servicing Arrangement are included in Subsidy expense on the Fund’s Statement of Operations and Payable to affiliate on the Fund’s Statement of Assets and Liabilities.
As of November 30, 2013, the percentage of the Fund’s outstanding shares owned by Lord Abbett Diversified Equity Strategy Fund was 5.52%.
12b-1 Distribution Plan
The Fund has adopted a distribution plan with respect to Class A, B, C, F, P, R2 and R3 shares pursuant to Rule 12b-1 under the Act, which provides for the payment of ongoing distribution and service fees to Lord Abbett Distributor LLC (the “Distributor”), an affiliate of Lord Abbett. The following annual rates have been approved by the Board pursuant to the plan:
| Fees* | | Class A | | Class B | | Class C | | Class F | | Class P | | Class R2 | | Class R3 |
| Service | | .25% | | .25% | | .25% | | — | | .25% | | .25% | | .25% |
| Distribution | | .10% | | .75% | | .75% | | .10% | | .20% | | .35% | | .25% |
| * | The Fund may designate a portion of the aggregate fee as attributable to service activities for purposes of calculating Financial Industry Regulatory Authority, Inc. (“FINRA”) sales charge limitations. |
Class I shares do not have a distribution plan.
27
Notes to Financial Statements (continued)
Commissions
Distributor received the following commissions on sales of shares of the Fund, after concessions were paid to authorized dealers, for the fiscal year ended November 30, 2013:
| Distributor | | Dealers’ |
| Commissions | | Concessions |
| $67,936 | | $368,462 |
Distributor received CDSCs of $3,638 and $3,999 for Class A and Class C shares, respectively, for the fiscal year ended November 30, 2013.
A Director and certain of the Fund’s officers have an interest in Lord Abbett.
| 4. | DISTRIBUTIONS AND CAPITAL LOSS CARRYFORWARDS |
Dividends from net investment income, if any, are declared and paid at least annually. Taxable net realized gains from investment transactions, reduced by allowable capital loss carryforwards, if any, are declared and distributed to shareholders at least annually. The capital loss carryforward amount, if any, is available to offset future net capital gains. Dividends and distributions to shareholders are recorded on the ex-dividend date. The amounts of dividends and distributions from net investment income and net realized capital gains are determined in accordance with federal income tax regulations, which may differ from accounting principles generally accepted in the United States of America. These book/tax differences are either considered temporary or permanent in nature. To the extent these differences are permanent in nature, such amounts are reclassified within the components of net assets based on their federal tax basis treatment; temporary differences do not require reclassification. Dividends and distributions, which exceed earnings and profits for tax purposes, are reported as a tax return of capital.
Subsequent to the Fund’s fiscal year ended November 30, 2013, short-term capital gain and long-term capital gain distributions of approximately $22,157,000 and $88,053,000, respectively, were declared by the Fund on December 11, 2013. The distributions were paid on December 18, 2013 to shareholders of record on December 17, 2013.
The tax character of distributions paid during the fiscal years ended November 30, 2013 and 2012 was as follows:
| | | Year Ended
11/30/2013 | | | Year Ended
11/30/2012 | |
| Distributions paid from: | | | | | | | | |
| Net long-term capital gains | | $ | 111,967 | | | $ | 87,834,728 | |
| Total distributions paid | | $ | 111,967 | | | $ | 87,834,728 | |
As of November 30, 2013, the components of accumulated gains on a tax-basis were as follows:
| Undistributed ordinary income - net | | $ | 22,154,723 | |
| Undistributed long-term capital gains | | $ | 88,052,219 | |
| Total undistributed earnings | | $ | 110,206,942 | |
| Temporary differences | | | (93,107 | ) |
| Unrealized gains - net | | | 148,293,401 | |
| Total accumulated gains - net | | $ | 258,407,236 | |
28
Notes to Financial Statements (continued)
As of November 30, 2013, the aggregate unrealized security gains and losses based on cost for U.S. federal income tax purposes were as follows:
| Tax cost | | $ | 517,636,540 | |
| Gross unrealized gain | | | 153,556,087 | |
| Gross unrealized loss | | | (5,262,686 | ) |
| Net unrealized security gain | | $ | 148,293,401 | |
The difference between book-basis and tax-basis unrealized gains (losses) is attributable to the tax treatment of wash sales.
Permanent items identified during the fiscal year ended November 30, 2013 have been reclassified among the components of net assets based on their tax basis treatment as follows:
Accumulated
Net Investment
Loss | | | Accumulated
Net Realized
Gain | | | Paid-in
Capital | |
| $ | 6,494,029 | | | $ | (7,641,820 | ) | | $ | 1,147,791 | |
The permanent differences are attributable to the tax treatment of certain distributions and net investment losses.
| 5. | PORTFOLIO SECURITIES TRANSACTIONS |
Purchases and sales of investment securities (excluding short-term investments) for the fiscal year ended November 30, 2013 were as follows:
| Purchases | | Sales |
| $ 709,844,796 | | $ 778,467,243 |
There were no purchases or sales of U.S. Government securities for the fiscal year ended November 30, 2013.
| 6. | DIRECTORS’ REMUNERATION |
The Company’s officers and a Director, who are associated with Lord Abbett, do not receive any compensation from the Company for serving in such capacities. Independent Directors’ fees are allocated among all Lord Abbett-sponsored funds based on the net assets of each fund. There is an equity-based plan available to all Independent Directors under which Independent Directors must defer receipt of a portion of, and may elect to defer receipt of an additional portion of Directors’ fees. The deferred amounts are treated as though equivalent dollar amounts had been invested in the funds. Such amounts and earnings accrued thereon are included in Directors’ fees on the Statement of Operations and in Directors’ fees payable on the Statement of Assets and Liabilities and are not deductible for U.S. federal income tax purposes until such amounts are paid.
The Company has entered into an arrangement with its transfer agent and custodian, whereby credits realized as a result of uninvested cash balances are used to reduce a portion of the Fund’s expenses.
29
Notes to Financial Statements (continued)
During the fiscal year ended November 30, 2013, the Fund and certain other funds managed by Lord Abbett (the “participating funds”) participated in an unsecured revolving credit facility (“Facility”) with State Street Bank and Trust Company (“SSB”). The Facility is to be used for temporary or emergency purposes as an additional source of liquidity to fund redemptions of investor shares. The Board considers annual renewal of the Facility under terms that depend on market conditions at the time of the renewal. The amounts available under the Facility are (i) the lesser of either $250,000,000 or 33.33% of total assets per participating fund and (ii) $350,000,000 in the aggregate for all participating funds. The annual fee to maintain the Facility is .09% of the amount available under the Facility. Each participating fund pays its pro rata share based on the net assets of each participating fund. This amount is included in Other expenses on the Fund’s Statement of Operations. Any borrowings under this Facility will bear interest at current market rates as set forth in the credit agreement.
Effective July 1, 2013, the Fund and participating funds renewed the Facility through June 30, 2014 under the same terms as described above.
During the fiscal year ended November 30, 2013, a participating fund also managed by Lord Abbett utilized the Facility and fully repaid its borrowings on June 13, 2013. As of November 30, 2013, there were no loans outstanding pursuant to this Facility.
| 9. | CUSTODIAN AND ACCOUNTING AGENT |
SSB is the Company’s custodian and accounting agent. SSB performs custodial, accounting and recordkeeping functions relating to portfolio transactions and calculating the Fund’s NAV.
The Fund is subject to the general risks and considerations associated with equity investing. The value of an investment will fluctuate in response to movements in the equity securities market in general, and to the changing prospects of individual companies in which the Fund invests. The Fund has particular risks associated with growth stocks. Growth companies may grow faster than other companies, which may result in more volatility in their stock prices. In addition, if the Fund’s assessment of a company’s potential for growth or market conditions is wrong, it could suffer losses or produce poor performance relative to other funds, even in a rising market. The Fund invests largely in mid-sized company stocks, which may be less able to weather economic shifts or other adverse developments than those of larger, more established companies.
These factors can affect the Fund’s performance.
| 11. | SUMMARY OF CAPITAL TRANSACTIONS |
Transactions in shares of beneficial interest were as follows:
| | | | | | Year Ended | | | | | | Year Ended | |
| | | November 30, 2013 | | | November 30, 2012 | |
| Class A Shares | | Shares | | | Amount | | | Shares | | | Amount | |
| Shares sold | | | 1,555,043 | | | $ | 34,765,764 | | | | 2,210,958 | | | $ | 42,057,029 | |
| Converted from Class B* | | | 168,467 | | | | 3,736,131 | | | | 350,232 | | | | 6,672,835 | |
| Reinvestment of distributions | | | 3,537 | | | | 69,274 | | | | 3,162,088 | | | | 52,964,981 | |
| Shares reacquired | | | (3,397,663 | ) | | | (75,703,321 | ) | | | (5,652,178 | ) | | | (106,041,742 | ) |
| Increase (decrease) | | | (1,670,616 | ) | | $ | (37,132,152 | ) | | | 71,100 | | | $ | (4,346,897 | ) |
30
Notes to Financial Statements (continued)
| | | Year Ended
November 30, 2013 | | | Year Ended
November 30, 2012 | |
| Class B Shares | | Shares | | | Amount | | | Shares | | | Amount | |
| Shares sold | | | 22,186 | | | $ | 417,053 | | | | 65,014 | | | $ | 1,069,266 | |
| Reinvestment of distributions | | | 236 | | | | 4,077 | | | | 302,024 | | | | 4,485,056 | |
| Shares reacquired | | | (221,504 | ) | | | (4,294,950 | ) | | | (379,536 | ) | | | (6,392,126 | ) |
| Converted to Class A* | | | (191,827 | ) | | | (3,736,131 | ) | | | (396,198 | ) | | | (6,672,835 | ) |
| Decrease | | | (390,909 | ) | | $ | (7,609,951 | ) | | | (408,696 | ) | | $ | (7,510,639 | ) |
| | | | | | | | | | | | | | | | | |
| Class C Shares | | | | | | | | | | | | | | | | |
| Shares sold | | | 331,337 | | | $ | 6,536,352 | | | | 413,471 | | | $ | 6,813,059 | |
| Reinvestment of distributions | | | 588 | | | | 10,140 | | | | 545,825 | | | | 8,100,035 | |
| Shares reacquired | | | (587,414 | ) | | | (11,438,752 | ) | | | (939,393 | ) | | | (15,786,152 | ) |
| Increase (decrease) | | | (255,489 | ) | | $ | (4,892,260 | ) | | | 19,903 | | | $ | (873,058 | ) |
| | | | | | | | | | | | | | | | | |
| Class F Shares | | | | | | | | | | | | | | | | |
| Shares sold | | | 225,949 | | | $ | 5,201,019 | | | | 356,321 | | | $ | 6,914,155 | |
| Reinvestment of distributions | | | 110 | | | | 2,193 | | | | 98,972 | | | | 1,678,575 | |
| Shares reacquired | | | (249,945 | ) | | | (5,769,142 | ) | | | (431,241 | ) | | | (8,308,596 | ) |
| Increase (decrease) | | | (23,886 | ) | | $ | (565,930 | ) | | | 24,052 | | | $ | 284,134 | |
| | | | | | | | | | | | | | | | | |
| Class I Shares | | | | | | | | | | | | | | | | |
| Shares sold | | | 972,722 | | | $ | 23,215,411 | | | | 4,047,981 | | | $ | 81,054,289 | |
| Reinvestment of distributions | | | 641 | | | | 13,357 | | | | 460,054 | | | | 8,175,152 | |
| Shares reacquired | | | (1,165,320 | ) | | | (25,736,373 | ) | | | (3,446,344 | ) | | | (69,514,625 | ) |
| Increase (decrease) | | | (191,957 | ) | | $ | (2,507,605 | ) | | | 1,061,691 | | | $ | 19,714,816 | |
| | | | | | | | | | | | | | | | | |
| Class P Shares | | | | | | | | | | | | | | | | |
| Shares sold | | | 36,963 | | | $ | 824,478 | | | | 46,480 | | | $ | 884,459 | |
| Reinvestment of distributions | | | 52 | | | | 1,009 | | | | 71,450 | | | | 1,189,634 | |
| Shares reacquired | | | (115,543 | ) | | | (2,473,382 | ) | | | (235,159 | ) | | | (4,461,801 | ) |
| Decrease | | | (78,528 | ) | | $ | (1,647,895 | ) | | | (117,229 | ) | | $ | (2,387,708 | ) |
| | | | | | | | | | | | | | | | | |
| Class R2 Shares | | | | | | | | | | | | | | | | |
| Shares sold | | | 14,598 | | | $ | 320,619 | | | | 51,623 | | | $ | 977,694 | |
| Reinvestment of distributions | | | 10 | | | | 201 | | | | 8,265 | | | | 136,785 | |
| Shares reacquired | | | (38,024 | ) | | | (824,825 | ) | | | (51,020 | ) | | | (961,310 | ) |
| Increase (decrease) | | | (23,416 | ) | | $ | (504,005 | ) | | | 8,868 | | | $ | 153,169 | |
| | | | | | | | | | | | | | | | | |
| Class R3 Shares | | | | | | | | | | | | | | | | |
| Shares sold | | | 403,941 | | | $ | 8,924,070 | | | | 654,968 | | | $ | 12,418,620 | |
| Reinvestment of distributions | | | 341 | | | | 6,598 | | | | 243,302 | | | | 4,050,988 | |
| Shares reacquired | | | (755,565 | ) | | | (16,907,656 | ) | | | (480,362 | ) | | | (9,011,870 | ) |
| Increase (decrease) | | | (351,283 | ) | | $ | (7,976,988 | ) | | | 417,908 | | | $ | 7,457,738 | |
| * | Automatic conversion of Class B shares occurs on the 25th day of the month (or, if the 25th day is not a business day, the next business day thereafter) following the eighth anniversary of the day on which the purchase order was accepted. |
31
Notes to Financial Statements (concluded)
| 12. | RECENT ACCOUNTING STANDARD |
In December 2011, the Financial Accounting Standards Board (“FASB”) issued Accounting Standards Update No. 2011–11 “Disclosures about Offsetting Assets and Liabilities” (“ASU 2011–11”). This disclosure requirement is intended to help investors and other financial statement users better assess the effect or potential effect of offsetting arrangements on a fund’s financial position. ASU 2011–11 requires entities to disclose both gross and net information about both instruments and transactions eligible for offset in the statement of assets and liabilities; and disclose instruments and transactions subject to an agreement similar to a master netting agreement. In addition, in January 2013, FASB issued Accounting Standards Update No. 2013–01 “Clarifying the Scope of Disclosures about Offsetting Assets and Liabilities” (“ASU 2013–01”), specifying exactly which transactions are subject to disclosures about offsetting. ASU 2011–11 and ASU 2013–01 are effective for public entities for interim and annual periods beginning on or after January 1, 2013. Management is currently evaluating the impact the adoption of ASU 2011–11 and ASU 2013–01 will have on the Fund’s financial statement disclosures.
32
Report of Independent Registered Public Accounting Firm
To the Board of Directors of Lord Abbett Research Fund, Inc. and the Shareholders of Lord Abbett Growth Opportunities Fund:
We have audited the accompanying statement of assets and liabilities, including the schedule of investments, of the Lord Abbett Growth Opportunities Fund, one of the three funds constituting the Lord Abbett Research Fund, Inc. (the “Company”) as of November 30, 2013, and the related statement of operations for the year then ended, the statements of changes in net assets for each of the two years in the period then ended, and the financial highlights for each of the five years in the period then ended. These financial statements and financial highlights are the responsibility of the Company’s management. Our responsibility is to express an opinion on these financial statements and financial highlights based on our audits.
We conducted our audits in accordance with the standards of the Public Company Accounting Oversight Board (United States). Those standards require that we plan and perform the audit to obtain reasonable assurance about whether the financial statements and financial highlights are free of material misstatement. The Company is not required to have, nor were we engaged to perform, an audit of its internal control over financial reporting. Our audits included consideration of internal control over financial reporting as a basis for designing audit procedures that are appropriate in the circumstances, but not for the purpose of expressing an opinion on the effectiveness of the Company’s internal control over financial reporting. Accordingly, we express no such opinion. An audit also includes examining, on a test basis, evidence supporting the amounts and disclosures in the financial statements, assessing the accounting principles used and significant estimates made by management, as well as evaluating the overall financial statement presentation. Our procedures included confirmation of securities owned as of November 30, 2013, by correspondence with the custodian and brokers; where replies were not received from brokers, we performed other auditing procedures. We believe that our audits provide a reasonable basis for our opinion.
In our opinion, such financial statements and financial highlights referred to above present fairly, in all material respects, the financial position of Lord Abbett Growth Opportunities Fund of the Lord Abbett Research Fund, Inc. as of November 30, 2013, the results of its operations for the year then ended, the changes in its net assets for each of the two years in the period then ended, and the financial highlights for each of the five years in the period then ended, in conformity with accounting principles generally accepted in the United States of America.
DELOITTE & TOUCHE LLP
New York, New York
January 29, 2014
33
Basic Information About Management
The Board is responsible for the management of the business and affairs of the Company in accordance with the laws of the State of Maryland. The Board elects officers who are responsible for the day-to-day operations of the Fund and who execute policies authorized by the Board. The Board also approves an investment adviser to the Fund and continues to monitor the cost and quality of the services the investment adviser provides, and annually considers whether to renew the contract with the adviser. Generally, each Director holds office until his/her successor is elected and qualified or until his/her earlier resignation or removal, as provided in the Company’s organizational documents.
Lord Abbett, a Delaware limited liability company, is the Company’s investment adviser. Designated Lord Abbett personnel are responsible for the day-to-day management of the Fund.
Interested Director
Ms. Foster is affiliated with Lord Abbett and is an “interested person” of the Company as defined in the Act. Ms. Foster is a director/trustee and officer of each of the 12 Lord Abbett-sponsored funds, which consist of 55 portfolios or series.
Name, Address and
Year of Birth | | Current Position and
Length of Service
with the Company | | Principal Occupation and Other Directorships
During the Past Five Years |
Daria L. Foster
Lord, Abbett & Co. LLC
90 Hudson Street
Jersey City, NJ 07302
(1954) | | Director and President since 2006; Chief Executive Officer since 2012 | | Principal Occupation: Managing Partner of Lord Abbett (since 2007), and was formerly Director of Marketing and Client Service, joined Lord Abbett in 1990.
Other Directorships: None. |
Independent Directors
The following Independent Directors also are directors/trustees of each of the 12 Lord Abbett-sponsored funds, which consist of 55 portfolios or series.
Name, Address and
Year of Birth | | Current Position and
Length of Service
with the Company | | Principal Occupation and Other Directorships
During the Past Five Years |
E. Thayer Bigelow
Lord, Abbett & Co. LLC
c/o Legal Dept.
90 Hudson Street
Jersey City, NJ 07302
(1941) | | Director since 1996; Chairman since 2013 | | Principal Occupation: Managing General Partner, Bigelow Media, LLC (since 2000); Senior Adviser, Time Warner Inc. (1998 – 2000).
Other Directorships: Currently serves as director of Crane Co. (since 1984) and Huttig Building Products Inc. (since 1998). Previously served as a director of R.H. Donnelley Inc. (2009 – 2010). |
| | | | | |
Robert B. Calhoun, Jr.
Lord, Abbett & Co. LLC
c/o Legal Dept.
90 Hudson Street
Jersey City, NJ 07302
(1942) | | Director since 1998 | | Principal Occupation: Senior Advisor of Monitor Clipper Partners, a private equity investment fund (since 1997); President of Clipper Asset Management Corp. (1991 – 2009).
Other Directorships: Previously served as a director of Interstate Bakeries Corp. (1991 – 2008). |
34
Basic Information About Management (continued)
Name, Address and
Year of Birth | | Current Position and
Length of Service
with the Company | | Principal Occupation and Other Directorships
During the Past Five Years |
Evelyn E. Guernsey
Lord, Abbett & Co. LLC
c/o Legal Dept.
90 Hudson Street
Jersey City, NJ 07302
(1955) | | Director since 2011 | | Principal Occupation: CEO, Americas of J.P. Morgan Asset Management (2004 – 2010).
Other Directorships: None. |
| | | | | |
Julie A. Hill
Lord, Abbett & Co. LLC
c/o Legal Dept.
90 Hudson Street
Jersey City, NJ 07302
(1946) | | Director since 2004 | | Principal Occupation: Owner and CEO of The Hill Company, a business consulting firm (since 1998).
Other Directorships: Currently serves as director of WellPoint, Inc., a health benefits company (since 1994). Previously served as a director of Lend Lease Corporation Limited, an international retail and residential property group (2006 – 2012). |
| | | | | |
Franklin W. Hobbs
Lord, Abbett & Co. LLC
c/o Legal Dept.
90 Hudson Street
Jersey City, NJ 07302
(1947) | | Director since 2001 | | Principal Occupation: Advisor of One Equity Partners, a private equity firm (since 2004).
Other Directorships: Currently serves as director and Chairman of the Board of Ally Financial Inc., a financial services firm (since 2009), and as director of Molson Coors Brewing Company (since 2002). |
| | | | | |
James M. McTaggart
Lord, Abbett & Co. LLC
c/o Legal Dept.
90 Hudson Street
Jersey City, NJ 07302
(1947) | | Director since 2012 | | Principal Occupation: Independent management advisor and consultant (since 2012); Vice President, CRA International, Inc. (doing business as Charles River Associates), a global management consulting firm (2009 – 2012); Founder and Chairman of Marakon Associates, Inc., a strategy consulting firm (1978 – 2009); and Officer and Director of Trinsum Group, a holding company (2007 – 2009).
Other Directorships: Currently serves as director of Blyth, Inc., a home products company (since 2004). |
| | | | | |
James L.L. Tullis
Lord, Abbett & Co. LLC
c/o Legal Dept.
90 Hudson Street
Jersey City, NJ 07302
(1947) | | Director since 2006 | | Principal Occupation: CEO of Tullis-Dickerson and Co. Inc., a venture capital management firm (since 1990); CEO of Tullis Health Investors Inc. (since 2012).
Other Directorships: Currently serves as director of Crane Co. (since 1998). Previously served as a director of Synageva BioPharma Corp., a biopharmaceutical company (2009 – 2011). |
35
Basic Information About Management (continued)
Officers
None of the officers listed below have received compensation from the Company. All of the officers of the Company also may be officers of the other Lord Abbett-sponsored funds and maintain offices at 90 Hudson Street, Jersey City, NJ 07302. Unless otherwise indicated, the position(s) and title(s) listed under the “Principal Occupation During the Past Five Years” column indicate each officer’s position(s) and title(s) with Lord Abbett.
Name and
Year of Birth | | Current Position
with the Company | | Length of Service
of Current
Position | | Principal Occupation
During the Past Five Years |
Daria L. Foster
(1954) | | President and Chief Executive Officer | | Elected as President in 2006 and Chief Executive Officer in 2012 | | Managing Partner of Lord Abbett (since 2007), and was formerly Director of Marketing and Client Service, joined Lord Abbett in 1990. |
| | | | | | | |
Robert I. Gerber
(1954) | | Executive Vice President | | Elected in 2007 | | Partner and Chief Investment Officer (since 2007), joined Lord Abbett in 1997 as Director of Taxable Fixed Income Management. |
| | | | | | | |
Thomas B. Maher
(1967) | | Executive Vice President | | Elected in 2013 | | Partner and Portfolio Manager, joined Lord Abbett in 2003. |
| | | | | | | |
Justin C. Maurer
(1969) | | Executive Vice President | | Elected in 2013 | | Partner and Portfolio Manager, joined Lord Abbett in 2001. |
| | | | | | | |
Walter H. Prahl
(1958) | | Executive Vice President | | Elected in 2012 | | Partner and Director, joined Lord Abbett in 1997. |
| | | | | | | |
Frederick J. Ruvkun
(1957) | | Executive Vice President | | Elected in 2012 | | Partner and Director, joined Lord Abbett in 2006. |
| | | | | | | |
Paul J. Volovich
(1973) | | Executive Vice President | | Elected in 2004 | | Partner and Director, joined Lord Abbett in 1997. |
| | | | | | | |
Joan A. Binstock
(1954) | | Chief Financial Officer and Vice President | | Elected in 1999 | | Partner and Chief Financial and Operations Officer, joined Lord Abbett in 1999. |
| | | | | | | |
John K. Forst
(1960) | | Vice President and Assistant Secretary | | Elected in 2005 | | Partner and Deputy General Counsel, joined Lord Abbett in 2004. |
| | | | | | | |
Lawrence H. Kaplan
(1957) | | Chief Compliance Officer, Vice President and Secretary | | Elected as Vice President and Secretary in 1997 and Chief Compliance Officer in 2013 | | Partner, General Counsel, and Chief Compliance Officer, joined Lord Abbett in 1997. |
36
Basic Information About Management (concluded)
| Name and Year of Birth | | Current Position with the Company | | Length of Service of Current Position | | Principal Occupation During the Past Five Years |
David J. Linsen
(1974) | | Vice President | | Elected in 2008 | | Partner and Director, joined Lord Abbett in 2001. |
| | | | | | | |
A. Edward Oberhaus, III
(1959) | | Vice President | | Elected in 1996 | | Partner and Director, joined Lord Abbett in 1983. |
| | | | | | | |
Thomas R. Phillips
(1960) | | Vice President and Assistant Secretary | | Elected in 2008 | | Partner and Deputy General Counsel, joined Lord Abbett in 2006. |
| | | | | | | |
Lawrence B. Stoller
(1963) | | Vice President and Assistant Secretary | | Elected in 2007 | | Partner and Senior Deputy General Counsel, joined Lord Abbett in 2007. |
| | | | | | | |
Scott S. Wallner
(1955) | | AML Compliance Officer | | Elected in 2011 | | Assistant General Counsel, joined Lord Abbett in 2004. |
| | | | | | | |
Bernard J. Grzelak
(1971) | | Treasurer | | Elected in 2003 | | Partner and Director of Fund Administration, joined Lord Abbett in 2003. |
Please call 888-522-2388 for a copy of the statement of additional information, which contains further information about the Company’s Directors. It is available free upon request.
37
Householding
The Company has adopted a policy that allows it to send only one copy of the Fund’s prospectus, proxy material, annual report and semiannual report to certain shareholders residing at the same “household.” This reduces Fund expenses, which benefits you and other shareholders. If you need additional copies or do not want your mailings to be “householded,” please call Lord Abbett at 888-522-2388 or send a written request with your name, the name of your fund or funds and your account number or numbers to Lord Abbett Family of Funds, P.O. Box 219336, Kansas City, MO 64121.
Proxy Voting Policies, Procedures and Records
A description of the policies and procedures that Lord Abbett uses to vote proxies related to the Fund’s portfolio securities, and information on how Lord Abbett voted the Fund’s proxies during the 12-month period ended June 30 are available without charge, upon request, (i) by calling 888-522-2388; (ii) on Lord Abbett’s Website at www.lordabbett.com; and (iii) on the Securities and Exchange Commission’s (“SEC”) Website at www.sec.gov.
Shareholder Reports and Quarterly Portfolio Disclosure
The Fund is required to file its complete schedule of portfolio holdings with the SEC for its first and third fiscal quarters on Form N-Q. Copies of the filings are available without charge, upon request on the SEC’s Website at www.sec.gov and may be available by calling Lord Abbett at 888-522-2388. You can also obtain copies of Form N-Q by visiting the SEC’s Public Reference Room in Washington, DC (information on the operation of the Public Reference Room may be obtained by calling 800-SEC-0330).
| | | |
| | Tax Information | |
| | | |
| | Of the distributions paid to shareholders during the fiscal year ended November 30, 2013, $111,967 represents long-term capital gains. | |
| | | |
38


| This report, when not used for the general information of shareholders of the Fund, is to be distributed only if preceded or accompanied by a current fund prospectus. | | | | |
| | | Lord Abbett Research Fund, Inc. | | |
Lord Abbett mutual fund shares are distributed by
LORD ABBETT DISTRIBUTOR LLC. | | Lord Abbett Growth Opportunities Fund | | LAGOF-2-1113
(01/14) |

2 0 1 3
L O R D A B B E T T
A N N U A L
R E P O R T
Lord Abbett
Small Cap Value Fund
For the fiscal year ended November 30, 2013
Lord Abbett Research Fund
Lord Abbett Small Cap Value Fund
Annual Report
For the fiscal year ended November 30, 2013

Daria L. Foster, Director, President and Chief Executive Officer of the Lord Abbett Funds, and E. Thayer Bigelow, Independent Chairman of the Lord Abbett Funds.
Dear Shareholders: We are pleased to provide you with this overview of the performance of Lord Abbett Small Cap Value Fund for the fiscal year ended November 30, 2013. On this page and the following pages, we discuss the major factors that influenced fiscal year performance. For detailed and more timely information about the Fund, please visit our Website at www.lordabbett.com, where you also can access the quarterly commentaries that provide updates on the Fund’s performance and other portfolio related updates.
Thank you for investing in Lord Abbett mutual funds. We value the trust that you place in us and look forward to serving your investment needs in the years to come.
Best regards,

Daria L. Foster
Director, President and Chief Executive Officer
For the fiscal year ended November 30, 2013, the Fund returned 34.52%, reflecting performance at the net asset value (NAV) of Class A shares, with all distributions reinvested, compared to its benchmark, the Russell 2000® Value Index,1 which returned 37.60% over the same period.
In a period marred by a series of congressional showdowns culminating in a two-week governmental shutdown, an escalating Syrian civil war, fears of a slowing Asian economy, and an ongoing European debt crisis, domestic equity markets could have very easily experienced
1
lackluster returns. Instead, positive investor sentiment, driven by a continuation of global accommodative monetary policy and a rebounding U.S. housing market, led to a significant and broad market rally for the trailing 12-month period. Meanwhile, in an anemic economic recovery, investors favored small capitalization companies over large and within the small cap space, growth companies over value.
For the period, the largest determinant of the Fund’s relative underperformance was security selection within the consumer discretionary sector, most notably Orient-Express Hotels Ltd. Shares of the hotel and travel businesses operator slid in February following a soft earnings report due primarily to higher-than-expected renovation costs. Investors also became worried that a previous bid to acquire the company would be rejected by management. We decided to close out the position in March because we believed that management had no plans to accept the offer. Security selection within the industrials sector was also a major component of the Fund’s relative underperformance. Within the sector, Titan International, Inc., a manufacturer of agriculture, mining, construction, and other off-highway tires, was a significant detractor. A confluence of concerns regarding management execution, labor negotiations, and industry headwinds led to a muted outlook from management and, subsequently, weak stock performance. Due to fundamental concerns, the position was liquidated in July.
In addition, the security that detracted most from the Fund’s relative performance was materials holding Axiall Corp. The company struggled with rising ethylene costs, deterioration in caustic soda and chlorine prices, and weaker-than-expected PVC piping demand, leading to lower investor confidence and uninspired stock performance. Due to fundamental concerns with the integrated chemicals and building products company, the position was exited in November 2013.
On a positive note, security selection within the financials sector contributed to the Fund’s relative performance. Within the sector, PacWest Bancorp and SVB Financial Group exhibited exemplary performance. Shares of PacWest Bancorp, the Fund’s top contributor, climbed higher as the Los Angeles-based bank holding company experienced a more favorable interest rate environment. Investors also lauded management’s July announcement to acquire a large commercial lender, as the acquisition showed potential to be highly accretive due to possible growth drivers and operational synergies. Also the beneficiary of a more favorable interest rate environment, SVB Financial Group, a California-based financial services company, saw its shares ascend during the period. The company, which caters to Silicon Valley-type businesses, also released a series of positive earnings reports. The strong performance was driven by expansion in net interest margin, improvements in loan growth, and revenue from venture capital investments.
2
In addition, the Fund’s underweight to real estate investment trusts (REITs) was a significant contributor to relative performance. The Fund had been underweight REITs throughout the period based on expensive valuations. This underweight proved advantageous when the industry sold off due to a spike in interest rates caused by the anticipation of a shift in monetary policy.
The Fund’s portfolio is actively managed and, therefore, its holdings and the weightings of a particular issuer or particular sector as a percentage of portfolio assets are subject to change. Sectors may include many industries.
1 The Russell 2000® Value Index measures the performance of those Russell 2000 companies with lower price-to-book ratios and lower forecasted growth values.
Unless otherwise specified, indexes reflect total return, with all dividends reinvested. Indexes are unmanaged, do not reflect the deduction of fees or expenses, and are not available for direct investment.
Important Performance and Other Information
Performance data quoted in the following pages reflect past performance and are no guarantee of future results. Current performance may be higher or lower than the performance quoted. The investment return and principal value of an investment in the Fund will fluctuate so that shares, on any given day or when redeemed, may be worth more or less than their original cost. You can obtain performance data current to the most recent month end by calling Lord Abbett at 888-522-2388 or referring to www.lordabbett.com.
Except where noted, comparative Fund performance does not account for the deduction of sales charges and would be different if sales charges were included. The Fund offers classes of shares with distinct pricing options. For a full description of the differences in pricing alternatives, please see the Fund’s prospectus.
The annual commentary above discusses the views of the Fund’s management and various portfolio holdings of the Fund as of November 30, 2013. These views and portfolio holdings may have changed after this date. Information provided in the commentary is not a recommendation to buy or sell securities. Because the Fund’s portfolio is actively managed and may change significantly, the Fund may no longer own the securities described above or may have otherwise changed its positions in the securities. For more recent information about the Fund’s portfolio holdings, please visit www.lordabbett.com.
A Note about Risk: See Notes to Financial Statements for a discussion of investment risks. For a more detailed discussion of the risks associated with the Fund, please see the Fund’s prospectus.
Mutual funds are not insured by the FDIC, are not deposits or other obligations of, or guaranteed by, banks, and are subject to investment risks including possible loss of principal amount invested.
3
Investment Comparison
Below is a comparison of a $10,000 investment in Class A shares with the same investment in both the Russell 2000® Value Index and the Russell 2000® Index, assuming reinvestment of all dividends and distributions. The performance of other classes will be greater than or less than the performance shown in the graph below due to different sales loads and expenses applicable to such classes. The graph and performance table below do not reflect the deduction of taxes that a shareholder would pay on Fund distributions or the redemption of Fund shares. Past performance is no guarantee of future results.
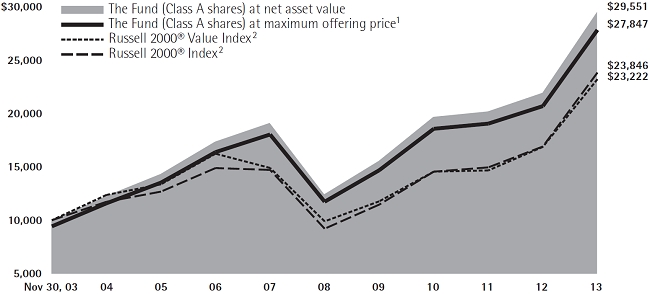
Average Annual Total Returns at Maximum Applicable
Sales Charge for the Periods Ended November 30, 2013
| | | 1 Year | | 5 Years | | 10 Years | | Life of Class | |
| Class A3 | | 26.78% | | 17.47% | | 10.78% | | — | |
| Class B4 | | 28.64% | | 17.84% | | 10.84% | | — | |
| Class C5 | | 32.56% | | 18.05% | | 10.68% | | — | |
| Class F6 | | 34.81% | | 19.10% | | — | | 7.23% | |
| Class I7 | | 34.93% | | 19.22% | | 11.79% | | — | |
| Class P7 | | 34.32% | | 18.68% | | 11.29% | | — | |
| Class R28 | | 34.08% | | 18.51% | | — | | 9.30% | |
| Class R39 | | 34.30% | | 18.65% | | — | | 9.42% | |
1 Reflects the deduction of the maximum initial sales charge of 5.75%.
2 Performance for each unmanaged index does not reflect any fees or expenses. The performance of each index is not necessarily representative of the Fund’s performance.
3 Total return, which is the percentage change in net asset value, after deduction of the maximum initial sales charge of 5.75% applicable to Class A shares, with all dividends and distributions reinvested for the periods shown ended November 30, 2013, is calculated using the SEC-required uniform method to compute such return.
4 Performance reflects the deduction of a CDSC of 5% for 1 year, 2% for 5 years and 0% for 10 years. Class B shares automatically convert to Class A shares after approximately 8 years. (There is no initial sales charge for automatic conversions.) All returns for periods greater than 8 years reflect this conversion.
5 The 1% CDSC for Class C shares normally applies before the first anniversary of the purchase date. Performance for other periods is at net asset value.
6 Class F shares commenced operations and performance for the Class began on September 28, 2007. Performance is at net asset value.
7 Performance is at net asset value.
8 Class R2 shares commenced operations on March 24, 2008 and performance for the Class began March 31, 2008. Performance is at net asset value.
9 Class R3 shares commenced operations on March 24, 2008 and performance for the Class began March 31, 2008. Performance is at net asset value.
4
Expense Example
As a shareholder of the Fund, you incur two types of costs: (1) transaction costs, including sales charges (loads) on purchase payments (these charges vary among the share classes); and (2) ongoing costs, including management fees; distribution and service (12b-1) fees (these charges vary among the share classes); and other Fund expenses. This Example is intended to help you understand your ongoing costs (in dollars) of investing in the Fund and to compare these costs with the ongoing costs of investing in other mutual funds.
The Example is based on an investment of $1,000 invested at the beginning of the period and held for the entire period (June 1, 2013 through November 30, 2013).
Actual Expenses
For each class of the Fund, the first line of the tables on the following pages provides information about actual account values and actual expenses. You may use the information in this line, together with the amount you invested, to estimate the expenses that you paid over the period. Simply divide your account value by $1,000 (for example, an $8,600 account value divided by $1,000 = 8.6), then multiply the result by the number in the first line under the heading titled “Expenses Paid During Period 6/1/13 – 11/30/13” to estimate the expenses you paid on your account during this period.
Hypothetical Example for Comparison Purposes
For each class of the Fund, the second line of the tables on the following pages provides information about hypothetical account values and hypothetical expenses based on the Fund’s actual expense ratio and an assumed rate of return of 5% per year before expenses, which is not the Fund’s actual return. The hypothetical account values and expenses may not be used to estimate the actual ending account balance or expenses you paid for the period. You may use this information to compare the ongoing costs of investing in the Fund and other funds. To do so, compare this 5% hypothetical example with the 5% hypothetical examples that appear in the shareholder reports of the other funds.
5
Please note that the expenses shown in the table are meant to highlight your ongoing costs only and do not reflect any transactional costs, such as sales charges (loads). Therefore, the second line of the table is useful in comparing ongoing costs only, and will not help you determine the relative total costs of owning different funds. In addition, if these transactional costs were included, your costs would have been higher.
| | | Beginning
Account
Value | | Ending
Account
Value | | Expenses
Paid During
Period† |
| | | 6/1/13 | | 11/30/13 | | 6/1/13 – 11/30/13 |
| Class A | | | | | | | | | | |
| Actual | | $1,000.00 | | | $1,133.60 | | | $ | 6.63 | |
| Hypothetical (5% Return Before Expenses) | | $1,000.00 | | | $1,018.86 | | | $ | 6.28 | |
| Class B | | | | | | | | | | |
| Actual | | $1,000.00 | | | $1,129.80 | | | $ | 10.36 | |
| Hypothetical (5% Return Before Expenses) | | $1,000.00 | | | $1,015.36 | | | $ | 9.80 | |
| Class C | | | | | | | | | | |
| Actual | | $1,000.00 | | | $1,129.40 | | | $ | 10.30 | |
| Hypothetical (5% Return Before Expenses) | | $1,000.00 | | | $1,015.38 | | | $ | 9.75 | |
| Class F | | | | | | | | | | |
| Actual | | $1,000.00 | | | $1,134.80 | | | $ | 5.57 | |
| Hypothetical (5% Return Before Expenses) | | $1,000.00 | | | $1,019.88 | | | $ | 5.27 | |
| Class I | | | | | | | | | | |
| Actual | | $1,000.00 | | | $1,135.20 | | | $ | 5.03 | |
| Hypothetical (5% Return Before Expenses) | | $1,000.00 | | | $1,020.37 | | | $ | 4.76 | |
| Class P | | | | | | | | | | |
| Actual | | $1,000.00 | | | $1,132.60 | | | $ | 7.43 | |
| Hypothetical (5% Return Before Expenses) | | $1,000.00 | | | $1,018.11 | | | $ | 7.03 | |
| Class R2 | | | | | | | | | | |
| Actual | | $1,000.00 | | | $1,131.40 | | | $ | 7.48 | |
| Hypothetical (5% Return Before Expenses) | | $1,000.00 | | | $1,018.07 | | | $ | 7.08 | |
| Class R3 | | | | | | | | | | |
| Actual | | $1,000.00 | | | $1,132.60 | | | $ | 7.59 | |
| Hypothetical (5% Return Before Expenses) | | $1,000.00 | | | $1,017.93 | | | $ | 7.18 | |
| † | For each class of the Fund, net expenses are equal to the annualized expense ratio for such class (1.24% for Class A, 1.94% for Class B, 1.93% for Class C, 1.04% for Class F, 0.94% for Class I, 1.39% for Class P, 1.40% for Class R2 and 1.42% for Class R3) multiplied by the average account value over the period, multiplied by 183/365 (to reflect one-half year period). |
Portfolio Holdings Presented by Sector
November 30, 2013
| Sector* | %** |
| Consumer Discretionary | 10.87% |
| Consumer Staples | 3.68% |
| Energy | 6.48% |
| Financials | 28.81% |
| Health Care | 9.59% |
| Industrials | 15.35% |
| Sector* | %** |
| Information Technology | 11.52% |
| Materials | 8.22% |
| Utilities | 4.94% |
| Repurchase Agreement | 0.54% |
| Total | 100.00% |
| * | A sector may comprise several industries. |
| ** | Represents percent of total investments. |
6
Schedule of Investments
November 30, 2013
| | | | | | Fair | |
| | | | | | Value | |
| Investments | | Shares | | | (000) | |
| COMMON STOCKS 98.09% | | | | | | | | |
| | | | | | | | | |
| Aerospace & Defense 2.05% | | | | | | | | |
| Astronics Corp.* | | | 148,600 | | | $ | 7,771 | |
| Hexcel Corp.* | | | 512,500 | | | | 22,514 | |
| Teledyne Technologies, Inc.* | | | 437,100 | | | | 40,532 | |
| Total | | | | | | | 70,817 | |
| | | | | | | | | |
| Airlines 1.11% | | | | | | | | |
| US Airways Group, Inc.* | | | 1,634,421 | | | | 38,376 | |
| | | | | | | | | |
| Auto Components 0.97% | | | | | | | | |
| Gentherm, Inc.* | | | 416,800 | | | | 10,070 | |
| Tenneco, Inc.* | | | 410,100 | | | | 23,540 | |
| Total | | | | | | | 33,610 | |
| | | | | | | | | |
| Capital Markets 1.71% | | | | | | | | |
| Stifel Financial Corp.* | | | 1,325,200 | | | | 59,329 | |
| | | | | | | | | |
| Chemicals 0.99% | | | | | | | | |
| Minerals Technologies, Inc. | | | 578,073 | | | | 34,337 | |
| | | | | | | | | |
| Commercial Banks 17.94% | | | | | | | | |
| BBCN Bancorp, Inc. | | | 2,335,600 | | | | 38,981 | |
| Boston Private Financial Holdings, Inc. | | | 2,282,300 | | | | 27,148 | |
| City National Corp. | | | 477,000 | | | | 36,424 | |
| Columbia Banking System, Inc. | | | 1,367,700 | | | | 37,913 | |
| CVB Financial Corp. | | | 965,900 | | | | 15,589 | |
| First Financial Holdings, Inc. | | | 936,977 | | | | 61,719 | |
| FNB Corp. | | | 1,228,621 | | | | 15,616 | |
| IBERIABANK Corp. | | | 571,400 | | | | 35,827 | |
| PacWest Bancorp | | | 1,583,100 | | | | 65,129 | |
| Prosperity Bancshares, Inc. | | | 611,900 | | | | 39,241 | |
| Renasant Corp. | | | 622,417 | | | | 19,170 | |
| Signature Bank* | | | 362,000 | | | | 38,462 | |
| SVB Financial Group* | | | 280,500 | | | | 28,398 | |
| UMB Financial Corp. | | | 631,300 | | | | 40,479 | |
| Umpqua Holdings Corp. | | | 2,516,900 | | | | 46,336 | |
| ViewPoint Financial Group, Inc. | | | 799,100 | | | | 20,281 | |
| | | | | | Fair | |
| | | | | | Value | |
| Investments | | Shares | | | (000) | |
| Western Alliance Bancorp* | | | 2,321,500 | | | $ | 53,905 | |
| Total | | | | | | | 620,618 | |
| | | | | | | | | |
| Commercial Services & Supplies 0.91% | | | | | | | | |
| Mobile Mini, Inc.* | | | 233,300 | | | | 9,425 | |
| Steelcase, Inc. Class A | | | 1,348,500 | | | | 22,021 | |
| Total | | | | | | | 31,446 | |
| | | | | | | | | |
| Computers & Peripherals 0.66% | | | | | | | | |
| Electronics for Imaging, Inc.* | | | 575,000 | | | | 22,770 | |
| | | | | | | | | |
| Construction & Engineering 1.99% | | | | | | | | |
| Aegion Corp.* | | | 145,548 | | | | 3,169 | |
| EMCOR Group, Inc. | | | 636,700 | | | | 25,296 | |
| Primoris Services Corp. | | | 667,700 | | | | 19,203 | |
| URS Corp. | | | 407,300 | | | | 21,167 | |
| Total | | | | | | | 68,835 | |
| | | | | | | | | |
| Construction Materials 0.23% | | | | | | | | |
| Caesarstone Sdot-Yam Ltd. (Israel)(a) | | | 161,375 | | | | 7,932 | |
| | | | | | | | | |
| Containers & Packaging 1.77% | | | | | | | | |
| AptarGroup, Inc. | | | 396,600 | | | | 25,747 | |
| Berry Plastics Group, Inc.* | | | 928,200 | | | | 19,910 | |
| Silgan Holdings, Inc. | | | 333,700 | | | | 15,601 | |
| Total | | | | | | | 61,258 | |
| | | | | | | | | |
| Electric: Utilities 1.64% | | | | | | | | |
| Cleco Corp. | | | 338,600 | | | | 15,477 | |
| IDACORP, Inc. | | | 800,900 | | | | 41,391 | |
| Total | | | | | | | 56,868 | |
| | | | | | | | | |
| Electrical Equipment 0.86% | | | | | | | | |
| Encore Wire Corp. | | | 420,800 | | | | 21,133 | |
| II-VI, Inc.* | | | 530,646 | | | | 8,676 | |
| Total | | | | | | | 29,809 | |
| | | | | | | | | |
| Electronic Equipment, Instruments & Components 4.83% | | | | | | | | |
| Anixter International, Inc.* | | | 254,800 | | | | 22,524 | |
| Cognex Corp. | | | 639,747 | | | | 21,080 | |
| Coherent, Inc. | | | 812,500 | | | | 56,095 | |
| FARO Technologies, Inc.* | | | 12,795 | | | | 698 | |
| | See Notes to Financial Statements. | 7 |
Schedule of Investments (continued)
November 30, 2013
| | | | | | Fair | |
| | | | | | Value | |
| Investments | | Shares | | | (000) | |
| Electronic Equipment, Instruments & Components (continued) | | | | | | | | |
| Littelfuse, Inc. | | | 454,700 | | | $ | 39,536 | |
| Rogers Corp.* | | | 434,100 | | | | 27,266 | |
| Total | | | | | | | 167,199 | |
| | | | | | | | | |
| Energy Equipment & Services 3.17% | | | | | | | | |
| Bristow Group, Inc. | | | 423,569 | | | | 33,970 | |
| Forum Energy Technologies, Inc.* | | | 232,100 | | | | 6,269 | |
| GulfMark Offshore, Inc. Class A | | | 353,100 | | | | 17,429 | |
| Hercules Offshore, Inc.* | | | 2,099,800 | | | | 13,418 | |
| Hornbeck Offshore Services, Inc.* | | | 328,800 | | | | 16,647 | |
| Superior Energy Services, Inc.* | | | 867,600 | | | | 22,107 | |
| Total | | | | | | | 109,840 | |
| | | | | | | | | |
| Food & Staples Retailing 1.99% | | | | | | | | |
| Andersons, Inc. (The) | | | 531,204 | | | | 45,190 | |
| Casey’s General Stores, Inc. | | | 316,400 | | | | 23,546 | |
| Total | | | | | | | 68,736 | |
| | | | | | | | | |
| Food Products 1.64% | | | | | | | | |
| Darling International, Inc.* | | | 1,791,750 | | | | 37,143 | |
| Diamond Foods, Inc.* | | | 788,900 | | | | 19,517 | |
| Total | | | | | | | 56,660 | |
| | | | | | | | | |
| Gas Utilities 3.23% | | | | | | | | |
| Laclede Group, Inc. (The) | | | 561,000 | | | | 25,868 | |
| New Jersey Resources Corp. | | | 772,800 | | | | 35,309 | |
| Piedmont Natural Gas Co., Inc. | | | 512,600 | | | | 16,993 | |
| South Jersey Industries, Inc. | | | 590,400 | | | | 33,475 | |
| Total | | | | | | | 111,645 | |
| | | | | | | | | |
| Health Care Equipment & Supplies 3.14% | | | | | | | | |
| Analogic Corp. | | | 574,000 | | | | 55,460 | |
| Greatbatch, Inc.* | | | 655,900 | | | | 26,649 | |
| West Pharmaceutical Services, Inc. | | | 529,600 | | | | 26,438 | |
| Total | | | | | | | 108,547 | |
| | | | | | Fair | |
| | | | | | Value | |
| Investments | | | Shares | | | | (000) | |
| Health Care Providers & Services 5.25% | | | | | | | | |
| Chemed Corp. | | | 367,222 | | | $ | 28,618 | |
| Hanger, Inc.* | | | 1,223,000 | | | | 47,501 | |
| HealthSouth Corp. | | | 793,600 | | | | 28,403 | |
| MEDNAX, Inc.* | | | 329,800 | | | | 36,542 | |
| Team Health Holdings, Inc.* | | | 870,600 | | | | 40,683 | |
| Total | | | | | | | 181,747 | |
| | | | | | | | | |
| Health Care Technology 0.35% | | | | | | | | |
| Allscripts Healthcare Solutions, Inc.* | | | 803,500 | | | | 12,004 | |
| | | | | | | | | |
| Hotels, Restaurants & Leisure 2.22% | | | | | | | | |
| Bob Evans Farms, Inc. | | | 457,789 | | | | 25,448 | |
| Cheesecake Factory, Inc. (The) | | | 637,600 | | | | 31,083 | |
| Jack in the Box, Inc.* | | | 428,100 | | | | 20,271 | |
| Total | | | | | | | 76,802 | |
| | | | | | | | | |
| Household Durables 0.93% | | | | | | | | |
| La-Z-Boy, Inc. | | | 1,104,053 | | | | 32,305 | |
| | | | | | | | | |
| Information Technology Services 1.48% | | | | | | | | |
| ExlService Holdings, Inc.* | | | 571,200 | | | | 15,057 | |
| Jack Henry & Associates, Inc. | | | 633,700 | | | | 35,975 | |
| Total | | | | | | | 51,032 | |
| | | | | | | | | |
| Insurance 3.30% | | | | | | | | |
| Allied World Assurance Co. | | | | | | | | |
| Holdings AG (Switzerland)(a) | | | 412,600 | | | | 46,479 | |
| Argo Group International Holdings Ltd. | | | 166,364 | | | | 7,867 | |
| Hilltop Holdings, Inc.* | | | 814,400 | | | | 19,310 | |
| Maiden Holdings Ltd. | | | 785,113 | | | | 9,940 | |
| ProAssurance Corp. | | | 638,400 | | | | 30,694 | |
| Total | | | | | | | 114,290 | |
| | | | | | | | | |
| Machinery 4.57% | | | | | | | | |
| Barnes Group, Inc. | | | 1,567,000 | | | | 57,195 | |
| Oshkosh Corp. | | | 1,448,100 | | | | 70,595 | |
| TriMas Corp.* | | | 832,200 | | | | 30,442 | |
| Total | | | | | | | 158,232 | |
| 8 | See Notes to Financial Statements. | |
Schedule of Investments (continued)
November 30, 2013
| | | | | | Fair | |
| | | | | | Value | |
| Investments | | Shares | | | (000) | |
| Marine 0.84% | | | | | | | | |
| Kirby Corp.* | | | 309,500 | | | $ | 29,232 | |
| | | | | | | | | |
| Media 1.21% | | | | | | | | |
| Cinemark Holdings, Inc. | | | 1,272,000 | | | | 41,963 | |
| | | | | | | | | |
| Metals & Mining 3.15% | | | | | | | | |
| AMCOL International, Corp. | | | 209,077 | | | | 6,515 | |
| Commercial Metals Co. | | | 1,392,900 | | | | 27,050 | |
| Reliance Steel & Aluminum Co. | | | 527,000 | | | | 38,750 | |
| RTI International Metals, Inc.* | | | 1,054,800 | | | | 36,781 | |
| Total | | | | | | | 109,096 | |
| | | | | | | | | |
| Oil, Gas & Consumable Fuels 3.21% | | | | | | | | |
| Laredo Petroleum Holdings, Inc.* | | | 1,385,200 | | | | 37,387 | |
| Rex Energy Corp.* | | | 1,640,900 | | | | 31,472 | |
| Sanchez Energy Corp.* | | | 1,644,400 | | | | 42,212 | |
| Total | | | | | | | 111,071 | |
| | | | | | | | | |
| Paper & Forest Products 1.96% | | | | | | | | |
| Boise Cascade Co.* | | | 1,221,600 | | | | 31,346 | |
| KapStone Paper and Packaging Corp. | | | 684,300 | | | | 36,460 | |
| Total | | | | | | | 67,806 | |
| | | | | | | | | |
| Pharmaceuticals 0.72% | | | | | | | | |
| Medicines Co. (The)* | | | 682,000 | | | | 24,968 | |
| | | | | | | | | |
| Real Estate Investment Trusts 4.23% | | | | | | | | |
| Brandywine Realty Trust | | | 643,700 | | | | 8,548 | |
| First Industrial Realty Trust, Inc. | | | 1,805,430 | | | | 31,523 | |
| LaSalle Hotel Properties | | | 1,443,200 | | | | 45,201 | |
| Pebblebrook Hotel Trust | | | 1,506,200 | | | | 45,683 | |
| Weingarten Realty Investors | | | 535,200 | | | | 15,275 | |
| Total | | | | | | | 146,230 | |
| | | | | | | | | |
| Real Estate Management & Development 1.24% | | | | | | | | |
| Kennedy-Wilson Holdings, Inc. | | | 2,076,600 | | | | 42,757 | |
| | | | | | | |
| | | | | | Fair | |
| | | | | | Value | |
| Investments | | | Shares | | | | (000) | |
| Road & Rail 0.74% | | | | | | | | |
| Ryder System, Inc. | | | 366,500 | | | $ | 25,596 | |
| | | | | | | | | |
| Semiconductors & Semiconductor Equipment 2.63% | | | | | | | | |
| Hittite Microwave Corp.* | | | 426,787 | | | | 26,986 | |
| Synaptics, Inc.* | | | 563,300 | | | | 28,452 | |
| Teradyne, Inc.* | | | 2,090,000 | | | | 35,593 | |
| Total | | | | | | | 91,031 | |
| | | | | | | | | |
| Software 1.77% | | | | | | | | |
| Mentor Graphics Corp. | | | 2,714,200 | | | | 61,137 | |
| | | | | | | | | |
| Specialty Retail 5.39% | | | | | | | | |
| ANN INC.* | | | 1,201,100 | | | | 42,843 | |
| Chico’s FAS, Inc. | | | 1,144,299 | | | | 21,387 | |
| Genesco, Inc.* | | | 425,700 | | | | 31,889 | |
| Group 1 Automotive, Inc. | | | 234,500 | | | | 16,052 | |
| Penske Automotive Group, Inc. | | | 662,600 | | | | 29,433 | |
| Pier 1 Imports, Inc. | | | 991,500 | | | | 22,101 | |
| Select Comfort Corp.* | | | 1,073,400 | | | | 22,659 | |
| Total | | | | | | | 186,364 | |
| | | | | | | | | |
| Trading Companies & Distributors 2.07% | | | | | | | | |
| Applied Industrial Technologies, Inc. | | | 420,000 | | | | 20,320 | |
| TAL International Group, Inc.* | | | 336,115 | | | | 18,365 | |
| Textainer Group Holdings Ltd. | | | 361,500 | | | | 14,037 | |
| WESCO International, Inc.* | | | 218,900 | | | | 18,821 | |
| Total | | | | | | | 71,543 | |
Total Common Stocks
(cost $2,489,991,016) | | | | | | | 3,393,838 | |
| | See Notes to Financial Statements. | 9 |
Schedule of Investments (concluded)
November 30, 2013
| | | Principal | | | Fair | |
| | | Amount | | | Value | |
| Investments | | (000) | | | (000) | |
| SHORT-TERM INVESTMENT 0.54% | | | | | | | | |
| | | | | | | | | |
| Repurchase Agreement | | | | | | | | |
Repurchase Agreement
dated 11/29/2013, Zero
Coupon due 12/2/2013
with Fixed Income Clearing
Corp. collateralized by
$17,975,000 of Federal
Home Loan Bank at
5.25% due 6/18/2014;
value: $18,896,219;
proceeds: $18,525,200
(cost $18,525,200) | | $ | 18,525 | | | $ | 18,525 | |
Total Investments in Securities 98.63%
(cost $2,508,516,216) | | | | | | | 3,412,363 | |
| Other Assets in Excess of Liabilities 1.37% | | | | | | | 47,413 | |
| Net Assets 100.00% | | | | | | $ | 3,459,776 | |
| * | Non-income producing security. |
| (a) | Foreign security traded in U.S. dollars. |
The following is a summary of the inputs used as of November 30, 2013 in valuing the Fund’s investments carried at fair value(1):
| | | Level 1 | | | Level 2 | | | Level 3 | | | Total | |
| Investment Type(2)(3) | | (000) | | | (000) | | | (000) | | | (000) | |
| Common Stocks | | $ | 3,393,838 | | | $ | — | | | | $— | | | $ | 3,393,838 | |
| Repurchase Agreement | | | — | | | | 18,525 | | | | — | | | | 18,525 | |
| Total | | $ | 3,393,838 | | | $ | 18,525 | | | | $— | | | $ | 3,412,363 | |
| (1) | Refer to note 2(h) for a description of fair value measurements and the three-tier hierarchy of inputs. |
| (2) | See Schedule of Investments for fair values in each industry and identification of foreign issuers and/or geography. |
| (3) | There were no level transfers during the fiscal year ended November 30, 2013. |
| 10 | See Notes to Financial Statements. | |
This page is intentionally left blank.
Statement of Assets and Liabilities
November 30, 2013
| ASSETS: | | | | |
| Investments in securities, at fair value (cost $2,508,516,216) | | $ | 3,412,363,189 | |
| Receivables: | | | | |
| Investment securities sold | | | 61,871,238 | |
| Dividends | | | 2,533,722 | |
| Capital shares sold | | | 2,334,925 | |
| Prepaid expenses and other assets | | | 67,317 | |
| Total assets | | | 3,479,170,391 | |
| LIABILITIES: | | | | |
| Payables: | | | | |
| Investment securities purchased | | | 13,241,037 | |
| Capital shares reacquired | | | 2,287,072 | |
| Management fee | | | 2,092,255 | |
| 12b-1 distribution fees | | | 441,984 | |
| Directors’ fees | | | 437,032 | |
| Fund administration | | | 114,861 | |
| To affiliates (See Note 3) | | | 24,035 | |
| Accrued expenses | | | 755,925 | |
| Total liabilities | | | 19,394,201 | |
| NET ASSETS | | $ | 3,459,776,190 | |
| COMPOSITION OF NET ASSETS: | | | | |
| Paid-in capital | | $ | 1,833,599,524 | |
| Undistributed net investment income | | | 1,096,172 | |
| Accumulated net realized gain on investments | | | 721,233,521 | |
| Net unrealized appreciation on investments | | | 903,846,973 | |
| Net Assets | | $ | 3,459,776,190 | |
| 12 | See Notes to Financial Statements. |
Statement of Assets and Liabilities (concluded)
November 30, 2013
| Net assets by class: | | | | |
| Class A Shares | | $ | 1,253,919,664 | |
| Class B Shares | | $ | 4,938,247 | |
| Class C Shares | | $ | 44,246,422 | |
| Class F Shares | | $ | 46,280,357 | |
| Class I Shares | | $ | 1,923,377,535 | |
| Class P Shares | | $ | 174,584,229 | |
| Class R2 Shares | | $ | 267,741 | |
| Class R3 Shares | | $ | 12,161,995 | |
| Outstanding shares by class: | | | | |
| Class A Shares (300 million shares of common stock authorized, $.001 par value) | | | 29,788,888 | |
| Class B Shares (30 million shares of common stock authorized, $.001 par value) | | | 137,678 | |
| Class C Shares (20 million shares of common stock authorized, $.001 par value) | | | 1,232,952 | |
| Class F Shares (30 million shares of common stock authorized, $.001 par value) | | | 1,099,377 | |
| Class I Shares (200 million shares of common stock authorized, $.001 par value) | | | 42,903,364 | |
| Class P Shares (50 million shares of common stock authorized, $.001 par value) | | | 4,206,462 | |
| Class R2 Shares (30 million shares of common stock authorized, $.001 par value) | | | 6,450 | |
| Class R3 Shares (30 million shares of common stock authorized, $.001 par value) | | | 292,368 | |
Net asset value, offering and redemption price per share
(Net assets divided by outstanding shares): | | | | |
| Class A Shares-Net asset value | | $ | 42.09 | |
Class A Shares-Maximum offering price
(Net asset value plus sales charge of 5.75%) | | $ | 44.66 | |
| Class B Shares-Net asset value | | $ | 35.87 | |
| Class C Shares-Net asset value | | $ | 35.89 | |
| Class F Shares-Net asset value | | $ | 42.10 | |
| Class I Shares-Net asset value | | $ | 44.83 | |
| Class P Shares-Net asset value | | $ | 41.50 | |
| Class R2 Shares-Net asset value | | $ | 41.51 | |
| Class R3 Shares-Net asset value | | $ | 41.60 | |
| | See Notes to Financial Statements. | 13 |
Statement of Operations
For the Year Ended November 30, 2013
| Investment income: | | | | |
| Dividends (net of foreign withholding taxes of $38,711) | | $ | 45,237,172 | |
| Interest and other | | | 3,556 | |
| Total investment income | | | 45,240,728 | |
| Expenses: | | | | |
| Management fee | | | 25,650,238 | |
| 12b-1 distribution plan-Class A | | | 3,810,717 | |
| 12b-1 distribution plan-Class B | | | 54,888 | |
| 12b-1 distribution plan-Class C | | | 408,029 | |
| 12b-1 distribution plan-Class F | | | 57,284 | |
| 12b-1 distribution plan-Class P | | | 830,853 | |
| 12b-1 distribution plan-Class R2 | | | 22,533 | |
| 12b-1 distribution plan-Class R3 | | | 66,583 | |
| Shareholder servicing | | | 4,881,786 | |
| Fund administration | | | 1,408,585 | |
| Subsidy (See Note 3) | | | 370,875 | |
| Reports to shareholders | | | 161,757 | |
| Directors’ fees | | | 121,961 | |
| Registration | | | 107,426 | |
| Custody | | | 72,608 | |
| Professional | | | 68,918 | |
| Other | | | 77,592 | |
| Gross expenses | | | 38,172,633 | |
| Expense reductions (See Note 7) | | | (3,338 | ) |
| Net expenses | | | 38,169,295 | |
| Net investment income | | | 7,071,433 | |
| Net realized and unrealized gain: | | | | |
| Net realized gain on investments in unaffiliated issuers | | | 833,794,027 | |
| Net realized gain on investments in affiliated issuers | | | 688,457 | |
| Net change in unrealized appreciation/depreciation on investments | | | 197,648,012 | |
| Net realized and unrealized gain | | | 1,032,130,496 | |
| Net Increase in Net Assets Resulting From Operations | | $ | 1,039,201,929 | |
| 14 | See Notes to Financial Statements. |
Statements of Changes in Net Assets
| | | For the Year Ended | | | For the Year Ended | |
| INCREASE (DECREASE) IN NET ASSETS | | November 30, 2013 | | | November 30, 2012 | |
| Operations: | | | | | | | | |
| Net investment income | | $ | 7,071,433 | | | $ | 26,433,254 | |
| Net realized gain on investments in affiliated and unaffiliated issuers | | | 834,482,484 | | | | 206,371,681 | |
| Net change in unrealized appreciation/depreciation on investments | | | 197,648,012 | | | | 79,002,408 | |
| Net increase in net assets resulting from operations | | | 1,039,201,929 | | | | 311,807,343 | |
| Distributions to shareholders from: | | | | | | | | |
| Net investment income | | | | | | | | |
| Class A | | | (9,106,295 | ) | | | — | |
| Class C | | | (64,809 | ) | | | — | |
| Class F | | | (509,970 | ) | | | — | |
| Class I | | | (18,526,508 | ) | | | — | |
| Class P | | | (1,048,215 | ) | | | — | |
| Class R2 | | | (28,482 | ) | | | — | |
| Class R3 | | | (57,505 | ) | | | — | |
| Net realized gain | | | | | | | | |
| Class A | | | (28,188,535 | ) | | | — | |
| Class B | | | (165,109 | ) | | | — | |
| Class C | | | (1,003,927 | ) | | | — | |
| Class F | | | (1,183,708 | ) | | | — | |
| Class I | | | (39,673,471 | ) | | | — | |
| Class P | | | (4,316,043 | ) | | | — | |
| Class R2 | | | (155,121 | ) | | | — | |
| Class R3 | | | (265,780 | ) | | | — | |
| Total distributions to shareholders | | | (104,293,478 | ) | | | — | |
| Capital share transactions (Net of share conversions) (See Note 12): | |
| Net proceeds from sales of shares | | | 496,471,086 | | | | 566,164,388 | |
| Reinvestment of distributions | | | 96,343,411 | | | | — | |
| Cost of shares reacquired | | | (1,486,077,065 | ) | | | (1,119,226,837 | ) |
| Net decrease in net assets resulting from capital share transactions | | | (893,262,568 | ) | | | (553,062,449 | ) |
| Net increase (decrease) in net assets | | | 41,645,883 | | | | (241,255,106 | ) |
| NET ASSETS: | | | | | | | | |
| Beginning of year | | $ | 3,418,130,307 | | | $ | 3,659,385,413 | |
| End of year | | $ | 3,459,776,190 | | | $ | 3,418,130,307 | |
| Undistributed net investment income | | $ | 1,096,172 | | | $ | 23,933,507 | |
| | See Notes to Financial Statements. | 15 |
Financial Highlights
| | | Class A Shares | |
| | | Year Ended 11/30 | |
| | | | 2013 | | | 2012 | | | 2011 | | | 2010 | | | 2009 | |
| Per Share Operating Performance | | | | | | | | | | | | | | | | |
| Net asset value, beginning of year | | | $32.24 | | | $29.68 | | | $28.93 | | | $22.87 | | | $18.32 | |
| Investment operations: | | | | | | | | | | | | | | | | |
| Net investment income (loss)(a) | | | .02 | | | .18 | | | (.07 | ) | | — | (b) | | (.02 | ) |
| Net realized and unrealized gain | | | 10.81 | | | 2.38 | | | .82 | | | 6.06 | | | 4.62 | |
| Total from investment operations | | | 10.83 | | | 2.56 | | | .75 | | | 6.06 | | | 4.60 | |
| Distributions to shareholders from: | | | | | | | | | | | | | | | | |
| Net investment income | | | (.24 | ) | | — | | | — | (b) | | — | | | (.05 | ) |
| Net realized gain | | | (.74 | ) | | — | | | — | | | — | | | — | |
| Total distributions | | | (.98 | ) | | — | | | — | (b) | | — | | | (.05 | ) |
| Net asset value, end of year | | | $42.09 | | | $32.24 | | | $29.68 | | | $28.93 | | | $22.87 | |
| Total Return(c) | | | 34.52 | % | | 8.63 | % | | 2.60 | % | | 26.50 | % | | 25.15 | % |
| Ratios to Average Net Assets: | | | | | | | | | | | | | | | | |
| Expenses, including expense reductions | | | 1.23 | % | | 1.23 | % | | 1.23 | % | | 1.25 | % | | 1.24 | % |
| Expenses, excluding expense reductions | | | 1.23 | % | | 1.23 | % | | 1.23 | % | | 1.25 | % | | 1.24 | % |
| Net investment income (loss) | | | .05 | % | | .57 | % | | (.22 | )% | | (.01 | )% | | (.08 | )% |
| | | | | | | | | | | | | | | | | |
| Supplemental Data: | | | | | | | | | | | | | | | | |
| Net assets, end of year (000) | | | $1,253,920 | | | $1,247,956 | | | $1,470,064 | | | $1,608,846 | | | $1,393,870 | |
| Portfolio turnover rate | | | 71.13 | % | | 28.91 | % | | 41.95 | % | | 42.28 | % | | 68.63 | % |
| (a) | Calculated using average shares outstanding during the year. |
| (b) | Amount is less than $.01. |
| (c) | Total return does not consider the effects of sales loads and assumes the reinvestment of all distributions. |
| 16 | See Notes to Financial Statements. | |
Financial Highlights (continued)
| | | Class B Shares | |
| | | Year Ended 11/30 | |
| | | | 2013 | | | 2012 | | | 2011 | | | 2010 | | | 2009 | |
| Per Share Operating Performance | | | | | | | | | | | | | | | | |
| Net asset value, beginning of year | | | $27.57 | | | $25.56 | | | $25.09 | | | $19.97 | | | $16.07 | |
| Investment operations: | | | | | | | | | | | | | | | | |
| Net investment loss(a) | | | (.19 | ) | | (.04 | ) | | (.25 | ) | | (.17 | ) | | (.12 | ) |
| Net realized and unrealized gain | | | 9.23 | | | 2.05 | | | .72 | | | 5.29 | | | 4.02 | |
| Total from investment operations | | | 9.04 | | | 2.01 | | | .47 | | | 5.12 | | | 3.90 | |
| Distributions to shareholders from: | | | | | | | | | | | | | | | | |
| Net realized gain | | | (.74 | ) | | — | | | — | | | — | | | — | |
| Net asset value, end of year | | | $35.87 | | | $27.57 | | | $25.56 | | | $25.09 | | | $19.97 | |
| Total Return(b) | | | 33.64 | % | | 7.82 | % | | 1.87 | % | | 25.64 | % | | 24.27 | % |
| Ratios to Average Net Assets: | | | | | | | | | | | | | | | | |
| Expenses, including expense reductions | | | 1.92 | % | | 1.93 | % | | 1.92 | % | | 1.95 | % | | 1.94 | % |
| Expenses, excluding expense reductions | | | 1.92 | % | | 1.93 | % | | 1.92 | % | | 1.95 | % | | 1.94 | % |
| Net investment loss | | | (.61 | )% | | (.15 | )% | | (.91 | )% | | (.73 | )% | | (.73 | )% |
| | | | | | | | | | | | | | | | | |
| Supplemental Data: | | | | | | | | | | | | | | | | |
| Net assets, end of year (000) | | | $4,938 | | | $6,406 | | | $9,612 | | | $14,612 | | | $15,917 | |
| Portfolio turnover rate | | | 71.13 | % | | 28.91 | % | | 41.95 | % | | 42.28 | % | | 68.63 | % |
| (a) | Calculated using average shares outstanding during the year. |
| (b) | Total return does not consider the effects of sales loads and assumes the reinvestment of all distributions. |
| | See Notes to Financial Statements. | 17 |
Financial Highlights (continued)
| | | Class C Shares | |
| | | Year Ended 11/30 | |
| | | | 2013 | | | 2012 | | | 2011 | | | 2010 | | | 2009 | |
| Per Share Operating Performance | | | | | | | | | | | | | | | | |
| Net asset value, beginning of year | | | $27.63 | | | $25.61 | | | $25.14 | | | $20.01 | | | $16.10 | |
| Investment operations: | | | | | | | | | | | | | | | | |
| Net investment loss(a) | | | (.21 | ) | | (.03 | ) | | (.24 | ) | | (.17 | ) | | (.13 | ) |
| Net realized and unrealized gain | | | 9.26 | | | 2.05 | | | .71 | | | 5.30 | | | 4.04 | |
| Total from investment operations | | | 9.05 | | | 2.02 | | | .47 | | | 5.13 | | | 3.91 | |
| Distributions to shareholders from: | | | | | | | | | | | | | | | | |
| Net investment income | | | (.05 | ) | | — | | | — | | | — | | | — | |
| Net realized gain | | | (.74 | ) | | — | | | — | | | — | | | — | |
| Total distributions | | | (.79 | ) | | — | | | — | | | — | | | — | |
| Net asset value, end of year | | | $35.89 | | | $27.63 | | | $25.61 | | | $25.14 | | | $20.01 | |
| Total Return(b) | | | 33.56 | % | | 7.89 | % | | 1.87 | % | | 25.64 | % | | 24.29 | % |
| Ratios to Average Net Assets: | | | | | | | | | | | | | | | | |
| Expenses, including expense reductions | | | 1.93 | % | | 1.92 | % | | 1.92 | % | | 1.95 | % | | 1.94 | % |
| Expenses, excluding expense reductions | | | 1.93 | % | | 1.92 | % | | 1.92 | % | | 1.95 | % | | 1.94 | % |
| Net investment loss | | | (.65 | )% | | (.12 | )% | | (.90 | )% | | (.72 | )% | | (.77 | )% |
| | | | | | | | | | | | | | | | | |
| Supplemental Data: | | | | | | | | | | | | | | | | |
| Net assets, end of year (000) | | | $44,246 | | | $37,988 | | | $41,597 | | | $46,980 | | | $46,275 | |
| Portfolio turnover rate | | | 71.13 | % | | 28.91 | % | | 41.95 | % | | 42.28 | % | | 68.63 | % |
| (a) | Calculated using average shares outstanding during the year. |
| (b) | Total return does not consider the effects of sales loads and assumes the reinvestment of all distributions. |
| 18 | See Notes to Financial Statements. | |
Financial Highlights (continued)
| | | Class F Shares | |
| | | Year Ended 11/30 | |
| | | | 2013 | | | 2012 | | | 2011 | | | 2010 | | | 2009 | |
| Per Share Operating Performance | | | | | | | | | | | | | | | | |
| Net asset value, beginning of year | | | $32.26 | | | $29.64 | | | $28.90 | | | $22.80 | | | $18.30 | |
| Investment operations: | | | | | | | | | | | | | | | | |
| Net investment income(a) | | | .09 | | | .26 | | | — | (b) | | .05 | | | — | (b) |
| Net realized and unrealized gain | | | 10.81 | | | 2.36 | | | .80 | | | 6.05 | | | 4.62 | |
| Total from investment operations | | | 10.90 | | | 2.62 | | | .80 | | | 6.10 | | | 4.62 | |
| Distributions to shareholders from: | | | | | | | | | | | | | | | | |
| Net investment income | | | (.32 | ) | | — | | | (.06 | ) | | — | | | (.12 | ) |
| Net realized gain | | | (.74 | ) | | — | | | — | | | — | | | — | |
| Total distributions | | | (1.06 | ) | | — | | | (.06 | ) | | — | | | (.12 | ) |
| Net asset value, end of year | | | $42.10 | | | $32.26 | | | $29.64 | | | $28.90 | | | $22.80 | |
| Total Return(c) | | | 34.81 | % | | 8.84 | % | | 2.76 | % | | 26.75 | % | | 25.39 | % |
| Ratios to Average Net Assets: | | | | | | | | | | | | | | | | |
| Expenses, including expense reductions | | | 1.03 | % | | 1.03 | % | | 1.04 | % | | 1.05 | % | | 1.03 | % |
| Expenses, excluding expense reductions | | | 1.03 | % | | 1.03 | % | | 1.04 | % | | 1.05 | % | | 1.03 | % |
| Net investment income (loss) | | | .24 | % | | .83 | % | | .01 | % | | .19 | % | | (.02 | )% |
| | | | | | | | | | | | | | | | | |
| Supplemental Data: | | | | | | | | | | | | | | | | |
| Net assets, end of year (000) | | | $46,280 | | | $52,084 | | | $32,597 | | | $27,236 | | | $22,387 | |
| Portfolio turnover rate | | | 71.13 | % | | 28.91 | % | | 41.95 | % | | 42.28 | % | | 68.63 | % |
| (a) | Calculated using average shares outstanding during the year. |
| (b) | Amount is less than $.01. |
| (c) | Total return assumes the reinvestment of all distributions. |
| | See Notes to Financial Statements. | 19 |
Financial Highlights (continued)
| | | Class I Shares | |
| | | Year Ended 11/30 | |
| | | | 2013 | | | 2012 | | | 2011 | | | 2010 | | | 2009 | |
| Per Share Operating Performance | | | | | | | | | | | | | | | | |
| Net asset value, beginning of year | | | $34.28 | | | $31.46 | | | $30.67 | | | $24.17 | | | $19.38 | |
| Investment operations: | | | | | | | | | | | | | | | | |
| Net investment income(a) | | | .14 | | | .30 | | | .03 | | | .08 | | | .05 | |
| Net realized and unrealized gain | | | 11.49 | | | 2.52 | | | .85 | | | 6.42 | | | 4.87 | |
| Total from investment operations | | | 11.63 | | | 2.82 | | | .88 | | | 6.50 | | | 4.92 | |
| Distributions to shareholders from: | | | | | | | | | | | | | | | | |
| Net investment income | | | (.34 | ) | | — | | | (.09 | ) | | — | | | (.13 | ) |
| Net realized gain | | | (.74 | ) | | — | | | — | | | — | | | — | |
| Total distributions | | | (1.08 | ) | | — | | | (.09 | ) | | — | | | (.13 | ) |
| Net asset value, end of year | | | $44.83 | | | $34.28 | | | $31.46 | | | $30.67 | | | $24.17 | |
| Total Return(b) | | | 34.93 | % | | 8.96 | % | | 2.84 | % | | 26.89 | % | | 25.55 | % |
| Ratios to Average Net Assets: | | | | | | | | | | | | | | | | |
| Expenses, including expense reductions | | | .93 | % | | .93 | % | | .93 | % | | .95 | % | | .94 | % |
| Expenses, excluding expense reductions | | | .93 | % | | .93 | % | | .93 | % | | .95 | % | | .94 | % |
| Net investment income | | | .35 | % | | .88 | % | | .09 | % | | .30 | % | | .21 | % |
| | | | | | | | | | | | | | | | | |
| Supplemental Data: | | | | | | | | | | | | | | | | |
| Net assets, end of year (000) | | | $1,923,378 | | | $1,862,546 | | | $1,855,748 | | | $1,692,837 | | | $1,231,291 | |
| Portfolio turnover rate | | | 71.13 | % | | 28.91 | % | | 41.95 | % | | 42.28 | % | | 68.63 | % |
| (a) | Calculated using average shares outstanding during the year. |
| (b) | Total return assumes the reinvestment of all distributions. |
| 20 | See Notes to Financial Statements. | |
Financial Highlights (continued)
| | | Class P Shares | |
| | | Year Ended 11/30 | |
| | | | 2013 | | | 2012 | | | 2011 | | | 2010 | | | 2009 | |
| Per Share Operating Performance | | | | | | | | | | | | | | | | |
| Net asset value, beginning of year | | | $31.79 | | | $29.31 | | | $28.62 | | | $22.66 | | | $18.15 | |
| Investment operations: | | | | | | | | | | | | | | | | |
| Net investment income (loss)(a) | | | (.03 | ) | | .13 | | | (.11 | ) | | (.04 | ) | | (.05 | ) |
| Net realized and unrealized gain | | | 10.66 | | | 2.35 | | | .80 | | | 6.00 | | | 4.57 | |
| Total from investment operations | | | 10.63 | | | 2.48 | | | .69 | | | 5.96 | | | 4.52 | |
| Distributions to shareholders from: | | | | | | | | | | | | | | | | |
| Net investment income | | | (.18 | ) | | — | | | — | | | — | | | (.01 | ) |
| Net realized gain | | | (.74 | ) | | — | | | — | | | — | | | — | |
| Total distributions | | | (.92 | ) | | — | | | — | | | — | | | (.01 | ) |
| Net asset value, end of year | | | $41.50 | | | $31.79 | | | $29.31 | | | $28.62 | | | $22.66 | |
| Total Return(b) | | | 34.32 | % | | 8.46 | % | | 2.41 | % | | 26.30 | % | | 24.94 | % |
| Ratios to Average Net Assets: | | | | | | | | | | | | | | | | |
| Expenses, including expense reductions | | | 1.38 | % | | 1.38 | % | | 1.38 | % | | 1.40 | % | | 1.39 | % |
| Expenses, excluding expense reductions | | | 1.38 | % | | 1.38 | % | | 1.38 | % | | 1.40 | % | | 1.39 | % |
| Net investment income (loss) | | | (.09 | )% | | .42 | % | | (.37 | )% | | (.16 | )% | | (.23 | )% |
| | | | | | | | | | | | | | | | | |
| Supplemental Data: | | | | | | | | | | | | | | | | |
| Net assets, end of year (000) | | | $174,584 | | | $192,603 | | | $231,655 | | | $295,973 | | | $261,914 | |
| Portfolio turnover rate | | | 71.13 | % | | 28.91 | % | | 41.95 | % | | 42.28 | % | | 68.63 | % |
| (a) | Calculated using average shares outstanding during the year. |
| (b) | Total return assumes the reinvestment of all distributions. |
| | See Notes to Financial Statements. | 21 |
Financial Highlights (continued)
| | | Class R2 Shares | |
| | | Year Ended 11/30 | |
| | | | 2013 | | | 2012 | | | 2011 | | | 2010 | | | 2009 | |
| Per Share Operating Performance | | | | | | | | | | | | | | | | |
| Net asset value, beginning of year | | | $31.81 | | | $29.37 | | | $28.72 | | | $22.77 | | | $18.29 | |
| Investment operations: | | | | | | | | | | | | | | | | |
| Net investment income (loss)(a) | | | .01 | | | .09 | | | (.11 | ) | | (.11 | ) | | (.10 | ) |
| Net realized and unrealized gain | | | 10.57 | | | 2.35 | | | .76 | | | 6.06 | | | 4.62 | |
| Total from investment operations | | | 10.58 | | | 2.44 | | | .65 | | | 5.95 | | | 4.52 | |
| Distributions to shareholders from: | | | | | | | | | | | | | | | | |
| Net investment income | | | (.14 | ) | | — | | | — | | | — | | | (.04 | ) |
| Net realized gain | | | (.74 | ) | | — | | | — | | | — | | | — | |
| Total distributions | | | (.88 | ) | | — | | | — | | | — | | | (.04 | ) |
| Net asset value, end of year | | | $41.51 | | | $31.81 | | | $29.37 | | | $28.72 | | | $22.77 | |
| Total Return(b) | | | 34.08 | % | | 8.31 | % | | 2.26 | % | | 26.13 | % | | 24.77 | % |
| Ratios to Average Net Assets: | | | | | | | | | | | | | | | | |
| Expenses, including expense reductions | | | 1.53 | % | | 1.53 | % | | 1.56 | % | | 1.54 | % | | 1.52 | % |
| Expenses, excluding expense reductions | | | 1.53 | % | | 1.53 | % | | 1.56 | % | | 1.54 | % | | 1.52 | % |
| Net investment income (loss) | | | .04 | % | | .28 | % | | (.38 | )% | | (.41 | )% | | (.48 | )% |
| | | | | | | | | | | | | | | | | |
| Supplemental Data: | | | | | | | | | | | | | | | | |
| Net assets, end of year (000) | | | $268 | | | $6,910 | | | $7,205 | | | $78 | | | $86 | |
| Portfolio turnover rate | | | 71.13 | % | | 28.91 | % | | 41.95 | % | | 42.28 | % | | 68.63 | % |
| (a) | Calculated using average shares outstanding during the year. |
| (b) | Total return assumes the reinvestment of all distributions. |
| 22 | See Notes to Financial Statements. | |
Financial Highlights (concluded)
| | | Class R3 Shares | |
| | | Year Ended 11/30 | |
| | | | 2013 | | | 2012 | | | 2011 | | | 2010 | | | 2009 | |
| Per Share Operating Performance | | | | | | | | | | | | | | | | |
| Net asset value, beginning of year | | | $31.85 | | | $29.38 | | | $28.69 | | | $22.73 | | | $18.29 | |
| Investment operations: | | | | | | | | | | | | | | | | |
| Net investment income (loss)(a) | | | (.05 | ) | | .12 | | | (.11 | ) | | (.04 | ) | | (.06 | ) |
| Net realized and unrealized gain | | | 10.70 | | | 2.35 | | | .80 | | | 6.00 | | | 4.60 | |
| Total from investment operations | | | 10.65 | | | 2.47 | | | .69 | | | 5.96 | | | 4.54 | |
| Distributions to shareholders from: | | | | | | | | | | | | | | | | |
| Net investment income | | | (.16 | ) | | — | | | — | | | — | | | (.10 | ) |
| Net realized gain | | | (.74 | ) | | — | | | — | | | — | | | — | |
| Total distributions | | | (.90 | ) | | — | | | — | | | — | | | (.10 | ) |
| Net asset value, end of year | | | $41.60 | | | $31.85 | | | $29.38 | | | $28.69 | | | $22.73 | |
| Total Return(b) | | | 34.30 | % | | 8.41 | % | | 2.41 | % | | 26.22 | % | | 24.94 | % |
| Ratios to Average Net Assets: | | | | | | | | | | | | | | | | |
| Expenses, including expense reductions | | | 1.42 | % | | 1.42 | % | | 1.42 | % | | 1.45 | % | | 1.44 | % |
| Expenses, excluding expense reductions | | | 1.42 | % | | 1.42 | % | | 1.42 | % | | 1.45 | % | | 1.44 | % |
| Net investment income (loss) | | | (.14 | )% | | .39 | % | | (.37 | )% | | (.16 | )% | | .30 | % |
| | | | | | | | | | | | | | | | | |
| Supplemental Data: | | | | | | | | | | | | | | | | |
| Net assets, end of year (000) | | | $12,162 | | | $11,635 | | | $10,907 | | | $5,190 | | | $1,995 | |
| Portfolio turnover rate | | | 71.13 | % | | 28.91 | % | | 41.95 | % | | 42.28 | % | | 68.63 | % |
| (a) | Calculated using average shares outstanding during the year. |
| (b) | Total return assumes the reinvestment of all distributions. |
| | See Notes to Financial Statements. | 23 |
Notes to Financial Statements
Lord Abbett Research Fund, Inc. (the “Company”) is registered under the Investment Company Act of 1940, as amended (the “Act”), as a diversified, open-end management investment company and was incorporated under Maryland law on April 6, 1992. The Company currently consists of three separate funds. This report covers one of the funds and its classes: Small-Cap Value Series (“Small Cap Value Fund” or the “Fund”).
The Fund’s investment objective is long-term capital appreciation. The Fund has eight classes of shares: Class A, B, C, F, I, P, R2 and R3, each with different expenses and dividends. A front-end sales charge is normally added to the net asset value (“NAV”) for Class A shares. There is no front-end sales charge in the case of Class B, C, F, I, P, R2 and R3 shares, although there may be a contingent deferred sales charge (“CDSC”) in certain cases as follows: Class A shares purchased without a sales charge and redeemed before the first day of the month in which the one-year anniversary of the purchase falls (subject to certain exceptions as set forth in the Fund’s prospectus); Class B shares redeemed before the sixth anniversary of purchase; and Class C shares redeemed before the first anniversary of purchase. Class B shares will automatically convert to Class A shares on the 25th day of the month (or, if the 25th day is not a business day, the next business day thereafter) following the eighth anniversary of the day on which the purchase order was accepted. The Fund is open to certain new investors on a limited basis as set forth in the Fund’s prospectus. The Fund no longer issues Class B shares for purchase. The Fund’s Class P shares are closed to substantially all investors, with certain exceptions as set forth in the Fund’s prospectus.
The preparation of the financial statements in conformity with accounting principles generally accepted in the United States of America requires management to make certain estimates and assumptions that affect the reported amounts of assets and liabilities and disclosure of contingent assets and liabilities at the date of the financial statements and the reported amounts of increases and decreases in net assets from operations during the reporting period. Actual results could differ from those estimates.
| 2. | SIGNIFICANT ACCOUNTING POLICIES |
| | |
| (a) | Investment Valuation–Under procedures approved by the Fund’s Board of Directors (the “Board”), Lord, Abbett & Co. LLC (“Lord Abbett”), the Fund’s investment manager, has formed a Pricing Committee to administer the pricing and valuation of portfolio investments and to ensure that prices utilized reasonably reflect fair value. Among other things, these procedures allow the Fund to utilize independent pricing services, quotations from securities and financial instrument dealers and other market sources to determine fair value. |
| | |
| | Securities actively traded on any recognized U.S. or non-U.S. exchange or on The NASDAQ Stock Market LLC are valued at the last sale price or official closing price on the exchange or system on which they are principally traded. Events occurring after the close of trading on non-U.S. exchanges may result in adjustments to the valuation of foreign securities to reflect their fair value as of the close of regular trading on the New York Stock Exchange LLC. The Fund may rely on an independent fair valuation service in adjusting the valuations of foreign securities. Unlisted equity securities are valued at the last quoted sale price or, if no sale price is available, at the mean between the most recently quoted bid and asked prices. |
| | |
| | Securities for which prices are not readily available are valued at fair value as determined by the Pricing Committee and approved by the Board. The Pricing Committee considers a number |
24
Notes to Financial Statements (continued)
| | of factors, including observable and unobservable inputs, when arriving at fair value. The Pricing Committee may use related or comparable assets or liabilities, recent transactions, market multiples, book values and other relevant information to determine fair value of portfolio investments. The Board or a designated committee thereof regularly reviews fair value determinations made by the Pricing Committee and employs techniques such as reviewing related market activity, reviewing inputs and assumptions, and retrospectively comparing prices of subsequent purchases and sales transactions to fair value determinations made by the Pricing Committee. |
| | |
| | Short-term securities with 60 days or less remaining to maturity are valued using the amortized cost method, which approximates fair value. |
| | |
| (b) | Security Transactions–Security transactions are recorded as of the date that the securities are purchased or sold (trade date). Realized gains and losses on sales of portfolio securities are calculated using the identified-cost method. Realized and unrealized gains (losses) are allocated to each class of shares based upon the relative proportion of net assets at the beginning of the day. |
| | |
| (c) | Investment Income–Dividend income is recorded on the ex-dividend date. Interest income is recorded on the accrual basis as earned. Discounts are accreted and premiums are amortized using the effective interest method and are included in Interest and other income on the Statement of Operations. Withholding taxes on foreign dividends have been provided for in accordance with the applicable country’s tax rules and rates. Investment income is allocated to each class of shares based upon the relative proportion of net assets at the beginning of the day. |
| | |
| (d) | Income Taxes–It is the policy of the Fund to meet the requirements of Subchapter M of the Internal Revenue Code applicable to regulated investment companies and to distribute substantially all taxable income and capital gains to its shareholders. Therefore, no income tax provision is required. |
| | |
| | The Fund files U.S. federal and various state and local tax returns. No income tax returns are currently under examination. The statute of limitations on the Fund’s filed U.S. federal tax returns remains open for the fiscal years ended November 30, 2010 through November 30, 2013. The statutes of limitations on the Company’s state and local tax returns may remain open for an additional year depending upon the jurisdiction. |
| | |
| (e) | Expenses–Expenses incurred by the Company that do not specifically relate to an individual fund are generally allocated to the funds within the Company on a pro rata basis by relative net assets. Expenses, excluding class-specific expenses, are allocated to each class of shares based upon the relative proportion of net assets at the beginning of the day. Class A, B, C, F, P, R2 and R3 shares bear their class-specific share of all expenses and fees relating to the Fund’s 12b-1 Distribution Plan. |
| | |
| (f) | Foreign Transactions–The books and records of the Fund are maintained in U.S. dollars and transactions denominated in foreign currencies are recorded in the Fund’s records at the rate prevailing when earned or recorded. Asset and liability accounts that are denominated in foreign currencies are adjusted daily to reflect current exchange rates and any unrealized gain (loss) is included in Net change in unrealized appreciation/depreciation on investments on the Fund’s Statement of Operations. The resultant exchange gains and losses upon settlement of such transactions are included in Net realized gain on investments in unaffiliated issuers on |
25
Notes to Financial Statements (continued)
| | the Fund’s Statement of Operations. The Fund does not isolate that portion of the results of operations arising as a result of changes in the foreign exchange rates from the changes in market prices of the securities. |
| | | |
| (g) | Repurchase Agreements–The Fund may enter into repurchase agreements with respect to securities. A repurchase agreement is a transaction in which a fund acquires a security and simultaneously commits to resell that security to the seller (a bank or securities dealer) at an agreed-upon price on an agreed-upon date. The Fund requires at all times that the repurchase agreement be collateralized by cash, or by securities of the U.S. Government, its agencies, its instrumentalities, or U.S. Government sponsored enterprises having a value equal to, or in excess of, the value of the repurchase agreement (including accrued interest). If the seller of the agreement defaults on its obligation to repurchase the underlying securities at a time when the fair value of these securities has declined, the Fund may incur a loss upon disposition of the securities. |
| | | |
| (h) | Fair Value Measurements–Fair value is defined as the price that the Fund would receive upon selling an investment or transferring a liability in an orderly transaction to an independent buyer in the principal or most advantageous market of the investment. A three-tier hierarchy is used to maximize the use of observable market data and minimize the use of unobservable inputs and to establish classification of fair value measurements for disclosure purposes. Inputs refer broadly to the assumptions that market participants would use in pricing the asset or liability, including assumptions about risk – for example, the risk inherent in a particular valuation technique used to measure fair value (such as a pricing model) and/or the risk inherent in the inputs to the valuation technique. Inputs may be observable or unobservable. Observable inputs reflect the assumptions market participants would use in pricing the asset or liability. Observable inputs are based on market data obtained from sources independent of the reporting entity. Unobservable inputs reflect the reporting entity’s own assumptions about the assumptions market participants would use in pricing the asset or liability. Unobservable inputs are based on the best information available in the circumstances. The three-tier hierarchy of inputs is summarized in the three broad Levels listed below: |
| | • Level 1 – | unadjusted quoted prices in active markets for identical investments; |
| | | |
| | • Level 2 – | other significant observable inputs (including quoted prices for similar investments, interest rates, prepayment speeds, credit risk, etc.); and |
| | | |
| | • Level 3 – | significant unobservable inputs (including the Fund’s own assumptions in determining the fair value of investments). |
| | A summary of inputs used in valuing the Fund’s investments as of November 30, 2013 and, if applicable, Level 1/Level 2 transfers and Level 3 rollforwards for the fiscal year then ended is included in the Fund’s Schedule of Investments. |
| | | |
| | Changes in valuation techniques may result in transfers into or out of an assigned level within the three-tier hierarchy. All transfers between different levels within the three-tier hierarchy are deemed to have occurred as of the beginning of the reporting period. The inputs or methodology used for valuing securities are not necessarily an indication of the risk associated with investing in those securities. |
26
Notes to Financial Statements (continued)
| 3. | MANAGEMENT FEE AND OTHER TRANSACTIONS WITH AFFILIATES |
Management Fee
The Company has a management agreement with Lord Abbett, pursuant to which Lord Abbett supplies the Fund with investment management services and executive and other personnel, provides office space and pays for ordinary and necessary office and clerical expenses relating to research and statistical work and supervision of the Fund’s investment portfolio.
The management fee is based on the Fund’s average daily net assets at the following annual rates:
| First $2 billion | .75% |
| Over $2 billion | .70% |
For the fiscal year ended November 30, 2013, the effective management fee was at an annualized rate of 0.73% of the Fund’s average daily net assets.
In addition, Lord Abbett provides certain administrative services to the Fund pursuant to an Administrative Services Agreement in return for a fee at an annual rate of .04% of the Fund’s average daily net assets.
The Fund, along with certain other funds managed by Lord Abbett (collectively, the “Underlying Funds”), has entered into a Servicing Arrangement with Lord Abbett Alpha Strategy Fund of Lord Abbett Securities Trust (a “Fund of Funds”), pursuant to which the Underlying Fund pays a portion of the expense (excluding management fees and distribution and service fees) of the applicable Fund of Funds in proportion to the average daily value of the Underlying Fund shares owned by each Fund of Funds. Amounts paid pursuant to the Servicing Arrangement are included in Subsidy expense on the Fund’s Statement of Operations and Payable to affiliates on the Fund’s Statement of Assets and Liabilities.
As of November 30, 2013, the percentage of the Fund’s outstanding shares owned by Lord Abbett Alpha Strategy Fund was 6.70%.
12b-1 Distribution Plan
The Fund has adopted a distribution plan with respect to Class A, B, C, F, P, R2 and R3 shares pursuant to Rule 12b-1 under the Act, which provides for the payment of ongoing distribution and service fees to Lord Abbett Distributor LLC (the “Distributor”), an affiliate of Lord Abbett. The following annual rates have been approved by the Board pursuant to the plan:
| Fees* | | Class A | | Class B | | Class C | | Class F | | Class P | | Class R2 | | Class R3 | |
| Service | | .25 | % | | .25 | % | | .25 | % | | — | | | .25 | % | | .25 | % | | .25 | % | |
| Distribution | | .05 | % | | .75 | % | | .75 | % | | .10 | % | | .20 | % | | .35 | % | | .25 | % | |
| * | The Fund may designate a portion of the aggregate fee as attributable to service activities for purposes of calculating Financial Industry Regulatory Authority, Inc. (“FINRA”) sales charge limitations. |
Class I shares do not have a distribution plan.
27
Notes to Financial Statements (continued)
Commissions
Distributor received the following commissions on sales of shares of the Fund, after concessions were paid to authorized dealers, for the fiscal year ended November 30, 2013:
| Distributor Commissions | | Dealers’ Concessions |
| $23,644 | | $131,569 |
Distributor received CDSCs of $1,128 and $0 for Class A and Class C shares, respectively, for the fiscal year ended November 30, 2013.
A Director and certain of the Company’s officers have an interest in Lord Abbett.
| 4. | DISTRIBUTIONS AND CAPITAL LOSS CARRYFORWARDS |
Dividends from net investment income, if any, are declared and paid at least annually. Taxable net realized gains from investment transactions, reduced by allowable capital loss carryforwards, if any, are declared and distributed to shareholders at least annually. The capital loss carryforward amount, if any, is available to offset future net capital gains. Dividends and distributions to shareholders are recorded on the ex-dividend date. The amounts of dividends and distributions from net investment income and net realized capital gains are determined in accordance with federal income tax regulations, which may differ from accounting principles generally accepted in the United States of America. These book/tax differences are either considered temporary or permanent in nature. To the extent these differences are permanent in nature, such amounts are reclassified within the components of net assets based on their federal tax basis treatment; temporary differences do not require reclassification. Dividends and distributions, which exceed earnings and profits for tax purposes, are reported as a tax return of capital.
Subsequent to the Fund’s fiscal year ended November 30, 2013, net investment income, short-term capital gain, and long-term capital gain distributions of approximately $2,819,000, $68,585,000 and $652,112,000, respectively, were declared by the Fund on December 11, 2013. The distributions were paid on December 18, 2013 to shareholders of record on December 17, 2013.
The tax character of distributions paid during the fiscal years ended November 30, 2013 and 2012 was as follows:
| | | Year Ended
11/30/2013 | | Year Ended
11/30/2012 | |
| Distributions paid from: | | | | | | | |
| Ordinary income | | $ | 29,330,235 | | $ | — | |
| Net long-term capital gains | | | 74,963,243 | | | — | |
| Total distributions | | $ | 104,293,478 | | $ | — | |
As of November 30, 2013, the components of accumulated gains on a tax-basis were as follows:
| Undistributed ordinary income – net | | $ | 71,394,861 | |
| Undistributed long-term capital gains | | | 652,111,635 | |
| Total undistributed earnings | | | 723,506,496 | |
| Temporary differences | | | (437,032 | ) |
| Unrealized gains – net | | | 903,107,202 | |
| Total accumulated gains – net | | $ | 1,626,176,666 | |
28
Notes to Financial Statements (continued)
As of November 30, 2013, the aggregate unrealized security gains and losses based on cost for U.S. federal income tax purposes were as follows:
| Tax cost | $ | 2,509,255,987 | |
| Gross unrealized gain | | 911,761,298 | |
| Gross unrealized loss | | (8,654,096 | ) |
| Net unrealized security gain | $ | 903,107,202 | |
The difference between book-basis and tax-basis unrealized gains (losses) is attributable to the tax treatment of certain securities and wash sales.
Permanent items identified during the fiscal year ended November 30, 2013 have been reclassified among the components of net assets based on their tax basis treatment as follows:
| Undistributed | | | Accumulated | | | |
| Net Investment | | | Net Realized | | | Paid-in |
| Income | | | Gain | | | Capital |
| $(566,984 | ) | | $(117,478,982 | ) | | $118,045,966 |
The permanent differences are attributable to the tax treatment of certain distributions.
| 5. | PORTFOLIO SECURITIES TRANSACTIONS |
Purchases and sales of investment securities (excluding short-term investments) for the fiscal year ended November 30, 2013 were as follows:
| Purchases | | Sales |
| $2,435,015,722 | | $3,420,127,810 |
There were no purchases or sales of U.S. Government securities for the fiscal year ended November 30, 2013.
| 6. | DIRECTORS’ REMUNERATION |
The Company’s officers and a Director, who are associated with Lord Abbett, do not receive any compensation from the Company for serving in such capacities. Independent Directors’ fees are allocated among all Lord Abbett-sponsored funds based on the net assets of each fund. There is an equity-based plan available to all Independent Directors under which Independent Directors must defer receipt of a portion of, and may elect to defer receipt of an additional portion of Directors’ fees. The deferred amounts are treated as though equivalent dollar amounts had been invested in the funds. Such amounts and earnings accrued thereon are included in Directors’ fees on the Statement of Operations and in Directors’ fees payable on the Statement of Assets and Liabilities and are not deductible for U.S. federal income tax purposes until such amounts are paid.
The Company has entered into an arrangement with its transfer agent and custodian, whereby credits realized as a result of uninvested cash balances are used to reduce a portion of the Fund’s expenses.
During the fiscal year ended November 30, 2013, the Fund and certain other funds managed by Lord Abbett (the “participating funds”) participated in an unsecured revolving credit facility (“Facility”) with State Street Bank and Trust Company (“SSB”). The Facility is to be used for
29
Notes to Financial Statements (continued)
temporary or emergency purposes as an additional source of liquidity to fund redemptions of investor shares. The Board considers annual renewal of the Facility under terms that depend on market conditions at the time of the renewal. The amounts available under the Facility are (i) the lesser of either $250,000,000 or 33.33% of total assets per participating fund and (ii) $350,000,000 in the aggregate for all participating funds. The annual fee to maintain the Facility is .09% of the amount available under the Facility. Each participating fund pays its pro rata share based on the net assets of each participating fund. This amount is included in Other expenses on the Fund’s Statement of Operations. Any borrowings under this Facility will bear interest at current market rates as set forth in the credit agreement.
Effective July 1, 2013, the Fund and participating funds renewed the Facility through June 30, 2014 under the same terms as described above.
During the fiscal year ended November 30, 2013, a participating fund also managed by Lord Abbett utilized the Facility and fully repaid its borrowings on June 13, 2013. As of November 30, 2013, there were no loans outstanding pursuant to this Facility.
| 9. | TRANSACTIONS WITH AFFILIATED ISSUERS |
An affiliated issuer is one in which a fund has ownership of at least 5% of the outstanding voting securities of the underlying issuer at any point during the fiscal year. The Fund had the following transactions with affiliated issuers for the fiscal year ended November 30, 2013:
Affiliated
Issuer | | Balance of
Shares
Held at
11/30/2012 | | Gross
Additions | | Gross
Sales | | | Balance of
Shares
Held at
11/30/2013 | | Fair
Value at
11/30/2013 | | Net
Realized
Gain
12/1/2012
to
11/30/2013 | (a) | | Dividend
Income
12/1/2012
to
11/30/2013 | (a) |
| Koppers Holdings, Inc.(b) | | | 1,045,200 | | | — | | | (1,045,200 | ) | | | — | | $ | — | | $ | 367,706 | | | $ | — | |
| Navigators Group, Inc. (The)(b) | | | 773,400 | | | — | | | (773,400 | ) | | | — | | | — | | | 320,751 | | | | — | |
| Total | | | | | | | | | | | | | | | $ | — | | $ | 688,457 | | | $ | — | |
| (a) | Represents realized gains and dividend income earned only when the issuer was an affiliate of the Fund. |
| (b) | No longer an affiliated issuer as of November 30, 2013. |
| 10. | CUSTODIAN AND ACCOUNTING AGENT |
SSB is the Company’s custodian and accounting agent. SSB performs custodial, accounting and recordkeeping functions relating to portfolio transactions and calculating the Fund’s NAV.
The Fund is subject to the general risks and considerations associated with equity investing, as well as the particular risks associated with small company value stocks. The value of an investment will fluctuate in response to movements in the equity securities market in general and to the changing prospects of individual companies in which the Fund invests. Small company value stocks may perform differently than the market as a whole and other types of stocks, such as large company stocks or growth stocks. The market may fail to recognize the intrinsic value of particular value stocks for a long time. In addition, small cap company stocks may be more volatile and less liquid
30
Notes to Financial Statements (continued)
than large cap company stocks. Also, if the Fund’s assessment of a company’s value or prospects for exceeding earnings expectations or market conditions is wrong, the Fund could suffer losses or produce poor performance relative to other funds, even in a rising market.
These factors can affect the Fund’s performance.
| 12. | SUMMARY OF CAPITAL TRANSACTIONS |
Transactions in shares by capital stock were as follows:
| | | | | | Year Ended | | | | | | Year Ended | |
| | | November 30, 2013 | | | November 30, 2012 | |
| Class A Shares | | Shares | | | Amount | | | Shares | | | Amount | |
| Shares sold | | | 5,129,907 | | | $ | 186,569,254 | | | | 5,713,997 | | | $ | 181,265,210 | |
| Converted from Class B* | | | 42,571 | | | | 1,547,735 | | | | 72,612 | | | | 2,334,823 | |
| Reinvestment of distributions | | | 1,050,275 | | | | 33,598,304 | | | | — | | | | — | |
| Shares reacquired | | | (15,139,331 | ) | | | (555,902,777 | ) | | | (16,613,976 | ) | | | (522,964,712 | ) |
| Decrease | | | (8,916,578 | ) | | $ | (334,187,484 | ) | | | (10,827,367 | ) | | $ | (339,364,679 | ) |
| | | | | | | | | | | | | | | | | |
| Class B Shares | | | | | | | | | | | | | | | | |
| Shares sold | | | 5,445 | | | $ | 179,548 | | | | 15,402 | | | $ | 429,152 | |
| Reinvestment of distributions | | | 5,789 | | | | 158,860 | | | | — | | | | — | |
| Shares reacquired | | | (56,166 | ) | | | (1,729,227 | ) | | | (74,519 | ) | | | (2,022,813 | ) |
| Converted to Class A* | | | (49,771 | ) | | | (1,547,735 | ) | | | (84,622 | ) | | | (2,334,823 | ) |
| Decrease | | | (94,703 | ) | | $ | (2,938,554 | ) | | | (143,739 | ) | | $ | (3,928,484 | ) |
| | | | | | | | | | | | | | | | | |
| Class C Shares | | | | | | | | | | | | | | | | |
| Shares sold | | | 61,449 | | | $ | 1,980,852 | | | | 29,892 | | | $ | 800,198 | |
| Reinvestment of distributions | | | 27,590 | | | | 757,626 | | | | — | | | | — | |
| Shares reacquired | | | (231,075 | ) | | | (7,263,109 | ) | | | (279,264 | ) | | | (7,569,382 | ) |
| Decrease | | | (142,036 | ) | | $ | (4,524,631 | ) | | | (249,372 | ) | | $ | (6,769,184 | ) |
| | | | | | | | | | | | | | | | | |
| Class F Shares | | | | | | | | | | | | | | | | |
| Shares sold | | | 237,584 | | | $ | 8,585,192 | | | | 994,332 | | | $ | 32,099,457 | |
| Reinvestment of distributions | | | 38,136 | | | | 1,217,697 | | | | — | | | | — | |
| Shares reacquired | | | (790,861 | ) | | | (30,739,857 | ) | | | (479,727 | ) | | | (15,131,390 | ) |
| Increase (decrease) | | | (515,141 | ) | | $ | (20,936,968 | ) | | | 514,605 | | | $ | 16,968,067 | |
| | | | | | | | | | | | | | | | | |
| Class I Shares | | | | | | | | | | | | | | | | |
| Shares sold | | | 7,114,851 | | | $ | 272,587,932 | | | | 9,616,276 | | | $ | 319,564,156 | |
| Reinvestment of distributions | | | 1,610,986 | | | | 54,741,286 | | | | — | | | | — | |
| Shares reacquired | | | (20,155,168 | ) | | | (780,309,881 | ) | | | (14,269,916 | ) | | | (480,815,569 | ) |
| Decrease | | | (11,429,331 | ) | | $ | (452,980,663 | ) | | | (4,653,640 | ) | | $ | (161,251,413 | ) |
| | | | | | | | | | | | | | | | | |
| Class P Shares | | | | | | | | | | | | | | | | |
| Shares sold | | | 595,391 | | | $ | 21,355,336 | | | | 771,469 | | | $ | 24,084,374 | |
| Reinvestment of distributions | | | 169,783 | | | | 5,363,447 | | | | — | | | | — | |
| Shares reacquired | | | (2,616,780 | ) | | | (93,676,049 | ) | | | (2,617,286 | ) | | | (81,658,131 | ) |
| Decrease | | | (1,851,606 | ) | | $ | (66,957,266 | ) | | | (1,845,817 | ) | | $ | (57,573,757 | ) |
31
Notes to Financial Statements (concluded)
| | | | | | Year Ended | | | | | | Year Ended | |
| | | November 30, 2013 | | | November 30, 2012 | |
| Class R2 Shares | | Shares | | | Amount | | | Shares | | | Amount | |
| Shares sold | | | 9,279 | | | $ | 327,573 | | | | 24,587 | | | $ | 780,124 | |
| Reinvestment of distributions | | | 5,779 | | | | 182,905 | | | | — | | | | — | |
| Shares reacquired | | | (225,807 | ) | | | (8,199,961 | ) | | | (52,689 | ) | | | (1,664,769 | ) |
| Decrease | | | (210,749 | ) | | $ | (7,689,483 | ) | | | (28,102 | ) | | $ | (884,645 | ) |
| | | | | | | | | | | | | | | | | |
| Class R3 Shares | | | | | | | | | | | | | | | | |
| Shares sold | | | 137,353 | | | $ | 4,885,399 | | | | 227,916 | | | $ | 7,141,717 | |
| Reinvestment of distributions | | | 10,208 | | | | 323,286 | | | | — | | | | — | |
| Shares reacquired | | | (220,461 | ) | | | (8,256,204 | ) | | | (233,944 | ) | | | (7,400,071 | ) |
| Decrease | | | (72,900 | ) | | $ | (3,047,519 | ) | | | (6,028 | ) | | $ | (258,354 | ) |
| * | Automatic conversion of Class B shares occurs on the 25th day of the month (or, if the 25th day is not a business day, the next business day thereafter) following the eighth anniversary of the day on which the purchase order was accepted. |
| 13. | RECENT ACCOUNTING STANDARD |
In December 2011, the Financial Accounting Standards Board (“FASB”) issued Accounting Standards Update No. 2011-11 “Disclosures about Offsetting Assets and Liabilities” (“ASU 2011-11”). This disclosure requirement is intended to help investors and other financial statement users better assess the effect or potential effect of offsetting arrangements on a fund’s financial position. ASU 2011-11 requires entities to disclose both gross and net information about both instruments and transactions eligible for offset in the statement of assets and liabilities; and disclose instruments and transactions subject to an agreement similar to a master netting agreement. In addition, in January 2013, FASB issued Accounting Standards Update No. 2013-01 “Clarifying the Scope of Disclosures about Offsetting Assets and Liabilities” (“ASU 2013-01”), specifying exactly which transactions are subject to disclosures about offsetting. ASU 2011-11 and ASU 2013-01 are effective for public entities for interim and annual periods beginning on or after January 1, 2013. Management is currently evaluating the impact the adoption of ASU 2011-11 and ASU 2013-01 will have on the Fund’s financial statement disclosures.
32
Report of Independent Registered Public Accounting Firm
To the Board of Directors of Lord Abbett Research Fund, Inc. and the Shareholders of Small-Cap Value Series:
We have audited the accompanying statement of assets and liabilities, including the schedule of investments, of the Small-Cap Value Series, one of the three funds constituting the Lord Abbett Research Fund, Inc. (the “Company”) as of November 30, 2013, and the related statements of operations for the year then ended, the statements of changes in net assets for each of the two years in the period then ended, and the financial highlights for each of the five years in the period then ended. These financial statements and financial highlights are the responsibility of the Company’s management. Our responsibility is to express an opinion on these financial statements and financial highlights based on our audits.
We conducted our audits in accordance with the standards of the Public Company Accounting Oversight Board (United States). Those standards require that we plan and perform the audit to obtain reasonable assurance about whether the financial statements and financial highlights are free of material misstatement. The Company is not required to have, nor were we engaged to perform, an audit of its internal control over financial reporting. Our audits included consideration of internal control over financial reporting as a basis for designing audit procedures that are appropriate in the circumstances, but not for the purpose of expressing an opinion on the effectiveness of the Company’s internal control over financial reporting. Accordingly, we express no such opinion. An audit also includes examining, on a test basis, evidence supporting the amounts and disclosures in the financial statements, assessing the accounting principles used and significant estimates made by management, as well as evaluating the overall financial statement presentation. Our procedures included confirmation of securities owned as of November 30, 2013, by correspondence with the custodian and brokers; where replies were not received from brokers, we performed other auditing procedures. We believe that our audits provide a reasonable basis for our opinion.
In our opinion, such financial statements and financial highlights referred to above present fairly, in all material respects, the financial position of Small-Cap Value Series of the Lord Abbett Research Fund, Inc. as of November 30, 2013, the results of its operations for the year then ended, the changes in its net assets for each of the two years in the period then ended, and the financial highlights for each of the five years in the period then ended, in conformity with accounting principles generally accepted in the United States of America.
DELOITTE & TOUCHE LLP
New York, New York
January 29, 2014
33
Basic Information About Management
The Board is responsible for the management of the business and affairs of the Company in accordance with the laws of the State of Maryland. The Board elects officers who are responsible for the day-to-day operations of the Fund and who execute policies authorized by the Board. The Board also approves an investment adviser to the Fund and continues to monitor the cost and quality of the services the investment adviser provides, and annually considers whether to renew the contract with the adviser. Generally, each Director holds office until his/her successor is elected and qualified or until his/her earlier resignation or removal, as provided in the Company’s organizational documents.
Lord Abbett, a Delaware limited liability company, is the Company’s investment adviser. Designated Lord Abbett personnel are responsible for the day-to-day management of the Fund.
Interested Directors
Ms. Foster is affiliated with Lord Abbett and is an “interested person” of the Company as defined in the Act. Ms. Foster is a director/trustee and officer of each of the 12 Lord Abbett-sponsored funds, which consist of 55 portfolios or series.
Name, Address and
Year of Birth | | Current Position and
Length of Service
with the Company | | Principal Occupation and Other Directorships
During the Past Five Years |
| | | | | |
Daria L. Foster
Lord, Abbett & Co. LLC
90 Hudson Street
Jersey City, NJ 07302
(1954) | | Director and President
since 2006; Chief
Executive Officer
since 2012 | | Principal Occupation: Managing Partner of Lord Abbett (since 2007), and was formerly Director of Marketing and Client Service, joined Lord Abbett in 1990.
Other Directorships: None. |
Independent Directors
The following Independent Directors also are directors/trustees of each of the 12 Lord Abbett-sponsored funds, which consist of 55 portfolios or series.
Name, Address and
Year of Birth | | Current Position and
Length of Service
with the Company | | Principal Occupation and Other Directorships
During the Past Five Years |
| | | | | |
E. Thayer Bigelow
Lord, Abbett & Co. LLC
c/o Legal Dept.
90 Hudson Street
Jersey City, NJ 07302
(1941) | | Director since 1996;
Chairman since 2013 | | Principal Occupation: Managing General Partner, Bigelow Media, LLC (since 2000); Senior Adviser, Time Warner Inc. (1998 – 2000).
Other Directorships: Currently serves as director of Crane Co. (since 1984) and Huttig Building Products Inc. (since 1998). Previously served as a director of R.H. Donnelley Inc. (2009 – 2010). |
| | | | | |
Robert B. Calhoun, Jr.
Lord, Abbett & Co. LLC
c/o Legal Dept.
90 Hudson Street
Jersey City, NJ 07302
(1942) | | Director since 1998 | | Principal Occupation: Senior Advisor of Monitor Clipper Partners, a private equity investment fund (since 1997); President of Clipper Asset Management Corp. (1991 – 2009).
Other Directorships: Previously served as a director of Interstate Bakeries Corp. (1991 – 2008). |
34
Basic Information About Management (continued)
Name, Address and
Year of Birth | | Current Position and
Length of Service
with the Company | | Principal Occupation and Other Directorships
During the Past Five Years |
| | | | | |
Evelyn E. Guernsey
Lord, Abbett & Co. LLC
c/o Legal Dept.
90 Hudson Street
Jersey City, NJ 07302
(1955) | | Director since 2011 | | Principal Occupation: CEO, Americas of J.P. Morgan Asset Management (2004 – 2010).
Other Directorships: None. |
| | | | | |
Julie A. Hill
Lord, Abbett & Co. LLC
c/o Legal Dept.
90 Hudson Street
Jersey City, NJ 07302
(1946) | | Director since 2004 | | Principal Occupation: Owner and CEO of The Hill Company, a business consulting firm (since 1998).
Other Directorships: Currently serves as director of WellPoint, Inc., a health benefits company (since 1994). Previously served as a director of Lend Lease Corporation Limited, an international retail and residential property group (2006 – 2012). |
Franklin W. Hobbs
Lord, Abbett & Co. LLC
c/o Legal Dept.
90 Hudson Street
Jersey City, NJ 07302
(1947) | | Director since 2001 | | Principal Occupation: Advisor of One Equity Partners, a private equity firm (since 2004).
Other Directorships: Currently serves as director and Chairman of the Board of Ally Financial Inc., a financial services firm (since 2009), and as director of Molson Coors Brewing Company (since 2002). |
James M. McTaggart
Lord, Abbett & Co. LLC
c/o Legal Dept.
90 Hudson Street
Jersey City, NJ 07302
(1947) | | Director since 2012 | | Principal Occupation: Independent management advisor and consultant (since 2012); Vice President, CRA International, Inc. (doing business as Charles River Associates), a global management consulting firm (2009 – 2012); Founder and Chairman of Marakon Associates, Inc., a strategy consulting firm (1978 – 2009); and Officer and Director of Trinsum Group, a holding company (2007 – 2009). |
| | | | | |
| | | | | Other Directorships: Currently serves as director of Blyth, Inc., a home products company (since 2004). |
| | | | | |
James L.L. Tullis
Lord, Abbett & Co. LLC
c/o Legal Dept.
90 Hudson Street
Jersey City, NJ 07302
(1947) | | Director since 2006 | | Principal Occupation: CEO of Tullis-Dickerson and Co. Inc., a venture capital management firm (since 1990); CEO of Tullis Health Investors Inc. (since 2012).
Other Directorships: Currently serves as director of Crane Co. (since 1998). Previously served as a director of Synageva BioPharma Corp., a biopharmaceutical company (2009 – 2011). |
35
Basic Information About Management (continued)
Officers
None of the officers listed below have received compensation from the Company. All of the officers of the Company also may be officers of the other Lord Abbett-sponsored funds and maintain offices at 90 Hudson Street, Jersey City, NJ 07302. Unless otherwise indicated, the position(s) and title(s) listed under the “Principal Occupation During the Past Five Years” column indicate each officer’s position(s) and title(s) with Lord Abbett.
Name and
Year of Birth | | Current Position with
the Company | | Length of
Service of
Current Position | | Principal Occupation
During the Past
Five Years |
| | | | | | | |
Daria L. Foster
(1954) | | President and Chief
Executive Officer | | Elected as President in 2006 and Chief Executive Officer in 2012 | | Managing Partner of Lord Abbett (since 2007), and was formerly Director of Marketing and Client Service, joined Lord Abbett in 1990. |
| | | | | | | |
Robert I. Gerber
(1954) | | Executive Vice President | | Elected in 2007 | | Partner and Chief Investment Officer (since 2007), joined Lord Abbett in 1997 as Director of Taxable Fixed Income Management. |
| | | | | | | |
Thomas B. Maher
(1967) | | Executive Vice President | | Elected in 2013 | | Partner and Portfolio Manager, joined Lord Abbett in 2003. |
| | | | | | | |
Justin C. Maurer
(1969) | | Executive Vice President | | Elected in 2013 | | Partner and Portfolio Manager, joined Lord Abbett in 2001. |
| | | | | | | |
Walter H. Prahl
(1958) | | Executive Vice President | | Elected in 2012 | | Partner and Director, joined Lord Abbett in 1997. |
| | | | | | | |
Frederick J. Ruvkun
(1957) | | Executive Vice President | | Elected in 2012 | | Partner and Director, joined Lord Abbett in 2006. |
| | | | | | | |
Paul J. Volovich
(1973) | | Executive Vice President | | Elected in 2004 | | Partner and Director, joined Lord Abbett in 1997. |
| | | | | | | |
Joan A. Binstock
(1954) | | Chief Financial Officer and Vice President | | Elected in 1999 | | Partner and Chief Financial and Operations Officer, joined Lord Abbett in 1999. |
| | | | | | | |
John K. Forst
(1960) | | Vice President and Assistant Secretary | | Elected in 2005 | | Partner and Deputy Counsel, joined Lord Abbett in 2004. |
| | | | | | | |
Lawrence H. Kaplan
(1957) | | Chief Compliance Officer, Vice President and Secretary | | Elected as Vice President and Secretary in 1997 and Chief Compliance Officer in 2013 | | Partner, General Counsel, and Chief Compliance Officer, joined Lord Abbett in 1997. |
36
Basic Information About Management (concluded)
Name and
Year of Birth | | Current Position with
the Company | | Length of
Service of
Current Position | | Principal Occupation
During the Past
Five Years |
| | | | | | | |
David J. Linsen
(1974) | | Vice President | | Elected in 2008 | | Partner and Director, joined Lord Abbett in 2001. |
| | | | | | | |
A. Edward Oberhaus, III
(1959) | | Vice President | | Elected in 1996 | | Partner and Director, joined Lord Abbett in 1983. |
| | | | | | | |
Thomas R. Phillips
(1960) | | Vice President and Assistant Secretary | | Elected in 2008 | | Partner and Deputy General Counsel, joined Lord Abbett in 2006. |
| | | | | | | |
Lawrence B. Stoller
(1963) | | Vice President and Assistant Secretary | | Elected in 2007 | | Partner and Senior Deputy General Counsel, joined Lord Abbett in 2007. |
| | | | | | | |
Scott S. Wallner
(1955) | | AML Compliance Officer | | Elected in 2011 | | Assistant General Counsel, joined Lord Abbett in 2004. |
| | | | | | | |
Bernard J. Grzelak
(1971) | | Treasurer | | Elected in 2003 | | Partner and Director of Fund Administration, joined Lord Abbett in 2003. |
Please call 888-522-2388 for a copy of the statement of additional information, which contains further information about the Company’s Directors. It is available free upon request.
37
Householding
The Company has adopted a policy that allows it to send only one copy of the Fund’s prospectus, proxy material, annual report and semiannual report to certain shareholders residing at the same “household.” This reduces Fund expenses, which benefits you and other shareholders. If you need additional copies or do not want your mailings to be “householded,” please call Lord Abbett at 888-522-2388 or send a written request with your name, the name of your fund or funds and your account number or numbers to Lord Abbett Family of Funds, P.O. Box 219336, Kansas City, MO 64121.
Proxy Voting Policies, Procedures and Records
A description of the policies and procedures that Lord Abbett uses to vote proxies related to the Fund’s portfolio securities, and information on how Lord Abbett voted the Fund’s proxies during the 12-month period ended June 30 are available without charge, upon request, (i) by calling 888-522-2388; (ii) on Lord Abbett’s Website at www.lordabbett.com; and (iii) on the Securities and Exchange Commission’s (“SEC”) Website at www.sec.gov.
Shareholder Reports and Quarterly Portfolio Disclosure
The Fund is required to file its complete schedule of portfolio holdings with the SEC for its first and third fiscal quarters on Form N-Q. Copies of the filings are available without charge, upon request on the SEC’s Website at www.sec.gov and may be available by calling Lord Abbett at 888-522-2388. You can also obtain copies of Form N-Q by visiting the SEC’s Public Reference Room in Washington, DC (information on the operation of the Public Reference Room may be obtained by calling 800-SEC-0330).
Tax Information
100% of the ordinary income distributions paid by the Fund during the fiscal year ended November 30, 2013 is qualified dividend income. For corporate shareholders, 100% of the Fund’s ordinary income distributions qualified for the dividends received deduction.
In addition, of the distributions paid to shareholders during the fiscal year ended November 30, 2013, $74,963,243 represents long-term capital gains.
38


This report, when not used for the general information of shareholders of the Fund, is to be distributed only if preceded or accompanied by a current fund prospectus.
Lord Abbett mutual fund shares are distributed by | | Lord Abbett Research Fund, Inc. | | LARF-2-1113 |
| LORD ABBETT DISTRIBUTOR LLC. | | Small-Cap Value Series | | (01/14) |
| | (a) | In accordance with applicable requirements, the Registrant adopted a Sarbanes-Oxley Code of Ethics on June 19, 2003 that applies to the principal executive officer and senior financial officers of the Registrant (“Code of Ethics”). The Code of Ethics was in effect during the fiscal year ended November 30, 2013 (the “Period”). |
| | | |
| | (b) | Not applicable. |
| | | |
| | (c) | The Registrant has not amended the Code of Ethics as described in Form N-CSR during the Period. |
| | | |
| | (d) | The Registrant has not granted any waiver, including an implicit waiver, from a provision of the Code of Ethics as described in Form N-CSR during the Period. |
| | | |
| | (e) | Not applicable. |
| | | |
| | (f) | See Item 12(a)(1) concerning the filing of the Code of Ethics. |
| Item 3: | Audit Committee Financial Expert. |
| | | The Registrant’s board of directors has determined that each of the following independent directors who are members of the audit committee is an audit committee financial expert: E. Thayer Bigelow and Robert B. Calhoun, Jr. Each of these persons is independent within the meaning of the Form N-CSR. |
| Item 4: | Principal Accountant Fees and Services. |
| | Item 4: | Principal Accountant Fees and Services. |
In response to sections (a), (b), (c) and (d) of Item 4, the aggregate fees billed to the Registrant for the fiscal years ended November 30, 2013 and 2012 by the Registrant’s principal accounting firm, Deloitte & Touche LLP, the member firms of Deloitte Touche Tohmatsu and their respective affiliates (collectively, “Deloitte”) were as follows:
| | | Fiscal year ended: | |
| | | 2013 | | | 2012 | |
| Audit Fees {a} | | $ | 127,000 | | | $ | 163,000 | |
| Audit-Related Fees | | | - 0 - | | | | - 0 - | |
| Total audit and audit-related fees | | | 127,000 | | | | 163,000 | |
| | | | | | | | | |
| Tax Fees {b} | | | 31,723 | | | | 31,031 | |
| All Other Fees | | | - 0 - | | | | - 0 - | |
| | | | | | | | | |
| Total Fees | | $ | 158,723 | | | $ | 194,031 | |
{a} Consists of fees for audits of the Registrant’s annual financial statements.
{b} Fees for the fiscal year ended November 30, 2013 and 2012 consist of fees for preparing the U.S. Income Tax Return for Regulated Investment Companies, New Jersey Corporation Business Tax Return, New Jersey Annual Report Form, U.S. Return of Excise Tax on Undistributed Income of Investment Companies, IRS Forms 1099-MISC and 1096 Annual Summary and Transmittal of U.S. Information Returns.
(e) (1) Pursuant to Rule 2-01(c) (7) of Regulation S-X, the Registrant’s Audit Committee has adopted pre-approval policies and procedures. Such policies and procedures generally provide that the Audit Committee must pre-approve:
| | · | any audit, audit-related, tax, and other services to be provided to the Lord Abbett Funds, including the Registrant, and |
| | · | any audit-related, tax, and other services to be provided to the Registrant’s investment adviser and any entity controlling, controlled by or under common control with the investment adviser that provides ongoing services to one or more Funds comprising the Registrant if the engagement relates directly to operations and financial reporting of a Fund, by the independent auditor to assure that the provision of such services does not impair the auditor’s independence. |
The Audit Committee has delegated pre-approval authority to its Chairman, subject to a fee limit of $10,000 per event, and not to exceed $25,000 annually. The Chairman will report any pre-approval decisions to the Audit Committee at its next scheduled meeting. Unless a type of service to be provided by the independent auditor has received general pre-approval, it must be pre-approved by the Audit Committee. Any proposed services exceeding pre-approved cost levels will require specific pre-approval by the Audit Committee.
(e) (2) The Registrant’s Audit Committee has approved 100% of the services described in this Item 4 (b) through (d).
(f) Not applicable.
(g) The aggregate non-audit fees billed by Deloitte for services rendered to the Registrant are shown above in the response to Item 4 (a), (b), (c) and (d) as “All Other Fees”.
The aggregate non-audit fees billed by Deloitte for services rendered to the Registrant’s investment adviser, Lord, Abbett & Co. LLC (“Lord Abbett”), for the fiscal years ended November 30, 2013 and 2012 were:
| | Fiscal year ended: |
| | 2013 | 2012 |
| All Other Fees {a} | $180,602 | $178,975 |
{a} Consist of fees for Independent Services Auditors’ Report on Controls Placed in Operation and Tests of Operating Effectiveness related to Lord Abbett’s Asset Management Services (“SOC-1 Report”).
The aggregate non-audit fees billed by Deloitte for services rendered to entities under the common control of Lord Abbett for the fiscal years ended November 30, 2013 and 2012 were:
| | Fiscal year ended: |
| | 2013 | 2012 |
| All Other Fees | $ - 0 - | $ - 0 - |
(h) The Registrant’s Audit Committee has considered the provision of non-audit services that were rendered to the Registrant’s investment adviser, and any entity controlling, controlled by or under common control with the investment adviser that provides ongoing services to the Registrant, that were not pre-approved pursuant to Rule 2-01 (c)(7)(ii) of Regulation S-X and has determined that the provision of such services is compatible with maintaining Deloitte’s independence.
| Item 5: | Audit Committee of Listed Registrants. |
| | |
| | Not applicable. |
| | |
| Item 6: | Investments. |
| | |
| | Not applicable. |
| | |
| Item 7: | Disclosure of Proxy Voting Policies and Procedures for Closed-End Management Investment Companies. |
| | |
| | Not applicable. |
| | |
| Item 8: | Portfolio Managers of Closed-End Management Investment Companies. |
| | |
| | Not applicable. |
| | |
| Item 9: | Purchases of Equity Securities by Closed-End Management Investment Company and Affiliated Purchasers. |
| | |
| | Not applicable. |
| | |
| Item 10: | Submission of Matters to a Vote of Security Holders. |
| | |
| | Not applicable. |
| | |
| Item 11: | Controls and Procedures. |
| | (a) | Based on their evaluation of the Registrant’s disclosure controls and procedures (as defined in Rule 30a-3(c) under the Investment Company Act of 1940) as of a date within 90 days prior to the filing date of this report, the Chief Executive Officer and Chief Financial Officer of the Registrant have concluded that such disclosure controls and procedures are reasonably designed and effective to ensure that material information relating to the Registrant, including its consolidated subsidiaries, is made known to them by others within those entities. |
| | | |
| | (b) | There were no changes in the Registrant’s internal control over financial reporting (as defined in Rule 30a-3(d) under the Investment Company Act of 1940) that occurred during the second fiscal quarter of the period covered by this report that have materially affected, or are reasonably likely to materially affect, the Registrant’s internal control over financial reporting. |
| | (a)(1) | The Lord Abbett Family of Funds Sarbanes Oxley Code of Ethics for the Principal Executive Officer and Senior Financial Officers is attached hereto as part of Ex-99. CODEETH. |
| | | |
| | (a)(2) | Certification of each Principal Executive Officer and Principal Financial Officer of the Registrant as required by Rule 30a-2 under the Investment Company Act of 1940 is attached hereto as a part of EX-99.CERT. |
| | | |
| | (b) | Certification of each Principal Executive Officer and Principal Financial Officer of the Registrant as required by Section 906 of the Sarbanes-Oxley Act of 2002 is provided as a part of EX-99.906CERT. |
SIGNATURES
Pursuant to the requirements of the Securities Exchange Act of 1934 and the Investment Company Act of 1940, the Registrant has duly caused this report to be signed on its behalf by the undersigned, thereunto duly authorized.
| | | LORD ABBETT RESEARCH FUND, INC. |
| | | | |
| | By: | /s/ Daria L. Foster | |
| | | Daria L. Foster |
| | | President and Chief Executive Officer |
| | | | |
| Date: January 27, 2014 | | | |
| | | | |
| | By: | /s/ Joan A. Binstock | |
| | | Joan A. Binstock |
| | | Chief Financial Officer and Vice President |
| | | | |
| Date: January 27, 2014 | | | |
Pursuant to the requirements of the Securities Exchange Act of 1934 and the Investment Company Act of 1940, this report has been signed below by the following persons on behalf of the Registrant and in the capacities and on the dates indicated.
| | By: | /s/ Daria L. Foster | |
| | | Daria L. Foster |
| | | President and Chief Executive Officer |
| | | | |
| Date: January 27, 2014 | | | |
| | | | |
| | By: | /s/ Joan A. Binstock | |
| | | Joan A. Binstock |
| | | Chief Financial Officer and Vice President |
| | | | |
| Date: January 27, 2014 | | | |