UNITED STATES
SECURITIES AND EXCHANGE COMMISSION
Washington, D.C. 20549
FORM N-CSR
CERTIFIED SHAREHOLDER REPORT OF REGISTERED MANAGEMENT INVESTMENT COMPANIES
Investment Company Act file number 811-6653
The Jensen Portfolio, Inc.
(Exact name of registrant as specified in charter)
2130 Pacwest Center, 1211 SW Fifth Avenue
Portland, OR 97204-3721
(Address of principal executive offices) (Zip code)
Gary Hibler
2130 Pacwest Center, 1211 SW Fifth Avenue
Portland, OR 97204-3721
(Name and address of agent for service)
(800) 221-4384
Registrant's telephone number, including area code
Date of fiscal year end: May 31, 2005
Date of reporting period: May 31, 2005
Item 1. Report to Stockholders.
the Jensen Portfolio
Annual Report, May 31, 2005

the Jensen Portfolio
Letter from The Investment Adviser
DEAR FELLOW SHAREHOLDERS:
Where Have The Returns Gone?
Federal Reserve Chairman Alan Greenspan dusted off the word “conundrum” to express his frustration that eight, and now nine, increases in the Fed Fund’s rate resulted in actually reducing long-term rates. The laws of economics (a discipline that thrives on conundrums) dictate that a hike in short-term rates will always translate into higher interest costs for ten- to thirty-year money. One needs only to look back to 1994 to witness the rule working precisely as it should.
In testimony before Congress, Mr. Greenspan attributed the failure of long-term rates to respond to a number of issues, all of which he immediately discounted:
- The economy is weaker than the Fed officials believe it is;
- Foreign banks have kept rates low by buying Treasuries;
- The fall in inflation; and
- Buying of long-term bonds by pension plans with the advent of baby boomers retiring.
With the benefit of hindsight, the path to this dilemma seems clear. In order to avert what might have become a severe recession when the dot-com bubble burst, the Fed sharply reduced the Fed Fund’s target rate to one percent and then held it there through early 2004. Lawrence Lindsey, a former Fed governor, was quoted by the Wall Street Journal praising the Fed’s actions in responding to the dot-com bubble, “This is the first time in history the textbook economic policy . . . was used and worked. The problem is, once you have finished that chapter of economic texts, you turn the page and the page is blank—because no one has gone through this process before.”
The low post-bubble rates encouraged both individuals and institutions to borrow more and provided nominal rewards for saving. The consequence of money chasing assets is an increase in prices, which is particularly noticeable today in housing. Thus, with deflation seeming unlikely and its counterpart, inflation, seeming more likely, the Federal Reserve began increasing the Fed Fund’s target rate at a “measured pace” of 1/4of one percent in June 2004.
The numbers tell the story of the conundrum more vividly. Since June, 2004, the Fed Fund’s rate has risen from one percent to three percent. Instead of rising, the ten-year Treasury currently yields 3.9 percent—a significant drop from its yield of 5.4 percent a year ago. Since many economists expect the Fed to halt their measured increases at 3.75 percent sometime this fall, our economy may experience one of Wall Street’s infamous oxymorons, a flat yield curve in which long-term and short-term rates are the same.
Mr. Lindsey’s “blank page” would show today that the economy at large is spiting the Fed by encouraging long term borrowing to chase assets. The media are reporting the page’s initial entries: a potential housing bubble, minimal personal savings rates, and a gargantuan trade deficit.
The point of this recounting is not to suggest that the causes or diagnoses of the “conundrum” are correct. Indeed, in our mind there is a high probability that the root source has yet to make the front pages. What is clear, there is uncertainty—“no one has gone through this process before”—and proper equity returns tend to dissolve in the face of doubt.
Of course, this is not the first uncertainty the market has experienced, and we can turn to other observers for counsel. Graham and Dodd thought that euphoria and despair were as much a part of the market as objective analysis. However, they did not believe that investing in common stocks was inherently a wholly speculative undertaking. “Common stocks are an appropriate vehicle for an investment program, because for a patient investor the stock market is efficient over the longer term. There is an inherent tendency for these [shorter term] disparities to correct themselves. In the meantime the investor could be entirely satisfied by the earnings, dividends, and balance sheet position, even if the market quotation remains disappointingly low . . . ” As reported below, we are pleased to report the business performances of the companies in The Jensen Portfolio are meeting our expectations by generating cash earnings that are either used to increase the intrinsic value of the company or to return to shareholders in the form of dividends and share repurchases.
Performance And Changes In Portfolio Holdings
The Jensen Portfolio—Class J Shares returned 0.61% for the year ended May 31, 2005, compared with an 8.23% return for this period for the Standard & Poor’s 500 Index. Please see page 4 of this report for complete standardized performance information for the Fund.
Market performance for this period was led by outsized returns from the energy and utilities sectors, which grew by 38.6% and 32.5%, respectively, for the year ended May 31, 2005. The Jensen Portfolio was notably absent from these market segments as companies within these sectors have not typically been able to produce the consistently strong business performance that our uncompromising investment discipline demands.
1
the Jensen Portfolio
Our Top Market Performers
Key contributors to the market performance of The Jensen Portfolio for the year ended May 31, 2005, included Equifax (which represented 4.75% of assets and saw a return of more than 42.1%), Johnson & Johnson (which represented 4.25% of assets and saw a return of more than 22.7%) and General Electric (4.87% of assets; return of nearly 20.1%).
Equifax, Johnson & Johnson, and General Electric are all excellent examples of businesses that meet our strict criteria for inclusion in The Jensen Portfolio. These companies continued to perform at high levels despite ongoing economic volatility, delivering persistent shareholder value while constantly identifying and addressing expected opportunities and challenges to come. They are using their free cash flow to grow and strengthen their business franchises either organically or through acquisition while buying back their shares and paying dividends. When we look at the transformation of General Electric under Jeff Immelt’s leadership over the last few quarters, we see a terrific example of a company responding to challenges and focusing on the long term. Consider the significant acquisitions of Amersham and Universal and the divestiture of Genworth Financial through an initial public offering as well as planned share repurchases of $15 billion and a dividend that increases about 10% a year. We think it is clear why we favor General Electric’s long-term prospects.
Similar patterns are playing out with many of the companies in which we invest, giving us comfort that our patience will be rewarded despite the turmoil that typically accompanies focus on short-term performance.
Our Biggest Market Disappointments
Paychex (which represented 2.72% of assets and declined 21.7% over the period) and Pfizer (4.08% of assets; decline of nearly 19.0%) were two of the largest detractors from the performance of The Jensen Portfolio for the year ended May 31, 2005. Our largest detractor was Merck, which is discussed in further detail later in this letter.
Paychex has suffered as many investors have focused on concerns over interest rates and economic growth. At the same time, Paychex has continued to focus on its business and has just completed its 15ththconsecutive year of record revenues, net income, and earnings per share—a record we believe will continue for some time. The company has a business model that is working very well and has completed a smooth transition of leadership to a new chief executive officer. Improving interest rates provide Paychex with additional free cash flow from the substantial float the company maintains, providing further investment opportunities for future growth.
Pfizer represents another transitioning company as it tackles patent expirations for key drugs in its portfolio over the next two years. The company is busy rebuilding its pipeline for long-term growth and we are comforted further as Pfizer is also repatriating more than $36 billion in foreign earnings for additional investments in research and development and growth opportunities while at the same time streamlining its organization and striving to reduce their cost base by 12% over the next few years. This focus on the long-term needs of the company is supplemented by continuing strong share repurchases and dividend increases.
Changes in The Jensen Portfolio
Over the course of the last fiscal year there were changes in the makeup of The Jensen Portfolio. We eliminated Merck, State Street, and Fannie Mae while adding Anheuser-Busch, Sysco, and First Data.
We sold Merck after the company pulled one of its largest selling drugs used to ease debilitating arthritis pain, know as Vioxx, from the marketplace because of safety concerns. Our decision to sell was based on evidence of the stress that exists on Merck’s pipeline portending lower growth rates and the prospect for potential and protracted litigation that is expected from users of Vioxx.
We also sold State Street. Although State Street remains a strong company, the impact of the ongoing difficult interest rate environment combined with the substantial capital issued as part of the Deutsche Bank acquisition in 2003 caused the company to fall short of the minimum requirement of a 15% return on equity for fiscal 2004. Because return on equity is an essential element of our disciplined investing strategy, we were required to sell State Street and look for another opportunity.
Last, we sold Fannie Mae. Fannie Mae has been working closely with the SEC and its regulator through a number of accounting and regulatory issues over the last nine months. Although it remains to be seen what, if any, changes will be made to Fannie Mae’s operations, it remains true that the company has competitive advantages in its marketplace and generates substantial cash flow that for the immediate future will be used to improve its capital position.
However, there continue to be accounting revelations that cause us additional concern, and it appears that Congress is much closer than ever to placing real constraints on Fannie Mae’s business that could inhibit the company’s growth for some time. Combining these issues with the ongoing lack of available financial information made it necessary to look for a better opportunity.
We added Anheuser-Busch, given its well known brands and a long history of strong business performance. Its traditional growth engine has been its dominant market share in the domestic beer market, but it is also entering into leading positions internationally. It expects to be able to grow its international business significantly over the next few years, particularly in China.
2
the Jensen Portfolio
Letter from The Investment Adviser (continued)
We also added Sysco, the dominant food-service distributor with $30 billion in sales, controlling a 15% market share. There is tremendous opportunity for Sysco to increase its industry dominance in a highly fragmented industry, given its size and scale. Sysco has consistently raised its net margin every year in a low-margin business, while also consistently increasing its revenues and free cash flows.
Finally, we added First Data. First Data provides money transfer services to millions of consumers primarily through its flagship Western Union subsidiary, processes literally billions of payment transactions in its merchant processing business, and provides card-issuing services to hundreds of card issuers. First Data is the market leader in its two key business areas with 75% share in money transfers and more than 50% share in merchant processing.
All three of these companies produce sufficient cash flow for funding their organic growth while also making strategic acquisitions, buying back significant amounts of shares, and paying ever-growing dividends.
We are optimistic about the overall quality and strength of the businesses in which we invest. We continue to believe these companies, with the characteristics of market leadership, deep competitive advantages, growing free cash flow, and strong management teams, represent the types of companies that have the strength to achieve high levels of business performance regardless of external factors. For the patient investor, among which we include ourselves, it is our view that this consistency will be rewarded with attractive long-term market returns with less risk than the overall securities market. We strive each day to serve our clients with honesty and integrity, and we welcome the opportunity to communicate openly and candidly with our clients, their consultants, and advisors.
We appreciate your continued support.
Cordially,
/s/ Val Jensen
Val Jensen, Chairman
The Jensen Portfolio and
The Jensen Investment Committee
This discussion and analysis of the Fund is as of May 2005 and is subject to change, and any forecasts made cannot be guaranteed.
Past performance is no guarantee of future results. Fund holdings and sector weightings are subject to change and are not recommendations to buy or sell any security. For more complete information regarding performance and holdings, please refer to the financial statements and schedule of investments headings of this report.
The Fund is nondiversified, meaning that it concentrates its assets in fewer individual holdings than a diversified fund and is therefore more exposed to individual stock volatility than a diversified fund.
For use only when preceded or accompanied by a current prospectus for the Fund.
The Jensen Portfolio is distributed by Quasar Distributors, LLC (07/05).
3
the Jensen Portfolio
the Jensen Portfolio - Class J
TOTAL RETURNS VS. THE S&P 500
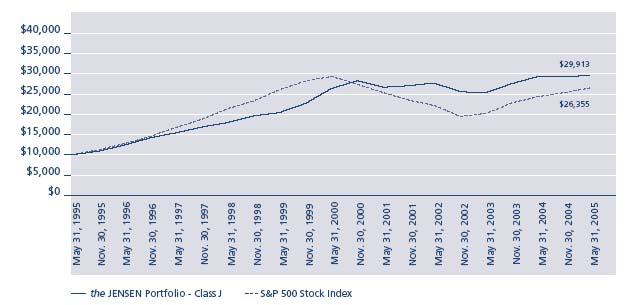
| Average Annual - FOR PERIODS ENDED MAY 31, 2005 | ||||
| 1 YEAR | 3 YEARS | 5 YEARS | 1O YEARS | |
the Jensen Portfolio - Class J | 0.61% | 2.50% | 2.42% | 11.58% |
| S&P 500 Stock Index | 8.23% | 5.59% | -1.92% | 10.17% |
The S&P 500 Stock Index is an unmanaged but commonly used measure of common stock total return performance. This chart assumes an initial gross investment of $10,000 made on 5/31/95 for Class J, the original share class of the fund. Returns shown include the reinvestment of all dividends. Returns shown do not reflect the deduction of taxes that a shareholder would pay on fund distributions or the redemption of fund shares.
Performance data shown represents past performance; Past performance does not guarantee future results. The investment return and principal value of an investment will fluctuate so that an investor’s shares, when redeemed, may be worth more or less than their original cost. Current performance of the fund may be lower or higher than the performance shown. Performance data current to the most recent month end may be obtained by calling 1-800-992-4144 or by visiting www.jenseninvestment.com.
4
the Jensen Portfolio
the Jensen Portfolio - Class R
TOTAL RETURNS VS. THE S&P 500
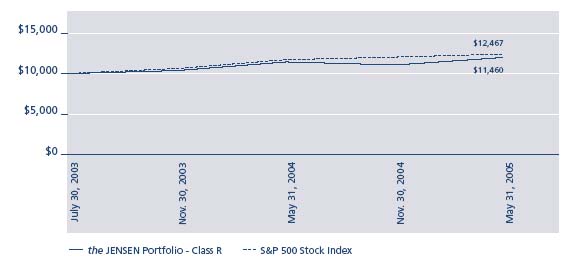
| Average Annual - FOR PERIODS ENDED MAY 31, 2005 | ||
| 1 YEA | SINCE INCEPTION JULY 30, 2003 | |
the Jensen Portfolio - Class R | 0.40% | 7.69% |
| S&P 500 Stock Index | 8.23% | 12.72% |
The S&P 500 Stock Index is an unmanaged but commonly used measure of common stock total return performance. This chart assumes an initial gross investment of $10,000 made on 7/30/03, the inception date for Class R shares. Returns shown include the reinvestment of all dividends. Returns shown do not reflect the deduction of taxes that a shareholder would pay on fund distributions or the redemption of fund shares.
Performance data shown represents past performance; Past performance does not guarantee future results. The investment return and principal value of an investment will fluctuate so that an investor’s shares, when redeemed, may be worth more or less than their original cost. Current performance of the fund may be lower or higher than the performance shown. Performance data current to the most recent month end may be obtained by calling 1-800-992-4144 or by visiting www.jenseninvestment.com.
5
the Jensen Portfolio
the Jensen Portfolio - Class I
TOTAL RETURNS VS. THE S&P 500
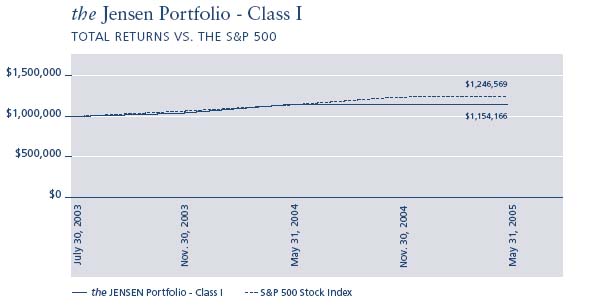
| Average Annual - FOR PERIODS ENDED MAY 31, 2005 | ||
| 1 YEAR | SINCE INCEPTION JULY 30, 2003 | |
the Jensen Portfolio - Class I | 0.77% | 8.11% |
| S&P 500 Stock Index | 8.23% | 12.72% |
The S&P 500 Stock Index is an unmanaged but commonly used measure of common stock total return performance. This chart assumes an initial gross investment of $1,000,000 made on 7/30/03, the inception date for Class I shares. Returns shown include the reinvestment of all dividends. Returns shown do not reflect the deduction of taxes that a shareholder would pay on fund distributions or the redemption of fund shares.
Performance data shown represents past performance; Past performance does not guarantee future results. The investment return and principal value of an investment will fluctuate so that an investor’s shares, when redeemed, may be worth more or less than their original cost. Current performance of the fund may be lower or higher than the performance shown. Performance data current to the most recent month end may be obtained by calling 1-800-992-4144 or by visiting www.jenseninvestment.com.
6
the Jensen Portfolio
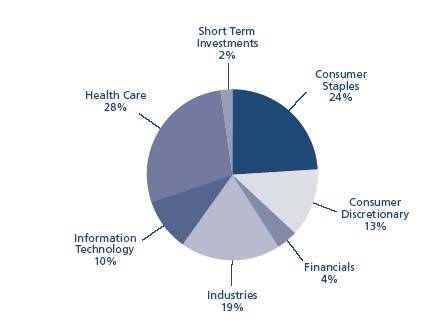
Investments by Sector as of May 31, 2005
(as a Percentage of Total Investments)
7
the Jensen Portfolio
Statement of Assets & Liabilities
May 31, 2005
Assets: | ||
| Investments, at value (cost $2,678,025,242) | $ | 2,987,158,402 |
| Income receivable | 4,151,085 | |
| Receivable for capital stock issued | 8,308,798 | |
| Other assets | 107,410 | |
| Total Assets | 2,999,725,695 | |
Liabilities: | ||
| Payable to Investment Adviser | 1,494,599 | |
| Payable to Directors | 28,770 | |
| Payable for capital stock redeemed | 3,981,123 | |
| Other accrued expenses | 1,740,322 | |
| Total Liabilities | 7,244,814 | |
| NET ASSETS | $ | 2,992,480,881 |
| NET ASSETS CONSIST OF: | ||
| Capital stock | $ | 2,747,250,225 |
| Unrealized appreciation on investments | 309,133,160 | |
| Accumulated undistributed net investment income | 3,134,672 | |
| Accumulated undistributed net realized loss | (67,037,176) | |
| Total Net Assets | $ | 2,992,480,881 |
| NET ASSETS CONSIST OF: | ||
| Class J Shares: | ||
| Net assets | $ | 2,680,168,794 |
| Shares outstanding | 112,672,810 | |
| Net Asset Value Per Share | ||
| (2,000,000,000 shares authorized, $.001 par value) | $ | 23.79 |
| Class R Shares: | ||
| Net assets | $ | 23,884,378 |
| Shares outstanding | 1,007,462 | |
| Net Asset Value Per Share | ||
| (1,000,000,000 shares authorized, $.001 par value) | $23.71 | |
| Class I Shares: | ||
| Net assets | $ | 288,427,709 |
| Shares outstanding | 12,121,122 | |
| Net Asset Value Per Share | ||
| (1,000,000,000 shares authorized, $.001 par value) | $ | 23.80 |
SEE NOTES TO FINANCIAL STATEMENTS
8
the Jensen Portfolio
Schedule of Investments
May 31, 2005
| SHARES | VALUE | |||
Common Stocks 98.03% | ||||
Beverages 9.23% | ||||
| 1,749,000 | Anheuser-Busch | |||
| Companies, Inc | $ | 81,940,650 | ||
| 1,705,000 | The Coca-Cola Company | 76,094,150 | ||
| 2,103,000 | PepsiCo, Inc | 118,314,780 | ||
| 276,349,580 | ||||
Commercial Services & Supplies 4.63% | ||||
| 3,993,000 | Equifax, Inc. | 138,517,170 | ||
Consumer Finance 4.10% | ||||
| 5,813,000 | MBNA Corporation | 122,596,170 | ||
Electrical Equipment 4.81% | ||||
| 2,166,000 | Emerson Electric Co. | 143,974,020 | ||
Electronic Equipment & Instruments 1.07% | ||||
| 713,000 | Dionex Corporation (a) | 31,978,050 | ||
Food & Staples Retailing 4.08% | ||||
| 3,288,000 | Sysco Corporation | 122,182,080 | ||
Health Care Equipment & Supplies 9.77% | ||||
| 2,248,000 | Medtronic, Inc. | 120,830,000 | ||
| 3,523,000 | Stryker Corporation | 171,393,950 | ||
| 292,223,950 | ||||
Health Care Providers & Services 4.58% | ||||
| 3,018,000 | Patterson Companies Inc. (a) | 136,987,020 | ||
Household Products 11.08% | ||||
| 1,719,000 | The Clorox Company | 100,406,790 | ||
| 1,881,000 | Colgate-Palmolive Company | 93,993,570 | ||
| 2,485,000 | The Procter & Gamble Company | 137,047,750 | ||
| 331,448,110 | ||||
Industrial Conglomerates 9.34% | ||||
| 1,642,500 | 3M Co. | 125,897,625 | ||
| 4,215,000 | General Electric Company | 153,763,200 | ||
| 279,660,825 |
| SHARES | VALUE | |||
IT Services 9.24% | ||||
| 2,569,000 | Automatic Data | |||
| Processing, Inc. | $ | 112,522,200 | ||
| 2,423,000 | First Data Corporation | 91,662,090 | ||
| 2,506,000 | Paychex, Inc. | 72,373,280 | ||
| 276,557,570 | ||||
Media 13.17% | ||||
| 1,508,000 | Gannett Co., Inc. | 112,285,680 | ||
| 1,869,500 | Omnicom Group Inc. | 153,093,355 | ||
| 2,948,000 | The McGraw-Hill | |||
| Companies, Inc. | 128,709,680 | |||
| 394,088,715 | ||||
Pharmaceuticals 12.93 | ||||
| 2,729,000 | Abbott Laboratories | 131,646,960 | ||
| 1,961,000 | Johnson & Johnson | 131,583,100 | ||
| 4,438,000 | Pfizer Inc. | 123,820,200 | ||
| 387,050,260 | ||||
| Total Common Stock | ||||
| (Cost $2,624,480,360) | 2,933,613,520 |
| PRINCIPAL AMOUNT | ||||
Short Term Investments 1.79% | ||||
Commercial Paper 1.79% | ||||
| $53,530,000 | Prudential Funding, 2.89%, | |||
| 6/1/2005 | 53,530,000 | |||
Variable Rate Demand Notes (b) 0.00% | ||||
| 14,882 | Wisconsin Corporate Central | |||
| Credit Union, 2.76% | 14,882 | |||
| Total Short Term Investments | ||||
| (Cost $53,544,882) | 53,544,882 | |||
| Total Investments 99.82% | ||||
| (Cost $2,678,025,242) | 2,987,158,402 | |||
| Other Assets in Excess of | ||||
| Liabilities 0.18% | 5,322,479 | |||
| NET ASSETS 100.00% | $2,992,480,881 |
| (a) | Non-Income Producing |
| (b) | Variable rate demand notes are considered short-term obligations and are payable on demand. Interest rates change periodically on specified dates. The rates shown are as of May 31, 2005. |
SEE NOTES TO FINANCIAL STATEMENTS
9
the Jensen Portfolio
Statement of Operations
Year Ended May 31, 2005
Investment Income | ||
| Dividend income | $ | 42,798,377 |
| Interest income | 644,153 | |
| 43,442,530 | ||
Expenses | ||
| Investment advisory fees | 13,407,591 | |
| 12b-1 fees-Class J | 6,012,098 | |
| Administration fees | 991,372 | |
| Transfer agent fees and expenses | 444,918 | |
| Reports to shareholders | 200,917 | |
| Custody fees | 379,012 | |
| Federal and state registration fees | 243,988 | |
| Shareholder servicing fees-Class I | 173,621 | |
| Fund accounting fees | 169,527 | |
| Directors’ fees and expenses | 130,916 | |
| Professional fees | 88,969 | |
| 12b-1 fees-Class R | 93,456 | |
| Other | 49,723 | |
| Total expenses | 22,386,108 | |
| NET INVESTMENT INCOME | 21,056,422 | |
| REALIZED AND UNREALIZED GAIN | ||
| (LOSS) ON INVESTMENTS: | ||
| Net realized loss on investment transactions | (51,494,706) | |
| Change in unrealized appreciation on investments | 53,989,222 | |
| Net gain on investments | 2,494,516 | |
| NET INCREASE IN NET ASSETS RESULTING | ||
| FROM OPERATIONS | $ | 23,550,938 |
Statements of Changes in Net Assets
| YEAR ENDED | YEAR ENDED | |||
| MAY 31, ’05 | MAY 31, ’04 | |||
Operations | ||||
| Net investment income | $ | 21,056,422 | $ | 13,219,295 |
| Net realized loss on | ||||
| investment transactions | (51,494,706) | (14,332,976) | ||
| Change in unrealized | ||||
| appreciation on investments | 53,989,222 | 253,944,024 | ||
| Net increase in net assets | ||||
| resulting from operations | 23,550,938 | 252,830,343 | ||
Capital Share Transactions | ||||
| Shares sold-Class J | 1,224,500,116 | 1,052,489,921 | ||
| Shares sold-Class R | 30,163,911 | 820,616 | ||
| Shares sold-Class I | 112,803,778 | 220,916,375 | ||
| Shares issued to holders | ||||
| in reinvestment of | ||||
| dividends-Class J | 15,207,731 | 9,460,817 | ||
| Shares issued to holders | ||||
| in reinvestment of | ||||
| dividends-Class R | 102,198 | 101 | ||
| Shares issued to holders | ||||
| in reinvestment of | ||||
| dividends-Class I | 2,040,511 | 1,178,769 | ||
| Shares redeemed-Class J | (608,603,947) | (696,368,981) | ||
| Shares redeemed-Class R | (8,124,061) | (34,763) | ||
| Shares redeemed-Class I | (53,789,230) | (7,315,906) | ||
| Net increase | 714,301,007 | 581,146,949 | ||
| DIVIDENDS AND DISTRIBUTIONS | ||||
| TO SHAREHOLDERS: | ||||
| Net investment | ||||
| income-Class J | (17,644,045) | (11,163,757) | ||
| Net investment | ||||
| income-Class R | (102,198) | (101) | ||
| Net investment | ||||
| income-Class I | (2,273,338) | (1,234,204) | ||
| Total dividends and | ||||
| distributions | (20,019,581) | (12,398,062) | ||
| INCREASE IN NET ASSETS | 717,832,364 | 821,579,230 | ||
| NET ASSETS: | ||||
| Beginning of year | 2,274,648,517 | 1,453,069,287 | ||
| End of year (including | ||||
| undistributed net | ||||
| investment income | ||||
| of $3,134,672 and | ||||
| $2,097,831, respectively) | $ | 2,992,480,881 | $2,274,648,517 |
SEE NOTES TO FINANCIAL STATEMENTS
10
the Jensen Portfolio
Financial Highlights
Class J
| YEAR ENDED | YEAR ENDED | YEAR ENDED | YEAR ENDED | YEAR ENDED | ||||||||||||
| MAY 31, ’05 | MAY 31, ’04 | MAY 31, ’03 | MAY 31, ’02 | MAY 31, ’01 | ||||||||||||
Per Share Data | ||||||||||||||||
| Net asset value, beginning of year | $ | 23.82 | $ | 20.80 | $ | 22.51 | $ | 21.53 | $ | 22.25 | ||||||
Income from investment operations: | ||||||||||||||||
| Net investment income | 0.18 | 0.16 | 0.11 | 0.05 | 0.09 | |||||||||||
| Net realized and unrealized gains | ||||||||||||||||
| (losses) on investments | (0.03(1 | )) | 3.01 | (1.73 | ) | 1.00 | (0.14 | ) | ||||||||
| Total from investment operations | 0.15 | 3.17 | (1.62 | ) | 1.05 | (0.05 | ) | |||||||||
Less distributions: | ||||||||||||||||
| Dividends from net investment income . . | (0.18 | ) | (0.15 | ) | (0.09 | ) | (0.07 | ) | (0.10 | ) | ||||||
| From net realized gains | - | - | - | - | (0.57 | ) | ||||||||||
| Total distributions | (0.18 | ) | (0.15 | ) | (0.09 | ) | (0.07 | ) | (0.67 | ) | ||||||
| Net asset value, end of year | $ | 23.79 | $ | 23.82 | $ | 20.80 | $ | 22.51 | $ | 21.53 | ||||||
| Total return | 0.61 | % | 15.28 | % | -7.17 | % | 4.88 | % | -0.18 | % | ||||||
Supplemental data and ratios: | ||||||||||||||||
| Net assets, end of year (000’s) | $ | 2,680,169 | $ | 2,046,288 | $ | 1,453,069 | $ | 473,414 | $ | 46,119 | ||||||
| Ratio of expenses to average | ||||||||||||||||
| net assets | 0.85 | % | 0.88 | % | 0.90 | % | 1.00 | % | 0.95 | % | ||||||
| Ratio of net investment income to | ||||||||||||||||
| average net assets | 0.77 | % | 0.71 | % | 0.62 | % | 0.23 | % | 0.45 | % | ||||||
| Portfolio turnover rate | 8.81 | % | 5.32 | % | 7.22 | % | 0.78 | % | 6.53 | % | ||||||
| (1) | The amount shown may not correlate with the aggregate gains (losses) of portfolio securities due to timing of subscriptions and redemptions of fund shares. |
SEE NOTES TO FINANCIAL STATEMENTS
11
the Jensen Portfolio
Financial Highlights
Class R
YEAR ENDED MAY 31, ’05 | PERIOD FROM JUL. 30, ’03(1) TO MAY 31, ’04 | ||||||
Per Share Data | |||||||
Net asset value, beginning of period | $ | 23.76 | $ | 20.93 | |||
Income from investment operations: | |||||||
Net investment income | 0.14 | 0.13 | |||||
Net realized and unrealized gains (losses) on investments | (0.05) | (4) | 2.83 | ||||
Total from investment operations | 0.09 | 2.96 | |||||
Less distributions: | |||||||
Dividends from net investment income | (0.14 | ) | (0.13 | ) | |||
Total distributions | (0.14 | ) | (0.13 | ) | |||
Net asset value, end of period | $ | 23.71 | $ | 23.76 | |||
Total return(2) | 0.40 | % | 14.13 | % | |||
Supplemental data and ratios: | |||||||
Net assets, end of period (000’s) | $ | 23,884 | $ | 799 | |||
Ratio of expenses to average net assets(3) | 1.10 | % | 1.12 | % | |||
Ratio of net investment income to average net assets(3) | 0.54 | % | 0.45 | % | |||
Portfolio turnover rate | 8.81 | % | 5.32 | % | |||
| (1) | Commencement of operations. |
| (2) | Not annualized for periods less than one year. |
| (3) | Annualized for periods less than one year. |
| (4) | The amount shown may not correlate with the aggregate gains (losses) of portfolio securities due to timing of subscriptions and redemptions of fund shares. |
SEE NOTES TO FINANCIAL STATEMENTS
12
the Jensen Portfolio
Financial Highlights
Class I
YEAR ENDED MAY 31, ’05 | PERIOD FROM JUL. 30, ’03(1) TO MAY 31, ’04 | ||||||
Per Share Data | |||||||
Net asset value, beginning of period | $ | 23.82 | $ | 20.93 | |||
Income from investment operations: | |||||||
Net investment income | 0.23 | 0.12 | |||||
Net realized and unrealized gains (losses) on investments | (0.04) | (4) | 2.92 | ||||
Total from investment operations | 0.19 | 3.04 | |||||
Less distributions: | |||||||
Dividends from net investment income | (0.21 | ) | (0.15 | ) | |||
Total distributions | (0.21 | ) | (0.15 | ) | |||
Net asset value, end of period | $ | 23.80 | $ | 23.82 | |||
Total return(2) . | 0.77 | % | 14.54 | % | |||
Supplemental data and ratios: | |||||||
Net assets, end of period | $ | 288,428 | $ | 227,561 | |||
Ratio of expenses to average net assets(3) | 0.67 | % | 0.70 | % | |||
Ratio of net investment income to average net assets(3) | 0.95 | % | 0.87 | % | |||
Portfolio turnover rate | 8.81 | % | 5.32 | % | |||
| (1) | Commencement of operations. |
| (2) | Not annualized for periods less than one year. |
| (3) | Annualized for periods less than one year. |
| (4) | The amount shown may not correlate with the aggregate gains (losses) of portfolio securities due to timing of subscriptions and redemptions of fund shares. |
SEE NOTES TO FINANCIAL STATEMENTS
13
the Jensen Portfolio
Notes to the Financial Statements
May 31, 2005
1. Organization and Significant Accounting Policies
The Jensen Portfolio, Inc. (the “Fund”) was organized as an Oregon Corporation on April 17, 1992, and is registered as an open-end, nondiversified management investment company under the Investment Company Act of 1940 (the “1940 Act”). The Fund commenced operations on August 3, 1992. Effective July 30, 2003, the Fund issued two new classes of shares, Class R and Class I and renamed the existing class as Class J. Class J shares are subject to a 0.25% 12b-1 fee; Class R shares are subject to a 0.50% 12b-1 fee and Class I shares are subject to a 0.10% shareholder servicing fee, as described in each Class’ prospectus. Each class of shares has identical rights and privileges except with respect to the 12b-1 fees and shareholder servicing fee, and voting rights on matters affecting a single class of shares. The principal investment objective of the Fund is long-term capital appreciation.
The following is a summary of significant accounting policies consistently followed by the Fund. The policies are in conformity with accounting principles generally accepted in the United States of America.
a) Investment Valuation - Securities that are listed on United States stock exchanges or the Nasdaq Stock Market are valued at the last sale price on the day the securities are valued or, if there has been no sale on that day, at their current bid price. Quotations are taken from the market in which the security is primarily traded. Over-the-counter securities are valued at their current bid price. Securities for which market quotations are not readily available are valued at fair value as determined by the Investment Adviser at or under the direction of the Fund’s Board of Directors. There were no securities valued by the Board of Directors as of May 31, 2005. Variable rate demand notes are valued at cost which approximates fair value. Notwithstanding the above, fixed-income securities may be valued on the basis of prices provided by an established pricing service when the Board believes that such prices better reflect market values.
b) Federal Income Taxes - No provision for federal income taxes has been made since the Fund has complied to date with the provisions of the Internal Revenue Code applicable to regulated investment companies and intends to continue to so comply in the future and to distribute substantially all of its net investment income and realized capital gains in order to relieve the Fund from all federal income taxes.
c) Distributions to Shareholders - Dividends to shareholders are recorded on ex-dividend date. Dividends from net investment income are declared and paid quarterly by the Fund. Distributions of net realized capital gains, if any, will be declared and paid at least annually. Income and capital gain distributions are determined in accordance with income tax regulations which may differ from generally accepted accounting principles. Permanent differences between financial reporting and tax are reclassified to capital stock.
d) Use of Estimates - The preparation of financial statements in conformity with accounting principles generally accepted in the United States of America requires management to make estimates and assumptions that affect the reported amounts of assets and liabilities and disclosure of contingent assets and liabilities at the date of the financial statements and the reported amounts of revenues and expenses during the reporting period. Actual results could differ from those estimates.
e) Guarantees and Indemnifications - In the normal course of business the Fund enters into contracts with service providers that contain general indemnification clauses. The Fund’s maximum exposure under these arrangements is unknown as this would involve future claims that may be made against the Fund that have not yet occurred. However, based on experience, the Fund expects the risk of loss to be remote.
f) Other - Investment and shareholder transactions are recorded on trade date. Gains or losses from the investment transactions are determined on the basis of identified carrying value. Dividend income is recognized on the ex-dividend date and interest income is recognized on an accrual basis. The Fund has investments in short-term variable rate demand notes, which are unsecured instruments. These notes may present credit risk to the extent the issuer defaults on its payment obligation. The credit-worthiness of the issuer is monitored, and these notes are considered to present minimal credit risk in the opinion of the Investment Adviser. Income, expenses (other than those deemed attributable to a specific share class), and gains and losses of the Fund are allocated daily to each class of shares based upon the ratio of net assets represented by each class as a percentage of the net assets of the Fund. Expenses deemed directly attributable to a specific class of shares are charged against the operations of such class.
2. Capital Share Transactions
Transactions in shares of the Fund were as follows:
| YEAR ENDED | YEAR ENDED | ||
| MAY 31, ’05 | MAY 31, ’04 | ||
Class J | |||
| Shares sold | 51,799,028 | 46,904,454 | |
| Shares issued to holders in | |||
| reinvestment of dividends | 639,759 | 426,590 | |
| Shares redeemed | (25,682,314) | (31,268,846) | |
| Net increase | 26,756,473 | 16,062,198 | |
| Shares outstanding: | |||
| Beginning of year | 85,916,337 | 69,854,139 | |
| End of year | 112,672,810 | 85,916,337 |
14
| YEAR ENDED | YEAR ENDED | ||
| MAY 31, ’05 | MAY 31, ’04 | ||
Class R | |||
| Shares sold | 1,312,508 | 35,075 | |
| Shares issued to holders in | |||
| reinvestment of dividends | 4,348 | 5 | |
| Shares redeemed | (343,028) | (1,446) | |
| Net increase | 973,828 | 33,634 | |
| Shares outstanding: | |||
| Beginning of year | 33,634 | - | |
| End of year | 1,007,462 | 33,634 | |
Class I | |||
| Shares sold | 4,746,946 | 9,817,146 | |
| Shares issued to holders in | |||
| reinvestment of dividends | 85,840 | 51,203 | |
| Shares redeemed | (2,265,289) | (314,724) | |
| Net increase | 2,567,497 | 9,553,625 | |
| Shares outstanding: | |||
| Beginning of year | 9,553,625 | - | |
| End of year | 12,121,122 | 9,553,625 |
3. Investment Transactions
The aggregate purchases and aggregate sales of securities, excluding short-term investments, by the Fund for the year ended May 31, 2005, were $917,476,907 and $232,896,263; respectively.
4. Income Taxes
At May 31, 2005, the Fund had accumulated net realized capital loss carryovers of $767,052, $14,029,552 and $24,932,611 which will expire on May 31, 2010, May 31, 2012 and May 31, 2013, respectively. To the extent the Fund realizes future net capital gains, taxable distributions to its shareholders will be offset by any unused capital loss carryover. At May 31, 2005, the Fund deferred on a tax basis to the first day of the next taxable year, post-October losses of $26,865,519. The cost of investments differ for financial statement and tax purposes primarily due to differing treatments of wash sales.
The distributions of $12,398,062 and $20,019,581 paid during the years ended May 31, 2004 and May 31, 2005, respectively were classified as ordinary for income tax purposes.
At May 31, 2005, the cost of investments, net unrealized appreciation (depreciation) and undistributed ordinary income and undistributed long term capital gains for income tax purposes were as follows:
| Cost of investments | $2,678,467,684 |
| Gross unrealized appreciation | 385,595,911 |
| Gross unrealized depreciation | (76,905,193) |
| Net unrealized appreciation | $308,690,718 |
| Undistributed ordinary income | $3,134,672 |
| Undistributed long-term capital gain | - |
| Total distributable earnings | $3,134,672 |
| Other accumulated losses | $(66,594,734) |
| Total accumulated earnings | $245,230,656 |
5. Line of Credit
The Fund has a $250 million revolving credit facility for temporary emergency purposes, including the meeting of redemption requests that otherwise might require the untimely disposition of securities. The interest rate on the outstanding principal amount is equal to the prime rate less 1/2%. The Fund did not borrow on the line of credit during the year ended May 31, 2005.
6. Investment Advisory and Other Agreements
The Fund has entered into an Investment Advisory and Service Contract with Jensen Investment Management, Inc. Pursuant to its advisory agreement with the Fund, the Investment Adviser is entitled to receive a fee, calculated daily and payable monthly, at the annual rate of 0.50% as applied to the Fund’s daily net assets.
Certain officers and directors of the Fund are also officers and directors of the Investment Adviser.
7. Distribution and Shareholder Servicing
The Fund has adopted a distribution and shareholder servicing plan pursuant to Rule 12b-1 under the 1940 Act (the “12b-1 Plan”), which provides that the Fund may reimburse the Fund’s distributor or others at an annual rate of up to 0.25% of the average daily net assets attributable to Class J shares and up to 0.50% of the average daily net assets attributable to Class R shares. Payments under the 12b-1 Plan shall be used to compensate or reimburse the Fund’s distributor or others for services provided and expenses incurred in connection with the sale of shares.
In addition, the Fund has adopted a Shareholder Servicing Plan (the “Servicing Plan”) under which the Fund can pay for shareholder support services from the Fund’s assets pursuant to a Shareholder Servicing Agreement in an amount not to exceed 0.10% of the Fund’s average daily net assets attributable to Class I shares.
15
the Jensen Portfolio
REPORT OF INDEPENDENT REGISTERED PUBLIC ACCOUNTING FIRM
To the Board of Directors and Shareholders of The Jensen Portfolio, Inc.
In our opinion, the accompanying statement of assets and liabilities, including the schedule of investments, and the related statements of operations and of changes in net assets and the financial highlights present fairly, in all material respects, the financial position of The Jensen Portfolio, Inc (the ‘Fund’) at May 31, 2005, the results of its operations for the year then ended, the changes in its net assets for each of the two years in the period then ended and its financial highlights for the periods presented, in conformity with accounting principles generally accepted in the United States of America. These financial statements and financial highlights (hereafter referred to as &#-3934;financial statements&#-3934;) are the responsibility of the Fund’s management; our responsibility is to express an opinion on these financial statements based on our audits. We conducted our audits of these financial statements in accordance with the standards of the Public Company Accounting Oversight Board (United States), which require that we plan and perform the audit to obtain reasonable assurance about whether the financial statements are free of material misstatement. An audit includes examining, on a test basis, evidence supporting the amounts and disclosures in the financial statements, assessing the accounting principles used and significant estimates made by management, and evaluating the overall financial statement presentation. We believe that our audits, which included confirmation of securities at May 31, 2005 by correspondence with the custodian, provide a reasonable basis for our opinion.
PricewaterhouseCoopers LLP
Milwaukee, Wisconsin July 15, 2005
16
the Jensen Portfolio
Expense Example - May 31, 2005 (Unaudited)
As a shareholder of The Jensen Portfolio (the “Fund”), you incur ongoing costs, including investment advisory fees, distribution and/or shareholder servicing fees, and other Fund expenses, which are indirectly paid by shareholders. This example is intended to help you understand your ongoing costs (in dollars) of investing in the Fund and to compare these costs with the ongoing costs of investing in other mutual funds.
The Example is based on an investment of $1,000 invested at the beginning of the period and held for the entire six month period (December 1, 2004 - May 31, 2005).
Actual Expenses
The first line of the table below for each share class of the Fund provides information about actual account values and actual expenses. However, the table does not include shareholder specific fees, such as the $15.00 fee charged to IRA accounts, or the $15.00 fee charged for wire redemptions. The table also does not include portfolio trading commissions and related trading costs. You may use the information in this line, together with the amount you invested, to estimate the expenses that you paid over the period. Simply divide your account value by $1,000 (for example, an $8,600 account value divided by $1,000 = 8.6), then multiply the result by the number in the first line under the heading entitled “Expenses Paid During Period” to estimate the expenses you paid on your account during this period.
Hypothetical Example for Comparison Purposes
The second line of the table below provides information about hypothetical account values and hypothetical expenses based on the actual expense ratios for each share class of the Fund and an assumed rate of return of 5% per year before expenses, which is not the Fund’s actual return. The hypothetical account values and expenses may not be used to estimate the actual ending account balance or expenses you paid for the period. You may use this information to compare the ongoing costs of investing in the Fund and other funds. To do so, compare this 5% hypothetical example with the 5% hypothetical examples that appear in the shareholder reports of the other funds.
Please note that the expenses shown in the table are meant to highlight your ongoing costs only and do not reflect any transactional costs, such as sales charges (loads), redemption fees, or exchange fees which, although not charged by the Fund, may be charged by other funds. Therefore, the second line of the table is useful in comparing ongoing costs only, and will not help you determine the relative total costs of owning different funds.
Expense Example Tables
The Jensen Portfolio-Class J
| BEGINNING | ENDING | EXPENSES PAID | |
| ACCOUNT VALUE | ACCOUNT VALUE | DURING PERIOD* | |
| DECEMBER 1, 2004 | MAY 31, 2005 | DECEMBER 1, 2004 - MAY 31, 2005 | |
| Actual | $1,000.00 | $1,021.40 | $4.28 |
| Hypothetical (5% return before expenses) | 1000.00 | 1,020.69 | 4.28 |
| * | Expenses are equal to Class J’s annualized expense ratio of 0.85%, multiplied by the average account value over the period, multiplied by 182/365 to reflect the one-half year period. |
The Jensen Portfolio-Class R | |||
| BEGINNING | ENDING | EXPENSES PAID | |
| ACCOUNT VALUE | ACCOUNT VALUE | DURING PERIOD* | |
| DECEMBER 1, 2004 | MAY 31, 2005 | DECEMBER 1, 2004 - MAY 31, 2005 | |
| Actual | $1,000.00 | $1,020.30 | $5.54 |
| Hypothetical (5% return before expenses) | 1,000.00 | 1,019.45 | 5.54 |
| * | Expenses are equal to Class R’s annualized expense ratio of 1.10%, multiplied by the average account value over the period, multiplied by 182/365 to reflect the one-half year period. |
The Jensen Portfolio-Class I
| BEGINNING | ENDING | EXPENSES PAID | |
| ACCOUNT VALUE | ACCOUNT VALUE | DURING PERIOD* | |
| DECEMBER 1, 2004 | MAY 31, 2005 | DECEMBER 1, 2004 - MAY 31, 2005 | |
| Actual | $1,000.00 | $1,022.30 | $3.38 |
| Hypothetical (5% return before expenses) | 1,000.00 | 1,021.59 | 3.38 |
| * | Expenses are equal to Class I’s annualized expense ratio of 0.67%, multiplied by the average account value over the period, multiplied by 182/365 to reflect the one-half year period. |
17
the Jensen Portfolio
1. SHAREHOLDER NOTIFICATION OF FEDERAL TAX STATUS
The Fund designates 100% of dividends declared during the fiscal year ended May 31, 2005 as dividends qualifying for the dividends received deduction available to corporate shareholders.
The Fund designates 100% of dividends declared from net investment income during the fiscal year ended May 31, 2005 as qualified dividend income under the Jobs and Growth Tax Relief Reconciliation Act of 2003.
2. AVAILABILITY OF PROXY VOTING INFORMATION
Information regarding how the Fund votes proxies relating to portfolio securities is available without charge, upon request by calling toll-free, 1-800-221-4384, or by accessing the SEC’s website at www.sec.gov.
3. PORTFOLIO HOLDINGS
The Jensen Portfolio will file its complete schedule of portfolio holdings with the SEC for the first and third quarters of each fiscal year on Form N-Q. The Fund’s Form N-Q will be available on the EDGAR database on the SEC’s website at www.sec.gov. These Forms may also be reviewed and copied at the SEC’s Public Reference Room in Washington D.C. Information about the operation of the Public Reference Room may be obtained by calling 1-800-SEC-0330.
4. ADDITIONAL DISCLOSURE REGARDING FUND DIRECTORS AND OFFICERS
Independent Directors
| # OF | |||||
| TERM OF IN FUND | PRINCIPAL | PORTFOLIOS | OTHER | ||
| POSITION(S) | OFFICE AND | OCCUPATION | COMPLEX | DIRECTORSHIPS | |
| HELD WITH | LENGTH OF | DURING PAST | OVERSEEN | HELD BY | |
| NAME, AGE AND ADDRESS | THE COMPANY | TIME SERVED** | FIVE YEARS | BY DIRECTOR | DIRECTOR |
| Norman W. Achen J.D., 83 | Independent | Indefinite Term; | President of N.W. | 1 | Director of Brentwood |
| 2842 Luciernaga St. | Director | Served since | Achen Professional | Biomedical Research | |
| Carlsbad, CA 92009 | inception. | Corporation | Institute (1998 - present); | ||
| (1980 - present). | Director of Clinical | ||||
| Research Administration | |||||
| at V.A. Hospital in | |||||
| Los Angeles, CA | |||||
| (2002 - present). | |||||
| Roger A. Cooke J.D., 56 | Independent | Indefinite Term; | Vice President - Regulatory | 1 | None |
| The Jensen Portfolio, Inc. | Director | since June 1999. | and Legal Affairs of | ||
| 2130 Pacwest Center | Precision Castparts Corp., | ||||
| 1211 SW Fifth Avenue | an investment casting and | ||||
| Portland, OR 97204 | forging company, | ||||
| (2000 - present); | |||||
| Executive Vice President - | |||||
| Regulatory and Legal | |||||
| Affairs of Fred Meyer, Inc., | |||||
| a grocery and general | |||||
| merchandise company, | |||||
| (1992 - 2000). |
18
the Jensen Portfolio
| # OF | |||||
| PORTFOLIOS | |||||
| TERM OF | PRINCIPAL | IN FUND | OTHER | ||
| POSITION(S) | OFFICE AND | OCCUPATION | COMPLEX | DIRECTORSHIPS | |
| HELD WITH | LENGTH OF | DURING PAST | OVERSEEN | HELD BY | |
NAME, AGE AND ADDRESS | THE COMPANY | TIME SERVED** | FIVE YEARS | BY DIRECTOR | DIRECTOR |
| Robert E. Harold | Independent | Indefinite Term; | Senior Director of | 1 | Director of |
| C.P.A. (Retired), 57 | Director | since | Financial Planning | StoriedLearning, | |
| The Jensen Portfolio, Inc. | September | of Nike, Inc. (2001 - | Inc. (2000 - 2003); | ||
| 2130 Pacwest Center | 2000. | 2002); Global Brand | Director of St. Mary’s | ||
| 1211 SW Fifth Avenue | Controller for Nike, Inc. | Academy, a non- | |||
| Portland, OR 97204 | (1996, 1997, 2000 - 2001); | profit high school | |||
| Interim Chief Financial Of- | (2000 - present); | ||||
| ficer for Nike, Inc. | Director of Laika, Inc. | ||||
| (1998 - 1999); Interim | (formerly Will Vinton | ||||
| Chief Executive Officer for | Studios), an animation | ||||
| Laika, Inc. (formerly | studio (2002 - present); | ||||
| Will Vinton Studios) | Director of The | ||||
| (March 2005 - present). | Sisters of the Holy | ||||
| Names Foundation | |||||
| (2004 - present). | |||||
| Thomas L. Thomsen, Jr., 60 | Independent | Indefinite Term; | Private rancher and | 1 | None |
| The Jensen Portfolio, Inc. | Director | since | real estate investor | ||
| 2130 Pacwest Center | December 2003 | (2002 - Present); | |||
| 1211 SW Fifth Ave. | Chief Executive Officer | ||||
| Portland, OR 97204 | (2000 - 2002) | ||||
| and President (1998 - | |||||
| 2000) of Columbia Man- | |||||
| agement Company, invest- | |||||
| ment adviser to the Colum- | |||||
| bia Funds family of mutual | |||||
| funds and to institutional | |||||
| and individual investors. | |||||
DIRECTOR EMERITUS | |||||
| Louis B. Perry, Ph.D, 87 | Director | Indefinite Term; | Retired | 1 | None |
| 1585 Gray Lynn Drive | Emeritus | Served since | |||
| Walla Walla, WA 99362 | inception | ||||
| (at times as | |||||
| Director | |||||
| Emeritus). |
19
the Jensen Portfolio
Interested Directors and Officers
| # OF | ||||||||||
| PORTFOLIOS | ||||||||||
| TERM OF | PRINCIPAL | IN FUND | OTHER | |||||||
| POSITION(S) | OFFICE AND | OCCUPATION | COMPLEX | DIRECTORSHIPS | ||||||
| HELD WITH | LENGTH OF | DURING PAST | OVERSEEN | HELD BY | ||||||
NAME, AGE AND ADDRESS | THE COMPANY | TIME SERVED** | FIVE YEARS | BY DIRECTOR | DIRECTOR | |||||
| Val E. Jensen,* 75 | Director and | Indefinite Term; | Chairman and Director | 1 | None | |||||
| Jensen Investment | Chairman | Served as | of Jensen Investment | |||||||
| Management, Inc. | Director since | Management, Inc. | ||||||||
| 2130 Pacwest Center | inception; Served as | (1988 - 2004). | ||||||||
| 1211 SW Fifth Avenue | President from inception | |||||||||
| Portland, OR 97204 | to March 2002; | |||||||||
| Served as Chairman since | ||||||||||
| March 2002. | ||||||||||
| Gary W. Hibler,* Ph.D., 61 | Director and | Indefinite Term; | President of Jensen | 1 | None | |||||
| Jensen Investment | President | Served as Director since | Investment Management | |||||||
| Management, Inc. | inception; Served as | (1994 - present). | ||||||||
| 2130 Pacwest Center | Secretary from | |||||||||
| 1211 SW Fifth Avenue | inception to | |||||||||
| Portland, OR 97204 | March 2002; | |||||||||
| Served as Treasurer | ||||||||||
| from December 2002 | ||||||||||
| to March 2004; | ||||||||||
| Served as | ||||||||||
| President since | ||||||||||
| March 2002. | ||||||||||
| Robert F. Zagunis,* 51 | Vice President | 1 Year Term; | Vice President and | N/A | N/A | |||||
| Jensen Investment | Served since | Director of Jensen | ||||||||
| Management, Inc. | inception. | Investment Management, | ||||||||
| 2130 Pacwest Center | Inc. (1993 - present). | |||||||||
| 1211 SW Fifth Avenue | ||||||||||
| Portland, OR 97204 | ||||||||||
| Robert G. Millen,* 58 | Vice President | 1 Year Term; | Vice President and | N/A | N/A | |||||
| Jensen Investment | and Secretary | Served as Vice | Director of Jensen | |||||||
| Management, Inc. | President from July | Investment Management, | ||||||||
| 2130 Pacwest Center | 2001 to March | Inc. (2000 - present); | ||||||||
| 1211 SW Fifth Avenue | 2002 and since June | Vice President of | ||||||||
| Portland, OR 97204 | 2005; Served as | Principal Financial | ||||||||
| Secretary since | Group, an insurance | |||||||||
| March 2002. | company (1997 - 2000). | |||||||||
20
the Jensen Portfolio
| # OF | ||||||||||
| PORTFOLIOS | ||||||||||
| TERM OF | PRINCIPAL | IN FUND | OTHER | |||||||
| POSITION(S) | OFFICE AND | OCCUPATION | COMPLEX | DIRECTORSHIPS | ||||||
| NAME, AGE AND | HELD WITH | LENGTH OF | DURING PAST | OVERSEEN | HELD BY | |||||
| ADDRESS | THE COMPANY | TIME SERVED** | FIVE YEARS | BY DIRECTOR | DIRECTOR | |||||
| Brian S. Ferrie,* 46 | Treasurer | 1 Year Term; | Director of Finance and | N/A | N/A | |||||
| Jensen Investment | and | Served since | Chief Compliance Officer | |||||||
| Management, Inc. | Chief | March 2004. | for Jensen Investment | |||||||
| 2130 Pacwest Center | Compliance | Management, Inc. | ||||||||
| 1211 SW Fifth Avenue | Officer | (2003 - present); Vice | ||||||||
| Portland, OR 97204 | President and CFO of | |||||||||
| Berger Financial Group | ||||||||||
| LLC (2001 - 2003); Vice | ||||||||||
| President and Chief | ||||||||||
| Compliance Officer | ||||||||||
| of Berger Financial Group | ||||||||||
| LLC (1994 - 2001). | ||||||||||
| * | This individual is an “interested person” of the Fund within the meaning of the 1940 Act. |
| ** | Each Director serves for an indefinite term in accordance with the Bylaws of the Fund until the date a Director resigns, retires or is removed in accordance with the Bylaws of the Fund. |
21
| Investment Adviser Jensen Investment Management, Inc. 2130 Pacwest Center 1211 SW Fifth Avenue Portland, OR 97204-3721 800.992.4144 www.jenseninvestment.com Fund Administrator, Transfer Agent, and Fund Accountant U.S. Bancorp Fund Services, LLC 615 East Michigan Street Milwaukee, WI 53202 Custodian U.S. Bank, N.A. 425 Walnut Street Cincinnati, OH 45202 Legal Counsel Stoel Rives LLP Standard Insurance Center 900 SW Fifth Avenue Suite 2300 Portland, OR 97204-1268 Independent Registered Public Accounting Firm PricewaterhouseCoopers LLP 100 East Wisconsin Avenue Suite 1500 Milwaukee, WI 53202 Distributor Quasar Distributors, LLC 615 East Michigan Street Milwaukee, WI 53202 This report has been prepared for shareholders and may be distributed to others only if preceded or accompanied by a current prospectus. |
Item 2. Code of Ethics.
| (1) | The registrant has adopted a code of ethics that applies to the registrant’s principal executive officer and principal financial officer. The registrant has not made any amendments to its code of ethics during the period covered by this report. The registrant has not granted any waivers from any provisions of the code of ethics during the period covered by this report. A copy of the registrant’s Code of Ethics has previously been filed. |
Item 3. Audit Committee Financial Expert.
The registrant’s board of directors has determined that there is at least one audit committee financial expert serving on its audit committee. Robert E. Harold, CPA (Retired), is the “audit committee financial expert” and is considered to be “independent” as each term is defined in Item 3 of Form N-CSR.
Item 4. Principal Accountant Fees and Services.
(a) - (d) The registrant has engaged its principal accountant to perform audit services, audit-related services, tax services and other services during the past two fiscal years. “Audit services” refer to performing an audit of the registrant's annual financial statements or services that are normally provided by the accountant in connection with statutory and regulatory filings or engagements for those fiscal years. “Audit-related services” refer to the assurance and related services by the principal accountant that are reasonably related to the performance of the audit. “Tax services” refer to professional services rendered by the principal accountant for tax compliance, tax advice, and tax planning. There are no “other services” provided by the principal accountant during the last two fiscal years ended May 31, 2005 and 2004. The following table details the aggregate fees billed for each of the last two fiscal years for audit fees, audit-related fees, tax fees and other fees by the principal accountant.
| FYE 5/31/05 | FYE 5/31/04 | |
| Audit Fees | $27,900 | $28,100 |
| Audit-Related Fees | 0 | 0 |
| Tax Fees | 0 | 0 |
| All Other Fees | 0 | 0 |
During the fiscal years ended May 31, 2005 and 2004, there were no audit-related fees, tax fees, or other fees required to be approved pursuant to paragraph (c)(7)(ii) of Rule 2-01 of Regulation S-X.
(e)(1) The audit committee has adopted pre-approval policies and procedures that require the audit committee to pre-approve all audit and non-audit services of the registrant, including services provided to any entity affiliated with the registrant where the nature of the services provided has a direct relationship to the operations or financial reporting of the registrant.
(e)(2) The percentage of audit-related services, tax services and all other services described in this Item above approved pursuant to the “de minimis” exception under paragraph (c)(7)(i)(C) of Rule 2-01 of Regulation S-X during both fiscal years ended May 31, 2005 and 2004 was zero.
(f) According to the registrant’s principal accountant, all of the principal accountant’s hours spent on auditing the registrant’s financial statements for the most recent fiscal year were attributed to work performed by full-time permanent employees of the principal accountant.
(g) The following table indicates the aggregate non-audit fees billed by the registrant’s accountant for services to the registrant and to the registrant’s investment adviser (and any other controlling entity, etc.—not sub-adviser) for the last two years.
| Non-Audit Related Fees | FYE 5/31/05 | FYE 5/31/04 |
| Registrant | $0 | $0 |
| Registrant’s Investment Adviser | $34,718 | $34,580 |
(h) For the most recent fiscal year, the audit committee of the board of directors considered the provision of non-audit services that were rendered by the principal accountant to the registrant's investment adviser that did not relate directly to the operations and financial reporting of the registrant to be compatible with maintaining the principal accountant's independence in its audit of the registrant, taking into account representations from the principal accountant, in accordance with Independence Standards Board Standard No. 1, regarding its independence from the registrant and related entities.
Item 5. Audit Committee of Listed Registrants.
Not applicable to open-end investment companies.
Item 6. Schedule of Investments.
Schedule of Investments is included as part of the report to shareholders filed under Item 1 of this Form.
Item 7. Disclosure of Proxy Voting Policies and Procedures for Closed-End Management Investment Companies.
Not applicable to open-end investment companies.
Item 8. Portfolio Managers of Closed-End Management Investment Companies
Not applicable to open-end investment companies.
Item 9. Purchases of Equity Securities by Closed-End Management Investment Company and Affiliated Purchases.
Not applicable to open-end investment companies.
Item 10. Submission of Matters to a Vote of Security Holders.
Not Applicable.
Item 11. Controls and Procedures.
| (a) | The Registrant’s President/Chief Executive Officer and Treasurer/Chief Financial Officer have reviewed the Registrant's disclosure controls and procedures (as defined in Rule 30a-3(c) under the Investment Company Act of 1940 (the “Act”)) as of a date within 90 days of the filing of this report, as required by Rule 30a-3(b) under the Act and Rules 13a-15(b) or 15d-15(b) under the Securities Exchange Act of 1934. Based on their review, such officers have concluded that the disclosure controls and procedures are effective in ensuring that information required to be disclosed in this report is appropriately recorded, processed, summarized and reported and made known to them by others within the Registrant and by the Registrant’s service provider. |
| (b) | There were no significant changes in the Registrant's internal controls over financial reporting that occurred during the Registrant's last fiscal half-year that has materially affected, or is reasonably likely to materially affect, the Registrant's internal control over financial reporting. |
Item 12. Exhibits.
| (a) | (1) Any code of ethics or amendment thereto, that is subject of the disclosure required by Item 2, to the extent that the registrant intends to satisfy Item 2 requirements through filing an exhibit. Previously filed. |
(2) Certifications pursuant to Section 302 of the Sarbanes-Oxley Act of 2002. Filed herewith.
(3) Any written solicitation to purchase securities under Rule 23c-1 under the Act sent or given during the period covered by the report by or on behalf of the registrant to 10 or more persons. Not applicable to open-end investment companies.
| (b) | Certification pursuant to Section 906 of the Sarbanes-Oxley Act of 2002. Furnished herewith. |
SIGNATURES
Pursuant to the requirements of the Securities Exchange Act of 1934 and the Investment Company Act of 1940, the registrant has duly caused this report to be signed on its behalf by the undersigned, thereunto duly authorized.
(Registrant) The Jensen Portfolio, Inc.
By (Signature and Title) /s/ Gary Hibler
Gary Hibler, President
Date 8/4/05
Pursuant to the requirements of the Securities Exchange Act of 1934 and the Investment Company Act of 1940, this report has been signed below by the following persons on behalf of the registrant and in the capacities and on the dates indicated.
By (Signature and Title) /s/ Gary Hibler
Gary Hibler, President
Date 8/4/05
By (Signature and Title) /s/ Brian Ferrie
Brian Ferrie, Treasurer
Date 8/4/05