As filed with the Securities and Exchange Commission on August 3, 2006
UNITED STATES
SECURITIES AND EXCHANGE COMMISSION
Washington, D.C. 20549
FORM N-CSR
CERTIFIED SHAREHOLDER REPORT OF REGISTERED
MANAGEMENT INVESTMENT COMPANIES
Investment Company Act file number 811-6653
The Jensen Portfolio, Inc.
(Exact name of registrant as specified in charter)
2130 Pacwest Center, 1211 SW Fifth Avenue
Portland, OR 97204-3721
(Address of principal executive offices) (Zip code)
Gary Hibler
2130 Pacwest Center, 1211 SW Fifth Avenue
Portland, OR 97204-3721
(Name and address of agent for service)
(800) 221-4384
Registrant's telephone number, including area code
Date of fiscal year end: May 31, 2006
Date of reporting period: May 31, 2006
Item 1. Report to Stockholders.
the Jensen Portfolio
Annual Report, May 31, 2006

the Jensen Portfolio
Letter from The Investment Adviser
DEAR FELLOW SHAREHOLDERS:
The Jensen Portfolio—Class J Shares—returned 3.30% for the year ended May 31, 2006, compared to a return of 8.64% for the Standard & Poor’s 500 Index for this period. Please see page 3 of this report for complete standardized information for the Fund.
The Jensen Portfolio’s relative market underperformance was largely due to declines in the health care sector. Patterson Companies declined over 20% for the year but has demonstrated strong growth in earnings and free cash flows over the last 10 years, and we continue to believe its long-term growth prospects remain bright. Pfizer, with a 12% decline for the year, is a company we are watching closely as it struggles with lower growth prospects due to patent expirations and a difficult regulatory environment amid concerns over rising health care costs.
In contrast, the energy sector saw outsized returns of over 29% for the period, but the companies in this highly cyclical sector do not meet Jensen’s strict investment criteria.
We continue to be pleased by the fundamental business performance of the companies in which we invest. Despite the outside pressures, these companies continue to grow their free cash flow, providing opportunities to invest in future growth, either organically or via acquisitions, and reward shareholders through ever increasing share buybacks and increasing dividend payouts. We believe this performance truly makes these higher quality companies.
While we do not pay particular attention to short term market trends, we saw somewhat of a shift toward higher quality companies over the last six weeks of the Fund’s fiscal year as investors come to grips with rising rates, slower corporate profit growth and increased market volatility. Whether or not this represents a return to quality will only be borne out in the months ahead.
Portfolio Changes
During the fiscal year we sold Dionex Corporation, one of the smallest companies that qualify for consideration by The Jensen Portfolio. We had been pleased by its consistently strong business performance, but our position in Dionex had been constrained by the small amount of the company’s outstanding shares and we believed it necessary to look for another opportunity.
We additionally sold Anheuser-Busch. Despite a dominant market share of the U.S. beer industry and growing international prospects, Anheuser-Busch’s business performance lagged over the last few quarters. The company had been unable to execute its business plan and had to reconfigure aspects of it.
Gannett was also sold by The Jensen Portfolio. Ongoing struggles in the traditional newspaper industry as a whole, combined with the growing appetite for on-demand media and a continuing decline in newspapers’ share of total advertising dollars, convinced us that better investment opportunities existed elsewhere.
Lastly, in December, we sold MBNA Corporation in advance of its acquisition by Bank of America.
We are pleased to have added four companies to The Jensen Portfolio.
We added T. Rowe Price Group, one of the best performing investment groups with a collegial management team that fosters a “shareholder comes first” culture. Consistently solid operating margins and high levels of free cash flow have allowed the company to pay down all of its debt and T. Rowe continues making investments in its business to facilitate future growth. Its mutual funds sport strong long-term performance and are led by investment teams, allowing the company to develop talented people. It is also a major force in the retirement industry and has promising prospects overseas.
We additionally added Ecolab Inc., developer and marketer of premium cleaning products and services for the hospitality, food service, institutional and industrial markets. Ecolab isn’t a household name but it is the dominant player in its $39 billion (and growing) industry with a market share of 12%. Ecolab’s competitive advantage is its large and deeply trained sales force of over 12,000 people who build strong relationships. Customer retention nears 90%. Ecolab has produced consistent quality growth, averaging solid double-digit growth in earnings and free cash flows, something we expect will continue as the company works to gain market share.
Wells Fargo, a leading provider of financial services, was also added to The Jensen Portfolio. The company has only a 5% market share of financial services sold in its existing geographic area. Its territory includes eight of the ten fastest growing states providing plenty of room for growth. Wells Fargo’s culture guides the management team to put the customer first, knowing that business performance comes from satisfied customers. Wells Fargo has produced consistent quality growth for two decades, and we expect this to continue given the firm’s earnings diversity, product leadership, powerful distribution channels and strong cross-selling dynamic.
Finally, we added CDW Corporation, a high-volume, low cost distributor of name brand computer hardware, software and accessory products and a provider of value-added services for these products. With $6 billion in sales, the company targets small and medium sized businesses and is the largest such
distributor, controlling about a 5% market share in a highly fragmented industry. CDW has strong cost controls yet provides excellent customer service which keeps customer loyalty high and market share growing. It also has a newly operational distribution facility that will allow the firm to meet customer demand more efficiently. We believe CDW’s diverse product mix and deeply experienced sales force are competitive advantages allowing CDW to gain market share and become a more dominant distributor.
1
the Jensen Portfolio
The Jensen Market Commentary
After hiking interest rates in each of its last seventeen meetings, the Federal Reserve released a kinder and gentler announcement shortly after the Fund’s year end about its battle with inflation. The market’s response was a 200-plus point gain in the Dow Jones Industrial Average; the largest jump in years. However, it was only a one-day response which could easily be credited to at least some temporary relief from the twin rates—inflation and interest—that messed up the market so badly in the second quarter.
In contrast to our domestic market, the Chinese economy has shown some real gusto. Although The Jensen Portfolio does not invest in Chinese companies, Morgan Stanley’s chief economist Steve Roach came up with awesome numbers. China accounted for 50% of the growth in aluminum consumption, 84% of the rise in demand for iron ore, 108% of the increase in consumption of steel, 115% in the growth of worldwide demand for cement, 120% for zinc, and 307% for copper. China’s first quarter gross domestic product steamed along at an increase of 10.3%, and its last month’s industrial production increased 17.9%. With an apology for all these numbers, there was one more. China’s money supply was up 19% in May.
All of this points to one conclusion: that the Dragon has been awakened. But there is a paradox here. Although their economy is hot, the Chinese, like the Japanese, are savers and they own a substantial amount of the United States’ debt.
That leads into the most disturbing news of the quarter. According to Ben Stein in the New York Times, Standard & Poor’s recently issued a warning that if the U.S. government did not change its fiscal policy, Treasury bonds would be downgraded to BBB by 2020 and to junk bond status by 2025. Whatever ramifications this has for the world’s primary reserve currency is beyond our comprehension.
A corporation with a rock solid business franchise creates advantages that all investors can appreciate. By business franchise we do not mean cloning in the sense of opening another McDonald’s or Taco Bell. Rather, we mean a business that has the possession of a product, service or a competitive advantage that is unique to that company. Patents are a classic example of a competitive advantage, although uniqueness can occur in a variety of forms in business.
In our opinion, the significance of a competitive advantage is that it creates the opportunity for a company to maintain a positive cash flow, which is necessary for its survival. And the continuity of a business is not only essential for its owners, the investors, but all the other stakeholders: employees, suppliers, and customers. Perhaps the most important attribute of corporations is their ability to withstand all types of economic weather, be it inflation, depression, war or revolution.
There are times when such companies receive little recognition in the market, of course. By their nature, they often create consistent value for shareholders rather than promising the potential of huge increases in earnings. Thus, the cornerstone of our strategy is that market values and corporate values align themselves over time.
We appreciate your continued support.
Cordially,

Val Jensen, Chairman
The Jensen Portfolio
and
The Jensen Investment Committee
This discussion and analysis of the Fund is as of May 2006 and is subject to change, and any forecasts made cannot be guaranteed.
Past performance is no guarantee of future results. Fund holdings and sector weightings are subject to change and are not recommendations to buy or sell any security. For more complete information regarding performance and holdings, please refer to the financial statements and schedule of investments headings of this report.
The Fund is nondiversified, meaning that it concentrates its assets in fewer individual holdings than a diversified fund and is therefore more exposed to individual stock volatility than a diversified fund.
Free Cash Flow: Is equal to the net income of a company plus depreciation and amortization less capital expenditures.
For use only when preceded or accompanied by a current prospectus for the Fund.
The Jensen Portfolio is distributed by Quasar Distributors, LLC (07/06).
2
the Jensen Portfolio
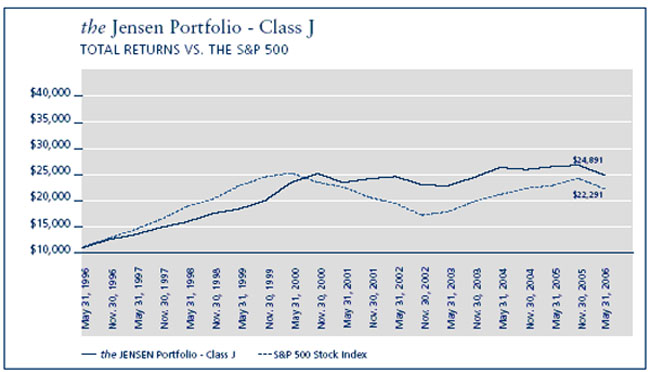
Average Annual - FOR PERIODS ENDED MAY 31, 2006 | ||||
| 1 YEAR | 3 YEARS | 5 YEARS | 1O YEARS | |
the Jensen Portfolio - Class J | 3.30% | 6.21% | 3.13% | 9.55% |
| S&P 500 Stock Index | 8.64% | 11.63% | 1.96% | 8.34% |
The S&P 500 Stock Index is an unmanaged but commonly used measure of common stock total return performance. This chart assumes an initial gross investment of $10,000 made on May 31, 1996 for Class J, the original share class of the fund. Returns shown include the reinvestment of all dividends. Returns shown do not reflect the deduction of taxes that a shareholder would pay on fund distributions or the redemption of fund shares.
Performance data shown represents past performance; Past performance does not guarantee future results. The investment return and principal value of an investment will fluctuate so that an investor’s shares, when redeemed, may be worth more or less than their original cost. Current performance of the fund may be lower or higher than the performance shown. Performance data current to the most recent month end may be obtained by calling 1-800-992-4144 or by visiting www.jenseninvestment.com.
3
the Jensen Portfolio
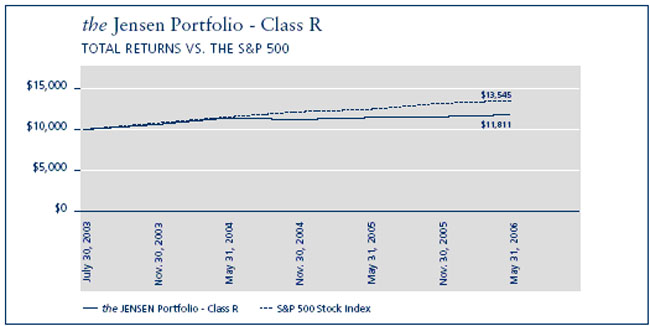
Average Annual - FOR PERIODS ENDED MAY 31, 2006 | ||
| 1 YEAR | SINCE INCEPTION | |
| JULY 30, 2003 | ||
the Jensen Portfolio - Class R | 3.07% | 6.04% |
| S&P 500 Stock Index | 8.64% | 11.26% |
The S&P 500 Stock Index is an unmanaged but commonly used measure of common stock total return performance. This chart assumes an initial gross investment of $10,000 made on July 30, 2003, the inception date for Class R shares. Returns shown include the reinvestment of all dividends. Returns shown do not reflect the deduction of taxes that a shareholder would pay on fund distributions or the redemption of fund shares.
Performance data shown represents past performance; Past performance does not guarantee future results. The investment return and principal value of an investment will fluctuate so that an investor’s shares, when redeemed, may be worth more or less than their original cost. Current performance of the fund may be lower or higher than the performance shown. Performance data current to the most recent month end may be obtained by calling 1-800-992-4144 or by visiting www.jenseninvestment.com.
4
the Jensen Portfolio
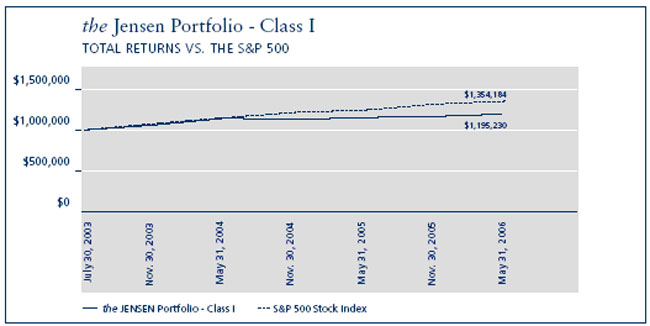
Average Annual - FOR PERIODS ENDED MAY 31, 2006 | ||
| 1 YEAR | SINCE INCEPTION | |
| JULY 30, 2003 | ||
the Jensen Portfolio - Class I | 3.56% | 6.49% |
| S&P 500 Stock Index | 8.64% | 11.26% |
The S&P 500 Stock Index is an unmanaged but commonly used measure of common stock total return performance. This chart assumes an initial gross investment of $1,000,000 made on July 30, 2003, the inception date for Class I shares. Returns shown include the reinvestment of all dividends. Returns shown do not reflect the deduction of taxes that a shareholder would pay on fund distributions or the redemption of fund shares.
Performance data shown represents past performance; Past performance does not guarantee future results. The investment return and principal value of an investment will fluctuate so that an investor’s shares, when redeemed, may be worth more or less than their original cost. Current performance of the fund may be lower or higher than the performance shown. Performance data current to the most recent month end may be obtained by calling 1-800-992-4144 or by visiting www.jenseninvestment.com.
5
the Jensen Portfolio
6
the Jensen Portfolio
Statement of Assets & Liabilities
May 31, 2006
Assets: | ||
| Investments, at value (cost $1,733,206,061) | $ | 2,095,211,877 |
| Income receivable | 3,223,167 | |
| Receivable for capital stock issued | 1,720,242 | |
| Other assets | 83,207 | |
| Total Assets | 2,100,238,493 | |
Liabilities: | ||
| Payable to Investment Adviser | 1,049,114 | |
| Payable to Directors | 33,718 | |
| Payable for capital stock redeemed | 3,028,237 | |
| Other accrued expenses | 1,228,930 | |
| Total Liabilities | 5,339,999 | |
| NET ASSETS | $ | 2,094,898,494 |
| NET ASSETS CONSIST OF: | ||
| Capital stock | 1,791,059,768 | |
| Unrealized appreciation on investments | 362,005,816 | |
| Accumulated undistributed net investment income | 2,967,066 | |
| Accumulated undistributed net realized loss | (61,134,156) | |
| Total Net Assets | $ | 2,094,898,494 |
| NET ASSETS CONSIST OF: | ||
| Class J Shares: | ||
| Net assets | $ | 1,764,211,650 |
| Shares outstanding | 72,379,809 | |
| Net Asset Value Per Share | ||
| (2,000,000,000 shares authorized, $.001 par value) | $24.37 | |
| Class R Shares: | ||
| Net assets | $ | 21,100,192 |
| Shares outstanding | 868,731 | |
| Net Asset Value Per Share | ||
| (1,000,000,000 shares authorized, $.001 par value) | $24.29 | |
| Class I Shares: | ||
| Net assets | $ | 309,586,652 |
| Shares outstanding | 12,700,967 | |
| Net Asset Value Per Share | ||
| (1,000,000,000 shares authorized, $.001 par value) | $24.38 |
SEE NOTES TO FINANCIAL STATEMENTS. 0; 7
the Jensen Portfolio
Schedule of Investments
May 31, 2006
| SHARES | VALUE | |||||
Common Stock 98.36% | ||||||
Beverages 6.18% | ||||||
| 1,070,000 | The Coca-Cola Company | $ | 47,112,100 | |||
| 1,363,000 | PepsiCo, Inc. | 82,406,980 | ||||
| 129,519,080 | ||||||
Capital Markets 4.07% | ||||||
| 1,078,000 | T. Rowe Price Group Inc. | 85,269,800 | ||||
Chemicals 3.04% | ||||||
| 1,643,000 | Ecolab, Inc. | 63,600,530 | ||||
Commercial Banks 2.77% | ||||||
| 875,000 | Wells Fargo & Company | 58,073,750 | ||||
Commercial Services & Supplies 3.87% | ||||||
| 2,247,000 | Equifax, Inc. | 81,071,760 | ||||
Electrical Equipment 5.57% | ||||||
| 1,415,000 | Emerson Electric Co. | 116,765,800 | ||||
Electronic Equipment & Instruments 2.20% | ||||||
| 825,000 | CDW Corporation | 46,142,250 | ||||
Food & Staples Retailing 3.78% | ||||||
| 2,587,000 | Sysco Corporation | 79,110,460 | ||||
Health Care Equipment & Supplies 9.01% | ||||||
| 1,740,000 | Medtronic, Inc. | 87,852,600 | ||||
| 2,300,000 | Stryker Corporation | 100,970,000 | ||||
| 188,822,600 | ||||||
Health Care Providers & Services 3.92% | ||||||
| 2,397,000 | Patterson Companies Inc. (a) | 82,097,250 | ||||
Household Products 11.20% | ||||||
| 780,000 | The Clorox Company | 49,288,200 | ||||
| 1,450,000 | Colgate-Palmolive Company | 87,493,000 | ||||
| 1,803,000 | The Procter & Gamble | |||||
| Company | 97,812,750 | |||||
| 234,593,950 | ||||||
Industrial Conglomerates 10.10% | ||||||
| 1,278,500 | 3M Co. | 106,959,310 | ||||
| 3,056,000 | General Electric Company | 104,698,560 | ||||
| 211,657,870 |
| SHARES | VALUE | |||||
IT Services 11.28% | ||||||
| 1,986,000 | Automatic Data | |||||
| Processing, Inc. | $ | 90,303,420 | ||||
| 1,881,000 | First Data Corporation | 86,732,910 | ||||
| 1,612,000 | Paychex, Inc. | 59,176,520 | ||||
| 236,212,850 | ||||||
Media 10.37% | ||||||
| 2,056,000 | The McGraw-Hill | |||||
| 1,169,500 | Companies, Inc. | 106,089,600 | ||||
| Omnicom Group Inc. | 111,231,145 | |||||
| 217,320,745 | ||||||
Pharmaceuticals 11.00% | ||||||
| 2,116,000 | Abbott Laboratories | 90,353,200 | ||||
| 1,523,000 | Johnson & Johnson | 91,715,060 | ||||
| 2,041,000 | Pfizer Inc. | 48,290,060 | ||||
| 230,358,320 | ||||||
| Total Common Stock | ||||||
| (Cost $1,698,611,199) | 2,060,617,015 |
| PRINCIPAL AMOUNT | ||||||
Short Term Investments 1.65% | ||||||
Commercial Paper 1.65% | ||||||
| $34,570,000 | Prudential Funding, 4.96%, | |||||
| 6/1/2006 | 34,570,000 | |||||
Variable Rate Demand Notes (b) 0.00% | ||||||
| 15,999 | American Family Demand | |||||
| Note, 4.84% | 15,999 | |||||
| 8,863 | Wisconsin Corporate Central | |||||
| Credit Union, 4.78% | 8,863 | |||||
| 24,862 | ||||||
| Total Short Term Investments | ||||||
| (Cost $34,594,862) | 34,594,862 | |||||
| Total Investments—100.01% | ||||||
| (Cost $1,733,206,061) | 2,095,211,877 | |||||
| Liabilities in Excess of Other | ||||||
| Assets—(0.01)% | (313,383) | |||||
| NET ASSETS—100.00% | $2,094,898,494 | |||||
| (a) Non-Income Producing | ||||||
| (b) Variable rate demand notes are considered short-term | ||||||
| obligations and are payable on demand. Interest rates | ||||||
| change periodically on specified dates. The rates shown | ||||||
| are as of May 31, 2006. | ||||||
8 0; SEE NOTES TO FINANCIAL STATEMENTS.
the Jensen Portfolio
Statement of Operations
Year Ended May 31, 2006
Investment Income: | |||
| Dividend income | $43,568,139 | ||
| Interest income | 965,694 | ||
| 44,533,833 | |||
Expenses: | |||
| Investment advisory fees | 13,157,111 | ||
| 12b-1 fees-Class J | 5,768,752 | ||
| Administration fees | 966,945 | ||
| Transfer agent fees and expenses | 425,145 | ||
| Custody fees | 271,042 | ||
| Shareholder servicing fees-Class I | 212,287 | ||
| Reports to shareholders | 210,804 | ||
| Fund accounting fees | 167,666 | ||
| Directors’ fees and expenses | 158,259 | ||
| Federal and state registration fees | 147,607 | ||
| Professional fees | 125,651 | ||
| 12b-1 fees-Class R | 114,629 | ||
| Other | 73,650 | ||
| Total expenses | 21,799,548 | ||
| NET INVESTMENT INCOME | 22,734,285 | ||
| REALIZED AND UNREALIZED GAIN | |||
| ON INVESTMENTS: | |||
| Net realized gain on investment | |||
| transactions | 5,903,020 | ||
| Change in unrealized appreciation | |||
| on investments | 52,872,656 | ||
| Net gain on investments | 58,775,676 | ||
| NET INCREASE IN NET ASSETS RESULTING | |||
| FROM OPERATIONS | $81,509,961 |
| Statements of Changes in | ||||||
| Net Assets | ||||||
| YEAR ENDED | YEAR ENDED | |||||
| MAY 31, ’06 | MAY 31, ’05 | |||||
Operations: | ||||||
| Net investment income | $ | 22,734,285 | $ | 21,056,422 | ||
| Net realized gain (loss) on | ||||||
| investment transactions | 5,903,020 | (51,494,706) | ||||
| Change in unrealized | ||||||
| appreciation on | ||||||
| investments | 52,872,656 | 53,989,222 | ||||
| Net increase in net assets | ||||||
| resulting from operations | 81,509,961 | 23,550,938 | ||||
Capital Shares Transactions: | ||||||
| Shares sold-Class J | 455,075,202 | 1,224,500,116 | ||||
| Shares sold-Class R | 9,197,191 | 30,163,911 | ||||
| Shares sold-Class I | 106,445,423 | 112,803,778 | ||||
| Shares issued to holders | ||||||
| in reinvestment of | ||||||
| dividends-Class J | 17,159,885 | 15,207,731 | ||||
| Shares issued to holders | ||||||
| in reinvestment of | ||||||
| dividends-Class R | 141,934 | 102,198 | ||||
| Shares issued to holders | ||||||
| in reinvestment of | ||||||
| dividends-Class I | 2,546,748 | 2,040,511 | ||||
| Shares redeemed-Class J | (1,439,196,668) | (608,603,947) | ||||
| Shares redeemed-Class R | (12,687,317) | (8,124,061) | ||||
| Shares redeemed-Class I | (94,872,855) | (53,789,230) | ||||
| Net increase (decrease) | (956,190,457) | 714,301,007 |
| DIVIDENDS AND DISTRIBUTIONS | ||||||
| TO SHAREHOLDERS: | ||||||
| Net investment | ||||||
| income-Class J | (19,575,552) | (17,644,045) | ||||
| Net investment | ||||||
| income-Class R | (141,934) | (102,198) | ||||
| Net investment | ||||||
| income-Class I | (3,184,405) | (2,273,338) | ||||
| Total dividends and | ||||||
| distributions | (22,901,891) | (20,019,581) | ||||
| INCREASE (DECREASE) IN | ||||||
| NET ASSETS | (897,582,387) | 717,832,364 | ||||
| NET ASSETS: | ||||||
| Beginning of year | 2,992,480,881 | 2,274,648,517 | ||||
| End of year (including | ||||||
| undistributed net | ||||||
| investment income | ||||||
| of $2,967,066 and | ||||||
| $3,134,672, respectively) | $ | 2,094,898,494 | $ | 2,992,480,881 |
SEE NOTES TO FINANCIAL STATEMENTS. 0; 9
the Jensen Portfolio
Financial Highlights
Class J
| YEAR ENDED | YEAR ENDED | YEAR ENDED | YEAR ENDED | YEAR ENDED | ||||||
| MAY 31, ’06 | MAY 31, ’05 | MAY 31, ’04 | MAY 31, ’03 | MAY 31, ’02 | ||||||
Per Share Data: | ||||||||||
| Net asset value, beginning of year | $ | 23.79 | $ | 23.82 | $ | 20.80 | $ | 22.51 | $ | 21.53 |
Income from investment operations: | ||||||||||
| Net investment income | 0.22 | 0.18 | 0.16 | 0.11 | 0.05 | |||||
| Net realized and unrealized gains (losses) | ||||||||||
| on investments | 0.56 | (0.03)(1) | 3.01 | (1.73) | 1.00 | |||||
| Total from investment operations | 0.78 | 0.15 | 3.17 | (1.62) | 1.05 | |||||
Less distributions: | ||||||||||
| Dividends from net investment income | (0.20) | (0.18) | (0.15) | (0.09) | (0.07) | |||||
| Total distributions | (0.20) | (0.18) | (0.15) | (0.09) | (0.07) | |||||
| Net asset value, end of year | $ | 24.37 | $ | 23.79 | $ | 23.82 | $ | 20.80 | $ | 22.51 |
| Total return | 3.30% | 0.61% | 15.28% | -7.17% | 4.88% | |||||
Supplemental data and ratios: | ||||||||||
| Net assets, end of year (000’s) | $ | 1,764,212 | $ | 2,680,169 | $ | 2,046,288 | $ | 1,453,069 | $ | 473,414 |
| Ratio of expenses to average | ||||||||||
| net assets | 0.85% | 0.85% | 0.88% | 0.90% | 1.00% | |||||
| Ratio of net investment income to | ||||||||||
| average net assets | 0.85% | 0.77% | 0.71% | 0.62% | 0.23% | |||||
| Portfolio turnover rate | 10.20% | 8.81% | 5.32% | 7.22% | 0.78% | |||||
| (1) The amount shown may not correlate with the aggregate gains (losses) of portfolio securities due to timing of | ||||||||||
| subscriptions and redemption of fund shares. | ||||||||||
10 60; SEE NOTES TO FINANCIAL STATEMENTS.
the Jensen Portfolio
Financial Highlights
Class R
| PERIOD FROM | ||||||
| YEAR ENDED | YEAR ENDED | JUL. 30, ‘03(1) | ||||
| MAY 31, ’06 | MAY 31, ’05 | TO MAY 31, ‘04 | ||||
Per Share Data: | ||||||
| Net asset value, beginning of period | $23.71 | $23.76 | $20.93 | |||
Income from investment operations: | ||||||
| Net investment income | 0.14 | 0.14 | 0.13 | |||
| Net realized and unrealized gains (losses) on investments | 0.59 | (0.05)(2) | 2.83 | |||
| Total from investment operations | 0.73 | 0.09 | 2.96 | |||
Less distributions: | ||||||
| Dividends from net investment income | (0.15) | (0.14) | (0.13) | |||
| Total distributions | (0.15) | (0.14) | (0.13) | |||
| Net asset value, end of period | $24.29 | $23.71 | $23.76 | |||
Total return(3) | 3.07% | 0.40% | 14.13% | |||
Supplemental data and ratios: | ||||||
| Net assets, end of period (000’s) | $21,100 | $23,884 | $ 799 | |||
Ratio of expenses to average net assets(4) | 1.10% | 1.10% | 1.12% | |||
Ratio of net investment income to average net assets(4) | 0.60% | 0.54% | 0.45% | |||
Portfolio turnover rate(3) | 10.20% | 8.81% | 5.32% | |||
| (1) Commencement of operations. | ||||
| (2) The amount shown may not correlate with the aggregate gains (losses) of portfolio securities due to timing of | ||||
| subscriptions and redemption of fund shares. | ||||
| (3) Not annualized for periods less than one year. | ||||
| (4) Annualized for periods less than one year. | ||||
SEE NOTES TO FINANCIAL STATEMENTS. &# 160; 11
Financial Highlights
Class I
| PERIOD FROM | ||||||
| YEAR ENDED | YEAR ENDED | JUL. 30, ‘03(1) | ||||
| MAY 31, ’06 | MAY 31, ’05 | TO MAY 31, ‘04 | ||||
Per Share Data: | ||||||
| Net asset value, beginning of period | $23.80 | $23.82 | $20.93 | |||
Income from investment operations: | ||||||
| Net investment income | 0.24 | 0.23 | 0.12 | |||
| Net realized and unrealized gains (losses) on investments | 0.59 | (0.04)(2) | 2.92 | |||
| Total from investment operations | 0.83 | 0.19 | 3.04 | |||
Less distributions: | ||||||
| Dividends from net investment income | (0.25) | (0.21) | (0.15) | |||
| Total distributions | (0.25) | (0.21) | (0.15) | |||
| Net asset value, end of period | $24.38 | $23.80 | $23.82 | |||
Total return(3) | 3.56% | 0.77% | 14.54% | |||
Supplemental data and ratios: | ||||||
| Net assets, end of period | $309,587 | $288,428 | $227,561 | |||
Ratio of expenses to average net assets(4) | 0.67% | 0.67% | 0.70% | |||
Ratio of net investment income to average net assets(4) | 1.03% | 0.95% | 0.87% | |||
Portfolio turnover rate(3) | 10.20% | 8.81% | 5.32% | |||
| (1) Commencement of operations. | ||||
| (2) The amount shown may not correlate with the aggregate gains (losses) of portfolio securities due to timing of | ||||
| subscriptions and redemption of fund shares. | ||||
| (3) Not annualized for periods less than one year. | ||||
| (4) Annualized for periods less than one year. | ||||
12 60; SEE NOTES TO FINANCIAL STATEMENTS.
the Jensen Portfolio
Notes to the Financial Statements
May 31, 2006
1. Organization and Significant Accounting Policies
The Jensen Portfolio, Inc. (the “Fund”) was organized as an Oregon Corporation on April 17, 1992, and is registered as an open-end, nondiversified management investment company under the Investment Company Act of 1940 (the “1940 Act”). The Fund commenced operations on August 3, 1992. Effective July 30, 2003, the Fund issued two new classes of shares, Class R and Class I and renamed the existing class as Class J. Class J shares are subject to a 0.25% 12b-1 fee; Class R shares are subject to a 0.50% 12b-1 fee and Class I shares are subject to a 0.10% shareholder servicing fee, as described in each Class’ prospectus. Each class of shares has identical rights and privileges except with respect to the 12b-1 fees and shareholder servicing fee, and voting rights on matters affecting a single class of shares. The principal investment objective of the Fund is long-term capital appreciation.
The following is a summary of significant accounting policies consistently followed by the Fund. The policies are in conformity with accounting principles generally accepted in the United States of America.
a) Investment Valuation - Securities that are listed on United States stock exchanges or the Nasdaq Stock Market are valued at the last sale price on the day the securities are valued or, if there has been no sale on that day, at their current bid price. Quotations are taken from the market in which the security is primarily traded. Over-the-counter securities are valued at current bid price. Securities for which market quotations are not readily available are valued at fair value as determined by the Investment Adviser at or under the direction of the Fund’s Board of Directors. There were no securities valued by the Board of Directors as of May 31, 2006. Variable rate demand notes are valued at cost which approximates fair value. Notwithstanding the above, fixed-income securities may be valued on the basis of prices provided by an established pricing service when the Board believes that such prices better reflect market values.
b) Federal Income Taxes - No provision for federal income taxes has been made since the Fund has complied to date with the requirements of Subchapter M of the Internal Revenue Code applicable to regulated investment companies and intends to continue to so comply in the future and to distribute substantially all of its net investment income and realized capital gains in order to relieve the Fund from all federal income taxes.
c) Distributions to Shareholders - Dividends to shareholders are recorded on ex-dividend date. Dividends from net investment income are declared and paid quarterly by the Fund. Distributions of net realized capital gains, if any, will be declared and paid at least annually. Income and capital gain distributions are determined in accordance with income tax regulations which may differ from generally accepted accounting principles. Permanent differences between financial reporting and tax are reclassified to capital stock.
d) Use of Estimates - The preparation of financial statements in conformity with accounting principles generally accepted in the United States of America requires management to make estimates and assumptions that affect the reported amounts of assets and liabilities and disclosure of contingent assets and liabilities at the date of the financial statements and the reported amounts of revenues and expenses during the reporting period. Actual results could differ from those estimates.
e) Guarantees and Indemnifications - In the normal course of business the Fund enters into contracts with service providers that contain general indemnification clauses. The Fund’s maximum exposure under these arrangements is unknown as this would involve future claims that may be made against the Fund that have not yet occurred. However, based on experience, the Fund expects the risk of loss to be remote.
f) Other - Investment and shareholder transactions are recorded on trade date. Gains or losses from the investment transactions are determined on the basis of identified carrying value. Dividend income is recognized on the ex-dividend date and interest income is recognized on an accrual basis. The Fund has investments in short-term variable rate demand notes, which are unsecured instruments. These notes may present credit risk to the extent the issuer defaults on its payment obligation. The credit-worthiness of the issuer is monitored, and these notes are considered to present minimal credit risk in the opinion of the Investment Adviser. Income, expenses (other than those deemed attributable to a specific share class), and gains and losses of the Fund are allocated daily to each class of shares based upon the ratio of net assets represented by each class as a percentage of the net assets of the Fund. Expenses deemed directly attributable to a specific class of shares are charged against the operations of such class.
2. Capital Share Transactions
Transactions in shares of the Fund were as follows:
| YEAR ENDED | YEAR ENDED | ||
| May 31, ’06 | MAY 31, ’05 | ||
Class J | |||
| Shares sold | 19,041,206 | 51,799,028 | |
| Shares issued to holders in | |||
| reinvestment of dividends | 717,440 | 639,759 | |
| Shares redeemed | (60,051,647) | (25,682,314) | |
| Net increase (decrease) | (40,293,001) | 26,756,473 | |
| Shares outstanding: | |||
| Beginning of year | 112,672,810 | 85,916,337 | |
| End of year | 72,379,809 | 112,672,810 |
13
| YEAR ENDED | YEAR ENDED | ||
| May 31, ’06 | MAY 31, ’05 | ||
Class R | |||
| Shares sold | 386,312 | 1,312,508 | |
| Shares issued to holders in | |||
| reinvestment of dividends | 5,928 | 4,348 | |
| Shares redeemed | (530,971) | (343,028) | |
| Net increase (decrease) | (138,731) | 973,828 | |
| Shares outstanding: | |||
| Beginning of year | 1,007,462 | 33,634 | |
| End of year | 868,731 | 1,007,462 | |
Class I | |||
| Shares sold | 4,420,414 | 4,746,946 | |
| Shares issued to holders in | |||
| reinvestment of dividends | 106,100 | 85,840 | |
| Shares redeemed | (3,946,669) | (2,265,289) | |
| Net increase | 579,845 | 2,567,497 | |
| Shares outstanding: | |||
| Beginning of year | 12,121,122 | 9,553,625 | |
| End of year | 12,700,967 | 12,121,122 |
3. Investment Transactions
The aggregate purchases and aggregate sales of securities, excluding short-term investments, by the Fund for the year ended May 31, 2006, were $263,523,823 and $1,195,293,128; respectively.
4. Income Taxes
At May 31, 2006, the Fund had accumulated net realized capital loss carryovers of $767,052, $14,029,552, $24,932,611, and $21,396,126 which will expire on May 31, 2010, May 31, 2012, May 31, 2013, and May 31, 2014, respectively. To the extent the Fund realizes future net capital gains, taxable distributions to its shareholders will be offset by any unused capital loss carryover.
The cost of investments differ for financial statement and tax purposes primarily due to differing treatments of wash sales.
The distributions of $20,019,581 and $22,901,891 paid during the years ended May 31, 2005 and May 31, 2006, respectively, were classified as ordinary for income tax purposes.
At May 31, 2006, the cost of investments, net unrealized appreciation (depreciation) and undistributed ordinary income and undistributed long term capital gains for income tax purposes were as follows:
| Cost of investments | $ | 1,733,214,876 |
| Gross unrealized appreciation | 391,640,829 | |
| Gross unrealized depreciation | (29,643,828) | |
| Net unrealized appreciation | $ | 361,997,001 |
| Undistributed ordinary income | $ | 2,967,066 |
| Undistributed long-term capital gain | - | |
| Total distributable earnings | $ | 2,967,066 |
| Other accumulated losses | $ | (61,125,341) |
| Total accumulated earnings | $ | 303,838,726 |
5. Line of Credit
The Fund has a $250 million revolving credit facility for temporary emergency purposes, including the meeting of redemption requests that otherwise might require the untimely disposition of securities. The interest rate on the outstanding principal amount is equal to the prime rate less 1/2%. During the year ended May 31, 2006, the Fund borrowed on the line of credit on twenty-one days, with an average borrowing on those days of $6,567,131.
6. Investment Advisory Agreement
The Fund has entered into an Investment Advisory and Service Contract with Jensen Investment Management, Inc. Pursuant to its advisory agreement with the Fund, the Investment Adviser is entitled to receive a fee, calculated daily and payable monthly, at the annual rate of 0.50% as applied to the Fund’s daily net assets.
Certain officers and directors of the Fund are also officers and directors of the Investment Adviser.
7. Distribution and Shareholder Servicing
The Fund has adopted a distribution and shareholder servicing plan pursuant to Rule 12b-1 under the 1940 Act (the “12b-1 Plan”), which provides that the Fund may reimburse the Fund’s distributor or others at an annual rate of up to 0.25% of the average daily net assets attributable to Class J shares and up to 0.50% of the average daily net assets attributable to Class R shares. Payments under the 12b-1 Plan shall be used to compensate or reimburse the Fund’s distributor or others for services provided and expenses incurred in connection with the sale of shares.
In addition, the Fund has adopted a Shareholder Servicing Plan (the “Servicing Plan”) under which the Fund can pay for shareholder support services from the Fund’s assets pursuant to a Shareholder Servicing Agreement in an amount not to exceed 0.10% of the Fund’s average daily net assets attributable to Class I shares.
14
the Jensen Portfolio
REPORT OF INDEPENDENT REGISTERED PUBLIC ACCOUNTING FIRM
To the Board of Directors and Shareholders of The Jensen Portfolio, Inc.
In our opinion, the accompanying statement of assets and liabilities, including the schedule of investments, and the related statements of operations and of changes in net assets and the financial highlights present fairly, in all material respects, the financial position of The Jensen Portfolio, Inc (the “Fund”) at May 31, 2006, the results of its operations for the year then ended, the changes in its net assets for each of the two years in the period then ended and its financial highlights for the periods presented, in conformity with accounting principles generally accepted in the United States of America. These financial statements and financial highlights (hereafter referred to as “financial statements”) are the responsibility of the Fund’s management; our responsibility is to express an opinion on these financial statements based on our audits. We conducted our audits of these financial statements in accordance with the standards of the Public Company Accounting Oversight Board (United States), which require that we plan and perform the audit to obtain reasonable assurance about whether the financial statements are free of material misstatement. An audit includes examining, on a test basis, evidence supporting the amounts and disclosures in the financial statements, assessing the accounting principles used and significant estimates made by management, and evaluating the overall financial statement presentation. We believe that our audits, which included confirmation of securities at May 31, 2006 by correspondence with the custodian, provide a reasonable basis for our opinion.
PricewaterhouseCoopers LLP
Milwaukee, Wisconsin
July 13, 2006
15
Expense Example - May 31, 2006 (Unaudited)
As a shareholder of The Jensen Portfolio (the “Fund”), you incur ongoing costs, including investment advisory fees, distribution and/or shareholder servicing fees, and other Fund expenses, which are indirectly paid by shareholders. This example is intended to help you understand your ongoing costs (in dollars) of investing in the Fund and to compare these costs with the ongoing costs of investing in other mutual funds. The Example is based on an investment of $1,000 invested at the beginning of the period and held for the entire six month period (December 1, 2005 - May 31, 2006).
Actual Expenses
The first line of the table below for each share class of the Fund provides information about actual account values and actual expenses. However, the table does not include shareholder specific fees, such as the $15.00 fee charged to IRA accounts, or the $12.00 fee charged for wire redemptions. The table also does not include portfolio trading commissions and related trading costs. You may use the information in this line, together with the amount you invested, to estimate the expenses that you paid over the period. Simply divide your account value by $1,000 (for example, an $8,600 account value divided by $1,000 = 8.6), then multiply the result by the number in the first line under the heading entitled “Expenses Paid During Period” to estimate the expenses you paid on your account during this period.
Hypothetical Example for Comparison Purposes
The second line of the table below provides information about hypothetical account values and hypothetical expenses based on the actual expense ratios for each share class of the Fund and an assumed rate of return of 5% per year before expenses, which is not the Fund’s actual return. The hypothetical account values and expenses may not be used to estimate the actual ending account balance or expenses you paid for the period. You may use this information to compare the ongoing costs of investing in the Fund and other funds. To do so, compare this 5% hypothetical example with the 5% hypothetical examples that appear in the shareholder reports of the other funds.
Please note that the expenses shown in the table are meant to highlight your ongoing costs only and do not reflect any transactional costs, such as sales charges (loads), redemption fees, or exchange fees which, although not charged by the Fund, may be charged by other funds. Therefore, the second line of the table is useful in comparing ongoing costs only, and will not help you determine the relative total costs of owning different funds.
Expense Example Tables
The Jensen Portfolio-Class J
| BEGINNING | ENDING | EXPENSES PAID | |||
| ACCOUNT VALUE | ACCOUNT VALUE | DURING PERIOD* | |||
| DECEMBER 1, 2005 | MAY 31, 2006 | DECEMBER 1, 2005 - MAY 31, 2006 | |||
| Actual | $1,000.00 | $1,022.10 | $4.29 | ||
| Hypothetical (5% annual return before expenses) | 1,000.00 | 1,020.69 | 4.28 |
| * Expenses are equal to Class J’s annualized expense ratio of 0.85%, multiplied by the average account value over the period, multiplied by 182/365 to reflect the one-half year period. |
The Jensen Portfolio-Class R
| BEGINNING | ENDING | EXPENSES PAID | |||
| ACCOUNT VALUE | ACCOUNT VALUE | DURING PERIOD* | |||
| DECEMBER 1, 2005 | MAY 31, 2006 | DECEMBER 1, 2005 - MAY 31, 2006 | |||
| Actual | $1,000.00 | $1,021.00 | $5.54 | ||
| Hypothetical (5% annual return before expenses) | 1,000.00 | 1,019.45 | 5.54 |
| * Expenses are equal to Class R’s annualized expense ratio of 1.10%, multiplied by the average account value over the period, multiplied by 182/365 to reflect the one-half year period. |
The Jensen Portfolio-Class I
| BEGINNING | ENDING | EXPENSES PAID | |||
| ACCOUNT VALUE | ACCOUNT VALUE | DURING PERIOD* | |||
| DECEMBER 1, 2005 | MAY 31, 2006 | DECEMBER 1, 2005 - MAY 31, 2006 | |||
| Actual | $1,000.00 | $1,023.40 | $3.38 | ||
| Hypothetical (5% annual return before expenses) | 1,000.00 | 1,021.59 | 3.38 |
| * Expenses are equal to Class I’s annualized expense ratio of 0.67%, multiplied by the average account value over the period, multiplied by 182/365 to reflect the one-half year period. |
16
the Jensen Portfolio
Additional Information (Unaudited)
1. INVESTMENT ADVISORY AGREEMENT DISCLOSURE
Section 15(c) of the 1940 Act requires that a fund’s board of directors, including a majority of those whom are not “interested persons” of the fund or the investment adviser as that term is defined under the 1940 Act (“Independent Directors”) voting separately, review and approve the terms of the fund’s investment advisory agreement on an annual basis.
In its most recent deliberations concerning whether to renew the Fund’s Investment Advisory and Service Agreement (the “Advisory Agreement”) with Jensen Investment Management, Inc. (the “Adviser”), the Fund’s Board of Directors, including the Independent Directors (the “Board”), conducted the review and made the determinations that are described below. During its deliberations, the Board requested from the Adviser, and the Adviser furnished, all information reasonably necessary for it to evaluate the Advisory Agreement.
The entire Board first met on April 13, 2005 to consider the information provided by the Adviser and discuss the proposed renewal of the Advisory Agreement. The Independent Directors met separately with their legal counsel on April 22, 2005 to review the Adviser’s presentation and identify additional information they needed to evaluate the Advisory Agreement. The Independent Directors reconvened in a separate meeting with their legal counsel on July 13, 2005 to consider additional materials provided by the Adviser at their request. The entire Board then met again on July 13, 2005 to consider the continuation of the Advisory Agreement. At those meetings, the Board considered the factors and reached the conclusions described below, among others. The Board did not identify any single factor as controlling. Moreover, not every factor was given the same weight by each director.
Nature, Extent and Quality of Services
The Board of Directors, including the Independent Directors, considered the nature, extent and quality of services provided to the Fund by the Adviser under the Advisory Agreement. The Board reviewed the history of the Adviser, its investment discipline, its investment performance, and its day to day management of the Fund. The Board also noted the Adviser’s increasing focus on the business of the Fund, the recent additions to the Adviser’s staff, the Fund’s low and declining expense ratio and very low turnover rate, and the Adviser’s oversight of the Fund’s service providers. Based on these and other factors, including those referenced below, the Board concluded that the services provided to the Fund were of high quality.
Investment Performance
The Board examined the investment performance of the Fund compared to an appropriate securities index, to appropriate Lipper and Morningstar categories, and to other mutual funds of similar asset size and with similar investment objectives and strategies. Performance over one-, three-, five- and ten-year periods for the Fund was analyzed. The Board noted that the long-term performance of the Fund was good, but that the Fund’s short-term results under-performed its benchmark. The Board found that the Fund’s assets had grown dramatically during the same short-term period, reflecting an attractive fund from a shareholder perspective. In addition, the Board observed that the Adviser had appeared to adhere to its strict, long-term investment discipline. As a result of these and other factors, the Board concluded that the investment performance of the Fund was satisfactory.
Advisory Fees and Expense Ratio
The Board compared the Fund’s advisory fees with those of other comparable mutual funds in the Fund’s peer group. The Board noted that the Fund’s advisory fee of 0.50% was below the average and the median for its Lipper category. The Board also noted that the Fund is a single fund (as opposed to a larger complex of funds) and that, while the Advisor deploys a strict and less complicated investment discipline, the Fund appeared to be an efficiently run operation with a high service component for shareholders. The Board compared the fees charged to the Fund with the advisory fees charged to the non-Fund advisory clients of the Adviser. The Board observed that, with the exception of a few existing clients, the Adviser charges its separate accounts a minimum of 0.50%. The Board considered the Fund’s expense ratio and expense ratios of funds in the Fund’s peer group. The Board noted that the Fund’s expense ratio was below the average and the median for its Lipper category.
Based on these considerations and other factors, the Board concluded that the Fund’s advisory fee and expense ratios were reasonable relative to the Fund’s peer group.
17
the Jensen Portfolio
Profitability of the Adviser
The Board considered the profitability of the Advisory Agreement to the Adviser, including the methodology used to calculate the Adviser’s profitability, and compared the Adviser’s profitability with that of selected publicly traded mutual fund advisers. When adjusted for certain marketing revenues and expenses, it appeared that the Adviser’s pre-tax profit was not significantly higher than the average pre-tax profit margin of the group of publicly traded investment advisory firms. It was noted that the Adviser’s profitability may have been overstated due to the relatively low salaries and bonuses paid to its investment professionals, who receive additional compensation through their equity ownership in the firm. The Board also considered the facts that the Adviser pays certain administrative expenses of the Fund, including certain sub-transfer agency costs and the cost of the Fund’s Chief Compliance Officer, that the Fund had been subsidized by the Adviser for the early years of the Fund’s existence, and that only in the most recent three to four years has the Fund generated profits to any sizable degree for the Adviser. Finally, the Board acknowledged the inherent limitations of profitability analyses, including the incomplete or dissimilar data available and the uncertainty of the various allocations and other assumptions used. Based on this and other information, the Board concluded that profits earned by the Adviser were not excessive.
Economies of Scale
The Board considered whether there have been economies of scales with respect to the management of the Fund, whether the Fund has benefited from any economies of scale, and whether the implementation of breakpoints in the Fund’s advisory fee was appropriate. The Board observed that, during a period of rapid growth, the Fund’s expense ratio had fallen from about 1% for the fiscal year ended May 31, 2002 to 0.86% for the nine months ended February 28, 2005. Regarding the issue of breakpoints, the Board noted that, although some funds in the Fund’s peer group had advisory fee breakpoints below 0.50%, many of these funds were index funds, classes of much larger funds, or funds offered by much larger fund groups. The Board also noted that a number of funds with lower breakpoints had higher overall advisory fees and significantly higher asset levels. Based on the data presented, the Board concluded that a breakpoint in the Fund’s advisory fee was not warranted at this time, but that the issue of breakpoints should be revisited each year.
Other Benefits
The Board considered the potential fall-out benefits realized by the Adviser from services as investment manager of the Fund. The Board noted that the Adviser has no affiliated entities that provide services to the Fund and that the Adviser prohibits the receipt of third-party “soft dollars.” The Board understood that the Adviser’s non-Fund business was approximately 10% of the Adviser’s total business. The Board concluded that, while there might be some benefit to the Adviser’s non-Fund business from the favorable publicity received by the Fund, it was likely not significant.
Other Factors and Considerations
The Board periodically reviews and considers other material information throughout the year relating to the quality of services provided to the Fund, such as allocation of Fund brokerage, if any, to brokers, the Adviser’s management of its relationship with the Fund’s custodian, transfer agent and other service providers, and expenses paid to those third parties. At its regular meetings, the Board also reviews detailed information relating to the Fund’s portfolio and performance, and interviews the Fund’s portfolio managers. Based on its evaluation of all material factors and the information provided to it, the Board of Directors, including all of the Independent Directors, voted unanimously to renew the Advisory Agreement for a one-year period until July 31, 2006.
2. SHAREHOLDER NOTIFICATION OF FEDERAL TAX STATUS
The Fund designates 100% of dividends declared during the fiscal year ended May 31, 2006 as dividends qualifying for the dividends received deduction available to corporate shareholders.
The Fund designates 100% of dividends declared from net investment income during the fiscal year ended May 31, 2006 as qualified dividend income under the Jobs and Growth Tax Relief Reconciliation Act of 2003.
Additional Information Applicable to Foreign Shareholders Only:
The Fund designates 1.91% of ordinary income distributions as interest-related dividends under Internal Revenue Code Section 871(k)(1)(c).
18
3. AVAILABILITY OF PROXY VOTING INFORMATION
Information regarding how the Fund votes proxies relating to portfolio securities is available without charge, upon request by calling toll-free, 1-800-221-4384, or by accessing the SEC’s website at www.sec.gov.
4. PORTFOLIO HOLDINGS
The Jensen Portfolio will file its complete schedule of portfolio holdings with the SEC for the first and third quarters of each fiscal year on Form N-Q. The Fund’s Form N-Q will be available on the EDGAR database on the SEC’s website at www.sec.gov. These Forms may also be reviewed and copied at the SEC’s Public Reference Room in Washington D.C. Information about the operation of the Public Reference Room may be obtained by calling 1-800-SEC-0330.
5. ADDITIONAL DISCLOSURE REGARDING FUND DIRECTORS AND OFFICERS
| Independent Directors | |||||
| # OF | |||||
| PORTFOLIOS | |||||
| TERM OF | PRINCIPAL | IN FUND | OTHER | ||
| POSITION(S) | OFFICE AND | OCCUPATION | COMPLEX | DIRECTORSHIPS | |
| HELD WITH | LENGTH OF | DURING PAST | OVERSEEN | HELD BY | |
| NAME, AGE AND ADDRESS | THE COMPANY | TIME SERVED** | FIVE YEARS | BY DIRECTOR | DIRECTOR |
| Norman W. Achen J.D., 84 | Independent | Indefinite Term; | President of N.W. | 1 | Director of Brentwood |
| The Jensen Portfolio, Inc. | Director | Served since | Achen Professional | Biomedical Research | |
| 2130 Pacwest Center | inception. | Corporation | Institute (1998 - present); | ||
| 1211 SW Fifth Avenue | (1980 - present). | Director of Clinical | |||
| Portland, OR 97204 | Research Administration | ||||
| at V.A. Hospital in | |||||
| Los Angeles, CA | |||||
| (2002 - present). | |||||
| Roger A. Cooke J.D., 57 | Independent | Indefinite Term; | Vice President - Regulatory | 1 | None |
| The Jensen Portfolio, Inc. | Director | since June 1999. | and Legal Affairs of | ||
| 2130 Pacwest Center | Precision Castparts Corp., | ||||
| 1211 SW Fifth Avenue | an investment casting and | ||||
| Portland, OR 97204 | forging company, | ||||
| (2000 - present); | |||||
| Executive Vice President - | |||||
| Regulatory and Legal | |||||
| Affairs of Fred Meyer, Inc., | |||||
| a grocery and general | |||||
| merchandise company, | |||||
| (1992 - 2000). | |||||
19
the Jensen Portfolio
| # OF | |||||
| PORTFOLIOS | |||||
| TERM OF | PRINCIPAL | IN FUND | OTHER | ||
| POSITION(S) | OFFICE AND | OCCUPATION | COMPLEX | DIRECTORSHIPS | |
| HELD WITH | LENGTH OF | DURING PAST | OVERSEEN | HELD BY | |
| NAME, AGE AND ADDRESS | THE COMPANY | TIME SERVED** | FIVE YEARS | BY DIRECTOR | DIRECTOR |
| Robert E. Harold | Independent | Indefinite Term; | Senior Director of | 1 | Director of |
| C.P.A. (Retired), 58 | Director | since | Financial Planning | StoriedLearning, | |
| The Jensen Portfolio, Inc. | September | of Nike, Inc., a footwear | Inc. (2000 - 2003); | ||
| 2130 Pacwest Center | 2000. | and apparel company | Director of St. Mary’s | ||
| 1211 SW Fifth Avenue | (2001 - 2002); Global | Academy, a non- | |||
| Portland, OR 97204 | Brand Controller for Nike, | profit high school | |||
| Inc. (1996, 1997, 2000 - | (2000 - present); | ||||
| 2001); Interim Chief | Director of Laika, Inc. | ||||
| Financial Officer for Nike, | (formerly Will Vinton | ||||
| Inc. (1998 - 1999); Interim | Studios), an animation | ||||
| Chief Executive Officer | studio (2002 - present); | ||||
| for Laika, Inc. (formerly | Director of The | ||||
| Will Vinton Studios), an | Sisters of the Holy | ||||
| animation studio (March | Names Foundation | ||||
| 2005 - October 2005). | (2004 - present). | ||||
| Thomas L. Thomsen, Jr., 62 | Independent | Indefinite Term; | Private rancher and | 1 | None |
| The Jensen Portfolio, Inc. | Director | since | real estate investor | ||
| 2130 Pacwest Center | December 2003 | (2002 - Present); | |||
| 1211 SW Fifth Ave. | Chief Executive Officer | ||||
| Portland, OR 97204 | (2000 - 2002) | ||||
| and President (1998 - | |||||
| 2000) of Columbia Man- | |||||
| agement Company (now | |||||
| called Columbia Manage- | |||||
| ment Advisors, Inc.), | |||||
| investment adviser to the | |||||
| Columbia Funds family of | |||||
| mutual funds and to insti- | |||||
| tutional and individual | |||||
| investors. | |||||
DIRECTOR EMERITUS | |||||
| Louis B. Perry, Ph.D, 88 | Director | Indefinite Term; | Retired | 1 | None |
| The Jensen Portfolio, Inc. | Emeritus | Served since | |||
| 2130 Pacwest Center | inception | ||||
| 1211 SW Fifth Ave. | (at times as | ||||
| Portland, OR 97204 | Director | ||||
| Emeritus). |
20
the Jensen Portfolio
| Interested Directors and Officers | |||||
| # OF | |||||
| PORTFOLIOS | |||||
| TERM OF | PRINCIPAL | IN FUND | OTHER | ||
| POSITION(S) | OFFICE AND | OCCUPATION | COMPLEX | DIRECTORSHIPS | |
| HELD WITH | LENGTH OF | DURING PAST | OVERSEEN | HELD BY | |
| NAME, AGE AND ADDRESS | THE COMPANY | TIME SERVED** | FIVE YEARS | BY DIRECTOR | DIRECTOR |
| Val E. Jensen,* 76 | Director and | Indefinite Term; | Chairman and Director | 1 | None |
| The Jensen Portfolio, Inc. | Chairman | Served as | of Jensen Investment | ||
| 2130 Pacwest Center | Director since | Management, Inc. | |||
| 1211 SW Fifth Avenue | inception; Served as | (1988 - 2004). | |||
| Portland, OR 97204 | President from inception | ||||
| to March 2002; | |||||
| Served as Chairman since | |||||
| March 2002. | |||||
| Gary W. Hibler,* Ph.D., 62 | Director and | Indefinite Term; | President and Director of Jensen | 1 | None |
| Jensen Investment | President | Served as Director since | Investment Management, | ||
| Management, Inc. | inception; Served as | Inc. (1994 - present). | |||
| 2130 Pacwest Center | Secretary from | ||||
| 1211 SW Fifth Avenue | inception to | ||||
| Portland, OR 97204 | March 2002; | ||||
| Served as Treasurer | |||||
| from December 2002 | |||||
| to March 2004; | |||||
| Served as | |||||
| President since | |||||
| March 2002. | |||||
| Robert F. Zagunis,* 52 | Vice President | 1 Year Term; | Vice President and | N/A | N/A |
| Jensen Investment | Served since | Director of Jensen | |||
| Management, Inc. | inception. | Investment Management, | |||
| 2130 Pacwest Center | Inc. (1993 - present). | ||||
| 1211 SW Fifth Avenue | |||||
| Portland, OR 97204 | |||||
| Robert G. Millen,* 59 | Vice President | 1 Year Term; | Vice President and | N/A | N/A |
| Jensen Investment | and Secretary | Served as Vice | Director of Jensen | ||
| Management, Inc. | President from July | Investment Management, | |||
| 2130 Pacwest Center | 2001 to March | Inc. (2000 - present); | |||
| 1211 SW Fifth Avenue | 2002 and since June | Vice President of | |||
| Portland, OR 97204 | 2005; Served as | Principal Financial | |||
| Secretary since | Group, an insurance | ||||
| March 2002. | company (1997 - 2000). | ||||
21
the Jensen Portfolio
| # OF | |||||
| PORTFOLIOS | |||||
| TERM OF | PRINCIPAL | IN FUND | OTHER | ||
| POSITION(S) | OFFICE AND | OCCUPATION | COMPLEX | DIRECTORSHIPS | |
| NAME, AGE AND | HELD WITH | LENGTH OF | DURING PAST | OVERSEEN | HELD BY |
| ADDRESS | THE COMPANY | TIME SERVED** | FIVE YEARS | BY DIRECTOR | DIRECTOR |
| Brian S. Ferrie,* 47 | Treasurer | 1 Year Term; | Director of Finance and | N/A | N/A |
| Jensen Investment | and | Served since | Chief Compliance Officer | ||
| Management, Inc. | Chief | March 2004. | for Jensen Investment | ||
| 2130 Pacwest Center | Compliance | Management, Inc. | |||
| 1211 SW Fifth Avenue | Officer | (2003 - present); Vice | |||
| Portland, OR 97204 | President and CFO of | ||||
| Berger Financial Group | |||||
| LLC (2001 - 2003); Vice | |||||
| President and Chief | |||||
| Compliance Officer | |||||
| of Berger Financial Group | |||||
| LLC (1994 - 2001). | |||||
| * | This individual is an “interested person” of the Fund within the meaning of the 1940 Act. | ||
| ** | Each Director serves for an indefinite term in accordance with the Bylaws of the Fund until the date a Director resigns, | ||
| retires or is removed in accordance with the Bylaws of the Fund. | |||
22
Investment Adviser | ||||
| Jensen Investment Management, Inc. | ||||
| 2130 Pacwest Center | ||||
| 1211 SW Fifth Avenue | ||||
| Portland, OR 97204-3721 | ||||
| 800.992.4144 | ||||
| www.jenseninvestment.com | ||||
Fund Administrator, | ||||
Transfer Agent, | ||||
and Fund Accountant | ||||
| U.S. Bancorp Fund Services, LLC | ||||
| 615 East Michigan Street | ||||
| Milwaukee, WI 53202 | ||||
Custodian | ||||
| U.S. Bank, N.A. | ||||
| Custody Operations | ||||
| 1555 N. River Center Drive | ||||
| Suite 302 | ||||
| Milwaukee, WI 53212 | ||||
Legal Counsel | ||||
| Stoel Rives LLP | ||||
| Standard Insurance Center | ||||
| 900 SW Fifth Avenue | ||||
| Suite 2300 | ||||
| Portland, OR 97204-1268 | ||||
Independent Registered | ||||
Public Accounting Firm | ||||
| PricewaterhouseCoopers LLP | ||||
| 100 East Wisconsin Avenue | ||||
| Suite 1800 | ||||
| Milwaukee, WI 53202 | ||||
Distributor | ||||
| Quasar Distributors, LLC | ||||
| 615 East Michigan Street | ||||
| Milwaukee, WI 53202 | ||||
| This report has been prepared for | ||||
| shareholders and may be distributed | ||||
| to others only if preceded or | ||||
| accompanied by a current prospectus. |
Item 2. Code of Ethics.
The registrant has adopted a code of ethics that applies to the registrant’s principal executive officer and principal financial officer. The registrant has not made any amendments to its code of ethics during the period covered by this report. The registrant has not granted any waivers from any provisions of the code of ethics during the period covered by this report. A copy of the registrant’s Code of Ethics has previously been filed.
Item 3. Audit Committee Financial Expert.
The registrant’s board of directors has determined that there is at least one audit committee financial expert serving on its audit committee. Robert E. Harold, CPA (Retired), is the “audit committee financial expert” and is considered to be “independent” as each term is defined in Item 3 of Form N-CSR.
Item 4. Principal Accountant Fees and Services.
The registrant has engaged its principal accountant to perform audit services, audit-related services, tax services and other services during the past two fiscal years. “Audit services” refer to performing an audit of the registrant's annual financial statements or services that are normally provided by the accountant in connection with statutory and regulatory filings or engagements for those fiscal years. “Audit-related services” refer to the assurance and related services by the principal accountant that are reasonably related to the performance of the audit. “Tax services” refer to professional services rendered by the principal accountant for tax compliance, tax advice, and tax planning. There were no “other services” provided by the principal accountant during the last two fiscal years ended May 31, 2006 and 2005. The following table details the aggregate fees billed or expected to be billed for each of the last two fiscal years for audit fees, audit-related fees, tax fees and other fees by the principal accountant.
| FYE 5/31/06 | FYE 5/31/05 | |
| Audit Fees | $29,850 | $27,900 |
| Audit-Related Fees | 0 | 0 |
| Tax Fees | 0 | 0 |
| All Other Fees | 0 | 0 |
The audit committee has adopted pre-approval policies and procedures that require the audit committee to pre-approve all audit and non-audit services of the registrant, including services provided to any entity affiliated with the registrant. All of the principal accountant’s hours spent on auditing the registrant’s financial statements were attributed to work performed by full-time permanent employees of the principal accountant.
The following table indicates the non-audit fees billed or expected to be billed by the registrant’s accountant for services to the registrant and to the registrant’s investment adviser (and any other controlling entity, etc.—not sub-adviser) for the last two years. The audit committee of the board of directors has considered whether the provision of non-audit services that were rendered to the registrant's investment adviser is compatible with maintaining the principal accountant's independence in its audit of the Registrant and has concluded that the provision of such non-audit services by the accountant has not compromised the accountant’s independence.
| Non-Audit Related Fees | FYE 5/31/06 | FYE 5/31/05 |
| Registrant | $0 | $0 |
| Registrant’s Investment Adviser | $29,376 | $34,718 |
Item 5. Audit Committee of Listed Registrants.
Not applicable to registrants who are not listed issuers (as defined in Rule 10A-3 under the Securities Exchange Act of 1934).
Item 6. Schedule of Investments.
Schedule of Investments is included as part of the report to shareholders filed under Item 1 of this Form.
Item 7. Disclosure of Proxy Voting Policies and Procedures for Closed-End Management Investment Companies.
Not applicable to open-end investment companies.
Item 8. Portfolio Managers of Closed-End Management Investment Companies.
Not applicable to open-end investment companies.
Item 9. Purchases of Equity Securities by Closed-End Management Investment Company and Affiliated Purchasers.
Not applicable to open-end investment companies.
Item 10. Submission of Matters to a Vote of Security Holders.
Not Applicable.
Item 11. Controls and Procedures.
| (a) | The Registrant’s President/Chief Executive Officer and Treasurer/Chief Financial Officer have reviewed the Registrant's disclosure controls and procedures (as defined in Rule 30a-3(c) under the Investment Company Act of 1940 (the “Act”)) as of a date within 90 days of the filing of this report, as required by Rule 30a-3(b) under the Act and Rules 13a-15(b) or 15d-15(b) under the Securities Exchange Act of 1934. Based on their review, such officers have concluded that the disclosure controls and procedures are effective in ensuring that information required to be disclosed in this report is appropriately recorded, processed, summarized and reported and made known to them by others within the Registrant and by the Registrant’s service provider. |
| (b) | There were no changes in the Registrant's internal control over financial reporting (as defined in Rule 30a-3(d) under the Act) that occurred during the Registrant's last fiscal half-year that has materially affected, or is reasonably likely to materially affect, the Registrant's internal control over financial reporting. |
Item 12. Exhibits.
| (a) | (1) Any code of ethics or amendment thereto, that is subject of the disclosure required by Item 2, to the extent that the registrant intends to satisfy Item 2 requirements through filing an exhibit. Incorporated by reference to the Registrant’s Form N-CSR filed August 9, 2004. |
(2) Certifications pursuant to Section 302 of the Sarbanes-Oxley Act of 2002. Filed herewith.
(3) Any written solicitation to purchase securities under Rule 23c-1 under the Act sent or given during the period covered by the report by or on behalf of the registrant to 10 or more persons. Not applicable to open-end investment companies.
| (b) | Certification pursuant to Section 906 of the Sarbanes-Oxley Act of 2002. Furnished herewith. |
SIGNATURES
Pursuant to the requirements of the Securities Exchange Act of 1934 and the Investment Company Act of 1940, the registrant has duly caused this report to be signed on its behalf by the undersigned, thereunto duly authorized.
(Registrant) The Jensen Portfolio, Inc.
By (Signature and Title) /s/ Gary Hibler
Gary Hibler, President
Date 8/2/06
Pursuant to the requirements of the Securities Exchange Act of 1934 and the Investment Company Act of 1940, this report has been signed below by the following persons on behalf of the registrant and in the capacities and on the dates indicated.
By (Signature and Title) /s/ Gary Hibler
Gary Hibler, President
Date 8/2/06
By (Signature and Title) /s/ Brian Ferrie
Brian Ferrie, Treasurer
Date 8/2/06