UNITED STATES
SECURITIES AND EXCHANGE COMMISSION
Washington, D.C. 20549
FORM N-CSR
CERTIFIED SHAREHOLDER REPORT OF REGISTERED
MANAGEMENT INVESTMENT COMPANIES
Investment Company Act file number 811-6653
The Jensen Portfolio, Inc.
(Exact name of registrant as specified in charter)
5300 Meadows Road, Suite 250
Lake Oswego, OR 97035-8234
(Address of principal executive offices) (Zip code)
Robert McIver
5300 Meadows Road, Suite 250
Lake Oswego, OR 97035-8234
(Name and address of agent for service)
(800) 221-4384
Registrant's telephone number, including area code
Date of fiscal year end: May 31
Date of reporting period: May 31, 2014
Item 1. Reports to Stockholders.

Letter from The Investment Adviser
Dear Fellow Shareholders,
The Jensen Quality Growth Fund -- Class J Shares -- returned 17.57% for the year ended May 31, 2014, compared to a return of 20.45% for the Standard & Poor’s 500 Index over this period. Please see pages 4 through 6 of this report for complete standardized performance information for the Fund.
Market Perspective
After very strong returns over most of the past two fiscal years, the U.S. stock market is off to a slower start in 2014. We believe the market is digesting a change in two important investment themes. The first is the recent pivot in U.S. Fed policy away from the historically easy monetary policy over the past five years. Also, while we maintain our view that economic growth in emerging markets has remained a long-term fundamental growth driver, currency devaluations in several emerging economies and mixed signals from China have become headwinds to earnings and market sentiment in recent periods.
The Effect at Jensen
During the fiscal year, specific stock selection slightly added value in the Information Technology sector, while detracting from returns primarily in the Health Care sector. From a sector perspective, our lack of presence in the Utilities and Telecom Services sectors added value. Our underweighting in the Financials sector contributed to returns, while our overweighting in the Consumer Staples sector detracted from returns, as both of these sectors underperformed the broader market over the twelve months.
Our top contributors to performance for the fiscal year were 3M, Cognizant Technology Solutions, United Technologies and Oracle. These companies represent the Information Technology and Industrials sectors, two of the best performing sectors in the Fund as well as in the broader market. The higher growth characteristics of the Information Technology sector were rewarded while the Industrials sector appeared to shrug off short term concerns about cyclical performance, allowing for strong market performance during the fiscal year. With the exception of Cognizant Technology Solutions, these companies represent some of the Funds’ largest holdings and we believe that solid growth should continue for these businesses as they are well positioned within their respective industries.
Significant detractors from the Fund’s performance for the fiscal year included C.H. Robinson, Laboratory Corporation of America and Abbott Laboratories. As noted below, these positions were ultimately liquidated from the Fund.
We are constantly evaluating the businesses in the Fund as well as other investment candidates to determine whether better opportunities exist in our investable universe. Such determinations ultimately reflect a combination of fundamental considerations as well as valuation opportunities.
Fund Additions and Eliminations
As noted earlier, Jensen sold Laboratory Corporation of America, C.H. Robinson Worldwide and Abbott Laboratories during this period. Additionally, Jensen sold Adobe Systems.
During July 2013, the Adviser’s Investment Committee decided to sell the Fund’s entire position in Laboratory Corporation of America (Labcorp) and deploy the proceeds to other positions across the Fund. We made the decision to sell Labcorp for several reasons, the most important of which was pricing pressure from its government customers. We anticipated some of this pressure during our initial due diligence but the degree of pricing headwinds exceeded our original expectations. Additionally, lab testing utilization slowed as commercial health insurance plans require more out-of-pocket expenses for plan members. We still believe that Labcorp is a quality business and one that we will continue to monitor closely. However, uncertainties surrounding both price and volume currently facing the company are not consistent with the quality attributes we require of our Fund holdings.
In March 2014 the Investment Committee decided to sell the entire position in C.H. Robinson (CHRW) from the Fund. Our original investment thesis centered on the company’s high profitability, large network effect, good track record of growth through challenging economic environments, and strong pricing power. Over the last two years, the company has faced numerous challenges, economic and strategic, leading to erosion in their competitive advantages. Reflecting these concerns, we had reduced our allocation to CHRW, and at the time of sale, the company was the smallest weighting in the portfolio.
At Jensen, we tend to be patient with companies provided that their fundamental characteristics remain strong. However, for CHRW, ongoing weakness in the company’s underlying markets, combined with increased competitive pressures and reduced pricing power with customers created numerous challenges that we believe are unlikely to let up in the near term. The proceeds from the sale were allocated to other names in the Fund, where some existing positions were adjusted to reflect the team’s conviction around fundamentals and valuation.
| | |
| Annual Report | Jensen Quality Growth Fund | 1 |
In April 2014, the Investment Committee liquidated our position in Abbott Laboratories (Abbott) as the company posted a Return on Equity percentage below 15% in fiscal 2013 and thus no longer qualified for our investable universe. In early 2013, the company executed a spin-off of its proprietary pharmaceutical business into a new company called AbbVie. A byproduct of that transaction was a material change in the company’s capital structure as the company assigned most of its legacy debt to AbbVie while retaining much of its legacy equity at Abbott. As a result, net income at Abbott declined in fiscal 2013, due to the loss of the proprietary pharmaceutical business, at a much faster rate than that of the company’s equity balance. At the date of the sale, Abbott was the smallest holding in the Portfolio.
The Investment Committee decided to sell Adobe Systems from the Fund during the latter part of 2013 and replace it with DuPont. Adobe is transitioning its business to a subscription model which will result in significantly lower earnings for a number of years. Although this change appears to be a long term positive for the business, the transition excludes the company from qualifying for the Jensen Quality Universe as the company breached our 15% Return on Equity requirement in fiscal 2013. On a positive note, the stock outperformed the overall market, providing us with a good opportunity to exit our position at a high valuation, realize profits, and invest the proceeds into what we believe are better long-term opportunities for the Fund.
DuPont is a globally diversified science and technology driven company that manufactures some of the most advanced materials in the world. We believe the company’s competitive advantages include economies of scale, innovation, strong brands, and high barriers to entry. In our estimation, DuPont is very good at creating innovative products based on its strong science and research competency. We believe coupling this advantage with the ability to productize these innovations via scale and strong brand management can enable the company to realize strong business returns. The company is focused on long-term growth drivers we find attractive: feeding the world, reducing dependence on fossil fuels, and keeping people and the environment safe. Just as we focus on the long term, we believe these are major opportunities for which DuPont is uniquely positioned to address for a sustainably long time.
We believe DuPont has an excellent management team. The company has been under the helm of CEO Ellen Kullman since 2009. While it was a challenging time to take control of a large corporation, we believe she and her team have successfully demonstrated the ability to navigate the company through difficult global economic conditions.
Over the past several years, the company restructured its operations and divested one slow growth, low profit business, resulting in a much stronger company, in our opinion. Financials have improved in recent years as evidenced by the increase in Return on Equity from 24.2% in fiscal 2008 to 35.5% in fiscal 2012. We decided to add DuPont to the Fund following the announced sale of the company’s volatile titanium dioxide and refrigerant businesses. The spin-off of these commodity-like businesses is expected to occur in the next 12-15 months and should result in higher, more stable growth going forward.
The Jensen Outlook
Over the last few quarters, the U.S. economy has been more self-sustaining with the appearance of more positive data points. At the same time, the economy cannot be said to be in a solid, or consistent, growth period. In fact, the most recent report of US Gross Domestic Product (GDP) growth was revised down to a negative 2.9% for the first quarter of 2014, hardly a data point that suggests sound economic growth, although tough weather conditions in much of the country certainly had an impact. The Eurozone concerns have not changed dramatically and much of the continent is still struggling for economic growth. Global GDP continues to be seen as historically weak, and emerging markets such as China continue to experience rising inflation and slowing exports. Geopolitical concerns exist, whether in Ukraine earlier this year or Iraq more recently, although the market seems to have shrugged such concerns off.
Closer to home, the companies held in the Jensen Quality Growth Fund reported incremental positive strength in their businesses during the most recently announced quarter despite some short term headwinds. Calendar 2014’s first quarter results included negative currency effects for several of Jensen’s businesses, due to the strength of the U.S. Dollar as well as weakening emerging market growth trends. We believe these currency headwinds are cyclical and short term in nature and do not diminish the fundamental strength of the portfolio businesses. While we are carefully monitoring the growth slowdown that is currently taking place in some emerging economies, we believe that emerging markets remain an important long-term growth opportunity, and many of the portfolio companies have deeply embedded business models and maintain strong market share in these strategically important economies.
In recent weeks the Investment Committee evaluated the current positions’ weightings and made adjustments with an extra focus on reducing cyclical risk in the portfolio. Given our view that interest rates are likely to increase, the Fed’s moves to add to their balance sheet
| | |
| 2 | Jensen Quality Growth Fund | Annual Report |
at a decreasing rate, and acknowledging the strong performance from the last two fiscal years, we believe this is the time to focus on solid, fundamentally strong businesses that maintain consistent earnings and whose management teams strategically use free cash flows to the benefit of their shareholders. We maintain our conviction that owning long term investments driven by strong business fundamentals can benefit patient investors.
Concerns remain about the ability of companies to grow revenues and earnings in the current global environment. There has also been considerable concern about revenue growth in recent years. It is worth noting then, that the companies in the Fund have produced revenue and earnings that we believe are indicative of the inherent strengths these businesses possess. Organic revenue growth ranged between 4.7% and 6.3% for the last eight quarters and earnings have risen nearly 6.7% per quarter on average over the same period. We believe steady results such as these represent a solid foundation for our companies.
We believe that investment in quality growth businesses can be an important component to every investor’s portfolio. Business performance for these companies continues to be supported by competitive advantages, strong balance sheets, robust free cash generation, and consistently high returns on capital. We believe such attributes should allow these companies to continue to produce consistent earnings growth despite an unpredictable macro environment. We favor these high quality companies due to their ability to use internally generated cash to fund future growth initiatives while simultaneously increasing dividend payments and repurchasing shares. We also believe the consistency of high quality business models can provide a measure of downside protection for investors, particularly if the US economy fails to grow in a more robust manner.
We invite you to seek additional information about The Jensen Quality Growth Fund at www.jenseninvestment.com where additional content, including updated holdings and performance information, is available. We take our investment responsibilities seriously and appreciate the trust you have placed in us. As always, we welcome your feedback.
Sincerely,
The Jensen Investment Committee
Unless otherwise noted, this discussion and analysis of the Fund is as of May 31, 2014 and is subject to change, and any forecasts made cannot be guaranteed. Past performance is no guarantee of future results. Fund holdings and sector weightings are subject to change and are not recommendations to buy or sell any security. The S&P 500 Stock Index is an unmanaged but commonly used measure of common stock total return performance. One cannot invest directly in an index. For more complete information regarding performance and holdings, please refer to the financial statements and schedule of investments headings of this report. Current and future portfolio holdings are subject to risk. Mutual fund investing involves risk, and principle loss is possible. The Fund is nondiversified, meaning that it may concentrate its assets in fewer individual holdings than a diversified fund and is therefore more exposed to individual stock volatility than a diversified fund. Return on Equity: Is equal to a company’s after-tax earnings (excluding non-recurring items) divided by its average stockholder equity for the year. Return on Capital measures how effectively a company uses the money (borrowed or owned) invested in its operations. Free Cash Flow: Is equal to the after-tax net income of a company plus depreciation and amortization less capital expenditures. For use only when preceded or accompanied by a current prospectus for the Fund. The Jensen Quality Growth Fund is distributed by Quasar Distributors, LLC. |
| | |
| Annual Report | Jensen Quality Growth Fund | 3 |
Jensen Quality Growth Fund - Class J (Unaudited)
Total Returns vs. The S&P 500
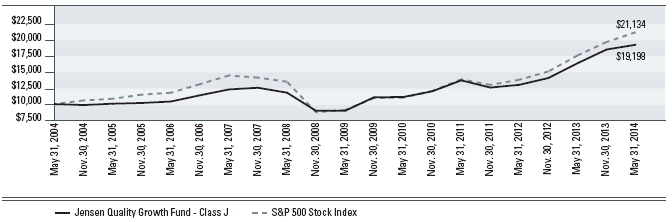
| Average Annual Returns – For periods ended May 31, 2014 | | 1 year | | | 3 years | | | 5 years | | | 10 years | |
| Jensen Quality Growth Fund - Class J | | 17.57% | | | 11.97% | | | 16.48% | | | 6.74% | |
| S&P 500 Stock Index | | 20.45% | | | 15.15% | | | 18.40% | | | 7.77% | |
The S&P 500 Stock Index is an unmanaged but commonly used measure of common stock total return performance. This chart assumes an initial gross investment of $10,000 made on May 31, 2004 for Class J. Returns shown include the reinvestment of all dividends. Returns shown do not reflect the deduction of taxes that a shareholder would pay on fund distributions or the redemption of fund shares.
Performance data shown represents past performance; Past performance does not guarantee future results. The investment return and principal value of an investment will fluctuate so that an investor’s shares, when redeemed, may be worth more or less than their original cost. Current performance of the fund may be lower or higher than the performance shown. Performance data current to the most recent month end may be obtained by calling 1-800-992-4144 or by visiting www.jenseninvestment.com.
| | |
| 4 | Jensen Quality Growth Fund | Annual Report |
Jensen Quality Growth Fund - Class R (Unaudited)
Total Returns vs. The S&P 500
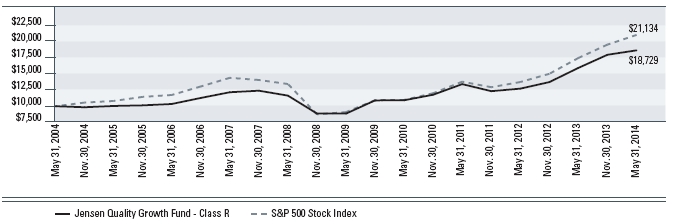
| Average Annual Returns – For periods ended May 31, 2014 | | 1 year | | | 3 years | | | 5 years | | | 10 years | |
| Jensen Quality Growth Fund - Class R | | 17.13% | | | 11.65% | | | 16.19% | | | 6.48% | |
| S&P 500 Stock Index | | 20.45% | | | 15.15% | | | 18.40% | | | 7.77% | |
The S&P 500 Stock Index is an unmanaged but commonly used measure of common stock total return performance. This chart assumes an initial gross investment of $10,000 made on May 31, 2004 for Class R. Returns shown include the reinvestment of all dividends. Returns shown do not reflect the deduction of taxes that a shareholder would pay on fund distributions or the redemption of fund shares.
Performance data shown represents past performance; Past performance does not guarantee future results. The investment return and principal value of an investment will fluctuate so that an investor’s shares, when redeemed, may be worth more or less than their original cost. Current performance of the fund may be lower or higher than the performance shown. Performance data current to the most recent month end may be obtained by calling 1-800-992-4144 or by visiting www.jenseninvestment.com.
| | |
| Annual Report | Jensen Quality Growth Fund | 5 |
Jensen Quality Growth Fund - Class I (Unaudited)
Total Returns vs. The S&P 500
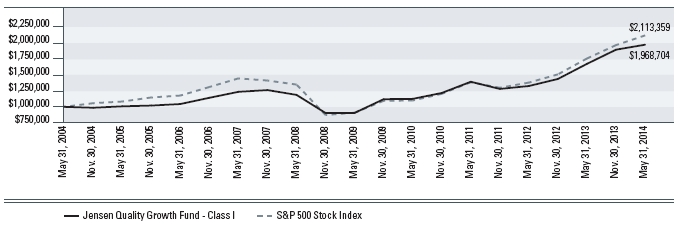
| Average Annual Returns – For periods ended May 31, 2014 | | 1 year | | | 3 years | | | 5 years | | | 10 years | |
| Jensen Quality Growth Fund - Class I | | 17.87% | | | 12.28% | | | 16.82% | | | 7.01% | |
| S&P 500 Stock Index | | 20.45% | | | 15.15% | | | 18.40% | | | 7.77% | |
The S&P 500 Stock Index is an unmanaged but commonly used measure of common stock total return performance. This chart assumes an initial gross investment of $1,000,000 made on May 31, 2004 for Class I. Returns shown include the reinvestment of all dividends. Returns shown do not reflect the deduction of taxes that a shareholder would pay on fund distributions or the redemption of fund shares.
Performance data shown represents past performance; Past performance does not guarantee future results. The investment return and principal value of an investment will fluctuate so that an investor’s shares, when redeemed, may be worth more or less than their original cost. Current performance of the fund may be lower or higher than the performance shown. Performance data current to the most recent month end may be obtained by calling 1-800-992-4144 or by visiting www.jenseninvestment.com.
| | |
| 6 | Jensen Quality Growth Fund | Annual Report |
Investments by Sector as of May 31, 2014
(as a Percentage of Total Investments) (Unaudited)
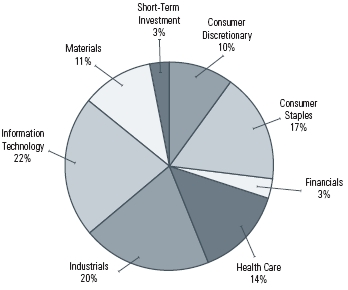
The Global Industry Classification Standard (GICS®) was developed by and/or is the exclusive property of MSCI, Inc. and Standard & Poor Financial Services LLC (“S&P”). GICS is a service mark of MSCI and S&P and has been licensed for use by U.S. Bancorp Fund Services, LLC.
| | |
| Annual Report | Jensen Quality Growth Fund | 7 |
Statement of Assets & Liabilities
Year Ended May 31, 2014
| Assets: | |
| Investments, at value (cost $3,363,873,585) | $5,312,805,994 |
| Cash | 40,271 |
| Income receivable | 9,090,560 |
| Receivable for capital stock issued | 6,271,908 |
| Other assets | 111,416 |
| Total assets | 5,328,320,149 |
| |
| Liabilities: | |
| Payable to Investment Adviser | 2,351,964 |
| Payable for capital stock redeemed | 4,274,321 |
| Accrued distribution fees | 971,419 |
| Accrued director fees | 58,265 |
| Accrued expenses and other liabilities | 1,115,019 |
| Total liabilities | 8,770,988 |
| Total Net Assets | $5,319,549,161 |
| |
| Net Assets Consist of: | |
| Capital stock | 3,183,069,062 |
| Accumulated undistributed net investment income | 8,329,016 |
| Accumulated net realized gain | 179,218,674 |
| Unrealized appreciation on investments | 1,948,932,409 |
| Total Net Assets | $5,319,549,161 |
| |
| Net Assets Consist of: | |
| Class J Shares | |
| Net Assets | $2,447,876,435 |
| Shares outstanding | 63,860,437 |
| Net Asset Value - Offering Price and Redemption Price Per Share (2,000,000,000 shares authorized, $.001 par value) | $38.33 |
| |
| Class R Shares | |
| Net Assets | $50,478,456 |
| Shares outstanding | 1,322,660 |
| Net Asset Value - Offering Price and Redemption Price Per Share (1,000,000,000 shares authorized, $.001 par value) | $38.16 |
| |
| Class I Shares | |
| Net Assets | $2,821,194,270 |
| Shares outstanding | 73,566,875 |
| Net Asset Value - Offering Price and Redemption Price Per Share (1,000,000,000 shares authorized, $.001 par value) | $38.35 |
The accompanying notes are an integral part of these financial statements.
| | |
| 8 | Jensen Quality Growth Fund | Annual Report |
Schedule of Investments
May 31, 2014 (showing percentage of total net assets)
Common Stocks - 96.66%
| shares | | Aerospace & Defense - 4.56% | | value |
| 2,088,000 | | United Technologies Corporation | $242,667,360 |
| |
| shares | | Air Freight & Logistics - 3.95% | | value |
| 2,025,000 | | United Parcel Service, Inc. - Class B | $210,357,000 |
| |
| shares | | Beverages - 8.51% | | value |
| 3,980,000 | | The Coca-Cola Company | $162,821,800 |
| 3,280,000 | | PepsiCo, Inc. | $289,722,400 |
| | | $452,544,200 |
| |
| shares | | Capital Markets - 2.52% | | value |
| 1,644,000 | | T. Rowe Price Group, Inc. | $134,035,320 |
| |
| shares | | Chemicals - 10.77% | | value |
| 1,901,000 | | Ecolab, Inc. | $207,570,190 |
| 1,592,000 | | EI du Pont de Nemours & Company | $110,341,520 |
| 1,928,000 | | Praxair, Inc. | $254,958,720 |
| | | $572,870,430 |
| |
| shares | | Electrical Equipment - 3.15% | | value |
| 2,512,000 | | Emerson Electric Company | $167,625,760 |
| |
| shares | | Electronic Equipment, Instruments &
Components - 2.82% | | value |
| 1,564,000 | | Amphenol Corporation - Class A | $149,831,200 |
| |
| shares | | Health Care Equipment & Supplies -
11.62% | | value |
| 2,412,000 | | Becton Dickinson & Company | $283,892,400 |
| 3,326,000 | | Medtronic, Inc. | $202,985,780 |
| 1,594,000 | | Varian Medical Systems, Inc. (a) | $131,425,300 |
| | | $618,303,480 |
| | | | |
| shares | | Household Products - 8.44% | | value |
| 3,859,000 | | Colgate-Palmolive Company | $263,955,600 |
| 2,289,000 | | The Procter & Gamble Company | $184,928,310 |
| | | $448,883,910 |
| |
| shares | | Industrial Conglomerates - 5.06% | | value |
| 1,889,000 | | 3M Company | $269,276,950 |
| |
| shares | | IT Services - 11.27% | | value |
| 3,037,000 | | Accenture PLC Class A (b) | $247,363,650 |
| 2,788,000 | | Automatic Data Processing, Inc. | $222,147,840 |
| 2,674,000 | | Cognizant Technology Solutions Corporation - | |
| | Class A (a) | $129,983,140 |
| | | $599,494,630 |
| |
| shares | | Life Sciences Tools & Services - 2.52% | | value |
| 1,337,000 | | Waters Corporation (a) | $133,913,920 |
| |
| shares | | Media - 3.36% | | value |
| 2,514,000 | | Omnicom Group, Inc. | $178,871,100 |
| |
| shares | | Professional Services - 3.40% | | value |
| 2,558,000 | | Equifax, Inc. | $181,080,820 |
| |
| shares | | Software - 8.14% | | value |
| 5,074,000 | | Microsoft Corporation | $207,729,560 |
| 5,362,000 | | Oracle Corporation | $225,311,240 |
| | | $433,040,800 |
| |
| shares | | Specialty Retail - 3.49% | | value |
| 3,408,000 | | TJX Companies, Inc. | $185,565,600 |
The accompanying notes are an integral part of these financial statements.
| | |
| Annual Report | Jensen Quality Growth Fund | 9 |
Schedule of Investments continued
May 31, 2014 (showing percentage of total net assets)
| | Textiles, Apparel & Luxury Goods - |
| shares | | 3.08% | | value |
| 2,128,000 | | NIKE, Inc. - Class B | $163,664,480 |
| |
| Total Common Stocks | | value |
| (Cost $3,193,094,551) | $5,142,026,960 |
| |
| Short-Term Investment - 3.21% | |
| |
| shares | | Money Market Fund - 3.21% | | value |
| 170,779,034 | | Fidelity Institutional Government Portfolio - |
| | | Class I, 0.01% (c) | $170,779,034 |
| |
| Total Short-Term Investment | | value |
| (Cost $170,779,034) | $170,779,034 |
| |
| Total Investments | | value |
| (Cost $3,363,873,585) - 99.87% | $5,312,805,994 |
| Other Assets in Excess of Liabilities - 0.13% | $6,743,167 |
| TOTAL NET ASSETS - 100.00% | $5,319,549,161 |
| (a) | Non-income producing security. |
| (b) | Foreign issued security. Foreign concentration (including ADRs) was as follows: Ireland 4.65%. |
| (c) | Variable rate security. Rate listed is the 7-day effective yield as of May 31, 2014. |
The accompanying notes are an integral part of these financial statements.
| | |
| 10 | Jensen Quality Growth Fund | Annual Report |
Statement of Operations
Year Ended May 31, 2014
| Investment Income: | |
| Dividend income | $95,437,375 |
| Interest income | 10,876 |
| | 95,448,251 |
| | |
| Expenses: | |
| Investment advisory fees | 25,140,529 |
| 12b-1 - Class J | 6,463,882 |
| Administration fees | 1,651,261 |
| Shareholder servicing fees - Class I | 1,590,795 |
| Sub-transfer agent expenses - Class J | 1,431,491 |
| Custody fees | 356,771 |
| Fund accounting fees | 289,591 |
| 12b-1 fees - Class R | 253,614 |
| Federal and state registration fees | 225,694 |
| Reports to shareholders - Class J | 223,618 |
| Transfer agent fees - Class J | 214,794 |
| Directors’ fees and expenses | 172,507 |
| Reports to shareholders - Class I | 168,800 |
| Professional fees | 107,290 |
| Shareholder servicing fees - Class R | 91,514 |
| Transfer agent expenses | 87,329 |
| Transfer agent fees - Class I | 64,722 |
| Other | 54,801 |
| Reports to shareholders - Class R | 5,009 |
| Transfer agent fees - Class R | 1,208 |
| Total expenses | 38,595,220 |
| |
| Net Investment Income | 56,853,031 |
| |
| Realized and Unrealized Gain on Investments: | |
| Net realized gain on investment transactions | 274,409,629 |
| Change in unrealized appreciation on investments | 493,825,421 |
| Net realized and unrealized gain on investments | 768,235,050 |
| Net Increase in Net Assets Resulting | |
| from Operations | $825,088,081 |
Statements of Changes in Net Assets
| | Year Ended | | | Year Ended | |
| Operations: | | May 31, 2014 | | | May 31, 2013 | |
| Net investment income | | $56,853,031 | | | $49,420,219 | |
| Net realized gain on investment | | | | | | |
| transactions | | 274,409,629 | | | 162,022,898 | |
| Change in unrealized appreciation | | | | | | |
| on investments | | 493,825,421 | | | 736,529,699 | |
| Net increase in net assets resulting | | | | | | |
| from operations | | 825,088,081 | | | 947,972,816 | |
| | | | | | | |
| | | Year Ended | | | Year Ended | |
| Capital Share Transactions: | | May 31, 2014 | | | May 31, 2013 | |
| Shares Sold - Class J | | 383,413,077 | | | 422,653,283 | |
| Shares Sold - Class R | | 11,401,593 | | | 12,126,857 | |
| Shares Sold - Class I | | 853,190,299 | | | 724,081,073 | |
| Shares issued in reinvestment of | | | | | | |
| dividends - Class J | | 105,129,328 | | | 25,808,289 | |
| Shares issued in reinvestment of | | | | | | |
| dividends - Class R | | 1,968,392 | | | 403,465 | |
| Shares issued in reinvestment of | | | | | | |
| dividends - Class I | | 104,678,714 | | | 22,124,191 | |
| Shares redeemed - Class J | | (883,620,987) | | | (738,668,567) | |
| Shares redeemed - Class R | | (16,004,531) | | | (15,249,702) | |
| Shares redeemed - Class I | | (565,494,938) | | | (428,366,987) | |
| Net increase (decrease) | | (5,339,053) | | | 24,911,902 | |
| | |
| Dividends and Distributions | | Year Ended | | | Year Ended | |
| to Shareholders: | | May 31, 2014 | | | May 31, 2013 | |
| Net investment income - Class J | | (25,234,196) | | | (26,500,367) | |
| Net investment income - Class R | | (298,232) | | | (403,465) | |
| Net investment income - Class I | | (29,533,866) | | | (24,096,545) | |
| Net realized gains - Class J | | (82,751,792) | | | — | |
| Net realized gains - Class R | | (1,670,392) | | | — | |
| Net realized gains - Class I | | (80,674,309) | | | — | |
| Total dividends and distributions | | (220,162,787) | | | (51,000,377) | |
| | | | | | | |
| | Year Ended | | | Year Ended | |
| Increase in Net Assets | | May 31, 2014 | | | May 31, 2013 | |
| | 599,586,241 | | | 921,884,341 | |
| | | | | | | |
| | Year Ended | | | Year Ended | |
| Net Assets: | | May 31, 2014 | | | May 31, 2013 | |
| Beginning of Year | | 4,719,962,920 | | | 3,798,078,579 | |
| End of Year (including accumulated | | | | | | |
| undistributed net investment income | | | | | | |
| of $8,329,016 and $6,542,279, | | | | | | |
| respectively) | | $5,319,549,161 | | | $4,719,962,920 | |
The accompanying notes are an integral part of these financial statements.
| | |
| Annual Report | Jensen Quality Growth Fund | 11 |
Financial Highlights
Class J
| | year ended | | | year ended | | | year ended | | | year ended | | | year ended | |
| Per Share Data: | | May 31, 2014 | | | May 31, 2013 | | | May 31, 2012 | | | May 31, 2011 | | | May 31, 2010 | |
| Net asset value, beginning of year | | $33.98 | | | $27.33 | | | $29.11 | | | $23.86 | | | $19.47 | |
| Income from investment operations: | | | | | | | | | | | | | | | |
| Net investment income | | 0.37 | | | 0.34 | | | 0.32 | | | 0.27 | | | 0.24 | |
| Net realized and unrealized gains (losses) on investments | | 5.52 | | | 6.65 | | | (1.80) | | | 5.25 | | | 4.39 | |
| Total from investment operations | | 5.89 | | | 6.99 | | | (1.48) | | | 5.52 | | | 4.63 | |
| Less distributions: | | | | | | | | | | | | | | | |
| Dividends from net investment income | | (0.35) | | | (0.34) | | | (0.30) | | | (0.27) | | | (0.24) | |
| Dividends from net realized capital gains | | (1.19) | | | — | | | — | | | — | | | — | |
| Total distributions | | (1.54) | | | (0.34) | | | (0.30) | | | (0.27) | | | (0.24) | |
| Net asset value, end of year | | $38.33 | | | $33.98 | | | $27.33 | | | $29.11 | | | $23.86 | |
| Total return | | 17.57% | | | 25.74% | | | -5.04% | | | 23.31% | | | 23.85% | |
| Supplemental data and ratios: | | | | | | | | | | | | | | | |
| Net assets, end of year (000’s) | | $2,447,876 | | | $2,531,859 | | | $2,307,634 | | | $2,593,128 | | | $1,776,091 | |
| Ratio of expenses to average net assets | | 0.87% | | | 0.90% | | | 0.91% | | | 0.92% | | | 0.92% | |
| Ratio of net investment income to average net assets | | 1.00% | | | 1.08% | | | 1.18% | | | 1.07% | | | 1.04% | |
| Portfolio turnover rate | | 14.10% | | | 22.09% | | | 15.80% | | | 6.84% | | | 12.33% | |
The accompanying notes are an integral part of these financial statements.
| | |
| 12 | Jensen Quality Growth Fund | Annual Report |
Financial Highlights
Class R
| | year ended | | | year ended | | | year ended | | | year ended | | | year ended | |
| Per Share Data: | | May 31, 2014 | | | May 31, 2013 | | | May 31, 2012 | | | May 31, 2011 | | | May 31, 2010 | |
| Net asset value, beginning of year | | $33.83 | | | $27.22 | | | $29.01 | | | $23.78 | | | $19.40 | |
| Income from investment operations: | | | | | | | | | | | | | | | |
| Net investment income | | 0.23 | | | 0.25 | | | 0.26 | | | 0.23 | | | 0.20 | |
| Net realized and unrealized gains (losses) on investments | | 5.50 | | | 6.64 | | | (1.79) | | | 5.23 | | | 4.37 | |
| Total from investment operations | | 5.73 | | | 6.89 | | | (1.53) | | | 5.46 | | | 4.57 | |
| Less distributions: | | | | | | | | | | | | | | | |
| Dividends from net investment income | | (0.21) | | | (0.28) | | | (0.26) | | | (0.23) | | | (0.19) | |
| Dividends from net realized capital gains | | (1.19) | | | — | | | — | | | — | | | — | |
| Total distributions | | (1.40) | | | (0.28) | | | (0.26) | | | (0.23) | | | (0.19) | |
| Net asset value, end of year | | $38.16 | | | $33.83 | | | $27.22 | | | $29.01 | | | $23.78 | |
| Total return | | 17.13% | | | 25.43% | | | -5.26% | | | 23.08% | | | 23.59% | |
| Supplemental data and ratios: | | | | | | | | | | | | | | | |
| Net assets, end of year (000’s) | | $50,478 | | | $47,074 | | | $40,216 | | | $29,077 | | | $12,533 | |
| Ratio of expenses to average net assets | | 1.25% | | | 1.16% | | | 1.12% | | | 1.10% | | | 1.12% | |
| Ratio of net investment income to average net assets | | 0.63% | | | 0.82% | | | 0.96% | | | 0.87% | | | 0.83% | |
| Portfolio turnover rate | | 14.10% | | | 22.09% | | | 15.80% | | | 6.84% | | | 12.33% | |
The accompanying notes are an integral part of these financial statements.
| | |
| Annual Report | Jensen Quality Growth Fund | 13 |
Financial Highlights
Class I
| | year ended | | | year ended | | | year ended | | | year ended | | | year ended | |
| Per Share Data: | | May 31, 2014 | | | May 31, 2013 | | | May 31, 2012 | | | May 31, 2011 | | | May 31, 2010 | |
| Net asset value, beginning of year | | $34.00 | | | $27.35 | | | $29.14 | | | $23.88 | | | $19.48 | |
| Income from investment operations: | | | | | | | | | | | | | | | |
| Net investment income | | 0.46 | | | 0.42 | | | 0.40 | | | 0.37 | | | 0.34 | |
| Net realized and unrealized gains (losses) on investments | | 5.53 | | | 6.66 | | | (1.80) | | | 5.24 | | | 4.36 | |
| Total from investment operations | | 5.99 | | | 7.08 | | | (1.40) | | | 5.61 | | | 4.70 | |
| Less distributions: | | | | | | | | | | | | | | | |
| Dividends from net investment income | | (0.45) | | | (0.43) | | | (0.39) | | | (0.35) | | | (0.30) | |
| Dividends from net realized capital gains | | (1.19) | | | — | | | — | | | — | | | — | |
| Total distributions | | (1.64) | | | (0.43) | | | (0.39) | | | (0.35) | | | (0.30) | |
| Net asset value, end of year | | $38.35 | | | $34.00 | | | $27.35 | | | $29.14 | | | $23.88 | |
| Total return | | 17.87% | | | 26.10% | | | -4.76% | | | 23.72% | | | 24.21% | |
| Supplemental data and ratios: | | | | | | | | | | | | | | | |
| Net assets, end of year (000’s) | | $2,821,194 | | | $2,141,031 | | | $1,450,228 | | | $1,552,075 | | | $831,505 | |
| Ratio of expenses to average net assets | | 0.63% | | | 0.62% | | | 0.60% | | | 0.60% | | | 0.61% | |
| Ratio of net investment income to average net assets | | 1.25% | | | 1.36% | | | 1.49% | | | 1.39% | | | 1.33% | |
| Portfolio turnover rate | | 14.10% | | | 22.09% | | | 15.80% | | | 6.84% | | | 12.33% | |
The accompanying notes are an integral part of these financial statements.
| | |
| 14 | Jensen Quality Growth Fund | Annual Report |
Notes to the Financial Statements
May 31, 2014
1. Organization and Significant Accounting Policies
The Jensen Portfolio, Inc., doing business as Jensen Quality Growth Fund (the “Fund”), was organized as an Oregon Corporation on April 17, 1992, and is registered as an open-end, nondiversified management investment company under the Investment Company Act of 1940 (the “1940 Act”). The Fund commenced operations on August 3, 1992. The Fund is authorized to issue 5,000,000,000 shares of common stock. The Fund currently offers three different classes of shares. Effective July 30, 2003, the Fund issued two new classes of shares, Class R and Class I, and renamed the existing class as Class J. Class J shares are subject to a 0.25% 12b-1 fee and a sub-transfer agency fee, Class R shares are subject to a 0.50% 12b-1 fee and up to a 0.25% shareholder servicing fee, and Class I shares are subject to a shareholder servicing fee up to 0.10%, as described in each Class’ prospectus. Each class of shares has identical rights and privileges except with respect to the 12b-1 fees, sub-transfer agency fees and shareholder servicing fees, and voting rights on matters affecting a single class of shares. The principal investment objective of the Fund is long-term capital appreciation.
The following is a summary of significant accounting policies consistently followed by the Fund. The policies are in conformity with accounting principles generally accepted in United States of America (“GAAP”).
a) Investment Valuation – Securities that are listed on United States stock exchanges are valued at the last sale price at the close of the exchange. Equity securities listed on NASDAQ Stock Market are valued at the NASDAQ Official Closing Price or, if there has been no sale on that day, at their current bid price. Investments in open-end and closed-end registered investment companies, including money market funds, that do not trade on an exchange are valued at the end of day net asset value per share. Quotations are taken from the market in which the security is primarily traded. Over-the-counter securities are valued at the current bid price in the absence of a closing price. Securities for which market quotations are not readily available are valued at fair value as determined by Jensen Investment Management, Inc. (the “Investment Adviser”) at or under the direction of the Fund’s Board of Directors.
There is no definitive set of circumstances under which the Fund may elect to use fair value procedures to value a security. Although the Fund only invests in publicly traded securities, the large majority of which are large capitalization, highly liquid securities, they nonetheless may become securities for which market quotations are not readily available, such as in instances where the market quotation for a security has become stale, sales of a security have been infrequent, trading in the security has been suspended, or where there is a thin market in the security. Securities for which market quotations are not readily available will be valued at their fair value as determined under the Fund’s fair valuation procedures established by the Board of Directors. The Fund is prohibited from investing in restricted securities (securities issued in private placement transactions that may not be offered or sold to the public without registration under the securities laws); therefore, fair value pricing considerations for restricted securities are generally not applicable to the Fund.
Fair Value Measurement – The Fund has adopted authoritative fair valuation accounting standards which establish an authoritative definition of fair value and set out a hierarchy for measuring fair value. These standards require additional disclosures about the various inputs and valuation techniques used to develop the measurements of fair value and a discussion of changes in valuation techniques and related inputs during the period. The three levels of the fair value hierarchy are as follows:
Level 1 | | Inputs that reflect unadjusted quoted prices in active markets for identical assets or liabilities that the Fund has the ability to access at the measurement date. |
| | |
Level 2 | | Inputs other than quoted prices that are observable for the asset or liability either directly or indirectly, including inputs in markets that are not considered to be active and prices for similar securities, interest rates, credit risk, etc. |
| | |
Level 3 | | Inputs that are unobservable (including the Fund’s own assumptions in determining the fair value of investments). |
Inputs refer broadly to the assumptions that market participants use to make valuation decisions, including assumptions about risk. Inputs may include price information, volatility statistics, specific and broad credit data, liquidity statistics, and other factors. A financial instrument’s level within the fair value hierarchy is based on the lowest level of input that is significant to the fair value measurement. However, the determination of what constitutes “observable” requires significant judgment by the Fund. The Fund considers observable data to be that market data which is readily available, regularly distributed or updated, reliable and verifiable, not proprietary, and provided by independent sources that are actively involved in the relevant market. The categorization of a financial instrument within the hierarchy is based upon the pricing transparency of the instrument and does not necessarily correspond to the Fund’s perceived risk of that instrument.
Investments whose values are based on quoted market prices in active markets, include common stocks and certain money market securities, and are classified within Level 1. Investments that trade in markets that are not considered to be active, but are valued based on quoted market
| | |
| Annual Report | Jensen Quality Growth Fund | 15 |
prices, dealer quotations or alternative pricing sources supported by observable inputs are classified within Level 2. Investments classified within Level 3 have significant unobservable inputs, as they trade infrequently or not at all.
The following is a summary of the inputs used, as of May 31, 2014, to value the Fund’s investments carried at fair value. The inputs and methodology used for valuing securities may not be an indication of the risk associated with investing in those securities.
| Investments at Value | | Total | | | Level 1 | | | Level 2 | | | Level 3 |
| Total Common | | | | | | | | | | | | | | | |
| Stocks* | | $5,142,026,960 | | | $5,142,026,960 | | | | $— | | | | | $— | |
| Total Money | | | | | | | | | | | | | | | |
| Market Fund | | 170,779,034 | | | 170,779,034 | | | | — | | | | | — | |
| Total Investments | | $5,312,805,994 | | | $5,312,805,994 | | | | $— | | | | | $— | |
| * | For further information regarding security characteristics and industry classifications, please see the Schedule of Investments. |
The Fund did not hold any investments during the period ended May 31, 2014 with significant unobservable inputs which would be classified as Level 3. There were no transfers of securities between levels during the reporting period. It is the Fund’s policy to record transfers between levels as of the end of the reporting period. The Fund did not hold any derivative instruments during the reporting period.
b) Federal Income Taxes – No provision has been made for Federal income taxes since the Fund has elected to be taxed as a “regulated investment company” and intends to distribute substantially all net investment company taxable income and net capital gains to its shareholders and otherwise comply with the provision of the Internal Revenue Code applicable to regulated investment companies.
The Fund has reviewed all open tax years and major jurisdictions and concluded that there is no tax liability resulting from unrecognized tax benefits relating to uncertain income tax positions taken or expected to be taken as of and for the year ended May 31, 2014. The Fund recognizes interest and penalties, if any, related to uncertain tax benefits in the Statement of Operations. During the year, the Fund did not incur any interest or penalties. Open tax years are those that are open for exam by taxing authorities. As of May 31, 2014, open Federal tax years include the tax years ended May 31, 2011 through 2014. The Fund has no examination in progress. The Fund is also not aware of any tax positions for which it is reasonably possible that the total amounts of unrecognized tax benefits will significantly change in the next twelve months.
c) Distributions to Shareholders – Dividends to shareholders are recorded on the ex-dividend date. Dividends from net investment income are declared and paid quarterly by the Fund. Distributions of net realized capital gains, if any, will be declared and paid at least annually. Income and capital gain distributions are determined in accordance with income tax regulations which may differ from GAAP. Additionally, GAAP requires that certain components of net assets relating to permanent differences be reclassified between the components of net assets. These reclassifications have no effect on net assets or net asset value per share. For the year ended May 31, 2014, there were no reclassifications made.
d) Use of Estimates – The preparation of financial statements in conformity with GAAP requires management to make estimates and assumptions that affect the reported amounts of assets and liabilities and disclosure of contingent assets and liabilities at the date of the financial statements and the reported amounts of revenues and expenses during the reporting period. Actual results could differ from those estimates.
e) Guarantees and Indemnifications – Under the Fund’s organizational documents, each director, officer, employee or other agent of the Fund is indemnified, to the extent permitted by the 1940 Act, against certain liabilities that may arise out of performance of their duties to the Fund. Additionally, in the normal course of business, the Fund enters into contracts that contain a variety of indemnification clauses. The Fund’s maximum exposure under these arrangements is unknown as this would involve future claims that may be made against the Fund that have not yet occurred. However, the Fund has not had prior claims or losses pursuant to these contracts and believes the risk of loss to be remote.
f) Allocation of Income, Expenses and Gains/Losses – Income, expenses (other than those deemed attributable to a specific share class), and gains and losses of the Fund are allocated daily to each class of shares based upon the ratio of net assets represented by each class as a percentage of the net assets of the Fund. Expenses deemed directly attributable to a class of shares are recorded by the specific class. Most Fund expenses are allocated by class based on relative net assets. Transfer agent fees and reports to shareholders are allocated based on the number of shareholder accounts in each class. Sub-transfer agency fees are expensed to the Class J shares based on the actual number of shareholder accounts held and serviced by certain financial intermediaries as described in the Class J shares’ prospectus. 12b-1 fees are expensed at 0.25% of average daily net assets of Class J shares and 0.50% of average daily net assets of Class R shares. Shareholder servicing fees are expensed at up to 0.10% and up to 0.25% of the average daily net assets of Class I shares and Class R shares, respectively.
g) Other – Investment and shareholder transactions are recorded on trade date. Gains or losses from investment transactions are determined on the basis of identified carrying value using the specific identification method. Dividend income is recognized on the ex-dividend date and interest income is recognized on an accrual basis.
| | |
| 16 | Jensen Quality Growth Fund | Annual Report |
2. Capital Share Transactions
Transactions in shares of the Fund were as follows:
| | year ended | | | year ended | |
| Class J | | May 31, 2014 | | | May 31, 2013 | |
| Shares sold | | | 10,609,145 | | | | | 13,742,393 | | |
| Shares issued in | | | | | | | | | | |
| reinvestment of dividends | | | 2,857,441 | | | | | 856,729 | | |
| Shares redeemed | | | (24,114,521 | ) | | | | (24,540,829 | ) | |
| Net decrease | | | (10,647,935 | ) | | | | (9,941,707 | ) | |
| Shares outstanding: | | | | | | | | | | |
| Beginning of year | | | 74,508,372 | | | | | 84,450,079 | | |
| End of year | | | 63,860,437 | | | | | 74,508,372 | | |
| | | |
| | year ended | | | year ended | |
| Class R | | May 31, 2014 | | | May 31, 2013 | |
| Shares sold | | | 314,812 | | | | | 399,182 | | |
| Shares issued in | | | | | | | | | | |
| reinvestment of dividends | | | 53,527 | | | | | 13,423 | | |
| Shares redeemed | | | (437,118 | ) | | | | (498,606 | ) | |
| Net decrease | | | (68,779 | ) | | | | (86,001 | ) | |
| Shares outstanding: | | | | | | | | | | |
| Beginning of year | | | 1,391,439 | | | | | 1,477,440 | | |
| End of year | | | 1,322,660 | | | | | 1,391,439 | | |
| | | |
| | | year ended | | | year ended | |
| Class I | | May 31, 2014 | | | May 31, 2013 | |
| Shares sold | | | 23,208,783 | | | | | 23,324,668 | | |
| Shares issued in | | | | | | | | | | |
| reinvestment of dividends | | | 2,845,376 | | | | | 732,488 | | |
| Shares redeemed | | | (15,460,105 | ) | | | | (14,118,192 | ) | |
| Net increase | | | 10,594,054 | | | | | 9,938,964 | | |
| Shares outstanding: | | | | | | | | | | |
| Beginning of year | | | 62,972,821 | | | | | 53,033,857 | | |
| End of year | | | 73,566,875 | | | | | 62,972,821 | | |
3. Investment Transactions
The aggregate purchases and aggregate sales of securities, excluding short-term investments, by the Fund for the year ended May 31, 2014, were $699,303,200 and $1,002,490,880, respectively.
4. Income Taxes
The cost of investments differ for financial statement and tax purposes primarily due to the deferral of losses on wash sales.
The distributions of $55,066,294 and $51,000,377 paid during the years ended May 31, 2014 and 2013, respectively, were classified as ordinary income for tax purposes. There were no long-term capital gain distributions paid during the year ended May 31, 2013. A Distribution of $165,096,493 was paid during the year ended May 31, 2014 and was classified as long-term capital gain for income tax purposes.
At May 31, 2014, the cost of investments, net unrealized appreciation (depreciation) and undistributed ordinary income and undistributed long term capital gains for income tax purposes were as follows:
| Cost of investments | $3,363,928,487 | |
| Gross unrealized appreciation | $1,950,529,297 | |
| Gross unrealized depreciation | (1,651,790 | ) |
| Net unrealized appreciation | 1,948,877,507 | |
| Undistributed ordinary income | 8,329,016 | |
| Undistributed long-term capital gain | 179,273,576 | |
| Total distributable earnings | 187,602,592 | |
| Other accumulated gains | — | |
| Total accumulated gains | $2,136,480,099 | |
At May 31, 2014, the Fund had total tax basis capital losses of $0.
On June 24, 2014, the Fund declared and paid a distribution from ordinary income of $6,630,043, $98,150 and $9,200,842 for Class J, Class R, and Class I, respectively, to shareholders of record as of June 23, 2014.
5. Line of Credit
The Fund has a $250 million revolving credit facility, subject to certain restrictions, for temporary emergency purposes, including the meeting of redemption requests that otherwise might require the untimely disposition of securities. The unsecured line of credit has a one-year term and is reviewed annually by the Board of Directors. The current agreement runs through December 20, 2014. The interest rate on the outstanding principal amount is equal to the prime rate less 1%. As of May 31, 2014, the rate on the Fund’s line of credit was 2.25%. The Fund did not borrow on the line of credit as of and during the year ended May 31, 2014.
6. Investment Advisory Agreement
The Fund has an Investment Advisory and Service Contract with Jensen Investment Management, Inc. Pursuant to the advisory agreement and breakpoint fee schedule, the Investment Adviser is entitled to receive a fee, calculated daily and payable monthly, at the annual rate of 0.50% as applied to the Fund’s average daily net assets of $4 billion or less, 0.475% as applied to the Fund’s average daily net assets of more than $4 billion and up to $8 billion, 0.45% as applied to the Fund’s average daily net assets of more than $8 billion and up to $12 billion, and 0.425% as applied to the Fund’s average daily net assets of more than $12 billion.
| | |
| Annual Report | Jensen Quality Growth Fund | 17 |
Certain officers of the Fund are also officers and directors of the Investment Adviser.
7. Distribution and Shareholder Servicing
The Fund has adopted a distribution and shareholder servicing plan pursuant to Rule 12b-1 under the 1940 Act (the “12b-1 Plan”), which provides that the Fund make payments to the Fund’s distributor at an annual rate of 0.25% of average daily net assets attributable to Class J shares and 0.50% of the average daily net assets attributable to Class R shares. The Fund’s distributor may then make payments to financial intermediaries or others at an annual rate of up to 0.25% of the average daily net assets attributable to Class J shares and up to 0.50% of the average daily net assets attributable to Class R shares. Payments under the 12b-1 Plan shall be used to compensate the Fund’s distributor or others for services provided and expenses incurred in connection with the sale and/or servicing of shares.
In addition, the Fund has adopted a Shareholder Servicing Plan for Class I shares under which the Fund can pay for shareholder support services from the Fund’s assets pursuant to a Shareholder Servicing Agreement in an amount not to exceed 0.10% of the Fund’s average daily net assets attributable to Class I shares. The amount actually incurred for the year ended May 31, 2014 was 0.07%.
The Fund has also adopted a Shareholder Servicing Plan for the Class R shares. Under the Shareholder Servicing Plan, the Fund can pay for shareholder support services, which include the recordkeeping and administrative services provided by retirement plan administrators to retirement plans (and their participants) that are shareholders of the class. Payments will be made pursuant to a Shareholder Servicing Agreement in an amount not to exceed 0.25% of the Fund’s average daily net assets attributable to Class R shares. The amount actually incurred for the year ended May 31, 2014 was 0.18%.
8. Beneficial Ownership
The beneficial ownership, either directly or indirectly, of more than 25% of the voting securities of a fund creates a presumption of control of the fund, under Section 2(a)(9) of the 1940 Act. At May 31, 2014, Charles Schwab & Co., Inc., for the benefit of its customers, held 41.87% of the outstanding shares of the Class J share class. At May 31, 2014, Great-West Trust Company for the benefit of its customers, held 30.32%, of the outstanding shares of the Class R share class.
| | |
| 18 | Jensen Quality Growth Fund | Annual Report |
Report of Independent Registered Public Accounting Firm
To the Shareholders and Board of Directors of
The Jensen Portfolio, Inc., doing business as Jensen Quality Growth Fund
We have audited the accompanying statement of assets and liabilities, including the schedule of investments, of The Jensen Portfolio, Inc., doing business as Jensen Quality Growth Fund (the “Fund”) as of May 31, 2014, and the related statement of operations for the year then ended, the statements of changes in net assets for each of the two years in the period then ended, and the financial highlights for each of the four years in the period then ended. These financial statements and financial highlights are the responsibility of the Fund’s management. Our responsibility is to express an opinion on these financial statements and financial highlights based on our audits. The financial highlights for the year ended May 31, 2010, were audited by another independent registered public accounting firm, whose report dated July 19, 2010, expressed an unqualified opinion on those financial highlights.
We conducted our audits in accordance with the standards of the Public Company Accounting Oversight Board (United States). Those standards require that we plan and perform the audit to obtain reasonable assurance about whether the financial statements and financial highlights are free of material misstatement. An audit includes examining, on a test basis, evidence supporting the amounts and disclosures in the financial statements. Our procedures included confirmation of securities owned as of May 31, 2014, by correspondence with the custodian. An audit also includes assessing the accounting principles used and significant estimates made by management, as well as evaluating the overall financial statement presentation. We believe that our audits provide a reasonable basis for our opinion.
In our opinion, the financial statements and financial highlights referred to above present fairly, in all material respects, the financial position of The Jensen Portfolio, Inc., doing business as Jensen Quality Growth Fund as of May 31, 2014, the results of its operations for the year then ended, the changes in its net assets for each of the two years in the period then ended, and the financial highlights for each of the four years in the period then ended, in conformity with accounting principles generally accepted in the United States of America.

COHEN FUND AUDIT SERVICES, LTD.
Cleveland, Ohio
July 28, 2014
| | |
| Annual Report | Jensen Quality Growth Fund | 19 |
Expense Example - May 31, 2014 (Unaudited)
As a shareholder of Jensen Quality Growth Fund, you incur ongoing costs, including investment advisory fees, distribution and/or shareholder servicing fees, and other Fund expenses, which are indirectly paid by shareholders. This example is intended to help you understand your ongoing costs (in dollars) of investing in the Fund and to compare these costs with the ongoing costs of investing in other mutual funds.
The Example is based on an investment of $1,000 invested at the beginning of the period and held for the entire six-month period (December 1, 2013–May 31, 2014).
Actual Expenses
The first line of the table below for each share class of the Fund provides information about actual account values and actual expenses. However, the table does not include shareholder specific fees, such as the $15.00 fee charged to IRA accounts, or the $15.00 fee charged for wire redemptions. The table also does not include portfolio trading commissions and related trading costs. You may use the information in this line, together with the amount you invested, to estimate the expenses that you paid over the period. Simply divide your account value by $1,000 (for example, an $8,600 account value divided by $1,000 = 8.6), then multiply the result by the number in the first line under the heading entitled “Expenses Paid During Period” to estimate the expenses you paid on your account during this period.
Hypothetical Example for Comparison Purposes
The second line of the table below provides information about hypothetical account values and hypothetical expenses based on the actual expense ratios for each share class of the Fund and an assumed rate of return of 5% per year before expenses, which is not the Fund’s actual return. The hypothetical account values and expenses may not be used to estimate the actual ending account balance or expenses you paid for the period. You may use this information to compare the ongoing costs of investing in the Fund and other funds. To do so, compare this 5% hypothetical example with the 5% hypothetical examples that appear in the shareholder reports of the other funds.
Please note that the expenses shown in the table are meant to highlight your ongoing costs only and do not reflect any transactional costs, such as sales charges (loads), redemption fees, or exchange fees which, although not charged by the Fund, may be charged by other funds. Therefore, the second line of the table is useful in comparing ongoing costs only, and will not help you determine the relative total costs of owning different funds.
| | |
| 20 | Jensen Quality Growth Fund | Annual Report |
Expense Example Tables
| | | | | | | | | | | | | | Expenses Paid During |
| | Beginning Account Value | | | Ending Account Value | | | Period* December 1, 2013 – |
| Jensen Quality Growth Fund – Class J | | December 1, 2013 | | | May 31, 2014 | | | May 31, 2014 |
| Actual | | | $ | 1,000.00 | | | | | $ | 1,039.90 | | | | | $ | 4.37 | |
| Hypothetical (5% annual return before expenses) | | | | 1,000.00 | | | | | | 1,020.64 | | | | | | 4.33 | |
| |
| * | Expenses are equal to the Fund’s annualized six-month expense ratio of 0.86%, multiplied by the average account value over the period, multiplied by 182/365 to reflect the one-half year period. |
| | | | | | | | | | | | | | Expenses Paid During |
| | Beginning Account Value | | | Ending Account Value | | | Period* December 1, 2013 – |
| Jensen Quality Growth Fund – Class R | | December 1, 2013 | | | May 31, 2014 | | | May 31, 2014 |
| Actual | | | $ | 1,000.00 | | | | | $ | 1,038.10 | | | | | $ | 6.20 | |
| Hypothetical (5% annual return before expenses) | | | | 1,000.00 | | | | | | 1,018.85 | | | | | | 4.33 | |
| |
| * | Expenses are equal to the Fund’s annualized six-month expense ratio of 1.22%, multiplied by the average account value over the period, multiplied by 182/365 to reflect the one-half year period. |
| | | | | | | | | | | | | | Expenses Paid During |
| | Beginning Account Value | | | Ending Account Value | | | Period* December 1, 2013 – |
| Jensen Quality Growth Fund – Class I | | December 1, 2013 | | | May 31, 2014 | | | May 31, 2014 |
| Actual | | | $ | 1,000.00 | | | | | $ | 1,041.10 | | | | | $ | 3.26 | |
| Hypothetical (5% annual return before expenses) | | | | 1,000.00 | | | | | | 1,021.74 | | | | | | 3.23 | |
| |
| * | Expenses are equal to the Fund’s annualized six-month expense ratio of 0.64%, multiplied by the average account value over the period, multiplied by 182/365 to reflect the one-half year period. |
| | |
| Annual Report | Jensen Quality Growth Fund | 21 |
Additional Information (Unaudited)
1. Shareholder Notification of Federal Tax Status
The Fund designates 100% of dividends declared during the fiscal year ended May 31, 2014 as dividends qualifying for the dividends received deduction available to corporate shareholders.
The Fund designates 100% of dividends declared from net investment income during the fiscal year ended May 31, 2014 as qualified dividend income under the Jobs and Growth Tax Relief Reconciliation Act of 2003.
The Fund designates as a long-term capital gain dividend, pursuant to the Internal Revenue Code Section 852(b)(3), the amount necessary to reduce earnings and profits of the Fund related to net capital gain to zero for the fiscal year ended May 31, 2014.
Additional Information Applicable to Foreign Shareholders Only:
The Fund designates 0.01% of ordinary income distributions as interest-related dividends under Internal Revenue Code Section 871(k)(1)(c).
2. Availability of Proxy Voting Information
Information regarding how the Fund votes proxies relating to portfolio securities is available without charge, upon request by calling toll-free, 1-800-221-4384, or by accessing the SEC’s website at www.sec.gov.
3. Portfolio Holdings
The Jensen Quality Growth Fund will file its complete schedule of portfolio holdings with the SEC for the first and third quarters of each fiscal year on Form N-Q. The Fund’s Form N-Q will be available on the EDGAR database on the SEC’s website at www.sec.gov. These Forms may also be reviewed and copied at the SEC’s Public Reference Room in Washington D.C. Information about the operation of the Public Reference Room may be obtained by calling 1-800-SEC-0330.
| | |
| 22 | Jensen Quality Growth Fund | Annual Report |
4. Additional Disclosure Regarding Fund Directors and Officers
Independent Directors
| Name, Age and Address | Position(s)
Held with
the Company | Term of Office and
Length of Time
Served** | Principal Occupation During
Past Five Years | # of Portfolios
in Fund
Complex
Overseen
by Director | Other Directorships
Held by Director |
Roger A. Cooke J.D.
Jensen Quality Growth Fund
5300 Meadows Road
Suite 250
Lake Oswego, OR 97035
Year of Birth: 1948
| Independent
Director | Indefinite Term; since
June 1999. | Retired. Senior Vice President, General Counsel and Secretary of Precision Castparts Corp., a diversified manufacturer of complex metal products, (2000 – 2013); Executive Vice President –Regulatory and Legal Affairs of Fred Meyer, Inc., a retail grocery and general merchandise company, (1992 – 2000).
| 1 | None |
Robert E. Harold
Jensen Quality Growth Fund
5300 Meadows Road
Suite 250
Lake Oswego, OR 97035
Year of Birth: 1947
| Independent
Director | Indefinite Term; since
September 2000. | Retired. Senior Director of Financial Planning of Nike, Inc., a footwear and apparel company (2001 – 2002); Global Brand Controller for Nike, Inc. (1996, 1997, 2000 – 2001); Interim Chief Financial Officer for Nike, Inc. (1998 – 1999); Interim Chief Executive Officer for Laika, Inc., an animation studio (March 2005 – October 2005).
| 1 | Director of St. Mary’s Academy, a non-profit high school (2000 – present); Director of Laika, Inc., an animation studio (2002 – present). |
Thomas L. Thomsen, Jr.
Jensen Quality Growth Fund
5300 Meadows Road
Suite 250
Lake Oswego, OR 97035
Year of Birth: 1944
| Independent
Director | Indefinite Term; since
December 2003 | Private rancher and real estate investor (2002 – Present); Chief Executive Officer (2000 – 2002) and President (1998 – 2000) of Columbia Management Company (now called Columbia Management Advisors, Inc.), investment adviser to the Columbia Funds family of mutual funds and to institutional and individual investors.
| 1 | None |
Kenneth Thrasher
Jensen Quality Growth Fund
5300 Meadows Road
Suite 250
Lake Oswego, OR 97035
Year of Birth: 1949
| Independent
Director | Indefinite Term; since
July 2007. | Chairman (2002 – present) and CEO (2002 – 2009) of Complí, a web-based compliance and risk management software solution company. | 1 | Northwest Natural Gas Company (a natural gas distribution and service provider). |
| | |
| Annual Report | Jensen Quality Growth Fund | 23 |
Interested Directors and Officers
| Name, Age and Address | Position(s)
Held with
the Company | Term of Office and
Length of Time
Served** | Principal Occupation During
Past Five Years | # of Portfolios
in Fund
Complex
Overseen
by Director | Other Directorships
Held by Director |
Val E. Jensen*
Jensen Quality Growth Fund
5300 Meadows Road
Suite 250
Lake Oswego, OR 97035
Year of Birth: 1929
| Director and
Chairman | Indefinite Term;
Served as Director
since inception; Served
as President from
inception to March
2002; Served as
Chairman since March
2002.
| Retired, Chairman and Director of Jensen Investment Management, Inc. (1988 – 2004); Chairman (since 2002) and Director (since 1992) of the Fund. | 1 | None |
Gary W. Hibler, Ph.D.*
Jensen Quality Growth Fund
5300 Meadows Road
Suite 250
Lake Oswego, OR 97035
Year of Birth: 1943
| Director | Indefinite Term;
Served as Director
since inception;
Served as Secretary
from inception to
March 2002; Served
as Treasurer from
December 2002 to
March 2004; Served as
President from March
2002 to February 2007.
| President and Director of Jensen Investment Management, Inc. (1999 – February 2007); Secretary and Director of Jensen Investment Management, Inc. (1994 – 1999). | 1 | Director of WaterWatch, a non-profit environmental group (2008 – present). |
Robert D. McIver*
Jensen Investment
Management, Inc.
5300 Meadows Road
Suite 250
Lake Oswego, OR 97035
Year of Birth: 1965
| President | 1 Year Term; Served
since February 2007. | President and Director (February 2007 – present) and Director of Operations (2004 – February 2007) of Jensen Investment Management, Inc.; General Manager of Fairmont Villa Management and Vice President of Fairmont Riverside Golf Estates Ltd (2001 – 2004); Chief Investment Officer, Schroder & Co. Trust Bank (1999 – 2001); Portfolio Manager, Schroder Investment Management (1989 – 1999).
| N/A | N/A |
Robert F. Zagunis*
Jensen Investment
Management, Inc.
5300 Meadows Road
Suite 250
Lake Oswego, OR 97035
Year of Birth: 1953
| Vice President
and Secretary | 1 Year Term; Served
since July 1993. | Chairman (January 2013 – present), Vice President and Director (1993 – present) and Secretary (1999 – present) of Jensen Investment Management, Inc. | N/A | N/A |
| | |
| 24 | Jensen Quality Growth Fund | Annual Report |
Interested Directors and Officers continued
| Name, Age and Address | Position(s)
Held with
the Company | Term of Office and
Length of Time
Served** | Principal Occupation During
Past Five Years | # of Portfolios
in Fund
Complex
Overseen
by Director | Other Directorships
Held by Director |
Brian S. Ferrie*
Jensen Investment
Management, Inc.
5300 Meadows Road
Suite 250
Lake Oswego, OR 97035
Year of Birth: 1958
| Treasurer and Chief
Compliance Officer | 1 Year Term; Served
since March 2004. | Director of Finance and Chief Compliance Officer (2003 – February 2007), Vice President, Treasurer and Director (February 2007 – present), and Chief Compliance Officer (February 2007 – March 2011, and July 2012 – September 2012) of Jensen Investment Management, Inc.; Vice President and CFO of Berger Financial Group LLC (2001 – 2003); Vice President and Chief Compliance Officer of Berger Financial Group Inc. (1994 – 2001).
| N/A | N/A |
David G. Mertens*
Jensen Investment
Management, Inc.
5300 Meadows Road
Suite 250
Lake Oswego, OR 97035
Year of Birth: 1960
| Vice President | 1 Year Term; Served
since January 2011. | Director and Vice President of Sales and Marketing for Jensen Investment Management, Inc. (2002 – present); various sales and marketing management positions for Berger Financial Group LLC and Berger Distributors LLC, ending as Senior Vice President of Institutional Marketing for Berger Financial Group and President of Berger Distributors (1995 – 2002).
| N/A | N/A |
Eric H. Schoenstein*
Jensen Investment
Management, Inc.
5300 Meadows Road
Suite 250
Lake Oswego, OR 97035
Year of Birth: 1965
| Vice President | 1 Year Term; Served
since January 2011. | Director and Vice President of Business Analysis for Jensen Investment Management, Inc. (2002 – present); various audit positions, most recently Senior Audit Manager, with Arthur Andersen LLP (1988 – 2001). | N/A | N/A |
| * | This individual is an “interested person” of the Fund within the meaning of the 1940 Act. |
| ** | Each Director serves for an indefinite term in accordance with the Bylaws of the Fund until the date a Director resigns, retires or is removed in accordance with the Bylaws of the Fund. |
The Statement of Additional Information includes additional information about the Directors and Officers and is available, without charge, upon request by calling 1-800-221-4384 |
| | |
| Annual Report | Jensen Quality Growth Fund | 25 |
Notice of Privacy Policy
Jensen Investment Management, Inc. and the Jensen Portfolio, Inc. d/b/a Jensen Quality Growth Fund (collectively, “Jensen”) have had a long-standing policy of maintaining strict confidentiality over customer information. Jensen’s policy is as follows:
Confidentiality and Security
All information regarding customer identity, security holdings and financial status will be kept strictly confidential. We maintain physical, electronic and operational safeguards to protect customer nonpublic personal information.
Jensen is now required to provide you the following two notices:
Categories of information Jensen discloses and parties to whom Jensen discloses that information:
Jensen does not disclose any nonpublic personal information about its current or former shareholders to nonaffiliated third parties, except as permitted or required by law. For example, Jensen is permitted by law to disclose all of the information it collects, as described below, to its transfer agent to process your transactions. Jensen is also permitted by law (and may be required by law) to disclose any nonpublic personal information it collects from you to law enforcement agencies, the Securities and Exchange Commission, and other federal and state regulatory authorities.
Categories of information Jensen collects:
Jensen collects nonpublic personal information about our customers from the following sources:
| | + | | Information Jensen receives from you on or in applications or other forms, correspondence, or conversations, including, but not limited to, your name, address, telephone number, social security number, assets, income and date of birth; and |
| | | | |
| + | | Information about your transactions with Jensen, its affiliates, or others, including, but not limited to, your account number and balance, parties to transactions, cost basis information, and other financial information. |
In the event that you hold shares of the Jensen Portfolio d/b/a Jensen Quality Growth Fund through a financial intermediary, including, but not limited to, a broker-dealer, bank, or trust company, the privacy policy of your financial intermediary would govern how your nonpublic personal information would be shared with nonaffiliated third parties.
| | |
| Jensen Quality Growth Fund | PN-1 |
| |
| Jensen Quality Growth Fund |
| |
| Class J Shares | Class I Shares | Class R Shares |
| | |
| Investment Adviser |
| | Jensen Investment Management, Inc. |
| 5300 Meadows Road, Suite 250 |
| Lake Oswego, OR 97035 |
| 800.992.4144 |
| | |
| Fund Administrator, Transfer Agent, |
| and Fund Accountant |
| U.S. Bancorp Fund Services, LLC |
| 615 East Michigan Street |
| Milwaukee, WI 53202 |
| |
| Custodian |
| U.S. Bank, N.A. |
| Custody Operations |
| 1555 N. RiverCenter Drive, Suite 302 |
| Milwaukee, WI 53212 |
| |
| Legal Counsel |
| Stoel Rives LLP |
| Standard Insurance Center |
| 900 SW Fifth Avenue |
| Suite 2300 |
| Portland, OR 97204-1268 |
| |
| Independent Registered Public Accounting Firm |
| Cohen Fund Audit Services, Ltd. |
| 1350 Euclid Avenue, Suite 800 |
| Cleveland, OH 44145 |
| |
| Distributor |
| Quasar Distributors, LLC |
| 615 East Michigan Street |
| Milwaukee, WI 53202 |
| |
| |
| |

| jenseninvestment.com |
| |
| |
| |
JNRPANNU – 0514 | This report has been prepared for shareholders and may be distributed to others only if preceded or accompanied by a current prospectus. |
Item 2. Code of Ethics.
The registrant has adopted a code of ethics that applies to the registrant’s principal executive officer and principal financial officer. The registrant has not made any substantive amendments to its code of ethics during the period covered by this report. The registrant has not granted any waivers from any provisions of the code of ethics during the period covered by this report. Incorporated by reference to the registrant’s N-CSR filed on 8/9/2004.
Item 3. Audit Committee Financial Expert.
The registrant’s board of directors has determined that there are at least two audit committee financial experts serving on its audit committee. Robert E. Harold and Kenneth R. Thrasher are the “audit committee financial experts” and are considered to be “independent” as each term is defined in Item 3 of Form N-CSR.
Item 4. Principal Accountant Fees and Services.
The registrant has engaged its principal accountant to perform audit services, audit-related services, tax services and other services during the past two fiscal years. “Audit services” refer to performing an audit of the registrant's annual financial statements or services that are normally provided by the accountant in connection with statutory and regulatory filings or engagements for those fiscal years. “Audit-related services” refer to the assurance and related services by the principal accountant that are reasonably related to the performance of the audit. “Tax services” refer to professional services rendered by the principal accountant for tax compliance, tax advice, and tax planning. There were no “Other services” provided by the principal accountant. The following table details the aggregate fees billed or expected to be billed for each of the last two fiscal years for audit fees, audit-related fees, tax fees and other fees by the principal accountant.
| | | FYE 05/31/2014 | | FYE 05/31/2013 |
| Audit Fees | | 19,500 | | 19,500 |
| Audit-Related Fees | | 0 | | 0 |
| Tax Fees | | 3,000 | | 3,000 |
| All Other Fees | | 0 | | 0 |
The audit committee has adopted pre-approval policies and procedures that require the audit committee to pre-approve all audit and non-audit services of the registrant, including services provided to any entity affiliated with the registrant.
The percentage of fees billed by Cohen Fund Audit Services, Ltd. applicable to non-audit services pursuant to waiver of pre-approval requirement were as follows:
| | | FYE 05/31/2014 | | FYE 05/31/2013 |
| Audit-Related Fees | | 0% | | 0% |
| Tax Fees | | 0% | | 0% |
| All Other Fees | | 0% | | 0% |
All of the principal accountant’s hours spent on auditing the registrant’s financial statements were attributed to work performed by full-time permanent employees of the principal accountant. The following table indicates the non-audit fees billed or expected to be billed by the registrant’s accountant for services to the registrant and to the registrant’s investment adviser (and any other controlling entity, etc.—not sub-adviser) for the last two years. The audit committee of the board of directors has considered whether the provision of non-audit services that were rendered to the registrant's investment adviser is compatible with maintaining the principal accountant's independence and has concluded that the provision of such non-audit services by the accountant has not compromised the accountant’s independence.
| Non-Audit Related Fees | | FYE 05/31/2014 | | FYE 05/31/2013 |
| Registrant | | 3,000 | | 0 |
| Registrant’s Investment Adviser | | 22,500 | | 0 |
Item 5. Audit Committee of Listed Registrants.
Not applicable to registrants who are not listed issuers (as defined in Rule 10A-3 under the Securities Exchange Act of 1934).
Item 6. Investments.
Schedule of Investments is included as part of the report to shareholders filed under Item 1 of this Form.
Item 7. Disclosure of Proxy Voting Policies and Procedures for Closed-End Management Investment Companies.
Not applicable to open-end investment companies.
Item 8. Portfolio Managers of Closed-End Management Investment Companies.
Not applicable to open-end investment companies.
Item 9. Purchases of Equity Securities by Closed-End Management Investment Company and Affiliated Purchasers.
Not applicable to open-end investment companies.
Item 10. Submission of Matters to a Vote of Security Holders.
There have been no material changes to the procedures by which shareholders may recommend nominees to the registrant’s board of directors.
Item 11. Controls and Procedures.
| (a) | | The Registrant’s President and Treasurer have reviewed the Registrant's disclosure controls and procedures (as defined in Rule 30a-3(c) under the Investment Company Act of 1940 (the “Act”)) as of a date within 90 days of the filing of this report, as required by Rule 30a-3(b) under the Act and Rules 13a-15(b) or 15d-15(b) under the Securities Exchange Act of 1934. Based on their review, such officers have concluded that the disclosure controls and procedures are effective in ensuring that information required to be disclosed in this report is appropriately recorded, processed, summarized and reported and made known to them by others within the Registrant and by the Registrant’s service provider. |
| |
| (b) | | There were no changes in the Registrant's internal control over financial reporting (as defined in Rule 30a-3(d) under the Act) that occurred during the second fiscal quarter of the period covered by this report that has materially affected, or is reasonably likely to materially affect, the Registrant's internal control over financial reporting. |
Item 12. Exhibits.
| (a) | | (1) Any code of ethics or amendment thereto, that is the subject of the disclosure required by Item 2, to the extent that the registrant intends to satisfy Item 2 requirements through filing an exhibit. Incorporated by reference to the Registrant’s Form N-CSR filed August 9, 2004. |
| |
| | (2) A separate certification for each principal executive and principal financial officer pursuant to Section 302 of the Sarbanes-Oxley Act of 2002. Filed herewith. |
| |
| | (3) Any written solicitation to purchase securities under Rule 23c-1 under the Act sent or given during the period covered by the report by or on behalf of the registrant to 10 or more persons. Not applicable to open-end investment companies. |
| |
| (b) | | Certifications pursuant to Section 906 of the Sarbanes-Oxley Act of 2002. Furnished herewith. |
| |
SIGNATURES
Pursuant to the requirements of the Securities Exchange Act of 1934 and the Investment Company Act of 1940, the registrant has duly caused this report to be signed on its behalf by the undersigned, thereunto duly authorized.
| | (Registrant) | The Jensen Portfolio, Inc., doing business as Jensen Quality Growth Fund | |
| | By (Signature and Title)* | /s/ Robert McIver | |
| | Robert McIver, President | |
Pursuant to the requirements of the Securities Exchange Act of 1934 and the Investment Company Act of 1940, this report has been signed below by the following persons on behalf of the registrant and in the capacities and on the dates indicated.
| | By (Signature and Title)* | /s/ Robert McIver | |
| | Robert McIver, President | |
| | By (Signature and Title)* | /s/ Brian Ferrie | |
| | Brian Ferrie, Treasurer |
| * | Print the name and title of each signing officer under his or her signature. |