UNITED STATES
SECURITIES AND EXCHANGE COMMISSION
Washington, D.C. 20549
FORM N-CSR
CERTIFIED SHAREHOLDER REPORT OF REGISTERED
MANAGEMENT INVESTMENT COMPANIES
Investment Company Act file number 811-03833
MAINSTAY VP FUNDS TRUST
(Exact name of Registrant as specified in charter)
51 Madison Avenue, New York, NY 10010
(Address of principal executive offices) (Zip code)
J. Kevin Gao, Esq.
169 Lackawanna Avenue
Parsippany, NJ 07054
(Name and address of agent for service)
Registrant's telephone number, including area code: (212) 576-7000
Date of fiscal year end: December 31
Date of reporting period: December 31, 2012
FORM N-CSR
Item 1. Reports to Stockholders.

MainStay VP Funds Trust
Message from the President and Annual Report
December 31, 2012
Message from the President
Most stock and bond investors enjoyed positive total returns for 2012. Several major U.S., international and world stock market indexes provided double-digit returns during the reporting period.
The stock market’s progress, however, was far from uniform. Stocks began the year buoyed by signs that systemic risk in Europe was coming under control. The European Central Bank’s Long Term Financing Operations helped ease market concerns and provide needed liquidity. During the second quarter, however, stocks tumbled as investors again focused on major risk factors, including missed budget targets, contentious elections and slowing economic growth.
Stocks began to rise again at the end of May and reached their high point for the year in mid-September. The remainder of the year was relatively volatile but ended on an up note, as investors weighed in on the U.S. presidential election and the continued debate about how best to address the fiscal cliff.
Much of the market’s advance during the year can be attributed to central bank actions designed to calm investor concerns. In July, European Central Bank President Mario Draghi pledged to do “whatever it takes” to support the euro. Later, he outlined a plan for direct purchases of government bonds across Europe.
Throughout the year, the Federal Reserve held the federal funds rate in a range near zero. It also continued to extend the average maturity of its U.S. Treasury holdings in an effort to put downward pressure on longer-term interest rates, provide broad easing in financial market conditions and contribute to an economic recovery. In September, the Federal Open Market Committee agreed to increase policy accommodation by purchasing an additional $40 billion per month in agency mortgage-backed securities.
In the bond market, the prospect of continued low interest rates led yield-hungry investors to lengthen
maturities and lower their aversion to risk. During 2012, higher-risk fixed-income securities tended to outperform those with lower risk. As an asset class, high-yield bonds were the top performers, providing strong double-digit returns. They were followed by convertible securities, leveraged loans, and high-grade corporate bonds. U.S. government securities provided positive total returns in the low single digits. It is important to note, however, that past performance is no guarantee of future results.
While most investors are pleased when markets advance, the portfolio managers of MainStay VP Funds know that long-term results depend on more than short-term market movements. They also depend on the consistent application of well-defined investment strategies and risk-management techniques over longer periods.
At MainStay VP Funds, we believe that a long-term perspective can help investors as well. Rather than focus on daily or weekly market movements, we invite you to consider the long-term potential that can come from getting invested, staying invested and adding to your investments over time.
The following pages contain more specific information on the market events, investment decisions and securities that affected your MainStay VP Portfolio(s) during the 12 months ended December 31, 2012. We encourage you to read the information carefully and use it as part of your ongoing Portfolio evaluation and investment review.
Sincerely,

Stephen P. Fisher
President
Not part of the Annual Report
This page intentionally left blank
Table of Contents
Investors should refer to the MainStay VP Funds Trust Prospectus dated May 1, 2012, as supplemented, for a discussion of each Portfolio’s investment objectives, strategies and risks. You may obtain copies of the Prospectus and the relevant Statement of Additional Information free of charge, upon request, by calling toll-free 800-598-2019, or by writing to New York Life Insurance and Annuity Corporation, 51 Madison Avenue, Room 251, New York, New York 10010. These documents are also available at mainstayinvestments.com.
| | | | |
| mainstayinvestments.com | | | M-1 | |
Index Definitions
The information below is an explanation of the various indices and reference rates cited throughout the Portfolio Investment and Performance Comparisons and the Portfolio Management Discussion and Analysis sections that follow from page M-4 through page M-435. Please use this as a reference.
Please note that you cannot make an investment directly in an index. Past performance is no guarantee of future results. Results for securities indices assume reinvestment of all income and capital gains but do not reflect fees, expenses or taxes. Securities in each Portfolio may not precisely match those in a related index, and as a result, performance of the Portfolio may differ.
Balanced Composite Index is an unmanaged index that consists of the Russell Midcap® Value Index (60% weighted) and the Bank of America Merrill Lynch 1–10 Year U.S. Corporate & Government Index (40% weighted).
Bank of America Merrill Lynch 1–10 Year U.S. Corporate & Government Index is a market-capitalization-weighted index including U.S. government and fixed-coupon domestic investment-grade corporate bonds.
Bank of America Merrill Lynch All U.S. Convertible Index is a market-capitalization-weighted index of domestic corporate convertible securities. To be included in the Index, bonds and preferred stocks must be convertible only to common stock.
Barclays U.S. Aggregate Bond Index is a broad-based benchmark that measures the investment-grade, U.S. dollar denominated, fixed-rate taxable bond market, including Treasurys, government-related and corporate securities, mortgage-backed securities (agency fixed-rate and hybrid adjustable-rate mortgage pass-throughs), asset-backed securities and commercial mortgage-backed securities.
Barclays U.S. Government Bond Index is an unmanaged index that consists of publicly issued debt of the U.S. Treasury and government agencies.
Barclays U.S. TIPS Index includes all publicly issued, U.S. Treasury Inflation-Protected Securities that have at least one year remaining to maturity and are rated investment grade.
Barclays U.S. Government/Credit Bond Index includes investment-grade corporate debt issues as well as debt issues of U.S. government agencies and the U.S. Treasury, with maturities of at least one year.
Credit Suisse High Yield Index is an unmanaged market-weighted index that includes publicly traded bonds rated below BBB by Standard & Poor’s and below Baa by Moody’s.
Credit Suisse Leveraged Loan Index is an unmanaged index that represents tradable, senior-secured, U.S. dollar denominated non-investment-grade loans.
Dow Jones Global Utilities Index is a free float market-capitalization-weighted index that measures the performance of utility companies in developed and emerging markets.
Income Builder Composite Index consists of the MSCI World Index and the Barclays U.S. Aggregate Bond Index weighted 50%/50%, respectively.
Janus Balanced Composite Index is an unmanaged index that consists of the S&P 500® Index (55% weighted) and the Barclays U.S. Aggregate Bond Index (45% weighted).
LIBOR—London InterBank Offered Rate is a composite of interest rates at which banks borrow from one another in the London market, and it is a widely used benchmark for short-term interest rates.
Lipper Inc. is an independent monitor of fund performance. Results are based on total returns with all dividend and capital-gain distributions reinvested. More information about the Lipper peer group for an individual Portfolio can be found in the Portfolio’s Investment and Performance Comparison.
MSCI ACWI® Ex U.S. is a free float-adjusted market capitalization weighted index that is designed to measure the equity market performance of developed and emerging markets, excluding the United States.
MSCI EAFE® Index is an unmanaged index that consists of international stocks representing the developed world outside of North America.
MSCI Emerging Markets Index is a free float-adjusted market-capitalization-weighted index that is designed to measure equity market performance in the global emerging markets.
MSCI World Index is a free float-adjusted market- capitalization-weighted index that is designed to measure the equity market performance of developed markets.
Russell 1000® Index is an unmanaged index that measures the performance of the large-cap segment of the U.S. equity universe. It is a subset of the Russell 3000® Index and includes approximately 1,000 of the largest securities based on a combination of their market cap and current index membership. The Russell 1000® Index represents approximately 92% of the U.S. market.
Russell 1000® Growth Index is an unmanaged index that measures the performance of the large-cap growth segment of the U.S. equity universe. It includes those Russell 1000® Index companies with higher price- to-book ratios and higher forecasted growth values.
Russell 1000® Value Index is an unmanaged index that measures the performance of the large-cap value segment of the U.S. equity universe. It includes those Russell 1000® Index companies with lower price-to-book ratios and lower expected growth values.
Russell 2000® Growth Index is an unmanaged Index that measures the performance of the small-cap growth segment of the U.S. equity universe. It includes those Russell 2000® Index companies with higher price-to-book ratios and higher forecasted growth values.
Russell 2500™ Index is an unmanaged index that measures the performance of the small- to mid-cap segment of the U.S. equity universe, commonly referred to as “smid” cap. The Russell 2500™ Index is a subset of the Russell 3000® Index. It includes approximately 2,500 of the smallest securities based on a combination of their market cap and current index membership.
Russell 3000® Index is an unmanaged index that measures the performance of the largest 3,000 U.S. companies.
Russell Midcap® Index is an unmanaged index that measures the performance of the mid-cap segment of the U.S. equity universe. The Russell Midcap® Index is a subset of the Russell 1000® Index. It includes approximately 800 of the smallest securities based on a combination of their market
cap and current index membership. The Russell Midcap® Index represents approximately 31% of the total market capitalization of the Russell 1000® companies.
Russell Midcap® Value Index is an unmanaged index that measures the performance of the mid-cap value segment of the U.S. equity universe. It includes those Russell Midcap® Index companies with lower price-to-book ratios and lower forecasted growth values.
S&P 500® is a registered trademark of the McGraw-Hill Companies, Inc.
S&P 500® Index is an unmanaged index and is widely regarded as the standard index for measuring large-cap U.S. stock-market performance.
S&P North American Natural Resources Sector Index is a modified capitalization-weighted index designed as a benchmark for U.S. traded natural resource-related stocks. The natural resource sector includes mining, energy, paper and forest products, and plantation-owning companies.
| | | | |
| mainstayinvestments.com | | | M-3 | |
MainStay VP Balanced Portfolio
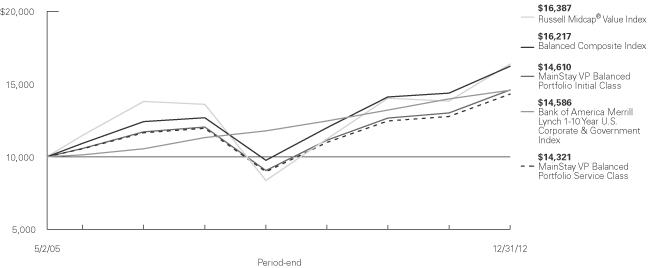
Investment and Performance Comparison1 (Unaudited)
Performance data quoted represents past performance. Past performance is no guarantee of future results. Because of market volatility, current performance may be lower or higher than the figures shown. Investment return and principal value will fluctuate, and as a result, when shares are redeemed, they may be worth more or less than their original cost. The performance table and graph do not reflect any deduction of sales charges, mortality and expense charges, contract charges or administrative charges. Please refer to the Performance Summary appropriate for your policy. For performance information current to the most recent month-end, please call 800-598-2019 or visit www.newyorklife.com.
Average Annual Total Returns for the Period Ended December 31, 2012
| | | | | | | | | | |
| Class | | One Year | | Five Years | | Since Inception (5/2/05) | | Gross Expense Ratio2 | |
| Initial Class Shares | | 12.32% | | 3.94% | | 5.06% | | | 0.84% | |
| Service Class Shares | | 12.04 | | 3.68 | | 4.79 | | | 1.09 | |
| | | | | | | | | | | | |
| Benchmark Performance | | One
Year | | | Five
Years | | | Since Inception
(5/2/05) | |
Russell Midcap® Value Index3 | | | 18.51 | % | | | 3.79 | % | | | 6.65 | % |
Balanced Composite Index3 | | | 12.74 | | | | 5.04 | | | | 6.50 | |
Bank of America Merrill Lynch 1-10 Year U.S. Corporate & Government Index3 | | | 4.24 | | | | 5.19 | | | | 5.05 | |
Average Lipper Variable Products Mixed-Asset Target Allocation Growth Portfolio4 | | | 13.50 | | | | 1.93 | | | | 5.20 | |
| 1. | Performance figures reflect certain fee waivers and/or expense limitations, without which total returns may have been different. For information on current fee waivers and/or expense limitations, please refer to the notes to the financial statements. |
| 2. | The gross expense ratios presented reflect the Portfolio’s “Total Annual Portfolio Operating Expenses” from the most recent Prospectus and may differ from other expense ratios disclosed in this report. |
| 3. | Please refer to pages M-2 and M-3 for additional explanations and disclosure regarding the Portfolios, their benchmark indices and other indices mentioned in the reports. |
| 4. | The Average Lipper Variable Products Mixed-Asset Target Allocation Growth Portfolio is representative of portfolios that, by portfolio practice, maintain a mix of between 60%-80% equity securities, with the remainder invested in bonds, cash, and cash equivalents. Lipper Inc. is an independent monitor of fund performance. Results are based on total returns with all dividend and capital gain distributions reinvested. |
| | |
| M-4 | | MainStay VP Balanced Portfolio |
Cost in Dollars of a $1,000 Investment in MainStay VP Balanced Portfolio (Unaudited)
The example below is intended to describe the fees and expenses borne by shareholders during the six-month period from July 1, 2012 to December 31, 2012, and the impact of those costs on your investment.
Example
As a shareholder of the Portfolio, you incur two types of costs: (1) transaction costs, including exchange fees and sales charges (loads) on purchases (as applicable), and (2) ongoing costs, including management fees, distribution and/or service (12b-1) fees, and other Portfolio expenses (as applicable). This example is intended to help you understand your ongoing costs (in dollars) of investing in the Portfolio and to compare these costs with the ongoing costs of investing in other Portfolios. The example is based on an investment of $1,000 made at the beginning of the six-month period and held for the entire period from July 1, 2012, to December 31, 2012. Shares are only sold in connection with variable life and annuity contracts and the example does not reflect any contract level or transactional fees or expenses. If these costs had been included, your costs would have been higher.
This example illustrates your Portfolio’s ongoing costs in two ways:
Actual Expenses
The second and third data columns in the table below provide information about actual account values and actual expenses. You may use the information in these columns, together with the amount you invested, to estimate the expenses that you paid during the six months ended
December 31, 2012. Simply divide your account value by $1,000 (for example, an $8,600 account value divided by $1,000 = 8.6), then multiply the result by the number under the heading entitled ‘‘Expenses Paid During Period’’ to estimate the expenses you paid on your account during this period.
Hypothetical Example for Comparison Purposes
The fourth and fifth data columns in the table below provide information about hypothetical account values and hypothetical expenses based on the Portfolio’s actual expense ratio and an assumed rate of return of 5% per year before expenses, which is not the Portfolio’s actual return. The hypothetical account values and expenses may not be used to estimate the actual ending account balances or expenses you paid for the six-month period shown. You may use this information to compare the ongoing costs of investing in the Portfolio with the ongoing costs of investing in other Portfolios. To do so, compare this 5% hypothetical example with the 5% hypothetical examples that appear in the shareholder reports of the other Portfolios.
Please note that the expenses shown in the table are meant to highlight your ongoing costs only and do not reflect any transactional costs, such as exchange fees or sales charges (loads). Therefore, the fourth and fifth data columns of the table are useful in comparing ongoing costs only and will not help you determine the relative total costs of owning different funds. In addition, if these transactional costs were included, your costs would have been higher.
| | | | | | | | | | | | | | | | | | | | |
| | | | | | | | | | | | | | | | |
| Share Class | | Beginning
Account
Value
7/1/12 | | | Ending Account
Value (Based
on Actual
Returns and
Expenses)
12/31/12 | | | Expenses
Paid
During
Period1 | | | Ending Account
Value (Based
on Hypothetical
5% Annualized
Return and
Actual Expenses)
12/31/12 | | | Expenses
Paid
During
Period1 | |
| | | | | |
| Initial Class Shares | | $ | 1,000.00 | | | $ | 1,061.00 | | | $ | 4.04 | | | $ | 1,021.20 | | | $ | 3.96 | |
| | | | | |
| Service Class Shares | | $ | 1,000.00 | | | $ | 1,059.70 | | | $ | 5.33 | | | $ | 1,020.00 | | | $ | 5.23 | |
| 1. | Expenses are equal to the Portfolio’s annualized expense ratio of each class (0.78% for Initial Class and 1.03% for Service Class) multiplied by the average account value over the period, divided by 366 and multiplied by 184 (to reflect the six-month period). The table above represents the actual expenses incurred during the six-month period. |
| | | | |
| mainstayinvestments.com | | | M-5 | |
Portfolio Composition as of December 31, 2012 (Unaudited)
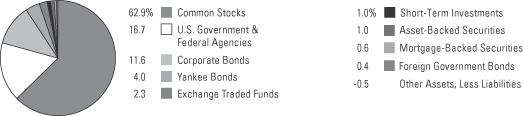
See Portfolio of Investments beginning on page M-10 for specific holdings within these categories.
Top Ten Holdings or Issuers Held as of December 31, 2012 (excluding short-term investments) (Unaudited)
| 1. | United States Treasury Notes, 0.125%–2.25%, due 9/30/14–11/15/22 |
| 2. | S&P Midcap 400 Index—Midcap SPDR Trust Series 1 |
| 3. | Federal Home Loan Mortgage Corporation, 0.50%–1.75%, due 11/25/14–8/1/19 |
| 4. | Federal National Mortgage Association, 0.375%–2.75%, due 3/13/14–12/28/17 |
| 5. | S&P 500 Index—SPDR Trust Series 1 |
| 9. | Marathon Petroleum Corp. |
| | |
| M-6 | | MainStay VP Balanced Portfolio |
Portfolio Management Discussion and Analysis (Unaudited)
Answers to the questions reflect the views of portfolio managers Jae S. Yoon, CFA, Thomas J. Girard, Donald F. Serek, CFA, and George S. Cherpelis of New York Life Investments,1 the Portfolio’s Manager, and Harvey J. Fram, CFA, of Madison Square Investors LLC,2 the Portfolio’s Subadvisor.
��
How did MainStay VP Balanced Portfolio perform relative to its peers and its benchmarks during the 12 months ended December 31, 2012?
For the 12 months ended December 31, 2012, MainStay VP Balanced Portfolio returned 12.32% for Initial Class shares and 12.04% for Service Class shares. Over the same period both share classes underperformed the 13.50% return of the average Lipper3 Variable Products Mixed-Asset Target Allocation Growth Portfolio, the 18.51% return of the Russell Midcap® Value Index3 and the 12.74% return of the Balanced Composite Index.3 Both share classes outperformed the 4.24% return of the Bank of America Merrill Lynch 1–10 Year U.S. Corporate & Government Index3 for the 12 months ended December 31, 2012. The Russell Midcap® Value Index is the Portfolio’s broad-based securities-market index. The Balanced Composite Index is the secondary benchmark for the Portfolio. The Bank of America Merrill Lynch 1–10 Year U.S. Corporate & Government Index is an additional benchmark for the Portfolio.
Were there any changes to the Portfolio during the reporting period?
At a meeting held on December 10–12, 2012, the Portfolio’s Board of Trustees approved, effective February 28, 2013, a change in the Portfolio’s Principal Investment Strategy and the addition of Andrew Ver Planck as a portfolio manager of the Portfolio. For more information on these changes, see the Supplement dated December 17, 2012, to the Prospectus dated May 1, 2012, as supplemented.
What factors affected the Portfolio’s relative performance during the reporting period?
In the equity portion of the Portfolio, the most important factor affecting relative performance was that many stocks started 2012 at unprecedentedly low valuation levels. By the end of the year, almost all of them had not only survived but had seen their multiples expand. The best example of this is in the energy sector, where refinery stocks were particularly strong contributors. (Contributions take weightings and total returns into account.) The turnaround in the housing market also affected relative performance. The price of PulteGroup shares almost tripled, and the
equity portion of the Portfolio held an overweight position in the stock.
Throughout the majority of the year, the fixed-income portion of the Portfolio held overweight positions in corporate bonds, mortgage-backed securities, commercial mortgage-backed securities and asset-backed securities. These sectors performed extremely well during the reporting period and added to the Portfolio’s relative performance. Corporate bonds made the most significant positive contributions.
During the second quarter of 2012, the fixed-income portion of the Portfolio reduced its overall exposure to risk assets. As we reduced allocations to corporate bonds and mortgage-backed securities, we also decreased the degree to which the fixed-income portion of the Portfolio was underweight in U.S. Treasury and agency securities. We maintained an overweight position in commercial mortgage-backed securities and slightly increased the allocation to asset-backed securities in the fixed-income portion of the Portfolio. The repositioning resulted in positive performance for the reporting period, as security selection within spread4 assets was accretive to performance.
Which sectors were the strongest positive contributors to relative performance in the equity portion of the Portfolio, and which sectors were particularly weak?
In the equity portion of the Portfolio, financials, energy and materials made the strongest positive contributions to excess returns relative to the Russell Midcap® Value Index. The standout stock among financials was Bank of America, whose stock price more than doubled for the year as much of the uncertainty about the company’s mortgage-related problems dissipated. In energy, refinery stocks such as Tesoro and Phillips 66 outperformed the Index after starting the year at valuations that we felt were extremely attractive. In materials, stocks such as chemicals company LyondellBasell Industries benefited from low raw material costs and from sales growth in many areas, including automobiles and housing.
| 1. | “New York Life Investments” is a service mark used by New York Life Investment Management LLC. |
| 2. | Effective on or about January 25, 2013, Madison Square Investors LLC changed its name to Cornerstone Capital Management Holdings LLC. |
| 3. | Please refer to pages M-2 and M-3 for additional explanations and disclosure regarding the Portfolios, their benchmark indices and service providers mentioned in the reports. |
| 4. | The terms “spread” and “yield spread” may refer to the difference in yield between a security or type of security and comparable U.S. Treasury issues. The terms may also refer to the difference in yield between two specific securities or types of securities at a given time. |
| | | | |
| mainstayinvestments.com | | | M-7 | |
The sectors that made the weakest contributions to performance in the equity portion of the Portfolio were industrials, information technology and consumer staples. Poor stock selection in industrials and consumer staples hurt performance. In the equity portion of the Portfolio, information technology also detracted from relative performance, largely because of overweight positions in Hewlett-Packard and Dell.
During the reporting period, which individual stocks made the strongest positive contributions to absolute performance in the equity portion of the Portfolio and which stocks detracted the most?
In the equity portion of the Portfolio, the best contributions to the Portfolio’s absolute performance came from refiners Marathon Petroleum and Valero Energy and from financial company Bank of America. Refiners were among the stocks that started the year at extremely attractive valuations and saw their multiples expand over the year as profitability improved. Bank of America advanced as mortgage-related concerns dissipated.
Hewlett-Packard, Dell and Humana were the worst absolute performers in the equity portion of the Portfolio. Facing strong competition from tablet devices, Hewlett-Packard and Dell continued to see PC sales decline. Humana came under pressure after the Patient Protection and Affordable Care Act, commonly known as Obamacare, was upheld by the Supreme Court.
Did the equity portion of the Portfolio make any significant purchases or sales during the reporting period?
Among the stocks the equity portion of the Portfolio purchased in 2012, two household durables companies—home builder PulteGroup and home appliance manufacturer Whirlpool—were noteworthy. Both stocks benefited from the recovery in the U.S. housing market.
During 2012, the equity portion of the Portfolio reduced its weighing in mortgage finance real estate investment trust (REIT) Annaly Capital Management and steel producer Nucor. Despite having a high dividend yield, Annaly Capital Management had become relatively expensive on a cash flow basis as demand for high-yield stocks rose in 2011. Nucor’s stock price weakened as steel prices declined.
How did sector weightings change in the equity portion of the Portfolio during the reporting period?
The equity portion of the Portfolio increased its sector weightings relative to the Russell Midcap® Value Index in consumer staples and financials. Despite the increase in financials, the equity portion of the Portfolio was underweight relative to the Index. During the reporting period, we decreased relative exposure to the energy and information technology sectors in the equity portion of the Portfolio. It should be noted that sector weightings in the Russell Midcap® Value Index can change substantially from year to year when the Index is reconstituted. In 2012, the Index weighting in energy saw a substantial increase, and the Index weighting in consumer staples saw a substantial decrease.
How was the equity portion of the Portfolio positioned at the end of the reporting period?
As of December 31, 2012, the sectors in the equity portion of the Portfolio that were most substantially overweight relative to the Russell Midcap® Value Index were health care and consumer staples. As of the same date, the most substantially underweight sectors in the equity portion of the Portfolio were financials and utilities. We typically seek to keep sector deviations from the Russell Midcap® Value Index at moderate levels. As of December 31, 2012, however, the deviation in financials was fairly large.
What was the duration strategy of the fixed-income portion of the Portfolio during the reporting period?
The duration of the fixed-income portion of the Portfolio varied over the course of the reporting period. In general, the duration was close to that of the Bank of America Merrill Lynch 1–10 Year U.S. Corporate & Government Index. There were, however, two instances when the duration of the fixed-income portion of the Portfolio was modestly shorter or longer. The first instance was during the first half of the reporting period, when the duration of the fixed-income portion of the Portfolio was shorter than that of the Bank of America Merrill Lynch 1–10 Year U.S. Corporate & Government Index. The second instance was in the second half of the reporting period, when the duration of the fixed-income portion of the Portfolio was longer than that of this Index. Overall duration positioning had a modestly negative impact on the Portfolio’s performance during the reporting period.
| | |
| M-8 | | MainStay VP Balanced Portfolio |
What specific factors, risks or market forces prompted significant decisions for the fixed-income portion of the Portfolio during the reporting period?
There were three periods where specific factors, risks and market forces prompted asset allocation decisions for the Portfolio during the reporting period. The Portfolio started the reporting period with an overweight position in spread assets. This positioning was adopted because we anticipated that funding pressures in Europe would abate and the U.S. economy would improve. This allocation decision contributed positively to the Portfolio’s performance. Toward the start of the second quarter of 2012, however, an upward swing in global economic risks and rising systemic risk from Europe prompted us to reduce spread-asset exposure to levels that were more neutral. This allocation decision was defensive, and the Portfolio’s performance during this portion of the reporting period was neutral to the benchmark. In the third quarter of 2012, aggressive central bank actions led us to once again view spread assets favorably. We increased the allocation to spread assets, maintaining overweight positions in them until the end of the reporting period. These allocation decisions were accretive to performance, as spread assets generated positive excess returns.
During the reporting period, which market segments were the strongest contributors to performance in the fixed-income portion of the Portfolio and which market segments were particularly weak?
During the reporting period, overweight positions relative to the Bank of America Merrill Lynch 1–10 Year U.S. Corporate & Government Index in corporate bonds, asset-backed securities, mortgage-backed securities and commercial mortgage-backed securities were all strong contributors to performance in the fixed-income portion of the Portfolio. Within the fixed-income portion of the Portfolio, corporate bonds—specifically overweight positions in financials, industrials and utilities—made the most substantial contribution to performance.
In the fixed-income portion of the Portfolio, an underweight position relative to the Bank of America Merrill Lynch 1–10 Year U.S. Corporate & Government Index in U.S. Treasury securities was the most substantial detractor from performance. The negative impact of U.S. Treasury securities, however, was more than offset by the returns on spread assets. Duration positioning had a modestly negatively impact on performance.
Did the fixed-income portion of the Portfolio make any significant purchases or sales during the reporting period?
Outside of its normal operating parameters, the fixed-income portion of the Portfolio did not make any significant purchases or sales.
During the reporting period, how did sector weightings change in the fixed-income portion of the Portfolio?
As previously noted, we modified exposure to spread assets throughout the year in response to risk factors and perceived reward potential. We funded overweight positions in spread assets by lowering allocations to U.S. Treasury and agency securities.
How was the fixed-income portion of the Portfolio positioned at the end of the reporting period?
As of December 31, 2012, the fixed-income portion of the Portfolio held overweight positions relative to the Bank of America Merrill Lynch 1–10 Year U.S. Corporate & Government Index in spread assets. The largest overweight was in U.S. corporate bonds, followed by mortgage-backed securities. In addition, the fixed-income portion of the Portfolio held overweight positions relative to this Index in asset-backed securities and commercial mortgage-backed securities. As of the same date, the fixed-income portion of the Portfolio held an underweight position relative to this Index in U.S. Treasurys. As of December 31, 2012, the duration of the fixed-income portion of the Portfolio was neutral in relation to the Bank of America Merrill Lynch 1–10 Year U.S. Corporate & Government Index.
The opinions expressed are those of the portfolio managers as of the date of this report and are subject to change. There is no guarantee that any forecasts made will come to pass. This material does not constitute investment advice and is not intended as an endorsement of any specific investment.
Not all MainStay VP Portfolios and/or share classes are available under all policies.
| | | | |
| mainstayinvestments.com | | | M-9 | |
Portfolio of Investments December 31, 2012
| | | | | | | | |
| | | Principal
Amount | | | Value | |
| | | | | | | | |
Long-Term Bonds 34.3%†
Asset-Backed Securities 1.0% | |
Automobile 0.6% | |
Ally Auto Receivables Trust
Series 2012-1, Class A3
0.93%, due 2/16/16 | | $ | 90,000 | | | $ | 90,561 | |
Ford Credit Auto Owner Trust
Series 2012-A, Class A3
0.84%, due 8/15/16 | | | 150,000 | | | | 150,783 | |
Huntington Auto Trust
Series 2012-2, Class A3
0.51%, due 4/17/17 | | | 200,000 | | | | 199,925 | |
Hyundai Auto Receivables Trust
Series 2012-A, Class A3
0.72%, due 3/15/16 | | | 156,000 | | | | 156,541 | |
Mercedes-Benz Auto Receivables Trust | | | | | | | | |
Series 2012-1, Class A3
0.47%, due 10/17/16 | | | 300,000 | | | | 299,885 | |
Series 2009-1, Class A3
1.67%, due 1/15/14 | | | 11,030 | | | | 11,040 | |
USAA Auto Owner Trust
Series 2012-1, Class A3
0.43%, due 8/15/16 | | | 100,000 | | | | 99,928 | |
Volkswagen Auto Loan Enhanced Trust
Series 2012-1, Class A3
0.85%, due 8/22/16 | | | 150,000 | | | | 150,879 | |
World Omni Automobile Lease Securitization Trust
Series 2012-A, Class A3
0.93%, due 11/16/15 | | | 100,000 | | | | 100,626 | |
| | | | | | | | |
| | | | | | | 1,260,168 | |
| | | | | | | | |
Credit Cards 0.1% | |
Discover Card Master Trust
Series 2012-A1, Class A1
0.81%, due 8/15/17 | | | 86,000 | | | | 86,649 | |
| | | | | | | | |
|
Other ABS 0.3% | |
CNH Equipment Trust
Series 2012-C, Class A3
0.57%, due 12/15/17 | | | 200,000 | | | | 200,031 | |
John Deere Owner Trust | | | | | | | | |
Series 2012-B, Class A3
0.53%, due 7/15/16 | | | 200,000 | | | | 200,146 | |
Series 2012-A, Class A3
0.75%, due 3/15/16 | | | 200,000 | | | | 200,689 | |
| | | | | | | | |
| | | | | | | 600,866 | |
| | | | | | | | |
Total Asset-Backed Securities
(Cost $1,942,909) | | | | | | | 1,947,683 | |
| | | | | | | | |
| | | | | | | | |
| | | Principal
Amount | | | Value | |
| | | | | | | | |
| Corporate Bonds 11.6% | |
Aerospace & Defense 0.4% | |
General Dynamics Corp. | | | | | | | | |
2.25%, due 7/15/16 | | $ | 50,000 | | | $ | 52,403 | |
2.25%, due 11/15/22 | | | 250,000 | | | | 244,646 | |
Northrop Grumman Corp.
1.85%, due 11/15/15 | | | 100,000 | | | | 102,679 | |
United Technologies Corp.
1.80%, due 6/1/17 | | | 300,000 | | | | 308,808 | |
| | | | | | | | |
| | | | | | | 708,536 | |
| | | | | | | | |
Auto Manufacturers 0.1% | |
Daimler Finance North America LLC
3.875%, due 9/15/21 (a) | | | 150,000 | | | | 161,816 | |
| | | | | | | | |
|
Banks 2.2% | |
¨Bank of America Corp. | | | | | | | | |
3.70%, due 9/1/15 | | | 50,000 | | | | 52,857 | |
4.50%, due 4/1/15 | | | 450,000 | | | | 479,667 | |
5.65%, due 5/1/18 | | | 375,000 | | | | 436,291 | |
BB&T Corp.
1.45%, due 1/12/18 | | | 100,000 | | | | 100,447 | |
Capital One Financial Corp. | | | | | | | | |
1.00%, due 11/6/15 | | | 200,000 | | | | 199,324 | |
2.15%, due 3/23/15 | | | 150,000 | | | | 153,111 | |
¨Citigroup, Inc. | | | | | | | | |
4.587%, due 12/15/15 | | | 160,000 | | | | 174,680 | |
5.375%, due 8/9/20 | | | 100,000 | | | | 117,845 | |
5.50%, due 10/15/14 | | | 450,000 | | | | 482,778 | |
6.00%, due 8/15/17 | | | 100,000 | | | | 117,815 | |
6.01%, due 1/15/15 | | | 25,000 | | | | 27,318 | |
Goldman Sachs Group, Inc. (The) | | | | | | | | |
3.625%, due 2/7/16 | | | 75,000 | | | | 79,389 | |
5.375%, due 3/15/20 | | | 125,000 | | | | 143,254 | |
6.00%, due 6/15/20 | | | 100,000 | | | | 118,821 | |
HSBC USA, Inc.
1.625%, due 1/16/18 | | | 250,000 | | | | 250,227 | |
¨JPMorgan Chase & Co. | | | | | | | | |
3.25%, due 9/23/22 | | | 225,000 | | | | 231,701 | |
4.35%, due 8/15/21 | | | 400,000 | | | | 447,295 | |
KeyCorp
6.50%, due 5/14/13 | | | 275,000 | | | | 280,902 | |
Morgan Stanley
5.50%, due 1/26/20 | | | 100,000 | | | | 112,179 | |
Wachovia Bank
4.80%, due 11/1/14 | | | 440,000 | | | | 472,276 | |
| | | | | | | | |
| | | | | | | 4,478,177 | |
| | | | | | | | |
| † | Percentages indicated are based on Portfolio net assets. |
| ¨ | | Among the Portfolio’s 10 largest holdings or issuers held, as of December 31, 2012, excluding short-term investments. May be subject to change daily. |
| | | | |
| M-10 | | MainStay VP Balanced Portfolio | | The notes to the financial statements are an integral part of,
and should be read in conjunction with, the financial statements. |
| | | | | | | | |
| | | Principal
Amount | | | Value | |
| | | | | | | | |
| Corporate Bonds (continued) | |
Beverages 0.3% | |
Anheuser-Busch InBev Worldwide, Inc. | | | | | | | | |
1.375%, due 7/15/17 | | $ | 250,000 | | | $ | 252,633 | |
4.375%, due 2/15/21 | | | 75,000 | | | | 87,269 | |
SABMiller Holdings, Inc.
2.45%, due 1/15/17 (a) | | | 250,000 | | | | 260,599 | |
| | | | | | | | |
| | | | | | | 600,501 | |
| | | | | | | | |
Building Materials 0.1% | |
CRH America, Inc.
4.125%, due 1/15/16 | | | 100,000 | | | | 104,120 | |
| | | | | | | | |
|
Chemicals 0.4% | |
Dow Chemical Co. (The) | | | | | | | | |
3.00%, due 11/15/22 | | | 200,000 | | | | 199,555 | |
5.70%, due 5/15/18 | | | 150,000 | | | | 178,391 | |
Eastman Chemical Co.
2.40%, due 6/1/17 | | | 75,000 | | | | 77,493 | |
Ecolab, Inc. | | | | | | | | |
1.45%, due 12/8/17 | | | 125,000 | | | | 124,432 | |
4.35%, due 12/8/21 | | | 125,000 | | | | 139,523 | |
| | | | | | | | |
| | | | | | | 719,394 | |
| | | | | | | | |
Commercial Services 0.1% | |
Western Union Co. (The)
2.875%, due 12/10/17 | | | 150,000 | | | | 148,627 | |
| | | | | | | | |
|
Computers 0.3% | |
Hewlett-Packard Co. | | | | | | | | |
2.35%, due 3/15/15 | | | 425,000 | | | | 426,893 | |
4.65%, due 12/9/21 | | | 125,000 | | | | 125,486 | |
| | | | | | | | |
| | | | | | | 552,379 | |
| | | | | | | | |
Cosmetics & Personal Care 0.0%‡ | |
Procter & Gamble Co. (The)
1.45%, due 8/15/16 | | | 50,000 | | | | 50,948 | |
| | | | | | | | |
|
Diversified Financial Services 0.3% | |
General Electric Capital Corp. | | | | | | | | |
2.10%, due 12/11/19 | | | 175,000 | | | | 175,495 | |
2.30%, due 4/27/17 | | | 250,000 | | | | 259,220 | |
6.00%, due 8/7/19 | | | 225,000 | | | | 273,727 | |
| | | | | | | | |
| | | | | | | 708,442 | |
| | | | | | | | |
Electric 1.3% | |
American Electric Power Co., Inc.
1.65%, due 12/15/17 | | | 200,000 | | | | 200,701 | |
Commonwealth Edison Co.
1.95%, due 9/1/16 | | | 100,000 | | | | 103,165 | |
Consumers Energy Co.
2.85%, due 5/15/22 | | | 50,000 | | | | 51,681 | |
| | | | | | | | |
| | | Principal
Amount | | | Value | |
| | | | | | | | |
Electric (continued) | |
Entergy Louisiana LLC | | | | | | | | |
1.875%, due 12/15/14 | | $ | 25,000 | | | $ | 25,543 | |
3.30%, due 12/1/22 | | | 50,000 | | | | 50,058 | |
Entergy Mississippi, Inc.
3.10%, due 7/1/23 | | | 50,000 | | | | 49,354 | |
Great Plains Energy, Inc. | | | | | | | | |
2.75%, due 8/15/13 | | | 250,000 | | | | 252,592 | |
4.85%, due 6/1/21 | | | 55,000 | | | | 60,595 | |
5.292%, due 6/15/22 (b) | | | 45,000 | | | | 50,569 | |
Kansas City Power & Light Co.
7.15%, due 4/1/19 | | | 250,000 | | | | 319,538 | |
NextEra Energy Capital Holdings, Inc.
1.20%, due 6/1/15 | | | 100,000 | | | | 100,711 | |
Niagara Mohawk Power Corp.
2.721%, due 11/28/22 (a) | | | 100,000 | | | | 99,439 | |
Nisource Finance Corp.
4.45%, due 12/1/21 | | | 100,000 | | | | 109,502 | |
NSTAR Electric Co.
2.375%, due 10/15/22 | | | 150,000 | | | | 149,076 | |
Pepco Holdings, Inc.
2.70%, due 10/1/15 | | | 100,000 | | | | 103,512 | |
PPL Capital Funding, Inc. | | | | | | | | |
3.50%, due 12/1/22 | | | 100,000 | | | | 101,790 | |
4.20%, due 6/15/22 | | | 100,000 | | | | 107,540 | |
Progress Energy, Inc.
6.05%, due 3/15/14 | | | 250,000 | | | | 265,326 | |
Westar Energy, Inc.
6.00%, due 7/1/14 | | | 300,000 | | | | 321,260 | |
| | | | | | | | |
| | | | | | | 2,521,952 | |
| | | | | | | | |
Electronics 0.2% | |
Thermo Fisher Scientific, Inc.
1.85%, due 1/15/18 | | | 400,000 | | | | 405,477 | |
| | | | | | | | |
|
Engineering & Construction 0.1% | |
ABB Finance USA, Inc.
2.875%, due 5/8/22 | | | 100,000 | | | | 102,384 | |
| | | | | | | | |
|
Finance—Auto Loans 0.1% | |
Ford Motor Credit Co. LLC
4.25%, due 9/20/22 | | | 200,000 | | | | 211,477 | |
| | | | | | | | |
|
Finance—Commercial 0.1% | |
Caterpillar Financial Services Corp.
2.05%, due 8/1/16 | | | 225,000 | | | | 232,912 | |
| | | | | | | | |
|
Finance—Consumer Loans 0.2% | |
John Deere Capital Corp. | | | | | | | | |
1.70%, due 1/15/20 | | | 200,000 | | | | 197,952 | |
2.80%, due 9/18/17 | | | 50,000 | | | | 53,376 | |
5.75%, due 9/10/18 | | | 75,000 | | | | 91,458 | |
| | | | | | | | |
| | | | | | | 342,786 | |
| | | | | | | | |
| | | | | | |
The notes to the financial statements are an integral part of,
and should be read in conjunction with, the financial statements. | | mainstayinvestments.com | | | M-11 | |
Portfolio of Investments December 31, 2012 (continued)
| | | | | | | | |
| | | Principal
Amount | | | Value | |
| | | | | | | | |
| Corporate Bonds (continued) | |
Finance—Credit Card 0.1% | |
American Express Co.
5.50%, due 9/12/16 | | $ | 250,000 | | | $ | 285,815 | |
| | | | | | | | |
|
Finance—Leasing Companies 0.0%‡ | |
Boeing Capital Corp.
2.90%, due 8/15/18 | | | 50,000 | | | | 53,908 | |
| | | | | | | | |
|
Finance—Other Services 0.2% | |
Aon Corp.
3.125%, due 5/27/16 | | | 75,000 | | | | 78,958 | |
National Rural Utilities Cooperative Finance Corp. | | | | | | | | |
1.90%, due 11/1/15 | | | 100,000 | | | | 103,152 | |
3.05%, due 2/15/22 | | | 100,000 | | | | 104,907 | |
5.45%, due 4/10/17 | | | 100,000 | | | | 117,152 | |
| | | | | | | | |
| | | | | | | 404,169 | |
| | | | | | | | |
Food 0.4% | |
General Mills, Inc.
3.15%, due 12/15/21 | | | 200,000 | | | | 209,058 | |
Ingredion, Inc.
1.80%, due 9/25/17 | | | 75,000 | | | | 74,507 | |
Kellogg Co.
1.75%, due 5/17/17 | | | 75,000 | | | | 76,218 | |
Mondelez International, Inc.
4.125%, due 2/9/16 | | | 375,000 | | | | 408,564 | |
Unilever Capital Corp.
0.85%, due 8/2/17 | | | 100,000 | | | | 98,992 | |
| | | | | | | | |
| | | | | | | 867,339 | |
| | | | | | | | |
Forest Products & Paper 0.1% | |
International Paper Co.
4.75%, due 2/15/22 | | | 150,000 | | | | 169,730 | |
| | | | | | | | |
|
Gas 0.0%‡ | |
Sempra Energy
2.30%, due 4/1/17 | | | 75,000 | | | | 77,878 | |
| | | | | | | | |
|
Hand & Machine Tools 0.0%‡ | |
Stanley Black & Decker, Inc.
3.40%, due 12/1/21 | | | 50,000 | | | | 52,192 | |
| | | | | | | | |
|
Health Care—Products 0.2% | |
Becton Dickinson and Co.
3.125%, due 11/8/21 | | | 200,000 | | | | 213,699 | |
CR Bard, Inc.
1.375%, due 1/15/18 | | | 75,000 | | | | 75,396 | |
Medtronic, Inc.
3.125%, due 3/15/22 | | | 75,000 | | | | 79,630 | |
| | | | | | | | |
| | | Principal
Amount | | | Value | |
| | | | | | | | |
Health Care—Products (continued) | |
Zimmer Holdings, Inc.
1.40%, due 11/30/14 | | $ | 100,000 | | | $ | 100,752 | |
| | | | | | | | |
| | | | | | | 469,477 | |
| | | | | | | | |
Health Care—Services 0.4% | |
Aetna, Inc.
1.75%, due 5/15/17 | | | 50,000 | | | | 50,754 | |
Laboratory Corp. of America Holdings
2.20%, due 8/23/17 | | | 100,000 | | | | 102,644 | |
Roche Holdings, Inc.
5.00%, due 3/1/14 (a) | | | 291,000 | | | | 305,683 | |
UnitedHealth Group, Inc.
2.75%, due 2/15/23 | | | 100,000 | | | | 100,900 | |
WellPoint, Inc.
1.875%, due 1/15/18 | | | 150,000 | | | | 151,863 | |
| | | | | | | | |
| | | | | | | 711,844 | |
| | | | | | | | |
Insurance 0.4% | |
MetLife, Inc.
1.756%, due 12/15/17 | | | 150,000 | | | | 152,361 | |
Metropolitan Life Global Funding I | | | | | | | | |
2.00%, due 1/9/15 (a) | | | 175,000 | | | | 179,722 | |
5.125%, due 6/10/14 (a) | | | 225,000 | | | | 239,198 | |
Principal Financial Group, Inc.
8.875%, due 5/15/19 | | | 90,000 | | | | 120,766 | |
Prudential Financial, Inc.
4.50%, due 11/16/21 | | | 100,000 | | | | 112,464 | |
| | | | | | | | |
| | | | | | | 804,511 | |
| | | | | | | | |
Machinery—Diversified 0.1% | |
Roper Industries, Inc.
6.625%, due 8/15/13 | | | 150,000 | | | | 155,342 | |
| | | | | | | | |
|
Media 0.4% | |
COX Communications, Inc. | | | | | | | | |
3.25%, due 12/15/22 (a) | | | 100,000 | | | | 103,126 | |
5.45%, due 12/15/14 | | | 64,000 | | | | 69,797 | |
DIRECTV Holdings LLC / DIRECTV Financing Co., Inc.
3.50%, due 3/1/16 | | | 75,000 | | | | 79,456 | |
NBC Universal Media LLC
5.15%, due 4/30/20 | | | 125,000 | | | | 148,182 | |
Reed Elsevier Capital, Inc.
7.75%, due 1/15/14 | | | 100,000 | | | | 107,082 | |
Time Warner Cable, Inc.
6.75%, due 7/1/18 | | | 100,000 | | | | 124,918 | |
Viacom, Inc.
1.25%, due 2/27/15 | | | 100,000 | | | | 100,976 | |
| | | | | | | | |
| | | | | | | 733,537 | |
| | | | | | | | |
Metal Fabricate & Hardware 0.0%‡ | |
Precision Castparts Corp.
2.50%, due 1/15/23 | | | 100,000 | | | | 100,641 | |
| | | | | | | | |
| | | | |
| M-12 | | MainStay VP Balanced Portfolio | | The notes to the financial statements are an integral part of,
and should be read in conjunction with, the financial statements. |
| | | | | | | | |
| | | Principal
Amount | | | Value | |
| | | | | | | | |
| Corporate Bonds (continued) | |
Miscellaneous—Manufacturing 0.1% | |
Eaton Corp.
1.50%, due 11/2/17 (a) | | $ | 150,000 | | | $ | 150,307 | |
General Electric Co.
2.70%, due 10/9/22 | | | 50,000 | | | | 50,965 | |
| | | | | | | | |
| | | | | | | 201,272 | |
| | | | | | | | |
Oil & Gas 0.2% | |
Marathon Oil Corp.
0.90%, due 11/1/15 | | | 275,000 | | | | 275,222 | |
Phillips 66
2.95%, due 5/1/17 (a) | | | 125,000 | | | | 132,479 | |
| | | | | | | | |
| | | | | | | 407,701 | |
| | | | | | | | |
Oil & Gas Services 0.0%‡ | |
Cameron International Corp.
1.60%, due 4/30/15 | | | 50,000 | | | | 50,513 | |
| | | | | | | | |
|
Packaging & Containers 0.1% | |
Bemis Co., Inc.
5.65%, due 8/1/14 | | | 215,000 | | | | 230,149 | |
| | | | | | | | |
|
Pharmaceuticals 0.4% | |
AbbVie, Inc.
1.75%, due 11/6/17 (a) | | | 300,000 | | | | 303,263 | |
Cardinal Health, Inc.
1.90%, due 6/15/17 | | | 50,000 | | | | 50,931 | |
Express Scripts Holding Co.
2.10%, due 2/12/15 (a) | | | 250,000 | | | | 254,664 | |
Merck & Co., Inc.
2.40%, due 9/15/22 | | | 150,000 | | | | 150,049 | |
Watson Pharmaceuticals, Inc.
3.25%, due 10/1/22 | | | 125,000 | | | | 127,606 | |
| | | | | | | | |
| | | | | | | 886,513 | |
| | | | | | | | |
Pipelines 0.5% | |
Energy Transfer Partners, L.P.
5.20%, due 2/1/22 | | | 175,000 | | | | 199,625 | |
Enterprise Products Operating LLC
1.25%, due 8/13/15 | | | 100,000 | | | | 100,614 | |
ONEOK Partners, L.P.
2.00%, due 10/1/17 | | | 50,000 | | | | 50,416 | |
Plains All American Pipeline, L.P. / PAA Finance Corp.
8.75%, due 5/1/19 | | | 200,000 | | | | 272,082 | |
Texas Eastern Transmission, L.P.
2.80%, due 10/15/22 (a) | | | 175,000 | | | | 175,056 | |
Williams Cos., Inc. (The)
3.70%, due 1/15/23 | | | 150,000 | | | | 151,298 | |
| | | | | | | | |
| | | | | | | 949,091 | |
| | | | | | | | |
| | | | | | | | |
| | | Principal
Amount | | | Value | |
| | | | | | | | |
Real Estate 0.1% | |
WEA Finance LLC / WT Finance Aust Pty, Ltd.
5.75%, due 9/2/15 (a) | | $ | 100,000 | | | $ | 111,646 | |
| | | | | | | | |
|
Real Estate Investment Trusts 0.8% | |
Brandywine Operating Partnership, L.P.
5.70%, due 5/1/17 | | | 300,000 | | | | 339,714 | |
DDR Corp.
4.75%, due 4/15/18 | | | 200,000 | | | | 221,655 | |
Hospitality Properties Trust
6.30%, due 6/15/16 | | | 170,000 | | | | 187,473 | |
National Retail Properties, Inc.
6.25%, due 6/15/14 | | | 200,000 | | | | 213,779 | |
Prologis, L.P.
6.625%, due 5/15/18 | | | 325,000 | | | | 392,543 | |
Realty Income Corp.
2.00%, due 1/31/18 | | | 150,000 | | | | 149,875 | |
Simon Property Group, L.P.
2.75%, due 2/1/23 | | | 150,000 | | | | 149,916 | |
| | | | | | | | |
| | | | | | | 1,654,955 | |
| | | | | | | | |
Retail 0.1% | |
Costco Wholesale Corp.
1.70%, due 12/15/19 | | | 150,000 | | | | 151,021 | |
Home Depot, Inc. (The)
4.40%, due 4/1/21 | | | 125,000 | | | | 147,424 | |
| | | | | | | | |
| | | | | | | 298,445 | |
| | | | | | | | |
Semiconductors 0.1% | |
Samsung Electronics America, Inc.
1.75%, due 4/10/17 (a) | | | 200,000 | | | | 202,350 | |
| | | | | | | | |
|
Special Purpose Entity 0.0%‡ | |
MassMutual Global Funding II
2.50%, due 10/17/22 (a) | | | 100,000 | | | | 98,322 | |
| | | | | | | | |
|
Telecommunications 0.6% | |
AT&T, Inc. | | | | | | | | |
1.70%, due 6/1/17 | | | 100,000 | | | | 101,425 | |
2.40%, due 8/15/16 | | | 200,000 | | | | 208,714 | |
2.625%, due 12/1/22 | | | 150,000 | | | | 150,247 | |
Cellco Partnership / Verizon Wireless Capital LLC
5.55%, due 2/1/14 | | | 300,000 | | | | 314,923 | |
Qwest Corp.
6.75%, due 12/1/21 | | | 75,000 | | | | 87,898 | |
Verizon Communications, Inc. | | | | | | | | |
2.00%, due 11/1/16 | | | 100,000 | | | | 103,493 | |
2.45%, due 11/1/22 | | | 175,000 | | | | 175,058 | |
| | | | | | | | |
| | | | | | | 1,141,758 | |
| | | | | | | | |
| | | | | | |
The notes to the financial statements are an integral part of,
and should be read in conjunction with, the financial statements. | | mainstayinvestments.com | | | M-13 | |
Portfolio of Investments December 31, 2012 (continued)
| | | | | | | | |
| | | Principal
Amount | | | Value | |
| | | | | | | | |
| Corporate Bonds (continued) | |
Transportation 0.1% | |
Burlington Northern Santa Fe LLC
4.70%, due 10/1/19 | | $ | 125,000 | | | $ | 144,095 | |
| | | | | | | | |
Total Corporate Bonds
(Cost $22,282,574) | | | | | | | 23,313,121 | |
| | | | | | | | |
| | |
| Foreign Government Bonds 0.4% | | | | | | | | |
Regional (State & Province) 0.4% | |
Province of Manitoba Canada
2.625%, due 7/15/15 | | | 75,000 | | | | 79,050 | |
Province of Ontario
1.10%, due 10/25/17 | | | 425,000 | | | | 425,468 | |
Province of Quebec
3.50%, due 7/29/20 | | | 200,000 | | | | 222,140 | |
| | | | | | | | |
| | | | | | | 726,658 | |
| | | | | | | | |
Sovereign 0.0%‡ | |
Poland Government International Bond
5.00%, due 3/23/22 | | | 50,000 | | | | 59,050 | |
| | | | | | | | |
Total Foreign Government Bonds
(Cost $772,749) | | | | | | | 785,708 | |
| | | | | | | | |
|
| Mortgage-Backed Securities 0.6% | |
Commercial Mortgage Loans (Collateralized Mortgage Obligations) 0.4% | |
JP Morgan Chase Commercial Mortgage Securities Corp. | | | | | | | | |
Series 2012-C6, Class A2
2.206%, due 5/15/45 | | | 100,000 | | | | 104,631 | |
Series 2006-CB15, Class A4
5.814%, due 6/12/43 (c) | | | 150,000 | | | | 171,165 | |
LB-UBS Commercial Mortgage Trust
Series 2006-C7, Class A3
5.347%, due 11/15/38 | | | 200,000 | | | | 229,831 | |
Morgan Stanley Capital I, Inc.
Series 2007-T25, Class A3
5.514%, due 11/12/49 (c) | | | 200,000 | | | | 231,995 | |
| | | | | | | | |
| | | | | | | 737,622 | |
| | | | | | | | |
Whole Loan Collateral (Collateralized Mortgage Obligations) 0.2% | |
Fosse Master Issuer PLC
Series 2011-1A, Class A5
1.825%, due 10/18/54 (a)(c) | | | 200,000 | | | | 206,320 | |
Holmes Master Issuer PLC
Series Reg S
1.99%, due 10/15/54 (a)(c) | | | 175,000 | | | | 179,170 | |
| | | | | | | | |
| | | | | | | 385,490 | |
| | | | | | | | |
Total Mortgage-Backed Securities
(Cost $1,093,305) | | | | | | | 1,123,112 | |
| | | | | | | | |
| | | | | | | | |
| | | Principal
Amount | | | Value | |
| | | | | | | | |
| U.S. Government & Federal Agencies 16.7% | |
Federal Home Loan Bank 0.1% | |
1.375%, due 5/28/14 | | $ | 300,000 | | | $ | 305,130 | |
| | | | | | | | |
|
¨Federal Home Loan Mortgage Corporation 1.4% | |
0.50%, due 4/17/15 | | | 550,000 | | | | 552,248 | |
0.50%, due 9/25/15 | | | 100,000 | | | | 100,070 | |
0.53%, due 11/20/15 | | | 150,000 | | | | 150,183 | |
0.55%, due 2/27/15 | | | 220,000 | | | | 220,152 | |
0.60%, due 5/22/15 | | | 200,000 | | | | 200,301 | |
0.75%, due 11/25/14 | | | 480,000 | | | | 484,357 | |
0.75%, due 1/12/18 | | | 200,000 | | | | 198,645 | |
1.00%, due 9/27/17 | | | 75,000 | | | | 75,243 | |
1.25%, due 8/1/19 | | | 200,000 | | | | 200,277 | |
1.75%, due 9/10/15 | | | 300,000 | | | | 310,991 | |
1.75%, due 5/30/19 | | | 325,000 | | | | 336,200 | |
| | | | | | | | |
| | | | | | | 2,828,667 | |
| | | | | | | | |
Federal Home Loan Mortgage Corporation
(Mortgage Pass-Through Security) 0.2% | |
3.50%, due 1/1/42 TBA (d) | | | 300,000 | | | | 319,008 | |
| | | | | | | | |
|
¨Federal National Mortgage Association 1.1% | |
0.375%, due 3/16/15 | | | 400,000 | | | | 400,532 | |
0.75%, due 12/19/14 | | | 400,000 | | | | 403,549 | |
0.875%, due 12/20/17 | | | 200,000 | | | | 200,391 | |
1.00%, due 12/28/17 | | | 100,000 | | | | 99,873 | |
1.25%, due 1/30/17 | | | 230,000 | | | | 235,788 | |
1.375%, due 11/15/16 | | | 850,000 | | | | 875,661 | |
2.75%, due 3/13/14 | | | 100,000 | | | | 103,038 | |
| | | | | | | | |
| | | | | | | 2,318,832 | |
| | | | | | | | |
Federal National Mortgage Association
(Mortgage Pass-Through Security) 0.3% | |
3.50%, due 1/1/42 TBA (d) | | | 500,000 | | | | 533,066 | |
| | | | | | | | |
|
¨United States Treasury Notes 13.6% | |
0.125%, due 12/31/14 | | | 700,000 | | | | 698,250 | |
0.25%, due 9/30/14 | | | 1,875,000 | | | | 1,875,439 | |
0.25%, due 10/31/14 | | | 720,000 | | | | 720,169 | |
0.25%, due 5/15/15 | | | 1,460,000 | | | | 1,458,175 | |
0.25%, due 8/15/15 | | | 1,010,000 | | | | 1,008,185 | |
0.25%, due 9/15/15 | | | 1,375,000 | | | | 1,371,992 | |
0.25%, due 12/15/15 | | | 1,050,000 | | | | 1,046,883 | |
0.375%, due 4/15/15 | | | 2,910,000 | | | | 2,915,229 | |
0.375%, due 11/15/15 | | | 1,520,000 | | | | 1,521,426 | |
0.50%, due 7/31/17 | | | 200,000 | | | | 198,797 | |
0.625%, due 11/30/17 | | | 1,010,000 | | | | 1,006,607 | |
0.75%, due 10/31/17 | | | 1,820,000 | | | | 1,825,971 | |
0.75%, due 12/31/17 | | | 1,400,000 | | | | 1,402,297 | |
1.00%, due 6/30/19 | | | 1,200,000 | | | | 1,196,437 | |
1.00%, due 8/31/19 | | | 200,000 | | | | 198,828 | |
| | | | |
| M-14 | | MainStay VP Balanced Portfolio | | The notes to the financial statements are an integral part of,
and should be read in conjunction with, the financial statements. |
| | | | | | | | |
| | | Principal
Amount | | | Value | |
| | | | | | | | |
| U.S. Government & Federal Agencies (continued) | |
¨United States Treasury Notes (continued) | |
1.00%, due 9/30/19 | | $ | 275,000 | | | $ | 273,109 | |
1.00%, due 11/30/19 | | | 350,000 | | | | 346,609 | |
1.125%, due 5/31/19 | | | 500,000 | | | | 503,164 | |
1.375%, due 9/30/18 | | | 840,000 | | | | 863,494 | |
1.50%, due 8/31/18 | | | 2,600,000 | | | | 2,692,017 | |
1.625%, due 11/15/22 | | | 400,000 | | | | 395,625 | |
2.25%, due 7/31/18 | | | 3,600,000 | | | | 3,877,592 | |
| | | | | | | | |
| | | | | | | 27,396,295 | |
| | | | | | | | |
Total U.S. Government & Federal Agencies
(Cost $33,280,056) | | | | | | | 33,700,998 | |
| | | | | | | | |
|
| Yankee Bonds 4.0% (e) | |
Aerospace & Defense 0.1% | |
BAE Systems PLC
3.50%, due 10/11/16 (a) | | | 100,000 | | | | 105,437 | |
| �� | | | | | | | |
|
Auto Manufacturers 0.1% | |
Volkswagen International Finance N.V.
1.625%, due 3/22/15 (a) | | | 100,000 | | | | 101,364 | |
| | | | | | | | |
|
Banks 1.6% | |
Bank of Montreal
1.95%, due 1/30/18 (a) | | | 325,000 | | | | 338,520 | |
Bank of Nova Scotia
1.95%, due 1/30/17 (a) | | | 250,000 | | | | 260,400 | |
BNP Paribas S.A.
2.375%, due 9/14/17 | | | 150,000 | | | | 152,152 | |
Commonwealth Bank of Australia
1.95%, due 3/16/15 | | | 250,000 | | | | 256,535 | |
Cooperatieve Centrale Raiffeisen-Boerenleenbank B.A. | | | | | | | | |
3.375%, due 1/19/17 | | | 200,000 | | | | 214,857 | |
3.875%, due 2/8/22 | | | 100,000 | | | | 107,613 | |
3.95%, due 11/9/22 | | | 250,000 | | | | 256,009 | |
HSBC Bank PLC
3.50%, due 6/28/15 (a) | | | 250,000 | | | | 265,175 | |
Korea Development Bank
3.875%, due 5/4/17 | | | 200,000 | | | | 216,224 | |
Landwirtschaftliche Rentenbank
2.50%, due 2/15/16 | | | 100,000 | | | | 105,870 | |
Royal Bank of Scotland Group PLC
2.55%, due 9/18/15 | | | 200,000 | | | | 204,682 | |
Societe Generale S.A.
2.75%, due 10/12/17 | | | 250,000 | | | | 254,306 | |
Svenska Handelsbanken AB
2.875%, due 4/4/17 | | | 250,000 | | | | 264,150 | |
UBS A.G.
2.25%, due 1/28/14 | | | 250,000 | | | | 253,610 | |
| | | | | | | | |
| | | Principal
Amount | | | Value | |
| | | | | | | | |
Banks (continued) | |
Westpac Banking Corp.
1.125%, due 9/25/15 | | $ | 100,000 | | | $ | 100,926 | |
| | | | | | | | |
| | | | | | | 3,251,029 | |
| | | | | | | | |
Beverages 0.1% | |
Diageo Capital PLC
1.50%, due 5/11/17 | | | 100,000 | | | | 101,414 | |
| | | | | | | | |
|
Electric 0.1% | |
GDF Suez
1.625%, due 10/10/17 (a) | | | 75,000 | | | | 74,982 | |
Hydro-Quebec
2.00%, due 6/30/16 | | | 150,000 | | | | 156,300 | |
| | | | | | | | |
| | | | | | | 231,282 | |
| | | | | | | | |
Finance—Investment Banker/Broker 0.1% | |
BNP Paribas Home Loan Covered Bonds S.A.
2.20%, due 11/2/15 (a) | | | 175,000 | | | | 180,320 | |
| | | | | | | | |
|
Iron & Steel 0.1% | |
ArcelorMittal
4.25%, due 2/25/15 | | | 100,000 | | | | 101,006 | |
| | | | | | | | |
|
Mining 0.4% | |
BHP Billiton Finance USA, Ltd.
1.875%, due 11/21/16 | | | 150,000 | | | | 154,661 | |
Rio Tinto Finance USA PLC
1.625%, due 8/21/17 | | | 100,000 | | | | 101,248 | |
Rio Tinto Finance USA, Ltd.
2.25%, due 9/20/16 | | | 275,000 | | | | 285,293 | |
Teck Resources, Ltd.
3.75%, due 2/1/23 | | | 250,000 | | | | 256,420 | |
| | | | | | | | |
| | | | | | | 797,622 | |
| | | | | | | | |
Miscellaneous—Manufacturing 0.0%‡ | |
Tyco Electronics Group S.A.
1.60%, due 2/3/15 | | | 50,000 | | | | 50,740 | |
| | | | | | | | |
|
Oil & Gas 0.6% | |
BP Capital Markets PLC | | | | | | | | |
1.375%, due 11/6/17 | | | 150,000 | | | | 150,132 | |
1.846%, due 5/5/17 | | | 75,000 | | | | 76,671 | |
3.561%, due 11/1/21 | | | 175,000 | | | | 189,103 | |
Petrobras International Finance Co.—Pifco
2.875%, due 2/6/15 | | | 150,000 | | | | 153,914 | |
Petroleos Mexicanos
4.875%, due 3/15/15 | | | 150,000 | | | | 161,625 | |
Shell International Finance B.V. | | | | | | | | |
1.125%, due 8/21/17 | | | 150,000 | | | | 150,704 | |
2.25%, due 1/6/23 | | | 150,000 | | | | 148,190 | |
Statoil ASA
2.45%, due 1/17/23 | | | 100,000 | | | | 99,766 | |
| | | | | | |
The notes to the financial statements are an integral part of,
and should be read in conjunction with, the financial statements. | | mainstayinvestments.com | | | M-15 | |
Portfolio of Investments December 31, 2012 (continued)
| | | | | | | | |
| | | Principal
Amount | | | Value | |
| | | | | | | | |
| Yankee Bonds (continued) | |
Oil & Gas (continued) | |
Total Capital International S.A. | | | | | | | | |
1.55%, due 6/28/17 | | $ | 100,000 | | | $ | 101,542 | |
2.875%, due 2/17/22 | | | 125,000 | | | | 130,478 | |
| | | | | | | | |
| | | | | | | 1,362,125 | |
| | | | | | | | |
Pharmaceuticals 0.4% | |
Novartis Securities Investment, Ltd.
5.125%, due 2/10/19 | | | 125,000 | | | | 149,397 | |
Sanofi S.A. | | | | | | | | |
2.625%, due 3/29/16 | | | 150,000 | | | | 157,878 | |
4.00%, due 3/29/21 | | | 125,000 | | | | 142,479 | |
Teva Pharmaceutical Finance Co. B.V. | | | | | | | | |
2.40%, due 11/10/16 | | | 100,000 | | | | 104,212 | |
2.95%, due 12/18/22 | | | 175,000 | | | | 177,023 | |
Teva Pharmaceutical Finance IV B.V.
3.65%, due 11/10/21 | | | 150,000 | | | | 160,535 | |
| | | | | | | | |
| | | | | | | 891,524 | |
| | | | | | | | |
Telecommunications 0.3% | |
America Movil SAB de CV
3.125%, due 7/16/22 | | | 200,000 | | | | 203,290 | |
British Telecommunications PLC
5.15%, due 1/15/13 | | | 100,000 | | | | 100,138 | |
France Telecom S.A.
2.75%, due 9/14/16 | | | 100,000 | | | | 104,972 | |
Telefonica Emisiones SAU
2.582%, due 4/26/13 | | | 125,000 | | | | 125,437 | |
Vivendi S.A.
2.40%, due 4/10/15 (a) | | | 100,000 | | | | 101,997 | |
Vodafone Group PLC
1.25%, due 9/26/17 | | | 100,000 | | | | 99,698 | |
| | | | | | | | |
| | | | | | | 735,532 | |
| | | | | | | | |
Transportation 0.1% | |
Canadian National Railway Co.
1.45%, due 12/15/16 | | | 125,000 | | | | 127,193 | |
| | | | | | | | |
Total Yankee Bonds
(Cost $7,789,230) | | | | | | | 8,036,588 | |
| | | | | | | | |
Total Long-Term Bonds
(Cost $67,160,823) | | | | | | | 68,907,210 | |
| | | | | | | | |
| | |
| | | | | | | | |
| | |
Shares | | | | |
| Common Stocks 62.9% | |
Aerospace & Defense 1.5% | |
Alliant Techsystems, Inc. | | | 2,079 | | | | 128,815 | |
Boeing Co. (The) | | | 5,688 | | | | 428,648 | |
General Dynamics Corp. | | | 7,125 | | | | 493,549 | |
Huntington Ingalls Industries, Inc. | | | 10,651 | | | | 461,614 | |
L-3 Communications Holdings, Inc. | | | 849 | | | | 65,050 | |
| | | | | | | | |
| | |
Shares | | | Value | |
| | | | | | | | |
Aerospace & Defense (continued) | |
Lockheed Martin Corp. | | | 4,648 | | | $ | 428,964 | |
Northrop Grumman Corp. | | | 7,147 | | | | 482,994 | |
Raytheon Co. | | | 8,386 | | | | 482,698 | |
Spirit Aerosystems Holdings, Inc. Class A (f) | | | 1,064 | | | | 18,056 | |
| | | | | | | | |
| | | | | | | 2,990,388 | |
| | | | | | | | |
Agriculture 0.7% | |
Altria Group, Inc. | | | 11,158 | | | | 350,584 | |
Archer-Daniels-Midland Co. | | | 13,827 | | | | 378,722 | |
Philip Morris International, Inc. | | | 4,186 | | | | 350,117 | |
Reynolds American, Inc. | | | 10,037 | | | | 415,833 | |
| | | | | | | | |
| | | | | | | 1,495,256 | |
| | | | | | | | |
Airlines 0.6% | |
Copa Holdings S.A. Class A | | | 3,455 | | | | 343,600 | |
Delta Air Lines, Inc. (f) | | | 46,789 | | | | 555,385 | |
Southwest Airlines Co. | | | 38,148 | | | | 390,636 | |
| | | | | | | | |
| | | | | | | 1,289,621 | |
| | | | | | | | |
Auto Manufacturers 0.6% | |
Ford Motor Co. | | | 32,577 | | | | 421,872 | |
General Motors Co. (f) | | | 16,995 | | | | 489,966 | |
Oshkosh Corp. (f) | | | 8,065 | | | | 239,127 | |
PACCAR, Inc. | | | 431 | | | | 19,486 | |
| | | | | | | | |
| | | | | | | 1,170,451 | |
| | | | | | | | |
Auto Parts & Equipment 0.2% | |
Johnson Controls, Inc. | | | 13,043 | | | | 400,420 | |
WABCO Holdings, Inc. (f) | | | 121 | | | | 7,888 | |
| | | | | | | | |
| | | | | | | 408,308 | |
| | | | | | | | |
Banks 4.6% | |
¨Bank of America Corp. | | | 46,013 | | | | 533,751 | |
Bank of New York Mellon Corp. (The) | | | 20,022 | | | | 514,565 | |
BB&T Corp. | | | 13,149 | | | | 382,767 | |
Capital One Financial Corp. | | | 7,471 | | | | 432,795 | |
CapitalSource, Inc. | | | 26,762 | | | | 202,856 | |
¨Citigroup, Inc. | | | 10,027 | | | | 396,668 | |
Comerica, Inc. | | | 8,306 | | | | 252,004 | |
Commerce Bancshares, Inc. | | | 96 | | | | 3,366 | |
East West Bancorp, Inc. | | | 6,401 | | | | 137,558 | |
Fifth Third Bancorp | | | 24,677 | | | | 374,844 | |
Goldman Sachs Group, Inc. (The) | | | 3,187 | | | | 406,534 | |
Huntington Bancshares, Inc. | | | 81,222 | | | | 519,009 | |
¨JPMorgan Chase & Co. | | | 11,494 | | | | 505,391 | |
KeyCorp | | | 72,107 | | | | 607,141 | |
M&T Bank Corp. | | | 20 | | | | 1,969 | |
Morgan Stanley | | | 21,923 | | | | 419,168 | |
Northern Trust Corp. | | | 10,382 | | | | 520,761 | |
PNC Financial Services Group, Inc. | | | 8,703 | | | | 507,472 | |
Regions Financial Corp. | | | 89,894 | | | | 640,045 | |
State Street Corp. | | | 10,821 | | | | 508,695 | |
SunTrust Banks, Inc. | | | 11,147 | | | | 316,017 | |
SVB Financial Group (f) | | | 6,563 | | | | 367,331 | |
| | | | |
| M-16 | | MainStay VP Balanced Portfolio | | The notes to the financial statements are an integral part of,
and should be read in conjunction with, the financial statements. |
| | | | | | | | |
| | |
Shares | | | Value | |
| | | | | | | | |
| Common Stocks (continued) | |
Banks (continued) | |
U.S. Bancorp | | | 11,689 | | | $ | 373,347 | |
Wells Fargo & Co. | | | 11,283 | | | | 385,653 | |
| | | | | | | | |
| | | | | | | 9,309,707 | |
| | | | | | | | |
Beverages 0.3% | |
Coca-Cola Enterprises, Inc. | | | 2,470 | | | | 78,373 | |
Constellation Brands, Inc. Class A (f) | | | 14,984 | | | | 530,284 | |
| | | | | | | | |
| | | | | | | 608,657 | |
| | | | | | | | |
Biotechnology 0.2% | |
Charles River Laboratories International, Inc. (f) | | | 9,924 | | | | 371,852 | |
| | | | | | | | |
| | |
Chemicals 1.9% | | | | | | | | |
Air Products & Chemicals, Inc. | | | 4,485 | | | | 376,830 | |
CF Industries Holdings, Inc. | | | 3,299 | | | | 670,225 | |
Dow Chemical Co. (The) | | | 14,036 | | | | 453,643 | |
Huntsman Corp. | | | 28,329 | | | | 450,431 | |
LyondellBasell Industries, N.V., Class A | | | 8,944 | | | | 510,613 | |
Mosaic Co. (The) | | | 8,941 | | | | 506,329 | |
W.R. Grace & Co. (f) | | | 5,848 | | | | 393,161 | |
Westlake Chemical Corp. | | | 5,351 | | | | 424,334 | |
| | | | | | | | |
| | | | | | | 3,785,566 | |
| | | | | | | | |
Coal 0.0%‡ | |
Peabody Energy Corp. | | | 731 | | | | 19,452 | |
| | | | | | | | |
| | |
Commercial Services 1.0% | | | | | | | | |
ADT Corp. (The) | | | 10,748 | | | | 499,675 | |
Booz Allen Hamilton Holding Corp. | | | 13,776 | | | | 191,762 | |
CoreLogic, Inc. (f) | | | 17,336 | | | | 466,685 | |
Equifax, Inc. | | | 3,367 | | | | 182,222 | |
H&R Block, Inc. | | | 2,790 | | | | 51,810 | |
Hertz Global Holdings, Inc. (f) | | | 13,416 | | | | 218,278 | |
Total System Services, Inc. | | | 17,779 | | | | 380,826 | |
| | | | | | | | |
| | | | | | | 1,991,258 | |
| | | | | | | | |
Computers 1.2% | |
Brocade Communications Systems, Inc. (f) | | | 47,486 | | | | 253,100 | |
Computer Sciences Corp. | | | 9,522 | | | | 381,356 | |
Dell, Inc. | | | 40,418 | | | | 409,434 | |
Hewlett-Packard Co. | | | 26,336 | | | | 375,288 | |
Lexmark International, Inc. Class A | | | 5,276 | | | | 122,351 | |
NetApp, Inc. (f) | | | 12,252 | | | | 411,055 | |
Synopsys, Inc. (f) | | | 141 | | | | 4,489 | |
Western Digital Corp. | | | 9,108 | | | | 386,999 | |
| | | | | | | | |
| | | | | | | 2,344,072 | |
| | | | | | | | |
Cosmetics & Personal Care 0.4% | |
Colgate-Palmolive Co. | | | 3,491 | | | | 364,949 | |
Procter & Gamble Co. (The) | | | 5,310 | | | | 360,496 | |
| | | | | | | | |
| | | | | | | 725,445 | |
| | | | | | | | |
| | | | | | | | |
| | |
Shares | | | Value | |
| | | | | | | | |
Electric 3.8% | |
AES Corp. (The) | | | 36,807 | | | $ | 393,835 | |
Ameren Corp. | | | 20,199 | | | | 620,513 | |
American Electric Power Co., Inc. | | | 9,906 | | | | 422,788 | |
Consolidated Edison, Inc. | | | 6,651 | | | | 369,397 | |
Dominion Resources, Inc. | | | 7,228 | | | | 374,410 | |
DTE Energy Co. | | | 11,162 | | | | 670,278 | |
Duke Energy Corp. | | | 5,797 | | | | 369,849 | |
Edison International | | | 14,848 | | | | 670,981 | |
Entergy Corp. | | | 7,344 | | | | 468,180 | |
Exelon Corp. | | | 12,543 | | | | 373,029 | |
FirstEnergy Corp. | | | 8,975 | | | | 374,796 | |
NextEra Energy, Inc. | | | 5,392 | | | | 373,072 | |
NRG Energy, Inc. | | | 24,739 | | | | 568,750 | |
NV Energy, Inc. | | | 2,017 | | | | 36,588 | |
PG&E Corp. | | | 9,122 | | | | 366,522 | |
Pinnacle West Capital Corp. | | | 3,323 | | | | 169,407 | |
PPL Corp. | | | 4,366 | | | | 124,999 | |
Public Service Enterprise Group, Inc. | | | 14,278 | | | | 436,907 | |
Southern Co. (The) | | | 8,537 | | | | 365,469 | |
Xcel Energy, Inc. | | | 5,009 | | | | 133,790 | |
| | | | | | | | |
| | | | | | | 7,683,560 | |
| | | | | | | | |
Electrical Components & Equipment 0.6% | |
Emerson Electric Co. | | | 8,385 | | | | 444,069 | |
Energizer Holdings, Inc. | | | 6,696 | | | | 535,546 | |
General Cable Corp. (f) | | | 6,714 | | | | 204,173 | |
| | | | | | | | |
| | | | | | | 1,183,788 | |
| | | | | | | | |
Electronics 0.5% | |
Tech Data Corp. (f) | | | 682 | | | | 31,051 | |
Thermo Fisher Scientific, Inc. | | | 6,631 | | | | 422,925 | |
Tyco International, Ltd. | | | 16,987 | | | | 496,870 | |
| | | | | | | | |
| | | | | | | 950,846 | |
| | | | | | | | |
Engineering & Construction 0.5% | |
AECOM Technology Corp. (f) | | | 11,675 | | | | 277,865 | |
Chicago Bridge & Iron Co. N.V. | | | 7,702 | | | | 356,988 | |
Engility Holdings, Inc. (f) | | | 11,606 | | | | 223,531 | |
Shaw Group, Inc. (The) (f) | | | 1,983 | | | | 92,428 | |
| | | | | | | | |
| | | | | | | 950,812 | |
| | | | | | | | |
Entertainment 0.1% | |
Regal Entertainment Group Class A | | | 14,975 | | | | 208,901 | |
| | | | | | | | |
| | |
Environmental Controls 0.2% | | | | | | | | |
Waste Management, Inc. | | | 14,166 | | | | 477,961 | |
| | | | | | | | |
| | |
Finance—Credit Card 0.4% | | | | | | | | |
American Express Co. | | | 7,570 | | | | 435,123 | |
Discover Financial Services | | | 11,925 | | | | 459,709 | |
| | | | | | | | |
| | | | | | | 894,832 | |
| | | | | | | | |
| | | | | | |
The notes to the financial statements are an integral part of,
and should be read in conjunction with, the financial statements. | | mainstayinvestments.com | | | M-17 | |
Portfolio of Investments December 31, 2012 (continued)
| | | | | | | | |
| | |
Shares | | | Value | |
| | | | | | | | |
| Common Stocks (continued) | |
Finance—Investment Banker/Broker 0.4% | |
Charles Schwab Corp. (The) | | | 36,376 | | | $ | 522,359 | |
Interactive Brokers Group, Inc. Class A | | | 12,457 | | | | 170,412 | |
Jefferies Group, Inc. | | | 193 | | | | 3,584 | |
TD Ameritrade Holding Corp. | | | 11,419 | | | | 191,954 | |
| | | | | | | | |
| | | | | | | 888,309 | |
| | | | | | | | |
Finance—Other Services 0.2% | |
CME Group, Inc. | | | 6,897 | | | | 349,747 | |
| | | | | | | | |
| | |
Food 2.5% | | | | | | | | |
ConAgra Foods, Inc. | | | 2,438 | | | | 71,921 | |
Dean Foods Co. (f) | | | 22,896 | | | | 378,013 | |
General Mills, Inc. | | | 10,478 | | | | 423,416 | |
Hillshire Brands Co. | | | 14,118 | | | | 397,280 | |
Ingredion, Inc. | | | 7,641 | | | | 492,310 | |
J.M. Smucker Co. (The) | | | 307 | | | | 26,476 | |
Kellogg Co. | | | 6,643 | | | | 371,012 | |
Kraft Foods Group, Inc. | | | 9,693 | | | | 440,741 | |
Mondelez International, Inc. Class A | | | 18,749 | | | | 477,537 | |
Ralcorp Holdings, Inc. (f) | | | 1,642 | | | | 147,205 | |
Safeway, Inc. | | | 22,034 | | | | 398,595 | |
Smithfield Foods, Inc. (f) | | | 21,437 | | | | 462,396 | |
Sysco Corp. | | | 11,752 | | | | 372,068 | |
Tyson Foods, Inc. Class A | | | 28,097 | | | | 545,082 | |
| | | | | | | | |
| | | | | | | 5,004,052 | |
| | | | | | | | |
Forest Products & Paper 0.5% | |
Domtar Corp. | | | 5,840 | | | | 487,757 | |
International Paper Co. | | | 14,148 | | | | 563,656 | |
| | | | | | | | |
| | | | | | | 1,051,413 | |
| | | | | | | | |
Gas 0.5% | |
CenterPoint Energy, Inc. | | | 23,200 | | | | 446,600 | |
Sempra Energy | | | 1,797 | | | | 127,479 | |
UGI Corp. | | | 14,998 | | | | 490,585 | |
Vectren Corp. | | | 1,177 | | | | 34,604 | |
| | | | | | | | |
| | | | | | | 1,099,268 | |
| | | | | | | | |
Health Care—Products 1.9% | |
Alere, Inc. (f) | | | 7,329 | | | | 135,586 | |
Baxter International, Inc. | | | 6,559 | | | | 437,223 | |
Becton, Dickinson & Co. | | | 5,544 | | | | 433,485 | |
Boston Scientific Corp. (f) | | | 109,616 | | | | 628,100 | |
Covidien PLC | | | 7,428 | | | | 428,893 | |
Hill-Rom Holdings, Inc. | | | 14,236 | | | | 405,726 | |
Medtronic, Inc. | | | 10,085 | | | | 413,687 | |
St. Jude Medical, Inc. | | | 13,329 | | | | 481,710 | |
Stryker Corp. | | | 8,876 | | | | 486,582 | |
| | | | | | | | |
| | | | | | | 3,850,992 | |
| | | | | | | | |
Health Care—Services 2.4% | |
Aetna, Inc. | | | 10,884 | | | | 503,929 | |
Cigna Corp. | | | 5,492 | | | | 293,602 | |
| | | | | | | | |
| | |
Shares | | | Value | |
| | | | | | | | |
Health Care—Services (continued) | |
Community Health Systems, Inc. | | | 15,282 | | | $ | 469,769 | |
Covance, Inc. (f) | | | 8,048 | | | | 464,933 | |
Coventry Health Care, Inc. | | | 4,022 | | | | 180,306 | |
HCA Holdings, Inc. | | | 13,241 | | | | 399,481 | |
Health Management Associates, Inc.
Class A (f) | | | 54,783 | | | | 510,578 | |
LifePoint Hospitals, Inc. (f) | | | 7,575 | | | | 285,956 | |
Tenet Healthcare Corp. (f) | | | 7,227 | | | | 234,661 | |
UnitedHealth Group, Inc. | | | 7,927 | | | | 429,960 | |
Universal Health Services, Inc. Class B | | | 10,785 | | | | 521,455 | |
WellPoint, Inc. | | | 8,355 | | | | 508,987 | |
| | | | | | | | |
| | | | | | | 4,803,617 | |
| | | | | | | | |
Holding Company—Diversified 0.1% | |
Leucadia National Corp. | | | 10,504 | | | | 249,890 | |
| | | | | | | | |
| | |
Home Builders 0.3% | | | | | | | | |
PulteGroup, Inc. (f) | | | 32,775 | | | | 595,194 | |
| | | | | | | | |
| | |
Home Furnishing 0.3% | | | | | | | | |
Whirlpool Corp. | | | 6,014 | | | | 611,925 | |
| | | | | | | | |
| | |
Household Products & Wares 0.5% | | | | | | | | |
Avery Dennison Corp. | | | 14,217 | | | | 496,458 | |
Jarden Corp. (f) | | | 1,390 | | | | 71,863 | |
Kimberly-Clark Corp. | | | 5,012 | | | | 423,163 | |
| | | | | | | | |
| | | | | | | 991,484 | |
| | | | | | | | |
Insurance 5.8% | |
ACE, Ltd. | | | 5,315 | | | | 424,137 | |
Aflac, Inc. | | | 9,078 | | | | 482,223 | |
Alleghany Corp. (f) | | | 242 | | | | 81,172 | |
Allied World Assurance Co. Holdings, A.G. | | | 2,848 | | | | 224,422 | |
Allstate Corp. (The) | | | 11,747 | | | | 471,877 | |
American Financial Group, Inc. | | | 7,290 | | | | 288,101 | |
American International Group, Inc. (f) | | | 14,578 | | | | 514,603 | |
American National Insurance Co. | | | 1,515 | | | | 103,459 | |
Aon PLC | | | 2,341 | | | | 130,160 | |
Aspen Insurance Holdings, Ltd. | | | 8,217 | | | | 263,601 | |
Assurant, Inc. | | | 7,848 | | | | 272,326 | |
Axis Capital Holdings, Ltd. | | | 13,860 | | | | 480,110 | |
Berkshire Hathaway, Inc. Class B (f) | | | 4,932 | | | | 442,400 | |
Chubb Corp. (The) | | | 6,299 | | | | 474,441 | |
CNA Financial Corp. | | | 5,989 | | | | 167,752 | |
Endurance Specialty Holdings, Ltd. | | | 531 | | | | 21,075 | |
Everest Re Group, Ltd. | | | 5,080 | | | | 558,546 | |
Fidelity National Financial, Inc. Class A | | | 22,641 | | | | 533,196 | |
Hanover Insurance Group, Inc. (The) | | | 98 | | | | 3,796 | |
Hartford Financial Services Group, Inc. (The) | | | 21,911 | | | | 491,683 | |
Loews Corp. | | | 9,085 | | | | 370,214 | |
Marsh & McLennan Cos., Inc. | | | 12,317 | | | | 424,567 | |
| | | | |
| M-18 | | MainStay VP Balanced Portfolio | | The notes to the financial statements are an integral part of,
and should be read in conjunction with, the financial statements. |
| | | | | | | | |
| | |
Shares | | | Value | |
| | | | | | | | |
| Common Stocks (continued) | |
Insurance (continued) | |
Mercury General Corp. | | | 637 | | | $ | 25,282 | |
MetLife, Inc. | | | 12,991 | | | | 427,924 | |
PartnerRe, Ltd. | | | 4,231 | | | | 340,553 | |
Principal Financial Group, Inc. | | | 12,902 | | | | 367,965 | |
ProAssurance Corp. | | | 6,142 | | | | 259,131 | |
Progressive Corp. (The) | | | 1,001 | | | | 21,121 | |
Protective Life Corp. | | | 16,385 | | | | 468,283 | |
Prudential Financial, Inc. | | | 9,263 | | | | 493,996 | |
Reinsurance Group of America, Inc. | | | 9,561 | | | | 511,705 | |
RenaissanceRe Holdings, Ltd. | | | 3,157 | | | | 256,538 | |
StanCorp Financial Group, Inc. | | | 9,548 | | | | 350,125 | |
Travelers Cos., Inc. (The) | | | 6,630 | | | | 476,167 | |
Validus Holdings, Ltd. | | | 10,610 | | | | 366,894 | |
White Mountains Insurance Group, Ltd. | | | 266 | | | | 136,990 | |
| | | | | | | | |
| | | | | | | 11,726,535 | |
| | | | | | | | |
Internet 1.2% | |
AOL, Inc. (f) | | | 7,732 | | | | 228,945 | |
Expedia, Inc. | | | 4,163 | | | | 255,816 | |
IAC / InterActiveCorp | | | 3,631 | | | | 171,746 | |
Liberty Interactive Corp. Class A (f) | | | 26,767 | | | | 526,775 | |
Symantec Corp. (f) | | | 40,493 | | | | 761,673 | |
Yahoo!, Inc. (f) | | | 25,031 | | | | 498,117 | |
| | | | | | | | |
| | | | | | | 2,443,072 | |
| | | | | | | | |
Investment Company 0.2% | |
American Capital Ltd. (f) | | | 25,737 | | | | 308,844 | |
| | | | | | | | |
|
Investment Management/Advisory Services 0.7% | |
Ameriprise Financial, Inc. | | | 60 | | | | 3,758 | |
BlackRock, Inc. | | | 2,194 | | | | 453,522 | |
Federated Investors, Inc. Class B | | | 485 | | | | 9,811 | |
Franklin Resources, Inc. | | | 3,371 | | | | 423,735 | |
Janus Capital Group, Inc. | | | 50,953 | | | | 434,119 | |
| | | | | | | | |
| | | | | | | 1,324,945 | |
| | | | | | | | |
Iron & Steel 0.0%‡ | |
Nucor Corp. | | | 332 | | | | 14,336 | |
United States Steel Corp. | | | 1,964 | | | | 46,880 | |
| | | | | | | | |
| | | | | | | 61,216 | |
| | | | | | | | |
Leisure Time 0.2% | |
Carnival Corp. | | | 12,842 | | | | 472,200 | |
| | | | | | | | |
| | |
Machinery—Construction & Mining 0.1% | | | | | | | | |
Terex Corp. (f) | | | 9,033 | | | | 253,918 | |
| | | | | | | | |
| | |
Machinery—Diversified 0.2% | | | | | | | | |
Flowserve Corp. | | | 25 | | | | 3,670 | |
Gardner Denver, Inc. | | | 6,980 | | | | 478,130 | |
| | | | | | | | |
| | | | | | | 481,800 | |
| | | | | | | | |
| | | | | | | | |
| | |
Shares | | | Value | |
| | | | | | | | |
Media 2.2% | |
Cablevision Systems Corp. Class A | | | 31,898 | | | $ | 476,556 | |
CBS Corp. Class B | | | 10,392 | | | | 395,416 | |
Comcast Corp. Class A | | | 13,055 | | | | 487,996 | |
DISH Network Corp. Class A | | | 11,633 | | | | 423,441 | |
Gannett Co., Inc. | | | 28,076 | | | | 505,649 | |
News Corp. Class A | | | 19,552 | | | | 499,358 | |
Thomson Reuters Corp. | | | 15,300 | | | | 444,618 | |
Time Warner, Inc. | | | 9,213 | | | | 440,658 | |
Walt Disney Co. (The) | | | 8,714 | | | | 433,870 | |
Washington Post Co. Class B | | | 643 | | | | 234,830 | |
| | | | | | | | |
| | | | | | | 4,342,392 | |
| | | | | | | | |
Metal Fabricate & Hardware 0.1% | |
Timken Co. | | | 4,329 | | | | 207,056 | |
| | | | | | | | |
|
Mining 0.6% | |
Freeport-McMoRan Copper & Gold, Inc. | | | 11,638 | | | | 398,020 | |
Newmont Mining Corp. | | | 8,266 | | | | 383,873 | |
Southern Copper Corp. | | | 11,191 | | | | 423,691 | |
| | | | | | | | |
| | | | | | | 1,205,584 | |
| | | | | | | | |
Miscellaneous—Manufacturing 1.6% | |
3M Co. | | | 4,676 | | | | 434,167 | |
Carlisle Cos., Inc. | | | 7,368 | | | | 432,944 | |
Danaher Corp. | | | 9,105 | | | | 508,969 | |
Dover Corp. | | | 958 | | | | 62,950 | |
Eaton Corp. PLC | | | 2,898 | | | | 157,072 | |
General Electric Co. | | | 17,434 | | | | 365,940 | |
Harsco Corp. | | | 1,547 | | | | 36,354 | |
Illinois Tool Works, Inc. | | | 6,933 | | | | 421,596 | |
Ingersoll-Rand PLC | | | 6,530 | | | | 313,179 | |
Leggett & Platt, Inc. | | | 16,175 | | | | 440,283 | |
Parker Hannifin Corp. | | | 1,204 | | | | 102,412 | |
| | | | | | | | |
| | | | | | | 3,275,866 | |
| | | | | | | | |
Oil & Gas 5.2% | |
Anadarko Petroleum Corp. | | | 4,919 | | | | 365,531 | |
Apache Corp. | | | 4,967 | | | | 389,909 | |
Chevron Corp. | | | 4,016 | | | | 434,290 | |
ConocoPhillips | | | 7,422 | | | | 430,402 | |
Devon Energy Corp. | | | 7,127 | | | | 370,889 | |
Diamond Offshore Drilling, Inc. | | | 7,589 | | | | 515,748 | |
EXCO Resources, Inc. | | | 46,376 | | | | 313,966 | |
ExxonMobil Corp. | | | 4,859 | | | | 420,546 | |
Helmerich & Payne, Inc. | | | 9,212 | | | | 515,964 | |
Hess Corp. | | | 8,589 | | | | 454,873 | |
HollyFrontier Corp. | | | 14,576 | | | | 678,513 | |
Marathon Oil Corp. | | | 14,151 | | | | 433,870 | |
¨Marathon Petroleum Corp. | | | 16,448 | | | | 1,036,224 | |
Murphy Oil Corp. | | | 12,338 | | | | 734,728 | |
Noble Energy, Inc. | | | 342 | | | | 34,795 | |
| | | | | | |
The notes to the financial statements are an integral part of,
and should be read in conjunction with, the financial statements. | | mainstayinvestments.com | | | M-19 | |
Portfolio of Investments December 31, 2012 (continued)
| | | | | | | | |
| | |
Shares | | | Value | |
| | | | | | | | |
| Common Stocks (continued) | |
Oil & Gas (continued) | |
Occidental Petroleum Corp. | | | 5,701 | | | $ | 436,754 | |
Patterson-UTI Energy, Inc. | | | 18,623 | | | | 346,946 | |
Phillips 66 | | | 9,076 | | | | 481,936 | |
Tesoro Corp. | | | 13,282 | | | | 585,072 | |
Unit Corp. (f) | | | 10,022 | | | | 451,491 | |
¨Valero Energy Corp. | | | 28,147 | | | | 960,376 | |
| | | | | | | | |
| | | | | | | 10,392,823 | |
| | | | | | | | |
Oil & Gas Services 0.8% | |
Baker Hughes, Inc. | | | 8,794 | | | | 359,147 | |
Halliburton Co. | | | 11,079 | | | | 384,331 | |
National-Oilwell Varco, Inc. | | | 5,492 | | | | 375,378 | |
RPC, Inc. | | | 32,677 | | | | 399,966 | |
| | | | | | | | |
| | | | | | | 1,518,822 | |
| | | | | | | | |
Packaging & Containers 0.2% | |
Bemis Co., Inc. | | | 1,686 | | | | 56,414 | |
Greif, Inc. Class A | | | 5,425 | | | | 241,412 | |
| | | | | | | | |
| | | | | | | 297,826 | |
| | | | | | | | |
Pharmaceuticals 2.1% | |
Abbott Laboratories | | | 6,575 | | | | 430,663 | |
Bristol-Myers Squibb Co. | | | 14,822 | | | | 483,049 | |
Cardinal Health, Inc. | | | 10,402 | | | | 428,354 | |
Eli Lilly & Co. | | | 9,703 | | | | 478,552 | |
Forest Laboratories, Inc. (f) | | | 18,738 | | | | 661,826 | |
Johnson & Johnson | | | 5,281 | | | | 370,198 | |
Merck & Co., Inc. | | | 9,659 | | | | 395,440 | |
Omnicare, Inc. | | | 14,064 | | | | 507,710 | |
Pfizer, Inc. | | | 16,908 | | | | 424,053 | |
| | | | | | | | |
| | | | | | | 4,179,845 | |
| | | | | | | | |
Pipelines 0.2% | |
Spectra Energy Corp. | | | 13,640 | | | | 373,463 | |
| | | | | | | | |
| | |
Real Estate Investment Trusts 3.7% | | | | | | | | |
American Capital Agency Corp. | | | 810 | | | | 23,441 | |
Annaly Capital Management, Inc. | | | 11,043 | | | | 155,044 | |
Apartment Investment & Management Co. Class A | | | 11,145 | | | | 301,584 | |
BioMed Realty Trust, Inc. | | | 3,920 | | | | 75,774 | |
Boston Properties, Inc. | | | 648 | | | | 68,565 | |
Brandywine Realty Trust | | | 35,214 | | | | 429,259 | |
CBL & Associates Properties, Inc. | | | 21,353 | | | | 452,897 | |
Corporate Office Properties Trust | | | 17,729 | | | | 442,870 | |
DDR Corp. | | | 5,861 | | | | 91,783 | |
Duke Realty Corp. | | | 4,456 | | | | 61,805 | |
Equity Residential | | | 6,769 | | | | 383,599 | |
General Growth Properties, Inc. | | | 24,786 | | | | 492,002 | |
HCP, Inc. | | | 5,132 | | | | 231,864 | |
Health Care REIT, Inc. | | | 8,518 | | | | 522,068 | |
| | | | | | | | |
| | |
Shares | | | Value | |
| | | | | | | | |
Real Estate Investment Trusts (continued) | |
Hospitality Properties Trust | | | 20,356 | | | $ | 476,737 | |
Host Hotels & Resorts, Inc. | | | 2,612 | | | | 40,930 | |
Kimco Realty Corp. | | | 16,374 | | | | 316,346 | |
Liberty Property Trust | | | 1,685 | | | | 60,272 | |
National Retail Properties, Inc. | | | 5,977 | | | | 186,482 | |
ProLogis, Inc. | | | 3,015 | | | | 110,017 | |
Regency Centers Corp. | | | 467 | | | | 22,005 | |
Senior Housing Properties Trust | | | 9,213 | | | | 217,795 | |
Simon Property Group, Inc. | | | 2,389 | | | | 377,677 | |
Taubman Centers, Inc. | | | 4,122 | | | | 324,484 | |
Ventas, Inc. | | | 11,368 | | | | 735,737 | |
Vornado Realty Trust | | | 636 | | | | 50,931 | |
Weingarten Realty Investors | | | 17,528 | | | | 469,225 | |
Weyerhaeuser Co. | | | 14,858 | | | | 413,350 | |
| | | | | | | | |
| | | | | | | 7,534,543 | |
| | | | | | | | |
Retail 2.9% | |
Abercrombie & Fitch Co. Class A | | | 9,199 | | | | 441,276 | |
American Eagle Outfitters, Inc. | | | 19,774 | | | | 405,565 | |
Chico’s FAS, Inc. | | | 21,949 | | | | 405,179 | |
CVS Caremark Corp. | | | 10,295 | | | | 497,763 | |
Dillard’s, Inc. Class A | | | 5,275 | | | | 441,887 | |
Foot Locker, Inc. | | | 14,377 | | | | 461,789 | |
GameStop Corp. Class A | | | 10,610 | | | | 266,205 | |
Kohl’s Corp. | | | 10,771 | | | | 462,938 | |
Lowe’s Cos., Inc. | | | 13,970 | | | | 496,214 | |
Macy’s, Inc. | | | 10,090 | | | | 393,712 | |
PVH Corp. | | | 1,809 | | | | 200,817 | |
Sears Hometown and Outlet Stores, Inc. (f) | | | 456 | | | | 14,847 | |
Target Corp. | | | 7,849 | | | | 464,425 | |
Wal-Mart Stores, Inc. | | | 6,747 | | | | 460,348 | |
Walgreen Co. | | | 13,379 | | | | 495,157 | |
| | | | | | | | |
| | | | | | | 5,908,122 | |
| | | | | | | | |
Savings & Loans 0.1% | |
Capitol Federal Financial, Inc. | | | 18,398 | | | | 215,073 | |
Hudson City Bancorp, Inc. | | | 7,896 | | | | 64,194 | |
| | | | | | | | |
| | | | | | | 279,267 | |
| | | | | | | | |
Semiconductors 1.2% | |
Applied Materials, Inc. | | | 20,085 | | | | 229,772 | |
Broadcom Corp. Class A (f) | | | 12,639 | | | | 419,741 | |
Cypress Semiconductor Corp. (f) | | | 1,325 | | | | 14,363 | |
Intel Corp. | | | 21,396 | | | | 441,400 | |
Lam Research Corp. (f) | | | 7,512 | | | | 271,409 | |
Micron Technology, Inc. (f) | | | 90,847 | | | | 576,878 | |
NVIDIA Corp. | | | 466 | | | | 5,727 | |
Texas Instruments, Inc. | | | 12,506 | | | | 386,936 | |
| | | | | | | | |
| | | | | | | 2,346,226 | |
| | | | | | | | |
| | | | |
| M-20 | | MainStay VP Balanced Portfolio | | The notes to the financial statements are an integral part of,
and should be read in conjunction with, the financial statements. |
| | | | | | | | |
| | |
Shares | | | Value | |
| | | | | | | | |
| Common Stocks (continued) | |
Software 1.2% | |
Activision Blizzard, Inc. | | | 45,903 | | | $ | 487,490 | |
Adobe Systems, Inc. (f) | | | 12,017 | | | | 452,801 | |
Allscripts Healthcare Solutions, Inc. (f) | | | 33,576 | | | | 316,286 | |
CA, Inc. | | | 20,035 | | | | 440,369 | |
Electronic Arts, Inc. (f) | | | 26,382 | | | | 383,330 | |
Fidelity National Information Services, Inc. | | | 9,038 | | | | 314,613 | |
| | | | | | | | |
| | | | | | | 2,394,889 | |
| | | | | | | | |
Telecommunications 2.5% | |
Amdocs, Ltd. | | | 5,740 | | | | 195,103 | |
AT&T, Inc. | | | 14,418 | | | | 486,031 | |
CenturyLink, Inc. | | | 12,788 | | | | 500,267 | |
Cisco Systems, Inc. | | | 24,575 | | | | 482,899 | |
Corning, Inc. | | | 38,507 | | | | 485,958 | |
EchoStar Corp. Class A (f) | | | 4,975 | | | | 170,244 | |
Frontier Communications Corp. | | | 80,070 | | | | 342,700 | |
Harris Corp. | | | 10,231 | | | | 500,910 | |
MetroPCS Communications, Inc. (f) | | | 44,996 | | | | 447,260 | |
Polycom, Inc. (f) | | | 25,224 | | | | 263,843 | |
Sprint Nextel Corp. (f) | | | 123,150 | | | | 698,260 | |
Telephone & Data Systems, Inc. | | | 19,352 | | | | 428,453 | |
United States Cellular Corp. (f) | | | 480 | | | | 16,915 | |
| | | | | | | | |
| | | | | | | 5,018,843 | |
| | | | | | | | |
Textiles 0.2% | |
Cintas Corp. | | | 25 | | | | 1,023 | |
Mohawk Industries, Inc. (f) | | | 3,441 | | | | 311,307 | |
| | | | | | | | |
| | | | | | | 312,330 | |
| | | | | | | | |
Transportation 0.8% | |
Con-way, Inc. | | | 6,686 | | | | 186,004 | |
CSX Corp. | | | 21,557 | | | | 425,320 | |
FedEx Corp. | | | 5,371 | | | | 492,628 | |
Norfolk Southern Corp. | | | 6,920 | | | | 427,933 | |
Ryder System, Inc. | | | 801 | | | | 39,994 | |
| | | | | | | | |
| | | | | | | 1,571,879 | |
| | | | | | | | |
Total Common Stocks
(Cost $111,024,275) | | | | | | | 126,588,930 | |
| | | | | | | | |
|
| Exchange Traded Funds 2.3% (g) | |
¨S&P 500 Index—SPDR Trust Series 1 | | | 12,270 | | | | 1,748,720 | |
¨S&P Midcap 400 Index—Midcap SPDR Trust Series 1 | | | 15,957 | | | | 2,963,375 | |
| | | | | | | | |
Total Exchange Traded Funds
(Cost $4,575,036) | | | | | | | 4,712,095 | |
| | | | | | | | |
| | | | | | | | |
| | | Principal
Amount | | | Value | |
| Short-Term Investments 1.0% | |
Financial Company Commercial Paper 0.7% | |
Bank of Nova Scotia
0.005%, due 1/2/13 (h) | | $ | 1,480,000 | | | $ | 1,479,999 | |
| | | | | | | | |
Total Financial Company Commercial Paper
(Cost $1,479,999) | | | | 1,479,999 | |
| | | | | | | | |
|
Repurchase Agreement 0.3% | |
State Street Bank and Trust Co.
0.01%, dated 12/31/12
due 2/1/13
Proceeds at Maturity $681,375 (Collateralized by United States Treasury and Government Agency securities with rates between 0.25% and 2.11% and maturity dates between 9/30/14 and 11/7/22, with a Principal Amount of $700,000 and a Market Value of $701,671) | | | 681,375 | | | | 681,375 | |
| | | | | | | | |
Total Repurchase Agreement
(Cost $681,375) | | | | | | | 681,375 | |
| | | | | | | | |
Total Short-Term Investments
(Cost $2,161,374) | | | | | | | 2,161,374 | |
| | | | | | | | |
Total Investments
(Cost $184,921,508) (i) | | | 100.5 | % | | | 202,369,609 | |
Other Assets, Less Liabilities | | | (0.5 | ) | | | (998,009 | ) |
Net Assets | | | 100.0 | % | | $ | 201,371,600 | |
| ‡ | Less than one-tenth of a percent. |
| (a) | May be sold to institutional investors only under Rule 144A or securities offered pursuant to Section 4(2) of the Securities Act of 1933, as amended. |
| (b) | Step coupon. Rate shown is the rate in effect as of December 31, 2012. |
| (c) | Floating rate—Rate shown is the rate in effect as of December 31, 2012. |
| (d) | TBA—Securities purchased on a forward commitment basis with an approximate principal amount and maturity date. The actual principal amount and maturity date will be determined upon settlement. The market value of these securities as of December 31, 2012 is $852,074, which represents 0.4% of the Portfolio’s net assets. All or a portion of these securities were acquired under a mortgage dollar roll agreement. |
| (e) | Yankee Bond—Dollar-denominated bond issued in the United States by a foreign bank or corporation. |
| | | | | | |
The notes to the financial statements are an integral part of,
and should be read in conjunction with, the financial statements. | | mainstayinvestments.com | | | M-21 | |
Portfolio of Investments December 31, 2012 (continued)
| (f) | Non-income producing security. |
| (g) | Exchange Traded Fund—An investment vehicle that represents a basket of securities that is traded on an exchange. |
| (h) | Interest rate presented is yield to maturity. |
| (i) | As of December 31, 2012, cost is $186,804,151 for federal income tax purposes and net unrealized appreciation is as follows: |
| | | | |
Gross unrealized appreciation | | $ | 16,959,755 | |
Gross unrealized depreciation | | | (1,394,297 | ) |
| | | | |
Net unrealized appreciation | | $ | 15,565,458 | |
| | | | |
The following abbreviation is used in the above portfolio:
SPDR—Standard & Poor’s Depositary Receipt
The following is a summary of the fair valuations according to the inputs used as of December 31, 2012, for valuing the Portfolio’s assets.
Asset Valuation Inputs
| | | | | | | | | | | | | | | | |
Description | | Quoted Prices
in Active Markets
for Identical Assets
(Level 1) | | | Significant Other
Observable Inputs (Level 2) | | | Significant
Unobservable
Inputs
(Level 3) | | | Total | |
| Investments in Securities (a) | | | | | | | | | | | | | | | | |
| Long-Term Bonds | | | | | | | | | | | | | | | | |
Asset-Backed Securities | | $ | — | | | $ | 1,947,683 | | | $ | — | | | $ | 1,947,683 | |
Corporate Bonds | | | — | | | | 23,313,121 | | | | — | | | | 23,313,121 | |
Foreign Government Bonds | | | — | | | | 785,708 | | | | — | | | | 785,708 | |
Mortgage-Backed Securities | | | — | | | | 1,123,112 | | | | — | | | | 1,123,112 | |
U.S. Government & Federal Agencies | | | — | | | | 33,700,998 | | | | — | | | | 33,700,998 | |
Yankee Bonds | | | — | | | | 8,036,588 | | | | — | | | | 8,036,588 | |
| | | | | | | | | | | | | | | | |
| Total Long-Term Bonds | | | — | | | | 68,907,210 | | | | — | | | | 68,907,210 | |
| | | | | | | | | | | | | | | | |
| Common Stocks | | | 126,588,930 | | | | — | | | | — | | | | 126,588,930 | |
| Exchange Traded Funds | | | 4,712,095 | | | | — | | | | — | | | | 4,712,095 | |
| Short-Term Investments | | | | | | | | | | | | | | | | |
Financial Company Commercial Paper | | | — | | | | 1,479,999 | | | | — | | | | 1,479,999 | |
Repurchase Agreement | | | — | | | | 681,375 | | | | — | | | | 681,375 | |
| | | | | | | | | | | | | | | | |
| Total Short-Term Investments | | | — | | | | 2,161,374 | | | | — | | | | 2,161,374 | |
| | | | | | | | | | | | | | | | |
| Total Investments in Securities | | $ | 131,301,025 | | | $ | 71,068,584 | | | $ | — | | | $ | 202,369,609 | |
| | | | | | | | | | | | | | | | |
| (a) | For a complete listing of investments and their industries, see the Portfolio of Investments. |
The Portfolio recognizes transfers between the levels as of the beginning of the period.
For the year ended December 31, 2012, the Portfolio did not have any transfers between Level 1 and Level 2 fair value measurements. (See Note 2)
As of December 31, 2012, the Portfolio did not hold any investments with significant unobservable inputs (Level 3). (See Note 2)
| | | | |
| M-22 | | MainStay VP Balanced Portfolio | | The notes to the financial statements are an integral part of,
and should be read in conjunction with, the financial statements. |
Statement of Assets and Liabilities as of December 31, 2012
| | | | |
| Assets | |
Investment in securities, at value
(identified cost $184,921,508) | | $ | 202,369,609 | |
Cash | | | 3,637 | |
Receivables: | | | | |
Investment securities sold | | | 1,653,212 | |
Dividends and interest | | | 498,961 | |
Fund shares sold | | | 303,290 | |
Other assets | | | 508 | |
| | | | |
Total assets | | | 204,829,217 | |
| | | | |
| |
| Liabilities | | | | |
Payables: | | | | |
Investment securities purchased | | | 3,221,955 | |
Manager (See Note 3) | | | 115,714 | |
NYLIFE Distributors (See Note 3) | | | 40,125 | |
Professional fees | | | 33,647 | |
Fund shares redeemed | | | 20,461 | |
Shareholder communication | | | 16,037 | |
Custodian | | | 9,292 | |
Trustees | | | 344 | |
Accrued expenses | | | 42 | |
| | | | |
Total liabilities | | | 3,457,617 | |
| | | | |
Net assets | | $ | 201,371,600 | |
| | | | |
| |
| Net Assets Consist of | | | | |
Shares of beneficial interest outstanding (par value of $.001 per share) unlimited number of shares authorized | | $ | 16,572 | |
Additional paid-in capital | | | 184,452,203 | |
| | | | |
| | | 184,468,775 | |
Undistributed net investment income | | | 2,535,109 | |
Accumulated net realized gain (loss) on investments | | | (3,080,385 | ) |
Net unrealized appreciation (depreciation) on investments | | | 17,448,101 | |
| | | | |
Net assets | | $ | 201,371,600 | |
| | | | |
| | | | |
Initial Class | | | | |
Net assets applicable to outstanding shares | | $ | 10,075,356 | |
| | | | |
Shares of beneficial interest outstanding | | | 824,726 | |
| | | | |
Net asset value per share outstanding | | $ | 12.22 | |
| | | | |
Service Class | | | | |
Net assets applicable to outstanding shares | | $ | 191,296,244 | |
| | | | |
Shares of beneficial interest outstanding | | | 15,746,789 | |
| | | | |
Net asset value per share outstanding | | $ | 12.15 | |
| | | | |
| | | | | | |
The notes to the financial statements are an integral part of,
and should be read in conjunction with, the financial statements. | | mainstayinvestments.com | | | M-23 | |
Statement of Operations for the year ended December 31, 2012
| | | | |
| Investment Income (Loss) | |
Income | | | | |
Dividends (a) | | $ | 3,232,590 | |
Interest | | | 1,273,234 | |
| | | | |
Total income | | | 4,505,824 | |
| | | | |
Expenses | | | | |
Manager (See Note 3) | | | 1,398,849 | |
Distribution and service—Service Class (See Note 3) | | | 441,526 | |
Custodian | | | 53,171 | |
Professional fees | | | 49,565 | |
Shareholder communication | | | 31,667 | |
Trustees | | | 5,013 | |
Miscellaneous | | | 8,959 | |
| | | | |
Total expenses before waiver/reimbursement | | | 1,988,750 | |
Expense waiver/reimbursement from Manager (See Note 3) | | | (93,256 | ) |
| | | | |
Net expenses | | | 1,895,494 | |
| | | | |
Net investment income (loss) | | | 2,610,330 | |
| | | | |
|
| Realized and Unrealized Gain (Loss) on Investments | |
Net realized gain (loss) on investments | | | 6,920,598 | |
Net change in unrealized appreciation (depreciation) on investments | | | 11,417,977 | |
| | | | |
Net realized and unrealized gain (loss) on investments | | | 18,338,575 | |
| | | | |
Net increase (decrease) in net assets resulting from operations | | $ | 20,948,905 | |
| | | | |
| (a) | Dividends recorded net of foreign withholding taxes in the amount of $7,829. |
| | | | |
| M-24 | | MainStay VP Balanced Portfolio | | The notes to the financial statements are an integral part of,
and should be read in conjunction with, the financial statements. |
Statements of Changes in Net Assets
for the years ended December 31, 2012 and December 31, 2011
| | | | | | | | |
| | | 2012 | | | 2011 | |
| Increase (Decrease) in Net Assets | |
Operations: | | | | | | | | |
Net investment income (loss) | | $ | 2,610,330 | | | $ | 2,218,511 | |
Net realized gain (loss) on investments and futures transactions | | | 6,920,598 | | | | 13,889,077 | |
Net change in unrealized appreciation (depreciation) on investments | | | 11,417,977 | | | | (12,257,853 | ) |
| | | | |
Net increase (decrease) in net assets resulting from operations | | | 20,948,905 | | | | 3,849,735 | |
| | | | |
Dividends to shareholders: | | | | | | | | |
From net investment income: | | | | | | | | |
Initial Class | | | (133,941 | ) | | | (148,427 | ) |
Service Class | | | (2,098,885 | ) | | | (2,154,087 | ) |
| | | | |
Total dividends to shareholders | | | (2,232,826 | ) | | | (2,302,514 | ) |
| | | | |
Capital share transactions: | | | | | | | | |
Net proceeds from sale of shares | | | 33,936,435 | | | | 34,228,656 | |
Net asset value of shares issued to shareholders in reinvestment of dividends | | | 2,232,826 | | | | 2,302,514 | |
Cost of shares redeemed | | | (23,181,558 | ) | | | (26,413,895 | ) |
| | | | |
Increase (decrease) in net assets derived from capital share transactions | | | 12,987,703 | | | | 10,117,275 | |
| | | | |
Net increase (decrease) in net assets | | | 31,703,782 | | | | 11,664,496 | |
|
| Net Assets | |
Beginning of year | | | 169,667,818 | | | | 158,003,322 | |
| | | | |
End of year | | $ | 201,371,600 | | | $ | 169,667,818 | |
| | | | |
Undistributed net investment income at end of year | | $ | 2,535,109 | | | $ | 2,237,862 | |
| | | | |
| | | | | | |
The notes to the financial statements are an integral part of,
and should be read in conjunction with, the financial statements. | | mainstayinvestments.com | | | M-25 | |
Financial Highlights selected per share data and ratios
| | | | | | | | | | | | | | | | | | | | |
| | | Initial Class | |
| | | Year ended December 31, | |
| | | 2012 | | | 2011 | | | 2010 | | | 2009 | | | 2008 | |
Net asset value at beginning of year | | $ | 11.02 | | | $ | 10.91 | | | $ | 9.74 | | | $ | 8.15 | | | $ | 10.89 | |
| | | | | | | | | | | | | | | | | | | | |
Net investment income (loss) | | | 0.19 | (a) | | | 0.17 | (a) | | | 0.19 | | | | 0.15 | (a) | | | 0.25 | |
Net realized and unrealized gain (loss) on investments | | | 1.17 | | | | 0.12 | | | | 1.13 | | | | 1.73 | | | | (2.96 | ) |
| | | | | | | | | | | | | | | | | | | | |
Total from investment operations | | | 1.36 | | | | 0.29 | | | | 1.32 | | | | 1.88 | | | | (2.71 | ) |
| | | | | | | | | | | | | | | | | | | | |
Less dividends and distributions: | | | | | | | | | | | | | | | | | | | | |
From net investment income | | | (0.16 | ) | | | (0.18 | ) | | | (0.15 | ) | | | (0.29 | ) | | | — | |
From net realized gain on investments | | | — | | | | — | | | | — | | | | — | | | | (0.03 | ) |
| | | | | | | | | | | | | | | | | | | | |
Total dividends and distributions | | | (0.16 | ) | | | (0.18 | ) | | | (0.15 | ) | | | (0.29 | ) | | | (0.03 | ) |
| | | | | | | | | | | | | | | | | | | | |
Net asset value at end of year | | $ | 12.22 | | | $ | 11.02 | | | $ | 10.91 | | | $ | 9.74 | | | $ | 8.15 | |
| | | | | | | | | | | | | | | | | | | | |
Total investment return | | | 12.32 | % | | | 2.79 | % | | | 13.62 | % | | | 23.07 | % | | | (24.85 | %) |
Ratios (to average net assets)/Supplemental Data: | | | | | | | | | | | | | | | | | | | | |
Net investment income (loss) | | | 1.62 | % | | | 1.57 | % | | | 1.89 | % | | | 1.69 | % | | | 2.44 | % |
Net expenses | | | 0.78 | % | | | 0.78 | % | | | 0.82 | % | | | 0.84 | % | | | 0.83 | % |
Expenses (before waiver/reimbursement) | | | 0.83 | % | | | 0.83 | % | | | 0.84 | % | | | 0.84 | % | | | 0.83 | % |
Portfolio turnover rate | | | 202 | %(b) | | | 241 | %(b) | | | 118 | % | | | 176 | %�� | | | 92 | % |
Net assets at end of year (in 000’s) | | $ | 10,075 | | | $ | 9,492 | | | $ | 9,598 | | | $ | 8,557 | | | $ | 7,232 | |
| (a) | Per share data based on average shares outstanding during the year. |
| (b) | The portfolio turnover rates not including mortgage dollar rolls were 195% and 238% for the years ended December 31, 2012 and 2011, respectively. The Portfolio did not engage in mortgage dollar rolls for the years ended December 31, 2010, 2009 and 2008. respectively. |
| | | | | | | | | | | | | | | | | | | | |
| | | Service Class | |
| | | Year ended December 31, | |
| | | 2012 | | | 2011 | | | 2010 | | | 2009 | | | 2008 | |
Net asset value at beginning of year | | $ | 10.97 | | | $ | 10.85 | | | $ | 9.69 | | | $ | 8.11 | | | $ | 10.86 | |
| | | | | | | | | | | | | | | | | | | | |
Net investment income (loss) | | | 0.16 | (a) | | | 0.15 | (a) | | | 0.16 | | | | 0.12 | (a) | | | 0.24 | |
Net realized and unrealized gain (loss) on investments | | | 1.16 | | | | 0.12 | | | | 1.13 | | | | 1.72 | | | | (2.96 | ) |
| | | | | | | | | | | | | | | | | | | | |
Total from investment operations | | | 1.32 | | | | 0.27 | | | | 1.29 | | | | 1.84 | | | | (2.72 | ) |
| | | | | | | | | | | | | | | | | | | | |
Less dividends and distributions: | | | | | | | | | | | | | | | | | | | | |
From net investment income | | | (0.14 | ) | | | (0.15 | ) | | | (0.13 | ) | | | (0.26 | ) | | | — | |
From net realized gain on investments | | | — | | | | — | | | | — | | | | — | | | | (0.03 | ) |
| | | | | | | | | | | | | | | | | | | | |
Total dividends and distributions | | | (0.14 | ) | | | (0.15 | ) | | | (0.13 | ) | | | (0.26 | ) | | | (0.03 | ) |
| | | | | | | | | | | | | | | | | | | | |
Net asset value at end of year | | $ | 12.15 | | | $ | 10.97 | | | $ | 10.85 | | | $ | 9.69 | | | $ | 8.11 | |
| | | | | | | | | | | | | | | | | | | | |
Total investment return | | | 12.04 | % | | | 2.53 | % | | | 13.34 | % | | | 22.76 | % | | | (25.04 | %) |
Ratios (to average net assets)/Supplemental Data: | | | | | | | | | | | | | | | | | | | | |
Net investment income (loss) | | | 1.37 | % | | | 1.32 | % | | | 1.65 | % | | | 1.43 | % | | | 2.18 | % |
Net expenses | | | 1.03 | % | | | 1.03 | % | | | 1.07 | % | | | 1.09 | % | | | 1.08 | % |
Expenses (before waiver/reimbursement) | | | 1.08 | % | | | 1.08 | % | | | 1.09 | % | | | 1.09 | % | | | 1.08 | % |
Portfolio turnover rate | | | 202 | %(b) | | | 241 | %(b) | | | 118 | % | | | 176 | % | | | 92 | % |
Net assets at end of year (in 000’s) | | $ | 191,296 | | | $ | 160,176 | | | $ | 148,405 | | | $ | 130,119 | | | $ | 119,374 | |
| (a) | Per share data based on average shares outstanding during the year. |
| (b) | The portfolio turnover rates not including mortgage dollar rolls were 195% and 238% for the years ended December 31, 2012 and 2011, respectively. The Portfolio did not engage in mortgage dollar rolls for the years ended December 31, 2010, 2009 and 2008. respectively. |
| | | | |
| M-26 | | MainStay VP Balanced Portfolio | | The notes to the financial statements are an integral part of,
and should be read in conjunction with, the financial statements. |
MainStay VP Bond Portfolio
Investment and Performance Comparison (Unaudited)
Performance data quoted represents past performance. Past performance is no guarantee of future results. Because of market volatility, current performance may be lower or higher than the figures shown. Investment return and principal value will fluctuate, and as a result, when shares are redeemed, they may be worth more or less than their original cost. The performance table and graph do not reflect any deduction of sales charges, mortality and expense charges, contract charges or administrative charges. Please refer to the Performance Summary appropriate for your policy. For performance information current to the most recent month-end, please call 800-598-2019 or visit www.newyorklife.com.
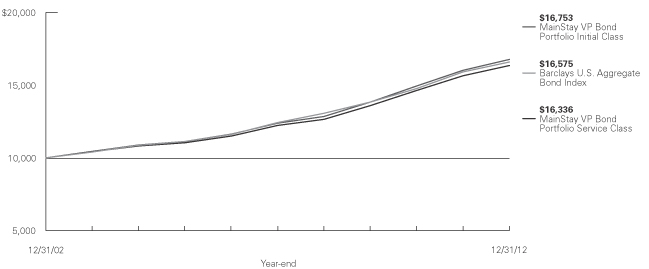
Average Annual Total Returns for the Year Ended December 31, 2012
| | | | | | | | | | | | | | | | |
| Class | | One Year | | | Five Years | | | Ten Years1 | | | Gross Expense Ratio2 | |
| Initial Class Shares | | | 4.66 | % | | | 6.24 | % | | | 5.30 | % | | | 0.54 | % |
| Service Class Shares3 | | | 4.40 | | | | 5.97 | | | | 5.03 | | | | 0.79 | |
| | | | | | | | | | | | |
| Benchmark Performance | | One
Year | | | Five
Years | | | Ten
Years | |
Barclays U.S. Aggregate Bond Index4 | | | 4.22 | % | | | 5.95 | % | | | 5.18 | % |
Average Lipper Variable Products Intermediate Investment Grade Debt Portfolio5 | | | 6.69 | | | | 5.62 | | | | 5.24 | |
| 1. | Performance figures shown for the ten-year period ended December 31, 2012 reflect nonrecurring reimbursements from affiliates for printing and mailing costs. If these nonrecurring reimbursements had not been made, the total returns would have been 5.28% for Initial Class shares and 5.02% for Service Class shares for the ten-year period. |
| 2. | The gross expense ratios presented reflect the Portfolio’s “Total Annual Portfolio Operating Expenses” from the most recent Prospectus and may differ from other expense ratios disclosed in this report. |
| 3. | Performance for Service Class shares, first offered June 4, 2003, includes the historical performance of Initial Class shares |
| | through June 3, 2003 adjusted to reflect the fees and expenses of Service Class shares. |
| 4. | Please refer to pages M-2 and M-3 for additional explanations and disclosure regarding the Portfolios, their benchmark indices and other indices mentioned in the reports. |
| 5. | The Average Lipper Variable Products Intermediate Investment Grade Debt Portfolio is representative of portfolios that invest primarily in investment-grade debt issues (rated in the top four grades) with dollar-weighted average maturities of five to ten years. Lipper Inc. is an independent monitor of fund performance. Results are based on total returns with all dividend and capital gain distributions reinvested. |
| | | | |
| mainstayinvestments.com | | | M-27 | |
Cost in Dollars of a $1,000 Investment in MainStay VP Bond Portfolio (Unaudited)
The example below is intended to describe the fees and expenses borne by shareholders during the six-month period from July 1, 2012 to December 31, 2012, and the impact of those costs on your investment.
Example
As a shareholder of the Portfolio, you incur two types of costs: (1) transaction costs, including exchange fees and sales charges (loads) on purchases (as applicable), and (2) ongoing costs, including management fees, distribution and/or service (12b-1) fees, and other Portfolio expenses (as applicable). This example is intended to help you understand your ongoing costs (in dollars) of investing in the Portfolio and to compare these costs with the ongoing costs of investing in other Portfolios. The example is based on an investment of $1,000 made at the beginning of the six-month period and held for the entire period from July 1, 2012, to December 31, 2012. Shares are only sold in connection with variable life and annuity contracts and the example does not reflect any contract level or transactional fees or expenses. If these costs had been included, your costs would have been higher.
This example illustrates your Portfolio’s ongoing costs in two ways:
Actual Expenses
The second and third data columns in the table below provide information about actual account values and actual expenses. You may use the information in these columns, together with the amount you invested, to estimate the expenses that you paid during the six months ended
December 31, 2012. Simply divide your account value by $1,000 (for example, an $8,600 account value divided by $1,000 = 8.6), then multiply the result by the number under the heading entitled ‘‘Expenses Paid During Period’’ to estimate the expenses you paid on your account during this period.
Hypothetical Example for Comparison Purposes
The fourth and fifth data columns in the table below provide information about hypothetical account values and hypothetical expenses based on the Portfolio’s actual expense ratio and an assumed rate of return of 5% per year before expenses, which is not the Portfolio’s actual return. The hypothetical account values and expenses may not be used to estimate the actual ending account balances or expenses you paid for the six-month period shown. You may use this information to compare the ongoing costs of investing in the Portfolio with the ongoing costs of investing in other Portfolios. To do so, compare this 5% hypothetical example with the 5% hypothetical examples that appear in the shareholder reports of the other Portfolios.
Please note that the expenses shown in the table are meant to highlight your ongoing costs only and do not reflect any transactional costs, such as exchange fees or sales charges (loads). Therefore, the fourth and fifth data columns of the table are useful in comparing ongoing costs only and will not help you determine the relative total costs of owning different funds. In addition, if these transactional costs were included, your costs would have been higher.
| | | | | | | | | | | | | | | | | | | | |
| | | | | | | | | | | | | | | | |
| Share Class | | Beginning
Account
Value
7/1/12 | | | Ending Account
Value (Based
on Actual
Returns and
Expenses)
12/31/12 | | | Expenses
Paid
During
Period1 | | | Ending Account
Value (Based
on Hypothetical
5% Annualized
Return and
Actual Expenses)
12/31/12 | | | Expenses
Paid
During
Period1 | |
| | | | | |
| Initial Class Shares | | $ | 1,000.00 | | | $ | 1,018.60 | | | $ | 2.69 | | | $ | 1,022.50 | | | $ | 2.69 | |
| | | | | |
| Service Class Shares | | $ | 1,000.00 | | | $ | 1,017.30 | | | $ | 3.96 | | | $ | 1,021.20 | | | $ | 3.96 | |
| 1. | Expenses are equal to the Portfolio’s annualized expense ratio of each class (0.53% for Initial Class and 0.78% for Service Class) multiplied by the average account value over the period, divided by 366 and multiplied by 184 (to reflect the six-month period). The table above represents the actual expenses incurred during the six-month period. |
| | |
| M-28 | | MainStay VP Bond Portfolio |
Portfolio Composition as of December 31, 2012 (Unaudited)
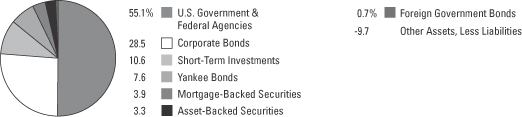
See Portfolio of Investments beginning on page M-32 for specific holdings within these categories.
Top Ten Issuers Held as of December 31, 2012 (excluding short-term investments) (Unaudited)
| 1. | Federal National Mortgage Association (Mortgage Pass-Through Securities), 2.283%–7.50%, due 5/1/16–8/1/42 |
| 2. | United States Treasury Notes, 0.125%–2.00%, due 12/31/14–11/15/22 |
| 3. | Federal Home Loan Mortgage Corporation (Mortgage Pass-Through Securities), 2.437%–7.00%, due 3/1/15–5/1/42 |
| 4. | Government National Mortgage Association (Mortgage Pass-Through Securities), 3.00%–7.00%, due 7/15/31–8/1/42 |
| 5. | Federal Home Loan Mortgage Corporation, 0.50%–5.50%, due 2/27/15–1/13/22 |
| 6. | Federal National Mortgage Association, 0.375%–2.75%, due 3/13/14–12/28/17 |
| 7. | United States Treasury Bonds, 2.75%–6.25%, due 8/15/23–8/15/42 |
| 8. | Citigroup, Inc., 4.587%–6.01%, due 10/15/14–8/9/20 |
| 9. | Bank of America Corp., 3.70%–5.625%, due 4/1/15–7/1/20 |
| 10. | JP Morgan Chase Commercial Mortgage Securities Corp., 2.206%–5.814%, due 1/12/43–5/15/45 |
| | | | |
| mainstayinvestments.com | | | M-29 | |
Portfolio Management Discussion and Analysis (Unaudited)
Answers to the questions reflect the views of portfolio managers Donald F. Serek, CFA, Thomas J. Girard and George S. Cherpelis of New York Life Investments,1 the Portfolio’s Manager.
How did MainStay VP Bond Portfolio perform relative to its peers and its benchmark during the 12 months ended December 31, 2012?
For the 12 months ended December 31, 2012, MainStay VP Bond Portfolio returned 4.66% for Initial Class shares and 4.40% for Service Class shares. Both share classes underperformed the 6.69% return of the average Lipper2 Variable Products Intermediate Investment Grade Debt Portfolio and outperformed the 4.22% return of the Barclays U.S. Aggregate Bond Index2 for the 12 months ended December 31, 2012. The Barclays U.S. Aggregate Bond Index is the Portfolio’s broad-based securities-market index.
What factors affected the Portfolio’s relative performance during the reporting period?
Throughout the majority of 2012, the Portfolio held overweight positions in corporate bonds, mortgage-backed securities, commercial mortgage-backed securities and asset-backed securities. These sec-tors performed very well during the reporting period. Overweight positions in these sectors were accretive to the Portfolio’s performance. The corporate sector made the greatest positive contribution to the Portfolio’s results. (Contributions take weightings and total returns into account.)
During the second quarter of 2012, the Portfolio reduced its overall exposure to risk assets. Allocations to corporate bonds and mortgage-backed securities were reduced, which increased the allocations to U.S. Treasury and agency securities. The Portfolio maintained its overweight position in commercial mortgage-backed securities and slightly increased its overweight position in asset-backed securities. The repositioning resulted in positive performance for the reporting period, as security selection within spread assets was accretive to performance.
What was the Portfolio’s duration3 strategy during the reporting period?
The Portfolio’s duration position varied during the year. In general, the duration was held in close proximity to that of the Barclays U.S. Aggregate Bond Index. There were two instances when the Portfolio’s
duration was slightly shorter or longer than that of the Index. One instance was during the first half of the reporting period when the Portfolio’s duration was shorter than that of the Barclays U.S. Aggregate Bond Index. The second instance was in the second half of the reporting period when the Portfolio’s duration was longer than that of the Index. Overall duration positioning had a modest negative impact on perfor-mance during the reporting period.
What specific factors, risks or market forces prompted significant decisions for the Portfolio during the reporting period?
There were three periods where specific factors, risks and market forces prompted asset allocation decisions for the Portfolio during 2012. The Portfolio started the reporting period with an overweight position in spread assets. This positioning was adopted because we anticipated that funding pressures in Europe would abate and the U.S. economy would improve. This allocation decision contributed favorably to the Portfolio’s performance. Toward the start of the second quarter of 2012, however, an upward swing in global economic risks and rising systemic risk from Europe prompted us to reduce spread-asset exposure to a more neutral position. This allocation decision was defensive, and the Portfolio’s performance during this portion of the reporting period was neutral to the benchmark. In the third quarter of 2012, aggressive central bank actions led us to once again view spread4 assets favorably. We increased the Portfolio’s allocation to spread assets, maintaining overweight positions in them until the end of the reporting period. These allocation decisions were accretive to performance, as spread assets gener-ated positive excess returns.
During the reporting period, which market segments were the strongest contributors to the Portfolio’s performance and which market segments were particularly weak?
During the reporting period, overweight positions relative to the Barclays U.S. Aggregate Bond Index in corporate bonds, asset-backed securities, mortgage-
| 1. | “New York Life Investments” is a service mark used by New York Life Investment Management LLC. |
| 2. | Please refer to pages M-2 and M-3 for additional explanations and disclosure regarding the Portfolios, their benchmark indices and service providers mentioned in the reports. |
| 3. | Duration is a measure of the price sensitivity of a fixed-income investment to changes in interest rates. Duration is expressed as a number of years and is considered a more accurate sensitivity gauge than average maturity. |
| 4. | The terms “spread” and “yield spread” may refer to the difference in yield between a security or type of security and comparable U.S. Treasury issues. The terms may also refer to the difference in yield between two specific securities or types of securities at a given time. |
| | |
| M-30 | | MainStay VP Bond Portfolio |
backed securities and commercial mortgage-backed securities were all strong contributors to the Portfolio’s performance. Corporate bonds—specifically overweight positions in financials, industrials and utilities—made the most substantial contribution to performance.
An underweight position relative to the Barclays U.S. Aggregate Bond Index in U.S. Treasury securities was the most substantial detractor from the Portfolio’s performance. The negative impact of U.S. Treasury securities, however, was more than offset by the returns on spread assets. Duration positioning had a modestly negative impact on performance.
Did the Portfolio make any significant purchases or sales during the reporting period?
Outside of its normal operating parameters, the Portfolio did not make any significant purchases or sales.
How did the Portfolio’s sector weightings change during the reporting period?
As previously noted, we modified the Portfolio’s exposure to spread assets throughout the year in response to risk factors and perceived reward potential. We funded overweight positions in spread assets by lowering allocations to U.S. Treasury and agency securities.
How was the Portfolio positioned at the end of the reporting period?
As of December 31, 2012, the Portfolio was positioned with overweight positions relative to the Barclays U.S. Aggregate Bond Index in spread assets. The largest overweight was in U.S. corporate bonds, followed by mortgage-backed securities. As of the same date, the Portfolio held overweight positions in asset-backed securities and commercial mortgage-backed securities. As of December 31, 2012, the Portfolio was underweight relative to the Barclays U.S. Aggregate Bond Index in U.S. Treasury securities, and the Portfolio’s duration was neutral to the Index.
The opinions expressed are those of the portfolio managers as of the date of this report and are subject to change. There is no guarantee that any forecasts made will come to pass. This material does not constitute investment advice and is not intended as an endorsement of any specific investment.
Not all MainStay VP Portfolios and/or share classes are available under all policies.
| | | | |
| mainstayinvestments.com | | | M-31 | |
Portfolio of Investments December 31, 2012
| | | | | | | | |
| | | Principal Amount | | | Value | |
| | | | | | | | |
Long-Term Bonds 99.1%† Asset-Backed Securities 3.3% | |
Automobile 1.5% | |
Ally Auto Receivables Trust
Series 2012-1, Class A3
0.93%, due 2/16/16 | | $ | 1,250,000 | | | $ | 1,257,800 | |
Ford Credit Auto Owner Trust
Series 2012-A, Class A3
0.84%, due 8/15/16 | | | 2,080,000 | | | | 2,090,851 | |
Huntington Auto Trust
Series 2012-2, Class A3
0.51%, due 4/17/17 | | | 3,300,000 | | | | 3,298,766 | |
Hyundai Auto Receivables Trust
Series 2012-A, Class A3
0.72%, due 3/15/16 | | | 1,797,000 | | | | 1,803,230 | |
Mercedes-Benz Auto Receivables Trust
Series 2012-1, Class A3
0.47%, due 10/17/16 | | | 4,000,000 | | | | 3,998,464 | |
Series 2009-1, Class A3
1.67%, due 1/15/14 | | | 66,179 | | | | 66,242 | |
Nissan Auto Lease Trust
Series 2010-B, Class A3
1.12%, due 12/15/13 | | | 249,876 | | | | 250,052 | |
USAA Auto Owner Trust
Series 2012-1, Class A3
0.43%, due 8/15/16 | | | 1,500,000 | | | | 1,498,915 | |
Volkswagen Auto Loan Enhanced Trust
Series 2012-1, Class A3
0.85%, due 8/22/16 | | | 2,080,000 | | | | 2,092,191 | |
| | | | | | | | |
| | | | | | | 16,356,511 | |
| | | | | | | | |
Credit Cards 0.1% | |
Discover Card Master Trust
Series 2012-A1, Class A1
0.81%, due 8/15/17 | | | 1,157,000 | | | | 1,165,726 | |
| | | | | | | | |
|
Home Equity 1.1% | |
Chase Funding Mortgage Loan Asset-Backed Certificates
Series 2002-2, Class 1A5
6.333%, due 4/25/32 (a)(b) | | | 402,145 | | | | 411,696 | |
CIT Group Home Equity Loan Trust
Series 2003-1, Class A4
3.93%, due 3/20/32 (a)(b) | | | 630,243 | | | | 645,857 | |
Citifinancial Mortgage Securities, Inc.
Series 2003-3, Class AF5
5.053%, due 8/25/33 (a)(b) | | | 398,581 | | | | 395,030 | |
| | | | | | | | |
| | | Principal Amount | | | Value | |
| | | | | | | | |
Home Equity (continued) | | | | | | | | |
Citigroup Mortgage Loan Trust, Inc.
Series 2006-WF2, Class A2C
5.852%, due 5/25/36 (a)(b) | | $ | 175,017 | | | $ | 109,542 | |
Countrywide Asset-Backed Certificates | | | | | | | | |
Series 2006-S8, Class A3
5.555%, due 4/25/36 (b)(c) | | | 994,642 | | | | 846,986 | |
Series 2007-S1, Class A3
5.81%, due 11/25/36 (b)(c) | | | 520,159 | | | | 381,871 | |
Credit-Based Asset Servicing and Securitization LLC | | | | | | | | |
Series 2007-CB4, Class A2B
5.171%, due 4/25/37 (a)(b) | | | 500,000 | | | | 334,789 | |
Series 2007-CB2, Class A2C
5.326%, due 2/25/37 (a)(b) | | | 1,000,000 | | | | 772,759 | |
Equity One ABS, Inc.
Series 2003-4, Class AF6
4.833%, due 10/25/34 (a)(b) | | | 884,666 | | | | 899,436 | |
JPMorgan Mortgage Acquisition Corp. | | | | | | | | |
Series 2007-CH2, Class AF3
5.266%, due 1/25/37 (a)(b) | | | 1,000,000 | | | | 636,489 | |
Series 2007-CH1, Class AF3
5.519%, due 11/25/36 (a)(b) | | | 1,000,000 | | | | 987,124 | |
Series 2006-WF1, Class A6
6.00%, due 7/25/36 (a)(b) | | | 794,755 | | | | 503,537 | |
Morgan Stanley Mortgage Loan Trust
Series 2006-17XS, Class A3A
5.651%, due 10/25/46 (a) | | | 1,654,271 | | | | 1,127,788 | |
Popular ABS Mortgage Pass-
Through Trust
Series 2005-5, Class AF3
5.086%, due 11/25/35 (b)(c) | | | 1,568,126 | | | | 1,493,541 | |
RAMP Trust
Series 2003-RZ5, Class A7
4.97%, due 9/25/33 (a)(b) | | | 333,627 | | | | 343,360 | |
Saxon Asset Securities Trust
Series 2003-1, Class AF5
5.455%, due 6/25/33 (a)(b) | | | 1,357,771 | | | | 1,425,379 | |
| | | | | | | | |
| | | | | | | 11,315,184 | |
| | | | | | | | |
Other ABS 0.6% | |
CNH Equipment Trust | | | | | | | | |
Series 2012-C, Class A3
0.57%, due 12/15/17 | | | 2,200,000 | | | | 2,200,348 | |
Series 2010-C, Class A3
1.17%, due 5/15/15 | | | 281,631 | | | | 282,618 | |
Entergy Texas Restoration Funding LLC
Series 2009-A, Class A1
2.12%, due 2/1/16 | | | 511,978 | | | | 520,722 | |
| † | Percentages indicated are based on Portfolio net assets. |
| ¨ | | Among the Portfolio’s 10 largest issuers held, as of December 31, 2012, excluding short-term investments. May be subject to change daily. |
| | | | |
| M-32 | | MainStay VP Bond Portfolio | | The notes to the financial statements are an integral part of,
and should be read in conjunction with, the financial statements. |
| | | | | | | | |
| | | Principal Amount | | | Value | |
| | | | | | | | |
| Asset-Backed Securities (continued) | |
Other ABS (continued) | |
John Deere Owner Trust
Series 2012-B, Class A3
0.53%, due 7/15/16 | | $ | 2,100,000 | | | $ | 2,101,531 | |
Marriott Vacation Club Owner Trust Series 2007-2A, Class A
5.808%, due 10/20/29 (d) | | | 1,054,171 | | | | 1,113,674 | |
| | | | | | | | |
| | | | | | | 6,218,893 | |
| | | | | | | | |
Total Asset-Backed Securities
(Cost $36,704,954) | | | | | | | 35,056,314 | |
| | | | | | | | |
|
| Corporate Bonds 28.5% | |
Aerospace & Defense 0.7% | |
General Dynamics Corp.
3.60%, due 11/15/42 | | | 2,500,000 | | | | 2,405,000 | |
Northrop Grumman Corp.
1.85%, due 11/15/15 | | | 1,250,000 | | | | 1,283,491 | |
United Technologies Corp.
3.10%, due 6/1/22 | | | 3,000,000 | | | | 3,176,964 | |
| | | | | | | | |
| | | | | | | 6,865,455 | |
| | | | | | | | |
Auto Manufacturers 0.3% | |
Daimler Finance North America LLC | | | | | | | | |
1.30%, due 7/31/15 (d) | | | 375,000 | | | | 377,177 | |
3.00%, due 3/28/16 (d) | | | 500,000 | | | | 523,016 | |
3.875%, due 9/15/21 (d) | | | 1,625,000 | | | | 1,753,009 | |
| | | | | | | | |
| | | | | | | 2,653,202 | |
| | | | | | | | |
Banks 5.2% | |
American Express Bank FSB
6.00%, due 9/13/17 | | | 750,000 | | | | 905,218 | |
¨Bank of America Corp. | | | | | | | | |
3.70%, due 9/1/15 | | | 5,430,000 | | | | 5,740,265 | |
4.50%, due 4/1/15 | | | 5,700,000 | | | | 6,075,778 | |
5.625%, due 7/1/20 | | | 925,000 | | | | 1,096,705 | |
BB&T Corp.
1.45%, due 1/12/18 | | | 1,200,000 | | | | 1,205,362 | |
Capital One Financial Corp.
1.00%, due 11/6/15 | | | 3,250,000 | | | | 3,239,021 | |
¨Citigroup, Inc. | | | | | | | | |
4.587%, due 12/15/15 | | | 1,745,000 | | | | 1,905,104 | |
5.375%, due 8/9/20 | | | 3,016,000 | | | | 3,554,199 | |
5.50%, due 10/15/14 | | | 5,200,000 | | | | 5,578,773 | |
6.00%, due 8/15/17 | | | 2,000,000 | | | | 2,356,292 | |
6.01%, due 1/15/15 | | | 1,150,000 | | | | 1,256,622 | |
Goldman Sachs Group, Inc. (The) | | | | | | | | |
5.375%, due 3/15/20 | | | 850,000 | | | | 974,126 | |
5.75%, due 1/24/22 | | | 1,300,000 | | | | 1,536,876 | |
6.15%, due 4/1/18 | | | 1,250,000 | | | | 1,468,460 | |
6.25%, due 2/1/41 | | | 550,000 | | | | 674,807 | |
| | | | | | | | |
| | | Principal Amount | | | Value | |
| | | | | | | | |
Banks (continued) | |
HSBC Bank USA N.A.
4.875%, due 8/24/20 | | $ | 1,500,000 | | | $ | 1,671,657 | |
JPMorgan Chase & Co. | | | | | | | | |
2.00%, due 8/15/17 | | | 1,650,000 | | | | 1,685,468 | |
4.35%, due 8/15/21 | | | 1,250,000 | | | | 1,397,796 | |
4.40%, due 7/22/20 | | | 2,525,000 | | | | 2,850,331 | |
5.40%, due 1/6/42 | | | 2,425,000 | | | | 2,922,377 | |
KeyCorp
6.50%, due 5/14/13 | | | 1,500,000 | | | | 1,532,196 | |
Morgan Stanley | | | | | | | | |
5.50%, due 1/26/20 | | | 800,000 | | | | 897,434 | |
5.625%, due 9/23/19 | | | 800,000 | | | | 904,784 | |
6.625%, due 4/1/18 | | | 600,000 | | | | 707,145 | |
Wachovia Bank
4.80%, due 11/1/14 | | | 1,050,000 | | | | 1,127,022 | |
Wells Fargo & Co.
4.60%, due 4/1/21 | | | 1,000,000 | | | | 1,150,241 | |
| | | | | | | | |
| | | | | | | 54,414,059 | |
| | | | | | | | |
Beverages 0.5% | |
Anheuser-Busch InBev Worldwide, Inc.
3.75%, due 7/15/42 | | | 1,500,000 | | | | 1,506,934 | |
Coca-Cola Enterprises, Inc.
2.125%, due 9/15/15 | | | 1,650,000 | | | | 1,703,742 | |
SABMiller Holdings, Inc.
3.75%, due 1/15/22 (d) | | | 1,700,000 | | | | 1,835,713 | |
| | | | | | | | |
| | | | | | | 5,046,389 | |
| | | | | | | | |
Building Materials 0.1% | |
CRH America, Inc.
4.125%, due 1/15/16 | | | 675,000 | | | | 702,809 | |
| | | | | | | | |
| | |
Chemicals 0.6% | | | | | | | | |
Dow Chemical Co. (The) | | | | | | | | |
3.00%, due 11/15/22 | | | 2,650,000 | | | | 2,644,101 | |
5.70%, due 5/15/18 | | | 1,200,000 | | | | 1,427,129 | |
Eastman Chemical Co.
2.40%, due 6/1/17 | | | 875,000 | | | | 904,087 | |
Ecolab, Inc.
4.35%, due 12/8/21 | | | 1,000,000 | | | | 1,116,181 | |
| | | | | | | | |
| | | | | | | 6,091,498 | |
| | | | | | | | |
Commercial Services 0.1% | |
Western Union Co. (The)
2.875%, due 12/10/17 | | | 1,525,000 | | | | 1,511,043 | |
| | | | | | | | |
|
Computers 0.6% | |
Hewlett-Packard Co. | | | | | | | | |
2.35%, due 3/15/15 | | | 2,600,000 | | | | 2,611,578 | |
3.30%, due 12/9/16 | | | 2,750,000 | | | | 2,799,194 | |
4.375%, due 9/15/21 | | | 500,000 | | | | 495,654 | |
| | | | | | | | |
| | | | | | | 5,906,426 | |
| | | | | | | | |
| | | | | | |
The notes to the financial statements are an integral part of,
and should be read in conjunction with, the financial statements. | | mainstayinvestments.com | | | M-33 | |
Portfolio of Investments December 31, 2012 (continued)
| | | | | | | | |
| | | Principal Amount | | | Value | |
| | | | | | | |
| Corporate Bonds (continued) | |
Cosmetics & Personal Care 0.1% | |
Procter & Gamble Co. (The)
1.45%, due 8/15/16 | | $ | 1,000,000 | | | $ | 1,018,951 | |
| | | | | | | | |
| | |
Diversified Financial Services 0.4% | | | | | | | | |
General Electric Capital Corp. | | | | | | | | |
2.10%, due 12/11/19 | | | 2,250,000 | | | | 2,256,361 | |
4.65%, due 10/17/21 | | | 625,000 | | | | 713,147 | |
5.875%, due 1/14/38 | | | 1,000,000 | | | | 1,206,252 | |
| | | | | | | | |
| | | | | | | 4,175,760 | |
| | | | | | | | |
Electric 3.5% | |
Alabama Power Co.
4.10%, due 1/15/42 | | | 1,050,000 | | | | 1,078,155 | |
American Electric Power Co., Inc.
1.65%, due 12/15/17 | | | 2,275,000 | | | | 2,282,972 | |
Appalachian Power Co.
6.375%, due 4/1/36 | | | 1,750,000 | | | | 2,198,068 | |
Arizona Public Service Co.
5.50%, due 9/1/35 | | | 1,275,000 | | | | 1,510,708 | |
Carolina Power & Light Co.
6.125%, due 9/15/33 | | | 500,000 | | | | 638,353 | |
Consolidated Edison Company of New York, Inc.
4.20%, due 3/15/42 | | | 1,600,000 | | | | 1,705,195 | |
Detroit Edison Co. (The)
2.65%, due 6/15/22 | | | 1,650,000 | | | | 1,675,441 | |
Duke Energy Carolinas LLC
7.00%, due 11/15/18 | | | 2,000,000 | | | | 2,617,334 | |
Entergy Louisiana LLC | | | | | | | | |
1.875%, due 12/15/14 | | | 375,000 | | | | 383,144 | |
3.30%, due 12/1/22 | | | 800,000 | | | | 800,928 | |
Entergy Mississippi, Inc. | | | | | | | | |
3.10%, due 7/1/23 | | | 675,000 | | | | 666,275 | |
5.15%, due 2/1/13 | | | 500,000 | | | | 501,672 | |
Great Plains Energy, Inc. | | | | | | | | |
2.75%, due 8/15/13 | | | 2,000,000 | | | | 2,020,732 | |
4.85%, due 6/1/21 | | | 385,000 | | | | 424,168 | |
5.292%, due 6/15/22 (a) | | | 340,000 | | | | 382,078 | |
Kansas City Power & Light Co.
7.15%, due 4/1/19 | | | 900,000 | | | | 1,150,338 | |
NextEra Energy Capital Holdings, Inc. 1.20%, due 6/1/15 | | | 1,450,000 | | | | 1,460,315 | |
Nisource Finance Corp. | | | | | | | | |
5.40%, due 7/15/14 | | | 890,000 | | | | 948,435 | |
5.80%, due 2/1/42 | | | 1,300,000 | | | | 1,480,163 | |
NSTAR Electric Co.
2.375%, due 10/15/22 | | | 1,500,000 | | | | 1,490,757 | |
Ohio Edison Co.
6.875%, due 7/15/36 | | | 2,500,000 | | | | 3,237,677 | |
| | | | | | | | |
| | | Principal Amount | | | Value | |
| | | | | | | |
Electric (continued) | |
Pepco Holdings, Inc.
2.70%, due 10/1/15 | | $ | 1,000,000 | | | $ | 1,035,116 | |
PPL Capital Funding, Inc. | | | | | | | | |
3.50%, due 12/1/22 | | | 875,000 | | | | 890,660 | |
4.20%, due 6/15/22 | | | 2,000,000 | | | | 2,150,804 | |
Union Electric Co. | | | | | | | | |
3.90%, due 9/15/42 | | | 1,800,000 | | | | 1,824,075 | |
6.70%, due 2/1/19 | | | 1,500,000 | | | | 1,892,139 | |
Virginia Electric and Power Co.
2.95%, due 1/15/22 | | | 500,000 | | | | 526,537 | |
| | | | | | | | |
| | | | | | | 36,972,239 | |
| | | | | | | | |
Electronics 0.2% | |
Thermo Fisher Scientific, Inc.
3.15%, due 1/15/23 | | | 2,050,000 | | | | 2,095,049 | |
| | | | | | | | |
| | |
Engineering & Construction 0.1% | | | | | | | | |
ABB Finance USA, Inc.
4.375%, due 5/8/42 | | | 900,000 | | | | 976,942 | |
| | | | | | | | |
| | |
Finance—Auto Loans 0.6% | | | | | | | | |
American Honda Finance Corp.
2.60%, due 9/20/16 (d) | | | 1,500,000 | | | | 1,572,357 | |
Ford Motor Credit Co. LLC | | | | | | | | |
3.00%, due 6/12/17 | | | 1,775,000 | | | | 1,823,679 | |
4.25%, due 9/20/22 | | | 2,600,000 | | | | 2,749,201 | |
| | | | | | | | |
| | | | | | | 6,145,237 | |
| | | | | | | | |
Finance—Consumer Loans 0.1% | |
John Deere Capital Corp.
1.70%, due 1/15/20 | | | 1,000,000 | | | | 989,758 | |
| | | | | | | | |
| | |
Finance—Leasing Companies 0.1% | | | | | | | | |
Boeing Capital Corp.
2.90%, due 8/15/18 | | | 1,025,000 | | | | 1,105,110 | |
| | | | | | | | |
| | |
Finance—Other Services 0.2% | | | | | | | | |
Aon Corp.
3.125%, due 5/27/16 | | | 1,350,000 | | | | 1,421,245 | |
National Rural Utilities Cooperative Finance Corp.
5.45%, due 4/10/17 | | | 500,000 | | | | 585,759 | |
| | | | | | | | |
| | | | | | | 2,007,004 | |
| | | | | | | | |
Food 1.2% | |
General Mills, Inc.
3.15%, due 12/15/21 | | | 1,700,000 | | | | 1,776,991 | |
Ingredion, Inc.
1.80%, due 9/25/17 | | | 1,600,000 | | | | 1,589,479 | |
Kellogg Co.
1.75%, due 5/17/17 | | | 1,250,000 | | | | 1,270,298 | |
| | | | |
| M-34 | | MainStay VP Bond Portfolio | | The notes to the financial statements are an integral part of,
and should be read in conjunction with, the financial statements. |
| | | | | | | | |
| | | Principal Amount | | | Value | |
| | | | | | | |
| Corporate Bonds (continued) | |
Food (continued) | |
Kraft Foods Group, Inc.
3.50%, due 6/6/22 (d) | | $ | 1,750,000 | | | $ | 1,867,892 | |
Kroger Co. (The)
7.70%, due 6/1/29 | | | 1,000,000 | | | | 1,303,274 | |
Mondelez International, Inc.
4.125%, due 2/9/16 | | | 2,375,000 | | | | 2,587,574 | |
Unilever Capital Corp.
0.85%, due 8/2/17 | | | 2,200,000 | | | | 2,177,833 | |
| | | | | | | | |
| | | | | | | 12,573,341 | |
| | | | | | | | |
Forest Products & Paper 0.2% | |
International Paper Co.
4.75%, due 2/15/22 | | | 1,825,000 | | | | 2,065,053 | |
| | | | | | | | |
|
Gas 0.5% | |
Boston Gas Co.
4.487%, due 2/15/42 (d) | | | 1,250,000 | | | | 1,322,070 | |
KeySpan Gas East Corp.
5.819%, due 4/1/41 (d) | | | 2,000,000 | | | | 2,523,142 | |
Sempra Energy
2.30%, due 4/1/17 | | | 1,725,000 | | | | 1,791,204 | |
| | | | | | | | |
| | | | | | | 5,636,416 | |
| | | | | | | | |
Hand & Machine Tools 0.1% | |
Stanley Black & Decker, Inc.
3.40%, due 12/1/21 | | | 1,150,000 | | | | 1,200,406 | |
| | | | | | | | |
|
Health Care—Products 0.5% | |
Becton Dickinson and Co.
3.125%, due 11/8/21 | | | 1,550,000 | | | | 1,656,169 | |
CR Bard, Inc.
1.375%, due 1/15/18 | | | 925,000 | | | | 929,885 | |
Zimmer Holdings, Inc.
1.40%, due 11/30/14 | | | 2,325,000 | | | | 2,342,486 | |
| | | | | | | | |
| | | | | | | 4,928,540 | |
| | | | | | | | |
Health Care—Services 0.6% | |
Aetna, Inc.
1.75%, due 5/15/17 | | | 1,100,000 | | | | 1,116,594 | |
Laboratory Corp. of America Holdings
2.20%, due 8/23/17 | | | 1,300,000 | | | | 1,334,376 | |
UnitedHealth Group, Inc.
2.75%, due 2/15/23 | | | 1,725,000 | | | | 1,740,518 | |
WellPoint, Inc.
3.30%, due 1/15/23 | | | 2,450,000 | | | | 2,513,712 | |
| | | | | | | | |
| | | | | | | 6,705,200 | |
| | | | | | | | |
Insurance 1.3% | |
Allstate Corp. (The)
5.20%, due 1/15/42 | | | 1,175,000 | | | | 1,394,539 | |
| | | | | | | | |
| | | Principal Amount | | | Value | |
| | | | | | | |
Insurance (continued) | |
MetLife, Inc.
1.756%, due 12/15/17 | | $ | 1,950,000 | | | $ | 1,980,699 | |
Metropolitan Life Global Funding I | | | | | | | | |
2.00%, due 1/9/15 (d) | | | 1,500,000 | | | | 1,540,475 | |
3.125%, due 1/11/16 (d) | | | 1,325,000 | | | | 1,404,500 | |
5.125%, due 4/10/13 (d) | | | 500,000 | | | | 506,262 | |
5.125%, due 6/10/14 (d) | | | 2,700,000 | | | | 2,870,370 | |
Principal Financial Group, Inc. | | | | | | | | |
1.85%, due 11/15/17 | | | 750,000 | | | | 753,968 | |
8.875%, due 5/15/19 | | | 810,000 | | | | 1,086,894 | |
Prudential Financial, Inc.
4.50%, due 11/16/21 | | | 2,000,000 | | | | 2,249,286 | |
| | | | | | | | |
| | | | | | | 13,786,993 | |
| | | | | | | | |
Machinery—Construction & Mining 0.3% | |
Caterpillar, Inc.
1.50%, due 6/26/17 | | | 3,000,000 | | | | 3,038,355 | |
| | | | | | | | |
|
Machinery—Diversified 0.3% | |
Deere & Co.
5.375%, due 10/16/29 | | | 1,100,000 | | | | 1,408,136 | |
Roper Industries, Inc.
6.625%, due 8/15/13 | | | 1,500,000 | | | | 1,553,424 | |
| | | | | | | | |
| | | | | | | 2,961,560 | |
| | | | | | | | |
Media 1.0% | |
Comcast Cable Communications Holdings, Inc.
8.375%, due 3/15/13 | | | 766,000 | | | | 778,079 | |
COX Communications, Inc. | | | | | | | | |
3.25%, due 12/15/22 (d) | | | 1,450,000 | | | | 1,495,324 | |
5.45%, due 12/15/14 | | | 480,000 | | | | 523,481 | |
NBC Universal Media LLC
5.15%, due 4/30/20 | | | 1,000,000 | | | | 1,185,455 | |
News America, Inc.
6.40%, due 12/15/35 | | | 2,500,000 | | | | 3,103,372 | |
Reed Elsevier Capital, Inc.
7.75%, due 1/15/14 | | | 705,000 | | | | 754,930 | |
Time Warner Cable, Inc.
6.75%, due 7/1/18 | | | 1,425,000 | | | | 1,780,086 | |
Time Warner, Inc.
6.10%, due 7/15/40 | | | 1,000,000 | | | | 1,210,718 | |
| | | | | | | | |
| | | | | | | 10,831,445 | |
| | | | | | | | |
Metal Fabricate & Hardware 0.2% | |
Precision Castparts Corp.
2.50%, due 1/15/23 | | | 1,865,000 | | | | 1,876,951 | |
| | | | | | | | |
|
Mining 0.0%‡ | |
Alcoa, Inc.
6.15%, due 8/15/20 | | | 425,000 | | | | 464,161 | |
| | | | | | | | |
| | | | | | |
The notes to the financial statements are an integral part of,
and should be read in conjunction with, the financial statements. | | mainstayinvestments.com | | | M-35 | |
Portfolio of Investments December 31, 2012 (continued)
| | | | | | | | |
| | | Principal Amount | | | Value | |
| | | | | | | |
| Corporate Bonds (continued) | |
Miscellaneous—Manufacturing 0.7% | |
Eaton Corp.
1.50%, due 11/2/17 (d) | | $ | 1,850,000 | | | $ | 1,853,780 | |
General Electric Co. | | | | | | | | |
2.70%, due 10/9/22 | | | 3,500,000 | | | | 3,567,574 | |
4.125%, due 10/9/42 | | | 2,075,000 | | | | 2,134,445 | |
| | | | | | | | |
| | | | | | | 7,555,799 | |
| | | | | | | | |
Oil & Gas 1.4% | |
Apache Corp.
4.75%, due 4/15/43 | | | 2,500,000 | | | | 2,721,517 | |
ConocoPhillips
5.90%, due 5/15/38 | | | 1,500,000 | | | | 1,973,402 | |
Marathon Oil Corp.
0.90%, due 11/1/15 | | | 3,475,000 | | | | 3,477,801 | |
Noble Energy, Inc.
6.00%, due 3/1/41 | | | 1,350,000 | | | | 1,626,218 | |
Pemex Project Funding Master Trust
5.75%, due 3/1/18 | | | 2,000,000 | | | | 2,335,000 | |
Phillips 66
2.95%, due 5/1/17 (d) | | | 1,300,000 | | | | 1,377,788 | |
Valero Energy Corp.
6.625%, due 6/15/37 | | | 550,000 | | | | 677,623 | |
| | | | | | | | |
| | | | | | | 14,189,349 | |
| | | | | | | | |
Oil & Gas Services 0.0%‡ | |
Cameron International Corp.
1.60%, due 4/30/15 | | | 500,000 | | | | 505,133 | |
| | | | | | | | |
| | |
Packaging & Containers 0.1% | | | | | | | | |
Bemis Co., Inc.
5.65%, due 8/1/14 | | | 1,460,000 | | | | 1,562,872 | |
| | | | | | | | |
|
Pharmaceuticals 1.2% | |
AbbVie, Inc.
2.90%, due 11/6/22 (d) | | | 1,900,000 | | | | 1,934,922 | |
Cardinal Health, Inc.
1.90%, due 6/15/17 | | | 975,000 | | | | 993,161 | |
Express Scripts Holding Co.
2.10%, due 2/12/15 (d) | | | 2,413,000 | | | | 2,458,015 | |
Merck & Co., Inc. | | | | | | | | |
2.40%, due 9/15/22 | | | 2,600,000 | | | | 2,600,850 | |
5.95%, due 12/1/28 | | | 1,200,000 | | | | 1,564,242 | |
Novartis Capital Corp.
3.70%, due 9/21/42 | | | 1,200,000 | | | | 1,194,799 | |
Watson Pharmaceuticals, Inc.
3.25%, due 10/1/22 | | | 1,425,000 | | | | 1,454,709 | |
| | | | | | | | |
| | | | | | | 12,200,698 | |
| | | | | | | | |
| | | | | | | | |
| | | Principal Amount | | | Value | |
| | | | | | | |
Pipelines 0.9% | |
Energy Transfer Partners, L.P.
6.50%, due 2/1/42 | | $ | 1,300,000 | | | $ | 1,591,638 | |
Enterprise Products Operating LLC
1.25%, due 8/13/15 | | | 1,550,000 | | | | 1,559,518 | |
Kinder Morgan Energy Partners, L.P.
6.375%, due 3/1/41 | | | 400,000 | | | | 494,978 | |
ONEOK Partners, L.P.
2.00%, due 10/1/17 | | | 1,000,000 | | | | 1,008,312 | |
Texas Eastern Transmission, L.P.
2.80%, due 10/15/22 (d) | | | 2,350,000 | | | | 2,350,757 | |
Williams Cos., Inc. (The)
3.70%, due 1/15/23 | | | 2,800,000 | | | | 2,824,231 | |
| | | | | | | | |
| | | | | | | 9,829,434 | |
| | | | | | | | |
Real Estate 0.1% | |
WEA Finance LLC / WT Finance Aust Pty, Ltd.
5.75%, due 9/2/15 (d) | | | 877,000 | | | | 979,134 | |
| | | | | | | | |
| | |
Real Estate Investment Trusts 1.2% | | | | | | | | |
Brandywine Operating Partnership, L.P.
5.70%, due 5/1/17 | | | 2,772,000 | | | | 3,138,960 | |
DDR Corp.
4.75%, due 4/15/18 | | | 2,000,000 | | | | 2,216,546 | |
Hospitality Properties Trust
6.30%, due 6/15/16 | | | 1,325,000 | | | | 1,461,190 | |
Prologis, L.P.
6.625%, due 5/15/18 | | | 2,000,000 | | | | 2,415,650 | |
Realty Income Corp.
2.00%, due 1/31/18 | | | 1,575,000 | | | | 1,573,691 | |
Simon Property Group, L.P.
2.75%, due 2/1/23 | | | 2,200,000 | | | | 2,198,766 | |
| | | | | | | | |
| | | | | | | 13,004,803 | |
| | | | | | | | |
Retail 0.5% | |
Costco Wholesale Corp.
1.70%, due 12/15/19 | | | 3,000,000 | | | | 3,020,430 | |
Home Depot, Inc.
5.95%, due 4/1/41 | | | 1,000,000 | | | | 1,350,271 | |
Wal-Mart Stores, Inc.
5.00%, due 10/25/40 | | | 750,000 | | | | 907,467 | |
| | | | | | | | |
| | | | | | | 5,278,168 | |
| | | | | | | | |
Semiconductors 0.2% | |
Samsung Electronics America, Inc.
1.75%, due 4/10/17 (d) | | | 2,475,000 | | | | 2,504,084 | |
| | | | | | | | |
|
Special Purpose Entity 0.1% | |
MassMutual Global Funding II
2.50%, due 10/17/22 (d) | | | 1,200,000 | | | | 1,179,858 | |
| | | | | | | | |
| | | | |
| M-36 | | MainStay VP Bond Portfolio | | The notes to the financial statements are an integral part of,
and should be read in conjunction with, the financial statements. |
| | | | | | | | |
| | | Principal Amount | | | Value | |
| | | | | | | |
| Corporate Bonds (continued) | |
Telecommunications 1.6% | |
AT&T, Inc. | | | | | | | | |
2.625%, due 12/1/22 | | $ | 5,800,000 | | | $ | 5,809,541 | |
5.35%, due 9/1/40 | | | 1,000,000 | | | | 1,164,548 | |
5.55%, due 8/15/41 | | | 1,000,000 | | | | 1,200,124 | |
Cellco Partnership / Verizon Wireless Capital LLC | | | | | | | | |
5.55%, due 2/1/14 | | | 875,000 | | | | 918,526 | |
8.50%, due 11/15/18 | | | 1,500,000 | | | | 2,063,550 | |
Qwest Corp.
6.75%, due 12/1/21 | | | 2,525,000 | | | | 2,959,217 | |
Verizon Communications, Inc.
7.35%, due 4/1/39 | | | 2,000,000 | | | | 2,964,778 | |
| | | | | | | | |
| | | | | | | 17,080,284 | |
| | | | | | | | |
Transportation 0.9% | |
Burlington Northern Santa Fe LLC
5.75%, due 5/1/40 | | | 1,000,000 | | | | 1,232,823 | |
CSX Corp. | | | | | | | | |
4.10%, due 3/15/44 | | | 2,250,000 | | | | 2,221,067 | |
4.75%, due 5/30/42 | | | 1,000,000 | | | | 1,076,797 | |
Norfolk Southern Corp.
5.64%, due 5/17/29 | | | 1,400,000 | | | | 1,724,590 | |
United Parcel Service, Inc.
3.625%, due 10/1/42 | | | 3,200,000 | | | | 3,131,888 | |
| | | | | | | | |
| | | | | | | 9,387,165 | |
| | | | | | | | |
Total Corporate Bonds
(Cost $280,244,183) | | | | | | | 300,002,133 | |
| | | | | | | | |
|
| Foreign Government Bonds 0.7% | |
Regional (State & Province) 0.6% | |
Province of Ontario
1.10%, due 10/25/17 | | | 3,500,000 | | | | 3,503,850 | |
Province of Quebec
3.50%, due 7/29/20 | | | 2,850,000 | | | | 3,165,495 | |
| | | | | | | | |
| | | | | | | 6,669,345 | |
| | | | | | | | |
Sovereign 0.1% | |
Poland Government International Bond
5.00%, due 3/23/22 | | | 350,000 | | | | 413,350 | |
| | | | | | | | |
Total Foreign Government Bonds
(Cost $6,994,132) | | | | | | | 7,082,695 | |
| | | | | | | | |
|
| Mortgage-Backed Securities 3.9% | |
Commercial Mortgage Loans
(Collateralized Mortgage Obligations) 3.2% | |
Bear Stearns Commercial Mortgage Securities | | | | | | | | |
Series 2006-PW11, Class A3
5.454%, due 3/11/39 (e) | | | 1,000,000 | | | | 1,020,375 | |
| | | | | | | | |
| | | Principal Amount | | | Value | |
| | | | | | | |
Commercial Mortgage Loans (Collateralized Mortgage Obligations) (continued) | |
Series 2006-PW11, Class AM
5.454%, due 3/11/39 (e) | | $ | 500,000 | | | $ | 548,311 | |
Series 2006-PW13, Class A3
5.518%, due 9/11/41 | | | 1,000,000 | | | | 1,034,882 | |
Series 2006-PW12, Class AAB
5.687%, due 9/11/38 (e) | | | 693,130 | | | | 703,236 | |
Series 2007-PW16, Class A4
5.717%, due 6/11/40 (e) | | | 1,700,000 | | | | 2,013,716 | |
Citigroup Commercial Mortgage Trust
Series 2006-C5, Class A4
5.431%, due 10/15/49 | | | 3,700,000 | | | | 4,245,728 | |
Credit Suisse Mortgage Capital Certificates
Series 2006-C1, Class AM
5.409%, due 2/15/39 (c) | | | 2,300,000 | | | | 2,546,091 | |
¨JP Morgan Chase Commercial Mortgage Securities Corp. | | | | | | | | |
Series 2012-C6, Class A2
2.206%, due 5/15/45 | | | 2,400,000 | | | | 2,511,132 | |
Series 2005-CB13, Class A4
5.294%, due 1/12/43 (e) | | | 1,170,000 | | | | 1,288,177 | |
Series 2006-CB17, Class A4
5.429%, due 12/12/43 | | | 5,000,000 | | | | 5,705,890 | |
Series 2006-CB15, Class A4
5.814%, due 6/12/43 (c) | | | 1,700,000 | | | | 1,939,875 | |
LB-UBS Commercial Mortgage Trust | | | | | | | | |
Series 2006-C7, Class A3
5.347%, due 11/15/38 | | | 2,300,000 | | | | 2,643,057 | |
Series 2007-C6, Class A3
5.933%, due 7/15/40 | | | 1,000,000 | | | | 1,073,533 | |
Merrill Lynch/Countrywide Commercial Mortgage Trust
Series 2006-4, Class A3
5.172%, due 12/12/49 (e) | | | 2,080,000 | | | | 2,366,659 | |
Morgan Stanley Capital I, Inc. | | | | | | | | |
Series 2006-HQ10, Class A4
5.328%, due 11/12/41 | | | 800,000 | | | | 916,179 | |
Series 2007-T25, Class A3
5.514%, due 11/12/49 (c) | | | 2,300,000 | | | | 2,667,942 | |
Series 2006-IQ11, Class A4
5.693%, due 10/15/42 (e) | | | 440,000 | | | | 496,714 | |
Wachovia Bank Commercial Mortgage Trust
Series 2006-C29, Class A4
5.308%, due 11/15/48 | | | 500,000 | | | | 574,968 | |
| | | | | | | | |
| | | | | | | 34,296,465 | |
| | | | | | | | |
| | | | | | |
The notes to the financial statements are an integral part of,
and should be read in conjunction with, the financial statements. | | mainstayinvestments.com | | | M-37 | |
Portfolio of Investments December 31, 2012 (continued)
| | | | | | | | |
| | | Principal Amount | | | Value | |
| | | | | | | |
| Mortgage-Backed Securities (continued) | |
Whole Loan Collateral (Collateralized Mortgage Obligations) 0.7% | |
Banc of America Funding Corp.
Series 2006-7, Class T2A3
5.695%, due 10/25/36 (c) | | $ | 613,603 | | | $ | 438,614 | |
Fosse Master Issuer PLC
Series 2011-1A, Class A5
1.825%, due 10/18/54 (c)(d) | | | 1,425,000 | | | | 1,470,031 | |
Holmes Master Issuer PLC
Series Reg S
1.99%, due 10/15/54 (c)(d) | | | 2,330,000 | | | | 2,385,512 | |
Permanent Master Issuer PLC
Series 2011-2A, Class 1A2
1.89%, due 7/15/42 (c)(d) | | | 990,000 | | | | 1,011,231 | |
Structured Adjustable Rate Mortgage Loan Trust
Series 2006-8, Class 4A3
5.351%, due 9/25/36 (e) | | | 1,000,000 | | | | 777,811 | |
TBW Mortgage-Backed Pass-
Through Certificates
Series 2006-6, Class A2B
5.66%, due 1/25/37 (a) | | | 1,573,502 | | | | 899,458 | |
| | | | | | | | |
| | | | | | | 6,982,657 | |
| | | | | | | | |
Total Mortgage-Backed Securities
(Cost $39,602,154) | | | | | | | 41,279,122 | |
| | | | | | | | |
|
| U.S. Government & Federal Agencies 55.1% | |
¨Federal Home Loan Mortgage Corporation 3.6% | |
0.50%, due 4/17/15 | | | 4,000,000 | | | | 4,016,348 | |
0.50%, due 9/25/15 | | | 1,500,000 | | | | 1,501,051 | |
0.53%, due 11/20/15 | | | 2,000,000 | | | | 2,002,442 | |
0.55%, due 2/27/15 | | | 1,200,000 | | | | 1,200,829 | |
0.75%, due 1/12/18 | | | 8,300,000 | | | | 8,243,784 | |
1.00%, due 9/27/17 | | | 1,325,000 | | | | 1,329,292 | |
1.25%, due 8/1/19 | | | 5,750,000 | | | | 5,757,958 | |
1.25%, due 10/2/19 | | | 2,000,000 | | | | 1,994,148 | |
2.375%, due 1/13/22 | | | 4,000,000 | | | | 4,178,700 | |
4.75%, due 1/19/16 | | | 2,000,000 | | | | 2,263,300 | |
5.50%, due 7/18/16 | | | 4,000,000 | | | | 4,698,532 | |
| | | | | | | | |
| | | | | | | 37,186,384 | |
| | | | | | | | |
¨Federal Home Loan Mortgage Corporation
(Mortgage Pass-Through Securities) 9.3% | |
2.437%, due 12/1/41 (c) | | | 1,498,143 | | | | 1,562,931 | |
3.00%, due 5/1/26 TBA (f) | | | 4,700,000 | | | | 4,935,000 | |
3.50%, due 5/1/26 | | | 1,462,043 | | | | 1,537,460 | |
3.50%, due 12/1/41 TBA (f) | | | 22,800,000 | | | | 24,244,594 | |
4.00%, due 3/1/15 | | | 205,170 | | | | 209,167 | |
4.00%, due 7/1/23 | | | 696,284 | | | | 736,552 | |
4.00%, due 8/1/25 | | | 347,669 | | | | 367,559 | |
| | | | | | | | |
| | | Principal Amount | | | Value | |
| | | | | | | |
Federal Home Loan Mortgage Corporation
(Mortgage Pass-Through Securities) (continued) | |
4.00%, due 1/1/31 | | $ | 737,343 | | | $ | 795,221 | |
4.00%, due 11/1/41 | | | 297,182 | | | | 317,723 | |
4.00%, due 1/1/42 | | | 353,831 | | | | 378,287 | |
4.00%, due 3/1/42 | | | 4,767,827 | | | | 5,124,940 | |
4.00%, due 4/1/42 | | | 7,031,276 | | | | 7,517,273 | |
4.00%, due 5/1/42 | | | 561,578 | | | | 606,887 | |
4.50%, due 4/1/22 | | | 271,973 | | | | 290,316 | |
4.50%, due 4/1/23 | | | 60,987 | | | | 64,909 | |
4.50%, due 6/1/24 | | | 148,965 | | | | 158,500 | |
4.50%, due 7/1/24 | | | 361,899 | | | | 385,062 | |
4.50%, due 5/1/25 | | | 758,940 | | | | 807,516 | |
4.50%, due 4/1/31 | | | 727,147 | | | | 796,016 | |
4.50%, due 9/1/35 | | | 431,552 | | | | 463,904 | |
4.50%, due 2/1/39 | | | 699,327 | | | | 750,442 | |
4.50%, due 4/1/39 | | | 725,106 | | | | 778,105 | |
4.50%, due 6/1/39 | | | 1,301,237 | | | | 1,396,347 | |
4.50%, due 11/1/39 | | | 4,132,994 | | | | 4,435,083 | |
4.50%, due 12/1/39 | | | 550,628 | | | | 590,874 | |
4.50%, due 8/1/40 | | | 433,413 | | | | 466,717 | |
4.50%, due 9/1/40 | | | 2,134,322 | | | | 2,298,327 | |
4.50%, due 11/1/40 | | | 3,584,208 | | | | 3,975,443 | |
5.00%, due 3/1/23 | | | 25,297 | | | | 27,169 | |
5.00%, due 6/1/23 | | | 367,624 | | | | 394,256 | |
5.00%, due 8/1/23 | | | 48,551 | | | | 52,068 | |
5.00%, due 7/1/24 | | | 293,504 | | | | 315,225 | |
5.00%, due 3/1/25 | | | 667,637 | | | | 717,046 | |
5.00%, due 6/1/30 | | | 650,021 | | | | 699,462 | |
5.00%, due 8/1/35 | | | 296,660 | | | | 320,337 | |
5.00%, due 4/1/37 | | | 5,059,003 | | | | 5,462,765 | |
5.00%, due 8/1/37 | | | 1,251,150 | | | | 1,346,313 | |
5.00%, due 3/1/40 | | | 3,403,448 | | | | 3,782,182 | |
5.50%, due 12/1/18 | | | 263,901 | | | | 283,823 | |
5.50%, due 9/1/21 | | | 345,753 | | | | 373,151 | |
5.50%, due 9/1/22 | | | 230,968 | | | | 249,270 | |
5.50%, due 9/1/37 | | | 2,682,028 | | | | 2,897,340 | |
5.50%, due 8/1/38 | | | 1,195,278 | | | | 1,290,487 | |
5.50%, due 12/1/38 | | | 3,125,092 | | | | 3,374,019 | |
6.00%, due 7/1/21 | | | 834,672 | | | | 908,627 | |
6.00%, due 8/1/36 | | | 1,414,674 | | | | 1,541,727 | |
6.00%, due 9/1/37 | | | 1,417,756 | | | | 1,542,870 | |
6.00%, due 5/1/40 | | | 2,793,955 | | | | 3,059,725 | |
6.50%, due 7/1/17 | | | 73,061 | | | | 79,244 | |
6.50%, due 11/1/35 | | | 123,423 | | | | 140,997 | |
6.50%, due 8/1/37 | | | 214,943 | | | | 244,628 | |
6.50%, due 11/1/37 | | | 418,296 | | | | 476,067 | |
6.50%, due 9/1/39 | | | 908,778 | | | | 1,034,290 | |
7.00%, due 1/1/33 | | | 690,406 | | | | 809,191 | |
7.00%, due 9/1/33 | | | 199,924 | | | | 232,971 | |
| | | | | | | | |
| | | | | | | 97,646,405 | |
| | | | | | | | |
| | | | |
| M-38 | | MainStay VP Bond Portfolio | | The notes to the financial statements are an integral part of,
and should be read in conjunction with, the financial statements. |
| | | | | | | | |
| | | Principal Amount | | | Value | |
| | | | | | | |
| U.S. Government & Federal Agencies (continued) | |
¨Federal National Mortgage Association 2.4% | |
0.375%, due 3/16/15 | | $ | 8,000,000 | | | $ | 8,010,632 | |
0.50%, due 7/2/15 | | | 6,000,000 | | | | 6,020,892 | |
1.00%, due 12/28/17 | | | 1,500,000 | | | | 1,498,089 | |
1.25%, due 1/30/17 | | | 5,000,000 | | | | 5,125,830 | |
2.75%, due 3/13/14 | | | 4,600,000 | | | | 4,739,766 | |
| | | | | | | | |
| | | | | | | 25,395,209 | |
| | | | | | | | |
¨Federal National Mortgage Association
(Mortgage Pass-Through Securities) 16.2% | |
2.283%, due 6/1/42 (c) | | | 3,157,268 | | | | 3,284,983 | |
2.50%, due 2/1/28 TBA (f) | | | 3,000,000 | | | | 3,132,188 | |
2.704%, due 1/1/42 (c) | | | 3,595,683 | | | | 3,768,217 | |
3.00%, due 11/1/26 TBA (f) | | | 8,100,000 | | | | 8,549,297 | |
3.00%, due 8/1/42 TBA (f) | | | 11,200,000 | | | | 11,726,750 | |
3.50%, due 10/1/20 | | | 2,108,378 | | | | 2,237,231 | |
3.50%, due 6/1/26 | | | 3,286,751 | | | | 3,488,647 | |
3.50%, due 2/1/32 | | | 1,188,134 | | | | 1,270,332 | |
3.50%, due 4/1/32 | | | 1,542,005 | | | | 1,648,684 | |
3.50%, due 11/1/40 | | | 675,856 | | | | 721,135 | |
3.50%, due 12/1/41 TBA (f) | | | 35,500,000 | | | | 37,847,714 | |
4.00%, due 8/1/18 | | | 1,144,957 | | | | 1,228,884 | |
4.00%, due 10/1/20 | | | 355 | | | | 382 | |
4.00%, due 3/1/22 | | | 224,009 | | | | 242,179 | |
4.00%, due 4/1/24 | | | 2,307,176 | | | | 2,471,971 | |
4.00%, due 12/1/24 | | | 180,713 | | | | 193,621 | |
4.00%, due 12/1/25 | | | 3,326,748 | | | | 3,563,328 | |
4.00%, due 4/1/31 | | | 1,147,699 | | | | 1,235,493 | |
4.00%, due 12/1/39 | | | 378,123 | | | | 405,380 | |
4.00%, due 7/1/40 | | | 1,887,756 | | | | 2,023,904 | |
4.00%, due 8/1/40 TBA (f) | | | 800,000 | | | | 857,500 | |
4.00%, due 11/1/41 | | | 7,014,686 | | | | 7,529,362 | |
4.00%, due 3/1/42 | | | 4,512,297 | | | | 4,896,953 | |
4.50%, due 5/1/24 | | | 1,676,325 | | | | 1,804,180 | |
4.50%, due 7/1/26 | | | 1,463,148 | | | | 1,580,688 | |
4.50%, due 4/1/31 | | | 1,123,854 | | | | 1,221,772 | |
4.50%, due 11/1/35 | | | 913,819 | | | | 990,297 | |
4.50%, due 4/1/41 | | | 1,857,514 | | | | 2,016,452 | |
4.50%, due 5/1/41 | | | 2,060,387 | | | | 2,204,490 | |
4.50%, due 7/1/41 | | | 11,051,577 | | | | 11,997,201 | |
4.50%, due 9/1/41 | | | 2,195,145 | | | | 2,382,939 | |
5.00%, due 12/1/23 | | | 1,391,445 | | | | 1,506,703 | |
5.00%, due 4/1/29 | | | 261,161 | | | | 281,198 | |
5.00%, due 4/1/31 | | | 796,816 | | | | 863,150 | |
5.00%, due 3/1/34 | | | 1,335,914 | | | | 1,513,088 | |
5.00%, due 4/1/34 | | | 1,776,918 | | | | 2,012,578 | |
5.00%, due 4/1/35 | | | 999,208 | | | | 1,088,546 | |
5.00%, due 2/1/36 | | | 1,012,919 | | | | 1,101,623 | |
5.00%, due 12/1/36 TBA (f) | | | 2,800,000 | | | | 3,032,750 | |
5.00%, due 5/1/37 | | | 2,589 | | | | 2,804 | |
| | | | | | | | |
| | | Principal Amount | | | Value | |
| | | | | | | |
Federal National Mortgage Association
(Mortgage Pass-Through Securities) (continued) | |
5.00%, due 6/1/37 | | $ | 1,315,081 | | | $ | 1,424,559 | |
5.00%, due 5/1/38 | | | 2,813,626 | | | | 3,047,855 | |
5.00%, due 7/1/38 | | | 720,023 | | | | 788,064 | |
5.00%, due 10/1/39 | | | 840,160 | | | | 921,391 | |
5.50%, due 5/1/16 | | | 20,639 | | | | 21,954 | |
5.50%, due 1/1/21 | | | 9,856 | | | | 10,677 | |
5.50%, due 12/1/21 | | | 31,577 | | | | 34,210 | |
5.50%, due 1/1/22 | | | 151,112 | | | | 163,711 | |
5.50%, due 2/1/22 | | | 7,904 | | | | 8,548 | |
5.50%, due 10/1/28 | | | 2,406,887 | | | | 2,618,161 | |
5.50%, due 4/1/34 | | | 624,430 | | | | 686,267 | |
5.50%, due 7/1/35 | | | 123,568 | | | | 135,032 | |
5.50%, due 2/1/37 | | | 1,268,138 | | | | 1,379,130 | |
5.50%, due 8/1/37 | | | 646,389 | | | | 706,360 | |
5.50%, due 2/1/38 | | | 514,877 | | | | 559,429 | |
5.50%, due 3/1/38 | | | 2,138,897 | | | | 2,323,973 | |
5.50%, due 7/1/38 | | | 480,813 | | | | 522,417 | |
5.50%, due 1/1/39 | | | 3,285,789 | | | | 3,573,919 | |
5.50%, due 2/1/39 | | | 1,203,841 | | | | 1,315,532 | |
5.50%, due 11/1/39 | | | 679,945 | | | | 738,780 | |
5.50%, due 6/1/40 | | | 502,672 | | | | 546,247 | |
6.00%, due 6/1/35 TBA (f) | | | 1,000,000 | | | | 1,092,188 | |
6.00%, due 3/1/36 | | | 257,731 | | | | 282,167 | |
6.00%, due 10/1/37 | | | 1,290,537 | | | | 1,412,894 | |
6.00%, due 10/1/38 | | | 3,569,040 | | | | 3,904,549 | |
6.00%, due 12/1/38 | | | 2,174,028 | | | | 2,375,393 | |
6.50%, due 10/1/36 | | | 325,363 | | | | 373,618 | |
6.50%, due 1/1/37 | | | 583,005 | | | | 654,346 | |
6.50%, due 8/1/37 | | | 74,193 | | | | 83,319 | |
6.50%, due 10/1/37 | | | 402,581 | | | | 478,441 | |
7.00%, due 9/1/37 | | | 142,398 | | | | 169,487 | |
7.00%, due 10/1/37 | | | 5,370 | | | | 6,391 | |
7.00%, due 11/1/37 | | | 13,932 | | | | 16,582 | |
7.50%, due 7/1/28 | | | 53,445 | | | | 64,305 | |
| | | | | | | | |
| | | | 170,364,490 | |
| | | | | | | | |
¨Government National Mortgage Association
(Mortgage Pass-Through Securities) 7.0% | |
3.00%, due 7/1/42 TBA (f) | | | 2,000,000 | | | | 2,125,938 | |
3.00%, due 8/1/42 TBA (f) | | | 1,700,000 | | | | 1,803,594 | |
3.50%, due 11/1/41 TBA (f) | | | 6,500,000 | | | | 7,060,039 | |
3.50%, due 3/1/42 TBA (f) | | | 7,400,000 | | | | 8,039,985 | |
4.00%, due 8/1/40 TBA (f) | | | 1,000,000 | | | | 1,095,625 | |
4.00%, due 10/15/41 | | | 5,081,314 | | | | 5,577,825 | |
4.00%, due 1/20/42 | | | 4,509,535 | | | | 4,913,152 | |
4.00%, due 2/20/42 | | | 1,875,055 | | | | 2,042,878 | |
4.50%, due 6/15/39 | | | 5,493,225 | | | | 6,039,349 | |
4.50%, due 6/15/40 | | | 800,495 | | | | 880,597 | |
4.50%, due 6/20/40 | | | 2,223,520 | | | | 2,458,619 | |
4.50%, due 9/15/40 | | | 4,916,954 | | | | 5,465,712 | |
| | | | | | |
The notes to the financial statements are an integral part of,
and should be read in conjunction with, the financial statements. | | mainstayinvestments.com | | | M-39 | |
Portfolio of Investments December 31, 2012 (continued)
| | | | | | | | |
| | | Principal Amount | | | Value | |
| | | | | | | |
| U.S. Government & Federal Agencies (continued) | |
Government National Mortgage Association
(Mortgage Pass-Through Securities) (continued) | |
4.50%, due 3/15/41 | | $ | 374,024 | | | $ | 412,512 | |
4.50%, due 3/20/41 | | | 853,577 | | | | 939,163 | |
4.50%, due 4/20/41 | | | 720,194 | | | | 789,136 | |
4.50%, due 9/20/41 | | | 1,246,392 | | | | 1,374,980 | |
4.50%, due 12/20/41 | | | 232,294 | | | | 256,259 | |
4.50%, due 4/20/42 | | | 576,259 | | | | 635,710 | |
5.00%, due 1/15/39 | | | 197,850 | | | | 216,592 | |
5.00%, due 3/15/39 | | | 97,787 | | | | 107,050 | |
5.00%, due 8/15/39 | | | 231,256 | | | | 253,163 | |
5.00%, due 9/15/39 | | | 1,733,391 | | | | 1,925,763 | |
5.00%, due 6/15/40 | | | 1,657,898 | | | | 1,823,758 | |
5.00%, due 7/15/40 | | | 1,180,735 | | | | 1,291,110 | |
5.00%, due 9/20/40 | | | 5,477,772 | | | | 6,079,217 | |
5.00%, due 10/20/41 | | | 422,707 | | | | 466,845 | |
5.50%, due 1/20/35 | | | 17,644 | | | | 19,623 | |
5.50%, due 7/15/35 | | | 208,738 | | | | 230,110 | |
5.50%, due 8/15/35 | | | 201,883 | | | | 223,058 | |
5.50%, due 5/15/36 | | | 226,940 | | | | 249,041 | |
5.50%, due 6/15/38 | | | 327,926 | | | | 359,861 | |
5.50%, due 1/15/39 | | | 426,410 | | | | 467,936 | |
5.50%, due 3/20/39 | | | 1,721,961 | | | | 1,882,005 | |
5.50%, due 7/15/39 | | | 469,388 | | | | 515,100 | |
5.50%, due 12/15/39 | | | 159,313 | | | | 174,828 | |
5.50%, due 2/15/40 | | | 767,299 | | | | 842,024 | |
6.00%, due 1/15/36 | | | 350,983 | | | | 391,818 | |
6.00%, due 11/15/37 | | | 175,247 | | | | 195,636 | |
6.00%, due 12/15/37 | | | 1,109,528 | | | | 1,238,613 | |
6.00%, due 9/15/38 | | | 1,184,787 | | | | 1,322,627 | |
6.00%, due 10/15/38 | | | 443,541 | | | | 495,144 | |
6.50%, due 1/15/36 | | | 325,715 | | | | 382,357 | |
6.50%, due 3/15/36 | | | 201,150 | | | | 235,931 | |
6.50%, due 6/15/36 | | | 184,179 | | | | 216,208 | |
6.50%, due 9/15/36 | | | 61,070 | | | | 71,897 | |
6.50%, due 7/15/37 | | | 224,956 | | | | 259,866 | |
7.00%, due 7/15/31 | | | 74,421 | | | | 88,708 | |
| | | | | | | | |
| | | | 73,936,962 | |
| | | | | | | | |
¨United States Treasury Bonds 1.8% | |
2.75%, due 8/15/42 | | | 1,200,000 | | | | 1,158,750 | |
3.125%, due 11/15/41 | | | 1,480,000 | | | | 1,549,144 | |
3.50%, due 2/15/39 | | | 2,500,000 | | | | 2,826,173 | |
4.25%, due 11/15/40 | | | 5,500,000 | | | | 7,022,812 | |
4.375%, due 5/15/41 | | | 400,000 | | | | 521,125 | |
4.75%, due 2/15/41 | | | 2,370,000 | | | | 3,267,268 | |
6.25%, due 8/15/23 | | | 2,000,000 | | | | 2,867,500 | |
| | | | | | | | |
| | | | 19,212,772 | |
| | | | | | | | |
| | | | | | | | |
| | | Principal Amount | | | Value | |
| | | | | | | |
¨United States Treasury Notes 14.8% | |
0.125%, due 12/31/14 | | $ | 16,700,000 | | | $ | 16,658,250 | |
0.25%, due 10/15/15 | | | 15,040,000 | | | | 15,005,919 | |
0.25%, due 12/15/15 | | | 13,290,000 | | | | 13,250,542 | |
0.375%, due 11/15/15 | | | 14,075,000 | | | | 14,088,202 | |
0.625%, due 9/30/17 | | | 17,180,000 | | | | 17,149,128 | |
0.625%, due 11/30/17 | | | 11,335,000 | | | | 11,296,926 | |
0.75%, due 10/31/17 | | | 7,805,000 | | | | 7,830,608 | |
0.75%, due 12/31/17 | | | 2,200,000 | | | | 2,203,610 | |
1.00%, due 8/31/19 | | | 5,000,000 | | | | 4,970,705 | |
1.00%, due 9/30/19 | | | 8,800,000 | | | | 8,739,500 | |
1.00%, due 11/30/19 | | | 20,000,000 | | | | 19,806,240 | |
1.25%, due 10/31/19 | | | 9,850,000 | | | | 9,931,568 | |
1.625%, due 8/15/22 | | | 1,705,000 | | | | 1,693,812 | |
1.625%, due 11/15/22 | | | 6,880,000 | | | | 6,804,747 | |
2.00%, due 2/15/22 | | | 6,000,000 | | | | 6,204,846 | |
| | | | | | | | |
| | | | 155,634,603 | |
| | | | | | | | |
Total U.S. Government & Federal Agencies
(Cost $571,358,932) | | | | 579,376,825 | |
| | | | | | | | |
|
| Yankee Bonds 7.6% (g) | |
Aerospace & Defense 0.2% | |
BAE Systems PLC
4.75%, due 10/11/21 (d) | | | 2,000,000 | | | | 2,239,281 | |
| | | | | | | | |
| | |
Banks 2.4% | | | | | | | | |
Bank of Nova Scotia
1.95%, due 1/30/17 (d) | | | 1,850,000 | | | | 1,926,960 | |
BNP Paribas S.A.
2.375%, due 9/14/17 | | | 3,000,000 | | | | 3,043,041 | |
Commonwealth Bank of Australia
1.95%, due 3/16/15 | | | 500,000 | | | | 513,071 | |
Cooperatieve Centrale Raiffeisen-Boerenleenbank B.A. | | | | | | | | |
3.375%, due 1/19/17 | | | 550,000 | | | | 590,857 | |
3.95%, due 11/9/22 | | | 2,000,000 | | | | 2,048,068 | |
HSBC Bank PLC | | | | | | | | |
3.50%, due 6/28/15 (d) | | | 2,450,000 | | | | 2,598,717 | |
4.125%, due 8/12/20 (d) | | | 1,300,000 | | | | 1,446,847 | |
Korea Development Bank
3.875%, due 5/4/17 | | | 1,300,000 | | | | 1,405,455 | |
National Bank of Canada
2.20%, due 10/19/16 (d) | | | 1,100,000 | | | | 1,157,640 | |
Nordea Bank AB
2.25%, due 3/20/15 (d) | | | 1,500,000 | | | | 1,536,504 | |
Royal Bank of Scotland Group PLC
2.55%, due 9/18/15 | | | 2,400,000 | | | | 2,456,184 | |
Societe Generale S.A.
2.75%, due 10/12/17 | | | 1,950,000 | | | | 1,983,583 | |
| | | | |
| M-40 | | MainStay VP Bond Portfolio | | The notes to the financial statements are an integral part of,
and should be read in conjunction with, the financial statements. |
| | | | | | | | |
| | | Principal Amount | | | Value | |
| | | | | | | |
| Yankee Bonds (continued) | |
Banks (continued) | | | | | | | | |
Svenska Handelsbanken AB
2.875%, due 4/4/17 | | $ | 1,000,000 | | | $ | 1,056,601 | |
UBS A.G.
2.25%, due 1/28/14 | | | 2,800,000 | | | | 2,840,432 | |
Westpac Banking Corp.
1.125%, due 9/25/15 | | | 1,050,000 | | | | 1,059,727 | |
| | | | | | | | |
| | | | | | | 25,663,687 | |
| | | | | | | | |
Beverages 0.2% | | | | | | | | |
Diageo Capital PLC
5.75%, due 10/23/17 | | | 1,750,000 | | | | 2,108,342 | |
| | | | | | | | |
| | |
Electric 0.1% | | | | | | | | |
GDF Suez
1.625%, due 10/10/17 (d) | | | 1,150,000 | | | | 1,149,727 | |
| | | | | | | | |
|
Finance—Investment Banker/Broker 0.1% | |
BNP Paribas Home Loan Covered
Bonds S.A.
2.20%, due 11/2/15 (d) | | | 500,000 | | | | 515,200 | |
Credit Suisse A.G./Guernsey
2.60%, due 5/27/16 (d) | | | 575,000 | | | | 606,745 | |
| | | | | | | | |
| | | | | | | 1,121,945 | |
| | | | | | | | |
Iron & Steel 0.1% | | | | | | | | |
ArcelorMittal
4.25%, due 2/25/15 | | | 1,325,000 | | | | 1,338,332 | |
| | | | | | | | |
| | |
Media 0.1% | | | | | | | | |
Thomson Reuters Corp.
5.25%, due 8/15/13 | | | 500,000 | | | | 512,071 | |
| | | | | | | | |
| | |
Mining 0.9% | | | | | | | | |
Barrick Gold Corp.
1.75%, due 5/30/14 | | | 550,000 | | | | 557,682 | |
BHP Billiton Finance USA, Ltd.
3.25%, due 11/21/21 | | | 875,000 | | | | 941,721 | |
Rio Tinto Finance USA PLC
1.625%, due 8/21/17 | | | 3,450,000 | | | | 3,493,077 | |
Rio Tinto Finance USA, Ltd.
3.75%, due 9/20/21 | | | 750,000 | | | | 801,974 | |
Teck Resources, Ltd.
3.75%, due 2/1/23 | | | 3,500,000 | | | | 3,589,877 | |
| | | | | | | | |
| | | | | | | 9,384,331 | |
| | | | | | | | |
Miscellaneous—Manufacturing 0.1% | | | | | | | | |
Tyco Electronics Group S.A.
1.60%, due 2/3/15 | | | 1,000,000 | | | | 1,014,808 | |
| | | | | | | | |
| | | | | | | | |
| | | Principal Amount | | | Value | |
| | | | | | | |
Oil & Gas 1.9% | | | | | | | | |
BP Capital Markets PLC | | | | | | | | |
2.50%, due 11/6/22 | | $ | 2,600,000 | | | $ | 2,576,166 | |
3.125%, due 10/1/15 | | | 1,400,000 | | | | 1,486,167 | |
3.561%, due 11/1/21 | | | 975,000 | | | | 1,053,576 | |
Petrobras International Finance Co.—Pifco
2.875%, due 2/6/15 | | | 2,350,000 | | | | 2,411,323 | |
Petroleos Mexicanos
4.875%, due 3/15/15 | | | 800,000 | | | | 862,000 | |
Shell International Finance B.V. | | | | | | | | |
1.125%, due 8/21/17 | | | 4,625,000 | | | | 4,646,701 | |
2.25%, due 1/6/23 | | | 3,175,000 | | | | 3,136,690 | |
Statoil ASA | | | | | | | | |
2.45%, due 1/17/23 | | | 1,650,000 | | | | 1,646,136 | |
3.125%, due 8/17/17 | | | 350,000 | | | | 380,928 | |
Total Capital International S.A.
2.875%, due 2/17/22 | | | 1,325,000 | | | | 1,383,064 | |
| | | | | | | | |
| | | | | | | 19,582,751 | |
| | | | | | | | |
Pharmaceuticals 0.7% | | | | | | | | |
Novartis Securities Investment, Ltd.
5.125%, due 2/10/19 | | | 800,000 | | | | 956,139 | |
Sanofi S.A.
4.00%, due 3/29/21 | | | 1,000,000 | | | | 1,139,835 | |
Teva Pharmaceutical Finance Co. B.V. | | | | | | | | |
2.95%, due 12/18/22 | | | 3,250,000 | | | | 3,287,564 | |
3.65%, due 11/10/21 | | | 2,000,000 | | | | 2,140,464 | |
| | | | | | | | |
| | | | | | | 7,524,002 | |
| | | | | | | | |
Telecommunications 0.8% | | | | | | | | |
America Movil SAB de CV
3.125%, due 7/16/22 | | | 1,350,000 | | | | 1,372,205 | |
Deutsche Telekom International
Finance B.V. | | | | | | | | |
2.25%, due 3/6/17 (d) | | | 1,150,000 | | | | 1,179,310 | |
3.125%, due 4/11/16 (d) | | | 1,000,000 | | | | 1,057,740 | |
France Telecom S.A.
5.375%, due 1/13/42 | | | 1,675,000 | | | | 1,933,940 | |
Telecom Italia Capital S.A.
5.25%, due 10/1/15 | | | 250,000 | | | | 266,000 | |
Telefonica Emisiones SAU
2.582%, due 4/26/13 | | | 1,665,000 | | | | 1,670,827 | |
Vivendi S.A.
2.40%, due 4/10/15 (d) | | | 1,200,000 | | | | 1,223,969 | |
| | | | | | | | |
| | | | | | | 8,703,991 | |
| | | | | | | | |
Total Yankee Bonds
(Cost $77,098,992) | | | | | | | 80,343,268 | |
| | | | | | | | |
Total Long-Term Bonds
(Cost $1,012,003,347) | | | | | | | 1,043,140,357 | |
| | | | | | | | |
| | | | | | |
The notes to the financial statements are an integral part of,
and should be read in conjunction with, the financial statements. | | mainstayinvestments.com | | | M-41 | |
Portfolio of Investments December 31, 2012 (continued)
| | | | | | | | |
| | | Principal Amount | | | Value | |
| | | | | | | |
| Short-Term Investments 10.6% | |
Financial Company Commercial Paper 1.8% | |
Bank of Nova Scotia
0.005%, due 1/2/13 (h) | | $ | 18,690,000 | | | $ | 18,689,990 | |
| | | | | | | | |
Total Financial Company Commercial Paper
(Cost $18,689,990) | | | | 18,689,990 | |
| | | | | | | | |
|
Other Commercial Paper 8.8% | |
American Transmission Systems, Inc.
0.118%, due 1/9/13 (d)(h) | | | 10,000,000 | | | | 9,999,644 | |
Brown-Forman Corp.
0.081%, due 1/3/13 (d)(h) | | | 7,000,000 | | | | 6,999,922 | |
Caterpillar Financial Services Corp.
0.124%, due 1/14/13 (h) | | | 10,000,000 | | | | 9,999,458 | |
Laclede Gas Co.
0.107%, due 1/4/13 (d)(h) | | | 6,750,000 | | | | 6,749,882 | |
Motiva Enterprises LLC
0.13%, due 1/10/13 (h) | | | 8,000,000 | | | | 7,999,660 | |
New Jersey Natural G
0.099%, due 1/14/13 (h) | | | 10,000,000 | | | | 9,999,567 | |
Oglethorpe Power Corp.
0.182%, due 1/14/13 (d)(h) | | | 10,000,000 | | | | 9,999,206 | |
Southern Co.
0.157%, due 1/8/13 (d)(h) | | | 5,000,000 | | | | 4,999,786 | |
United Healthcare Co. | | | | | | | | |
0.041%, due 1/2/13 (d)(h) | | | 10,000,000 | | | | 9,999,956 | |
0.156%, due 1/11/13 (d)(h) | | | 10,000,000 | | | | 9,999,444 | |
Washington Gas
0.13%, due 1/10/13 (h) | | | 5,300,000 | | | | 5,299,775 | |
| | | | | | | | |
Total Other Commercial Paper
(Cost $92,046,300) | | | | | | | 92,046,300 | |
| | | | | | | | |
|
Repurchase Agreement 0.0%‡ | |
State Street Bank and Trust Co.
0.01%, dated 12/31/12
due 1/2/13
Proceeds at Maturity $47,085 (Collateralized by a Federal Home Loan Mortgage Corp. security with a rate of 2.07% and a maturity date of 11/7/22, with a Principal Amount of $50,000 and a Market Value of $49,539) | | | 47,085 | | | | 47,085 | |
| | | | | | | | |
Total Repurchase Agreement
(Cost $47,085) | | | | | | | 47,085 | |
| | | | | | | | |
Total Short-Term Investments
(Cost $110,783,375) | | | | | | | 110,783,375 | |
| | | | | | | | |
Total Investments
(Cost $1,122,786,722) (i) | | | 109.7 | % | | | 1,153,923,732 | |
Other Assets, Less Liabilities | | | (9.7 | ) | | | (102,413,076 | ) |
Net Assets | | | 100.0 | % | | $ | 1,051,510,656 | |
| ‡ | Less than one-tenth of a percent. |
| (a) | Step coupon. Rate shown is the rate in effect as of December 31, 2012. |
| (b) | Subprime mortgage investment and other asset-backed securities. The total market value of these securities as of December 31, 2012 is $10,187,396, which represents 1.0% of the Portfolio’s net assets. |
| (c) | Floating rate—Rate shown is the rate in effect as of December 31, 2012. |
| (d) | May be sold to institutional investors only under Rule 144A or securities offered pursuant to Section 4(2) of the Securities Act of 1933, as amended. |
| (e) | Collateral strip rate—Bond whose interest is based on the weighted net interest rate of the collateral. Coupon rate adjusts periodically based on a predetermined schedule. Rate shown is the rate in effect as of December 31, 2012. |
| (f) | TBA—Securities purchased on a forward commitment basis with an approximate principal amount and maturity date. The actual principal amount and maturity date will be determined upon settlement. The market value of these securities as of December 31, 2012 is $115,543,162, which represents 11.0% of the Portfolio’s net assets. All or a portion of these securities were acquired under a mortgage dollar roll agreement. |
| (g) | Yankee Bond—Dollar-denominated bond issued in the United States by a foreign bank or corporation. |
| (h) | Interest rate presented is yield to maturity. |
| (i) | As of December 31, 2012, cost is $1,123,000,977 for federal income tax purposes and net unrealized appreciation is as follows: |
| | | | |
Gross unrealized appreciation | | $ | 34,960,934 | |
Gross unrealized depreciation | | | (4,038,179 | ) |
| | | | |
Net unrealized appreciation | | $ | 30,922,755 | |
| | | | |
| | | | |
| M-42 | | MainStay VP Bond Portfolio | | The notes to the financial statements are an integral part of,
and should be read in conjunction with, the financial statements. |
The following is a summary of the fair valuations according to the inputs used as of December 31, 2012, for valuing the Portfolio’s assets.
Asset Valuation Inputs
| | | | | | | | | | | | | | | | |
Description | | Quoted Prices
in Active Markets
for Identical Assets
(Level 1) | | | Significant Other
Observable Inputs (Level 2) | | | Significant
Unobservable
Inputs
(Level 3) | | | Total | |
| Investments in Securities (a) | | | | | | | | | | | | | | | | |
| Long-Term Bonds | | | | | | | | | | | | | | | | |
Asset-Backed Securities | | $ | — | | | $ | 35,056,314 | | | $ | — | | | $ | 35,056,314 | |
Corporate Bonds | | | — | | | | 300,002,133 | | | | — | | | | 300,002,133 | |
Foreign Government Bonds | | | — | | | | 7,082,695 | | | | — | | | | 7,082,695 | |
Mortgage-Backed Securities | | | — | | | | 41,279,122 | | | | — | | | | 41,279,122 | |
U.S. Government & Federal Agencies | | | — | | | | 579,376,825 | | | | — | | | | 579,376,825 | |
Yankee Bonds | | | — | | | | 80,343,268 | | | | — | | | | 80,343,268 | |
| | | | | | | | | | | | | | | | |
| Total Long-Term Bonds | | | — | | | | 1,043,140,357 | | | | — | | | | 1,043,140,357 | |
| | | | | | | | | | | | | | | | |
| Short-Term Investments | | | | | | | | | | | | | | | | |
Financial Company Commercial Paper | | | — | | | | 18,689,990 | | | | — | | | | 18,689,990 | |
Other Commercial Paper | | | — | | | | 92,046,300 | | | | — | | | | 92,046,300 | |
Repurchase Agreement | | | — | | | | 47,085 | | | | — | | | | 47,085 | |
| | | | | | | | | | | | | | | | |
| Total Short-Term Investments | | | — | | | | 110,783,375 | | | | — | | | | 110,783,375 | |
| | | | | | | | | | | | | | | | |
| Total Investments in Securities | | $ | — | | | $ | 1,153,923,732 | | | $ | — | | | $ | 1,153,923,732 | |
| | | | | | | | | | | | | | | | |
| (a) | For a complete listing of investments and their industries, see the Portfolio of Investments. |
The Portfolio recognizes transfers between the levels as of the beginning of the period.
For the year ended December 31, 2012, the Portfolio did not have any transfers between Level 1 and Level 2 fair value measurements. (See Note 2)
As of December 31, 2012, the Portfolio did not hold any investments with significant unobservable inputs (Level 3). (See Note 2)
| | | | | | |
The notes to the financial statements are an integral part of,
and should be read in conjunction with, the financial statements. | | mainstayinvestments.com | | | M-43 | |
Statement of Assets and Liabilities as of December 31, 2012
| | | | |
| Assets | |
Investment in securities, at value
(identified cost $1,122,786,722) | | $ | 1,153,923,732 | |
Receivables: | | | | |
Investment securities sold | | | 40,041,298 | |
Interest | | | 5,164,361 | |
Fund shares sold | | | 602,340 | |
Other assets | | | 363 | |
| | | | |
Total assets | | | 1,199,732,094 | |
| | | | |
| |
| Liabilities | | | | |
Payables: | | | | |
Investment securities purchased | | | 147,248,128 | |
Manager (See Note 3) | | | 431,963 | |
Fund shares redeemed | | | 288,929 | |
Shareholder communication | | | 100,668 | |
NYLIFE Distributors (See Note 3) | | | 93,340 | |
Professional fees | | | 46,923 | |
Custodian | | | 9,974 | |
Trustees | | | 1,513 | |
| | | | |
Total liabilities | | | 148,221,438 | |
| | | | |
Net assets | | $ | 1,051,510,656 | |
| | | | |
| |
| Net Assets Consist of | | | | |
Shares of beneficial interest outstanding (par value of $.001 per share) unlimited number of shares authorized | | $ | 71,425 | |
Additional paid-in capital | | | 985,993,745 | |
| | | | |
| | | 986,065,170 | |
Undistributed net investment income | | | 18,836,342 | |
Accumulated net realized gain (loss) on investments and futures transactions | | | 15,472,134 | |
Net unrealized appreciation (depreciation) on investments | | | 31,137,010 | |
| | | | |
Net assets | | $ | 1,051,510,656 | |
| | | | |
| | | | |
Initial Class | | | | |
Net assets applicable to outstanding shares | | $ | 608,651,018 | |
| | | | |
Shares of beneficial interest outstanding | | | 41,182,841 | |
| | | | |
Net asset value per share outstanding | | $ | 14.78 | |
| | | | |
Service Class | | | | |
Net assets applicable to outstanding shares | | $ | 442,859,638 | |
| | | | |
Shares of beneficial interest outstanding | | | 30,241,842 | |
| | | | |
Net asset value per share outstanding | | $ | 14.64 | |
| | | | |
| | | | |
| M-44 | | MainStay VP Bond Portfolio | | The notes to the financial statements are an integral part of,
and should be read in conjunction with, the financial statements. |
Statement of Operations for the year ended December 31, 2012
| | | | |
| Investment Income (Loss) | |
Income | | | | |
Interest | | $ | 23,399,346 | |
| | | | |
Expenses | | | | |
Manager (See Note 3) | | | 4,811,330 | |
Distribution and service—Service Class (See Note 3) | | | 1,017,698 | |
Shareholder communication | | | 192,753 | |
Professional fees | | | 90,596 | |
Custodian | | | 61,592 | |
Trustees | | | 26,227 | |
Miscellaneous | | | 32,823 | |
| | | | |
Total expenses | | | 6,233,019 | |
| | | | |
Net investment income (loss) | | | 17,166,327 | |
| | | | |
|
| Realized and Unrealized Gain (Loss) on Investments and Futures Contracts | |
Net realized gain (loss) on: | | | | |
Security transactions | | | 18,860,168 | |
Futures transactions | | | (64,820 | ) |
| | | | |
Net realized gain (loss) on investments and
futures transactions | | | 18,795,348 | |
| | | | |
Net change in unrealized appreciation (depreciation) on investments | | | 7,240,680 | |
| | | | |
Net realized and unrealized gain (loss) on investments and futures transactions | | | 26,036,028 | |
| | | | |
Net increase (decrease) in net assets resulting from operations | | $ | 43,202,355 | |
| | | | |
| | | | | | |
The notes to the financial statements are an integral part of,
and should be read in conjunction with, the financial statements. | | mainstayinvestments.com | | | M-45 | |
Statements of Changes in Net Assets
for the years ended December 31, 2012 and December 31, 2011
| | | | | | | | |
| | | 2012 | | | 2011 | |
| Increase (Decrease) in Net Assets | |
Operations: | | | | | | | | |
Net investment income (loss) | | $ | 17,166,327 | | | $ | 22,572,730 | |
Net realized gain (loss) on investments and futures transactions | | | 18,795,348 | | | | 35,400,638 | |
Net change in unrealized appreciation (depreciation) on investments | | | 7,240,680 | | | | 2,010,809 | |
| | | | |
Net increase (decrease) in net assets resulting from operations | | | 43,202,355 | | | | 59,984,177 | |
| | | | |
Dividends and distributions to shareholders: | | | | | | | | |
From net investment income: | | | | | | | | |
Initial Class | | | (14,699,699 | ) | | | (16,245,157 | ) |
Service Class | | | (9,360,380 | ) | | | (10,612,205 | ) |
| | | | |
| | | (24,060,079 | ) | | | (26,857,362 | ) |
| | | | |
From net realized gain on investments: | | | | | | | | |
Initial Class | | | (20,340,451 | ) | | | (7,544,161 | ) |
Service Class | | | (14,115,491 | ) | | | (5,252,432 | ) |
| | | | |
| | | (34,455,942 | ) | | | (12,796,593 | ) |
| | | | |
Total dividends and distributions to shareholders | | | (58,516,021 | ) | | | (39,653,955 | ) |
| | | | |
Capital share transactions: | | | | | | | | |
Net proceeds from sale of shares | | | 257,718,188 | | | | 253,774,025 | |
Net asset value of shares issued to shareholders in reinvestment of dividends and distributions | | | 58,516,021 | | | | 39,653,955 | |
Cost of shares redeemed | | | (153,563,688 | ) | | | (285,693,870 | ) |
| | | | |
Increase (decrease) in net assets derived from capital share transactions | | | 162,670,521 | | | | 7,734,110 | |
| | | | |
Net increase (decrease) in net assets | | | 147,356,855 | | | | 28,064,332 | |
|
| Net Assets | |
Beginning of year | | | 904,153,801 | | | | 876,089,469 | |
| | | | |
End of year | | $ | 1,051,510,656 | | | $ | 904,153,801 | |
| | | | |
Undistributed net investment income at end of year | | $ | 18,836,342 | | | $ | 24,060,033 | |
| | | | |
| | | | |
| M-46 | | MainStay VP Bond Portfolio | | The notes to the financial statements are an integral part of,
and should be read in conjunction with, the financial statements. |
Financial Highlights selected per share data and ratios
| | | | | | | | | | | | | | | | | | | | |
| | | Initial Class | |
| | | Year ended December 31, | |
| | | 2012 | | | 2011 | | | 2010 | | | 2009 | | | 2008 | |
Net asset value at beginning of year | | $ | 14.97 | | | $ | 14.63 | | | $ | 14.17 | | | $ | 13.82 | | | $ | 13.96 | |
| | | | | | | | | | | | | | | | | | | | |
Net investment income (loss) (a) | | | 0.28 | | | | 0.40 | | | | 0.48 | | | | 0.56 | | | | 0.64 | |
Net realized and unrealized gain (loss) on investments | | | 0.41 | | | | 0.66 | | | | 0.64 | | | | 0.51 | | | | (0.16 | ) |
| | | | | | | | | | | | | | | | | | | | |
Total from investment operations | | | 0.69 | | | | 1.06 | | | | 1.12 | | | | 1.07 | | | | 0.48 | |
| | | | | | | | | | | | | | | | | | | | |
Less dividends and distributions: | | | | | | | | | | | | | | | | | | | | |
From net investment income | | | (0.37 | ) | | | (0.49 | ) | | | (0.47 | ) | | | (0.67 | ) | | | (0.62 | ) |
From net realized gain on investments | | | (0.51 | ) | | | (0.23 | ) | | | (0.19 | ) | | | (0.05 | ) | | | (0.00 | )‡ |
| | | | | | | | | | | | | | | | | | | | |
Total dividends and distributions | | | (0.88 | ) | | | (0.72 | ) | | | (0.66 | ) | | | (0.72 | ) | | | (0.62 | ) |
| | | | | | | | | | | | | | | | | | | | |
Net asset value at end of year | | $ | 14.78 | | | $ | 14.97 | | | $ | 14.63 | | | $ | 14.17 | | | $ | 13.82 | |
| | | | | | | | | | | | | | | | | | | | |
Total investment return | | | 4.66 | % | | | 7.24 | % | | | 7.84 | % | | | 7.77 | % | | | 3.72 | % |
Ratios (to average net assets)/Supplemental Data: | | | | | | | | | | | | | | | | | | | | |
Net investment income (loss) | | | 1.84 | % | | | 2.70 | % | | | 3.26 | % | | | 3.97 | % | | | 4.58 | % |
Net expenses | | | 0.53 | % | | | 0.54 | % | | | 0.55 | % | | | 0.55 | % | | | 0.54 | % |
Portfolio turnover rate (b) | | | 311 | % | | | 293 | % | | | 127 | % | | | 158 | % | | | 304 | % |
Net assets at end of year (in 000’s) | | $ | 608,651 | | | $ | 530,001 | | | $ | 554,818 | | | $ | 515,186 | | | $ | 451,804 | |
| ‡ | Less than one cent per share. |
| (a) | Per share data based on average shares outstanding during the year. |
| (b) | The portfolio turnover rates not including mortgage dollar rolls were 222%, 231%, 97%, 151%, and 297% for the years ended December 31, 2012, 2011, 2010, 2009, and 2008, respectively. |
| | | | | | | | | | | | | | | | | | | | |
| | | Service Class | |
| | | Year ended December 31, | |
| | | 2012 | | | 2011 | | | 2010 | | | 2009 | | | 2008 | |
Net asset value at beginning of year | | $ | 14.85 | | | $ | 14.53 | | | $ | 14.09 | | | $ | 13.75 | | | $ | 13.90 | |
| | | | | | | | | | | | | | | | | | | | |
Net investment income (loss) (a) | | | 0.24 | | | | 0.36 | | | | 0.44 | | | | 0.52 | | | | 0.60 | |
Net realized and unrealized gain (loss) on investments | | | 0.40 | | | | 0.65 | | | | 0.63 | | | | 0.51 | | | | (0.15 | ) |
| | | | | | | | | | | | | | | | | | | | |
Total from investment operations | | | 0.64 | | | | 1.01 | | | | 1.07 | | | | 1.03 | | | | 0.45 | |
| | | | | | | | | | | | | | | | | | | | |
Less dividends and distributions: | | | | | | | | | | | | | | | | | | | | |
From net investment income | | | (0.34 | ) | | | (0.46 | ) | | | (0.44 | ) | | | (0.64 | ) | | | (0.60 | ) |
From net realized gain on investments | | | (0.51 | ) | | | (0.23 | ) | | | (0.19 | ) | | | (0.05 | ) | | | (0.00 | )‡ |
| | | | | | | | | | | | | | | | | | | | |
Total dividends and distributions | | | (0.85 | ) | | | (0.69 | ) | | | (0.63 | ) | | | (0.69 | ) | | | (0.60 | ) |
| | | | | | | | | | | | | | | | | | | | |
Net asset value at end of year | | $ | 14.64 | | | $ | 14.85 | | | $ | 14.53 | | | $ | 14.09 | | | $ | 13.75 | |
| | | | | | | | | | | | | | | | | | | | |
Total investment return | | | 4.40 | % | | | 6.98 | % | | | 7.58 | % | | | 7.50 | % | | | 3.47 | % |
Ratios (to average net assets)/Supplemental Data: | | | | | | | | | | | | | | | | | | | | |
Net investment income (loss) | | | 1.59 | % | | | 2.43 | % | | | 2.99 | % | | | 3.70 | % | | | 4.34 | % |
Net expenses | | | 0.78 | % | | | 0.79 | % | | | 0.80 | % | | | 0.80 | % | | | 0.79 | % |
Portfolio turnover rate (b) | | | 311 | % | | | 293 | % | | | 127 | % | | | 158 | % | | | 304 | % |
Net assets at end of year (in 000’s) | | $ | 442,860 | | | $ | 374,152 | | | $ | 321,271 | | | $ | 222,830 | | | $ | 182,241 | |
| ‡ | Less than one cent per share. |
| (a) | Per share data based on average shares outstanding during the year. |
| (b) | The portfolio turnover rates not including mortgage dollar rolls were 222%, 231%, 97%, 151%, and 297% for the years ended December 31, 2012, 2011, 2010, 2009, and 2008, respectively. |
| | | | | | |
The notes to the financial statements are an integral part of,
and should be read in conjunction with, the financial statements. | | mainstayinvestments.com | | | M-47 | |
MainStay VP Cash Management Portfolio
Investment and Performance Comparison1 (Unaudited)
Performance data quoted represents past performance. Past performance is no guarantee of future results. Because of market volatility, current performance may be lower or higher than the figures shown. Investment return and principal value will fluctuate, and as a result, when shares are redeemed, they may be worth more or less than their original cost. The performance table and graph do not reflect any deduction of sales charges, mortality and expense charges, contract charges or administrative charges. Please refer to the Performance Summary appropriate for your policy. For performance information current to the most recent month-end, please call 800-598-2019 or visit www.newyorklife.com.
An investment in the Portfolio is not insured or guaranteed by the Federal Deposit Insurance Corporation or any other government agency. Although the Portfolio seeks to preserve the value of your investment at $1.00 per share, it is possible to lose money by investing in the Portfolio.
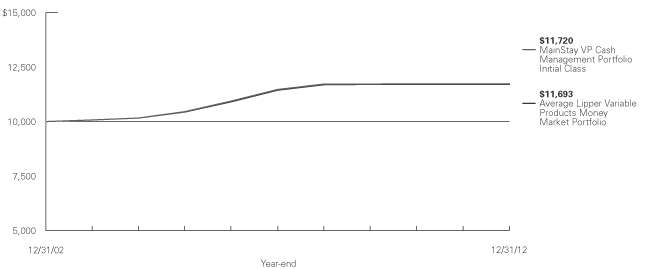
Average Annual Total Returns for the Year Ended December 31, 2012
| | | | | | | | | | |
| Class | | One Year | | Five Years | | Ten Years2 | | Gross Expense Ratio3 | |
| Initial Class Shares | | 0.01% | | 0.45% | | 1.60% | | | 0.47 | % |
| | |
| 7-Day Current Yield: 0.01%4 | | | | | | |
| | | | | | | | | | | | |
| Benchmark Performance | | One
Year | | | Five
Years | | | Ten
Years | |
Average Lipper Variable Products Money Market Portfolio5 | | | –0.03% | | | | 0.47% | | | | 1.58% | |
| 1. | Performance figures reflect certain fee waivers and/or expense limitations, without which total returns may have been different. For information on current expense limitations and/or expense limitations, please refer to the notes to the financial statements. |
| 2. | Performance figures shown for the ten-year period ended December 31, 2012 reflect nonrecurring reimbursements from affiliates for printing and mailing costs. If these nonrecurring reimbursements had not been made, the total returns would have been 1.58% for Initial Class shares for the ten-year period. |
| 3. | The gross expense ratios presented reflect the Portfolio’s “Total Annual Portfolio Operating Expenses” from the most recent Prospectus and may differ from other expense ratios disclosed in this report. |
| 4. | As of December 31, 2012, MainStay VP Cash Management Portfolio had an effective 7-day yield of 0.01% and a 7-day current yield of 0.01%. The current yield is more reflective of the Portfolio’s earnings than the total return. |
| 5. | The Average Lipper Variable Products Money Market Portfolio is an equally weighted performance average adjusted for capital gains distributions and income dividends of all of the money market portfolios in the Lipper universe which may include portfolios that do not maintain a stable net asset value of $1.00 per share. Lipper Inc. is an independent monitor of fund performance. Results are based on total returns with all dividend and capital gain distributions reinvested. |
| | |
| M-48 | | MainStay VP Cash Management Portfolio |
Cost in Dollars of a $1,000 Investment in MainStay VP Cash Management Portfolio (Unaudited)
The example below is intended to describe the fees and expenses borne by shareholders during the six-month period from July 1, 2012 to December 31, 2012, and the impact of those costs on your investment.
Example
As a shareholder of the Portfolio, you incur two types of costs: (1) transaction costs, including exchange fees and sales charges (loads) on purchases (as applicable), and (2) ongoing costs, including management fees, distribution and/or service (12b-1) fees, and other Portfolio expenses (as applicable). This example is intended to help you understand your ongoing costs (in dollars) of investing in the Portfolio and to compare these costs with the ongoing costs of investing in other Portfolios. The example is based on an investment of $1,000 made at the beginning of the six-month period and held for the entire period from July 1, 2012, to December 31, 2012. Shares are only sold in connection with variable life and annuity contracts and the example does not reflect any contract level or transactional fees or expenses. If these costs had been included, your costs would have been higher.
This example illustrates your Portfolio’s ongoing costs in two ways:
Actual Expenses
The second and third data columns in the table below provide information about actual account values and actual expenses. You may use the information in these columns, together with the amount you invested, to estimate the expenses that you paid during the six months ended
December 31, 2012. Simply divide your account value by $1,000 (for example, an $8,600 account value divided by $1,000 = 8.6), then multiply the result by the number under the heading entitled ‘‘Expenses Paid During Period’’ to estimate the expenses you paid on your account during this period.
Hypothetical Example for Comparison Purposes
The fourth and fifth data columns in the table below provide information about hypothetical account values and hypothetical expenses based on the Portfolio’s actual expense ratio and an assumed rate of return of 5% per year before expenses, which is not the Portfolio’s actual return. The hypothetical account values and expenses may not be used to estimate the actual ending account balances or expenses you paid for the six-month period shown. You may use this information to compare the ongoing costs of investing in the Portfolio with the ongoing costs of investing in other Portfolios. To do so, compare this 5% hypothetical example with the 5% hypothetical examples that appear in the shareholder reports of the other Portfolios.
Please note that the expenses shown in the table are meant to highlight your ongoing costs only and do not reflect any transactional costs, such as exchange fees or sales charges (loads). Therefore, the fourth and fifth data columns of the table are useful in comparing ongoing costs only and will not help you determine the relative total costs of owning different funds. In addition, if these transactional costs were included, your costs would have been higher.
| | | | | | | | | | | | | | | | | | | | |
| | | | | | | | | | | | | | | | |
| Share Class | | Beginning
Account
Value
7/1/12 | | | Ending Account
Value (Based
on Actual
Returns and
Expenses)
12/31/12 | | | Expenses
Paid
During
Period1 | | | Ending Account
Value (Based
on Hypothetical
5% Annualized
Return and
Actual Expenses)
12/31/12 | | | Expenses
Paid
During
Period1 | |
| | | | | |
| Initial Class Shares | | $ | 1,000.00 | | | $ | 1,000.10 | | | $ | 0.96 | | | $ | 1,024.20 | | | $ | 0.97 | |
| 1. | Expenses are equal to the Portfolio’s net annualized expense ratio of 0.19% multiplied by the average account value over the period, divided by 366 and multiplied by 184 (to reflect the six-month period). The table above represents the actual expenses incurred during the six-month period. |
| | | | |
| mainstayinvestments.com | | | M-49 | |
Portfolio Composition as of December 31, 2012 (Unaudited)
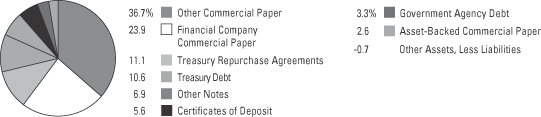
See Portfolio of Investments beginning on page M-53 for specific holdings within these categories.
| | |
| M-50 | | MainStay VP Cash Management Portfolio |
Portfolio Management Discussion and Analysis (Unaudited)
Answers to the questions reflect the views of portfolio managers David E. Clement, CFA, and Thomas J. Girard of New York Life Investments.1
How did MainStay VP Cash Management Portfolio perform relative to its peers during the 12 months ended December 31, 2012?
As of December 31, 2012, MainStay VP Cash Management Portfolio Initial Class shares provided a 7-day current yield of 0.01% and a 7-day effective yield of 0.01%. For the 12 months ended December 31, 2012, Initial Class shares of MainStay VP Cash Management Portfolio returned 0.01%. The Portfolio outperformed the –0.03% return of the average Lipper2 Variable Products Money Market Portfolio for the 12 months ended December 31, 2012. Performance figures for the Portfolio reflect certain fee waivers and/or expense limitations, without which total returns may have been different.
What were the most significant factors and risks that influenced the markets in which the Portfolio invested during the 12 months ended December 31, 2012?
During the reporting period, short-term interest rates remained at historically low levels. The Federal Reserve remained committed to an accommodative monetary policy in an effort to bolster a growing—but still weak—economy.
Supply-and-demand dynamics remained challenging. Issuers continued to take advantage of low interest rates and consequently continued to “term out” funding (or transfer debt on their balance sheets without acquiring new debt). Meanwhile, demand for short assets increased as investors anticipated that the Transaction Amount Guarantee Program (TAG) would expire at the end of the year. This program allowed for unlimited Federal Deposit Insurance Corporation (FDIC) coverage.
During 2012, talks of money fund reform continued to place a cloud of uncertainty over the market.
What factors affected the Portfolio’s performance during the reporting period?
A variety of factors influenced the Portfolio’s results. Floating-rate corporate bonds continued to perform
well relative to commercial paper. Short-term asset-backed securities added to the Portfolio’s yield, but spreads3 tightened significantly over the reporting period. U.S. Treasury bills and agency discount notes became less expensive relative to commercial paper and continued to help fund the Portfolio’s liquidity position. Meanwhile, cheaper (or higher yielding) repurchase agreements strengthened the Portfolio’s return.
What was the Portfolio’s duration4 strategy during the reporting period?
The Portfolio continued to target a duration centered around a 50-day weighted average maturity. We viewed this target as being on the long side because by law, the weighted average maturity of money market funds cannot exceed 60 days. This duration strategy allowed the Portfolio to benefit from securities with longer maturities and higher yields, such as U.S. Treasury coupon securities and asset-backed securities.
What specific factors, risks, or market forces prompted significant decisions for the Portfolio during the reporting period?
The Federal Open Market Committee stated that it anticipated that exceptionally low levels for the federal funds rate were likely to be warranted for a considerable period. This suggested that short-term interest rates would remain low, which kept our strategy weighted toward a longer weighted average maturity during the reporting period.
A weak economic recovery gave us the confidence to continue to emphasize longer-dated (and higher-yielding) securities during the reporting period. Higher rates on repurchase agreements increased the attractiveness of these investments. Since we use repurchase agreements to help manage the Portfolio’s liquidity position, higher rates helped to solidify the Portfolio’s yield.
| 1. | “New York Life Investments” is a service mark used by New York Life Investment Management LLC. |
| 2. | Please refer to pages M-2 and M-3 for additional explanations and disclosure regarding the Portfolios, their benchmark indices and service providers mentioned in the reports. |
| 3. | The terms “spread” and “yield spread” may refer to the difference in yield between a security or type of security and comparable U.S. Treasury issues. The terms may also refer to the difference in yield between two specific securities or types of securities at a given time. |
| 4. | Duration is a measure of the price sensitivity of a fixed-income investment to changes in interest rates. Duration is expressed as a number of years and is considered a more accurate sensitivity gauge than average maturity. |
| | | | |
| mainstayinvestments.com | | | M-51 | |
During the reporting period, which market segments were the strongest positive contributors to the Portfolio’s performance, and which market segments were particularly weak?
Some of the strongest contributors to the Portfolio’s performance were repurchase agreements, agency discount notes, floating-rate securities and asset-backed securities. (Contributions take weightings and total returns into account.) The weakest contributor was the commercial paper sector, primarily because we continued to limit the majority of our commercial paper investments to industrial issuers.
Did the Portfolio make any significant purchases or sales during the reporting period?
Significant purchases during the reporting period included a BP Capital Markets Floating Rate Note due 2/8/2013, a John Deere Equipment 0.267% coupon ABS Note due 5/15/2013, a MetLife Institutional
Funding Floating Rate Note due 9/12/2013 and a USAA Auto 0.23% coupon ABS due 9/16/13.
There were no significant sales during the reporting period.
How did the Portfolio’s sector weightings change during the reporting period?
During the reporting period, the Portfolio saw significant weighting increases among repurchase agreements and U.S. government agencies. Significant weighting decreases occurred in commercial paper and U.S. Treasury coupon securities.
How was the Portfolio positioned at the end of the reporting period?
As of December 31, 2012, the Portfolio was positioned for low short-term interest rates and continuing supply-side challenges.
The opinions expressed are those of the portfolio managers as of the date of this report and are subject to change. There is no guarantee that any forecasts made will come to pass. This material does not constitute investment advice and is not intended as an endorsement of any specific investment.
Not all MainStay VP Portfolios and/or share classes are available under all policies.
| | |
| M-52 | | MainStay VP Cash Management Portfolio |
Portfolio of Investments December 31, 2012
| | | | | | | | |
| | | Principal
Amount | | | Amortized
Cost | |
| | | | | | | |
| Short-Term Investments 100.7%† | |
Asset-Backed Commercial Paper 2.6% | |
Straight-A Funding LLC | | | | | | | | |
0.17%, due 2/5/13 (a)(b) | | $ | 9,357,000 | | | $ | 9,355,454 | |
0.18%, due 2/4/13 (a)(b) | | | 9,315,000 | | | | 9,313,416 | |
| | | | | | | | |
| | | | | | | 18,668,870 | |
| | | | | | | | |
Certificates of Deposit 5.6% | | | | | | | | |
Bank of Montreal | | | | | | | | |
0.20%, due 1/11/13 | | | 9,335,000 | | | | 9,335,000 | |
0.20%, due 1/29/13 | | | 9,280,000 | | | | 9,280,000 | |
Royal Bank of Canada
0.16%, due 1/18/13 | | | 9,355,000 | | | | 9,355,000 | |
Toronto-Dominion Bank (The)
0.313%, due 2/4/13 (c) | | | 6,735,000 | | | | 6,735,000 | |
Toronto-Dominion Holdings U.S.A., Inc.
0.321%, due 10/21/13 (b)(c) | | | 6,165,000 | | | | 6,165,000 | |
| | | | | | | | |
| | | | | | | 40,870,000 | |
| | | | | | | | |
Financial Company Commercial Paper 23.9% | |
American Honda Finance Corp.
0.15%, due 2/7/13 (a) | | | 9,330,000 | | | | 9,328,562 | |
Bank of Nova Scotia | | | | | | | | |
0.17%, due 2/27/13 (a) | | | 6,250,000 | | | | 6,248,318 | |
0.17%, due 2/20/13 (a) | | | 9,300,000 | | | | 9,297,804 | |
0.185%, due 2/11/13 (a) | | | 3,000,000 | | | | 2,999,368 | |
0.205%, due 1/16/13 (a) | | | 6,000,000 | | | | 5,999,487 | |
Caterpillar Financial Services Corp. | | | | | | | | |
0.17%, due 1/17/13 (a) | | | 6,185,000 | | | | 6,184,533 | |
0.19%, due 3/4/13 (a) | | | 9,355,000 | | | | 9,351,939 | |
0.20%, due 3/25/13 (a) | | | 6,235,000 | | | | 6,232,125 | |
Glaxosmithkline Finance PLC | | | | | | | | |
0.15%, due 1/4/13 (a) | | | 9,365,000 | | | | 9,364,883 | |
0.16%, due 1/4/13 (a)(b) | | | 5,787,000 | | | | 5,786,923 | |
John Deere Bank SA
0.18%, due 1/30/13 (a)(b) | | | 4,900,000 | | | | 4,899,290 | |
John Deere Financial Ltd.
0.18%, due 1/30/13 (a)(b) | | | 9,295,000 | | | | 9,293,652 | |
JPMorgan Chase & Co.
0.331%, due 3/13/13 (a) | | | 6,235,000 | | | | 6,235,000 | |
National Australia Funding Delaware, Inc.
0.185%, due 2/19/13 (a)(b) | | | 9,300,000 | | | | 9,297,658 | |
National Rural Utilities Cooperative Finance Corp. | | | | | | | | |
0.14%, due 1/31/13 (a) | | | 2,350,000 | | | | 2,349,726 | |
0.15%, due 1/7/13 (a) | | | 6,195,000 | | | | 6,194,845 | |
0.15%, due 1/9/13 (a) | | | 9,355,000 | | | | 9,354,688 | |
0.16%, due 2/19/13 (a) | | | 5,415,000 | | | | 5,413,821 | |
| | | | | | | | |
| | | Principal
Amount | | | Amortized
Cost | |
| | | | | | | |
Financial Company Commercial Paper (continued) | |
PACCAR Financial Corp. | | | | | | | | |
0.14%, due 1/2/13 (a) | | $ | 5,870,000 | | | $ | 5,869,977 | |
0.16%, due 1/16/13 (a) | | | 3,715,000 | | | | 3,714,752 | |
Private Export Funding Corp.
0.17%, due 1/22/13 (a)(b) | | | 6,185,000 | | | | 6,184,387 | |
Royal Bank of Canada
0.14%, due 1/22/13 (a) | | | 9,340,000 | | | | 9,339,237 | |
U.S. Bank NA | | | | | | | | |
0.12%, due 1/2/13 (a) | | | 6,225,000 | | | | 6,225,000 | |
0.15%, due 1/3/13 (a) | | | 9,365,000 | | | | 9,365,000 | |
Westpac Banking Corp.
0.61%, due 5/3/13 (a)(b) | | | 9,455,000 | | | | 9,455,000 | |
| | | | | | | | |
| | | | | | | 173,985,975 | |
| | | | | | | | |
Government Agency Debt 3.3% | | | | | | | | |
Federal Home Loan Bank | | | | | | | | |
0.045%, due 2/1/13 | | | 9,410,000 | | | | 9,409,635 | |
0.07%, due 3/8/13 | | | 9,380,000 | | | | 9,378,796 | |
Federal National Mortgage Association
0.055%, due 2/20/13 | | | 5,505,000 | | | | 5,504,580 | |
| | | | | | | | |
| | | | | | | 24,293,011 | |
| | | | | | | | |
Other Commercial Paper 36.7% | | | | | | | | |
Air Products & Chemicals, Inc. | | | | | | | | |
0.14%, due 1/15/13 (a)(b) | | | 4,355,000 | | | | 4,354,763 | |
0.15%, due 1/16/13 (a)(b) | | | 6,225,000 | | | | 6,224,611 | |
0.16%, due 1/31/13 (a)(b) | | | 9,355,000 | | | | 9,353,753 | |
BP Capital Markets PLC
0.512%, due 2/8/13 (a)(b) | | | 6,080,000 | | | | 6,080,000 | |
Brown-Forman Corp. | | | | | | | | |
0.16%, due 1/15/13 (a)(b) | | | 5,480,000 | | | | 5,479,659 | |
0.20%, due 1/3/13 (a)(b) | | | 6,220,000 | | | | 6,219,931 | |
ConocoPhillips Qatar Funding Ltd.
0.16%, due 2/26/13 (a)(b) | | | 6,142,000 | | | | 6,140,471 | |
Danaher Corp.
0.15%, due 1/4/13 (a)(b) | | | 9,355,000 | | | | 9,354,883 | |
Deere & Co.
0.13%, due 1/15/13 (a)(b) | | | 8,090,000 | | | | 8,089,591 | |
Emerson Electric Co.
0.18%, due 3/22/13 (a)(b) | | | 4,425,000 | | | | 4,423,230 | |
Illinois Tool Works, Inc.
0.12%, due 1/7/13 (a)(b) | | | 18,750,000 | | | | 18,749,625 | |
McDonald’s Corp.
0.14%, due 1/28/13 (a)(b) | | | 7,495,000 | | | | 7,494,213 | |
Medtronic, Inc.
0.15%, due 2/28/13 (a)(b) | | | 9,355,000 | | | | 9,352,739 | |
NetJets, Inc.
0.12%, due 1/2/13 (a)(b) | | | 25,090,000 | | | | 25,089,916 | |
| † | Percentages indicated are based on Portfolio net assets. |
| | | | | | |
The notes to the financial statements are an integral part of,
and should be read in conjunction with, the financial statements. | | mainstayinvestments.com | | | M-53 | |
Portfolio of Investments December 31, 2012 (continued)
| | | | | | | | |
| | | Principal
Amount | | | Amortized
Cost | |
| | | | | | | |
| Short-Term Investments (continued) | |
Other Commercial Paper (continued) | | | | | | | | |
NSTAR Electric Co.
0.25%, due 1/14/13 (a) | | $ | 4,244,000 | | | $ | 4,243,617 | |
Parker Hannifin Corp.
0.12%, due 1/10/13 (a)(b) | | | 9,340,000 | | | | 9,339,720 | |
Procter & Gamble Co. (The)
0.16%, due 3/4/13 (a)(b) | | | 9,355,000 | | | | 9,352,422 | |
Rockwell Collins, Inc. | | | | | | | | |
0.13%, due 1/4/13 (a)(b) | | | 9,355,000 | | | | 9,354,899 | |
0.13%, due 1/11/13 (a)(b) | | | 9,715,000 | | | | 9,714,649 | |
Sigma-Aldrich Corp.
0.12%, due 1/7/13 (a)(b) | | | 14,384,000 | | | | 14,383,712 | |
Southern Co. (The) | | | | | | | | |
0.23%, due 1/29/13 (a)(b) | | | 9,335,000 | | | | 9,333,330 | |
0.24%, due 1/23/13 (a)(b) | | | 5,320,000 | | | | 5,319,220 | |
0.25%, due 1/16/13 (a)(b) | | | 2,000,000 | | | | 1,999,792 | |
St. Jude Medical, Inc. | | | | | | | | |
0.19%, due 1/9/13 (a)(b) | | | 9,340,000 | | | | 9,339,606 | |
0.20%, due 1/11/13 (a)(b) | | | 6,220,000 | | | | 6,219,654 | |
Toyota Motor Credit Corp. | | | | | | | | |
0.18%, due 1/16/13 (a) | | | 6,235,000 | | | | 6,234,532 | |
0.21%, due 2/6/13 (a) | | | 5,765,000 | | | | 5,763,789 | |
WGL Holdings, Inc. | | | | | | | | |
0.24%, due 1/2/13 (a)(b) | | | 6,250,000 | | | | 6,249,958 | |
0.24%, due 1/10/13 (a)(b) | | | 6,905,000 | | | | 6,904,586 | |
0.24%, due 1/14/13 (a)(b) | | | 3,110,000 | | | | 3,109,731 | |
Wisconsin Gas LLC | | | | | | | | |
0.17%, due 1/4/13 (a) | | | 5,645,000 | | | | 5,644,920 | |
0.18%, due 1/3/13 (a) | | | 3,752,000 | | | | 3,751,963 | |
0.18%, due 1/10/13 (a) | | | 8,720,000 | | | | 8,719,608 | |
0.23%, due 1/10/13 (a) | | | 6,235,000 | | | | 6,234,641 | |
| | | | | | | | |
| | | | | | | 267,621,734 | |
| | | | | | | | |
Other Notes 6.9% | | | | | | | | |
American Honda Finance Corp.
0.34%, due 11/8/13 (b)(c) | | | 6,195,000 | | | | 6,195,000 | |
CNH Equipment Trust
Series 2012-B, Class A1
0.383%, due 7/12/13 | | | 1,451,848 | | | | 1,451,848 | |
Enterprise Fleet Financing LLC | | | | | | | | |
Series 2012-2, Class A1
0.325%, due 9/20/13 (b) | | | 4,035,531 | | | | 4,035,531 | |
Series 2012-1, Class A1
0.46%, due 5/20/13 (b) | | | 1,048,818 | | | | 1,048,818 | |
Great America Leasing Receivables
Series 2012-1, Class A1
0.512%, due 4/15/13 (b) | | | 175,907 | | | | 175,907 | |
Holmes Master Issuer PLC
Series 2012-1A, Class A1
0.409%, due 1/15/13 (b)(c) | | | 6,955,000 | | | | 6,955,000 | |
| | | | | | | | |
| | | Principal
Amount | | | Amortized
Cost | |
| | | | | | | |
Other Notes (continued) | | | | | | | | |
Hyundai Auto Lease Securitization Trust
Series 2012-A, Class A1
0.384%, due 6/17/13 (b) | | $ | 391,057 | | | $ | 391,057 | |
John Deere Owner Trust
Series 2012-B, Class A1
0.267%, due 9/16/13 | | | 2,222,604 | | | | 2,222,604 | |
MetLife Institutional Funding II | | | | | | | | |
0.411%, due 9/12/13 (b)(c) | | | 6,235,000 | | | | 6,235,000 | |
0.605%, due 4/3/13 (b)(c) | | | 8,000,000 | | | | 8,000,000 | |
MMAF Equipment Finance LLC
Series 2012-AA, Class A1
0.346%, due 7/10/13 (b) | | | 962,693 | | | | 962,693 | |
Navistar Financial Corp. Owner Trust
Series 2012-A, Class A1
0.432%, due 7/18/13 (b) | | | 827,954 | | | | 827,954 | |
Northern Trust Corp.
5.50%, due 8/15/13 | | | 2,105,000 | | | | 2,171,843 | |
SMART Trust
Series 2012-2USA, Class A1
0.424%, due 6/14/13 (b) | | | 988,811 | | | | 988,811 | |
Target Corp.
0.377%, due 1/11/13 (c) | | | 6,000,000 | | | | 6,000,000 | |
USAA Auto Owner Trust
Series 2012-1, Class A1
0.23%, due 9/16/13 | | | 2,544,583 | | | | 2,544,583 | |
World Omni Automobile Lease Securitization Trust
Series 2012-A, Class A1
0.328%, due 6/17/13 | | | 335,184 | | | | 335,184 | |
| | | | | | | | |
| | | | | | | 50,541,833 | |
| | | | | | | | |
Treasury Debt 10.6% | | | | | | | | |
United States Treasury Notes | | | | | | | | |
0.125%, due 8/31/13 | | | 6,370,000 | | | | 6,365,904 | |
0.125%, due 9/30/13 | | | 6,205,000 | | | | 6,201,135 | |
0.25%, due 10/31/13 | | | 6,165,000 | | | | 6,166,735 | |
0.25%, due 11/30/13 | | | 6,200,000 | | | | 6,201,437 | |
0.375%, due 6/30/13 | | | 6,200,000 | | | | 6,204,647 | |
0.375%, due 7/31/13 | | | 6,410,000 | | | | 6,416,771 | |
0.50%, due 5/31/13 | | | 6,400,000 | | | | 6,407,662 | |
0.625%, due 1/31/13 | | | 9,000,000 | | | | 9,003,408 | |
0.625%, due 2/28/13 | | | 10,000,000 | | | | 10,007,426 | |
0.625%, due 4/30/13 | | | 6,430,000 | | | | 6,438,863 | |
0.75%, due 3/31/13 | | | 7,700,000 | | | | 7,709,857 | |
| | | | | | | | |
| | | | | | | 77,123,845 | |
| | | | | | | | |
| | | | |
| M-54 | | MainStay VP Cash Management Portfolio | | The notes to the financial statements are an integral part of,
and should be read in conjunction with, the financial statements. |
| | | | | | | | |
| | | Principal
Amount | | | Amortized
Cost | |
| | | | | | | |
| Short-Term Investments (continued) | |
Treasury Repurchase Agreements 11.1% | | | | | | | | |
Bank of America N.A.
0.15%, dated 12/31/12
due 1/2/13
Proceeds at Maturity $61,702,514 (Collateralized by a United States Treasury Bill with a rate of 0.097% and a maturity date of 5/23/13, with a Principal Amount of $62,960,600 and a Market Value of $62,936,675) | | $ | 61,702,000 | | | $ | 61,702,000 | |
Deutsche Bank Securities, Inc.
0.15%, dated 12/31/12
due 1/2/13
Proceeds at Maturity $19,000,158 (Collateralized by a United States Treasury Note with a rate of 0.625% and a maturity date of 11/30/17, with a Principal Amount of $19,433,500 and a Market Value of $19,380,083) | | | 19,000,000 | | | | 19,000,000 | |
| | | | | | | | |
| | | | | | | 80,702,000 | |
| | | | | | | | |
Total Short-Term Investments
(Amortized Cost $733,807,268) (d) | | | 100.7 | % | | | 733,807,268 | |
Other Assets, Less Liabilities | | | (0.7 | ) | | | (5,101,012 | ) |
Net Assets | | | 100.0 | % | | $ | 728,706,256 | |
| (a) | Interest rate presented is yield to maturity. |
| (b) | May be sold to institutional investors only under Rule 144A or securities offered pursuant to Section 4(2) of the Securities Act of 1933, as amended. |
| (c) | Floating rate—Rate shown is the rate in effect as of December 31, 2012. |
| (d) | The amortized cost also represents the aggregate cost for federal income tax purposes. |
The following is a summary of the fair valuations according to the inputs used as of December 31, 2012, for valuing the Portfolio’s assets.
Asset Valuation Inputs
| | | | | | | | | | | | | | | | |
Description | | Quoted Prices
in Active Markets
for Identical Assets
(Level 1) | | | Significant Other
Observable Inputs (Level 2) | | | Significant
Unobservable
Inputs
(Level 3) | | | Total | |
| Investments in Securities (a) | | | | | | | | | | | | | | | | |
| Short-Term Investments | | | | | | | | | | | | | | | | |
Asset-Backed Commercial Paper | | $ | — | | | $ | 18,668,870 | | | $ | — | | | $ | 18,668,870 | |
Certificates of Deposit | | | — | | | | 40,870,000 | | | | — | | | | 40,870,000 | |
Financial Company Commercial Paper | | | — | | | | 173,985,975 | | | | — | | | | 173,985,975 | |
Government Agency Debt | | | — | | | | 24,293,011 | | | | — | | | | 24,293,011 | |
Other Commercial Paper | | | — | | | | 267,621,734 | | | | — | | | | 267,621,734 | |
Other Notes | | | — | | | | 50,541,833 | | | | — | | | | 50,541,833 | |
Treasury Debt | | | — | | | | 77,123,845 | | | | — | | | | 77,123,845 | |
Treasury Repurchase Agreements | | | — | | | | 80,702,000 | | | | — | | | | 80,702,000 | |
| | | | | | | | | | | | | | | | |
| Total Investments in Securities | | $ | — | | | $ | 733,807,268 | | | $ | — | | | $ | 733,807,268 | |
| | | | | | | | | | | | | | | | |
| (a) | For a complete listing of investments, see the Portfolio of Investments. |
The Portfolio recognizes transfers between the levels as of the beginning of the period.
For the year ended December 31, 2012, the Portfolio did not have any transfers between Level 1 and Level 2 fair value measurements. (See Note 2)
As of December 31, 2012, the Portfolio did not hold any investments with significant unobservable inputs (Level 3). (See Note 2)
| | | | | | |
The notes to the financial statements are an integral part of,
and should be read in conjunction with, the financial statements. | | mainstayinvestments.com | | | M-55 | |
Portfolio of Investments December 31, 2012 (continued)
The table below sets forth the diversification of MainStay VP Cash Management Portfolio investments by industry.
Industry Diversification (Unaudited)
| | | | | | | | |
| | | Amortized Cost | | | Percent† | |
Aerospace & Defense | | $ | 19,069,548 | | | | 2.6 | % |
Auto Manufacturers | | | 11,998,321 | | | | 1.6 | |
Automobile | | | 2,543,006 | | | | 0.3 | |
Automobile ABS | | | 10,043,473 | | | | 1.4 | |
Banks | | | 117,503,715 | | | | 16.1 | |
Beverages | | | 11,699,590 | | | | 1.6 | |
Chemicals | | | 34,316,839 | | | | 4.7 | |
Cosmetics & Personal Care | | | 9,352,422 | | | | 1.3 | |
Diversified Financial Services | | | 12,368,920 | | | | 1.7 | |
Electric | | | 20,895,959 | | | | 2.9 | |
Electrical Components & Equipment | | | 4,423,230 | | | | 0.6 | |
Finance—Auto Loans | | | 25,108,291 | | | | 3.4 | |
Finance—Commercial | | | 15,584,064 | | | | 2.1 | |
Finance—Consumer Loans | | | 14,192,942 | | | | 1.9 | |
Finance—Other Services | | | 57,214,511 | | | | 7.9 | |
Gas | | | 40,615,407 | | | | 5.6 | |
Health Care—Products | | | 24,911,999 | | | | 3.4 | |
Insurance | | | 14,235,000 | | | | 2.0 | |
Machinery—Diversified | | | 8,089,591 | | | | 1.1 | |
Miscellaneous—Manufacturing | | | 18,694,603 | | | | 2.6 | |
Oil & Gas | | | 12,220,471 | | | | 1.7 | |
Other ABS | | | 2,398,511 | | | | 0.3 | |
Repurchase Agreements | | | 80,702,000 | | | | 11.1 | |
Retail | | | 13,494,213 | | | | 1.9 | |
Sovereign | | | 91,409,430 | | | | 12.5 | |
Special Purpose Entity | | | 18,668,870 | | | | 2.6 | |
Transportation | | | 25,089,916 | | | | 3.4 | |
U.S. Government & Agency | | | 10,007,426 | | | | 1.4 | |
Whole Loan Collateral (Collateralized Mortgage Obligations) | | | 6,955,000 | | | | 1.0 | |
| | | | | | | | |
| | | 733,807,268 | | | | 100.7 | |
Other Assets, Less Liabilities | | | (5,101,012 | ) | | | (0.7 | ) |
| | | | | | | | |
Net Assets | | $ | 728,706,256 | | | | 100.0 | % |
| | | | | | | | |
| † | Percentages indicated are based on Portfolio net assets. |
| | | | |
| M-56 | | MainStay VP Cash Management Portfolio | | The notes to the financial statements are an integral part of,
and should be read in conjunction with, the financial statements. |
Statement of Assets and Liabilities as of December 31, 2012
| | | | |
| Assets | | | | |
Investment in securities, at value
(amortized cost $653,105,268) | | $ | 653,105,268 | |
Repurchase agreements, at value
(amortized cost $80,702,000) | | | 80,702,000 | |
Cash | | | 857 | |
Receivables: | | | | |
Fund shares sold | | | 1,485,504 | |
Interest | | | 183,864 | |
Other assets | | | 746 | |
| | | | |
Total assets | | | 735,478,239 | |
| | | | |
| |
| Liabilities | | | | |
Payables: | | | | |
Fund shares redeemed | | | 6,543,000 | |
Manager (See Note 3) | | | 119,857 | |
Shareholder communication | | | 69,719 | |
Professional fees | | | 34,570 | |
Custodian | | | 3,802 | |
Trustees | | | 1,035 | |
| | | | |
Total liabilities | | | 6,771,983 | |
| | | | |
Net assets | | $ | 728,706,256 | |
| | | | |
| |
| Net Assets Consist of | | | | |
Shares of beneficial interest outstanding (par value of $.001 per share) unlimited number of shares authorized | | $ | 728,655 | |
Additional paid-in capital (a) | | | 727,977,489 | |
| | | | |
| | | 728,706,144 | |
Accumulated net realized gain (loss) on investments | | | 112 | |
| | | | |
Net assets applicable to outstanding shares | | $ | 728,706,256 | |
| | | | |
Shares of beneficial interest outstanding | | | 728,655,289 | |
| | | | |
Net asset value per share outstanding | | $ | 1.00 | |
| | | | |
| (a) | Additional paid-in capital includes a prior period adjustment in the amount of $67,105 in accordance with generally accepted accounting principles. |
| | | | | | |
The notes to the financial statements are an integral part of,
and should be read in conjunction with, the financial statements. | | mainstayinvestments.com | | | M-57 | |
Statement of Operations for the year ended December 31, 2012
| | | | |
| |
| Investment Income (Loss) | | | | |
Income | | | | |
Interest | | $ | 1,425,785 | |
| | | | |
Expenses | | | | |
Manager (See Note 3) | | | 3,221,644 | |
Shareholder communication | | | 129,753 | |
Professional fees | | | 60,263 | |
Custodian | | | 23,029 | |
Trustees | | | 20,456 | |
Miscellaneous | | | 25,867 | |
| | | | |
Total expenses before waiver/reimbursement | | | 3,481,012 | |
Expense waiver/reimbursement from Manager (See Note 3) | | | (2,129,590 | ) |
| | | | |
Net expenses | | | 1,351,422 | |
| | | | |
Net investment income (loss) | | | 74,363 | |
| | | | |
|
| Realized and Unrealized Gain (Loss) on Investments | |
Net realized gain (loss) on investments | | | 112 | |
| | | | |
Net increase (decrease) in net assets resulting from operations | | $ | 74,475 | |
| | | | |
| | | | |
| M-58 | | MainStay VP Cash Management Portfolio | | The notes to the financial statements are an integral part of,
and should be read in conjunction with, the financial statements. |
Statements of Changes in Net Assets
for the years ended December 31, 2012 and December 31, 2011
| | | | | | | | |
| | | 2012 | | | 2011 | |
| Increase (Decrease) in Net Assets | | | | | |
Operations: | | | | | | | | |
Net investment income (loss) | | $ | 74,363 | | | $ | 83,793 | |
Net realized gain (loss) on investments | | | 112 | | | | — | |
| | | | | | | | |
Net increase (decrease) in net assets resulting from operations | | | 74,475 | | | | 83,793 | |
| | | | | | | | |
Dividends to shareholders: | | | | | | | | |
From net investment income | | | (74,363 | ) | | | (77,843 | ) |
| | | | | | | | |
Capital share transactions: | | | | | | | | |
Net proceeds from sale of shares | | | 608,218,552 | | | | 751,253,099 | |
Net asset value of shares issued to shareholders in reinvestment of dividends | | | 74,363 | | | | 77,843 | |
Cost of shares redeemed | | | (768,841,980 | ) | | | (533,291,944 | ) |
| | | | | | | | |
Increase (decrease) in net assets derived from capital share transactions | | | (160,549,065 | ) | | | 218,038,998 | |
| | | | | | | | |
Net increase (decrease) in net assets | | | (160,548,953 | ) | | | 218,044,948 | |
| |
| Net Assets | | | | | |
Beginning of year | | | 889,255,209 | | | | 671,210,261 | |
| | | | | | | | |
End of year | | $ | 728,706,256 | | | $ | 889,255,209 | |
| | | | | | | | |
| | | | | | |
The notes to the financial statements are an integral part of,
and should be read in conjunction with, the financial statements. | | mainstayinvestments.com | | | M-59 | |
Financial Highlights selected per share data and ratios
| | | | | | | | | | | | | | | | | | | | |
| | | Year ended December 31, | |
| | | 2012 | | | 2011 | | | 2010 | | | 2009 | | | 2008 | |
Net asset value at beginning of year | | $ | 1.00 | | | $ | 1.00 | | | $ | 1.00 | | | $ | 1.00 | | | $ | 1.00 | |
| | | | | | | | | | | | | | | | | | | | |
Net investment income (loss) | | | 0.00 | ‡ | | | 0.00 | ‡ | | | 0.00 | ‡ | | | 0.00 | ‡ | | | 0.02 | |
Net realized and unrealized gain (loss) on investments | | | 0.00 | ‡ | | | 0.00 | ‡ | | | 0.00 | ‡ | | | 0.00 | ‡ | | | 0.00 | ‡ |
| | | | | | | | | | | | | | | | | | | | |
Total from investment operations | | | 0.00 | ‡ | | | 0.00 | ‡ | | | 0.00 | ‡ | | | 0.00 | ‡ | | | 0.02 | |
| | | | | | | | | | | | | | | | | | | | |
Less dividends: | | | | | | | | | | | | | | | | | | | | |
From net investment income | | | (0.00 | )‡ | | | (0.00 | )‡ | | | (0.00 | )‡ | | | (0.00 | )‡ | | | (0.02 | ) |
| | | | | | | | | | | | | | | | | | | | |
Net asset value at end of year | | $ | 1.00 | | | $ | 1.00 | | | $ | 1.00 | | | $ | 1.00 | | | $ | 1.00 | |
| | | | | | | | | | | | | | | | | | | | |
Total investment return | | | 0.01 | % | | | 0.01 | % | | | 0.01 | % | | | 0.05 | % | | | 2.18 | % |
Ratios (to average net assets)/Supplemental Data: | | | | | | | | | | | | | | | | | | | | |
Net investment income (loss) | | | 0.01 | % | | | 0.01 | % | | | 0.01 | % | | | 0.05 | % | | | 2.02 | % |
Net expenses | | | 0.18 | % | | | 0.15 | % | | | 0.25 | % | | | 0.41 | % | | | 0.50 | % |
Expenses (before waiver/reimbursement) | | | 0.47 | % | | | 0.47 | % | | | 0.50 | % | | | 0.51 | % | | | 0.50 | % |
Net assets at end of year (in 000’s) | | $ | 728,706 | | | $ | 889,255 | | | $ | 671,210 | | | $ | 765,118 | | | $ | 1,095,888 | |
| ‡ | Less than one cent per share. |
| | | | |
| M-60 | | MainStay VP Cash Management Portfolio | | The notes to the financial statements are an integral part of,
and should be read in conjunction with, the financial statements. |
MainStay VP Common Stock Portfolio
Investment and Performance Comparison (Unaudited)
Performance data quoted represents past performance. Past performance is no guarantee of future results. Because of market volatility, current performance may be lower or higher than the figures shown. Investment return and principal value will fluctuate, and as a result, when shares are redeemed, they may be worth more or less than their original cost. The performance table and graph do not reflect any deduction of sales charges, mortality and expense charges, contract charges or administrative charges. Please refer to the Performance Summary appropriate for your policy. For performance information current to the most recent month-end, please call 800-598-2019 or visit www.newyorklife.com.
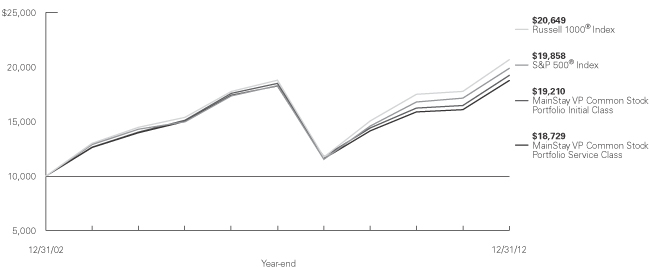
Average Annual Total Returns for the Year Ended December 31, 2012
| | | | | | | | | | | | | | | | |
| Class | | One Year | | | Five Years | | | Ten Years1 | | | Gross Expense Ratio2 | |
Initial Class Shares | | | 16.72 | % | | | 0.77 | % | | | 6.75 | % | | | 0.60 | % |
Service Class Shares3 | | | 16.43 | | | | 0.52 | | | | 6.48 | | | | 0.85 | |
| | | | | | | | | | | | |
| Benchmark Performance | | One Year | | | Five Years | | | Ten
Years | |
S&P 500® Index4 | | | 16.00 | % | | | 1.66 | % | | | 7.10 | % |
Russell 1000® Index4 | | | 16.42 | | | | 1.92 | | | | 7.52 | |
Average Lipper Variable Products Large-Cap Core Portfolio5 | | | 15.02 | | | | 0.53 | | | | 6.55 | |
| 1. | Performance figures shown for the ten-year period ended December 31, 2012 reflect nonrecurring reimbursements from affiliates for printing and mailing costs. If these nonrecurring reimbursements had not been made, the total returns would have been 6.73% for Initial Class shares and 6.46% for Service Class shares for the ten-year period. |
| 2. | The gross expense ratios presented reflect the Portfolio’s “Total Annual Portfolio Operating Expenses” from the most recent Prospectus and may differ from other expense ratios disclosed in this report. |
| 3. | Performance for Service Class shares, first offered June 5, 2003, includes the historical performance of Initial Class shares through June 4, 2003 adjusted to reflect the fees and expenses of Service Class shares. |
| 4. | Please refer to pages M-2 and M-3 for additional explanations and disclosure regarding the Portfolios, their benchmark indices and other indices mentioned in the reports. |
| 5. | The Average Lipper Variable Products Large-Cap Core Portfolio is representative of portfolios that, by portfolio practice, invest at least 75% of their equity assets in companies with market capitalizations (on a three-year weighted basis) above Lipper’s U.S. diversified equity large-cap floor. Large-cap core portfolios have more latitude in the companies in which they invest. These portfolios typically have an average price-to-earnings ratio, price-to-book ratio, and three-year sales-per-share growth value compared to the S&P 500® Index. Lipper Inc. is an independent monitor of fund performance. Results are based on total returns with all dividend and capital gain distributions reinvested. |
| | |
| mainstayinvestments.com | | M-61 |
Cost in Dollars of a $1,000 Investment in MainStay VP Common Stock Portfolio (Unaudited)
The example below is intended to describe the fees and expenses borne by shareholders during the six-month period from July 1, 2012 to December 31, 2012, and the impact of those costs on your investment.
Example
As a shareholder of the Portfolio, you incur two types of costs: (1) transaction costs, including exchange fees and sales charges (loads) on purchases (as applicable), and (2) ongoing costs, including management fees, distribution and/or service (12b-1) fees, and other Portfolio expenses (as applicable). This example is intended to help you understand your ongoing costs (in dollars) of investing in the Portfolio and to compare these costs with the ongoing costs of investing in other Portfolios. The example is based on an investment of $1,000 made at the beginning of the six-month period and held for the entire period from July 1, 2012, to December 31, 2012. Shares are only sold in connection with variable life and annuity contracts and the example does not reflect any contract level or transactional fees or expenses. If these costs had been included, your costs would have been higher.
This example illustrates your Portfolio’s ongoing costs in two ways:
Actual Expenses
The second and third data columns in the table below provide information about actual account values and actual expenses. You may use the information in these columns, together with the amount you invested, to estimate the expenses that you paid during the six months ended
December 31, 2012. Simply divide your account value by $1,000 (for example, an $8,600 account value divided by $1,000 = 8.6), then multiply the result by the number under the heading entitled ‘‘Expenses Paid During Period’’ to estimate the expenses you paid on your account during this period.
Hypothetical Example for Comparison Purposes
The fourth and fifth data columns in the table below provide information about hypothetical account values and hypothetical expenses based on the Portfolio’s actual expense ratio and an assumed rate of return of 5% per year before expenses, which is not the Portfolio’s actual return. The hypothetical account values and expenses may not be used to estimate the actual ending account balances or expenses you paid for the six-month period shown. You may use this information to compare the ongoing costs of investing in the Portfolio with the ongoing costs of investing in other Portfolios. To do so, compare this 5% hypothetical example with the 5% hypothetical examples that appear in the shareholder reports of the other Portfolios.
Please note that the expenses shown in the table are meant to highlight your ongoing costs only and do not reflect any transactional costs, such as exchange fees or sales charges (loads). Therefore, the fourth and fifth data columns of the table are useful in comparing ongoing costs only and will not help you determine the relative total costs of owning different funds. In addition, if these transactional costs were included, your costs would have been higher.
| | | | | | | | | | | | | | | | | | | | |
| | | | | | | | | | | | | | | | |
| Share Class | | Beginning
Account
Value
7/1/12 | | | Ending Account
Value (Based
on Actual
Returns and
Expenses)
12/31/12 | | | Expenses
Paid
During
Period1 | | | Ending Account
Value (Based
on Hypothetical
5% Annualized
Return and
Actual Expenses)
12/31/12 | | | Expenses
Paid
During
Period1 | |
| | | | | |
| Initial Class Shares | | $ | 1,000.00 | | | $ | 1,070.10 | | | $ | 3.07 | | | $ | 1,022.20 | | | $ | 3.00 | |
| | | | | |
| Service Class Shares | | $ | 1,000.00 | | | $ | 1,068.80 | | | $ | 4.37 | | | $ | 1,020.90 | | | $ | 4.27 | |
| 1. | Expenses are equal to the Portfolio’s annualized expense ratio of each class (0.59% for Initial Class and 0.84% for Service Class) multiplied by the average account value over the period, divided by 366 and multiplied by 184 (to reflect the six-month period). The table above represents the actual expenses incurred during the six-month period. |
| | |
| M-62 | | MainStay VP Common Stock Portfolio |
Industry Composition as of December 31, 2012 (Unaudited)
| | | | |
| Oil, Gas & Consumable Fuels | | | 9.3 | % |
| Insurance | | | 5.7 | |
| Pharmaceuticals | | | 5.4 | |
| Computers & Peripherals | | | 5.3 | |
| Software | | | 4.5 | |
| IT Services | | | 4.4 | |
| Specialty Retail | | | 4.0 | |
| Food & Staples Retailing | | | 3.8 | |
| Media | | | 3.7 | |
| Diversified Telecommunication Services | | | 3.4 | |
| Diversified Financial Services | | | 3.2 | |
| Beverages | | | 3.1 | |
| Biotechnology | | | 3.1 | |
| Food Products | | | 3.1 | |
| Internet Software & Services | | | 3.0 | |
| Health Care Providers & Services | | | 2.6 | |
| Communications Equipment | | | 2.4 | |
| Health Care Equipment & Supplies | | | 2.3 | |
| Aerospace & Defense | | | 2.1 | |
| Industrial Conglomerates | | | 2.1 | |
| Hotels, Restaurants & Leisure | | | 1.7 | |
| Capital Markets | | | 1.6 | |
| Chemicals | | | 1.6 | |
| Household Products | | | 1.6 | |
| Consumer Finance | | | 1.4 | |
| Commercial Services & Supplies | | | 1.3 | |
| Household Durables | | | 1.3 | |
| | | | |
| Energy Equipment & Services | | | 1.1 | % |
| Semiconductors & Semiconductor Equipment | | | 1.1 | |
| Commercial Banks | | | 1.0 | |
| Machinery | | | 0.9 | |
| Road & Rail | | | 0.9 | |
| Independent Power Producers & Energy Traders | | | 0.8 | |
| Tobacco | | | 0.8 | |
| Air Freight & Logistics | | | 0.7 | |
| Internet & Catalog Retail | | | 0.7 | |
| Auto Components | | | 0.6 | |
| Textiles, Apparel & Luxury Goods | | | 0.6 | |
| Wireless Telecommunication Services | | | 0.6 | |
| Airlines | | | 0.5 | |
| Exchange Traded Funds | | | 0.5 | |
| Multiline Retail | | | 0.5 | |
| Real Estate Investment Trusts | | | 0.5 | |
| Multi-Utilities | | | 0.4 | |
| Electric Utilities | | | 0.3 | |
| Electrical Equipment | | | 0.2 | |
| Paper & Forest Products | | | 0.2 | |
| Diversified Consumer Services | | | 0.1 | |
| Electronic Equipment & Instruments | | | 0.0 | ‡ |
| Professional Services | | | 0.0 | ‡ |
| Thrifts & Mortgage Finance | | | 0.0 | ‡ |
| Other Assets, Less Liabilities | | | 0.0 | ‡ |
| | | | |
| | | 100.0 | % |
| | | | |
See Portfolio of Investments beginning on page M-66 for specific holdings within these categories.
| ‡ | Less than one-tenth of a percent. |
Top Ten Holdings as of December 31, 2012 (excluding short-term investment) (Unaudited)
| 4. | International Business Machines Corp. |
| | | | |
| mainstayinvestments.com | | | M-63 | |
Portfolio Management Discussion and Analysis (Unaudited)
Answers to the questions reflect the views of portfolio managers Harvey J. Fram, CFA, and Migene Kim, CFA, of Madison Square Investors LLC,1 the Portfolio’s Subadvisor.
How did MainStay VP Common Stock Portfolio perform relative to its peers and its benchmarks during the reporting period?
For the 12 months ended December 31, 2012, MainStay VP Common Stock Portfolio returned 16.72% for Initial Class shares and 16.43% for Service Class shares. Over the same period, both share classes outperformed the 15.02% return of the average Lipper2 Variable Products Large-Cap Core Portfolio and the 16.00% return of the S&P 500® Index1 for the 12 months ended December 31, 2012. The S&P 500® Index is the Portfolio’s broad-based securities-market index. Over the same period, both share classes outperformed the 16.42% return of the Russell 1000® Index,2 which is the secondary benchmark of the Portfolio.
What factors affected the Portfolio’s relative performance during the reporting period?
In 2012, stock market performance was affected by concerns about Europe, the fiscal cliff, stubbornly slow (though positive) economic growth in the United States and slowing growth in China. The most important factor that affected the relative performance of the Portfolio, however, was the remarkably low valuation levels at which many stocks started the year. By year-end, almost all of them had not only survived but had seen their multiples expand. The best example of this was in the energy sector, where refinery stocks were particularly strong contributors. (Contributions take weightings and total returns into account.) The turnaround in the housing market also affected relative performance. The price of PulteGroup shares almost tripled, and the Portfolio held an overweight position in the stock.
Which sectors were the strongest positive contributors to the Portfolio’s relative performance, and which sectors were particularly weak?
Relative to the S&P 500® Index, the energy, health care and consumer discretionary sectors made the strongest positive contributions to the Portfolio’s excess returns. Energy was by far the strongest positive contributor, as refinery stocks such as Marathon Petroleum and HollyFrontier outperformed after starting the year at extremely attractive valuations. In health care, the Portfolio benefited from overweight positions in an array of individual stocks, each of which
outperformed for company-specific reasons. Examples included biotechnology company Gilead Sciences and sleep specialist ResMed. Home construction stocks such as PulteGroup led the consumer discretionary sector.
Industrials, financials and information technology were the sectors that detracted the most from the Portfolio’s relative performance. Unfavorable stock selection in industrials hurt performance. The financials sector performed well ahead of the S&P 500® Index, and our stock selection was strong. Unfortunately, the Portfolio held an underweight position in the sector, which detracted from relative performance. Information technology, an overweight sector relative to the S&P 500® Index, detracted from performance. During the reporting period, stocks such as semiconductor maker Nvidia, in which the Portfolio held an overweight position, performed poorly.
During the reporting period, which individual stocks made the strongest positive contributions to the Portfolio’s absolute performance, and which stocks detracted the most?
The strongest individual positive contributions to
the Portfolio’s absolute performance came from computers & peripherals company Apple, diversified financial services company Bank of America and media company Comcast. All three stocks were heavily weighted in the S&P 500® Index, with Apple the most heavily weighted of the three. The Portfolio held overweight positions in each of these stocks. Apple rose strongly in the first three quarters of the year on excitement about the company’s products and market share. The price of Bank of America shares more than doubled for the year, as much of the uncertainty about the company’s mortgage-related problems dissipated. Comcast performed strongly as the company’s investment in NBC resulted in strong earnings growth.
Negative absolute performers included semiconductor companies Intel and Advanced Micro Devices. Neither of these companies has participated much in the smartphone boom, and both have been hurt as tablet computers have eroded sales of traditional PCs. Prudential Financial underperformed in relation to most other financial stocks.
| 1. | Effective on or about January 25, 2013, Madison Square Investors LLC changed its name to Cornerstone Capital Management Holdings LLC. |
| 2. | Please refer to pages M-2 and M-3 for additional explanations and disclosure regarding the Portfolios, their benchmark indices and service providers mentioned in the reports. |
| | |
| M-64 | | MainStay VP Common Stock Portfolio |
Did the Portfolio make any significant purchases or sales during the reporting period?
Among the Portfolio positions that we reduced during 2012 were tobacco company Philip Morris International and health maintenance organization United- Health Group. UnitedHealth scores poorly on our main measure of earnings quality. In our view, Philip Morris became relatively expensive, especially after the 2011 run-up in stocks with high dividend yields.
Among the Portfolio positions we increased during 2012 were insurance company American International Group (AIG) and pharmaceutical giant Bristol-Myers Squibb. AIG has been buying back shares as the U.S. government has sold its stake in the company, and we believe that Bristol-Myers Squibb is attractively valued, especially compared to other major pharmaceutical stocks.
How did the Portfolio’s sector weightings change during the reporting period?
We increased the Portfolio’s relative weight in the consumer staples and telecommunication services sectors. In consumer staples, we believed that many food products companies had reached better-than-usual values because of rising input prices. An example
of this would be corn. In telecommunication services, we increased the Portfolio’s positions in Sprint and AT&T.
The Portfolio saw decreases in its relative weight in the energy and information technology sectors. In energy, we sold stocks in the energy equipment & services industry and in oil, gas & consumable fuels. Within information technology, we mainly lowered exposure to PC-related companies.
How was the Portfolio positioned at the end of the reporting period?
As of December 31, 2012, the Portfolio’s most substantially overweight sectors were consumer discretionary and consumer staples. In consumer discretionary, the most substantially overweight industries were specialty retail and household durables. In consumer staples, the most substantially overweight industries were food products and food & staples retailing.
As of the same date, the sectors that were most substantially underweight were financials and utilities. In financials, the Portfolio was underweight commercial banks and real estate investment trusts (REITs).
The opinions expressed are those of the portfolio managers as of the date of this report and are subject to change. There is no guarantee that any forecasts made will come to pass. This material does not constitute investment advice and is not intended as an endorsement of any specific investment.
Not all MainStay VP Portfolios and/or share classes are available under all policies.
| | | | |
| mainstayinvestments.com | | | M-65 | |
Portfolio of Investments December 31, 2012
| | | | | | | | |
| | |
Shares | | | Value | |
| | | | | | | |
| Common Stocks 99.5%† | |
Aerospace & Defense 2.1% | |
Boeing Co. (The) | | | 22,694 | | | $ | 1,710,220 | |
General Dynamics Corp. | | | 14,155 | | | | 980,517 | |
Honeywell International, Inc. | | | 461 | | | | 29,260 | |
Lockheed Martin Corp. | | | 17,098 | | | | 1,577,974 | |
Northrop Grumman Corp. | | | 23,223 | | | | 1,569,410 | |
United Technologies Corp. | | | 64,300 | | | | 5,273,243 | |
| | | | | | | | |
| | | | | | | 11,140,624 | |
| | | | | | | | |
Air Freight & Logistics 0.7% | |
United Parcel Service, Inc. Class B | | | 48,631 | | | | 3,585,564 | |
| | | | | | | | |
|
Airlines 0.5% | |
Alaska Air Group, Inc. (a) | | | 26,705 | | | | 1,150,718 | |
Southwest Airlines Co. | | | 151,933 | | | | 1,555,794 | |
| | | | | | | | |
| | | | | | | 2,706,512 | |
| | | | | | | | |
Auto Components 0.6% | |
Delphi Automotive PLC (a) | | | 18,370 | | | | 702,653 | |
Goodyear Tire & Rubber Co. (The) (a) | | | 199,477 | | | | 2,754,777 | |
| | | | | | | | |
| | | | | | | 3,457,430 | |
| | | | | | | | |
Beverages 3.1% | |
Coca-Cola Co. (The) | | | 218,293 | | | | 7,913,121 | |
Constellation Brands, Inc. Class A (a) | | | 73,464 | | | | 2,599,891 | |
PepsiCo., Inc. | | | 85,380 | | | | 5,842,554 | |
| | | | | | | | |
| | | | | | | 16,355,566 | |
| | | | | | | | |
Biotechnology 3.1% | |
Amgen, Inc. | | | 58,947 | | | | 5,088,305 | |
Biogen Idec, Inc. (a) | | | 14,236 | | | | 2,087,994 | |
Celgene Corp. (a) | | | 39,180 | | | | 3,084,250 | |
Gilead Sciences, Inc. (a) | | | 62,877 | | | | 4,618,316 | |
Vertex Pharmaceuticals, Inc. (a) | | | 32,065 | | | | 1,344,806 | |
| | | | | | | | |
| | | | | | | 16,223,671 | |
| | | | | | | | |
Capital Markets 1.6% | |
Bank of New York Mellon Corp. (The) | | | 95,781 | | | | 2,461,572 | |
BlackRock, Inc. | | | 2,337 | | | | 483,081 | |
Charles Schwab Corp. (The) | | | 95,796 | | | | 1,375,630 | |
Franklin Resources, Inc. | | | 627 | | | | 78,814 | |
Northern Trust Corp. | | | 33,003 | | | | 1,655,430 | |
State Street Corp. | | | 45,084 | | | | 2,119,399 | |
Waddell & Reed Financial, Inc. Class A | | | 7,502 | | | | 261,220 | |
| | | | | | | | |
| | | | | | | 8,435,146 | |
| | | | | | | | |
Chemicals 1.6% | |
CF Industries Holdings, Inc. | | | 8,341 | | | | 1,694,557 | |
LyondellBasell Industries, N.V., Class A | | | 60,173 | | | | 3,435,277 | |
Mosaic Co. (The) | | | 1,717 | | | | 97,234 | |
PPG Industries, Inc. | | | 24,737 | | | | 3,348,153 | |
| | | | | | | | |
| | | | | | | 8,575,221 | |
| | | | | | | | |
| | | | | | | | |
| | |
Shares | | | Value | |
| | | | | | | |
Commercial Banks 1.0% | |
KeyCorp | | | 51,754 | | | $ | 435,769 | |
PNC Financial Services Group, Inc. | | | 6,561 | | | | 382,572 | |
U.S. Bancorp | | | 5,479 | | | | 174,999 | |
Wells Fargo & Co. | | | 133,486 | | | | 4,562,551 | |
| | | | | | | | |
| | | | | | | 5,555,891 | |
| | | | | | | | |
Commercial Services & Supplies 1.3% | |
ADT Corp. (The) | | | 35,157 | | | | 1,634,449 | |
Avery Dennison Corp. | | | 72,974 | | | | 2,548,252 | |
Iron Mountain, Inc. | | | 14,057 | | | | 436,470 | |
Tyco International, Ltd. | | | 73,172 | | | | 2,140,281 | |
| | | | | | | | |
| | | | | | | 6,759,452 | |
| | | | | | | | |
Communications Equipment 2.4% | |
Cisco Systems, Inc. | | | 281,048 | | | | 5,522,593 | |
Harris Corp. | | | 53,731 | | | | 2,630,670 | |
QUALCOMM, Inc. | | | 32,757 | | | | 2,031,589 | |
Riverbed Technology, Inc. (a) | | | 133,447 | | | | 2,631,575 | |
| | | | | | | | |
| | | | | | | 12,816,427 | |
| | | | | | | | |
Computers & Peripherals 5.3% | |
¨Apple, Inc. | | | 40,053 | | | | 21,349,451 | |
EMC Corp. (a) | | | 94,208 | | | | 2,383,462 | |
NetApp, Inc. (a) | | | 51,587 | | | | 1,730,744 | |
Seagate Technology PLC | | | 55,571 | | | | 1,693,804 | |
Western Digital Corp. | | | 18,522 | | | | 787,000 | |
| | | | | | | | |
| | | | | | | 27,944,461 | |
| | | | | | | | |
Consumer Finance 1.4% | |
American Express Co. | | | 77,422 | | | | 4,450,216 | |
Discover Financial Services | | | 80,203 | | | | 3,091,826 | |
| | | | | | | | |
| | | | | | | 7,542,042 | |
| | | | | | | | |
Diversified Consumer Services 0.1% | |
Service Corp. International | | | 38,306 | | | | 529,006 | |
| | | | | | | | |
|
Diversified Financial Services 3.2% | |
Bank of America Corp. | | | 558,061 | | | | 6,473,508 | |
Citigroup, Inc. | | | 59,250 | | | | 2,343,930 | |
¨JPMorgan Chase & Co. | | | 185,185 | | | | 8,142,584 | |
| | | | | | | | |
| | | | | | | 16,960,022 | |
| | | | | | | | |
Diversified Telecommunication Services 3.4% | |
¨AT&T, Inc. | | | 306,620 | | | | 10,336,160 | |
Frontier Communications Corp. | | | 130,408 | | | | 558,147 | |
Verizon Communications, Inc. | | | 172,282 | | | | 7,454,642 | |
| | | | | | | | |
| | | | | | | 18,348,949 | |
| | | | | | | | |
Electric Utilities 0.3% | |
American Electric Power Co., Inc. | | | 1,456 | | | | 62,142 | |
Edison International | | | 1,624 | | | | 73,389 | |
| † | Percentages indicated are based on Portfolio net assets. |
| ¨ | | Among the Portfolio’s 10 largest holdings, as of December 31, 2012, excluding short-term investment. May be subject to change daily. |
| | | | |
| M-66 | | MainStay VP Common Stock Portfolio | | The notes to the financial statements are an integral part of,
and should be read in conjunction with, the financial statements. |
| | | | | | | | |
| | |
Shares | | | Value | |
| | | | | | | |
| Common Stocks (continued) | |
Electric Utilities (continued) | |
Exelon Corp. | | | 1,960 | | | $ | 58,290 | |
Southern Co. (The) | | | 32,510 | | | | 1,391,753 | |
| | | | | | | | |
| | | | | | | 1,585,574 | |
| | | | | | | | |
Electrical Equipment 0.2% | |
Eaton Corp. PLC | | | 4,382 | | | | 237,504 | |
Emerson Electric Co. | | | 10,712 | | | | 567,308 | |
| | | | | | | | |
| | | | | | | 804,812 | |
| | | | | | | | |
Electronic Equipment & Instruments 0.0%‡ | |
Jabil Circuit, Inc. | | | 4,020 | | | | 77,546 | |
| | | | | | | | |
|
Energy Equipment & Services 1.1% | |
Diamond Offshore Drilling, Inc. | | | 20,323 | | | | 1,381,151 | |
Helmerich & Payne, Inc. | | | 48,346 | | | | 2,707,859 | |
Schlumberger, Ltd. | | | 22,099 | | | | 1,531,240 | |
| | | | | | | | |
| | | | | | | 5,620,250 | |
| | | | | | | | |
Food & Staples Retailing 3.8% | |
Costco Wholesale Corp. | | | 22,092 | | | | 2,182,027 | |
CVS Caremark Corp. | | | 85,000 | | | | 4,109,750 | |
Kroger Co. (The) | | | 103,849 | | | | 2,702,151 | |
Safeway, Inc. | | | 32,981 | | | | 596,626 | |
Wal-Mart Stores, Inc. | | | 103,517 | | | | 7,062,965 | |
Walgreen Co. | | | 103,267 | | | | 3,821,912 | |
| | | | | | | | |
| | | | | | | 20,475,431 | |
| | | | | | | | |
Food Products 3.1% | |
Dean Foods Co. (a) | | | 149,836 | | | | 2,473,792 | |
Hillshire Brands Co. | | | 58,118 | | | | 1,635,441 | |
Ingredion, Inc. | | | 39,986 | | | | 2,576,298 | |
Kraft Foods Group, Inc. | | | 29,454 | | | | 1,339,273 | |
Mondelez International, Inc. Class A | | | 149,146 | | | | 3,798,749 | |
Smithfield Foods, Inc. (a) | | | 97,869 | | | | 2,111,034 | |
Tyson Foods, Inc. Class A | | | 133,523 | | | | 2,590,346 | |
| | | | | | | | |
| | | | | | | 16,524,933 | |
| | | | | | | | |
Health Care Equipment & Supplies 2.3% | |
Abbott Laboratories | | | 81,479 | | | | 5,336,875 | |
Boston Scientific Corp. (a) | | | 475,700 | | | | 2,725,761 | |
ResMed, Inc. | | | 30,413 | | | | 1,264,269 | |
St. Jude Medical, Inc. | | | 69,295 | | | | 2,504,321 | |
Zimmer Holdings, Inc. | | | 5,696 | | | | 379,695 | |
| | | | | | | | |
| | | | | | | 12,210,921 | |
| | | | | | | | |
Health Care Providers & Services 2.6% | |
Aetna, Inc. | | | 28,660 | | | | 1,326,958 | |
AmerisourceBergen Corp. | | | 54,331 | | | | 2,346,012 | |
Cigna Corp. | | | 13,133 | | | | 702,090 | |
Community Health Systems, Inc. | | | 82,454 | | | | 2,534,636 | |
Coventry Health Care, Inc. | | | 5,507 | | | | 246,879 | |
Express Scripts Holding Co. (a) | | | 5,285 | | | | 285,390 | |
McKesson Corp. | | | 34,415 | | | | 3,336,878 | |
| | | | | | | | |
| | |
Shares | | | Value | |
| | | | | | | |
Health Care Providers & Services (continued) | |
Omnicare, Inc. | | | 42,906 | | | $ | 1,548,907 | |
UnitedHealth Group, Inc. | | | 3,882 | | | | 210,560 | |
WellPoint, Inc. | | | 21,736 | | | | 1,324,157 | |
| | | | | | | | |
| | | | | | | 13,862,467 | |
| | | | | | | | |
Hotels, Restaurants & Leisure 1.7% | |
Darden Restaurants, Inc. | | | 38,757 | | | | 1,746,778 | |
International Game Technology | | | 140,269 | | | | 1,987,612 | |
McDonald’s Corp. | | | 14,862 | | | | 1,310,977 | |
Starwood Hotels & Resorts Worldwide, Inc. | | | 6,707 | | | | 384,713 | |
Wyndham Worldwide Corp. | | | 37,180 | | | | 1,978,348 | |
Wynn Resorts, Ltd. | | | 16,532 | | | | 1,859,685 | |
| | | | | | | | |
| | | | | | | 9,268,113 | |
| | | | | | | | |
Household Durables 1.3% | |
Jarden Corp. (a) | | | 14,251 | | | | 736,777 | |
Leggett & Platt, Inc. | | | 65,127 | | | | 1,772,757 | |
PulteGroup, Inc. (a) | | | 149,721 | | | | 2,718,933 | |
Whirlpool Corp. | | | 15,845 | | | | 1,612,229 | |
| | | | | | | | |
| | | | | | | 6,840,696 | |
| | | | | | | | |
Household Products 1.6% | |
Energizer Holdings, Inc. | | | 32,421 | | | | 2,593,031 | |
Procter & Gamble Co. (The) | | | 85,666 | | | | 5,815,865 | |
| | | | | | | | |
| | | | | | | 8,408,896 | |
| | | | | | | | |
Independent Power Producers & Energy Traders 0.8% | |
AES Corp. (The) | | | 192,002 | | | | 2,054,421 | |
NRG Energy, Inc. | | | 94,302 | | | | 2,168,003 | |
| | | | | | | | |
| | | | | | | 4,222,424 | |
| | | | | | | | |
Industrial Conglomerates 2.1% | |
3M Co. | | | 14,480 | | | | 1,344,468 | |
Danaher Corp. | | | 1,641 | | | | 91,732 | |
¨General Electric Co. | | | 459,048 | | | | 9,635,417 | |
| | | | | | | | |
| | | | | | | 11,071,617 | |
| | | | | | | | |
Insurance 5.7% | |
Aflac, Inc. | | | 64,368 | | | | 3,419,228 | |
Allstate Corp. (The) | | | 78,365 | | | | 3,147,922 | |
American International Group, Inc. (a) | | | 89,448 | | | | 3,157,514 | |
Assurant, Inc. | | | 37,164 | | | | 1,289,591 | |
Berkshire Hathaway, Inc. Class B (a) | | | 49,175 | | | | 4,410,998 | |
Chubb Corp. (The) | | | 41,829 | | | | 3,150,560 | |
Everest Re Group, Ltd. | | | 5,912 | | | | 650,024 | |
Fidelity National Financial, Inc. Class A | | | 109,130 | | | | 2,570,012 | |
Hartford Financial Services Group, Inc. (The) | | | 58,427 | | | | 1,311,102 | |
MetLife, Inc. | | | 56,251 | | | | 1,852,908 | |
Prudential Financial, Inc. | | | 37,452 | | | | 1,997,315 | |
Travelers Cos., Inc. (The) | | | 48,920 | | | | 3,513,434 | |
| | | | | | | | |
| | | | | | | 30,470,608 | |
| | | | | | | | |
| | | | | | |
The notes to the financial statements are an integral part of,
and should be read in conjunction with, the financial statements. | | mainstayinvestments.com | | | M-67 | |
Portfolio of Investments December 31, 2012 (continued)
| | | | | | | | |
| | |
Shares | | | Value | |
| | | | | | | |
| Common Stocks (continued) | |
Internet & Catalog Retail 0.7% | |
Amazon.com, Inc. (a) | | | 5,285 | | | $ | 1,327,275 | |
Expedia, Inc. | | | 23,412 | | | | 1,438,667 | |
Priceline.com, Inc. (a) | | | 1,885 | | | | 1,170,962 | |
| | | | | | | | |
| | | | | | | 3,936,904 | |
| | | | | | | | |
Internet Software & Services 3.0% | |
Akamai Technologies, Inc. (a) | | | 14,671 | | | | 600,191 | |
AOL, Inc. (a) | | | 17,253 | | | | 510,861 | |
eBay, Inc. (a) | | | 676 | | | | 34,489 | |
¨Google, Inc. Class A (a) | | | 14,107 | | | | 10,007,083 | |
VeriSign, Inc. (a) | | | 66,039 | | | | 2,563,634 | |
Yahoo!, Inc. (a) | | | 122,824 | | | | 2,444,198 | |
| | | | | | | | |
| | | | | | | 16,160,456 | |
| | | | | | | | |
IT Services 4.4% | |
Accenture PLC Class A | | | 61,585 | | | | 4,095,403 | |
Broadridge Financial Solutions, Inc. | | | 41,799 | | | | 956,361 | |
Computer Sciences Corp. | | | 37,134 | | | | 1,487,217 | |
Fidelity National Information Services, Inc. | | | 22,877 | | | | 796,348 | |
Global Payments, Inc. | | | 14,213 | | | | 643,849 | |
¨International Business Machines Corp. | | | 56,491 | | | | 10,820,851 | |
Jack Henry & Associates, Inc. | | | 26,458 | | | | 1,038,741 | |
NeuStar, Inc. Class A (a) | | | 61,374 | | | | 2,573,412 | |
Total System Services, Inc. | | | 93 | | | | 1,992 | |
Visa, Inc. Class A | | | 5,812 | | | | 880,983 | |
| | | | | | | | |
| | | | | | | 23,295,157 | |
| | | | | | | | |
Machinery 0.9% | |
Caterpillar, Inc. | | | 58 | | | | 5,196 | |
Gardner Denver, Inc. | | | 18,247 | | | | 1,249,919 | |
Illinois Tool Works, Inc. | | | 796 | | | | 48,405 | |
Ingersoll-Rand PLC | | | 42,546 | | | | 2,040,506 | |
Parker Hannifin Corp. | | | 2,945 | | | | 250,502 | |
Terex Corp. (a) | | | 46,117 | | | | 1,296,349 | |
Timken Co. | | | 912 | | | | 43,621 | |
| | | | | | | | |
| | | | | | | 4,934,498 | |
| | | | | | | | |
Media 3.7% | |
Cablevision Systems Corp. Class A | | | 170,728 | | | | 2,550,676 | |
Cinemark Holdings, Inc. | | | 46,772 | | | | 1,215,137 | |
Comcast Corp. Class A | | | 174,032 | | | | 6,505,316 | |
DIRECTV (a) | | | 71,674 | | | | 3,595,168 | |
Gannett Co., Inc. | | | 141,418 | | | | 2,546,938 | |
Interpublic Group of Cos., Inc. (The) | | | 748 | | | | 8,243 | |
Time Warner Cable, Inc. | | | 15,978 | | | | 1,552,902 | |
Walt Disney Co. (The) | | | 26,143 | | | | 1,301,660 | |
Washington Post Co. Class B | | | 1,766 | | | | 644,961 | |
| | | | | | | | |
| | | | | | | 19,921,001 | |
| | | | | | | | |
| | | | | | | | |
| | |
Shares | | | Value | |
| | | | | | | |
Multi-Utilities 0.4% | |
DTE Energy Co. | | | 825 | | | $ | 49,541 | |
Public Service Enterprise Group, Inc. | | | 60,021 | | | | 1,836,643 | |
| | | | | | | | |
| | | | | | | 1,886,184 | |
| | | | | | | | |
Multiline Retail 0.5% | |
Kohl’s Corp. | | | 29,910 | | | | 1,285,532 | |
Macy’s, Inc. | | | 36,829 | | | | 1,437,067 | |
| | | | | | | | |
| | | | | | | 2,722,599 | |
| | | | | | | | |
Oil, Gas & Consumable Fuels 9.3% | |
¨Chevron Corp. | | | 103,221 | | | | 11,162,319 | |
ConocoPhillips | | | 91,396 | | | | 5,300,054 | |
¨ExxonMobil Corp. | | | 216,870 | | | | 18,770,098 | |
HollyFrontier Corp. | | | 38,376 | | | | 1,786,403 | |
Marathon Petroleum Corp. | | | 42,351 | | | | 2,668,113 | |
Occidental Petroleum Corp. | | | 16,161 | | | | 1,238,094 | |
Phillips 66 | | | 67,858 | | | | 3,603,260 | |
Tesoro Corp. | | | 61,791 | | | | 2,721,894 | |
Valero Energy Corp. | | | 68,590 | | | | 2,340,291 | |
| | | | | | | | |
| | | | | | | 49,590,526 | |
| | | | | | | | |
Paper & Forest Products 0.2% | |
Domtar Corp. | | | 13,214 | | | | 1,103,633 | |
| | | | | | | | |
|
Pharmaceuticals 5.4% | |
Bristol-Myers Squibb Co. | | | 112,259 | | | | 3,658,521 | |
Eli Lilly & Co. | | | 49,975 | | | | 2,464,767 | |
Forest Laboratories, Inc. (a) | | | 48,851 | | | | 1,725,417 | |
¨Johnson & Johnson | | | 114,643 | | | | 8,036,474 | |
Merck & Co., Inc. | | | 126,970 | | | | 5,198,152 | |
Pfizer, Inc. | | | 313,694 | | | | 7,867,446 | |
| | | | | | | | |
| | | | | | | 28,950,777 | |
| | | | | | | | |
Professional Services 0.0%‡ | |
Robert Half International, Inc. | | | 34 | | | | 1,082 | |
| | | | | | | | |
|
Real Estate Investment Trusts 0.5% | |
American Tower Corp. | | | 32,455 | | | | 2,507,798 | |
| | | | | | | | |
|
Road & Rail 0.9% | |
Union Pacific Corp. | | | 37,559 | | | | 4,721,917 | |
| | | | | | | | |
|
Semiconductors & Semiconductor Equipment 1.1% | |
Intel Corp. | | | 152,627 | | | | 3,148,695 | |
Lam Research Corp. (a) | | | 36,265 | | | | 1,310,254 | |
Micron Technology, Inc. (a) | | | 221,282 | | | | 1,405,141 | |
| | | | | | | | |
| | | | | | | 5,864,090 | |
| | | | | | | | |
Software 4.5% | |
BMC Software, Inc. (a) | | | 32,412 | | | | 1,285,460 | |
CA, Inc. | | | 52,791 | | | | 1,160,346 | |
¨Microsoft Corp. | | | 356,777 | | | | 9,536,649 | |
| | | | |
| M-68 | | MainStay VP Common Stock Portfolio | | The notes to the financial statements are an integral part of,
and should be read in conjunction with, the financial statements. |
| | | | | | | | |
| | |
Shares | | | Value | |
| | | | | | | |
| Common Stocks (continued) | |
Software (continued) | |
Oracle Corp. | | | 230,582 | | | $ | 7,682,992 | |
Symantec Corp. (a) | | | 156,147 | | | | 2,937,125 | |
Synopsys, Inc. (a) | | | 34,057 | | | | 1,084,375 | |
| | | | | | | | |
| | | | | | | 23,686,947 | |
| | | | | | | | |
Specialty Retail 4.0% | |
Abercrombie & Fitch Co. Class A | | | 33,004 | | | | 1,583,202 | |
American Eagle Outfitters, Inc. | | | 59,723 | | | | 1,224,919 | |
Chico’s FAS, Inc. | | | 130,062 | | | | 2,400,945 | |
Foot Locker, Inc. | | | 71,884 | | | | 2,308,914 | |
GameStop Corp. Class A | | | 50,857 | | | | 1,276,002 | |
Gap, Inc. (The) | | | 48,147 | | | | 1,494,483 | |
Home Depot, Inc. (The) | | | 24,741 | | | | 1,530,231 | |
Lowe’s Cos., Inc. | | | 97,023 | | | | 3,446,257 | |
O’Reilly Automotive, Inc. (a) | | | 30,813 | | | | 2,755,298 | |
PetSmart, Inc. | | | 37,354 | | | | 2,552,772 | |
TJX Cos., Inc. | | | 11,258 | | | | 477,902 | |
| | | | | | | | |
| | | | | | | 21,050,925 | |
| | | | | | | | |
Textiles, Apparel & Luxury Goods 0.6% | |
Carter’s, Inc. (a) | | | 23,318 | | | | 1,297,647 | |
Hanesbrands, Inc. (a) | | | 46,508 | | | | 1,665,916 | |
| | | | | | | | |
| | | | | | | 2,963,563 | |
| | | | | | | | |
Thrifts & Mortgage Finance 0.0%‡ | |
Hudson City Bancorp, Inc. | | | 9,947 | | | | 80,869 | |
| | | | | | | | |
|
Tobacco 0.8% | |
Altria Group, Inc. | | | 11,241 | | | | 353,192 | |
Philip Morris International, Inc. | | | 44,727 | | | | 3,740,967 | |
| | | | | | | | |
| | | | | | | 4,094,159 | |
| | | | | | | | |
| | | | | | | | |
| | |
Shares | | | Value | |
| | | | | | | |
Wireless Telecommunication Services 0.6% | |
MetroPCS Communications, Inc. (a) | | | 127,909 | | | $ | 1,271,415 | |
Sprint Nextel Corp. (a) | | | 334,203 | | | | 1,894,931 | |
| | | | | | | | |
| | | | | | | 3,166,346 | |
| | | | | | | | |
Total Common Stocks
(Cost $456,844,938) | | | | | | | 529,019,703 | |
| | | | | | | | |
| | |
| | | | | | | | |
| Exchange Traded Fund 0.5% (b) | |
S&P 500 Index—SPDR Trust Series 1 | | | 18,463 | | | | 2,631,347 | |
| | | | | | | | |
Total Exchange Traded Fund
(Cost $2,596,432) | | | | | | | 2,631,347 | |
| | | | | | | | |
Total Investments
(Cost $459,441,370) (c) | | | 100.0 | % | | | 531,651,050 | |
Other Assets, Less Liabilities | | | 0.0 | ‡ | | | 2,062 | |
Net Assets | | | 100.0 | % | | $ | 531,653,112 | |
| ‡ | Less than one-tenth of a percent. |
| (a) | Non-income producing security. |
| (b) | Exchange Traded Fund—An investment vehicle that represents a basket of securities that is traded on an exchange. |
| (c) | As of December 31, 2012, cost is $466,453,789 for federal income tax purposes and net unrealized appreciation is as follows: |
| | | | |
Gross unrealized appreciation | | $ | 68,432,865 | |
Gross unrealized depreciation | | | (3,235,604 | ) |
| | | | |
Net unrealized appreciation | | $ | 65,197,261 | |
| | | | |
The following abbreviation is used in the above portfolio:
SPDR—Standard & Poor’s Depositary Receipt
The following is a summary of the fair valuations according to the inputs used as of December 31, 2012, for valuing the Portfolio’s assets.
Asset Valuation Inputs
| | | | | | | | | | | | | | | | |
Description | | Quoted Prices
in Active Markets
for Identical Assets (Level 1) | | | Significant Other
Observable Inputs
(Level 2) | | | Significant
Unobservable
Inputs
(Level 3) | | | Total | |
| Investments in Securities (a) | | | | | | | | | | | | | | | | |
| Common Stocks | | $ | 529,019,703 | | | $ | — | | | $ | — | | | $ | 529,019,703 | |
| Exchange Traded Fund | | | 2,631,347 | | | | — | | | | — | | | | 2,631,347 | |
| | | | | | | | | | | | | | | | |
| Total Investments in Securities | | $ | 531,651,050 | | | $ | — | | | $ | — | | | $ | 531,651,050 | |
| | | | | | | | | | | | | | | | |
| (a) | For a complete listing of investments and their industries, see the Portfolio of Investments. |
The Portfolio recognizes transfers between the levels as of the beginning of the period.
For the year ended December 31, 2012, the Portfolio did not have any transfers between Level 1 and Level 2 fair value measurements. (See Note 2)
As of December 31, 2012, the Portfolio did not hold any investments with significant unobservable inputs (Level 3). (See Note 2)
| | | | | | |
The notes to the financial statements are an integral part of,
and should be read in conjunction with, the financial statements. | | mainstayinvestments.com | | | M-69 | |
Statement of Assets and Liabilities as of December 31, 2012
| | | | |
| Assets | |
Investment in securities, at value
(identified cost $459,441,370) | | $ | 531,651,050 | |
Cash | | | 83,248 | |
Receivables: | | | | |
Investment securities sold | | | 47,812,624 | |
Dividends and interest | | | 500,304 | |
Fund shares sold | | | 47,740 | |
Other assets | | | 404 | |
| | | | |
Total assets | | | 580,095,370 | |
| | | | |
|
| Liabilities | |
Payables: | | | | |
Investment securities purchased | | | 47,890,924 | |
Manager (See Note 3) | | | 247,332 | |
Fund shares redeemed | | | 200,099 | |
Shareholder communication | | | 51,158 | |
Professional fees | | | 35,294 | |
NYLIFE Distributors (See Note 3) | | | 12,605 | |
Custodian | | | 4,080 | |
Trustees | | | 766 | |
| | | | |
Total liabilities | | | 48,442,258 | |
| | | | |
Net assets | | $ | 531,653,112 | |
| | | | |
|
| Net Assets Consist of | |
Shares of beneficial interest outstanding (par value of $.001 per share) unlimited number of shares authorized | | $ | 28,909 | |
Additional paid-in capital | | | 600,324,766 | |
| | | | |
| | | 600,353,675 | |
Undistributed net investment income | | | 9,226,345 | |
Accumulated net realized gain (loss) on investments | | | (150,136,588 | ) |
Net unrealized appreciation (depreciation) on investments | | | 72,209,680 | |
| | | | |
Net assets | | $ | 531,653,112 | |
| | | | |
| | | | |
Initial Class | | | | |
Net assets applicable to outstanding shares | | $ | 472,324,235 | |
| | | | |
Shares of beneficial interest outstanding | | | 25,669,217 | |
| | | | |
Net asset value per share outstanding | | $ | 18.40 | |
| | | | |
Service Class | | | | |
Net assets applicable to outstanding shares | | $ | 59,328,877 | |
| | | | |
Shares of beneficial interest outstanding | | | 3,240,187 | |
| | | | |
Net asset value per share outstanding | | $ | 18.31 | |
| | | | |
| | | | |
| M-70 | | MainStay VP Common Stock Portfolio | | The notes to the financial statements are an integral part of,
and should be read in conjunction with, the financial statements. |
Statement of Operations for the year ended December 31, 2012
| | | | |
| Investment Income (Loss) | |
Income | | | | |
Dividends (a) | | $ | 12,575,752 | |
Interest | | | 1,290 | |
| | | | |
Total income | | | 12,577,042 | |
| | | | |
Expenses | | | | |
Manager (See Note 3) | | | 2,892,626 | |
Distribution and service—Service Class (See Note 3) | | | 148,998 | |
Shareholder communication | | | 99,047 | |
Professional fees | | | 61,043 | |
Custodian | | | 27,525 | |
Trustees | | | 14,204 | |
Miscellaneous | | | 18,798 | |
| | | | |
Total expenses | | | 3,262,241 | |
| | | | |
Net investment income (loss) | | | 9,314,801 | |
| | | | |
|
| Realized and Unrealized Gain (Loss) on Investments | |
Net realized gain (loss) on investments | | | 39,816,997 | |
Net change in unrealized appreciation (depreciation) on investments | | | 31,716,272 | |
| | | | |
Net realized and unrealized gain (loss) on investments | | | 71,533,269 | |
| | | | |
Net increase (decrease) in net assets resulting from operations | | $ | 80,848,070 | |
| | | | |
| (a) | Dividends recorded net of foreign withholding taxes in the amount of $28,297. |
| | | | | | |
The notes to the financial statements are an integral part of,
and should be read in conjunction with, the financial statements. | | mainstayinvestments.com | | | M-71 | |
Statements of Changes in Net Assets
for the years ended December 31, 2012 and December 31, 2011
| | | | | | | | |
| | | 2012 | | | 2011 | |
| Increase (Decrease) in Net Assets | |
Operations: | | | | | | | | |
Net investment income (loss) | | $ | 9,314,801 | | | $ | 8,471,426 | |
Net realized gain (loss) on investments | | | 39,816,997 | | | | 35,820,919 | |
Net change in unrealized appreciation (depreciation) on investments | | | 31,716,272 | | | | (35,010,452 | ) |
| | | | |
Net increase (decrease) in net assets resulting from operations | | | 80,848,070 | | | | 9,281,893 | |
| | | | |
Dividends to shareholders: | | | | | | | | |
From net investment income: | | | | | | | | |
Initial Class | | | (7,607,005 | ) | | | (7,500,653 | ) |
Service Class | | | (821,937 | ) | | | (759,825 | ) |
| | | | |
Total dividends to shareholders | | | (8,428,942 | ) | | | (8,260,478 | ) |
| | | | |
Capital share transactions: | | | | | | | | |
Net proceeds from sale of shares | | | 21,385,373 | | | | 28,945,141 | |
Net asset value of shares issued to shareholders in reinvestment of dividends | | | 8,428,942 | | | | 8,260,478 | |
Cost of shares redeemed | | | (80,358,416 | ) | | | (168,860,077 | ) |
| | | | |
Increase (decrease) in net assets derived from capital share transactions | | | (50,544,101 | ) | | | (131,654,458 | ) |
| | | | |
Net increase (decrease) in net assets | | | 21,875,027 | | | | (130,633,043 | ) |
|
| Net Assets | |
Beginning of year | | | 509,778,085 | | | | 640,411,128 | |
| | | | |
End of year | | $ | 531,653,112 | | | $ | 509,778,085 | |
| | | | |
Undistributed net investment income at end of year | | $ | 9,226,345 | | | $ | 8,466,799 | |
| | | | |
| | | | |
| M-72 | | MainStay VP Common Stock Portfolio | | The notes to the financial statements are an integral part of,
and should be read in conjunction with, the financial statements. |
Financial Highlights selected per share data and ratios
| | | | | | | | | | | | | | | | | | | | |
| | | Initial Class | |
| | | Year ended December 31, | |
| | | 2012 | | | 2011 | | | 2010 | | | 2009 | | | 2008 | |
Net asset value at beginning of year | | $ | 16.02 | | | $ | 16.04 | | | $ | 14.48 | | | $ | 12.06 | | | $ | 23.60 | |
| | | | | | | | | | | | | | | | | | | | |
Net investment income (loss) | | | 0.32 | (a) | | | 0.25 | (a) | | | 0.20 | (a) | | | 0.21 | (a) | | | 0.22 | |
Net realized and unrealized gain (loss) on investments | | | 2.36 | | | | (0.02 | ) | | | 1.60 | | | | 2.48 | | | | (8.72 | ) |
| | | | | | | | | | | | | | | | | | | | |
Total from investment operations | | | 2.68 | | | | 0.23 | | | | 1.80 | | | | 2.69 | | | | (8.50 | ) |
| | | | | | | | | | | | | | | | | | | | |
Less dividends and distributions: | | | | | | | | | | | | | | | | | | | | |
From net investment income | | | (0.30 | ) | | | (0.25 | ) | | | (0.24 | ) | | | (0.27 | ) | | | (0.30 | ) |
From net realized gain on investments | | | — | | | | — | | | | — | | | | — | | | | (2.74 | ) |
| | | | | | | | | | | | | | | | | | | | |
Total dividends and distributions | | | (0.30 | ) | | | (0.25 | ) | | | (0.24 | ) | | | (0.27 | ) | | | (3.04 | ) |
| | | | | | | | | | | | | | | | | | | | |
Net asset value at end of year | | $ | 18.40 | | | $ | 16.02 | | | $ | 16.04 | | | $ | 14.48 | | | $ | 12.06 | |
| | | | | | | | | | | | | | | | | | | | |
Total investment return | | | 16.72 | % | | | 1.57 | % | | | 12.60 | % | | | 22.40 | % | | | (36.39 | %) |
Ratios (to average net assets)/Supplemental Data: | | | | | | | | | | | | | | | | | | | | |
Net investment income (loss) | | | 1.80 | % | | | 1.45 | % | | | 1.40 | % | | | 1.66 | % | | | 1.44 | % |
Net expenses | | | 0.59 | % | | | 0.59 | % | | | 0.61 | % | | | 0.60 | % | | | 0.56 | % |
Portfolio turnover rate | | | 132 | % | | | 102 | % | | | 107 | % | | | 100 | % | | | 111 | % |
Net assets at end of year (in 000’s) | | $ | 472,324 | | | $ | 452,849 | | | $ | 574,582 | | | $ | 573,296 | | | $ | 585,158 | |
| (a) | Per share data based on average shares outstanding during the year. |
| | | | | | | | | | | | | | | | | | | | |
| | | Service Class | |
| | | Year ended December 31, | |
| | | 2012 | | | 2011 | | | 2010 | | | 2009 | | | 2008 | |
Net asset value at beginning of year | | $ | 15.94 | | | $ | 15.96 | | | $ | 14.41 | | | $ | 12.00 | | | $ | 23.48 | |
| | | | | | | | | | | | | | | | | | | | |
Net investment income (loss) | | | 0.27 | (a) | | | 0.21 | (a) | | | 0.17 | (a) | | | 0.17 | (a) | | | 0.23 | |
Net realized and unrealized gain (loss) on investments | | | 2.35 | | | | (0.02 | ) | | | 1.59 | | | | 2.47 | | | | (8.72 | ) |
| | | | | | | | | | | | | | | | | | | | |
Total from investment operations | | | 2.62 | | | | 0.19 | | | | 1.76 | | | | 2.64 | | | | (8.49 | ) |
| | | | | | | | | | | | | | | | | | | | |
Less dividends and distributions: | | | | | | | | | | | | | | | | | | | | |
From net investment income | | | (0.25 | ) | | | (0.21 | ) | | | (0.21 | ) | | | (0.23 | ) | | | (0.25 | ) |
From net realized gain on investments | | | — | | | | — | | | | — | | | | — | | | | (2.74 | ) |
| | | | | | | | | | | | | | | | | | | | |
Total dividends and distributions | | | (0.25 | ) | | | (0.21 | ) | | | (0.21 | ) | | | (0.23 | ) | | | (2.99 | ) |
| | | | | | | | | | | | | | | | | | | | |
Net asset value at end of year | | $ | 18.31 | | | $ | 15.94 | | | $ | 15.96 | | | $ | 14.41 | | | $ | 12.00 | |
| | | | | | | | | | | | | | | | | | | | |
Total investment return | | | 16.43 | % | | | 1.31 | % | | | 12.32 | % | | | 22.08 | % | | | (36.55 | %) |
Ratios (to average net assets)/Supplemental Data: | | | | | | | | | | | | | | | | | | | | |
Net investment income (loss) | | | 1.54 | % | | | 1.21 | % | | | 1.15 | % | | | 1.39 | % | | | 1.18 | % |
Net expenses | | | 0.84 | % | | | 0.84 | % | | | 0.86 | % | | | 0.85 | % | | | 0.81 | % |
Portfolio turnover rate | | | 132 | % | | | 102 | % | | | 107 | % | | | 100 | % | | | 111 | % |
Net assets at end of year (in 000’s) | | $ | 59,329 | | | $ | 56,929 | | | $ | 65,829 | | | $ | 62,413 | | | $ | 51,434 | |
| (a) | Per share data based on average shares outstanding during the year. |
| | | | | | |
The notes to the financial statements are an integral part of,
and should be read in conjunction with, the financial statements. | | mainstayinvestments.com | | | M-73 | |
MainStay VP Conservative Allocation Portfolio
Investment and Performance Comparison1 (Unaudited)
Performance data quoted represents past performance. Past performance is no guarantee of future results. Because of market volatility, current performance may be lower or higher than the figures shown. Investment return and principal value will fluctuate, and as a result, when shares are redeemed, they may be worth more or less than their original cost. The performance table and graph do not reflect any deduction of sales charges, mortality and expense charges, contract charges, or administrative charges. Please refer to the Performance Summary appropriate for your policy. For performance information current to the most recent month-end, please call 800-598-2019 or visit www.newyorklife.com.
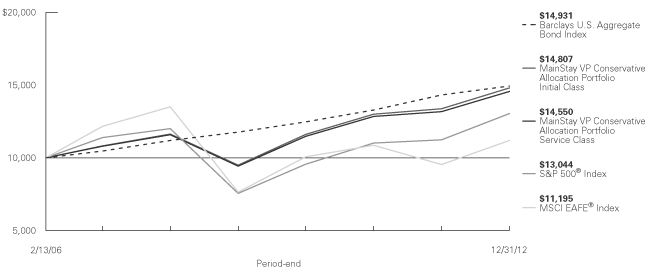
Average Annual Total Returns for the Period Ended December 31, 2012
| | | | | | | | | | | | | | | | |
| Class | | One Year | | | Five Years | | | Since Inception (2/13/06) | | | Gross Expense Ratio2 | |
Initial Class Shares | | | 10.69 | % | | | 4.95 | % | | | 5.86 | % | | | 0.84 | % |
Service Class Shares | | | 10.42 | | | | 4.68 | | | | 5.60 | | | | 1.09 | |
| | | | | | | | | | | | |
| Benchmark Performance | | One
Year | | | Five
Years | | | Since Inception
(2/13/06) | |
S&P 500® Index3 | | | 16.00 | % | | | 1.66 | % | | | 3.93 | % |
MSCI EAFE® Index3 | | | 17.32 | | | | –3.69 | | | | 1.65 | |
Barclays U.S. Aggregate Bond Index3 | | | 4.22 | | | | 5.95 | | | | 5.99 | |
Average Lipper Variable Products Mixed-Asset Target Allocation Conservative Portfolio4 | | | 8.72 | | | | 3.57 | | | | 4.54 | |
| 1. | Performance figures reflect certain fee waivers and/or expense limitations, without which total returns may have been different. For information on current fee waivers and/or expense limitations, please refer to the notes to the financial statements. |
| 2. | The gross expense ratios presented reflect the Portfolio’s “Total Annual Portfolio Operating Expenses” from the most recent Prospectus and may differ from other expense ratios disclosed in this report. |
| 3. | Please refer to pages M-2 and M-3 for additional explanations and disclosure regarding the Portfolios, their benchmark indices and other indices mentioned in the reports. |
| 4. | The Average Lipper Variable Products Mixed-Asset Target Allocation Conservative Portfolio is representative of portfolios that, by portfolio practice, maintain a mix of between 20%–40% equity securities, with the remainder invested in bonds, cash and cash equivalents. Lipper Inc. is an independent monitor of fund performance. Results are based on total returns with all dividend and capital gain distributions reinvested. |
| | |
| M-74 | | MainStay VP Conservative Allocation Portfolio |
Cost in Dollars of a $1,000 Investment in MainStay VP Conservative Allocation Portfolio (Unaudited)
The example below is intended to describe the fees and expenses borne by shareholders during the six-month period from July 1, 2012 to December 31, 2012, and the impact of those costs on your investment.
Example
As a shareholder of the Portfolio, you incur two types of costs: (1) transaction costs, including exchange fees and sales charges (loads) on purchases (as applicable), and (2) ongoing costs, including management fees, distribution and/or service (12b-1) fees, and other Portfolio expenses (as applicable). This example is intended to help you understand your ongoing costs (in dollars) of investing in the Portfolio and to compare these costs with the ongoing costs of investing in other Portfolios. The example is based on an investment of $1,000 made at the beginning of the six-month period and held for the entire period from July 1, 2012, to December 31, 2012. Shares are only sold in connection with variable life and annuity contracts and the example does not reflect any contract level or transactional fees or expenses. If these costs had been included, your costs would have been higher.
This example illustrates your Portfolio’s ongoing costs in two ways:
Actual Expenses
The second and third data columns in the table below provide information about actual account values and actual expenses. You may use the information in these columns, together with the amount you invested, to estimate the expenses that you paid during the six months ended
December 31, 2012. Simply divide your account value by $1,000 (for example, an $8,600 account value divided by $1,000 = 8.6), then multiply the result by the number under the heading entitled ‘‘Expenses Paid During Period’’ to estimate the expenses you paid on your account during this period.
Hypothetical Example for Comparison Purposes
The fourth and fifth data columns in the table below provide information about hypothetical account values and hypothetical expenses based on the Portfolio’s actual expense ratio and an assumed rate of return of 5% per year before expenses, which is not the Portfolio’s actual return. The hypothetical account values and expenses may not be used to estimate the actual ending account balances or expenses you paid for the six-month period shown. You may use this information to compare the ongoing costs of investing in the Portfolio with the ongoing costs of investing in other Portfolios. To do so, compare this 5% hypothetical example with the 5% hypothetical examples that appear in the shareholder reports of the other Portfolios.
Please note that the expenses shown in the table are meant to highlight your ongoing costs only and do not reflect any transactional costs, such as exchange fees or sales charges (loads). Therefore, the fourth and fifth data columns of the table are useful in comparing ongoing costs only and will not help you determine the relative total costs of owning different funds. In addition, if these transactional costs were included, your costs would have been higher.
| | | | | | | | | | | | | | | | | | | | |
| | | | | | | | | | | | | | | | |
| Share Class | | Beginning
Account
Value
7/1/12 | | | Ending Account
Value (Based
on Actual
Returns and
Expenses)
12/31/12 | | | Expenses
Paid
During
Period1 | | | Ending Account
Value (Based
on Hypothetical
5% Annualized
Return and
Actual Expenses)
12/31/12 | | | Expenses
Paid
During
Period1 | |
| | | | | |
| Initial Class Shares | | $ | 1,000.00 | | | $ | 1,051.50 | | | $ | 0.15 | | | $ | 1,025.00 | | | $ | 0.15 | |
| | | | | |
| Service Class Shares | | $ | 1,000.00 | | | $ | 1,050.20 | | | $ | 1.44 | | | $ | 1,023.70 | | | $ | 1.42 | |
| 1. | Expenses are equal to the Portfolio’s annualized expense ratio of each class (0.03% for Initial Class and 0.28% for Service Class) multiplied by the average account value over the period, divided by 366 and multiplied by 184 (to reflect the six-month period). The table above represents the actual expenses incurred during the six-month period. In addition to the fees and expenses which the Portfolio bears directly, the Portfolio indirectly bears a pro rata share of the fees and expenses of the Underlying Portfolios/Funds in which it invests. Such indirect expenses are not included in the above-reported expense figures. |
| | | | |
| mainstayinvestments.com | | | M-75 | |
Investment Objectives of Underlying Portfolios/Funds as of December 31, 2012 (Unaudited)
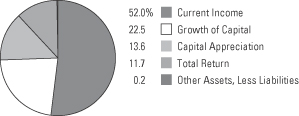
See Portfolio of Investments beginning on page M-80 for specific holdings within these categories.
| | |
| M-76 | | MainStay VP Conservative Allocation Portfolio |
Portfolio Management Discussion and Analysis (Unaudited)
Answers to the questions reflect the views of portfolio managers Jae S. Yoon, CFA, and Jonathan Swaney of New York Life Investments,1 the Portfolio’s Manager.
How did MainStay VP Conservative Allocation Portfolio perform relative to its peers and its benchmarks during the 12 months ended December 31, 2012?
For the 12 months ended December 31, 2012, MainStay VP Conservative Allocation Portfolio returned 10.69% for Initial Class shares and 10.42% for Service Class shares. Over the same period, both share classes outperformed the 8.72% return of the average Lipper2 Variable Products Mixed-Asset Target Allocation Conservative Portfolio and underperformed the 16.00% return of the S&P 500® Index.2 The S&P 500® Index is the Portfolio’s broad-based securities-market index. For the 12 months ended December 31, 2012, both share classes underperformed the 17.32% return of the MSCI EAFE® Index,2 which is the secondary benchmark for the Portfolio. Over the same period, both share classes outperformed the 4.22% return of the Barclays U.S. Aggregate Bond Index,2 which is an additional benchmark for the Portfolio.
What factors affected the Portfolio’s relative performance during the reporting period?
The Portfolio is a “fund of funds” that invests primarily in other MainStay Portfolios and other Funds managed by New York Life Investments (the “Underlying Portfolios/Funds”). The Underlying Portfolios/Funds may invest in fixed-income securities or in domestic or international stocks at various capitalization levels. The Portfolio’s primary benchmark, on the other hand, consists entirely of U.S. large-cap stocks. This difference—particularly the Portfolio’s significant allocation to Underlying Portfolios/Funds that invest in fixed-income securities—accounted for many of the challenges the Portfolio experienced in terms of relative performance compared to the S&P 500® Index.
Our effort to manage the risk posture of the Portfolio by adjusting its mix of stocks and bonds contributed positively to the Portfolio’s relative performance. Within the allocation ranges outlined in the Prospectus, the Portfolio at times adopted a small bias in favor of Underlying Portfolios/Funds that invest in stocks over Underlying Portfolios/Funds that invest in bonds. This bias was used early in the reporting period, early in the summer and near year-end, and
the bias was beneficial each time. Persistent exposure to lower-quality bonds and loans also boosted returns, although efforts to lower the Portfolio’s sensitivity to interest rates by investing in Underlying Portfolios/Funds that held shorter-maturity instruments detracted slightly, as interest rates fell to levels we did not anticipate.
Among the Underlying Portfolios/Funds in which the Portfolio invested, results were mixed. Several fared quite well relative to their respective peers and benchmarks. Among these were MainStay VP Flexible Bond Opportunities Portfolio and MainStay 130/30 International Fund. Other substantial holdings experienced challenges. Among these were MainStay VP Large Cap Growth Portfolio, MainStay Epoch U.S. All
Cap Fund and MainStay VP High Yield Corporate Bond Portfolio. While asset-class positioning generally added to the Portfolio’s returns, some returns among the Underlying Portfolios/Funds detracted moderately from the Portfolio’s relative performance.
How did you allocate the Portfolio’s assets during the reporting period and why?
In managing the Portfolio, we considered a variety of information, including the portfolio-level characteristics of the Underlying Portfolios/Funds, such as capitalization, style biases, sector exposures, credit quality and duration.3 We also examined the attributes of the individual holdings of the Underlying Portfolios/Funds, such as valuation metrics, earnings data and technical indicators. Finally, we evaluated the historical success of the portfolio managers responsible for the Underlying Portfolios/Funds. Generally speaking, we seek to invest in Underlying Portfolios/Funds that occupy attractively valued segments of the market, invest in fairly priced securities and are steered by individuals who have consistently demonstrated capable management in the past.
The Portfolio’s blend of stocks and bonds varied slightly over the course of the reporting period in response to the changing environment. In the equity portion of the Portfolio, we placed a mild emphasis on two themes. First, we viewed Underlying Portfolios/Funds that invest in large-capitalization stocks favorably in relation to Underlying Portfolios/Funds
| 1. | “New York Life Investments” is a service mark used by New York Life Investment Management LLC. |
| 2. | Please refer to pages M-2 and M-3 for additional explanations and disclosure regarding the Portfolios, their benchmark indices and service providers mentioned in the reports. |
| 3. | Duration is a measure of the price sensitivity of a fixed-income investment to changes in interest rates. Duration is expressed as a number of years and is considered a more accurate sensitivity gauge than average maturity. |
| | | | |
| mainstayinvestments.com | | | M-77 | |
that invest in small-cap stocks. We adopted this positioning because we believed that large-cap stocks were more attractively valued, had superior access to capital and were better positioned to benefit from growth in the developing world. Second, we preferred Underlying Portfolios/Funds that invest in U.S. stocks over Underlying Portfolios/Funds that invest in stocks of other developed markets. Both of these position-ing strategies contributed positively to the Portfolio’s returns during the first half of the year, but surrendered their gains in the second half. The result was relatively neutral for the year as a whole.
The fixed-income portion of the Portfolio had a slightly shorter duration than the Barclays U.S. Aggregate Bond Index. We also tilted the Portfolio heavily toward Underlying Portfolios/Funds that invest in corporate bonds over those that invest in government-backed issues. This positioning reflected our view that corporations have improved the quality of their balance sheets significantly in the past few years by reducing leverage, accumulating cash and controlling operating costs. In our opinion, if corporate default rates remain low for the next few years, investors are likely to find the yields available on corporate bonds attractive relative to the yields available on U.S. Treasury instruments. The Portfolio’s credit exposure had a positive influence on relative results, but interest rates have not yet moved in the direction we anticipated.
How did the Portfolio’s allocations change over the course of the reporting period?
In the equity portion of the Portfolio, the primary allocation changes came as several new options were introduced to the pool of eligible investments. We established new positions in MainStay VP T. Rowe Price Equity Income Portfolio and MainStay VP DFA / DuPont Capital Emerging Markets Equity Portfolio, with funding coming from a variety of sources, including selling shares of MainStay ICAP Equity Fund and MainStay Epoch U.S. All Cap Fund. We also materially increased the Portfolio’s holdings of MainStay VP S&P 500® Index Portfolio and MainStay VP Large Cap Growth Portfolio.
As of December 31, 2012, the Portfolio was in the process of exiting positions in certain Underlying Portfolios/Funds that occupy specialized segments of the investable universe. Among these were MainStay Epoch International Small Cap Fund and MainStay VP
Convertible Portfolio. In our opinion, the risk-adjusted return potential of these Underlying Portfolios/Funds has become less compelling than it was in previous periods.
In the fixed-income portion of the Portfolio, we emphasized two general themes. First, we sought to reduce exposure to the lowest-quality credits. This led us to cut the Portfolio’s holdings of MainStay VP Flexible Bond Opportunities Portfolio in half while shifting some of the proceeds into the MainStay VP Bond Portfolio. While we believed that government bonds represented a very poor value proposition, we were also wary of the junk bond market, which we believed had become increasingly speculative. In light of these concerns, we believed that emphasizing the middle of the quality spectrum would be a prudent strategy. Second, we shortened the Portfolio’s duration in an effort to reduce the Portfolio’s sensitivity to a potential rise in interest rates. Our primary tool in this effort was to increase the size of the Portfolio’s position in MainStay VP Floating Rate Portfolio. With the same goal in mind, we also established a position in the new MainStay Short Duration High Yield Fund.
Which Underlying Equity Portfolios/Funds had the highest total returns during the reporting period, and which Underlying Equity Portfolios/Funds had the lowest total returns?
Among the Underlying Equity Portfolios/Funds in which the Portfolio invested, MainStay International Opportunities Fund (formerly MainStay 130/30 International Fund) had the highest return for 2012, followed by MainStay VP International Equity Portfolio and MainStay Epoch International Small Cap Fund. Although all Underlying Equity Portfolios/Funds in which the Portfolio invested generated positive returns for the reporting period, the lowest total returns came from MainStay Epoch U.S. All Cap Fund and MainStay VP U.S. Small Cap Portfolio.
Which Underlying Equity Portfolios/Funds made the strongest positive contributions to the Portfolio’s overall performance, and which Underlying Equity Portfolios/Funds were the greatest detractors?
The most significant contributions to the Portfolio’s equity performance came from MainStay U.S. Opportunities Fund (formerly MainStay 130/30 Core Fund) and MainStay MAP Fund. (Contributions take weightings and total returns into account.) The weakest
| | |
| M-78 | | MainStay VP Conservative Allocation Portfolio |
equity contributions came from MainStay VP Eagle Small Cap Growth Portfolio and MainStay Marketfield Fund. That some positions made only marginal contributions tended to reflect position size and timing as much as the returns of the Underlying Portfolios/Funds.
What factors and risks affected the Portfolio’s Underlying Fixed-Income Portfolio/Fund investments during the reporting period?
Central bank policy played a pivotal role in the fixed-income markets during 2012. Amid slowing global economic growth, distressed European sovereign debt markets and looming fiscal retrenchment in the United States, the Federal Reserve pursued aggressively accommodative policies. The Federal Reserve’s maturity extension program (referred to by some as “Operation Twist”), its loose policy guidance and its additional securities purchases helped keep interest rates suppressed across the entire yield curve.4 These moves proved detrimental to relative performance to the extent that the Portfolio’s duration was shorter than that of the Barclays U.S. Aggregate Bond Index. On the other hand, these same policies helped reduce risk aversion and led to tightening credit spreads5 that benefited the Portfolio on a larger scale.
During the reporting period, which fixed-income market segments were the strongest positive contributors to the Portfolio’s performance and which segments were particularly weak?
Over the course of 2012, high-yield debt generally provided strong results. Over the same period, cash and short-duration bonds issued by the governments of developed nations provided comparatively weak returns.
Which Underlying Fixed-Income Portfolios/Funds made the strongest positive contributions to the Portfolio’s performance, and which Underlying Fixed-Income Portfolios/Funds were the greatest detractors?
The largest contribution to the Portfolio’s fixed-income performance came from a very large position in MainStay VP Bond Portfolio. This was followed by a smaller position in MainStay VP Flexible Bond Opportunities Portfolio. While all of the Underlying Fixed-Income Portfolios/Funds in which the Portfolio invested provided positive total returns for 2012, the smallest contributions came from MainStay VP Cash Management Portfolio followed by a small position in MainStay VP Convertible Portfolio.
| 4. | The yield curve is a line that plots the yields of various securities of similar quality—typically U.S. Treasury issues—across a range of maturities. The U.S. Treasury yield curve serves as a benchmark for other debt and is used in economic forecasting. |
| 5. | The terms “spread” and “yield spread” may refer to the difference in yield between a security or type of security and comparable U.S. Treasury issues. The terms may also refer to the difference in yield between two specific securities or types of securities at a given time. The term “credit spread” usually refers to the yield spread between credit securities and comparable U.S. Treasury securities. |
The opinions expressed are those of the portfolio managers as of the date of this report and are subject to change. There is no guarantee that any forecasts made will come to pass. This material does not constitute investment advice and is not intended as an endorsement of any specific investment.
Not all MainStay VP Portfolios and/or share classes are available under all policies.
| | | | |
| mainstayinvestments.com | | | M-79 | |
Portfolio of Investments December 31, 2012
| | | | | | | | |
| | |
Shares | | | Value | |
| Affiliated Investment Companies 99.8%† | |
Equity Funds 43.8% | | | | | | | | |
MainStay 130/30 Core Fund Class I (a) | | | 6,808,715 | | | $ | 53,380,327 | |
MainStay 130/30 International Fund Class I | | | 1,270,370 | | | | 9,006,926 | |
MainStay Epoch International Small Cap Fund Class I | | | 3,600 | | | | 66,425 | |
MainStay Epoch U.S. All Cap Fund Class I | | | 528,008 | | | | 11,716,488 | |
MainStay ICAP Equity Fund Class I | | | 518,173 | | | | 20,965,276 | |
MainStay ICAP International Fund Class I | | | 218,754 | | | | 6,584,489 | |
MainStay MAP Fund Class I | | | 1,886,636 | | | | 66,673,707 | |
MainStay Marketfield Fund Class I | | | 173,698 | | | | 2,751,369 | |
MainStay VP DFA / DuPont Capital Emerging Markets Equity Portfolio Initial Class (a)(b) | | | 1,356,335 | | | | 13,723,549 | |
MainStay VP Eagle Small Cap Growth Portfolio Initial Class (b) | | | 41,509 | | | | 414,877 | |
MainStay VP ICAP Select Equity Portfolio Initial Class | | | 90,467 | | | | 1,244,582 | |
MainStay VP International Equity Portfolio Initial Class | | | 241,146 | | | | 2,926,784 | |
MainStay VP Large Cap Growth Portfolio Initial Class (a)(b) | | | 3,691,241 | | | | 62,295,646 | |
MainStay VP Mid Cap Core Portfolio Initial Class | | | 1,786 | | | | 21,845 | |
MainStay VP S&P 500 Index Portfolio Initial Class | | | 792,793 | | | | 22,937,076 | |
MainStay VP T. Rowe Price Equity Income Portfolio Initial Class (a)(b) | | | 2,629,488 | | | | 28,365,137 | |
MainStay VP U.S. Small Cap Portfolio Initial Class | | | 26,930 | | | | 270,982 | |
| | | | | | | | |
Total Equity Funds
(Cost $287,586,789) | | | | | | | 303,345,485 | |
| | | | | | | | |
| | |
Fixed Income Funds 56.0% | | | | | | | | |
MainStay High Yield Opportunities Fund Class I | | | 638,844 | | | | 7,749,183 | |
MainStay Intermediate Term Bond Fund Class I | | | 2,392,127 | | | | 26,528,685 | |
MainStay Short Duration High Yield Fund Class I (a) | | | 223,644 | | | | 2,225,259 | |
MainStay VP Bond Portfolio Initial Class (a) | | | 14,069,291 | | | | 207,933,402 | |
MainStay VP Cash Management Portfolio Initial Class | | | 11,385,595 | | | | 11,385,333 | |
MainStay VP Convertible Portfolio Initial Class | | | 93,210 | | | | 1,090,175 | |
MainStay VP Flexible Bond Opportunities Portfolio Initial Class (a) | | | 3,294,099 | | | | 33,982,922 | |
MainStay VP Floating Rate Portfolio Initial Class (a) | | | 8,291,842 | | | | 77,264,932 | |
| | | | | | | | |
| | |
Shares | | | Value | |
Fixed Income Funds (continued) | |
MainStay VP High Yield Corporate Bond Portfolio Initial Class | | | 1,951,078 | | | $ | 19,881,239 | |
| | | | | | | | |
Total Fixed Income Funds
(Cost $384,269,747) | | | | | | | 388,041,130 | |
| | | | | | | | |
Total Investments
(Cost $671,856,536) (c) | | | 99.8 | % | | | 691,386,615 | |
Other Assets, Less Liabilities | | | 0.2 | | | | 1,598,579 | |
Net Assets | | | 100.0 | % | | $ | 692,985,194 | |
| † | Percentages indicated are based on Portfolio net assets. |
| (a) | The Portfolio’s ownership exceeds 5% of the outstanding shares of the Underlying Portfolio’s/Fund’s share class. (See Note 3) |
| (b) | Non-income producing Underlying Portfolio/Fund. |
| (c) | As of December 31, 2012, cost is $672,972,251 for federal income tax purposes and net unrealized appreciation is as follows: |
| | | | |
Gross unrealized appreciation | | $ | 20,587,824 | |
Gross unrealized depreciation | | | (2,173,460 | ) |
| | | | |
Net unrealized appreciation | | $ | 18,414,364 | |
| | | | |
| | | | |
| M-80 | | MainStay VP Conservative Allocation Portfolio | | The notes to the financial statements are an integral part of,
and should be read in conjunction with, the financial statements. |
The following is a summary of the fair valuations according to the inputs used as of December 31, 2012, for valuing the Portfolio’s assets.
Asset Valuation Inputs
| | | | | | | | | | | | | | | | |
Description | | Quoted Prices
in Active Markets
for Identical Assets (Level 1) | | | Significant Other
Observable Inputs
(Level 2) | | | Significant
Unobservable
Inputs
(Level 3) | | | Total | |
| Investments (a) | | | | | | | | | | | | |
| Affiliated Investment Companies | | | | | | | | | | | | | | | | |
Equity Funds | | $ | 303,345,485 | | | $ | — | | | $ | — | | | $ | 303,345,485 | |
Fixed Income Funds | | | 388,041,130 | | | | — | | | | — | | | | 388,041,130 | |
| | | | | | | | | | | | | | | | |
| Total Investments | | $ | 691,386,615 | | | $ | — | | | $ | — | | | $ | 691,386,615 | |
| | | | | | | | | | | | | | | | |
| (a) | For a complete listing of investments, see the Portfolio of Investments. |
The Portfolio recognizes transfers between the levels as of the beginning of the period.
For the year ended December 31, 2012, the Portfolio did not have any transfers between Level 1 and Level 2 fair value measurements. (See Note 2)
As of December 31, 2012, the Portfolio did not hold any investments with significant unobservable inputs (Level 3). (See Note 2)
| | | | | | |
The notes to the financial statements are an integral part of,
and should be read in conjunction with, the financial statements. | | mainstayinvestments.com | | | M-81 | |
Statement of Assets and Liabilities as of December 31, 2012
| | | | |
| Assets | |
Investment in affiliated investment companies, at value (identified cost $671,856,536) | | $ | 691,386,615 | |
Receivables: | | | | |
Fund shares sold | | | 2,348,833 | |
Investment securities sold | | | 1,101,667 | |
Other assets | | | 2,883 | |
| | | | |
Total assets | | | 694,839,998 | |
| | | | |
|
| Liabilities | |
Payables: | | | | |
Investment securities purchased | | | 1,380,475 | |
Fund shares redeemed | | | 251,685 | |
NYLIFE Distributors (See Note 3) | | | 142,242 | |
Shareholder communication | | | 53,849 | |
Professional fees | | | 24,916 | |
Trustees | | | 977 | |
Custodian | | | 660 | |
| | | | |
Total liabilities | | | 1,854,804 | |
| | | | |
Net assets | | $ | 692,985,194 | |
| | | | |
|
| Net Assets Consist of | |
Shares of beneficial interest outstanding (par value of $.001 per share) unlimited number of shares authorized | | $ | 60,055 | |
Additional paid-in capital | | | 659,476,957 | |
| | | | |
| | | 659,537,012 | |
Undistributed net investment income | | | 18,733,977 | |
Accumulated net realized gain (loss) on investments | | | (4,815,874 | ) |
Net unrealized appreciation (depreciation) on investments | | | 19,530,079 | |
| | | | |
Net assets | | $ | 692,985,194 | |
| | | | |
| | | | |
Initial Class | |
Net assets applicable to outstanding shares | | $ | 12,865,930 | |
| | | | |
Shares of beneficial interest outstanding | | | 1,106,981 | |
| | | | |
Net asset value per share outstanding | | $ | 11.62 | |
| | | | |
Service Class | |
Net assets applicable to outstanding shares | | $ | 680,119,264 | |
| | | | |
Shares of beneficial interest outstanding | | | 58,948,334 | |
| | | | |
Net asset value per share outstanding | | $ | 11.54 | |
| | | | |
| | | | |
| M-82 | | MainStay VP Conservative Allocation Portfolio | | The notes to the financial statements are an integral part of,
and should be read in conjunction with, the financial statements. |
Statement of Operations for the year ended December 31, 2012
| | | | |
| Investment Income (Loss) | | | | |
Income | |
Dividend distributions from affiliated investment companies | | $ | 14,516,922 | |
| | | | |
Expenses | |
Distribution and service—Service Class (See Note 3) | | | 1,514,103 | |
Shareholder communication | | | 105,855 | |
Professional fees | | | 49,780 | |
Trustees | | | 16,282 | |
Custodian | | | 4,355 | |
Miscellaneous | | | 17,329 | |
| | | | |
Total expenses | | | 1,707,704 | |
| | | | |
Net investment income (loss) | | | 12,809,218 | |
| | | | |
|
| Realized and Unrealized Gain (Loss) on Investments | |
Net realized gain (loss) on: | | | | |
Affiliated investment company transactions | | | 16,237,983 | |
Realized capital gain distributions from affiliated investment companies | | | 11,678,543 | |
| | | | |
Net realized gain (loss) on investments from affiliated investment companies | | | 27,916,526 | |
| | | | |
Net change in unrealized appreciation (depreciation) on investments | | | 18,395,516 | |
| | | | |
Net realized and unrealized gain (loss) on investments | | | 46,312,042 | |
| | | | |
Net increase (decrease) in net assets resulting from operations | | $ | 59,121,260 | |
| | | | |
| | | | | | |
The notes to the financial statements are an integral part of,
and should be read in conjunction with, the financial statements. | | mainstayinvestments.com | | | M-83 | |
Statements of Changes in Net Assets
for the years ended December 31, 2012 and December 31, 2011
| | | | | | | | |
| | | 2012 | | | 2011 | |
| Increase (Decrease) in Net Assets | |
Operations: | | | | | | | | |
Net investment income (loss) | | $ | 12,809,218 | | | $ | 10,601,971 | |
Net realized gain (loss) on investments from affiliated investment companies transactions | | | 27,916,526 | | | | 36,969,625 | |
Net change in unrealized appreciation (depreciation) on investments | | | 18,395,516 | | | | (36,055,223 | ) |
| | | | |
Net increase (decrease) in net assets resulting from operations | | | 59,121,260 | | | | 11,516,373 | |
| | | | |
Dividends and distributions to shareholders: | | | | | | | | |
From net investment income: | | | | | | | | |
Initial Class | | | (248,049 | ) | | | (190,473 | ) |
Service Class | | | (12,331,529 | ) | | | (10,069,305 | ) |
| | | | |
| | | (12,579,578 | ) | | | (10,259,778 | ) |
| | | | |
From net realized gain on investments: | | | | | | | | |
Initial Class | | | (656,622 | ) | | | (34,457 | ) |
Service Class | | | (35,735,731 | ) | | | (1,976,098 | ) |
| | | | |
| | | (36,392,353 | ) | | | (2,010,555 | ) |
| | | | |
Total dividends and distributions to shareholders | | | (48,971,931 | ) | | | (12,270,333 | ) |
| | | | |
Capital share transactions: | | | | | | | | |
Net proceeds from sale of shares | | | 172,763,242 | | | | 172,204,839 | |
Net asset value of shares issued to shareholders in reinvestment of dividends and distributions | | | 48,971,931 | | | | 12,270,333 | |
Cost of shares redeemed | | | (67,159,137 | ) | | | (71,822,389 | ) |
| | | | |
Increase (decrease) in net assets derived from capital share transactions | | | 154,576,036 | | | | 112,652,783 | |
| | | | |
Net increase (decrease) in net assets | | | 164,725,365 | | | | 111,898,823 | |
|
| Net Assets | |
Beginning of year | | | 528,259,829 | | | | 416,361,006 | |
| | | | |
End of year | | $ | 692,985,194 | | | $ | 528,259,829 | |
| | | | |
Undistributed net investment income at end of year | | $ | 18,733,977 | | | $ | 12,579,553 | |
| | | | |
| | | | |
| M-84 | | MainStay VP Conservative Allocation Portfolio | | The notes to the financial statements are an integral part of,
and should be read in conjunction with, the financial statements. |
Financial Highlights selected per share data and ratios
| | | | | | | | | | | | | | | | | | | | |
| | | Initial Class | |
| | | Year ended December 31, | |
| | | 2012 | | | 2011 | | | 2010 | | | 2009 | | | 2008 | |
Net asset value at beginning of year | | $ | 11.35 | | | $ | 11.34 | | | $ | 10.37 | | | $ | 8.89 | | | $ | 11.01 | |
| | | | | | | | | | | | | | | | | | | | |
Net investment income (loss) (a) | | | 0.28 | | | | 0.28 | | | | 0.29 | | | | 0.34 | | | | 0.32 | |
Net realized and unrealized gain (loss) on investments | | | 0.93 | | | | 0.03 | | | | 0.95 | | | | 1.63 | | | | (2.35 | ) |
| | | | | | | | | | | | | | | | | | | | |
Total from investment operations | | | 1.21 | | | | 0.31 | | | | 1.24 | | | | 1.97 | | | | (2.03 | ) |
| | | | | | | | | | | | | | | | | | | | |
Less dividends and distributions: | | | | | | | | | | | | | | | | | | | | |
From net investment income | | | (0.26 | ) | | | (0.25 | ) | | | (0.27 | ) | | | (0.31 | ) | | | (0.01 | ) |
From net realized gain on investments | | | (0.68 | ) | | | (0.05 | ) | | | — | | | | (0.18 | ) | | | (0.08 | ) |
| | | | | | | | | | | | | | | | | | | | |
Total dividends and distributions | | | (0.94 | ) | | | (0.30 | ) | | | (0.27 | ) | | | (0.49 | ) | | | (0.09 | ) |
| | | | | | | | | | | | | | | | | | | | |
Net asset value at end of year | | $ | 11.62 | | | $ | 11.35 | | | $ | 11.34 | | | $ | 10.37 | | | $ | 8.89 | |
| | | | | | | | | | | | | | | | | | | | |
Total investment return | | | 10.69 | % | | | 2.90 | % | | | 12.03 | % | | | 22.28 | % | | | (18.41 | %) |
Ratios (to average net assets)/Supplemental Data: | | | | | | | | | | | | | | | | | | | | |
Net investment income (loss) | | | 2.34 | % | | | 2.44 | % | | | 2.66 | % | | | 3.54 | % | | | 3.16 | % |
Net expenses (b) | | | 0.03 | % | | | 0.04 | % | | | 0.05 | % | | | 0.05 | % | | | 0.06 | % |
Portfolio turnover rate | | | 53 | % | | | 62 | % | | | 26 | % | | | 38 | % | | | 44 | % |
Net assets at end of year (in 000’s) | | $ | 12,866 | | | $ | 9,472 | | | $ | 8,123 | | | $ | 6,827 | | | $ | 3,984 | |
| (a) | Per share data based on average shares outstanding during the year. |
| (b) | In addition to the fees and expenses which the Portfolio bears directly, the Portfolio indirectly bears a pro-rata share of the fees and expenses of the Underlying Portfolios/Funds in which it invests. Such indirect expenses are not included in the above expense ratios. |
| | | | | | | | | | | | | | | | | | | | |
| | | Service Class | |
| | | Year ended December 31, | |
| | | 2012 | | | 2011 | | | 2010 | | | 2009 | | | 2008 | |
Net asset value at beginning of year | | $ | 11.28 | | | $ | 11.28 | | | $ | 10.33 | | | $ | 8.86 | | | $ | 10.99 | |
| | | | | | | | | | | | | | | | | | | | |
Net investment income (loss) (a) | | | 0.24 | | | | 0.25 | | | | 0.27 | | | | 0.33 | | | | 0.30 | |
Net realized and unrealized gain (loss) on investments | | | 0.93 | | | | 0.03 | | | | 0.94 | | | | 1.61 | | | | (2.35 | ) |
| | | | | | | | | | | | | | | | | | | | |
Total from investment operations | | | 1.17 | | | | 0.28 | | | | 1.21 | | | | 1.94 | | | | (2.05 | ) |
| | | | | | | | | | | | | | | | | | | | |
Less dividends and distributions: | | | | | | | | | | | | | | | | | | | | |
From net investment income | | | (0.23 | ) | | | (0.23 | ) | | | (0.26 | ) | | | (0.29 | ) | | | (0.00 | )‡ |
From net realized gain on investments | | | (0.68 | ) | | | (0.05 | ) | | | — | | | | (0.18 | ) | | | (0.08 | ) |
| | | | | | | | | | | | | | | | | | | | |
Total dividends and distributions | | | (0.91 | ) | | | (0.28 | ) | | | (0.26 | ) | | | (0.47 | ) | | | (0.08 | ) |
| | | | | | | | | | | | | | | | | | | | |
Net asset value at end of year | | $ | 11.54 | | | $ | 11.28 | | | $ | 11.28 | | | $ | 10.33 | | | $ | 8.86 | |
| | | | | | | | | | | | | | | | | | | | |
Total investment return | | | 10.42 | % | | | 2.65 | % | | | 11.75 | % | | | 21.93 | % | | | (18.62 | %) |
Ratios (to average net assets)/Supplemental Data: | | | | | | | | | | | | | | | | | | | | |
Net investment income (loss) | | | 2.07 | % | | | 2.23 | % | | | 2.47 | % | | | 3.39 | % | | | 2.95 | % |
Net expenses (b) | | | 0.28 | % | | | 0.29 | % | | | 0.30 | % | | | 0.30 | % | | | 0.31 | % |
Portfolio turnover rate | | | 53 | % | | | 62 | % | | | 26 | % | | | 38 | % | | | 44 | % |
Net assets at end of year (in 000’s) | | $ | 680,119 | | | $ | 518,788 | | | $ | 408,238 | | | $ | 291,307 | | | $ | 209,443 | |
| ‡ | Less than one cent per share. |
| (a) | Per share data based on average shares outstanding during the year. |
| (b) | In addition to the fees and expenses which the Portfolio bears directly, the Portfolio indirectly bears a pro-rata share of the fees and expenses of the Underlying Portfolios/Funds in which it invests. Such indirect expenses are not included in the above expense ratios. |
| | | | | | |
The notes to the financial statements are an integral part of,
and should be read in conjunction with, the financial statements. | | mainstayinvestments.com | | | M-85 | |
MainStay VP Convertible Portfolio
Investment and Performance Comparison (Unaudited)
Performance data quoted represents past performance. Past performance is no guarantee of future results. Because of market volatility, current performance may be lower or higher than the figures shown. Investment return and principal value will fluctuate, and as a result, when shares are redeemed, they may be worth more or less than their original cost. The performance table and graph do not reflect any deduction of sales charges, mortality and expense charges, contract charges or administrative charges. Please refer to the Performance Summary appropriate for your policy. For performance information current to the most recent month-end, please call 800-598-2019 or visit www.newyorklife.com.
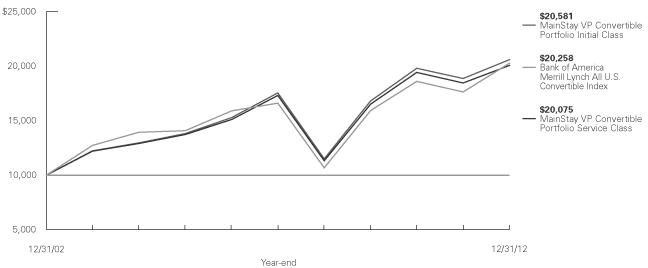
Average Annual Total Returns for the Year Ended December 31, 2012
| | | | | | | | | | | | | | |
| Class | | One Year | | Five Years | | | Ten Years1 | | | Gross Expense Ratio2 | |
| Initial Class Shares | | 9.13% | | | 3.25 | % | | | 7.48 | % | | | 0.65 | % |
| Service Class Shares3 | | 8.86 | | | 3.00 | | | | 7.22 | | | | 0.90 | |
| | | | | | | | | | | | |
| Benchmark Performance | | One
Year | | | Five
Years | | | Ten
Years | |
Bank of America Merrill Lynch All U.S. Convertible Index4 | | | 14.96 | % | | | 4.06 | % | | | 7.31 | % |
Average Lipper Convertible Securities Fund5 | | | 11.05 | | | | 2.50 | | | | 6.87 | |
| 1. | Performance figures shown for the ten-year period ended December 31, 2012 reflect nonrecurring reimbursements from affiliates for printing and mailing costs. If these nonrecurring reimbursements had not been made, the total returns would have been 7.48% for Initial Class shares and 7.21% for Service Class shares for the ten-year period. |
| 2. | The gross expense ratios presented reflect the Portfolio’s “Total Annual Portfolio Operating Expenses” from the most recent Prospectus and may differ from other expense ratios disclosed in this report. |
| 3. | Performance for Service Class shares, first offered June 5, 2003, includes the historical performance of Initial Class shares |
| | through June 4, 2003 adjusted to reflect the fees and expenses of Service Class shares. |
| 4. | Please refer to pages M-2 and M-3 for additional explanations and disclosure regarding the Portfolios, their benchmark indices and other indices mentioned in the reports. |
| 5. | The Average Lipper Convertible Securities Fund is representative of funds that invest primarily in convertible bonds and/or convertible preferred stock. Lipper Inc. is an independent monitor of fund performance. Results are based on total returns with all dividend and capital gain distributions reinvested. |
| | |
| M-86 | | MainStay VP Convertible Portfolio |
Cost in Dollars of a $1,000 Investment in MainStay VP Convertible Portfolio (Unaudited)
The example below is intended to describe the fees and expenses borne by shareholders during the six-month period from July 1, 2012 to December 31, 2012, and the impact of those costs on your investment.
Example
As a shareholder of the Portfolio, you incur two types of costs: (1) transaction costs, including exchange fees and sales charges (loads) on purchases (as applicable), and (2) ongoing costs, including management fees, distribution and/or service (12b-1) fees, and other Portfolio expenses (as applicable). This example is intended to help you understand your ongoing costs (in dollars) of investing in the Portfolio and to compare these costs with the ongoing costs of investing in other Portfolios. The example is based on an investment of $1,000 made at the beginning of the six-month period and held for the entire period from July 1, 2012, to December 31, 2012. Shares are only sold in connection with variable life and annuity contracts and the example does not reflect any contract level or transactional fees or expenses. If these costs had been included, your costs would have been higher.
This example illustrates your Portfolio’s ongoing costs in two ways:
Actual Expenses
The second and third data columns in the table below provide information about actual account values and actual expenses. You may use the information in these columns, together with the amount you invested, to estimate the expenses that you paid during the six months ended
December 31, 2012. Simply divide your account value by $1,000 (for example, an $8,600 account value divided by $1,000 = 8.6), then multiply the result by the number under the heading entitled ‘‘Expenses Paid During Period’’ to estimate the expenses you paid on your account during this period.
Hypothetical Example for Comparison Purposes
The fourth and fifth data columns in the table below provide information about hypothetical account values and hypothetical expenses based on the Portfolio’s actual expense ratio and an assumed rate of return of 5% per year before expenses, which is not the Portfolio’s actual return. The hypothetical account values and expenses may not be used to estimate the actual ending account balances or expenses you paid for the six-month period shown. You may use this information to compare the ongoing costs of investing in the Portfolio with the ongoing costs of investing in other Portfolios. To do so, compare this 5% hypothetical example with the 5% hypothetical examples that appear in the shareholder reports of the other Portfolios.
Please note that the expenses shown in the table are meant to highlight your ongoing costs only and do not reflect any transactional costs, such as exchange fees or sales charges (loads). Therefore, the fourth and fifth data columns of the table are useful in comparing ongoing costs only and will not help you determine the relative total costs of owning different funds. In addition, if these transactional costs were included, your costs would have been higher.
| | | | | | | | | | | | | | | | | | | | |
| | | | | | | | | | | | | | | | |
| Share Class | | Beginning
Account
Value
7/1/12 | | | Ending Account
Value (Based
on Actual
Returns and
Expenses)
12/31/12 | | | Expenses
Paid
During
Period1 | | | Ending Account
Value (Based
on Hypothetical
5% Annualized
Return and
Actual Expenses)
12/31/12 | | | Expenses
Paid
During
Period1 | |
| | | | | |
| Initial Class Shares | | $ | 1,000.00 | | | $ | 1,047.50 | | | $ | 3.29 | | | $ | 1,021.90 | | | $ | 3.25 | |
| | | | | |
| Service Class Shares | | $ | 1,000.00 | | | $ | 1,046.10 | | | $ | 4.58 | | | $ | 1,020.70 | | | $ | 4.52 | |
| 1. | Expenses are equal to the Portfolio’s annualized expense ratio of each class (0.64% for Initial Class and 0.89% for Service Class) multiplied by the average account value over the period, divided by 366 and multiplied by 184 (to reflect the six-month period). The table above represents the actual expenses incurred during the six-month period. |
| | | | |
| mainstayinvestments.com | | | M-87 | |
Portfolio Composition as of December 31, 2012 (Unaudited)
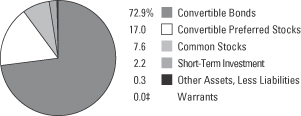
See Portfolio of Investments beginning on page M-91 for specific holdings within these categories.
| ‡ | Less than one-tenth of a percent. |
Top Ten Holdings or Issuers Held as of December 31, 2012 (excluding short-term investment) (Unaudited)
| 2. | JPMorgan Chase & Co. (Convertible into Schlumberger, Ltd.), 1.50%, due 6/25/15 |
| 3. | Gilead Sciences, Inc., 1.00%, due 5/1/14 |
| 4. | Stanley Black & Decker, Inc., 4.75% |
| 5. | Teva Pharmaceutical Finance Co. LLC, 0.25%, due 2/1/26 |
| 6. | Salix Pharmaceuticals, Ltd., 1.50%–2.75%, due 5/15/15–3/15/19 |
| 7. | EMC Corp., 1.75%, due 12/1/13 |
| 8. | Danaher Corp., (zero coupon) , due 1/22/21 |
| 9. | United Technologies Corp., 7.50% |
| 10. | Jarden Corp., 1.875%, due 9/15/18 |
| | |
| M-88 | | MainStay VP Convertible Portfolio |
Portfolio Management Discussion and Analysis (Unaudited)
Answers to the questions reflect the views of portfolio manager Edward Silverstein, CFA, of MacKay Shields LLC, the Portfolio’s Subadvisor.
How did MainStay VP Convertible Portfolio perform relative to its peers and its benchmark for the 12 months ended December 31, 2012?
For the 12 months ended December 31, 2012, MainStay VP Convertible Portfolio returned 9.13% for Initial Class shares and 8.86% for Service Class shares. Both share classes underperformed the 11.05% return of the average Lipper1 Convertible Securities Fund and the 14.96% return of the Bank of America Merrill Lynch All U.S. Convertible Index1 for the 12 months ended December 31, 2012. The Bank of America Merrill Lynch All U.S. Convertible Index is the Portfolio’s broad-based securities-market index.
What factors affected the Portfolio’s relative performance during the reporting period?
The Portfolio’s performance relative to its benchmark was negatively affected by sector allocation. The Portfolio held overweight positions in the materials and energy sectors, two of the poorest-performing sectors within the convertible bond universe. In addition, the Portfolio held a significantly underweight position in the financial sector, which was one of the best-performing convertible bond sectors. The Portfolio’s focus on “balanced” convertible securi- ties left the Portfolio underweight among several “busted”2 financial convertible preferred securities with large weightings in the Bank of America Merrill Lynch All U.S. Convertible Index. These securities were strong performers in 2012, as investors bid up the prices of securities that offered investors relatively high income yields.
What was the Portfolio’s duration3 strategy during the reporting period?
Because convertible securities are tied to the value of underlying stocks, duration is not a key consideration in the management of the Portfolio. During the reporting period the Portfolio’s duration remained relatively in line with that of the Bank of America Merrill Lynch All U.S. Convertible Index.
What specific factors, risks or market forces prompted significant decisions for the Portfolio during the reporting period?
Our investment focus is driven by a bottom-up approach. Our process involves finding well-managed
companies with strong fundamental businesses, strong balance sheets and cash flow, and an associated convertible security that offers meaningful upside participation with the company’s common stock and a measure of downside protection.
During the reporting period, which market segments were the strongest positive contributors to the Portfolio’s performance, and which market segments were particularly weak?
The Portfolio’s strongest positive industry contrib-utor in 2012 was biotechnology. (Contributions take weightings and total returns into account.) The Portfolio had numerous solid performers in this group, including Gilead Sciences, Biomarin Pharmaceutical, Incyte and Amarin Corp. Gilead Sciences was the Portfolio’s leading contributor, as the company reported positive results in several trials for its hepatitis C treatment. A successful launch of a hepatitis C treatment would reduce the company’s dependency on its HIV drug sales, some of which lose patent protection within the next five years. Another strong industry was home building, as the convertible bond holding of Lennar was the second-best-contributing security in the Portfolio. Lennar and home builders in general did very well in 2012, as investors were relieved to a see a rise in new home sales and housing starts—and an increase in home prices in most housing markets in the United States.
During 2012, the Portfolio’s weakest industry contribution came from energy exploration & production. The industry was hurt by a steep drop in the price of natural gas in the United States. The warmest winter on record reduced demand for the heating fuel. The convertible preferred shares of Chesapeake Energy and convertible bonds of SM Energy were hurt by declining natural gas prices. In addition, the convertible preferred shares of Apache declined in part because of political turmoil in Egypt, where the company has approximately twenty percent of its oil and gas assets. The second-worst-performing sector in the Portfolio was materials. The Portfolio’s investments in several metals & mining companies suffered because of investor concerns that a slowdown in Chinese demand might result in lower prices and lower profits for companies in the sector.
| 1. | Please refer to pages M-2 and M-3 for additional explanations and disclosure regarding the Portfolios, their benchmark indices and service providers mentioned in the reports. |
| 2. | A “busted” convertible security is one that is trading well below its conversion value. In light of the large gap between the current value of the underlying stock and the conversion value, the convertible security may tend to trade much like a nonconvertible security. |
| 3. | Duration is a measure of the price sensitivity of a fixed-income investment to changes in interest rates. Duration is expressed as a number of years and is considered a more accurate sensitivity gauge than average maturity. |
| | | | |
| mainstayinvestments.com | | | M-89 | |
Did the Portfolio make any significant purchases or sales during the reporting period?
In 2012, we purchased relatively large positions in the convertible bonds of industrial conglomerate Danaher and consumer products company Jarden. We initiated the position in Danaher because we believe that the company’s industrial businesses are likely to see increased demand. In addition, the company has a strong balance sheet and generates significant free cash flow. We purchased the convertible bonds of Jarden after the initial public offering of the securities. The company has a strong lineup of well-known consumer brands such as Coleman, Sunbeam and First Alert. Jarden also generates excess cash flow.
During the year, we sold the convertible bonds of pharmaceutical company Amarin, following the company’s announcement that it would be hiring a sales force to market its leading drug candidate for the treatment of high triglycerides. Investors expected the company to partner with a larger pharmaceutical firm rather than market its drug on its own. We also sold the common shares of Valeant Pharmaceuticals International after the company called its convertible bonds and gave holders common shares in return.
How did the Portfolio’s sector weightings change over the course of the reporting period?
The only significant weighting change was the decrease in the Portfolio’s allocation to health care. We sold Portfolio positions in several biotechnology companies and trimmed several holdings that had increased in size during the year because of appreciation. Some of the proceeds from these sales were added to holdings in the industrials and consumer sectors.
How was the Portfolio positioned at the end of the reporting period?
As of December 31, 2012, the Portfolio maintained overweight positions in the energy and materials sectors. As of the same date, the Portfolio held a neutral weight relative to the Bank of America Merrill Lynch All U.S. Convertible Index in information technology and health care. As of December 31, 2012, the Portfolio held underweight positions in the financials and utilities sectors.
The opinions expressed are those of the portfolio manager as of the date of this report and are subject to change. There is no guarantee that any forecasts made will come to pass. This material does not constitute investment advice and is not intended as an endorsement of any specific investment.
Not all MainStay VP Portfolios and/or share classes are available under all policies.
| | |
| M-90 | | MainStay VP Convertible Portfolio |
Portfolio of Investments December 31, 2012
| | | | | | | | |
| | | Principal
Amount | | | Value | |
Convertible Securities 89.9%† Convertible Bonds 72.9% | | | | | | | | |
Aerospace & Defense 1.0% | | | | | | | | |
GenCorp, Inc.
4.063%, due 12/31/39 | | $ | 2,044,000 | | | $ | 2,519,230 | |
Kaman Corp.
3.25%, due 11/15/17 (a) | | | 1,783,000 | | | | 2,248,809 | |
| | | | | | | | |
| | | | | | | 4,768,039 | |
| | | | | | | | |
Airlines 0.8% | | | | | | | | |
Continental Airlines, Inc.
4.50%, due 1/15/15 | | | 2,495,000 | | | | 3,611,513 | |
| | | | | | | | |
| | |
Apparel 0.6% | | | | | | | | |
Iconix Brand Group, Inc.
2.50%, due 6/1/16 (a) | | | 2,807,000 | | | | 2,921,034 | |
| | | | | | | | |
| | |
Auto Manufacturers 1.2% | | | | | | | | |
Wabash National Corp.
3.375%, due 5/1/18 | | | 5,075,000 | | | | 5,645,937 | |
| | | | | | | | |
| | |
Biotechnology 5.4% | | | | | | | | |
Amgen, Inc.
0.375%, due 2/1/13 | | | 6,777,000 | | | | 7,619,889 | |
¨Gilead Sciences, Inc.
1.00%, due 5/1/14 | | | 6,792,000 | | | | 11,138,880 | |
InterMune, Inc.
2.50%, due 9/15/18 | | | 4,195,000 | | | | 3,300,941 | |
Medicines Co. (The)
1.375%, due 6/1/17 (a) | | | 2,787,000 | | | | 3,065,700 | |
| | | | | | | | |
| | | | | | | 25,125,410 | |
| | | | | | | | |
Coal 1.8% | | | | | | | | |
Peabody Energy Corp.
4.75%, due 12/15/66 | | | 8,441,000 | | | | 8,171,943 | |
| | | | | | | | |
| | |
Commercial Services 1.5% | | | | | | | | |
Hertz Global Holdings, Inc.
5.25%, due 6/1/14 | | | 1,809,000 | | | | 3,679,054 | |
Sotheby’s
3.125%, due 6/15/13 | | | 2,844,000 | | | | 3,087,517 | |
| | | | | | | | |
| | | | | | | 6,766,571 | |
| | | | | | | | |
Computers 3.6% | | | | | | | | |
¨EMC Corp.
1.75%, due 12/1/13 | | | 5,943,000 | | | | 9,490,258 | |
Mentor Graphics Corp.
4.00%, due 4/1/31 | | | 1,251,000 | | | | 1,476,962 | |
Quantum Corp.
3.50%, due 11/15/15 | | | 2,009,000 | | | | 1,844,513 | |
| | | | | | | | |
| | | Principal
Amount | | | Value | |
Computers (continued) | | | | | | | | |
SanDisk Corp.
1.50%, due 8/15/17 | | $ | 3,575,000 | | | $ | 4,164,875 | |
| | | | | | | | |
| | | | | | | 16,976,608 | |
| | | | | | | | |
Distribution & Wholesale 0.7% | | | | | | | | |
WESCO International, Inc.
6.00%, due 9/15/29 | | | 1,389,000 | | | | 3,448,193 | |
| | | | | | | | |
| | |
Diversified Financial Services 1.3% | | | | | | | | |
Air Lease Corp.
3.875%, due 12/1/18 (a) | | | 5,596,000 | | | | 6,082,152 | |
| | | | | | | | |
| | |
Entertainment 0.9% | | | | | | | | |
International Game Technology
3.25%, due 5/1/14 | | | 4,176,000 | | | | 4,376,970 | |
| | | | | | | | |
| | |
Environmental Controls 1.8% | | | | | | | | |
Covanta Holding Corp.
3.25%, due 6/1/14 | | | 6,760,000 | | | | 8,200,725 | |
| | | | | | | | |
| | |
Health Care—Products 4.7% | | | | | | | | |
China Medical Technologies, Inc.
4.00%, due 8/15/13 (b)(c) | | | 7,607,000 | | | | 361,332 | |
Hologic, Inc.
2.00%, due 3/1/42 (d) | | | 5,246,000 | | | | 5,229,606 | |
Insulet Corp.
3.75%, due 6/15/16 | | | 4,145,000 | | | | 4,520,641 | |
Teleflex, Inc.
3.875%, due 8/1/17 | | | 5,964,000 | | | | 7,671,195 | |
Wright Medical Group, Inc.
2.00%, due 8/15/17 (a) | | | 3,663,000 | | | | 3,887,359 | |
| | | | | | | | |
| | | | | | | 21,670,133 | |
| | | | | | | | |
Health Care—Services 1.1% | | | | | | | | |
WellPoint, Inc.
2.75%, due 10/15/42 (a) | | | 4,852,000 | | | | 5,243,193 | |
| | | | | | | | |
|
Home Builders 1.5% | |
Lennar Corp.
3.25%, due 11/15/21 (a) | | | 3,866,000 | | | | 6,953,967 | |
| | | | | | | | |
|
Household Products & Wares 2.0% | |
¨Jarden Corp.
1.875%, due 9/15/18 (a) | | | 9,099,000 | | | | 9,252,546 | |
| | | | | | | | |
|
Insurance 1.0% | |
American Equity Investment Life Holding Co. 3.50%, due 9/15/15 (a) | | | 4,172,000 | | | | 4,836,913 | |
| | | | | | | | |
| † | Percentages indicated are based on Portfolio net assets. |
| ¨ | | Among the Portfolio’s 10 largest holdings or issuers held, as of December 31, 2012, excluding short-term investment. May be subject to change daily. |
| | | | | | |
The notes to the financial statements are an integral part of,
and should be read in conjunction with, the financial statements. | | mainstayinvestments.com | | | M-91 | |
Portfolio of Investments December 31, 2012 (continued)
| | | | | | | | |
| | | Principal
Amount | | | Value | |
| Convertible Bonds (continued) | |
Internet 2.2% | | | | | | | | |
At Home Corp.
4.75%, due 12/31/49 (b)(c)(e)(f) | | $ | 2,335,418 | | | $ | 234 | |
Dealertrack Technologies, Inc.
1.50%, due 3/15/17 (a) | | | 2,738,000 | | | | 2,903,991 | |
VeriSign, Inc.
3.25%, due 8/15/37 | | | 5,662,000 | | | | 7,169,507 | |
| | | | | | | | |
| | | | | | | 10,073,732 | |
| | | | | | | | |
Investment Company 1.0% | | | | | | | | |
Ares Capital Corp.
4.875%, due 3/15/17 (a) | | | 4,436,000 | | | | 4,605,123 | |
| | | | | | | | |
| | |
Iron & Steel 1.8% | | | | | | | | |
Allegheny Technologies, Inc.
4.25%, due 6/1/14 | | | 7,863,000 | | | | 8,605,071 | |
| | | | | | | | |
| | |
Lodging 0.8% | | | | | | | | |
MGM Resorts International
4.25%, due 4/15/15 | | | 3,544,000 | | | | 3,758,855 | |
| | | | | | | | |
| | |
Machinery—Diversified 1.1% | | | | | | | | |
Chart Industries, Inc.
2.00%, due 8/1/18 | | | 4,052,000 | | | | 5,011,818 | |
| | | | | | | | |
| | |
Miscellaneous—Manufacturing 2.7% | | | | | | | | |
¨Danaher Corp.
(zero coupon), due 1/22/21 | | | 5,805,000 | | | | 9,462,150 | |
Textron, Inc.
4.50%, due 5/1/13 | | | 1,681,000 | | | | 3,190,748 | |
| | | | | | | | |
| | | | | | | 12,652,898 | |
| | | | | | | | |
Oil & Gas Services 6.5% | | | | | | | | |
Helix Energy Solutions Group, Inc.
3.25%, due 3/15/32 | | | 4,923,000 | | | | 5,830,678 | |
Hornbeck Offshore Services, Inc.
1.50%, due 9/1/19 (a) | | | 2,525,000 | | | | 2,550,250 | |
¨JPMorgan Chase & Co.
(Convertible into Schlumberger, Ltd.) 1.50%, due 6/25/15 (a)(h) | | | 11,715,347 | | | | 14,528,202 | |
SEACOR Holdings, Inc.
2.50%, due 12/15/27 (a) | | | 1,751,000 | | | | 1,792,586 | |
Subsea 7 S.A.
3.50%, due 10/13/14 | | | 3,700,000 | | | | 5,649,900 | |
| | | | | | | | |
| | | | | | | 30,351,616 | |
| | | | | | | | |
Pharmaceuticals 9.9% | | | | | | | | |
Akorn, Inc.
3.50%, due 6/1/16 | | | 3,185,000 | | | | 5,344,828 | |
BioMarin Pharmaceutical, Inc.
1.875%, due 4/23/17 | | | 1,911,000 | | | | 4,723,753 | |
| | | | | | | | |
| | | Principal
Amount | | | Value | |
Pharmaceuticals (continued) | | | | | | | | |
Medivation, Inc.
2.625%, due 4/1/17 | | $ | 4,827,000 | | | $ | 6,193,645 | |
Mylan, Inc.
3.75%, due 9/15/15 | | | 2,793,000 | | | | 5,950,836 | |
Omnicare, Inc.
3.75%, due 12/15/25 | | | 2,964,000 | | | | 4,383,015 | |
¨Salix Pharmaceuticals, Ltd.
1.50%, due 3/15/19 (a) | | | 3,147,000 | | | | 3,046,689 | |
2.75%, due 5/15/15 | | | 5,799,000 | | | | 6,661,601 | |
¨Teva Pharmaceutical Finance Co. LLC 0.25%, due 2/1/26 | | | 9,464,000 | | | | 9,712,430 | |
| | | | | | | | |
| | | | | | | 46,016,797 | |
| | | | | | | | |
Real Estate Investment Trusts 2.8% | | | | | | | | |
Host Hotels & Resorts, L.P.
2.50%, due 10/15/29 (a) | | | 4,322,000 | | | | 5,659,119 | |
SL Green Operating Partnership, L.P.
3.00%, due 10/15/17 (a) | | | 6,391,000 | | | | 7,193,869 | |
| | | | | | | | |
| | | | | | | 12,852,988 | |
| | | | | | | | |
Retail 0.8% | | | | | | | | |
Coinstar, Inc.
4.00%, due 9/1/14 | | | 2,746,000 | | | | 3,901,036 | |
| | | | | | | | |
| | |
Semiconductors 5.9% | | | | | | | | |
Lam Research Corp.
1.25%, due 5/15/18 | | | 2,560,000 | | | | 2,542,400 | |
Microchip Technology, Inc.
2.125%, due 12/15/37 | | | 4,617,000 | | | | 5,852,048 | |
Micron Technology, Inc.
3.125%, due 5/1/32 (a) | | | 6,374,000 | | | | 6,238,552 | |
Novellus Systems, Inc.
2.625%, due 5/15/41 | | | 3,756,000 | | | | 4,695,000 | |
ON Semiconductor Corp.
Series B
2.625%, due 12/15/26 | | | 3,712,000 | | | | 3,974,160 | |
Xilinx, Inc.
2.625%, due 6/15/17 | | | 2,968,000 | | | | 4,055,030 | |
| | | | | | | | |
| | | | | | | 27,357,190 | |
| | | | | | | | |
Software 2.4% | | | | | | | | |
Bottomline Technologies, Inc.
1.50%, due 12/1/17 | | | 1,050,000 | | | | 1,171,406 | |
Microsoft Corp.
(zero coupon), due 6/15/13 (a) | | | 5,171,000 | | | | 5,200,087 | |
Nuance Communications, Inc.
2.75%, due 11/1/31 | | | 4,299,000 | | | | 4,688,597 | |
| | | | | | | | |
| | | | | | | 11,060,090 | |
| | | | | | | | |
Telecommunications 3.5% | | | | | | | | |
Anixter International, Inc.
1.00%, due 2/15/13 | | | 3,522,000 | | | | 4,037,092 | |
| | | | |
| M-92 | | MainStay VP Convertible Portfolio | | The notes to the financial statements are an integral part of,
and should be read in conjunction with, the financial statements. |
| | | | | | | | |
| | | Principal
Amount | | | Value | |
| Convertible Bonds (continued) | |
Telecommunications (continued) | | | | | | | | |
Ciena Corp.
4.00%, due 12/15/20 | | $ | 4,927,000 | | | $ | 5,662,971 | |
SBA Communications Corp.
1.875%, due 5/1/13 | | | 775,000 | | | | 1,320,891 | |
4.00%, due 10/1/14 | | | 2,260,000 | | | | 5,354,787 | |
| | | | | | | | |
| | | | | | | 16,375,741 | |
| | | | | | | | |
Transportation 0.6% | | | | | | | | |
XPO Logistics, Inc.
4.50%, due 10/1/17 | | | 2,486,000 | | | | 2,969,216 | |
| | | | | | | | |
Total Convertible Bonds
(Cost $322,230,315) | | | | | | | 339,644,018 | |
| | | | | | | | |
| | |
| | | | | | | | |
| | |
Shares | | | | |
| Convertible Preferred Stocks 17.0% | |
Aerospace & Defense 2.0% | |
¨United Technologies Corp.
7.50% | | | 168,500 | | | | 9,387,135 | |
| | | | | | | | |
|
Auto Manufacturers 1.3% | |
General Motors Co.
4.75% | | | 136,200 | | | | 6,010,506 | |
| | | | | | | | |
|
Auto Parts & Equipment 0.6% | |
Goodyear Tire & Rubber Co. (The)
5.88% | | | 57,600 | | | | 2,719,296 | |
| | | | | | | | |
|
Electric 0.8% | |
PPL Corp.
9.50% | | | 68,500 | | | | 3,583,235 | |
| | | | | | | | |
|
Hand & Machine Tools 2.1% | |
¨Stanley Black & Decker, Inc.
4.75% | | | 83,400 | | | | 10,068,048 | |
| | | | | | | | |
|
Insurance 2.0% | |
Hartford Financial Services Group, Inc.
7.25% | | | 73,300 | | | | 1,513,645 | |
MetLife, Inc.
5.00% | | | 174,400 | | | | 7,755,568 | |
| | | | | | | | |
| | | | | | | 9,269,213 | |
| | | | | | | | |
Media 1.4% | |
Nielsen Holdings N.V.
6.25% | | | 115,400 | | | | 6,509,276 | |
| | | | | | | | |
| | | | | | | | |
| | |
Shares | | |
Value | |
Oil & Gas 5.6% | |
¨Apache Corp.
6.00% | | | 333,000 | | | $ | 15,218,100 | |
Energy XXI Bermuda, Ltd.
5.63% | | | 19,700 | | | | 6,888,844 | |
Sanchez Energy Corp. (a)
4.88% | | | 48,100 | | | | 2,367,342 | |
SandRidge Energy, Inc.
7.00% | | | 13,800 | | | | 1,424,160 | |
| | | | | | | | |
| | | | | | | 25,898,446 | |
| | | | | | | | |
Pharmaceuticals 0.9% | |
Omnicare Capital Trust II
4.00% | | | 84,000 | | | | 4,037,880 | |
| | | | | | | | |
|
Real Estate Investment Trusts 0.3% | |
Health Care REIT, Inc.
6.50% | | | 26,800 | | | | 1,532,692 | |
| | | | | | | | |
Total Convertible Preferred Stocks
(Cost $80,246,793) | | | | | | | 79,015,727 | |
| | | | | | | | |
Total Convertible Securities
(Cost $402,477,108) | | | | | | | 418,659,745 | |
| | | | | | | | |
| | |
| | | | | | | | |
| Common Stocks 7.6% | | | | | | | | |
Auto Manufacturers 0.0%‡ | | | | | | | | |
General Motors Co. (g) | | | 1,638 | | | | 47,224 | |
| | | | | | | | |
|
Banks 1.1% | |
Citigroup, Inc. | | | 128,171 | | | | 5,070,451 | |
| | | | | | | | |
|
Electronics 0.0%‡ | |
TTM Technologies, Inc. (g) | | | 15,700 | | | | 144,440 | |
| | | | | | | | |
|
Entertainment 0.1% | |
International Game Technology | | | 36,200 | | | | 512,954 | |
| | | | | | | | |
| | |
Internet 1.0% | | | | | | | | |
Symantec Corp. (g) | | | 154,300 | | | | 2,902,383 | |
TIBCO Software, Inc. (g) | | | 73,482 | | | | 1,617,339 | |
| | | | | | | | |
| | | | | | | 4,519,722 | |
| | | | | | | | |
Lodging 0.4% | | | | | | | | |
MGM Resorts International (g) | | | 166,800 | | | | 1,941,552 | |
| | | | | | | | |
|
Oil & Gas 0.3% | |
Ensco PLC Class A | | | 19,000 | | | | 1,126,320 | |
Forest Oil Corp. (g) | | | 26,200 | | | | 175,278 | |
| | | | | | | | |
| | | | | | | 1,301,598 | |
| | | | | | | | |
Oil & Gas Services 2.0% | | | | | | | | |
Baker Hughes, Inc. | | | 75,000 | | | | 3,063,000 | |
Halliburton Co. | | | 73,392 | | | | 2,545,968 | |
| | | | | | |
The notes to the financial statements are an integral part of,
and should be read in conjunction with, the financial statements. | | mainstayinvestments.com | | | M-93 | |
Portfolio of Investments December 31, 2012 (continued)
| | | | | | | | |
| | |
Shares | | |
Value | |
| | | | | | | | |
| Common Stocks (continued) | | | | | | | | |
Oil & Gas Services (continued) | | | | | | | | |
ION Geophysical Corp. (g) | | | 360,900 | | | $ | 2,349,459 | |
Schlumberger, Ltd. | | | 22,000 | | | | 1,524,380 | |
| | | | | | | | |
| | | | | | | 9,482,807 | |
| | | | | | | | |
Pharmaceuticals 1.7% | | | | | | | | |
Merck & Co., Inc. | | | 135,553 | | | | 5,549,540 | |
Valeant Pharmaceuticals International, Inc. (g) | | | 40,200 | | | | 2,402,754 | |
| | | | | | | | |
| | | | | | | 7,952,294 | |
| | | | | | | | |
Semiconductors 0.3% | | | | | | | | |
Microchip Technology, Inc. | | | 36,900 | | | | 1,202,571 | |
| | | | | | | | |
| | |
Software 0.2% | | | | | | | | |
QLIK Technologies, Inc. (g) | | | 52,300 | | | | 1,135,956 | |
| | | | | | | | |
| | |
Transportation 0.5% | | | | | | | | |
Tidewater, Inc. | | | 49,600 | | | | 2,216,128 | |
| | | | | | | | |
Total Common Stocks
(Cost $37,061,835) | | | | | | | 35,527,697 | |
| | | | | | | | |
| | |
| | | | | | | | |
| | | Number of
Warrants | | | | |
| Warrants 0.0%‡ | |
Auto Manufacturers 0.0%‡ | |
General Motors Co. | | | | | | | | |
Strike Price $10.00
Expires 7/10/16 (g) | | | 634 | | | | 12,363 | |
Strike Price $18.33
Expires 7/10/19 (g) | | | 634 | | | | 7,918 | |
| | | | | | | | |
Total Warrants
(Cost $569) | | | | | | | 20,281 | |
| | | | | | | | |
| | |
| | | | | | | | |
| | | Principal
Amount | | | | |
| Short-Term Investment 2.2% | |
Repurchase Agreement 2.2% | |
State Street Bank and Trust Co.
0.01%, dated 12/31/12
due 1/2/13
Proceeds at Maturity $10,191,168 (Collateralized by a Federal National Mortgage Association security with a rate of 2.17% and a maturity date of 11/7/22, with a Principal Amount of $10,355,000 and a Market Value of $10,398,667) | | $ | 10,191,162 | | | | 10,191,162 | |
Total Short-Term Investment
(Cost $10,191,162) | | | | | | | 10,191,162 | |
| | | | | | | | |
Total Investments
(Cost $449,730,674) (i) | | | 99.7 | % | | | 464,398,885 | |
Other Assets, Less Liabilities | | | 0.3 | | | | 1,190,439 | |
Net Assets | | | 100.0 | % | | $ | 465,589,324 | |
| ‡ | Less than one-tenth of a percent. |
| (a) | May be sold to institutional investors only under Rule 144A or securities offered pursuant to Section 4(2) of the Securities Act of 1933, as amended. |
| (c) | Illiquid security. The total market value of these securities as of December 31, 2012 is $361,566, which represents 0.1% of the Portfolio’s net assets. |
| (d) | Step coupon. Rate shown is the rate in effect as of December 31, 2012. |
| (f) | Fair valued security. The total market value of this security as of December 31, 2012 is $234, which represents less than one-tenth of a percent of the Portfolio’s net assets. |
| (g) | Non-income producing security. |
| (h) | Synthetic Convertible Bond—Security structured by an investment bank that provides exposure to a specific company’s stock, represents 3.1% of the Portfolio’s net assets. |
| (i) | As of December 31, 2012, cost is $452,208,117 for federal income tax purposes and net unrealized appreciation is as follows: |
| | | | |
Gross unrealized appreciation | | $ | 31,756,585 | |
Gross unrealized depreciation | | | (19,565,817 | ) |
| | | | |
Net unrealized appreciation | | $ | 12,190,768 | |
| | | | |
| | | | |
| M-94 | | MainStay VP Convertible Portfolio | | The notes to the financial statements are an integral part of,
and should be read in conjunction with, the financial statements. |
The following is a summary of the fair valuations according to the inputs used as of December 31, 2012, for valuing the Portfolio’s assets.
Asset Valuation Inputs
| | | | | | | | | | | | | | | | |
Description | | Quoted Prices
in Active Markets
for Identical Assets (Level 1) | | | Significant Other
Observable Inputs (Level 2) | | | Significant
Unobservable
Inputs (Level 3) | | | Total | |
| Investments in Securities (a) | | | | | | | | | | | | | | | | |
| Convertible Securities | | | | | | | | | | | | | | | | |
Convertible Bonds (b) | | $ | — | | | $ | 339,643,784 | | | $ | 234 | | | $ | 339,644,018 | |
Convertible Preferred Stocks | | | 79,015,727 | | | | — | | | | — | | | | 79,015,727 | |
| | | | | | | | | | | | | | | | |
| Total Convertible Securities | | | 79,015,727 | | | | 339,643,784 | | | | 234 | | | | 418,659,745 | |
| | | | | | | | | | | | | | | | |
| Common Stocks | | | 35,527,697 | | | | — | | | | — | | | | 35,527,697 | |
| Warrants | | | 20,281 | | | | — | | | | — | | | | 20,281 | |
| Short-Term Investment | | | | | | | | | | | | | | | | |
Repurchase Agreement | | | — | | | | 10,191,162 | | | | — | | | | 10,191,162 | |
| | | | | | | | | | | | | | | | |
| Total Investments in Securities | | $ | 114,563,705 | | | $ | 349,834,946 | | | $ | 234 | | | $ | 464,398,885 | |
| | | | | | | | | | | | | | | | |
| (a) | For a complete listing of investments and their industries, see the Portfolio of Investments. |
| (b)The | Level 3 security valued at $234 is held in Internet within the Convertible Bonds Section of the Portfolio of Investments. |
The Portfolio recognizes transfers between the levels as of the beginning of the period.
For the year ended December 31, 2012, the Portfolio did not have any transfers between Level 1 and Level 2 fair value measurements. (See Note 2)
The following is a reconciliation of investments in which significant unobservable inputs (Level 3) were used in determining value:
| | | | | | | | | | | | | | | | | | | | | | | | | | | | | | | | | | | | | | | | |
Investments
in Securities | | Balance
as of
December 31,
2011 | | | Accrued
Discounts
(Premiums) | | | Realized
Gain
(Loss) | | | Change in
Unrealized
Appreciation
(Depreciation) | | | Purchases | | | Sales | | | Transfers
in to
Level 3 | | | Transfers
out of
Level 3 | | | Balance
as of
December 31,
2012 | | | Change in
Unrealized
Appreciation
(Depreciation)
from
Investments
Still Held at
December 31,
2012 (a) | |
| Convertible Bonds | | | | | | | | | | | | | | | | | | | | | | | | | | | | | | | | | | | | | | | | |
Internet | | $ | 234 | | | $ | — | | | $ | — | | | $ | — | | | $ | — | | | $ | — | | | $ | — | | | $ | — | | | $ | 234 | | | $ | — | |
| Common Stocks | | | | | | | | | | | | | | | | | | | | | | | | | | | | | | | | | | | | | | | | |
Auto Manufacturers | | | 2,901 | | | | — | | | | — | | | | (2,711 | ) | | | — | | | | (190 | ) | | | — | | | | — | | | | — | | | | — | |
| | | | | | | | | | | | | | | | | | | | | | | | | | | | | | | | | | | | | | | | |
| Total | | $ | 3,135 | | | $ | — | | | $ | — | | | $ | (2,711 | ) | | $ | — | | | $ | (190 | ) | | $ | — | | | $ | — | | | $ | 234 | | | $ | — | |
| | | | | | | | | | | | | | | | | | | | | | | | | | | | | | | | | | | | | | | | |
| (a) | Included in “Net change in unrealized appreciation (depreciation) on Investments” in the Statement of Operations. |
| | | | | | |
The notes to the financial statements are an integral part of,
and should be read in conjunction with, the financial statements. | | mainstayinvestments.com | | | M-95 | |
Statement of Assets and Liabilities as of December 31, 2012
| | | | |
| Assets | | | | |
Investment in securities, at value
(identified cost $449,730,674) | | $ | 464,398,885 | |
Receivables: | | | | |
Dividends and interest | | | 1,710,746 | |
Fund shares sold | | | 227,208 | |
Other assets | | | 467 | |
| | | | |
Total assets | | | 466,337,306 | |
| | | | |
| |
| Liabilities | | | | |
Due to custodian | | | 41,749 | |
Payables: | | | | |
Fund shares redeemed | | | 316,679 | |
Manager (See Note 3) | | | 236,801 | |
NYLIFE Distributors (See Note 3) | | | 66,804 | |
Professional fees | | | 45,561 | |
Shareholder communication | | | 38,328 | |
Custodian | | | 1,390 | |
Trustees | | | 670 | |
| | | | |
Total liabilities | | | 747,982 | |
| | | | |
Net assets | | $ | 465,589,324 | |
| | | | |
| |
| Net Assets Consist of | | | | |
Shares of beneficial interest outstanding (par value of $.001 per share) unlimited number of shares authorized | | $ | 39,998 | |
Additional paid-in capital | | | 409,671,772 | |
| | | | |
| | | 409,711,770 | |
Undistributed net investment income | | | 10,881,954 | |
Accumulated net realized gain (loss) on investments | | | 30,327,389 | |
Net unrealized appreciation (depreciation) on investments | | | 14,668,211 | |
| | | | |
Net assets | | $ | 465,589,324 | |
| | | | |
| | | | |
Initial Class | | | | |
Net assets applicable to outstanding shares | | $ | 149,652,555 | |
| | | | |
Shares of beneficial interest outstanding | | | 12,795,361 | |
| | | | |
Net asset value per share outstanding | | $ | 11.70 | |
| | | | |
Service Class | | | | |
Net assets applicable to outstanding shares | | $ | 315,936,769 | |
| | | | |
Shares of beneficial interest outstanding | | | 27,202,383 | |
| | | | |
Net asset value per share outstanding | | $ | 11.61 | |
| | | | |
| | | | |
| M-96 | | MainStay VP Convertible Portfolio | | The notes to the financial statements are an integral part of,
and should be read in conjunction with, the financial statements. |
Statement of Operations for the year ended December 31, 2012
| | | | |
| Investment Income (Loss) | | | | |
Income | | | | |
Interest | | $ | 9,416,379 | |
Dividends (a) | | | 4,190,685 | |
| | | | |
Total income | | | 13,607,064 | |
| | | | |
Expenses | | | | |
Manager (See Note 3) | | | 2,951,473 | |
Distribution and service—Service Class (See Note 3) | | | 806,185 | |
Professional fees | | | 86,940 | |
Shareholder communication | | | 78,725 | |
Trustees | | | 13,209 | |
Custodian | | | 9,704 | |
Miscellaneous | | | 18,295 | |
| | | | |
Total expenses | | | 3,964,531 | |
| | | | |
Net investment income (loss) | | | 9,642,533 | |
| | | | |
|
| Realized and Unrealized Gain (Loss) on Investments | |
Net realized gain (loss) on investments | | | 35,123,856 | |
Net change in unrealized appreciation (depreciation) on investments | | | (2,613,515 | ) |
| | | | |
Net realized and unrealized gain (loss) on investments | | | 32,510,341 | |
| | | | |
Net increase (decrease) in net assets resulting from operations | | $ | 42,152,874 | |
| | | | |
| (a) | Dividends recorded net of foreign withholding taxes in the amount of $5,740. |
| | | | | | |
The notes to the financial statements are an integral part of,
and should be read in conjunction with, the financial statements. | | mainstayinvestments.com | | | M-97 | |
Statements of Changes in Net Assets
for the years ended December 31, 2012 and December 31, 2011
| | | | | | | | |
| | | 2012 | | | 2011 | |
| Increase (Decrease) in Net Assets | |
Operations: | | | | | | | | |
Net investment income (loss) | | $ | 9,642,533 | | | $ | 12,226,774 | |
Net realized gain (loss) on investments | | | 35,123,856 | | | | 13,617,387 | |
Net change in unrealized appreciation (depreciation) on investments | | | (2,613,515 | ) | | | (52,996,141 | ) |
| | | | |
Net increase (decrease) in net assets resulting from operations | | | 42,152,874 | | | | (27,151,980 | ) |
| | | | |
Dividends and distributions to shareholders: From net investment income: | | | | | | | | |
Initial Class | | | (4,737,544 | ) | | | (4,471,908 | ) |
Service Class | | | (8,770,757 | ) | | | (7,427,112 | ) |
| | | | |
| | | (13,508,301 | ) | | | (11,899,020 | ) |
| | | | |
From net realized gain on investments: | | | | | | | | |
Initial Class | | | (601,018 | ) | | | — | |
Service Class | | | (1,214,005 | ) | | | — | |
| | | | |
| | | (1,815,023 | ) | | | — | |
| | | | |
Total dividends and distributions to shareholders | | | (15,323,324 | ) | | | (11,899,020 | ) |
| | | | |
Capital share transactions: | | | | | | | | |
Net proceeds from sale of shares | | | 33,317,960 | | | | 84,690,779 | |
Net asset value of shares issued to shareholders in reinvestment of dividends and distributions | | | 15,323,324 | | | | 11,899,020 | |
Cost of shares redeemed | | | (98,417,389 | ) | | | (105,153,783 | ) |
| | | | |
Increase (decrease) in net assets derived from capital share transactions | | | (49,776,105 | ) | | | (8,563,984 | ) |
| | | | |
Net increase (decrease) in net assets | | | (22,946,555 | ) | | | (47,614,984 | ) |
|
| Net Assets | |
Beginning of year | | | 488,535,879 | | | | 536,150,863 | |
| | | | |
End of year | | $ | 465,589,324 | | | $ | 488,535,879 | |
| | | | |
Undistributed net investment income at end of year | | $ | 10,881,954 | | | $ | 11,760,265 | |
| | | | |
| | | | |
| M-98 | | MainStay VP Convertible Portfolio | | The notes to the financial statements are an integral part of,
and should be read in conjunction with, the financial statements. |
Financial Highlights selected per share data and ratios
| | | | | | | | | | | | | | | | | | | | |
| | | Initial Class | |
| | | Year ended December 31, | |
| | | 2012 | | | 2011 | | | 2010 | | | 2009 | | | 2008 | |
Net asset value at beginning of year | | $ | 11.09 | | | $ | 11.96 | | | $ | 10.45 | | | $ | 7.29 | | | $ | 13.98 | |
| | | | | | | | | | | | | | | | | | | | |
Net investment income (loss) | | | 0.25 | (a) | | | 0.29 | (a) | | | 0.30 | (a) | | | 0.38 | (a) | | | 0.27 | |
Net realized and unrealized gain (loss)
on investments | | | 0.75 | | | | (0.88 | ) | | | 1.53 | | | | 2.98 | | | | (5.13 | ) |
| | | | | | | | | | | | | | | | | | | | |
Total from investment operations | | | 1.00 | | | | (0.59 | ) | | | 1.83 | | | | 3.36 | | | | (4.86 | ) |
| | | | | | | | | | | | | | | | | | | | |
Less dividends and distributions: | | | | | | | | | | | | | | | | | | | | |
From net investment income | | | (0.35 | ) | | | (0.28 | ) | | | (0.32 | ) | | | (0.20 | ) | | | (0.27 | ) |
From net realized gain on investments | | | (0.04 | ) | | | — | | | | — | | | | — | | | | (1.56 | ) |
| | | | | | | | | | | | | | | | | | | | |
Total dividends and distributions | | | (0.39 | ) | | | (0.28 | ) | | | (0.32 | ) | | | (0.20 | ) | | | (1.83 | ) |
| | | | | | | | | | | | | | | | | | | | |
Net asset value at end of year | | $ | 11.70 | | | $ | 11.09 | | | $ | 11.96 | | | $ | 10.45 | | | $ | 7.29 | |
| | | | | | | | | | | | | | | | | | | | |
Total investment return | | | 9.13 | % | | | (4.75 | %) | | | 17.86 | % | | | 46.08 | % | | | (34.42 | %) |
Ratios (to average net assets)/Supplemental Data: | | | | | | | | | | | | | | | | | | | | |
Net investment income (loss) | | | 2.12 | % | | | 2.43 | % | | | 2.77 | % | | | 4.30 | % | | | 2.32 | % |
Net expenses | | | 0.64 | % | | | 0.65 | % | | | 0.66 | % | | | 0.66 | % | | | 0.65 | % |
Portfolio turnover rate | | | 69 | % | | | 80 | % | | | 83 | % | | | 73 | % | | | 107 | % |
Net assets at end of year (in 000’s) | | $ | 149,653 | | | $ | 173,777 | | | $ | 223,633 | | | $ | 181,366 | | | $ | 135,743 | |
| (a) | Per share data based on average shares outstanding during the year. |
| | | | | | | | | | | | | | | | | | | | |
| | | Service Class | |
| | | Year ended December 31, | |
| | | 2012 | | | 2011 | | | 2010 | | | 2009 | | | 2008 | |
Net asset value at beginning of year | | $ | 11.01 | | | $ | 11.89 | | | $ | 10.39 | | | $ | 7.26 | | | $ | 13.92 | |
| | | | | | | | | | | | | | | | | | | | |
Net investment income (loss) | | | 0.22 | (a) | | | 0.26 | (a) | | | 0.27 | (a) | | | 0.36 | (a) | | | 0.25 | |
Net realized and unrealized gain (loss)
on investments | | | 0.74 | | | | (0.88 | ) | | | 1.53 | | | | 2.95 | | | | (5.11 | ) |
| | | | | | | | | | | | | | | | | | | | |
Total from investment operations | | | 0.96 | | | | (0.62 | ) | | | 1.80 | | | | 3.31 | | | | (4.86 | ) |
| | | | | | | | | | | | | | | | | | | | |
Less dividends and distributions: | | | | | | | | | | | | | | | | | | | | |
From net investment income | | | (0.32 | ) | | | (0.26 | ) | | | (0.30 | ) | | | (0.18 | ) | | | (0.24 | ) |
From net realized gain on investments | | | (0.04 | ) | | | — | | | | — | | | | — | | | | (1.56 | ) |
| | | | | | | | | | | | | | | | | | | | |
Total dividends and distributions | | | (0.36 | ) | | | (0.26 | ) | | | (0.30 | ) | | | (0.18 | ) | | | (1.80 | ) |
| | | | | | | | | | | | | | | | | | | | |
Net asset value at end of year | | $ | 11.61 | | | $ | 11.01 | | | $ | 11.89 | | | $ | 10.39 | | | $ | 7.26 | |
| | | | | | | | | | | | | | | | | | | | |
Total investment return | | | 8.86 | % | | | (4.99 | %) | | | 17.56 | % | | | 45.71 | % | | | (34.58 | %) |
Ratios (to average net assets)/Supplemental Data: | | | | | | | | | | | | | | | | | | | | |
Net investment income (loss) | | | 1.87 | % | | | 2.19 | % | | | 2.52 | % | | | 4.03 | % | | | 2.12 | % |
Net expenses | | | 0.89 | % | | | 0.90 | % | | | 0.91 | % | | | 0.91 | % | | | 0.90 | % |
Portfolio turnover rate | | | 69 | % | | | 80 | % | | | 83 | % | | | 73 | % | | | 107 | % |
Net assets at end of year (in 000’s) | | $ | 315,937 | | | $ | 314,759 | | | $ | 312,518 | | | $ | 227,463 | | | $ | 121,201 | |
| (a) | Per share data based on average shares outstanding during the year. |
| | | | | | |
The notes to the financial statements are an integral part of,
and should be read in conjunction with, the financial statements. | | mainstayinvestments.com | | | M-99 | |
MainStay VP DFA / DuPont Capital Emerging Markets Equity Portfolio
Investment and Performance Comparison1 (Unaudited)
Performance data quoted represents past performance. Past performance is no guarantee of future results. Because of market volatility, current performance may be lower or higher than the figures shown. Investment return and principal value will fluctuate, and as a result, when shares are redeemed, they may be worth more or less than their original cost. The performance table and graph do not reflect any deduction of sales charges, mortality and expense charges, contract charges or administrative charges. Please refer to the Performance Summary appropriate for your policy. For performance information current to the most recent month-end, please call 800-598-2019 or visit www.newyorklife.com.
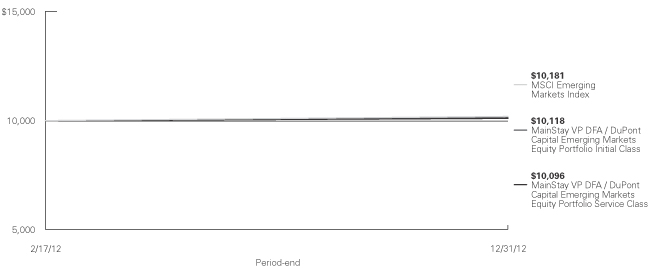
Total Returns for the Period Ended December 31, 2012
| | | | | | | | |
| Class | | Since Inception (2/17/12) | | | Gross Expense Ratio2 | |
| Initial Class Shares | | | 1.18 | % | | | 1.37 | % |
| Service Class Shares | | | 0.96 | | | | 1.62 | |
| | | | |
| Benchmark Performance | | Since Inception
(2/17/12) | |
MSCI Emerging Markets Index3 | | | 1.81 | % |
Average Lipper Variable Products Emerging Markets Portfolio4 | | | 1.07 | |
| 1. | Performance figures reflect certain fee waivers and/or expense limitations, without which total returns may have been different. For information on current fee waivers and/or expense limitations please refer to the notes to the financial statements. |
| 2. | The gross expense ratios presented reflect the Portfolio’s “Total Annual Portfolio Operating Expenses” from the most recent Prospectus and may differ from other expense ratios disclosed in this report. |
| 3. | Please refer to pages M-2 and M-3 for additional explanations and disclosure regarding the Portfolios, their benchmark indices and other indices mentioned in the reports. |
| 4. | The Average Lipper Variable Products Emerging Markets Portfolio is representative of portfolios that, by portfolio practice, seek long-term capital appreciation by investing primarily in emerging market equity securities, where “emerging market” is defined by a country’s per-capita GNP or other economic measures. Lipper Inc. is an independent monitor of fund performance. Results are based on total returns with all dividend and capital gain distributions reinvested. |
| | |
| M-100 | | MainStay VP DFA / DuPont Capital Emerging Markets Equity Portfolio |
Cost in Dollars of a $1,000 Investment in MainStay VP DFA / DuPont Capital Emerging Markets Equity Portfolio (Unaudited)
The example below is intended to describe the fees and expenses borne by shareholders during the period from July 1, 2012, to December 31, 2012, and the impact of those costs on your investment.
Example
As a shareholder of the Portfolio, you incur two types of costs: (1) transaction costs, including exchange fees and sales charges (loads) on purchases (as applicable), and (2) ongoing costs, including management fees, distribution and/or service (12b-1) fees, and other Portfolio expenses (as applicable). This example is intended to help you
understand your ongoing costs (in dollars) of investing in the Portfolio and to compare these costs with the ongoing costs of investing in other Portfolios. The example is based on an investment of $1,000 made at the beginning of the six-month period and held for the entire period from July 1, 2012, to December 31, 2012. Shares are only sold in
connection with variable life and annuity contracts and the example does not reflect any contract level or transactional fees or expenses. If these costs had been included, your costs would have been higher.
This example illustrates your Portfolio’s ongoing costs in two ways:
Actual Expenses
The second and third data columns in the table below
provide information about actual account values and actual expenses. You may use the information in these columns, together with the amount you invested, to estimate the expenses that you paid during the six months ended
December 31, 2012. Simply divide your account value by $1,000 (for example, an $8,600 account value divided by $1,000 = 8.6), then multiply the result by the number under the heading entitled ‘‘Expenses Paid During Period’’ to estimate the expenses you paid on your account during this period.
Hypothetical Example for Comparison Purposes
The fourth and fifth data columns in the table below provide information about hypothetical account values and
hypothetical expenses based on the Portfolio’s actual expense ratio and an assumed rate of return of 5% per year before expenses, which is not the Portfolio’s actual return. The hypothetical account values and expenses may not be used to estimate the actual ending account balances or expenses you paid for the six-month period shown. You may use this information to compare the ongoing costs of investing in the Portfolio with the ongoing costs of investing in other Portfolios. To do so, compare this 5% hypothetical example with the 5% hypothetical examples that appear in the shareholder reports of the other Portfolios.
Please note that the expenses shown in the table are meant to highlight your ongoing costs only and do not reflect any transactional costs, such as exchange fees or sales charges (loads). Therefore, the fourth and fifth data columns of the table are useful in comparing ongoing costs only and will not help you determine the relative total costs of owning different funds. In addition, if these transactional costs were included, your costs would have been higher.
| | | | | | | | | | | | | | | | | | | | |
| | | | | | | | | | | | | | | | |
| Share Class | | Beginning
Account
Value
7/1/12 | | | Ending Account
Value (Based
on Actual
Returns and
Expenses)
12/31/12 | | | Expenses
Paid
During
Period1 | | | Ending Account
Value (Based
on Hypothetical
5% Annualized
Return and
Actual Expenses)
12/31/12 | | | Expenses
Paid
During
Period1 | |
| | | | | |
| Initial Class Shares | | $ | 1,000.00 | | | $ | 1,147.60 | | | $ | 7.72 | | | $ | 1,017.90 | | | $ | 7.25 | |
| | | | | |
| Service Class Shares | | $ | 1,000.00 | | | $ | 1,146.20 | | | $ | 9.06 | | | $ | 1,016.70 | | | $ | 8.52 | |
| 1. | Expenses are equal to the Portfolio’s annualized expense ratio of each class (1.43% for Initial Class and 1.68% for Service Class) multiplied by the average account value over the period, divided by 366 and multiplied by 184 (to reflect the six-month period). The table above represents the actual expenses incurred during the six-month period. |
| | | | |
| mainstayinvestments.com | | | M-101 | |
Portfolio Composition as of December 31, 2012 (Unaudited)
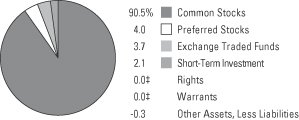
See Portfolio of Investments beginning on page M-106 for specific holdings within these categories.
| ‡ | Less than one-tenth of a percent. |
Top Ten Holdings as of December 31, 2012 (excluding short-term investment) (Unaudited)
| 1. | Gazprom OAO, Sponsored ADR |
| 3. | Shinhan Financial Group Co., Ltd. |
| 5. | Reliance Industries, Ltd., Sponsored GDR |
| 7. | PetroChina Co., Ltd. Class H |
| 8. | Cia Cervecerias Unidas S.A. |
| 10. | China Petroleum & Chemical Corp. Class H |
| | |
| M-102 | | MainStay VP DFA / DuPont Capital Emerging Markets Equity Portfolio |
Portfolio Management Discussion and Analysis (Unaudited)
Answers to the questions reflect the views of portfolio managers Karen Umland, CFA, Joseph H. Chi, CFA, Jed S. Fogdall and Henry F. Gray of Dimensional Fund Advisors LP (“DFA”), which is a Subadvisor of the Portfolio and portfolio manager Rafi U. Zaman, CFA, of DuPont Capital Management Corporation (“DuPont Capital”), which is a Subadvisor of the Portfolio.
How did MainStay VP DFA / DuPont Capital Emerging Markets Equity Portfolio perform relative to its peers and its benchmark from February 17 through December 31, 2012?
The inception date for MainStay VP DFA / DuPont Capital Emerging Markets Equity Portfolio was February 17, 2012. From February 17 through December 31, 2012, MainStay VP DFA / DuPont Capital Emerging Markets Equity Portfolio returned 1.18% for Initial Class shares and 0.96% for Service Class shares. Over the same period, Initial Class shares outperformed and Service Class shares underperformed the 1.07% return of the average Lipper1 Variable Products Emerging Markets Portfolio. Both share classes underperformed the 1.81% return of the MSCI Emerging Markets Index1 for the period from February 17 through December 31, 2012. The MSCI Emerging Markets Index is the Portfolio’s broad-based securities-market index.
What factors affected the Portfolio’s relative performance during the reporting period?
DFA
Deep value stocks in emerging markets were particularly poor performers during the reporting period. Consequently, in our portion of the Portfolio the focus on deep value stocks and lesser exposure to growth-oriented stocks detracted from relative performance when compared to the style-neutral MSCI Emerging Markets Index.
DuPont Capital
Our portion of the Portfolio increased its exposure to economically sensitive areas of the market and decreased exposure to less economically sensitive areas as the reporting period progressed. The shift was made because of the substantial valuation differential between these two segments of the market. The increased exposure to economically sensitive stocks detracted from performance in October and November as investors became defensive. December brought about a reversal of that trend—economically sensitive areas rebounded sharply and led the market. The reversal benefited our portion of the Portfolio in December.
Our portion of the Portfolio benefited from favorable stock selection in each of the major emerging-market regions. The Latin America region added the most to
relative performance because of positive stock selection in Brazil, Mexico and Chile. The emerging Europe, Middle East and Africa (EMEA) region provided a positive contribution to relative performance, led by favorable stock selection in Poland, Egypt and Turkey. (Contributions take weightings and total returns into account.) In our portion of the Portfolio, stock selection in Russia and South Africa detracted from relative performance. Within emerging Asia, stock selection in Thailand, China and India added the most to relative performance. This positive stock selection was somewhat—but not fully—offset by unfavorable stock selection in Indonesia, Malaysia and the Philippines.
Which sectors were the strongest positive contributors to the Portfolio’s relative performance, and which sectors were particularly weak?
DFA
In our portion of the Portfolio, industrials made the strongest positive contribution to the Portfolio’s performance relative to the MSCI Emerging Markets Index, primarily as a result of favorable stock selection. The sectors that detracted the most from relative performance were information technology, consumer staples and energy. In our portion of the Portfolio, underweight positions in information technology and consumer staples detracted from relative performance, as both of these sectors outperformed the MSCI Emerging Markets Index during the reporting period. Our portion of the Portfolio also held a slightly overweight position in the energy sector. Since the sector underperformed the Index, this positioning detracted from relative performance. Stock selection detracted from relative performance in the information technology, consumer staples and energy sectors.
DuPont Capital
In our portion of the Portfolio, the telecommunication services, materials and financials sectors were the strongest contributors to performance relative to the MSCI Emerging Market Index. The telecommunications sector benefited from favorable stock selection and an overweight position relative to the Index. The materials sector benefited from favorable stock selection and an underweight position. Positive stock selection in the financials sector contributed positively to the Portfolio’s relative performance.
| 1. | Please refer to pages M-2 and M-3 for additional explanations and disclosure regarding the Portfolios, their benchmark indices and service providers mentioned in the reports. |
| | | | |
| mainstayinvestments.com | | | M-103 | |
The information technology, utility and industrial sectors were the weakest-contributing sectors relative to the Portfolio’s benchmark. Stock selection and an underweight postion in the information technology sector negatively contributed to the Portfolio’s relative performance. Stock selection in the utility sector negatively affected performance. Stock selection and an overweight position in the industrials sector had a
negatively impact on performance.
During the reporting period, which individual stocks made the strongest positive contributions to the Portfolio’s absolute performance and which stocks detracted the most?
DFA
Our strategy is designed and managed to capture the returns and diversification benefits of a broad cross-section of deep-value securities across the market capitalization spectrum in approved emerging-market countries.
In our portion of the Portfolio, the strongest positive contributors to absolute performance during the reporting period included financial services company Grupo Financiero Banorte, materials company Cemex and industrial company Alfa. All three companies are headquartered in Mexico.
In our portion of the Portfolio, holdings that detracted the most from the Portfolio’s absolute performance during the reporting period included Russian gas producer Gazprom OAO, Brazilian bank Banco Santander Brasil and Brazilian oil producer Petroleo Brasileiro.
DuPont Capital
In our portion of the Portfolio, the strongest positive contributors to absolute performance included semiconductor company Novatek Microelectronics, consumer products company AmorePacific Group and wireless telecommunication services provider MTN Group. Novatek Microelectronics reported improved profitability, which drove its stock price higher in the second half of 2012. Near the end of the reporting period, we reduced our position in the stock as we believed the stock approached its fair value. AmorePacific Group’s shares rose because of better-than-expected sales and earnings results. The position was sold as the stock outperformed and in our opinion, its valuation had become less attractive relative to other positions in our portion of the Portfolio. MTN Group
outperformed the broader market as worries diminished regarding the company’s growth prospects in Africa and the Middle East. Near the end of the year, we reduced the position as a percent of net assets in our portion of the Portfolio, as we viewed the stock’s value as increasingly fair relative to the market.
The weakest individual contributions came from notebook computer manufacturer Compal Electronics, Brazilian oil & gas company Petroleo Brasilerio and Brazilian electric utility Companhia Paranaense de Energia. Compal Electronics’ stock price fell when weak notebook computer demand led to disappointing sales and profitability. We believe the stock is attractively valued and have continued to hold the position. Petroleo Brasilerio fell because of weak profitability from its oil refining business and the company’s aggressive expansion plans. The position was sold
from the Portfolio. Companhia Paranaense de Energia declined because the Brazilian government decided to reduce electricity rates. We added to the position in our portion of the Portfolio because we believe that the stock overreacted to the announcement.
Did the Portfolio make any significant purchases or sales during the reporting period?
DFA
The Portfolio commenced operations during the reporting period, so many significant security purchases occurred during the ramp-up period. After that, security weights typically did not change significantly from month to month. This was a result of our long-term investment approach and the large number of securities typically held. Changes generally occur because of new securities coming into the buy range, securities moving into the sell range and fluctuations in market performance. Security weightings in our portion of the Portfolio could also be affected to the extent that a company’s market cap or book-to-market characteristics change.
DuPont Capital
Early in the reporting period, all purchases played a role in positioning our portion of the Portfolio. Large purchases in our portion of the Portfolio included Chinese automaker Dongfeng Motor Group, wireless telecommunication services provider MTN Group
and oil refiner Thai Oil. The Portfolio purchased shares of Dongeng Motor Group after their price declined because of political discord between China and Japan. We viewed this near-term turmoil as an opportunity to purchase a strong business at depressed prices.
| | |
| M-104 | | MainStay VP DFA / DuPont Capital Emerging Markets Equity Portfolio |
South African company MTN Group had a low valuation because of political concerns in several of the countries in which it operates. We bought the stock because, in our view, it had good long-term growth prospects. Thai Oil’s shares were depressed relative to the overall market because of uncertainty about refining profitability.
Among the large sales in our portion of the Portfolio were consumer products company AmorePacific Group, Brazilian oil & gas company Petroleo Brasilerio and wireless telecommunication services provider Advanced Info Services. Our portion of the Portfolio sold its entire position in AmorePacific Group after increases in the company’s stock price made the stock, in our view, less attractively valued. Petroleo Brasilerio shares were sold as we became concerned with the company’s large capital spending plans. Shares of Advanced Info Services were sold when increases in the stock price made the Thailand-based company less attractively valued.
How did the Portfolio’s sector weightings change during the reporting period?
DFA
In our portion of the Portfolio, weightings relative to the MSCI Emerging Markets Index are a residual of a construction process that targets value stocks. With the exception of excluding REITs, we do not make an active decision to time or weight sectors or industries.
At the beginning of the period, our portion of the Portfolio had significantly overweight positions relative to the MSCI Emerging Markets Index in financials, industrials and materials and underweight positions in information technology, telecommunication services and consumer staples. During the reporting period, the Portfolio increased its weightings relative to the MSCI Emerging Markets Index in materials and energy and decreased its weightings relative to the Index
in the financials, consumer staples and information technology sectors. During the reporting period,
the degree to which our portion of the Portfolio was overweight in financials was reduced. Over the same period, our portion of the Portfolio increased its relative weightings in the materials and energy sectors.
DuPont Capital
Our portion of the Portfolio decreased its weighting in financials, moving from an overweight position relative to the MSCI Emerging Markets Index to a position that was underweight. This decrease primarily resulted from reducing exposure to Brazilian and Chinese financial institutions. Our portion of the Portfolio decreased its already underweight position in consumer staples. Stocks in the consumer staples sector have become expensive relative to areas of the market that are more economically sensitive.
Our portion of the Portfolio increased its allocation to the energy sector, which was already overweight relative to the MSCI Emerging Markets Index early in the reporting period. Our portion of the Portfolio also increased its weighting in the materials sector, moving from an underweight position relative to the Index to a somewhat neutral position. Stocks in these two sectors became increasingly attractively valued as they sold off relative to market sectors that were less economically sensitive.
How was the Portfolio positioned at the end of the reporting period?
DFA
As of December 31, 2012, our portion of the Portfolio maintained overweight positions relative to the MSCI Emerging Markets Index in financials, industrials and materials. As of the same date, our portion of the Portfolio was underweight relative to the Index in the information technology, telecommunication services and consumer staples sectors.
DuPont Capital
At the end of the reporting period, our portion of the Portfolio was overweight economically sensitive areas of the market because of what we perceived to be attractive investment opportunities available in those areas. As of December 31, 2012, our portion of the Portfolio was overweight in the energy and industrials sectors. As of the same date, our portion of the Portfolio was underweight in areas such as consumer staples and large-cap information technology. In our opinion, these market segments, which are less economically sensitive, were not attractively valued relative to the broader market.
The opinions expressed are those of the portfolio managers as of the date of this report and are subject to change. There is no guarantee that any forecasts made will come to pass. This material does not constitute investment advice and is not intended as an endorsement of any specific investment.
Not all MainStay VP Portfolios and/or share classes are available under all policies.
| | | | |
| mainstayinvestments.com | | | M-105 | |
Portfolio of Investments December 31, 2012
| | | | | | | | |
| | |
Shares | | | Value | |
| Common Stocks 90.5%† | |
Brazil 6.9% | |
Autometal S.A. (Auto Components) | | | 376,031 | | | $ | 3,865,601 | |
Banco do Brasil S.A. (Commercial Banks) | | | 28,400 | | | | 362,301 | |
Banco Santander Brasil S.A., ADR (Commercial Banks) (a) | | | 193,600 | | | | 1,407,472 | |
Bematech S.A. (Computers & Peripherals) | | | 12,500 | | | | 35,050 | |
BrasilAgro—Companhia Brasileira de Propriedades Agricolas (Food Products) (b) | | | 12,600 | | | | 61,573 | |
Braskem S.A., Sponsored ADR (Chemicals) (a) | | | 13,281 | | | | 177,301 | |
Brookfield Incorporacoes S.A. (Household Durables) | | | 123,416 | | | | 211,116 | |
Cia Providencia Industria e Comercio S.A. (Textiles, Apparel & Luxury Goods) | | | 14,400 | | | | 63,139 | |
Cyrela Brazil Realty S.A. Empreendimentos e Participacoes (Household Durables) | | | 357,700 | | | | 3,153,452 | |
Embraer S.A. (Aerospace & Defense) | | | 860,520 | | | | 6,157,687 | |
Even Construtora e Incorporadora S.A. (Household Durables) | | | 541,500 | | | | 2,507,424 | |
Fibria Celulose S.A., Sponsored ADR (Paper & Forest Products) (a)(b) | | | 84,978 | | | | 966,200 | |
Gafisa S.A., ADR (Household Durables) (a)(b) | | | 83,400 | | | | 387,810 | |
Gerdau S.A. (Metals & Mining) | | | 17,100 | | | | 131,293 | |
Gerdau S.A., Sponsored ADR (Metals & Mining) (a) | | | 48,512 | | | | 436,123 | |
Industrias Romi S.A. (Machinery) (b) | | | 3,600 | | | | 8,057 | |
JBS S.A. (Food Products) (b) | | | 160,000 | | | | 475,156 | |
Kepler Weber S.A. (Machinery) | | | 4,400 | | | | 26,143 | |
Log-in Logistica Intermodal S.A. (Air Freight & Logistics) (b) | | | 1,900 | | | | 7,932 | |
Magnesita Refratarios S.A. (Construction Materials) | | | 29,271 | | | | 118,638 | |
Marfrig Alimentos S.A. (Food Products) (b) | | | 53,600 | | | | 227,379 | |
MMX Mineracao e Metalicos S.A. (Metals & Mining) (b) | | | 800,100 | | | | 1,761,562 | |
OSX Brasil S.A. (Energy Equipment & Services) (b) | | | 6,600 | | | | 34,782 | |
Paranapanema S.A. (Metals & Mining) (b) | | | 48,800 | | | | 119,764 | |
PDG Realty S.A. Empreendimentos e Participacoes (Household Durables) | | | 292,740 | | | | 483,954 | |
Petroleo Brasileiro S.A., Sponsored ADR (Oil, Gas & Consumable Fuels) (a) | | | 151,615 | | | | 2,926,170 | |
Petroleo Brasileiro S.A., ADR (Oil, Gas & Consumable Fuels) (a) | | | 89,700 | | | | 1,746,459 | |
Plascar Participacoes Industriais S.A. (Auto Components) | | | 23,100 | | | | 4,595 | |
Positivo Informatica S.A. (Computers & Peripherals) (b) | | | 9,900 | | | | 24,347 | |
| | | | | | | | |
| | |
Shares | | | Value | |
Brazil (continued) | |
Profarma Distribuidora de Produtos Farmaceuticos S.A. (Health Care Providers & Services) | | | 100 | | | $ | 706 | |
Rodobens Negocios Imobiliarios S.A. (Household Durables) | | | 2,000 | | | | 12,400 | |
Rossi Residencial S.A. (Household Durables) | | | 67,300 | | | | 152,554 | |
Rossi Residencial S.A. RCT Shares (Household Durables) (b) | | | 37,540 | | | | 80,305 | |
SLC Agricola S.A. (Food Products) | | | 13,908 | | | | 134,988 | |
Sul America S.A. (Insurance) | | | 273,850 | | | | 2,381,251 | |
Tecnisa S.A. (Household Durables) | | | 5,700 | | | | 22,877 | |
Tereos Internacional S.A. (Food Products) | | | 16,700 | | | | 25,365 | |
TPI—Triunfo Participacoes e Investimentos S.A. (Transportation Infrastructure) | | | 7,500 | | | | 45,720 | |
Vanguarda Agro S.A. (Oil, Gas & Consumable Fuels) (b) | | | 873,902 | | | | 175,092 | |
Viver Incorporadora e Construtora S.A. (Miscellaneous) (b) | | | 50,418 | | | | 15,645 | |
| | | | | | | | |
| | | | 30,935,383 | |
| | | | | | | | |
Chile 2.8% | |
Aguas Andinas S.A. Class A (Water Utilities) | | | 2,018,698 | | | | 1,440,361 | |
¨Cia Cervecerias Unidas S.A., ADR (Beverages) (a) | | | 282,863 | | | | 8,946,941 | |
Cia General de Electricidad S.A. (Electric Utilities) | | | 966 | | | | 5,585 | |
Cia Sud Americana de Vapores S.A. (Marine) (b) | | | 394,861 | | | | 35,467 | |
Corpbanca SA/Chile, ADR (Commercial Banks) (a) | | | 800 | | | | 16,200 | |
Empresas CMPC S.A. (Paper & Forest Products) | | | 192,421 | | | | 713,608 | |
Empresas COPEC S.A. (Oil, Gas & Consumable Fuels) | | | 13,438 | | | | 190,931 | |
Empresas Iansa S.A. (Food Products) | | | 96,500 | | | | 7,057 | |
Enersis S.A., Sponsored ADR (Electric Utilities) (a) | | | 45,512 | | | | 829,229 | |
Inversiones Aguas Metropolitanas S.A. (Water Utilities) | | | 45,408 | | | | 91,730 | |
Masisa S.A. (Paper & Forest Products) | | | 376,562 | | | | 39,631 | |
Ripley Corp. S.A. (Multiline Retail) | | | 62,190 | | | | 59,415 | |
Socovesa S.A. (Household Durables) | | | 26,762 | | | | 12,799 | |
Vina Concha y Toro S.A. (Beverages) | | | 23,675 | | | | 45,603 | |
| | | | | | | | |
| | | | 12,434,557 | |
| | | | | | | | |
China 16.1% | |
Agile Property Holdings, Ltd. (Real Estate Management & Development) | | | 130,000 | | | | 186,109 | |
Agricultural Bank of China, Ltd. Class H (Commercial Banks) | | | 1,887,000 | | | | 951,390 | |
| † | Percentages indicated are based on Portfolio net assets. |
| ¨ | | Among the Portfolio’s 10 largest holdings, as of December 31, 2012, excluding short-term investment. May be subject to change daily. |
| | | | |
| M-106 | | MainStay VP DFA / DuPont Capital Emerging Markets Equity Portfolio | | The notes to the financial statements are an integral part of,
and should be read in conjunction with, the financial statements. |
| | | | | | | | |
| | |
Shares | | | Value | |
| Common Stocks (continued) | |
China (continued) | |
Aluminum Corp. of China, Ltd., ADR (Metals & Mining) (a)(b) | | | 3,800 | | | $ | 45,258 | |
AMVIG Holdings, Ltd. (Containers & Packaging) | | | 60,000 | | | | 21,965 | |
Angang Steel Co., Ltd. Class H (Metals & Mining) (b) | | | 112,000 | | | | 85,052 | |
Asia Cement China Holdings Corp. (Construction Materials) | | | 66,000 | | | | 33,114 | |
Asian Citrus Holdings, Ltd. (Food Products) | | | 69,000 | | | | 32,827 | |
Bank of China, Ltd. Class H (Commercial Banks) | | | 6,844,000 | | | | 3,116,188 | |
Bank of Communications Co., Ltd. Class H (Commercial Banks) | | | 747,000 | | | | 569,814 | |
BBMG Corp. Class H (Construction Materials) | | | 42,500 | | | | 39,405 | |
Beijing Capital International Airport Co., Ltd. Class H (Transportation Infrastructure) | | | 194,000 | | | | 140,056 | |
Beijing Capital Land, Ltd. Class H (Real Estate Management & Development) | | | 90,000 | | | | 37,805 | |
Beijing Enterprises Holdings, Ltd. (Industrial Conglomerates) | | | 9,500 | | | | 62,223 | |
BYD Electronic International Co., Ltd. (Communications Equipment) | | | 89,000 | | | | 23,562 | |
China Aerospace International Holdings, Ltd. (Electronic Equipment & Instruments) | | | 420,000 | | | | 38,067 | |
China Agri-Industries Holdings, Ltd. (Food Products) | | | 215,800 | | | | 121,358 | |
China All Access Holdings, Ltd. (Communications Equipment) | | | 134,000 | | | | 31,615 | |
China Aoyuan Property Group, Ltd. (Real Estate Management & Development) | | | 222,000 | | | | 42,455 | |
China Automation Group, Ltd. (Machinery) | | | 110,000 | | | | 31,136 | |
China Citic Bank Corp., Ltd. Class H (Commercial Banks) | | | 761,000 | | | | 458,629 | |
China Coal Energy Co., Ltd. (Oil, Gas & Consumable Fuels) | | | 339,000 | | | | 379,026 | |
China Communications Construction Co., Ltd. Class H (Construction & Engineering) | | | 452,000 | | | | 443,257 | |
China Communications Services Corp., Ltd. Class H (Diversified Telecommunication Services) | | | 244,000 | | | | 142,085 | |
China Dongxiang Group Co. (Textiles, Apparel & Luxury Goods) | | | 165,000 | | | | 22,268 | |
China Everbright, Ltd. (Capital Markets) | | | 88,000 | | | | 172,973 | |
China Glass Holdings, Ltd. (Building Products) | | | 172,000 | | | | 26,587 | |
China Green Holdings, Ltd. (Food Products) (b) | | | 102,000 | | | | 20,533 | |
China High Speed Transmission Equipment Group Co., Ltd. (Electrical Equipment) (b) | | | 95,000 | | | | 37,804 | |
China Hongqiao Group, Ltd. (Metals & Mining) | | | 121,500 | | | | 64,894 | |
China ITS Holdings Co., Ltd. (IT Services) (b) | | | 177,000 | | | | 34,477 | |
| | | | | | | | |
| | |
Shares | | | Value | |
China (continued) | |
China Lumena New Materials Corp. (Chemicals) | | | 260,000 | | | $ | 57,831 | |
China Merchants Bank Co., Ltd. Class H (Commercial Banks) | | | 151,000 | | | | 338,232 | |
China Metal Recycling Holdings, Ltd. (Metals & Mining) | | | 75,000 | | | | 78,696 | |
China Minsheng Banking Corp., Ltd. Class H (Commercial Banks) | | | 380,000 | | | | 448,767 | |
¨China Mobile, Ltd. (Wireless Telecommunication Services) | | | 1,246,000 | | | | 14,595,460 | |
China National Materials Co., Ltd. Class H (Machinery) | | | 101,000 | | | | 31,774 | |
China Oil and Gas Group, Ltd. (Gas Utilities) (b) | | | 20,000 | | | | 3,355 | |
China Overseas Land & Investment, Ltd. (Real Estate Management & Development) | | | 626,000 | | | | 1,896,258 | |
¨China Petroleum & Chemical Corp. Class H (Oil, Gas & Consumable Fuels) | | | 7,128,000 | | | | 8,183,752 | |
China Properties Group, Ltd. (Real Estate Management & Development) (b) | | | 124,000 | | | | 39,116 | |
China Railway Construction Corp., Ltd. Class H (Construction & Engineering) | | | 202,000 | | | | 232,314 | |
China Rare Earth Holdings, Ltd. (Metals & Mining) | | | 130,000 | | | | 29,056 | |
China Rongsheng Heavy Industries Group Holdings, Ltd. (Machinery) | | | 102,000 | | | | 16,720 | |
China SCE Property Holdings, Ltd. (Real Estate Management & Development) | | | 147,000 | | | | 36,474 | |
China Shipping Container Lines Co., Ltd. Class H (Marine) (b) | | | 364,000 | | | | 107,081 | |
China Shipping Development Co., Ltd. Class H (Marine) | | | 134,000 | | | | 78,708 | |
China South City Holdings, Ltd. (Real Estate Management & Development) | | | 180,000 | | | | 27,537 | |
China Southern Airlines Co., Ltd. Class H (Airlines) | | | 188,000 | | | | 96,369 | |
China Tontine Wines Group, Ltd. (Beverages) | | | 298,000 | | | | 29,922 | |
China Travel International Inv HK (Hotels, Restaurants & Leisure) | | | 290,000 | | | | 60,142 | |
China Unicom Hong Kong, Ltd., ADR (Diversified Telecommunication Services) (a) | | | 60,300 | | | | 982,287 | |
China Vanadium Titano—Magnetite Mining Co., Ltd. (Metals & Mining) | | | 138,000 | | | | 33,111 | |
China Yurun Food Group, Ltd. (Food Products) (b) | | | 166,000 | | | | 123,686 | |
China ZhengTong Auto Services Holdings, Ltd. (Specialty Retail) (b) | | | 84,000 | | | | 59,628 | |
China Zhongwang Holdings, Ltd. (Metals & Mining) (b) | | | 166,000 | | | | 62,420 | |
| | | | | | |
The notes to the financial statements are an integral part of,
and should be read in conjunction with, the financial statements. | | mainstayinvestments.com | | | M-107 | |
Portfolio of Investments December 31, 2012 (continued)
| | | | | | | | |
| | |
Shares | | | Value | |
| Common Stocks (continued) | |
China (continued) | |
Chongqing Machinery & Electric Co., Ltd. Class H (Industrial Conglomerates) | | | 168,000 | | | $ | 28,260 | |
Citic Pacific, Ltd. (Industrial Conglomerates) | | | 131,000 | | | | 198,177 | |
Citic Resources Holdings, Ltd. (Trading Companies & Distributors) (b) | | | 284,000 | | | | 44,193 | |
Comba Telecom Systems Holdings, Ltd. (Communications Equipment) | | | 158,000 | | | | 58,247 | |
COSCO Pacific, Ltd. (Transportation Infrastructure) | | | 171,175 | | | | 248,382 | |
Daqing Dairy Holdings, Ltd. (Food Products) (b)(c)(d) | | | 157,000 | | | | 2 | |
Dongfeng Motor Group Co., Ltd. Class H (Automobiles) | | | 3,850,000 | | | | 6,062,672 | |
Fosun International, Ltd. (Metals & Mining) | | | 72,000 | | | | 46,265 | |
Franshion Properties China, Ltd. (Real Estate Management & Development) | | | 140,000 | | | | 50,815 | |
GCL-Poly Energy Holdings, Ltd. (Semiconductors & Semiconductor Equipment) | | | 670,000 | | | | 138,235 | |
Global Bio-Chem Technology Group Co., Ltd. (Food Products) | | | 200,000 | | | | 23,108 | |
Glorious Property Holdings, Ltd. (Real Estate Management & Development) (b) | | | 125,000 | | | | 23,896 | |
Golden Meditech Holdings, Ltd. (Health Care Equipment & Supplies) | | | 224,000 | | | | 22,949 | |
GOME Electrical Appliances Holdings, Ltd. (Specialty Retail) (b) | | | 756,000 | | | | 91,554 | |
Greentown China Holdings, Ltd. (Real Estate Management & Development) | | | 18,000 | | | | 33,557 | |
Guangshen Railway Co., Ltd., Sponsored ADR (Road & Rail) (a) | | | 2,500 | | | | 49,350 | |
Guangzhou Automobile Group Co., Ltd. Class H (Automobiles) | | | 174,000 | | | | 156,782 | |
Harbin Power Equipment Co., Ltd. Class H (Electrical Equipment) | | | 70,000 | | | | 61,133 | |
Heng Tai Consumables Group, Ltd. (Food & Staples Retailing) (b) | | | 1,035,000 | | | | 29,305 | |
Hidili Industry International Development, Ltd. (Oil, Gas & Consumable Fuels) | | | 107,000 | | | | 28,995 | |
HKC Holdings, Ltd. (Construction & Engineering) | | | 248,000 | | | | 9,296 | |
Hopson Development Holdings, Ltd. (Real Estate Management & Development) (b) | | | 28,000 | | | | 45,130 | |
Hua Han Bio-Pharmaceutical Holdings, Ltd. Class H (Pharmaceuticals) | | | 192,000 | | | | 58,641 | |
Ju Teng International Holdings, Ltd. (Electronic Equipment & Instruments) | | | 140,000 | | | | 67,195 | |
Kaisa Group Holdings, Ltd. (Real Estate Management & Development) (b) | | | 69,000 | | | | 21,733 | |
| | | | | | | | |
| | |
Shares | | | Value | |
China (continued) | |
Kingboard Chemical Holdings, Ltd. (Electronic Equipment & Instruments) | | | 49,000 | | | $ | 176,428 | |
Kingboard Laminates Holdings, Ltd. (Electronic Equipment & Instruments) | | | 108,000 | | | | 50,085 | |
KWG Property Holding, Ltd. (Real Estate Management & Development) | | | 77,500 | | | | 58,764 | |
Lee & Man Paper Manufacturing, Ltd. (Paper & Forest Products) | | | 107,000 | | | | 67,925 | |
Li Ning Co., Ltd. (Textiles, Apparel & Luxury Goods) (b) | | | 34,000 | | | | 22,527 | |
Lonking Holdings, Ltd. (Machinery) | | | 275,000 | | | | 74,121 | |
Maanshan Iron & Steel Class H (Metals & Mining) (b) | | | 176,000 | | | | 54,703 | |
Maoye International Holdings, Ltd. (Multiline Retail) | | | 135,000 | | | | 27,937 | |
Metallurgical Corp. of China, Ltd. Class H (Construction & Engineering) (b)(d) | | | 217,000 | | | | 42,380 | |
New World China Land, Ltd. (Real Estate Management & Development) | | | 98,000 | | | | 47,669 | |
Nine Dragons Paper Holdings, Ltd. (Paper & Forest Products) | | | 167,000 | | | | 154,701 | |
Pacific Basin Shipping, Ltd. (Marine) | | | 4,471,000 | | | | 2,541,146 | |
PCD Stores Group, Ltd. (Multiline Retail) | | | 312,000 | | | | 38,314 | |
Peak Sport Products Co., Ltd. (Textiles, Apparel & Luxury Goods) | | | 117,000 | | | | 23,061 | |
¨PetroChina Co., Ltd. Class H (Oil, Gas & Consumable Fuels) | | | 6,291,550 | | | | 9,003,606 | |
Poly Hong Kong Investments, Ltd. (Real Estate Management & Development) (b) | | | 174,000 | | | | 138,489 | |
Real Nutriceutical Group, Ltd. (Personal Products) | | | 97,000 | | | | 35,743 | |
Renhe Commercial Holdings Co., Ltd. (Real Estate Management & Development) (b) | | | 1,082,000 | | | | 116,280 | |
REXLot Holdings, Ltd. (Hotels, Restaurants & Leisure) | | | 650,000 | | | | 49,634 | |
Samson Holding, Ltd. (Household Durables) | | | 212,000 | | | | 35,274 | |
Semiconductor Manufacturing International Corp. (Semiconductors & Semiconductor Equipment) (b) | | | 1,970,000 | | | | 99,517 | |
Shandong Chenming Paper Holdings, Ltd. Class H (Paper & Forest Products) | | | 69,000 | | | | 27,274 | |
Shanghai Industrial Holdings, Ltd. (Industrial Conglomerates) | | | 56,000 | | | | 197,864 | |
Shanghai Jin Jiang International Hotels Group Co., Ltd. Class H (Hotels, Restaurants & Leisure) | | | 236,000 | | | | 45,211 | |
Shengli Oil & Gas Pipe Holdings, Ltd. (Energy Equipment & Services) | | | 277,500 | | | | 29,851 | |
Shenzhen Investment, Ltd. (Real Estate Management & Development) | | | 230,799 | | | | 94,773 | |
| | | | |
| M-108 | | MainStay VP DFA / DuPont Capital Emerging Markets Equity Portfolio | | The notes to the financial statements are an integral part of,
and should be read in conjunction with, the financial statements. |
| | | | | | | | |
| | |
Shares | | | Value | |
| Common Stocks (continued) | |
China (continued) | |
Shimao Property Holdings, Ltd. (Real Estate Management & Development) | | | 73,000 | | | $ | 140,947 | |
Shougang Fushan Resources Group, Ltd. (Metals & Mining) | | | 304,000 | | | | 113,158 | |
Shui On Land, Ltd. (Real Estate Management & Development) | | | 172,000 | | | | 83,611 | |
Sino Oil And Gas Holdings, Ltd. (Oil, Gas & Consumable Fuels) (b) | | | 985,000 | | | | 24,524 | |
Sino-Ocean Land Holdings, Ltd. (Real Estate Management & Development) | | | 352,955 | | | | 270,837 | |
Sinofert Holdings, Ltd. (Chemicals) | | | 216,000 | | | | 53,182 | |
Sinotrans Shipping, Ltd. (Marine) | | | 133,000 | | | | 32,377 | |
Sinotruk Hong Kong, Ltd. (Machinery) | | | 3,136,000 | | | | 2,413,179 | |
Skyworth Digital Holdings, Ltd. (Household Durables) | | | 198,134 | | | | 102,605 | |
Soho China, Ltd. (Real Estate Management & Development) | | | 212,500 | | | | 171,657 | |
Sunac China Holdings, Ltd. (Real Estate Management & Development) | | | 18,000 | | | | 14,037 | |
TCC International Holdings, Ltd. (Construction Materials) | | | 102,000 | | | | 29,691 | |
TCL Communication Technology Holdings, Ltd. (Communications Equipment) | | | 31,000 | | | | 9,902 | |
Tiangong International Co., Ltd. (Metals & Mining) | | | 152,000 | | | | 36,759 | |
Tianjin Port Development Holdings, Ltd. (Transportation Infrastructure) | | | 204,000 | | | | 29,286 | |
TPV Technology, Ltd. (Computers & Peripherals) | | | 82,000 | | | | 22,360 | |
Travelsky Technology, Ltd. Class H (IT Services) | | | 96,000 | | | | 51,885 | |
Truly International Holdings (Electronic Equipment & Instruments) | | | 190,000 | | | | 43,306 | |
VODone, Ltd. (Media) | | | 222,000 | | | | 21,560 | |
Wasion Group Holdings, Ltd. (Electronic Equipment & Instruments) | | | 80,000 | | | | 37,630 | |
Weichai Power Co., Ltd. Class H (Machinery) | | | 1,083,000 | | | | 4,925,055 | |
Weiqiao Textile Co. Class H (Textiles, Apparel & Luxury Goods) | | | 64,000 | | | | 25,371 | |
Xingda International Holdings, Ltd. (Auto Components) | | | 86,000 | | | | 44,840 | |
Yanchang Petroleum International, Ltd. (Oil, Gas & Consumable Fuels) (b) | | | 70,000 | | | | 5,115 | |
Yanzhou Coal Mining Co., Ltd. Class H (Oil, Gas & Consumable Fuels) | | | 4,112,000 | | | | 6,944,479 | |
Yuexiu Property Co., Ltd. (Real Estate Management & Development) | | | 524,000 | | | | 167,779 | |
| | | | | | | | |
| | | | 71,726,909 | |
| | | | | | | | |
| | | | | | | | |
| | |
Shares | | | Value | |
Colombia 1.9% | |
¨BanColombia S.A., Sponsored ADR (Commercial Banks) (a) | | | 128,983 | | | $ | 8,587,688 | |
Grupo De Inversiones Suramericana S.A. (Diversified Financial Services) | | | 1,049 | | | | 22,604 | |
Grupo Nutresa S.A. (Food Products) | | | 1,893 | | | | 27,279 | |
| | | | | | | | |
| | | | 8,637,571 | |
| | | | | | | | |
Czech Republic 1.5% | |
Komercni Banka A.S. (Commercial Banks) | | | 31,539 | | | | 6,673,270 | |
Unipetrol AS (Chemicals) (b) | | | 10,000 | | | | 92,465 | |
| | | | | | | | |
| | | | 6,765,735 | |
| | | | | | | | |
Egypt 0.3% | |
Ezz Steel (Metals & Mining) | | | 932,767 | | | | 1,466,615 | |
| | | | | | | | |
|
Hungary 0.6% | |
EGIS Pharmaceuticals PLC (Pharmaceuticals) | | | 24,817 | | | | 1,986,712 | |
OTP Bank PLC (Commercial Banks) | | | 29,644 | | | | 563,444 | |
| | | | | | | | |
| | | | 2,550,156 | |
| | | | | | | | |
India 2.8% | |
ICICI Bank, Ltd., Sponsored ADR (Commercial Banks) (a) | | | 56,695 | | | | 2,472,469 | |
¨Reliance Industries, Ltd., Sponsored GDR (Oil, Gas & Consumable Fuels) (e)(f) | | | 308,020 | | | | 9,499,479 | |
State Bank Of India, GDR (Commercial Banks) (e) | | | 657 | | | | 58,900 | |
Sterlite Industries India, Ltd., ADR (Metals & Mining) (a) | | | 48,003 | | | | 413,306 | |
Tata Steel, Ltd., GDR (Metals & Mining) (e) | | | 21,252 | | | | 168,953 | |
| | | | | | | | |
| | | | 12,613,107 | |
| | | | | | | | |
Indonesia 3.1% | |
Adaro Energy Tbk PT (Oil, Gas & Consumable Fuels) | | | 946,000 | | | | 156,624 | |
Alam Sutera Realty Tbk PT (Real Estate Management & Development) | | | 990,000 | | | | 61,894 | |
Aneka Tambang Persero Tbk PT (Metals & Mining) | | | 613,500 | | | | 81,767 | |
Bakrie Sumatera Plantations Tbk PT (Food Products) | | | 1,887,000 | | | | 18,258 | |
Bakrie Telecom Tbk PT (Wireless Telecommunication Services) (b) | | | 2,068,500 | | | | 10,716 | |
Bank Bukopin Tbk PT (Commercial Banks) | | | 584,500 | | | | 37,563 | |
Bank Danamon Indonesia Tbk PT (Commercial Banks) | | | 321,500 | | | | 188,605 | |
Bank Negara Indonesia Persero Tbk PT (Commercial Banks) | | | 667,500 | | | | 257,231 | |
Bank Pan Indonesia Tbk PT (Commercial Banks) (b) | | | 389,000 | | | | 25,541 | |
Bank Rakyat Indonesia Persero Tbk PT (Commercial Banks) | | | 5,855,800 | | | | 4,264,615 | |
Bank Tabungan Negara PerseroTbk PT (Commercial Banks) | | | 436,223 | | | | 65,426 | |
| | | | | | |
The notes to the financial statements are an integral part of,
and should be read in conjunction with, the financial statements. | | mainstayinvestments.com | | | M-109 | |
Portfolio of Investments December 31, 2012 (continued)
| | | | | | | | |
| | |
Shares | | | Value | |
| Common Stocks (continued) | |
Indonesia (continued) | |
Barito Pacific Tbk PT (Chemicals) (b) | | | 358,000 | | | $ | 15,663 | |
Bhakti Investama Tbk PT (Media) | | | 932,000 | | | | 52,359 | |
Bisi International PT (Food Products) | | | 92,000 | | | | 7,570 | |
Borneo Lumbung Energi & Metal Tbk PT (Metals & Mining) (b) | | | 932,000 | | | | 52,496 | |
Bumi Serpong Damai PT (Real Estate Management & Development) | | | 124,000 | | | | 14,680 | |
Ciputra Development Tbk PT (Real Estate Management & Development) | | | 972,500 | | | | 80,434 | |
Ciputra Property Tbk PT (Real Estate Management & Development) | | | 565,000 | | | | 35,299 | |
Energi Mega Persada Tbk PT (Oil, Gas & Consumable Fuels) (b) | | | 5,217,000 | | | | 44,659 | |
Gajah Tunggal Tbk PT (Auto Components) | | | 226,500 | | | | 52,441 | |
Garuda Indonesia Persero Tbk PT (Airlines) (b) | | | 301,000 | | | | 20,753 | |
Global Mediacom Tbk PT (Media) | | | 306,500 | | | | 76,485 | |
Holcim Indonesia Tbk PT (Construction Materials) | | | 81,000 | | | | 24,410 | |
Indah Kiat Pulp & Paper Corp. Tbk PT (Paper & Forest Products) (b) | | | 439,000 | | | | 30,996 | |
Indika Energy Tbk PT (Oil, Gas & Consumable Fuels) | | | 287,500 | | | | 42,270 | |
Indo Tambangraya Megah Tbk PT (Oil, Gas & Consumable Fuels) | | | 824,500 | | | | 3,559,883 | |
Indofood Sukses Makmur Tbk PT (Food Products) | | | 416,000 | | | | 252,874 | |
Intiland Development Tbk PT (Real Estate Management & Development) | | | 876,000 | | | | 30,550 | |
Japfa Comfeed Indonesia Tbk PT (Food Products) | | | 40,000 | | | | 25,588 | |
Kawasan Industri Jababeka Tbk PT (Real Estate Management & Development) (b) | | | 3,458,000 | | | | 71,662 | |
Lippo Karawaci Tbk PT (Real Estate Management & Development) | | | 3,178,500 | | | | 330,161 | |
Matahari Putra Prima Tbk PT (Multiline Retail) | | | 241,500 | | | | 28,943 | |
Medco Energi Internasional Tbk PT (Oil, Gas & Consumable Fuels) | | | 233,000 | | | | 39,489 | |
Panin Financial Tbk PT (Insurance) (b) | | | 2,317,000 | | | | 32,514 | |
Pembangunan Perumahan Persero Tbk PT (Construction & Engineering) | | | 221,000 | | | | 19,325 | |
Perusahaan Perkebunan London Sumatra Indonesia Tbk PT (Food Products) | | | 128,500 | | | | 31,173 | |
Polychem Indonesia Tbk PT (Chemicals) (b) | | | 586,000 | | | | 22,234 | |
Ramayana Lestari Sentosa Tbk PT (Multiline Retail) | | | 239,500 | | | | 30,436 | |
Sampoerna Agro PT (Food Products) | | | 94,000 | | | | 24,569 | |
Sentul City Tbk PT (Real Estate Management & Development) (b) | | | 1,963,000 | | | | 38,636 | |
Tiga Pilar Sejahtera Food Tbk (Food Products) | | | 690,500 | | | | 77,510 | |
| | | | | | | | |
| | |
Shares | | | Value | |
Indonesia (continued) | |
Timah Persero Tbk PT (Metals & Mining) | | | 354,500 | | | $ | 56,889 | |
United Tractors Tbk PT (Machinery) | | | 578,000 | | | | 1,188,018 | |
Vale Indonesia Tbk PT (Metals & Mining) | | | 9,195,500 | | | | 2,256,093 | |
| | | | | | | | |
| | | | | | | 13,835,302 | |
| | | | | | | | |
Jordan 0.8% | | | | | | | | |
Hikma Pharmaceuticals PLC (Pharmaceuticals) | | | 298,266 | | | | 3,732,841 | |
| | | | | | | | |
| | |
Lebanon 0.1% | | | | | | | | |
Solidere, GDR (Real Estate Management & Development) (e) | | | 48,454 | | | | 633,642 | |
| | | | | | | | |
| | |
Malaysia 3.3% | | | | | | | | |
Affin Holdings BHD (Commercial Banks) | | | 48,200 | | | | 54,381 | |
AirAsia BHD (Airlines) | | | 50,200 | | | | 45,215 | |
Alliance Financial Group BHD (Commercial Banks) | | | 100,700 | | | | 145,008 | |
AMMB Holdings BHD (Diversified Financial Services) | | | 23,500 | | | | 52,198 | |
APM Automotive Holdings BHD (Auto Components) | | | 9,600 | | | | 14,681 | |
Berjaya Corp. BHD (Industrial Conglomerates) | | | 381,100 | | | | 73,399 | |
BIMB Holdings BHD (Commercial Banks) | | | 51,200 | | | | 47,065 | |
Boustead Holdings BHD (Industrial Conglomerates) | | | 58,300 | | | | 99,418 | |
Cahya Mata Sarawak BHD (Industrial Conglomerates) | | | 36,800 | | | | 40,115 | |
Coastal Contracts BHD (Machinery) | | | 45,900 | | | | 29,948 | |
DRB-Hicom BHD (Automobiles) | | | 108,900 | | | | 97,767 | |
Eastern & Oriental BHD (Real Estate Management & Development) | | | 38,200 | | | | 19,488 | |
Evergreen Fibreboard BHD (Paper & Forest Products) | | | 99,100 | | | | 18,730 | |
Faber Group BHD (Health Care Providers & Services) | | | 64,200 | | | | 30,481 | |
Genting BHD (Hotels, Restaurants & Leisure) | | | 2,032,000 | | | | 6,135,865 | |
Genting Malaysia BHD (Hotels, Restaurants & Leisure) | | | 81,200 | | | | 94,637 | |
Glomac BHD (Real Estate Management & Development) | | | 122,200 | | | | 33,170 | |
HAP Seng Consolidated BHD (Industrial Conglomerates) | | | 78,500 | | | | 44,804 | |
Hap Seng Plantations Holdings BHD (Food Products) | | | 10,600 | | | | 9,802 | |
Hong Leong Financial Group BHD (Commercial Banks) | | | 8,300 | | | | 35,870 | |
IGB Corp. BHD (Real Estate Management & Development) | | | 143,900 | | | | 108,628 | |
IJM Corp. BHD (Construction & Engineering) | | | 128,500 | | | | 209,878 | |
| | | | |
| M-110 | | MainStay VP DFA / DuPont Capital Emerging Markets Equity Portfolio | | The notes to the financial statements are an integral part of,
and should be read in conjunction with, the financial statements. |
| | | | | | | | |
| | |
Shares | | | Value | |
| Common Stocks (continued) | |
Malaysia (continued) | | | | | | | | |
IJM Land BHD (Real Estate Management & Development) | | | 44,200 | | | $ | 34,758 | |
Inch Kenneth Kajang Rubber BHD (Industrial Conglomerates) (b) | | | 130,800 | | | | 36,288 | |
Insas BHD (Industrial Conglomerates) (b) | | | 186,864 | | | | 26,975 | |
Iris Corp. BHD (Software) | | | 581,500 | | | | 32,451 | |
JAKS Resources BHD (Construction & Engineering) (b) | | | 176,800 | | | | 20,761 | |
Karambunai Corp. BHD (Hotels, Restaurants & Leisure) (b) | | | 613,700 | | | | 24,560 | |
Kian JOO CAN Factory BHD (Containers & Packaging) | | | 51,500 | | | | 37,668 | |
KNM Group BHD (Energy Equipment & Services) (b) | | | 120,800 | | | | 17,993 | |
KSL Holdings BHD (Real Estate Management & Development) (b) | | | 69,100 | | | | 32,564 | |
KUB Malaysia BHD (Industrial Conglomerates) (b) | | | 149,300 | | | | 20,008 | |
Kulim Malaysia BHD (Food Products) | | | 60,900 | | | | 98,007 | |
Kwantas Corp. BHD (Food Products) | | | 35,700 | | | | 22,064 | |
Lingui Development BHD (Paper & Forest Products) | | | 74,100 | | | | 38,780 | |
Lion Industries Corp. BHD (Metals & Mining) | | | 108,300 | | | | 35,080 | |
Malayan Banking BHD (Commercial Banks) | | | 1,545,440 | | | | 4,650,162 | |
Malayan Flour Mills BHD (Food Products) | | | 20,300 | | | | 8,512 | |
Malaysia Airports Holdings BHD (Transportation Infrastructure) | | | 5,400 | | | | 9,211 | |
Malaysian Bulk Carriers BHD (Marine) | | | 30,100 | | | | 13,132 | |
Malaysian Resources Corp. BHD (Construction & Engineering) | | | 146,000 | | | | 74,431 | |
MBM Resources BHD (Distributors) | | | 18,200 | | | | 19,073 | |
Media Prima BHD (Media) | | | 21,200 | | | | 16,223 | |
Metro Kajang Holdings BHD (Real Estate Management & Development) | | | 62,040 | | | | 36,417 | |
MISC BHD (Marine) (b) | | | 139,200 | | | | 196,203 | |
MMC Corp. BHD (Industrial Conglomerates) | | | 113,300 | | | | 97,528 | |
Mudajaya Group BHD (Construction & Engineering) | | | 49,100 | | | | 42,131 | |
Muhibbah Engineering M BHD (Construction & Engineering) | | | 77,300 | | | | 20,888 | |
Mulpha International BHD (Diversified Financial Services) (b) | | | 161,400 | | | | 20,571 | |
Multi-Purpose Holdings BHD (Diversified Financial Services) | | | 50,300 | | | | 57,540 | |
Naim Holdings BHD (Real Estate Management & Development) | | | 52,400 | | | | 30,288 | |
PPB Group BHD (Food Products) | | | 76,300 | | | | 289,775 | |
RHB Capital BHD (Commercial Banks) | | | 91,502 | | | | 230,347 | |
Salcon BHD (Water Utilities) | | | 166,400 | | | | 23,143 | |
Sarawak Plantation BHD (Food Products) | | | 30,200 | | | | 26,935 | |
| | | | | | | | |
| | |
Shares | | | Value | |
Malaysia (continued) | | | | | | | | |
Scomi Group BHD (Energy Equipment & Services) (b) | | | 139,000 | | | $ | 15,976 | |
Selangor Properties BHD (Real Estate Management & Development) | | | 31,300 | | | | 34,337 | |
Sunway BHD (Real Estate Management & Development) (b) | | | 41,000 | | | | 31,952 | |
Supermax Corp. BHD (Health Care Equipment & Supplies) | | | 40,000 | | | | 25,292 | |
TA Enterprise BHD (Hotels, Restaurants & Leisure) | | | 174,000 | | | | 29,035 | |
TAN Chong Motor Holdings BHD (Automobiles) | | | 22,200 | | | | 33,628 | |
TDM BHD (Food Products) | | | 5,000 | | | | 5,503 | |
Time dotCom BHD (Diversified Telecommunication Services) (b) | | | 14,340 | | | | 18,553 | |
Tradewinds Malaysia BHD (Food Products) | | | 14,400 | | | | 42,279 | |
Tradewinds Plantation BHD (Food Products) | | | 2,500 | | | | 3,371 | |
UEM Land Holdings BHD (Real Estate Management & Development) (b) | | | 109,500 | | | | 75,733 | |
Unisem M BHD (Semiconductors & Semiconductor Equipment) | | | 22,900 | | | | 6,425 | |
Wah Seong Corp. BHD (Energy Equipment & Services) | | | 54,900 | | | | 29,725 | |
WCT BHD (Construction & Engineering) | | | 97,060 | | | | 75,172 | |
YTL Corp. BHD (Multi-Utilities) | | | 527,360 | | | | 328,187 | |
| | | | | | | | |
| | | | | | | 14,536,183 | |
| | | | | | | | |
Mexico 4.8% | | | | | | | | |
Alfa S.A.B. de C.V. Class A (Industrial Conglomerates) | | | 498,400 | | | | 1,059,548 | |
America Movil S.A.B. de C.V. Series L (Wireless Telecommunication Services) | | | 6,341,620 | | | | 7,305,008 | |
Axtel S.A.B. de C.V. (Diversified Telecommunication Services) (b) | | | 141,000 | | | | 31,851 | |
Cemex S.A.B. de C.V., Sponsored ADR (Construction Materials) (a)(b) | | | 152,736 | | | | 1,507,504 | |
Cia Minera Autlan S.A.B. de C.V. (Metals & Mining) | | | 21,790 | | | | 23,162 | |
Consorcio ARA S.A.B. de C.V. (Household Durables) (b) | | | 108,695 | | | | 34,728 | |
Controladora Comercial Mexicana S.A.B. de C.V. (Food & Staples Retailing) | | | 73,300 | | | | 256,652 | |
Corporacion GEO S.A.B. de C.V. (Household Durables) (b) | | | 88,600 | | | | 103,636 | |
Desarrolladora Homex S.A.B. de C.V., ADR (Household Durables) (a)(b) | | | 6,900 | | | | 86,112 | |
Empresas ICA S.A.B. de C.V., Sponsored ADR (Construction & Engineering) (a)(b) | | | 27,400 | | | | 275,644 | |
Gruma S.A.B. de C.V. Class B (Food Products) (b) | | | 21,500 | | | | 65,167 | |
Grupo Aeromexico S.A.B. de C.V. (Airlines) (b) | | | 800 | | | | 1,194 | |
Grupo Aeroportuario del Centro Norte S.A.B. de C.V. (Transportation Infrastructure) | | | 15,300 | | | | 41,546 | |
| | | | | | |
The notes to the financial statements are an integral part of,
and should be read in conjunction with, the financial statements. | | mainstayinvestments.com | | | M-111 | |
Portfolio of Investments December 31, 2012 (continued)
| | | | | | | | |
| | |
Shares | | | Value | |
| Common Stocks (continued) | |
Mexico (continued) | | | | | | | | |
Grupo Aeroportuario del Pacifico S.A.B. de C.V. Class B (Transportation Infrastructure) | | | 66,213 | | | $ | 378,183 | |
Grupo Aeroportuario del Sureste S.A.B. de C.V., ADR (Transportation Infrastructure) (a) | | | 4,000 | | | | 456,000 | |
Grupo Comercial Chedraui S.A. de C.V. (Food & Staples Retailing) | | | 31,400 | | | | 102,025 | |
Grupo Famsa S.A.B. de C.V. Class A (Multiline Retail) (b) | | | 1,000 | | | | 1,245 | |
Grupo Financiero Banorte S.A.B. de C.V. Class O (Commercial Banks) | | | 277,268 | | | | 1,790,424 | |
Grupo Simec S.A.B. de C.V. Series B (Metals & Mining) (b) | | | 17,499 | | | | 82,850 | |
Industrias Bachoco S.A.B. de C.V., ADR (Food Products) (a) | | | 3,919 | | | | 109,419 | |
Industrias CH S.A.B. de C.V. Series B (Metals & Mining) (b) | | | 33,100 | | | | 249,691 | |
Kimberly-Clark de Mexico S.A.B. de C.V. Class A (Household Products) | | | 164,600 | | | | 422,760 | |
Megacable Holdings S.A.B. de C.V. (Media) | | | 82,100 | | | | 204,515 | |
OHL Mexico S.A.B. de C.V. (Transportation Infrastructure) (b) | | | 84,900 | | | | 186,334 | |
Organizacion Soriana S.A.B. de C.V. Class B (Food & Staples Retailing) | | | 58,041 | | | | 221,364 | |
Ternium S.A., Sponsored ADR (Metals & Mining) (a) | | | 257,948 | | | | 6,074,675 | |
TV Azteca S.A.B. de C.V. (Media) | | | 83,664 | | | | 54,562 | |
Urbi Desarrollos Urbanos S.A.B. de C.V. (Household Durables) (b) | | | 101,900 | | | | 63,932 | |
| | | | | | | | |
| | | | | | | 21,189,731 | |
| | | | | | | | |
Panama 1.3% | | | | | | | | |
Copa Holdings S.A. Class A (Airlines) | | | 56,181 | | | | 5,587,201 | |
| | | | | | | | |
| | |
Philippines 0.4% | | | | | | | | |
Alliance Global Group, Inc. (Industrial Conglomerates) | | | 481,900 | | | | 196,943 | |
Atlas Consolidated Mining & Development (Metals & Mining) (b) | | | 32,500 | | | | 14,800 | |
Cebu Air, Inc. (Airlines) | | | 5,000 | | | | 7,542 | |
China Banking Corp. (Commercial Banks) | | | 32,230 | | | | 42,993 | |
Filinvest Land, Inc. (Real Estate Management & Development) | | | 1,563,000 | | | | 56,797 | |
First Philippine Holdings Corp. (Electric Utilities) | | | 22,100 | | | | 48,446 | |
Global-Estate Resorts, Inc. (Real Estate Management & Development) (b) | | | 570,000 | | | | 27,288 | |
Globe Telecom, Inc. (Wireless Telecommunication Services) | | | 29,185 | | | | 778,138 | |
JG Summit Holdings, Inc. (Industrial Conglomerates) | | | 101,200 | | | | 97,469 | |
| | | | | | | | |
| | |
Shares | | | Value | |
Philippines (continued) | | | | | | | | |
Lopez Holdings Corp. (Media) | | | 114,200 | | | $ | 17,489 | |
Megaworld Corp. (Real Estate Management & Development) | | | 1,521,000 | | | | 102,767 | |
Philippine National Bank (Commercial Banks) (b) | | | 22,810 | | | | 50,525 | |
Robinsons Land Corp. (Real Estate Management & Development) | | | 51,500 | | | | 25,991 | |
San Miguel Corp. (Industrial Conglomerates) | | | 69,920 | | | | 179,594 | |
SM Development Corp. (Real Estate Management & Development) | | | 146,600 | | | | 21,037 | |
Vista Land & Lifescapes, Inc. (Real Estate Management & Development) | | | 484,000 | | | | 57,362 | |
| | | | | | | | |
| | | | | | | 1,725,181 | |
| | | | | | | | |
Poland 4.1% | | | | | | | | |
Asseco Poland S.A. (Software) | | | 7,269 | | | | 106,210 | |
Bank Handlowy w Warszawie S.A. (Commercial Banks) | | | 160,761 | | | | 5,130,568 | |
Bank Pekao S.A. (Commercial Banks) | | | 102,421 | | | | 5,587,628 | |
Ciech S.A. (Chemicals) (b) | | | 4,553 | | | | 32,856 | |
Enea S.A. (Electric Utilities) | | | 10,613 | | | | 54,285 | |
Getin Holding S.A. (Commercial Banks) (b) | | | 17,377 | | | | 15,960 | |
Grupa Lotos S.A. (Oil, Gas & Consumable Fuels) (b) | | | 282,934 | | | | 3,790,393 | |
Kopex S.A. (Machinery) (b) | | | 2,064 | | | | 11,853 | |
Petrolinvest S.A. (Oil, Gas & Consumable Fuels) (b) | | | 44,142 | | | | 20,043 | |
PGE S.A. (Electric Utilities) | | | 86,246 | | | | 508,507 | |
Polimex-Mostostal S.A. (Construction & Engineering) (b) | | | 58,304 | | | | 11,793 | |
Polski Koncern Naftowy Orlen S.A. (Oil, Gas & Consumable Fuels) (b) | | | 42,274 | | | | 683,214 | |
Tauron Polska Energia S.A. (Electric Utilities) | | | 138,576 | | | | 212,942 | |
Telekomunikacja Polska S.A. (Diversified Telecommunication Services) | | | 586,997 | | | | 2,325,262 | |
Zaklady Azotowe Pulawy S.A. (Chemicals) | | | 75 | | | | 3,346 | |
| | | | | | | | |
| | | | | | | 18,494,860 | |
| | | | | | | | |
Republic of Korea 11.8% | | | | | | | | |
AUK Corp. (Semiconductors & Semiconductor Equipment) (b) | | | 11,290 | | | | 19,348 | |
China Ocean Resources Co., Ltd. (Food Products) | | | 7,670 | | | | 17,736 | |
CJ Corp. (Industrial Conglomerates) | | | 1,364 | | | | 152,194 | |
CJ E&M Corp. (Media) (b) | | | 660 | | | | 16,417 | |
Cosmochemical Co., Ltd. (Chemicals) (b) | | | 2,200 | | | | 19,214 | |
Dae Han Flour Mills Co., Ltd. (Food Products) | | | 258 | | | | 33,589 | |
Daechang Co., Ltd. (Metals & Mining) (b) | | | 25,940 | | | | 31,646 | |
Daelim Industrial Co., Ltd. (Construction & Engineering) | | | 3,531 | | | | 290,077 | |
Daishin Securities Co., Ltd. (Capital Markets) | | | 3,040 | | | | 28,429 | |
Dongbu Securities Co., Ltd. (Capital Markets) | | | 7,510 | | | | 25,419 | |
| | | | |
| M-112 | | MainStay VP DFA / DuPont Capital Emerging Markets Equity Portfolio | | The notes to the financial statements are an integral part of,
and should be read in conjunction with, the financial statements. |
| | | | | | | | |
| | |
Shares | | | Value | |
| Common Stocks (continued) | |
Republic of Korea (continued) | | | | | | | | |
Dongkuk Steel Mill Co., Ltd. (Metals & Mining) | | | 4,860 | | | $ | 62,735 | |
Dongwha Pharm Co., Ltd. (Pharmaceuticals) | | | 7,240 | | | | 40,989 | |
Doosan Corp. (Industrial Conglomerates) | | | 200 | | | | 24,265 | |
Doosan Engineering & Construction Co., Ltd. (Construction & Engineering) (b) | | | 11,120 | | | | 26,218 | |
Eugene Investment & Securities Co., Ltd. (Capital Markets) (b) | | | 10,150 | | | | 24,775 | |
GS Holdings (Oil, Gas & Consumable Fuels) | | | 6,691 | | | | 453,127 | |
Gwangju Shinsegae Co., Ltd. (Multiline Retail) | | | 158 | | | | 34,366 | |
Hana Financial Group, Inc. (Commercial Banks) | | | 28,640 | | | | 936,286 | |
Hanil Cement Co., Ltd. (Construction Materials) | | | 635 | | | | 28,802 | |
Hanjin Heavy Industries & Construction Co., Ltd. (Machinery) (b) | | | 4,110 | | | | 48,413 | |
Hanjin Shipping Co., Ltd. (Marine) (b) | | | 10,650 | | | | 120,294 | |
Hanjin Transportation Co., Ltd. (Air Freight & Logistics) | | | 1,660 | | | | 30,759 | |
Hansol Paper Co. (Paper & Forest Products) | | | 4,580 | | | | 39,041 | |
Hanwha Chemical Corp. (Chemicals) | | | 11,020 | | | | 190,415 | |
Hanwha Corp. (Chemicals) | | | 3,560 | | | | 114,517 | |
Hanwha Securities Co. (Capital Markets) | | | 7,600 | | | | 30,098 | |
HMC Investment Securities Co., Ltd. (Capital Markets) | | | 2,540 | | | | 34,038 | |
Hyosung Corp. (Chemicals) | | | 2,989 | | | | 207,284 | |
Hyundai BNG Steel Co., Ltd. (Metals & Mining) (b) | | | 2,770 | | | | 26,323 | |
Hyundai Development Co. (Construction & Engineering) | | | 7,400 | | | | 150,979 | |
Hyundai Heavy Industries Co., Ltd. (Machinery) | | | 33,532 | | | | 7,651,080 | |
Hyundai Mobis (Auto Components) | | | 19,263 | | | | 5,224,640 | |
Hyundai Securities Co., Ltd. (Capital Markets) | | | 14,040 | | | | 119,068 | |
Hyundai Steel Co. (Metals & Mining) | | | 7,261 | | | | 600,133 | |
Industrial Bank of Korea (Commercial Banks) | | | 21,450 | | | | 238,922 | |
ISU Chemical Co., Ltd. (Chemicals) | | | 1,460 | | | | 29,965 | |
Jeonbuk Bank (Commercial Banks) | | | 8,110 | | | | 31,823 | |
JW Pharmaceutical Corp. (Pharmaceuticals) | | | 2,446 | | | | 32,385 | |
KB Financial Group, Inc. (Commercial Banks) | | | 48,060 | | | | 1,714,800 | |
KCC Corp. (Building Products) | | | 552 | | | | 153,781 | |
Keangnam Enterprises, Ltd. (Construction & Engineering) | | | 3,550 | | | | 17,816 | |
KISWIRE, Ltd. (Metals & Mining) | | | 940 | | | | 27,072 | |
Kolon Industries, Inc. (Chemicals) | | | 2,297 | | | | 137,310 | |
Korea Investment Holdings Co., Ltd. (Capital Markets) | | | 5,120 | | | | 205,317 | |
Korea Life Insurance Co., Ltd. (Insurance) | | | 19,850 | | | | 144,286 | |
KTB Investment & Securities Co., Ltd. (Capital Markets) (b) | | | 16,210 | | | | 34,351 | |
| | | | | | | | |
| | |
Shares | | | Value | |
Republic of Korea (continued) | | | | | | | | |
Kumho Electric Co., Ltd. (Electrical Equipment) | | | 1,440 | | | $ | 28,997 | |
Kyobo Securities Co. (Capital Markets) | | | 6,510 | | | �� | 29,530 | |
LG Corp. (Industrial Conglomerates) | | | 505 | | | | 30,953 | |
LG Display Co., Ltd. (Electronic Equipment & Instruments) (b) | | | 10,790 | | | | 311,846 | |
LG Electronics, Inc. (Household Durables) | | | 5,435 | | | | 375,504 | |
LG Hausys, Ltd. (Building Products) | | | 534 | | | | 39,634 | |
LG Uplus Corp. (Diversified Telecommunication Services) | | | 419,990 | | | | 3,066,669 | |
Lotte Chilsung Beverage Co., Ltd. (Beverages) | | | 71 | | | | 100,735 | |
Lotte Confectionery Co., Ltd. (Food Products) | | | 80 | | | | 122,213 | |
Lotte Shopping Co., Ltd. (Multiline Retail) | | | 994 | | | | 351,019 | |
Meritz Securities Co., Ltd. (Capital Markets) | | | 31,740 | | | | 41,784 | |
Mirae Asset Securities Co., Ltd. (Capital Markets) | | | 3,030 | | | | 101,394 | |
Moorim P&P Co., Ltd. (Paper & Forest Products) | | | 6,320 | | | | 22,533 | |
Motonic Corp. (Auto Components) | | | 960 | | | | 11,363 | |
Neo Holdings Co., Ltd. (Miscellaneous) (b)(c)(d)(g) | | | 200 | | | | 0 | |
Nexen Corp. (Auto Components) | | | 349 | | | | 25,418 | |
NongShim Co., Ltd. (Food Products) | | | 237 | | | | 60,370 | |
Poongsan Corp. (Metals & Mining) | | | 2,400 | | | | 75,695 | |
Poongsan Holdings Corp. (Metals & Mining) | | | 1,230 | | | | 27,033 | |
POSCO (Metals & Mining) | | | 7,872 | | | | 2,573,900 | |
POSCO, ADR (Metals & Mining) (a) | | | 36,045 | | | | 2,961,097 | |
S&T Dynamics Co., Ltd. (Aerospace & Defense) | | | 2,240 | | | | 24,949 | |
Samsung Heavy Industries Co., Ltd. (Machinery) | | | 72,820 | | | | 2,649,984 | |
Samsung SDI Co., Ltd. (Electronic Equipment & Instruments) | | | 2,926 | | | | 413,664 | |
¨Shinhan Financial Group Co., Ltd. (Commercial Banks) | | | 342,830 | | | | 12,470,151 | |
Shinsegae Co., Ltd. (Multiline Retail) | | | 25,813 | | | | 5,284,902 | |
Shinsung Solar Energy Co., Ltd. (Semiconductors & Semiconductor Equipment) (b) | | | 11,829 | | | | 17,341 | |
SK Broadband Co., Ltd. (Diversified Telecommunication Services) (b) | | | 3,745 | | | | 16,330 | |
SK Holdings Co., Ltd. (Industrial Conglomerates) | | | 3,383 | | | | 566,982 | |
SK Innovation Co., Ltd. (Oil, Gas & Consumable Fuels) | | | 1,084 | | | | 177,837 | |
SK Networks Co., Ltd. (Trading Companies & Distributors) | | | 13,210 | | | | 104,817 | |
SK Securities Co., Ltd. (Capital Markets) | | | 29,350 | | | | 32,677 | |
Ssangyong Cement Industrial Co., Ltd. (Construction Materials) (b) | | | 7,890 | | | | 41,837 | |
STX Corp. Co., Ltd. (Machinery) | | | 4,320 | | | | 34,149 | |
| | | | | | |
The notes to the financial statements are an integral part of,
and should be read in conjunction with, the financial statements. | | mainstayinvestments.com | | | M-113 | |
Portfolio of Investments December 31, 2012 (continued)
| | | | | | | | |
| | |
Shares | | | Value | |
| Common Stocks (continued) | |
Republic of Korea (continued) | | | | | | | | |
STX Engine Co., Ltd. (Machinery) | | | 2,640 | | | $ | 23,032 | |
STX Offshore & Shipbuilding Co., Ltd. (Machinery) | | | 6,790 | | | | 46,706 | |
STX Pan Ocean Co., Ltd. (Marine) | | | 13,480 | | | | 60,122 | |
Taekwang Industrial Co., Ltd. (Chemicals) | | | 30 | | | | 26,493 | |
Unid Co., Ltd. (Chemicals) | | | 639 | | | | 22,862 | |
Woori Finance Holdings Co., Ltd. (Commercial Banks) | | | 47,500 | | | | 527,512 | |
Youlchon Chemical Co., Ltd. (Containers & Packaging) | | | 4,830 | | | | 36,722 | |
| | | | | | | | |
| | | | 52,557,298 | |
| | | | | | | | |
Russia 6.5% | |
Federal Hydrogenerating Co. JSC, ADR (Electric Utilities) (a) | | | 239,109 | | | | 560,118 | |
¨Gazprom OAO, Sponsored ADR (Oil, Gas & Consumable Fuels) (a) | | | 2,048,140 | | | | 19,864,014 | |
Magnitogorsk Iron & Steel Works, GDR (Metals & Mining) (b)(e) | | | 18,065 | | | | 78,872 | |
Mechel, Sponsored ADR (Metals & Mining) (a) | | | 1,024 | | | | 7,096 | |
Novolipetsk Steel OJSC, GDR (Metals & Mining) (e) | | | 84,039 | | | | 1,736,108 | |
Sberbank of Russia, Sponsored ADR (Commercial Banks) (a) | | | 249,756 | | | | 3,104,534 | |
VimpelCom, Ltd., Sponsored ADR (Wireless Telecommunication Services) (a) | | | 345,581 | | | | 3,625,145 | |
| | | | | | | | |
| | | | 28,975,887 | |
| | | | | | | | |
South Africa 9.1% | |
¨ABSA Group, Ltd. (Commercial Banks) | | | 524,667 | | | | 10,229,642 | |
Adcorp Holdings, Ltd. (Professional Services) | | | 1,224 | | | | 4,312 | |
Aeci, Ltd. (Chemicals) | | | 2,355 | | | | 22,181 | |
African Bank Investments, Ltd. (Diversified Financial Services) | | | 24,451 | | | | 94,018 | |
African Rainbow Minerals, Ltd. (Metals & Mining) | | | 14,451 | | | | 330,213 | |
Allied Electronics Corp., Ltd. (Industrial Conglomerates) | | | 6,398 | | | | 15,860 | |
ArcelorMittal South Africa, Ltd. (Metals & Mining) (b) | | | 20,652 | | | | 89,015 | |
Aveng, Ltd. (Construction & Engineering) | | | 634,074 | | | | 2,294,194 | |
Barloworld, Ltd. (Trading Companies & Distributors) | | | 28,094 | | | | 289,574 | |
Blue Label Telecoms, Ltd. (Commercial Services & Supplies) | | | 45,597 | | | | 43,474 | |
Business Connexion Group, Ltd. (IT Services) | | | 16,350 | | | | 10,471 | |
Cipla Medpro South Africa, Ltd. (Pharmaceuticals) | | | 42,969 | | | | 45,639 | |
DataTec, Ltd. (Electronic Equipment & Instruments) | | | 15,459 | | | | 90,541 | |
| | | | | | | | |
| | |
Shares | | | Value | |
South Africa (continued) | | | | | | | | |
DRDGOLD, Ltd., Sponsored ADR (Metals & Mining) (a) | | | 5,200 | | | $ | 41,912 | |
Eqstra Holdings, Ltd. (Trading Companies & Distributors) | | | 12,633 | | | | 9,093 | |
Gold Fields, Ltd. (Metals & Mining) | | | 15,436 | | | | 191,577 | |
Gold Fields, Ltd., Sponsored ADR (Metals & Mining) (a) | | | 39,342 | | | | 491,382 | |
Grindrod, Ltd. (Marine) | | | 50,593 | | | | 95,277 | |
Group Five, Ltd. (Construction & Engineering) | | | 16,436 | | | | 54,943 | |
Harmony Gold Mining Co., Ltd., Sponsored ADR (Metals & Mining) (a) | | | 52,500 | | | | 470,400 | |
Hulamin, Ltd. (Metals & Mining) (b) | | | 3,311 | | | | 1,273 | |
Impala Platinum Holdings, Ltd. (Metals & Mining) | | | 258,686 | | | | 5,223,242 | |
Investec, Ltd. (Capital Markets) | | | 30,427 | | | | 212,550 | |
JD Group, Ltd. (Specialty Retail) | | | 12,447 | | | | 65,890 | |
Lewis Group, Ltd. (Specialty Retail) | | | 11,215 | | | | 91,480 | |
Liberty Holdings, Ltd. (Insurance) | | | 10,377 | | | | 136,251 | |
MMI Holdings, Ltd. (Insurance) | | | 134,087 | | | | 351,684 | |
Mondi, Ltd. (Paper & Forest Products) | | | 12,208 | | | | 132,812 | |
Mpact, Ltd. (Containers & Packaging) | | | 3,473 | | | | 8,147 | |
MTN Group, Ltd. (Wireless Telecommunication Services) | | | 379,057 | | | | 7,967,216 | |
Nedbank Group, Ltd. (Commercial Banks) | | | 27,443 | | | | 613,701 | |
Northam Platinum, Ltd. (Metals & Mining) | | | 18,763 | | | | 84,775 | |
Omnia Holdings, Ltd. (Chemicals) | | | 6,114 | | | | 99,118 | |
Petmin, Ltd. (Metals & Mining) | | | 91,673 | | | | 23,749 | |
PPC, Ltd. (Construction Materials) | | | 1,097,544 | | | | 4,438,613 | |
Reunert, Ltd. (Industrial Conglomerates) | | | 266,959 | | | | 2,449,395 | |
Royal Bafokeng Platinum, Ltd. (Metals & Mining) (b) | | | 6,699 | | | | 45,642 | |
Sappi, Ltd. (Paper & Forest Products) (b) | | | 48,592 | | | | 179,238 | |
Standard Bank Group, Ltd. (Commercial Banks) | | | 164,172 | | | | 2,323,008 | |
Steinhoff International Holdings, Ltd. (Household Durables) (b) | | | 162,593 | | | | 531,401 | |
Super Group, Ltd. (Specialty Retail) (b) | | | 34,867 | | | | 70,028 | |
Telkom SA, Ltd. (Diversified Telecommunication Services) (b) | | | 35,206 | | | | 70,426 | |
Tongaat Hulett, Ltd. (Food Products) | | | 14,198 | | | | 225,910 | |
Trencor, Ltd. (Marine) | | | 19,868 | | �� | | 130,575 | |
Zeder Investments, Ltd. (Food Products) | | | 2,835 | | | | 1,008 | |
| | | | | | | | |
| | | | | | | 40,390,850 | |
| | | | | | | | |
Taiwan 8.3% | | | | | | | | |
Ability Enterprise Co., Ltd. (Office Electronics) | | | 43,000 | | | | 40,379 | |
AcBel Polytech, Inc. (Electrical Equipment) | | | 58,000 | | | | 41,168 | |
Accton Technology Corp. (Communications Equipment) | | | 58,000 | | | | 32,337 | |
Acer, Inc. (Computers & Peripherals) (b) | | | 173,000 | | | | 150,911 | |
| | | | |
| M-114 | | MainStay VP DFA / DuPont Capital Emerging Markets Equity Portfolio | | The notes to the financial statements are an integral part of,
and should be read in conjunction with, the financial statements. |
| | | | | | | | |
| | |
Shares | | | Value | |
| Common Stocks (continued) | |
Taiwan (continued) | | | | | | | | |
Advanced Semiconductor Engineering, Inc. (Semiconductors & Semiconductor Equipment) | | | 898,000 | | | $ | 779,198 | |
AGV Products Corp. (Food Products) (b) | | | 89,000 | | | | 32,257 | |
Altek Corp. (Leisure Equipment & Products) | | | 40,000 | | | | 23,645 | |
AmTRAN Technology Co., Ltd. (Computers & Peripherals) | | | 88,000 | | | | 68,745 | |
Asia Cement Corp. (Construction Materials) | | | 51,500 | | | | 66,484 | |
Asia Optical Co., Inc. (Leisure Equipment & Products) (b) | | | 31,000 | | | | 29,100 | |
Asia Vital Components Co., Ltd. (Computers & Peripherals) | | | 48,288 | | | | 25,944 | |
AU Optronics Corp., Sponsored ADR (Electronic Equipment & Instruments) (a)(b) | | | 89,100 | | | | 400,950 | |
Audix Corp. (Electrical Equipment) | | | 36,000 | | | | 30,338 | |
Avermedia Technologies (Computers & Peripherals) | | | 36,000 | | | | 19,395 | |
Bank of Kaohsiung (Commercial Banks) (b) | | | 110,000 | | | | 34,924 | |
BES Engineering Corp. (Construction & Engineering) | | | 155,000 | | | | 43,469 | |
Biostar Microtech International Corp. (Computers & Peripherals) | | | 68,000 | | | | 25,685 | |
Capital Securities Corp. (Capital Markets) | | | 154,000 | | | | 59,444 | |
Carnival Industrial Corp. (Textiles, Apparel & Luxury Goods) (b) | | | 100,000 | | | | 33,060 | |
Cathay Real Estate Development Co., Ltd. (Real Estate Management & Development) | | | 89,000 | | | | 43,646 | |
Champion Building Materials Co., Ltd. (Building Products) | | | 70,000 | | | | 27,045 | |
Chang Hwa Commercial Bank (Commercial Banks) | | | 484,710 | | | | 267,318 | |
Charoen Pokphand Enterprise (Food Products) | | | 70,000 | | | | 36,784 | |
Cheng Loong Corp. (Containers & Packaging) | | | 109,000 | | | | 46,437 | |
Chia Hsin Cement Corp. (Construction Materials) | | | 78,280 | | | | 37,307 | |
Chien Kuo Construction Co., Ltd. (Construction & Engineering) | | | 73,000 | | | | 35,713 | |
Chimei Innolux Corp. (Electronic Equipment & Instruments) (b) | | | 647,907 | | | | 351,005 | |
China Airlines, Ltd. (Airlines) (b) | | | 141,000 | | | | 58,345 | |
China Development Financial Holding Corp. (Commercial Banks) (b) | | | 1,034,000 | | | | 275,174 | |
China Electric Manufacturing Corp. (Electrical Equipment) | | | 50,000 | | | | 29,522 | |
China General Plastics Corp. (Chemicals) (b) | | | 87,000 | | | | 46,200 | |
China Manmade Fibers Corp. (Chemicals) (b) | | | 118,000 | | | | 46,077 | |
China Metal Products Co., Ltd. (Metals & Mining) | | | 52,000 | | | | 49,760 | |
China Motor Corp. (Automobiles) | | | 67,000 | | | | 63,622 | |
| | | | | | | | |
| | |
Shares | | | Value | |
Taiwan (continued) | | | | | | | | |
China Petrochemical Development Corp. (Chemicals) | | | 131,600 | | | $ | 82,051 | |
China Steel Structure Co., Ltd. (Construction & Engineering) | | | 37,000 | | | | 39,164 | |
China Synthetic Rubber Corp. (Chemicals) | | | 53,000 | | | | 59,959 | |
Chinese Maritime Transport, Ltd. (Marine) | | | 23,000 | | | | 30,560 | |
Chipbond Technology Corp. (Semiconductors & Semiconductor Equipment) | | | 870,000 | | | | 1,718,126 | |
Chung Hsin Electric & Machinery Manufacturing Corp. (Construction & Engineering) | | | 54,000 | | | | 28,955 | |
Chung Hung Steel Corp. (Metals & Mining) (b) | | | 103,000 | | | | 33,533 | |
Chunghwa Picture Tubes (Electronic Equipment & Instruments) (b) | | | 485,000 | | | | 16,261 | |
CMC Magnetics Corp. (Computers & Peripherals) (b) | | | 266,000 | | | | 44,962 | |
Compal Electronics, Inc. (Computers & Peripherals) | | | 8,396,000 | | | | 5,681,118 | |
Compeq Manufacturing Co. (Electronic Equipment & Instruments) | | | 107,000 | | | | 46,326 | |
Continental Holdings Corp. (Construction & Engineering) | | | 82,000 | | | | 32,691 | |
Coretronic Corp. (Electronic Equipment & Instruments) | | | 8,000 | | | | 6,233 | |
Cosmos Bank Taiwan (Commercial Banks) (b) | | | 145,000 | | | | 49,375 | |
Coxon Precise Industrial Co., Ltd. (Electronic Equipment & Instruments) | | | 15,000 | | | | 30,916 | |
CSBC Corp. Taiwan (Machinery) | | | 48,410 | | | | 29,813 | |
D-Link Corp. (Communications Equipment) | | | 70,000 | | | | 44,332 | |
E Ink Holdings, Inc. (Electronic Equipment & Instruments) | | | 20,000 | | | | 15,372 | |
E.Sun Financial Holding Co., Ltd. (Commercial Banks) | | | 485,100 | | | | 272,366 | |
Eastern Media International Corp. (Commercial Services & Supplies) (b) | | | 237,000 | | | | 32,784 | |
Epistar Corp. (Semiconductors & Semiconductor Equipment) | | | 57,000 | | | | 104,183 | |
Eternal Chemical Co., Ltd. (Chemicals) | | | 38,000 | | | | 33,008 | |
Evergreen International Storage & Transport Corp. (Road & Rail) | | | 63,000 | | | | 44,380 | |
Evergreen Marine Corp. Taiwan, Ltd. (Marine) (b) | | | 166,000 | | | | 99,498 | |
Everlight Electronics Co., Ltd. (Electronic Equipment & Instruments) | | | 9,000 | | | | 11,888 | |
Excelsior Medical Co., Ltd. (Health Care Providers & Services) | | | 16,500 | | | | 32,947 | |
Far Eastern International Bank (Commercial Banks) | | | 147,476 | | | | 59,389 | |
First Financial Holding Co., Ltd. (Commercial Banks) | | | 722,920 | | | | 442,280 | |
| | | | | | |
The notes to the financial statements are an integral part of,
and should be read in conjunction with, the financial statements. | | mainstayinvestments.com | | | M-115 | |
Portfolio of Investments December 31, 2012 (continued)
| | | | | | | | |
| | |
Shares | | | Value | |
| Common Stocks (continued) | |
Taiwan (continued) | | | | | | | | |
First Insurance Co., Ltd. (Insurance) | | | 63,000 | | | $ | 35,036 | |
First Steamship Co., Ltd. (Marine) | | | 10,000 | | | | 9,136 | |
Forhouse Corp. (Semiconductors & Semiconductor Equipment) | | | 52,000 | | | | 27,943 | |
Formosa Epitaxy, Inc. (Semiconductors & Semiconductor Equipment) (b) | | | 41,000 | | | | 29,077 | |
Formosa Taffeta Co., Ltd. (Textiles, Apparel & Luxury Goods) | | | 82,000 | | | | 79,274 | |
Formosan Rubber Group, Inc. (Chemicals) | | | 52,000 | | | | 37,435 | |
FSP Technology, Inc. (Electrical Equipment) | | | 35,000 | | | | 32,493 | |
Fubon Financial Holding Co., Ltd. (Diversified Financial Services) | | | 725,462 | | | | 880,574 | |
Fwusow Industry Co., Ltd. (Food Products) | | | 58,800 | | | | 31,746 | |
Gemtek Technology Corp. (Communications Equipment) (b) | | | 36,000 | | | | 43,552 | |
Gigabyte Technology Co., Ltd. (Computers & Peripherals) | | | 61,000 | | | | 54,787 | |
Gintech Energy Corp. (Semiconductors & Semiconductor Equipment) (b) | | | 35,000 | | | | 32,889 | |
Global Brands Manufacture, Ltd. (Electronic Equipment & Instruments) | | | 73,257 | | | | 26,490 | |
Gold Circuit Electronics, Ltd. (Electronic Equipment & Instruments) (b) | | | 115,000 | | | | 24,383 | |
Goldsun Development & Construction Co., Ltd. (Construction Materials) | | | 145,000 | | | | 56,119 | |
Grand Pacific Petrochemical (Chemicals) | | | 95,000 | | | | 50,737 | |
Green Energy Technology, Inc. (Semiconductors & Semiconductor Equipment) (b) | | | 29,825 | | | | 25,430 | |
HannStar Display Corp. (Electronic Equipment & Instruments) (b) | | | 193,000 | | | | 21,731 | |
Harvatek Corp. (Semiconductors & Semiconductor Equipment) | | | 57,570 | | | | 23,867 | |
Hua Nan Financial Holdings Co., Ltd. (Commercial Banks) | | | 60,000 | | | | 34,809 | |
Hung Poo Real Estate Development Corp. (Real Estate Management & Development) | | | 40,000 | | | | 41,364 | |
Inotera Memories, Inc. (Semiconductors & Semiconductor Equipment) (b) | | | 371,000 | | | | 49,629 | |
Inventec Corp. (Computers & Peripherals) | | | 231,840 | | | | 88,905 | |
ITE Technology, Inc. (Semiconductors & Semiconductor Equipment) (b) | | | 34,000 | | | | 27,673 | |
Kindom Construction Co. (Real Estate Management & Development) | | | 55,000 | | | | 40,675 | |
King Yuan Electronics Co., Ltd. (Semiconductors & Semiconductor Equipment) | | | 136,000 | | | | 87,097 | |
Kuoyang Construction Co., Ltd. (Real Estate Management & Development) | | | 22,000 | | | | 12,457 | |
| | | | | | | | |
| | |
Shares | | | Value | |
Taiwan (continued) | | | | | | | | |
Kwong Fong Industries (Textiles, Apparel & Luxury Goods) (b) | | | 88,000 | | | $ | 53,114 | |
KYE Systems Corp.
(Computers & Peripherals) (b) | | | 71,000 | | | | 23,136 | |
L&K Engineering Co., Ltd. (Commercial Services & Supplies) | | | 23,000 | | | | 21,417 | |
Lealea Enterprise Co., Ltd. (Textiles, Apparel & Luxury Goods) | | | 88,580 | | | | 35,238 | |
Leofoo Development Co. (Hotels, Restaurants & Leisure) (b) | | | 27,000 | | | | 15,257 | |
Li Peng Enterprise Co., Ltd. (Textiles, Apparel & Luxury Goods) (b) | | | 91,354 | | | | 32,382 | |
Lien Hwa Industrial Corp. (Food Products) | | | 57,000 | | | | 37,267 | |
Lingsen Precision Industries, Ltd. (Semiconductors & Semiconductor Equipment) | | | 52,000 | | | | 27,287 | |
LITE-ON IT Corp. (Computers & Peripherals) | | | 44,219 | | | | 38,129 | |
Lite-On Technology Corp. (Computers & Peripherals) | | | 241,690 | | | | 321,730 | |
Macronix International (Semiconductors & Semiconductor Equipment) | | | 414,154 | | | | 124,347 | |
Marketech International Corp. (Electronic Equipment & Instruments) | | | 47,000 | | | | 28,251 | |
Masterlink Securities Corp. (Capital Markets) | | | 102,000 | | | | 32,488 | |
Mega Financial Holding Co., Ltd. (Commercial Banks) | | | 952,070 | | | | 744,220 | |
Micro-Star International Co., Ltd. (Computers & Peripherals) | | | 92,000 | | | | 44,369 | |
Mirle Automation Corp. (Machinery) | | | 46,350 | | | | 34,367 | |
Mitac International Corp. (Computers & Peripherals) | | | 128,000 | | | | 46,060 | |
Motech Industries, Inc. (Semiconductors & Semiconductor Equipment) (b) | | | 10,000 | | | | 9,519 | |
Nan Ya Printed Circuit Board Corp. (Electronic Equipment & Instruments) | | | 23,000 | | | | 28,585 | |
Neo Solar Power Corp. (Semiconductors & Semiconductor Equipment) (b) | | | 71,000 | | | | 46,631 | |
Nien Hsing Textile Co., Ltd. (Textiles, Apparel & Luxury Goods) | | | 37,800 | | | | 26,390 | |
Novatek Microelectronics Corp. (Semiconductors & Semiconductor Equipment) | | | 1,397,000 | | | | 5,736,294 | |
Opto Technology Corp. (Semiconductors & Semiconductor Equipment) | | | 76,000 | | | | 31,809 | |
Pegatron Corp. (Computers & Peripherals) (b) | | | 201,000 | | | | 261,514 | |
Phihong Technology Co., Ltd. (Electrical Equipment) | | | 20,000 | | | | 17,142 | |
Pou Chen Corp. (Textiles, Apparel & Luxury Goods) | | | 56,000 | | | | 58,986 | |
| | | | |
| M-116 | | MainStay VP DFA / DuPont Capital Emerging Markets Equity Portfolio | | The notes to the financial statements are an integral part of,
and should be read in conjunction with, the financial statements. |
| | | | | | | | |
| | |
Shares | | | Value | |
| Common Stocks (continued) | |
Taiwan (continued) | | | | | | | | |
Powertech Technology, Inc. (Semiconductors & Semiconductor Equipment) | | | 25,000 | | | $ | 41,025 | |
President Securities Corp. (Capital Markets) (b) | | | 88,580 | | | | 51,679 | |
Qisda Corp. (Computers & Peripherals) (b) | | | 176,000 | | | | 44,455 | |
Radium Life Tech Co., Ltd. (Real Estate Management & Development) | | | 60,820 | | | | 51,781 | |
Ritek Corp. (Computers & Peripherals) (b) | | | 299,000 | | | | 41,390 | |
Sanyang Industry Co., Ltd. (Automobiles) (b) | | | 80,000 | | | | 48,879 | |
SDI Corp. (Semiconductors & Semiconductor Equipment) | | | 42,000 | | | | 28,736 | |
Sheng Yu Steel Co., Ltd. (Metals & Mining) | | | 44,000 | | | | 28,188 | |
Shih Wei Navigation Co., Ltd. (Marine) | | | 37,000 | | | | 28,402 | |
Shihlin Electric & Engineering Corp. (Electrical Equipment) | | | 30,000 | | | | 37,349 | |
Shin Kong Financial Holding Co., Ltd. (Insurance) (b) | | | 702,000 | | | | 198,887 | |
Shinkong Synthetic Fibers Corp. (Chemicals) | | | 174,000 | | | | 59,050 | |
Sigurd Microelectronics Corp. (Semiconductors & Semiconductor Equipment) | | | 67,000 | | | | 59,945 | |
Silicon Integrated Systems Corp. (Semiconductors & Semiconductor Equipment) (b) | | | 86,000 | | | | 34,003 | |
Sino-American Silicon Products, Inc. (Semiconductors & Semiconductor Equipment) | | | 11,000 | | | | 13,166 | |
Sinon Corp. (Chemicals) | | | 77,000 | | | | 37,545 | |
SinoPac Financial Holdings Co., Ltd. (Commercial Banks) | | | 625,149 | | | | 269,537 | |
Sunrex Technology Corp. (Computers & Peripherals) | | | 47,000 | | | | 20,246 | |
Supreme Electronics Co., Ltd. (Electronic Equipment & Instruments) | | | 59,000 | | | | 23,822 | |
TA Chen Stainless Pipe (Metals & Mining) | | | 11,000 | | | | 5,815 | |
Ta Chong Bank, Ltd. (Commercial Banks) (b) | | | 160,680 | | | | 55,536 | |
TA-I Technology Co., Ltd. (Semiconductors & Semiconductor Equipment) | | | 21,842 | | | | 13,283 | |
Tah Hsin Industrial Co., Ltd. (Textiles, Apparel & Luxury Goods) | | | 31,000 | | | | 31,150 | |
Taichung Commercial Bank (Commercial Banks) | | | 157,776 | | | | 55,026 | |
Tainan Enterprises Co., Ltd. (Textiles, Apparel & Luxury Goods) | | | 28,000 | | | | 29,224 | |
Tainan Spinning Co., Ltd. (Textiles, Apparel & Luxury Goods) | | | 112,000 | | | | 57,143 | |
Taishin Financial Holding Co., Ltd. (Commercial Banks) | | | 655,908 | | | | 261,188 | |
Taisun Enterprise Co., Ltd. (Food Products) | | | 9,070 | | | | 5,005 | |
| | | | | | | | |
| | |
Shares | | | Value | |
Taiwan (continued) | | | | | | | | |
Taiwan Business Bank (Commercial Banks) (b) | | | 350,480 | | | $ | 105,840 | |
Taiwan Cooperative Financial Holding (Commercial Banks) | | | 55,000 | | | | 31,067 | |
Taiwan Fertilizer Co., Ltd. (Chemicals) | | | 1,172,670 | | | | 3,116,640 | |
Taiwan Land Development Corp. (Real Estate Management & Development) (b) | | | 18,046 | | | | 7,064 | |
Taiwan Paiho, Ltd. (Textiles, Apparel & Luxury Goods) | | | 49,220 | | | | 30,004 | |
Taiwan Sakura Corp. (Household Durables) | | | 17,000 | | | | 9,833 | |
Taiwan Semiconductor Manufacturing Co., Ltd. (Semiconductors & Semiconductor Equipment) | | | 775,000 | | | | 2,593,857 | |
Taiwan TEA Corp. (Food & Staples Retailing) | | | 98,000 | | | | 53,618 | |
Taiyen Biotech Co., Ltd. (Food Products) | | | 46,000 | | | | 33,610 | |
Tatung Co., Ltd. (Household Durables) (b) | | | 219,000 | | | | 55,621 | |
Teco Electric and Machinery Co., Ltd. (Electrical Equipment) | | | 179,000 | | | | 137,527 | |
Thinking Electronic Industrial Co., Ltd. (Electronic Equipment & Instruments) | | | 35,000 | | | | 34,506 | |
Tong Yang Industry Co., Ltd. (Auto Components) | | | 45,760 | | | | 41,189 | |
Tong-Tai Machine & Tool Co., Ltd. (Machinery) | | | 31,620 | | | | 24,142 | |
Topoint Technology Co., Ltd. (Electronic Equipment & Instruments) | | | 48,259 | | | | 28,277 | |
TPK Holding Co., Ltd. (Electronic Equipment & Instruments) | | | 94,000 | | | | 1,678,942 | |
Tung Ho Steel Enterprise Corp. (Metals & Mining) | | | 87,000 | | | | 89,285 | |
TYC Brother Industrial Co., Ltd. (Auto Components) | | | 76,762 | | | | 28,360 | |
Tycoons Group Enterprise (Machinery) (b) | | | 156,000 | | | | 30,905 | |
Tyntek Corp. (Semiconductors & Semiconductor Equipment) (b) | | | 85,109 | | | | 21,676 | |
Unimicron Technology Corp. (Electronic Equipment & Instruments) | | | 118,000 | | | | 125,829 | |
United Microelectronics Corp. (Semiconductors & Semiconductor Equipment) | | | 1,581,000 | | | | 639,588 | |
Universal Cement Corp. (Construction Materials) | | | 59,000 | | | | 32,604 | |
UPC Technology Corp. (Chemicals) | | | 72,443 | | | | 40,630 | |
Vanguard International Semiconductor Corp. (Semiconductors & Semiconductor Equipment) | | | 25,000 | | | | 17,594 | |
Walsin Lihwa Corp. (Electrical Equipment) (b) | | | 7,861,000 | | | | 2,695,613 | |
Walton Advanced Engineering, Inc. (Semiconductors & Semiconductor Equipment) (b) | | | 87,000 | | | | 25,215 | |
Wan Hai Lines, Ltd. (Marine) (b) | | | 105,000 | | | | 60,897 | |
| | | | | | |
The notes to the financial statements are an integral part of,
and should be read in conjunction with, the financial statements. | | mainstayinvestments.com | | | M-117 | |
Portfolio of Investments December 31, 2012 (continued)
| | | | | | | | |
| | |
Shares | | | Value | |
| Common Stocks (continued) | |
Taiwan (continued) | | | | | | | | |
Winbond Electronics Corp. (Semiconductors & Semiconductor Equipment) (b) | | | 327,000 | | | $ | 57,341 | |
Wintek Corp. (Electronic Equipment & Instruments) (b) | | | 177,000 | | | | 94,733 | |
Wistron Corp. (Computers & Peripherals) | | | 109,400 | | | | 113,985 | |
WT Microelectronics Co., Ltd. (Electronic Equipment & Instruments) | | | 7,209 | | | | 8,986 | |
WUS Printed Circuit Co., Ltd. (Electronic Equipment & Instruments) (b) | | | 80,000 | | | | 34,387 | |
Yageo Corp. (Electronic Equipment & Instruments) (b) | | | 204,000 | | | | 64,880 | |
Yem Chio Co., Ltd. (Commercial Services & Supplies) | | | 52,436 | | | | 34,121 | |
Yieh Phui Enterprise Co., Ltd. (Metals & Mining) | | | 108,120 | | | | 35,478 | |
Young Fast Optoelectronics Co., Ltd. (Electronic Equipment & Instruments) | | | 7,000 | | | | 14,319 | |
Yuanta Financial Holding Co., Ltd. (Capital Markets) | | | 963,000 | | | | 498,288 | |
Yuen Foong Yu Paper Manufacturing Co., Ltd. (Paper & Forest Products) | | | 50,000 | | | | 24,270 | |
Yulon Motor Co., Ltd. (Automobiles) | | | 98,000 | | | | 188,636 | |
Zig Sheng Industrial Co., Ltd. (Textiles, Apparel & Luxury Goods) | | | 82,364 | | | | 27,891 | |
| | | | | | | | |
| | | | | | | 36,873,798 | |
| | | | | | | | |
Thailand 3.1% | | | | | | | | |
Advanced Info Service PCL (Wireless Telecommunication Services) | | | 89,040 | | | | 612,492 | |
Bangchak Petroleum PCL (Oil, Gas & Consumable Fuels) | | | 73,400 | | | | 76,450 | |
Bangkok Bank PCL (Commercial Banks) | | | 127,800 | | | | 820,401 | |
Bangkok Expressway PCL (Transportation Infrastructure) | | | 67,400 | | | | 76,683 | |
Bangkokland PCL (Real Estate Management & Development) | | | 1,553,900 | | | | 62,921 | |
Banpu PCL (Oil, Gas & Consumable Fuels) | | | 11,600 | | | | 156,937 | |
Delta Electronics Thailand PCL (Electronic Equipment & Instruments) | | | 12,200 | | | | 12,812 | |
Esso Thailand PCL (Oil, Gas & Consumable Fuels) | | | 184,300 | | | | 60,851 | |
Hana Microelectronics PCL (Electronic Equipment & Instruments) | | | 57,800 | | | | 43,189 | |
IRPC PCL (Oil, Gas & Consumable Fuels) | | | 1,087,900 | | | | 148,481 | |
Kasikornbank PCL, NVDR (Commercial Banks) (h) | | | 585,400 | | | | 3,717,879 | |
Kiatnakin Bank PCL (Commercial Banks) | | | 35,000 | | | | 55,832 | |
Polyplex PCL (Containers & Packaging) | | | 67,000 | | | | 30,226 | |
Precious Shipping PCL (Marine) | | | 59,500 | | | | 27,641 | |
PTT Global Chemical PCL (Chemicals) | | | 239,900 | | | | 555,782 | |
| | | | | | | | |
| | |
Shares | | | Value | |
Thailand (continued) | | | | | | | | |
PTT PCL (Oil, Gas & Consumable Fuels) | | | 36,300 | | | $ | 395,816 | |
Quality Houses PCL (Real Estate Management & Development) | | | 748,258 | | | | 52,835 | |
Saha-Union PCL (Miscellaneous) | | | 31,200 | | | | 40,815 | |
Sahaviriya Steel Industries PCL (Metals & Mining) (b) | | | 1,232,200 | | | | 24,008 | |
Sri Trang Agro-Industry PCL (Auto Components) | | | 70,700 | | | | 40,993 | |
Thai Airways International PCL (Airlines) (b) | | | 116,300 | | | | 84,506 | |
Thai Oil PCL (Oil, Gas & Consumable Fuels) | | | 2,962,500 | | | | 6,593,366 | |
Thanachart Capital PCL (Commercial Banks) | | | 70,400 | | | | 87,000 | |
Thoresen Thai Agencies PCL (Marine) | | | 45,800 | | | | 24,966 | |
TMB Bank PCL (Commercial Banks) | | | 2,317,500 | | | | 140,914 | |
TPI Polene PCL (Construction Materials) | | | 97,000 | | | | 44,897 | |
Vinythai PCL (Chemicals) | | | 51,000 | | | | 30,071 | |
| | | | | | | | |
| | | | | | | 14,018,764 | |
| | | | | | | | |
Turkey 0.9% | | | | | | | | |
Adana Cimento Sanayii TAS Class A (Construction Materials) | | | 15,372 | | | | 32,613 | |
Aksa Akrilik Kimya Sanayii (Textiles, Apparel & Luxury Goods) | | | 13,078 | | | | 37,749 | |
Anadolu Cam Sanayii AS (Containers & Packaging) (b) | | | 21,699 | | | | 34,118 | |
Anadolu Sigorta (Insurance) (b) | | | 72,371 | | | | 46,836 | |
Asya Katilim Bankasi AS (Commercial Banks) (b) | | | 63,974 | | | | 79,635 | |
Dogan Sirketler Grubu Holding AS (Industrial Conglomerates) (b) | | | 111,747 | | | | 57,889 | |
EIS Eczacibasi Ilac ve Sinai ve Finansal Yatirimlar Sanayi ve Ticaret AS (Pharmaceuticals) | | | 33,519 | | | | 37,676 | |
Eregli Demir ve Celik Fabrikalari TAS (Metals & Mining) | | | 99,840 | | | | 137,531 | |
Ford Otomotiv Sanayi AS (Automobiles) | | | 142,807 | | | | 1,718,863 | |
Gentas Genel Metal Sanayi ve Ticaret AS (Commercial Services & Supplies) | | | 39,557 | | | | 30,576 | |
Global Yatirim Holding AS (Diversified Financial Services) (b) | | | 55,866 | | | | 38,555 | |
GSD Holding (Commercial Banks) (b) | | | 102,720 | | | | 44,685 | |
Ihlas Holding AS (Industrial Conglomerates) (b) | | | 87,504 | | | | 61,470 | |
Ipek Dogal Enerji Kaynaklari ve Uretim AS (Commercial Services & Supplies) (b) | | | 26,426 | | | | 89,124 | |
Kardemir Karabuk Demir Celik Sanayi ve Ticaret AS Class A (Metals & Mining) (b) | | | 26,759 | | | | 21,377 | |
Kardemir Karabuk Demir Celik Sanayi ve Ticaret AS Class D (Metals & Mining) | | | 36,922 | | | | 26,165 | |
KOC Holding AS (Industrial Conglomerates) | | | 41,801 | | | | 217,469 | |
Petkim Petrokimya Holding AS (Chemicals) | | | 6,352 | | | | 9,900 | |
Polyester Sanayi AS (Chemicals) (b) | | | 47,176 | | | | 31,620 | |
| | | | |
| M-118 | | MainStay VP DFA / DuPont Capital Emerging Markets Equity Portfolio | | The notes to the financial statements are an integral part of,
and should be read in conjunction with, the financial statements. |
| | | | | | | | |
| | |
Shares | | | Value | |
| Common Stocks (continued) | |
Turkey (continued) | | | | | | | | |
Sekerbank TAS (Commercial Banks) (b) | | | 21,585 | | | $ | 21,826 | |
Soda Sanayii AS (Chemicals) (b) | | | 21,843 | | | | 29,639 | |
Tekfen Holding AS (Construction & Engineering) | | | 14,345 | | | | 58,447 | |
Trakya Cam Sanayi AS (Building Products) (b) | | | 26,896 | | | | 36,865 | |
Turk Hava Yollari (Airlines) (b) | | | 62,036 | | | | 218,293 | |
Turkiye Is Bankasi Class C (Commercial Banks) | | | 203,559 | | | | 707,520 | |
Turkiye Sise ve Cam Fabrikalari AS (Industrial Conglomerates) | | | 55,873 | | | | 92,681 | |
Turkiye Vakiflar Bankasi Tao (Commercial Banks) | | | 96,933 | | | | 251,344 | |
Vestel Elektronik Sanayi ve Ticaret AS (Household Durables) (b) | | | 24,553 | | | | 26,056 | |
| | | | | | | | |
| | | | | | | 4,196,522 | |
| | | | | | | | |
United Kingdom 0.0%‡ | | | | | | | | |
West China Cement, Ltd. (Construction Materials) | | | 288,000 | | | | 58,024 | |
| | | | | | | | |
Total Common Stocks
(Cost $391,009,217) | | | | | | | 403,936,117 | |
| | | | | | | | |
| | |
| Exchange Traded Funds 3.7% (i) | | | | | | | | |
India 0.9% | | | | | | | | |
PowerShares India Portfolio (Capital Markets) | | | 216,598 | | | | 3,976,739 | |
| | | | | | | | |
| | |
United States 2.8% | | | | | | | | |
iShares MSCI Emerging Markets Index Fund (Capital Markets) | | | 154,001 | | | | 6,829,944 | |
Vanguard Emerging Markets (Capital Markets) | | | 129,607 | | | | 5,771,400 | |
| | | | | | | | |
| | | | | | | 12,601,344 | |
| | | | | | | | |
Total Exchange Traded Funds (Cost $16,795,421) | | | | | | | 16,578,083 | |
| | | | | | | | |
| | |
| Preferred Stocks 4.0% | | | | | | | | |
Brazil 4.0% | | | | | | | | |
Banco Industrial e Comercial S.A.
7.34% (Commercial Banks) | | | 15,600 | | | | 51,506 | |
Banco Panamericano S.A.
1.32% (Commercial Banks) | | | 35,600 | | | | 90,522 | |
Braskem S.A. Class A
4.35% (Chemicals) | | | 17,500 | | | | 115,835 | |
Cia Ferro Ligas da Bahia—Ferbasa
1.88% (Metals & Mining) | | | 15,311 | | | | 93,965 | |
Cia Paranaense de Energia Class B
4.06% (Electric Utilities) | | | 436,230 | | | | 6,720,437 | |
| | | | | | | | |
| | |
Shares | | | Value | |
Brazil (continued) | | | | | | | | |
Eucatex S.A. Industria e Comercio
2.86% (Paper & Forest Products) | | | 8,300 | | | $ | 32,332 | |
Forjas Taurus S.A.
3.43% (Aerospace & Defense) | | | 49,000 | | | | 69,892 | |
Gerdau S.A.
1.56% (Metals & Mining) | | | 17,300 | | | | 154,395 | |
Inepar S.A. Industria e Construcoes
0.00% (Electrical Equipment) (b) | | | 7,200 | | | | 4,788 | |
Suzano Papel e Celulose S.A.
0.00% (Paper & Forest Products) (b) | | | 84,800 | | | | 295,945 | |
Unipar Participacoes S.A.
0.49% (Chemicals) | | | 200,800 | | | | 39,428 | |
Usinas Siderurgicas de Minas Gerais S.A. 0.65% (Metals & Mining) | | | 110,400 | | | | 719,714 | |
¨Vale S.A.
5.38% (Metals & Mining) | | | 457,800 | | | | 9,314,232 | |
| | | | | | | | |
| | | | | | | 17,702,991 | |
| | | | | | | | |
Colombia 0.0%‡ | | | | | | | | |
Grupo De Inversiones Suramericana S.A. 2.76% (Diversified Financial Services) | | | 4,182 | | | | 92,484 | |
| | | | | | | | |
Total Preferred Stocks
(Cost $18,665,294) | | | | | | | 17,795,475 | |
| | | | | | | | |
| | |
| | | | | | | | |
| | | Number of
Rights | | | | |
| Rights 0.0%‡ | | | | | | | | |
Brazil 0.0%‡ | | | | | | | | |
MMX Mineracao e Metalicos S.A. Expires 1/18/13 (Metals & Mining) (b) | | | 84,609 | | | | 16,529 | |
| | | | | | | | |
| | |
Poland 0.0%‡ | | | | | | | | |
Polimex-Mostostal S.A. (Construction & Engineering) (b)(d) | | | 58,304 | | | | 697 | |
| | | | | | | | |
Total Rights
(Cost $0) | | | | | | | 17,226 | |
| | | | | | | | |
| | |
| | | | | | | | |
| | | Number of
Warrants | | | | |
| | | | | | | | |
| Warrants 0.0%‡ | | | | | | | | |
Malaysia 0.0%‡ | | | | | | | | |
WCT BHD Expires 12/11/17 (Construction & Engineering) (b) | | | 16,880 | | | | 1,628 | |
| | | | | | | | |
Total Warrants
(Cost $1,820) | | | | | | | 1,628 | |
| | | | | | | | |
| | |
| | | | | | | | |
| | | | | | |
The notes to the financial statements are an integral part of,
and should be read in conjunction with, the financial statements. | | mainstayinvestments.com | | | M-119 | |
Portfolio of Investments December 31, 2012 (continued)
| | | | | | | | |
| | | Principal
Amount | | | Value | |
| Short-Term Investment 2.1% | |
Repurchase Agreement 2.1% | |
United States 2.1% | |
State Street Bank and Trust Co.
0.01%, dated 12/31/12
due 1/2/13
Proceeds at Maturity $9,121,484 (Collateralized by a Federal National Mortgage Association Security with a rate of 2.140% and a maturity date of 11/7/22, with a Principal Amount of $9,270,000 and a Market Value of $9,307,979) (Capital Markets) | | $ | 9,121,478 | | | $ | 9,121,478 | |
| | | | | | | | |
Total Short-Term Investment
(Cost $9,121,478) | | | | 9,121,478 | |
| | | | | | | | |
Total Investments
(Cost $435,593,230) (j) | | | 100.3 | % | | | 447,450,007 | |
Other Assets, Less Liabilities | | | (0.3 | ) | | | (1,130,396 | ) |
Net Assets | | | 100.0 | % | | $ | 446,319,611 | |
| ‡ | Less than one-tenth of a percent. |
| (a) | ADR—American Depositary Receipt. |
| (b) | Non-income producing security. |
| (c) | Illiquid security. The total market value of this security as of December 31, 2012 is $2, which represents less than one-tenth of a percent of the Portfolio’s net assets. |
| (d) | Fair valued security. The total market value of these securities as of December 31, 2012 is $43,079, which represents less than one-tenth of a percent of the Portfolio’s net assets. |
| (e) | GDR—Global Depositary Receipt. |
| (f) | May be sold to institutional investors only under Rule 144A or securities offered pursuant to Section 4(2) of the Securities Act of 1933, as amended. |
| (h) | NVDR—Non-Voting Depositary Receipt. |
| (i) | Exchange Traded Fund—An investment vehicle that represents a basket of securities that is traded on an exchange. |
| (j) | As of December 31, 2012, cost is $439,753,964 for federal income tax purposes and net unrealized appreciation is as follows: |
| | | | | | |
Gross unrealized appreciation | | | | $ | 30,513,433 | |
Gross unrealized depreciation | | | | | (22,817,390 | ) |
| | | | | | |
Net unrealized appreciation | | | | $ | 7,696,043 | |
| | | | | | |
| | | | |
| M-120 | | MainStay VP DFA / DuPont Capital Emerging Markets Equity Portfolio | | The notes to the financial statements are an integral part of,
and should be read in conjunction with, the financial statements. |
The following is a summary of the fair valuations according to the inputs used as of December 31, 2012, for valuing the Portfolio’s assets.
Asset Valuation Inputs
| | | | | | | | | | | | | | | | |
Description | | Quoted Prices
in Active Markets
for Identical Assets
(Level 1) | | | Significant Other
Observable Inputs
(Level 2) | | | Significant
Unobservable
Inputs
(Level 3) | | | Total | |
| Investments in Securities (a) | | | | | | | | | | | | | | | | |
| Common Stocks | | | | | | | | | | | | | | | | |
Brazil | | $ | 8,187,277 | | | $ | 22,748,106 | | | $ | — | | | $ | 30,935,383 | |
Chile | | | 9,792,370 | | | | 2,642,187 | | | | — | | | | 12,434,557 | |
China (b) | | | 1,076,895 | | | | 70,607,632 | | | | 42,382 | | | | 71,726,909 | |
Colombia | | | 8,587,688 | | | | 49,883 | | | | — | | | | 8,637,571 | |
Czech Republic | | | — | | | | 6,765,735 | | | | — | | | | 6,765,735 | |
Egypt | | | — | | | | 1,466,615 | | | | — | | | | 1,466,615 | |
Hungary | | | — | | | | 2,550,156 | | | | — | | | | 2,550,156 | |
India | | | 3,113,628 | | | | 9,499,479 | | | | — | | | | 12,613,107 | |
Indonesia | | | — | | | | 13,835,302 | | | | — | | | | 13,835,302 | |
Jordan | | | — | | | | 3,732,841 | | | | — | | | | 3,732,841 | |
Lebanon | | | — | | | | 633,642 | | | | — | | | | 633,642 | |
Malaysia | | | 22,064 | | | | 14,514,119 | | | | — | | | | 14,536,183 | |
Philippines | | | — | | | | 1,725,181 | | | | — | | | | 1,725,181 | |
Poland | | | — | | | | 18,494,860 | | | | — | | | | 18,494,860 | |
Republic of Korea (c) | | | 2,961,097 | | | | 49,596,201 | | | | 0 | | | | 52,557,298 | |
Russia | | | 19,200,271 | | | | 9,775,616 | | | | — | | | | 28,975,887 | |
South Africa | | | 1,003,694 | | | | 39,387,156 | | | | — | | | | 40,390,850 | |
Taiwan | | | 400,950 | | | | 36,472,848 | | | | — | | | | 36,873,798 | |
Thailand | | | 314,897 | | | | 13,703,867 | | | | — | | | | 14,018,764 | |
Turkey | | | — | | | | 4,196,522 | | | | — | | | | 4,196,522 | |
United Kingdom | | | — | | | | 58,024 | | | | — | | | | 58,024 | |
All Other Countries | | | 26,776,932 | | | | — | | | | — | | | | 26,776,932 | |
| | | | | | | | | | | | | | | | |
| Total Common Stocks | | | 81,437,763 | | | | 322,455,972 | | | | 42,382 | | | | 403,936,117 | |
| | | | | | | | | | | | | | | | |
| Exchange Traded Funds | | | 16,578,083 | | | | — | | | | — | | | | 16,578,083 | |
| Preferred Stocks | | | — | | | | 17,795,475 | | | | — | | | | 17,795,475 | |
| Rights (d) | | | 16,529 | | | | — | | | | 697 | | | | 17,226 | |
| Warrants | | | 1,628 | | | | — | | | | — | | | | 1,628 | |
| Short-Term Investment | | | | | | | | | | | | | | | | |
Repurchase Agreement | | | — | | | | 9,121,478 | | | | — | | | | 9,121,478 | |
| | | | | | | | | | | | | | | | |
| Total Investments in Securities | | $ | 98,034,003 | | | $ | 349,372,925 | | | $ | 43,079 | | | $ | 447,450,007 | |
| | | | | | | | | | | | | | | | |
| (a) | For a complete listing of investments and their industries, see the Portfolio of Investments. |
| (b) | The Level 3 securities valued at $42,382 are securities listed under China within the Common Stocks section of the Portfolio of Investments. |
| (c) | The Level 3 security valued at less than one dollar is listed under Republic of Korea within the Common Stocks section of the Portfolio of Investments. |
| (d) | The Level 3 security valued at $697 is a security listed under Poland within the Rights section of the Portfolio of Investments. |
The Portfolio recognizes transfers between the levels as of the beginning of the period.
| | | | | | | | | | | | | | | | | | | | | | | | | | | | | | | | | | | | | | | | |
Investments in Securities | | Balance
as of
February 17,
2012 (a) | | | Accrued
Discounts
(Premiums) | | | Realized
Gain
(Loss) | | | Change in
Unrealized
Appreciation
(Depreciation) | | | Purchases | | | Sales | | | Transfers
in to
Level 3 | | | Transfers
out of
Level 3 | | | Balance as of
December 31,
2012 | | | Change in
Unrealized
Appreciation
(Depreciation)
from
Investments
Still Held at
December 31,
2012 (b) | |
| Common Stocks | | | | | | | | | | | | | | | | | | | | | | | | | | | | | | | | | | | | | | | | |
China | | $ | — | | | $ | — | | | $ | — | | | $ | (52,383 | ) | | $ | 94,765 | | | $ | — | | | $ | — | | | $ | — | | | $ | 42,382 | | | $ | (52,583 | ) |
| Rights | | | | | | | | | | | | | | | | | | | | | | | | | | | | | | | | | | | | | | | | |
Poland | | | — | | | | — | | | | — | | | | 697 | | | | — | | | | — | | | | — | | | | — | | | | 697 | | | | 697 | |
| | | | | | | | | | | | | | | | | | | | | | | | | | | | | | | | | | | | | | | | |
| Total | | $ | — | | | $ | — | | | $ | — | | | $ | (51,686 | ) | | $ | 94,765 | | | $ | — | | | $ | — | | | $ | — | | | $ | 43,079 | | | $ | (51,886 | ) |
| | | | | | | | | | | | | | | | | | | | | | | | | | | | | | | | | | | | | | | | |
(a) Inception Date | |
| (b) | Included in “Net change in unrealized appreciation (depreciation) on investments” in the Statement of Operations. |
| | | | | | |
The notes to the financial statements are an integral part of,
and should be read in conjunction with, the financial statements. | | mainstayinvestments.com | | | M-121 | |
Portfolio of Investments December 31, 2012 (continued)
The table below sets forth the diversification of MainStay VP DFA / DuPont Capital Emerging Markets Equity Portfolio investments by industry.
Industry Diversification (Unaudited)
| | | | | | | | | | |
| | | Value | | | Percent† | |
Aerospace & Defense | | $ | 6,252,528 | | | | 1.4 | % |
Air Freight & Logistics | | | 38,691 | | | | 0.0 | ‡ |
Airlines | | | 6,119,418 | | | | 1.4 | |
Auto Components | | | 9,354,121 | | | | 2.1 | |
Automobiles | | | 8,370,849 | | | | 1.9 | |
Beverages | | | 9,123,201 | | | | 2.0 | |
Building Products | | | 283,912 | | | | 0.1 | |
Capital Markets | | | 27,433,863 | | | | 6.1 | |
Chemicals | | | 5,745,844 | | | | 1.3 | |
Commercial Banks | | | 89,862,168 | | | | 20.1 | |
Commercial Services & Supplies | | | 251,496 | | | | 0.1 | |
Communications Equipment | | | 243,547 | | | | 0.1 | |
Computers & Peripherals | | | 7,197,223 | | | | 1.6 | |
Construction & Engineering | | | 4,552,261 | | | | 1.0 | |
Construction Materials | | | 6,590,062 | | | | 1.5 | |
Containers & Packaging | | | 215,283 | | | | 0.1 | |
Distributors | | | 19,073 | | | | 0.0 | ‡ |
Diversified Financial Services | | | 1,258,544 | | | | 0.3 | |
Diversified Telecommunication Services | | | 6,653,463 | | | | 1.5 | |
Electric Utilities | | | 8,939,549 | | | | 2.0 | |
Electrical Equipment | | | 3,153,874 | | | | 0.7 | |
Electronic Equipment & Instruments | | | 4,401,835 | | | | 1.0 | |
Energy Equipment & Services | | | 128,327 | | | | 0.0 | ‡ |
Food & Staples Retailing | | | 662,964 | | | | 0.2 | |
Food Products | | | 3,036,182 | | | | 0.7 | |
Gas Utilities | | | 3,355 | | | | 0.0 | ‡ |
Health Care Equipment & Supplies | | | 48,241 | | | | 0.0 | ‡ |
Health Care Providers & Services | | | 64,134 | | | | 0.0 | ‡ |
Hotels, Restaurants & Leisure | | | 6,454,341 | | | | 1.4 | |
Household Durables | | | 8,462,725 | | | | 1.9 | |
Household Products | | | 422,760 | | | | 0.1 | |
Industrial Conglomerates | | | 6,127,771 | | | | 1.4 | |
Insurance | | | 3,326,745 | | | | 0.7 | |
| | | | | | | | | | |
| | | Value | | | Percent† | |
IT Services | | $ | 96,833 | | | | 0.0 | %‡ |
Leisure Equipment & Products | | | 52,745 | | | | 0.0 | ‡ |
Machinery | | | 19,328,595 | | | | 4.3 | |
Marine | | | 3,691,482 | | | | 0.8 | |
Media | | | 459,610 | | | | 0.1 | |
Metals & Mining | | | 40,025,356 | | | | 9.0 | |
Miscellaneous | | | 43,128 | | | | 0.0 | ‡ |
Multi-Utilities | | | 328,187 | | | | 0.1 | |
Multiline Retail | | | 5,856,577 | | | | 1.3 | |
Office Electronics | | | 40,379 | | | | 0.0 | ‡ |
Oil, Gas & Consumable Fuels | | | 75,371,082 | | | | 16.9 | |
Paper & Forest Products | | | 2,784,016 | | | | 0.6 | |
Personal Products | | | 35,743 | | | | 0.0 | ‡ |
Pharmaceuticals | | | 5,934,883 | | | | 1.3 | |
Professional Services | | | 4,312 | | | | 0.0 | ‡ |
Real Estate Management & Development | | | 6,084,006 | | | | 1.4 | |
Road & Rail | | | 93,730 | | | | 0.0 | ‡ |
Semiconductors & Semiconductor Equipment | | | 12,707,294 | | | | 2.8 | |
Software | | | 138,661 | | | | 0.0 | ‡ |
Specialty Retail | | | 378,580 | | | | 0.1 | |
Textiles, Apparel & Luxury Goods | | | 687,971 | | | | 0.2 | |
Trading Companies & Distributors | | | 447,677 | | | | 0.1 | |
Transportation Infrastructure | | | 1,611,401 | | | | 0.4 | |
Water Utilities | | | 1,555,234 | | | | 0.4 | |
Wireless Telecommunication Services | | | 34,894,175 | | | | 7.8 | |
| | | | | | | | |
| | | 447,450,007 | | | | 100.3 | |
Other Assets, Less Liabilities | | | (1,130,396 | ) | | | –0.3 | |
| | | | | | | | |
Net Assets | | $ | 446,319,611 | | | | 100.0 | % |
| | | | | | | | |
| † | Percentages indicated are based on Portfolio net assets. |
| ‡ | Less than one-tenth of a percent. |
| | | | |
| M-122 | | MainStay VP DFA / DuPont Capital Emerging Markets Equity Portfolio | | The notes to the financial statements are an integral part of,
and should be read in conjunction with, the financial statements. |
Statement of Assets and Liabilities as of December 31, 2012
| | | | |
| Assets | | | | |
Investment in securities, at value
(identified cost $435,593,230) | | $ | 447,450,007 | |
Cash denominated in foreign currencies
(identified cost $708,026) | | | 709,775 | |
Receivables: | | | | |
Investment securities sold | | | 3,034,790 | |
Fund shares sold | | | 730,795 | |
Dividends and interest | | | 375,743 | |
Other assets | | | 873 | |
| | | | |
Total assets | | | 452,301,983 | |
| | | | |
| |
| Liabilities | | | | |
Payables: | | | | |
Investment securities purchased | | | 4,601,459 | |
Manager (See Note 3) | | | 432,819 | |
Fund shares redeemed | | | 430,955 | |
Foreign capital gains tax (See Note 2(C)) | | | 239,043 | |
Professional fees | | | 122,495 | |
Custodian | | | 69,800 | |
NYLIFE Distributors (See Note 3) | | | 52,791 | |
Shareholder communication | | | 32,422 | |
Trustees | | | 588 | |
| | | | |
Total liabilities | | | 5,982,372 | |
| | | | |
Net assets | | $ | 446,319,611 | |
| | | | |
| |
| Net Assets Consist of | | | | |
Shares of beneficial interest outstanding (par value of $.001 per share) unlimited number of shares authorized | | $ | 44,167 | |
Additional paid-in capital | | | 439,720,145 | |
| | | | |
| | | 439,764,312 | |
Undistributed net investment income | | | 2,557,450 | |
Accumulated net realized gain (loss) on investments and foreign currency transactions | | | (7,625,651 | ) |
Net unrealized appreciation (depreciation) on investments (a) | | | 11,617,734 | |
Net unrealized appreciation (depreciation) on translation of other assets and liabilities in foreign currencies | | | 5,766 | |
| | | | |
Net assets | | $ | 446,319,611 | |
| | | | |
| | | | |
Initial Class | | | | |
Net assets applicable to outstanding shares | | $ | 190,688,159 | |
| | | | |
Shares of beneficial interest outstanding | | | 18,846,221 | |
| | | | |
Net asset value per share outstanding | | $ | 10.12 | |
| | | | |
Service Class | | | | |
Net assets applicable to outstanding shares | | $ | 255,631,452 | |
| | | | |
Shares of beneficial interest outstanding | | | 25,320,937 | |
| | | | |
Net asset value per share outstanding | | $ | 10.10 | |
| | | | |
| (a) | Net of unrealized foreign capital gains tax of $239,043. |
| | | | | | |
The notes to the financial statements are an integral part of,
and should be read in conjunction with, the financial statements. | | mainstayinvestments.com | | | M-123 | |
Statement of Operations
for the period February 17, 2012 (inception date) through December 31, 2012
| | | | |
| Investment Income (Loss) | | | | |
Income | | | | |
Dividends (a) | | $ | 8,800,335 | |
Interest (b) | | | 422 | |
| | | | |
Total income | | | 8,800,757 | |
| | | | |
Expenses | | | | |
Manager (See Note 3) | | | 4,083,345 | |
Distribution and service—Service Class (See Note 3) | | | 537,967 | |
Custodian | | | 419,288 | |
Professional fees | | | 151,181 | |
Shareholder communication | | | 66,256 | |
Trustees | | | 8,348 | |
Miscellaneous | | | 25,945 | |
| | | | |
Total expenses | | | 5,292,330 | |
| | | | |
Net investment income (loss) | | | 3,508,427 | |
| | | | |
|
| Realized and Unrealized Gain (Loss) on Investments and Foreign Currency Transactions | |
Net realized gain (loss) on: | | | | |
Security transactions | | | (7,888,641 | ) |
Foreign currency transactions | | | (687,987 | ) |
| | | | |
Net realized gain (loss) on investments and foreign currency transactions | | | (8,576,628 | ) |
| | | | |
Net change in unrealized appreciation (depreciation) on: | | | | |
Investments | | | 11,617,734 | |
Translation of other assets and liabilities in foreign currencies | | | 5,766 | |
| | | | |
Net change in unrealized appreciation (depreciation) on investments and foreign currency transactions | | | 11,623,500 | |
| | | | |
Net realized and unrealized gain (loss) on investments and foreign currency transactions | | | 3,046,872 | |
| | | | |
Net increase (decrease) in net assets resulting from operations | | $ | 6,555,299 | |
| | | | |
| (a) | Dividends recorded net of foreign withholding taxes in the amount of $1,151,706. |
| (b) | Interest recorded net of foreign withholding taxes in the amount of $9. |
| | | | |
| M-124 | | MainStay VP DFA / DuPont Capital Emerging Markets Equity Portfolio | | The notes to the financial statements are an integral part of,
and should be read in conjunction with, the financial statements. |
Statements of Changes in Net Assets
for the period February 17, 2012 (inception date) through December 31, 2012
| | | | |
| | | 2012 | |
| Increase (Decrease) in Net Assets | | | | |
Operations: | | | | |
Net investment income (loss) | | $ | 3,508,427 | |
Net realized gain (loss) on investments and foreign currency transactions | | | (8,576,628 | ) |
Net change in unrealized appreciation (depreciation) on investments and foreign currency transactions | | | 11,623,500 | |
| | | | |
Net increase (decrease) in net assets resulting from operations | | | 6,555,299 | |
| | | | |
Capital share transactions: | | | | |
Net proceeds from sale of shares | | | 496,980,175 | |
Cost of shares redeemed | | | (57,215,863 | ) |
| | | | |
Increase (decrease) in net assets derived from capital share transactions | | | 439,764,312 | |
| | | | |
Net increase (decrease) in net assets | | | 446,319,611 | |
| |
| Net Assets | | | | |
Beginning of period | | | — | |
| | | | |
End of period | | $ | 446,319,611 | |
| | | | |
Undistributed net investment income at end of period | | $ | 2,557,450 | |
| | | | |
| | | | | | |
The notes to the financial statements are an integral part of,
and should be read in conjunction with, the financial statements. | | mainstayinvestments.com | | | M-125 | |
Financial Highlights selected per share data and ratios
| | | | |
| | | Initial Class | |
| | | February 17,
2012**
through
December 31, | |
| | | 2012 | |
Net asset value at beginning of period | | $ | 10.00 | |
| | | | |
Net investment income (loss) (a) | | | 0.09 | |
Net realized and unrealized gain (loss) on investments | | | 0.04 | |
Net realized and unrealized gain (loss) on foreign currency transactions | | | (0.01 | ) |
| | | | |
Total from investment operations | | | 0.12 | |
| | | | |
Net asset value at end of period | | $ | 10.12 | |
| | | | |
Total investment return | | | 1.20 | %(b)(c) |
Ratios (to average net assets)/Supplemental Data: | | | | |
Net investment income (loss) | | | 1.15 | %†† |
Net expenses | | | 1.40 | %†† |
Portfolio turnover rate | | | 81 | % |
Net assets at end of period (in 000’s) | | $ | 190,688 | |
| (a) | Per share data based on average shares outstanding during the period. |
| (b) | Total investment return is not annualized. |
| (c) | Total investment return may reflect adjustments to conform to generally accepted accounting principles. |
| | | | |
| | | Service Class | |
| | | February 17,
2012**
through
December 31, | |
| | | 2012 | |
Net asset value at beginning of period | | $ | 10.00 | |
| | | | |
Net investment income (loss) (a) | | | 0.08 | |
Net realized and unrealized gain (loss) on investments | | | 0.04 | |
Net realized and unrealized gain (loss) on foreign currency transactions | | | (0.02 | ) |
| | | | |
Total from investment operations | | | 0.10 | |
| | | | |
Net asset value at end of period | | $ | 10.10 | |
| | | | |
Total investment return | | | 1.00 | %(b)(c) |
Ratios (to average net assets)/Supplemental Data: | | | | |
Net investment income (loss) | | | 0.96 | %†† |
Net expenses | | | 1.65 | %†† |
Portfolio turnover rate | | | 81 | % |
Net assets at end of period (in 000’s) | | $ | 255,631 | |
| (a) | Per share data based on average shares outstanding during the period. |
| (b) | Total investment return is not annualized. |
| (c) | Total investment return may reflect adjustments to conform to generally accepted accounting principles. |
| | | | |
| M-126 | | MainStay VP DFA / DuPont Capital Emerging Markets Equity Portfolio | | The notes to the financial statements are an integral part of,
and should be read in conjunction with, the financial statements. |
MainStay VP Eagle Small Cap Growth Portfolio
Investment and Performance Comparison1 (Unaudited)
Performance data quoted represents past performance. Past performance is no guarantee of future results. Because of market volatility, current performance may be lower or higher than the figures shown. Investment return and principal value will fluctuate, and as a result, when shares are redeemed, they may be worth more or less than their original cost. The performance table and graph do not reflect any deduction of sales charges, mortality and expense charges, contract charges or administrative charges. Please refer to the Performance Summary appropriate for your policy. For performance information current to the most recent month-end, please call 800-598-2019 or visit www.newyorklife.com.
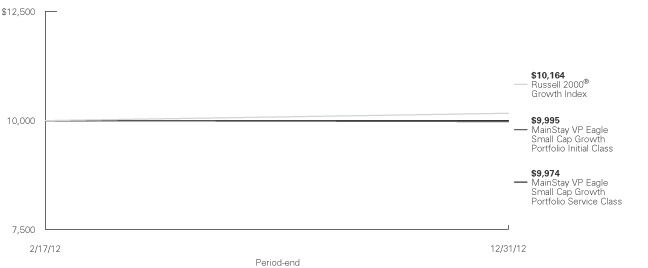
Total Returns for the Period Ended December 31, 2012
| | | | | | |
| Class | | Since Inception (2/17/12) | | Gross Expense Ratio2 | |
| Initial Class Shares | | –0.05% | | | 0.89 | % |
| Service Class Shares | | –0.26 | | | 1.14 | |
| | | | |
| Benchmark Performance | | Since
Inception
(2/17/12) | |
Russell 2000® Growth Index3 | | | 1.64 | % |
Average Lipper Variable Products Small-Cap Growth Portfolio4 | | | –0.15 | |
| 1. | Performance figures reflect certain fee waivers and/or expense limitations, without which total returns may have been different. For information on current fee waivers and/or expense limitations, please refer to the notes to the financial statements. |
| 2. | The gross expense ratios presented reflect the Portfolio’s “Total Annual Portfolio Operating Expenses” from the most recent Prospectus and may differ from other expense ratios disclosed in this report. |
| 3. | Please refer to pages M-2 and M-3 for additional explanations and disclosure regarding the Portfolios, their benchmark indices and other indices mentioned in the reports. |
| 4. | The Average Lipper Variable Products Small-Cap Growth Portfolio is representative of portfolios that, by portfolio practice, invest at least 75% of their equity assets in companies with market capitalizations (on a three-year weighted basis) below Lipper’s U.S. Diversified Equity small-cap ceiling. Small-cap growth portfolios typically have an above-average price-to-earnings ratio, price-to-book ratio, and three-year sales-per-share growth value, compared to the S&P Small Cap 600 Index. Lipper Inc. is an independent monitor of fund performance. Results are based on total returns with all dividend and capital gain distributions reinvested. |
| | |
| mainstayinvestments.com | | M-127 |
Cost in Dollars of a $1,000 Investment in MainStay VP Eagle Small Cap Growth Portfolio (Unaudited)
The example below is intended to describe the fees and expenses borne by shareholders during the period from July 1, 2012, to December 31, 2012, and the impact of those costs on your investment.
Example
As a shareholder of the Portfolio, you incur two types of costs: (1) transaction costs, including exchange fees and sales charges (loads) on purchases (as applicable), and (2) ongoing costs, including management fees, distribution and/or service (12b-1) fees, and other Portfolio expenses (as applicable). This example is intended to help you understand your ongoing costs (in dollars) of investing in the Portfolio and to compare these costs with the ongoing costs of investing in other Portfolios. The example is based on an investment of $1,000 made at the beginning of the period and held for the entire period from July 1, 2012, to December 31, 2012. Shares are only sold in connection with variable life and annuity contracts and the example does not reflect any contract level or transactional fees or expenses. If these costs had been included, your costs would have been higher.
This example illustrates your Portfolio’s ongoing costs in two ways:
Actual Expenses
The second and third data columns in the table below provide information about actual account values and actual expenses. You may use the information in these columns, together with the amount you invested, to estimate the expenses that you paid during the six months ended
December 31, 2012. Simply divide your account value by $1,000 (for example, an $8,600 account value divided by $1,000 = 8.6), then multiply the result by the number under the heading entitled ‘‘Expenses Paid During Period’’ to estimate the expenses you paid on your account during this period.
Hypothetical Example for Comparison Purposes
The fourth and fifth data columns in the table below provide information about hypothetical account values and hypothetical expenses based on the Portfolio’s actual expense ratio and an assumed rate of return of 5% per year before expenses, which is not the Portfolio’s actual return. The hypothetical account values and expenses may not be used to estimate the actual ending account balances or expenses you paid for the six-month period shown. You may use this information to compare the ongoing costs of investing in the Portfolio with the ongoing costs of investing in other Portfolios. To do so, compare this 5% hypothetical example with the 5% hypothetical examples that appear in the shareholder reports of the other Portfolios.
Please note that the expenses shown in the table are meant to highlight your ongoing costs only and do not reflect any transactional costs, such as exchange fees or sales charges (loads). Therefore, the fourth and fifth data columns of the table are useful in comparing ongoing costs only and will not help you determine the relative total costs of owning different funds. In addition, if these transactional costs were included, your costs would have been higher.
| | | | | | | | | | | | | | | | | | | | |
| | | | | | | | | | | | | | | | |
| Share Class | | Beginning
Account
Value
7/1/12 | | | Ending Account
Value (Based
on Actual
Returns and
Expenses)
12/31/12 | | | Expenses
Paid
During
Period1 | | | Ending Account
Value (Based
on Hypothetical
5% Annualized
Return and
Actual Expenses)
12/31/12 | | | Expenses
Paid
During
Period1 | |
| | | | | |
| Initial Class Shares | | $ | 1,000.00 | | | $ | 1,085.10 | | | $ | 4.51 | | | $ | 1,020.80 | | | $ | 4.37 | |
| | | | | |
| Service Class Shares | | $ | 1,000.00 | | | $ | 1,083.70 | | | $ | 5.81 | | | $ | 1,019.60 | | | $ | 5.64 | |
| 1. | Expenses are equal to the Portfolio’s annualized expense ratio of each class (0.86% for Initial Class and 1.11% for Service Class) multiplied by the average account value over the period, divided by 366 and multiplied by 184 (to reflect the one-half year period). The table above represents the actual expenses incurred during the period. |
| | |
| M-128 | | MainStay VP Eagle Small Cap Growth Portfolio |
Industry Composition as of December 31, 2012 (Unaudited)
| | | | |
| Specialty Retail | | | 7.5 | % |
| Biotechnology | | | 7.2 | |
| Health Care Equipment & Supplies | | | 6.8 | |
| Energy Equipment & Services | | | 6.2 | |
| Hotels, Restaurants & Leisure | | | 6.0 | |
| Software | | | 5.9 | |
| Machinery | | | 4.2 | |
| Semiconductors & Semiconductor Equipment | | | 4.0 | |
| Electronic Equipment & Instruments | | | 3.7 | |
| Chemicals | | | 3.5 | |
| Internet Software & Services | | | 3.5 | |
| Commercial Services & Supplies | | | 3.3 | |
| Health Care Providers & Services | | | 3.2 | |
| Aerospace & Defense | | | 2.9 | |
| Oil, Gas & Consumable Fuels | | | 2.8 | |
| Electrical Equipment | | | 2.6 | |
| Household Durables | | | 2.2 | |
| Food & Staples Retailing | | | 2.1 | |
| Airlines | | | 1.5 | |
| Commercial Banks | | | 1.5 | |
| Construction Materials | | | 1.4 | |
| | | | |
| Insurance | | | 1.4 | % |
| Metals & Mining | | | 1.4 | |
| Real Estate Investment Trusts | | | 1.4 | |
| Communications Equipment | | | 1.2 | |
| Health Care Technology | | | 1.2 | |
| Life Sciences Tools & Services | | | 1.2 | |
| Road & Rail | | | 1.2 | |
| Pharmaceuticals | | | 1.1 | |
| Food Products | | | 1.0 | |
| Textiles, Apparel & Luxury Goods | | | 1.0 | |
| Consumer Finance | | | 0.9 | |
| Air Freight & Logistics | | | 0.8 | |
| Diversified Consumer Services | | | 0.8 | |
| Construction & Engineering | | | 0.7 | |
| Computers & Peripherals | | | 0.6 | |
| Diversified Financial Services | | | 0.6 | |
| Thrifts & Mortgage Finance | | | 0.5 | |
| Building Products | | | 0.2 | |
| Short-Term Investment | | | 0.5 | |
| Other Assets, Less Liabilities | | | 0.3 | |
| | | | |
| | | 100.0 | % |
| | | | |
See Portfolio of Investments beginning on page M-132 for specific holdings within these categories.
Top Ten Holdings as of December 31, 2012 (excluding short-term investment) (Unaudited)
| 1. | Geospace Technologies Corp. |
| 4. | Lufkin Industries, Inc. |
| 6. | Sirona Dental Systems, Inc. |
| 7. | SHFL Entertainment, Inc. |
| 8. | Bally Technologies, Inc. |
| 10. | United Therapeutics Corp. |
| | | | |
| mainstayinvestments.com | | | M-129 | |
Portfolio Management Discussion and Analysis (Unaudited)
Answers to the questions reflect the views of portfolio managers Bert L. Boksen and Eric Mintz of Eagle Asset Management, Inc. (“Eagle”), the Portfolio’s Subadvisor.
How did MainStay VP Eagle Small Cap Growth Portfolio perform relative to its peers and its benchmark from February 17 through December 31, 2012?
The inception date for MainStay VP Eagle Small
Cap Growth Portfolio was February 17, 2012. From February 17 through December 31, 2012, the Portfolio returned –0.05% for Initial Class shares and –0.26% for Service Class shares. Over the same period, Initial Class shares outperformed—and Service Class shares underperformed—the –0.15% return of the average Lipper1 Variable Products Small-Cap Growth Portfolio. From February 17 through December 31, 2012, both share classes underperformed the 1.64% return of
the Russell 2000® Growth Index.1 The Russell 2000® Growth Index is the Portfolio’s broad-based securities-market index.
What factors affected the Portfolio’s relative performance during the reporting period?
The Portfolio’s underperformance of the Russell 2000® Growth Index from February 17 through December 31, 2012, resulted largely from setbacks in information technology, where weak performance from Monster Worldwide detracted from returns. On the other hand, the Portfolio’s positions in the energy and materials sectors outperformed the Russell 2000® Growth Index, boosted by Geospace Technologies in energy and Texas Industries in materials.
Which sectors were the strongest positive contributors to the Portfolio’s relative performance, and which sectors were particularly weak?
The strongest positive contributions to the Portfolio’s relative performance came from the energy and materials sectors, largely because of favorable stock selection and modestly overweight allocations. (Contributions take weightings and total returns into account.) The health care sector also contributed positively to the Portfolio’s relative performance as a result of stock selection.
The sector that detracted most significantly from the Portfolio’s performance relative to the Russell 2000® Growth Index was information technology. The sector posted negative returns and trailed the Index. The industrials sector also detracted from the Portfolio’s relative performance, with unfavorable stock selection leading to nominally negative total returns
that fell short of the Index. To a lesser extent, the consumer discretionary sector also weighed on relative performance, largely because of stock selection.
During the reporting period, which individual stocks made the strongest positive contributions to the Portfolio’s absolute performance and which stocks detracted the most?
The Portfolio’s strongest stocks in terms of absolute performance during the reporting period were energy equipment & services company Geospace Technologies (formerly named OYO Geospace), correctional facilities management company Geo Group and pharmacy-benefit-management company Catalyst Health Solutions. Geospace Technologies continues to see demand strength and order growth for its geospace seismic recorders, along with increasing order traction for its seabed reservoir-monitoring systems. Geo Group shares rose sharply toward the end of the reporting period when the company announced plans to convert to a real-estate investment trust (REIT) structure and to pay a large special dividend. During the reporting period, Catalyst Health Solutions was acquired by SXC Health Solutions, a slightly larger peer, at a modest premium.
The stocks that made the weakest contributions
to the Portfolio’s absolute performance during the reporting period were energy equipment & services company Lufkin Industries, health care technology company Quality Systems and specialty retailer Genesco. Although oil-rig counts have continued to climb, pump jack manufacturer Lufkin Industries could be hurt if sustained lower oil prices reduce spending for exploration and production. Quality Systems saw erosion in its previously strong positioning as the electronic health records market has shifted away from relatively small physician groups toward larger hospitals, which are quickly acquiring smaller practices. Genesco is a retailer of headwear, sporting goods, footwear and clothing accessories. Despite beating estimates in the third quarter and raising guidance for 2013, Genesco traded down in the fourth quarter as investors became concerned with declining same-store sales at its Lids cap subsidiary. In our opinion, those sagging late-2012 sales mean that year-over-year revenue comparisons should be easier to match or exceed in the latter part of 2013. We continue to
| 1. | Please refer to pages M-2 and M-3 for additional explanations and disclosure regarding the Portfolios, their benchmark indices and service providers mentioned in the reports. |
| | |
| M-130 | | MainStay VP Eagle Small Cap Growth Portfolio |
hold Genesco and believe it will be a strong contributor to 2013 performance.
Did the Portfolio make any significant purchases or sales during the reporting period?
Among the stocks the Portfolio purchased during the reporting period were liquid natural gas (LNG) engineered equipment manufacturer Chart Industries, medical device company HeartWare and organic foods producer and distributor WhiteWave Foods. In our view, a position in Chart Industries was a great way to play the LNG export-terminal build-out in North America and the shift to natural gas–powered trucks. We believe that HeartWare is well positioned in left ventricular-assist devices for the treatment of heart failure. The long-awaited U.S. Food and Drug Administration (FDA) approval of its product for potential transplant patients is expected to provide a substantial catalyst as the product launch takes shape over the coming quarters. We believe that being the second player in a field with only two major suppliers may set the company up for substantial revenue growth in 2013. WhiteWave Foods produces and distributes organic dairy food and beverage products through brands such as Silk soybean milk substitute and International Delight coffee creamers and beverages. The firm is expected to leverage strong awareness of its product portfolio into the rapidly growing organic-foods business.
The Portfolio sold its position in Bruker, a provider
of high-performance scientific instruments and solutions for molecular and materials research. When management expressed subdued expectations for its European segment, which accounts for about a third of its business, we sold the stock. The company’s
new chief financial officer is focused on restructuring operations, but we believe that the plan may take several years. We also sold the Portfolio’s position in EZCORP, a specialty finance company providing credit terms and short-term pawn loans through single-payment and non-collateralized payday loan methods in the United States. We sold the stock when the company’s positioning wavered as its chief financial
officer departed and regulatory uncertainty hurt payday lending. Sapient is an IT services provider specializing in digital marketing and risk-management consulting. We sold the Portfolio’s position in the stock because of moderating revenue growth in SapientNitro, the company’s digital marketing segment.
How did the Portfolio’s sector weightings change during the reporting period?
The Portfolio’s weighting in the small consumer staples sector increased. The addition of one or two names was enough to increase the Portfolio’s relative weighting in the sector, which remains at a modest underweight relative to the benchmark. The Portfolio also increased its weighing in the industrials sector, but tended to remain slightly underweight relative to the Russell 2000® Growth Index, as it has since the Portfolio’s inception.
The Portfolio’s weighting in the consumer discretionary sector decreased, moving from a modest underweight to a nominal overweight relative to
the Russell 2000® Growth Index. The Portfolio also decreased its allocation to the information technology sector from roughly neutral to modestly underweight. In part, this was due to a reduction in the Portfolio’s overweight position in the software industry.
How was the Portfolio positioned at the end of the reporting period?
As of December 31, 2012, the Portfolio was modestly overweight relative to the Russell 2000® Growth Index in energy and materials because we expect those cyclical groups to perform well. As of the same date, the Portfolio remained modestly underweight relative to the Index in consumer staples and financials. In financials, the Portfolio maintained some exposure
to REITs, which have not traditionally been viewed as growth stocks. Even so, exposure to REITs in the Russell 2000® Growth Index has grown to a level that, from a risk-management perspective, required the Portfolio to have exposure to REITs as well.
The opinions expressed are those of the portfolio managers as of the date of this report and are subject to change. There is no guarantee that any forecasts made will come to pass. This material does not constitute investment advice and is not intended as an endorsement of any specific investment.
Not all MainStay VP Portfolios and/or share classes are available under all policies.
| | | | |
| mainstayinvestments.com | | | M-131 | |
Portfolio of Investments December 31, 2012
| | | | | | | | |
| | | Shares | | | Value | |
| Common Stocks 99.2%† | | | | | | | | |
Aerospace & Defense 2.9% | |
Hexcel Corp. (a) | | | 176,502 | | | $ | 4,758,494 | |
Triumph Group, Inc. | | | 69,453 | | | | 4,535,281 | |
| | | | | | | | |
| | | | | | | 9,293,775 | |
| | | | | | | | |
Air Freight & Logistics 0.8% | |
Atlas Air Worldwide Holdings, Inc. (a) | | | 55,556 | | | | 2,461,686 | |
| | | | | | | | |
|
Airlines 1.5% | |
JetBlue Airways Corp. (a) | | | 527,370 | | | | 3,011,283 | |
US Airways Group, Inc. (a) | | | 122,646 | | | | 1,655,721 | |
| | | | | | | | |
| | | | | | | 4,667,004 | |
| | | | | | | | |
Biotechnology 7.2% | |
Acorda Therapeutics, Inc. (a) | | | 110,091 | | | | 2,736,862 | |
Ariad Pharmaceuticals, Inc. (a) | | | 162,394 | | | | 3,114,717 | |
BioMarin Pharmaceutical, Inc. (a) | | | 38,743 | | | | 1,908,093 | |
Halozyme Therapeutics, Inc. (a) | | | 330,363 | | | | 2,216,736 | |
Onyx Pharmaceuticals, Inc. (a) | | | 50,010 | | | | 3,777,255 | |
Seattle Genetics, Inc. (a) | | | 76,164 | | | | 1,767,005 | |
Theravance, Inc. (a) | | | 120,383 | | | | 2,680,929 | |
¨United Therapeutics Corp. (a) | | | 89,616 | | | | 4,787,287 | |
| | | | | | | | |
| | | | | | | 22,988,884 | |
| | | | | | | | |
Building Products 0.2% | |
Apogee Enterprises, Inc. | | | 23,031 | | | | 552,053 | |
| | | | | | | | |
|
Chemicals 3.5% | |
Georgia Gulf Corp. | | | 95,324 | | | | 3,934,974 | |
Huntsman Corp. | | | 198,771 | | | | 3,160,459 | |
Quaker Chemical Corp. | | | 74,916 | | | | 4,034,976 | |
| | | | | | | | |
| | | | | | | 11,130,409 | |
| | | | | | | | |
Commercial Banks 1.5% | |
Citizens Republic Bancorp, Inc. (a) | | | 126,488 | | | | 2,399,478 | |
UMB Financial Corp. | | | 53,992 | | | | 2,367,009 | |
| | | | | | | | |
| | | | | | | 4,766,487 | |
| | | | | | | | |
Commercial Services & Supplies 3.3% | |
¨Geo Group, Inc. (The) | | | 214,207 | | | | 6,040,638 | |
Waste Connections, Inc. | | | 128,356 | | | | 4,337,149 | |
| | | | | | | | |
| | | | | | | 10,377,787 | |
| | | | | | | | |
Communications Equipment 1.2% | |
Riverbed Technology, Inc. (a) | | | 202,948 | | | | 4,002,134 | |
| | | | | | | | |
|
Computers & Peripherals 0.6% | |
Fusion-io, Inc. (a) | | | 78,880 | | | | 1,808,718 | |
| | | | | | | | |
|
Construction & Engineering 0.7% | |
Northwest Pipe Co. (a) | | | 90,617 | | | | 2,162,122 | |
| | | | | | | | |
| | | | | | | | |
| | | Shares | | | Value | |
Construction Materials 1.4% | |
Texas Industries, Inc. (a) | | | 88,080 | | | $ | 4,492,961 | |
| | | | | | | | |
|
Consumer Finance 0.9% | |
Cash America International, Inc. | | | 72,874 | | | | 2,890,911 | |
| | | | | | | | |
|
Diversified Consumer Services 0.8% | |
Sotheby’s | | | 73,179 | | | | 2,460,278 | |
| | | | | | | | |
|
Diversified Financial Services 0.6% | |
KKR Financial Holdings LLC | | | 174,752 | | | | 1,845,381 | |
| | | | | | | | |
|
Electrical Equipment 2.6% | |
General Cable Corp. (a) | | | 82,039 | | | | 2,494,806 | |
Regal-Beloit Corp. | | | 48,967 | | | | 3,450,704 | |
Thermon Group Holdings, Inc. (a) | | | 105,260 | | | | 2,371,508 | |
| | | | | | | | |
| | | | | | | 8,317,018 | |
| | | | | | | | |
Electronic Equipment & Instruments 3.7% | |
Coherent, Inc. | | | 89,995 | | | | 4,555,547 | |
InvenSense, Inc. (a) | | | 210,605 | | | | 2,339,821 | |
IPG Photonics Corp. | | | 55,701 | | | | 3,712,472 | |
Universal Display Corp. (a) | | | 45,915 | | | | 1,176,342 | |
| | | | | | | | |
| | | | | | | 11,784,182 | |
| | | | | | | | |
Energy Equipment & Services 6.2% | |
Dril-Quip, Inc. (a) | | | 32,345 | | | | 2,362,802 | |
¨Geospace Technologies Corp. (a) | | | 113,191 | | | | 10,059,284 | |
¨Lufkin Industries, Inc. | | | 103,949 | | | | 6,042,555 | |
Ocean Rig UDW, Inc. (a) | | | 79,141 | | | | 1,184,741 | |
| | | | | | | | |
| | | | | | | 19,649,382 | |
| | | | | | | | |
Food & Staples Retailing 2.1% | |
Fresh Market, Inc. (The) (a) | | | 81,470 | | | | 3,917,892 | |
Natural Grocers by Vitamin Cottage, Inc. (a) | | | 148,071 | | | | 2,826,676 | |
| | | | | | | | |
| | | | | | | 6,744,568 | |
| | | | | | | | |
Food Products 1.0% | |
WhiteWave Foods Co. Class A (a) | | | 204,755 | | | | 3,181,893 | |
| | | | | | | | |
|
Health Care Equipment & Supplies 6.8% | |
¨ArthroCare Corp. (a) | | | 141,151 | | | | 4,882,413 | |
Cooper Cos., Inc. (The) | | | 44,409 | | | | 4,106,944 | |
HeartWare International, Inc. (a) | | | 39,021 | | | | 3,275,813 | |
¨Sirona Dental Systems, Inc. (a) | | | 88,182 | | | | 5,684,212 | |
Thoratec Corp. (a) | | | 101,396 | | | | 3,804,378 | |
| | | | | | | | |
| | | | | | | 21,753,760 | |
| | | | | | | | |
Health Care Providers & Services 3.2% | |
Air Methods Corp. | | | 83,490 | | | | 3,079,946 | |
Catamaran Corp. (a) | | | 55,520 | | | | 2,615,547 | |
Centene Corp. (a) | | | 109,300 | | | | 4,481,300 | |
| | | | | | | | |
| | | | | | | 10,176,793 | |
| | | | | | | | |
| † | Percentages indicated are based on Portfolio net assets. |
| ¨ | | Among the Portfolio’s 10 largest holdings, as of December 31, 2012, excluding short-term investment. May be subject to change daily. |
| | | | |
| M-132 | | MainStay VP Eagle Small Cap Growth Portfolio | | The notes to the financial statements are an integral part of,
and should be read in conjunction with, the financial statements. |
| | | | | | | | |
| | | Shares | | | Value | |
| Common Stocks (continued) | | | | | | | | |
Health Care Technology 1.2% | |
MedAssets, Inc. (a) | | | 226,886 | | | $ | 3,804,878 | |
| | | | | | | | |
| | |
Hotels, Restaurants & Leisure 6.0% | | | | | | | | |
¨Bally Technologies, Inc. (a) | | | 114,779 | | | | 5,131,769 | |
BJ’s Restaurants, Inc. (a) | | | 87,509 | | | | 2,879,046 | |
Orient-Express Hotels, Ltd. (a) | | | 233,700 | | | | 2,731,953 | |
Pinnacle Entertainment, Inc. (a) | | | 182,915 | | | | 2,895,545 | |
¨SHFL Entertainment, Inc. (a) | | | 366,986 | | | | 5,321,297 | |
| | | | | | | | |
| | | | | | | 18,959,610 | |
| | | | | | | | |
Household Durables 2.2% | |
Meritage Homes Corp. (a) | | | 118,825 | | | | 4,438,114 | |
Universal Electronics, Inc. (a) | | | 126,242 | | | | 2,442,782 | |
| | | | | | | | |
| | | | | | | 6,880,896 | |
| | | | | | | | |
Insurance 1.4% | |
Validus Holdings, Ltd. | | | 127,570 | | | | 4,411,371 | |
| | | | | | | | |
|
Internet Software & Services 3.5% | |
Cornerstone OnDemand, Inc. (a) | | | 110,714 | | | | 3,269,384 | |
Demandware, Inc. (a) | | | 56,802 | | | | 1,551,831 | |
Monster Worldwide, Inc. (a) | | | 754,666 | | | | 4,241,223 | |
Trulia, Inc. (a) | | | 136,903 | | | | 2,223,305 | |
| | | | | | | | |
| | | | | | | 11,285,743 | |
| | | | | | | | |
Life Sciences Tools & Services 1.2% | |
PAREXEL International Corp. (a) | | | 126,403 | | | | 3,740,265 | |
| | | | | | | | |
|
Machinery 4.2% | |
Chart Industries, Inc. (a) | | | 23,975 | | | | 1,598,413 | |
Colfax Corp. (a) | | | 72,582 | | | | 2,928,684 | |
Terex Corp. (a) | | | 156,758 | | | | 4,406,467 | |
WABCO Holdings, Inc. (a) | | | 36,550 | | | | 2,382,695 | |
Woodward, Inc. | | | 54,360 | | | | 2,072,747 | |
| | | | | | | | |
| | | | | | | 13,389,006 | |
| | | | | | | | |
Metals & Mining 1.4% | |
RTI International Metals, Inc. (a) | | | 162,660 | | | | 4,482,910 | |
| | | | | | | | |
|
Oil, Gas & Consumable Fuels 2.8% | |
Gulfport Energy Corp. (a) | | | 107,979 | | | | 4,126,957 | |
Oasis Petroleum, Inc. (a) | | | 149,843 | | | | 4,765,008 | |
| | | | | | | | |
| | | | | | | 8,891,965 | |
| | | | | | | | |
| | | | | | | | |
| | | Shares | | | Value | |
Pharmaceuticals 1.1% | |
Salix Pharmaceuticals, Ltd. (a) | | | 89,606 | | | $ | 3,627,251 | |
| | | | | | | | |
|
Real Estate Investment Trusts 1.4% | |
Redwood Trust, Inc. | | | 101,096 | | | | 1,707,511 | |
Two Harbors Investment Corp. | | | 250,374 | | | | 2,774,144 | |
| | | | | | | | |
| | | | | | | 4,481,655 | |
| | | | | | | | |
Road & Rail 1.2% | |
Landstar System, Inc. | | | 54,258 | | | | 2,846,375 | |
Quality Distribution, Inc. (a) | | | 188,546 | | | | 1,131,276 | |
| | | | | | | | |
| | | | | | | 3,977,651 | |
| | | | | | | | |
Semiconductors & Semiconductor Equipment 4.0% | |
Cavium, Inc. (a) | | | 116,540 | | | | 3,637,213 | |
EZchip Semiconductor, Ltd. (a) | | | 72,907 | | | | 2,411,035 | |
Teradyne, Inc. (a) | | | 232,164 | | | | 3,921,250 | |
Veeco Instruments, Inc. (a) | | | 89,872 | | | | 2,653,021 | |
| | | | | | | | |
| | | | | | | 12,622,519 | |
| | | | | | | | |
Software 5.9% | |
Compuware Corp. (a) | | | 165,521 | | | | 1,799,213 | |
Concur Technologies, Inc. (a) | | | 34,469 | | | | 2,327,347 | |
Fortinet, Inc. (a) | | | 222,169 | | | | 4,681,101 | |
NICE Systems, Ltd., Sponsored ADR (a)(b) | | | 118,902 | | | | 3,980,839 | |
QLIK Technologies, Inc. (a) | | | 167,805 | | | | 3,644,725 | |
TIBCO Software, Inc. (a) | | | 110,144 | | | | 2,424,269 | |
| | | | | | | | |
| | | | | | | 18,857,494 | |
| | | | | | | | |
Specialty Retail 7.5% | |
Chico’s FAS, Inc. | | | 187,417 | | | | 3,459,718 | |
Francesca’s Holdings Corp. (a) | | | 139,876 | | | | 3,631,181 | |
¨Genesco, Inc. (a) | | | 176,945 | | | | 9,731,975 | |
Sally Beauty Holdings, Inc. (a) | | | 12,920 | | | | 304,524 | |
¨Vitamin Shoppe, Inc. (a) | | | 115,997 | | | | 6,653,588 | |
| | | | | | | | |
| | | | | | | 23,780,986 | |
| | | | | | | | |
| | |
Textiles, Apparel & Luxury Goods 1.0% | | | | | | | | |
Steven Madden, Ltd. (a) | | | 78,200 | | | | 3,305,514 | |
| | | | | | | | |
| | |
Thrifts & Mortgage Finance 0.5% | | | | | | | | |
Home Loan Servicing Solutions, Ltd. | | | 83,773 | | | | 1,583,310 | |
| | | | | | | | |
Total Common Stocks
(Cost $307,688,178) | | | | | | | 315,591,210 | |
| | | | | | | | |
| | |
| | | | | | | | |
| | | | | | |
The notes to the financial statements are an integral part of,
and should be read in conjunction with, the financial statements. | | mainstayinvestments.com | | | M-133 | |
Portfolio of Investments December 31, 2012 (continued)
| | | | | | | | |
| | | Principal
Amount | | | Value | |
| Short-Term Investment 0.5% | | | | | | | | |
Repurchase Agreement 0.5% | | | | | | | | |
State Street Bank and Trust Co.
0.01%, dated 12/31/12
due 1/2/13
Proceeds at Maturity $1,635,335 (Collateralized by a Federal National Mortgage Association security with a rate of 2.14% and a maturity date of 11/7/22, with a Principal Amount of $1,665,000 and a Market Value of $1,671,822) | | $ | 1,635,334 | | | $ | 1,635,334 | |
| | | | | | | | |
Total Short-Term Investment
(Cost $1,635,334) | | | | | | | 1,635,334 | |
| | | | | | | | |
Total Investments
(Cost $309,323,512) (c) | | | 99.7 | % | | | 317,226,544 | |
Other Assets, Less Liabilities | | | 0.3 | | | | 999,397 | |
Net Assets | | | 100.0 | % | | $ | 318,225,941 | |
| (a) | Non-income producing security. |
| (b) | ADR—American Depositary Receipt. |
| (c) | As of December 31, 2012, cost is $310,740,371 for federal income tax purposes and net unrealized appreciation is as follows: |
| | | | |
Gross unrealized appreciation | | $ | 26,529,975 | |
Gross unrealized depreciation | | | (20,043,802 | ) |
| | | | |
Net unrealized appreciation | | $ | 6,486,173 | |
| | | | |
The following is a summary of the fair valuations according to the inputs used as of December 31, 2012, for valuing the Portfolio’s assets.
Asset Valuation Inputs
| | | | | | | | | | | | | | | | |
Description | | Quoted Prices
in Active Markets
for Identical Assets (Level 1) | | | Significant Other
Observable Inputs (Level 2) | | | Significant
Unobservable
Inputs
(Level 3) | | | Total | |
| Investments in Securities (a) | | | | | | | | | | | | | | | | |
| Common Stocks | | $ | 315,591,210 | | | $ | — | | | $ | — | | | $ | 315,591,210 | |
| Short-Term Investment | | | | | | | | | | | | | | | | |
Repurchase Agreement | | | — | | | | 1,635,334 | | | | — | | | | 1,635,334 | |
| | | | | | | | | | | | | | | | |
| Total Investments in Securities | | $ | 315,591,210 | | | $ | 1,635,334 | | | $ | — | | | $ | 317,226,544 | |
| | | | | | | | | | | | | | | | |
| (a) | For a complete listing of investments and their industries, see the Portfolio of Investments. |
The Portfolio recognizes transfers between the levels as of the beginning of the period.
As of December 31, 2012, the Portfolio did not have any transfers between Level 1 and Level 2 fair value measurements. (See Note 2)
As of December 31, 2012, the Portfolio did not hold any investments with significant unobservable inputs (Level 3). (See Note 2)
| | | | |
| M-134 | | MainStay VP Eagle Small Cap Growth Portfolio | | The notes to the financial statements are an integral part of,
and should be read in conjunction with, the financial statements. |
Statement of Assets and Liabilities as of December 31, 2012
| | | | |
| Assets | | | | |
Investment in securities, at value
(identified cost $309,323,512) | | $ | 317,226,544 | |
Receivables: | | | | |
Investment securities sold | | | 4,704,897 | |
Dividends and interest | | | 157,063 | |
Fund shares sold | | | 1,323 | |
Other assets | | | 771 | |
| | | | |
Total assets | | | 322,090,598 | |
| | | | |
| |
| Liabilities | | | | |
Due to custodian | | | 800,426 | |
Payables: | | | | |
Investment securities purchased | | | 2,561,450 | |
Manager (See Note 3) | | | 216,177 | |
Fund shares redeemed | | | 211,711 | |
Professional fees | | | 38,578 | |
Shareholder communication | | | 24,995 | |
NYLIFE Distributors (See Note 3) | | | 9,547 | |
Custodian | | | 1,319 | |
Trustees | | | 454 | |
| | | | |
Total liabilities | | | 3,864,657 | |
| | | | |
Net assets | | $ | 318,225,941 | |
| | | | |
| |
| Net Assets Consist of | | | | |
Shares of beneficial interest outstanding (par value of $.001 per share) unlimited number of shares authorized | | $ | 31,848 | |
Additional paid-in capital | | | 318,680,285 | |
| | | | |
| | | 318,712,133 | |
Undistributed net investment income | | | 250,633 | |
Accumulated net realized gain (loss) on investments | | | (8,639,857 | ) |
Net unrealized appreciation (depreciation) on investments | | | 7,903,032 | |
| | | | |
Net assets | �� | $ | 318,225,941 | |
| | | | |
| | | | |
Initial Class | | | | |
Net assets applicable to outstanding shares | | $ | 272,907,794 | |
| | | | |
Shares of beneficial interest outstanding | | | 27,304,529 | |
| | | | |
Net asset value per share outstanding | | $ | 9.99 | |
| | | | |
Service Class | | | | |
Net assets applicable to outstanding shares | | $ | 45,318,147 | |
| | | | |
Shares of beneficial interest outstanding | | | 4,543,967 | |
| | | | |
Net asset value per share outstanding | | $ | 9.97 | |
| | | | |
| | | | | | |
The notes to the financial statements are an integral part of,
and should be read in conjunction with, the financial statements. | | mainstayinvestments.com | | | M-135 | |
Statement of Operations
for the period February 17, 2012 (inception date) through December 31, 2012
| | | | |
| Investment Income (Loss) | |
Income | | | | |
Dividends | | $ | 2,850,420 | |
Interest | | | 408 | |
| | | | |
Total income | | | 2,850,828 | |
| | | | |
Expenses | | | | |
Manager (See Note 3) | | | 2,159,801 | |
Distribution and service—Service Class (See Note 3) | | | 104,112 | |
Professional fees | | | 56,875 | |
Shareholder communication | | | 52,298 | |
Custodian | | | 10,433 | |
Trustees | | | 6,523 | |
Miscellaneous | | | 12,126 | |
| | | | |
Total expenses | | | 2,402,168 | |
| | | | |
Net investment income (loss) | | | 448,660 | |
| | | | |
|
| Realized and Unrealized Gain (Loss) on Investments | |
Net realized gain (loss) on investments | | | (8,837,884 | ) |
Net change in unrealized appreciation (depreciation)
on investments | | | 7,903,032 | |
| | | | |
Net realized and unrealized gain (loss) on investments | | | (934,852 | ) |
| | | | |
Net increase (decrease) in net assets resulting from operations | | $ | (486,192 | ) |
| | | | |
| | | | |
| M-136 | | MainStay VP Eagle Small Cap Growth Portfolio | | The notes to the financial statements are an integral part of,
and should be read in conjunction with, the financial statements. |
Statements of Changes in Net Assets
for the period February 17, 2012 (inception date) through December 31, 2012
| | | | |
| | | 2012 | |
| Increase (Decrease) in Net Assets | |
Operations: | | | | |
Net investment income (loss) | | $ | 448,660 | |
Net realized gain (loss) on investments | | | (8,837,884 | ) |
Net change in unrealized appreciation (depreciation)
on investments | | | 7,903,032 | |
| | | | |
Net increase (decrease) in net assets resulting
from operations | | | (486,192 | ) |
| | | | |
Capital share transactions: | | | | |
Net proceeds from sale of shares | | | 374,820,551 | |
Cost of shares redeemed | | | (56,108,418 | ) |
| | | | |
Increase (decrease) in net assets derived from capital share transactions | | | 318,712,133 | |
| | | | |
Net increase (decrease) in net assets | | | 318,225,941 | |
| |
| Net Assets | | | | |
Beginning of period | | | — | |
| | | | |
End of period | | $ | 318,225,941 | |
| | | | |
Undistributed net investment income at end of period | | $ | 250,633 | |
| | | | |
| | | | | | |
The notes to the financial statements are an integral part of,
and should be read in conjunction with, the financial statements. | | mainstayinvestments.com | | | M-137 | |
Financial Highlights selected per share data and ratios
| | | | |
| | | Initial Class | |
| | | February 17,
2012** through December 31, | |
| | | 2012 | |
Net asset value at beginning of period | | $ | 10.00 | |
| | | | |
Net investment income (loss) | | | 0.02 | |
Net realized and unrealized gain (loss) on investments | | | (0.03 | ) |
| | | | |
Total from investment operations | | | (0.01 | ) |
| | | | |
Net asset value at end of period | | $ | 9.99 | |
| | | | |
Total investment return | | | (0.10 | %)(a)(b) |
Ratios (to average net assets)/Supplemental Data: | | | | |
Net investment income (loss) | | | 0.22 | % †† |
Net expenses | | | 0.86 | % †† |
Portfolio turnover rate | | | 78 | % |
Net assets at end of period (in 000’s) | | $ | 272,908 | |
| (a) | Total investment return is not annualized. |
| (b) | Total investment return may reflect adjustments to conform to generally accepted accounting principles. |
| | | | |
| | | Service Class | |
| | | February 17,
2012**
through
December 31, | |
| | | 2012 | |
Net asset value at beginning of period | | $ | 10.00 | |
| | | | |
Net investment income (loss) | | | (0.01 | ) |
Net realized and unrealized gain (loss) on investments | | | (0.02 | ) |
| | | | |
Total from investment operations | | | (0.03 | ) |
| | | | |
Net asset value at end of period | | $ | 9.97 | |
| | | | |
Total investment return | | | (0.30 | %)(a)(b) |
Ratios (to average net assets)/Supplemental Data: | | | | |
Net investment income (loss) | | | (0.09 | %)†† |
Net expenses | | | 1.11 | % †† |
Portfolio turnover rate | | | 78 | % |
Net assets at end of period (in 000’s) | | $ | 45,318 | |
| (a) | Total investment return is not annualized. |
| (b) | Total investment return may reflect adjustments to conform to generally accepted accounting principles. |
| | | | |
| M-138 | | MainStay VP Eagle Small Cap Growth Portfolio | | The notes to the financial statements are an integral part of,
and should be read in conjunction with, the financial statements. |
MainStay VP Flexible Bond Opportunities Portfolio
Investment and Performance Comparison1 (Unaudited)
Performance data quoted represents past performance. Past performance is no guarantee of future results. Because of market volatility, current performance may be lower or higher than the figures shown. Investment return and principal value will fluctuate, and as a result, when shares are redeemed, they may be worth more or less than their original cost. The performance table and graph do not reflect any deduction of sales charges, mortality and expense charges, contract charges or administrative charges. Please refer to the Performance Summary appropriate for your policy. For performance information current to the most recent month-end, please call 800-598-2019 or visit www.newyorklife.com.
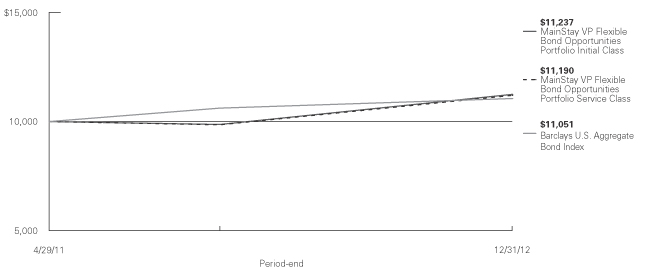
Average Annual Total Returns for the Period Ended December 31, 2012
| | | | | | | | |
| Class | | One Year | | Since
Inception (4/29/11) | | Gross Expense Ratio2 | |
| Initial Class Shares | | 13.88% | | 7.21% | | | 0.78 | % |
| Service Class Shares | | 13.58 | | 6.94 | | | 1.03 | |
| | | | | | | | |
| Benchmark Performance | | One
Year | | | Since Inception
(4/29/11) | |
Barclays U.S. Aggregate Bond Index3 | | | 4.22 | % | | | 6.18 | % |
Average Lipper Variable Products Global Income Portfolio4 | | | 9.42 | | | | 5.20 | |
| 1. | Performance figures reflect certain fee waivers and/or expense limitations, without which total returns may have been different. For information on current fee waivers and/or expense limitations please refer to the notes to the financial statements. |
| 2. | The gross expense ratios presented reflect the Portfolio’s “Total Annual Portfolio Operating Expenses” from the most recent Prospectus and may differ from other expense ratios disclosed in this report. |
| 3. | Please refer to pages M-2 and M-3 for additional explanations and disclosure regarding the Portfolios, their benchmark indices and other indices mentioned in the reports. |
| 4. | The Average Lipper Variable Products Global Income Portfolio is representative of portfolios that state in their prospectus that they invest primarily in U.S. dollar and non-U.S. dollar debt securities of issuers located in at least three countries, one of which may be the United States. Lipper Inc. is an independent monitor of fund performance. Results are based on total returns with all dividend and capital gain distributions reinvested. |
| | | | |
| mainstayinvestments.com | | | M-139 | |
Cost in Dollars of a $1,000 Investment in MainStay VP Flexible Bond Opportunities Portfolio (Unaudited)
The example below is intended to describe the fees and expenses borne by shareholders during the six-month period from July 1, 2012 to December 31, 2012, and the impact of those costs on your investment.
Example
As a shareholder of the Portfolio, you incur two types of costs: (1) transaction costs, including exchange fees and sales charges (loads) on purchases (as applicable), and (2) ongoing costs, including management fees, distribution and/or service (12b-1) fees, and other Portfolio expenses (as applicable). This example is intended to help you understand your ongoing costs (in dollars) of investing in the Portfolio and to compare these costs with the ongoing costs of investing in other Portfolios. The example is based on an investment of $1,000 made at the beginning of the six-month period and held for the entire period from July 1, 2012, to December 31, 2012. Shares are only sold in connection with variable life and annuity contracts and the example does not reflect any contract level or transactional fees or expenses. If these costs had been included, your costs would have been higher.
This example illustrates your Portfolio’s ongoing costs in two ways:
Actual Expenses
The second and third data columns in the table below provide information about actual account values and actual expenses. You may use the information in these columns, together with the amount you invested, to estimate the
expenses that you paid during the six months ended December 31, 2012. Simply divide your account value by $1,000 (for example, an $8,600 account value divided by $1,000 = 8.6), then multiply the result by the number under the heading entitled ‘‘Expenses Paid During Period’’ to estimate the expenses you paid on your account during this period.
Hypothetical Example for Comparison Purposes
The fourth and fifth data columns in the table below provide information about hypothetical account values and hypothetical expenses based on the Portfolio’s actual expense ratio and an assumed rate of return of 5% per year before expenses, which is not the Portfolio’s actual return. The hypothetical account values and expenses may not be used to estimate the actual ending account balances or expenses you paid for the six-month period shown. You may use this information to compare the ongoing costs of investing in the Portfolio with the ongoing costs of investing in other Portfolios. To do so, compare this 5% hypothetical example with the 5% hypothetical examples that appear in the shareholder reports of the other Portfolios.
Please note that the expenses shown in the table are meant to highlight your ongoing costs only and do not reflect any transactional costs, such as exchange fees or sales charges (loads). Therefore, the fourth and fifth data columns of the table are useful in comparing ongoing costs only and will not help you determine the relative total costs of owning different funds. In addition, if these transactional costs were included, your costs would have been higher.
| | | | | | | | | | | | | | | | | | | | |
| | | | | | | | | | | | | | | | |
Share Class | | Beginning
Account
Value
7/1/12 | | | Ending Account
Value (Based
on Actual
Returns and
Expenses)
12/31/12 | | | Expenses
Paid
During
Period1 | | | Ending Account
Value (Based
on Hypothetical
5% Annualized
Return and
Actual Expenses)
12/31/12 | | | Expenses
Paid
During
Period1 | |
| | | | | |
| Initial Class Shares | | $ | 1,000.00 | | | $ | 1,073.40 | | | $ | 3.34 | | | $ | 1,021.90 | | | $ | 3.25 | |
| | | | | |
| Service Class Shares | | $ | 1,000.00 | | | $ | 1,072.00 | | | $ | 4.69 | | | $ | 1,020.60 | | | $ | 4.57 | |
| 1. | Expenses are equal to the Portfolio’s annualized expense ratio of each class (0.64% for Initial Class and 0.90% for Service Class) multiplied by the average account value over the period, divided by 366 and multiplied by 184 (to reflect the six-month period). The table above represents the actual expenses incurred during the six-month period. |
| | |
| M-140 | | MainStay VP Flexible Bond Opportunities Portfolio |
Portfolio Composition as of December 31, 2012 (Unaudited)
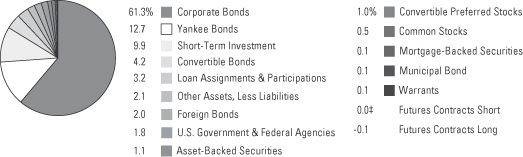
See Portfolio of Investments beginning on page M-144 for specific holdings within these categories.
| ‡ | Less than one-tenth of a percent. |
Top Ten Holdings or Issuers Held as of December 31, 2012 (excluding short-term investment) (Unaudited)
| 1. | United States Treasury Inflation-Indexed Notes, 1.125%–1.25%, due 7/15/20–1/15/21 |
| 2. | Bank of America Corp., 4.75%–7.625%, due 5/6/19 –7/1/20 |
| 3. | First Data Corp., 7.375%–8.875%, due 6/15/19–8/15/20 |
| 4. | Royal Bank of Scotland Group PLC, 6.125%–6.40%, due 10/21/19–12/15/22 |
| 5. | Sprint Capital Corp., 6.90%–8.75%, due 5/1/19–3/15/32 |
| 6. | Novelis, Inc., 8.375%–8.75%, due 12/15/17–12/15/20 |
| 7. | Portugal Obrigacoes do Tesouro OT, 4.95%, due 10/25/23 |
| 8. | Urbi Desarrollos Urbanos S.A.B. de C.V., 9.50%–9.75%, due 1/21/20–2/3/22 |
| 9. | Triumph Group, Inc., 8.00%–8.625%, due 11/15/17–7/15/18 |
| 10. | KB Home, 8.00%, due 3/15/20 |
| | | | |
| mainstayinvestments.com | | | M-141 | |
Portfolio Management Discussion and Analysis (Unaudited)
Answers to the questions reflect the views of portfolio managers Dan Roberts, Michael Kimble, Louis N. Cohen and Taylor Wagenseil of MacKay Shields LLC, the Portfolio’s Subadvisor.
How did MainStay VP Flexible Bond Opportunities Portfolio perform relative to its peers and its benchmark during the reporting period?
For the 12 months ended December 31, 2012, MainStay VP Flexible Bond Opportunities Portfolio returned 13.88% for Initial Class shares and 13.58% for Service Class shares. Both share classes outperformed the 9.42% return of the average Lipper1 Variable Products Global Income Portfolio and the 4.22% return of the Barclays U.S. Aggregate Bond Index for the 12 months ended December 31, 2012. The Barclays U.S. Aggregate Bond Index is the Portfolio’s broad-based securities-market index.
Were there any changes to the Portfolio during the reporting period?
At a meeting of the Board of Trustees (“Board”) of the Fund on December 12, 2012, the Board approved: (1) a change to the name of the Portfolio; (2) changes to the investment objective; (3) modification to the principal investment strategies; and (4) the addition of new secondary benchmark indices. It is anticipated that effective May 1, 2013, the name of the Portfolio will be changed to “MainStay VP Unconstrained Bond Portfolio,” the Portfolio’s investment objective will change from “to seek current income and total return by investing primarily in domestic and foreign debt securities“ to “to seek total return by investing primarily in domestic and foreign debt securities” and the Bank of America Merrill Lynch U.S. 3-month LIBOR Constant Maturity Index will become a secondary benchmark of the Portfolio and the Morningstar Nontraditional Bond Category Average will become an additional benchmark. Please see the Supplement dated December 13, 2012, to the Prospectus dated May 1, 2012, as supplemented.
What factors affected the Portfolio’s relative performance during the reporting period?
The Portfolio’s outperformance of the Barclays U.S. Aggregate Bond Index was primarily driven by an overweight position in spread2 products, specifically high-yield corporate bonds. Assets with higher-risk profiles provided strong results during the reporting
period, largely in response to accommodative monetary policies among the world’s central banks. In particular, the European Central Bank’s Long Term Refinancing Operations offered in late December 2011 and in February 2012 helped recapitalize the European banking system. In the last quarter of the reporting period, the European Central Bank president’s proclamation to “preserve the euro”—along with the U.S. Federal Reserve’s announcement that it would engage in an open-ended mortgage purchase program—calmed market fears and kept the “risk rally” alive as investors continued to search for yield. A stronger appetite for risk benefited the Portfolio’s overweight positions in high-yield corporate bonds and convertible bonds.
High-yield corporate bonds were the Portfolio’s largest overweight position in relation to the Barclays U.S. Aggregate Bond Index. (The Index consists entirely of investment-grade bonds.) Within high-yield corporate bonds, holdings in sectors that are more cyclical—such as financials, gaming and housing—were among the Portfolio’s strongest performers.
Lower-risk assets, such as U.S. Treasury securities and agency mortgages, underperformed the Barclays U.S. Aggregate Bond Index. Fortunately, having underweight positions in these asset classes helped the Portfolio’s performance relative to the Barclays U.S. Aggregate Bond Index.
What was the Portfolio’s duration3 strategy during the reporting period?
The Portfolio’s duration was shorter than that of the Barclays U.S. Aggregate Bond Index throughout the reporting period, in large part because of the Portfolio’s overweight position in high-yield corporate bonds. These bonds tend to have shorter durations than investment-grade corporate bonds. They also tend to have a low correlation to U.S. Treasury securities, so they have a lower sensitivity to interest rates. To further insulate the Portfolio from a potential rise in interest rates, we maintained a short position in U.S. Treasury futures to keep the Portfolio’s duration shorter than that of the Index.
| 1. | Please refer to pages M-2 and M-3 for additional explanations and disclosure regarding the Portfolios, their benchmark indices and service providers mentioned in the reports. |
| 2. | The terms “spread” and “yield spread” may refer to the difference in yield between a security or type of security and comparable U.S. Treasury issues. The terms may also refer to the difference in yield between two specific securities or types of securities at a given time. |
| 3. | Duration is a measure of the price sensitivity of a fixed-income investment to changes in interest rates. Duration is expressed as a number of years and is considered a more accurate sensitivity gauge than average maturity. |
| | |
| M-142 | | MainStay VP Flexible Bond Opportunities Portfolio |
What specific factors, risks or market forces prompted significant decisions for the Portfolio during the reporting period?
During the reporting period, there were many macro factors to consider, and the Portfolio experienced some periods of volatility. Nevertheless, we did not make any material changes to the Portfolio’s positioning. Prior to the reporting period, we had judged the Federal Reserve’s accommodative monetary policy, along with improving economic data, to be a positive for spread products such as high-yield corporate bonds. Additionally, improving profitability signaled that many corporations were doing more with less: less leverage, less short-term debt and smaller funding gaps. In our opinion, improving credit fundamentals would support narrower spreads—or less compensation for assuming credit risk—alongside a favorable balance of supply and demand for corporate debt. For these reasons, we maintained a risk profile that was higher than that of the Barclays U.S. Aggregate Bond Index.
During the reporting period, which market segments were the strongest positive contributors to the Portfolio’s performance, and which market segments were particularly weak?
An overweight position in high-yield corporate bonds was the driving force behind the Portfolio’s outperformance of the Barclays U.S. Aggregate Bond Index. During the reporting period, the Barclays U.S. Aggregate Bond Index was up 4.22%, while high-yield corporate bonds, as measured by the Bank of America Merrill Lynch High Yield Master II Constrained Index,1 was up 15.6%. Within high-yield corporate bonds, the Portfolio’s financials and real estate holdings were the best performers. Energy and utilities holdings were among the Portfolio’s weakest performers.
Convertible bond holdings also had a positive impact on the Portfolio’s performance during the reporting period.
With an overweight position in high-yield corporate bonds came underweight positions in U.S. Treasury securities and agency mortgages. These underweight sector positions contributed to the Portfolio’s relative performance as investors continued their search for higher-yielding assets and were willing to assume higher levels of risk to pursue their yield objectives. (Contributions take weightings and total returns into account.)
Did the Portfolio make any significant purchases or sales during the reporting period?
The year 2012 brought robust new issuance in the high-yield corporate bond market. As of December 31, 2012, year-to-date volume exceeded the previous record set in 2010. The majority of new issuance, approximately 60% year-to-date, was for refinancing. Several companies in which the Portfolio held positions, including privatized correctional and detention facilities operator Corrections Corporation of America and residential home builder Meritage Homes, redeemed their bonds during the reporting period.
In 2012, some companies whose bonds the Portfolio had previously owned issued new securities that fit our process, and we bought them for the Portfolio. Among these companies were oil and gas producer Chesapeake Energy, gaming facilities operator Mohegan Tribal Gaming Authority and residential home builder KB Home.
How did the Portfolio’s sector weightings change during the reporting period?
Prior to and during the reporting period, we viewed the accommodative monetary policies of the world’s central banks as a positive for spread product, specifically high-yield and investment-grade corporate bonds. For this reason, we maintained an overweight position in credit throughout the reporting period. We also maintained an underweight position in government and government-sponsored securities in the Portfolio.
How was the Portfolio positioned at the end of the reporting period?
As of December 31, 2012, the Portfolio remained positioned to take advantage of accommodative monetary policies globally. The Portfolio’s most substantially overweight sector relative to the Barclays U.S. Aggregate Bond Index was high-yield corporate bonds. The Portfolio also held overweight positions in bank debt and convertible securities.
As of the same date, the Portfolio held underweight positions relative to the Index in U.S. Treasury securities, agency debentures and agency mortgage-backed securities. As of December 31, 2012, the Portfolio’s duration position was shorter than that of the Barclays U.S. Aggregate Bond Index.
The opinions expressed are those of the portfolio managers as of the date of this report and are subject to change. There is no guarantee that any forecasts made will come to pass. This material does not constitute investment advice and is not intended as an endorsement of any specific investment.
Not all MainStay VP Portfolios and/or share classes are available under all policies.
| | | | |
| mainstayinvestments.com | | | M-143 | |
Portfolio of Investments December 31, 2012
| | | | | | | | |
| | | Principal
Amount | | | Value | |
| | | | | | | | |
Long-Term Bonds 86.5%† Asset-Backed Securities 1.1% | | | | | | | | |
Airlines 0.2% | | | | | | | | |
American Airlines Pass-Through Trust
Series 2001-1, Class A1
6.977%, due 11/23/22 | | $ | 325,859 | | | $ | 322,601 | |
Continental Airlines, Inc.
Series 2004-ERJ1, Class A
9.558%, due 3/1/21 | | | 22,798 | | | | 24,052 | |
Northwest Airlines, Inc.
Series 2007-1, Class A
7.027%, due 5/1/21 | | | 79,809 | | | | 88,684 | |
United Air Lines, Inc.
Series 2009-2, Class A
9.75%, due 7/15/18 | | | 147,507 | | | | 170,739 | |
| | | | | | | | |
| | | | | | | 606,076 | |
| | | | | | | | |
Home Equity 0.7% | | | | | | | | |
Carrington Mortgage Loan Trust
Series 2006-NC4, Class A5
0.27%, due 10/25/36 (a)(b) | | | 143,356 | | | | 107,178 | |
Citigroup Mortgage Loan Trust
Series 2007-AHL2, Class A3A
0.28%, due 5/25/37 (a)(b) | | | 91,577 | | | | 67,149 | |
Equifirst Loan Securitization Trust
Series 2007-1, Class A2A
0.27%, due 4/25/37 (a)(b) | | | 36,244 | | | | 34,313 | |
First NLC Trust
Series 2007-1, Class A1
0.28%, due 8/25/37 (a)(b)(c) | | | 108,916 | | | | 47,658 | |
GSAA Home Equity Trust
Series 2006-14, Class A1
0.26%, due 9/25/36 (a)(b) | | | 229,401 | | | | 106,087 | |
Home Equity Loan Trust
Series 2007-FRE1, Class 2AV1
0.34%, due 4/25/37 (a)(b) | | | 63,533 | | | | 54,296 | |
HSI Asset Securitization Corp. Trust
Series 2007-NC1, Class A1
0.31%, due 4/25/37 (a)(b) | | | 119,348 | | | | 103,801 | |
JP Morgan Mortgage Acquisition Corp.
Series 2007-HE1, Class AF1
0.31%, due 3/25/47 (a)(b) | | | 78,894 | | | | 56,708 | |
Master Asset Backed Securities Trust
Series 2006-HE4, Class A1
0.26%, due 11/25/36 (a)(b) | | | 28,861 | | | | 11,707 | |
Merrill Lynch Mortgage Investors Trust
Series 2007-MLN1, Class A2A
0.32%, due 3/25/37 (a)(b) | | | 190,791 | | | | 126,707 | |
Morgan Stanley ABS Capital I, Inc.
Series 2006-HE6, Class A2B
0.31%, due 9/25/36 (a)(b) | | | 128,178 | | | | 84,193 | |
| | | | | | | | |
| | | Principal
Amount | | | Value | |
| | | | | | | | |
Home Equity (continued) | | | | | | | | |
Morgan Stanley ABS Capital I, Inc. (continued) | |
Series 2006-HE8, Class A2B
0.31%, due 10/25/36 (a)(b) | | $ | 52,878 | | | $ | 29,308 | |
Series 2007-HE4, Class A2A
0.32%, due 2/25/37 (a)(b) | | | 25,283 | | | | 10,216 | |
Series 2007-NC2, Class A2FP
0.36%, due 2/25/37 (a)(b) | | | 104,412 | | | | 55,255 | |
Renaissance Home Equity Loan Trust
Series 2007-2, Class AF1
5.893%, due 6/25/37 (b)(d) | | | 208,002 | | | | 109,069 | |
Securitized Asset Backed Receivables LLC Trust
Series 2007-BR4, Class A2A
0.30%, due 5/25/37 (a)(b) | | | 127,750 | | | | 63,603 | |
Soundview Home Equity Loan Trust
Series 2007-OPT1, Class 2A1
0.29%, due 6/25/37 (a)(b) | | | 159,406 | | | | 149,448 | |
Series 2006-EQ2, Class A2
0.32%, due 1/25/37 (a)(b) | | | 79,657 | | | | 47,570 | |
Specialty Underwriting & Residential Finance
Series 2006-BC4, Class A2B
0.32%, due 9/25/37 (a)(b) | | | 867,897 | | | | 715,527 | |
| | | | | | | | |
| | | | | | | 1,979,793 | |
| | | | | | | | |
Student Loans 0.2% | | | | | | | | |
Keycorp Student Loan Trust
Series 2000-A, Class A2
0.632%, due 5/25/29 (a) | | | 536,978 | | | | 493,341 | |
| | | | | | | | |
Total Asset-Backed Securities
(Cost $3,194,829) | | | | | | | 3,079,210 | |
| | | | | | | | |
|
| Convertible Bonds 4.2% | |
Apparel 0.1% | | | | | | | | |
Iconix Brand Group, Inc.
2.50%, due 6/1/16 (c) | | | 175,000 | | | | 182,109 | |
| | | | | | | | |
| | |
Auto Manufacturers 0.1% | | | | | | | | |
Ford Motor Co.
4.25%, due 11/15/16 | | | 142,000 | | | | 225,780 | |
| | | | | | | | |
| | |
Auto Parts & Equipment 0.1% | | | | | | | | |
Meritor, Inc.
4.00%, due 2/15/27 (d) | | | 350,000 | | | | 263,594 | |
| | | | | | | | |
| | |
Biotechnology 0.2% | | | | | | | | |
Amgen, Inc.
0.375%, due 2/1/13 | | | 251,000 | | | | 282,218 | |
Gilead Sciences, Inc.
1.00%, due 5/1/14 | | | 266,000 | | | | 436,240 | |
| | | | | | | | |
| | | | | | | 718,458 | |
| | | | | | | | |
| † | Percentages indicated are based on Portfolio net assets. |
| ¨ | | Among the Portfolio’s 10 largest holdings or issuers held, as of December 31, 2012, excluding short-term investment. May be subject to change daily. |
| | | | |
| M-144 | | MainStay VP Flexible Bond Opportunities Portfolio | | The notes to the financial statements are an integral part of,
and should be read in conjunction with, the financial statements. |
| | | | | | | | |
| | | Principal
Amount | | | Value | |
| | | | | | | | |
| Convertible Bonds (continued) | |
Coal 0.2% | | | | | | | | |
Alpha Natural Resources, Inc.
2.375%, due 4/15/15 | | $ | 125,000 | | | $ | 116,719 | |
Peabody Energy Corp.
4.75%, due 12/15/66 | | | 447,000 | | | | 432,752 | |
| | | | | | | | |
| | | | | | | 549,471 | |
| | | | | | | | |
Computers 0.3% | | | | | | | | |
EMC Corp.
1.75%, due 12/1/13 | | | 396,000 | | | | 632,364 | |
Mentor Graphics Corp.
4.00%, due 4/1/31 | | | 180,000 | | | | 212,513 | |
SanDisk Corp.
1.50%, due 8/15/17 | | | 118,000 | | | | 137,470 | |
| | | | | | | | |
| | | | | | | 982,347 | |
| | | | | | | | |
Distribution & Wholesale 0.2% | | | | | | | | |
WESCO International, Inc.
6.00%, due 9/15/29 | | | 190,000 | | | | 471,675 | |
| | | | | | | | |
| | |
Electronics 0.1% | | | | | | | | |
TTM Technologies, Inc.
3.25%, due 5/15/15 | | | 303,000 | | | | 307,166 | |
| | | | | | | | |
| | |
Entertainment 0.1% | | | | | | | | |
International Game Technology
3.25%, due 5/1/14 | | | 258,000 | | | | 270,416 | |
| | | | | | | | |
| | |
Environmental Controls 0.2% | | | | | | | | |
Covanta Holding Corp.
3.25%, due 6/1/14 | | | 445,000 | | | | 539,841 | |
| | | | | | | | |
| | |
Health Care—Products 0.1% | | | | | | | | |
Teleflex, Inc.
3.875%, due 8/1/17 | | | 322,000 | | | | 414,173 | |
| | | | | | | | |
| | |
Health Care—Services 0.1% | | | | | | | | |
WellPoint, Inc.
2.75%, due 10/15/42 (c) | | | 160,000 | | | | 172,900 | |
| | | | | | | | |
| | |
Household Products & Wares 0.1% | | | | | | | | |
Jarden Corp.
1.875%, due 9/15/18 (c) | | | 310,000 | | | | 315,231 | |
| | | | | | | | |
| | |
Internet 0.2% | | | | | | | | |
Dealertrack Technologies, Inc.
1.50%, due 3/15/17 (c) | | | 90,000 | | | | 95,456 | |
Symantec Corp.
1.00%, due 6/15/13 | | | 275,000 | | | | 296,485 | |
VeriSign, Inc.
3.25%, due 8/15/37 | | | 185,000 | | | | 234,256 | |
| | | | | | | | |
| | | | | | | 626,197 | |
| | | | | | | | |
| | | | | | | | |
| | | Principal
Amount | | | Value | |
| | | | | | | | |
Iron & Steel 0.4% | | | | | | | | |
Allegheny Technologies, Inc.
4.25%, due 6/1/14 | | $ | 405,000 | | | $ | 443,222 | |
ArcelorMittal
5.00%, due 5/15/14 | | | 219,000 | | | | 228,718 | |
Steel Dynamics, Inc.
5.125%, due 6/15/14 | | | 222,000 | | | | 242,674 | |
United States Steel Corp.
4.00%, due 5/15/14 | | | 182,000 | | | | 197,129 | |
| | | | | | | | |
| | | | | | | 1,111,743 | |
| | | | | | | | |
Lodging 0.1% | | | | | | | | |
MGM Resorts International
4.25%, due 4/15/15 | | | 170,000 | | | | 180,306 | |
| | | | | | | | |
| | |
Mining 0.0%‡ | | | | | | | | |
Alcoa, Inc.
5.25%, due 3/15/14 | | | 40,000 | | | | 57,475 | |
| | | | | | | | |
| | |
Miscellaneous—Manufacturing 0.2% | | | | | | | | |
Danaher Corp.
(zero coupon), due 1/22/21 | | | 266,000 | | | | 433,580 | |
Textron, Inc.
4.50%, due 5/1/13 | | | 50,000 | | | | 94,906 | |
| | | | | | | | |
| | | | | | | 528,486 | |
| | | | | | | | |
Oil & Gas 0.1% | | | | | | | | |
Stone Energy Corp.
1.75%, due 3/1/17 (c) | | | 325,000 | | | | 286,813 | |
| | | | | | | | |
| | |
Oil & Gas Services 0.2% | | | | | | | | |
Helix Energy Solutions Group, Inc.
3.25%, due 3/15/32 | | | 300,000 | | | | 355,312 | |
SEACOR Holdings, Inc.
2.50%, due 12/15/27 (c) | | | 60,000 | | | | 61,425 | |
Subsea 7 S.A.
3.50%, due 10/13/14 | | | 100,000 | | | | 152,700 | |
| | | | | | | | |
| | | | | | | 569,437 | |
| | | | | | | | |
Pharmaceuticals 0.2% | | | | | | | | |
BioMarin Pharmaceutical, Inc.
1.875%, due 4/23/17 | | | 65,000 | | | | 160,672 | |
Salix Pharmaceuticals, Ltd.
1.50%, due 3/15/19 (c) | | | 85,000 | | | | 82,290 | |
2.75%, due 5/15/15 | | | 125,000 | | | | 143,594 | |
Teva Pharmaceutical Finance Co. LLC
0.25%, due 2/1/26 | | | 295,000 | | | | 302,744 | |
| | | | | | | | |
| | | | | | | 689,300 | |
| | | | | | | | |
Real Estate Investment Trusts 0.1% | | | | | | | | |
SL Green Operating Partnership, L.P.
3.00%, due 10/15/17 (c) | | | 250,000 | | | | 281,406 | |
| | | | | | | | |
| | | | | | |
The notes to the financial statements are an integral part of,
and should be read in conjunction with, the financial statements. | | mainstayinvestments.com | | | M-145 | |
Portfolio of Investments December 31, 2012 (continued)
| | | | | | | | |
| | | Principal
Amount | | | Value | |
| | | | | | | | |
| Convertible Bonds (continued) | |
Semiconductors 0.3% | | | | | | | | |
Microchip Technology, Inc.
2.125%, due 12/15/37 | | $ | 150,000 | | | $ | 190,125 | |
Novellus Systems, Inc.
2.625%, due 5/15/41 | | | 130,000 | | | | 162,500 | |
ON Semiconductor Corp.
Series B
2.625%, due 12/15/26 | | | 260,000 | | | | 278,362 | |
Xilinx, Inc.
2.625%, due 6/15/17 | | | 75,000 | | | | 102,469 | |
| | | | | | | | |
| | | | | | | 733,456 | |
| | | | | | | | |
Software 0.0%‡ | | | | | | | | |
Bottomline Technologies, Inc.
1.50%, due 12/1/17 | | | 35,000 | | | | 39,047 | |
Microsoft Corp.
(zero coupon), due 6/15/13 (c) | | | 65,000 | | | | 65,366 | |
| | | | | | | | |
| | | | | | | 104,413 | |
| | | | | | | | |
Telecommunications 0.5% | | | | | | | | |
Anixter International, Inc.
1.00%, due 2/15/13 | | | 286,000 | | | | 327,828 | |
Ciena Corp.
4.00%, due 12/15/20 | | | 130,000 | | | | 149,419 | |
SBA Communications Corp.
1.875%, due 5/1/13 | | | 233,000 | | | | 397,119 | |
4.00%, due 10/1/14 | | | 180,000 | | | | 426,487 | |
| | | | | | | | |
| | | | | | | 1,300,853 | |
| | | | | | | | |
Total Convertible Bonds
(Cost $11,916,107) | | | | | | | 11,883,046 | |
| | | | | | | | |
|
| Corporate Bonds 61.3% | |
Advertising 0.3% | | | | | | | | |
Lamar Media Corp.
7.875%, due 4/15/18 | | | 750,000 | | | | 828,750 | |
| | | | | | | | |
| | |
Aerospace & Defense 2.4% | | | | | | | | |
Alliant Techsystems, Inc.
6.875%, due 9/15/20 | | | 1,200,000 | | | | 1,318,500 | |
B/E Aerospace, Inc.
5.25%, due 4/1/22 | | | 1,150,000 | | | | 1,219,000 | |
Ducommun, Inc.
9.75%, due 7/15/18 | | | 775,000 | | | | 833,125 | |
TransDigm, Inc.
7.75%, due 12/15/18 | | | 1,075,000 | | | | 1,189,219 | |
¨Triumph Group, Inc.
8.00%, due 11/15/17 | | | 900,000 | | | | 972,000 | |
8.625%, due 7/15/18 | | | 1,100,000 | | | | 1,221,000 | |
| | | | | | | | |
| | | | | | | 6,752,844 | |
| | | | | | | | |
| | | | | | | | |
| | | Principal
Amount | | | Value | |
| | | | | | | | |
Agriculture 0.5% | | | | | | | | |
Bunge, Ltd. Finance Corp.
8.50%, due 6/15/19 | | $ | 1,015,000 | | | $ | 1,305,995 | |
| | | | | | | | |
| | |
Airlines 2.1% | | | | | | | | |
Continental Airlines, Inc. | | | | | | | | |
7.875%, due 1/2/20 | | | 319,242 | | | | 328,819 | |
9.798%, due 10/1/22 | | | 720,252 | | | | 785,074 | |
Delta Air Lines, Inc.
Series 2011-1 Class A Pass Through Trust
5.30%, due 10/15/20 | | | 320,140 | | | | 352,954 | |
Series 2010-1 Class A Pass Through Trust
6.20%, due 1/2/20 | | | 86,057 | | | | 97,030 | |
Series 2010-2, Class B Pass Through Trust
6.75%, due 5/23/17 | | | 563,000 | | | | 585,520 | |
U.S. Airways Group, Inc.
Series A
6.25%, due 10/22/24 | | | 1,038,638 | | | | 1,124,325 | |
U.S. Airways, Inc.
Series 2012-1A, Pass Through Trust 5.90%, due 4/1/26 | | | 1,879,000 | | | | 2,048,110 | |
United Air Lines, Inc.
9.875%, due 8/1/13 (c) | | | 667,000 | | | | 670,752 | |
| | | | | | | | |
| | | | | | | 5,992,584 | |
| | | | | | | | |
Auto Manufacturers 1.3% | | | | | | | | |
Chrysler Group LLC / CG Co-Issuer, Inc. 8.25%, due 6/15/21 | | | 1,360,000 | | | | 1,496,000 | |
Ford Motor Co.
6.625%, due 10/1/28 | | | 51,000 | | | | 58,898 | |
7.45%, due 7/16/31 | | | 525,000 | | | | 666,750 | |
9.98%, due 2/15/47 | | | 133,000 | | | | 186,532 | |
Navistar International Corp.
8.25%, due 11/1/21 | | | 1,415,000 | | | | 1,365,475 | |
| | | | | | | | |
| | | | | | | 3,773,655 | |
| | | | | | | | |
Auto Parts & Equipment 1.4% | | | | | | | | |
Commercial Vehicle Group, Inc.
7.875%, due 4/15/19 | | | 500,000 | | | | 495,000 | |
Continental Rubber of America Corp.
4.50%, due 9/15/19 (c) | | | 1,450,000 | | | | 1,483,921 | |
Goodyear Tire & Rubber Co. (The)
8.25%, due 8/15/20 | | | 1,650,000 | | | | 1,810,875 | |
Tomkins LLC / Tomkins, Inc.
9.00%, due 10/1/18 | | | 252,000 | | | | 282,240 | |
| | | | | | | | |
| | | | | | | 4,072,036 | |
| | | | | | | | |
| | | | |
| M-146 | | MainStay VP Flexible Bond Opportunities Portfolio | | The notes to the financial statements are an integral part of,
and should be read in conjunction with, the financial statements. |
| | | | | | | | |
| | | Principal
Amount | | | Value | |
| | | | | | | | |
| Corporate Bonds (continued) | |
Banks 3.1% | | | | | | | | |
¨Bank of America Corp.
4.75%, due 5/6/19 (a) | | € | 1,000,000 | | | $ | 1,283,566 | |
5.625%, due 7/1/20 | | $ | 1,910,000 | | | | 2,264,548 | |
7.625%, due 6/1/19 | | | 95,000 | | | | 121,559 | |
CIT Group, Inc.
4.25%, due 8/15/17 | | | 600,000 | | | | 617,845 | |
Discover Bank / Greenwood
7.00%, due 4/15/20 | | | 1,055,000 | | | | 1,309,989 | |
JPMorgan Chase & Co.
7.90%, due 4/29/49 (a) | | | 1,500,000 | | | | 1,699,515 | |
Morgan Stanley
4.875%, due 11/1/22 | | | 831,000 | | | | 860,413 | |
PNC Funding Corp.
5.625%, due 2/1/17 | | | 495,000 | | | | 571,518 | |
| | | | | | | | |
| | | | | | | 8,728,953 | |
| | | | | | | | |
Building Materials 2.5% | | | | | | | | |
Associated Materials LLC / AMH New Finance, Inc.
9.125%, due 11/1/17 | | | 1,252,000 | | | | 1,270,780 | |
Masco Corp.
7.125%, due 3/15/20 | | | 1,100,000 | | | | 1,279,774 | |
Texas Industries, Inc.
9.25%, due 8/15/20 | | | 615,000 | | | | 659,588 | |
¨Urbi Desarrollos Urbanos S.A.B. de C.V. | | | | | | | | |
9.50%, due 1/21/20 (c) | | | 1,350,000 | | | | 1,275,750 | |
9.75%, due 2/3/22 (c) | | | 1,000,000 | | | | 947,500 | |
USG Corp. | | | | | | | | |
6.30%, due 11/15/16 | | | 280,000 | | | | 289,800 | |
8.375%, due 10/15/18 (c) | | | 500,000 | | | | 555,000 | |
9.75%, due 1/15/18 | | | 582,000 | | | | 659,115 | |
| | | | | | | | |
| | | | | | | 6,937,307 | |
| | | | | | | | |
Chemicals 1.6% | | | | | | | | |
Ashland, Inc.
4.75%, due 8/15/22 (c) | | | 950,000 | | | | 988,000 | |
Dow Chemical Co. (The)
8.55%, due 5/15/19 | | | 596,000 | | | | 804,645 | |
Hexion U.S. Finance Corp. / Hexion Nova Scotia Finance ULC
8.875%, due 2/1/18 | | | 877,000 | | | | 901,118 | |
Huntsman International LLC
8.625%, due 3/15/21 | | | 1,240,000 | | | | 1,416,700 | |
Momentive Performance Materials, Inc. 9.00%, due 1/15/21 | | | 610,000 | | | | 445,300 | |
| | | | | | | | |
| | | | | | | 4,555,763 | |
| | | | | | | | |
Coal 1.0% | | | | | | | | |
Alpha Natural Resources, Inc.
6.00%, due 6/1/19 | | | 575,000 | | | | 529,000 | |
| | | | | | | | |
| | | Principal
Amount | | | Value | |
| | | | | | | | |
Coal (continued) | | | | | | | | |
Arch Coal, Inc.
7.25%, due 10/1/20 | | $ | 1,045,000 | | | $ | 969,238 | |
Cloud Peak Energy Resources LLC / Cloud Peak Energy Finance Corp.
8.25%, due 12/15/17 | | | 763,000 | | | | 816,410 | |
Peabody Energy Corp.
7.375%, due 11/1/16 | | | 475,000 | | | | 543,875 | |
| | | | | | | | |
| | | | | | | 2,858,523 | |
| | | | | | | | |
Commercial Services 2.7% | | | | | | | | |
Avis Budget Car Rental LLC / Avis Budget Finance, Inc. | | | | | | | | |
8.25%, due 1/15/19 | | | 677,000 | | | | 748,085 | |
9.625%, due 3/15/18 | | | 1,075,000 | | | | 1,198,625 | |
Ford Holdings LLC
9.30%, due 3/1/30 | | | 294,000 | | | | 403,882 | |
Geo Group, Inc. (The)
6.625%, due 2/15/21 | | | 277,000 | | | | 307,470 | |
Hertz Corp. (The)
7.375%, due 1/15/21 | | | 1,570,000 | | | | 1,727,000 | |
Iron Mountain, Inc.
7.75%, due 10/1/19 | | | 322,000 | | | | 363,055 | |
8.375%, due 8/15/21 | | | 1,077,000 | | | | 1,195,470 | |
United Rentals North America, Inc.
8.375%, due 9/15/20 | | | 1,548,000 | | | | 1,714,410 | |
| | | | | | | | |
| | | | | | | 7,657,997 | |
| | | | | | | | |
Computers 0.8% | | | | | | | | |
NCR Corp.
5.00%, due 7/15/22 (c) | | | 1,450,000 | | | | 1,473,562 | |
SunGard Data Systems, Inc.
6.625%, due 11/1/19 (c) | | | 550,000 | | | | 562,375 | |
7.625%, due 11/15/20 | | | 325,000 | | | | 355,063 | |
| | | | | | | | |
| | | | | | | 2,391,000 | |
| | | | | | | | |
Diversified Financial Services 0.2% | | | | | | | | |
GE Capital Trust IV
Series Reg S
4.625%, due 9/15/66 (a) | | € | 277,000 | | | | 357,948 | |
General Electric Capital Corp.
6.50%, due 9/15/67 (a) | | £ | 185,000 | | | | 309,539 | |
| | | | | | | | |
| | | | | | | 667,487 | |
| | | | | | | | |
Electric 2.7% | | | | | | | | |
Calpine Corp.
7.875%, due 7/31/20 (c) | | $ | 1,350,000 | | | | 1,515,375 | |
CMS Energy Corp.
8.75%, due 6/15/19 | | | 907,000 | | | | 1,180,024 | |
Duquesne Light Holdings, Inc.
5.90%, due 12/1/21 (c) | | | 1,494,000 | | | | 1,773,203 | |
Energy Future Intermediate Holding Co. LLC / EFIH Finance, Inc.
10.00%, due 12/1/20 | | | 800,000 | | | | 902,000 | |
| | | | | | |
The notes to the financial statements are an integral part of,
and should be read in conjunction with, the financial statements. | | mainstayinvestments.com | | | M-147 | |
Portfolio of Investments December 31, 2012 (continued)
| | | | | | | | |
| | | Principal
Amount | | | Value | |
| | | | | | | | |
| Corporate Bonds (continued) | |
Electric (continued) | | | | | | | | |
NRG Energy, Inc.
8.50%, due 6/15/19 | | $ | 1,405,000 | | | $ | 1,545,500 | |
Puget Energy, Inc.
5.625%, due 7/15/22 | | | 585,000 | | | | 630,091 | |
Wisconsin Energy Corp.
6.25%, due 5/15/67 (a) | | | 189,000 | | | | 203,412 | |
| | | | | | | | |
| | | | | | | 7,749,605 | |
| | | | | | | | |
Entertainment 0.7% | | | | | | | | |
Isle of Capri Casinos, Inc.
7.75%, due 3/15/19 | | | 725,000 | | | | 781,188 | |
Mohegan Tribal Gaming Authority
10.50%, due 12/15/16 (c) | | | 185,000 | | | | 181,300 | |
Pinnacle Entertainment, Inc.
8.75%, due 5/15/20 | | | 975,000 | | | | 1,053,000 | |
| | | | | | | | |
| | | | | | | 2,015,488 | |
| | | | | | | | |
Environmental Controls 0.0%‡ | | | | | | | | |
EnergySolutions, Inc. / EnergySolutions LLC
10.75%, due 8/15/18 | | | 73,000 | | | | 68,985 | |
| | | | | | | | |
| | |
Finance—Auto Loans 0.7% | | | | | | | | |
Ford Motor Credit Co. LLC
8.125%, due 1/15/20 | | | 1,584,000 | | | | 2,029,701 | |
| | | | | | | | |
| | |
Finance—Consumer Loans 0.8% | | | | | | | | |
HSBC Finance Capital Trust IX
5.911%, due 11/30/35 (a) | | | 500,000 | | | | 498,750 | |
SLM Corp.
4.75%, due 3/17/14 | | € | 185,000 | | | | 249,284 | |
6.25%, due 1/25/16 | | $ | 92,000 | | | | 100,050 | |
7.25%, due 1/25/22 | | | 625,000 | | | | 689,063 | |
8.00%, due 3/25/20 | | | 492,000 | | | | 562,110 | |
8.45%, due 6/15/18 | | | 250,000 | | | | 292,500 | |
| | | | | | | | |
| | | | | | | 2,391,757 | |
| | | | | | | | |
Finance—Credit Card 0.9% | | | | | | | | |
American Express Co.
6.80%, due 9/1/66 (a) | | | 486,000 | | | | 521,843 | |
Capital One Capital III
7.686%, due 8/1/66 | | | 1,703,000 | | | | 1,703,000 | |
Discover Financial Services
3.85%, due 11/21/22 (c) | | | 300,000 | | | | 309,562 | |
| | | | | | | | |
| | | | | | | 2,534,405 | |
| | | | | | | | |
Finance—Other Services 0.5% | | | | | | | | |
Icahn Enterprises, L.P. / Icahn Enterprises Finance Corp.
7.75%, due 1/15/16 | | | 1,420,000 | | | | 1,471,475 | |
| | | | | | | | |
| | | | | | | | |
| | | Principal
Amount | | | Value | |
| | | | | | | | |
Food 1.2% | | | | | | | | |
JBS USA LLC / JBS USA Finance, Inc. 8.25%, due 2/1/20 (c) | | $ | 432,000 | | | $ | 457,920 | |
Smithfield Foods, Inc.
7.75%, due 7/1/17 | | | 1,284,000 | | | | 1,495,860 | |
Virgolino de Oliveira Finance, Ltd.
11.75%, due 2/9/22 (c) | | | 1,350,000 | | | | 1,390,500 | |
| | | | | | | | |
| | | | | | | 3,344,280 | |
| | | | | | | | |
Forest Products & Paper 0.6% | | | | | | | | |
Domtar Corp.
10.75%, due 6/1/17 | | | 166,000 | | | | 215,056 | |
International Paper Co.
7.30%, due 11/15/39 | | | 157,000 | | | | 212,823 | |
MeadWestvaco Corp.
7.375%, due 9/1/19 | | | 900,000 | | | | 1,128,914 | |
| | | | | | | | |
| | | | | | | 1,556,793 | |
| | | | | | | | |
Gas 0.2% | | | | | | | | |
Southern Union Co.
7.60%, due 2/1/24 | | | 383,000 | | | | 487,749 | |
| | | | | | | | |
| | |
Health Care—Products 1.1% | | | | | | | | |
Alere, Inc.
7.25%, due 7/1/18 (c) | | | 1,000,000 | | | | 1,002,500 | |
8.625%, due 10/1/18 | | | 277,000 | | | | 278,385 | |
Kinetic Concepts, Inc. / KCI U.S.A., Inc. 10.50%, due 11/1/18 (c) | | | 1,650,000 | | | | 1,730,438 | |
| | | | | | | | |
| | | | | | | 3,011,323 | |
| | | | | | | | |
Health Care—Services 0.6% | | | | | | | | |
HCA, Inc.
7.50%, due 2/15/22 | | | 1,350,000 | | | | 1,545,750 | |
| | | | | | | | |
| | |
Home Builders 2.6% | | | | | | | | |
Beazer Homes USA, Inc.
6.875%, due 7/15/15 | | | 1,375,000 | | | | 1,378,437 | |
8.125%, due 6/15/16 | | | 186,000 | | | | 198,090 | |
K Hovnanian Enterprises, Inc.
7.25%, due 10/15/20 (c) | | | 1,080,000 | | | | 1,161,000 | |
¨KB Home
8.00%, due 3/15/20 | | | 1,925,000 | | | | 2,184,875 | |
Lennar Corp.
6.95%, due 6/1/18 | | | 46,000 | | | | 51,405 | |
MDC Holdings, Inc.
5.625%, due 2/1/20 | | | 157,000 | | | | 171,474 | |
Shea Homes, L.P. / Shea Homes Funding Corp.
8.625%, due 5/15/19 | | | 1,150,000 | | | | 1,270,750 | |
Standard Pacific Corp.
8.375%, due 5/15/18 | | | 885,000 | | | | 1,026,600 | |
| | | | | | | | |
| | | | | | | 7,442,631 | |
| | | | | | | | |
| | | | |
| M-148 | | MainStay VP Flexible Bond Opportunities Portfolio | | The notes to the financial statements are an integral part of,
and should be read in conjunction with, the financial statements. |
| | | | | | | | |
| | | Principal
Amount | | | Value | |
| | | | | | | | |
| Corporate Bonds (continued) | |
Household Products & Wares 1.7% | | | | | | | | |
Jarden Corp.
7.50%, due 5/1/17 | | $ | 325,000 | | | $ | 366,031 | |
7.50%, due 1/15/20 | | | 977,000 | | | | 1,072,257 | |
Mead Products LLC / ACCO Brands Corp. 6.75%, due 4/30/20 (c) | | | 1,206,000 | | | | 1,266,300 | |
Reynolds Group Issuer, Inc. / Reynolds Group Issuer LLC / Reynolds Group Issuer Lu | | | | | | | | |
7.875%, due 8/15/19 | | | 475,000 | | | | 528,438 | |
8.50%, due 5/15/18 | | | 625,000 | | | | 640,625 | |
9.875%, due 8/15/19 | | | 826,000 | | | | 883,820 | |
| | | | | | | | |
| | | | | | | 4,757,471 | |
| | | | | | | | |
Insurance 2.3% | | | | | | | | |
Allstate Corp. (The)
6.50%, due 5/15/67 (a) | | | 162,000 | | | | 172,327 | |
American International Group, Inc.
4.875%, due 3/15/67 (a) | | € | 1,300,000 | | | | 1,540,053 | |
Series A2
5.75%, due 3/15/67 (a) | | £ | 50,000 | | | | 75,537 | |
Chubb Corp. (The)
6.375%, due 3/29/67 (a) | | $ | 1,295,000 | | | | 1,411,550 | |
Farmers Exchange Capital
7.20%, due 7/15/48 (c) | | | 137,000 | | | | 166,345 | |
Liberty Mutual Group, Inc.
7.80%, due 3/7/87 (c) | | | 102,000 | | | | 113,475 | |
10.75%, due 6/15/88 (a)(c) | | | 987,000 | | | | 1,470,630 | |
Lincoln National Corp.
7.00%, due 5/17/66 (a) | | | 1,407,000 | | | | 1,438,657 | |
Pacific Life Insurance Co.
9.25%, due 6/15/39 (c) | | | 46,000 | | | | 64,326 | |
Progressive Corp. (The)
6.70%, due 6/15/67 (a) | | | 138,000 | | | | 149,040 | |
| | | | | | | | |
| | | | | | | 6,601,940 | |
| | | | | | | | |
Iron & Steel 1.6% | | | | | | | | |
AK Steel Corp.
7.625%, due 5/15/20 | | | 800,000 | | | | 696,000 | |
8.75%, due 12/1/18 (c) | | | 1,000,000 | | | | 1,055,000 | |
Allegheny Ludlum Corp.
6.95%, due 12/15/25 | | | 157,000 | | | | 185,164 | |
Cliffs Natural Resources, Inc.
3.95%, due 1/15/18 | | | 524,000 | | | | 527,397 | |
5.90%, due 3/15/20 | | | 760,000 | | | | 808,138 | |
United States Steel Corp.
7.00%, due 2/1/18 | | | 650,000 | | | | 693,875 | |
7.50%, due 3/15/22 | | | 600,000 | | | | 631,500 | |
| | | | | | | | |
| | | | | | | 4,597,074 | |
| | | | | | | | |
| | | | | | | | |
| | | Principal
Amount | | | Value | |
| | | | | | | | |
Lodging 1.3% | | | | | | | | |
Caesars Entertainment Operating Co., Inc. 10.00%, due 12/15/18 | | $ | 1,250,000 | | | $ | 823,750 | |
MGM Resorts International
6.75%, due 10/1/20 (c) | | | 1,194,000 | | | | 1,219,373 | |
8.625%, due 2/1/19 (c) | | | 475,000 | | | | 529,625 | |
Wynn Las Vegas LLC / Wynn Las Vegas Capital Corp.
7.75%, due 8/15/20 | | | 900,000 | | | | 1,026,000 | |
| | | | | | | | |
| | | | | | | 3,598,748 | |
| | | | | | | | |
Machinery—Diversified 0.6% | | | | | | | | |
Briggs & Stratton Corp.
6.875%, due 12/15/20 | | | 800,000 | | | | 905,000 | |
CNH America LLC
7.25%, due 1/15/16 | | | 748,000 | | | | 841,500 | |
| | | | | | | | |
| | | | | | | 1,746,500 | |
| | | | | | | | |
Media 1.7% | | | | | | | | |
CC Holdings GS V LLC
2.381%, due 12/15/17 (c) | | | 473,000 | | | | 475,312 | |
CCO Holdings LLC / CCO Holdings Capital Corp.
7.00%, due 1/15/19 | | | 222,000 | | | | 239,483 | |
7.25%, due 10/30/17 | | | 500,000 | | | | 545,000 | |
Clear Channel Communications, Inc.
9.00%, due 3/1/21 | | | 1,080,000 | | | | 963,900 | |
COX Communications, Inc.
6.95%, due 6/1/38 (c) | | | 509,000 | | | | 669,199 | |
DISH DBS Corp.
6.75%, due 6/1/21 | | | 1,400,000 | | | | 1,596,000 | |
7.125%, due 2/1/16 | | | 185,000 | | | | 207,200 | |
| | | | | | | | |
| | | | | | | 4,696,094 | |
| | | | | | | | |
Metal Fabricate & Hardware 0.2% | | | | | | | | |
Mueller Water Products, Inc.
8.75%, due 9/1/20 | | | 457,000 | | | | 520,980 | |
| | | | | | | | |
| | |
Mining 0.9% | | | | | | | | |
Alcoa, Inc.
6.15%, due 8/15/20 | | | 724,000 | | | | 790,712 | |
Aleris International, Inc.
7.625%, due 2/15/18 | | | 924,000 | | | | 940,170 | |
7.875%, due 11/1/20 (c) | | | 240,000 | | | | 240,000 | |
Century Aluminum Co.
8.00%, due 5/15/14 | | | 500,000 | | | | 505,000 | |
| | | | | | | | |
| | | | | | | 2,475,882 | |
| | | | | | | | |
Miscellaneous—Manufacturing 0.9% | | | | | | | | |
American Railcar Industries, Inc.
7.50%, due 3/1/14 | | | 401,000 | | | | 404,008 | |
Amsted Industries, Inc.
8.125%, due 3/15/18 (c) | | | 1,280,000 | | | | 1,369,600 | |
| | | | | | |
The notes to the financial statements are an integral part of,
and should be read in conjunction with, the financial statements. | | mainstayinvestments.com | | | M-149 | |
Portfolio of Investments December 31, 2012 (continued)
| | | | | | | | |
| | | Principal
Amount | | | Value | |
| | | | | | | | |
| Corporate Bonds (continued) | |
Miscellaneous—Manufacturing (continued) | |
GE Capital Trust I
6.375%, due 11/15/67 (a) | | $ | 475,000 | | | $ | 500,531 | |
Polypore International, Inc.
7.50%, due 11/15/17 | | | 285,000 | | | | 310,650 | |
| | | | | | | | |
| | | | | | | 2,584,789 | |
| | | | | | | | |
Office Furnishings 0.4% | | | | | | | | |
Interface, Inc.
7.625%, due 12/1/18 | | | 1,164,000 | | | | 1,249,845 | |
| | | | | | | | |
| | |
Oil & Gas 4.9% | | | | | | | | |
Berry Petroleum Co.
6.75%, due 11/1/20 | | | 752,000 | | | | 808,400 | |
Chesapeake Energy Corp.
6.625%, due 8/15/20 (e) | | | 1,055,000 | | | | 1,131,488 | |
6.875%, due 8/15/18 | | | 600,000 | | | | 633,000 | |
Concho Resources, Inc.
6.50%, due 1/15/22 | | | 500,000 | | | | 550,000 | |
7.00%, due 1/15/21 | | | 623,000 | | | | 694,645 | |
Denbury Resources, Inc.
6.375%, due 8/15/21 | | | 185,000 | | | | 203,500 | |
8.25%, due 2/15/20 | | | 525,000 | | | | 590,625 | |
EP Energy LLC / EP Energy Finance, Inc. 9.375%, due 5/1/20 | | | 1,325,000 | | | | 1,493,937 | |
Frontier Oil Corp.
6.875%, due 11/15/18 | | | 129,000 | | | | 138,675 | |
Hilcorp Energy I, L.P. / Hilcorp Finance Co. 7.625%, due 4/15/21 (c) | | | 277,000 | | | | 301,930 | |
8.00%, due 2/15/20 (c) | | | 700,000 | | | | 766,500 | |
Linn Energy LLC /Linn Energy Finance Corp.
6.50%, due 5/15/19 | | | 850,000 | | | | 858,500 | |
7.75%, due 2/1/21 | | | 185,000 | | | | 197,025 | |
8.625%, due 4/15/20 | | | 425,000 | | | | 463,250 | |
Nabors Industries, Inc.
5.00%, due 9/15/20 | | | 1,222,000 | | | | 1,327,873 | |
Samson Investment Co.
9.75%, due 2/15/20 (c) | | | 1,300,000 | | | | 1,374,750 | |
Swift Energy Co.
7.125%, due 6/1/17 | | | 500,000 | | | | 515,000 | |
8.875%, due 1/15/20 | | | 1,042,000 | | | | 1,133,175 | |
Valero Energy Corp.
6.125%, due 2/1/20 | | | 509,000 | | | | 618,936 | |
| | | | | | | | |
| | | | | | | 13,801,209 | |
| | | | | | | | |
Oil & Gas Services 0.9% | | | | | | | | |
Basic Energy Services, Inc.
7.75%, due 2/15/19 | | | 625,000 | | | | 621,875 | |
Dresser-Rand Group, Inc.
6.50%, due 5/1/21 | | | 293,000 | | | | 310,580 | |
Helix Energy Solutions Group, Inc.
9.50%, due 1/15/16 (c) | | | 214,000 | | | | 219,350 | |
| | | | | | | | |
| | | Principal
Amount | | | Value | |
| | | | | | | | |
Oil & Gas Services (continued) | | | | | | | | |
Hornbeck Offshore Services, Inc.
5.875%, due 4/1/20 | | $ | 84,000 | | | $ | 87,780 | |
8.00%, due 9/1/17 | | | 1,185,000 | | | | 1,267,950 | |
| | | | | | | | |
| | | | | | | 2,507,535 | |
| | | | | | | | |
Packaging & Containers 0.4% | | | | | | | | |
Sealed Air Corp.
8.125%, due 9/15/19 (c) | | | 935,000 | | | | 1,051,875 | |
| | | | | | | | |
| | |
Pipelines 3.5% | | | | | | | | |
Access Midstream Partners, L.P./ ACMP Finance Corp.
4.875%, due 5/15/23 | | | 490,000 | | | | 497,350 | |
Atlas Pipeline Escrow LLC
6.625%, due 10/1/20 (c) | | | 1,350,000 | | | | 1,397,250 | |
Energy Transfer Equity, L.P.
7.50%, due 10/15/20 | | | 1,100,000 | | | | 1,270,500 | |
Energy Transfer Partners, L.P.
4.65%, due 6/1/21 | | | 860,000 | | | | 944,908 | |
MarkWest Energy Partners, L.P. / MarkWest Energy Finance Corp.
6.75%, due 11/1/20 | | | 752,000 | | | | 819,680 | |
Panhandle Eastern Pipe Line Co., L.P.
8.125%, due 6/1/19 | | | 463,000 | | | | 579,080 | |
Plains All American Pipeline, L.P. / PAA Finance Corp.
5.00%, due 2/1/21 | | | 463,000 | | | | 536,318 | |
Regency Energy Partners, L.P. / Regency Energy Finance Corp.
6.875%, due 12/1/18 | | | 1,050,000 | | | | 1,144,500 | |
Targa Resources Partners, L.P. / Targa Resources Partners Finance Corp. | | | | | | | | |
6.375%, due 8/1/22 (c) | | | 500,000 | | | | 545,000 | |
7.875%, due 10/15/18 | | | 800,000 | | | | 876,000 | |
Williams Cos., Inc. (The)
3.70%, due 1/15/23 | | | 1,350,000 | | | | 1,361,683 | |
| | | | | | | | |
| | | | | | | 9,972,269 | |
| | | | | | | | |
Real Estate Investment Trusts 0.3% | | | | | | | | |
Host Hotels & Resorts, L.P.
5.875%, due 6/15/19 | | | 750,000 | | | | 817,500 | |
| | | | | | | | |
| | |
Retail 2.0% | | | | | | | | |
AmeriGas Finance LLC / AmeriGas Finance Corp.
7.00%, due 5/20/22 | | | 950,000 | | | | 1,056,875 | |
AmeriGas Partners, L.P. / AmeriGas
Finance Corp. | | | | | | | | |
6.25%, due 8/20/19 | | | 1,360,000 | | | | 1,455,200 | |
6.50%, due 5/20/21 | | | 168,000 | | | | 182,280 | |
AutoNation, Inc.
6.75%, due 4/15/18 | | | 830,000 | | | | 937,900 | |
| | | | |
| M-150 | | MainStay VP Flexible Bond Opportunities Portfolio | | The notes to the financial statements are an integral part of,
and should be read in conjunction with, the financial statements. |
| | | | | | | | |
| | | Principal
Amount | | | Value | |
| | | | | | | | |
| Corporate Bonds (continued) | |
Retail (continued) | | | | | | | | |
CVS Caremark Corp.
4.75%, due 5/18/20 | | $ | 1,305,000 | | | $ | 1,531,733 | |
Suburban Propane Partners L.P. / Suburban Energy Finance Corp.
7.50%, due 10/1/18 | | | 428,000 | | | | 461,170 | |
| | | | | | | | |
| | | | | | | 5,625,158 | |
| | | | | | | | |
Semiconductors 0.4% | | | | | | | | |
Freescale Semiconductor, Inc.
9.25%, due 4/15/18 (c) | | | 1,066,000 | | | | 1,164,605 | |
| | | | | | | | |
| | |
Software 1.3% | | | | | | | | |
Fidelity National Information Services, Inc. 7.875%, due 7/15/20 | | | 1,014,000 | | | | 1,147,087 | |
¨First Data Corp.
7.375%, due 6/15/19 (c) | | | 2,042,000 | | | | 2,113,470 | |
8.875%, due 8/15/20 (c) | | | 320,000 | | | | 348,800 | |
| | | | | | | | |
| | | | | | | 3,609,357 | |
| | | | | | | | |
Telecommunications 3.2% | | | | | | | | |
CommScope, Inc.
8.25%, due 1/15/19 (c) | | | 1,720,000 | | | | 1,883,400 | |
Frontier Communications Corp.
8.50%, due 4/15/20 | | | 686,000 | | | | 788,900 | |
Hughes Satellite Systems Corp.
7.625%, due 6/15/21 | | | 1,398,000 | | | | 1,590,225 | |
MetroPCS Wireless, Inc.
7.875%, due 9/1/18 | | | 314,000 | | | | 339,905 | |
SBA Tower Trust
4.254%, due 4/15/15 (c) | | | 1,920,000 | | | | 2,017,116 | |
¨Sprint Capital Corp.
6.90%, due 5/1/19 | | | 738,000 | | | | 804,420 | |
8.75%, due 3/15/32 | | | 1,330,000 | | | | 1,625,925 | |
| | | | | | | | |
| | | | | | | 9,049,891 | |
| | | | | | | | |
Toys, Games & Hobbies 0.2% | |
Hasbro, Inc.
6.30%, due 9/15/17 | | | 395,000 | | | | 457,997 | |
| | | | | | | | |
|
Transportation 0.1% | |
PHI, Inc.
8.625%, due 10/15/18 | | | 151,000 | | | | 161,570 | |
| | | | | | | | |
Total Corporate Bonds
(Cost $166,214,162) | | | | | | | 173,221,125 | |
| | | | | | | | |
|
| Foreign Bonds 2.0% | |
El Salvador 0.0%‡ | |
Republic of El Salvador | | | | | | | | |
7.65%, due 6/15/35 | | | 37,000 | | | | 42,273 | |
8.25%, due 4/10/32 (c) | | | 37,000 | | | | 44,677 | |
| | | | | | | | |
| | | | | | | 86,950 | |
| | | | | | | | |
| | | | | | | | |
| | | Principal Amount | | | Value | |
| | | | | | | | |
Germany 0.1% | |
IKB Deutsche Industriebank A.G.
4.50%, due 7/9/13 | | € | 166,000 | | | $ | 215,847 | |
| | | | | | | | |
|
Portugal 0.8% | |
¨Portugal Obrigacoes do Tesouro OT
Series Reg S
4.95%, due 10/25/23 | | | 2,000,000 | | | | 2,233,753 | |
| | | | | | | | |
|
United Kingdom 1.1% | |
Barclays Bank PLC
Series Reg S
10.00%, due 5/21/21 | | £ | 401,000 | | | | 874,665 | |
Canada Square Operations Ltd.
7.50%, due 5/29/49 (a) | | | 1,127,000 | | | | 1,822,696 | |
Rexam PLC
6.75%, due 6/29/67 (a) | | € | 222,000 | | | | 308,410 | |
| | | | | | | | |
| | | | | | | 3,005,771 | |
| | | | | | | | |
Total Foreign Bonds
(Cost $4,405,170) | | | | | | | 5,542,321 | |
| | | | | | | | |
|
| Loan Assignments & Participations 3.2% (f) | |
Chemicals, Plastics & Rubber 0.9% | |
Ascend Performance Materials LLC
Term Loan B
6.75%, due 4/10/18 | | $ | 1,637,625 | | | | 1,619,202 | |
PQ Corp.
1st Lien Term Loan
5.25%, due 5/8/17 | | | 1,000,000 | | | | 1,004,500 | |
| | | | | | | | |
| | | | | | | 2,623,702 | |
| | | | | | | | |
|
Commercial Services 0.3% | |
KAR Auction Services, Inc.
Term Loan B
5.00%, due 5/19/17 | | | 985,000 | | | | 993,003 | |
| | | | | | | | |
|
Finance—Consumer Loans 0.4% | |
Springleaf Financial Funding Company
Term Loan
5.50%, due 5/10/17 | | | 1,000,000 | | | | 993,438 | |
| | | | | | | | |
|
Hotels, Motels, Inns & Gaming 0.2% | |
MGM Resorts International
Term Loan B
4.25%, due 12/20/19 | | | 500,000 | | | | 505,000 | |
| | | | | | | | |
| | | | | | |
The notes to the financial statements are an integral part of,
and should be read in conjunction with, the financial statements. | | mainstayinvestments.com | | | M-151 | |
Portfolio of Investments December 31, 2012 (continued)
| | | | | | | | |
| | | Principal Amount | | | Value | |
| | | | | | | | |
| Loan Assignments & Participations (continued) | |
Mining, Steel, Iron & Non-Precious Metals 0.2% | |
FMG America Finance, Inc.
Term Loan
5.25%, due 10/18/17 | | $ | 498,750 | | | $ | 502,257 | |
| | | | | | | | |
|
Oil & Gas 0.5% | |
Plains Exploration & Production Co.
7 Year Term Loan
4.00%, due 11/30/19 | | | 1,500,000 | | | | 1,503,124 | |
| | | | | | | | |
|
Retail 0.4% | |
Neiman Marcus Group, Inc. (The)
Extended Term Loan
4.75%, due 5/16/18 | | | 1,000,000 | | | | 1,000,556 | |
| | | | | | | | |
|
Telecommunications 0.3% | |
MetroPCS Wireless, Inc.
Incremental Term Loan B3
4.00%, due 3/16/18 | | | 982,485 | | | | 983,713 | |
| | | | | | | | |
Total Loan Assignments & Participations
(Cost $9,047,966) | | | | | | | 9,104,793 | |
| | | | | | | | |
|
| Mortgage-Backed Securities 0.1% | |
Commercial Mortgage Loans
(Collateralized Mortgage Obligations) 0.1% | |
Banc of America Commercial Mortgage, Inc.
Series 2005-J, Class 1A1
3.00%, due 11/25/35 (g) | | | 103,976 | | | | 90,448 | |
Deutsche ALT-A Securities, Inc. Alternate Loan Trust
Series 2005-5, Class 1A3
5.50%, due 11/25/35 (a) | | | 39,572 | | | | 35,728 | |
WaMu Mortgage Pass-Through Certificates
Series 2006-AR14, Class 1A1
2.424%, due 11/25/36 (g) | | | 50,513 | | | | 40,500 | |
Wells Fargo Mortgage Backed Securities Trust
Series 2006-AR10, Class 5A2
2.614%, due 7/25/36 (g) | | | 62,189 | | | | 54,332 | |
| | | | | | | | |
Total Mortgage-Backed Securities
(Cost $220,151) | | | | | | | 221,008 | |
| | | | | | | | |
| | | | | | | | |
| | | Principal Amount | | | Value | |
| | | | | | | | |
| Municipal Bond 0.1% | |
New York 0.1% | |
New York City Industrial Development Agency Special Facilities Revenue
Series A
8.00%, due 8/1/12 (h)(i) | | $ | 320,000 | | | $ | 319,997 | |
| | | | | | | | |
Total Municipal Bond
(Cost $325,859) | | | | | | | 319,997 | |
| | | | | | | | |
|
| U.S. Government & Federal Agencies 1.8% | |
¨United States Treasury Inflation-Indexed Notes 1.8% | |
1.125%, due 1/15/21 | | | 2,643,625 | | | | 3,105,019 | |
1.25%, due 7/15/20 | | | 1,571,518 | | | | 1,864,214 | |
| | | | | | | | |
| | | | | | | 4,969,233 | |
| | | | | | | | |
Total U.S. Government & Federal Agencies
(Cost $4,368,322) | | | | 4,969,233 | |
| | | | | | | | |
|
| Yankee Bonds 12.7% (j) | |
Banks 2.2% | |
Banco Santander Mexico S.A. Institucion De Banca Multiple Grupo Financiero Santand
4.125%, due 11/9/22 (c) | | | 1,715,000 | | | | 1,745,012 | |
Barclays Bank PLC
5.14%, due 10/14/20 | | | 463,000 | | | | 483,600 | |
BBVA Bancomer S.A.
6.75%, due 9/30/22 (c) | | | 1,095,000 | | | | 1,231,875 | |
Mizuho Capital Investment, Ltd.
14.95%, due 12/29/49 (a)(c) | | | 248,000 | | | | 292,553 | |
¨Royal Bank of Scotland Group PLC | | | | | | | | |
6.125%, due 12/15/22 | | | 970,000 | | | | 1,023,818 | |
6.40%, due 10/21/19 | | | 1,194,000 | | | | 1,410,878 | |
| | | | | | | | |
| | | | | | | 6,187,736 | |
| | | | | | | | |
Building Materials 1.0% | |
Cemex Espana Luxembourg
9.25%, due 5/12/20 (c) | | | 1,000,000 | | | | 1,085,000 | |
Desarrolladora Homex S.A.B. de C.V.
9.50%, due 12/11/19 (c) | | | 1,300,000 | | | | 1,397,500 | |
Holcim U.S. Finance Sarl & Cie SCS
6.00%, due 12/30/19 (c) | | | 370,000 | | | | 419,665 | |
| | | | | | | | |
| | | | | | | 2,902,165 | |
| | | | | | | | |
Cosmetics & Personal Care 0.5% | |
Albea Beauty Holdings S.A.
8.375%, due 11/1/19 (c) | | | 1,250,000 | | | | 1,318,750 | |
| | | | | | | | |
| | | | |
| M-152 | | MainStay VP Flexible Bond Opportunities Portfolio | | The notes to the financial statements are an integral part of,
and should be read in conjunction with, the financial statements. |
| | | | | | | | |
| | | Principal Amount | | | Value | |
| | | | | | | | |
| Yankee Bonds (continued) | |
Electric 0.6% | |
Abu Dhabi National Energy Co.
3.625%, due 1/12/23 (c) | | $ | 1,600,000 | | | $ | 1,648,000 | |
| | | | | | | | |
|
Engineering & Construction 0.4% | |
Heathrow Funding, Ltd.
4.875%, due 7/15/21 (c) | | | 1,100,000 | | | | 1,198,364 | |
| | | | | | | | |
|
Finance—Leasing Companies 0.4% | |
Banque PSA Finance S.A.
5.75%, due 4/4/21 (c) | | | 1,225,000 | | | | 1,204,616 | |
| | | | | | | | |
|
Food 1.0% | |
Grupo Bimbo S.A.B. de C.V.
4.50%, due 1/25/22 (c) | | | 1,387,000 | | | | 1,515,732 | |
JBS Finance II, Ltd.
8.25%, due 1/29/18 (c) | | | 350,000 | | | | 371,000 | |
Minerva Luxembourg S.A.
12.25%, due 2/10/22 (c) | | | 830,000 | | | | 993,925 | |
| | | | | | | | |
| | | | | | | 2,880,657 | |
| | | | | | | | |
Forest Products & Paper 0.0%‡ | |
Norske Skogindustrier A.S.A.
7.125%, due 10/15/33 (c) | | | 185,000 | | | | 107,300 | |
| | | | | | | | |
| | |
Insurance 0.1% | | | | | | | | |
Oil Insurance, Ltd.
3.293%, due 12/29/49 (a)(c) | | | 148,000 | | | | 131,158 | |
Swiss Re Capital I, L.P.
6.854%, due 5/29/49 (a)(c) | | | 129,000 | | | | 135,205 | |
| | | | | | | | |
| | | | | | | 266,363 | |
| | | | | | | | |
Iron & Steel 0.4% | |
APERAM
7.375%, due 4/1/16 (c) | | | 1,025,000 | | | | 955,813 | |
| | | | | | | | |
|
Leisure Time 0.3% | |
Royal Caribbean Cruises, Ltd.
7.25%, due 3/15/18 | | | 600,000 | | | | 678,000 | |
| | | | | | | | |
|
Machinery—Construction & Mining 0.1% | |
Boart Longyear Management Pty, Ltd.
7.00%, due 4/1/21 (c) | | | 364,000 | | | | 369,460 | |
| | | | | | | | |
|
Mining 2.3% | |
FMG Resources August 2006 Pty, Ltd. | | | | | | | | |
6.875%, due 2/1/18 (c) | | | 400,000 | | | | 413,000 | |
8.25%, due 11/1/19 (c) | | | 1,000,000 | | | | 1,065,000 | |
| | | | | | | | |
| | | Principal
Amount | | | Value | |
| | | | | | | | |
Mining (continued) | | | | | | | | |
¨Novelis, Inc. | | | | | | | | |
8.375%, due 12/15/17 | | $ | 766,000 | | | $ | 844,515 | |
8.75%, due 12/15/20 | | | 1,302,000 | | | | 1,451,730 | |
Teck Resources, Ltd.
2.50%, due 2/1/18 | | | 991,000 | | | | 1,011,620 | |
Vedanta Resources PLC
8.25%, due 6/7/21 (c) | | | 1,640,000 | | | | 1,808,100 | |
| | | | | | | | |
| | | | | | | 6,593,965 | |
| | | | | | | | |
Oil & Gas 1.6% | |
ENI S.p.A.
4.15%, due 10/1/20 (c) | | | 370,000 | | | | 378,902 | |
OGX Austria GmbH
8.50%, due 6/1/18 (c) | | | 1,595,000 | | | | 1,435,500 | |
Petrobras International Finance Co.
5.375%, due 1/27/21 | | | 1,165,000 | | | | 1,311,580 | |
Precision Drilling Corp. | | | | | | | | |
6.50%, due 12/15/21 | | | 487,000 | | | | 518,655 | |
6.625%, due 11/15/20 | | | 882,000 | | | | 948,150 | |
| | | | | | | | |
| | | | | | | 4,592,787 | |
| | | | | | | | |
Oil & Gas Services 0.3% | |
Cie Generale de Geophysique—Veritas | | | | | | | | |
6.50%, due 6/1/21 | | | 200,000 | | | | 214,000 | |
9.50%, due 5/15/16 | | | 600,000 | | | | 643,500 | |
| | | | | | | | |
| | | | | | | 857,500 | |
| | | | | | | | |
Savings & Loans 0.5% | | | | | | | | |
RBS Citizens Financial Group, Inc.
4.15%, due 9/28/22 (c) | | | 1,450,000 | | | | 1,479,651 | |
| | | | | | | | |
| | |
Telecommunications 0.5% | | | | | | | | |
Intelsat Luxembourg S.A.
11.25%, due 2/4/17 | | | 185,000 | | | | 195,637 | |
11.50%, due 2/4/17 | | | 1,150,000 | | | | 1,221,875 | |
| | | | | | | | |
| | | | | | | 1,417,512 | |
| | | | | | | | |
Transportation 0.5% | | | | | | | | |
CHC Helicopter S.A.
9.25%, due 10/15/20 | | | 1,233,000 | | | | 1,297,732 | |
| | | | | | | | |
Total Yankee Bonds
(Cost $34,050,136) | | | | | | | 35,956,371 | |
| | | | | | | | |
Total Long-Term Bonds
(Cost $233,742,702) | | | | | | | 244,297,104 | |
| | | | | | | | |
| | | | | | | | |
| | |
Shares | | | | |
| Common Stocks 0.5% | |
Auto Manufacturers 0.2% | |
General Motors Co. (k) | | | 20,270 | | | | 584,384 | |
| | | | | | | | |
| | |
Banks 0.3% | | | | | | | | |
CIT Group, Inc. (k) | | | 1,475 | | | | 56,994 | |
Citigroup, Inc. | | | 20,468 | | | | 809,708 | |
| | | | | | | | |
| | | | | | | 866,702 | |
| | | | | | | | |
| | | | | | |
The notes to the financial statements are an integral part of,
and should be read in conjunction with, the financial statements. | | mainstayinvestments.com | | | M-153 | |
Portfolio of Investments December 31, 2012 (continued)
| | | | | | | | |
| | |
Shares | | | Value | |
| Common Stocks (continued) | |
Building Materials 0.0%‡ | | | | | | | | |
U.S. Concrete, Inc. (k)(l) | | | 4,455 | | | $ | 40,318 | |
| | | | | | | | |
Total Common Stocks
(Cost $1,564,879) | | | | | | | 1,491,404 | |
| | | | | | | | |
| |
| Convertible Preferred Stocks 1.0% | | | | | |
Auto Manufacturers 0.1% | | | | | | | | |
General Motors Co.
4.75% | | | 4,850 | | | | 214,030 | |
| | | | | | | | |
| | |
Auto Parts & Equipment 0.1% | | | | | | | | |
Goodyear Tire & Rubber Co. (The)
5.88% | | | 5,100 | | | | 240,771 | |
| | | | | | | | |
| | |
Banks 0.3% | | | | | | | | |
¨Bank of America Corp.
7.25% Series L | | | 400 | | | | 454,000 | |
Wells Fargo & Co.
7.50% Series L | | | 400 | | | | 490,000 | |
| | | | | | | | |
| | | | | | | 944,000 | |
| | | | | | | | |
Hand & Machine Tools 0.1% | | | | | | | | |
Stanley Black & Decker, Inc.
4.75% | | | 2,700 | | | | 325,944 | |
| | | | | | | | |
| | |
Insurance 0.1% | | | | | | | | |
Hartford Financial Services Group, Inc.
7.25% | | | 8,300 | | | | 171,395 | |
MetLife, Inc.
5.00% | | | 5,025 | | | | 223,462 | |
| | | | | | | | |
| | | | | | | 394,857 | |
| | | | | | | | |
Media 0.1% | | | | | | | | |
Nielsen Holdings N.V.
6.25% | | | 2,500 | | | | 141,015 | |
| | | | | | | | |
| | |
Oil & Gas 0.2% | | | | | | | | |
Apache Corp.
6.00% | | | 11,800 | | | | 539,260 | |
Sanchez Energy Corp. (c)(k)
4.88% | | | 1,500 | | | | 73,826 | |
| | | | | | | | |
| | | | | | | 613,086 | |
| | | | | | | | |
Total Convertible Preferred Stocks
(Cost $3,024,730) | | | | | | | 2,873,703 | |
| | | | | | | | |
| | | | | | | | |
| | | Number of
Warrants | | | Value | |
| | | | | | | | |
| Warrants 0.1% | |
Auto Manufacturers 0.1% | |
General Motors Co. | | | | | | | | |
Strike Price $10.00 Expires 7/10/16 (k) | | | 7,425 | | | $ | 144,788 | |
Strike Price $18.33 Expires 7/10/19 (k) | | | 7,425 | | | | 92,738 | |
| | | | | | | | |
Total Warrants
(Cost $299,155) | | | | | | | 237,526 | |
| | | | | | | | |
| | |
| | | | | | | | |
| | | Principal
Amount | | | | |
| | | | | | | | |
| Short-Term Investment 9.9% | |
Repurchase Agreement 9.9% | |
State Street Bank and Trust Co.
0.01%, dated 12/31/12
due 1/2/13
Proceeds at Maturity $28,134,821 (Collateralized by a Federal Home Loan Mortgage Corp. security with a rate of 2.07% and a maturity date of 11/7/22, with a Principal Amount of $28,965,000 and a Market Value of $28,698,088) | | $ | 28,134,805 | | | | 28,134,805 | |
| | | | | | | | |
Total Short-Term Investment
(Cost $28,134,805) | | | | | | | 28,134,805 | |
| | | | | | | | |
Total Investments
(Cost $266,766,271) (o) | | | 98.0 | % | | | 277,034,542 | |
Other Assets, Less Liabilities | | | 2.0 | | | | 5,771,533 | |
| | | | | | | | |
Net Assets | | | 100.0 | % | | $ | 282,806,075 | |
| | |
| | | | | | | | |
| | | | | | | | |
| | | Contracts
Long | | | Unrealized
Appreciation
(Depreciation) (m) | |
| Futures Contracts (0.1%) | |
United States Treasury Bond
March 2013 (30 Year) (n) | | | 115 | | | $ | (294,077 | ) |
| | | | | | | | |
Total Futures Contracts Long
(Settlement Value $16,962,500) | | | | | | | (294,077 | ) |
| | | | | | | | |
| | | | | | | | |
| | | Contracts
Short | | | | |
United States Treasury Note
March 2013 (10 Year) (n) | | | (150 | ) | | | 65,250 | |
United States Treasury Note
March 2013 (5 Year) (n) | | | (390 | ) | | | 26,447 | |
| | | | | | | | |
Total Futures Contracts Short
(Settlement Value $68,438,672) | | | | | | | 91,697 | |
| | | | | | | | |
Total Futures Contracts
(Settlement Value $51,476,172) | | | | | | $ | (202,380 | ) |
| | | | | | | | |
| | | | |
| M-154 | | MainStay VP Flexible Bond Opportunities Portfolio | | The notes to the financial statements are an integral part of,
and should be read in conjunction with, the financial statements. |
| ‡ | Less than one-tenth of a percent. |
| (a) | Floating rate—Rate shown is the rate in effect as of December 31, 2012. |
| (b) | Subprime mortgage investment and other asset-backed securities. The total market value of these securities as of December 31, 2012 is $1,979,793, which represents 0.7% of the Portfolio’s net assets. |
| (c) | May be sold to institutional investors only under Rule 144A or securities offered pursuant to Section 4(2) of the Securities Act of 1933, as amended. |
| (d) | Step coupon. Rate shown is the rate in effect as of December 31, 2012. |
| (e) | Security, or a portion thereof, is maintained in a segregated account at the Portfolio’s custodian as collateral for securities sold short (See Note 2(L)). |
| (f) | Floating Rate Loan—generally pays interest at rates which are periodically re-determined at a margin above the London InterBank Offered Rate or other short-term rates. The rate shown is the rate(s) in effect as of December 31, 2012. Floating Rate Loans are generally considered restricted in that the Portfolio is ordinarily contractually obligated to receive consent from the Agent Bank and/or borrower prior to disposition of a Floating Rate Loan. |
| (g) | Collateral strip rate—Bond whose interest is based on the weighted net interest rate of the collateral. Coupon rate adjusts periodically based on a predetermined schedule. Rate shown is the rate in effect as of December 31, 2012. |
| (h) | Interest on these securities is subject to alternative minimum tax. |
| (j) | Yankee Bond—Dollar-denominated bond issued in the United States by a foreign bank or corporation. |
| (k) | Non-income producing security. |
| (l) | Illiquid security. The total market value of this security as of December 31, 2012 is $40,318, which represents less than one-tenth of a percent of the Portfolio’s net assets. |
| (m) | Represents the difference between the value of the contracts at the time they were opened and the value as of December 31, 2012. |
| (n) | At December 31, 2012, cash in the amount of $154,100 is on deposit with broker for futures transactions. |
| (o) | As of December 31, 2012, cost is $266,779,004 for federal income tax purposes and net unrealized appreciation is as follows: |
| | | | |
Gross unrealized appreciation | | $ | 13,393,540 | |
Gross unrealized depreciation | | | (3,138,002 | ) |
| | | | |
Net unrealized appreciation | | $ | 10,255,538 | |
| | | | |
The following abbreviations are used in the above portfolio:
€—Euro
£—British Pound Sterling
As of December 31, 2012, the Portfolio held the following foreign currency forward contracts:
| | | | | | | | | | | | | | | | | | | | | | | | | | | | | | | | | | | | |
Foreign Currency Sale Contracts | | Expiration
Date | | | Counterparty | | | Contract
Amount
Sold | | | Contract
Amount
Purchased | | | Unrealized
Appreciation
(Depreciation) | |
Euro vs. U.S. Dollar | | | 2/28/13 | | | | JPMorgan Chase Bank | | | | EUR | | | | 4,764,000 | | | | USD | | | | 6,257,882 | | | USD | | | (33,426 | ) |
Pound Sterling vs. U.S. Dollar | | | 2/28/13 | | | | JPMorgan Chase Bank | | | | GBP | | | | 1,960,000 | | | | | | | | 3,154,855 | | | | | | (28,540 | ) |
Net unrealized appreciation (depreciation) on foreign currency forward contracts | | | USD | | | (61,966 | ) |
| | | | | | |
The notes to the financial statements are an integral part of,
and should be read in conjunction with, the financial statements. | | mainstayinvestments.com | | | M-155 | |
Portfolio of Investments December 31, 2012 (continued)
The following is a summary of the fair valuations according to the inputs used as of December 31, 2012, for valuing the Portfolio’s assets and liabilities.
Asset Valuation Inputs
| | | | | | | | | | | | | | | | |
Description | | Quoted Prices
in Active Markets
for Identical Assets (Level 1) | | | Significant Other
Observable Inputs (Level 2) | | | Significant
Unobservable
Inputs
(Level 3) | | | Total | |
| Investments in Securities (a) | | | | | | | | | | | | | | | | |
| Long-Term Bonds | | | | | | | | | | | | | | | | |
Asset-Backed Securities | | $ | — | | | $ | 3,079,210 | | | $ | — | | | $ | 3,079,210 | |
Convertible Bonds | | | — | | | | 11,883,046 | | | | — | | | | 11,883,046 | |
Corporate Bonds | | | — | | | | 173,221,125 | | | | — | | | | 173,221,125 | |
Foreign Bonds | | | — | | | | 5,542,321 | | | | — | | | | 5,542,321 | |
Loan Assignments & Participations | | | — | | | | 9,104,793 | | | | — | | | | 9,104,793 | |
Mortgage-Backed Securities | | | — | | | | 221,008 | | | | — | | | | 221,008 | |
Municipal Bond | | | — | | | | 319,997 | | | | — | | | | 319,997 | |
U.S. Government & Federal Agencies | | | — | | | | 4,969,233 | | | | — | | | | 4,969,233 | |
Yankee Bonds | | | — | | | | 35,956,371 | | | | — | | | | 35,956,371 | |
| | | | | | | | | | | | | | | | |
| Total Long-Term Bonds | | | — | | | | 244,297,104 | | | | — | | | | 244,297,104 | |
| | | | | | | | | | | | | | | | |
| Common Stocks | | | 1,491,404 | | | | — | | | | — | | | | 1,491,404 | |
| Convertible Preferred Stocks | | | 2,873,703 | | | | — | | | | — | | | | 2,873,703 | |
| Warrants | | | 237,526 | | | | — | | | | — | | | | 237,526 | |
| Short-Term Investment | | | | | | | | | | | | | | | | |
Repurchase Agreement | | | — | | | | 28,134,805 | | | | — | | | | 28,134,805 | |
| | | | | | | | | | | | | | | | |
| Total Investments in Securities | | | 4,602,633 | | | | 272,431,909 | | | | — | | | | 277,034,542 | |
| | | | | | | | | | | | | | | | |
| Other Financial Instruments | | | | | | | | | | | | | | | | |
Futures Contracts Short (b) | | | 91,697 | | | | — | | | | — | | | | 91,697 | |
| | | | | | | | | | | | | | | | |
| Total Investments in Securities and Other Financial Instruments | | $ | 4,694,330 | | | $ | 272,431,909 | | | $ | — | | | $ | 277,126,239 | |
| | | | | | | | | | | | | | | | |
| | | | |
| M-156 | | MainStay VP Flexible Bond Opportunities Portfolio | | The notes to the financial statements are an integral part of,
and should be read in conjunction with, the financial statements. |
Liability Valuation Inputs
| | | | | | | | | | | | | | | | |
Description | | Quoted Prices
in Active Markets
for Identical Assets (Level 1) | | | Significant Other
Observable Inputs (Level 2) | | | Significant
Unobservable
Inputs
(Level 3) | | | Total | |
| Other Financial Instruments | | | | | | | | | | | | | | | | |
Foreign Currency Forward Contracts (b) | | $ | — | | | $ | (61,966 | ) | | $ | — | | | $ | (61,966 | ) |
Futures Contracts Long (b) | | | (294,077 | ) | | | — | | | | — | | | | (294,077 | ) |
| | | | | | | | | | | | | | | | |
| Total Other Financial Instruments | | $ | (294,077 | ) | | $ | (61,966 | ) | | $ | — | | | $ | (356,043 | ) |
| | | | | | | | | | | | | | | | |
| (a) | For a complete listing of investments and their industries, see the Portfolio of Investments. |
| (b) | The value listed for these securities reflects unrealized appreciation (depreciation) as shown on the Portfolio of Investments. |
The Portfolio recognizes transfers between the levels as of the beginning of the period.
As of December 31, 2011 and December 31, 2012 foreign equity securities were not fair valued, as a result there were no transfers between Level 1 and Level 2 fair value measurements. (See Note 2)
As of December 31, 2012, the Portfolio did not hold any investments with significant unobservable inputs (Level 3). (See Note 2)
| | | | | | |
The notes to the financial statements are an integral part of,
and should be read in conjunction with, the financial statements. | | mainstayinvestments.com | | | M-157 | |
Statement of Assets and Liabilities as of December 31, 2012
| | | | |
| Assets | |
Investment in securities, at value
(identified cost $266,766,271) | | $ | 277,034,542 | |
Cash denominated in foreign currencies
(identified cost $294,789) | | | 295,891 | |
Cash collateral on deposit at broker | | | 154,100 | |
Receivables: | | | | |
Dividends and interest | | | 3,847,952 | |
Fund shares sold | | | 1,845,438 | |
Investment securities sold | | | 4,942 | |
Other assets | | | 669 | |
| | | | |
Total assets | | | 283,183,534 | |
| | | | |
| |
| Liabilities | | | | |
Payables: | | | | |
Manager (See Note 3) | | | 137,149 | |
Variation margin on futures contracts | | | 80,938 | |
Professional fees | | | 42,011 | |
NYLIFE Distributors (See Note 3) | | | 29,085 | |
Shareholder communication | | | 20,407 | |
Custodian | | | 3,640 | |
Fund shares redeemed | | | 1,883 | |
Trustees | | | 380 | |
Unrealized depreciation on foreign currency forward contracts | | | 61,966 | |
| | | | |
Total liabilities | | | 377,459 | |
| | | | |
Net assets | | $ | 282,806,075 | |
| | | | |
| |
| Net Assets Consist of | | | | |
Shares of beneficial interest outstanding (par value of $.001 per share) unlimited number of shares authorized | | $ | 27,437 | |
Additional paid-in capital | | | 273,702,816 | |
| | | | |
| | | 273,730,253 | |
Distributions in excess of net investment income | | | (64,636 | ) |
Accumulated net realized gain (loss) on investments, investments sold short, futures transactions and foreign currency transactions | | | (869,069 | ) |
Net unrealized appreciation (depreciation) on investments and futures contracts | | | 10,065,891 | |
Net unrealized appreciation (depreciation) on translation of other assets and liabilities in foreign currencies and foreign currency forward contracts | | | (56,364 | ) |
| | | | |
Net assets | | $ | 282,806,075 | |
| | | | |
| | | | |
Initial Class | | | | |
Net assets applicable to outstanding shares | | $ | 133,839,931 | |
| | | | |
Shares of beneficial interest outstanding | | | 12,973,626 | |
| | | | |
Net asset value per share outstanding | | $ | 10.32 | |
| | | | |
Service Class | | | | |
Net assets applicable to outstanding shares | | $ | 148,966,144 | |
| | | | |
Shares of beneficial interest outstanding | | | 14,463,478 | |
| | | | |
Net asset value per share outstanding | | $ | 10.30 | |
| | | | |
| | | | |
| M-158 | | MainStay VP Flexible Bond Opportunities Portfolio | | The notes to the financial statements are an integral part of,
and should be read in conjunction with, the financial statements. |
Statement of Operations for the year ended December 31, 2012
| | | | |
| Investment Income (Loss) | |
Income | | | | |
Interest (a) | | $ | 14,610,065 | |
Dividends (b) | | | 179,435 | |
| | | | |
Total income | | | 14,789,500 | |
| | | | |
Expenses | | | | |
Manager (See Note 3) | | | 1,492,430 | |
Distribution and service—Service Class (See Note 3) | | | 203,192 | |
Professional fees | | | 59,266 | |
Shareholder communication | | | 41,110 | |
Custodian | | | 23,050 | |
Trustees | | | 6,641 | |
Broker fees and charges on short sales | | | 3,406 | |
Interest on investments sold short | | | 3,182 | |
Miscellaneous | | | 68 | |
| | | | |
Total expenses | | | 1,832,345 | |
| | | | |
Net investment income (loss) | | | 12,957,155 | |
| | | | |
|
| Realized and Unrealized Gain (Loss) on Investments, Futures Contracts and Foreign Currency Transactions | |
Net realized gain (loss) on: | | | | |
Security transactions | | | 1,691,040 | |
Futures transactions | | | (856,257 | ) |
Foreign currency transactions | | | (184,177 | ) |
| | | | |
Net realized gain (loss) on investments, futures transactions and foreign currency transactions | | | 650,606 | |
| | | | |
Net change in unrealized appreciation (depreciation) on: | | | | |
Investments | | | 17,895,458 | |
Investments sold short | | | 86,547 | |
Futures contracts | | | (92,797 | ) |
Translation of other assets and liabilities in foreign currencies and foreign currency forward contracts | | | (51,936 | ) |
| | | | |
Net change in unrealized appreciation (depreciation) on investments, investments sold short, futures contracts and foreign currency transactions | | | 17,837,272 | |
| | | | |
Net realized and unrealized gain (loss) on investments, investments sold short, futures transactions and foreign currency transactions | | | 18,487,878 | |
| | | | |
Net increase (decrease) in net assets resulting from operations | | $ | 31,445,033 | |
| | | | |
| (a) | Interest recorded net of foreign withholding taxes in the amount of $1,630. |
| (b) | Dividends recorded net of foreign withholding taxes in the amount of $50. |
| | | | | | |
The notes to the financial statements are an integral part of,
and should be read in conjunction with, the financial statements. | | mainstayinvestments.com | | | M-159 | |
Statement of Changes in Net Assets
for the year ended December 31, 2012 and the period April 29, 2011 (inception date) through December 31, 2011
| | | | | | | | |
| | | 2012 | | | 2011 | |
| Increase (Decrease) in Net Assets | |
Operations: | | | | | | | | |
Net investment income (loss) | | $ | 12,957,155 | | | $ | 5,817,150 | |
Net realized gain (loss) on investments, futures transactions and foreign currency transactions | | | 650,606 | | | | 733,801 | |
Net change in unrealized appreciation (depreciation) on investments, investments sold short, futures contracts and foreign currency transactions | | | 17,837,272 | | | | (7,827,745 | ) |
| | | | |
Net increase (decrease) in net assets resulting from operations | | | 31,445,033 | | | | (1,276,794 | ) |
| | | | |
Dividends and distributions to shareholders: | | | | | | | | |
From net investment income: | | | | | | | | |
Initial Class | | | (6,496,910 | ) | | | (4,981,114 | ) |
Service Class | | | (6,484,699 | ) | | | (992,891 | ) |
| | | | |
| | | (12,981,609 | ) | | | (5,974,005 | ) |
| | | | |
From net realized gain on investments: | | | | | | | | |
Initial Class | | | (1,107,043 | ) | | | — | |
Service Class | | | (1,060,445 | ) | | | — | |
| | | | |
| | | (2,167,488 | ) | | | — | |
| | | | |
Total dividends and distributions to shareholders | | | (15,149,097 | ) | | | (5,974,005 | ) |
| �� | | | |
Capital share transactions: | | | | | | | | |
Net proceeds from sale of shares | | | 147,761,010 | | | | 252,739,616 | (a) |
Net asset value of shares issued to shareholders in reinvestment of dividends and distributions | | | 15,149,097 | | | | 5,974,005 | |
Cost of shares redeemed | | | (124,556,990 | ) | | | (23,305,800 | ) |
| | | | |
Increase (decrease) in net assets derived from capital share transactions | | | 38,353,117 | | | | 235,407,821 | |
| | | | |
Net increase (decrease) in net assets | | | 54,649,053 | | | | 228,157,022 | |
|
| Net Assets | |
Beginning of period | | | 228,157,022 | | | | — | |
| | | | |
End of period | | $ | 282,806,075 | | | $ | 228,157,022 | |
| | | | |
Undistributed (distributions in excess of) net investment income at end of period | | $ | (64,636 | ) | | $ | 262,733 | |
| | | | |
| (a) | Includes a subscription in-kind in the amount of $79,972,617 during the period ended December 31, 2011. (See Note 10) |
| | | | |
| M-160 | | MainStay VP Flexible Bond Opportunities Portfolio | | The notes to the financial statements are an integral part of,
and should be read in conjunction with, the financial statements. |
Financial Highlights selected per share data and ratios
| | | | | | | | |
| | | Initial Class | |
| | | Year ended
December 31, | | | April 29,
2011**
through
December 31, | |
| | | 2012 | | | 2011 | |
Net asset value at beginning of period | | $ | 9.60 | | | $ | 10.00 | |
| | | | | | | | |
Net investment income (loss) (a) | | | 0.54 | | | | 0.31 | |
Net realized and unrealized gain (loss) on investments | | | 0.81 | | | | (0.47 | ) |
Net realized and unrealized gain (loss) on foreign currency transactions | | | (0.01 | ) | | | 0.02 | |
| | | | | | | | |
Total from investment operations | | | 1.34 | | | | (0.14 | ) |
| | | | | | | | |
Less dividends and distributions: | | | | | | | | |
From net investment income | | | (0.53 | ) | | | (0.26 | ) |
From net realized gain on investments | | | (0.09 | ) | | | — | |
| | | | | | | | |
Total dividends and distributions | | | (0.62 | ) | | | (0.26 | ) |
| | | | | | | | |
Net asset value at end of period | | $ | 10.32 | | | $ | 9.60 | |
| | | | | | | | |
Total investment return | | | 13.88 | % | | | (1.32 | %)(b) |
Ratios (to average net assets)/Supplemental Data: | | | | | | | | |
Net investment income (loss) | | | 5.30 | % | | | 4.74 | %†† |
Net expenses (excluding short sales expenses) | | | 0.65 | % | | | 0.71 | %†† |
Expenses (including short sales expenses) | | | 0.65 | % | | | 0.78 | %†† |
Short sale expenses | | | 0.00 | %(c) | | | 0.07 | %†† |
Portfolio turnover rate | | | 39 | % | | | 7 | % |
Net assets at end of period (in 000’s) | | $ | 133,840 | | | $ | 188,333 | |
| (a) | Per share data based on average shares outstanding during the period. |
| (b) | Total investment return is not annualized. |
| (c) | Less than one-hundredth of a percent. |
| | | | | | |
The notes to the financial statements are an integral part of,
and should be read in conjunction with, the financial statements. | | mainstayinvestments.com | | | M-161 | |
Financial Highlights selected per share data and ratios
| | | | | | | | |
| | | Service Class | |
| | | Year ended
December 31, | | | April 29,
2011**
through
December 31, | |
| | | 2012 | | | 2011 | |
Net asset value at beginning of period | | $ | 9.60 | | | $ | 10.00 | |
| | | | | | | | |
Net investment income (loss) (a) | | | 0.52 | | | | 0.31 | |
Net realized and unrealized gain (loss) on investments | | | 0.79 | | | | (0.49 | ) |
Net realized and unrealized gain (loss) on foreign currency transactions | | | (0.01 | ) | | | 0.03 | |
| | | | | | | | |
Total from investment operations | | | 1.30 | | | | (0.15 | ) |
| | | | | | | | |
Less dividends and distributions: | | | | | | | | |
From net investment income | | | (0.51 | ) | | | (0.25 | ) |
From net realized gain on investments | | | (0.09 | ) | | | — | |
| | | | | | | | |
Total dividends and distributions | | | (0.60 | ) | | | (0.25 | ) |
| | | | | | | | |
Net asset value at end of period | | $ | 10.30 | | | $ | 9.60 | |
| | | | | | | | |
Total investment return | | | 13.58 | % | | | (1.48 | %)(b) |
Ratios (to average net assets)/Supplemental Data: | | | | | | | | |
Net investment income (loss) | | | 5.03 | % | | | 4.81 | %†† |
Net expenses (excluding short sales expenses) | | | 0.90 | % | | | 0.95 | %†† |
Expenses (including short sales expenses) | | | 0.90 | % | | | 1.03 | %†† |
Short sale expenses | | | 0.00 | %(c) | | | 0.08 | %†† |
Portfolio turnover rate | | | 39 | % | | | 7 | % |
Net assets at end of period (in 000’s) | | $ | 148,966 | | | $ | 39,824 | |
| (a) | Per share data based on average shares outstanding during the period. |
| (b) | Total investment return is not annualized. |
| (c) | Less than one-hundredth of a percent. |
| | | | |
| M-162 | | MainStay VP Flexible Bond Opportunities Portfolio | | The notes to the financial statements are an integral part of,
and should be read in conjunction with, the financial statements. |
MainStay VP Floating Rate Portfolio
Investment and Performance Comparison (Unaudited)
Performance data quoted represents past performance. Past performance is no guarantee of future results. Because of market volatility, current performance may be lower or higher than the figures shown. Investment return and principal value will fluctuate, and as a result, when shares are redeemed, they may be worth more or less than their original cost. The performance table and graph do not reflect any deduction of sales charges, mortality and expense charges, contract charges or administrative charges. Please refer to the Performance Summary appropriate for your policy. For performance information current to the most recent month-end, please call 800-598-2019 or visit www.newyorklife.com.
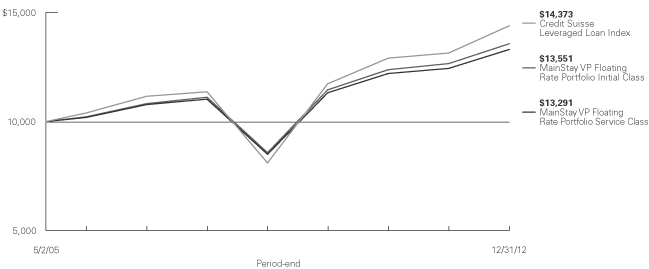
Average Annual Total Returns for the Period Ended December 31, 2012
| | | | | | | | | | | | | | | | |
| Class | | One Year | | | Five Years | | | Since Inception
(5/2/05) | | | Gross
Expense
Ratio1 | |
| Initial Class Shares | | | 7.15 | % | | | 4.07 | % | | | 4.04 | % | | | 0.65 | % |
| Service Class Shares | | | 6.89 | | | | 3.81 | | | | 3.78 | | | | 0.90 | |
| | | | | | | | | | | | |
| Benchmark Performance | | One
Year | | | Five
Years | | | Since Inception
(5/2/05) | |
Credit Suisse Leveraged Loan Index2 | | | 9.43 | % | | | 4.81 | % | | | 4.84 | % |
Average Lipper Loan Participation Fund3 | | | 9.09 | | | | 3.89 | | | | 3.63 | |
| 1. | The gross expense ratios presented reflect the Portfolio’s “Total Annual Portfolio Operating Expenses” from the most recent Prospectus and may differ from other expense ratios disclosed in this report. |
| 2. | Please refer to pages M-2 and M-3 for additional explanations and disclosure regarding the Portfolios, their benchmark indices and other indices mentioned in the reports. |
| 3. | The Average Lipper Loan Participation Fund is representative of funds that invest primarily in participation interests in collateralized senior corporate loans that have floating or variable rates. Lipper Inc. is an independent monitor of fund performance. Results are based on total returns with all dividend and capital gain distributions reinvested. |
| | |
| mainstayinvestments.com | | M-163 |
Cost in Dollars of a $1,000 Investment in MainStay VP Floating Rate Portfolio (Unaudited)
The example below is intended to describe the fees and expenses borne by shareholders during the six-month period from July 1, 2012 to December 31, 2012, and the impact of those costs on your investment.
Example
As a shareholder of the Portfolio, you incur two types of costs: (1) transaction costs, including exchange fees and sales charges (loads) on purchases (as applicable), and (2) ongoing costs, including management fees, distribution and/or service (12b-1) fees, and other Portfolio expenses (as applicable). This example is intended to help you understand your ongoing costs (in dollars) of investing in the Portfolio and to compare these costs with the ongoing costs of investing in other Portfolios. The example is based on an investment of $1,000 made at the beginning of the six-month period and held for the entire period from July 1, 2012, to December 31, 2012. Shares are only sold in connection with variable life and annuity contracts and the example does not reflect any contract level or transactional fees or expenses. If these costs had been included, your costs would have been higher.
This example illustrates your Portfolio’s ongoing costs in two ways:
Actual Expenses
The second and third data columns in the table below provide information about actual account values and actual expenses. You may use the information in these columns, together with the amount you invested, to estimate the expenses that you paid during the six months ended
December 31, 2012. Simply divide your account value by $1,000 (for example, an $8,600 account value divided by $1,000 = 8.6), then multiply the result by the number under the heading entitled ‘‘Expenses Paid During Period’’ to estimate the expenses you paid on your account during this period.
Hypothetical Example for Comparison Purposes
The fourth and fifth data columns in the table below provide information about hypothetical account values and hypothetical expenses based on the Portfolio’s actual expense ratio and an assumed rate of return of 5% per year before expenses, which is not the Portfolio’s actual return. The hypothetical account values and expenses may not be used to estimate the actual ending account balances or expenses you paid for the six-month period shown. You may use this information to compare the ongoing costs of investing in the Portfolio with the ongoing costs of investing in other Portfolios. To do so, compare this 5% hypothetical example with the 5% hypothetical examples that appear in the shareholder reports of the other Portfolios.
Please note that the expenses shown in the table are meant to highlight your ongoing costs only and do not reflect any transactional costs, such as exchange fees or sales charges (loads). Therefore, the fourth and fifth data columns of the table are useful in comparing ongoing costs only and will not help you determine the relative total costs of owning different funds. In addition, if these transactional costs were included, your costs would have been higher.
| | | | | | | | | | | | | | | | | | | | |
| | | | | | | | | | | | | | | | |
| Share Class | | Beginning
Account
Value
7/1/12 | | | Ending Account
Value (Based
on Actual
Returns and
Expenses)
12/31/12 | | | Expenses
Paid
During
Period1 | | | Ending Account
Value (Based
on Hypothetical
5% Annualized
Return and
Actual Expenses)
12/31/12 | | | Expenses
Paid
During
Period1 | |
| | | | | |
| Initial Class Shares | | $ | 1,000.00 | | | $ | 1,038.70 | | | $ | 3.28 | | | $ | 1,021.90 | | | $ | 3.25 | |
| | | | | |
| Service Class Shares | | $ | 1,000.00 | | | $ | 1,037.40 | | | $ | 4.56 | | | $ | 1,020.70 | | | $ | 4.52 | |
| 1. | Expenses are equal to the Portfolio’s annualized expense ratio of each class (0.64% for Initial Class and 0.89% for Service Class) multiplied by the average account value over the period, divided by 366 and multiplied by 184 (to reflect the six-month period). The table above represents the actual expenses incurred during the six-month period. |
| | |
| M-164 | | MainStay VP Floating Rate Portfolio |
Portfolio Composition as of December 31, 2012 (Unaudited)
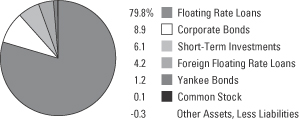
See Portfolio of Investments beginning on page M-167 for specific holdings within these categories.
Top Ten Issuers Held as of December 31, 2012 (excluding short-term investments) (Unaudited)
| 1. | Bausch & Lomb, Inc., 5.25%, due 5/17/19 |
| 2. | TransDigm, Inc., 4.00%–7.75%, due 2/14/17–10/15/20 |
| 3. | Calpine Corp., 4.50%, due 4/2/18 |
| 4. | Hertz Corp. (The), 3.75%, due 3/9/18 |
| 5. | Michaels Stores, Inc., 4.813%, due 7/29/16 |
| 6. | DaVita, Inc., 4.50%, due 10/20/16 |
| 7. | Reynolds Group, 4.75%–9.875%, due 9/28/18–8/15/19 |
| 8. | FMG America Finance, Inc., 5.25%, due 10/18/17 |
| 9. | Telesat LLC, 4.25%, due 3/28/19 |
| 10. | Grifols, Inc., 4.50%–8.25%, due 6/1/17-2/1/18 |
| | | | |
| mainstayinvestments.com | | | M-165 | |
Portfolio Management Discussion and Analysis (Unaudited)
Answers to the questions reflect the views of portfolio managers Robert H. Dial, Mark A. Campellone and Arthur S. Torrey of New York Life Investments,1 the Portfolio’s Manager.
How did MainStay VP Floating Rate Portfolio perform relative to its peers and its benchmark during the 12 months ended December 31, 2012?
For the 12 months ended December 31, 2012,
MainStay VP Floating Rate Portfolio returned 7.15% for Initial Class shares and 6.89% for Service Class shares. Both share classes underperformed the 9.09% return of the average Lipper2 Loan Participation Fund and the 9.43% return of the Credit Suisse Leveraged Loan Index2 for the 12 months ended December 31, 2012. The Credit Suisse Leveraged Loan Index is the Portfolio’s broad-based securities-market index.
What were the most significant factors and risks that influenced the markets in which the Portfolio invested during the 12 months ended December 31, 2012?
Strong inflows into the leveraged loan asset class during the first quarter of 2012, coupled with limited new issuance, caused prices to rally early in the year. Riskier assets (those rated CCC3 and lower and distressed credits) outperformed credits that were less risky (loans rated BB)4 during the first quarter of 2012. During the second quarter, concerns about European sovereign risk caused many investors to reduce risk in their portfolios, leading to lower secondary prices for floating-rate loans during much of the second quarter and into the beginning of the third quarter. Renewed investor confidence midway through the third quarter of 2012 supported a rally in loan prices through the remainder of the year.
What factors affected the Portfolio’s relative performance during the reporting period?
During 2012, the Portfolio’s underperformance of the Credit Suisse Leveraged Loan Index resulted primarily because the Portfolio held an overweight position relative to the Index in credits rated BB and underweight positions relative to the Index in credits rated CCC and lower and unrated credits. Additionally, cash balances held to meet potential redemptions contributed to the Portfolio’s underperformance.
What was the Portfolio’s duration5 strategy during the reporting period?
The Portfolio invested in floating-rate loans that had a weighted average effective duration of less than three months. Floating rate loans mature, on average, in five to seven years, but loan maturity can be as long as nine years. The underlying interest rate contracts of the Portfolio’s loans, which are typically pegged to LIBOR,2 reset every 30, 60, 90 or 180 days. The Portfolio’s weighted average LIBOR reset figure as of December 31, 2012, was 50 days, which we viewed as a short duration. Since actual reset dates may vary for different loans in the Portfolio, the actual period between a shift in interest rates and the time when the Portfolio would “catch up” may differ.
During the reporting period, which market segments were the strongest positive contributors to the Portfolio’s performance, and which market segments were particularly weak?
We believe that the Portfolio’s overweight position relative to the Credit Suisse Leveraged Loan Index in higher-quality credits and its underweight position in lower-quality credits contributed to underperformance because the riskiest sectors generated the highest relative returns in the asset class. (Contributions take weightings and total returns into account.) During 2012, the Portfolio maintained a substantial allocation to bonds, which we believe contributed positively to the Portfolio’s relative performance. As of December 31, 2012, the Portfolio had 10.1% of net assets in long-term high-yield corporate bonds. A much smaller cash position was needed to meet possible redemptions. In in light of low short-term interest rates, the cash position detracted from the Portfolio’s relative results.
How was the Portfolio positioned at the end of the reporting period?
As of December 31, 2012, the Portfolio remained overweight relative to the Credit Suisse Leveraged Loan Index in credits rated BB. As of the same date, the Portfolio remained underweight relative to the Index in unrated credits, distressed credits and credits rated CCC.
| 1. | “New York Life Investments” is a service mark used by New York Life Investment Management LLC. |
| 2. | Please refer to pages M-2 and M-3 for additional explanations and disclosure regarding the Portfolios, their benchmark indices and service providers mentioned in the reports. |
| 3. | An obligation rated ‘CCC’ by Standard & Poor’s (“S&P”) is deemed by S&P to be currently vulnerable to nonpayment and is dependent upon favorable business, financial and economic conditions for the obligor to meet its financial commitment on the obligation. It is the opinion of S&P that in the event of adverse business, financial or economic conditions, the obligor is not likely to have the capacity to meet its financial commitment on the obligation. When applied to Portfolio holdings, ratings are based solely on the creditworthiness of the bonds in the Portfolio and are not meant to represent the security or safety of the Portfolio. |
| 4. | An obligation rated ‘BB’ by S&P is deemed by S&P to be less vulnerable to nonpayment than other speculative issues. In the opinion of S&P, however, the obligor faces major ongoing uncertainties or exposure to adverse business, financial or economic conditions which could lead to the obligor’s inadequate capacity to meet its financial commitment on the obligation. When applied to Portfolio holdings, ratings are based solely on the creditworthiness of the bonds in the Portfolio and are not meant to represent the security or safety of the Portfolio. |
| 5. | Duration is a measure of the price sensitivity of a fixed-income investment to changes in interest rates. Duration is expressed as a number of years and is considered a more accurate sensitivity gauge than average maturity. |
The opinions expressed are those of the portfolio managers as of the date of this report and are subject to change. There is no guarantee that any forecasts made will come to pass. This material does not constitute investment advice and is not intended as an endorsement of any specific investment.
Not all MainStay VP Portfolios and/or share classes are available under all policies.
| | |
| M-166 | | MainStay VP Floating Rate Portfolio |
Portfolio of Investments December 31, 2012
| | | | | | | | |
| | | Principal
Amount | | | Value | |
| | | | | | | | |
Long-Term Bonds 94.1%† Corporate Bonds 8.9% | |
Aerospace & Defense 0.9% | |
Oshkosh Corp.
8.25%, due 3/1/17 | | $ | 1,600,000 | | | $ | 1,756,000 | |
Spirit Aerosystems, Inc.
7.50%, due 10/1/17 | | | 435,000 | | | | 465,450 | |
¨TransDigm, Inc. | |
5.50%, due 10/15/20 (a) | | | 1,400,000 | | | | 1,456,000 | |
7.75%, due 12/15/18 | | | 2,500,000 | | | | 2,765,625 | |
| | | | | | | | |
| | | | 6,443,075 | |
| | | | | | | | |
Automobile 0.2% | |
Dana Holding Corp.
6.50%, due 2/15/19 | | | 400,000 | | | | 427,000 | |
United Rentals North America, Inc.
5.75%, due 7/15/18 (a) | | | 800,000 | | | | 862,000 | |
| | | | | | | | |
| | | | 1,289,000 | |
| | | | | | | | |
Beverage, Food & Tobacco 0.3% | |
Constellation Brands, Inc.
6.00%, due 5/1/22 | | | 1,200,000 | | | | 1,374,000 | |
Dole Food Co., Inc.
8.00%, due 10/1/16 (a) | | | 750,000 | | | | 780,000 | |
| | | | | | | | |
| | | | 2,154,000 | |
| | | | | | | | |
Broadcasting & Entertainment 1.2% | |
CSC Holdings LLC
8.625%, due 2/15/19 | | | 700,000 | | | | 836,500 | |
National CineMedia LLC
6.00%, due 4/15/22 | | | 2,785,000 | | | | 2,952,100 | |
Scientific Games International, Inc.
6.25%, due 9/1/20 (a) | | | 2,000,000 | | | | 2,065,000 | |
Sinclair Television Group, Inc.
8.375%, due 10/15/18 | | | 3,000,000 | | | | 3,352,500 | |
| | | | | | | | |
| | | | 9,206,100 | |
| | | | | | | | |
Buildings & Real Estate 0.4% | |
Building Materials Corp. of America | |
6.75%, due 5/1/21 (a) | | | 850,000 | | | | 939,250 | |
6.875%, due 8/15/18 (a) | | | 1,200,000 | | | | 1,296,000 | |
CBRE Services, Inc.
6.625%, due 10/15/20 | | | 900,000 | | | | 984,375 | |
| | | | | | | | |
| | | | 3,219,625 | |
| | | | | | | | |
Chemicals, Plastics & Rubber 0.6% | |
Hexion U.S. Finance Corp. / Hexion Nova Scotia Finance ULC
8.875%, due 2/1/18 | | | 2,500,000 | | | | 2,568,750 | |
Huntsman International LLC
5.50%, due 6/30/16 | | | 333,000 | | | | 333,416 | |
| | | | | | | | |
| | | Principal
Amount | | | Value | |
| | | | | | | | |
Chemicals, Plastics & Rubber (continued) | |
Kraton Polymers LLC / Kraton Polymers Capital Corp.
6.75%, due 3/1/19 | | $ | 150,000 | | | $ | 155,063 | |
Nexeo Solutions LLC / Nexeo Solutions Finance Corp.
8.375%, due 3/1/18 | | | 1,500,000 | | | | 1,417,500 | |
| | | | | | | | |
| | | | 4,474,729 | |
| | | | | | | | |
Containers, Packaging & Glass 0.7% | |
Ball Corp.
5.00%, due 3/15/22 | | | 1,250,000 | | | | 1,337,500 | |
Berry Plastics Corp.
4.183%, due 9/15/14 (b) | | | 500,000 | | | | 500,000 | |
Crown Americas LLC / Crown Americas Capital Corp. III
6.25%, due 2/1/21 | | | 1,500,000 | | | | 1,644,375 | |
Greif, Inc.
7.75%, due 8/1/19 | | | 650,000 | | | | 750,750 | |
¨Reynolds Group Issuer, Inc. / Reynolds Group Issuer LLC / Reynolds Group Issuer Lu
9.875%, due 8/15/19 | | | 800,000 | | | | 856,000 | |
| | | | | | | | |
| | | | 5,088,625 | |
| | | | | | | | |
Diversified Natural Resources, Precious Metals & Minerals 0.2% | |
Boise Paper Holdings LLC / Boise Co-Issuer Co.
8.00%, due 4/1/20 | | | 700,000 | | | | 773,500 | |
Boise Paper Holdings LLC / Boise Finance Co.
9.00%, due 11/1/17 | | | 1,000,000 | | | | 1,092,500 | |
| | | | | | | | |
| | | | 1,866,000 | |
| | | | | | | | |
Healthcare, Education & Childcare 0.3% | |
¨Grifols, Inc.
8.25%, due 2/1/18 | | | 692,000 | | | | 762,065 | |
IMS Health, Inc.
6.00%, due 11/1/20 (a) | | | 1,500,000 | | | | 1,571,250 | |
| | | | | | | | |
| | | | 2,333,315 | |
| | | | | | | | |
Home Furnishings 0.1% | |
Tempur-Pedic International, Inc.
6.875%, due 12/15/20 (a) | | | 500,000 | | | | 514,375 | |
| | | | | | | | |
|
Hotels, Motels, Inns & Gaming 0.2% | |
Ameristar Casinos, Inc.
7.50%, due 4/15/21 | | | 1,200,000 | | | | 1,300,500 | |
| | | | | | | | |
|
Leisure, Amusement, Motion Pictures & Entertainment 0.1% | |
Cinemark USA, Inc.
5.125%, due 12/15/22 (a) | | | 800,000 | | | | 810,000 | |
| | | | | | | | |
| † | Percentages indicated are based on Portfolio net assets. |
| ¨ | | Among the Portfolio’s 10 largest issuers held, as of December 31, 2012, excluding short-term investments. May be subject to change daily. |
| | | | | | |
The notes to the financial statements are an integral part of,
and should be read in conjunction with, the financial statements. | | mainstayinvestments.com | | | M-167 | |
Portfolio of Investments December 31, 2012 (continued)
| | | | | | | | |
| | | Principal
Amount | | | Value | |
| | | | | | | | |
| Corporate Bonds (continued) | |
Machinery 0.4% | |
SPX Corp.
6.875%, due 9/1/17 | | $ | 2,750,000 | | | $ | 3,066,250 | |
| | | | | | | | |
|
Mining, Steel, Iron & Non-Precious Metals 0.4% | |
CONSOL Energy, Inc.
8.00%, due 4/1/17 | | | 3,000,000 | | | | 3,247,500 | |
| | | | | | | | |
|
Oil & Gas 1.4% | |
Basic Energy Services, Inc.
7.75%, due 10/15/22 (a) | | | 1,665,000 | | | | 1,623,375 | |
Chesapeake Energy Corp.
6.125%, due 2/15/21 | | | 3,083,000 | | | | 3,198,612 | |
Energy Transfer Equity, L.P.
7.50%, due 10/15/20 | | | 788,000 | | | | 910,140 | |
Forest Oil Corp.
7.25%, due 6/15/19 | | | 3,000,000 | | | | 3,015,000 | |
Oil States International, Inc.
5.125%, due 1/15/23 (a) | | | 1,600,000 | | | | 1,622,000 | |
| | | | | | | | |
| | | | 10,369,127 | |
| | | | | | | | |
Pipelines 0.2% | |
Inergy Midstream, L.P. / NRGM Finance Corp.
6.00%, due 12/15/20 (a) | | | 1,200,000 | | | | 1,239,000 | |
| | | | | | | | |
|
Software 0.4% | |
First Data Corp.
6.75%, due 11/1/20 (a) | | | 2,610,000 | | | | 2,636,100 | |
| | | | | | | | |
|
Telecommunications 0.9% | |
Crown Castle International Corp.
5.25%, due 1/15/23 (a) | | | 2,000,000 | | | | 2,140,000 | |
GCI, Inc.
6.75%, due 6/1/21 | | | 1,750,000 | | | | 1,715,000 | |
MetroPCS Wireless, Inc.
6.625%, due 11/15/20 | | | 3,000,000 | | | | 3,187,500 | |
| | | | | | | | |
| | | | | | | 7,042,500 | |
| | | | | | | | |
Total Corporate Bonds
(Cost $62,678,811) | | | | | | | 66,299,821 | |
| | | | | | | | |
|
| Floating Rate Loans 79.8% (c) | |
Aerospace & Defense 2.9% | |
Aeroflex, Inc.
Term Loan B
5.75%, due 5/9/18 | | | 2,952,740 | | | | 2,976,117 | |
Booz Allen Hamilton, Inc.
New Term Loan B
4.50%, due 7/31/19 | | | 5,486,250 | | | | 5,538,369 | |
| | | | | | | | |
| | | Principal
Amount | | | Value | |
| | | | | | | | |
Aerospace & Defense (continued) | |
SI Organization, Inc. (The)
New Term Loan B
4.50%, due 11/22/16 | | $ | 2,793,000 | | | $ | 2,765,070 | |
Six3 Systems, Inc.
Term Loan B
7.00%, due 10/4/19 (d) | | | 2,400,000 | | | | 2,391,000 | |
Spirit Aerosystems, Inc.
Term Loan B
3.75%, due 4/18/19 | | | 3,275,250 | | | | 3,290,261 | |
¨TransDigm, Inc.
New Term Loan B
4.00%, due 2/14/17 | | | 4,372,441 | | | | 4,395,672 | |
| | | | | | | | |
| | | | 21,356,489 | |
| | | | | | | | |
Automobile 4.9% | |
Allison Transmission, Inc.
Extended Term Loan B2
3.71%, due 8/7/17 | | | 5,037,357 | | | | 5,064,599 | |
Capital Automotive, L.P.
New Term Loan B
5.25%, due 3/10/17 | | | 5,705,789 | | | | 5,759,281 | |
Chrysler Group LLC
Term Loan B
6.00%, due 5/24/17 | | | 3,935,050 | | | | 4,015,369 | |
Federal-Mogul Corp. | | | | | | | | |
Term Loan B
2.148%, due 12/29/14 | | | 2,249,097 | | | | 2,060,735 | |
Term Loan C
2.148%, due 12/28/15 | | | 1,632,192 | | | | 1,495,496 | |
Goodyear Tire & Rubber Co. (The)
New 2nd Lien Term Loan
4.75%, due 4/30/19 | | | 6,150,000 | | | | 6,182,288 | |
HHI Holdings LLC
1st Lien Term Loan
6.00%, due 10/3/18 | | | 2,500,000 | | | | 2,528,125 | |
KAR Auction Services, Inc.
Term Loan B
5.00%, due 5/19/17 | | | 3,751,372 | | | | 3,781,852 | |
Metaldyne Co. LLC
New Term Loan B
6.00%, due 12/18/18 | | | 2,250,000 | | | | 2,265,001 | |
Tomkins LLC
New Term Loan B
4.25%, due 9/29/16 | | | 3,058,575 | | | | 3,073,868 | |
| | | | | | | | |
| | | | | | | 36,226,614 | |
| | | | | | | | |
Beverage, Food & Tobacco 2.3% | | | | | | | | |
American Seafoods Group LLC
New Term Loan B
4.25%, due 3/16/18 (d) | | | 1,431,336 | | | | 1,409,866 | |
Del Monte Foods Co.
Term Loan
4.50%, due 3/8/18 | | | 4,161,837 | | | | 4,165,303 | |
| | | | |
| M-168 | | MainStay VP Floating Rate Portfolio | | The notes to the financial statements are an integral part of,
and should be read in conjunction with, the financial statements. |
| | | | | | | | |
| | | Principal
Amount | | | Value | |
| | | | | | | | |
| Floating Rate Loans (continued) | |
Beverage, Food & Tobacco (continued) | | | | | | | | |
Dole Food Co., Inc.
Term Loan B2
5.033%, due 7/6/18 | | $ | 2,455,095 | | | $ | 2,459,480 | |
Michael Foods Group, Inc.
Term Loan
4.25%, due 2/23/18 | | | 5,793,204 | | | | 5,825,791 | |
Pinnacle Foods Finance LLC | | | | | | | | |
Term Loan E
4.75%, due 10/17/18 | | | 2,055,973 | | | | 2,068,089 | |
Term Loan F
4.75%, due 10/17/18 | | | 845,750 | | | | 852,622 | |
| | | | | | | | |
| | | | | | | 16,781,151 | |
| | | | | | | | |
Broadcasting & Entertainment 4.8% | | | | | | | | |
BBHI Acquisition LLC
Term Loan B
4.50%, due 12/14/17 | | | 3,920,000 | | | | 3,940,827 | |
Cequel Communications LLC
Term Loan B
4.00%, due 2/14/19 | | | 3,176,000 | | | | 3,187,027 | |
Charter Communications Operating LLC Extended TL C
3.47%, due 9/6/16 | | | 189,347 | | | | 190,055 | |
CSC Holdings, Inc.
Incremental B-2 Term Loan
1.962%, due 3/29/16 | | | 1,434,221 | | | | 1,439,087 | |
Cumulus Media Holdings, Inc.
First Lien Term Loan
4.50%, due 9/17/18 | | | 3,465,261 | | | | 3,470,830 | |
Foxco Acquisition Sub LLC
New Term Loan B
5.50%, due 7/14/17 | | | 3,094,750 | | | | 3,133,434 | |
Hubbard Radio LLC | | | | | | | | |
Term Loan B
5.25%, due 4/28/17 | | | 1,666,258 | | | | 1,678,755 | |
2nd Lien Term Loan
8.75%, due 4/30/18 | | | 500,000 | | | | 507,500 | |
Mediacom Broadband LLC
Term Loan F
4.50%, due 10/23/17 | | | 731,250 | | | | 730,336 | |
Univision Communications, Inc.
Extended Term Loan
4.462%, due 3/31/17 | | | 5,253,565 | | | | 5,161,628 | |
Weather Channel
New Term Loan B
4.25%, due 2/13/17 | | | 6,222,624 | | | | 6,279,667 | |
WideOpenWest Finance LLC
New 1st Lien Term Loan
6.25%, due 7/17/18 | | | 5,970,000 | | | | 6,032,500 | |
| | | | | | | | |
| | | | | | | 35,751,646 | |
| | | | | | | | |
| | | | | | | | |
| | | Principal
Amount | | | Value | |
| | | | | | | | |
Buildings & Real Estate 2.4% | | | | | | | | |
Armstrong World Industries, Inc.
New Term Loan B
4.00%, due 3/9/18 | | $ | 4,827,764 | | | $ | 4,855,924 | |
CB Richard Ellis Services, Inc.
Term Loan D
3.71%, due 9/4/19 | | | 3,546,000 | | | | 3,546,000 | |
CPG International, Inc.
Term Loan
5.75%, due 9/21/19 | | | 4,862,813 | | | | 4,874,970 | |
Realogy Corp.
Letter of Credit
3.415%, due 10/10/13 | | | 106,922 | | | | 107,189 | |
Wilsonart International Holdings LLC
Term Loan B
5.50%, due 10/31/19 | | | 4,333,300 | | | | 4,356,050 | |
| | | | | | | | |
| | | | | | | 17,740,133 | |
| | | | | | | | |
Cargo Transport 0.5% | | | | | | | | |
Swift Transportation Co., Inc. | | | | | | | | |
New Term Loan B1
3.959%, due 12/21/16 | | | 1,200,000 | | | | 1,202,700 | |
New Term Loan B2
5.00%, due 12/21/17 | | | 2,744,842 | | | | 2,767,144 | |
| | | | | | | | |
| | | | | | | 3,969,844 | |
| | | | | | | | |
Chemicals, Plastics & Rubber 2.0% | | | | | | | | |
Ashland, Inc.
Term Loan B
3.75%, due 8/23/18 | | | 1,700,692 | | | | 1,718,645 | |
General Chemical Corp.
New Term Loan
5.002%, due 10/6/15 | | | 3,466,610 | | | | 3,470,943 | |
Ineos US Finance LLC
6 year Term Loan
6.50%, due 4/27/18 | | | 2,977,500 | | | | 3,006,810 | |
Momentive Specialty Chemicals, Inc.
Extended Term Loan C-7B
4.063%, due 5/5/15 | | | 981,818 | | | | 947,455 | |
Univar, Inc.
Term Loan B
5.00%, due 6/30/17 | | | 6,012,681 | | | | 5,994,306 | |
| | | | | | | | |
| | | | 15,138,159 | |
| | | | | | | | |
Containers, Packaging & Glass 1.5% | |
BWAY Corp.
Term Loan B
4.50%, due 8/7/17 | | | 3,840,000 | | | | 3,852,799 | |
¨Reynolds Group Holdings, Inc.
New Dollar Term Loan
4.75%, due 9/28/18 | | | 7,155,456 | | | | 7,235,954 | |
| | | | | | | | |
| | | | 11,088,753 | |
| | | | | | | | |
| | | | | | |
The notes to the financial statements are an integral part of,
and should be read in conjunction with, the financial statements. | | mainstayinvestments.com | | | M-169 | |
Portfolio of Investments December 31, 2012 (continued)
| | | | | | | | |
| | | Principal
Amount | | | Value | |
| | | | | | | | |
| Floating Rate Loans (continued) | |
Diversified/Conglomerate Manufacturing 1.3% | |
Colfax Corp.
Term Loan B
4.50%, due 1/11/19 | | $ | 6,067,472 | | | $ | 6,115,824 | |
Sensus USA, Inc. | |
1st Lien Term Loan
4.75%, due 5/9/17 | | | 1,473,750 | | | | 1,475,592 | |
2nd Lien Term Loan
8.50%, due 5/9/18 | | | 200,000 | | | | 200,000 | |
Terex Corp.
REFI Term Loan B
4.50%, due 4/28/17 | | | 1,086,278 | | | | 1,095,782 | |
Veyance Technologies, Inc. | |
Initial Term Loan
2.47%, due 7/31/14 | | | 829,062 | | | | 819,114 | |
Delayed Draw Term Loan
2.47%, due 7/31/14 | | | 118,750 | | | | 117,325 | |
| | | | | | | | |
| | | | 9,823,637 | |
| | | | | | | | |
Diversified/Conglomerate Service 6.5% | |
Acosta, Inc.
Term Loan D
5.00%, due 3/2/18 | | | 4,655,833 | | | | 4,690,752 | |
Advantage Sales & Marketing, Inc. | |
Term Loan B
5.25%, due 12/18/17 | | | 3,448,608 | | | | 3,470,161 | |
2nd Lien Term Loan
9.25%, due 6/18/18 | | | 1,000,000 | | | | 998,750 | |
Brickman Group Holdings, Inc.
New Term Loan B
5.50%, due 10/14/16 | | | 3,191,903 | | | | 3,231,802 | |
Brock Holdings III, Inc. | |
New Term Loan B
6.00%, due 3/16/17 | | | 1,406,103 | | | | 1,409,618 | |
New 2nd Lien Term Loan
10.00%, due 3/16/18 | | | 750,000 | | | | 753,750 | |
CompuCom Systems, Inc.
New Term Loan
6.50%, due 10/2/18 | | | 2,400,000 | | | | 2,406,000 | |
Dealer Computer Services, Inc.
New Term Loan B
3.75%, due 4/20/18 | | | 2,401,286 | | | | 2,410,291 | |
Emdeon, Inc.
Term Loan B1
5.00%, due 11/2/18 | | | 2,280,765 | | | | 2,300,151 | |
First Data Corp. | | | | | | | | |
Extended 2017 US Term Loan
5.211%, due 3/24/17 | | | 4,003,173 | | | | 3,930,616 | |
2018 Add-on Term Loan
5.211%, due 9/27/18 | | | 2,000,000 | | | | 1,960,000 | |
| | | | | | | | |
| | | Principal
Amount | | | Value | |
| | | | | | | | |
Diversified/Conglomerate Service (continued) | |
Genesys Telecom Holdings U.S., Inc.
Term Loan B
6.75%, due 1/31/19 | | $ | 2,894,825 | | | $ | 2,925,582 | |
ServiceMaster Co.
Extended Term Loan
4.46%, due 1/31/17 | | | 4,357,679 | | | | 4,362,219 | |
Sophia, L.P.
Term Loan B
6.25%, due 7/19/18 | | | 1,163,093 | | | | 1,175,815 | |
SunGard Data Systems, Inc. | | | | | | | | |
Term Loan B
3.866%, due 2/26/16 | | | 1,762,093 | | | | 1,769,781 | |
Term Loan C
3.963%, due 2/28/17 | | | 3,001,996 | | | | 3,015,130 | |
Travelport LLC
Extended Dollar Term Loan
5.105%, due 8/21/15 | | | 3,000,000 | | | | 2,866,251 | |
Verint Systems, Inc.
Term Loan
4.50%, due 10/27/17 | | | 4,176,140 | | | | 4,195,718 | |
| | | | | | | | |
| | | | | | | 47,872,387 | |
| | | | | | | | |
Ecological 1.3% | | | | | | | | |
ADS Waste Holdings, Inc.
Term Loan B
5.25%, due 10/9/19 | | | 6,500,000 | | | | 6,573,125 | |
Synagro Technologies, Inc.
Term Loan B
2.308%, due 4/2/14 | | | 850,204 | | | | 764,121 | |
WCA Waste Systems, Inc.
Term Loan B
5.50%, due 3/22/18 | | | 1,985,000 | | | | 1,993,271 | |
| | | | | | | | |
| | | | | | | 9,330,517 | |
| | | | | | | | |
Electronics 3.5% | | | | | | | | |
Blue Coat Systems, Inc.
Term Loan
5.75%, due 2/15/18 | | | 2,995,000 | | | | 3,011,224 | |
Eagle Parent, Inc.
New Term Loan
5.00%, due 5/16/18 | | | 4,944,912 | | | | 4,975,817 | |
EIG Investors Corp.
New 1st Lien Term Loan
6.25%, due 11/8/19 | | | 3,500,000 | | | | 3,500,000 | |
NeuStar, Inc.
Term Loan B
5.00%, due 11/8/18 | | | 3,626,886 | | | | 3,642,754 | |
Rovi Solutions Corp.
Term Loan B2
4.00%, due 3/29/19 | | | 4,872,697 | | | | 4,799,607 | |
Sabre, Inc.
New Extended Term Loan
5.962%, due 12/29/17 | | | 1,542,082 | | | | 1,552,202 | |
| | | | |
| M-170 | | MainStay VP Floating Rate Portfolio | | The notes to the financial statements are an integral part of,
and should be read in conjunction with, the financial statements. |
| | | | | | | | |
| | | Principal
Amount | | | Value | |
| | | | | �� | | | |
| Floating Rate Loans (continued) | |
Electronics (continued) | | | | | | | | |
Sensata Technologies Finance Co. LLC
Term Loan
3.75%, due 5/11/18 | | $ | 4,771,965 | | | $ | 4,791,053 | |
| | | | | | | | |
| | | | 26,272,657 | |
| | | | | | | | |
Finance 1.5% | |
Avis Budget Car Rental LLC
Term Loan C
4.25%, due 3/15/19 | | | 3,344,076 | | | | 3,369,157 | |
¨Hertz Corp. (The) | |
New Synthetic LC
3.75%, due 3/9/18 | | | 2,750,000 | | | | 2,753,438 | |
Term Loan B
3.75%, due 3/9/18 | | | 5,189,767 | | | | 5,178,416 | |
| | | | | | | | |
| | | | 11,301,011 | |
| | | | | | | | |
Grocery 0.4% | |
Roundy’s Supermarkets, Inc.
Term Loan B
5.75%, due 2/13/19 | | | 2,977,500 | | | | 2,794,384 | |
| | | | | | | | |
|
Healthcare, Education & Childcare 12.2% | |
Alliance Healthcare Services, Inc.
Term Loan B
7.25%, due 6/1/16 | | | 888,801 | | | | 873,247 | |
¨Bausch & Lomb, Inc.
Term Loan B
5.25%, due 5/17/19 | | | 9,054,500 | | | | 9,128,874 | |
Biomet, Inc.
Extended Term Loan B
4.008%, due 7/25/17 | | | 4,965,105 | | | | 4,988,853 | |
Community Health Systems, Inc.
Extended Term Loan
3.811%, due 1/25/17 | | | 5,005,724 | | | | 5,031,504 | |
¨DaVita, Inc.
New Term Loan B
4.50%, due 10/20/16 | | | 7,350,000 | | | | 7,383,075 | |
Emergency Medical Services Corp.
Term Loan
5.25%, due 5/25/18 | | | 3,951,499 | | | | 3,976,196 | |
Gentiva Health Services, Inc.
New Term Loan B
6.50%, due 8/17/16 | | | 1,391,368 | | | | 1,368,758 | |
¨Grifols, Inc.
New Term Loan B
4.50%, due 6/1/17 | | | 5,949,986 | | | | 5,998,330 | |
HCA, Inc.
Extended Term Loan B3
3.462%, due 5/1/18 | | | 2,872,019 | | | | 2,877,660 | |
| | | | | | | | |
| | | Principal
Amount | | | Value | |
| | | | | | | | |
Healthcare, Education & Childcare (continued) | |
Health Management Associates, Inc.
New Term Loan B
4.50%, due 11/16/18 | | $ | 5,702,437 | | | $ | 5,738,038 | |
Hologic, Inc.
Term Loan B
4.50%, due 8/1/19 | | | 4,653,338 | | | | 4,704,720 | |
Iasis Healthcare LLC
Term Loan
5.00%, due 5/3/18 | | | 2,358,000 | | | | 2,363,895 | |
IMS Health, Inc.
New Term Loan B
4.50%, due 8/25/17 | | | 1,595,928 | | | | 1,604,157 | |
Kinetic Concepts, Inc.
Term Loan C1
5.50%, due 5/4/18 | | | 3,465,000 | | | | 3,499,650 | |
Par Pharmaceutical Co., Inc.
Term Loan B
5.00%, due 9/30/19 | | | 2,244,375 | | | | 2,242,505 | |
Pharmaceutical Product Development, Inc.
Term Loan B
6.25%, due 12/5/18 | | | 3,962,481 | | | | 4,021,094 | |
Quintiles Transnational Corp.
New Term Loan B
4.50%, due 6/8/18 | | | 5,134,222 | | | | 5,153,475 | |
RPI Finance Trust
New Term Loan Tranche 2
3.50%, due 5/9/18 | | | 5,403,766 | | | | 5,442,040 | |
Rural / Metro Corp.
Term Loan
5.75%, due 6/29/18 | | | 2,364,000 | | | | 2,334,450 | |
Select Medical Corp. | | | | | | | | |
New Term Loan B
5.50%, due 6/1/18 | | | 1,970,000 | | | | 1,974,925 | |
Incremental Term Loan B
5.50%, due 6/1/18 | | | 1,492,500 | | | | 1,499,962 | |
Universal Health Services, Inc.
New Term Loan B
3.75%, due 11/15/16 | | | 2,322,230 | | | | 2,329,197 | |
Vanguard Health Holding Co. II LLC
Term Loan B
5.00%, due 1/29/16 | | | 3,413,478 | | | | 3,436,236 | |
Warner Chilcott Co. LLC
New Term Loan B2
4.25%, due 3/15/18 | | | 675,495 | | | | 678,390 | |
Warner Chilcott Corp. | | | | | | | | |
New Term Loan B1
4.25%, due 3/15/18 | | | 1,350,990 | | | | 1,356,780 | |
Incremental Term Loan B1
4.25%, due 3/15/18 | | | 513,067 | | | | 515,266 | |
| | | | | | | | |
| | | | | | | 90,521,277 | |
| | | | | | | | |
| | | | | | |
The notes to the financial statements are an integral part of,
and should be read in conjunction with, the financial statements. | | mainstayinvestments.com | | | M-171 | |
Portfolio of Investments December 31, 2012 (continued)
| | | | | | | | |
| | | Principal
Amount | | | Value | |
| | | | | | | | |
| Floating Rate Loans (continued) | |
Hotels, Motels, Inns & Gaming 2.2% | | | | | | | | |
Ameristar Casinos, Inc.
Term Loan B
4.00%, due 4/16/18 | | $ | 2,752,629 | | | $ | 2,767,683 | |
Caesars Entertainment Operating Co.
Extended Term Loan B5
4.46%, due 1/26/18 (d) | | | 2,000,000 | | | | 1,725,278 | |
MGM Resorts International
Term Loan B
4.25%, due 12/20/19 | | | 4,000,000 | | | | 4,040,000 | |
Penn National Gaming, Inc.
New Term Loan B
3.75%, due 7/16/18 | | | 3,060,983 | | | | 3,069,594 | |
Station Casinos, Inc.
Term Loan B
5.50%, due 9/27/19 | | | 4,862,813 | | | | 4,891,688 | |
| | | | | | | | |
| | | | | | | 16,494,243 | |
| | | | | | | | |
Insurance 1.7% | | | | | | | | |
Asurion LLC | | | | | | | | |
New 1st Lien Term Loan
5.50%, due 5/24/18 | | | 5,329,545 | | | | 5,376,179 | |
New 2nd Lien Term Loan
9.00%, due 5/24/19 | | | 557,325 | | | | 572,950 | |
Hub International, Ltd. | | | | | | | | |
2017 Extended Term Loan
4.712%, due 6/13/17 | | | 1,588,002 | | | | 1,599,416 | |
Extended Incremental TL
6.75%, due 12/13/17 | | | 975,000 | | | | 981,094 | |
Multiplan, Inc.
New Term Loan B
4.75%, due 8/26/17 | | | 4,219,368 | | | | 4,233,874 | |
| | | | | | | | |
| | | | | | | 12,763,513 | |
| | | | | | | | |
Leisure, Amusement, Motion Pictures & Entertainment 2.3% | |
AMC Entertainment, Inc. | | | | | | | | |
Extended Term Loan B2
4.25%, due 12/15/16 | | | 989,362 | | | | 993,381 | |
Term Loan B3
4.75%, due 2/22/18 | | | 3,093,750 | | | | 3,115,273 | |
Cedar Fair, L.P.
New Term Loan B
4.00%, due 12/15/17 | | | 4,955,611 | | | | 4,995,876 | |
Cinemark USA, Inc.
New Term Loan
3.21%, due 12/18/19 | | | 1,454,420 | | | | 1,455,511 | |
SeaWorld Parks & Entertainment, Inc.
Term Loan B
4.00%, due 8/17/17 | | | 6,058,089 | | | | 6,095,916 | |
| | | | | | | | |
| | | | | | | 16,655,957 | |
| | | | | | | | |
| | | | | | | | |
| | | Principal
Amount | | | Value | |
| | | | | | | | |
Machinery (Non-Agriculture, Non-Construct & Non-Electronic) 2.7% | |
Alliance Laundry Systems LLC | | | | | | | | |
1st Lien Term Loan
5.50%, due 12/10/18 | | $ | 700,000 | | | $ | 706,125 | |
2nd Lien Term Loan
9.50%, due 12/10/19 | | | 1,125,000 | | | | 1,136,250 | |
CPM Acquisition Corp. | | | | | | | | |
1st Lien Term Loan
6.25%, due 8/29/17 | | | 2,094,750 | | | | 2,105,224 | |
2nd Lien Term Loan
10.25%, due 2/28/18 | | | 1,093,700 | | | | 1,101,903 | |
Generac Power Systems, Inc.
New Term Loan B
6.25%, due 5/30/18 | | | 3,723,967 | | | | 3,804,654 | |
Hamilton Sundstrand Industrial
1st Lien Term Loan
5.00%, due 12/13/19 | | | 5,300,000 | | | | 5,339,750 | |
Manitowoc Co., Inc. (The)
New Term Loan B
4.25%, due 11/13/17 | | | 275,175 | | | | 276,895 | |
Rexnord Corp.
REFI Term Loan B
4.50%, due 4/2/18 | | | 5,162,255 | | | | 5,199,361 | |
| | | | | | | | |
| | | | 19,670,162 | |
| | | | | | | | |
Mining, Steel, Iron & Non-Precious Metals 2.9% | |
Arch Coal, Inc.
Term Loan B
5.75%, due 5/16/18 | | | 3,980,004 | | | | 4,016,250 | |
Boomerang Tube LLC
Term Loan
11.00%, due 10/11/17 (d) | | | 3,950,000 | | | | 3,890,750 | |
¨FMG America Finance, Inc.
Term Loan
5.25%, due 10/18/17 | | | 6,974,819 | | | | 7,023,859 | |
JMC Steel Group, Inc.
Term Loan
4.75%, due 4/3/17 | | | 1,596,587 | | | | 1,612,553 | |
McJunkin Corp.
New Term Loan B
6.25%, due 11/9/19 (d) | | | 1,596,000 | | | | 1,596,000 | |
SunCoke Energy, Inc.
Term Loan B
4.00%, due 7/26/18 | | | 394,001 | | | | 393,016 | |
Walter Energy, Inc.
Term Loan B
5.75%, due 4/2/18 | | | 3,226,239 | | | | 3,248,420 | |
| | | | | | | | |
| | | | 21,780,848 | |
| | | | | | | | |
Oil & Gas 2.4% | |
Chesapeake Energy Corp.
New Unsecured Term Loan
5.75%, due 12/1/17 | | | 1,533,300 | | | | 1,534,364 | |
| | | | |
| M-172 | | MainStay VP Floating Rate Portfolio | | The notes to the financial statements are an integral part of,
and should be read in conjunction with, the financial statements. |
| | | | | | | | |
| | | Principal
Amount | | | Value | |
| | | | | | | | |
| Floating Rate Loans (continued) | |
Oil & Gas (continued) | |
Energy Transfer Equity, L.P.
New Term Loan B
3.75%, due 3/24/17 | | $ | 5,500,000 | | | $ | 5,536,955 | |
EP Energy LLC
Incremental Term Loan
4.50%, due 4/23/19 (d) | | | 2,500,000 | | | | 2,507,500 | |
Frac Tech International LLC
Term Loan B
8.50%, due 5/6/16 | | | 5,573,544 | | | | 4,619,075 | |
Samson Investment Co.
2nd Lien Term Loan
6.00%, due 9/25/18 | | | 3,500,000 | | | | 3,525,522 | |
| | | | | | | | |
| | | | 17,723,416 | |
| | | | | | | | |
Personal & Nondurable Consumer Products (Manufacturing Only) 2.1% | |
ACCO Brands Corp.
New Term Loan B
4.25%, due 4/30/19 | | | 3,085,972 | | | | 3,105,260 | |
Prestige Brands, Inc.
Term Loan
5.25%, due 1/31/19 | | | 2,102,273 | | | | 2,124,422 | |
Serta Simmons Holdings LLC
Term Loan
5.00%, due 10/1/19 | | | 4,500,000 | | | | 4,501,251 | |
SRAM LLC | | | | | | | | |
New Term Loan B
4.782%, due 6/7/18 | | | 1,594,562 | | | | 1,598,548 | |
2nd Lien Term Loan
8.50%, due 12/7/18 | | | 600,000 | | | | 606,000 | |
Visant Holding Corp.
Term Loan B
5.25%, due 12/22/16 | | | 4,165,350 | | | | 3,760,270 | |
| | | | | | | | |
| | | | | | | 15,695,751 | |
| | | | | | | | |
Personal, Food & Miscellaneous Services 0.2% | |
Aramark Corp. | | | | | | | | |
Extended Term Loan C
3.527%, due 7/26/16 | | | 1,334,749 | | | | 1,339,321 | |
New Extended LC-3 Facility
3.558%, due 7/26/16 | | | 104,933 | | | | 105,292 | |
| | | | | | | | |
| | | | | | | 1,444,613 | |
| | | | | | | | |
Printing & Publishing 1.9% | | | | | | | | |
Dex Media East LLC
New Term Loan
2.81%, due 10/24/14 | | | 401,216 | | | | 280,182 | |
Getty Images, Inc.
Term Loan B
4.75%, due 10/18/19 | | | 6,000,000 | | | | 6,000,936 | |
| | | | | | | | |
| | | Principal
Amount | | | Value | |
| | | | | | | | |
Printing & Publishing (continued) | | | | | | | | |
Lamar Media Corp.
Term Loan B
4.00%, due 12/30/16 | | $ | 150,328 | | | $ | 151,142 | |
MediaNews Group
New Term Loan
8.50%, due 3/19/14 | | | 39,627 | | | | 38,339 | |
Nielsen Finance LLC | | | | | | | | |
Class A Term Loan
2.213%, due 8/9/13 | | | 17,387 | | | | 17,394 | |
Class C Term Loan
3.463%, due 5/2/16 | | | 4,846,651 | | | | 4,863,095 | |
Penton Media, Inc.
New Term Loan B
5.00%, due 8/1/14 (d)(e) | | | 772,805 | | | | 679,425 | |
R.H. Donnelley, Inc.
New Term Loan
9.00%, due 10/24/14 | | | 446,362 | | | | 306,502 | |
SNL Financial LC
New Term Loan B
5.50%, due 10/23/18 | | | 2,000,000 | | | | 1,995,000 | |
| | | | | | | | |
| | | | | | | 14,332,015 | |
| | | | | | | | |
Retail Store 5.7% | | | | | | | | |
BJ’s Wholesale Club, Inc.
New 1st Lien Term Loan
5.75%, due 9/26/19 | | | 3,500,000 | | | | 3,545,626 | |
Collective Brands Finance, Inc.
Term Loan
7.25%, due 10/9/19 (d) | | | 1,800,000 | | | | 1,820,250 | |
Harbor Freight Tools USA, Inc.
Term Loan B
5.50%, due 11/14/17 | | | 2,992,500 | | | | 3,014,944 | |
Leslie’s Poolmart, Inc.
New Term Loan B
5.198%, due 10/16/19 (f) | | | 3,534,120 | | | | 3,554,441 | |
¨Michaels Stores, Inc. | |
Extended Term Loan B3
4.813%, due 7/29/16 | | | 3,693,850 | | | | 3,722,872 | |
Term Loan B2
4.813%, due 7/29/16 | | | 4,075,609 | | | | 4,107,631 | |
NBTY, Inc.
Term Loan B1
4.25%, due 10/2/17 | | | 1,293,222 | | | | 1,303,562 | |
Neiman Marcus Group, Inc. (The)
Extended Term Loan
4.75%, due 5/16/18 | | | 3,833,891 | | | | 3,836,023 | |
Party City Holdings, Inc.
New Term Loan B
5.75%, due 7/26/19 | | | 4,339,125 | | | | 4,379,127 | |
Petco Animal Supplies, Inc.
New Term Loan
4.50%, due 11/24/17 | | | 4,037,374 | | | | 4,063,330 | |
| | | | | | |
The notes to the financial statements are an integral part of,
and should be read in conjunction with, the financial statements. | | mainstayinvestments.com | | | M-173 | |
Portfolio of Investments December 31, 2012 (continued)
| | | | | | | | |
| | | Principal
Amount | | | Value | |
| | | | | | | | |
| Floating Rate Loans (continued) | |
Retail Store (continued) | | | | | | | | |
Pilot Travel Centers LLC | |
REFI Term Loan B
3.75%, due 3/30/18 | | $ | 4,185,313 | | | $ | 4,202,318 | |
Term Loan B2
4.25%, due 8/7/19 | | | 1,197,000 | | | | 1,204,981 | |
Yankee Candle Co., Inc. (The)
New Term Loan B
5.25%, due 4/2/19 | | | 3,741,548 | | | | 3,775,065 | |
| | | | | | | | |
| | | | 42,530,170 | |
| | | | | | | | |
Telecommunications 3.0% | |
Crown Castle International Corp.
Term Loan B
4.00%, due 1/31/19 | | | 4,041,681 | | | | 4,059,869 | |
Level 3 Financing, Inc. | |
2016 Term Loan B
4.75%, due 2/1/16 | | | 1,795,500 | | | | 1,813,455 | |
2019 Term Loan B
5.25%, due 8/1/19 | | | 2,000,000 | | | | 2,015,626 | |
MetroPCS Wireless, Inc. | |
Incremental Term Loan B3
4.00%, due 3/16/18 | | | 1,834,540 | | | | 1,836,833 | |
Tranche B2
4.071%, due 11/3/16 | | | 1,607,205 | | | | 1,611,558 | |
Syniverse Holdings, Inc.
New Term Loan
5.00%, due 4/23/19 | | | 3,956,120 | | | | 3,977,550 | |
¨Telesat LLC
Term Loan B
4.25%, due 3/28/19 | | | 6,865,500 | | | | 6,905,546 | |
| | | | | | | | |
| | | | 22,220,437 | |
| | | | | | | | |
Textiles & Leather 0.1% | |
Phillips-Van Heusen Corp.
New Term Loan B1
3.50%, due 5/6/16 | | | 488,616 | | | | 489,314 | |
| | | | | | | | |
|
Utilities 4.6% | |
AES Corp.
New Term Loan
4.25%, due 6/1/18 | | | 4,651,065 | | | | 4,696,743 | |
¨Calpine Corp. | |
New Term Loan
4.50%, due 4/2/18 | | | 4,967,197 | | | | 5,010,094 | |
Term Loan B2
4.50%, due 4/2/18 | | | 2,959,950 | | | | 2,983,736 | |
Covanta Energy Corp.
New Term Loan
4.00%, due 3/28/19 | | | 1,488,750 | | | | 1,502,707 | |
| | | | | | | | |
| | | Principal
Amount | | | Value | |
| | | | | | | | |
Utilities (continued) | |
Equipower Resources Holdings LLC | |
Refi Term Loan B
5.50%, due 12/21/18 | | $ | 3,235,620 | | | $ | 3,255,843 | |
2nd Lien Term Loan
10.00%, due 6/21/19 | | | 600,000 | | | | 612,000 | |
Essential Power LLC
Term Loan B
5.50%, due 8/8/19 | | | 2,309,044 | | | | 2,340,794 | |
LSP Madison Funding LLC
Term Loan
5.50%, due 6/28/19 | | | 5,940,771 | | | | 6,017,507 | |
NRG Energy, Inc.
New Term Loan B
4.00%, due 7/2/18 | | | 6,206,515 | | | | 6,263,732 | |
Texas Competitive Electric Holdings Co. LLC
Extended Term Loan
4.746%, due 10/10/17 | | | 1,292,822 | | | | 865,729 | |
TPF Generation Holdings LLC | |
Synthetic Letter of Credit
2.211%, due 12/13/13 | | | 7,583 | | | | 7,555 | |
2nd Lien Term Loan C
4.561%, due 12/15/14 | | | 409,014 | | | | 405,946 | |
| | | | | | | | |
| | | | | | | 33,962,386 | |
| | | | | | | | |
Total Floating Rate Loans
(Cost $587,717,707) | | | | | | | 591,731,484 | |
| | | | | | | | |
|
| Foreign Floating Rate Loans 4.2% (c) | |
Beverage, Food & Tobacco 0.6% | |
Solvest, Ltd.
Term Loan C2
5.018%, due 7/6/18 | | | 4,393,335 | | | | 4,401,181 | |
| | | | | | | | |
|
Broadcasting & Entertainment 0.7% | |
UPC Financing Partnership | |
Term Loan T
3.714%, due 12/30/16 | | | 1,020,716 | | | | 1,012,551 | |
Term Loan X
3.714%, due 12/29/17 | | | 1,896,576 | | | | 1,887,567 | |
Term Loan AF
4.00%, due 1/29/21 | | | 2,000,000 | | | | 1,995,000 | |
| | | | | | | | |
| | | | | | | 4,895,118 | |
| | | | | | | | |
Chemicals, Plastics & Rubber 0.5% | | | | | | | | |
Trinseo Materials Operating S.C.A.
New Term Loan B
8.00%, due 8/2/17 | | | 3,871,875 | | | | 3,778,710 | |
| | | | | | | | |
| | |
Electronics 0.2% | | | | | | | | |
AVG Technologies N.V.
Term Loan
7.50%, due 3/15/16 | | | 1,716,821 | | | | 1,716,821 | |
| | | | | | | | |
| | | | |
| M-174 | | MainStay VP Floating Rate Portfolio | | The notes to the financial statements are an integral part of,
and should be read in conjunction with, the financial statements. |
| | | | | | | | |
| | | Principal
Amount | | | Value | |
| | | | | | | | |
| Foreign Floating Rate Loans (continued) | |
Healthcare, Education & Childcare 0.1% | | | | | | | | |
WC Luxco S.A.R.L.
New Term Loan B3
4.25%, due 3/15/18 | | $ | 928,805 | | | $ | 932,786 | |
| | | | | | | | |
|
Leisure, Amusement, Motion Pictures & Entertainment 0.5% | |
Bombardier Recreational Products, Inc.
Extended Term Loan B2
4.51%, due 6/28/16 | | | 3,847,427 | | | | 3,871,473 | |
| | | | | | | | |
|
Mining, Steel, Iron & Non-Precious Metals 0.6% | |
Novelis, Inc.
Term Loan
4.00%, due 3/10/17 | | | 4,413,694 | | | | 4,444,590 | |
| | | | | | | | |
| | |
Printing & Publishing 0.1% | | | | | | | | |
Yell Group PLC
New Term Loan B1
(TBD), due 7/31/14 (g) | | | 1,894,129 | | | | 418,286 | |
| | | | | | | | |
| | |
Telecommunications 0.9% | | | | | | | | |
Intelsat Jackson Holdings, Ltd.
Term Loan B1
4.50%, due 4/2/18 | | | 6,715,000 | | | | 6,758,171 | |
| | | | | | | | |
Total Foreign Floating Rate Loans
(Cost $32,653,489) | | | | | | | 31,217,136 | |
| | | | | | | | |
|
| Yankee Bonds 1.2% (h) | |
Aerospace & Defense 0.3% | |
Bombardier, Inc.
7.50%, due 3/15/18 (a) | | | 1,600,000 | | | | 1,782,000 | |
Silver II Borrower / Silver II U.S. Holdings LLC
7.75%, due 12/15/20 (a) | | | 400,000 | | | | 414,000 | |
| | | | | | | | |
| | | | | | | 2,196,000 | |
| | | | | | | | |
Chemicals, Plastics & Rubber 0.1% | | | | | | | | |
Ineos Finance PLC
8.375%, due 2/15/19 (a) | | | 1,000,000 | | | | 1,077,500 | |
| | | | | | | | |
|
Forest Products & Paper 0.4% | |
Sappi Papier Holding GmbH
6.625%, due 4/15/21 (a) | | | 3,000,000 | | | | 2,962,500 | |
| | | | | | | | |
|
Mining, Steel, Iron & Non-Precious Metals 0.4% | |
FMG Resources August 2006 Pty, Ltd. | | | | | | | | |
6.00%, due 4/1/17 (a) | | | 1,000,000 | | | | 1,020,000 | |
6.375%, due 2/1/16 (a) | | | 1,500,000 | | | | 1,552,500 | |
| | | | | | | | |
| | | | | | | 2,572,500 | |
| | | | | | | | |
Total Yankee Bonds
(Cost $8,296,921) | | | | | | | 8,808,500 | |
| | | | | | | | |
Total Long-Term Bonds
(Cost $691,346,928) | | | | | | | 698,056,941 | |
| | | | | | | | |
| | | | | | | | |
| | |
Shares | | | Value | |
| | | | | | | | |
| Common Stock 0.1% | |
Leisure, Amusement, Motion Pictures & Entertainment 0.1% | |
MGM Studios, Inc. (d)(i) | | | 10,945 | | | $ | 394,896 | |
| | | | | | | | |
Total Common Stock
(Cost $259,944) | | | | | | | 394,896 | |
| | | | | | | | |
| | |
| | | | | | | | |
| | | Principal
Amount | | | | |
| Short-Term Investments 6.1% | |
Commercial Paper 1.1% | |
John Deere Ltd.
0.15%, due 2/6/13 (a)(j) | | $ | 605,000 | | | | 604,903 | |
New Jersey Natural G
0.11%, due 1/15/13 (j) | | | 4,508,000 | | | | 4,507,772 | |
Precision Castparts Corp.
0.11%, due 1/7/13 (a)(j) | | | 2,762,000 | | | | 2,761,931 | |
| | | | | | | | |
Total Commercial Paper
(Cost $7,874,606) | | | | 7,874,606 | |
| | | | | | | | |
| | |
Repurchase Agreement 0.6% | | | | | | | | |
State Street Bank and Trust Co.
0.01%, dated 12/31/12
due 1/2/13
Proceeds at Maturity $4,341,065 (Collateralized by a Federal National Mortgage Association security with a rate of 2.17% and a maturity date of 10/17/22, with a Principal Amount of $4,410,000 and a Market Value of $4,429,629) | | | 4,341,062 | | | | 4,341,062 | |
| | | | | | | | |
Total Repurchase Agreement
(Cost $4,341,062) | | | | 4,341,062 | |
| | | | | | | | |
|
U.S. Government & Federal Agencies 4.4% | |
Federal Home Loan Bank Discount Notes
0.05%, due 1/11/13 (j) | | | 8,000,000 | | | | 7,999,884 | |
Tennessee Valley Authority Discount Notes
0.048%, due 1/10/13 (j) | | | 4,905,000 | | | | 4,904,939 | |
United States Treasury Bills | | | | | | | | |
0.049%, due 1/3/13 (j) | | | 11,238,000 | | | | 11,237,964 | |
0.061%, due 1/31/13 (j) | | | 8,510,000 | | | | 8,509,564 | |
| | | | | | | | |
Total U.S. Government & Federal Agencies
(Cost $32,652,351) | | | | 32,652,351 | |
| | | | | | | | |
Total Short-Term Investments
(Cost $44,868,019) | | | | 44,868,019 | |
| | | | | | | | |
Total Investments
(Cost $736,474,891) (k) | | | 100.3 | % | | | 743,319,856 | |
Other Assets, Less Liabilities | | | (0.3 | ) | | | (1,994,960 | ) |
Net Assets | | | 100.0 | % | | $ | 741,324,896 | |
| | | | | | |
The notes to the financial statements are an integral part of,
and should be read in conjunction with, the financial statements. | | mainstayinvestments.com | | | M-175 | |
Portfolio of Investments December 31, 2012 (continued)
| (a) | May be sold to institutional investors only under Rule 144A or securities offered pursuant to Section 4(2) of the Securities Act of 1933, as amended. |
| (b) | Floating rate—Rate shown is the rate in effect as of December 31, 2012. |
| (c) | Floating Rate Loan—generally pays interest at rates which are periodically re-determined at a margin above the London InterBank Offered Rate or other short-term rates. The rate shown is the rate(s) in effect as of December 31, 2012. Floating Rate Loans are generally considered restricted in that the Portfolio is ordinarily contractually obligated to receive consent from the Agent Bank and/or borrower prior to disposition of a Floating Rate Loan. |
| (d) | Illiquid security. The total market value of these securities as of December 31, 2012 is $16,414,965, which represents 2.2% of the Portfolio’s net assets. |
| (e) | PIK (“Payment in Kind”)—interest or dividend payment is made with additional securities. |
| (f) | This security has additional commitments and contingencies. Principal amount and value exclude unfunded commitment. |
| (g) | This Floating Rate Loan will settle after December 31, 2012, at which time the interest rate will be determined. |
| (h) | Yankee Bond—Dollar-denominated bond issued in the United States by a foreign bank or corporation. |
| (i) | Fair valued security. The total market value of this security as of December 31, 2012 is $394,896, which represents 0.1% of the Portfolio’s net assets. |
| (j) | Interest rate presented is yield to maturity. |
| (k) | As of December 31, 2012, cost is $736,270,511 for federal income tax purposes and net unrealized appreciation is as follows: |
| | | | |
Gross unrealized appreciation | | $ | 11,407,714 | |
Gross unrealized depreciation | | | (4,358,369 | ) |
| | | | |
Net unrealized appreciation | | $ | 7,049,345 | |
| | | | |
The following is a summary of the fair valuations according to the inputs used as of December 31, 2012, for valuing the Portfolio’s assets.
Asset Valuation Inputs
| | | | | | | | | | | | | | | | |
Description | | Quoted Prices
in Active Markets
for Identical Assets
(Level 1) | | | Significant Other
Observable Inputs (Level 2) | | | Significant
Unobservable
Inputs (Level 3) | | | Total | |
| Investments in Securities (a) | | | | | | | | | | | | | | | | |
| Long-Term Bonds | | | | | | | | | | | | | | | | |
Corporate Bonds | | $ | — | | | $ | 66,299,821 | | | $ | — | | | $ | 66,299,821 | |
Floating Rate Loans (b) | | | — | | | | 567,358,891 | | | | 24,372,593 | | | | 591,731,484 | |
Foreign Floating Rate Loans | | | — | | | | 31,217,136 | | | | — | | | | 31,217,136 | |
Yankee Bonds | | | — | | | | 8,808,500 | | | | — | | | | 8,808,500 | |
| | | | | | | | | | | | | | | | |
| Total Long-Term Bonds | | | — | | | | 673,684,348 | | | | 24,372,593 | | | | 698,056,941 | |
| | | | | | | | | | | | | | | | |
| Common Stock (c) | | | — | | | | — | | | | 394,896 | | | | 394,896 | |
| Short-Term Investments | | | | | | | | | | | | | | | | |
Commercial Paper | | | — | | | | 7,874,606 | | | | — | | | | 7,874,606 | |
Repurchase Agreement | | | — | | | | 4,341,062 | | | | — | | | | 4,341,062 | |
U.S. Government & Federal Agencies | | | — | | | | 32,652,351 | | | | — | | | | 32,652,351 | |
| | | | | | | | | | | | | | | | |
| Total Short-Term Investments | | | — | | | | 44,868,019 | | | | — | | | | 44,868,019 | |
| | | | | | | | | | | | | | | | |
| Total Investments in Securities | | $ | — | | | $ | 718,552,367 | | | $ | 24,767,489 | | | $ | 743,319,856 | |
| | | | | | | | | | | | | | | | |
| (a) | For a complete listing of investments and their industries, see the Portfolio of Investments. |
| (b) | Includes $24,372,593 of Level 3 securities which represent floating rate loans whose value was obtained from pricing agent which utilized a single broker quote to determine such value as referenced in the Portfolio of Investments. |
| (c) | The Level 3 security valued at $394,896 is held in Leisure, Amusement, Motion Pictures & Entertainment within the Common Stock section of the Portfolio of Investments. |
The Portfolio recognizes transfers between the levels as of the beginning of the period.
For the year ended December 31, 2012, the Portfolio did not have any transfers between Level 1 and Level 2 fair value measurements. (See Note 2)
During the year ended December 31, 2012, securities with a total value of $6,341,167 transferred from Level 2 to Level 3. The transfer occurred as a result of the value for certain floating rate loans obtained from the independent pricing service which were derived based on single broker quote. (See Note 2)
| | | | |
| M-176 | | MainStay VP Floating Rate Portfolio | | The notes to the financial statements are an integral part of,
and should be read in conjunction with, the financial statements. |
The following is a reconciliation of investments in which significant unobservable inputs (Level 3) were used in determining value:
| | | | | | | | | | | | | | | | | | | | | | | | | | | | | | | | | | | | | | | | |
Investments in Securities | | Balance
as of
December 31,
2011 | | | Accrued
Discounts
(Premiums) | | | Realized
Gain
(Loss) | | | Change in
Unrealized
Appreciation
(depreciation) | | | Purchases | | | Sales (a) | | | Transfers
in to
Level 3 | | | Transfers
out of
Level 3 | | | Balance
as of
December 31,
2012 | | | Change in
Unrealized
Appreciation
(Depreciation)
from
Investments
Still Held as of
December 31,
2012 (b) | |
| Long-Term Bonds | | | | | | | | | | | | | | | | | | | | | | | | | | | | | | | | | | | | | | | | |
Floating Rate Loans | | | | | | | | | | | | | | | | | | | | | | | | | | | | | | | | | | | | | | | | |
Aerospace & Defense | | $ | — | | | $ | 584 | | | $ | — | | | $ | 14,236 | | | $ | 2,376,180 | | | $ | — | | | $ | — | | | $ | — | | | $ | 2,391,000 | | | $ | 14,236 | |
Automobile | | | 3,044,002 | | | | — | | | | — | | | | — | | | | — | | | | — | | | | — | | | | (3,044,002 | ) | | | — | | | | — | |
Beverage, Food & Tobacco | | | 1,378,719 | | | | — | | | | — | | | | — | | | | — | | | | — | | | | — | | | | (1,378,719 | ) | | | — | | | | — | |
Broadcasting & Entertainment | | | — | | | | 2,100 | | | | 138 | | | | 44,387 | | | | 3,455,965 | | | | (19,260 | ) | | | 495,000 | | | | — | | | | 3,978,330 | | | | 44,387 | |
Chemicals, Plastics & Rubber | | | 942,607 | | | | 1,284 | | | | 37 | | | | 13,917 | | | | — | | | | (10,390 | ) | | | — | | | | — | | | | 947,455 | | | | 13,433 | |
Diversified/Conglomerate Service | | | — | | | | (691 | ) | | | — | | | | 35,750 | | | | 3,196,743 | | | | — | | | | — | | | | — | | | | 3,231,802 | | | | 35,750 | |
Electronics | | | 4,675,000 | | | | 346 | | | | — | | | | 34,635 | | | | 3,465,019 | | | | — | | | | — | | | | (4,675,000 | ) | | | 3,500,000 | | | | 34,635 | |
Finance | | | 5,632,892 | | | | — | | | | — | | | | — | | | | — | | | | — | | | | — | | | | (5,632,892 | ) | | | — | | | | — | |
Healthcare, Education & Childcare | | | — | | | | 2,264 | | | | 323 | | | | 49,471 | | | | 1,459,154 | | | | (11,250 | ) | | | — | | | | — | | | | 1,499,962 | | | | 49,471 | |
Machinery (Non-Agriculture, Non-Construct & Non-Electronic) | | | — | | | | 1,325 | | | | — | | | | 60,820 | | | | 2,882,133 | | | | — | | | | — | | | | — | | | | 2,944,278 | | | | 60,820 | |
Mining, Steel, Iron & Non-Precious Metals | | | 391,035 | | | | 3,253 | | | | 1,498 | | | | 75,948 | | | | 5,466,031 | | | | (57,999 | ) | | | — | | | | — | | | | 5,879,766 | | | | 75,894 | |
Utilities | | | 2,621,963 | | | | — | | | | — | | | | — | | | | — | | | | — | | | | — | | | | (2,621,963 | ) | | | — | | | | — | |
Foreign Floating Rate Loans | | | | | | | | | | | | | | | | | | | | | | | | | | | | | | | | | | | | | | | | |
Leisure, Amusement, Motion Pictures & Entertainment | | | 380,138 | | | | — | | | | — | | | | — | | | | — | | | | — | | | | — | | | | (380,138 | ) | | | — | | | | — | |
| Common Stock | | | | | | | | | | | | | | | | | | | | | | | | | | | | | | | | | | | | | | | | |
Leisure, Amusement, Motion Pictures & Entertainment | | | 218,900 | | | | — | | | | — | | | | 175,996 | | | | — | | | | — | | | | — | | | | — | | | | 394,896 | | | | 175,996 | |
| | | | | | | | | | | | | | | | | | | | | | | | | | | | | | | | | | | | | | | | |
| Total | | $ | 19,285,256 | | | $ | 10,465 | | | $ | 1,996 | | | $ | 505,160 | | | $ | 22,301,225 | | | $ | (98,899 | ) | | $ | 495,000 | | | $ | (17,732,714 | ) | | $ | 24,767,489 | | | $ | 504,622 | |
| | | | | | | | | | | | | | | | | | | | | | | | | | | | | | | | | | | | | | | | |
| (a) | Sales include principal reduction. |
| (b) | Included in “Net change in unrealized appreciation (depreciation) on investments” in the Statement of Operations. |
| | | | | | |
The notes to the financial statements are an integral part of,
and should be read in conjunction with, the financial statements. | | mainstayinvestments.com | | | M-177 | |
Statement of Assets and Liabilities as of December 31, 2012
| | | | |
| Assets | |
Investment in securities, at value
(identified cost $736,474,891) | | $ | 743,319,856 | |
Unrealized appreciation on unfunded commitments | | | 616 | |
Receivables: | | | | |
Interest | | | 4,173,994 | |
Investment securities sold | | | 2,805,225 | |
Fund shares sold | | | 539,950 | |
Other Assets | | | 1,176 | |
| | | | |
Total assets | | | 750,840,817 | |
| | | | |
| |
| Liabilities | | | | |
Due to custodian | | | 6,154 | |
Unfunded commitments | | | 57,600 | |
Payables: | | | | |
Investment securities purchased | | | 8,812,807 | |
Manager (See Note 3) | | | 374,147 | |
NYLIFE Distributors (See Note 3) | | | 96,356 | |
Shareholder communication | | | 60,199 | |
Professional fees | | | 57,044 | |
Fund shares redeemed | | | 43,745 | |
Custodian | | | 3,796 | |
Trustees | | | 1,058 | |
Accrued expenses | | | 3,015 | |
| | | | |
Total liabilities | | | 9,515,921 | |
| | | | |
Net assets | | $ | 741,324,896 | |
| | | | |
| |
| Net Assets Consist of | | | | |
Shares of beneficial interest outstanding (par value of
$.001 per share) unlimited number of shares authorized | | $ | 79,518 | |
Additional paid-in capital | | | 744,700,138 | |
| | | | |
| | | 744,779,656 | |
Undistributed net investment income | | | 125,056 | |
Accumulated net realized gain (loss) on investments | | | (10,425,397 | ) |
Net unrealized appreciation (depreciation) on investments | | | 6,844,965 | |
Net unrealized appreciation (depreciation) on unfunded commitments | | | 616 | |
| | | | |
Net assets | | $ | 741,324,896 | |
| | | | |
| | | | |
Initial Class | | | | |
Net assets applicable to outstanding shares | | $ | 282,715,609 | |
| | | | |
Shares of beneficial interest outstanding | | | 30,340,322 | |
| | | | |
Net asset value per share outstanding | | $ | 9.32 | |
| | | | |
Service Class | | | | |
Net assets applicable to outstanding shares | | $ | 458,609,287 | |
| | | | |
Shares of beneficial interest outstanding | | | 49,177,577 | |
| | | | |
Net asset value per share outstanding | | $ | 9.33 | |
| | | | |
| | | | |
| M-178 | | MainStay VP Floating Rate Portfolio | | The notes to the financial statements are an integral part of,
and should be read in conjunction with, the financial statements. |
Statement of Operations for the year ended December 31, 2012
| | | | |
| Investment Income (Loss) | |
Income | | | | |
Interest | | $ | 32,527,564 | |
| | | | |
Expenses | | | | |
Manager (See Note 3) | | | 3,989,983 | |
Distribution and service—Service Class (See Note 3) | | | 1,051,556 | |
Shareholder communication | | | 116,198 | |
Professional fees | | | 83,157 | |
Custodian | | | 22,260 | |
Trustees | | | 17,470 | |
Miscellaneous | | | 47,422 | |
| | | | |
Total expenses | | | 5,328,046 | |
| | | | |
Net investment income (loss) | | | 27,199,518 | |
| | | | |
|
| Realized and Unrealized Gain (Loss) on Investments | |
Net realized gain (loss) on investments | | | 512,687 | |
Net change in unrealized appreciation (depreciation) on investments and unfunded commitments | | | 16,307,398 | |
| | | | |
Net realized and unrealized gain (loss) on investments and unfunded commitments | | | 16,820,085 | |
| | | | |
Net increase (decrease) in net assets resulting from operations | | $ | 44,019,603 | |
| | | | |
| | | | | | |
The notes to the financial statements are an integral part of,
and should be read in conjunction with, the financial statements. | | mainstayinvestments.com | | | M-179 | |
Statements of Changes in Net Assets
for the years ended December 31, 2012 and December 31, 2011
| | | | | | | | |
| | | 2012 | | | 2011 | |
| Increase (Decrease) in Net Assets | |
Operations: | | | | | | | | |
Net investment income (loss) | | $ | 27,199,518 | | | $ | 22,339,730 | |
Net realized gain (loss) on investments and foreign currency transactions | | | 512,687 | | | | 2,119,070 | |
Net change in unrealized appreciation (depreciation) on investments, unfunded commitments and foreign currency transactions | | | 16,307,398 | | | | (13,997,967 | ) |
| | | | |
Net increase (decrease) in net assets resulting from operations | | | 44,019,603 | | | | 10,460,833 | |
| | | | |
Dividends to shareholders: | | | | | | | | |
From net investment income: | | | | | | | | |
Initial Class | | | (10,330,192 | ) | | | (6,591,162 | ) |
Service Class | | | (16,722,520 | ) | | | (15,889,956 | ) |
| | | | |
Total dividends to shareholders | | | (27,052,712 | ) | | | (22,481,118 | ) |
| | | | |
Capital share transactions: | | | | | | | | |
Net proceeds from sale of shares | | | 252,094,222 | | | | 164,347,343 | |
Net asset value of shares issued to shareholders in reinvestment of dividends | | | 27,052,712 | | | | 22,481,118 | |
Cost of shares redeemed | | | (113,339,733 | ) | | | (145,977,821 | ) |
| | | | |
Increase (decrease) in net assets derived from capital share transactions | | | 165,807,201 | | | | 40,850,640 | |
| | | | |
Net increase (decrease) in net assets | | | 165,807,201 | | | | 28,830,355 | |
| | |
| Net Assets | | | | | | | | |
Beginning of year | | | 558,550,804 | | | | 529,720,449 | |
| | | | |
End of year | | $ | 741,324,896 | | | $ | 558,550,804 | |
| | | | |
Undistributed net investment income at end of year | | $ | 125,056 | | | $ | — | |
| | | | |
| | | | |
| M-180 | | MainStay VP Floating Rate Portfolio | | The notes to the financial statements are an integral part of,
and should be read in conjunction with, the financial statements. |
Financial Highlights selected per share data and ratios
| | | | | | | | | | | | | | | | | | | | |
| | | Initial Class | |
| | | Year ended December 31, | |
| | | 2012 | | | 2011 | | | 2010 | | | 2009 | | | 2008 | |
Net asset value at beginning of year | | $ | 9.07 | | | $ | 9.26 | | | $ | 8.92 | | | $ | 6.93 | | | $ | 9.47 | |
| | | | | | | | | | | | | | | | | | | | |
Net investment income (loss) | | | 0.39 | | | | 0.40 | | | | 0.36 | | | | 0.30 | | | | 0.46 | |
Net realized and unrealized gain (loss) on investments | | | 0.25 | | | | (0.19 | ) | | | 0.34 | | | | 1.99 | | | | (2.54 | ) |
| | | | | | | | | | | | | | | | | | | | |
Total from investment operations | | | 0.64 | | | | 0.21 | | | | 0.70 | | | | 2.29 | | | | (2.08 | ) |
| | | | | | | | | | | | | | | | | | | | |
Less dividends: | | | | | | | | | | | | | | | | | | | | |
From net investment income | | | (0.39 | ) | | | (0.40 | ) | | | (0.36 | ) | | | (0.30 | ) | | | (0.46 | ) |
| | | | | | | | | | | | | | | | | | | | |
Net asset value at end of year | | $ | 9.32 | | | $ | 9.07 | | | $ | 9.26 | | | $ | 8.92 | | | $ | 6.93 | |
| | | | | | | | | | | | | | | | | | | | |
Total investment return | | | 7.15 | % | | | 2.19 | % | | | 8.08 | % | | | 33.54 | % | | | (22.77 | %) |
Ratios (to average net assets)/Supplemental Data: | | | | | | | | | | | | | | | | | | | | |
Net investment income (loss) | | | 4.25 | % | | | 4.19 | % | | | 4.02 | % | | | 3.70 | % | | | 5.29 | % |
Net expenses | | | 0.65 | % | | | 0.65 | % | | | 0.67 | % | | | 0.68 | % | | | 0.69 | % |
Portfolio turnover rate | | | 47 | % | | | 13 | % | | | 11 | % | | | 17 | % | | | 7 | % |
Net assets at end of year (in 000’s) | | $ | 282,716 | | | $ | 161,480 | | | $ | 145,965 | | | $ | 106,754 | | | $ | 52,378 | |
| | | | | | | | | | | | | | | | | | | | |
| | | Service Class | |
| | | Year ended December 31, | |
| | | 2012 | | | 2011 | | | 2010 | | | 2009 | | | 2008 | |
Net asset value at beginning of year | | $ | 9.08 | | | $ | 9.26 | | | $ | 8.92 | | | $ | 6.93 | | | $ | 9.47 | |
| | | | | | | | | | | | | | | | | | | | |
Net investment income (loss) | | | 0.37 | | | | 0.36 | | | | 0.34 | | | | 0.28 | | | | 0.44 | |
Net realized and unrealized gain (loss) on investments | | | 0.25 | | | | (0.18 | ) | | | 0.34 | | | | 1.99 | | | | (2.54 | ) |
| | | | | | | | | | | | | | | | | | | | |
Total from investment operations | | | 0.62 | | | | 0.18 | | | | 0.68 | | | | 2.27 | | | | (2.10 | ) |
| | | | | | | | | | | | | | | | | | | | |
Less dividends: | | | | | | | | | | | | | | | | | | | | |
From net investment income | | | (0.37 | ) | | | (0.36 | ) | | | (0.34 | ) | | | (0.28 | ) | | | (0.44 | ) |
| | | | | | | | | | | | | | | | | | | | |
Net asset value at end of year | | $ | 9.33 | | | $ | 9.08 | | | $ | 9.26 | | | $ | 8.92 | | | $ | 6.93 | |
| | | | | | | | | | | | | | | | | | | | |
Total investment return | | | 6.89 | % | | | 1.93 | % | | | 7.81 | % | | | 33.21 | % | | | (22.97 | %) |
Ratios (to average net assets)/Supplemental Data: | | | | | | | | | | | | | | | | | | | | |
Net investment income (loss) | | | 4.00 | % | | | 3.94 | % | | | 3.77 | % | | | 3.44 | % | | | 5.09 | % |
Net expenses | | | 0.90 | % | | | 0.90 | % | | | 0.92 | % | | | 0.93 | % | | | 0.94 | % |
Portfolio turnover rate | | | 47 | % | | | 13 | % | | | 11 | % | | | 17 | % | | | 7 | % |
Net assets at end of year (in 000’s) | | $ | 458,609 | | | $ | 397,071 | | | $ | 383,756 | | | $ | 309,163 | | | $ | 150,355 | |
| | | | | | |
The notes to the financial statements are an integral part of,
and should be read in conjunction with, the financial statements. | | mainstayinvestments.com | | | M-181 | |
MainStay VP Government Portfolio
Investment and Performance Comparison (Unaudited)
Performance data quoted represents past performance. Past performance is no guarantee of future results. Because of market volatility, current performance may be lower or higher than the figures shown. Investment return and principal value will fluctuate, and as a result, when shares are redeemed, they may be worth more or less than their original cost. The performance table and graph do not reflect any deduction of sales charges, mortality and expense charges, contract charges or administrative charges. Please refer to the Performance Summary appropriate for your policy. For performance information current to the most recent month-end, please call 800-598-2019 or visit www.newyorklife.com.
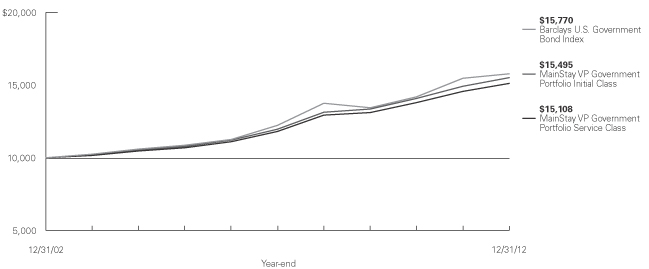
Average Annual Total Returns for the Year Ended December 31, 2012
| | | | | | | | | | | | | | | | |
| Class | | One Year | | | Five Years | | | Ten Years1 | | | Gross Expense Ratio2 | |
| Initial Class Shares | | | 3.96 | % | | | 5.31 | % | | | 4.48 | % | | | 0.55 | % |
| Service Class Shares3 | | | 3.70 | | | | 5.04 | | | | 4.21 | | | | 0.80 | |
| | | | | | | | | | | | |
| Benchmark Performance | | One
Year | | | Five
Years | | | Ten
Years | |
Barclays U.S. Government Bond Index4 | | | 2.02 | % | | | 5.23 | % | | | 4.66 | % |
Average Lipper Variable Products General U.S. Government Portfolio5 | | | 2.80 | | | | 5.53 | | | | 4.53 | |
| 1. | Performance figures shown for the ten-year period ended December 31, 2012 reflect nonrecurring reimbursements from affiliates for printing and mailing costs. If these nonrecurring reimbursements had not been made, the total returns would have been 4.46% for Initial Class shares and 4.20% for Service Class shares for the ten-year period. |
| 2. | The gross expense ratios presented reflect the Portfolio’s “Total Annual Portfolio Operating Expenses” from the most recent Prospectus and may differ from other expense ratios disclosed in this report. |
| 3. | Performance for Service Class shares, first offered June 4, 2003, includes the historical performance of Initial Class shares |
| | through June 3, 2003 adjusted to reflect the fees and expenses of Service Class shares. |
| 4. | Please refer to pages M-2 and M-3 for additional explanations and disclosure regarding the Portfolios, their benchmark indices and other indices mentioned in the reports. |
| 5. | The Average Lipper Variable Products General U.S. Government Portfolio is representative of portfolios that invest primarily in U.S. government and agency issues. Lipper Inc. is an independent monitor of fund performance. Results are based on total returns with all dividend and capital gain distributions reinvested. |
| | |
| M-182 | | MainStay VP Government Portfolio |
Cost in Dollars of a $1,000 Investment in MainStay VP Government Portfolio (Unaudited)
The example below is intended to describe the fees and expenses borne by shareholders during the six-month period from July 1, 2012 to December 31, 2012, and the impact of those costs on your investment.
Example
As a shareholder of the Portfolio, you incur two types of costs: (1) transaction costs, including exchange fees and sales charges (loads) on purchases (as applicable), and (2) ongoing costs, including management fees, distribution and/or service (12b-1) fees, and other Portfolio expenses (as applicable). This example is intended to help you understand your ongoing costs (in dollars) of investing in the Portfolio and to compare these costs with the ongoing costs of investing in other Portfolios. The example is based on an investment of $1,000 made at the beginning of the six-month period and held for the entire period from July 1, 2012, to December 31, 2012. Shares are only sold in connection with variable life and annuity contracts and the example does not reflect any contract level or transactional fees or expenses. If these costs had been included, your costs would have been higher.
This example illustrates your Portfolio’s ongoing costs in two ways:
Actual Expenses
The second and third data columns in the table below provide information about actual account values and actual expenses. You may use the information in these columns, together with the amount you invested, to estimate the
expenses that you paid during the six months ended December 31, 2012. Simply divide your account value by $1,000 (for example, an $8,600 account value divided by $1,000 = 8.6), then multiply the result by the number under the heading entitled ‘‘Expenses Paid During Period’’ to estimate the expenses you paid on your account during this period.
Hypothetical Example for Comparison Purposes
The fourth and fifth data columns in the table below provide information about hypothetical account values and hypothetical expenses based on the Portfolio’s actual expense ratio and an assumed rate of return of 5% per year before expenses, which is not the Portfolio’s actual return. The hypothetical account values and expenses may not be used to estimate the actual ending account balances or expenses you paid for the six-month period shown. You may use this information to compare the ongoing costs of investing in the Portfolio with the ongoing costs of investing in other Portfolios. To do so, compare this 5% hypothetical example with the 5% hypothetical examples that appear in the shareholder reports of the other Portfolios.
Please note that the expenses shown in the table are meant to highlight your ongoing costs only and do not reflect any transactional costs, such as exchange fees or sales charges (loads). Therefore, the fourth and fifth data columns of the table are useful in comparing ongoing costs only and will not help you determine the relative total costs of owning different funds. In addition, if these transactional costs were included, your costs would have been higher.
| | | | | | | | | | | | | | | | | | | | |
| | | | | | | | | | | | | | | | |
| Share Class | | Beginning
Account
Value
7/1/12 | | | Ending Account
Value (Based
on Actual
Returns and
Expenses)
12/31/12 | | | Expenses
Paid
During
Period1 | | | Ending Account
Value (Based
on Hypothetical
5% Annualized
Return and
Actual Expenses)
12/31/12 | | | Expenses
Paid
During
Period1 | |
| | | | | |
| Initial Class Shares | | $ | 1,000.00 | | | $ | 1,016.30 | | | $ | 2.74 | | | $ | 1,022.40 | | | $ | 2.75 | |
| | | | | |
| Service Class Shares | | $ | 1,000.00 | | | $ | 1,015.10 | | | $ | 4.00 | | | $ | 1,021.20 | | | $ | 4.01 | |
| 1. | Expenses are equal to the Portfolio’s annualized expense ratio of each class (0.54% for Initial Class and 0.79% for Service Class) multiplied by the average account value over the period, divided by 366 and multiplied by 184 (to reflect the six-month period). The table above represents the actual expenses incurred during the six-month period. |
| | | | |
| mainstayinvestments.com | | | M-183 | |
Portfolio Composition as of December 31, 2012 (Unaudited)
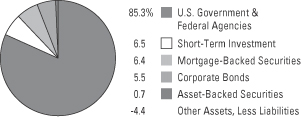
See Portfolio of Investments beginning on page M-188 for specific holdings within these categories.
Top Ten Holdings as of December 31, 2012 (excluding short-term investment) (Unaudited)
| 1. | Federal National Mortgage Association (Mortgage Pass-Through Securities), 3.50%, due 11/1/25 |
| 2. | Government National Mortgage Association (Mortgage Pass-Through Securities), 4.50%, due 5/20/40 |
| 3. | Federal Home Loan Mortgage Corporation (Mortgage Pass-Through Securities), 4.00%, due 3/1/41 |
| 4. | Federal Home Loan Mortgage Corporation (Mortgage Pass-Through Securities), 4.00%, due 2/1/41 |
| 5. | Federal National Mortgage Association (Mortgage Pass-Through Securities), 4.50%, due 1/1/41 |
| 6. | Overseas Private Investment Corporation, 5.142%, due 12/15/23 |
| 7. | Government National Mortgage Association (Mortgage Pass-Through Securities), 4.00%, due 10/15/41 |
| 8. | Federal National Mortgage Association (Mortgage Pass-Through Securities), 4.50%, due 8/1/39 |
| 9. | Federal National Mortgage Association (Mortgage Pass-Through Securities), 6.00%, due 6/1/35 TBA |
| 10. | Federal Home Loan Mortgage Corporation (Mortgage Pass-Through Securities), 4.00%, due 12/1/40 |
| | |
| M-184 | | MainStay VP Government Portfolio |
Portfolio Management Discussion and Analysis (Unaudited)
Answers to the questions reflect the views of portfolio managers Dan Roberts, Louis N. Cohen and Steven H. Rich of MacKay Shields LLC, the Portfolio’s Subadvisor.
How did MainStay VP Government Portfolio perform relative to its peers and its benchmark during the reporting period?
For the 12 months ended December 31, 2012, MainStay VP Government Portfolio returned 3.96% for Initial Class shares and 3.70% for Service Class shares. Both share classes outperformed the 2.80% return of the average Lipper1 Variable Products General U.S. Government Portfolio and the 2.02% return of the Barclays U.S. Government Bond Index1 for the 12 months ended December 31, 2012. The Barclays U.S. Government Bond Index is the Portfolio’s broad-based securities-market index.
What factors affected the Portfolio’s relative performance during the reporting period?
Four key factors—duration,2 yield-curve3 posture, sector weighting and issue selection—affected the Portfolio’s relative performance during the reporting period.
Agency mortgage pass-throughs4 were the largest asset class in the Portfolio. Their 3.2-year average duration was shorter than the 5.2-year duration of the Barclays U.S. Government Bond Index, which consists of U.S. Treasury securities and agency debentures. Agency mortgage pass-throughs usually lie in the 2 to 7 year duration range, while the securities in the Barclays U.S. Government Bond Index span the breadth of the yield curve. With its longer duration, the Barclays U.S. Government Bond Index is more sensitive than the Portfolio to changes in U.S. Treasury yields, which had a negative impact on the Portfolio.
Peer Portfolios with longer durations would have had similar advantages relative to the Portfolio, except
for those with large concentrations in long-maturity securities, whose performance was slowed by inflation fears.
During the reporting period, yields fell faster in the center of the yield curve than they did at the short and
long ends. As a result, the yield spread5 between the 2- and 10-year benchmark points on the yield curve narrowed, while the spread between the 10- and 30-year benchmark points widened. The Portfolio benefited from the yield curve’s reshaping more than peer Portfolios that were less concentrated in the center of the curve.
Our commitment to agency mortgage pass-throughs during the reporting period imparted a yield advantage relative to lower-yielding government-related securities, such as U.S. Treasury securities and agency debentures. This effect contributed positively to the Portfolio’s absolute return.
On average, agency mortgage pass-throughs outperformed comparable-duration U.S. Treasury securities for two reasons: better yield and better price appreciation. A narrowing of the spread between the mortgage pass-through yield and the U.S. Treasury yield explains the price effect. A favorable supply/demand balance helped spreads narrow. Net supply has been muted because of limited housing turnover and few cash-out refinancings, while investor demand has been robust. On the demand side, there have been four catalysts. First, the Federal Reserve recycles prepayments from its mortgage holdings. Second, it buys an additional $40 billion of agency mortgage-backed securities each month. Third, investors are attracted to the sector’s yield. Fourth, banks purchase mortgages for their investment portfolios as deposits grow faster than loans.
Over the medium term, we have emphasized call protection6 when purchasing mortgage-backed securities for the Portfolio. We moderate the pace of prepayments in a low-interest-rate environment by owning securities where borrowers have limited incentives to refinance. This includes securities backed by 15-year loan terms, lower-balance mortgages and securities backed by newer-production lower-rate loans. In securitizations of higher-rate loans, we have
| 1. | Please refer to pages M-2 and M-3 for additional explanations and disclosure regarding the Portfolios, their benchmark indices and service providers mentioned in the reports. |
| 2. | Duration is a measure of the price sensitivity of a fixed-income investment to changes in interest rates. Duration is expressed as a number of years and is considered a more accurate sensitivity gauge than average maturity. |
| 3. | The yield curve is a line that plots the yields of various securities of similar quality—typically U.S. Treasury issues—across a range of maturities. The U.S. Treasury yield curve serves as a benchmark for other debt and is used in economic forecasting. |
| 4. | Mortgage pass-through securities consist of a pool of residential mortgage loans in which homeowners’ monthly payments of principal, interest and prepayments pass from the original bank through a government agency or investment bank to investors. |
| 5. | The terms “spread” and “yield spread” may refer to the difference in yield between a security or type of security and comparable U.S. Treasury issues. The terms may also refer to the difference in yield between two specific securities or types of securities at a given time. |
| 6. | Call protection is a provision that prohibits the issuer of a callable security from forcing redemption early in the security’s life. Regardless of how poorly the market performs, call protection gives investors a minimum period during which they can earn the yield the security provides. |
| | | | |
| mainstayinvestments.com | | | M-185 | |
focused attention on mortgages originated in 2003 and earlier, where burnout7 and lower loan sizes can slow prepayments. During the reporting period, call-protection stories tended to outperform generic mortgage collateral.
Low turnover gave the Portfolio an advantage relative to peer Portfolios by limiting transaction costs. We also preserved yield by keeping the Portfolio nearly fully invested and avoiding large cash balances.
Treasury Inflation-Protected Securities (TIPS) outperformed nominal U.S. Treasury securities during the reporting period, and real rate of return Portfolios (a sizeable segment within the Lipper universe) would have benefited from this trend. The Portfolio holds only a modest allocation to TIPS.
What was the Portfolio’s duration strategy during the reporting period?
The Portfolio typically targets an intermediate duration between 3.5 and 4.5 years. During 2012, the Portfolio’s duration fell by one-tenth of a year to 3.2 years. The shorter duration resulted from the drift
in mortgage durations as U.S. Treasury yields and mortgage rates fell. Homeowners have more opportunities to refinance when mortgage rates are lower. This effect accelerates prepayment rates of securities in which the mortgage loans are pooled.
The durations of mortgage-backed securities usually shorten as mortgage rates follow U.S. Treasury yields lower, and refinancings tend to accelerate in response to the lower yields. We often allow the Portfolio’s duration to drift with the change in mortgage duration rather than compensate by buying or selling U.S. Treasury securities. Given the vagaries of Treasury yields, this approach typically avoids the need to swiftly react to rate changes and then reverse the trade should U.S. Treasury yields abruptly turn around.
What specific factors, risks or market forces prompted significant decisions for the Portfolio during the reporting period?
The Portfolio’s largest allocation is to agency mortgage pass-throughs. Mortgage pass-throughs offer better relative value than comparable-duration U.S. Treasury securities or agency debentures because of their superior yield and favorable supply/demand technicals. The trade introduces incremental yield to
the Portfolio and positions the Portfolio to benefit should the yield spread between mortgage-backed securities and comparable-duration Treasury securities compress.
The Portfolio’s residential mortgage exposure is taken mostly through pass-throughs rather than collateralized mortgage obligations (CMOs). The compensation currently demanded by the market for the better convexity8 of CMOs appears overdone while U.S. Treasury yields remain range bound.
We maintain our moderate exposure to credit risk as
a secondary driver of Portfolio performance for two reasons. First, the prospects of the credit-related sectors (investment-grade corporate bonds, commercial mortgage-backed securities and asset-backed securities) are aligned with the decision of the Federal Reserve’s monetary policymaking committee to maintain the federal funds rate in a range near
zero. Second, low interest rates should spark healthy demand for higher-yielding products. The Portfolio ended 2012 with a 12% allocation to non-government-related securities, unchanged from the prior year-end.
During the reporting period, which market segments were the strongest contributors to the Portfolio’s performance, and which market segments were particularly weak?
Agency mortgage pass-throughs collateralized by loans less apt to refinance were the best performers during the reporting period. (Contributions take weightings and total returns into account.) Lower-balance loans often provide a measure of call protection, because the lower balance limits the borrower’s incentive to refinance. Mortgage pass-throughs whose durations are longer than average, such as newer-production lower-coupon securities, also did well as U.S. Treasury yields declined.
Among the Portfolio’s non-government-related assets, the commercial mortgage-backed securities had the best performance. In an environment where investors were clamoring for high-quality securities with higher yields, commercial mortgage-backed securities gained increased attention.
During the reporting period, the Portfolio’s weaker performers were less-liquid securities, (less actively traded) such as a securitization of reverse residential
| 7. | Burnout is a period of slowing prepayments for a mortgage-backed security. It usually occurs as loans move closer to maturity. If some underlying loans fail to prepay during an interest rate cycle, those underlying loans may be less likely to prepay should rates fall again. |
| 8. | Convexity is a mathematical measure of the sensitivity of an interest-bearing bond to changes in interest rates. |
| | |
| M-186 | | MainStay VP Government Portfolio |
mortgages insured by the Federal Housing Administration (FHA). Investors placed a premium on liquidity during 2012 and preferred more conventional names such as Fannie Mae.
How did the Portfolio’s sector weightings change during the reporting period?
Sector allocations were relatively stable during 2012. The bulk of the trading activity kept the Portfolio fully invested by reinvesting principal income from mortgage securities. With the new purchases, we emphasized mortgage securities whose collateral is less likely to be refinanced. We also undertook several mortgage dollar rolls9 for security types where we keep exposure in generic form rather than as specified pools of mortgage loans. Finally, we allocated a portion of new contributions to corporate bonds and commercial mortgage-backed securities to retain
our current sector weightings.
How was the Portfolio positioned at the end of the reporting period?
As of December 31, 2012, the Portfolio held
overweight positions relative to the Barclays U.S. Government Bond Index in agency mortgage pass-through securities and modestly overweight positions in asset-backed securities, corporate bonds and commercial mortgage-backed securities. As of the same date, the Portfolio was underweight U.S. Treasury securities and agency debentures.
As of December 31, 2012, the majority of the Portfolio’s assets had durations between two and seven years. To maintain a duration close to 4.0 years, about 3% of assets were invested in longer-duration agency debentures to balance the Portfolio’s shorter-duration securi- ties. The short-duration product consists mostly of seasoned mortgage-backed securities.
| 9. | A mortgage dollar roll is a transaction in which a Portfolio sells mortgage-related securities from its portfolio to a counterparty from whom it simultaneously agrees to buy a similar security on a delayed delivery basis. A Portfolio is required to segregate assets having a value not less than the repurchase price. Mortgage dollar roll transactions involve certain risks, including the risk that the mortgage-backed security returned to the Portfolio at the end of the roll, while substantially similar, could be inferior to what was initially sold to the counterparty. |
The opinions expressed are those of the portfolio managers as of the date of this report and are subject to change. There is no guarantee that any forecasts made will come to pass. This material does not constitute investment advice and is not intended as an endorsement of any specific investment.
Not all MainStay VP Portfolios and/or share classes are available under all policies.
| | | | |
| mainstayinvestments.com | | | M-187 | |
Portfolio of Investments December 31, 2012
| | | | | | | | |
| | | Principal
Amount | | | Value | |
| | | | | | | | |
Long-Term Bonds 97.9%† Asset-Backed Securities 0.7% | |
Utilities 0.7% | |
Atlantic City Electric Transition Funding LLC Series 2002-1, Class A4
5.55%, due 10/20/23 | | $ | 1,995,000 | | | $ | 2,431,456 | |
Massachusetts RRB Special Purpose Trust Series 2001-1, Class A
6.53%, due 6/1/15 | | | 196,086 | | | | 198,110 | |
| | | | | | | | |
| | | | | | | 2,629,566 | |
| | | | | | | | |
Total Asset-Backed Securities
(Cost $2,228,788) | | | | | | | 2,629,566 | |
| | | | | | | | |
| | |
| Corporate Bonds 5.5% | | | | | | | | |
Agriculture 0.8% | | | | | | | | |
Altria Group, Inc.
2.85%, due 8/9/22 | | | 1,170,000 | | | | 1,157,749 | |
9.70%, due 11/10/18 | | | 1,217,000 | | | | 1,703,712 | |
| | | | | | | | |
| | | | | | | 2,861,461 | |
| | | | | | | | |
Auto Manufacturers 0.9% | |
DaimlerChrysler N.A. Holding Corp.
6.50%, due 11/15/13 | | | 3,235,000 | | | | 3,395,903 | |
| | | | | | | | |
| | |
Banks 0.3% | | | | | | | | |
KeyCorp
6.50%, due 5/14/13 | | | 1,000,000 | | | | 1,021,464 | |
| | | | | | | | |
| | |
Electric 1.0% | | | | | | | | |
Great Plains Energy, Inc.
2.75%, due 8/15/13 | | | 3,710,000 | | | | 3,748,458 | |
| | | | | | | | |
| | |
Pipelines 0.8% | | | | | | | | |
Plains All American Pipeline, L.P. / PAA Finance Corp. 5.00%, due 2/1/21 | | | 2,700,000 | | | | 3,127,556 | |
| | | | | | | | |
| | |
Real Estate Investment Trusts 0.8% | | | | | | | | |
Duke Realty, L.P.
6.75%, due 3/15/20 | | | 2,350,000 | | | | 2,841,357 | |
| | | | | | | | |
| | |
Telecommunications 0.9% | | | | | | | | |
Crown Castle Towers LLC
4.883%, due 8/15/20 (a) | | | 3,100,000 | | | | 3,497,925 | |
| | | | | | | | |
Total Corporate Bonds
(Cost $19,168,686) | | | | | | | 20,494,124 | |
| | | | | | | | |
| | | | | | | | |
| | | Principal
Amount | | | Value | |
| | | | | | | | |
| Mortgage-Backed Securities 6.4% | |
Commercial Mortgage Loans
(Collateralized Mortgage Obligations) 5.9% | |
Bear Stearns Commercial Mortgage Securities
Series 2005-PW10, Class A4
5.405%, due 12/11/40 (b) | | $ | 1,550,000 | | | $ | 1,726,148 | |
CD 2006-CD3 Mortgage Trust
Series 2006-CD3, Class A5
5.617%, due 10/15/48 | | | 802,000 | | | | 921,772 | |
CD 2007-CD5 Mortgage Trust
Series 2007-CD5, Class A4
5.886%, due 11/15/44 (b) | | | 1,493,803 | | | | 1,765,161 | |
CFCRE Commercial Mortgage Trust
Series 2011-C1, Class A2
3.759%, due 4/15/44 (a) | | | 2,500,000 | | | | 2,704,790 | |
DBUBS Mortgage Trust
Series 2011-LC2A, Class A2
3.386%, due 7/10/44 (a) | | | 660,000 | | | | 711,604 | |
Four Times Square Trust
Series 2006-4TS, Class A
5.401%, due 12/13/28 (a) | | | 530,000 | | | | 635,742 | |
GE Capital Commercial Mortgage Corp.
Series 2004-C2, Class A4
4.893%, due 3/10/40 | | | 1,200,000 | | | | 1,250,248 | |
GS Mortgage Securities Corp. II
| | | | | | | | |
Series 2011-GC5, Class A2
2.999%, due 8/10/44 | | | 800,000 | | | | 854,710 | |
Series 2004-GG2, Class A6
5.396%, due 8/10/38 (c) | | | 2,000,000 | | | | 2,113,358 | |
JP Morgan Chase Commercial Mortgage Securities Corp.
Series 2011-C4, Class A3
4.106%, due 7/15/46 (a) | | | 1,500,000 | | | | 1,690,287 | |
Series 2007-CB20, Class A3
5.819%, due 2/12/51 | | | 556,000 | | | | 580,121 | |
LB-UBS Commercial Mortgage Trust
Series 2004-C1, Class A4
4.568%, due 1/15/31 | | | 2,000,000 | | | | 2,075,270 | |
Merrill Lynch Mortgage Trust
Series 2003-KEY1, Class A4
5.236%, due 11/12/35 (b) | | | 1,000,000 | | | | 1,026,300 | |
Morgan Stanley Capital I
Series 2005-HQ6, Class A4A
4.989%, due 8/13/42 | | | 1,330,000 | | | | 1,453,050 | |
RBSCF Trust
Series 2010-MB1, Class A2
3.686%, due 4/15/24 (a) | | | 800,000 | | | | 848,774 | |
| † | Percentages indicated are based on Portfolio net assets. |
| ¨ | | Among the Portfolio’s 10 largest holdings, as of December 31, 2012, excluding short-term investment. May be subject to change daily. |
| | | | |
| M-188 | | MainStay VP Government Portfolio | | The notes to the financial statements are an integral part of,
and should be read in conjunction with, the financial statements. |
| | | | | | | | |
| | | Principal
Amount | | | Value | |
| | | | | | | | |
| Mortgage-Backed Securities (continued) | |
Commercial Mortgage Loans
(Collateralized Mortgage Obligations) (continued) | |
Wachovia Bank Commercial Mortgage Trust
Series 2006-C29, Class A4
5.308%, due 11/15/48 | | $ | 1,500,000 | | | $ | 1,724,903 | |
| | | | | | | | |
| | | | | | | 22,082,238 | |
| | | | | | | | |
Residential Mortgages (Collateralized Mortgage Obligations) 0.5% | |
Citigroup Mortgage Loan Trust, Inc.
Series 2006-AR6, Class 1A1
5.791%, due 8/25/36 (c) | | | 703,337 | | | | 654,843 | |
Mortgage Equity Conversion Asset Trust Series 2007-FF2, Class A
0.65%, due 2/25/42 (a)(b)(d) | | | 1,238,559 | | | | 1,028,778 | |
| | | | | | | | |
| | | | | | | 1,683,621 | |
| | | | | | | | |
Total Mortgage-Backed Securities
(Cost $23,076,332) | | | | | | | 23,765,859 | |
| | | | | | | | |
|
| U.S. Government & Federal Agencies 85.3% | |
Fannie Mae Strip (Collateralized Mortgage Obligations) 0.0%‡ | |
Series 360, Class 2, IO
5.00%, due 8/1/35 (e) | | | 587,142 | | | | 72,496 | |
Series 361, Class 2, IO
6.00%, due 10/1/35 (e) | | | 113,964 | | | | 17,384 | |
| | | | | | | | |
| | | | | | | 89,880 | |
| | | | | | | | |
Federal Home Loan Mortgage Corporation
(Mortgage Pass-Through Securities) 17.5% | |
2.375%, due 6/1/35 (b) | | | 369,687 | | | | 397,793 | |
2.377%, due 2/1/37 (b) | | | 204,426 | | | | 218,355 | |
2.726%, due 3/1/35 (b) | | | 44,583 | | | | 47,261 | |
3.50%, due 10/1/25 | | | 1,114,157 | | | | 1,189,385 | |
3.50%, due 11/1/25 | | | 5,597,116 | | | | 5,974,804 | |
3.50%, due 12/1/41 | | | 536,167 | | | | 580,988 | |
4.00%, due 3/1/25 | | | 2,913,872 | | | | 3,132,473 | |
4.00%, due 7/1/25 | | | 957,639 | | | | 1,029,482 | |
4.00%, due 8/1/31 | | | 1,557,608 | | | | 1,679,872 | |
4.00%, due 8/1/39 | | | 1,277,598 | | | | 1,422,598 | |
¨ 4.00%, due 12/1/40 | | | 5,490,308 | | | | 6,096,269 | |
¨ 4.00%, due 2/1/41 | | | 9,051,025 | | | | 9,979,611 | |
¨ 4.00%, due 3/1/41 | | | 10,469,182 | | | | 11,624,658 | |
4.00%, due 1/1/42 | | | 4,814,179 | | | | 5,345,517 | |
4.00%, due 12/1/42 | | | 1,517,466 | | | | 1,684,947 | |
4.50%, due 3/1/41 | | | 1,384,065 | | | | 1,557,021 | |
4.50%, due 5/1/41 | | | 2,185,304 | | | | 2,411,274 | |
4.50%, due 8/1/41 | | | 2,410,980 | | | | 2,660,286 | |
5.00%, due 1/1/20 | | | 746,667 | | | | 803,324 | |
5.00%, due 6/1/33 | | | 1,538,505 | | | | 1,664,616 | |
| | | | | | | | |
| | | Principal
Amount | | | Value | |
| | | | | | | | |
Federal Home Loan Mortgage Corporation
(Mortgage Pass-Through Securities) (continued) | |
5.00%, due 8/1/33 | | $ | 898,152 | | | $ | 975,448 | |
5.00%, due 5/1/36 | | | 581,136 | | | | 625,883 | |
5.00%, due 10/1/39 | | | 1,851,005 | | | | 2,072,775 | |
5.50%, due 1/1/21 | | | 588,234 | | | | 638,522 | |
5.50%, due 1/1/33 | | | 1,145,221 | | | | 1,246,106 | |
6.50%, due 4/1/37 | | | 173,550 | | | | 197,519 | |
| | | | | | | | |
| | | | 65,256,787 | |
| | | | | | | | |
Federal National Mortgage Association 0.9% | |
4.625%, due 5/1/13 | | | 3,285,000 | | | | 3,333,618 | |
| | | | | | | | |
|
Federal National Mortgage Association
(Mortgage Pass-Through Securities) 49.3% | |
2.268%, due 11/1/34 (b) | | | 322,611 | | | | 342,480 | |
2.726%, due 4/1/34 (b) | | | 461,896 | | | | 492,217 | |
3.00%, due 10/1/32 | | | 1,724,657 | | | | 1,815,283 | |
3.50%, due 11/1/20 | | | 5,202,582 | | | | 5,520,535 | |
3.50%, due 10/1/25 | | | 2,486,371 | | | | 2,677,174 | |
¨ 3.50%, due 11/1/25 | | | 17,297,155 | | | | 18,634,806 | |
3.50%, due 9/1/32 | | | 4,922,621 | | | | 5,317,019 | |
3.50%, due 11/1/32 | | | 1,196,158 | | | | 1,278,910 | |
3.50%, due 2/1/41 | | | 3,342,011 | | | | 3,565,908 | |
3.50%, due 11/1/41 | | | 4,074,107 | | | | 4,423,440 | |
3.50%, due 12/1/41 | | | 1,731,684 | | | | 1,880,167 | |
3.50%, due 1/1/42 | | | 3,934,554 | | | | 4,284,216 | |
3.50%, due 3/1/42 | | | 3,755,103 | | | | 4,014,888 | |
3.50%, due 5/1/42 | | | 1,763,838 | | | | 1,885,864 | |
3.50%, due 8/1/42 | | | 3,905,302 | | | | 4,224,295 | |
3.50%, due 12/1/42 | | | 1,853,627 | | | | 2,012,565 | |
4.00%, due 9/1/31 | | | 3,628,336 | | | | 3,905,890 | |
4.00%, due 1/1/41 | | | 1,660,150 | | | | 1,849,401 | |
4.00%, due 2/1/41 | | | 1,245,797 | | | | 1,387,814 | |
4.00%, due 3/1/41 | | | 3,108,323 | | | | 3,472,374 | |
4.00%, due 10/1/41 | | | 974,776 | | | | 1,088,943 | |
4.00%, due 3/1/42 | | | 2,585,925 | | | | 2,888,792 | |
4.00%, due 6/1/42 | | | 1,088,377 | | | | 1,209,727 | |
4.00%, due 7/1/42 | | | 3,323,427 | | | | 3,693,977 | |
4.00%, due 8/1/42 | | | 1,644,316 | | | | 1,827,652 | |
4.00%, due 9/1/42 | | | 1,604,074 | | | | 1,770,891 | |
4.50%, due 7/1/18 | | | 2,343,506 | | | | 2,527,373 | |
4.50%, due 11/1/18 | | | 1,907,217 | | | | 2,056,855 | |
4.50%, due 6/1/23 | | | 1,620,719 | | | | 1,744,333 | |
4.50%, due 6/1/39 | | | 1,685,053 | | | | 1,888,264 | |
4.50%, due 7/1/39 | | | 4,219,547 | | | | 4,765,196 | |
¨ 4.50%, due 8/1/39 | | | 6,291,590 | | | | 7,077,659 | |
4.50%, due 9/1/40 | | | 4,742,543 | | | | 5,355,823 | |
4.50%, due 12/1/40 | | | 3,270,162 | | | | 3,603,113 | |
¨ 4.50%, due 1/1/41 | | | 7,900,490 | | | | 8,922,139 | |
4.50%, due 2/1/41 | | | 699,653 | | | | 787,067 | |
5.00%, due 11/1/17 | | | 1,148,130 | | | | 1,247,718 | |
| | | | | | |
The notes to the financial statements are an integral part of,
and should be read in conjunction with, the financial statements. | | mainstayinvestments.com | | | M-189 | |
Portfolio of Investments December 31, 2012 (continued)
| | | | | | | | |
| | | Principal
Amount | | | Value | |
| | | | | | | | |
| U.S. Government & Federal Agencies (continued) | |
Federal National Mortgage Association
(Mortgage Pass-Through Securities) (continued) | |
5.00%, due 9/1/20 | | $ | 90,477 | | | $ | 98,326 | |
5.00%, due 11/1/33 | | | 2,953,455 | | | | 3,217,783 | |
5.00%, due 7/1/34 | | | 380,280 | | | | 413,364 | |
5.00%, due 6/1/35 | | | 2,333,168 | | | | 2,546,824 | |
5.00%, due 10/1/35 | | | 664,910 | | | | 723,675 | |
5.00%, due 1/1/36 | | | 309,136 | | | | 336,484 | |
5.00%, due 2/1/36 | | | 3,635,806 | | | | 3,954,201 | |
5.00%, due 5/1/36 | | | 3,539,755 | | | | 3,852,705 | |
5.00%, due 3/1/40 | | | 2,968,983 | | | | 3,325,626 | |
5.00%, due 2/1/41 | | | 4,522,003 | | | | 5,121,725 | |
5.50%, due 11/1/17 | | | 775,620 | | | | 832,915 | |
5.50%, due 6/1/19 | | | 772,501 | | | | 844,758 | |
5.50%, due 11/1/19 | | | 840,140 | | | | 918,724 | |
5.50%, due 4/1/21 | | | 1,268,598 | | | | 1,374,374 | |
5.50%, due 6/1/21 | | | 103,765 | | | | 112,417 | |
5.50%, due 6/1/33 | | | 3,810,642 | | | | 4,188,007 | |
5.50%, due 11/1/33 | | | 2,456,072 | | | | 2,699,296 | |
5.50%, due 12/1/33 | | | 2,488,248 | | | | 2,734,657 | |
5.50%, due 6/1/34 | | | 731,624 | | | | 800,418 | |
5.50%, due 3/1/35 | | | 1,116,311 | | | | 1,221,277 | |
5.50%, due 12/1/35 | | | 487,052 | | | | 532,241 | |
5.50%, due 4/1/36 | | | 2,671,386 | | | | 2,919,235 | |
5.50%, due 1/1/37 | | | 532,630 | | | | 610,509 | |
5.50%, due 7/1/37 | | | 389,349 | | | | 429,789 | |
5.50%, due 8/1/37 | | | 621,274 | | | | 678,915 | |
6.00%, due 12/1/16 | | | 45,469 | | | | 48,323 | |
6.00%, due 1/1/33 | | | 399,095 | | | | 445,788 | |
6.00%, due 3/1/33 | | | 465,543 | | | | 520,011 | |
6.00%, due 9/1/34 | | | 71,628 | | | | 79,650 | |
¨ 6.00%, due 6/1/35 TBA (f) | | | 6,450,000 | | | | 7,044,609 | |
6.00%, due 9/1/35 | | | 1,347,208 | | | | 1,511,038 | |
6.00%, due 10/1/35 | | | 179,800 | | | | 203,289 | |
6.00%, due 4/1/36 | | | 1,126,530 | | | | 1,241,258 | |
6.00%, due 6/1/36 | | | 985,393 | | | | 1,078,819 | |
6.00%, due 11/1/36 | | | 1,026,425 | | | | 1,146,194 | |
6.00%, due 4/1/37 | | | 252,580 | | | | 273,370 | |
6.50%, due 10/1/31 | | | 127,665 | | | | 146,114 | |
6.50%, due 7/1/32 | | | 28,247 | | | | 33,422 | |
6.50%, due 2/1/37 | | | 118,448 | | | | 140,768 | |
6.50%, due 8/1/47 | | | 176,928 | | | | 194,670 | |
| | | | | | | | |
| | | | | | | 184,036,336 | |
| | | | | | | | |
Government National Mortgage Association
(Mortgage Pass-Through Securities) 11.3% | |
4.00%, due 7/15/39 | | | 1,254,670 | | | | 1,380,796 | |
4.00%, due 9/20/40 | | | 3,583,373 | | | | 3,969,044 | |
4.00%, due 11/20/40 | | | 354,463 | | | | 392,613 | |
4.00%, due 1/15/41 | | | 4,110,476 | | | | 4,512,123 | |
| | | | | | | | |
| | | Principal
Amount | | | Value | |
| | | | | | | | |
Government National Mortgage Association
(Mortgage Pass-Through Securities) (continued) | |
¨ 4.00%, due 10/15/41 | | $ | 6,399,369 | | | $ | 7,148,659 | |
¨ 4.50%, due 5/20/40 | | | 11,745,577 | | | | 12,950,000 | |
5.00%, due 4/15/34 | | | 1,967,354 | | | | 2,162,329 | |
5.00%, due 2/20/41 | | | 1,383,171 | | | | 1,532,751 | |
5.50%, due 6/15/33 | | | 1,489,030 | | | | 1,691,741 | |
5.50%, due 12/15/35 | | | 537,548 | | | | 592,585 | |
5.50%, due 2/1/36 TBA (f) | | | 3,810,000 | | | | 4,186,238 | |
6.00%, due 8/15/32 | | | 340,090 | | | | 383,050 | |
6.00%, due 10/15/32 | | | 545,039 | | | | 615,945 | |
6.50%, due 7/15/28 | | | 57,218 | | | | 65,648 | |
6.50%, due 8/15/28 | | | 79,360 | | | | 91,829 | |
6.50%, due 7/15/32 | | | 345,482 | | | | 410,503 | |
| | | | | | | | |
| | | | | | | 42,085,854 | |
| | | | | | | | |
¨Overseas Private Investment Corporation 1.9% | |
5.142%, due 12/15/23 | | | 6,220,970 | | | | 7,264,475 | |
| | | | | | | | |
| | |
Tennessee Valley Authority 3.4% | | | | | | | | |
3.875%, due 2/15/21 | | | 2,750,000 | | | | 3,191,243 | |
4.65%, due 6/15/35 | | | 4,395,000 | | | | 5,257,343 | |
6.25%, due 12/15/17 | | | 3,485,000 | | | | 4,394,142 | |
| | | | | | | | |
| | | | | | | 12,842,728 | |
| | | | | | | | |
United States Treasury Inflation—Indexed Notes 1.0% | |
2.00%, due 7/15/14 (g) | | | 3,681,540 | | | | 3,884,886 | |
| | | | | | | | |
Total U.S. Government & Federal Agencies
(Cost $299,999,765) | | | | 318,794,564 | |
| | | | | | | | |
Total Long-Term Bonds
(Cost $344,473,571) | | | | | | | 365,684,113 | |
| | | | | | | | |
|
| Short-Term Investment 6.5% | |
Repurchase Agreement 6.5% | |
State Street Bank and Trust Co.
0.01%, dated 12/31/12
due 1/2/13
Proceeds at Maturity $24,230,585 (Collateralized by a Federal National Mortgage Association security with a rate of 2.17% and a maturity date of 11/7/22, with a Principal Amount of $24,615,000 and a Market Value of $24,718,801) | | | 24,230,571 | | | | 24,230,571 | |
| | | | | | | | |
Total Short-Term Investment
(Cost $24,230,571) | | | | | | | 24,230,571 | |
| | | | | | | | |
Total Investments
(Cost $368,704,142) (h) | | | 104.4 | % | | | 389,914,684 | |
Other Assets, Less Liabilities | | | (4.4 | ) | | | (16,406,794 | ) |
Net Assets | | | 100.0 | % | | $ | 373,507,890 | |
| | | | |
| M-190 | | MainStay VP Government Portfolio | | The notes to the financial statements are an integral part of,
and should be read in conjunction with, the financial statements. |
| ‡ | Less than one-tenth of a percent. |
| (a) | May be sold to institutional investors only under Rule 144A or securities offered pursuant to Section 4(2) of the Securities Act of 1933, as amended. |
| (b) | Floating rate—Rate shown is the rate in effect as of December 31, 2012. |
| (c) | Collateral strip rate—Bond whose interest is based on the weighted net interest rate of the collateral. Coupon rate adjusts periodically based on a predetermined schedule. Rate shown is the rate in effect as of December 31, 2012. |
| (d) | Illiquid security. The total market value of this security as of December 31, 2012 is $1,028,778, which represents 0.3% of the Portfolio’s net assets. |
| (e) | Collateralized Mortgage Obligation Interest Only Strip—Pays a fixed or variable rate of interest based on mortgage loans or mortgage pass-through securities. The principal amount of the underlying pool represents the notional amount on which the current interest is calculated. The value of these stripped securities may be particularly sensitive to changes in prevailing interest rates and are typically more sensitive to changes in prepayment rates than traditional mortgage-backed securities. |
| (f) | TBA—Securities purchased on a forward commitment basis with an approximate principal amount and maturity date. The actual principal amount and maturity date will be determined upon settlement. The market value of these securities as of December 31, 2012 is $11,230,847, which represents 3.0% of the Portfolio’s net assets. All or a portion of these securities were acquired under a mortgage dollar roll agreement. |
| (g) | Treasury Inflation Protected Security—Pays a fixed rate of interest on a principal amount that is continuously adjusted for inflation based on the Consumer Price Index-Urban Consumers. |
| (h) | As of December 31, 2012, cost is $368,704,142 for federal income tax purposes and net unrealized appreciation is as follows: |
| | | | |
Gross unrealized appreciation | | $ | 21,656,999 | |
Gross unrealized depreciation | | | (446,457 | ) |
| | | | |
Net unrealized appreciation | | $ | 21,210,542 | |
| | | | |
The following is a summary of the fair valuations according to the inputs used as of December 31, 2012, for valuing the Portfolio’s assets.
Asset Valuation Inputs
| | | | | | | | | | | | | | | | |
Description | | Quoted Prices
in Active Markets
for Identical Assets
(Level 1) | | | Significant Other
Observable Inputs (Level 2) | | | Significant
Unobservable
Inputs
(Level 3) | | | Total | |
| Investments in Securities (a) | | | | | | | | | | | | | | | | |
| Long-Term Bonds | | | | | | | | | | | | | | | | |
Asset-Backed Securities | | $ | — | | | $ | 2,629,566 | | | $ | — | | | $ | 2,629,566 | |
Corporate Bonds | | | — | | | | 20,494,124 | | | | — | | | | 20,494,124 | |
Mortgage-Backed Securities | | | — | | | | 23,765,859 | | | | — | | | | 23,765,859 | |
U.S. Government & Federal Agencies | | | — | | | | 318,794,564 | | | | — | | | | 318,794,564 | |
| | | | | | | | | | | | | | | | |
| Total Long-Term Bonds | | | — | | | | 365,684,113 | | | | — | | | | 365,684,113 | |
| | | | | | | | | | | | | | | | |
| Short-Term Investment | | | | | | | | | | | | | | | | |
Repurchase Agreement | | | — | | | | 24,230,571 | | | | — | | | | 24,230,571 | |
| | | | | | | | | | | | | | | | |
| Total Investments in Securities | | $ | — | | | $ | 389,914,684 | | | $ | — | | | $ | 389,914,684 | |
| | | | | | | | | | | | | | | | |
| (a) | For a complete listing of investments and their industries, see the Portfolio of Investments. |
The Portfolio recognizes transfers between the levels as of the beginning of the period.
For the year ended December 31, 2012, the Portfolio did not have any transfers between Level 1 and Level 2 fair value measurements. (See Note 2)
During the year ended December 31, 2012, securities with a total value of $1,147,421 transferred from Level 3 to Level 2. The transfer occurred as a result of the value of these securities being obtained from an independent pricing source using observable inputs as of December 31, 2012. As of December 31, 2011, the valuation of these securities was obtained using fair valued prices due to market quotations not being readily available.
| | | | | | |
The notes to the financial statements are an integral part of,
and should be read in conjunction with, the financial statements. | | mainstayinvestments.com | | | M-191 | |
Portfolio of Investments December 31, 2012 (continued)
The following is a reconciliation of investments in which significant unobservable inputs (Level 3) were used in determining value:
| | | | | | | | | | | | | | | | | | | | | | | | | | | | | | | | | | | | | | | | |
Investments in Securities | | Balance
as of
December 31,
2011 | | | Accrued
Discounts
(Premiums) | | | Realized
Gain
(Loss) | | | Change in
Unrealized
Appreciation
(Depreciation) | | | Purchases | | | Sales | | | Transfers
into
Level 3 | | | Transfers
out of
Level 3 | | | Balance
as of
December 31,
2012 | | | Change in
Unrealized
Appreciation
(Depreciation)
from
Investments
Still Held at
December 31,
2012 | |
| Long-Term Bonds | | | | | | | | | | | | | | | | | | | | | | | | | | | | | | | | | | | | | | | | |
Mortgage-Backed Securities | | | | | | | | | | | | | | | | | | | | | | | | | | | | | | | | | | | | | | | | |
Commercial Mortgage Loans (Collateralized Mortgage Obligations) | | $ | 1,147,421 | | | $ | — | | | $ | — | | | $ | — | | | $ | — | | | $ | — | | | $ | — | | | $ | (1,147,421 | ) | | $ | — | | | $ | �� — | |
| | | | | | | | | | | | | | | | | | | | | | | | | | | | | | | | | | | | | | | | |
| Total | | $ | 1,147,421 | | | $ | — | | | $ | — | | | $ | — | | | $ | — | | | $ | — | | | $ | — | | | $ | (1,147,421 | ) | | $ | — | | | $ | — | |
| | | | | | | | | | | | | | | | | | | | | | | | | | | | | | | | | | | | | | | | |
| | | | |
| M-192 | | MainStay VP Government Portfolio | | The notes to the financial statements are an integral part of,
and should be read in conjunction with, the financial statements. |
Statement of Assets and Liabilities as of December 31, 2012
| | | | |
| Assets | | | | |
Investment in securities, at value
(identified cost $368,704,142) | | $ | 389,914,684 | |
Receivables: | | | | |
Interest | | | 1,368,738 | |
Fund shares sold | | | 527,541 | |
Investment securities sold | | | 6,684 | |
Other assets | | | 489 | |
| | | | |
Total assets | | | 391,818,136 | |
| | | | |
| |
| Liabilities | | | | |
Payables: | | | | |
Investment securities purchased | | | 17,877,952 | |
Manager (See Note 3) | | | 157,571 | |
Fund shares redeemed | | | 149,021 | |
NYLIFE Distributors (See Note 3) | | | 53,833 | |
Professional fees | | | 38,249 | |
Shareholder communication | | | 30,281 | |
Custodian | | | 2,801 | |
Trustees | | | 538 | |
| | | | |
Total liabilities | | | 18,310,246 | |
| | | | |
Net assets | | $ | 373,507,890 | |
| | | | |
| |
| Net Assets Consist of | | | | |
Shares of beneficial interest outstanding (par value of $.001 per share) unlimited number of shares authorized | | $ | 31,723 | |
Additional paid-in capital | | | 342,132,608 | |
| | | | |
| | | 342,164,331 | |
Undistributed net investment income | | | 9,726,545 | |
Accumulated net realized gain (loss) on investments | | | 406,472 | |
Net unrealized appreciation (depreciation) on investments | | | 21,210,542 | |
| | | | |
Net assets | | $ | 373,507,890 | |
| | | | |
| | | | |
Initial Class | | | | |
Net assets applicable to outstanding shares | | $ | 117,125,910 | |
| | | | |
Shares of beneficial interest outstanding | | | 9,891,441 | |
| | | | |
Net asset value per share outstanding | | $ | 11.84 | |
| | | | |
Service Class | | | | |
Net assets applicable to outstanding shares | | $ | 256,381,980 | |
| | | | |
Shares of beneficial interest outstanding | | | 21,831,650 | |
| | | | |
Net asset value per share outstanding | | $ | 11.74 | |
| | | | |
| | | | | | |
The notes to the financial statements are an integral part of,
and should be read in conjunction with, the financial statements. | | mainstayinvestments.com | | | M-193 | |
Statement of Operations for the year ended December 31, 2012
| | | | |
| Investment Income (Loss) | |
Income | | | | |
Interest | | $ | 12,252,537 | |
| | | | |
Expenses | | | | |
Manager (See Note 3) | | | 1,843,291 | |
Distribution and service—Service Class (See Note 3) | | | 609,227 | |
Shareholder communication | | | 60,933 | |
Professional fees | | | 60,344 | |
Custodian | | | 16,944 | |
Trustees | | | 9,905 | |
Miscellaneous | | | 14,314 | |
| | | | |
Total expenses | | | 2,614,958 | |
| | | | |
Net investment income (loss) | | | 9,637,579 | |
| | | | |
|
| Realized and Unrealized Gain (Loss) on Investments | |
Net realized gain (loss) on investments | | | 689,044 | |
Net change in unrealized appreciation (depreciation) on investments | | | 3,318,534 | |
| | | | |
Net realized and unrealized gain (loss) on investments | | | 4,007,578 | |
| | | | |
Net increase (decrease) in net assets resulting from operations | | $ | 13,645,157 | |
| | | | |
| | | | |
| M-194 | | MainStay VP Government Portfolio | | The notes to the financial statements are an integral part of,
and should be read in conjunction with, the financial statements. |
Statements of Changes in Net Assets
for the years ended December 31, 2012 and December 31, 2011
| | | | | | | | |
| | | 2012 | | | 2011 | |
| Increase (Decrease) in Net Assets | |
Operations: | | | | | | | | |
Net investment income (loss) | | $ | 9,637,579 | | | $ | 10,260,840 | |
Net realized gain (loss) on investments | | | 689,044 | | | | 344,467 | |
Net change in unrealized appreciation (depreciation) on investments | | | 3,318,534 | | | | 9,097,347 | |
| | | | |
Net increase (decrease) in net assets resulting from operations | | | 13,645,157 | | | | 19,702,654 | |
| | | | |
Dividends and distributions to shareholders: | | | | | | | | |
From net investment income: | | | | | | | | |
Initial Class | | | (3,610,388 | ) | | | (4,400,897 | ) |
Service Class | | | (6,936,666 | ) | | | (6,859,220 | ) |
| | | | |
| | | (10,547,054 | ) | | | (11,260,117 | ) |
| | | | |
From net realized gain on investments: | | | | | | | | |
Initial Class | | | — | | | | (1,094,128 | ) |
Service Class | | | — | | | | (1,835,328 | ) |
| | | | |
| | | — | | | | (2,929,456 | ) |
| | | | |
Total dividends and distributions to shareholders | | | (10,547,054 | ) | | | (14,189,573 | ) |
| | | | |
Capital share transactions: | | | | | | | | |
Net proceeds from sale of shares | | | 70,520,572 | | | | 75,781,271 | |
Net asset value of shares issued to shareholders in reinvestment of dividends and distributions | | | 10,547,054 | | | | 14,189,573 | |
Cost of shares redeemed | | | (78,820,337 | ) | | | (102,292,617 | ) |
| | | | |
Increase (decrease) in net assets derived from capital share transactions | | | 2,247,289 | | | | (12,321,773 | ) |
| | | | |
Net increase (decrease) in net assets | | | 5,345,392 | | | | (6,808,692 | ) |
|
| Net Assets | |
Beginning of year | | | 368,162,498 | | | | 374,971,190 | |
| | | | |
End of year | | $ | 373,507,890 | | | $ | 368,162,498 | |
| | | | |
Undistributed net investment income at end of year | | $ | 9,726,545 | | | $ | 10,547,033 | |
| | | | |
| | | | | | |
The notes to the financial statements are an integral part of,
and should be read in conjunction with, the financial statements. | | mainstayinvestments.com | | | M-195 | |
Financial Highlights selected per share data and ratios
| | | | | | | | | | | | | | | | | | | | |
| | | Initial Class | |
| | | Year ended December 31, | |
| | | 2012 | | | 2011 | | | 2010 | | | 2009 | | | 2008 | |
Net asset value at beginning of year | | $ | 11.74 | | | $ | 11.55 | | | $ | 11.47 | | | $ | 11.72 | | | $ | 11.02 | |
| | | | | | | | | | | | | | | | | | | | |
Net investment income (loss) (a) | | | 0.33 | | | | 0.36 | | | | 0.33 | | | | 0.36 | | | | 0.44 | |
Net realized and unrealized gain (loss) on investments | | | 0.13 | | | | 0.32 | | | | 0.30 | | | | (0.17 | ) | | | 0.60 | |
| | | | | | | | | | | | | | | | | | | | |
Total from investment operations | | | 0.46 | | | | 0.68 | | | | 0.63 | | | | 0.19 | | | | 1.04 | |
| | | | | | | | | | | | | | | | | | | | |
Less dividends and distributions: | | | | | | | | | | | | | | | | | | | | |
From net investment income | | | (0.36 | ) | | | (0.39 | ) | | | (0.37 | ) | | | (0.43 | ) | | | (0.34 | ) |
From net realized gain on investments | | | — | | | | (0.10 | ) | | | (0.18 | ) | | | (0.01 | ) | | | — | |
| | | | | | | | | | | | | | | | | | | | |
Total dividends and distributions | | | (0.36 | ) | | | (0.49 | ) | | | (0.55 | ) | | | (0.44 | ) | | | (0.34 | ) |
| | | | | | | | | | | | | | | | | | | | |
Net asset value at end of year | | $ | 11.84 | | | $ | 11.74 | | | $ | 11.55 | | | $ | 11.47 | | | $ | 11.72 | |
| | | | | | | | | | | | | | | | | | | | |
Total investment return | | | 3.96 | % | | | 5.98 | % | | | 5.35 | % | | | 1.61 | % | | | 9.80 | % |
Ratios (to average net assets)/Supplemental Data: | | | | | | | | | | | | | | | | | | | | |
Net investment income (loss) | | | 2.78 | % | | | 3.04 | % | | | 2.79 | % | | | 3.12 | % | | | 3.91 | % |
Net expenses | | | 0.54 | % | | | 0.55 | % | | | 0.56 | % | | | 0.56 | % | | | 0.57 | % |
Portfolio turnover rate (b) | | | 40 | % | | | 58 | % | | | 127 | % | | | 141 | % | | | 72 | % |
Net assets at end of year (in 000’s) | | $ | 117,126 | | | $ | 133,395 | | | $ | 153,178 | | | $ | 167,267 | | | $ | 206,744 | |
| (a) | Per share data based on average shares outstanding during the year. |
| (b) | The portfolio turnover rates not including mortgage dollar rolls were 20%, 37%, 30%, 24% and 50% for the years ended December 31, 2012, 2011, 2010, 2009 and 2008, respectively. |
| | | | | | | | | | | | | | | | | | | | |
| | | Service Class | |
| | | Year ended December 31, | |
| | | 2012 | | | 2011 | | | 2010 | | | 2009 | | | 2008 | |
Net asset value at beginning of year | | $ | 11.65 | | | $ | 11.46 | | | $ | 11.40 | | | $ | 11.66 | | | $ | 10.97 | |
| �� | | | | | | | | | | | | | | | | | | | |
Net investment income (loss) (a) | | | 0.30 | | | | 0.33 | | | | 0.30 | | | | 0.33 | | | | 0.40 | |
Net realized and unrealized gain (loss) on investments | | | 0.13 | | | | 0.33 | | | | 0.28 | | | | (0.17 | ) | | | 0.62 | |
| | | | | | | | | | | | | | | | | | | | |
Total from investment operations | | | 0.43 | | | | 0.66 | | | | 0.58 | | | | 0.16 | | | | 1.02 | |
| | | | | | | | | | | | | | | | | | | | |
Less dividends and distributions: | | | | | | | | | | | | | | | | | | | | |
From net investment income | | | (0.34 | ) | | | (0.37 | ) | | | (0.34 | ) | | | (0.41 | ) | | | (0.33 | ) |
From net realized gain on investments | | | — | | | | (0.10 | ) | | | (0.18 | ) | | | (0.01 | ) | | | — | |
| | | | | | | | | | | | | | | | | | | | |
Total dividends and distributions | | | (0.34 | ) | | | (0.47 | ) | | | (0.52 | ) | | | (0.42 | ) | | | (0.33 | ) |
| | | | | | | | | | | | | | | | | | | | |
Net asset value at end of year | | $ | 11.74 | | | $ | 11.65 | | | $ | 11.46 | | | $ | 11.40 | | | $ | 11.66 | |
| | | | | | | | | | | | | | | | | | | | |
Total investment return | | | 3.70 | % | | | 5.71 | % | | | 5.09 | % | | | 1.36 | % | | | 9.53 | % |
Ratios (to average net assets)/Supplemental Data: | | | | | | | | | | | | | | | | | | | | |
Net investment income (loss) | | | 2.53 | % | | | 2.79 | % | | | 2.53 | % | | | 2.87 | % | | | 3.59 | % |
Net expenses | | | 0.79 | % | | | 0.80 | % | | | 0.81 | % | | | 0.81 | % | | | 0.82 | % |
Portfolio turnover rate (b) | | | 40 | % | | | 58 | % | | | 127 | % | | | 141 | % | | | 72 | % |
Net assets at end of year (in 000’s) | | $ | 256,382 | | | $ | 234,768 | | | $ | 221,793 | | | $ | 182,700 | | | $ | 216,838 | |
| (a) | Per share data based on average shares outstanding during the year. |
| (b) | The portfolio turnover rates not including mortgage dollar rolls were 20%, 37%, 30%, 24% and 50% for the years ended December 31, 2012, 2011, 2010, 2009 and 2008, respectively. |
| | | | |
| M-196 | | MainStay VP Government Portfolio | | The notes to the financial statements are an integral part of,
and should be read in conjunction with, the financial statements. |
MainStay VP Growth Allocation Portfolio
Investment and Performance Comparison1 (Unaudited)
Performance data quoted represents past performance. Past performance is no guarantee of future results. Because of market volatility, current performance may be lower or higher than the figures shown. Investment return and principal value will fluctuate, and as a result, when shares are redeemed, they may be worth more or less than their original cost. The performance table and graph do not reflect any deduction of sales charges, mortality and expense charges, contract charges or administrative charges. Please refer to the Performance Summary appropriate for your policy. For performance information current to the most recent month-end, please call 800-598-2019 or visit www.newyorklife.com.
Average Annual Total Returns for the Period Ended December 31, 2012
| | | | | | | | | | | | | | | | |
Class | | One Year | | | Five Years | | | Since Inception (2/13/06) | | | Gross Expense Ratio2 | |
| Initial Class Shares | | | 15.47 | % | | | 0.66 | % | | | 3.68 | % | | | 1.11 | % |
| Service Class Shares | | | 15.18 | | | | 0.41 | | | | 3.42 | | | | 1.36 | |
| | | | | | | | | | | | |
| Benchmark Performance | | One
Year | | | Five
Years | | | Since Inception
(2/13/06) | |
S&P 500® Index3 | | | 16.00 | % | | | 1.66 | % | | | 3.93 | % |
MSCI EAFE® Index3 | | | 17.32 | | | | –3.69 | | | | 1.65 | |
Average Lipper Variable Products Multi-Cap Core Portfolio4 | | | 15.02 | | | | 0.95 | | | | 2.37 | |
| 1. | Performance figures reflect certain fee waivers and/or expense limitations, without which total returns may have been different. For information on current fee waivers and/or expense limitations, please refer to the notes to the financial statements. |
| 2. | The gross expense ratios presented reflect the Portfolio’s “Total Annual Portfolio Operating Expenses” from the most recent Prospectus and may differ from other expense ratios disclosed in this report. |
| 3. | Please refer to pages M-2 and M-3 for additional explanations and disclosure regarding the Portfolios, their benchmark indices and other indices mentioned in the reports. |
| 4. | The Average Lipper Variable Products Multi-Cap Core Portfolio is representative of portfolios that, by portfolio practice, invest in a variety of market-capitalization ranges without concentrating 75% of their equity assets in any one market-capitalization range over an extended period of time. Multi-cap core portfolios typically have an average price-to-earnings ratio, price-to-book ratio, and three-year sales-per-share growth value compared to the S&P SuperComposite 1500® Index. Lipper Inc. is an independent monitor of fund performance. Results are based on total returns with all dividend and capital gain distributions reinvested. |
| | |
| mainstayinvestments.com | | M-197 |
Cost in Dollars of a $1,000 Investment in MainStay VP Growth Allocation Portfolio (Unaudited)
The example below is intended to describe the fees and expenses borne by shareholders during the six-month period from July 1, 2012 to December 31, 2012, and the impact of those costs on your investment.
Example
As a shareholder of the Portfolio, you incur two types of costs: (1) transaction costs, including exchange fees and sales charges (loads) on purchases (as applicable), and (2) ongoing costs, including management fees, distribution and/or service (12b-1) fees, and other Portfolio expenses (as applicable). This example is intended to help you understand your ongoing costs (in dollars) of investing in the Portfolio and to compare these costs with the ongoing costs of investing in other Portfolios. The example is based on an investment of $1,000 made at the beginning of the six-month period and held for the entire period from July 1, 2012, to December 31, 2012. Shares are only sold in connection with variable life and annuity contracts and the example does not reflect any contract level or transactional fees or expenses. If these costs had been included, your costs would have been higher.
This example illustrates your Portfolio’s ongoing costs in two ways:
Actual Expenses
The second and third data columns in the table below provide information about actual account values and actual expenses. You may use the information in these columns, together with the amount you invested, to estimate the
expenses that you paid during the six months ended December 31, 2012. Simply divide your account value by $1,000 (for example, an $8,600 account value divided by $1,000 = 8.6), then multiply the result by the number under the heading entitled ‘‘Expenses Paid During Period’’ to estimate the expenses you paid on your account during this period.
Hypothetical Example for Comparison Purposes
The fourth and fifth data columns in the table below provide information about hypothetical account values and hypothetical expenses based on the Portfolio’s actual expense ratio and an assumed rate of return of 5% per year before expenses, which is not the Portfolio’s actual return. The hypothetical account values and expenses may not be used to estimate the actual ending account balances or expenses you paid for the six-month period shown. You may use this information to compare the ongoing costs of investing in the Portfolio with the ongoing costs of investing in other Portfolios. To do so, compare this 5% hypothetical example with the 5% hypothetical examples that appear in the shareholder reports of the other Portfolios.
Please note that the expenses shown in the table are meant to highlight your ongoing costs only and do not reflect any transactional costs, such as exchange fees or sales charges (loads). Therefore, the fourth and fifth data columns of the table are useful in comparing ongoing costs only and will not help you determine the relative total costs of owning different funds. In addition, if these transactional costs were included, your costs would have been higher.
| | | | | | | | | | | | | | | | | | | | |
| | | | | | | | | | | | | | | | |
| Share Class | | Beginning
Account
Value
7/1/12 | | | Ending Account
Value (Based
on Actual
Returns and
Expenses)
12/31/12 | | | Expenses
Paid
During
Period1 | | | Ending Account
Value (Based
on Hypothetical
5% Annualized
Return and
Actual Expenses)
12/31/12 | | | Expenses
Paid
During
Period1 | |
| | | | | |
| Initial Class Shares | | $ | 1,000.00 | | | $ | 1,085.80 | | | $ | 0.21 | | | $ | 1,024.90 | | | $ | 0.20 | |
| | | | | |
| Service Class Shares | | $ | 1,000.00 | | | $ | 1,084.40 | | | $ | 1.52 | | | $ | 1,023.70 | | | $ | 1.48 | |
| 1. | Expenses are equal to the Portfolio’s annualized expense ratio of each class (0.04% for Initial Class and 0.29% for Service Class) multiplied by the average account value over the period, divided by 366 and multiplied by 184 (to reflect the six-month period). The table above represents the actual expenses incurred during the six-month period. In addition to the fees and expenses which the Portfolio bears directly, the Portfolio indirectly bears a pro rata share of the fees and expenses of the Underlying Portfolios/Funds in which it invests. Such indirect expenses are not included in the above-reported expense figures. |
| | |
| M-198 | | MainStay VP Growth Allocation Portfolio |
Investment Objectives of Underlying Portfolios/Funds as of December 31, 2012 (Unaudited)
See Portfolio of Investments beginning on page M-202 for specific holdings within these categories.
| | | | |
| mainstayinvestments.com | | | M-199 | |
Portfolio Management Discussion and Analysis (Unaudited)
Answers to the questions reflect the views of portfolio managers Jae S. Yoon, CFA, and Jonathan Swaney of New York Life Investments,1 the Portfolio’s Manager.
How did MainStay VP Growth Allocation Portfolio perform relative to its peers and its benchmark during the 12 months ended December 31, 2012?
For the 12 months ended December 31, 2012, MainStay VP Growth Allocation Portfolio returned 15.47% for Initial Class shares and 15.18% for Service Class shares. Over the same period, both share classes outperformed the 15.02% return of the average Lipper2 Variable Products Multi-Cap Core Portfolio and underperformed the 16.00% return
of the S&P 500® Index.2 The S&P 500® Index is the Portfolio’s broad-based securities-market index. For the 12 months ended December 31, 2012, both share classes underperformed the 17.32% return of the MSCI EAFE® Index,2 which is the secondary benchmark for the Portfolio.
What factors affected the Portfolio’s relative performance during the reporting period?
The Portfolio is a “fund of funds” that invests primarily in other MainStay Portfolios and other Funds managed by New York Life Investments (the “Underlying Portfolios/Funds”). The Underlying Portfolios/Funds may invest in domestic or international stocks at various capitalization levels. The Portfolio’s primary benchmark, on the other hand, consists entirely of U.S. large-cap stocks.
Among the Underlying Portfolios/Funds in which the Portfolio invested, results were mixed. Several fared quite well relative to their respective peers and benchmarks. Among these was MainStay 130/30 International Fund. Other substantial holdings experienced challenges. Among these were MainStay VP Large Cap Growth Portfolio and MainStay Epoch U.S. All
Cap Fund. Excess returns among the Underlying Portfolios/Funds in which the Portfolio invested detracted significantly from the Portfolio’s relative performance. Nevertheless, the Portfolio generated better-than-median performance in its Lipper category despite coming up short relative to the S&P 500® Index.
How did you allocate the Portfolio’s assets during the reporting period and why?
In managing the Portfolio, we considered a variety of information, including the portfolio-level characteristics of the Underlying Portfolios/Funds, such as capitalization, style biases and sector exposures. We also
examined the attributes of the individual holdings of the Underlying Portfolios/Funds, such as valuation metrics, earnings data and technical indicators. Finally, we evaluated the historical success of the portfolio managers responsible for the Underlying Portfolios/Funds. Generally speaking, we seek to invest in Underlying Portfolios/Funds that occupy attractively valued segments of the market, invest in fairly priced securities and are steered by individuals who have consistently demonstrated capable management in the past.
We placed a mild emphasis on two themes during 2012. First, we viewed Underlying Portfolios/Funds that invest in large-capitalization stocks favorably
in relation to Underlying Portfolios/Funds that invest in small-cap stocks. We adopted this positioning because we believed that large-cap stocks were more attractively valued, had superior access to capital and were better positioned to benefit from growth in the developing world. Second, we preferred Underlying Portfolios/Funds that invest in U.S. stocks over Underlying Portfolios/Funds that invest in stocks of other developed markets. Both of these positioning strategies contributed positively to the Portfolio’s returns during the first half of the year but surrendered their gains in the second half. The result was relatively neutral for the year as a whole.
How did the Portfolio’s allocations change over the course of the reporting period?
The primary allocation changes came as several new options were introduced to the pool of eligible investments. We established new positions in MainStay VP T. Rowe Price Equity Income Portfolio, MainStay VP Eagle Small Cap Growth Portfolio and MainStay VP DFA / DuPont Capital Emerging Markets Equity Portfolio, with funding coming from a variety of sources including selling shares of MainStay VP Mid Cap Core Portfolio and MainStay Epoch U.S. All Cap Fund. We also materially increased the Portfolio’s holdings of MainStay VP S&P 500® Index Portfolio and MainStay VP Large Cap Growth Portfolio.
As of December 31, 2012, the Portfolio was in the process of exiting a position in MainStay Epoch International Small Cap Fund, an Underlying Portfolio/Fund that occupies a specialized segment of the investable universe. In our opinion, the risk-adjusted return potential of this Underlying Portfolio/Fund has become less compelling than it was in previous periods.
| 1 | “New York Life Investments” is a service mark used by New York Life Investment Management LLC. |
| 2 | Please refer to pages M-2 and M-3 for additional explanations and disclosure regarding the Portfolios, their benchmark indices and service providers mentioned in the reports. |
| | |
| M-200 | | MainStay VP Growth Allocation Portfolio |
In the fixed-income portion of the Portfolio, we emphasized two general themes. First, we sought to reduce exposure to the lowest-quality credits. This led us to cut the Portfolio’s holdings of MainStay VP Flexible Bond Opportunities Portfolio in half while shifting some of the proceeds into the MainStay VP Bond Portfolio. While we believed that government bonds represented a very poor value proposition, we were also wary of the junk bond market, which we believed had become increasingly speculative. In light of these concerns, we believed that emphasizing the middle of the quality spectrum would be a prudent strategy. Second, we shortened the Portfolio’s duration in an effort to reduce the Portfolio’s sensitivity to a potential rise in interest rates. Our primary tool in this effort was to increase the size of the Portfolio’s position in MainStay VP Floating Rate Portfolio. With the same goal in mind, we also established a position in the new MainStay Short Duration High Yield Fund.
During the reporting period, which Underlying Portfolios/Funds had the highest total returns and which Underlying Portfolios/Funds had the lowest total returns?
Among the Underlying Portfolios/Funds in which the Portfolio invested, MainStay International Opportunities Fund (formerly MainStay 130/30 International
Fund) had the highest return for 2012, followed by MainStay VP International Equity Portfolio and MainStay Epoch International Small Cap Fund. Although all Underlying Portfolios/Funds in which the Portfolio invested generated positive returns for the reporting period, the lowest total returns came from MainStay Epoch U.S. All Cap Fund and MainStay VP U.S. Small Cap Portfolio.
Which Underlying Portfolios/Funds made the strongest positive contributions to the Portfolio’s overall performance, and which Underlying Portfolios/Funds were the greatest detractors?
The most significant contributions to the Portfolio’s performance came from large positions in MainStay MAP Fund and MainStay VP Large Cap Growth Portfolio. (Contributions take weightings and total returns into account.) The weakest contributions came from MainStay VP Eagle Small Cap Growth Portfolio and
MainStay Marketfield Fund. That some positions made only marginal contributions tended to reflect position size and timing as much as the returns of the Underlying Portfolios/Funds.
The opinions expressed are those of the portfolio managers as of the date of this report and are subject to change. There is no guarantee that any forecasts made will come to pass. This material does not constitute investment advice and is not intended as an endorsement of any specific investment.
Not all MainStay VP Portfolios and/or share classes are available under all policies.
| | | | |
| mainstayinvestments.com | | | M-201 | |
Portfolio of Investments December 31, 2012
| | | | | | | | |
| | |
| | | Shares | | | Value | |
| Affiliated Investment Companies 100.1%† | |
Equity Funds 100.1% | |
MainStay 130/30 Core Fund Class I (a) | | | 3,783,672 | | | $ | 29,663,987 | |
MainStay 130/30 International Fund Class I (a) | | | 2,571,255 | | | | 18,230,196 | |
MainStay Epoch Global Choice Fund Class I (a) | | | 394,549 | | | | 6,691,558 | |
MainStay Epoch International Small Cap Fund
Class I | | | 13,794 | | | | 254,503 | |
MainStay Epoch U.S. All Cap Fund Class I | | | 275,298 | | | | 6,108,873 | |
MainStay ICAP Equity Fund Class I | | | 248,632 | | | | 10,059,665 | |
MainStay ICAP International Fund Class I | | | 422,249 | | | | 12,709,698 | |
MainStay MAP Fund Class I | | | 1,458,704 | | | | 51,550,590 | |
MainStay Marketfield Fund Class I | | | 65,733 | | | | 1,041,214 | |
MainStay VP Common Stock Portfolio
Initial Class | | | 236,552 | | | | 4,352,653 | |
MainStay VP DFA / DuPont Capital Emerging Markets Equity Portfolio Initial Class (b) | | | 636,691 | | | | 6,442,113 | |
MainStay VP Eagle Small Cap Growth Portfolio Initial Class (b) | | | 977,914 | | | | 9,774,217 | |
MainStay VP ICAP Select Equity Portfolio
Initial Class | | | 198,151 | | | | 2,726,022 | |
MainStay VP International Equity Portfolio
Initial Class | | | 460,169 | | | | 5,585,057 | |
MainStay VP Large Cap Growth Portfolio
Initial Class (a)(b) | | | 2,426,148 | | | | 40,945,166 | |
| | | | | | | | |
| | |
| | | Shares | | | Value | |
Equity Funds (continued) | |
MainStay VP Mid Cap Core Portfolio
Initial Class | | | 195,223 | | | $ | 2,388,181 | |
MainStay VP S&P 500 Index Portfolio
Initial Class | | | 225,353 | | | | 6,519,911 | |
MainStay VP T. Rowe Price Equity Income Portfolio Initial Class (a)(b) | | | 2,523,153 | | | | 27,218,071 | |
MainStay VP U.S. Small Cap Portfolio
Initial Class (a) | | | 1,666,932 | | | | 16,773,304 | |
MainStay VP Van Eck Global Hard Assets Portfolio Initial Class (b) | | | 126,347 | | | | 1,147,315 | |
| | | | | | | | |
Total Investments
(Cost $241,790,177) (c) | | | 100.1 | % | | | 260,182,294 | |
Other Assets, Less Liabilities | | | (0.1 | ) | | | (342,033 | ) |
Net Assets | | | 100.0 | % | | $ | 259,840,261 | |
| † | Percentages indicated are based on Portfolio net assets. |
| (a) | The Portfolio’s ownership exceeds 5% of the outstanding shares of the Underlying Portfolio’s/Fund’s share class. (See Note 3) |
| (b) | Non-income producing Underlying Portfolio/Fund. |
| (c) | As of December 31, 2012, cost is $244,579,037 for federal income tax purposes and net unrealized appreciation is as follows: |
| | | | |
Gross unrealized appreciation | | $ | 15,908,281 | |
Gross unrealized depreciation | | | (305,024 | ) |
| | | | |
Net unrealized appreciation | | $ | 15,603,257 | |
| | | | |
The following is a summary of the fair valuations according to the inputs used as of December 31, 2012, for valuing the Portfolio’s assets.
Asset Valuation Inputs
| | | | | | | | | | | | | | | | |
Description | | Quoted Prices
in Active Markets
for Identical Assets (Level 1) | | | Significant Other
Observable Inputs
(Level 2) | | | Significant
Unobservable
Inputs
(Level 3) | | | Total | |
| Investments (a) | | | | | | | | | | | | | | | | |
| Affiliated Investment Companies | | | | | | | | | | | | | | | | |
Equity Funds | | $ | 260,182,294 | | | $ | — | | | $ | — | | | $ | 260,182,294 | |
| | | | | | | | | | | | | | | | |
| Total Investments | | $ | 260,182,294 | | | $ | — | | | $ | — | | | $ | 260,182,294 | |
| | | | | | | | | | | | | | | | |
| (a) | For a complete listing of investments see the Portfolio of Investments. |
The Portfolio recognizes transfers between the levels as of the beginning of the period.
For the year ended December 31, 2012, the Portfolio did not have any transfers between Level 1 and Level 2 fair value measurements. (See Note 2)
As of December 31, 2012, the Portfolio did not hold any investments with significant unobservable inputs (Level 3). (See Note 2)
| | | | |
| M-202 | | MainStay VP Growth Allocation Portfolio | | The notes to the financial statements are an integral part of,
and should be read in conjunction with, the financial statements. |
Statement of Assets and Liabilities as of December 31, 2012
| | | | |
| Assets | | | | |
Investment in affiliated investment companies, at value (identified cost $241,790,177) | | $ | 260,182,294 | |
Receivables: | | | | |
Investment securities sold | | | 102,072 | |
Fund shares sold | | | 95,132 | |
Other assets | | | 1,451 | |
| | | | |
Total assets | | | 260,380,949 | |
| | | | |
| |
| Liabilities | | | | |
Due to custodian | | | 102,072 | |
Payables: | | | | |
Fund shares redeemed | | | 345,322 | |
NYLIFE Distributors (See Note 3) | | | 48,245 | |
Professional fees | | | 23,290 | |
Shareholder communication | | | 20,810 | |
Custodian | | | 579 | |
Trustees | | | 370 | |
| | | | |
Total liabilities | | | 540,688 | |
| | | | |
Net assets | | $ | 259,840,261 | |
| | | | |
| |
| Net Assets Consist of | | | | |
Shares of beneficial interest outstanding (par value of $.001 per share) unlimited number of shares authorized | | $ | 25,773 | |
Additional paid-in capital | | | 264,544,550 | |
| | | | |
| | | 264,570,323 | |
Undistributed net investment income | | | 2,693,832 | |
Accumulated net realized gain (loss) on investments | | | (25,816,011 | ) |
Net unrealized appreciation (depreciation) on investments | | | 18,392,117 | |
| | | | |
Net assets | | $ | 259,840,261 | |
| | | | |
| | | | |
Initial Class | | | | |
Net assets applicable to outstanding shares | | $ | 31,447,162 | |
| | | | |
Shares of beneficial interest outstanding | | | 3,109,153 | |
| | | | |
Net asset value per share outstanding | | $ | 10.11 | |
| | | | |
Service Class | | | | |
Net assets applicable to outstanding shares | | $ | 228,393,099 | |
| | | | |
Shares of beneficial interest outstanding | | | 22,664,182 | |
| | | | |
Net asset value per share outstanding | | $ | 10.08 | |
| | | | |
| | | | | | |
The notes to the financial statements are an integral part of,
and should be read in conjunction with, the financial statements. | | mainstayinvestments.com | | | M-203 | |
Statement of Operations for the year ended December 31, 2012
| | | | |
| |
| Investment Income (Loss) | | | | |
Income | | | | |
Dividend distributions from affiliated investment companies | | $ | 2,394,060 | |
| | | | |
Expenses | | | | |
Distribution and service—Service Class (See Note 3) | | | 562,115 | |
Shareholder communication | | | 41,471 | |
Professional fees | | | 37,655 | |
Trustees | | | 6,786 | |
Custodian | | | 3,360 | |
Miscellaneous | | | 9,464 | |
| | | | |
Total expenses | | | 660,851 | |
| | | | |
Net investment income (loss) | | | 1,733,209 | |
| | | | |
|
| Realized and Unrealized Gain (Loss) on Investments | |
Net realized gain (loss) on: | | | | |
Affiliated investment company transactions | | | 14,371,807 | |
Realized capital gain distributions from affiliated
investment companies | | | 2,712,370 | |
| | | | |
Net realized gain (loss) on investments from affiliated investment companies | | | 17,084,177 | |
| | | | |
Net change in unrealized appreciation (depreciation)
on investments | | | 16,837,613 | |
| | | | |
Net realized and unrealized gain (loss) on investments | | | 33,921,790 | |
| | | | |
Net increase (decrease) in net assets resulting from operations | | $ | 35,654,999 | |
| | | | |
| | | | |
| M-204 | | MainStay VP Growth Allocation Portfolio | | The notes to the financial statements are an integral part of,
and should be read in conjunction with, the financial statements. |
Statements of Changes in Net Assets
for the years ended December 31, 2012 and December 31, 2011
| | | | | | | | |
| | | 2012 | | | 2011 | |
| Increase (Decrease) in Net Assets | |
Operations: | | | | | | | | |
Net investment income (loss) | | $ | 1,733,209 | | | $ | 2,022,289 | |
Net realized gain (loss) on investments from affiliated investment
companies transactions | | | 17,084,177 | | | | 21,049,561 | |
Net change in unrealized appreciation (depreciation) on investments | | | 16,837,613 | | | | (30,084,853 | ) |
| | | | |
Net increase (decrease) in net assets resulting from operations | | | 35,654,999 | | | | (7,013,003 | ) |
| | | | |
Dividends and distributions to shareholders: | | | | | | | | |
From net investment income: | | | | | | | | |
Initial Class | | | (302,698 | ) | | | (258,010 | ) |
Service Class | | | (1,757,645 | ) | | | (1,544,549 | ) |
| | | | |
| | | (2,060,343 | ) | | | (1,802,559 | ) |
| | | | |
From net realized gain on investments: | | | | | | | | |
Initial Class | | | (1,975,695 | ) | | | — | |
Service Class | | | (15,116,478 | ) | | | — | |
| | | | |
| | | (17,092,173 | ) | | | — | |
| | | | |
Total dividends and distributions to shareholders | | | (19,152,516 | ) | | | (1,802,559 | ) |
| | | | |
Capital share transactions: | | | | | | | | |
Net proceeds from sale of shares | | | 20,771,399 | | | | 29,973,362 | |
Net asset value of shares issued to shareholders in reinvestment of dividends and distributions | | | 19,152,516 | | | | 1,802,559 | |
Cost of shares redeemed | | | (34,574,866 | ) | | | (37,764,668 | ) |
| | | | |
Increase (decrease) in net assets derived from capital share transactions | | | 5,349,049 | | | | (5,988,747 | ) |
| | | | |
Net increase (decrease) in net assets | | | 21,851,532 | | | | (14,804,309 | ) |
| | |
| Net Assets | | | | | | | | |
Beginning of year | | | 237,988,729 | | | | 252,793,038 | |
| | | | |
End of year | | $ | 259,840,261 | | | $ | 237,988,729 | |
| | | | |
Undistributed net investment income at end of year | | $ | 2,693,832 | | | $ | 2,060,338 | |
| | | | |
| | | | | | |
The notes to the financial statements are an integral part of,
and should be read in conjunction with, the financial statements. | | mainstayinvestments.com | | | M-205 | |
Financial Highlights selected per share data and ratios
| | | | | | | | | | | | | | | | | | | | |
| | | Initial Class | |
| | | Year ended December 31, | |
| | | 2012 | | | 2011 | | | 2010 | | | 2009 | | | 2008 | |
Net asset value at beginning of year | | $ | 9.47 | | | $ | 9.83 | | | $ | 8.64 | | | $ | 7.02 | | | $ | 11.69 | |
| | | | | | | | | | | | | | | | | | | | |
Net investment income (loss) | | | 0.10 | | | | 0.10 | | | | 0.09 | (a) | | | 0.12 | (a) | | | 0.11 | (a) |
Net realized and unrealized gain (loss) on investments | | | 1.35 | | | | (0.37 | ) | | | 1.20 | | | | 1.83 | | | | (4.50 | ) |
| | | | | | | | | | | | | | | | | | | | |
Total from investment operations | | | 1.45 | | | | (0.27 | ) | | | 1.29 | | | | 1.95 | | | | (4.39 | ) |
| | | | | | | | | | | | | | | | | | | | |
Less dividends and distributions: | | | | | | | | | | | | | | | | | | | | |
From net investment income | | | (0.11 | ) | | | (0.09 | ) | | | (0.10 | ) | | | (0.18 | ) | | | (0.07 | ) |
From net realized gain on investments | | | (0.70 | ) | | | — | | | | — | | | | (0.15 | ) | | | (0.21 | ) |
| | | | | | | | | | | | | | | | | | | | |
Total dividends and distributions | | | (0.81 | ) | | | (0.09 | ) | | | (0.10 | ) | | | (0.33 | ) | | | (0.28 | ) |
| | | | | | | | | | | | | | | | | | | | |
Net asset value at end of year | | $ | 10.11 | | | $ | 9.47 | | | $ | 9.83 | | | $ | 8.64 | | | $ | 7.02 | |
| | | | | | | | | | | | | | | | | | | | |
Total investment return | | | 15.47 | % | | | (2.65 | %) | | | 15.03 | % | | | 28.04 | % | | | (37.58 | %) |
Ratios (to average net assets)/Supplemental Data: | | | | | | | | | | | | | | | | | | | | |
Net investment income (loss) | | | 0.92 | % | | | 0.99 | % | | | 1.03 | % | | | 1.56 | % | | | 1.14 | % |
Net expenses (b) | | | 0.04 | % | | | 0.05 | % | | | 0.06 | % | | | 0.06 | % | | | 0.07 | % |
Portfolio turnover rate | | | 42 | % | | | 54 | % | | | 48 | % | | | 47 | % | | | 42 | % |
Net assets at end of year (in 000’s) | | $ | 31,447 | | | $ | 27,003 | | | $ | 30,384 | | | $ | 24,774 | | | $ | 15,699 | |
| (a) | Per share data based on average shares outstanding during the year. |
| (b) | In addition to the fees and expenses which the Portfolio bears directly, the Portfolio indirectly bears a pro-rata share of the fees and expenses of the Underlying Portfolios/Funds in which it invests. Such indirect expenses are not included in the above expense ratios. |
| | | | | | | | | | | | | | | | | | | | |
| | | Service Class | |
| | | Year ended December 31, | |
| | | 2012 | | | 2011 | | | 2010 | | | 2009 | | | 2008 | |
Net asset value at beginning of year | | $ | 9.44 | | | $ | 9.80 | | | $ | 8.62 | | | $ | 7.00 | | | $ | 11.67 | |
| | | | | | | | | | | | | | | | | | | | |
Net investment income (loss) | | | 0.06 | | | | 0.08 | | | | 0.07 | (a) | | | 0.10 | (a) | | | 0.09 | (a) |
Net realized and unrealized gain (loss) on investments | | | 1.36 | | | | (0.37 | ) | | | 1.20 | | | | 1.83 | | | | (4.50 | ) |
| | | | | | | | | | | | | | | | | | | | |
Total from investment operations | | | 1.42 | | | | (0.29 | ) | | | 1.27 | | | | 1.93 | | | | (4.41 | ) |
| | | | | | | | | | | | | | | | | | | | |
Less dividends and distributions: | | | | | | | | | | | | | | | | | | | | |
From net investment income | | | (0.08 | ) | | | (0.07 | ) | | | (0.09 | ) | | | (0.16 | ) | | | (0.05 | ) |
From net realized gain on investments | | | (0.70 | ) | | | — | | | | — | | | | (0.15 | ) | | | (0.21 | ) |
| | | | | | | | | | | | | | | | | | | | |
Total dividends and distributions | | | (0.78 | ) | | | (0.07 | ) | | | (0.09 | ) | | | (0.31 | ) | | | (0.26 | ) |
| | | | | | | | | | | | | | | | | | | | |
Net asset value at end of year | | $ | 10.08 | | | $ | 9.44 | | | $ | 9.80 | | | $ | 8.62 | | | $ | 7.00 | |
| | | | | | | | | | | | | | | | | | | | |
Total investment return | | | 15.18 | % | | | (2.89 | %) | | | 14.75 | % | | | 27.72 | % | | | (37.75 | %) |
Ratios (to average net assets)/Supplemental Data: | | | | | | | | | | | | | | | | | | | | |
Net investment income (loss) | | | 0.65 | % | | | 0.78 | % | | | 0.77 | % | | | 1.29 | % | | | 0.90 | % |
Net expenses (b) | | | 0.29 | % | | | 0.30 | % | | | 0.31 | % | | | 0.31 | % | | | 0.32 | % |
Portfolio turnover rate | | | 42 | % | | | 54 | % | | | 48 | % | | | 47 | % | | | 42 | % |
Net assets at end of year (in 000’s) | | $ | 228,393 | | | $ | 210,986 | | | $ | 222,409 | | | $ | 186,844 | | | $ | 134,981 | |
| (a) | Per share data based on average shares outstanding during the year. |
| (b) | In addition to the fees and expenses which the Portfolio bears directly, the Portfolio indirectly bears a pro-rata share of the fees and expenses of the Underlying Portfolios/Funds in which it invests. Such indirect expenses are not included in the above expense ratios. |
| | | | |
| M-206 | | MainStay VP Growth Allocation Portfolio | | The notes to the financial statements are an integral part of,
and should be read in conjunction with, the financial statements. |
MainStay VP Growth Equity Portfolio
Investment and Performance Comparison (Unaudited)
Performance data quoted represents past performance. Past performance is no guarantee of future results. Because of market volatility, current performance may be lower or higher than the figures shown. Investment return and principal value will fluctuate, and as a result, when shares are redeemed, they may be worth more or less than their original cost. The performance table and graph do not reflect any deduction of sales charges, mortality and expense charges, contract charges or administrative charges. Please refer to the Performance Summary appropriate for your policy. For performance information current to the most recent month-end, please call 800-598-2019 or visit www.newyorklife.com.
Average Annual Total Returns for the Year Ended December 31, 2012
| | | | | | | | | | | | | | | | | | | | |
| Class | | One Year | | | Five Years | | | Ten Years1 | | | Gross
Expense Ratio2 | |
| Initial Class Shares | | | 14.94 | % | | | 0.85 | % | | | 5.79 | % | | | 0.66 | % |
| Service Class Shares3 | | | 14.66 | | | | 0.60 | | | | 5.53 | | | | 0.91 | |
| | | | | | | | | | | | |
| Benchmark Performance | | One
Year | | | Five
Years | | | Ten
Years | |
Russell 1000® Growth Index4 | | | 15.26 | % | | | 3.12 | % | | | 7.52 | % |
| Average Lipper Variable Products Large-Cap Growth Portfolio5 | | | 16.00 | | | | 1.45 | | | | 7.23 | |
| 1. | Performance figures shown for the ten-year period ended December 31, 2012 reflect nonrecurring reimbursements from affiliates for printing and mailing costs. If these nonrecurring reimbursements had not been made, the total returns would have been 5.77% for Initial Class shares and 5.51% for Service Class shares for the ten-year period. |
| 2. | The gross expense ratios presented reflect the Portfolio’s “Total Annual Portfolio Operating Expenses” from the most recent Prospectus and may differ from other expense ratios disclosed in this report. |
| 3. | Performance for Service Class shares, first offered June 5, 2003, includes the historical performance of Initial Class shares through June 4, 2003 adjusted to reflect the fees and expenses of Service Class shares. |
| 4. | Please refer to pages M-2 and M-3 for additional explanations and disclosure regarding the Portfolios, their benchmark indices and other indices mentioned in the reports. |
| 5. | The Average Lipper Variable Products Large-Cap Growth Portfolio is representative of portfolios that, by portfolio practice, invest at least 75% of their equity assets in companies with market capitalizations (on a three-year weighted basis) above Lipper’s U.S. diversified equity large-cap floor. Large-cap growth portfolios typically have an above-average price-to-earnings ratio, price-to-book ratio, and three-year sales-per-share growth value compared to the S&P 500® Index. Lipper Inc. is an independent monitor of fund performance. Results are based on total returns with all dividend and capital gain distributions reinvested. |
| | |
| mainstayinvestments.com | | M-207 |
Cost in Dollars of a $1,000 Investment in MainStay VP Growth Equity Portfolio (Unaudited)
The example below is intended to describe the fees and expenses borne by shareholders during the six-month period from July 1, 2012 to December 31, 2012, and the impact of those costs on your investment.
Example
As a shareholder of the Portfolio, you incur two types of costs: (1) transaction costs, including exchange fees and sales charges (loads) on purchases (as applicable), and (2) ongoing costs, including management fees, distribution and/or service (12b-1) fees, and other Portfolio expenses (as applicable). This example is intended to help you understand your ongoing costs (in dollars) of investing in the Portfolio and to compare these costs with the ongoing costs of investing in other Portfolios. The example is based on an investment of $1,000 made at the beginning of the six-month period and held for the entire period from July 1, 2012, to December 31, 2012. Shares are only sold in connection with variable life and annuity contracts and the example does not reflect any contract level or transactional fees or expenses. If these costs had been included, your costs would have been higher.
This example illustrates your Portfolio’s ongoing costs in two ways:
Actual Expenses
The second and third data columns in the table below provide information about actual account values and actual expenses. You may use the information in these columns, together with the amount you invested, to estimate the
expenses that you paid during the six months ended December 31, 2012. Simply divide your account value by $1,000 (for example, an $8,600 account value divided by $1,000 = 8.6), then multiply the result by the number under the heading entitled ‘‘Expenses Paid During Period’’ to estimate the expenses you paid on your account during this period.
Hypothetical Example for Comparison Purposes
The fourth and fifth data columns in the table below provide information about hypothetical account values and hypothetical expenses based on the Portfolio’s actual expense ratio and an assumed rate of return of 5% per year before expenses, which is not the Portfolio’s actual return. The hypothetical account values and expenses may not be used to estimate the actual ending account balances or expenses you paid for the six-month period shown. You may use this information to compare the ongoing costs of investing in the Portfolio with the ongoing costs of investing in other Portfolios. To do so, compare this 5% hypothetical example with the 5% hypothetical examples that appear in the shareholder reports of the other Portfolios.
Please note that the expenses shown in the table are meant to highlight your ongoing costs only and do not reflect any transactional costs, such as exchange fees or sales charges (loads). Therefore, the fourth and fifth data columns of the table are useful in comparing ongoing costs only and will not help you determine the relative total costs of owning different funds. In addition, if these transactional costs were included, your costs would have been higher.
| | | | | | | | | | | | | | | | | | | | |
| | | | | | | | | | | | | | | | |
| Share Class | | Beginning
Account
Value
7/1/12 | | | Ending Account
Value (Based
on Actual
Returns and
Expenses)
12/31/12 | | | Expenses
Paid
During
Period1 | | | Ending Account
Value (Based
on Hypothetical
5% Annualized
Return and
Actual Expenses)
12/31/12 | | | Expenses
Paid
During
Period1 | |
| | | | | |
| Initial Class Shares | | $ | 1,000.00 | | | $ | 1,046.20 | | | $ | 3.29 | | | $ | 1,021.90 | | | $ | 3.25 | |
| | | | | |
| Service Class Shares | | $ | 1,000.00 | | | $ | 1,044.90 | | | $ | 4.63 | | | $ | 1,020.60 | | | $ | 4.57 | |
| 1. | Expenses are equal to the Portfolio’s annualized expense ratio of each class (0.64% for Initial Class and 0.90% for Service Class) multiplied by the average account value over the period, divided by 366 and multiplied by 184 (to reflect the six-month period). The table above represents the actual expenses incurred during the six-month period. |
| | |
| M-208 | | MainStay VP Growth Equity Portfolio |
Industry Composition as of December 31, 2012 (Unaudited)
| | | | |
| Computers & Peripherals | | | 9.0 | % |
| IT Services | | | 7.1 | |
| Chemicals | | | 5.5 | |
| Internet Software & Services | | | 4.9 | |
| Pharmaceuticals | | | 4.9 | |
| Aerospace & Defense | | | 4.6 | |
| Software | | | 4.1 | |
| Health Care Providers & Services | | | 4.0 | |
| Health Care Equipment & Supplies | | | 3.7 | |
| Oil, Gas & Consumable Fuels | | | 3.6 | |
| Internet & Catalog Retail | | | 3.5 | |
| Specialty Retail | | | 3.5 | |
| Tobacco | | | 3.5 | |
| Textiles, Apparel & Luxury Goods | | | 3.3 | |
| Communications Equipment | | | 2.9 | |
| Food Products | | | 2.5 | |
| Biotechnology | | | 2.2 | |
| Real Estate Investment Trusts | | | 2.2 | |
| Road & Rail | | | 2.2 | |
| | | | |
| Multiline Retail | | | 1.9 | % |
| Professional Services | | | 1.9 | |
| Semiconductors & Semiconductor Equipment | | | 1.9 | |
| Industrial Conglomerates | | | 1.8 | |
| Media | | | 1.7 | |
| Hotels, Restaurants & Leisure | | | 1.5 | |
| Personal Products | | | 1.5 | |
| Consumer Finance | | | 1.4 | |
| Health Care Technology | | | 1.2 | |
| Commercial Services & Supplies | | | 1.1 | |
| Diversified Financial Services | | | 1.1 | |
| Electrical Equipment | | | 1.0 | |
| Trading Companies & Distributors | | | 0.9 | |
| Energy Equipment & Services | | | 0.8 | |
| Metals & Mining | | | 0.5 | |
| Short-Term Investments | | | 2.6 | |
| Other Assets, Less Liabilities | | | 0.0 | ‡ |
| | | | |
| | | 100.0 | % |
| | | | |
See Portfolio of Investments beginning on page M-211 for specific holdings within these categories.
| ‡ | Less than one-tenth of a percent. |
Top Ten Holdings as of December 31, 2012 (excluding short-term investments) (Unaudited)
| 2. | Philip Morris International, Inc. |
| | | | |
| mainstayinvestments.com | | | M-209 | |
Portfolio Management Discussion and Analysis (Unaudited)
Answers to the questions reflect the views of portfolio managers Harish Kumar, PhD, CFA, and Martin J. Mickus, CFA, of Madison Square Investors LLC,1 the Portfolio’s Subadvisor.
How did MainStay VP Growth Equity Portfolio perform relative to its peers and its benchmark during the 12 months ended December 31, 2012?
For the 12 months ended December 31, 2012, MainStay VP Growth Equity Portfolio returned 14.94% for Initial Class shares and 14.66% for Service Class shares. Both share classes underperformed the 16.00% return of the average Lipper2 Variable Prod-
ucts Large-Cap Growth Portfolio and the 15.26% return of the Russell 1000® Growth Index2 for the 12 months ended December 31, 2012. The Russell 1000® Growth Index is the Portfolio’s broad-based securities-market index.
Were there any changes to the Portfolio during the reporting period?
At a meeting held on September 24–25, 2012, the Board of Trustees of MainStay VP Funds Trust approved certain matters with respect to the Portfolio. These matters are subject to policy holder approval and included a change in Subadvisor; change in Portfolio Name, Principal Investment Strategies and Investment Process; and an amendment to the Portfolio’s Management Agreement. For more infor-
mation on these changes, please consult the Supplements dated September 25, 2012, and January 11, 2013, to the Prospectus dated May 1, 2012, as supplemented.
What factors affected the Portfolio’s relative performance during the reporting period?
The Portfolio underperformed the Russell 1000® Growth Index largely because of stock selection resulting from the fact that intra-stock correlations were higher than normal, which made stock picking more difficult. Even so, the Portfolio benefited from favorable stock selection and positive exposure to valuation and sentiment factors that helped relative returns.
Which sectors were the strongest positive contributors to the Portfolio’s relative performance, and which sectors were particularly weak?
Information technology, industrials and consumer discretionary were the strongest positive-contributing sectors relative to the Russell 1000® Growth Index. (Contributions take weightings and total returns into account.) Stock selection was the primary driver in all three sectors. Health care, materials and consumer staples were the weakest sectors relative to the Index.
Again, stock selection was the primary driver within these sectors.
During the reporting period, which individual stocks made the strongest positive contributions to the Portfolio’s absolute performance, and which stocks detracted the most?
Internet software & services company eBay, apparel and accessories company Michael Kors Holdings, Ltd., and hospital chain HCA Holdings made the strongest positive contributions to the Portfolio��s absolute per-
formance during the reporting period. Global oil & gas equipment & services company FMC Technologies and electronic payment solutions company Verifone Systems were the Portfolio’s weakest absolute performers.
Did the Portfolio make any significant purchases or sales during the reporting period?
The Portfolio made purchases in health care company Johnson & Johnson and Internet software & services company eBay. During the reporting period, the Portfolio sold shares of Cognizant Technology Solutions and TD Ameritrade Holding. The Portfolio purchased Johnson & Johnson because we believed that the stock was attractively valued, the company had survived most of its patent cliff, and it had a good pipeline of products. The Portfolio purchased eBay seeking to benefit from the growth of PayPal and online commerce. The Portfolio sold Cognizant Technology Solutions because of slowing growth in the company’s outsourcing business. The Portfolio sold TD Ameritrade Holding when the company faced headwinds because of persistently low interest rates.
How did the Portfolio’s sector weightings change during the reporting period?
During the reporting period, the Portfolio’s sector weightings increased in health care and materials. Over the same period, the Portfolio’s sector weightings decreased in energy and consumer discretionary.
How was the Portfolio positioned at the end of the reporting period?
As of December 31, 2012, the portfolio was slightly overweight in the health care and materials sectors. As of the same date, the Portfolio was slightly under weight in the consumer staples and telecommuni- cation services sectors.
| 1. | Effective January 11, 2013, Cornerstone Capital Management LLC became the Subadvisor for the Portfolio. |
| 2. | Please refer to pages M-2 and M-3 for additional explanations and disclosure regarding the Portfolios, their benchmark indices and service providers mentioned in the reports. |
The opinions expressed are those of the portfolio managers as of the date of this report and are subject to change. There is no guarantee that any forecasts made will come to pass. This material does not constitute investment advice and is not intended as an endorsement of any specific investment.
Not all MainStay VP Portfolios and/or share classes are available under all policies.
| | |
| M-210 | | MainStay VP Growth Equity Portfolio |
Portfolio of Investments December 31, 2012
| | | | | | | | |
| | |
| | | Shares | | | Value | |
| | | | | | | | |
| Common Stocks 97.4%† | | | | | | | | |
Aerospace & Defense 4.6% | | | | | | | | |
Precision Castparts Corp. | | | 37,896 | | | $ | 7,178,261 | |
TransDigm Group, Inc. | | | 49,803 | | | | 6,791,137 | |
United Technologies Corp. | | | 66,586 | | | | 5,460,718 | |
| | | | | | | | |
| | | | | | | 19,430,116 | |
| | | | | | | | |
Biotechnology 2.2% | | | | | | | | |
Alexion Pharmaceuticals, Inc. (a) | | | 41,936 | | | | 3,934,016 | |
Celgene Corp. (a) | | | 70,069 | | | | 5,515,832 | |
| | | | | | | | |
| | | | | | | 9,449,848 | |
| | | | | | | | |
Chemicals 5.5% | | | | | | | | |
Ecolab, Inc. | | | 87,865 | | | | 6,317,494 | |
Monsanto Co. | | | 93,699 | | | | 8,868,610 | |
Potash Corp. of Saskatchewan, Inc. | | | 51,186 | | | | 2,082,758 | |
Praxair, Inc. | | | 54,764 | | | | 5,993,920 | |
| | | | | | | | |
| | | | | | | 23,262,782 | |
| | | | | | | | |
Commercial Services & Supplies 1.1% | | | | | | | | |
Tyco International, Ltd. | | | 156,441 | | | | 4,575,899 | |
| | | | | | | | |
| | |
Communications Equipment 2.9% | | | | | | | | |
¨QUALCOMM, Inc. | | | 195,049 | | | | 12,096,939 | |
| | | | | | | | |
| | |
Computers & Peripherals 9.0% | | | | | | | | |
¨Apple, Inc. (b) | | | 58,045 | | | | 30,939,726 | |
EMC Corp. (a) | | | 283,772 | | | | 7,179,432 | |
| | | | | | | | |
| | | | | | | 38,119,158 | |
| | | | | | | | |
Consumer Finance 1.4% | | | | | | | | |
American Express Co. | | | 106,137 | | | | 6,100,755 | |
| | | | | | | | |
| | |
Diversified Financial Services 1.1% | | | | | | | | |
IntercontinentalExchange, Inc. (a) | | | 36,007 | | | | 4,458,027 | |
| | | | | | | | |
| | |
Electrical Equipment 1.0% | | | | | | | | |
AMETEK, Inc. | | | 109,763 | | | | 4,123,796 | �� |
| | | | | | | | |
| | |
Energy Equipment & Services 0.8% | | | | | | | | |
FMC Technologies, Inc. (a) | | | 82,599 | | | | 3,537,715 | |
| | | | | | | | |
| | |
Food Products 2.5% | | | | | | | | |
Kraft Foods Group, Inc. | | | 60,724 | | | | 2,761,120 | |
Mead Johnson Nutrition Co. | | | 67,915 | | | | 4,474,920 | |
Mondelez International, Inc. Class A | | | 123,253 | | | | 3,139,254 | |
| | | | | | | | |
| | | | | | | 10,375,294 | |
| | | | | | | | |
| | | | | | | | |
| | |
| | | Shares | | | Value | |
| | | | | | | | |
Health Care Equipment & Supplies 3.7% | | | | | | | | |
Covidien PLC | | | 124,342 | | | $ | 7,179,507 | |
St. Jude Medical, Inc. | | | 99,319 | | | | 3,589,388 | |
Varian Medical Systems, Inc. (a) | | | 71,832 | | | | 5,045,480 | |
| | | | | | | | |
| | | | | | | 15,814,375 | |
| | | | | | | | |
Health Care Providers & Services 4.0% | | | | | | | | |
Express Scripts Holding Co. (a) | | | 131,440 | | | | 7,097,760 | |
HCA Holdings, Inc. | | | 154,020 | | | | 4,646,784 | |
UnitedHealth Group, Inc. | | | 92,467 | | | | 5,015,410 | |
| | | | | | | | |
| | | | | | | 16,759,954 | |
| | | | | | | | |
Health Care Technology 1.2% | | | | | | | | |
Cerner Corp. (a) | | | 63,881 | | | | 4,959,721 | |
| | | | | | | | |
| | |
Hotels, Restaurants & Leisure 1.5% | | | | | | | | |
Starbucks Corp. | | | 117,130 | | | | 6,280,511 | |
| | | | | | | | |
| | |
Industrial Conglomerates 1.8% | | | | | | | | |
Danaher Corp. | | | 134,177 | | | | 7,500,494 | |
| | | | | | | | |
| | |
Internet & Catalog Retail 3.5% | | | | | | | | |
¨Amazon.com, Inc. (a) | | | 37,409 | | | | 9,394,896 | |
Priceline.com, Inc. (a) | | | 8,370 | | | | 5,199,444 | |
| | | | | | | | |
| | | | | | | 14,594,340 | |
| | | | | | | | |
Internet Software & Services 4.9% | | | | | | | | |
eBay, Inc. (a) | | | 135,258 | | | | 6,900,863 | |
¨Google, Inc. Class A (a) | | | 19,359 | | | | 13,732,694 | |
| | | | | | | | |
| | | | | | | 20,633,557 | |
| | | | | | | | |
IT Services 7.1% | | | | | | | | |
Accenture PLC Class A | | | 74,424 | | | | 4,949,196 | |
Genpact, Ltd. | | | 227,506 | | | | 3,526,343 | |
Teradata Corp. (a) | | | 80,193 | | | | 4,963,145 | |
VeriFone Systems, Inc. (a) | | | 97,885 | | | | 2,905,227 | |
¨Visa, Inc. Class A | | | 88,384 | | | | 13,397,246 | |
| | | | | | | | |
| | | | | | | 29,741,157 | |
| | | | | | | | |
Media 1.7% | | | | | | | | |
DIRECTV (a) | | | 140,524 | | | | 7,048,684 | |
| | | | | | | | |
| | |
Metals & Mining 0.5% | | | | | | | | |
Cliffs Natural Resources, Inc. | | | 55,380 | | | | 2,135,453 | |
| | | | | | | | |
| | |
Multiline Retail 1.9% | | | | | | | | |
Dollar Tree, Inc. (a) | | | 115,032 | | | | 4,665,698 | |
Macy’s, Inc. | | | 82,225 | | | | 3,208,419 | |
| | | | | | | | |
| | | | | | | 7,874,117 | |
| | | | | | | | |
| † | Percentages indicated are based on Portfolio net assets. |
| ¨ | | Among the Portfolio’s 10 largest holdings, as of December 31, 2012, excluding short-term investments. May be subject to change daily. |
| | | | | | |
The notes to the financial statements are an integral part of,
and should be read in conjunction with, the financial statements. | | mainstayinvestments.com | | | M-211 | |
Portfolio of Investments December 31, 2012 (continued)
| | | | | | | | |
| | |
| | | Shares | | | Value | |
| | | | | | | | |
| Common Stocks (continued) | |
Oil, Gas & Consumable Fuels 3.6% | | | | | | | | |
Noble Energy, Inc. | | | 51,137 | | | $ | 5,202,678 | |
Occidental Petroleum Corp. | | | 36,225 | | | | 2,775,197 | |
Pioneer Natural Resources Co. | | | 47,273 | | | | 5,038,829 | |
Southwestern Energy Co. (a) | | | 69,389 | | | | 2,318,286 | |
| | | | | | | | |
| | | | | | | 15,334,990 | |
| | | | | | | | |
Personal Products 1.5% | | | | | | | | |
Estee Lauder Cos., Inc. (The) Class A | | | 103,844 | | | | 6,216,102 | |
| | | | | | | | |
| | |
Pharmaceuticals 4.9% | | | | | | | | |
Johnson & Johnson | | | 118,859 | | | | 8,332,016 | |
Perrigo Co. | | | 30,617 | | | | 3,185,086 | |
Shire PLC, Sponsored ADR (c) | | | 38,850 | | | | 3,581,193 | |
Valeant Pharmaceuticals International, Inc. (a) | | | 96,152 | | | | 5,747,005 | |
| | | | | | | | |
| | | | | | | 20,845,300 | |
| | | | | | | | |
Professional Services 1.9% | | | | | | | | |
Equifax, Inc. | | | 73,889 | | | | 3,998,873 | |
Verisk Analytics, Inc. Class A (a) | | | 82,179 | | | | 4,191,129 | |
| | | | | | | | |
| | | | | | | 8,190,002 | |
| | | | | | | | |
Real Estate Investment Trusts 2.2% | | | | | | | | |
¨American Tower Corp. | | | 119,206 | | | | 9,211,048 | |
| | | | | | | | |
| | |
Road & Rail 2.2% | | | | | | | | |
¨Union Pacific Corp. | | | 74,914 | | | | 9,418,188 | |
| | | | | | | | |
| |
Semiconductors & Semiconductor Equipment 1.9% | | | | | |
Altera Corp. | | | 110,866 | | | | 3,818,225 | |
Texas Instruments, Inc. | | | 142,230 | | | | 4,400,596 | |
| | | | | | | | |
| | | | | | | 8,218,821 | |
| | | | | | | | |
Software 4.1% | | | | | | | | |
Check Point Software Technologies, Ltd. (a) | | | 64,394 | | | | 3,067,730 | |
Citrix Systems, Inc. (a) | | | 63,922 | | | | 4,202,872 | |
¨Oracle Corp. | | | 302,060 | | | | 10,064,639 | |
| | | | | | | | |
| | | | | | | 17,335,241 | |
| | | | | | | | |
Specialty Retail 3.5% | | | | | | | | |
¨Home Depot, Inc. (The) | | | 177,756 | | | | 10,994,208 | |
O’Reilly Automotive, Inc. (a) | | | 39,828 | | | | 3,561,420 | |
| | | | | | | | |
| | | | | | | 14,555,628 | |
| | | | | | | | |
Textiles, Apparel & Luxury Goods 3.3% | | | | | | | | |
Michael Kors Holdings, Ltd. (a) | | | 83,159 | | | | 4,243,604 | |
NIKE, Inc. Class B | | | 118,690 | | | | 6,124,404 | |
VF Corp. | | | 24,480 | | | | 3,695,745 | |
| | | | | | | | |
| | | | | | | 14,063,753 | |
| | | | | | | | |
Tobacco 3.5% | | | | | | | | |
¨Philip Morris International, Inc. | | | 178,045 | | | | 14,891,684 | |
| | | | | | | | |
| | | | | | | | |
| | |
| | | Shares | | | Value | |
| | | | | | | | |
Trading Companies & Distributors 0.9% | | | | | |
United Rentals, Inc. (a) | | | 82,112 | | | $ | 3,737,738 | |
| | | | | | | | |
Total Common Stocks
(Cost $330,576,699) | | | | | | | 410,891,187 | |
| | | | | | | | |
| | |
| | | | | | | | |
| | | Principal
Amount | | | | |
| | | | | | | | |
| Short-Term Investments 2.6% | | | | | |
Repurchase Agreement 0.0%‡ | | | | | | | | |
State Street Bank and Trust Co.
0.01%, dated 12/31/12
due 1/2/13
Proceeds at Maturity $53,213 (Collateralized by a Federal Home Loan Mortgage Corp. security with a rate of 2.07% and a maturity date of 11/7/22, with a Principal Amount of $55,000 and a Market Value of $54,493) | | $ | 53,213 | | | | 53,213 | |
| | | | | | | | |
Total Repurchase Agreement
(Cost $53,213) | | | | | | | 53,213 | |
| | | | | | | | |
| | |
U.S. Government 2.6% | | | | | | | | |
United States Treasury Bills | | | | | | | | |
0.059%, due 1/10/13 (d) | | | 10,400,000 | | | | 10,399,838 | |
0.091%, due 1/24/13 (b)(d) | | | 400,000 | | | | 399,976 | |
| | | | | | | | |
Total U.S. Government
(Cost $10,799,814) | | | | | | | 10,799,814 | |
| | | | | | | | |
Total Short-Term Investments
(Cost $10,853,027) | | | | | | | 10,853,027 | |
| | | | | | | | |
Total Investments
(Cost $341,429,726) (f) | | | 100.0 | % | | | 421,744,214 | |
Other Assets, Less Liabilities | | | 0.0 | ‡ | | | 66,738 | |
| | | | | | | | |
Net Assets | | | 100.0 | % | | $ | 421,810,952 | |
| | | | | | | | |
| | |
| | | | | | | | |
| | | Contracts
Long | | | Unrealized
Appreciation
(Depreciation)(e) | |
| Futures Contracts (0.0%)‡ | | | | | | | | |
Standard & Poor’s 500 Index Mini March 2013 | | | 93 | | | $ | (56,918 | ) |
| | | | | | | | |
Total Futures Contracts
(Settlement Value $6,603,465) | | | | | | $ | (56,918 | ) |
| | | | | | | | |
| ‡ | Less than one-tenth of a percent. |
| | | | |
| M-212 | | MainStay VP Growth Equity Portfolio | | The notes to the financial statements are an integral part of,
and should be read in conjunction with, the financial statements. |
| (a) | Non-income producing security. |
| (b) | Represents a security, or a portion thereof, which is maintained at a broker as collateral for futures contracts. |
| (c) | ADR—American Depositary Receipt. |
| (d) | Interest rate presented is yield to maturity. |
| (e) | Represents the difference between the value of the contracts at the time they were opened and the value as of December 31, 2012. |
| (f) | As of December 31, 2012, cost is $341,601,633 for federal income tax purposes and net unrealized appreciation is as follows: |
| | | | |
Gross unrealized appreciation | | $ | 87,440,254 | |
Gross unrealized depreciation | | | (7,297,673 | ) |
| | | | |
Net unrealized appreciation | | $ | 80,142,581 | |
| | | | |
The following is a summary of the fair valuations according to the inputs used as of December 31, 2012, for valuing the Portfolio’s assets and liabilities.
Asset Valuation Inputs
| | | | | | | | | | | | | | | | |
Description | | Quoted Prices
in Active Markets
for Identical Assets (Level 1) | | | Significant Other
Observable Inputs
(Level 2) | | | Significant
Unobservable
Inputs
(Level 3) | | | Total | |
| Investments in Securities (a) | | | | | | | | | | | | | | | | |
| Common Stocks | | $ | 410,891,187 | | | $ | — | | | $ | — | | | $ | 410,891,187 | |
| Short-Term Investments | | | | | | | | | | | | | | | | |
Repurchase Agreement | | | — | | | | 53,213 | | | | — | | | | 53,213 | |
U.S. Government | | | — | | | | 10,799,814 | | | | — | | | | 10,799,814 | |
| | | | | | | | | | | | | | | | |
| Total Short-Term Investments | | | — | | | | 10,853,027 | | | | — | | | | 10,853,027 | |
| | | | | | | | | | | | | | | | |
| Total Investments in Securities | | $ | 410,891,187 | | | $ | 10,853,027 | | | $ | — | | | $ | 421,744,214 | |
| | | | | | | | | | | | | | | | |
| | | | |
| Liability Valuation Inputs | | | | | | | | | | | | | | | | |
Description | | Quoted Prices
in Active Markets
for Identical Assets
(Level 1) | | | Significant Other
Observable Inputs
(Level 2) | | | Significant
Unobservable
Inputs
(Level 3) | | | Total | |
| Other Financial Instruments | | | | | | | | | | | | | | | | |
Futures Contracts Long (b) | | $ | (56,918 | ) | | $ | — | | | $ | — | | | $ | (56,918 | ) |
| | | | | | | | | | | | | | | | |
| Total Other Financial Instruments | | $ | (56,918 | ) | | $ | — | | | $ | — | | | $ | (56,918 | ) |
| | | | | | | | | | | | | | | | |
| (a) | For a complete listing of investments and their industries, see the Portfolio of Investments. |
| (b) | The value listed for these securities reflects unrealized appreciation (depreciation) as shown on the Portfolio of Investments. |
The Portfolio recognizes transfers between the levels as of the beginning of the period.
For the year ended December 31, 2012, the Portfolio did not have any transfers between Level 1 and Level 2 fair value measurements. (See Note 2)
As of December 31, 2012, the Portfolio did not hold any investments with significant unobservable inputs (Level 3). (See Note 2)
| | | | | | |
The notes to the financial statements are an integral part of,
and should be read in conjunction with, the financial statements. | | mainstayinvestments.com | | | M-213 | |
Statement of Assets and Liabilities as of December 31, 2012
| | | | |
| Assets | | | | |
Investment in securities, at value
(identified cost $341,429,726) | | $ | 421,744,214 | |
Receivables: | | | | |
Dividends and interest | | | 309,077 | |
Variation margin on futures contracts | | | 175,202 | |
Fund shares sold | | | 59,083 | |
Other assets | | | 474 | |
| | | | |
Total assets | | | 422,288,050 | |
| | | | |
| |
| Liabilities | | | | |
Payables: | | | | |
Manager (See Note 3) | | | 217,856 | |
Fund shares redeemed | | | 174,986 | |
Professional fees | | | 35,970 | |
Shareholder communication | | | 34,657 | |
NYLIFE Distributors (See Note 3) | | | 11,311 | |
Custodian | | | 1,707 | |
Trustees | | | 611 | |
| | | | |
Total liabilities | | | 477,098 | |
| | | | |
Net assets | | $ | 421,810,952 | |
| | | | |
| |
| Net Assets Consist of | | | | |
Shares of beneficial interest outstanding (par value of $.001 per share) unlimited number of shares authorized | | $ | 15,270 | |
Additional paid-in capital | | | 368,747,436 | |
| | | | |
| | | 368,762,706 | |
Undistributed net investment income | | | 4,350,401 | |
Accumulated net realized gain (loss) on investments, futures transactions and foreign currency transactions | | | (31,559,725 | ) |
Net unrealized appreciation (depreciation) on investments and futures contracts | | | 80,257,570 | |
| | | | |
Net assets | | $ | 421,810,952 | |
| | | | |
| | | | |
Initial Class | | | | |
Net assets applicable to outstanding shares | | $ | 368,442,240 | |
| | | | |
Shares of beneficial interest outstanding | | | 13,330,411 | |
| | | | |
Net asset value per share outstanding | | $ | 27.64 | |
| | | | |
Service Class | | | | |
Net assets applicable to outstanding shares | | $ | 53,368,712 | |
| | | | |
Shares of beneficial interest outstanding | | | 1,939,499 | |
| | | | |
Net asset value per share outstanding | | $ | 27.52 | |
| | | | |
| | | | |
| M-214 | | MainStay VP Growth Equity Portfolio | | The notes to the financial statements are an integral part of,
and should be read in conjunction with, the financial statements. |
Statement of Operations for the year ended December 31, 2012
| | | | |
| Investment Income (Loss) | | | | |
Income | | | | |
Dividends (a) | | $ | 7,309,744 | |
Interest | | | 7,093 | |
| | | | |
Total income | | | 7,316,837 | |
| | | | |
Expenses | | | | |
Manager (See Note 3) | | | 2,641,397 | |
Distribution and service—Service Class (See Note 3) | | | 129,795 | |
Shareholder communication | | | 69,648 | |
Professional fees | | | 58,422 | |
Trustees | | | 11,589 | |
Custodian | | | 9,306 | |
Miscellaneous | | | 15,499 | |
| | | | |
Total expenses | | | 2,935,656 | |
| | | | |
Net investment income (loss) | | | 4,381,181 | |
| | | | |
|
| Realized and Unrealized Gain (Loss) on Investments, Futures Contracts and Foreign Currency Transactions | |
Net realized gain (loss) on: | | | | |
Security transactions | | | 16,059,465 | |
Futures transactions | | | 948,720 | |
Foreign currency transactions | | | (30,770 | ) |
| | | | |
Net realized gain (loss) on investments, futures transactions and foreign currency transactions | | | 16,977,415 | |
| | | | |
Net change in unrealized appreciation (depreciation) on: | | | | |
Investments | | | 38,160,262 | |
Futures contracts | | | (164,688 | ) |
| | | | |
Net change in unrealized appreciation (depreciation) on investments and futures contracts | | | 37,995,574 | |
| | | | |
Net realized and unrealized gain (loss) on investments, futures transactions and foreign currency transactions | | | 54,972,989 | |
| | | | |
Net increase (decrease) in net assets resulting from operations | | $ | 59,354,170 | |
| | | | |
| (a) | Dividends recorded net of foreign withholding taxes in the amount of $5,318. |
| | | | | | |
The notes to the financial statements are an integral part of,
and should be read in conjunction with, the financial statements. | | mainstayinvestments.com | | | M-215 | |
Statements of Changes in Net Assets
for the years ended December 31, 2012 and December 31, 2011
| | | | | | | | |
| | | 2012 | | | 2011 | |
| Increase (Decrease) in Net Assets | | | | | |
Operations: | | | | | | | | |
Net investment income (loss) | | $ | 4,381,181 | | | $ | 1,662,424 | |
Net realized gain (loss) on investments, futures transactions and foreign currency transactions | | | 16,977,415 | | | | 24,400,414 | |
Net change in unrealized appreciation (depreciation) on investments and futures contracts | | | 37,995,574 | | | | (31,562,150 | ) |
| | | | |
Net increase (decrease) in net assets resulting from operations | | | 59,354,170 | | | | (5,499,312 | ) |
| | | | |
Dividends to shareholders: | | | | | | | | |
From net investment income: | | | | | | | | |
Initial Class | | | (1,542,898 | ) | | | (1,796,656 | ) |
Service Class | | | (100,260 | ) | | | (111,335 | ) |
| | | | |
Total dividends to shareholders | | | (1,643,158 | ) | | | (1,907,991 | ) |
| | | | |
Capital share transactions: | | | | | | | | |
Net proceeds from sale of shares | | | 16,008,453 | | | | 9,355,949 | |
Net asset value of shares issued to shareholders in reinvestment of dividends | | | 1,643,158 | | | | 1,907,991 | |
Cost of shares redeemed | | | (59,264,572 | ) | | | (64,035,251 | ) |
| | | | |
Increase (decrease) in net assets derived from capital share transactions | | | (41,612,961 | ) | | | (52,771,311 | ) |
| | | | |
Net increase (decrease) in net assets | | | 16,098,051 | | | | (60,178,614 | ) |
| | |
| Net Assets | | | | | | | | |
Beginning of year | | | 405,712,901 | | | | 465,891,515 | |
| | | | |
End of year | | $ | 421,810,952 | | | $ | 405,712,901 | |
| | | | |
Undistributed net investment income at end of year | | $ | 4,350,401 | | | $ | 1,643,148 | |
| | | | |
| | | | |
| M-216 | | MainStay VP Growth Equity Portfolio | | The notes to the financial statements are an integral part of,
and should be read in conjunction with, the financial statements. |
Financial Highlights selected per share data and ratios
| | | | | | | | | | | | | | | | | | | | |
| | | Initial Class | |
| | | Year ended December 31, | |
| | | 2012 | | | 2011 | | | 2010 | | | 2009 | | | 2008 | |
Net asset value at beginning of year | | $ | 24.14 | | | $ | 24.62 | | | $ | 22.04 | | | $ | 16.52 | | | $ | 27.23 | |
| | | | | | | | | | | | | | | | | | | | |
Net investment income (loss) | | | 0.31 | | | | 0.12 | | | | 0.13 | | | | 0.12 | | | | 0.10 | (a) |
Net realized and unrealized gain (loss) on investments | | | 3.30 | | | | (0.48 | ) | | | 2.57 | | | | 5.51 | | | | (10.68 | ) |
| | | | | | | | | | | | | | | | | | | | |
Total from investment operations | | | 3.61 | | | | (0.36 | ) | | | 2.70 | | | | 5.63 | | | | (10.58 | ) |
| | | | | | | | | | | | | | | | | | | | |
Less dividends: | | | | | | | | | | | | | | | | | | | | |
From net investment income | | | (0.11 | ) | | | (0.12 | ) | | | (0.12 | ) | | | (0.11 | ) | | | (0.13 | ) |
| | | | | | | | | | | | | | | | | | | | |
Net asset value at end of year | | $ | 27.64 | | | $ | 24.14 | | | $ | 24.62 | | | $ | 22.04 | | | $ | 16.52 | |
| | | | | | | | | | | | | | | | | | | | |
Total investment return | | | 14.94 | % | | | (1.37 | %) | | | 12.21 | % | | | 34.18 | % | | | (38.87 | %) |
Ratios (to average net assets)/Supplemental Data: | | | | | | | | | | | | | | | | | | | | |
Net investment income (loss) | | | 1.04 | % | | | 0.40 | % | | | 0.48 | % | | | 0.57 | % | | | 0.43 | % |
Net expenses | | | 0.65 | % | | | 0.66 | % | | | 0.65 | % | | | 0.68 | % | | | 0.64 | % |
Portfolio turnover rate | | | 42 | % | | | 97 | % | | | 126 | % | | | 157 | % | | | 54 | % |
Net assets at end of year (in 000’s) | | $ | 368,442 | | | $ | 361,067 | | | $ | 417,194 | | | $ | 423,086 | | | $ | 350,412 | |
| (a) | Per share data based on average shares outstanding during the year. |
| | | | | | | | | | | | | | | | | | | | |
| | | Service Class | |
| | | Year ended December 31, | |
| | | 2012 | | | 2011 | | | 2010 | | | 2009 | | | 2008 | |
Net asset value at beginning of year | | $ | 24.04 | | | $ | 24.52 | | | $ | 21.96 | | | $ | 16.45 | | | $ | 27.07 | |
| | | | | | | | | | | | | | | | | | | | |
Net investment income (loss) | | | 0.22 | | | | 0.04 | | | | 0.05 | | | | 0.05 | | | | 0.04 | (a) |
Net realized and unrealized gain (loss) on investments | | | 3.31 | | | | (0.46 | ) | | | 2.58 | | | | 5.51 | | | | (10.60 | ) |
| | | | | | | | | | | | | | | | | | | | |
Total from investment operations | | | 3.53 | | | | (0.42 | ) | | | 2.63 | | | | 5.56 | | | | (10.56 | ) |
| | | | | | | | | | | | | | | | | | | | |
Less dividends: | | | | | | | | | | | | | | | | | | | | |
From net investment income | | | (0.05 | ) | | | (0.06 | ) | | | (0.07 | ) | | | (0.05 | ) | | | (0.06 | ) |
| | | | | | | | | | | | | | | | | | | | |
Net asset value at end of year | | $ | 27.52 | | | $ | 24.04 | | | $ | 24.52 | | | $ | 21.96 | | | $ | 16.45 | |
| | | | | | | | | | | | | | | | | | | | |
Total investment return | | | 14.66 | % | | | (1.62 | %) | | | 11.93 | % | | | 33.85 | % | | | (39.03 | %) |
Ratios (to average net assets)/Supplemental Data: | | | | | | | | | | | | | | | | | | | | |
Net investment income (loss) | | | 0.82 | % | | | 0.15 | % | | | 0.23 | % | | | 0.32 | % | | | 0.18 | % |
Net expenses | | | 0.90 | % | | | 0.91 | % | | | 0.90 | % | | | 0.93 | % | | | 0.89 | % |
Portfolio turnover rate | | | 42 | % | | | 97 | % | | | 126 | % | | | 157 | % | | | 54 | % |
Net assets at end of year (in 000’s) | | $ | 53,369 | | | $ | 44,646 | | | $ | 48,698 | | | $ | 44,427 | | | $ | 36,228 | |
| (a) | Per share data based on average shares outstanding during the year. |
| | | | | | |
The notes to the financial statements are an integral part of,
and should be read in conjunction with, the financial statements. | | mainstayinvestments.com | | | M-217 | |
MainStay VP High Yield Corporate Bond Portfolio
Investment and Performance Comparison (Unaudited)
Performance data quoted represents past performance. Past performance is no guarantee of future results. Because of market volatility, current performance may be lower or higher than the figures shown. Investment return and principal value will fluctuate, and as a result, when shares are redeemed, they may be worth more or less than their original cost. The performance table and graph do not reflect any deduction of sales charges, mortality and expense charges, contract charges or administrative charges. Please refer to the Performance Summary appropriate for your policy. For performance information current to the most recent month-end, please call 800-598-2019 or visit www.newyorklife.com.
Average Annual Total Returns for the Year Ended December 31, 2012
| | | | | | | | | | | | | | |
| Class | | One Year | | Five Years | | | Ten Years1 | | | Gross Expense Ratio2 | |
| Initial Class Shares | | 13.42% | | | 8.04 | % | | | 10.32 | % | | | 0.60 | % |
| Service Class Shares3 | | 13.14 | | | 7.77 | | | | 10.04 | | | | 0.85 | |
| | | | | | | | | | | | |
| Benchmark Performance | | One
Year | | | Five
Years | | | Ten Years | |
Credit Suisse High Yield Index4 | | | 14.71 | % | | | 9.53 | % | | | 10.25 | % |
Average Lipper Variable Products High Yield Portfolio5 | | | 14.09 | | | | 7.89 | | | | 8.97 | |
| 1. | Performance figures shown for the ten-year period ended December 31, 2012 reflect nonrecurring reimbursements from affiliates for printing and mailing costs. If these nonrecurring reimbursements had not been made, the total returns would have been 10.31% for Initial Class shares and 10.03% for Service Class shares for the ten-year period. |
| 2. | The gross expense ratios presented reflect the Portfolio’s “Total Annual Portfolio Operating Expenses” from the most recent Prospectus and may differ from other expense ratios disclosed in this report. |
| 3. | Performance for Service Class shares, first offered June 4, 2003, includes the historical performance of Initial Class shares through June 3, 2003 adjusted to reflect the fees and expenses of Service Class shares. |
| 4. | Please refer to pages M-2 and M-3 for additional explanations and disclosure regarding the Portfolios, their benchmark indices and other indices mentioned in the reports. |
| 5. | The Average Lipper Variable Products High Yield Portfolio is representative of portfolios that aim at high (relative) current yield from fixed-income securities, have no quality or maturity restrictions, and tend to invest in lower-grade debt issues. Lipper Inc. is an independent monitor of fund performance. Results are based on total returns with all dividend and capital gain distributions reinvested. |
| | |
| M-218 | | MainStay VP High Yield Corporate Bond Portfolio |
Cost in Dollars of a $1,000 Investment in MainStay VP High Yield Corporate Bond Portfolio (Unaudited)
The example below is intended to describe the fees and expenses borne by shareholders during the six-month period from July 1, 2012 to December 31, 2012, and the impact of those costs on your investment.
Example
As a shareholder of the Portfolio, you incur two types of costs: (1) transaction costs, including exchange fees and sales charges (loads) on purchases (as applicable), and (2) ongoing costs, including management fees, distribution and/or service (12b-1) fees, and other Portfolio expenses (as applicable). This example is intended to help you understand your ongoing costs (in dollars) of investing in the Portfolio and to compare these costs with the ongoing costs of investing in other Portfolios. The example is based on an investment of $1,000 made at the beginning of the six-month period and held for the entire period from July 1, 2012, to December 31, 2012. Shares are only sold in connection with variable life and annuity contracts and the example does not reflect any contract level or transactional fees or expenses. If these costs had been included, your costs would have been higher.
This example illustrates your Portfolio’s ongoing costs in two ways:
Actual Expenses
The second and third data columns in the table below provide information about actual account values and actual expenses. You may use the information in these columns, together with the amount you invested, to estimate the
expenses that you paid during the six months ended December 31, 2012. Simply divide your account value by $1,000 (for example, an $8,600 account value divided by $1,000 = 8.6), then multiply the result by the number under the heading entitled ‘‘Expenses Paid During Period’’ to estimate the expenses you paid on your account during this period.
Hypothetical Example for Comparison Purposes
The fourth and fifth data columns in the table below provide information about hypothetical account values and hypothetical expenses based on the Portfolio’s actual expense ratio and an assumed rate of return of 5% per year before expenses, which is not the Portfolio’s actual return. The hypothetical account values and expenses may not be used to estimate the actual ending account balances or expenses you paid for the six-month period shown. You may use this information to compare the ongoing costs of investing in the Portfolio with the ongoing costs of investing in other Portfolios. To do so, compare this 5% hypothetical example with the 5% hypothetical examples that appear in the shareholder reports of the other Portfolios.
Please note that the expenses shown in the table are meant to highlight your ongoing costs only and do not reflect any transactional costs, such as exchange fees or sales charges (loads). Therefore, the fourth and fifth data columns of the table are useful in comparing ongoing costs only and will not help you determine the relative total costs of owning different funds. In addition, if these transactional costs were included, your costs would have been higher.
| | | | | | | | | | | | | | | | | | | | |
| | | | | | | | | | | | | | | | |
| Share Class | | Beginning
Account
Value
7/1/12 | | | Ending Account
Value (Based
on Actual
Returns and
Expenses)
12/31/12 | | | Expenses
Paid
During
Period1 | | | Ending Account
Value (Based
on Hypothetical
5% Annualized
Return and
Actual Expenses)
12/31/12 | | | Expenses
Paid
During
Period1 | |
| | | | | |
| Initial Class Shares | | $ | 1,000.00 | | | $ | 1,070.20 | | | $ | 3.07 | | | $ | 1,022.20 | | | $ | 3.00 | |
| | | | | |
| Service Class Shares | | $ | 1,000.00 | | | $ | 1,068.90 | | | $ | 4.37 | | | $ | 1,020.90 | | | $ | 4.27 | |
| 1. | Expenses are equal to the Portfolio’s annualized expense ratio of each class (0.59% for Initial Class and 0.84% for Service Class) multiplied by the average account value over the period, divided by 366 and multiplied by 184 (to reflect the six-month period). The table above represents the actual expenses incurred during the six-month period. |
| | | | |
| mainstayinvestments.com | | | M-219 | |
Portfolio Composition as of December 31, 2012 (Unaudited)
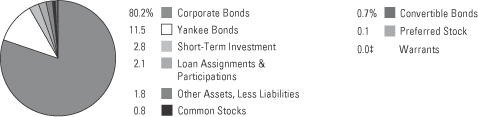
See Portfolio of Investments beginning on page M-222 for specific holdings within these categories.
| ‡ | Less than one-tenth of a percent. |
Top Ten Holdings or Issuers Held as of December 31, 2012 (excluding short-term investment) (Unaudited)
| 1. | Ally Financial, Inc., (zero coupon)–8.30%, due 2/12/15–11/1/31 |
| 2. | HCA, Inc., 4.75%–9.875%, due 3/15/14–9/15/25 |
| 3. | GenOn Energy, Inc., 7.625%–9.50%, due 6/15/14–10/15/18 |
| 4. | Texas Industries, Inc., 9.25%, due 8/15/20 |
| 5. | Nationstar Mortgage LLC / Nationstar Capital Corp., 7.875%–10.875%, due 4/1/15–10/1/20 |
| 6. | Algeco Scotsman Global Finance PLC, 8.50%–10.75%, due 10/15/18–10/15/19 |
| 8. | Sprint Capital Corp., 6.875%–8.75%, due 11/15/28–3/15/32 |
| 9. | Intelsat Jackson Holdings S.A., 6.625%–7.50%, due 4/1/19–12/15/22 |
| 10. | Schaeffler Finance B.V., 7.75%–8.50%, due 2/15/17–2/15/19 |
| | |
| M-220 | | MainStay VP High Yield Corporate Bond Portfolio |
Portfolio Management Discussion and Analysis (Unaudited)
Answers to the questions reflect the views of portfolio manager J. Matthew Philo, CFA, of MacKay Shields, the Portfolio’s Subadvisor.
How did MainStay VP High Yield Corporate Bond Portfolio perform relative to its peers and its benchmark during the 12 months ended December 31, 2012?
For the 12 months ended December 31, 2012, MainStay VP High Yield Corporate Bond Portfolio returned 13.42% for Initial Class shares and 13.14% for Service Class shares. Both share classes underperformed the 14.09% return of the average Lipper1 Variable Products High Yield Portfolio and the 14.71% return of the Credit Suisse High Yield Index1 for the same period. The Credit Suisse High Yield Index is the Portfolio’s broad-based securities-market index.
What factors affected the Portfolio’s relative performance during the reporting period?
The Portfolio’s performance relative to its peers and the Credit Suisse High Yield Index resulted from our bottom-up investment style, which focuses on individual companies and seeks to maximize risk-adjusted spreads and yields. The Portfolio remained conservatively positioned throughout the reporting period because of what we viewed as attractive risk-adjusted yields and spreads2 in the higher-quality part of the high-yield market. On the other hand, we viewed valuations in the higher-risk segment of the high-yield market as generally unattractive. We believed the higher-risk segment of the market was particularly vulnerable because of weak corporate earnings outlooks and challenging growth conditions in global economies.
What specific factors, risks or market forces prompted significant decisions for the Portfolio during the reporting period?
Because the Portfolio is managed with a bottom-up investment style, the factors that prompt significant decisions are specific to each individual company. During the reporting period, we generally believed that valuations for most lower-quality high-yield bonds were unattractive, and we positioned the Portfolio more conservatively.
During the reporting period, which market segments made the strongest contributions to the Portfolio’s performance and which market segments were particularly weak?
The most significant positive contributors to the Portfolio’s absolute performance were investments
in the health care, energy and financials industries. (Contributions take weightings and total returns into account.) Although no industries generated negative absolute returns during the reporting period, the Portfolio’s positions in the retail, food and drug, and aerospace industries contributed the least to the Portfolio’s absolute performance.
Did the Portfolio make any significant purchases or sales during the reporting period?
During the reporting period, the Portfolio purchased the bonds of Schaeffler, a leading manufacturer of automotive and industrial components. We found
the bonds attractive because the company has low leverage and generates free cash flow. The Portfolio also initiated a position in bonds of travel and leisure company Carlson Wagonlit. During the reporting period, the Portfolio sold the bonds of entertainment company American Casino and food company Tyson Foods.Tyson Foods was tendered through a corporate action. American Casino was sold because of relative value in relation to the expected return.
How did the Portfolio’s industry weightings change during the reporting period?
In 2012, the Portfolio increased its exposure to the housing and service industries because we found valuations and yield levels attractive. During the year, the Portfolio reduced its exposure to the utility and health care industries.
How was the Portfolio positioned at the end of the reporting period?
As of December 31, 2012, the Portfolio held overweight positions relative to the Credit Suisse High Yield Index in the transportation, financials and housing industries. As of the same date, the Portfolio held underweight positions relative to the Index in the retail, energy and media industries.
| 1. | Please refer to pages M-2 and M-3 for additional explanations and disclosure regarding the Portfolios, their benchmark indices and service providers mentioned in the reports. |
| 2. | The terms “spread” and “yield spread” may refer to the difference in yield between a security or type of security and comparable U.S. Treasury issues. The terms may also refer to the difference in yield between two specific securities or types of securities at a given time. |
The opinions expressed are those of the portfolio manager as of the date of this report and are subject to change. There is no guarantee that any forecasts made will come to pass. This material does not constitute investment advice and is not intended as an endorsement of any specific investment.
Not all MainStay VP Portfolios and/or share classes are available under all policies.
| | | | |
| mainstayinvestments.com | | | M-221 | |
Portfolio of Investments December 31, 2012
| | | | | | | | |
| | | Principal
Amount | | | Value | |
| | | | | | | | |
Long-Term Bonds 94.5%† Convertible Bonds 0.7% | |
Coal 0.1% | |
Somerset Cayuga Holding Co., Inc.
20.00%, due 6/15/17 (b)(d)(e)(f)(h) | | $ | 1,422,073 | | | $ | 1,919,799 | |
| | | | | | | | |
|
Holding Company—Diversified 0.5% | |
Icahn Enterprises, L.P.
4.00%, due 8/15/13 (a) | | | 10,840,000 | | | | 10,921,300 | |
| | | | | | | | |
|
Internet 0.0%‡ | |
At Home Corp. | | | | | | | | |
0.525%, due 12/28/18 (b)(c)(d)(e) | | | 1,869,975 | | | | 187 | |
4.75%, due 12/31/49 (b)(c)(d)(e) | | | 9,032,054 | | | | 903 | |
| | | | | | | | |
| | | | | | | 1,090 | |
| | | | | | | | |
Investment Management/Advisory Services 0.1% | |
Janus Capital Group, Inc.
3.25%, due 7/15/14 | | | 3,039,000 | | | | 3,171,956 | |
| | | | | | | | |
Total Convertible Bonds
(Cost $15,121,452) | | | | | | | 16,014,145 | |
| | | | | | | | |
|
| Corporate Bonds 80.2% | |
Advertising 0.4% | | | | | | | | |
Lamar Media Corp. | | | | | | | | |
5.875%, due 2/1/22 | | | 1,525,000 | | | | 1,654,625 | |
7.875%, due 4/15/18 | | | 3,775,000 | | | | 4,171,375 | |
9.75%, due 4/1/14 | | | 3,297,000 | | | | 3,610,215 | |
| | | | | | | | |
| | | | | | | 9,436,215 | |
| | | | | | | | |
Aerospace & Defense 1.4% | | | | | | | | |
AAR Corp.
7.25%, due 1/15/22 (f) | | | 4,490,000 | | | | 4,753,787 | |
Alliant Techsystems, Inc.
6.875%, due 9/15/20 | | | 3,480,000 | | | | 3,823,650 | |
B/E Aerospace, Inc.
5.25%, due 4/1/22 | | | 7,665,000 | | | | 8,124,900 | |
DAE Aviation Holdings, Inc.
11.25%, due 8/1/15 (f) | | | 4,491,000 | | | | 4,614,503 | |
TransDigm, Inc. | | | | | | | | |
5.50%, due 10/15/20 (f) | | | 6,200,000 | | | | 6,448,000 | |
7.75%, due 12/15/18 | | | 7,635,000 | | | | 8,446,219 | |
| | | | | | | | |
| | | | | | | 36,211,059 | |
| | | | | | | | |
Agriculture 0.1% | | | | | | | | |
American Rock Salt Co. LLC / American Rock Capital Corp.
8.25%, due 5/1/18 (f) | | | 3,830,000 | | | | 3,466,150 | |
| | | | | | | | |
| | | | | | | | |
| | | Principal
Amount | | | Value | |
| | | | | | | | |
Apparel 0.3% | |
Hanesbrands, Inc.
8.00%, due 12/15/16 | | $ | 1,898,000 | | | $ | 2,083,055 | |
Wolverine World Wide, Inc.
6.125%, due 10/15/20 (f) | | | 4,800,000 | | | | 5,040,000 | |
| | | | | | | | |
| | | | | | | 7,123,055 | |
| | | | | | | | |
Auto Manufacturers 0.2% | |
Ford Motor Co.
6.50%, due 8/1/18 | | | 1,125,000 | | | | 1,302,187 | |
Oshkosh Corp. | | | | | | | | |
8.25%, due 3/1/17 | | | 2,810,000 | | | | 3,083,975 | |
8.50%, due 3/1/20 | | | 905,000 | | | | 1,002,288 | |
| | | | | | | | |
| | | | | | | 5,388,450 | |
| | | | | | | | |
Auto Parts & Equipment 3.1% | |
Affinia Group, Inc. | | | | | | | | |
9.00%, due 11/30/14 | | | 1,570,000 | | | | 1,570,000 | |
10.75%, due 8/15/16 (f) | | | 2,216,000 | | | | 2,401,590 | |
Allison Transmission, Inc.
7.125%, due 5/15/19 (f) | | | 10,620,000 | | | | 11,336,850 | |
Continental Rubber of America Corp.
4.50%, due 9/15/19 (f) | | | 6,420,000 | | | | 6,570,189 | |
Cooper-Standard Automotive, Inc.
8.50%, due 5/1/18 | | | 12,945,000 | | | | 13,915,875 | |
Dana Holding Corp. | | | | | | | | |
6.50%, due 2/15/19 | | | 3,089,000 | | | | 3,297,508 | |
6.75%, due 2/15/21 | | | 6,279,000 | | | | 6,749,925 | |
Delphi Corp.
5.875%, due 5/15/19 | | | 7,825,000 | | | | 8,392,312 | |
Exide Technologies
8.625%, due 2/1/18 | | | 8,015,000 | | | | 6,792,712 | |
Lear Corp. (Escrow Shares)
8.75%, due 12/1/16 (b)(d)(e)(g) | | | 2,681,000 | | | | 4,022 | |
Tenneco, Inc. | | | | | | | | |
6.875%, due 12/15/20 | | | 1,870,000 | | | | 2,035,963 | |
7.75%, due 8/15/18 | | | 3,395,000 | | | | 3,683,575 | |
Titan International, Inc.
7.875%, due 10/1/17 | | | 3,594,000 | | | | 3,818,625 | |
TRW Automotive, Inc. | | | | | | | | |
7.00%, due 3/15/14 (f) | | | 800,000 | | | | 844,000 | |
7.25%, due 3/15/17 (f) | | | 2,835,000 | | | | 3,263,794 | |
8.875%, due 12/1/17 (f) | | | 3,050,000 | | | | 3,355,000 | |
| | | | | | | | |
| | | | | | | 78,031,940 | |
| | | | | | | | |
Banks 1.6% | |
¨Ally Financial, Inc. | | | | | | | | |
(zero coupon), due 6/15/15 | | | 490,000 | | | | 443,548 | |
4.625%, due 6/26/15 | | | 3,438,000 | | | | 3,584,032 | |
5.50%, due 2/15/17 | | | 1,600,000 | | | | 1,711,621 | |
| † | Percentages indicated are based on Portfolio net assets. |
| ¨ | | Among the Portfolio’s 10 largest holdings or issuers held, as of December 31, 2012, excluding short-term investment. May be subject to change daily. |
| | | | |
| M-222 | | MainStay VP High Yield Corporate Bond Portfolio | | The notes to the financial statements are an integral part of,
and should be read in conjunction with, the financial statements. |
| | | | | | | | |
| | | Principal
Amount | | | Value | |
| | | | | | | | |
| Corporate Bonds (continued) | |
Banks (continued) | | | | | | | | |
¨Ally Financial, Inc. (continued) | | | | | | | | |
6.25%, due 12/1/17 | | $ | 1,040,000 | | | $ | 1,151,506 | |
7.50%, due 9/15/20 | | | 7,047,000 | | | | 8,509,252 | |
8.00%, due 11/1/31 | | | 7,390,000 | | | | 9,338,894 | |
8.30%, due 2/12/15 | | | 7,800,000 | | | | 8,687,250 | |
Provident Funding Associates, L.P. | | | | | | | | |
10.125%, due 2/15/19 (f) | | | 2,450,000 | | | | 2,584,750 | |
10.25%, due 4/15/17 (f) | | | 3,670,000 | | | | 4,046,175 | |
| | | | | | | | |
| | | | | | | 40,057,028 | |
| | | | | | | | |
Beverages 0.7% | | | | | | | | |
Constellation Brands, Inc.
8.375%, due 12/15/14 | | | 1,620,000 | | | | 1,810,350 | |
Cott Beverages, Inc. | | | | | | | | |
8.125%, due 9/1/18 | | | 4,290,000 | | | | 4,740,450 | |
8.375%, due 11/15/17 | | | 9,750,000 | | | | 10,603,125 | |
| | | | | | | | |
| | | | | | | 17,153,925 | |
| | | | | | | | |
Building Materials 3.0% | | | | | | | | |
Building Materials Corp. of America | | | | | | | | |
6.75%, due 5/1/21 (f) | | | 2,110,000 | | | | 2,331,550 | |
6.875%, due 8/15/18 (f) | | | 5,050,000 | | | | 5,454,000 | |
7.00%, due 2/15/20 (f) | | | 3,060,000 | | | | 3,335,400 | |
7.50%, due 3/15/20 (f) | | | 5,640,000 | | | | 6,204,000 | |
Headwaters, Inc.
7.625%, due 4/1/19 | | | 7,457,000 | | | | 7,923,062 | |
Jeld-Wen Escrow Corp.
12.25%, due 10/15/17 (f) | | | 6,860,000 | | | | 7,923,300 | |
Martin Marietta Materials, Inc.
6.60%, due 4/15/18 | | | 2,000,000 | | | | 2,214,182 | |
Taylor Morrison Communities, Inc.
7.75%, due 4/15/20 (f) | | | 5,890,000 | | | | 6,243,400 | |
¨Texas Industries, Inc.
9.25%, due 8/15/20 | | | 27,590,000 | | | | 29,590,275 | |
USG Corp. | | | | | | | | |
6.30%, due 11/15/16 | | | 3,460,000 | | | | 3,581,100 | |
7.875%, due 3/30/20 (f) | | | 530,000 | | | | 589,625 | |
8.375%, due 10/15/18 (f) | | | 1,165,000 | | | | 1,293,150 | |
| | | | | | | | |
| | | | | | | 76,683,044 | |
| | | | | | | | |
Chemicals 2.2% | | | | | | | | |
Celanese U.S. Holdings LLC
4.625%, due 11/15/22 | | | 5,090,000 | | | | 5,331,775 | |
CF Industries, Inc. | | | | | | | | |
6.875%, due 5/1/18 | | | 2,580,000 | | | | 3,151,762 | |
7.125%, due 5/1/20 | | | 570,000 | | | | 717,367 | |
Georgia Gulf Corp.
9.00%, due 1/15/17 (f) | | | 5,688,000 | | | | 6,327,900 | |
Huntsman International LLC
5.50%, due 6/30/16 | | | 562,000 | | | | 562,702 | |
| | | | | | | | |
| | | Principal
Amount | | | Value | |
| | | | | | | | |
Chemicals (continued) | |
Kraton Polymers LLC / Kraton Polymers Capital Corp.
6.75%, due 3/1/19 | | $ | 6,135,000 | | | $ | 6,342,056 | |
Olin Corp. | | | | | | | | |
5.50%, due 8/15/22 | | | 4,500,000 | | | | 4,691,250 | |
8.875%, due 8/15/19 | | | 6,675,000 | | | | 7,576,125 | |
Phibro Animal Health Corp.
9.25%, due 7/1/18 (f) | | | 13,850,000 | | | | 13,850,000 | |
PolyOne Corp.
7.375%, due 9/15/20 | | | 1,200,000 | | | | 1,311,000 | |
Rockwood Specialties Group, Inc.
4.625%, due 10/15/20 | | | 7,225,000 | | | | 7,477,875 | |
| | | | | | | | |
| | | | | | | 57,339,812 | |
| | | | | | | | |
Coal 2.0% | | | | | | | | |
Arch Coal, Inc. | | | | | | | | |
7.00%, due 6/15/19 | | | 6,935,000 | | | | 6,449,550 | |
7.25%, due 10/1/20 | | | 1,110,000 | | | | 1,029,525 | |
8.75%, due 8/1/16 | | | 2,070,000 | | | | 2,152,800 | |
9.875%, due 6/15/19 (f) | | | 2,570,000 | | | | 2,672,800 | |
CONSOL Energy, Inc. | | | | | | | | |
8.00%, due 4/1/17 | | | 10,900,000 | | | | 11,799,250 | |
8.25%, due 4/1/20 | | | 1,590,000 | | | | 1,721,175 | |
Peabody Energy Corp. | | | | | | | | |
6.00%, due 11/15/18 | | | 7,635,000 | | | | 8,112,187 | |
6.25%, due 11/15/21 | | | 4,670,000 | | | | 4,961,875 | |
6.50%, due 9/15/20 | | | 3,485,000 | | | | 3,737,663 | |
7.375%, due 11/1/16 | | | 845,000 | | | | 967,525 | |
7.875%, due 11/1/26 | | | 2,235,000 | | | | 2,413,800 | |
Penn Virginia Resource Partners, L.P. /
Penn Virginia Resource Finance Corp.
8.25%, due 4/15/18 | | | 1,340,000 | | | | 1,420,400 | |
Penn Virginia Resource Partners, L.P. /
Penn Virginia Resource Finance Corp. II
8.375%, due 6/1/20 (f) | | | 4,335,000 | | | | 4,670,962 | |
| | | | | | | | |
| | | | | | | 52,109,512 | |
| | | | | | | | |
Commercial Services 4.1% | | | | | | | | |
Alliance Data Systems Corp. | | | | | | | | |
5.25%, due 12/1/17 (f) | | | 5,800,000 | | | | 5,887,000 | |
6.375%, due 4/1/20 (f) | | | 5,385,000 | | | | 5,735,025 | |
Avis Budget Car Rental LLC / Avis Budget Finance, Inc. | | | | | | | | |
4.875%, due 11/15/17 (f) | | | 4,010,000 | | | | 4,070,150 | |
8.25%, due 1/15/19 | | | 1,345,000 | | | | 1,486,225 | |
9.75%, due 3/15/20 | | | 2,895,000 | | | | 3,343,725 | |
Catalent Pharma Solutions, Inc.
7.875%, due 10/15/18 (f) | | | 7,060,000 | | | | 7,112,950 | |
Cenveo Corp.
8.875%, due 2/1/18 | | | 5,490,000 | | | | 5,215,500 | |
Corrections Corporation of America
7.75%, due 6/1/17 | | | 1,455,000 | | | | 1,545,938 | |
| | | | | | |
The notes to the financial statements are an integral part of,
and should be read in conjunction with, the financial statements. | | mainstayinvestments.com | | | M-223 | |
Portfolio of Investments December 31, 2012 (continued)
| | | | | | | | |
| | | Principal
Amount | | | Value | |
| | | | | | | | |
| Corporate Bonds (continued) | |
Commercial Services (continued) | |
Great Lakes Dredge & Dock Corp.
7.375%, due 2/1/19 | | $ | 6,455,000 | | | $ | 6,922,987 | |
H&E Equipment Services, Inc.
7.00%, due 9/1/22 (f) | | | 4,130,000 | | | | 4,398,450 | |
HDTFS, Inc.
5.875%, due 10/15/20 (f) | | | 1,330,000 | | | | 1,389,850 | |
Knowledge Universe Education LLC
7.75%, due 2/1/15 (f) | | | 8,530,000 | | | | 7,890,250 | |
PHH Corp. | | | | | | | | |
7.375%, due 9/1/19 | | | 2,730,000 | | | | 3,030,300 | |
9.25%, due 3/1/16 | | | 1,615,000 | | | | 1,885,512 | |
Quebecor World, Inc. (Litigation Recovery Trust—Escrow Shares) | | | | | | | | |
6.50%, (b)(d)(e)(g) | | | 150,000 | | | | 2,400 | |
9.75%, (b)(d)(e)(f)(g) | | | 8,530,000 | | | | 136,480 | |
Sotheby’s
5.25%, due 10/1/22 (f) | | | 4,820,000 | | | | 4,868,200 | |
Speedy Cash Intermediate Holdings Corp.
10.75%, due 5/15/18 (f) | | | 6,110,000 | | | | 6,507,150 | |
Sunstate Equipment Co. LLC / Sunstate Equipment Co., Inc.
12.00%, due 6/15/16 (f)(h) | | | 9,800,000 | | | | 10,559,500 | |
United Rentals North America, Inc. | | | | | | | | |
5.75%, due 7/15/18 (f) | | | 4,155,000 | | | | 4,477,012 | |
6.125%, due 6/15/23 | | | 5,165,000 | | | | 5,449,075 | |
7.375%, due 5/15/20 (f) | | | 835,000 | | | | 916,413 | |
7.625%, due 4/15/22 (f) | | | 2,920,000 | | | | 3,263,100 | |
9.25%, due 12/15/19 | | | 2,450,000 | | | | 2,793,000 | |
Valassis Communications, Inc.
6.625%, due 2/1/21 | | | 4,740,000 | | | | 5,024,400 | |
| | | | | | | | |
| | | | | | | 103,910,592 | |
| | | | | | | | |
Computers 0.6% | |
iGATE Corp.
9.00%, due 5/1/16 | | | 5,140,000 | | | | 5,570,475 | |
NCR Corp. | | | | | | | | |
4.625%, due 2/15/21 (f) | | | 1,100,000 | | | | 1,100,000 | |
5.00%, due 7/15/22 (f) | | | 4,050,000 | | | | 4,115,813 | |
SunGard Data Systems, Inc.
4.875%, due 1/15/14 | | | 3,625,000 | | | | 3,738,281 | |
| | | | | | | | |
| | | | | | | 14,524,569 | |
| | | | | | | | |
Distribution & Wholesale 0.4% | |
American Tire Distributors, Inc.
9.75%, due 6/1/17 | | | 10,815,000 | | | | 11,463,900 | |
| | | | | | | | |
|
Diversified Financial Services 1.2% | |
CNG Holdings, Inc.
9.375%, due 5/15/20 (f) | | | 4,695,000 | | | | 4,765,425 | |
| | | | | | | | |
| | | Principal
Amount | | | Value | |
| | | | | | | | |
Diversified Financial Services (continued) | |
Community Choice Financial, Inc. | | | | | | | | |
10.75%, due 5/1/19 | | $ | 7,430,000 | | | $ | 7,151,375 | |
12.75%, due 5/1/20 (b)(f) | | | 3,000,000 | | | | 3,000,000 | |
Ford Holdings LLC
9.30%, due 3/1/30 | | | 6,970,000 | | | | 9,575,037 | |
ROC Finance LLC / ROC Finance 1 Corp.
12.125%, due 9/1/18 (f) | | | 5,105,000 | | | | 5,896,275 | |
| | | | | | | | |
| | | | | | | 30,388,112 | |
| | | | | | | | |
Electric 3.1% | |
AES Eastern Energy, L.P. (Escrow Shares) Series 1999-A
9.00%, due 1/2/17 (b)(c)(d)(e) | | | 3,526,011 | | | | 599,422 | |
Calpine Construction Finance Co., L.P. / CCFC Finance Corp.
8.00%, due 6/1/16 (f) | | | 14,635,000 | | | | 15,549,687 | |
Calpine Corp.
7.25%, due 10/15/17 (f) | | | 9,267,000 | | | | 9,869,355 | |
Cedar Brakes II LLC
9.875%, due 9/1/13 (f) | | | 729,965 | | | | 750,192 | |
Energy Future Intermediate Holding Co. LLC / EFIH Finance, Inc.
10.00%, due 12/1/20 | | | 8,101,000 | | | | 9,133,878 | |
¨GenOn Energy, Inc. | | | | | | | | |
7.625%, due 6/15/14 | | | 4,535,000 | | | | 4,841,113 | |
7.875%, due 6/15/17 | | | 14,250,000 | | | | 15,746,250 | |
9.50%, due 10/15/18 | | | 9,610,000 | | | | 11,339,800 | |
GenOn REMA LLC
Series C
9.681%, due 7/2/26 | | | 1,190,000 | | | | 1,279,250 | |
Ipalco Enterprises, Inc.
7.25%, due 4/1/16 (f) | | | 1,615,000 | | | | 1,792,650 | |
Mirant Americas Generation LLC
9.125%, due 5/1/31 | | | 3,760,000 | | | | 4,136,000 | |
PNM Resources, Inc.
9.25%, due 5/15/15 | | | 1,704,000 | | | | 1,944,690 | |
Public Service Co. of New Mexico
7.95%, due 5/15/18 | | | 2,305,000 | | | | 2,800,748 | |
| | | | | | | | |
| | | | | | | 79,783,035 | |
| | | | | | | | |
Electrical Components & Equipment 0.6% | |
Belden, Inc.
5.50%, due 9/1/22 (f) | | | 10,110,000 | | | | 10,388,025 | |
General Cable Corp.
5.75%, due 10/1/22 (f) | | | 3,610,000 | | | | 3,736,350 | |
| | | | | | | | |
| | | | | | | 14,124,375 | |
| | | | | | | | |
Electronics 0.3% | |
Kemet Corp.
10.50%, due 5/1/18 | | | 3,670,000 | | | | 3,619,538 | |
Stoneridge, Inc.
9.50%, due 10/15/17 (f) | | | 3,110,000 | | | | 3,312,150 | |
| | | | | | | | |
| | | | | | | 6,931,688 | |
| | | | | | | | |
| | | | |
| M-224 | | MainStay VP High Yield Corporate Bond Portfolio | | The notes to the financial statements are an integral part of,
and should be read in conjunction with, the financial statements. |
| | | | | | | | |
| | | Principal
Amount | | | Value | |
| | | | | | | | |
| Corporate Bonds (continued) | |
Engineering & Construction 0.5% | |
New Enterprise Stone & Lime Co., Inc. | | | | | | | | |
11.00%, due 9/1/18 | | $ | 10,275,000 | | | $ | 7,706,250 | |
13.00%, due 3/15/18 (f)(h) | | | 5,726,600 | | | | 5,969,981 | |
| | | | | | | | |
| | | | | | | 13,676,231 | |
| | | | | | | | |
Entertainment 1.9% | |
Affinity Gaming LLC / Affinity Gaming Finance Corp.
9.00%, due 5/15/18 (b)(f) | | | 10,045,000 | | | | 10,497,025 | |
Greektown Superholdings, Inc.
13.00%, due 7/1/15 | | | 5,235,000 | | | | 5,588,362 | |
NAI Entertainment Holdings LLC
8.25%, due 12/15/17 (f) | | | 8,807,000 | | | | 9,698,709 | |
Production Resource Group, Inc.
8.875%, due 5/1/19 | | | 6,090,000 | | | | 4,445,700 | |
Speedway Motorsports, Inc.
8.75%, due 6/1/16 | | | 2,985,000 | | | | 3,190,219 | |
Sterling Entertainment Enterprise, LLC
9.75%, due 12/31/19 (b)(d)(e) | | | 10,000,000 | | | | 10,000,000 | |
United Artists Theatre Circuit, Inc.
Series BA7
9.30%, due 7/1/15 (b)(e) | | | 365,760 | | | | 256,032 | |
Vail Resorts, Inc.
6.50%, due 5/1/19 | | | 4,620,000 | | | | 4,972,275 | |
| | | | | | | | |
| | | | | | | 48,648,322 | |
| | | | | | | | |
Environmental Controls 0.6% | |
Clean Harbors, Inc. | | | | | | | | |
5.125%, due 6/1/21 (f) | | | 2,735,000 | | | | 2,830,725 | |
5.25%, due 8/1/20 | | | 4,320,000 | | | | 4,503,600 | |
Darling International, Inc.
8.50%, due 12/15/18 | | | 3,600,000 | | | | 4,135,500 | |
Heckmann Corp.
9.875%, due 4/15/18 | | | 3,205,000 | | | | 3,309,163 | |
9.875%, due 4/15/18 (f) | | | 1,720,000 | | | | 1,763,000 | |
| | | | | | | | |
| | | | | | | 16,541,988 | |
| | | | | | | | |
Finance—Auto Loans 1.2% | |
Credit Acceptance Corp.
9.125%, due 2/1/17 | | | 5,020,000 | | | | 5,484,350 | |
Ford Motor Credit Co. LLC | | | | | | | | |
7.00%, due 4/15/15 | | | 3,075,000 | | | | 3,428,742 | |
12.00%, due 5/15/15 | | | 4,455,000 | | | | 5,468,512 | |
General Motors Financial Co., Inc. | | | | | | | | |
4.75%, due 8/15/17 (f) | | | 6,455,000 | | | | 6,787,368 | |
6.75%, due 6/1/18 | | | 8,850,000 | | | | 10,152,570 | |
| | | | | | | | |
| | | | | | | 31,321,542 | |
| | | | | | | | |
| | | | | | | | |
Finance—Consumer Loans 0.3% | |
SLM Corp. | | | | | | | | |
8.00%, due 3/25/20 | | | 2,540,000 | | | | 2,901,950 | |
8.45%, due 6/15/18 | | | 4,085,000 | | | | 4,779,450 | |
| | | | | | | | |
| | | | | | | 7,681,400 | |
| | | | | | | | |
| | | | | | | | |
| | | Principal
Amount | | | Value | |
| | | | | | | | |
Finance—Other Services 1.3% | |
¨Nationstar Mortgage LLC / Nationstar Capital Corp. | | | | | | | | |
7.875%, due 10/1/20 (f) | | $ | 4,005,000 | | | $ | 4,225,275 | |
9.625%, due 5/1/19 (f) | | | 5,305,000 | | | | 5,958,125 | |
10.875%, due 4/1/15 | | | 15,980,000 | | | | 17,098,600 | |
SquareTwo Financial Corp.
11.625%, due 4/1/17 | | | 4,875,000 | | | | 4,619,062 | |
| | | | | | | | |
| | | | | | | 31,901,062 | |
| | | | | | | | |
Food 2.1% | |
American Seafoods Group LLC / American Seafoods Finance, Inc.
10.75%, due 5/15/16 (f) | | | 4,740,000 | | | | 4,858,500 | |
American Stores Co.
8.00%, due 6/1/26 | | | 9,740,000 | | | | 8,449,450 | |
ASG Consolidated LLC / ASG Finance, Inc.
15.00%, due 5/15/17 (f)(h) | | | 4,853,070 | | | | 4,416,294 | |
B&G Foods, Inc.
7.625%, due 1/15/18 | | | 1,960,000 | | | | 2,107,000 | |
C&S Group Enterprises LLC
8.375%, due 5/1/17 (f) | | | 3,267,000 | | | | 3,454,853 | |
Harmony Foods Corp.
10.00%, due 5/1/16 (f) | | | 6,510,000 | | | | 7,014,525 | |
Land O’ Lakes, Inc.
6.00%, due 11/15/22 (f) | | | 7,905,000 | | | | 8,557,162 | |
Smithfield Foods, Inc.
6.625%, due 8/15/22 | | | 3,755,000 | | | | 4,149,275 | |
TreeHouse Foods, Inc. | | | | | | | | |
6.03%, due 9/30/13 (b)(d)(e) | | | 6,300,000 | | | | 6,394,500 | |
7.75%, due 3/1/18 | | | 3,070,000 | | | | 3,330,950 | |
| | | | | | | | |
| | | | | | | 52,732,509 | |
| | | | | | | | |
Forest Products & Paper 1.2% | |
Boise Cascade LLC / Boise Cascade Finance Corp.
6.375%, due 11/1/20 (f) | | | 6,000,000 | | | | 6,180,000 | |
Clearwater Paper Corp.
7.125%, due 11/1/18 | | | 4,082,000 | | | | 4,449,380 | |
Georgia-Pacific Corp. | | | | | | | | |
7.25%, due 6/1/28 | | | 4,180,000 | | | | 5,472,903 | |
7.375%, due 12/1/25 | | | 1,310,000 | | | | 1,784,981 | |
7.75%, due 11/15/29 | | | 64,000 | | | | 87,524 | |
8.00%, due 1/15/24 | | | 3,469,000 | | | | 4,850,224 | |
8.875%, due 5/15/31 | | | 3,165,000 | | | | 4,745,576 | |
Resolute Forest Products
10.25%, due 10/15/18 | | | 3,152,000 | | | | 3,609,040 | |
| | | | | | | | |
| | | | | | | 31,179,628 | |
| | | | | | | | |
| | | | | | |
The notes to the financial statements are an integral part of,
and should be read in conjunction with, the financial statements. | | mainstayinvestments.com | | | M-225 | |
Portfolio of Investments December 31, 2012 (continued)
| | | | | | | | |
| | | Principal
Amount | | | Value | |
| | | | | | | | |
| Corporate Bonds (continued) | |
Health Care—Products 1.0% | |
Alere, Inc. | | | | | | | | |
8.625%, due 10/1/18 | | $ | 1,555,000 | | | $ | 1,562,775 | |
9.00%, due 5/15/16 | | | 650,000 | | | | 685,750 | |
Hanger, Inc.
7.125%, due 11/15/18 | | | 7,627,000 | | | | 8,046,485 | |
Hologic, Inc.
6.25%, due 8/1/20 (f) | | | 3,230,000 | | | | 3,480,325 | |
Teleflex, Inc.
6.875%, due 6/1/19 | | | 4,860,000 | | | | 5,248,800 | |
Universal Hospital Services, Inc.
7.625%, due 8/15/20 (f) | | | 6,160,000 | | | | 6,491,100 | |
| | | | | | | | |
| | | | | | | 25,515,235 | |
| | | | | | | | |
Health Care—Services 4.1% | |
American Renal Associates Holdings, Inc.
9.75%, due 3/1/16 (h) | | | 3,104,575 | | | | 3,275,327 | |
American Renal Holdings Co., Inc.
8.375%, due 5/15/18 | | | 2,830,000 | | | | 2,978,575 | |
AMERIGROUP Corp.
7.50%, due 11/15/19 | | | 6,865,000 | | | | 8,238,000 | |
Centene Corp.
5.75%, due 6/1/17 | | | 3,905,000 | | | | 4,197,875 | |
CHS / Community Health Systems, Inc. | | | | | | | | |
5.125%, due 8/15/18 | | | 2,990,000 | | | | 3,117,075 | |
7.125%, due 7/15/20 | | | 3,495,000 | | | | 3,730,912 | |
DaVita HeathCare Partners Inc. | | | | | | | | |
6.375%, due 11/1/18 | | | 3,010,000 | | | | 3,228,225 | |
6.625%, due 11/1/20 | | | 1,896,000 | | | | 2,061,900 | |
Fresenius Medical Care U.S. Finance, Inc.
6.50%, due 9/15/18 (f) | | | 3,750,000 | | | | 4,190,625 | |
Fresenius Medical Care U.S. Finance II, Inc. | | | | | | | | |
5.625%, due 7/31/19 (f) | | | 460,000 | | | | 493,925 | |
5.875%, due 1/31/22 (f) | | | 2,710,000 | | | | 2,940,350 | |
HCA Holdings, Inc.
7.75%, due 5/15/21 | | | 3,900,000 | | | | 4,231,500 | |
¨HCA, Inc. | | | | | | | | |
4.75%, due 5/1/23 | | | 11,730,000 | | | | 11,935,275 | |
5.75%, due 3/15/14 | | | 2,920,000 | | | | 3,051,400 | |
6.375%, due 1/15/15 | | | 2,780,000 | | | | 3,005,875 | |
6.50%, due 2/15/16 | | | 4,270,000 | | | | 4,643,625 | |
6.50%, due 2/15/20 | | | 2,125,000 | | | | 2,390,625 | |
7.19%, due 11/15/15 | | | 243,000 | | | | 267,300 | |
7.25%, due 9/15/20 | | | 995,000 | | | | 1,101,962 | |
7.50%, due 2/15/22 | | | 1,570,000 | | | | 1,797,650 | |
7.58%, due 9/15/25 | | | 575,000 | | | | 582,188 | |
7.875%, due 2/15/20 | | | 645,000 | | | | 717,563 | |
8.36%, due 4/15/24 | | | 450,000 | | | | 484,875 | |
9.00%, due 12/15/14 | | | 1,520,000 | | | | 1,694,800 | |
9.875%, due 2/15/17 | | | 881,000 | | | | 930,556 | |
| | | | | | | | |
| | | Principal
Amount | | | Value | |
| | | | | | | | |
Health Care—Services (continued) | | | | | | | | |
Health Management Associates, Inc.
7.375%, due 1/15/20 | | $ | 2,505,000 | | | $ | 2,705,400 | |
INC Research LLC
11.50%, due 7/15/19 (f) | | | 7,110,000 | | | | 7,358,850 | |
MultiPlan, Inc.
9.875%, due 9/1/18 (f) | | | 10,145,000 | | | | 11,311,675 | |
ResCare, Inc.
10.75%, due 1/15/19 | | | 3,520,000 | | | | 3,907,200 | |
Vanguard Health Holding Co. II LLC /Vanguard Holding Co. II, Inc. | | | | | | | | |
7.75%, due 2/1/19 | | | 3,080,000 | | | | 3,187,800 | |
8.00%, due 2/1/18 | | | 1,655,000 | | | | 1,712,925 | |
| | | | | | | | |
| | | | | | | 105,471,833 | |
| | | | | | | | |
Holding Companies—Diversified 0.8% | | | | | |
Alphabet Holding Co., Inc.
7.75%, due 11/1/17 (f)(h) | | | 6,060,000 | | | | 6,241,800 | |
Leucadia National Corp.
8.125%, due 9/15/15 | | | 4,480,000 | | | | 5,040,000 | |
Susser Holdings LLC / Susser Finance Corp.
8.50%, due 5/15/16 | | | 7,468,000 | | | | 7,934,750 | |
| | | | | | | | |
| | | | | | | 19,216,550 | |
| | | | | | | | |
Home Builders 0.5% | | | | | |
Meritage Homes Corp.
7.00%, due 4/1/22 | | | 1,665,000 | | | | 1,810,688 | |
Ryland Group, Inc. (The) | | | | | | | | |
5.375%, due 10/1/22 | | | 540,000 | | | | 552,825 | |
6.625%, due 5/1/20 | | | 1,880,000 | | | | 2,086,800 | |
Standard Pacific Corp.
8.375%, due 1/15/21 | | | 4,400,000 | | | | 5,104,000 | |
Taylor Morrison Communities, Inc. / Monarch Communities, Inc.
7.75%, due 4/15/20 (f) | | | 2,415,000 | | | | 2,559,900 | |
| | | | | | | | |
| | | | | | | 12,114,213 | |
| | | | | | | | |
Household Products & Wares 1.0% | | | | | |
Jarden Corp. | | | | | | | | |
6.125%, due 11/15/22 | | | 945,000 | | | | 1,020,600 | |
7.50%, due 5/1/17 | | | 5,940,000 | | | | 6,689,925 | |
Prestige Brands, Inc.
8.25%, due 4/1/18 | | | 3,560,000 | | | | 3,947,150 | |
Spectrum Brands Escrow Corp. | | | | | | | | |
6.375%, due 11/15/20 (f) | | | 1,545,000 | | | | 1,622,250 | |
6.625%, due 11/15/22 (f) | | | 1,545,000 | | | | 1,657,012 | |
Spectrum Brands, Inc. | | | | | | | | |
6.75%, due 3/15/20 (f) | | | 710,000 | | | | 759,700 | |
9.50%, due 6/15/18 | | | 8,887,000 | | | | 10,086,745 | |
| | | | | | | | |
| | | | | | | 25,783,382 | |
| | | | | | | | |
| | | | |
| M-226 | | MainStay VP High Yield Corporate Bond Portfolio | | The notes to the financial statements are an integral part of,
and should be read in conjunction with, the financial statements. |
| | | | | | | | |
| | | Principal
Amount | | | Value | |
| | | | | | | | |
| Corporate Bonds (continued) | |
Housewares 0.2% | | | | | |
Libbey Glass, Inc.
6.875%, due 5/15/20 | | $ | 5,360,000 | | | $ | 5,762,000 | |
| | | | | | | | |
| | |
Insurance 0.6% | | | | | | | | |
A-S Co-issuer Subsidiary, Inc. /
A-S Merger Sub LLC
7.875%, due 12/15/20 (f) | | | 1,405,000 | | | | 1,405,000 | |
Hub International, Ltd.
8.125%, due 10/15/18 (f) | | | 3,125,000 | | | | 3,203,125 | |
Ironshore Holdings (U.S.), Inc.
8.50%, due 5/15/20 (f) | | | 4,190,000 | | | | 4,640,970 | |
Onex Usi Aquisition Corp.
7.75%, due 1/15/21 (f) | | | 5,700,000 | | | | 5,614,500 | |
| | | | | | | | |
| | | | | | | 14,863,595 | |
| | | | | | | | |
Internet 0.7% | | | | | |
Cogent Communications Group, Inc.
8.375%, due 2/15/18 (f) | | | 5,405,000 | | | | 5,931,987 | |
Cyrusone, L.P. / Cyrusone Finance Corp.
6.375%, due 11/15/22 (f) | | | 4,930,000 | | | | 5,139,525 | |
Equinix, Inc.
7.00%, due 7/15/21 | | | 5,638,000 | | | | 6,258,180 | |
| | | | | | | | |
| | | | | | | 17,329,692 | |
| | | | | | | | |
Investment Management/Advisory Services 0.2% | | | | | |
Janus Capital Group, Inc.
6.70%, due 6/15/17 | | | 3,743,000 | | | | 4,277,935 | |
| | | | | | | | |
| | |
Iron & Steel 0.3% | | | | | | | | |
Allegheny Ludlum Corp.
6.95%, due 12/15/25 | | | 2,545,000 | | | | 3,001,545 | |
Allegheny Technologies, Inc.
9.375%, due 6/1/19 | | | 2,600,000 | | | | 3,307,918 | |
Steel Dynamics, Inc.
6.375%, due 8/15/22 (f) | | | 1,675,000 | | | | 1,775,500 | |
| | | | | | | | |
| | | | | | | 8,084,963 | |
| | | | | | | | |
Leisure Time 0.1% | | | | | | | | |
Brunswick Corp.
11.25%, due 11/1/16 (f) | | | 1,760,000 | | | | 1,986,600 | |
| | | | | | | | |
| | |
Lodging 1.6% | | | | | | | | |
Choice Hotels International, Inc.
5.75%, due 7/1/22 | | | 9,285,000 | | | | 10,283,137 | |
Eldorado Resorts LLC / Eldorado Capital Corp.
8.625%, due 6/15/19 (f) | | | 4,810,000 | | | | 4,569,500 | |
MGM Resorts International | | | | | | | | |
6.625%, due 7/15/15 | | | 1,000,000 | | | | 1,072,500 | |
6.625%, due 12/15/21 | | | 5,135,000 | | | | 5,135,000 | |
| | | | | | | | |
| | | Principal
Amount | | | Value | |
| | | | | | | | |
Lodging (continued) | | | | | | | | |
MTR Gaming Group, Inc.
11.50%, due 8/1/19 (h) | | $ | 5,652,225 | | | $ | 5,991,358 | |
Seminole Hard Rock Entertainment, Inc.
2.808%, due 3/15/14 (f) | | | 2,295,000 | | | | 2,277,788 | |
Sheraton Holding Corp.
7.375%, due 11/15/15 | | | 2,580,000 | | | | 2,983,804 | |
Station Casinos LLC
3.66%, due 6/18/18 | | | 10,110,000 | | | | 8,694,600 | |
| | | | | | | | |
| | | | | | | 41,007,687 | |
| | | | | | | | |
Machinery—Diversified 0.5% | | | | | | | | |
Briggs & Stratton Corp.
6.875%, due 12/15/20 | | | 3,660,000 | | | | 4,140,375 | |
Cleaver-Brooks, Inc.
8.75%, due 12/15/19 (f) | | | 2,635,000 | | | | 2,720,638 | |
SPL Logistics Escrow LLC / SPL Logistics Finance Corp.
8.875%, due 8/1/20 (f) | | | 4,485,000 | | | | 4,754,100 | |
| | | | | | | | |
| | | | | | | 11,615,113 | |
| | | | | | | | |
Media 3.0% | | | | | | | | |
AMC Networks, Inc. | | | | | | | | |
4.75%, due 12/15/22 | | | 3,800,000 | | | | 3,819,000 | |
7.75%, due 7/15/21 | | | 2,480,000 | | | | 2,839,600 | |
CCO Holdings LLC / CCO Holdings Capital Corp. | | | | | | | | |
7.00%, due 1/15/19 | | | 4,700,000 | | | | 5,070,125 | |
7.25%, due 10/30/17 | | | 1,245,000 | | | | 1,357,050 | |
7.375%, due 6/1/20 | | | 9,520,000 | | | | 10,567,200 | |
7.875%, due 4/30/18 | | | 1,585,000 | | | | 1,705,856 | |
Crown Media Holdings, Inc.
10.50%, due 7/15/19 | | | 6,000,000 | | | | 6,757,500 | |
CSC Holdings LLC | | | | | | | | |
7.625%, due 7/15/18 | | | 95,000 | | | | 109,725 | |
7.875%, due 2/15/18 | | | 965,000 | | | | 1,116,987 | |
DISH DBS Corp. | | | | | | | | |
4.625%, due 7/15/17 | | | 6,040,000 | | | | 6,296,700 | |
5.875%, due 7/15/22 | | | 3,725,000 | | | | 4,004,375 | |
6.75%, due 6/1/21 | | | 3,925,000 | | | | 4,474,500 | |
7.125%, due 2/1/16 | | | 1,085,000 | | | | 1,215,200 | |
7.75%, due 5/31/15 | | | 1,345,000 | | | | 1,504,719 | |
Nielsen Finance LLC / Nielsen Finance Co. | | | | | | | | |
4.50%, due 10/1/20 (f) | | | 9,455,000 | | | | 9,407,725 | |
7.75%, due 10/15/18 | | | 7,560,000 | | | | 8,448,300 | |
ProQuest LLC / ProQuest Notes Co.
9.00%, due 10/15/18 (f) | | | 8,860,000 | | | | 8,372,700 | |
| | | | | | | | |
| | | | | | | 77,067,262 | |
| | | | | | | | |
| | | | | | |
The notes to the financial statements are an integral part of,
and should be read in conjunction with, the financial statements. | | mainstayinvestments.com | | | M-227 | |
Portfolio of Investments December 31, 2012 (continued)
| | | | | | | | |
| | | Principal
Amount | | | Value | |
| | | | | | | | |
| Corporate Bonds (continued) | |
Metal Fabricate & Hardware 1.1% | | | | | | | | |
A. M. Castle & Co.
12.75%, due 12/15/16 | | $ | 9,200,000 | | | $ | 10,741,000 | |
Mueller Water Products, Inc. | | | | | | | | |
7.375%, due 6/1/17 | | | 4,825,000 | | | | 4,981,813 | |
8.75%, due 9/1/20 | | | 4,680,000 | | | | 5,335,200 | |
Neenah Foundry Co.
15.00%, due 7/29/15 (b)(h) | | | 1,377,570 | | | | 1,267,364 | |
Shale-Inland Holdings LLC / Shale-Inland Finance Corp.
8.75%, due 11/15/19 (f) | | | 4,240,000 | | | | 4,441,400 | |
| | | | | | | | |
| | | | | | | 26,766,777 | |
| | | | | | | | |
Mining 0.7% | | | | | | | | |
Kaiser Aluminum Corp.
8.25%, due 6/1/20 | | | 6,495,000 | | | | 7,079,550 | |
Vulcan Materials Co. | | | | | | | | |
6.50%, due 12/1/16 | | | 9,075,000 | | | | 10,005,187 | |
7.50%, due 6/15/21 | | | 1,505,000 | | | | 1,715,700 | |
| | | | | | | | |
| | | | | | | 18,800,437 | |
| | | | | | | | |
Miscellaneous—Manufacturing 1.8% | | | | | | | | |
Actuant Corp.
5.625%, due 6/15/22 | | | 3,941,000 | | | | 4,078,935 | |
Amsted Industries, Inc.
8.125%, due 3/15/18 (f) | | | 10,375,000 | | | | 11,101,250 | |
FGI Operating Co. LLC / FGI Finance, Inc.
7.875%, due 5/1/20 (f) | | | 4,730,000 | | | | 4,871,900 | |
Griffon Corp.
7.125%, due 4/1/18 | | | 4,755,000 | | | | 5,040,300 | |
Koppers, Inc.
7.875%, due 12/1/19 | | | 5,005,000 | | | | 5,505,500 | |
Polypore International, Inc.
7.50%, due 11/15/17 | | | 6,465,000 | | | | 7,046,850 | |
SPX Corp. | | | | | | | | |
6.875%, due 9/1/17 | | | 4,285,000 | | | | 4,777,775 | |
7.625%, due 12/15/14 | | | 4,095,000 | | | | 4,484,025 | |
| | | | | | | | |
| | | | | | | 46,906,535 | |
| | | | | | | | |
Office Furnishings 0.3% | | | | | | | | |
Interface, Inc.
7.625%, due 12/1/18 | | | 7,363,000 | | | | 7,906,021 | |
| | | | | | | | |
| | |
Oil & Gas 9.4% | | | | | | | | |
Berry Petroleum Co.
10.25%, due 6/1/14 | | | 3,915,000 | | | | 4,335,863 | |
Bill Barrett Corp.
7.625%, due 10/1/19 | | | 1,195,000 | | | | 1,260,725 | |
BreitBurn Energy Partners, L.P.
8.625%, due 10/15/20 | | | 5,465,000 | | | | 5,956,850 | |
| | | | | | | | |
| | | Principal
Amount | | | Value | |
| | | | | | | | |
Oil & Gas (continued) | | | | | | | | |
Calumet Specialty Products Partners, L.P. / Calumet Finance Corp. | | | | | | | | |
9.375%, due 5/1/19 | | $ | 11,222,000 | | | $ | 12,175,870 | |
9.625%, due 8/1/20 (f) | | | 1,770,000 | | | | 1,924,875 | |
Chesapeake Energy Corp. | | | | | | | | |
6.50%, due 8/15/17 | | | 9,615,000 | | | | 10,432,275 | |
6.775%, due 3/15/19 | | | 4,740,000 | | | | 4,745,925 | |
Chesapeake Oilfield Operating LLC / Chesapeake Oilfield Finance, Inc.
6.625%, due 11/15/19 (f) | | | 6,220,000 | | | | 5,862,350 | |
Comstock Resources, Inc. | | | | | | | | |
7.75%, due 4/1/19 | | | 5,955,000 | | | | 6,044,325 | |
8.375%, due 10/15/17 | | | 1,575,000 | | | | 1,653,750 | |
9.50%, due 6/15/20 | | | 3,750,000 | | | | 4,031,250 | |
¨Concho Resources, Inc. | | | | | | | | |
5.50%, due 10/1/22 | | | 1,990,000 | | | | 2,099,450 | |
5.50%, due 4/1/23 | | | 4,390,000 | | | | 4,598,525 | |
6.50%, due 1/15/22 | | | 7,710,000 | | | | 8,481,000 | |
7.00%, due 1/15/21 | | | 5,485,000 | | | | 6,115,775 | |
Continental Resources, Inc. | | | | | | | | |
5.00%, due 9/15/22 | | | 9,656,000 | | | | 10,404,340 | |
8.25%, due 10/1/19 | | | 3,620,000 | | | | 4,054,400 | |
Denbury Resources, Inc.
8.25%, due 2/15/20 | | | 4,605,000 | | | | 5,180,625 | |
Forest Oil Corp.
8.50%, due 2/15/14 | | | 205,000 | | | | 217,300 | |
Halcon Resources Corp.
8.875%, due 5/15/21 (f) | | | 4,390,000 | | | | 4,653,400 | |
HollyFrontier Corp.
9.875%, due 6/15/17 | | | 4,550,000 | | | | 4,925,375 | |
Linn Energy LLC
9.875%, due 7/1/18 | | | 2,395,000 | | | | 2,586,600 | |
Linn Energy LLC / Linn Energy Finance Corp. | | | | | | | | |
6.50%, due 5/15/19 | | | 1,175,000 | | | | 1,186,750 | |
11.75%, due 5/15/17 | | | 2,483,000 | | | | 2,718,885 | |
Newfield Exploration Co. | | | | | | | | |
5.625%, due 7/1/24 | | | 4,310,000 | | | | 4,654,800 | |
6.875%, due 2/1/20 | | | 1,630,000 | | | | 1,744,100 | |
Oasis Petroleum, Inc.
7.25%, due 2/1/19 | | | 9,740,000 | | | | 10,470,500 | |
PDC Energy, Inc.
7.75%, due 10/15/22 (f) | | | 5,435,000 | | | | 5,570,875 | |
Penn Virginia Corp. | | | | | | | | |
7.25%, due 4/15/19 | | | 3,855,000 | | | | 3,681,525 | |
10.375%, due 6/15/16 | | | 5,135,000 | | | | 5,417,425 | |
PetroHawk Energy Corp. | | | | | | | | |
7.25%, due 8/15/18 | | | 4,285,000 | | | | 4,837,538 | |
10.50%, due 8/1/14 | | | 1,410,000 | | | | 1,501,650 | |
Petroquest Energy, Inc.
10.00%, due 9/1/17 | | | 9,935,000 | | | | 10,282,725 | |
| | | | |
| M-228 | | MainStay VP High Yield Corporate Bond Portfolio | | The notes to the financial statements are an integral part of,
and should be read in conjunction with, the financial statements. |
| | | | | | | | |
| | | Principal
Amount | | | Value | |
| | | | | | | | |
| Corporate Bonds (continued) | |
Oil & Gas (continued) | | | | | | | | |
Pioneer Energy Services Corp.
9.875%, due 3/15/18 | | $ | 7,900,000 | | | $ | 8,591,250 | |
Plains Exploration & Production Co.
10.00%, due 3/1/16 | | | 3,319,000 | | | | 3,534,735 | |
Quicksilver Resources, Inc.
11.75%, due 1/1/16 | | | 7,225,000 | | | | 7,134,688 | |
Range Resources Corp. | | | | | | | | |
5.00%, due 8/15/22 | | | 1,660,000 | | | | 1,734,700 | |
8.00%, due 5/15/19 | | | 2,980,000 | | | | 3,300,350 | |
Rex Energy Corp.
8.875%, due 12/1/20 (f) | | | 6,340,000 | | | | 6,355,850 | |
SM Energy Co. | | | | | | | | |
6.50%, due 11/15/21 | | | 2,895,000 | | | | 3,097,650 | |
6.625%, due 2/15/19 | | | 3,795,000 | | | | 4,003,725 | |
Stone Energy Corp. | | | | | | | | |
7.50%, due 11/15/22 | | | 4,500,000 | | | | 4,680,000 | |
8.625%, due 2/1/17 | | | 2,400,000 | | | | 2,577,000 | |
W&T Offshore, Inc. | | | | | | | | |
8.50%, due 6/15/19 | | | 4,000,000 | | | | 4,300,000 | |
8.50%, due 6/15/19 (f) | | | 4,170,000 | | | | 4,482,750 | |
Whiting Petroleum Corp. | | | | | | | | |
6.50%, due 10/1/18 | | | 5,450,000 | | | | 5,858,750 | |
7.00%, due 2/1/14 | | | 7,891,000 | | | | 8,265,822 | |
WPX Energy, Inc.
6.00%, due 1/15/22 | | | 6,915,000 | | | | 7,450,912 | |
| | | | | | | | |
| | | | | | | 239,175,803 | |
| | | | | | | | |
Oil & Gas Services 0.3% | | | | | | | | |
American Petroleum Tankers LLC / AP Tankers Co.
10.25%, due 5/1/15 | | | 4,168,000 | | | | 4,355,560 | |
Hiland Partners, L.P. / Hiland Partners Finance Corp.
7.25%, due 10/1/20 (f) | | | 3,560,000 | | | | 3,809,200 | |
| | | | | | | | |
| | | | | | | 8,164,760 | |
| | | | | | | | |
Packaging & Containers 2.0% | | | | | | | | |
AEP Industries, Inc.
8.25%, due 4/15/19 | | | 8,490,000 | | | | 9,084,300 | |
Ball Corp. | | | | | | | | |
5.00%, due 3/15/22 | | | 3,780,000 | | | | 4,044,600 | |
6.75%, due 9/15/20 | | | 835,000 | | | | 920,587 | |
7.125%, due 9/1/16 | | | 2,790,000 | | | | 2,985,300 | |
Greif, Inc.
6.75%, due 2/1/17 | | | 3,324,000 | | | | 3,706,260 | |
Owens-Brockway Glass Container, Inc.
7.375%, due 5/15/16 | | | 1,750,000 | | | | 1,995,000 | |
Plastipak Holdings, Inc.
10.625%, due 8/15/19 (f) | | | 10,148,000 | | | | 11,594,090 | |
Sealed Air Corp.
8.125%, due 9/15/19 (f) | | | 2,045,000 | | | | 2,300,625 | |
| | | | | | | | |
| | | Principal
Amount | | | Value | |
| | | | | | | | |
Packaging & Containers (continued) | | | | | | | | |
Silgan Holdings, Inc.
5.00%, due 4/1/20 | | $ | 6,900,000 | | | $ | 7,158,750 | |
Tekni-Plex, Inc.
9.75%, due 6/1/19 (f) | | | 6,480,000 | | | | 7,063,200 | |
| | | | | | | | |
| | | | | | | 50,852,712 | |
| | | | | | | | |
Pharmaceuticals 2.3% | | | | | | | | |
BioScrip, Inc.
10.25%, due 10/1/15 | | | 3,805,000 | | | | 4,061,837 | |
Catalent Pharma Solutions, Inc.
9.50%, due 4/15/15 | | | 3,573,428 | | | | 3,645,611 | |
Endo Health Solutions, Inc.
7.00%, due 7/15/19 | | | 2,490,000 | | | | 2,654,963 | |
Grifols, Inc.
8.25%, due 2/1/18 | | | 7,400,000 | | | | 8,149,250 | |
Lantheus Medical Imaging, Inc.
9.75%, due 5/15/17 | | | 7,645,000 | | | | 7,109,850 | |
Mylan, Inc. | | | | | | | | |
7.625%, due 7/15/17 (f) | | | 2,075,000 | | | | 2,332,028 | |
7.875%, due 7/15/20 (f) | | | 4,880,000 | | | | 5,766,994 | |
NBTY, Inc.
9.00%, due 10/1/18 | | | 6,150,000 | | | | 6,949,500 | |
Valeant Pharmaceuticals International | | | | | | | | |
6.375%, due 10/15/20 (f) | | | 2,550,000 | | | | 2,734,875 | |
6.50%, due 7/15/16 (f) | | | 4,485,000 | | | | 4,714,856 | |
6.75%, due 10/1/17 (f) | | | 2,200,000 | | | | 2,376,000 | |
6.875%, due 12/1/18 (f) | | | 1,715,000 | | | | 1,847,913 | |
7.00%, due 10/1/20 (f) | | | 765,000 | | | | 831,938 | |
VPI Escrow Corp.
6.375%, due 10/15/20 (f) | | | 5,095,000 | | | | 5,464,387 | |
| | | | | | | | |
| | | | | | | 58,640,002 | |
| | | | | | | | |
Pipelines 1.9% | | | | | | | | |
ANR Pipeline Co. | | | | | | | | |
7.375%, due 2/15/24 | | | 395,000 | | | | 526,899 | |
9.625%, due 11/1/21 | | | 6,855,000 | | | | 10,370,107 | |
Atlas Pipeline Escrow LLC
6.625%, due 10/1/20 (f) | | | 1,510,000 | | | | 1,562,850 | |
Atlas Pipeline Partners, L.P. / Atlas Pipeline Finance Corp.
6.625%, due 10/1/20 (f) | | | 4,725,000 | | | | 4,890,375 | |
Chesapeake Midstream Partners, L.P. / CHKM Finance Corp.
6.125%, due 7/15/22 | | | 2,320,000 | | | | 2,499,800 | |
Copano Energy LLC / Copano Energy Finance Corp. | | | | | | | | |
7.125%, due 4/1/21 | | | 6,880,000 | | | | 7,387,400 | |
7.75%, due 6/1/18 | | | 7,365,000 | | | | 7,760,869 | |
Inergy Midstream, L.P. / NRGM Finance Corp.
6.00%, due 12/15/20 (f) | | | 2,915,000 | | | | 3,009,737 | |
| | | | | | |
The notes to the financial statements are an integral part of,
and should be read in conjunction with, the financial statements. | | mainstayinvestments.com | | | M-229 | |
Portfolio of Investments December 31, 2012 (continued)
| | | | | | | | |
| | | Principal
Amount | | | Value | |
| | | | | | | | |
| Corporate Bonds (continued) | |
Pipelines (continued) | | | | | | | | |
MarkWest Energy Partners, L.P. / MarkWest Energy Finance Corp.
6.75%, due 11/1/20 | | $ | 6,940,000 | | | $ | 7,564,600 | |
Northwest Pipeline Corp.
7.125%, due 12/1/25 | | | 2,195,000 | | | | 2,882,406 | |
| | | | | | | | |
| | | | | | | 48,455,043 | |
| | | | | | | | |
Real Estate 0.1% | | | | | | | | |
Crescent Resources LLC / Crescent Ventures, Inc.
10.25%, due 8/15/17 (f) | | | 3,290,000 | | | | 3,470,950 | |
| | | | | | | | |
| | |
Real Estate Investment Trusts 1.1% | | | | | | | | |
Felcor Lodging, L.P.
5.625%, due 3/1/23 (f) | | | 2,635,000 | | | | 2,621,825 | |
Host Hotels & Resorts, L.P. | | | | | | | | |
4.75%, due 3/1/23 | | | 7,510,000 | | | | 7,960,600 | |
5.25%, due 3/15/22 | | | 4,055,000 | | | | 4,440,225 | |
5.875%, due 6/15/19 | | | 385,000 | | | | 419,650 | |
6.00%, due 10/1/21 | | | 1,070,000 | | | | 1,227,825 | |
Series Q
6.75%, due 6/1/16 | | | 6,463,000 | | | | 6,608,417 | |
Sabra Health Care, L.P. / Sabra Capital Corp.
8.125%, due 11/1/18 | | | 4,230,000 | | | | 4,510,238 | |
Weyerhaeuser Co.
6.875%, due 12/15/33 | | | 495,000 | | | | 591,221 | |
| | | | | | | | |
| | | | | | | 28,380,001 | |
| | | | | | | | |
Retail 3.2% | | | | | | | | |
AmeriGas Finance LLC / AmeriGas Finance Corp.
6.75%, due 5/20/20 | | | 1,970,000 | | | | 2,162,075 | |
AmeriGas Partners, L.P. / AmeriGas Finance Corp. | | | | | | | | |
6.25%, due 8/20/19 | | | 2,180,000 | | | | 2,332,600 | |
6.50%, due 5/20/21 | | | 1,685,000 | | | | 1,828,225 | |
Asbury Automotive Group, Inc. | | | | | | | | |
7.625%, due 3/15/17 | | | 2,864,000 | | | | 2,957,080 | |
8.375%, due 11/15/20 | | | 7,476,000 | | | | 8,298,360 | |
AutoNation, Inc.
6.75%, due 4/15/18 | | | 5,495,000 | | | | 6,209,350 | |
DineEquity, Inc.
9.50%, due 10/30/18 | | | 12,440,000 | | | | 14,134,950 | |
J.C. Penney Corp., Inc.
7.125%, due 11/15/23 | | | 4,215,000 | | | | 3,635,437 | |
Limited Brands, Inc. | | | | | | | | |
5.625%, due 2/15/22 | | | 970,000 | | | | 1,054,875 | |
6.625%, due 4/1/21 | | | 3,610,000 | | | | 4,133,450 | |
8.50%, due 6/15/19 | | | 1,555,000 | | | | 1,897,100 | |
| | | | | | | | |
| | | Principal
Amount | | | Value | |
| | | | | | | | |
Retail (continued) | | | | | | | | |
Penske Automotive Group, Inc.
5.75%, due 10/1/22 (f) | | $ | 7,265,000 | | | $ | 7,482,950 | |
PVH Corp. | | | | | | | | |
4.50%, due 12/15/22 | | | 798,000 | | | | 805,980 | |
7.375%, due 5/15/20 | | | 2,540,000 | | | | 2,847,975 | |
Radio Systems Corp.
8.375%, due 11/1/19 (f) | | | 4,100,000 | | | | 4,274,250 | |
Sally Holdings LLC / Sally Capital, Inc. | | | | | | | | |
5.75%, due 6/1/22 | | | 3,075,000 | | | | 3,336,375 | |
6.875%, due 11/15/19 | | | 3,860,000 | | | | 4,265,300 | |
Sonic Automotive, Inc. | | | | | | | | |
7.00%, due 7/15/22 (f) | | | 3,300,000 | | | | 3,613,500 | |
9.00%, due 3/15/18 | | | 5,640,000 | | | | 6,189,900 | |
| | | | | | | | |
| | | | | | | 81,459,732 | |
| | | | | | | | |
Savings & Loans 0.2% | | | | | | | | |
Rivers Pittsburgh Borrower L.P. / Rivers Pittsburgh Finance Corp.
9.50%, due 6/15/19 (f) | | | 5,802,000 | | | | 6,295,170 | |
| | | | | | | | |
| | |
Semiconductors 0.2% | | | | | | | | |
MEMC Electronic Materials, Inc.
7.75%, due 4/1/19 | | | 4,735,000 | | | | 3,977,400 | |
| | | | | | | | |
| | |
Shipbuilding 0.2% | | | | | | | | |
Huntington Ingalls Industries, Inc. | | | | | | | | |
6.875%, due 3/15/18 | | | 2,245,000 | | | | 2,441,437 | |
7.125%, due 3/15/21 | | | 1,825,000 | | | | 1,984,688 | |
| | | | | | | | |
| | | | | | | 4,426,125 | |
| | | | | | | | |
Software 0.5% | | | | | | | | |
Fidelity National Information Services, Inc. | | | | | | | | |
7.625%, due 7/15/17 | | | 3,245,000 | | | | 3,528,937 | |
7.875%, due 7/15/20 | | | 955,000 | | | | 1,080,344 | |
Legend Acquisition Sub, Inc.
10.75%, due 8/15/20 (f) | | | 4,625,000 | | | | 4,185,625 | |
Nuance Communications, Inc.
5.375%, due 8/15/20 (f) | | | 4,710,000 | | | | 4,921,950 | |
| | | | | | | | |
| | | | | | | 13,716,856 | |
| | | | | | | | |
Storage & Warehousing 0.0%‡ | | | | | | | | |
Mobile Mini, Inc.
7.875%, due 12/1/20 | | | 280,000 | | | | 307,300 | |
| | | | | | | | |
| | |
Telecommunications 4.4% | | | | | | | | |
Clearwire Communications LLC / Clearwire Finance, Inc.
12.00%, due 12/1/15 (f) | | | 2,555,000 | | | | 2,746,625 | |
Crown Castle International Corp. | | | | | | | | |
5.25%, due 1/15/23 (f) | | | 11,845,000 | | | | 12,674,150 | |
7.125%, due 11/1/19 | | | 6,835,000 | | | | 7,552,675 | |
| | | | |
| M-230 | | MainStay VP High Yield Corporate Bond Portfolio | | The notes to the financial statements are an integral part of,
and should be read in conjunction with, the financial statements. |
| | | | | | | | |
| | | Principal
Amount | | | Value | |
| | | | | | | | |
| Corporate Bonds (continued) | |
Telecommunications (continued) | | | | | | | | |
Frontier Communications Corp.
9.25%, due 7/1/21 | | $ | 4,300,000 | | | $ | 5,041,750 | |
GCI, Inc. | | | | | | | | |
6.75%, due 6/1/21 | | | 4,300,000 | | | | 4,214,000 | |
8.625%, due 11/15/19 | | | 3,025,000 | | | | 3,214,063 | |
Hughes Satellite Systems Corp. | | | | | | | | |
6.50%, due 6/15/19 | | | 4,710,000 | | | | 5,192,775 | |
7.625%, due 6/15/21 | | | 5,860,000 | | | | 6,665,750 | |
NII Capital Corp. | | | | | | | | |
7.625%, due 4/1/21 | | | 11,950,000 | | | | 9,052,125 | |
8.875%, due 12/15/19 | | | 1,580,000 | | | | 1,256,100 | |
Satelites Mexicanos S.A. de C.V.
9.50%, due 5/15/17 | | | 7,940,000 | | | | 8,337,000 | |
SBA Telecommunications, Inc. | | | | | | | | |
5.75%, due 7/15/20 (f) | | | 3,750,000 | | | | 3,984,375 | |
8.25%, due 8/15/19 | | | 2,538,000 | | | | 2,836,215 | |
¨Sprint Capital Corp. | | | | | | | | |
6.875%, due 11/15/28 | | | 15,020,000 | | | | 15,620,800 | |
8.75%, due 3/15/32 | | | 5,920,000 | | | | 7,237,200 | |
Sprint Nextel Corp. | | | | | | | | |
6.00%, due 11/15/22 | | | 7,580,000 | | | | 7,788,450 | |
9.125%, due 3/1/17 | | | 3,765,000 | | | | 4,433,287 | |
tw telecom holdings, Inc.
5.375%, due 10/1/22 (f) | | | 3,600,000 | | | | 3,771,000 | |
| | | | | | | | |
| | | | | | | 111,618,340 | |
| | | | | | | | |
Transportation 1.1% | | | | | | | | |
Florida East Coast Holdings Corp.
10.50%, due 8/1/17 (h) | | | 1,080,938 | | | | 1,070,129 | |
Florida East Coast Railway Corp.
8.125%, due 2/1/17 | | | 12,342,000 | | | | 13,082,520 | |
KAR Holdings, Inc.
4.313%, due 5/1/14 | | | 2,475,000 | | | | 2,478,118 | |
Syncreon Global Ireland, Ltd. / Syncreon Global Finance US, Inc.
9.50%, due 5/1/18 (f) | | | 11,270,000 | | | | 11,720,800 | |
| | | | | | | | |
| | | | | | | 28,351,567 | |
| | | | | | | | |
Trucking & Leasing 0.4% | | | | | | | | |
NESCO LLC / NESCO Holdings Corp.
11.75%, due 4/15/17 (f) | | | 4,530,000 | | | | 4,869,750 | |
TRAC Intermodal LLC / TRAC Intermodal Corp.
11.00%, due 8/15/19 (f) | | | 5,690,000 | | | | 5,917,600 | |
| | | | | | | | |
| | | | | | | 10,787,350 | |
| | | | | | | | |
Total Corporate Bonds
(Cost $1,917,153,891) | | | | 2,046,364,084 | |
| | | | | | | | |
| | | | | | | | |
| | | Principal
Amount | | | Value | |
| | | | | | | | |
| Loan Assignments & Participations 2.1% (i) | |
Apparel 0.1% | | | | | | | | |
Unifi, Inc.
Term Loan
8.75%, due 5/1/17 (b)(d)(e) | | $ | 2,625,000 | | | $ | 2,703,750 | |
| | | | | | | | |
| | |
Auto Manufacturers 0.2% | | | | | | | | |
Chrysler Group LLC
Term Loan
6.00%, due 5/24/17 | | | 4,465,995 | | | | 4,557,150 | |
| | | | | | | | |
| | |
Finance 0.1% | | | | | | | | |
Ocwen Financial Corp.
Term Loan B
7.00%, due 9/1/16 | | | 1,830,707 | | | | 1,830,707 | |
| | | | | | | | |
| |
Finance—Investment Banker/Broker 0.1% | | | | | |
VFH Parent LLC
Term Loan
7.50%, due 7/8/16 | | | 3,094,260 | | | | 3,094,260 | |
| | | | | | | | |
| | |
Finance—Other Services 0.2% | | | | | | | | |
Bats Global Markets, Inc.
7.00%, due 12/19/18 | | | 6,000,000 | | | | 5,820,000 | |
| | | | | | | | |
| | |
Lodging 0.8% | | | | | | | | |
Cannery Casino Resorts LLC | | | | | | | | |
New Term Loan B
6.00%, due 10/2/18 | | | 2,493,750 | | | | 2,484,398 | |
New 2nd Lien Term Loan
10.00%, due 10/2/19 | | | 3,395,000 | | | | 3,208,275 | |
Station Casinos, Inc. | | | | | | | | |
2012 Term Loan B2
4.211%, due 6/17/16 | | | 14,406,760 | | | | 13,830,490 | |
New Term Loan B
5.50%, due 9/27/19 | | | 1,546,125 | | | | 1,555,306 | |
| | | | | | | | |
| | | | | | | 21,078,469 | |
| | | | | | | | |
Media 0.2% | | | | | | | | |
Nielsen Finance LLC
Class A Term Loan
2.21%, due 8/9/13 | | | 896,228 | | | | 896,601 | |
Proquest Co.
Term Loan B
6.00%, due 4/13/18 | | | 3,295,100 | | | | 3,303,338 | |
| | | | | | | | |
| | | | | | | 4,199,939 | |
| | | | | | | | |
Metal Fabricate & Hardware 0.2% | | | | | | | | |
Neenah Corp.
Exit Term Loan
11.00%, due 1/29/15 (b)(e) | | | 5,910,000 | | | | 5,910,000 | |
| | | | | | | | |
| | | | | | |
The notes to the financial statements are an integral part of,
and should be read in conjunction with, the financial statements. | | mainstayinvestments.com | | | M-231 | |
Portfolio of Investments December 31, 2012 (continued)
| | | | | | | | |
| | | Principal
Amount | | | Value | |
| | | | | | | | |
| Loan Assignments & Participations (continued) | |
Miscellaneous—Manufacturing 0.2% | | | | | | | | |
FGI Operating Co. LLC
Term Loan
5.50%, due 4/19/19 | | $ | 4,977,315 | | | $ | 4,840,439 | |
| | | | | | | | |
Total Loan Assignments & Participations
(Cost $52,666,597) | | | | 54,034,714 | |
| | | | | | | | |
|
| Yankee Bonds 11.5% (j) | |
Aerospace & Defense 0.2% | | | | | | | | |
Silver II Borrower / Silver II U.S. Holdings LLC
7.75%, due 12/15/20 (f) | | | 3,760,000 | | | | 3,891,600 | |
| | | | | | | | |
| | |
Auto Manufacturers 0.2% | | | | | | | | |
Jaguar Land Rover PLC
8.125%, due 5/15/21 (f) | | | 4,095,000 | | | | 4,504,500 | |
| | | | | | | | |
| | |
Auto Parts & Equipment 1.1% | | | | | | | | |
International Automotive Components Group S.A.
9.125%, due 6/1/18 (f) | | | 4,775,000 | | | | 4,428,812 | |
¨Schaeffler Finance B.V. | | | | | | | | |
7.75%, due 2/15/17 (f) | | | 13,700,000 | | | | 15,207,000 | |
8.50%, due 2/15/19 (f) | | | 6,560,000 | | | | 7,412,800 | |
| | | | | | | | |
| | | | | | | 27,048,612 | |
| | | | | | | | |
Chemicals 0.4% | | | | | | | | |
Ineos Finance PLC
7.50%, due 5/1/20 (f) | | | 6,635,000 | | | | 6,950,163 | |
NOVA Chemicals Corp.
8.375%, due 11/1/16 | | | 3,835,000 | | | | 4,199,325 | |
| | | | | | | | |
| | | | | | | 11,149,488 | |
| | | | | | | | |
Computers 0.4% | | | | | | | | |
Seagate HDD Cayman | | | | | | | | |
7.00%, due 11/1/21 | | | 5,220,000 | | | | 5,598,450 | |
7.75%, due 12/15/18 | | | 4,100,000 | | | | 4,504,875 | |
| | | | | | | | |
| | | | | | | 10,103,325 | |
| | | | | | | | |
Diversified Financial Services 0.7% | | | | | | | | |
National Money Mart Co.
10.375%, due 12/15/16 | | | 7,910,000 | | | | 8,740,550 | |
Smurfit Kappa Treasury Funding Ltd
7.50%, due 11/20/25 | | | 8,835,000 | | | | 9,254,662 | |
| | | | | | | | |
| | | | | | | 17,995,212 | |
| | | | | | | | |
Entertainment 0.4% | | | | | | | | |
MU Finance PLC
8.375%, due 2/1/17 (f) | | | 8,938,209 | | | | 9,720,302 | |
| | | | | | | | |
| | | | | | | | |
| | | Principal
Amount | | | Value | |
| | | | | | | | |
Forest Products & Paper 0.2% | | | | | | | | |
Sappi Papier Holding GmbH | | | | | | | | |
6.625%, due 4/15/21 (f) | | $ | 1,900,000 | | | $ | 1,876,250 | |
8.375%, due 6/15/19 (f) | | | 1,100,000 | | | | 1,201,750 | |
Smurfit Kappa Acquisitions
4.875%, due 9/15/18 (f) | | | 2,325,000 | | | | 2,371,500 | |
| | | | | | | | |
| | | | | | | 5,449,500 | |
| | | | | | | | |
Holding Company—Diversified 0.2% | | | | | | | | |
CFG Holdings, Ltd. / CFG Finance LLC
11.50%, due 11/15/19 (f) | | | 5,000,000 | | | | 5,000,000 | |
| | | | | | | | |
| |
Home Builders 0.3% | | | | | |
Brookfield Residential Properties, Inc.
6.50%, due 12/15/20 (f) | | | 7,885,000 | | | | 8,082,125 | |
| | | | | | | | |
| |
Insurance 0.4% | | | | | |
Fairfax Financial Holdings, Ltd. | | | | | | | | |
7.375%, due 4/15/18 | | | 3,015,000 | | | | 3,437,100 | |
7.75%, due 7/15/37 | | | 1,260,000 | | | | 1,439,240 | |
8.30%, due 4/15/26 | | | 4,645,000 | | | | 5,543,738 | |
| | | | | | | | |
| | | | | | | 10,420,078 | |
| | | | | | | | |
Iron & Steel 0.1% | | | | | |
APERAM | | | | | | | | |
7.375%, due 4/1/16 (f) | | | 3,295,000 | | | | 3,072,588 | |
7.75%, due 4/1/18 (f) | | | 5,000 | | | | 4,400 | |
| | | | | | | | |
| | | | | | | 3,076,988 | |
| | | | | | | | |
Leisure Time 0.6% | | | | | |
Carlson Wagonlit B.V.
6.875%, due 6/15/19 (f) | | | 14,005,000 | | | | 14,775,275 | |
| | | | | | | | |
| |
Media 1.4% | | | | | |
Quebecor Media, Inc. | | | | | | | | |
5.75%, due 1/15/23 (f) | | | 9,100,000 | | | | 9,589,125 | |
7.75%, due 3/15/16 | | | 6,280,000 | | | | 6,437,000 | |
Videotron Ltee | | | | | | | | |
5.00%, due 7/15/22 | | | 4,385,000 | | | | 4,598,769 | |
6.375%, due 12/15/15 | | | 2,425,000 | | | | 2,457,010 | |
9.125%, due 4/15/18 | | | 12,630,000 | | | | 13,450,950 | |
| | | | | | | | |
| | | | | | | 36,532,854 | |
| | | | | | | | |
Mining 1.1% | | | | | |
New Gold, Inc. | | | | | | | | |
6.25%, due 11/15/22 (f) | | | 5,900,000 | | | | 6,106,500 | |
7.00%, due 4/15/20 (f) | | | 7,640,000 | | | | 8,155,700 | |
Novelis, Inc. | | | | | | | | |
8.375%, due 12/15/17 | | | 4,205,000 | | | | 4,636,012 | |
8.75%, due 12/15/20 | | | 2,810,000 | | | | 3,133,150 | |
Thompson Creek Metals Co., Inc.
9.75%, due 12/1/17 | | | 4,970,000 | | | | 5,268,200 | |
| | | | | | | | |
| | | | | | | 27,299,562 | |
| | | | | | | | |
| | | | |
| M-232 | | MainStay VP High Yield Corporate Bond Portfolio | | The notes to the financial statements are an integral part of,
and should be read in conjunction with, the financial statements. |
| | | | | | | | |
| | | Principal
Amount | | | Value | |
| | | | | | | | |
| Yankee Bonds (continued) | |
Oil & Gas 0.2% | | | | | |
OGX Austria GmbH
8.50%, due 6/1/18 (f) | | $ | 6,895,000 | | | $ | 6,205,500 | |
| | | | | | | | |
| |
Oil & Gas Services 0.3% | | | | | |
Expro Finance Luxembourg SCA
8.50%, due 12/15/16 (f) | | | 7,778,000 | | | | 8,128,010 | |
| | | | | | | | |
| |
Pharmaceuticals 0.4% | | | | | |
ConvaTec Healthcare E S.A.
10.50%, due 12/15/18 (f) | | | 7,095,000 | | | | 7,822,238 | |
Warner Chilcott Co., LLC / Warner Chilcott Co., LLC
7.75%, due 9/15/18 | | | 2,435,000 | | | | 2,593,275 | |
| | | | | | | | |
| | | | | | | 10,415,513 | |
| | | | | | | | |
Real Estate 0.1% | | | | | |
Mattamy Group Corp.
6.50%, due 11/15/20 (f) | | | 2,460,000 | | | | 2,466,150 | |
| | | | | | | | |
| |
Storage & Warehousing 1.0% | | | | | |
¨Algeco Scotsman Global Finance PLC | | | | | | | | |
8.50%, due 10/15/18 (f) | | | 13,090,000 | | | | 13,548,150 | |
10.75%, due 10/15/19 (f) | | | 11,805,000 | | | | 11,627,925 | |
| | | | | | | | |
| | | | | | | 25,176,075 | |
| | | | | | | | |
Telecommunications 1.8% | | | | | |
¨Intelsat Jackson Holdings S.A. | | | | | | | | |
6.625%, due 12/15/22 (f) | | | 4,500,000 | | | | 4,646,250 | |
7.25%, due 4/1/19 | | | 5,295,000 | | | | 5,692,125 | |
7.25%, due 10/15/20 (f) | | | 7,780,000 | | | | 8,441,300 | |
7.50%, due 4/1/21 | | | 3,665,000 | | | | 4,040,663 | |
Intelsat Luxembourg S.A.
11.25%, due 2/4/17 | | | 4,645,000 | | | | 4,912,087 | |
Sable International Finance, Ltd. | | | | | | | | |
7.75%, due 2/15/17 (f) | | | 7,145,000 | | | | 7,645,150 | |
8.75%, due 2/1/20 (f) | | | 3,600,000 | | | | 4,122,000 | |
Virgin Media Finance PLC
8.375%, due 10/15/19 | | | 4,455,000 | | | | 5,056,425 | |
| | | | | | | | |
| | | | | | | 44,556,000 | |
| | | | | | | | |
Total Yankee Bonds
(Cost $274,602,330) | | | | 291,996,669 | |
| | | | | | | | |
Total Long-Term Bonds
(Cost $2,259,544,270) | | | | 2,408,409,612 | |
| | | | | | | | |
| | |
| | | | | | | | |
| | | | | | | | |
| | |
| | | Shares | | | Value | |
| | | | | | | | |
| Common Stocks 0.8% | |
Coal 0.0%‡ | | | | | |
Upstate NY Power Producers (b)(d)(e) | | | 19,474 | | | $ | 331,058 | |
| | | | | | | | |
| |
Media 0.0%‡ | | | | | |
Adelphia Contingent Value Vehicle (b)(d)(e)(g) | | | 2,207,279 | | | | 22,073 | |
| | | | | | | | |
| |
Metal Fabricate & Hardware 0.1% | | | | | |
Neenah Enterprises, Inc. (b)(e)(g) | | | 230,859 | | | | 1,371,302 | |
| | | | | | | | |
| |
Mining 0.3% | | | | | |
Goldcorp, Inc. | | | 211,500 | | | | 7,762,050 | |
| | | | | | | | |
| |
Oil & Gas 0.4% | | | | | |
¨Concho Resources, Inc. (g) | | | 44,500 | | | | 3,584,920 | |
Continental Resources, Inc. (g) | | | 47,800 | | | | 3,512,822 | |
Whiting Petroleum Corp. (g) | | | 80,091 | | | | 3,473,547 | |
| | | | | | | | |
| | | | | | | 10,571,289 | |
| | | | | | | | |
Total Common Stocks
(Cost $21,500,636) | | | | 20,057,772 | |
| | | | | | | | |
| | |
| Preferred Stock 0.1% | | | | | | | | |
Savings & Loans 0.1% | | | | | | | | |
GMAC Capital Trust I
8.125% | | | 124,200 | | | | 3,309,930 | |
| | | | | | | | |
Total Preferred Stock
(Cost $3,028,994) | | | | 3,309,930 | |
| | | | | | | | |
| | |
| | | | | | | | |
| | | Number of
Warrants | | | | |
| Warrants 0.0%‡ | | | | | | | | |
Food 0.0%‡ | | | | | | | | |
ASG Corp. Expires 5/15/18 (b)(d)(g) | | | 3,370 | | | | 101,100 | |
| | | | | | | | |
| | |
Media 0.0%‡ | | | | | | | | |
ION Media Networks, Inc. | | | | | | | | |
Second Lien Expires 12/18/39 (b)(d)(e)(g) | | | 365 | | | | 4 | |
Unsecured Debt Expires 12/18/16 (b)(d)(e)(g) | | | 360 | | | | 3 | |
| | | | | | | | |
| | | | | | | 7 | |
| | | | | | | | |
Total Warrants
(Cost $1,099) | | | | 101,107 | |
| | | | | | | | |
| | |
| | | | | | | | |
| | | | | | |
The notes to the financial statements are an integral part of,
and should be read in conjunction with, the financial statements. | | mainstayinvestments.com | | | M-233 | |
Portfolio of Investments December 31, 2012 (continued)
| | | | | | | | |
| | | Principal
Amount | | | Value | |
| | | | | | | | |
| Short-Term Investment 2.8% | | | | | | | | |
Repurchase Agreement 2.8% | | | | | | | | |
State Street Bank and Trust Co.
0.01%, dated 12/31/12
due 1/2/13
Proceeds at Maturity $72,076,516 (Collateralized by a Federal National Mortgage Association security with a rate of 2.17% and a maturity date of 11/7/22, with a Principal Amount of $73,210,000 and a Market Value of $73,518,727) | | $ | 72,076,476 | | | $ | 72,076,476 | |
| | | | | | | | |
Total Short-Term Investment
(Cost $72,076,476) | | | | 72,076,476 | |
| | | | | | | | |
Total Investments
(Cost $2,356,151,475) (k) | | | 98.2 | % | | | 2,503,954,897 | |
Other Assets, Less Liabilities | | | 1.8 | | | | 45,547,092 | |
Net Assets | | | 100.0 | % | | $ | 2,549,501,989 | |
| ‡ | Less than one-tenth of a percent. |
| (a) | Floating rate—Rate shown is the rate in effect as of December 31, 2012. |
| (b) | Illiquid security. The total market value of these securities as of December 31, 2012 is $44,517,424, which represents 1.8% of the Portfolio’s net assets. |
| (e) | Fair valued security. The total market value of these securities as of December 31, 2012 is $29,651,935, which represents 1.2% of the Portfolio’s net assets. |
| (f) | May be sold to institutional investors only under Rule 144A or securities offered pursuant to Section 4(2) of the Securities Act of 1933, as amended. |
| (g) | Non-income producing security. |
| (h) | PIK (“Payment in Kind”)—interest or dividend payment is made with additional securities. |
| (i) | Floating Rate Loan—generally pays interest at rates which are periodically re-determined at a margin above the London InterBank Offered Rate or other short-term rates. The rate shown is the rate(s) in effect as of December 31, 2012. Floating Rate Loans are generally considered restricted in that the Portfolio is ordinarily contractually obligated to receive consent from the Agent Bank and/or borrower prior to disposition of a Floating Rate Loan. |
| (j) | Yankee Bond—Dollar-denominated bond issued in the United States by a foreign bank or corporation. |
| (k) | As of December 31, 2012, cost is $2,356,343,334 for federal income tax purposes and net unrealized appreciation is as follows: |
| | | | |
Gross unrealized appreciation | | $ | 163,099,187 | |
Gross unrealized depreciation | | | (15,487,624 | ) |
| | | | |
Net unrealized appreciation | | $ | 147,611,563 | |
| | | | |
| | | | |
| M-234 | | MainStay VP High Yield Corporate Bond Portfolio | | The notes to the financial statements are an integral part of,
and should be read in conjunction with, the financial statements. |
The following is a summary of the fair valuations according to the inputs used as of December 31, 2012, for valuing the Portfolio’s assets.
Asset Valuation Inputs
| | | | | | | | | | | | | | | | |
Description | | Quoted Prices
in Active Markets
for Identical Assets (Level 1) | | | Significant Other
Observable Inputs (Level 2) | | | Significant
Unobservable
Inputs (Level 3) | | | Total | |
| Investments in Securities (a) | | | | | | | | | | | | | | | | |
| Long-Term Bonds | | | | | | | | | | | | | | | | |
Convertible Bonds (b) | | $ | — | | | $ | 14,093,256 | | | $ | 1,920,889 | | | $ | 16,014,145 | |
Corporate Bonds (c) | | | — | | | | 2,028,971,228 | | | | 17,392,856 | | | | 2,046,364,084 | |
Loan Assignments & Participations (d) | | | — | | | | 40,381,982 | | | | 13,652,732 | (e) | | | 54,034,714 | |
Yankee Bonds | | | — | | | | 291,996,669 | | | | — | | | | 291,996,669 | |
| | | | | | | | | | | | | | | | |
| Total Long-Term Bonds | | | — | | | | 2,375,443,135 | | | | 32,966,477 | | | | 2,408,409,612 | |
| | | | | | | | | | | | | | | | |
| Common Stocks (f) | | | 18,333,339 | | | | — | | | | 1,724,433 | | | | 20,057,772 | |
| Preferred Stock | | | 3,309,930 | | | | — | | | | — | | | | 3,309,930 | |
| Warrants (g) | | | 101,100 | | | | — | | | | 7 | | | | 101,107 | |
| Short-Term Investment | | | | | | | | | | | | | | | | |
Repurchase Agreement | | | — | | | | 72,076,476 | | | | — | | | | 72,076,476 | |
| | | | | | | | | | | | | | | | |
| Total Investments in Securities | | $ | 21,744,369 | | | $ | 2,447,519,611 | | | $ | 34,690,917 | | | $ | 2,503,954,897 | |
| | | | | | | | | | | | | | | | |
| (a) | For a complete listing of investments and their industries, see the Portfolio of Investments. |
| (b) | The Level 3 securities valued at $1,919,799 and $1,090 are held in Coal and Internet within the Convertible Bonds section of the Portfolio of Investments. |
| (c) | The Level 3 securities valued at $4,022, $138,880, $599,422, $10,256,032 and $6,394,500 are held in Auto Parts & Equipment, Commercial Services, Electric, Entertainment and Food, respectively, within the Corporate Bonds section of the Portfolio of Investments. |
| (d) | The Level 3 securities valued at $2,703,750 and $5,910,000 are held in Apparel and Metal Fabricate & Hardware within the Loan Assignments & Participations section of the Portfolio of Investments. |
| (e) | Includes $1,830,707 and $3,208,275 of Level 3 securities held in Finance and Lodging which represent Loan Assignments & Participations whose value was obtained from an independent pricing service which utilized a single broker quote to determine such value with significant unobservable inputs. |
| (f) | The Level 3 securities valued at $331,058, $22,073 and $1,371,302 are held in Coal, Media and Metal Fabricate & Hardware, respectively, within the Common Stocks section of the Portfolio of Investments. |
| (g) | The Level 3 securities valued at $7 are held in Media within the Warrants section of the Portfolio of Investments. |
The Portfolio recognizes transfers between the levels as of the beginning of the period.
For the year ended December 31, 2012, the Portfolio did not have any transfers between Level 1 and Level 2 fair value measurements. (See Note 2)
During the year ended December 31, 2012, a corporate bond with a total value of $2,337,318 transferred from Level 2 to Level 3. The transfer occurred as a result of the corporate bond being valued by methods deemed in good faith by the Fund’s Valuation Committee utilizing significant unobservable inputs as of December 31, 2012. The fair value obtained for this corporate bond from the independent pricing service as of December 31, 2011 utilized observable inputs.
| | | | | | |
The notes to the financial statements are an integral part of,
and should be read in conjunction with, the financial statements. | | mainstayinvestments.com | | | M-235 | |
Portfolio of Investments December 31, 2012 (continued)
The following is a reconciliation of investments in which significant unobservable inputs (Level 3) were used in determining value:
| | | | | | | | | | | | | | | | | | | | | | | | | | | | | | | | | | | | | | | | |
Investments
in Securities | | Balance
as of
December 31,
2011 | | | Accrued
Discounts
(Premiums) | | | Realized
Gain
(Loss) | | | Change in
Unrealized
Appreciation
(Depreciation) | | | Purchases | | | Sales | | | Transfers
in to Level
3 | | | Transfers
out of
Level 3 | | | Balance
as of
December 31,
2012 | | | Change in
Unrealized
Appreciation
(Depreciation)
from
Investments
Still Held at
December 31,
2012 (a) | |
| Long-Term Bonds | | | | | | | | | | | | | | | | | | | | | | | | | | | | | | | | | | | | | | | | |
Convertible Bonds | | | | | | | | | | | | | | | | | | | | | | | | | | | | | | | | | | | | | | | | |
Coal | | $ | — | | | $ | — | | | $ | — | | | $ | 487,599 | | | $ | 1,432,200 | (b) | | $ | — | | | $ | — | | | $ | — | | | $ | 1,919,799 | | | $ | 487,599 | |
Internet | | | 1,090 | | | | — | | | | — | | | | — | | | | — | | | | — | | | | — | | | | — | | | | 1,090 | | | | — | |
Corporate Bonds | | | | | | | | | | | | | | | | | | | | | | | | | | | | | | | | | | | | | | | | |
Auto Parts & Equipment | | | 4,022 | | | | — | | | | | | | | — | | | | — | | | | — | | | | — | | | | — | | | | 4,022 | | | | — | |
Commercial Services | | | 312,544 | | | | — | | | | — | | | | (158,454 | ) | | | — | | | | (15,210 | ) | | | — | | | | — | | | | 138,880 | | | | — | |
Electric | | | — | | | | — | | | | (4,996,118 | ) | | | 3,589,272 | | | | 599,422 | (b) | | | (930,472 | ) | | | 2,337,318 | | | | — | | | | 599,422 | | | | — | |
Entertainment | | | 350,397 | | | | 13,119 | | | | 17,801 | | | | 9,522 | | | | 10,000,000 | | | | (134,807 | ) | | | — | | | | — | | | | 10,256,032 | | | | (13,119 | ) |
Food | | | 6,331,500 | | | | — | | | | — | | | | 63,000 | | | | — | | | | — | | | | — | | | | — | | | | 6,394,500 | | | | 63,000 | |
Insurance | | | 30,935 | | | | — | | | | (2,650,841 | ) | | | 2,619,906 | | | | — | | | | — | | | | — | | | | — | | | | — | | | | — | |
Loan Assignments & Participations | | | | | | | | | | | | | | | | | | | | | | | | | | | | | | | | | | | | | | | | |
Apparel | | | — | | | | 4,798 | | | | 173,434 | | | | 101,768 | | | | 6,930,000 | | | | (4,506,250 | )(c) | | | — | | | | — | | | | 2,703,750 | | | | 101,768 | |
Finance | | | 4,270,191 | | | | 14,844 | | | | 39,714 | | | | 21,501 | | | | — | | | | (2,515,543 | )(c) | | | — | | | | — | | | | 1,830,707 | | | | 17,194 | |
Lodging | | | — | | | | 1,406 | | | | — | | | | (131,419 | ) | | | 3,338,288 | | | | — | | | | — | | | | — | | | | 3,208,275 | | | | (131,419 | ) |
Machinery | | | 12,385 | | | | (19,837 | ) | | | (2,976,048 | ) | | | 2,983,500 | | | | — | | | | — | | | | — | | | | — | | | | — | | | | — | |
Metal Fabricate & Hardware | | | 5,970,000 | | | | — | | | | — | | | | — | | | | — | | | | (60,000 | )(c) | | | — | | | | — | | | | 5,910,000 | | | | — | |
| Common Stocks | | | | | | | | | | | | | | | | | | | | | | | | | | | | | | | | | | | | | | | | |
Coal | | | — | | | | — | | | | — | | | | 8 | | | | 331,050 | (b) | | | — | | | | — | | | | — | | | | 331,058 | | | | — | |
Media | | | 22,073 | | | | — | | | | — | | | | — | | | | — | | | | — | | | | — | | | | — | | | | 22,073 | | | | — | |
Metal, Fabricate & Hardware | | | 1,371,302 | | | | — | | | | — | | | | — | | | | — | | | | — | | | | — | | | | — | | | | 1,371,302 | | | | — | |
| Warrants | | | | | | | | | | | | | | | — | | | | | | | | | | | | | | | | | | | | | | | | | |
Media | | | 7 | | | | — | | | | — | | | | | | �� | | | | | | — | | | | — | | | | — | | | | 7 | | | | — | |
| | | | | | | | | | | | | | | | | | | | | | | | | | | | | | | | | | | | | | | | |
| Total | | $ | 18,676,446 | | | $ | 14,330 | | | $ | (10,392,058 | ) | | $ | 9,586,203 | | | $ | 22,630,960 | | | $ | (8,162,282 | ) | | $ | 2,337,318 | | | $ | — | | | $ | 34,690,917 | | | $ | 525,023 | |
| | | | | | | | | | | | | | | | | | | | | | | | | | | | | | | | | | | | | | | | |
| (a) | Included in “Net change in unrealized appreciation (depreciation) on investments” in the Statement of Operations. |
| (b) | Purchases include securities received from a restructure. |
| (c) | Sales include principal reductions. |
| | | | |
| M-236 | | MainStay VP High Yield Corporate Bond Portfolio | | The notes to the financial statements are an integral part of,
and should be read in conjunction with, the financial statements. |
Statement of Assets and Liabilities as of December 31, 2012
| | | | |
| Assets | |
Investment in securities, at value
(identified cost $2,356,151,475) | | $ | 2,503,954,897 | |
Cash | | | 216,054 | |
Receivables: | | | | |
Dividends and interest | | | 40,125,834 | |
Fund shares sold | | | 5,693,786 | |
Investment securities sold | | | 2,405,270 | |
Other assets | | | 531 | |
| | | | |
Total assets | | | 2,552,396,372 | |
| | | | |
| |
| Liabilities | | | | |
Payables: | | | | |
Manager (See Note 3) | | | 1,195,048 | |
Fund shares redeemed | | | 1,028,554 | |
NYLIFE Distributors (See Note 3) | | | 382,539 | |
Shareholder communication | | | 197,740 | |
Professional fees | | | 80,981 | |
Custodian | | | 5,911 | |
Trustees | | | 3,610 | |
| | | | |
Total liabilities | | | 2,894,383 | |
| | | | |
Net assets | | $ | 2,549,501,989 | |
| | | | |
| |
| Net Assets Consist of | | | | |
Shares of beneficial interest outstanding (par value of $.001 per share) unlimited number of shares authorized | | $ | 251,821 | |
Additional paid-in capital | | | 2,373,768,112 | |
| | | | |
| | | 2,374,019,933 | |
Undistributed net investment income | | | 148,068,224 | |
Accumulated net realized gain (loss) on investments | | | (120,389,590 | ) |
Net unrealized appreciation (depreciation) on investments | | | 147,803,422 | |
| | | | |
Net assets | | $ | 2,549,501,989 | |
| | | | |
| | | | |
Initial Class | | | | |
Net assets applicable to outstanding shares | | $ | 718,047,090 | |
| | | | |
Shares of beneficial interest outstanding | | | 70,466,715 | |
| | | | |
Net asset value per share outstanding | | $ | 10.19 | |
| | | | |
Service Class | | | | |
Net assets applicable to outstanding shares | | $ | 1,831,454,899 | |
| | | | |
Shares of beneficial interest outstanding | | | 181,354,573 | |
| | | | |
Net asset value per share outstanding | | $ | 10.10 | |
| | | | |
| | | | | | |
The notes to the financial statements are an integral part of,
and should be read in conjunction with, the financial statements. | | mainstayinvestments.com | | | M-237 | |
Statement of Operations for the year ended December 31, 2012
| | | | |
| Investment Income (Loss) | |
Income | | | | |
Interest | | $ | 166,565,015 | |
Dividends (a) | | | 686,912 | |
| | | | |
Total income | | | 167,251,927 | |
| | | | |
Expenses | | | | |
Manager (See Note 3) | | | 12,548,538 | |
Distribution and service—Service Class (See Note 3) | | | 3,872,008 | |
Shareholder communication | | | 382,706 | |
Professional fees | | | 167,907 | |
Trustees | | | 59,262 | |
Custodian | | | 35,896 | |
Miscellaneous | | | 69,088 | |
| | | | |
Total expenses | | | 17,135,405 | |
| | | | |
Net investment income (loss) | | | 150,116,522 | |
| | | | |
|
| Realized and Unrealized Gain (Loss) on Investments | |
Net realized gain (loss) on: | | | | |
Security transactions | | | 12,271,567 | |
Foreign currency transactions | | | (37 | ) |
| | | | |
Net realized gain (loss) on investments and foreign currency transactions | | | 12,271,530 | |
| | | | |
Net change in unrealized appreciation (depreciation) on: | | | | |
Investments | | | 114,007,730 | |
Translation of other assets and liabilities in foreign currencies | | | 37 | |
| | | | |
Net change in unrealized appreciation (depreciation) on investments and foreign currency transactions | | | 114,007,767 | |
| | | | |
Net realized and unrealized gain (loss) on investments | | | 126,279,297 | |
| | | | |
Net increase (decrease) in net assets resulting from operations | | $ | 276,395,819 | |
| | | | |
| (a) | Dividends recorded net of foreign withholding taxes in the amount of $23,119. |
| | | | |
| M-238 | | MainStay VP High Yield Corporate Bond Portfolio | | The notes to the financial statements are an integral part of,
and should be read in conjunction with, the financial statements. |
Statements of Changes in Net Assets
for the years ended December 31, 2012 and December 31, 2011
| | | | | | | | |
| | | 2012 | | | 2011 | |
| Increase (Decrease) in Net Assets | |
| Operations: | | | | | | | | |
Net investment income (loss) | | $ | 150,116,522 | | | $ | 132,917,883 | |
Net realized gain (loss) on investments and foreign currency transactions | | | 12,271,530 | | | | 32,469,352 | |
Net change in unrealized appreciation (depreciation) on investments, unfunded commitments and foreign currency transactions | | | 114,007,767 | | | | (53,276,856 | ) |
| | | | |
Net increase (decrease) in net assets resulting from operations | | | 276,395,819 | | | | 112,110,379 | |
| | | | |
| Dividends to shareholders: | | | | | | | | |
From net investment income: | | | | | | | | |
Initial Class | | | (40,276,749 | ) | | | (41,276,486 | ) |
Service Class | | | (92,907,075 | ) | | | (76,391,318 | ) |
| | | | |
Total dividends to shareholders | | | (133,183,824 | ) | | | (117,667,804 | ) |
| | | | |
Capital share transactions: | | | | | | | | |
Net proceeds from sale of shares | | | 533,280,971 | | | | 342,624,108 | |
Net asset value of shares issued to shareholders in reinvestment of dividends | | | 133,183,824 | | | | 117,667,804 | |
Cost of shares redeemed | | | (220,118,314 | ) | | | (347,950,872 | ) |
| | | | |
Increase (decrease) in net assets derived from capital share transactions | | | 446,346,481 | | | | 112,341,040 | |
| | | | |
Net increase (decrease) in net assets | | | 589,558,476 | | | | 106,783,615 | |
| | |
| Net Assets | | | | | | | | |
Beginning of year | | | 1,959,943,513 | | | | 1,853,159,898 | |
| | | | |
End of year | | $ | 2,549,501,989 | | | $ | 1,959,943,513 | |
| | | | |
Undistributed net investment income at end of year | | $ | 148,068,224 | | | $ | 132,769,218 | |
| | | | |
| | | | | | |
The notes to the financial statements are an integral part of,
and should be read in conjunction with, the financial statements. | | mainstayinvestments.com | | | M-239 | |
Financial Highlights selected per share data and ratios
| | | | | | | | | | | | | | | | | | | | |
| | | Initial Class | |
| | | Year ended December 31, | |
| | | 2012 | | | 2011 | | | 2010 | | | 2009 | | | 2008 | |
Net asset value at beginning of year | | $ | 9.52 | | | $ | 9.59 | | | $ | 9.03 | | | $ | 6.79 | | | $ | 10.08 | |
| | | | | | | | | | | | | | | | | | | | |
Net investment income (loss) (a) | | | 0.69 | | | | 0.70 | | | | 0.70 | | | | 0.67 | | | | 0.76 | |
Net realized and unrealized gain (loss) on investments | | | 0.57 | | | | (0.14 | ) | | | 0.43 | | | | 2.22 | | | | (3.16 | ) |
Net realized and unrealized gain (loss) on foreign currency transactions | | | — | | | | 0.00 | ‡ | | | 0.00 | ‡ | | | 0.00 | ‡ | | | (0.00 | )‡ |
| | | | | | | | | | | | | | | | | | | | |
Total from investment operations | | | 1.26 | | | | 0.56 | | | | 1.13 | | | | 2.89 | | | | (2.40 | ) |
| | | | | | | | | | | | | | | | | | | | |
Less dividends: | | | | | | | | | | | | | | | | | | | | |
From net investment income | | | (0.59 | ) | | | (0.63 | ) | | | (0.57 | ) | | | (0.65 | ) | | | (0.89 | ) |
| | | | | | | | | | | | | | | | | | | | |
Net asset value at end of year | | $ | 10.19 | | | $ | 9.52 | | | $ | 9.59 | | | $ | 9.03 | | | $ | 6.79 | |
| | | | | | | | | | | | | | | | | | | | |
Total investment return | | | 13.42 | % | | | 6.26 | % | | | 12.67 | % | | | 42.82 | % | | | (24.11 | %) |
Ratios (to average net assets)/Supplemental Data: | | | | | | | | | | | | | | | | | | | | |
Net investment income (loss) | | | 6.86 | % | | | 7.14 | % | | | 7.40 | % | | | 8.23 | % | | | 8.20 | % |
Net expenses | | | 0.59 | % | | | 0.60 | % | | | 0.61 | % | | | 0.62 | % | | | 0.59 | % |
Portfolio turnover rate | | | 30 | % | | | 39 | % | | | 45 | % | | | 43 | % | | | 24 | % |
Net assets at end of year (in 000’s) | | $ | 718,047 | | | $ | 661,780 | | | $ | 729,071 | | | $ | 700,295 | | | $ | 506,827 | |
| ‡ | Less than one cent per share. |
| (a) | Per share data based on average shares outstanding during the year. |
| | | | | | | | | | | | | | | | | | | | |
| | | Service Class | |
| | | Year ended December 31, | |
| | | 2012 | | | 2011 | | | 2010 | | | 2009 | | | 2008 | |
Net asset value at beginning of year | | $ | 9.44 | | | $ | 9.53 | | | $ | 8.98 | | | $ | 6.76 | | | $ | 10.03 | |
| | | | | | | | | | | | | | | | | | | | |
Net investment income (loss) (a) | | | 0.66 | | | | 0.67 | | | | 0.67 | | | | 0.65 | | | | 0.73 | |
Net realized and unrealized gain (loss) on investments | | | 0.57 | | | | (0.15 | ) | | | 0.44 | | | | 2.21 | | | | (3.14 | ) |
Net realized and unrealized gain (loss) on foreign currency transactions | | | — | | | | 0.00 | ‡ | | | 0.00 | ‡ | | | 0.00 | ‡ | | | (0.00 | )‡ |
| | | | | | | | | | | | | | | | | | | | |
Total from investment operations | | | 1.23 | | | | 0.52 | | | | 1.11 | | | | 2.86 | | | | (2.41 | ) |
| | | | | | | | | | | | | | | | | | | | |
Less dividends: | | | | | | | | | | | | | | | | | | | | |
From net investment income | | | (0.57 | ) | | | (0.61 | ) | | | (0.56 | ) | | | (0.64 | ) | | | (0.86 | ) |
| | | | | | | | | | | | | | | | | | | | |
Net asset value at end of year | | $ | 10.10 | | | $ | 9.44 | | | $ | 9.53 | | | $ | 8.98 | | | $ | 6.76 | |
| | | | | | | | | | | | | | | | | | | | |
Total investment return | | | 13.14 | % | | | 5.99 | % | | | 12.39 | % | | | 42.47 | % | | | (24.30 | %) |
Ratios (to average net assets)/Supplemental Data: | | | | | | | | | | | | | | | | | | | | |
Net investment income (loss) | | | 6.61 | % | | | 6.89 | % | | | 7.16 | % | | | 7.90 | % | | | 7.99 | % |
Net expenses | | | 0.84 | % | | | 0.85 | % | | | 0.86 | % | | | 0.87 | % | | | 0.84 | % |
Portfolio turnover rate | | | 30 | % | | | 39 | % | | | 45 | % | | | 43 | % | | | 24 | % |
Net assets at end of year (in 000’s) | | $ | 1,831,455 | | | $ | 1,298,164 | | | $ | 1,124,089 | | | $ | 859,870 | | | $ | 430,738 | |
| ‡ | Less than one cent per share. |
| (a) | Per share data based on average shares outstanding during the year. |
| | | | |
| M-240 | | MainStay VP High Yield Corporate Bond Portfolio | | The notes to the financial statements are an integral part of,
and should be read in conjunction with, the financial statements. |
MainStay VP ICAP Select Equity Portfolio
Investment and Performance Comparison (Unaudited)
Performance data quoted represents past performance. Past performance is no guarantee of future results. Because of market volatility, current performance may be lower or higher than the figures shown. Investment return and principal value will fluctuate, and as a result, when shares are redeemed, they may be worth more or less than their original cost. The performance table and graph do not reflect any deduction of sales charges, mortality and expense charges, contract charges or administrative charges. Please refer to the Performance Summary appropriate for your policy. For performance information current to the most recent month-end, please call 800-598-2019 or visit www.newyorklife.com.
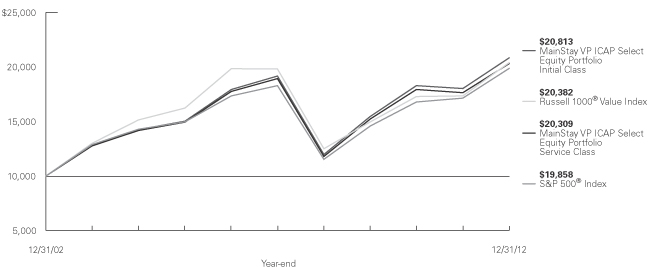
Average Annual Total Returns for the Year Ended December 31, 2012
| | | | | | | | | | | | |
| Class | | One Year | | Five Years | | Ten Years1 | | | Gross Expense Ratio2 | |
| Initial Class Shares | | 15.58% | | 1.68% | | | 7.61 | % | | | 0.80 | % |
| Service Class Shares3 | | 15.29 | | 1.42 | | | 7.34 | | | | 1.05 | |
| | | | | | | | | | | | |
| Benchmark Performance | | One
Year | | | Five
Years | | | Ten
Years | |
Russell 1000® Value Index4 | | | 17.51 | % | | | 0.59 | % | | | 7.38 | % |
| S&P 500® Index4 | | | 16.00 | | | | 1.66 | | | | 7.10 | |
Average Lipper Variable Products Large-Cap Value Portfolio5 | | | 15.71 | | | | 0.35 | | | | 6.54 | |
| 1. | Performance figures shown for the ten-year period ended December 31, 2012 reflect nonrecurring reimbursements from affiliates for printing and mailing costs. If these nonrecurring reimbursements had not been made, the total returns would have been 7.60% for Initial Class shares and 7.33% for Service Class shares for the ten-year period. |
| 2. | The gross expense ratios presented reflect the Portfolio’s “Total Annual Portfolio Operating Expenses” from the most recent Prospectus and may differ from other expense ratios disclosed in this report. |
| 3. | Performance for Service Class shares, first offered June 5, 2003, includes the historical performance of Initial Class shares through June 4, 2003 adjusted to reflect the fees and expenses of Service Class shares. |
| 4. | Please refer to pages M-2 and M-3 for additional explanations and disclosure regarding the Portfolios, their benchmark indices and other indices mentioned in the reports. |
| 5. | The Average Lipper Variable Products Large-Cap Value Portfolio is representative of portfolios that, by portfolio practice, invest at least 75% of their equity assets in companies with market capitalizations (on a three-year weighted basis) above Lipper’s U.S. diversified equity large-cap floor. Large-cap value portfolios typically have a below average price-to-earnings ratio, price-to-book ratio, and three-year sales-per-share growth value compared to the S&P 500® Index. Lipper Inc. is an independent monitor of fund performance. Results are based on total returns with all dividend and capital gain distributions reinvested. |
| | | | |
| mainstayinvestments.com | | | M-241 | |
Cost in Dollars of a $1,000 Investment in MainStay VP ICAP Select Equity Portfolio (Unaudited)
The example below is intended to describe the fees and expenses borne by shareholders during the six-month period from July 1, 2012 to December 31, 2012, and the impact of those costs on your investment.
Example
As a shareholder of the Portfolio, you incur two types of costs: (1) transaction costs, including exchange fees and sales charges (loads) on purchases (as applicable), and (2) ongoing costs, including management fees, distribution and/or service (12b-1) fees, and other Portfolio expenses (as applicable). This example is intended to help you understand your ongoing costs (in dollars) of investing in the Portfolio and to compare these costs with the ongoing costs of investing in other Portfolios. The example is based on an investment of $1,000 made at the beginning of the six-month period and held for the entire period from July 1, 2012, to December 31, 2012. Shares are only sold in connection with variable life and annuity contracts and the example does not reflect any contract level or transactional fees or expenses. If these costs had been included, your costs would have been higher.
This example illustrates your Portfolio’s ongoing costs in two ways:
Actual Expenses
The second and third data columns in the table below provide information about actual account values and actual expenses. You may use the information in these columns, together with the amount you invested, to estimate the
expenses that you paid during the six months ended December 31, 2012. Simply divide your account value by $1,000 (for example, an $8,600 account value divided by $1,000 = 8.6), then multiply the result by the number under the heading entitled ‘‘Expenses Paid During Period’’ to estimate the expenses you paid on your account during this period.
Hypothetical Example for Comparison Purposes
The fourth and fifth data columns in the table below provide information about hypothetical account values and hypothetical expenses based on the Portfolio’s actual expense ratio and an assumed rate of return of 5% per year before expenses, which is not the Portfolio’s actual return. The hypothetical account values and expenses may not be used to estimate the actual ending account balances or expenses you paid for the six-month period shown. You may use this information to compare the ongoing costs of investing in the Portfolio with the ongoing costs of investing in other Portfolios. To do so, compare this 5% hypothetical example with the 5% hypothetical examples that appear in the shareholder reports of the other Portfolios.
Please note that the expenses shown in the table are meant to highlight your ongoing costs only and do not reflect any transactional costs, such as exchange fees or sales charges (loads). Therefore, the fourth and fifth data columns of the table are useful in comparing ongoing costs only and will not help you determine the relative total costs of owning different funds. In addition, if these transactional costs were included, your costs would have been higher.
| | | | | | | | | | | | | | | | | | | | |
| | | | | | | | | | | | | | | | |
| Share Class | | Beginning
Account
Value
7/1/12 | | | Ending Account
Value (Based
on Actual
Returns and
Expenses)
12/31/12 | | | Expenses
Paid
During
Period1 | | | Ending Account
Value (Based
on Hypothetical
5% Annualized
Return and
Actual Expenses)
12/31/12 | | | Expenses
Paid
During
Period1 | |
| | | | | |
| Initial Class Shares | | $ | 1,000.00 | | | $ | 1,087.70 | | | $ | 4.15 | | | $ | 1,021.20 | | | $ | 4.01 | |
| | | | | |
| Service Class Shares | | $ | 1,000.00 | | | $ | 1,086.30 | | | $ | 5.45 | | | $ | 1,019.90 | | | $ | 5.28 | |
| 1. | Expenses are equal to the Portfolio’s annualized expense ratio of each class (0.79% for Initial Class and 1.04% for Service Class) multiplied by the average account value over the period, divided by 366 and multiplied by 184 (to reflect the six-month period). The table above represents the actual expenses incurred during the six-month period. |
| | |
| M-242 | | MainStay VP ICAP Select Equity Portfolio |
Industry Composition as of December 31, 2012 (Unaudited)
| | | | |
| Pharmaceuticals | | | 13.7 | % |
| Media | | | 10.8 | |
| Oil, Gas & Consumable Fuels | | | 9.7 | |
| Diversified Financial Services | | | 8.2 | |
| Health Care Equipment & Supplies | | | 6.2 | |
| Semiconductors & Semiconductor Equipment | | | 4.9 | |
| Aerospace & Defense | | | 4.6 | |
| Commercial Banks | | | 4.2 | |
| Communications Equipment | | | 4.2 | |
| Wireless Telecommunication Services | | | 4.1 | |
| Industrial Conglomerates | | | 4.0 | |
| Software | | | 3.7 | |
| | | | |
| Auto Components | | | 3.5 | % |
| Consumer Finance | | | 3.2 | |
| Chemicals | | | 3.1 | |
| Metals & Mining | | | 2.7 | |
| Energy Equipment & Services | | | 2.2 | |
| Capital Markets | | | 2.1 | |
| Machinery | | | 2.1 | |
| Health Care Providers & Services | | | 2.0 | |
| Short-Term Investment | | | 0.8 | |
| Other Assets, Less Liabilities | | | 0.0 | ‡ |
| | | | |
| | | 100.0 | % |
| | | | |
See Portfolio of Investments beginning on page M-246 for specific holdings within these categories.
| ‡ | Less than one-tenth of a percent. |
Top Ten Holdings as of December 31, 2012 (excluding short-term investment) (Unaudited)
| 3. | Texas Instruments, Inc. |
| 5. | Honeywell International, Inc. |
| 8. | Vodafone Group PLC, Sponsored ADR |
| | | | |
| mainstayinvestments.com | | | M-243 | |
Portfolio Management Discussion and Analysis (Unaudited)
Answers to the questions reflect the views of portfolio managers Jerrold K. Senser, CFA, Thomas R. Wenzel, CFA, and Thomas M. Cole, CFA, of Institutional Capital LLC (ICAP), the Portfolio’s Subadvisor.
How did MainStay VP ICAP Select Equity Portfolio perform relative to its peers and its benchmarks during the 12 months ended December 31, 2012?
For the 12 months ended December 31, 2012,
MainStay VP ICAP Select Equity Portfolio returned 15.58% for Initial Class shares and 15.29% for Service Class shares. Over the same period, both share classes underperformed the 15.71% return of the average Lipper1 Variable Products Large-Cap Value Portfolio. Both share classes underperformed the 17.51% return of the Russell 1000® Value Index1 and the 16.00% return of the S&P 500® Index1 for the 12 months ended December 31, 2012. The Russell 1000® Value Index is the Portfolio’s broad-based securities-market index. The S&P 500 Index® is a secondary benchmark for the Portfolio.
Were there any changes to the Portfolio during the reporting period?
Effective September 28, 2012, Thomas M. Cole became an additional portfolio manager for the Portfolio. Please refer to the Prospectus Supplement dated September 28, 2012, for additional information regarding Mr. Cole.
What factors affected the Portfolio’s relative performance during the reporting period?
A number of key drivers affected performance rela-
tive to the Russell 1000® Value Index. Positive stock selection in the health care and financials sectors added to relative performance. However, stock selection in the consumer discretionary and telecommunication services sectors detracted from relative performance. The Portfolio benefited from having no exposure to the utilities sector, but an overweight position in information technology detracted from the Portfolio’s relative performance.
Which sectors were the strongest contributors to the Portfolio’s relative performance, and which sectors were particularly weak?
The sectors that made the strongest positive contributions to the Portfolio’s performance relative to the Russell 1000® Value Index were utilities, health care and financials. (Contributions take weightings and total returns into account.) Favorable stock
selection was the primary driver for both health care and financials, while having no position in the utilities sector added to relative performance.
The sectors that detracted the most from relative performance were telecommunication services, consumer staples and consumer discretionary. Stock selection was the primary driver in each case.
During the reporting period, which individual stocks made the strongest positive contributions to the Portfolio’s absolute performance and which stocks detracted the most?
The stocks that made the strongest positive contributions to the Portfolio’s absolute performance were media company Time Warner and diversified financial services companies Citigroup and JPMorgan Chase. Time Warner’s stock outperformed the Russell 1000® Value Index as the company continued strong operational performance, returned cash to shareholders through increased dividends and stock buybacks, and provided expectations of growth in affiliate-fee revenue. Citigroup performed well as the company sought to increase efficiency and generate operating leverage globally under the direction of its new CEO, Michael Corbat. JPMorgan continued to add market share and increased its dividend and share repurchase target. All three positions remained in the Portfolio at the end of the reporting period.
Detractors from the Portfolio’s absolute performance included integrated oil & gas company Occidental Petroleum, gold producer Barrick Gold and household and personal care product manufacturer Procter & Gamble. Occidental Petroleum’s results were hurt by increased production costs, and the company lowered its growth outlook. Barrick Gold lagged as lower production levels and higher operating costs hampered earnings results. Procter & Gamble underperformed when profit margins declined because of higher commodity costs and weaker sales. Barrick Gold remained in the Portfolio at the end of the reporting period, as we believe that the company is well positioned in its industry and has attractive valuation and performance catalysts. Occidental Petroleum and Procter & Gamble were sold in favor of other stocks that we believed had greater upside potential and were more attractive on a relative-valuation basis.
| 1. | Please refer to pages M-2 and M-3 for additional explanations and disclosure regarding the Portfolios, their benchmark indices and service providers mentioned in the reports. |
| | |
| M-244 | | MainStay VP ICAP Select Equity Portfolio |
Did the Portfolio make any significant purchases or sales during the reporting period?
During a period characterized by ongoing volatility and an uncertain environment, we continued to look for stocks with both attractive valuations and specific catalysts that we believe can trigger appreciation over a 12- to 18-month time frame.
We added a position in diversified financial services company Citigroup. We believe that the company’s investment spending will increase efficiency and generate operating leverage globally. We also added a position in pharmaceutical distributor McKesson. We believe that the coming wave of generic drugs may prove more profitable for a longer time than some investors currently expect.
During the reporting period, we sold oil refiner Phillips 66 and global insurer MetLife. Phillips 66 was sold when the stock neared our target price and showed limited upside potential. MetLife was sold to make way for other positions that we believed had greater upside potential and were more attractive on a relative-valuation basis.
How did the Portfolio’s sector weightings change during the reporting period?
During the reporting period, the Portfolio increased its sector exposure relative to the Russell 1000® Value
Index in health care and industrials. In health care, the Portfolio increased its already overweight position relative to the Index. In industrials, the Portfolio moved from an underweight to an overweight position.
During the reporting period, the Portfolio decreased its sector weightings relative to the Russell 1000® Value Index in consumer staples and financials. In consumer staples, the Portfolio moved from an overweight position relative to the Index to an underweight position. In financials, the Portfolio reduced the size of an already underweight position relative to the Russell 1000® Value Index.
How was the Portfolio positioned at the end of the reporting period?
As of December 31, 2012, the Portfolio was most significantly overweight relative to the Russell 1000® Value Index in the health care and information technology sectors. As of the same date, the Portfolio was most significantly underweight relative to the Index in financials and consumer staples. This positioning reflected our view on the prospects for economic growth and the relative attractiveness of individual holdings in these sectors.
The opinions expressed are those of the portfolio managers as of the date of this report and are subject to change. There is no guarantee that any forecasts made will come to pass. This material does not constitute investment advice and is not intended as an endorsement of any specific investment.
Not all MainStay VP Portfolios and/or share classes are available under all policies.
| | | | |
| mainstayinvestments.com | | | M-245 | |
Portfolio of Investments December 31, 2012
| | | | | | | | |
| | |
Shares | | | Value | |
| Common Stocks 99.2%† | |
Aerospace & Defense 4.6% | | | | | | | | |
¨Honeywell International, Inc. | | | 777,450 | | | $ | 49,344,751 | |
| | | | | | | | |
|
Auto Components 3.5% | |
Johnson Controls, Inc. | | | 1,229,950 | | | | 37,759,465 | |
| | | | | | | | |
|
Capital Markets 2.1% | |
BlackRock, Inc. | | | 109,000 | | | | 22,531,390 | |
| | | | | | | | |
|
Chemicals 3.1% | |
Monsanto Co. | | | 359,100 | | | | 33,988,815 | |
| | | | | | | | |
|
Commercial Banks 4.2% | |
BB&T Corp. | | | 681,550 | | | | 19,839,920 | |
Wells Fargo & Co. | | | 763,150 | | | | 26,084,467 | |
| | | | | | | | |
| | | | | | | 45,924,387 | |
| | | | | | | | |
Communications Equipment 4.2% | |
¨Cisco Systems, Inc. | | | 2,325,100 | | | | 45,688,215 | |
| | | | | | | | |
|
Consumer Finance 3.2% | |
Capital One Financial Corp. | | | 606,400 | | | | 35,128,752 | |
| | | | | | | | |
|
Diversified Financial Services 8.2% | |
¨Citigroup, Inc. | | | 1,240,350 | | | | 49,068,246 | |
JPMorgan Chase & Co. | | | 904,900 | | | | 39,788,453 | |
| | | | | | | | |
| | | | | | | 88,856,699 | |
| | | | | | | | |
Energy Equipment & Services 2.2% | |
Halliburton Co. | | | 675,100 | | | | 23,419,219 | |
| | | | | | | | |
|
Health Care Equipment & Supplies 6.2% | |
Baxter International, Inc. | | | 549,050 | | | | 36,599,673 | |
Covidien PLC | | | 521,700 | | | | 30,122,958 | |
| | | | | | | | |
| | | | | | | 66,722,631 | |
| | | | | | | | |
Health Care Providers & Services 2.0% | |
McKesson Corp. | | | 228,000 | | | | 22,106,880 | |
| | | | | | | | |
|
Industrial Conglomerates 4.0% | |
¨General Electric Co. | | | 2,057,000 | | | | 43,176,430 | |
| | | | | | | | |
|
Machinery 2.1% | |
Cummins, Inc. | | | 210,550 | | | | 22,813,093 | |
| | | | | | | | |
| | | | | | | | |
| | |
Shares | | | Value | |
Media 10.8% | |
¨Time Warner, Inc. | | | 1,543,700 | | | $ | 73,835,171 | |
¨Viacom, Inc. Class B | | | 815,700 | | | | 43,020,018 | |
| | | | | | | | |
| | | | | | | 116,855,189 | |
| | | | | | | | |
Metals & Mining 2.7% | |
Barrick Gold Corp. | | | 823,150 | | | | 28,818,482 | |
| | | | | | | | |
|
Oil, Gas & Consumable Fuels 9.7% | |
Encana Corp. | | | 822,550 | | | | 16,253,588 | |
ExxonMobil Corp. | | | 480,650 | | | | 41,600,257 | |
Marathon Oil Corp. | | | 877,000 | | | | 26,888,820 | |
Southwestern Energy Co. (a) | | | 594,000 | | | | 19,845,540 | |
| | | | | | | | |
| | | | | | | 104,588,205 | |
| | | | | | | | |
Pharmaceuticals 13.7% | |
¨Johnson & Johnson | | | 710,550 | | | | 49,809,555 | |
Novartis A.G., ADR (b) | | | 478,800 | | | | 30,308,040 | |
¨Pfizer, Inc. | | | 2,695,600 | | | | 67,605,648 | |
| | | | | | | | |
| | | | | | | 147,723,243 | |
| | | | | | | | |
Semiconductors & Semiconductor Equipment 4.9% | |
¨Texas Instruments, Inc. | | | 1,708,883 | | | | 52,872,840 | |
| | | | | | | | |
| | |
Software 3.7% | | | | | | | | |
Adobe Systems, Inc. (a) | | | 572,900 | | | | 21,586,872 | |
Microsoft Corp. | | | 673,700 | | | | 18,008,001 | |
| | | | | | | | |
| | | | | | | 39,594,873 | |
| | | | | | | | |
Wireless Telecommunication Services 4.1% | |
¨Vodafone Group PLC, Sponsored ADR (b) | | | 1,740,600 | | | | 43,845,714 | |
| | | | | | | | |
Total Common Stocks
(Cost $912,122,933) | | | | | | | 1,071,759,273 | |
| | | | | | | | |
| † | Percentages indicated are based on Portfolio net assets. |
| ¨ | | Among the Portfolio’s 10 largest holdings, as of December 31, 2012, excluding short-term investment. May be subject to change daily. |
| | | | |
| M-246 | | MainStay VP ICAP Select Equity Portfolio | | The notes to the financial statements are an integral part of,
and should be read in conjunction with, the financial statements. |
| | | | | | | | |
| | | Principal
Amount | | | Value | |
| Short-Term Investment 0.8% | | | | | | | | |
Repurchase Agreement 0.8% | | | | | | | | |
State Street Bank and Trust Co.
0.01%, dated 12/31/12
due 1/2/13
Proceeds at Maturity $8,734,649 (Collateralized by a Federal National Mortgage Association security with a rate of 2.17% and a maturity date
of 11/7/22, with a Principal Amount
of $8,875,000 and a Market Value
of $8,912,426) | | $ | 8,734,644 | | | $ | 8,734,644 | |
| | | | | | | | |
Total Short-Term Investment
(Cost $8,734,644) | | | | | | | 8,734,644 | |
| | | | | | | | |
Total Investments
(Cost $920,857,577) (c) | | | 100.0 | % | | | 1,080,493,917 | |
Other Assets, Less Liabilities | | | 0.0 | ‡ | | | 106,588 | |
Net Assets | | | 100.0 | % | | $ | 1,080,600,505 | |
| ‡ | Less than one-tenth of a percent. |
| (a) | Non-income producing security. |
| (b) | ADR—American Depositary Receipt. |
| (c) | As of December 31, 2012, cost is $923,749,103 for federal income tax purposes and net unrealized appreciation is as follows: |
| | | | |
Gross unrealized appreciation | | $ | 163,478,033 | |
Gross unrealized depreciation | | | (6,733,219 | ) |
| | | | |
Net unrealized appreciation | | $ | 156,744,814 | |
| | | | |
The following is a summary of the fair valuations according to the inputs used as of December 31, 2012, for valuing the Portfolio’s assets.
Asset Valuation Inputs
| | | | | | | | | | | | | | | | | | |
Description | | Quoted Prices
in Active Markets
for Identical Assets (Level 1) | | | Significant Other
Observable Inputs
(Level 2) | | | Significant
Unobservable
Inputs
(Level 3) | | | Total | |
| Investments in Securities (a) | | | | | | | | | | | | | | | | | | |
| Common Stocks | | $ | 1,071,759,273 | | | $ | — | | | $ | — | | | $ | 1,071,759,273 | |
| Short-Term Investment | | | | | | | | | | | | | | | | | | |
Repurchase Agreement | | | | | — | | | | 8,734,644 | | | | — | | | | 8,734,644 | |
| | | | | | | | | | | | | | | | | | |
| Total Investments in Securities | | $ | 1,071,759,273 | | | $ | 8,734,644 | | | $ | — | | | $ | 1,080,493,917 | |
| | | | | | | | | | | | | | | | | | |
| (a) | For a complete listing of investments and their industries, see the Portfolio of Investments. |
The Portfolio recognizes transfers between the levels as of the beginning of the period.
For the year ended December 31, 2012, the Portfolio did not have any transfers between Level 1 and Level 2 fair value measurements. (See Note 2)
As of December 31, 2012, the Portfolio did not hold any investments with significant unobservable inputs (Level 3). (See Note 2)
| | | | | | |
The notes to the financial statements are an integral part of,
and should be read in conjunction with, the financial statements. | | mainstayinvestments.com | | | M-247 | |
Statement of Assets and Liabilities as of December 31, 2012
| | | | |
| Assets | |
Investment in securities, at value
(identified cost $920,857,577) | | $ | 1,080,493,917 | |
Receivables: | | | | |
Dividends and interest | | | 1,572,565 | |
Fund shares sold | | | 157,150 | |
| | | | |
Total assets | | | 1,082,223,632 | |
| | | | |
| |
| Liabilities | | | | |
Payables: | | | | |
Manager (See Note 3) | | | 694,123 | |
Fund shares redeemed | | | 692,587 | |
NYLIFE Distributors (See Note 3) | | | 100,354 | |
Shareholder communication | | | 87,414 | |
Professional fees | | | 43,495 | |
Custodian | | | 1,614 | |
Trustees | | | 1,530 | |
Accrued expenses | | | 2,010 | |
| | | | |
Total liabilities | | | 1,623,127 | |
| | | | |
Net assets | | $ | 1,080,600,505 | |
| | | | |
| |
| Net Assets Consist of | | | | |
Shares of beneficial interest outstanding (par value of $.001 per share) unlimited number of shares authorized | | $ | 78,860 | |
Additional paid-in capital | | | 1,100,205,617 | |
| | | | |
| | | 1,100,284,477 | |
Undistributed net investment income | | | 18,023,969 | |
Accumulated net realized gain (loss) on investments | | | (197,344,281 | ) |
Net unrealized appreciation (depreciation) on investments | | | 159,636,340 | |
| | | | |
Net assets | | $ | 1,080,600,505 | |
| | | | |
| | | | |
Initial Class | | | | |
Net assets applicable to outstanding shares | | $ | 604,785,511 | |
| | | | |
Shares of beneficial interest outstanding | | | 43,961,074 | |
| | | | |
Net asset value per share outstanding | | $ | 13.76 | |
| | | | |
Service Class | | | | |
Net assets applicable to outstanding shares | | $ | 475,814,994 | |
| | | | |
Shares of beneficial interest outstanding | | | 34,898,936 | |
| | | | |
Net asset value per share outstanding | | $ | 13.63 | |
| | | | |
| | | | |
| M-248 | | MainStay VP ICAP Select Equity Portfolio | | The notes to the financial statements are an integral part of,
and should be read in conjunction with, the financial statements. |
Statement of Operations for the year ended December 31, 2012
| | | | |
| Investment Income (Loss) | |
Income | | | | |
Dividends (a) | | $ | 27,845,023 | |
Interest | | | 2,200 | |
| | | | |
Total income | | | 27,847,223 | |
| | | | |
Expenses | | | | |
Manager (See Note 3) | | | 8,295,271 | |
Distribution and service—Service Class (See Note 3) | | | 1,182,726 | |
Shareholder communication | | | 177,958 | |
Professional fees | | | 88,733 | |
Trustees | | | 29,373 | |
Custodian | | | 10,796 | |
Miscellaneous | | | 38,336 | |
| | | | |
Total expenses | | | 9,823,193 | |
| | | | |
Net investment income (loss) | | | 18,024,030 | |
| | | | |
|
| Realized and Unrealized Gain (Loss) on Investments | |
Net realized gain (loss) on investments | | | 30,058,160 | |
Net change in unrealized appreciation (depreciation) on investments | | | 109,454,583 | |
| | | | |
Net realized and unrealized gain (loss) on investments | | | 139,512,743 | |
| | | | |
Net increase (decrease) in net assets resulting from operations | | $ | 157,536,773 | |
| | | | |
| (a) | Dividends recorded net of foreign withholding taxes in the amount of $275,732. |
| | | | | | |
The notes to the financial statements are an integral part of,
and should be read in conjunction with, the financial statements. | | mainstayinvestments.com | | | M-249 | |
Statements of Changes in Net Assets
for the years ended December 31, 2012 and December 31, 2011
| | | | | | | | |
| | | 2012 | | | 2011 | |
| Increase (Decrease) in Net Assets | |
Operations: | | | | | | | | |
Net investment income (loss) | | $ | 18,024,030 | | | $ | 21,988,834 | |
Net realized gain (loss) on investments | | | 30,058,160 | | | | 84,738,080 | |
Net change in unrealized appreciation (depreciation) on investments | | | 109,454,583 | | | | (127,146,051 | ) |
| | | | |
Net increase (decrease) in net assets resulting from operations | | | 157,536,773 | | | | (20,419,137 | ) |
| | | | |
Dividends to shareholders: | | | | | | | | |
From net investment income: | | | | | | | | |
Initial Class | | | (12,939,217 | ) | | | (9,445,779 | ) |
Service Class | | | (9,049,625 | ) | | | (5,799,194 | ) |
| | | | |
Total dividends to shareholders | | | (21,988,842 | ) | | | (15,244,973 | ) |
| | | | |
Capital share transactions: | | | | | | | | |
Net proceeds from sale of shares | | | 54,592,941 | | | | 84,889,261 | |
Net asset value of shares issued to shareholders in reinvestment of dividends | | | 21,988,842 | | | | 15,244,973 | |
Cost of shares redeemed | | | (191,921,510 | ) | | | (216,597,859 | ) |
| | | | |
Increase (decrease) in net assets derived from capital share transactions | | | (115,339,727 | ) | | | (116,463,625 | ) |
| | | | |
Net increase (decrease) in net assets | | | 20,208,204 | | | | (152,127,735 | ) |
|
| Net Assets | |
Beginning of year | | | 1,060,392,301 | | | | 1,212,520,036 | |
| | | | |
End of year | | $ | 1,080,600,505 | | | $ | 1,060,392,301 | |
| | | | |
Undistributed net investment income at end of year | | $ | 18,023,969 | | | $ | 21,988,781 | |
| | | | |
| | | | |
| M-250 | | MainStay VP ICAP Select Equity Portfolio | | The notes to the financial statements are an integral part of,
and should be read in conjunction with, the financial statements. |
Financial Highlights selected per share data and ratios
| | | | | | | | | | | | | | | | | | | | |
| | | Initial Class | |
| | | Year ended December 31, | |
| | | 2012 | | | 2011 | | | 2010 | | | 2009 | | | 2008 | |
Net asset value at beginning of year | | $ | 12.15 | | | $ | 12.54 | | | $ | 10.70 | | | $ | 8.41 | | | $ | 14.22 | |
| | | | | | | | | | | | | | | | | | | | |
Net investment income (loss) | | | 0.29 | | | | 0.25 | (a) | | | 0.18 | | | | 0.11 | | | | 0.05 | |
Net realized and unrealized gain (loss) on investments | | | 1.61 | | | | (0.46 | ) | | | 1.76 | | | | 2.36 | | | | (5.38 | ) |
| | | | | | | | | | | | | | | | | | | | |
Total from investment operations | | | 1.90 | | | | (0.21 | ) | | | 1.94 | | | | 2.47 | | | | (5.33 | ) |
| | | | | | | | | | | | | | | | | | | | |
Less dividends and distributions: | | | | | | | | | | | | | | | | | | | | |
From net investment income | | | (0.29 | ) | | | (0.18 | ) | | | (0.10 | ) | | | (0.18 | ) | | | (0.06 | ) |
From net realized gain on investments | | | — | | | | — | | | | — | | | | — | | | | (0.42 | ) |
| | | | | | | | | | | | | | | | | | | | |
Total dividends and distributions | | | (0.29 | ) | | | (0.18 | ) | | | (0.10 | ) | | | (0.18 | ) | | | (0.48 | ) |
| | | | | | | | | | | | | | | | | | | | |
Net asset value at end of year | | $ | 13.76 | | | $ | 12.15 | | | $ | 12.54 | | | $ | 10.70 | | | $ | 8.41 | |
| | | | | | | | | | | | | | | | | | | | |
Total investment return | | | 15.58 | % | | | (1.44 | %) | | | 18.12 | % | | | 29.41 | % | | | (37.59 | %) |
Ratios (to average net assets)/Supplemental Data: | | | | | | | | | | | | | | | | | | | | |
Net investment income (loss) | | | 1.76 | % | | | 2.01 | % | | | 1.46 | % | | | 1.32 | % | | | 1.98 | % |
Net expenses | | | 0.79 | % | | | 0.80 | % | | | 0.81 | % | | | 0.80 | % | | | 0.78 | % |
Expenses (before waiver/reimbursement) | | | 0.79 | % | | | 0.80 | % | | | 0.81 | % | | | 0.82 | % | | | 0.83 | % |
Portfolio turnover rate | | | 60 | % | | | 67 | % | | | 57 | % | | | 85 | % | | | 152 | % |
Net assets at end of year (in 000’s) | | $ | 604,786 | | | $ | 608,551 | | | $ | 731,165 | | | $ | 686,907 | | | $ | 456,377 | |
| (a) | Per share data based on average shares outstanding during the year. |
| | | | | | | | | | | | | | | | | | | | |
| | | Service Class | |
| | | Year ended December 31, | |
| | | 2012 | | | 2011 | | | 2010 | | | 2009 | | | 2008 | |
Net asset value at beginning of year | | $ | 12.05 | | | $ | 12.43 | | | $ | 10.62 | | | $ | 8.36 | | | $ | 14.14 | |
| | | | | | | | | | | | | | | | | | | | |
Net investment income (loss) | | | 0.22 | | | | 0.22 | (a) | | | 0.13 | | | | 0.07 | | | | 0.12 | |
Net realized and unrealized gain (loss) on investments | | | 1.62 | | | | (0.45 | ) | | | 1.76 | | | | 2.35 | | | | (5.43 | ) |
| | | | | | | | | | | | | | | | | | | | |
Total from investment operations | | | 1.84 | | | | (0.23 | ) | | | 1.89 | | | | 2.42 | | | | (5.31 | ) |
| | | | | | | | | | | | | | | | | | | | |
Less dividends and distributions: | | | | | | | | | | | | | | | | | | | | |
From net investment income | | | (0.26 | ) | | | (0.15 | ) | | | (0.08 | ) | | | (0.16 | ) | | | (0.05 | ) |
From net realized gain on investments | | | — | | | | — | | | | — | | | | — | | | | (0.42 | ) |
| | | | | | | | | | | | | | | | | | | | |
Total dividends and distributions | | | (0.26 | ) | | | (0.15 | ) | | | (0.08 | ) | | | (0.16 | ) | | | (0.47 | ) |
| | | | | | | | | | | | | | | | | | | | |
Net asset value at end of year | | $ | 13.63 | | | $ | 12.05 | | | $ | 12.43 | | | $ | 10.62 | | | $ | 8.36 | |
| | | | | | | | | | | | | | | | | | | | |
Total investment return | | | 15.29 | % | | | (1.69 | %) | | | 17.82 | % | | | 29.09 | % | | | (37.75 | %) |
Ratios (to average net assets)/Supplemental Data: | | | | | | | | | | | | | | | | | | | | |
Net investment income (loss) | | | 1.51 | % | | | 1.77 | % | | | 1.21 | % | | | 1.04 | % | | | 1.71 | % |
Net expenses | | | 1.04 | % | | | 1.05 | % | | | 1.06 | % | | | 1.05 | % | | | 1.03 | % |
Expenses (before waiver/reimbursement) | | | 1.04 | % | | | 1.05 | % | | | 1.06 | % | | | 1.07 | % | | | 1.08 | % |
Portfolio turnover rate | | | 60 | % | | | 67 | % | | | 57 | % | | | 85 | % | | | 152 | % |
Net assets at end of year (in 000’s) | | $ | 475,815 | | | $ | 451,841 | | | $ | 481,355 | | | $ | 400,773 | | | $ | 198,592 | |
| (a) | Per share data based on average shares outstanding during the year. |
| | | | | | |
The notes to the financial statements are an integral part of,
and should be read in conjunction with, the financial statements. | | mainstayinvestments.com | | | M-251 | |
MainStay VP Income Builder Portfolio
Investment and Performance Comparison (Unaudited)
Performance data quoted represents past performance. Past performance is no guarantee of future results. Because of market volatility, current performance may be lower or higher than the figures shown. Investment return and principal value will fluctuate, and as a result, when shares are redeemed, they may be worth more or less than their original cost. The performance table and graph do not reflect any deduction of sales charges, mortality and expense charges, contract charges or administrative charges. Please refer to the Performance Summary appropriate for your policy. For performance information current to the most recent month-end, please call 800-598-2019 or visit www.newyorklife.com.
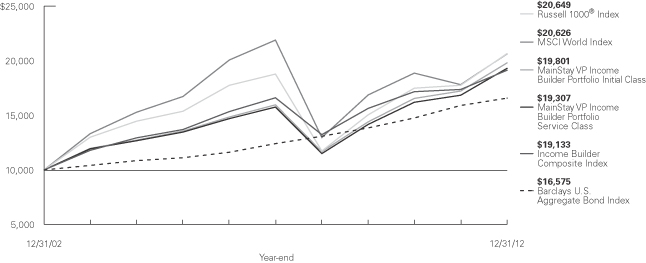
Average Annual Total Returns for the Year Ended December 31, 2012
| | | | | | | | | | | | |
| Class | | One Year | | Five Years | | Ten Years1 | | | Gross Expense Ratio2 | |
| Initial Class Shares | | 15.00% | | 4.41% | | | 7.07 | % | | | 0.65 | % |
| Service Class Shares3 | | 14.71 | | 4.15 | | | 6.80 | | | | 0.90 | |
| | | | | | | | | | | | |
| Benchmark Performance | | One
Year | | | Five
Years | | | Ten
Years | |
MSCI World Index4 | | | 15.83 | % | | | –1.18 | % | | | 7.51 | % |
Russell 1000® Index4 | | | 16.42 | | | | 1.92 | | | | 7.52 | |
Income Builder Composite Index4 | | | 10.13 | | | | 2.89 | | | | 6.70 | |
Barclays U.S. Aggregate Bond Index4 | | | 4.22 | | | | 5.95 | | | | 5.18 | |
Average Lipper Variable Products Mixed-Asset Target Allocation Growth Portfolio5 | | | 13.50 | | | | 1.93 | | | | 6.70 | |
| 1. | Performance figures shown for the ten-year period ended December 31, 2012 reflect nonrecurring reimbursements from affiliates for printing and mailing costs. If these nonrecurring reimbursements had not been made, the total returns would have been 7.05% for Initial Class shares and 6.78% for Service Class shares for the ten-year period. |
| 2. | The gross expense ratios presented reflect the Portfolio’s “Total Annual Portfolio Operating Expenses” from the most recent Prospectus and may differ from other expense ratios disclosed in this report. |
| 3. | Performance for Service Class shares, first offered June 4, 2003, includes the historical performance of Initial Class shares |
| | through June 3, 2003 adjusted to reflect the fees and expenses of Service Class shares. |
| 4. | Please refer to pages M-2 and M-3 for additional explanations and disclosure regarding the Portfolios, their benchmark indices and other indices mentioned in the reports. |
| 5. | The Average Lipper Variable Products Mixed-Asset Target Allocation Growth Portfolio is representative of portfolios that, by portfolio practice, maintain a mix of between 60%-80% equity securities, with the remainder invested in bonds, cash, and cash equivalents. Lipper Inc. is an independent monitor of fund performance. Results are based on total returns with all dividend and capital gain distributions reinvested. |
| | |
| M-252 | | MainStay VP Income Builder Portfolio |
Cost in Dollars of a $1,000 Investment in MainStay VP Income Builder Portfolio (Unaudited)
The example below is intended to describe the fees and expenses borne by shareholders during the six-month period from July 1, 2012 to December 31, 2012, and the impact of those costs on your investment.
Example
As a shareholder of the Portfolio, you incur two types of costs: (1) transaction costs, including exchange fees and sales charges (loads) on purchases (as applicable), and (2) ongoing costs, including management fees, distribution and/or service (12b-1) fees, and other Portfolio expenses (as applicable). This example is intended to help you understand your ongoing costs (in dollars) of investing in the Portfolio and to compare these costs with the ongoing costs of investing in other Portfolios. The example is based on an investment of $1,000 made at the beginning of the six-month period and held for the entire period from July 1, 2012, to December 31, 2012. Shares are only sold in connection with variable life and annuity contracts and the example does not reflect any contract level or transactional fees or expenses. If these costs had been included, your costs would have been higher.
This example illustrates your Portfolio’s ongoing costs in two ways:
Actual Expenses
The second and third data columns in the table below provide information about actual account values and actual expenses. You may use the information in these columns, together with the amount you invested, to estimate the expenses that you paid during the six months ended
December 31, 2012. Simply divide your account value by $1,000 (for example, an $8,600 account value divided by $1,000 = 8.6), then multiply the result by the number under the heading entitled ‘‘Expenses Paid During Period’’ to estimate the expenses you paid on your account during this period.
Hypothetical Example for Comparison Purposes
The fourth and fifth data columns in the table below provide information about hypothetical account values and hypothetical expenses based on the Portfolio’s actual expense ratio and an assumed rate of return of 5% per year before expenses, which is not the Portfolio’s actual return. The hypothetical account values and expenses may not be used to estimate the actual ending account balances or expenses you paid for the six-month period shown. You may use this information to compare the ongoing costs of investing in the Portfolio with the ongoing costs of investing in other Portfolios. To do so, compare this 5% hypothetical example with the 5% hypothetical examples that appear in the shareholder reports of the other Portfolios.
Please note that the expenses shown in the table are meant to highlight your ongoing costs only and do not reflect any transactional costs, such as exchange fees or sales charges (loads). Therefore, the fourth and fifth data columns of the table are useful in comparing ongoing costs only and will not help you determine the relative total costs of owning different funds. In addition, if these transactional costs were included, your costs would have been higher.
| | | | | | | | | | | | | | | | | | | | |
| | | | | | | | | | | | | | | | |
| Share Class | | Beginning
Account
Value
7/1/12 | | | Ending Account
Value (Based
on Actual
Returns and
Expenses)
12/31/12 | | | Expenses
Paid During
Period1 | | | Ending Account
Value (Based
on Hypothetical
5% Annualized
Return and
Actual Expenses)
12/31/12 | | | Expenses
Paid
During
Period1 | |
| | | | | |
| Initial Class Shares | | $ | 1,000.00 | | | $ | 1,070.40 | | | $ | 3.33 | | | $ | 1,021.90 | | | $ | 3.25 | |
| | | | | |
| Service Class Shares | | $ | 1,000.00 | | | $ | 1,069.10 | | | $ | 4.68 | | | $ | 1,020.60 | | | $ | 4.57 | |
| 1. | Expenses are equal to the Portfolio’s annualized expense ratio of each class (0.64% for Initial Class and 0.90% for Service Class) multiplied by the average account value over the period, divided by 366 and multiplied by 184 (to reflect the six-month period). The table above represents the actual expenses incurred during the six-month period. |
| | | | |
| mainstayinvestments.com | | | M-253 | |
Portfolio Composition as of December 31, 2012 (Unaudited)
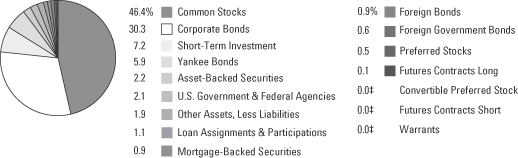
See Portfolio of Investments beginning on page M-259 for specific holdings within these categories.
| ‡Less | than one-tenth of a percent. |
Top Ten Holdings or Issuers Held as of December 31, 2012 (excluding short-term investment) (Unaudited)
| 1. | United States Treasury Bonds, 2.75%–4.375%, due 11/15/39–8/15/42 |
| 2. | MGM Resorts International, 6.75%, due 10/1/20 |
| 3. | USG Corp., 6.30%-9.75%, due 11/15/16–1/15/18 |
| 7. | Linn Energy LLC / Linn Energy Finance Corp., 8.625%, due 4/15/20 |
| | |
| M-254 | | MainStay VP Income Builder Portfolio |
Portfolio Management Discussion and Analysis (Unaudited)
Answers to the questions reflect the views of portfolio managers Dan Roberts, PhD, Michael Kimble, Louis N. Cohen and Taylor Wagenseil of MacKay Shields LLC, the Subadvisor for the fixed-income portion of the Portfolio, and Eric Sappenfield, William Priest, CFA, and Michael Welhoelter, CFA, of Epoch Investment Partners, Inc., the Subadvisor for the equity portion of the Portfolio.
How did MainStay VP Income Builder Portfolio perform relative to its peers and its benchmarks during the 12 months ended December 31, 2012?
For the 12 months ended December 31, 2012, MainStay VP Income Builder Portfolio returned 15.00% for Initial Class shares and 14.71% for Service Class shares. Both share classes outperformed the 13.50% return of the average Lipper1 Variable Products Mixed-Asset Target Allocation Growth Portfolio, underperformed the 15.83% return of the MSCI World Index,1 and the 16.42% return of the Russell 1000® Index.1 Over the same period, both share classes outperformed the 4.22% return of the Barclays U.S. Aggregate Bond Index for the 12 months ended December 31, 2012. The MSCI World Index is the Portfolio’s broad-based securities-market index. The Russell 1000® Index is the Portfolio’s secondary benchmark. The Barclays U.S. Aggregate Bond Index is an additional benchmark for the Portfolio.
What factors affected relative performance in the equity portion of the Portfolio during the reporting period?
The equity portion of the Portfolio provided positive results but lagged the MSCI Word Index during the reporting period. This was largely a function of the Portfolio’s lack of exposure to financials, particularly banks. Although some large banks raised dividends, we remain skeptical that they will be able to sustainably increase dividends because profitability continues to be under pressure. The Portfolio was also hurt by a few holdings within industrials—notably bus and rail company FirstGroup, which operates in the U.K. and North America—and by exposure to telecommunication services stocks, which lagged the broader market. On the positive side, having less exposure than the MSCI World Index to energy stocks helped relative returns, as did strong stock performance in consumer staples and materials.
During the reporting period, how was the Portfolio’s performance materially affected by investments in derivatives?
During the reporting period, Epoch did not use any derivatives. MacKay Shields, however, used S&P equity futures to raise the Portfolio’s overall equity sensitivity. This position in derivatives had a positive impact on the Portfolio’s overall performance during the reporting period.
In the equity portion of the Portfolio, which market segments were the strongest positive contributors to the Portfolio’s relative performance and which market segments detracted the most?
In the equity portion of the Portfolio, the sectors that made the strongest positive contributions to the Portfolio’s relative performance during the reporting period were energy, materials and consumer staples. (Contributions take weightings and total returns into account.) The weakest-contributing sectors in the equity portion of the Portfolio were financials, industrials and telecommunication services.
During the reporting period, which individual stocks made the strongest positive contributions to the Portfolio’s absolute performance and which stocks detracted the most?
In the equity portion of the Portfolio, the strongest positive contributors on an absolute basis included beverage company Anheuser-Busch InBev, global reinsurer Munich Re and chemical company BASF. Anheuser-Busch InBev reported strong growth in revenues and operating profits in 2012. The company announced that it would acquire the remaining half
of Mexican brewer Modelo, with which it anticipates significant operating synergies. Munich Re benefitted from strong industry pricing trends following 2011—the second-worst year for natural catastrophes on record. Despite the strong performance of the stock, Munich Re still offers a dividend yield of 4.6%. BASF benefited from its diversified array of products, industries and geographies, which provided a buffer against cyclical headwinds. The company generates consistent free cash flow, which supports its progressive dividend policy.
In the equity portion of the Portfolio, weak contributors to absolute performance included U.K.-based bus and rail company FirstGroup, mail and package management company Pitney Bowes and commercial services company R.R. Donnelley & Sons. Although FirstGroup was making progress in restructuring its U.S. business, recovery in the U.K. bus segment has been slow. Regulatory uncertainty surrounding the U.K. rail franchise bidding process led us to reduce our position in the stock. Pitney Bowes was hurt by investor uneasiness about long-term growth opportunities. We exited the position in the fourth quarter
| 1. | Please refer to pages M-2 and M-3 for additional explanations and disclosure regarding the Portfolios, their benchmark indices and service providers mentioned in the reports. |
| | | | |
| mainstayinvestments.com | | | M-255 | |
of 2012 because of concerns about the company’s capital allocation policy and management’s long-term commitment to the dividend. R.R. Donnelley’s shares declined during the reporting period after facing challenges from the overall macro environment and secular shifts within the printing industry. Management is actively addressing these issues by seeking
to add flexibility to the company’s cost structure, improve the balance sheet and drive cash flow generation, which supports R.R. Donnelley’s attractive and well-covered dividend.
Were there any other stocks that were particularly noteworthy during the reporting period?
Media company Comcast and beverage company Diageo were also strong absolute performers. Comcast advanced after posting strong operational results, increasing its dividend and announcing a sizeable share repurchase program. Diageo benefited from emerging-market exposure, strong brands and ongoing cost-cutting.
Belgian mobile communications company Mobistar and French telecommunications company France Telecom were both weak absolute performers. Both companies suffered from increased competition, and France Telecom reneged on its earlier assurance that the company’s dividend was safe. Both positions were sold.
Did the equity portion of the Portfolio make any significant purchases or sales during the reporting period?
During the reporting period, we added Dominion Resources, a U.S. utility, to the equity portion of the Portfolio. We were attracted by the company’s current yield, its relatively secure operating cash flow growth and its decision to increase its regulated earnings mix and its dividend payout ratio. We also initiated a position in Germany-based global transport and logistics company Deutsche Post. After selling Postbank, settling a VAT dispute and correcting a pension funding deficit, Deutsche Post has cash generation and a cash dividend policy of 40% to 60% of earnings that in our opinion is sustainable with room to grow. We added Health Care REIT to the equity portion of the Portfolio. We believe the company, which owns and manages a high-quality diversified
array of U.S. health care assets, is positioned to benefit from the aging U.S. population. During the reporting period, the equity portion of the Portfolio also initiated a position in machinery company Deere.
In addition to the sales already mentioned, the equity portion of the Portfolio sold global engineering company Meggitt after a period of strong stock performance. The proceeds provided cash for new ideas that would deliver more attractive dividend yield and diversification. In the equity portion of the Portfolio, we sold the position in exchange operator NYSE Euronext after disappointing operating results reduced our confidence in management’s ability to continue returning attractive levels of cash to shareholders. We also eliminated our position in China Mobile. The company had not materially increased
its payout as originally intended or promised; and management’s actions did not suggest a commitment to creating value for shareholders.
How did the Portfolio’s equity sector weightings change during the reporting period?
The positioning of the equity portion of the Portfolio did not change significantly from beginning of the year. The largest changes in the equity portion of the Portfolio were to the overweight positions in telecommunication services and consumer staples, both of which narrowed relative to the MSCI World Index. Changes to relative weightings of all other equity sectors were relatively modest.
How was the equity portion of the Portfolio positioned at the end of the reporting period?
As of December 31, 2012, the equity portion of the Portfolio was significantly overweight relative to the MSCI World Index in the telecommunications services, utilities and consumer staples sectors. As of the same date, the equity portion of the Portfolio held significantly underweight positions in financials sector, particularly among banks—and in the information technology sector, where companies lack meaningful dividends.
What factors affected relative performance in the fixed-income portion of the Portfolio during the reporting period?
The fixed-income portion of the Portfolio outperformed the Barclays U.S. Aggregate Bond Index primarily because of an overweight position in spread2
| 2. | The terms “spread” and “yield spread” may refer to the difference in yield between a security or type of security and comparable U.S. Treasury issues. The terms may also refer to the difference in yield between two specific securities or types of securities at a given time. |
| | |
| M-256 | | MainStay VP Income Builder Portfolio |
products, specifically high-yield corporate bonds. Assets with higher risk profiles provided strong results during the reporting period, largely in response to the accommodative monetary policies of the world’s central banks. In particular, the European Central Bank’s Long Term Refinancing Operations offered in late December 2011 and February 2012 helped recapitalize the European banking system. In the last quarter of the reporting period, the European Central Bank president’s proclamation to “preserve the euro”—along with the U.S. Federal Reserve’s announcement that it would engage in an open-ended mortgage purchase program—calmed market fears and kept the “risk rally” alive as investors continued to search for yield. A stronger appetite for risk benefited overweight positions in high-yield corporate bonds as well as convertible bonds in the fixed-income portion of the Portfolio.
High-yield corporate bonds made up the largest overweight position in relation to the Barclays U.S. Aggregate Bond Index in the fixed-income portion of the Portfolio. (The Index consists entirely of investment-grade bonds.) Within high-yield corporate bonds, holdings in sectors that are more cyclical—such as financials, gaming and housing—were among strongest performers in the fixed-income portion of the Portfolio. An overweight position in convertible bonds through most of the reporting period also strengthened performance in the fixed-income portion of the Portfolio.
Lower-risk assets, such as U.S. Treasury securities and agency mortgages, underperformed the Barclays U.S. Aggregate Bond Index. Fortunately, the fixed-income portion of the Portfolio held underweight positions in these asset classes, which helped per-
formance relative to the Barclays U.S. Aggregate Bond Index.
What was the duration3 strategy of the fixed-income portion of the Portfolio during the reporting period?
The duration of the fixed-income portion of the Portfolio was shorter than that of the Barclays U.S. Aggregate Bond Index throughout the reporting period, in large part because of an overweight position in high-yield corporate bonds. These bonds tend to have shorter durations than investment-grade corporate bonds. They also tend to have a low correlation to U.S. Treasury securities, so they have a lower sensitivity to interest rates. To further insulate the Portfolio from a potential rise in interest rates, we maintained a short position in U.S. Treasury futures to
keep the Portfolio’s duration shorter than that of the Index.
What specific factors, risks or market forces prompted significant decisions for the fixed-income portion of the Portfolio during the reporting period?
During the reporting period, there were many macro factors to consider, and the fixed-income portion of the Portfolio experienced some periods of volatility. Nevertheless, we did not make any material changes to the positioning in this portion of the Portfolio. Prior to the reporting period, we had judged the Federal Reserve’s accommodative monetary policy, along with improving economic data, to be a positive for spread products such as high-yield corporate bonds. In addition, improving profitability signaled that many corporations were doing more with less: less leverage, less short-term debt and smaller funding gaps. In our opinion, improving credit fundamentals would support narrower spreads—or less compensation for assuming credit risk—alongside a favorable balance of supply and demand for corporate debt. For these reasons, we maintained a risk profile that was higher than that of the Barclays U.S. Aggregate Bond Index. We did, however, reduce convertible bond exposure in the fixed-income portion of the Portfolio toward the end of the reporting period, and we increased our weightings in investment-grade and high-yield corporate bonds.
During the reporting period, which market segments were the strongest positive contributors to performance in the fixed-income portion of the Portfolio, and which market segments were particularly weak?
In the fixed-income portion of the Portfolio, an overweight position in high-yield corporate bonds was the driving force behind outperformance of the Barclays U.S. Aggregate Bond Index. During the reporting period, the Barclays U.S. Aggregate Bond Index was up 4.22%, while high-yield corporate bonds, as measured by the Bank of America Merrill Lynch High Yield Master II Constrained Index,4 were up 15.59%. Within the high-yield corporate bond component of the fixed-income portion of the Portfolio, financials and real estate holdings were the best performers. Energy and utilities holdings were among the weakest performers within our high-yield holdings. An overweight position in convertible bonds also had a positive impact on the performance of the fixed-income portion of the Portfolio during the reporting period. Although this portion of the Portfolio was underweight investment-grade corporate bonds during the reporting period,
| 3. | Duration is a measure of the price sensitivity of a fixed-income investment to changes in interest rates. Duration is expressed as a number of years and is considered a more accurate sensitivity gauge than average maturity. |
| | | | |
| mainstayinvestments.com | | | M-257 | |
security selection within the sector was a positive contributor to performance.
With an overweight position in high-yield corporate bonds came underweight positions in U.S. Treasury securities and agency mortgages. These underweight sector positions contributed to the relative performance of the fixed-income portion of the Portfolio as investors continued to search for higher-yielding assets and were willing to assume higher levels of risk to pursue their yield objectives.
Did the fixed-income portion of the Portfolio make any significant purchases or sales during the reporting period?
The year 2012 brought robust new issuance in both the high-yield and investment grade corporate bond markets. Year-to-date volume within the high-yield market exceeded the previous record set in 2010. The majority of new issuance was for refinancing. As a result, several companies in which the fixed-income portion of the Portfolio held positions, including privatized correctional and detention facilities operator Corrections Corporation of America and residential home builder Meritage Homes, redeemed their bonds during the reporting period.
During the reporting period, some companies, whose bonds the Portfolio had previously owned, issued new securities that fit our process, and we bought them for
the fixed-income portion of the Portfolio. Among these companies were oil & gas producer Chesapeake Energy, gaming facilities operator Mohegan Tribal Gaming Authority and residential home builder KB Home.
How did sector weightings in the fixed-income portion of the Portfolio change during the reporting period?
Through most of the reporting period we maintained a beta5 position that was greater than that of the Barclay’s U.S. Aggregate Bond Index. Toward the end of the reporting period, we reduced exposure to convertible securities in the fixed-income portion of the Portfolio while increasing credit exposure by adding to high-yield and investment-grade corporate bonds.
How was the fixed-income portion of the Portfolio positioned at the end of the reporting period?
As of December 31, 2012, the fixed-income portion of the Portfolio continued to maintain an overweight position relative to the Barclays U.S. Aggregate Bond Index in high-yield bonds and, to a lesser degree, in bank loans. As of the same date, the fixed-income portion of the Portfolio held underweight positions relative to this Index in U.S. Treasury securities, agency debentures and agency mortgage-backed securities.
| 4. | The Bank of America Merrill Lynch U.S. High Yield Master II Constrained Index is a market-value-weighted index of all domestic and Yankee high-yield bonds, including deferred-interest bonds and payment-in-kind securities. Issuers included in the Index have maturities of one year or more and have a credit rating lower than BBB-/Baa3, but are not in default. No single issuer may constitute greater than 2% of the Index. |
| 5. | Beta is a measure of volatility in relation to the market as a whole. A beta higher than 1 indicates that a security or portfolio will tend to exhibit higher volatility than the market. A beta lower than 1 indicates that a security or portfolio will tend to exhibit lower volatility than the market. |
The opinions expressed are those of the portfolio managers as of the date of this report and are subject to change. There is no guarantee that any forecasts made will come to pass. This material does not constitute investment advice and is not intended as an endorsement of any specific investment.
Not all MainStay VP Portfolios and/or share classes are available under all policies.
| | |
| M-258 | | MainStay VP Income Builder Portfolio |
Portfolio of Investments December 31, 2012
| | | | | | | | |
| | | Principal
Amount | | | Value | |
| | | | | | | | |
Long-Term Bonds 44.0%† Asset-Backed Securities 2.2% | |
Airlines 0.5% | | | | | | | | |
Northwest Airlines, Inc.
Series 2007-1, Class A
7.027%, due 5/1/21 | | $ | 1,381,317 | | | $ | 1,534,919 | |
| | | | | | | | |
| | |
Home Equity 1.5% | | | | | | | | |
Carrington Mortgage Loan Trust
Series 2006-NC4, Class A5
0.27%, due 10/25/36 (a)(b) | | | 483,789 | | | | 361,697 | |
Citigroup Mortgage Loan Trust, Inc.
Series 2007-AHL2, Class A3A
0.28%, due 5/25/37 (a)(b) | | | 633,941 | | | | 464,838 | |
GSAA Home Equity Trust
Series 2006-14, Class A1
0.26%, due 9/25/36 (a)(b) | | | 2,776,326 | | | | 1,283,920 | |
HSI Asset Securitization Corp. Trust
Series 2007-NC1, Class A1
0.31%, due 4/25/37 (a)(b) | | | 363,523 | | | | 316,168 | |
JP Morgan Mortgage Acquisition Corp.
Series 2007-HE1, Class AF1
0.31%, due 3/25/47 (a)(b) | | | 501,166 | | | | 360,233 | |
Master Asset Backed Securities Trust
Series 2006-HE4, Class A1
0.26%, due 11/25/36 (a)(b) | | | 353,634 | | | | 143,439 | |
Merrill Lynch Mortgage Investors Trust
Series 2007-MLN1, Class A2A
0.32%, due 3/25/37 (a)(b) | | | 1,670,154 | | | | 1,109,169 | |
Soundview Home Equity Loan Trust
Series 2006-EQ2, Class A2
0.32%, due 1/25/37 (a)(b) | | | 655,412 | | | | 391,404 | |
Specialty Underwriting & Residential Finance
Series 2006-BC4, Class A2B
0.32%, due 9/25/37 (a)(b) | | | 520,738 | | | | 429,316 | |
| | | | | | | | |
| | | | | | | 4,860,184 | |
| | | | | | | | |
Student Loans 0.2% | | | | | | | | |
Keycorp Student Loan Trust
Series 2000-A, Class A2
0.632%, due 5/25/29 (a) | | | 562,870 | | | | 517,129 | |
| | | | | | | | |
Total Asset-Backed Securities
(Cost $7,279,352) | | | | | | | 6,912,232 | |
| | | | | | | | |
|
| Corporate Bonds 30.3% | |
Aerospace & Defense 0.5% | | | | | | | | |
BAE Systems Holdings, Inc.
5.20%, due 8/15/15 (c) | | | 1,325,000 | | | | 1,450,994 | |
| | | | | | | | |
| | | | | | | | |
| | | Principal
Amount | | | Value | |
| | | | | | | | |
Agriculture 0.1% | | | | | | | | |
Lorillard Tobacco Co.
8.125%, due 6/23/19 | | $ | 165,000 | | | $ | 210,545 | |
| | | | | | | | |
| | |
Airlines 1.1% | | | | | | | | |
Continental Airlines, Inc. | | | | | | | | |
Series A
7.25%, due 5/10/21 | | | 394,461 | | | | 455,602 | |
7.875%, due 1/2/20 | | | 985,313 | | | | 1,014,873 | |
U.S. Airways Group, Inc.
Series A
6.25%, due 10/22/24 | | | 677,372 | | | | 733,256 | |
U.S. Airways, Inc.
Class A Series 2012-1,
Pass-Through Trust
5.90%, due 4/1/26 | | | 1,080,000 | | | | 1,177,200 | |
| | | | | | | | |
| | | | | | | 3,380,931 | |
| | | | | | | | |
Auto Manufacturers 0.9% | | | | | | | | |
Chrysler Group LLC / CG Co-Issuer, Inc.
8.25%, due 6/15/21 | | | 900,000 | | | | 990,000 | |
Ford Motor Co. | | | | | | | | |
6.625%, due 10/1/28 | | | 500,000 | | | | 577,430 | |
7.45%, due 7/16/31 | | | 455,000 | | | | 577,850 | |
Navistar International Corp.
8.25%, due 11/1/21 | | | 675,000 | | | | 651,375 | |
| | | | | | | | |
| | | | | | | 2,796,655 | |
| | | | | | | | |
Auto Parts & Equipment 0.5% | | | | | | | | |
Continental Rubber of America Corp.
4.50%, due 9/15/19 (c) | | | 950,000 | | | | 972,224 | |
Goodyear Tire & Rubber Co. (The)
8.25%, due 8/15/20 | | | 525,000 | | | | 576,188 | |
| | | | | | | | |
| | | | | | | 1,548,412 | |
| | | | | | | | |
Banks 2.0% | | | | | | | | |
AgriBank FCB
9.125%, due 7/15/19 | | | 200,000 | | | | 271,235 | |
Bank of America Corp. | | | | | | | | |
6.50%, due 8/1/16 | | | 50,000 | | | | 57,738 | |
7.625%, due 6/1/19 | | | 680,000 | | | | 870,108 | |
8.00%, due 12/31/49 (a) | | | 1,000,000 | | | | 1,106,080 | |
CIT Group, Inc. | | | | | | | | |
4.25%, due 8/15/17 | | | 200,000 | | | | 205,948 | |
5.00%, due 5/15/17 | | | 765,000 | | | | 810,900 | |
Citigroup, Inc.
8.50%, due 5/22/19 | | | 87,500 | | | | 117,656 | |
JPMorgan Chase & Co.
7.90%, due 12/31/49 (a) | | | 1,300,000 | | | | 1,472,913 | |
Morgan Stanley
4.875%, due 11/1/22 | | | 495,000 | | | | 512,520 | |
| † | Percentages indicated are based on Portfolio net assets. |
| ¨ | | Among the Portfolio’s 10 largest holdings or issuers held, as of December 31, 2012, excluding short-term investment. May be subject to change daily. |
| | | | | | |
The notes to the financial statements are an integral part of,
and should be read in conjunction with, the financial statements. | | mainstayinvestments.com | | | M-259 | |
Portfolio of Investments December 31, 2012 (continued)
| | | | | | | | |
| | | Principal
Amount | | | Value | |
| | | | | | | | |
| Corporate Bonds (continued) | |
Banks (continued) | | | | | | | | |
Wells Fargo & Co.
7.98%, due 12/31/49 (a) | | $ | 800,000 | | | $ | 918,000 | |
| | | | | | | | |
| | | | | | | 6,343,098 | |
| | | | | | | | |
Biotechnology 0.5% | | | | | | | | |
Amgen, Inc.
5.85%, due 6/1/17 | | | 1,250,000 | | | | 1,480,294 | |
| | | | | | | | |
| | |
Building Materials 0.9% | | | | | | | | |
¨USG Corp. | | | | | | | | |
6.30%, due 11/15/16 | | | 2,265,000 | | | | 2,344,275 | |
9.75%, due 1/15/18 | | | 545,000 | | | | 617,212 | |
| | | | | | | | |
| | | | | | | 2,961,487 | |
| | | | | | | | |
Chemicals 0.8% | | | | | | | | |
Dow Chemical Co. (The) | | | | | | | | |
4.125%, due 11/15/21 | | | 710,000 | | | | 777,822 | |
8.55%, due 5/15/19 | | | 140,000 | | | | 189,011 | |
Hexion U.S. Finance Corp.
6.625%, due 4/15/20 | | | 780,000 | | | | 793,650 | |
Rockwood Specialties Group, Inc.
4.625%, due 10/15/20 | | | 675,000 | | | | 698,625 | |
| | | | | | | | |
| | | | | | | 2,459,108 | |
| | | | | | | | |
Coal 0.2% | | | | | | | | |
Alpha Natural Resources, Inc. | | | | | | | | |
6.00%, due 6/1/19 | | | 525,000 | | | | 483,000 | |
6.25%, due 6/1/21 | | | 50,000 | | | | 45,750 | |
| | | | | | | | |
| | | | | | | 528,750 | |
| | | | | | | | |
Commercial Services 1.0% | | | | | | | | |
Avis Budget Car Rental LLC / Avis Budget Finance, Inc.
9.625%, due 3/15/18 | | | 1,010,000 | | | | 1,126,150 | |
HDTFS, Inc.
5.875%, due 10/15/20 (c) | | | 277,000 | | | | 289,465 | |
Hertz Corp. (The)
7.375%, due 1/15/21 | | | 900,000 | | | | 990,000 | |
Quebecor World, Inc. (Litigation Recovery Trust—Escrow Shares)
9.75% (c)(d)(e)(f) | | | 70,000 | | | | 1,120 | |
UR Merger Sub Corp.
8.375%, due 9/15/20 | | | 725,000 | | | | 802,937 | |
| | | | | | | | |
| | | | | | | 3,209,672 | |
| | | | | | | | |
Computers 0.7% | | | | | | | | |
NCR Corp.
5.00%, due 7/15/22 (c) | | | 1,205,000 | | | | 1,224,581 | |
SunGard Data Systems, Inc. | | | | | | | | |
6.625%, due 11/1/19 (c) | | | 600,000 | | | | 613,500 | |
7.375%, due 11/15/18 | | | 350,000 | | | | 374,938 | |
| | | | | | | | |
| | | | | | | 2,213,019 | |
| | | | | | | | |
| | | | | | | | |
| | | Principal
Amount | | | Value | |
| | | | | | | | |
Diversified Financial Services 0.5% | | | | | | | | |
Alterra Finance LLC
6.25%, due 9/30/20 | | $ | 75,000 | | | $ | 86,658 | |
GE Capital Trust II
5.50%, due 9/15/67 (a) | | € | 410,000 | | | | 536,580 | |
General Electric Capital Corp.
6.50%, due 9/15/67 (a) | | £ | 490,000 | | | | 819,860 | |
| | | | | | | | |
| | | | | | | 1,443,098 | |
| | | | | | | | |
Electric 0.8% | | | | | | | | |
CMS Energy Corp. | | | | | | | | |
5.05%, due 3/15/22 | | $ | 335,000 | | | | 373,346 | |
6.25%, due 2/1/20 | | | 90,000 | | | | 105,112 | |
Energy Future Intermediate Holding Co. LLC / EFIH Finance, Inc.
10.00%, due 12/1/20 | | | 709,000 | | | | 799,397 | |
Puget Energy, Inc.
5.625%, due 7/15/22 | | | 350,000 | | | | 376,978 | |
Wisconsin Energy Corp.
6.25%, due 5/15/67 (a) | | | 681,520 | | | | 733,486 | |
| | | | | | | | |
| | | | | | | 2,388,319 | |
| | | | | | | | |
Entertainment 0.3% | | | | | | | | |
Mohegan Tribal Gaming Authority
10.50%, due 12/15/16 (c) | | | 945,000 | | | | 926,100 | |
| | | | | | | | |
| | |
Environmental Controls 0.0%‡ | | | | | | | | |
EnergySolutions, Inc. / EnergySolutions LLC
10.75%, due 8/15/18 | | | 155,000 | | | | 146,475 | |
| | | | | | | | |
| | |
Finance—Auto Loans 0.1% | | | | | | | | |
Ford Motor Credit Co. LLC
5.875%, due 8/2/21 | | | 150,000 | | | | 174,681 | |
| | | | | | | | |
| | |
Finance—Consumer Loans 0.8% | | | | | | | | |
HSBC Finance Capital Trust IX
5.911%, due 11/30/35 (a) | | | 1,100,000 | | | | 1,097,250 | |
SLM Corp.
6.25%, due 1/25/16 | | | 750,000 | | | | 815,625 | |
Springleaf Finance Corp.
6.90%, due 12/15/17 | | | 800,000 | | | | 716,000 | |
| | | | | | | | |
| | | | | | | 2,628,875 | |
| | | | | | | | |
Finance—Credit Card 0.2% | | | | | | | | |
American Express Co.
6.80%, due 9/1/66 (a) | | | 700,000 | | | | 751,625 | |
| | | | | | | | |
| |
Finance—Mortgage Loan/Banker 0.2% | | | | | |
Countrywide Financial Corp.
6.25%, due 5/15/16 | | | 520,000 | | | | 570,808 | |
| | | | | | | | |
| | | | |
| M-260 | | MainStay VP Income Builder Portfolio | | The notes to the financial statements are an integral part of,
and should be read in conjunction with, the financial statements. |
| | | | | | | | |
| | | Principal
Amount | | | Value | |
| | | | | | | | |
| Corporate Bonds (continued) | |
Finance—Other Services 0.2% | | | | | | | | |
Icahn Enterprises, L.P. / Icahn Enterprises Finance Corp.
8.00%, due 1/15/18 | | $ | 725,000 | | | $ | 778,469 | |
| | | | | | | | |
| | |
Food 0.3% | | | | | | | | |
JBS USA LLC / JBS USA Finance, Inc.
8.25%, due 2/1/20 (c) | | | 435,000 | | | | 461,100 | |
Smithfield Foods, Inc.
7.75%, due 7/1/17 | | | 500,000 | | | | 582,500 | |
| | | | | | | | |
| | | | | | | 1,043,600 | |
| | | | | | | | |
Forest Products & Paper 0.2% | | | | | | | | |
Boise Paper Holdings LLC / Boise Co-Issuer Co.
8.00%, due 4/1/20 | | | 600,000 | | | | 663,000 | |
| | | | | | | | |
| | |
Gas 0.1% | | | | | | | | |
Southern Union Co.
7.60%, due 2/1/24 | | | 290,000 | | | | 369,314 | |
| | | | | | | | |
| | |
Health Care—Products 0.3% | | | | | | | | |
Alere, Inc.
7.25%, due 7/1/18 (c) | | | 825,000 | | | | 827,063 | |
| | | | | | | | |
| | |
Health Care—Services 0.3% | | | | | | | | |
CIGNA Corp.
4.375%, due 12/15/20 | | | 135,000 | | | | 149,086 | |
HCA, Inc.
8.00%, due 10/1/18 | | | 825,000 | | | | 954,938 | |
| | | | | | | | |
| | | | | | | 1,104,024 | |
| | | | | | | | |
Home Builders 1.4% | | | | | | | | |
Beazer Homes USA, Inc.
6.875%, due 7/15/15 | | | 800,000 | | | | 802,000 | |
K Hovnanian Enterprises, Inc.
7.25%, due 10/15/20 (c) | | | 2,225,000 | | | | 2,391,875 | |
MDC Holdings, Inc.
5.625%, due 2/1/20 | | | 1,100,000 | | | | 1,201,409 | |
| | | | | | | | |
| | | | | | | 4,395,284 | |
| | | | | | | | |
Household Products & Wares 0.3% | | | | | | | | |
Mead Products LLC / ACCO Brands Corp.
6.75%, due 4/30/20 (c) | | | 665,000 | | | | 698,250 | |
Reynolds Group Issuer, Inc.
9.875%, due 8/15/19 | | | 205,000 | | | | 219,350 | |
| | | | | | | | |
| | | | | | | 917,600 | |
| | | | | | | | |
Insurance 3.2% | | | | | | | | |
Allstate Corp. (The)
6.50%, due 5/15/67 (a) | | | 1,725,000 | | | | 1,834,969 | |
| | | | | | | | |
| | | Principal
Amount | | | Value | |
| | | | | | | | |
Insurance (continued) | | | | | | | | |
American International Group, Inc. | | | | | | | | |
4.875%, due 3/15/67 (a) | | € | 500,000 | | | $ | 592,328 | |
Series A2
5.75%, due 3/15/67 (a) | | £ | 350,000 | | | | 528,756 | |
Chubb Corp. (The)
6.375%, due 3/29/67 (a) | | $ | 730,000 | | | | 795,700 | |
Hartford Financial Services Group, Inc.
6.10%, due 10/1/41 | | | 1,725,000 | | | | 2,050,043 | |
Hartford Life, Inc.
7.65%, due 6/15/27 | | | 245,000 | | | | 312,816 | |
Liberty Mutual Group, Inc.
7.80%, due 3/7/87 (c) | | | 1,195,000 | | | | 1,329,438 | |
Pacific Life Insurance Co.
7.90%, due 12/30/23 (c) | | | 1,000,000 | | | | 1,248,162 | |
Progressive Corp. (The)
6.70%, due 6/15/67 (a) | | | 1,450,000 | | | | 1,566,000 | |
| | | | | | | | |
| | | | | | | 10,258,212 | |
| | | | | | | | |
Iron & Steel 0.5% | | | | | | | | |
AK Steel Corp.
8.75%, due 12/1/18 (c) | | | 800,000 | | | | 844,000 | |
Cliffs Natural Resources, Inc. | | | | | | | | |
3.95%, due 1/15/18 | | | 325,000 | | | | 327,107 | |
5.90%, due 3/15/20 | | | 465,000 | | | | 494,453 | |
| | | | | | | | |
| | | | | | | 1,665,560 | |
| | | | | | | | |
Lodging 1.6% | | | | | | | | |
Caesars Entertainment Operating Co., Inc.
10.00%, due 12/15/18 | | | 1,000,000 | | | | 662,500 | |
¨MGM Resorts International
6.75%, due 10/1/20 (c) | | | 3,468,000 | | | | 3,541,695 | |
Wynn Las Vegas LLC / Wynn Las Vegas Capital Corp.
7.75%, due 8/15/20 | | | 675,000 | | | | 769,500 | |
| | | | | | | | |
| | | | | | | 4,973,695 | |
| | | | | | | | |
Media 0.9% | | | | | | | | |
CC Holdings GS V LLC
2.381%, due 12/15/17 (c) | | | 285,000 | | | | 286,393 | |
Clear Channel Communications, Inc. | | | | | | | | |
5.50%, due 12/15/16 | | | 50,000 | | | | 29,750 | |
6.875%, due 6/15/18 | | | 870,000 | | | | 513,300 | |
Comcast Corp.
5.70%, due 7/1/19 | | | 800,000 | | | | 974,753 | |
DISH DBS Corp.
7.125%, due 2/1/16 | | | 600,000 | | | | 672,000 | |
NBC Universal Media LLC
5.15%, due 4/30/20 | | | 55,000 | | | | 65,200 | |
Time Warner Cable, Inc.
8.25%, due 2/14/14 | | | 200,000 | | | | 216,650 | |
Time Warner, Inc.
7.70%, due 5/1/32 | | | 115,000 | | | | 160,790 | |
| | | | | | | | |
| | | | | | | 2,918,836 | |
| | | | | | | | |
| | | | | | |
The notes to the financial statements are an integral part of,
and should be read in conjunction with, the financial statements. | | mainstayinvestments.com | | | M-261 | |
Portfolio of Investments December 31, 2012 (continued)
| | | | | | | | |
| | | Principal
Amount | | | Value | |
| | | | | | | | |
| Corporate Bonds (continued) | |
Mining 0.6% | | | | | | | | |
Alcoa, Inc.
5.90%, due 2/1/27 | | $ | 440,000 | | | $ | 452,889 | |
Aleris International, Inc.
7.875%, due 11/1/20 (c) | | | 850,000 | | | | 850,000 | |
Century Aluminum Co.
8.00%, due 5/15/14 | | | 606,000 | | | | 612,060 | |
| | | | | | | | |
| | | | | | | 1,914,949 | |
| | | | | | | | |
Miscellaneous—Manufacturing 0.5% | | | | | |
Amsted Industries, Inc.
8.125%, due 3/15/18 (c) | | | 1,400,000 | | | | 1,498,000 | |
| | | | | | | | |
| | |
Office Equipment/Supplies 0.1% | | | | | | | | |
Xerox Corp.
8.25%, due 5/15/14 | | | 270,000 | | | | 294,512 | |
| | | | | | | | |
| | |
Oil & Gas 3.3% | | | | | | | | |
Berry Petroleum Co.
6.375%, due 9/15/22 | | | 640,000 | | | | 665,600 | |
Chesapeake Energy Corp.
6.625%, due 8/15/20 | | | 1,025,000 | | | | 1,099,312 | |
¨ConocoPhillips
6.50%, due 2/1/39 | | | 1,000,000 | | | | 1,418,139 | |
EP Energy LLC / EP Energy Finance, Inc.
9.375%, due 5/1/20 | | | 825,000 | | | | 930,187 | |
¨Linn Energy LLC / Linn Energy Finance Corp.
8.625%, due 4/15/20 | | | 2,405,000 | | | | 2,621,450 | |
Nabors Industries, Inc.
5.00%, due 9/15/20 | | | 1,000,000 | | | | 1,086,639 | |
Plains Exploration & Production Co.
6.125%, due 6/15/19 | | | 750,000 | | | | 817,500 | |
Samson Investment Co.
9.75%, due 2/15/20 (c) | | | 835,000 | | | | 883,013 | |
Swift Energy Co.
7.875%, due 3/1/22 | | | 825,000 | | | | 862,125 | |
| | | | | | | | |
| | | | | | | 10,383,965 | |
| | | | | | | | |
Pipelines 1.7% | | | | | | | | |
Access Midstream Partners, L.P. / ACMP Finance Corp.
4.875%, due 5/15/23 | | | 310,000 | | | | 314,650 | |
Atlas Pipeline Escrow LLC
6.625%, due 10/1/20 (c) | | | 850,000 | | | | 879,750 | |
Energy Transfer Partners, L.P.
4.65%, due 6/1/21 | | | 650,000 | | | | 714,175 | |
MarkWest Energy Partners, L.P. / MarkWest Energy Finance Corp.
5.50%, due 2/15/23 | | | 925,000 | | | | 1,003,625 | |
| | | | | | | | |
| | | Principal
Amount | | | Value | |
| | | | | | | | |
Pipelines (continued) | | | | | | | | |
ONEOK, Inc.
6.00%, due 6/15/35 | | $ | 130,000 | | | $ | 150,818 | |
Regency Energy Partners, L.P. / Regency Energy Finance Corp.
6.875%, due 12/1/18 | | | 555,000 | | | | 604,950 | |
Targa Resources Partners, L.P. / Targa Resources Partners Finance Corp.
5.25%, due 5/1/23 (c) | | | 800,000 | | | | 828,000 | |
Williams Cos., Inc. (The)
3.70%, due 1/15/23 | | | 850,000 | | | | 857,356 | |
| | | | | | | | |
| | | | | | | 5,353,324 | |
| | | | | | | | |
Real Estate Investment Trusts 0.0%‡ | | | | | | | | |
ProLogis, L.P.
7.375%, due 10/30/19 | | | 75,000 | | | | 92,987 | |
| | | | | | | | |
| | |
Retail 0.3% | | | | | | | | |
AmeriGas Finance LLC / AmeriGas Finance Corp. | | | | | | | | |
6.75%, due 5/20/20 | | | 325,000 | | | | 356,688 | |
7.00%, due 5/20/22 | | | 610,000 | | | | 678,625 | |
CVS Caremark Corp.
5.789%, due 1/10/26 (c)(e) | | | 54,733 | | | | 61,656 | |
| | | | | | | | |
| | | | | | | 1,096,969 | |
| | | | | | | | |
Semiconductors 0.2% | | | | | | | | |
Freescale Semiconductor, Inc.
9.25%, due 4/15/18 (c) | | | 700,000 | | | | 764,750 | |
| | | | | | | | |
| | |
Software 0.8% | | | | | | | | |
Fidelity National Information Services, Inc.
7.875%, due 7/15/20 | | | 650,000 | | | | 735,312 | |
First Data Corp. | | | | | | | | |
7.375%, due 6/15/19 (c) | | | 1,115,000 | | | | 1,154,025 | |
8.875%, due 8/15/20 (c) | | | 710,000 | | | | 773,900 | |
| | | | | | | | |
| | | | | | | 2,663,237 | |
| | | | | | | | |
Telecommunications 1.2% | | | | | | | | |
CommScope, Inc.
8.25%, due 1/15/19 (c) | | | 875,000 | | | | 958,125 | |
Hughes Satellite Systems Corp.
7.625%, due 6/15/21 | | | 575,000 | | | | 654,062 | |
SBA Tower Trust
4.254%, due 4/15/40 (c) | | | 1,170,000 | | | | 1,229,180 | |
Sprint Nextel Corp.
6.00%, due 11/15/22 | | | 1,100,000 | | | | 1,130,250 | |
| | | | | | | | |
| | | | | | | 3,971,617 | |
| | | | | | | | |
Transportation 0.2% | | | | | | | | |
PHI, Inc.
8.625%, due 10/15/18 | | | 658,000 | | | | 704,060 | |
| | | | | | | | |
Total Corporate Bonds
(Cost $88,582,826) | | | | | | | 96,265,973 | |
| | | | | | | | |
| | | | |
| M-262 | | MainStay VP Income Builder Portfolio | | The notes to the financial statements are an integral part of,
and should be read in conjunction with, the financial statements. |
| | | | | | | | |
| | | Principal
Amount | | | Value | |
| | | | | | | | |
| Foreign Bonds 0.9% | |
Banks 0.6% | | | | | | | | |
Barclays Bank PLC
Series Reg S
10.00%, due 5/21/21 | | £ | 525,000 | | | $ | 1,145,136 | |
Canada Square Operations PLC
7.50%, due 12/31/49 (a) | | | 430,000 | | | | 695,439 | |
| | | | | | | | |
| | | | | | | 1,840,575 | |
| | | | | | | | |
Packaging & Containers 0.3% | | | | | | | | |
Rexam PLC
6.75%, due 6/29/67 (a) | | € | 525,000 | | | | 729,348 | |
| | | | | | | | |
Total Foreign Bonds
(Cost $2,279,668) | | | | | | | 2,569,923 | |
| | | | | | | | |
|
| Foreign Government Bonds 0.6% | |
Foreign Sovereign 0.6% | | | | | | | | |
Portugal Obrigacoes do Tesouro OT
Series Reg S
4.95%, due 10/25/23 | | € | 1,575,000 | | | | 1,759,080 | |
Republic of Venezuela
6.00%, due 12/9/20 | | $ | 217,000 | | | | 181,195 | |
| | | | | | | | |
Total Foreign Government Bonds
(Cost $1,219,688) | | | | | | | 1,940,275 | |
| | | | | | | | |
|
| Loan Assignments & Participations 1.1% (g) | |
Airlines 0.3% | | | | | | | | |
U.S. Airways Group, Inc.
Term Loan
2.712%, due 3/21/14 | | | 972,222 | | | | 956,910 | |
| | | | | | | | |
| | |
Automobile 0.3% | | | | | | | | |
Allison Transmission, Inc.
Extended Term Loan B2
3.71%, due 8/7/17 | | | 953,883 | | | | 959,041 | |
| | | | | | | | |
| | |
Media 0.3% | | | | | | | | |
Clear Channel Communications, Inc.
Term Loan B
3.862%, due 1/29/16 | | | 1,119,652 | | | | 926,512 | |
| | | | | | | | |
| | |
Metals & Mining 0.2% | | | | | | | | |
FMG America Finance, Inc.
Term Loan
5.25%, due 10/18/17 | | | 498,750 | | | | 502,257 | |
| | | | | | | | |
Total Loan Assignments & Participations
(Cost $3,432,846) | | | | | | | 3,344,720 | |
| | | | | | | | |
| | | | | | | | |
| | | Principal
Amount | | | Value | |
| | | | | | | | |
| Mortgage-Backed Securities 0.9% | |
Commercial Mortgage Loans (Collateralized Mortgage Obligations) 0.8% | |
Banc of America Commercial Mortgage, Inc.
Series 2007-2, Class A4
5.625%, due 4/10/49 (h) | | $ | 290,000 | | | $ | 339,178 | |
Bayview Commercial Asset Trust
Series 2006-4A, Class A1
0.44%, due 12/25/36 (a)(c)(d) | | | 170,683 | | | | 135,089 | |
Bear Stearns Commercial Mortgage Securities | | | | | | | | |
Series 2005-PW10, Class A4
5.405%, due 12/11/40 (a) | | | 130,000 | | | | 144,774 | |
Series 2007-PW16, Class A4
5.715%, due 6/11/40 (h) | | | 290,000 | | | | 343,516 | |
Citigroup Commercial Mortgage Trust
Series 2008-C7, Class A4
6.06%, due 12/10/49 (h) | | | 150,000 | | | | 181,015 | |
Deutsche ALT-A Securities, Inc.
Alternate Loan Trust
Series 2005-5, Class 1A3
5.50%, due 11/25/35 (a) | | | 112,176 | | | | 101,281 | |
Four Times Square Trust
Series 2006-4TS, Class A
5.401%, due 12/13/28 (c) | | | 480,000 | | | | 575,767 | |
Morgan Stanley Capital I, Inc.
Series 2007-IQ15, Class A4
5.882%, due 6/11/49 (h) | | | 200,000 | | | | 235,126 | |
Timberstar Trust
Series 2006-1, Class A
5.668%, due 10/15/36 (c) | | | 160,000 | | | | 183,587 | |
WaMu Mortgage
Pass-Through Certificates
Series 2006-AR14, Class 1A1
2.424%, due 11/25/36 (h) | | | 320,181 | | | | 256,715 | |
| | | | | | | | |
| | | | | | | 2,496,048 | |
| | | | | | | | |
Residential Mortgage (Collateralized Mortgage Obligation) 0.1% | |
Mortgage Equity Conversion Asset Trust
Series 2007-FF2, Class A
0.65%, due 2/25/42 (a)(c)(d) | | | 429,043 | | | | 356,374 | |
| | | | | | | | |
Total Mortgage-Backed Securities
(Cost $2,476,469) | | | | | | | 2,852,422 | |
| | | | | | | | |
|
| U.S. Government & Federal Agencies 2.1% | |
Federal National Mortgage Association
(Mortgage Pass-Through Security) 0.1% | |
6.00%, due 4/1/37 | | | 226,520 | | | | 245,165 | |
| | | | | | | | |
| | |
¨United States Treasury Bonds 1.3% | | | | | | | | |
2.75%, due 8/15/42 | | | 3,005,000 | | | | 2,901,703 | |
4.375%, due 11/15/39 | | | 800,000 | | | | 1,040,750 | |
| | | | | | |
The notes to the financial statements are an integral part of,
and should be read in conjunction with, the financial statements. | | mainstayinvestments.com | | | M-263 | |
Portfolio of Investments December 31, 2012 (continued)
| | | | | | | | |
| | | Principal
Amount | | | Value | |
| | | | | | | | |
| U.S. Government & Federal Agencies (continued) | |
United States Treasury Bonds (continued) | |
4.375%, due 5/15/40 | | $ | 155,000 | | | $ | 201,767 | |
| | | | | | | | |
| | | | | | | 4,144,220 | |
| | | | | | | | |
United States Treasury Notes 0.7% | | | | | | | | |
1.25%, due 3/15/14 | | | 175,000 | | | | 177,174 | |
2.00%, due 4/30/16 | | | 2,005,000 | | | | 2,109,479 | |
| | | | | | | | |
| | | | | | | 2,286,653 | |
| | | | | | | | |
Total U.S. Government & Federal Agencies
(Cost $6,332,703) | | | | 6,676,038 | |
| | | | | | | | |
|
| Yankee Bonds 5.9% (i) | |
Banks 0.6% | | | | | | | | |
Banco Santander Mexico S.A. Institucion De Banca Multiple Grupo Financiero Santand
4.125%, due 11/9/22 (c) | | | 1,000,000 | | | | 1,017,500 | |
HSBC Holdings PLC
5.10%, due 4/5/21 | | | 40,000 | | | | 47,235 | |
Royal Bank of Scotland Group PLC | | | | | | | | |
2.55%, due 9/18/15 | | | 120,000 | | | | 122,809 | |
6.125%, due 12/15/22 | | | 550,000 | | | | 580,515 | |
UBS A.G.
3.875%, due 1/15/15 | | | 150,000 | | | | 158,500 | |
| | | | | | | | |
| | | | | | | 1,926,559 | |
| | | | | | | | |
Building Materials 0.5% | | | | | | | | |
Desarrolladora Homex S.A.B. de C.V.
9.50%, due 12/11/19 (c) | | | 750,000 | | | | 806,250 | |
Urbi Desarrollos Urbanos S.A.B. de C.V.
9.50%, due 1/21/20 (c) | | | 750,000 | | | | 708,750 | |
| | | | | | | | |
| | | | | | | 1,515,000 | |
| | | | | | | | |
Cosmetics & Personal Care 0.3% | | | | | | | | |
Albea Beauty Holdings S.A.
8.375%, due 11/1/19 (c) | | | 800,000 | | | | 844,000 | |
| | | | | | | | |
| | |
Diversified Financial Services 0.0%‡ | | | | | | | | |
Permanent TSB PLC
3.60%, due 1/14/13 (c) | | | 100,000 | | | | 100,001 | |
| | | | | | | | |
| | |
Electric 0.3% | | | | | | | | |
Abu Dhabi National Energy Co.
3.625%, due 1/12/23 (c) | | | 980,000 | | | | 1,009,400 | |
| | | | | | | | |
| | |
Finance—Leasing Companies 0.3% | | | | | | | | |
Banque PSA Finance S.A.
5.75%, due 4/4/21 (c) | | | 800,000 | | | | 786,688 | |
| | | | | | | | |
| | | | | | | | |
| | | Principal
Amount | | | Value | |
| | | | | | | | |
Food 0.8% | | | | | | | | |
Grupo Bimbo S.A.B. de
C.V. 4.50%, due 1/25/22 (c) | | $ | 750,000 | | | $ | 819,610 | |
Minerva Luxembourg S.A.
12.25%, due 2/10/22 (c) | | | 750,000 | | | | 898,125 | |
Virgolino de Oliveira Finance, Ltd.
11.75%, due 2/9/22 (c) | | | 750,000 | | | | 772,500 | |
| | | | | | | | |
| | | | | | | 2,490,235 | |
| | | | | | | | |
Insurance 0.4% | | | | | | | | |
Oil Insurance, Ltd.
3.293%, due 12/31/49 (a)(c) | | | 580,000 | | | | 513,996 | |
Swiss Re Capital I, L.P.
6.854%, due 12/31/49 (a)(c) | | | 600,000 | | | | 628,861 | |
| | | | | | | | |
| | | | | | | 1,142,857 | |
| | | | | | | | |
Investment Company 0.3% | | | | | | | | |
CDP Financial, Inc.
4.40%, due 11/25/19 (c) | | | 900,000 | | | | 1,035,569 | |
| | | | | | | | |
| | |
Iron & Steel 0.2% | | | | | | | | |
Vale S.A.
5.625%, due 9/11/42 | | | 685,000 | | | | 743,636 | |
| | | | | | | | |
| | |
Mining 0.9% | | | | | | | | |
FMG Resources August 2006 Pty, Ltd.
8.25%, due 11/1/19 (c) | | | 900,000 | | | | 958,500 | |
Rio Tinto Finance USA, Ltd.
9.00%, due 5/1/19 | | | 650,000 | | | | 892,793 | |
Vedanta Resources PLC
8.25%, due 6/7/21 (c) | | | 820,000 | | | | 904,050 | |
| | | | | | | | |
| | | | | | | 2,755,343 | |
| | | | | | | | |
Miscellaneous—Manufacturing 0.5% | | | | | |
Bombardier, Inc.
7.75%, due 3/15/20 (c) | | | 1,400,000 | | | | 1,589,000 | |
| | | | | | | | |
| | |
Oil & Gas 0.4% | | | | | | | | |
Gazprom Oao Via Gaz Capital S.A.
4.95%, due 7/19/22 (c) | | | 640,000 | | | | 688,320 | |
OGX Austria GmbH
8.50%, due 6/1/18 (c) | | | 650,000 | | | | 585,000 | |
TNK-BP Finance S.A.
7.50%, due 7/18/16 (c) | | | 100,000 | | | | 115,750 | |
| | | | | | | | |
| | | | | | | 1,389,070 | |
| | | | | | | | |
Transportation 0.4% | | | | | | | | |
CHC Helicopter S.A.
9.25%, due 10/15/20 | | | 940,000 | | | | 989,350 | |
| | | | |
| M-264 | | MainStay VP Income Builder Portfolio | | The notes to the financial statements are an integral part of,
and should be read in conjunction with, the financial statements. |
| | | | | | | | |
| | | Principal
Amount | | | Value | |
| | | | | | | | |
| Yankee Bonds (continued) | |
Transportation (continued) | | | | | | | | |
Hapag-Lloyd A.G.
9.75%, due 10/15/17 (c) | | $ | 300,000 | | | $ | 301,500 | |
| | | | | | | | |
| | | | | | | 1,290,850 | |
| | | | | | | | |
Total Yankee Bonds
(Cost $17,770,194) | | | | | | | 18,618,208 | |
| | | | | | | | |
Total Long-Term Bonds
(Cost $129,373,746) | | | | | | | 139,179,791 | |
| | | | | | | | |
| | |
| | | | | | | | |
| | |
| | | Shares | | | | |
| Common Stocks 46.4% | |
Aerospace & Defense 1.2% | | | | | | | | |
BAE Systems PLC | | | 334,700 | | | | 1,838,834 | |
Lockheed Martin Corp. | | | 20,500 | | | | 1,891,945 | |
| | | | | | | | |
| | | | | | | 3,730,779 | |
| | | | | | | | |
Agriculture 3.6% | | | | | | | | |
Altria Group, Inc. | | | 71,450 | | | | 2,244,959 | |
British American Tobacco PLC | | | 24,900 | | | | 1,261,684 | |
Imperial Tobacco Group PLC | | | 61,200 | | | | 2,363,229 | |
Lorillard, Inc. | | | 15,350 | | | | 1,790,884 | |
Philip Morris International, Inc. | | | 23,750 | | | | 1,986,450 | |
Reynolds American, Inc. | | | 44,350 | | | | 1,837,420 | |
| | | | | | | | |
| | | | | | | 11,484,626 | |
| | | | | | | | |
Auto Manufacturers 0.8% | | | | | | | | |
Daimler A.G. | | | 36,800 | | | | 2,010,927 | |
Ford Motor Co. | | | 52,500 | | | | 679,875 | |
| | | | | | | | |
| | | | | | | 2,690,802 | |
| | | | | | | | |
Banks 0.7% | | | | | | | | |
CIT Group, Inc. (f) | | | 11,500 | | | | 444,360 | |
Citigroup, Inc. | | | 16,500 | | | | 652,740 | |
Westpac Banking Corp. | | | 44,350 | | | | 1,212,459 | |
| | | | | | | | |
| | | | | | | 2,309,559 | |
| | | | | | | | |
Beverages 1.5% | | | | | | | | |
Anheuser-Busch InBev N.V. | | | 12,450 | | | | 1,087,988 | |
Coca-Cola Co. (The) | | | 21,650 | | | | 784,813 | |
Coca-Cola Enterprises, Inc. | | | 26,450 | | | | 839,258 | |
Diageo PLC, Sponsored ADR (j) | | | 9,400 | | | | 1,095,852 | |
PepsiCo., Inc. | | | 11,800 | | | | 807,474 | |
| | | | | | | | |
| | | | | | | 4,615,385 | |
| | | | | | | | |
Building Materials 0.1% | | | | | | | | |
U.S. Concrete, Inc. (d)(f) | | | 35,009 | | | | 316,831 | |
| | | | | | | | |
| | |
Chemicals 1.6% | | | | | | | | |
BASF S.E. | | | 25,000 | | | | 2,349,783 | |
Bayer A.G. | | | 11,200 | | | | 1,063,580 | |
| | | | | | | | |
| | |
| | | Shares | | | Value | |
| | | | | | | | |
Chemicals (continued) | | | | | | | | |
E.I. du Pont de Nemours & Co. | | | 35,750 | | | $ | 1,607,678 | |
| | | | | | | | |
| | | | | | | 5,021,041 | |
| | | | | | | | |
Commercial Services 0.5% | | | | | | | | |
Automatic Data Processing, Inc. | | | 14,900 | | | | 849,449 | |
R.R. Donnelley & Sons Co. | | | 84,850 | | | | 763,650 | |
| | | | | | | | |
| | | | | | | 1,613,099 | |
| | | | | | | | |
Computers 0.3% | | | | | | | | |
Diebold, Inc. | | | 32,600 | | | | 997,886 | |
| | | | | | | | |
| | |
Distribution & Wholesale 0.3% | | | | | | | | |
Genuine Parts Co. | | | 14,300 | | | | 909,194 | |
| | | | | | | | |
| | |
Electric 4.6% | | | | | | | | |
CMS Energy Corp. | | | 47,400 | | | | 1,155,612 | |
Dominion Resources, Inc. | | | 20,850 | | | | 1,080,030 | |
Duke Energy Corp. | | | 36,208 | | | | 2,310,070 | |
Integrys Energy Group, Inc. | | | 19,930 | | | | 1,040,745 | |
PPL Corp. | | | 63,100 | | | | 1,806,553 | |
SCANA Corp. | | | 18,400 | | | | 839,776 | |
Southern Co. (The) | | | 34,650 | | | | 1,483,367 | |
SSE PLC | | | 79,600 | | | | 1,839,642 | |
TECO Energy, Inc. | | | 88,850 | | | | 1,489,126 | |
Terna S.p.A. | | | 362,000 | | | | 1,449,735 | |
| | | | | | | | |
| | | | | | | 14,494,656 | |
| | | | | | | | |
Electrical Components & Equipment 0.3% | | | | | | | | |
Emerson Electric Co. | | | 21,050 | | | | 1,114,808 | |
| | | | | | | | |
| | |
Electronics 0.3% | | | | | | | | |
Honeywell International, Inc. | | | 17,450 | | | | 1,107,552 | |
| | | | | | | | |
| | |
Engineering & Construction 0.5% | | | | | | | | |
Vinci S.A. | | | 34,250 | | | | 1,630,040 | |
| | | | | | | | |
| | |
Entertainment 0.3% | | | | | | | | |
Regal Entertainment Group Class A | | | 72,750 | | | | 1,014,863 | |
| | | | | | | | |
| | |
Environmental Controls 0.5% | | | | | | | | |
Waste Management, Inc. | | | 44,400 | | | | 1,498,056 | |
| | | | | | | | |
| | |
Finance—Other Services 0.4% | | | | | | | | |
CME Group, Inc. | | | 26,800 | | | | 1,359,028 | |
| | | | | | | | |
| | |
Food 1.5% | | | | | | | | |
H.J. Heinz Co. | | | 13,400 | | | | 772,912 | |
¨Nestlé S.A. Registered | | | 38,150 | | | | 2,486,392 | |
| | | | | | |
The notes to the financial statements are an integral part of,
and should be read in conjunction with, the financial statements. | | mainstayinvestments.com | | | M-265 | |
Portfolio of Investments December 31, 2012 (continued)
| | | | | | | | |
| | |
| | | Shares | | | Value | |
| | | | | | | | |
| Common Stocks (continued) | |
Food (continued) | | | | | | | | |
Unilever PLC | | | 22,250 | | | $ | 844,562 | |
WM Morrison Supermarkets PLC | | | 174,600 | | | | 746,790 | |
| | | | | | | | |
| | | | | | | 4,850,656 | |
| | | | | | | | |
Food Services 0.4% | | | | | | | | |
Compass Group PLC | | | 100,700 | | | | 1,190,955 | |
| | | | | | | | |
| | |
Gas 1.3% | | | | | | | | |
¨National Grid PLC | | | 212,500 | | | | 2,434,066 | |
NiSource, Inc. | | | 33,500 | | | | 833,815 | |
Vectren Corp. | | | 33,650 | | | | 989,310 | |
| | | | | | | | |
| | | | | | | 4,257,191 | |
| | | | | | | | |
Household Products & Wares 1.1% | | | | | | | | |
Kimberly-Clark Corp. | | | 27,950 | | | | 2,359,818 | |
Reckitt Benckiser Group PLC | | | 19,200 | | | | 1,202,760 | |
| | | | | | | | |
| | | | | | | 3,562,578 | |
| | | | | | | | |
Insurance 2.0% | | | | | | | | |
Arthur J. Gallagher & Co. | | | 42,600 | | | | 1,476,090 | |
Muenchener Rueckversicherungs-Gesellschaft A.G. Registered | | | 12,100 | | | | 2,172,478 | |
SCOR SE | | | 67,500 | | | | 1,820,096 | |
Travelers Cos., Inc. (The) | | | 12,200 | | | | 876,204 | |
| | | | | | | | |
| | | | | | | 6,344,868 | |
| | | | | | | | |
Machinery—Diversified 0.2% | | | | | | | | |
Deere & Co. | | | 8,950 | | | | 773,459 | |
| | | | | | | | |
| | |
Media 2.3% | | | | | | | | |
Comcast Corp. Class A | | | 46,300 | | | | 1,664,485 | |
¨Pearson PLC | | | 132,950 | | | | 2,599,085 | |
Shaw Communications, Inc. | | | 70,100 | | | | 1,609,615 | |
Time Warner, Inc. | | | 26,900 | | | | 1,286,627 | |
| | | | | | | | |
| | | | | | | 7,159,812 | |
| | | | | | | | |
Miscellaneous—Manufacturing 0.4% | | | | | | | | |
Orkla ASA | | | 132,250 | | | | 1,157,822 | |
| | | | | | | | |
| | |
Oil & Gas 2.7% | | | | | | | | |
¨ConocoPhillips | | | 25,350 | | | | 1,470,047 | |
Diamond Offshore Drilling, Inc. | | | 31,800 | | | | 2,161,128 | |
ExxonMobil Corp. | | | 9,200 | | | | 796,260 | |
Royal Dutch Shell PLC, ADR (j) | | | 28,410 | | | | 1,958,869 | |
Total S.A. | | | 39,450 | | | | 2,041,835 | |
| | | | | | | | |
| | | | | | | 8,428,139 | |
| | | | | | | | |
Pharmaceuticals 4.0% | | | | | | | | |
Abbott Laboratories | | | 14,450 | | | | 946,475 | |
AstraZeneca PLC, Sponsored ADR (j) | | | 37,800 | | | | 1,786,806 | |
Bristol-Myers Squibb Co. | | | 30,600 | | | | 997,254 | |
GlaxoSmithKline PLC | | | 85,200 | | | | 1,849,827 | |
| | | | | | | | |
| | |
| | | Shares | | | Value | |
| | | | | | | | |
Pharmaceuticals (continued) | | | | | | | | |
Johnson & Johnson | | | 15,850 | | | $ | 1,111,085 | |
Merck & Co., Inc. | | | 26,400 | | | | 1,080,816 | |
Novartis A.G. | | | 23,950 | | | | 1,516,311 | |
Roche Holding A.G., Genusscheine | | | 10,060 | | | | 2,049,472 | |
Sanofi | | | 14,300 | | | | 1,356,144 | |
| | | | | | | | |
| | | | | | | 12,694,190 | |
| | | | | | | | |
Pipelines 1.3% | | | | | | | | |
Enterprise Products Partners, L.P. | | | 22,250 | | | | 1,114,280 | |
Kinder Morgan Energy Partners, L.P. | | | 18,600 | | | | 1,484,094 | |
MarkWest Energy Partners, L.P. | | | 16,400 | | | | 836,564 | |
Spectra Energy Corp. | | | 29,900 | | | | 818,662 | |
| | | | | | | | |
| | | | | | | 4,253,600 | |
| | | | | | | | |
Real Estate Investment Trusts 0.4% | | | | | | | | |
Health Care REIT, Inc. | | | 18,600 | | | | 1,139,994 | |
| | | | | | | | |
| | |
Retail 0.7% | | | | | | | | |
Costco Wholesale Corp. | | | 8,470 | | | | 836,582 | |
McDonald’s Corp. | | | 16,500 | | | | 1,455,465 | |
| | | | | | | | |
| | | | | | | 2,292,047 | |
| | | | | | | | |
Semiconductors 1.3% | | | | | | | | |
KLA-Tencor Corp. | | | 23,600 | | | | 1,127,136 | |
Microchip Technology, Inc. | | | 52,000 | | | | 1,694,680 | |
Taiwan Semiconductor Manufacturing Co., Ltd., Sponsored ADR (j) | | | 68,700 | | | | 1,178,892 | |
| | | | | | | | |
| | | | | | | 4,000,708 | |
| | | | | | | | |
Software 0.6% | | | | | | | | |
Microsoft Corp. | | | 41,000 | | | | 1,095,930 | |
Oracle Corp. | | | 22,000 | | | | 733,040 | |
| | | | | | | | |
| | | | | | | 1,828,970 | |
| | | | | | | | |
Telecommunications 6.8% | | | | | | | | |
AT&T, Inc. | | | 49,600 | | | | 1,672,016 | |
¨BCE, Inc. | | | 66,400 | | | | 2,845,714 | |
CenturyLink, Inc. | | | 54,250 | | | | 2,122,260 | |
Deutsche Telekom A.G. | | | 151,100 | | | | 1,716,683 | |
Philippine Long Distance Telephone Co., Sponsored ADR (j) | | | 13,300 | | | | 815,423 | |
Rogers Communications, Inc. Class B | | | 31,000 | | | | 1,407,419 | |
¨Swisscom A.G. | | | 6,135 | | | | 2,645,977 | |
Telstra Corp, Ltd. | | | 410,850 | | | | 1,871,629 | |
Verizon Communications, Inc. | | | 53,400 | | | | 2,310,618 | |
Vivendi S.A. | | | 75,318 | | | | 1,696,136 | |
Vodafone Group PLC | | | 964,750 | | | | 2,426,217 | |
| | | | | | | | |
| | | | | | | 21,530,092 | |
| | | | | | | | |
Toys, Games & Hobbies 0.5% | | | | | | | | |
Mattel, Inc. | | | 44,950 | | | | 1,646,069 | |
| | | | | | | | |
| | | | |
| M-266 | | MainStay VP Income Builder Portfolio | | The notes to the financial statements are an integral part of,
and should be read in conjunction with, the financial statements. |
| | | | | | | | |
| | |
| | | Shares | | | Value | |
| | | | | | | | |
| Common Stocks (continued) | |
Transportation 0.7% | | | | | | | | |
Deutsche Post A.G. | | | 34,350 | | | $ | 753,204 | |
FirstGroup PLC | | | 384,600 | | | | 1,317,094 | |
| | | | | | | | |
| | | | | | | 2,070,298 | |
| | | | | | | | |
Water 0.7% | | | | | | | | |
United Utilities Group PLC | | | 202,750 | | | | 2,224,826 | |
| | | | | | | | |
Total Common Stocks
(Cost $125,144,915) | | | | | | | 147,314,479 | |
| | | | | | | | |
|
| Convertible Preferred Stock 0.0%‡ | |
Oil & Gas 0.0%‡ | | | | | | | | |
Sanchez Energy Corp. (c)
4.875% | | | 2,400 | | | | 118,121 | |
| | | | | | | | |
Total Convertible Preferred Stock
(Cost $120,450) | | | | 118,121 | |
| | | | | | | | |
|
| Preferred Stocks 0.5% | |
Insurance 0.3% | | | | | | | | |
MetLife, Inc.
6.50% | | | 35,550 | | | | 896,216 | |
| | | | | | | | |
| | |
Media 0.2% | | | | | | | | |
ProSiebenSat.1 Media A.G.
5.32% | | | 25,410 | | | | 715,010 | |
| | | | | | | | |
Total Preferred Stocks
(Cost $1,479,047) | | | | | | | 1,611,226 | |
| | | | | | | | |
| | |
| | | | | | | | |
| | | Number of
Warrants | | | | |
| Warrants 0.0%‡ | |
Media 0.0%‡ | | | | | | | | |
ION Media Networks, Inc.
Second Lien
Expires 12/12/39 (d)(e)(f)(k) | | | 4 | | | | 0 | (l) |
Unsecured Debt
Expires 12/31/49 (d)(e)(f)(k) | | | 4 | | | | 0 | (l) |
| | | | | | | | |
Total Warrants
(Cost $13) | | | | | | | 0 | (l) |
| | | | | | | | |
| | | | | | | | |
| | | Principal
Amount | | | Value | |
| | | | | | | | |
| Short-Term Investment 7.2% | |
Repurchase Agreement 7.2% | | | | | | | | |
State Street Bank and Trust Co.
0.01%, dated 12/31/12
due 1/2/13
Proceeds at Maturity $22,980,296 (Collateralized by a Federal National Mortgage Association security with a rate of 2.11% and a maturity date of 11/7/22, with a Principal Amount of $23,335,000 and a Market Value of $23,444,092) | | $ | 22,980,284 | | | $ | 22,980,284 | |
| | | | | | | | |
Total Short-Term Investment
(Cost $22,980,284) | | | | | | | 22,980,284 | |
| | | | | | | | |
Total Investments
(Cost $279,098,455) (o) | | | 98.1 | % | | | 311,203,901 | |
Other Assets, Less Liabilities | | | 1.9 | | | | 6,057,273 | |
Net Assets | | | 100.0 | % | | $ | 317,261,174 | |
| | |
| | | | | | | | |
| | | | | | | | |
| | | Contracts
Long | | | Unrealized
Appreciation
(Depreciation) (m) | |
| Futures Contracts 0.1% | | | | | | | | |
Standard & Poor’s 500 Index
Mini March 2013 (n) | | | 625 | | | $ | 252,679 | |
| | | | | | | | |
Total Futures Contracts Long
(Settlement Value $44,378,125) | | | | | | | 252,679 | |
| | | | | | | | |
| | |
| | | | | | | | |
| | | Contracts
Short | | | | |
United States Treasury Note
March 2013 (5 Year) (n) | | | (229 | ) | | | 15,529 | |
| | | | | | | | |
Total Futures Contracts Short
(Settlement Value $28,490,820) | | | | 15,529 | |
| | | | | | | | |
Total Futures Contracts
(Settlement Value $15,887,305) | | | $ | 268,208 | |
| | | | | | | | |
| ‡ | Less than one-tenth of a percent. |
| (a) | Floating rate—Rate shown is the rate in effect as of December 31, 2012. |
| | | | | | |
The notes to the financial statements are an integral part of,
and should be read in conjunction with, the financial statements. | | mainstayinvestments.com | | | M-267 | |
Portfolio of Investments December 31, 2012 (continued)
| (b) | Subprime mortgage investment and other asset-backed securities. The total market value of these securities as of December 31, 2012 is $4,860,184, which represents 1.5% of the Portfolio’s net assets. |
| (c) | May be sold to institutional investors only under Rule 144A or securities offered pursuant to Section 4(2) of the Securities Act of 1933, as amended. |
| (d) | Illiquid security. The total market value of these securities as of December 31, 2012 is $809,414, which represents 0.3% of the Portfolio’s net assets. |
| (e) | Fair valued security. The total market value of these securities as of December 31, 2012 is $62,776, which represents less than one-tenth of a percent of the Portfolio’s net assets. |
| (f) | Non-income producing security. |
| (g) | Floating Rate Loan—generally pays interest at rates which are periodically re-determined at a margin above the London InterBank Offered Rate or other short-term rates. The rate shown is the rate(s) in effect as of December 31, 2012. Floating Rate Loans are generally considered restricted in that the Portfolio is ordinarily contractually obligated to receive consent from the Agent Bank and/or borrower prior to disposition of a Floating Rate Loan. |
| (h) | Collateral strip rate—Bond whose interest is based on the weighted net interest rate of the collateral. Coupon rate adjusts periodically based on a predetermined schedule. Rate shown is the rate in effect as of December 31, 2012. |
| (i) | Yankee Bond—Dollar-denominated bond issued in the United States by a foreign bank or corporation. |
| (j) | ADR—American Depositary Receipt. |
| (k) | Restricted security. (See Note 6) |
| (m) | Represents the difference between the value of the contracts at the time they were opened and the value as of December 31, 2012. |
| (n) | At December 31, 2012, cash in the amount of $2,313,450 is on deposit with the broker for futures transactions. |
| (o) | As of December 31, 2012, cost is $278,819,599 for federal income tax purposes and net unrealized appreciation is as follows: |
| | | | |
Gross unrealized appreciation | | $ | 37,436,201 | |
Gross unrealized depreciation | | | (5,051,899 | ) |
| | | | |
Net unrealized appreciation | | $ | 32,384,302 | |
| | | | |
The following abbreviations are used in the above portfolio:
£—British Pound Sterling
€—Euro
As of December 31, 2012, the Portfolio held the following foreign currency forward contracts:
| | | | | | | | | | | | | | | | | | | | | | | | | | | | | | | | |
Foreign Currency Sale Contracts | | Expiration Date | | | Counterparty | | | Contract
Amount
Sold | | | Contract
Amount
Purchased | | | Unrealized
Appreciation
(Depreciation) | |
Euro vs. U.S. Dollar | | | 2/28/13 | | | | JPMorgan Chase Bank | | | | EUR | | | | 13,482,000 | | | | USD | | | | 17,670,723 | | | | USD | | | | (133,521 | ) |
Pound Sterling vs. U.S. Dollar | | | 2/28/13 | | | | JPMorgan Chase Bank | | | | GBP | | | | 8,204,000 | | | | | | | | 13,205,322 | | | | | | | | (119,461 | ) |
Net unrealized appreciation (depreciation) on foreign currency forward contracts | | | | | | | | | | | | | | | | USD | | | | (252,982 | ) |
| | | | |
| M-268 | | MainStay VP Income Builder Portfolio | | The notes to the financial statements are an integral part of,
and should be read in conjunction with, the financial statements. |
The following is a summary of the fair valuations according to the inputs used as of December 31, 2012, for valuing the Portfolio’s assets and liabilities.
Asset Valuation Inputs
| | | | | | | | | | | | | | | | |
Description | | Quoted Prices in
Active Markets
for Identical Assets
(Level 1) | | | Significant Other
Observable Inputs
(Level 2) | | | Significant
Unobservable
Inputs
(Level 3) | | | Total | |
| Investments in Securities (a) | | | | | | | | | | | | | | | | |
| Long-Term Bonds | | | | | | | | | | | | | | | | |
Asset-Backed Securities | | $ | — | | | $ | 6,912,232 | | | $ | — | | | $ | 6,912,232 | |
Corporate Bonds (b) | | | — | | | | 96,203,197 | | | | 62,776 | | | | 96,265,973 | |
Foreign Bonds | | | — | | | | 2,569,923 | | | | — | | | | 2,569,923 | |
Foreign Government Bonds | | | — | | | | 1,940,275 | | | | — | | | | 1,940,275 | |
Loan Assignments & Participations | | | — | | | | 3,344,720 | | | | — | | | | 3,344,720 | |
Mortgage-Backed Securities | | | — | | | | 2,852,422 | | | | — | | | | 2,852,422 | |
U.S. Government & Federal Agencies | | | — | | | | 6,676,038 | | | | — | | | | 6,676,038 | |
Yankee Bonds | | | — | | | | 18,618,208 | | | | — | | | | 18,618,208 | |
| | | | | | | | | | | | | | | | |
| Total Long-Term Bonds | | | — | | | | 139,117,015 | | | | 62,776 | | | | 139,179,791 | |
| | | | | | | | | | | | | | | | |
| Common Stocks | | | | | | | | | | | | | | | | |
Aerospace & Defense | | | 1,891,945 | | | | 1,838,834 | | | | — | | | | 3,730,779 | |
Agriculture | | | 7,859,713 | | | | 3,624,913 | | | | — | | | | 11,484,626 | |
Auto Manufacturers | | | 679,875 | | | | 2,010,927 | | | | — | | | | 2,690,802 | |
Banks | | | 1,097,100 | | | | 1,212,459 | | | | — | | | | 2,309,559 | |
Beverages | | | 3,527,397 | | | | 1,087,988 | | | | — | | | | 4,615,385 | |
Chemicals | | | 1,607,678 | | | | 3,413,363 | | | | — | | | | 5,021,041 | |
Electric | | | 11,205,279 | | | | 3,289,377 | | | | — | | | | 14,494,656 | |
Engineering & Construction | | | — | | | | 1,630,040 | | | | — | | | | 1,630,040 | |
Food | | | 772,912 | | | | 4,077,744 | | | | — | | | | 4,850,656 | |
Food Services | | | — | | | | 1,190,955 | | | | — | | | | 1,190,955 | |
Gas | | | 1,823,125 | | | | 2,434,066 | | | | — | | | | 4,257,191 | |
Household Products & Wares | | | 2,359,818 | | | | 1,202,760 | | | | — | | | | 3,562,578 | |
Insurance | | | 2,352,294 | | | | 3,992,574 | | | | — | | | | 6,344,868 | |
Media | | | 4,560,727 | | | | 2,599,085 | | | | — | | | | 7,159,812 | |
Miscellaneous—Manufacturing | | | — | | | | 1,157,822 | | | | — | | | | 1,157,822 | |
Oil & Gas | | | 6,386,304 | | | | 2,041,835 | | | | — | | | | 8,428,139 | |
Pharmaceuticals | | | 5,922,436 | | | | 6,771,754 | | | | — | | | | 12,694,190 | |
Telecommunications | | | 11,173,450 | | | | 10,356,642 | | | | — | | | | 21,530,092 | |
Transportation | | | — | | | | 2,070,298 | | | | — | | | | 2,070,298 | |
Water | | | — | | | | 2,224,826 | | | | — | | | | 2,224,826 | |
All Other Industries | | | 25,866,164 | | | | — | | | | — | | | | 25,866,164 | |
| | | | | | | | | | | | | | | | |
| Total Common Stocks | | | 89,086,217 | | | | 58,228,262 | | | | — | | | | 147,314,479 | |
| | | | | | | | | | | | | | | | |
| Convertible Preferred Stock | | | 118,121 | | | | — | | | | — | | | | 118,121 | |
| Preferred Stocks | | | | | | | | | | | — | | | | | |
Insurance | | | 896,216 | | | | — | | | | — | | | | 896,216 | |
Media | | | — | | | | 715,010 | | | | — | | | | 715,010 | |
| Warrants (c) | | | — | | | | — | | | | 0 | (c) | | | 0 | (c) |
| Short-Term Investment | | | | | | | | | | | | | | | | |
Repurchase Agreement | | | — | | | | 22,980,284 | | | | — | | | | 22,980,284 | |
| | | | | | | | | | | | | | | | |
| Total Investments in Securities | | | 90,100,554 | | | | 221,040,571 | | | | 62,776 | | | | 311,203,901 | |
| | | | | | | | | | | | | | | | |
| Other Financial Instruments | | | | | | | | | | | | | | | | |
Futures Contracts Long (d) | | | 252,679 | | | | — | | | | — | | | | 252,679 | |
| Futures Contracts Short (d) | | | 15,529 | | | | — | | | | — | | | | 15,529 | |
| | | | | | | | | | | | | | | | |
| Total Investments in Securities and Other Financial Instruments | | $ | 90,368,762 | | | $ | 221,040,571 | | | $ | 62,776 | | | $ | 311,472,109 | |
| | | | | | | | | | | | | | | | |
| | | | | | |
The notes to the financial statements are an integral part of,
and should be read in conjunction with, the financial statements. | | mainstayinvestments.com | | | M-269 | |
Portfolio of Investments December 31, 2012 (continued)
Liability Valuation Inputs
| | | | | | | | | | | | | | | | |
Description | | Quoted Prices in
Active Markets
for Identical Assets
(Level 1) | | | Significant Other
Observable Inputs
(Level 2) | | | Significant
Unobservable
Inputs
(Level 3) | | | Total | |
| Other Financial Instruments | | | | | | | | | | | | | | | | |
Foreign Currency Forward Contracts (d) | | $ | — | | | $ | (252,982 | ) | | $ | — | | | $ | (252,982 | ) |
| | | | | | | | | | | | | | | | |
| Total Other Financial Instruments | | $ | — | | | $ | (252,982 | ) | | $ | — | | | $ | (252,982 | ) |
| | | | | | | | | | | | | | | | |
| (a) | For a complete listing of investments and their industries, see the Portfolio of Investments. |
| (b) | The Level 3 securities valued at $1,120 and $61,656 are held in Commercial Services and Retail, respectively, within the Corporate Bonds section of the Portfolio of Investments. |
| (c) | The Level 3 securities valued less than one dollar are held in Media within the Warrants section of the Portfolio of Investments. |
| (d) | The value listed for these securities reflects unrealized appreciation (depreciation) as shown on the Portfolio of Investments. |
The Portfolio recognizes transfers between the levels as of the beginning of the period.
During the period ended December 31, 2012, certain foreign equity securities with a market value of $46,741,732 held by the Portfolio transferred from Level 1 to Level 2 due to these securities being fair valued at year end by applying factors provided by a third party vendor in accordance with the Portfolio’s policies and procedures. (See Note 2)
During the year ended December 31, 2012, securities with a total value of $397,463 transferred from Level 3 to Level 2. The transfer occurred as a result of the value of these securities being obtained from an independent pricing source using observable inputs as of December 31, 2012. As of December 31, 2011, the valuation of these securities was obtained using fair valued prices due to market quotations not being readily available.
The following is a reconciliation of investments in which significant unobservable inputs (Level 3) were used in determining value:
| | | | | | | | | | | | | | | | | | | | | | | | | | | | | | | | | | | | | | | | |
Investments in Securities | | Balance
as of
December 31,
2011 | | | Accrued
Discounts
(Premiums) | | | Realized
Gain
(Loss) | | | Change in
Unrealized
Appreciation
(Depreciation) | | | Purchases | | | Sales | | | Transfers
into
Level 3 | | | Transfers
out of
Level 3 | | | Balance
as of
December 31,
2012 | | | Change in
Unrealized
Appreciation
(Depreciation)
from
Investments
Still Held at
December 31,
2012 (a) | |
| Long-Term Bonds | | | | | | | | | | | | | | | | | | | | | | | | | | | | | | | | | | | | | | | | |
Corporate Bonds | | | | | | | | | | | | | | | | | | | | | | | | | | | | | | | | | | | | | | | | |
Commercial Services | | $ | 1,120 | | | $ | — | | | $ | — | | | $ | — | | | $ | — | | | $ | — | | | $ | — | | | $ | — | | | $ | 1,120 | | | $ | — | |
Retail | | | 59,940 | | | | (61 | ) | | | (62 | ) | | | 4,667 | | | | — | | | | (2,828 | ) | | | — | | | | — | | | | 61,656 | | | | 4,847 | |
Loan Assignments & Participations | | | | | | | | | | | | | | | | | | | | | | | | | | | | | | | | | | | | | | | | |
Machinery | | | 208 | | | | (333 | ) | | | (50,069 | ) | | | 50,194 | | | | — | | | | — | | | | — | | | | — | | | | — | | | | — | |
Mortgage-Backed Securities | | | | | | | | | | | | | | | | | | | | | | | | | | | | | | | | | | | | | | | | |
Commercial Mortgage Loans (Collateralized Mortgage Obligations) | | | 397,473 | | | | — | | | | — | | | | — | | | | — | | | | — | | | | — | | | | (397,473 | ) | | | — | | | | — | |
| Warrants | | | | | | | | | | | | | | | | | | | | | | | | | | | | | | | | | | | | | | | | |
Media | | | 0 | (b) | | | — | | | | — | | | | — | | | | — | | | | — | | | | — | | | | — | | | | 0 | (b) | | | — | |
| | | | | | | | | | | | | | | | | | | | | | | | | | | | | | | | | | | | | | | | |
| Total | | $ | 458,741 | | | $ | (394 | ) | | $ | (50,131 | ) | | $ | 54,861 | | | $ | — | | | $ | (2,828 | ) | | $ | — | | | $ | (397,473 | ) | | $ | 62,776 | | | $ | 4,847 | |
| | | | | | | | | | | | | | | | | | | | | | | | | | | | | | | | | | | | | | | | |
| (a) | Included in “Net change in unrealized appreciation (depreciation) on investments” in the Statement of Operations. |
| | | | |
| M-270 | | MainStay VP Income Builder Portfolio | | The notes to the financial statements are an integral part of,
and should be read in conjunction with, the financial statements. |
Statement of Assets and Liabilities as of December 31, 2012
| | | | |
| Assets | |
Investment in securities, at value
(identified cost $279,098,455) | | $ | 311,203,901 | |
Cash collateral on deposit at broker | | | 2,313,450 | |
Cash denominated in foreign currencies
(identified cost $378,263) | | | 381,449 | |
Receivables: | | | | |
Dividends and interest | | | 2,433,341 | |
Investment securities sold | | | 1,373,898 | |
Variation margin on futures contracts | | | 1,124,547 | |
Fund shares sold | | | 844,574 | |
Other assets | | | 7,256 | |
| | | | |
Total assets | | | 319,682,416 | |
| | | | |
|
| Liabilities | |
Payables: | | | | |
Investment securities purchased | | | 1,818,635 | |
Manager (See Note 3) | | | 152,014 | |
Fund shares redeemed | | | 92,453 | |
Professional fees | | | 51,425 | |
Shareholder communication | | | 24,938 | |
NYLIFE Distributors (See Note 3) | | | 21,216 | |
Custodian | | | 7,129 | |
Trustees | | | 450 | |
Unrealized depreciation on foreign currency forward contracts | | | 252,982 | |
| | | | |
Total liabilities | | | 2,421,242 | |
| | | | |
Net assets | | $ | 317,261,174 | |
| | | | |
|
| Net Assets Consist of | |
Shares of beneficial interest outstanding (par value of $.001 per share) unlimited number of shares authorized | | $ | 20,335 | |
Additional paid-in capital | | | 284,666,690 | |
| | | | |
| | | 284,687,025 | |
Undistributed net investment income | | | 11,610,140 | |
Accumulated net realized gain (loss) on investments, futures transactions and foreign currency transactions | | | (11,163,859 | ) |
Net unrealized appreciation (depreciation) on investments and futures contracts | | | 32,373,654 | |
Net unrealized appreciation (depreciation) on translation of other assets and liabilities in foreign currencies and foreign currency forward contracts | | | (245,786 | ) |
| | | | |
Net assets | | $ | 317,261,174 | |
| | | | |
| | | | |
Initial Class | | | | |
Net assets applicable to outstanding shares | | $ | 214,268,034 | |
| | | | |
Shares of beneficial interest outstanding | | | 13,709,151 | |
| | | | |
Net asset value per share outstanding | | $ | 15.63 | |
| | | | |
Service Class | | | | |
Net assets applicable to outstanding shares | | $ | 102,993,140 | |
| | | | |
Shares of beneficial interest outstanding | | | 6,625,769 | |
| | | | |
Net asset value per share outstanding | | $ | 15.54 | |
| | | | |
| | | | | | |
The notes to the financial statements are an integral part of,
and should be read in conjunction with, the financial statements. | | mainstayinvestments.com | | | M-271 | |
Statement of Operations for the year ended December 31, 2012
| | | | |
| Investment Income (Loss) | |
Income | | | | |
Interest | | $ | 8,423,900 | |
Dividends (a) | | | 6,514,880 | |
| | | | |
Total income | | | 14,938,780 | |
| | | | |
Expenses | | | | |
Manager (See Note 3) | | | 1,676,007 | |
Distribution and service — Service Class (See Note 3) | | | 201,341 | |
Professional fees | | | 85,973 | |
Shareholder communication | | | 48,793 | |
Custodian | | | 45,262 | |
Trustees | | | 7,838 | |
Miscellaneous | | | 27,659 | |
| | | | |
Total expenses | | | 2,092,873 | |
| | | | |
Net investment income (loss) | | | 12,845,907 | |
| | | | |
|
| Realized and Unrealized Gain (Loss) on Investments, Futures Contracts and Foreign Currency Transactions | |
Net realized gain (loss) on: | | | | |
Security transactions | | | 3,620,218 | |
Futures transactions | | | 5,731,708 | |
Foreign currency transactions | | | (364,829 | ) |
| | | | |
Net realized gain (loss) on investments, futures transactions and foreign currency transactions | | | 8,987,097 | |
| | | | |
Net change in unrealized appreciation (depreciation) on: | | | | |
Investments | | | 18,559,628 | |
Futures contracts | | | 401,395 | |
Translation of other assets and liabilities in foreign currencies and foreign currency forward contracts | | | (383,718 | ) |
| | | | |
Net change in unrealized appreciation (depreciation) on investments, futures contracts and foreign currency transactions | | | 18,577,305 | |
| | | | |
Net realized and unrealized gain (loss) on investments, futures transactions and foreign currency transactions | | | 27,564,402 | |
| | | | |
Net increase (decrease) in net assets resulting from operations | | $ | 40,410,309 | |
| | | | |
| (a) | Dividends recorded net of foreign withholding taxes in the amount of $304,127. |
| | | | |
| M-272 | | MainStay VP Income Builder Portfolio | | The notes to the financial statements are an integral part of,
and should be read in conjunction with, the financial statements. |
Statements of Changes in Net Assets
for the years ended December 31, 2012 and December 31, 2011
| | | | | | | | |
| | | 2012 | | | 2011 | |
| Increase (Decrease) in Net Assets | |
Operations: | | | | | | | | |
Net investment income (loss) | | $ | 12,845,907 | | | $ | 12,349,722 | |
Net realized gain (loss) on investments, futures transactions and foreign currency transactions | | | 8,987,097 | | | | 12,859,445 | |
Net change in unrealized appreciation (depreciation) on investments, futures contracts and foreign currency transactions | | | 18,577,305 | | | | (14,220,394 | ) |
| | | | |
Net increase (decrease) in net assets resulting from operations | | | 40,410,309 | | | | 10,988,773 | |
| | | | |
Dividends to shareholders: | | | | | | | | |
From net investment income: | | | | | | | | |
Initial Class | | | (9,029,798 | ) | | | (8,429,136 | ) |
Service Class | | | (3,624,215 | ) | | | (2,466,832 | ) |
| | | | |
Total dividends to shareholders | | | (12,654,013 | ) | | | (10,895,968 | ) |
| | | | |
Capital share transactions: | | | | | | | | |
Net proceeds from sale of shares | | | 42,070,690 | | | | 28,259,133 | |
Net asset value of shares issued to shareholders in reinvestment of dividends | | | 12,654,013 | | | | 10,895,968 | |
Cost of shares redeemed | | | (41,205,984 | ) | | | (44,258,614 | ) |
| | | | |
Increase (decrease) in net assets derived from capital share transactions | | | 13,518,719 | | | | (5,103,513 | ) |
| | | | |
Net increase (decrease) in net assets | | | 41,275,015 | | | | (5,010,708 | ) |
| | |
| Net Assets | | | | | | | | |
Beginning of year | | | 275,986,159 | | | | 280,996,867 | |
| | | | |
End of year | | $ | 317,261,174 | | | $ | 275,986,159 | |
| | | | |
Undistributed net investment income at end of year | | $ | 11,610,140 | | | $ | 12,486,087 | |
| | | | |
| | | | | | |
The notes to the financial statements are an integral part of,
and should be read in conjunction with, the financial statements. | | mainstayinvestments.com | | | M-273 | |
Financial Highlights selected per share data and ratios
| | | | | | | | | | | | | | | | | | | | |
| | | Initial Class | |
| | | Year ended December 31, | |
| | | 2012 | | | 2011 | | | 2010 | | | 2009 | | | 2008 | |
Net asset value at beginning of year | | $ | 14.18 | | | $ | 14.22 | | | $ | 12.78 | | | $ | 10.71 | | | $ | 18.40 | |
| | | | | | | | | | | | | | | | | | | | |
Net investment income (loss) | | | 0.68 | (a) | | | 0.64 | (a) | | | 0.64 | (a) | | | 0.37 | (a) | | | 0.47 | |
Net realized and unrealized gain (loss) on investments | | | 1.48 | | | | (0.13 | ) | | | 1.31 | | | | 2.12 | | | | (5.40 | ) |
Net realized and unrealized gain (loss) on foreign currency transactions | | | (0.04 | ) | | | 0.03 | | | | (0.08 | ) | | | 0.01 | | | | — | |
| | | | | | | | | | | | | | | | | | | | |
Total from investment operations | | | 2.12 | | | | 0.54 | | | | 1.87 | | | | 2.50 | | | | (4.93 | ) |
| | | | | | | | | | | | | | | | | | | | |
Less dividends and distributions: | | | | | | | | | | | | | | | | | | | | |
From net investment income | | | (0.67 | ) | | | (0.58 | ) | | | (0.43 | ) | | | (0.43 | ) | | | (0.56 | ) |
From net realized gain on investments | | | — | | | | — | | | | — | | | | — | | | | (2.20 | ) |
| | | | | | | | | | | | | | | | | | | | |
Total dividends and distributions | | | (0.67 | ) | | | (0.58 | ) | | | (0.43 | ) | | | (0.43 | ) | | | (2.76 | ) |
| | | | | | | | | | | | | | | | | | | | |
Net asset value at end of year | | $ | 15.63 | | | $ | 14.18 | | | $ | 14.22 | | | $ | 12.78 | | | $ | 10.71 | |
| | | | | | | | | | | | | | | | | | | | |
Total investment return | | | 15.00 | % | | | 4.12 | % | | | 14.79 | % | | | 23.51 | % | | | (26.92 | %) |
Ratios (to average net assets)/Supplemental Data: | | | | | | | | | | | | | | | | | | | | |
Net investment income (loss) | | | 4.44 | % | | | 4.40 | % | | | 4.85 | % | | | 3.26 | % | | | 2.55 | % |
Net expenses | | | 0.64 | % | | | 0.65 | % | | | 0.65 | % | | | 0.71 | % | | | 0.65 | % |
Portfolio turnover rate | | | 34 | % | | | 31 | % | | | 61 | %(b) | | | 161 | %(b) | | | 94 | % (b) |
Net assets at end of year (in 000’s) | | $ | 214,268 | | | $ | 209,222 | | | $ | 222,426 | | | $ | 224,119 | | | $ | 217,037 | |
| (a) | Per share data based on average shares outstanding during the year. |
| (b) | The portfolio turnover rates not including mortgage dollar rolls were 60%, 141%, and 78% for the years ended December 31, 2010, 2009, and 2008, respectively. The Portfolio did not engage in mortgage dollar rolls for the years ended December 31, 2012 and 2011, respectively. |
| | | | | | | | | | | | | | | | | | | | |
| | | Service Class | |
| | | Year ended December 31, | |
| | | 2012 | | | 2011 | | | 2010 | | | 2009 | | | 2008 | |
Net asset value at beginning of year | | $ | 14.12 | | | $ | 14.17 | | | $ | 12.74 | | | $ | 10.67 | | | $ | 18.33 | |
| | | | | | | | | | | | | | | | | | | | |
Net investment income (loss) | | | 0.63 | (a) | | | 0.60 | (a) | | | 0.61 | (a) | | | 0.35 | (a) | | | 0.40 | |
Net realized and unrealized gain (loss) on investments | | | 1.47 | | | | (0.13 | ) | | | 1.30 | | | | 2.10 | | | | (5.35 | ) |
Net realized and unrealized gain (loss) on foreign currency transactions | | | (0.04 | ) | | | 0.03 | | | | (0.08 | ) | | | 0.01 | | | | — | |
| | | | | | | | | | | | | | | | | | | | |
Total from investment operations | | | 2.06 | | | | 0.50 | | | | 1.83 | | | | 2.46 | | | | (4.95 | ) |
| | | | | | | | | | | | | | | | | | | | |
Less dividends and distributions: | | | | | | | | | | | | | | | | | | | | |
From net investment income | | | (0.64 | ) | | | (0.55 | ) | | | (0.40 | ) | | | (0.39 | ) | | | (0.51 | ) |
From net realized gain on investments | | | — | | | | — | | | | — | | | | — | | | | (2.20 | ) |
| | | | | | | | | | | | | | | | | | | | |
Total dividends and distributions | | | (0.64 | ) | | | (0.55 | ) | | | (0.40 | ) | | | (0.39 | ) | | | (2.71 | ) |
| | | | | | | | | | | | | | | | | | | | |
Net asset value at end of year | | $ | 15.54 | | | $ | 14.12 | | | $ | 14.17 | | | $ | 12.74 | | | $ | 10.67 | |
| | | | | | | | | | | | | | | | | | | | |
Total investment return | | | 14.71 | % | | | 3.86 | % | | | 14.51 | % | | | 23.21 | % | | | (27.10 | %) |
Ratios (to average net assets)/Supplemental Data: | | | | | | | | | | | | | | | | | | | | |
Net investment income (loss) | | | 4.17 | % | | | 4.15 | % | | | 4.59 | % | | | 3.03 | % | | | 2.30 | % |
Net expenses | | | 0.89 | % | | | 0.90 | % | | | 0.90 | % | | | 0.96 | % | | | 0.90 | % |
Portfolio turnover rate | | | 34 | % | | | 31 | % | | | 61 | %(b) | | | 161 | %(b) | | | 94 | % (b) |
Net assets at end of year (in 000’s) | | $ | 102,993 | | | $ | 66,764 | | | $ | 58,571 | | | $ | 46,691 | | | $ | 38,955 | |
| (a) | Per share data based on average shares outstanding during the year. |
| (b) | The portfolio turnover rates not including mortgage dollar rolls were 60%, 141%, and 78% for the years ended December 31, 2010, 2009, and 2008, respectively. The Portfolio did not engage in mortgage dollar rolls for the years ended December 31, 2012 and 2011, respectively. |
| | | | |
| M-274 | | MainStay VP Income Builder Portfolio | | The notes to the financial statements are an integral part of,
and should be read in conjunction with, the financial statements. |
MainStay VP International Equity Portfolio
Investment and Performance Comparison (Unaudited)
Performance data quoted represents past performance. Past performance is no guarantee of future results. Because of market volatility, current performance may be lower or higher than the figures shown. Investment return and principal value will fluctuate, and as a result, when shares are redeemed, they may be worth more or less than their original cost. The performance table and graph do not reflect any deduction of sales charges, mortality and expense charges, contract charges or administrative charges. Please refer to the Performance Summary appropriate for your policy. For performance information current to the most recent month-end, please call 800-598-2019 or visit www.newyorklife.com.
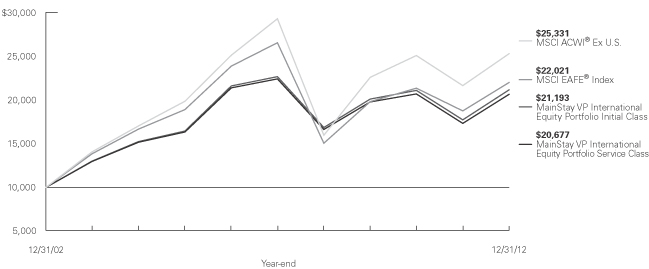
Average Annual Total Returns for the Year Ended December 31, 2012
| | | | | | | | | | | | | | | | |
| Class | | One Year | | | Five Years | | | Ten Years1 | | | Gross Expense Ratio2 | |
| Initial Class Shares | | | 19.48 | % | | | –1.37 | % | | | 7.80 | % | | | 0.95 | % |
| Service Class Shares3 | | | 19.18 | | | | –1.61 | | | | 7.53 | | | | 1.20 | |
| | | | | | | | | | | | |
| Benchmark Performance | | One
Year | | | Five
Years | | | Ten
Years | |
MSCI EAFE® Index4 | | | 17.32 | % | | | –3.69 | % | | | 8.21 | % |
MSCI ACWI® Ex U.S. | | | 16.83 | | | | –2.89 | | | | 9.74 | |
Average Lipper Variable Products International Growth Portfolio5 | | | 19.45 | | | | –2.49 | | | | 8.96 | |
| 1. | Performance figures shown for the ten-year period ended December 31, 2012 reflect nonrecurring reimbursements from affiliates for printing and mailing costs. If these nonrecurring reimbursements had not been made, the total returns would have been 7.80% for Initial Class shares and 7.53% for Service Class shares for the ten-year period. |
| 2. | The gross expense ratios presented reflect the Portfolio’s “Total Annual Portfolio Operating Expenses” from the most recent Prospectus and may differ from other expense ratios disclosed in this report. |
| 3. | Performance for Service Class shares, first offered June 5, 2003, includes the historical performance of Initial Class shares through June 4, 2003 adjusted to reflect the fees and expenses of Service Class shares. |
| 4. | Please refer to pages M-2 and M-3 for additional explanations and disclosure regarding the Portfolios, their benchmark indices and other indices mentioned in the reports. |
| 5. | The Average Lipper Variable Products International Growth Portfolio is representative of portfolios that, by portfolio practice, invest at least 75% of their equity assets in companies strictly outside of the U.S. Growth portfolios typically have an above-average price-to-cash flow ratio, price-to-book ratio, and three-year sales-per-share growth value compared to the S&P/Citigroup World ex-U.S. BMI. |
| | | | |
| mainstayinvestments.com | | | M-275 | |
Cost in Dollars of a $1,000 Investment in MainStay VP International Equity Portfolio (Unaudited)
The example below is intended to describe the fees and expenses borne by shareholders during the six-month period from July 1, 2012 to December 31, 2012, and the impact of those costs on your investment.
Example
As a shareholder of the Portfolio, you incur two types of costs: (1) transaction costs, including exchange fees and sales charges (loads) on purchases (as applicable), and (2) ongoing costs, including management fees, distribution and/or service (12b-1) fees, and other Portfolio expenses (as applicable). This example is intended to help you understand your ongoing costs (in dollars) of investing in the Portfolio and to compare these costs with the ongoing costs of investing in other Portfolios. The example is based on an investment of $1,000 made at the beginning of the six-month period and held for the entire period from July 1, 2012, to December 31, 2012. Shares are only sold in connection with variable life and annuity contracts and the example does not reflect any contract level or transactional fees or expenses. If these costs had been included, your costs would have been higher.
This example illustrates your Portfolio’s ongoing costs in two ways:
Actual Expenses
The second and third data columns in the table below provide information about actual account values and actual expenses. You may use the information in these columns, together with the amount you invested, to estimate the
expenses that you paid during the six months ended December 31, 2012. Simply divide your account value by $1,000 (for example, an $8,600 account value divided by $1,000 = 8.6), then multiply the result by the number under the heading entitled ‘‘Expenses Paid During Period’’ to estimate the expenses you paid on your account during this period.
Hypothetical Example for Comparison Purposes
The fourth and fifth data columns in the table below provide information about hypothetical account values and hypothetical expenses based on the Portfolio’s actual expense ratio and an assumed rate of return of 5% per year before expenses, which is not the Portfolio’s actual return. The hypothetical account values and expenses may not be used to estimate the actual ending account balances or expenses you paid for the six-month period shown. You may use this information to compare the ongoing costs of investing in the Portfolio with the ongoing costs of investing in other Portfolios. To do so, compare this 5% hypothetical example with the 5% hypothetical examples that appear in the shareholder reports of the other Portfolios.
Please note that the expenses shown in the table are meant to highlight your ongoing costs only and do not reflect any transactional costs, such as exchange fees or sales charges (loads). Therefore, the fourth and fifth data columns of the table are useful in comparing ongoing costs only and will not help you determine the relative total costs of owning different funds. In addition, if these transactional costs were included, your costs would have been higher.
| | | | | | | | | | | | | | | | | | | | |
| | | | | | | | | | | | | | | | |
| Share Class | | Beginning
Account
Value
7/1/12 | | | Ending Account
Value (Based
on Actual
Returns and
Expenses)
12/31/12 | | | Expenses
Paid
During
Period1 | | | Ending Account
Value (Based
on Hypothetical
5% Annualized
Return and
Actual Expenses)
12/31/12 | | | Expenses
Paid
During
Period1 | |
| | | | | |
| Initial Class Shares | | $ | 1,000.00 | | | $ | 1,112.80 | | | $ | 5.05 | | | $ | 1,020.40 | | | $ | 4.82 | |
| | | | | |
| Service Class Shares | | $ | 1,000.00 | | | $ | 1,111.40 | | | $ | 6.37 | | | $ | 1,019.10 | | | $ | 6.09 | |
| 1. | Expenses are equal to the Portfolio’s annualized expense ratio of each class (0.95% for Initial Class and 1.20% for Service Class) multiplied by the average account value over the period, divided by 366 and multiplied by 184 (to reflect the six-month period). The table above represents the actual expenses incurred during the six-month period. |
| | |
| M-276 | | MainStay VP International Equity Portfolio |
Portfolio Composition as of December 31, 2012 (Unaudited)
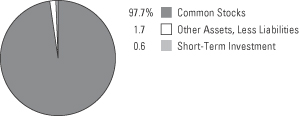
See Portfolio of Investments beginning on page M-280 for specific holdings within these categories.
Top Ten Holdings as of December 31, 2012 (excluding short-term investment) (Unaudited)
| 2. | Svenska Handelsbanken AB Class A |
| 6. | Teva Pharmaceutical Industries, Ltd., Sponsored ADR |
| 9. | Essilor International S.A. |
| | | | |
| mainstayinvestments.com | | | M-277 | |
Portfolio Management Discussion and Analysis
Answers to questions reflect the views of Edward Ramos, CFA, of Madison Square Investors LLC,1 the Portfolio’s Subadvisor.
How did MainStay VP International Equity Portfolio perform relative to its peers and its benchmarks during the reporting period?
For the 12 months ended December 31, 2012, MainStay VP International Equity Portfolio returned 19.48% for Initial Class shares and 19.18% for Service Class shares. Over the same period, Initial Class shares outperformed—and Service Class shares underperformed—the 19.45% return of the average Lipper2 Variable Products International Growth Portfolio. Both share classes outperformed the 17.32% return of the MSCI EAFE® Index2 and the 16.83% return of the MSCI ACWI® (All Country World Index) Ex U.S.2 for the 12 months ended December 31, 2012. The MSCI EAFE® Index is the Portfolio’s broad-based securities-market index. The MSCI ACWI® Ex U.S. is the Portfolio’s secondary benchmark.
Were there any changes to the Portfolio during 2012?
Effective August 1, 2012, the Portfolio adjusted its principal investment strategies to limit its investments in securities from countries located in emerging markets. The Portfolio also selected the MSCI ACWI® (All Country World Index) Ex U.S. as its secondary benchmark. For more information on these changes, please refer to the Prospectus Supplement dated July 2, 2012, and the Prospectus dated May 1, 2012, as supplemented.
What factors affected the Portfolio’s relative performance during the reporting period?
The Portfolio outperformed the MSCI EAFE® Index primarily because of positive stock selection. This was driven by the Portfolio’s focus on companies providing growth supported by visible and sustainable forces that generate attractive alpha.3 Positive sector and country allocation also contributed to the Portfolio’s relative outperformance, albeit to a lesser degree than stock selection.
Which sectors were the strongest positive contributors to the Portfolio’s relative performance, and which sectors were particularly weak?
During 2012, the Portfolio’s strongest positive sector contributions came from health care, energy and telecommunication services. (Contributions take weightings and total returns into account.) Stock
selection was the key driver in health care, though an overweight position also helped. Favorable stock selection and an underweight sector allocation each helped relative performance in the energy sector. In telecommunication services, an underweight sector allocation was the primary driver, although favorable stock selection also helped.
Consumer discretionary, financials and consumer staples were the weakest sector contributors to the Portfolio’s relative performance. Unfavorable stock selection was the key driver in the consumer discretionary sector, slightly offset by an overweight position that helped relative results. In financials, unfavorable stock selection and an underweight sector allocation hurt relative performance. Unfavorable stock selection in consumer staples was partially offset by a positive contribution from the Portfolio’s underweight position in that sector.
During the reporting period, which individual stocks made the strongest positive contributions to the Portfolio’s absolute performance and which stocks detracted the most?
The strongest positive contributors to the Portfolio’s absolute performance included Spanish plasma therapeutics company Grifols, U.K. testing and inspect- ion company Intertek and Swedish bank Svenska Handelsbanken. Grifols advanced because of rising consensus earnings estimates and a rising stock price-to-earnings rating throughout the year. The company benefited from stronger fundamentals and improved market sentiment. Intertek benefited from a powerful market re-rating as the company’s stable growth profile came into greater focus. Stronger investor appreciation for Svenska Handelsbanken’s uniquely defensible operating model and balance sheet helped the company’s stock price.
Detractors from the Portfolio’s absolute performance included Chinese pork supplier China Yurun, Swedish media company Modern Times Group and U.K.-listed emerging power solutions supplier Aggreko. All three stocks had negative total returns. China Yurun suffered when speculation over quality-control lapses lead to corporate-governance concerns. The Portfolio sold its entire position in the company. Modern Times
Group saw its stock price fall after management
| 1. | Effective on or about January 25, 2013, Madison Square Investors LLC changed its name to Cornerstone Capital Management Holdings LLC. |
| 2. | Please refer to pages M-2 and M-3 for additional explanations and disclosure regarding the Portfolios, their benchmark indices and service providers mentioned in the reports. |
| 3. | Alpha measures the risk-adjusted performance of a mutual fund and compares it to a benchmark index. The excess return of the mutual fund is its alpha. |
| | |
| M-278 | | MainStay VP International Equity Portfolio |
reduced future earnings guidance. The Portfolio has exited its position in the stock. Aggreko’s stock price fell after the company tempered its future growth expectations.
Did the Portfolio make any significant purchases or sales during the reporting period?
The Portfolio’s largest purchase during 2012 was a position in German industrial gas company Linde AG. We found the stock appealing because of the group’s strong franchise position, growing presence in emerging markets, defensive operating model and a valuation that we viewed as attractive. The Portfolio also purchased shares of Japanese diagnostic tester and instrument supplier Sysmex. The company enjoyed strong underlying growth supported by favorable demographics, a diversified global footprint, a recurring revenue base and a valuation that we found attractive.
During the reporting period, the Portfolio sold a sizeable position in French pharmaceutical company Ipsen after the company’s management lowered guidance. The announcement called into question the sustainability of the franchise and its growth prospects. Another large sale was U.K. alternative investment manager Man Group. The company continues to struggle with fund performance and flows, which could have significant negative ramifications on operating leverage.
How did the Portfolio’s sector weightings change during the reporting period?
The most significant sector-weighting increase was in industrials, where the Portfolio went from an underweight to an overweight position during the reporting period. The Portfolio also increased its sector weighting in materials. Although the Portfolio remains underweight in that sector, the addition of another security moved the weighting meaningfully.
The most significant sector-weighting decrease was in financials, where the Portfolio moved from an underweight to a more substantially underweight position. The Portfolio also decreased its weighting in consumer staples, where exiting select legacy positions more than offset the impact of additions.
How was the Portfolio positioned at the end of the reporting period?
As of December 31, 2012, the Portfolio’s most substantially overweight sector allocation was in health care. As of the same date, the Portfolio was also overweight in information technology.
As of December 31, 2012, the Portfolio’s most significantly underweight sector allocation was in financials. As of the same date, the Portfolio was also underweight in consumer staples.
The opinions expressed are those of the portfolio manager as of the date of this report and are subject to change. There is no guarantee that any forecasts made will come to pass. This material does not constitute investment advice and is not intended as an endorsement of any specific investment.
Not all MainStay VP Portfolios and/or share classes are available under all policies.
| | | | |
| mainstayinvestments.com | | | M-279 | |
Portfolio of Investments December 31, 2012
| | | | | | | | |
| | |
Shares | | | Value | |
| Common Stocks 97.7%† | |
Australia 1.2% | |
Computershare, Ltd. (IT Services) | | | 606,708 | | | $ | 5,713,043 | |
| | | | | | | | |
|
Bermuda 0.9% | |
Genpact, Ltd. (IT Services) | | | 274,167 | | | | 4,249,589 | |
| | | | | | | | |
|
Brazil 1.7% | |
Cia. Hering (Specialty Retail) | | | 374,500 | | | | 7,742,056 | |
| | | | | | | | |
|
Canada 3.7% | |
IGM Financial, Inc. (Capital Markets) | | | 108,900 | | | | 4,554,378 | |
Open Text Corp. (Internet Software & Services) (a) | | | 141,697 | | | | 7,916,611 | |
Tim Hortons, Inc. (Hotels,
Restaurants & Leisure) | | | 87,500 | | | | 4,295,391 | |
| | | | | | | | |
| | | | | | | 16,766,380 | |
| | | | | | | | |
China 3.3% | |
Baidu, Inc., Sponsored ADR (Internet Software & Services) (a)(b) | | | 80,194 | | | | 8,042,656 | |
China Shenhua Energy Co., Ltd.
(Oil, Gas & Consumable Fuels) | | | 1,519,800 | | | | 6,790,301 | |
| | | | | | | | |
| | | | | | | 14,832,957 | |
| | | | | | | | |
Czech Republic 2.4% | |
Komercni Banka A.S. (Commercial Banks) | | | 52,340 | | | | 11,074,509 | |
| | | | | | | | |
|
Denmark 5.2% | |
Coloplast A/S Class B (Health Care Equipment & Supplies) | | | 241,170 | | | | 11,819,838 | |
FLSmidth & Co. A/S
(Construction & Engineering) | | | 206,458 | | | | 12,060,915 | |
| | | | | | | | |
| | | | | | | 23,880,753 | |
| | | | | | | | |
France 7.6% | |
Bureau Veritas S.A. (Professional Services) | | | 88,814 | | | | 9,874,586 | |
Dassault Systemes S.A. (Software) | | | 88,854 | | | | 9,946,784 | |
¨Essilor International S.A. (Health Care Equipment & Supplies) | | | 145,461 | | | | 14,748,354 | |
| | | | | | | | |
| | | | | | | 34,569,724 | |
| | | | | | | | |
Germany 13.9% | |
¨Adidas A.G. (Textiles, Apparel &
Luxury Goods) | | | 202,046 | | | | 18,005,975 | |
Brenntag A.G. (Trading
Companies & Distributors) | | | 63,279 | | | | 8,313,453 | |
Fresenius Medical Care A.G. & Co. KGaA (Health Care Providers & Services) | | | 192,635 | | | | 13,309,575 | |
| | | | | | | | |
| | |
Shares | | | Value | |
Germany (continued) | |
¨Linde A.G. (Chemicals) | | | 83,085 | | | $ | 14,489,147 | |
United Internet A.G.
(Internet Software & Services) | | | 221,897 | | | | 4,789,646 | |
Wirecard A.G. (IT Services) | | | 188,809 | | | | 4,630,320 | |
| | | | | | | | |
| | | | | | | 63,538,116 | |
| | | | | | | | |
Hong Kong 2.8% | |
Li & Fung, Ltd. (Distributors) | | | 7,038,100 | | | | 12,680,934 | |
| | | | | | | | |
|
India 1.0% | |
Infosys, Ltd., Sponsored ADR
(IT Services) (b) | | | 109,119 | | | | 4,615,734 | |
| | | | | | | | |
|
Indonesia 1.1% | |
Media Nusantara Citra Tbk PT (Media) | | | 18,455,000 | | | | 4,803,863 | |
| | | | | | | | |
|
Israel 5.5% | |
Check Point Software Technologies, Ltd. (Software) (a) | | | 205,952 | | | | 9,811,553 | |
¨Teva Pharmaceutical Industries, Ltd., Sponsored ADR (Pharmaceuticals) (b) | | | 411,417 | | | | 15,362,311 | |
| | | | | | | | |
| | | | | | | 25,173,864 | |
| | | | | | | | |
Italy 1.0% | |
DiaSorin S.p.A.
(Health Care Equipment & Supplies) | | | 112,389 | | | | 4,508,124 | |
| | | | | | | | |
|
Japan 7.1% | |
Daito Trust Construction Co., Ltd. (Real Estate Management & Development) | | | 140,600 | | | | 13,230,767 | |
FamilyMart Co., Ltd.
(Food & Staples Retailing) | | | 142,000 | | | | 5,845,314 | |
Sysmex Corp. (Health Care
Equipment & Supplies) | | | 290,000 | | | | 13,286,697 | |
| | | | | | | | |
| | | | | | | 32,362,778 | |
| | | | | | | | |
South Africa 0.8% | |
Clicks Group, Ltd. (Food &
Staples Retailing) | | | 447,069 | | | | 3,501,438 | |
| | | | | | | | |
|
Spain 4.4% | |
¨Grifols S.A. (Biotechnology) (a) | | | 566,104 | | | | 19,917,435 | |
| | | | | | | | |
|
Sweden 4.7% | |
Modern Times Group AB Class B (Media) | | | 68,213 | | | | 2,389,857 | |
¨Svenska Handelsbanken AB Class A (Commercial Banks) | | | 528,816 | | | | 18,947,466 | |
| | | | | | | | |
| | | | | | | 21,337,323 | |
| | | | | | | | |
| † | Percentages indicated are based on Portfolio net assets. |
| ¨ | | Among the Portfolio’s 10 largest holdings, as of December 31, 2012, excluding short-term investment. May be subject to change daily. |
| | | | |
| M-280 | | MainStay VP International Equity Portfolio | | The notes to the financial statements are an integral part of,
and should be read in conjunction with, the financial statements. |
| | | | | | | | |
| | |
Shares | | | Value | |
| Common Stocks (continued) | |
Thailand 2.6% | |
Kasikornbank PCL (Commercial Banks) | | | 1,866,500 | | | $ | 11,850,706 | |
| | | | | | | | |
|
United Kingdom 23.9% | |
¨Aggreko PLC (Commercial
Services & Supplies) | | | 517,755 | | | | 14,848,392 | |
Experian PLC (Professional Services) | | | 665,005 | | | | 10,744,656 | |
¨Intertek Group PLC (Professional Services) | | | 320,298 | | | | 16,164,142 | |
Johnson Matthey PLC (Chemicals) | | | 302,691 | | | | 11,624,949 | |
¨Petrofac, Ltd. (Energy
Equipment & Services) | | | 557,230 | | | | 15,096,939 | |
¨SABMiller PLC (Beverages) | | | 357,137 | | | | 16,809,754 | |
Shire PLC (Pharmaceuticals) | | | 253,113 | | | | 7,773,857 | |
Standard Chartered PLC
(Commercial Banks) | | | 464,841 | | | | 11,783,100 | |
Telecity Group PLC
(Internet Software & Services) | | | 326,630 | | | | 4,281,915 | |
| | | | | | | | |
| | | | | | | 109,127,704 | |
| | | | | | | | |
United States 2.9% | |
ResMed, Inc.
(Health Care Equipment & Supplies) | | | 314,622 | | | | 13,078,837 | |
| | | | | | | | |
Total Common Stocks
(Cost $385,009,024) | | | | | | | 445,325,867 | |
| | | | | | | �� | |
| | | | | | | | |
| | | Principal
Amount | | | Value | |
| Short-Term Investment 0.6% | |
Repurchase Agreement 0.6% | |
United States 0.6% | | | | | | | | |
State Street Bank and Trust Co.
0.01%, dated 12/31/12
due 1/2/13
Proceeds at Maturity $2,954,119 (Collateralized by a Federal National Mortgage Association security with a rate of 2.11% and a maturity date of 11/7/22, with a Principal Amount of $3,000,000 and a Market Value of $3,014,025) (Capital Markets) | | $ | 2,954,117 | | | $ | 2,954,117 | |
| | | | | | | | |
Total Short-Term Investment
(Cost $2,954,117) | | | | | | | 2,954,117 | |
| | | | | | | | |
Total Investments
(Cost $387,963,141) (c) | | | 98.3 | % | | | 448,279,984 | |
Other Assets, Less Liabilities | | | 1.7 | | | | 7,695,431 | |
Net Assets | | | 100.0 | % | | $ | 455,975,415 | |
| (a) | Non-income producing security. |
| (b) | ADR—American Depositary Receipt. |
| (c) | As of December 31, 2012, cost is $388,791,629 for federal income tax purposes and net unrealized appreciation is as follows: |
| | | | |
Gross unrealized appreciation | | $ | 70,242,670 | |
Gross unrealized depreciation | | | (10,754,315 | ) |
| | | | |
Net unrealized appreciation | | $ | 59,488,355 | |
| | | | |
| | | | | | |
The notes to the financial statements are an integral part of,
and should be read in conjunction with, the financial statements. | | mainstayinvestments.com | | | M-281 | |
Portfolio of Investments December 31, 2012 (continued)
The following is a summary of the fair valuations according to the inputs used as of December 31, 2012, for valuing the Portfolio’s assets.
Asset Valuation Inputs
| | | | | | | | | | | | | | | | |
Description | | Quoted Prices
in Active Markets
for Identical Assets
(Level 1) | | | Significant Other
Observable
Inputs (Level 2) | | | Significant
Unobservable
Inputs (Level 3) | | | Total | |
| Investments in Securities (a) | | | | | | | | | | | | | | | | |
| Common Stocks | | | | | | | | | | | | | | | | |
Australia | | $ | — | | | $ | 5,713,043 | | | $ | — | | | $ | 5,713,043 | |
Brazil | | | — | | | | 7,742,056 | | | | — | | | | 7,742,056 | |
China | | | — | | | | 6,790,301 | | | | — | | | | 6,790,301 | |
Czech Republic | | | — | | | | 11,074,509 | | | | — | | | | 11,074,509 | |
Denmark | | | — | | | | 23,880,753 | | | | — | | | | 23,880,753 | |
France | | | — | | | | 34,569,724 | | | | — | | | | 34,569,724 | |
Germany | | | — | | | | 63,538,116 | | | | — | | | | 63,538,116 | |
Hong Kong | | | — | | | | 12,680,934 | | | | — | | | | 12,680,934 | |
Indonesia | | | — | | | | 4,803,863 | | | | — | | | | 4,803,863 | |
Italy | | | — | | | | 4,508,124 | | | | — | | | | 4,508,124 | |
Japan | | | — | | | | 32,362,778 | | | | — | | | | 32,362,778 | |
South Africa | | | — | | | | 3,501,438 | | | | — | | | | 3,501,438 | |
Spain | | | — | | | | 19,917,435 | | | | — | | | | 19,917,435 | |
Sweden | | | — | | | | 21,337,323 | | | | — | | | | 21,337,323 | |
Thailand | | | — | | | | 11,850,706 | | | | — | | | | 11,850,706 | |
United Kingdom | | | — | | | | 109,127,704 | | | | — | | | | 109,127,704 | |
All Other Countries | | | 71,927,060 | | | | — | | | | — | | | | 71,927,060 | |
| | | | | | | | | | | | | | | | |
| Total Common Stocks | | | 71,927,060 | | | | 373,398,807 | | | | — | | | | 445,325,867 | |
| | | | | | | | | | | | | | | | |
| Short-Term Investment | | | | | | | | | | | | | | | | |
Repurchase Agreement | | | — | | | | 2,954,117 | | | | — | | | | 2,954,117 | |
| | | | | | | | | | | | | | | | |
| Total Investments in Securities | | $ | 71,927,060 | | | $ | 376,352,924 | | | $ | — | | | $ | 448,279,984 | |
| | | | | | | | | | | | | | | | |
| (a) | For a complete listing of investments and their industries, see the Portfolio of Investments. |
The Portfolio recognizes transfers between the levels as of the beginning of the period.
As of year ended December 31, 2012, certain foreign equity securities with a market value of $236,866,239 held by the Portfolio at December 31, 2011, transferred from Level 1 to Level 2 due to these securities being fair valued at year end by applying factors provided by a third party vendor in accordance with the Portfolio’s policies and procedures. (See Note 2)
As of December 31, 2012, the Portfolio did not hold any investments with significant unobservable inputs (Level 3). (See Note 2)
| | | | |
| M-282 | | MainStay VP International Equity Portfolio | | The notes to the financial statements are an integral part of,
and should be read in conjunction with, the financial statements. |
The table below sets forth the diversification of MainStay VP International Equity Portfolio investments by industry.
Industry Diversification (Unaudited)
| | | | | | | | |
| | | Value | | | Percent† | |
Beverages | | $ | 16,809,754 | | | | 3.7 | % |
Biotechnology | | | 19,917,435 | | | | 4.4 | |
Capital Markets | | | 7,508,495 | | | | 1.6 | |
Chemicals | | | 26,114,096 | | | | 5.7 | |
Commercial Banks | | | 53,655,781 | | | | 11.8 | |
Commercial Services & Supplies | | | 14,848,392 | | | | 3.3 | |
Construction & Engineering | | | 12,060,915 | | | | 2.6 | |
Distributors | | | 12,680,934 | | | | 2.8 | |
Energy Equipment & Services | | | 15,096,939 | | | | 3.3 | |
Food & Staples Retailing | | | 9,346,752 | | | | 2.1 | |
Health Care Equipment & Supplies | | | 57,441,850 | | | | 12.6 | |
Health Care Providers & Services | | | 13,309,575 | | | | 2.9 | |
Hotels, Restaurants & Leisure | | | 4,295,391 | | | | 0.9 | |
Internet Software & Services | | | 25,030,828 | | | | 5.5 | |
IT Services | | | 19,208,686 | | | | 4.2 | |
Media | | | 7,193,720 | | | | 1.6 | |
Oil, Gas & Consumable Fuels | | | 6,790,301 | | | | 1.5 | |
Pharmaceuticals | | | 23,136,168 | | | | 5.1 | |
Professional Services | | | 36,783,384 | | | | 8.1 | |
Real Estate Management & Development | | | 13,230,767 | | | | 2.9 | |
Software | | | 19,758,337 | | | | 4.3 | |
Specialty Retail | | | 7,742,056 | | | | 1.7 | |
Textiles, Apparel & Luxury Goods | | | 18,005,975 | | | | 3.9 | |
Trading Companies & Distributors | | | 8,313,453 | | | | 1.8 | |
| | | | | | | | |
| | | 448,279,984 | | | | 98.3 | |
Other Assets, Less Liabilities | | | 7,695,431 | | | | 1.7 | |
| | | | | | | | |
Net Assets | | $ | 455,975,415 | | | | 100.0 | % |
| | | | | | | | |
| † | Percentages indicated are based on Portfolio net assets. |
| | | | | | |
The notes to the financial statements are an integral part of,
and should be read in conjunction with, the financial statements. | | mainstayinvestments.com | | | M-283 | |
Statement of Assets and Liabilities as of December 31, 2012
| | | | |
| Assets | |
Investment in securities, at value
(identified cost $387,963,141) | | $ | 448,279,984 | |
Cash denominated in foreign currencies
(identified cost $7,131,761) | | | 7,237,219 | |
Receivables: | | | | |
Investment securities sold | | | 2,775,220 | |
Dividends and interest | | | 364,180 | |
Fund shares sold | | | 152,417 | |
Other assets | | | 10,359 | |
| | | | |
Total assets | | | 458,819,379 | |
| | | | |
|
| Liabilities | |
Payables: | | | | |
Investment securities purchased | | | 1,584,983 | |
Foreign capital gains tax (See Note 2(C)) | | | 525,758 | |
Manager (See Note 3) | | | 342,671 | |
Fund shares redeemed | | | 237,889 | |
NYLIFE Distributors (See Note 3) | | | 58,382 | |
Professional fees | | | 42,627 | |
Shareholder communication | | | 36,475 | |
Custodian | | | 14,522 | |
Trustees | | | 657 | |
| | | | |
Total liabilities | | | 2,843,964 | |
| | | | |
Net assets | | $ | 455,975,415 | |
| | | | |
|
| Net Assets Consist of | |
Shares of beneficial interest outstanding (par value of $.001 per share) unlimited number of shares authorized | | $ | 37,753 | |
Additional paid-in capital | | | 527,161,715 | |
| | | | |
| | | 527,199,468 | |
Undistributed net investment income | | | 5,029,955 | |
Accumulated net realized gain (loss) on investments and foreign currency transactions | | | (136,163,841 | ) |
Net unrealized appreciation (depreciation) on investments (a) | | | 59,791,085 | |
Net unrealized appreciation (depreciation) on translation of other assets and liabilities in foreign currencies | | | 118,748 | |
| | | | |
Net assets | | $ | 455,975,415 | |
| | | | |
| | | | |
Initial Class | | | | |
Net assets applicable to outstanding shares | | $ | 180,123,519 | |
| | | | |
Shares of beneficial interest outstanding | | | 14,840,885 | |
| | | | |
Net asset value per share outstanding | | $ | 12.14 | |
| | | | |
Service Class | | | | |
Net assets applicable to outstanding shares | | $ | 275,851,896 | |
| | | | |
Shares of beneficial interest outstanding | | | 22,911,670 | |
| | | | |
Net asset value per share outstanding | | $ | 12.04 | |
| | | | |
| (a) | Net of unrealized foreign capital gains tax of $525,758. |
| | | | |
| M-284 | | MainStay VP International Equity Portfolio | | The notes to the financial statements are an integral part of,
and should be read in conjunction with, the financial statements. |
Statement of Operations for the year ended December 31, 2012
| | | | |
|
| Investment Income (Loss) | |
Income | | | | |
Dividends (a) | | $ | 9,376,696 | |
Interest | | | 374 | |
| | | | |
Total income | | | 9,377,070 | |
| | | | |
Expenses | | | | |
Manager (See Note 3) | | | 4,002,180 | |
Distribution and service—Service Class (See Note 3) | | | 683,919 | |
Custodian | | | 87,896 | |
Shareholder communication | | | 74,454 | |
Professional fees | | | 73,757 | |
Trustees | | | 11,877 | |
Miscellaneous | | | 23,995 | |
| | | | |
Total expenses | | | 4,958,078 | |
| | | | |
Net investment income (loss) | | | 4,418,992 | |
| | | | |
|
| Realized and Unrealized Gain (Loss) on Investments and Foreign Currency Transactions | |
Net realized gain (loss) on: | | | | |
Security transactions (b) | | | (1,553,424 | ) |
Foreign currency transactions | | | 769,862 | |
| | | | |
Net realized gain (loss) on investments and foreign currency transactions | | | (783,562 | ) |
| | | | |
Net change in unrealized appreciation (depreciation) on: | | | | |
Investments (c) | | | 74,959,138 | |
Translation of other assets and liabilities in foreign currencies | | | 38,385 | |
| | | | |
Net change in unrealized appreciation (depreciation) on investments and foreign currency transactions | | | 74,997,523 | |
| | | | |
Net realized and unrealized gain (loss) on investments and foreign currency transactions | | | 74,213,961 | |
| | | | |
Net increase (decrease) in net assets resulting from operations | | $ | 78,632,953 | |
| | | | |
| (a) | Dividends recorded net of foreign withholding taxes in the amount of $1,191,188. |
| (b) | Net of foreign capital gains tax of $158,869. |
| (c) | Net of foreign capital gains tax of $525,758. |
| | | | | | |
The notes to the financial statements are an integral part of,
and should be read in conjunction with, the financial statements. | | mainstayinvestments.com | | | M-285 | |
Statements of Changes in Net Assets
for the years ended December 31, 2012 and December 31, 2011
| | | | | | | | |
| | | 2012 | | | 2011 | |
| Increase (Decrease) in Net Assets | |
Operations: | | | | | | | | |
Net investment income (loss) | | $ | 4,418,992 | | | $ | 11,036,762 | |
Net realized gain (loss) on investments, futures transactions and foreign currency transactions | | | (783,562 | ) | | | (47,398,575 | ) |
Net change in unrealized appreciation (depreciation) on investments, futures contracts and foreign currency transactions | | | 74,997,523 | | | | (41,842,135 | ) |
| | | | |
Net increase (decrease) in net assets resulting from operations | | | 78,632,953 | | | | (78,203,948 | ) |
| | | | |
Dividends to shareholders: | | | | | | | | |
From net investment income: | | | | | | | | |
Initial Class | | | (3,187,864 | ) | | | (6,058,841 | ) |
Service Class | | | (4,283,314 | ) | | | (8,908,718 | ) |
| | | | |
Total dividends to shareholders | | | (7,471,178 | ) | | | (14,967,559 | ) |
| | | | |
Capital share transactions: | | | | | | | | |
Net proceeds from sale of shares | | | 52,233,170 | | | | 63,014,971 | |
Net asset value of shares issued to shareholders in reinvestment of dividends | | | 7,471,178 | | | | 14,967,559 | |
Cost of shares redeemed | | | (78,567,358 | ) | | | (144,661,687 | ) |
| | | | |
Increase (decrease) in net assets derived from capital share transactions | | | (18,863,010 | ) | | | (66,679,157 | ) |
| | | | |
Net increase (decrease) in net assets | | | 52,298,765 | | | | (159,850,664 | ) |
|
| Net Assets | |
Beginning of year | | | 403,676,650 | | | | 563,527,314 | |
| | | | |
End of year | | $ | 455,975,415 | | | $ | 403,676,650 | |
| | | | |
Undistributed net investment income at end of year | | $ | 5,029,955 | | | $ | 7,471,148 | |
| | | | |
| | | | |
| M-286 | | MainStay VP International Equity Portfolio | | The notes to the financial statements are an integral part of,
and should be read in conjunction with, the financial statements. |
Financial Highlights selected per share data and ratios
| | | | | | | | | | | | | | | | | | | | |
| | | Initial Class | |
| | | Year ended December 31, | |
| | | 2012 | | | 2011 | | | 2010 | | | 2009 | | | 2008 | |
Net asset value at beginning of year | | $ | 10.34 | | | $ | 12.82 | | | $ | 12.63 | | | $ | 11.30 | | | $ | 18.29 | |
| | | | | | | | | | | | | | | | | | | | |
Net investment income (loss) | | | 0.13 | (a) | | | 0.29 | (a) | | | 0.29 | (b) | | | 0.32 | (a) | | | 0.59 | (a) |
Net realized and unrealized gain (loss) on investments | | | 1.86 | | | | (2.35 | ) | | | 0.30 | | | | 1.74 | | | | (5.71 | ) |
Net realized and unrealized gain (loss) on foreign currency transactions | | | 0.02 | | | | (0.02 | ) | | | 0.01 | | | | 0.13 | | | | 0.31 | |
| | | | | | | | | | | | | | | | | | | | |
Total from investment operations | | | 2.01 | | | | (2.08 | ) | | | 0.60 | | | | 2.19 | | | | (4.81 | ) |
| | | | | | | | | | | | | | | | | | | | |
Less dividends and distributions: | | | | | | | | | | | | | | | | | | | | |
From net investment income | | | (0.21 | ) | | | (0.40 | ) | | | (0.41 | ) | | | (0.86 | ) | | | (0.24 | ) |
From net realized gain on investments | | | — | | | | — | | | | — | | | | — | | | | (1.94 | ) |
| | | | | | | | | | | | | | | | | | | | |
Total dividends and distributions | | | (0.21 | ) | | | (0.40 | ) | | | (0.41 | ) | | | (0.86 | ) | | | (2.18 | ) |
| | | | | | | | | | | | | | | | | | | | |
Net asset value at end of year | | $ | 12.14 | | | $ | 10.34 | | | $ | 12.82 | | | $ | 12.63 | | | $ | 11.30 | |
| | | | | | | | | | | | | | | | | | | | |
Total investment return | | | 19.48 | % | | | (16.04 | %) | | | 4.90 | % | | | 19.36 | % | | | (25.67 | %) |
Ratios (to average net assets)/Supplemental Data: | | | | | | | | | | | | | | | | | | | | |
Net investment income (loss) | | | 1.14 | % | | | 2.40 | % | | | 2.34 | %(b) | | | 2.75 | % | | | 3.87 | % |
Net expenses | | | 0.95 | % | | | 0.95 | % | | | 0.98 | % | | | 0.99 | % | | | 0.96 | % |
Portfolio turnover rate | | | 42 | % | | | 101 | % | | | 42 | % | | | 83 | % | | | 89 | % |
Net assets at end of year (in 000’s) | | $ | 180,124 | | | $ | 147,740 | | | $ | 265,519 | | | $ | 256,710 | | | $ | 244,533 | |
| (a) | Per share data based on average shares outstanding during the year. |
| (b) | Included in net investment income per share and the ratio of net investment income to average net assets are $0.04 per share and 0.30%, respectively, resulting from a special one-time dividend from Ryanair Holdings PLC that paid $0.30 per share. |
| | | | | | | | | | | | | | | | | | | | |
| | | Service Class | |
| | | Year ended December 31, | |
| | | 2012 | | | 2011 | | | 2010 | | | 2009 | | | 2008 | |
Net asset value at beginning of year | | $ | 10.26 | | | $ | 12.72 | | | $ | 12.54 | | | $ | 11.22 | | | $ | 18.17 | |
| | | | | | | | | | | | | | | | | | | | |
Net investment income (loss) | | | 0.10 | (a) | | | 0.26 | (a) | | | 0.23 | (b) | | | 0.28 | (a) | | | 0.54 | (a) |
Net realized and unrealized gain (loss) on investments | | | 1.84 | | | | (2.33 | ) | | | 0.32 | | | | 1.73 | | | | (5.67 | ) |
Net realized and unrealized gain (loss) on foreign currency transactions | | | 0.02 | | | | (0.02 | ) | | | 0.01 | | | | 0.13 | | | | 0.31 | |
| | | | | | | | | | | | | | | | | | | | |
Total from investment operations | | | 1.96 | | | | (2.09 | ) | | | 0.56 | | | | 2.14 | | | | (4.82 | ) |
| | | | | | | | | | | | | | | | | | | | |
Less dividends and distributions: | | | | | | | | | | | | | | | | | | | | |
From net investment income | | | (0.18 | ) | | | (0.37 | ) | | | (0.38 | ) | | | (0.82 | ) | | | (0.19 | ) |
From net realized gain on investments | | | — | | | | — | | | | — | | | | — | | | | (1.94 | ) |
| | | | | | | | | | | | | | | | | | | | |
Total dividends and distributions | | | (0.18 | ) | | | (0.37 | ) | | | (0.38 | ) | | | (0.82 | ) | | | (2.13 | ) |
| | | | | | | | | | | | | | | | | | | | |
Net asset value at end of year | | $ | 12.04 | | | $ | 10.26 | | | $ | 12.72 | | | $ | 12.54 | | | $ | 11.22 | |
| | | | | | | | | | | | | | | | | | | | |
Total investment return | | | 19.18 | % | | | (16.25 | %) | | | 4.63 | % | | | 19.06 | % | | | (25.86 | %) |
Ratios (to average net assets)/Supplemental Data: | | | | | | | | | | | | | | | | | | | | |
Net investment income (loss) | | | 0.88 | % | | | 2.17 | % | | | 2.10 | %(b) | | | 2.47 | % | | | 3.60 | % |
Net expenses | | | 1.20 | % | | | 1.20 | % | | | 1.23 | % | | | 1.24 | % | | | 1.21 | % |
Portfolio turnover rate | | | 42 | % | | | 101 | % | | | 42 | % | | | 83 | % | | | 89 | % |
Net assets at end of year (in 000’s) | | $ | 275,852 | | | $ | 255,937 | | | $ | 298,008 | | | $ | 262,263 | | | $ | 222,210 | |
| (a) | Per share data based on average shares outstanding during the year. |
| (b) | Included in net investment income per share and the ratio of net investment income to average net assets are $0.04 per share and 0.30%, respectively, resulting from a special one-time dividend from Ryanair Holdings PLC that paid $0.30 per share. |
| | | | | | |
The notes to the financial statements are an integral part of,
and should be read in conjunction with, the financial statements. | | mainstayinvestments.com | | | M-287 | |
MainStay VP Janus Balanced Portfolio
Investment and Performance Comparison1 (Unaudited)
Performance data quoted represents past performance. Past performance is no guarantee of future results. Because of market volatility, current performance may be lower or higher than the figures shown. Investment return and principal value will fluctuate, and as a result, when shares are redeemed, they may be worth more or less than their original cost. The performance table and graph do not reflect any deduction of sales charges, mortality and expense charges, contract charges or administrative charges. Please refer to the Performance Summary appropriate for your policy. For performance information current to the most recent month-end, please call 800-598-2019 or visit www.newyorklife.com.
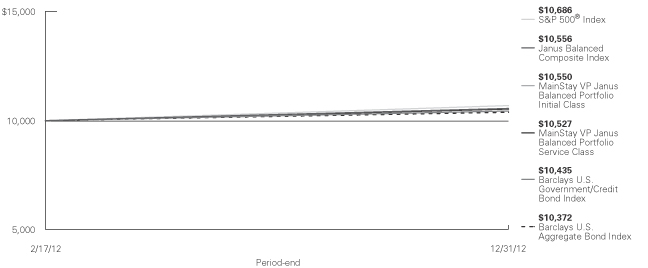
Total Returns for the Year Ended December 31, 2012
| | | | | | | | |
| Class | | Since Inception (2/17/12) | | | Gross Expense Ratio2 | |
| Initial Class Shares | | | 5.50 | % | | | 0.60 | % |
| Service Class Shares | | | 5.27 | | | | 0.85 | |
| | | | |
| Benchmark Performance | | Since Inception
(2/17/12) | |
S&P 500® Index3 | | | 6.86 | % |
Barclays U.S. Aggregate Bond Index3 | | | 3.72 | |
Barclays U.S. Government/Credit Bond Index3 | | | 4.35 | |
Janus Balanced Composite Index3 | | | 5.56 | |
Average Lipper Variable Products Mixed-Asset Target Allocation Moderate Portfolio4 | | | 5.38 | |
| 1. | Performance figures reflect certain fee waivers and/or expense limitations, without which total returns may have been different. For information on current fee waivers and/or expense limitations, please refer to the notes to the financial statements. |
| 2. | The gross expense ratios presented reflect the Portfolio’s “Total Annual Portfolio Operating Expenses” from the most recent Prospectus and may differ from other expense ratios disclosed in this report. |
| 3. | Please refer to pages M-2 and M-3 for additional explanations and disclosure regarding the Portfolios, their benchmark indices and other indices mentioned in the reports. |
| 4. | The Lipper Variable Products Mixed-Asset Target Allocation Moderate Portfolio is representative of portfolios that, by portfolio practice, maintain a mix of between 40%-60% equity securities, with the remainder invested in bonds, cash, and cash equivalents. Lipper Inc. is an independent monitor of fund performance. Results are based on total returns with all dividend and capital gain distributions reinvested. |
| | |
| M-288 | | MainStay VP Janus Balanced Portfolio |
Cost in Dollars of a $1,000 Investment in MainStay VP Janus Balanced Portfolio (Unaudited)
The example below is intended to describe the fees and expenses borne by shareholders during the period from July 1, 2012, to December 31, 2012, and the impact of those costs on your investment.
Example
As a shareholder of the Portfolio, you incur two types of costs: (1) transaction costs, including exchange fees and sales charges (loads) on purchases (as applicable), and (2) ongoing costs, including management fees, distribution and/or service (12b-1) fees, and other Portfolio expenses (as applicable). This example is intended to help you understand your ongoing costs (in dollars) of investing in the Portfolio and to compare these costs with the ongoing costs of investing in other Portfolios. The example is based on an investment of $1,000 made at the beginning of the six-month period and held for the entire period from July 1, 2012, to December 31, 2012. Shares are only sold in connection with variable life and annuity contracts and the example does not reflect any contract level or transactional fees or expenses. If these costs had been included, your costs would have been higher.
This example illustrates your Portfolio’s ongoing costs in two ways:
Actual Expenses
The second and third data columns in the table below provide information about actual account values and actual expenses. You may use the information in these columns, together with the amount you invested, to estimate the
expenses that you paid during the six months ended December 31, 2012. Simply divide your account value by $1,000 (for example, an $8,600 account value divided by $1,000 = 8.6), then multiply the result by the number under the heading entitled ‘‘Expenses Paid During Period’’ to estimate the expenses you paid on your account during this period.
Hypothetical Example for Comparison Purposes
The fourth and fifth data columns in the table below provide information about hypothetical account values and hypothetical expenses based on the Portfolio’s actual expense ratio and an assumed rate of return of 5% per year before expenses, which is not the Portfolio’s actual return. The hypothetical account values and expenses may not be used to estimate the actual ending account balances or expenses you paid for the six-month period shown. You may use this information to compare the ongoing costs of investing in the Portfolio with the ongoing costs of investing in other Portfolios. To do so, compare this 5% hypothetical example with the 5% hypothetical examples that appear in the shareholder reports of the other Portfolios.
Please note that the expenses shown in the table are meant to highlight your ongoing costs only and do not reflect any transactional costs, such as exchange fees or sales charges (loads). Therefore, the fourth and fifth data columns of the table are useful in comparing ongoing costs only and will not help you determine the relative total costs of owning different funds. In addition, if these transactional costs were included, your costs would have been higher.
| | | | | | | | | | | | | | | | | | | | |
| | | | | | | | | | | | | | | | |
| Share Class | | Beginning
Account
Value
7/1/12 | | | Ending Account
Value (Based
on Actual
Returns and
Expenses)
12/31/12 | | | Expenses
Paid
During
Period1 | | | Ending Account
Value (Based
on Hypothetical
5% Annualized
Return and
Actual Expenses)
12/31/12 | | | Expenses
Paid
During
Period1 | |
| | | | | |
| Initial Class Shares | | $ | 1,000.00 | | | $ | 1,062.80 | | | $ | 3.01 | | | $ | 1,022.20 | | | $ | 2.95 | |
| | | | | |
| Service Class Shares | | $ | 1,000.00 | | | $ | 1,061.50 | | | $ | 4.30 | | | $ | 1,021.00 | | | $ | 4.22 | |
| 1. | Expenses are equal to the Portfolio’s annualized expense ratio of each class (0.58% for Initial Class and 0.83% for Service Class) multiplied by the average account value over the period, divided by 366 and multiplied by 184 (to reflect the six-month period). The table above represents the actual expenses incurred during the six-month period. |
| | | | |
| mainstayinvestments.com | | | M-289 | |
Portfolio Composition as of December 31, 2012 (Unaudited)
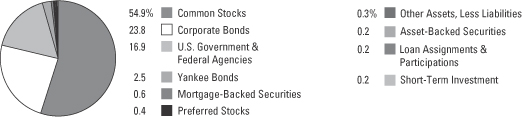
See Portfolio of Investments beginning on page M-294 for specific holdings within these categories.
Top Ten Holdings or Issuers Held as of December 31, 2012 (excluding short-term investment) (Unaudited)
| 1. | United States Treasury Notes, 0.25%–3.125%, due 3/31/14–11/15/22 |
| 2. | Federal National Mortgage Association (Mortgage Pass-Through Securities), 4.50%–6.00%, due 1/1/25–6/1/41 |
| 3. | Government National Mortgage Association (Mortgage Pass-Through Securities), 3.50%–6.00%, due 11/20/34–5/20/42 |
| 5. | Express Scripts Holding Co. |
| 7. | Philip Morris International, Inc. |
| 9. | E.I. du Pont de Nemours & Co. |
| | |
| M-290 | | MainStay VP Janus Balanced Portfolio |
Portfolio Management Discussion and Analysis (Unaudited)
Answers to the questions reflect the views of portfolio managers E. Marc Pinto, CFA, and R. Gibson Smith of Janus Capital Management LLC (“Janus Capital”), the Portfolio’s Subadvisor.
How did MainStay VP Janus Balanced Portfolio perform relative to its peers and its benchmark from February 17 through December 31, 2012?
The inception date for MainStay VP Janus Balanced Portfolio was February 17, 2012. From February 17 through December 31, 2012, MainStay VP Janus Balanced Portfolio returned 5.50% for Initial Class shares and 5.27% for Service Class shares. Over the same period, Initial Class shares outperformed—and Service Class shares underperformed—the 5.38% return of the average Lipper1 Variable Products Mixed-Asset Target Allocation Moderate Portfolio. During the reporting period, both share classes underperformed the 6.86% return of the S&P 500® Index.1 The S&P 500® Index is the Portfolio’s broad-based securities-market index. From February 17 through December 31, 2012, both share classes outperformed the 3.72% return of the Barclays U.S. Aggregate Bond Index1 and the 4.35% return of the Barclays U.S. Government/Credit Bond Index1 but underperformed the 5.56% return of the Janus Balanced Composite Index.1 The Barclays U.S. Aggregate Bond Index is the secondary benchmark of the Portfolio. The Barclays U.S. Government/Credit Bond Index and the Janus Balanced Composite Index are additional benchmarks for the Portfolio.
What factors affected the Portfolio’s relative performance during the reporting period?
The equity portion of the Portfolio underperformed the S&P 500® Index during the reporting period, with stock selection in the financials and energy sectors detracting from relative results. In the equity portion of the Portfolio, stock selection contributed positively to performance in the information technology, industrials and materials sectors.
The fixed-income portion of the Portfolio outperformed the Barclays U.S. Aggregate Bond Index. Security selection and an overweight allocation to corporate credit were the top contributors during the reporting period, as well as spread2 carry, or the additional yield that our holdings generated compared to that Index. (Contributions take weightings and total returns into account.) Security selection and an underweight position in mortgage-backed securities were also beneficial, as was an underweight position in
U.S. Treasury securities. A small cash position created a modest drag on performance. Cash is not an active strategy, but is primarily used to facilitate our day-to-day investment process.
Which sectors in the equity portion of the Portfolio were the strongest positive contributors to the Portfolio’s relative performance, and which sectors in the equity portion of the Portfolio were particularly weak?
In the equity portion of the Portfolio, the strongest positive sector contributors were information technology, industrials and materials. The weakest sector contributors were financials, energy and health care.
During the reporting period, which individual stocks made the strongest positive contributions to the absolute performance of the equity portion of the Portfolio and which individual stocks detracted the most?
In the equity portion of the Portfolio, the strongest positive individual contributions to absolute performance came from chemicals company LyondellBasell Industries N.V., media company CBS and Internet company eBay. LyondellBasell Industries recently benefited from high refining margins because of low natural gas and U.S. oil prices, as well as firm end markets for its products. The company continues to pay back debt and has instituted a dividend and a share-repurchase plan. We added to the position during the reporting period. CBS enjoyed good ratings, decent growth in advertising revenue and increasing affiliate fees tied to retransmission of the CBS network. Ebay saw a return to growth in its core eBay Marketplace business, which is its traditional auction business. The company has migrated toward a buy-it-now business, which encourages higher velocity transactions. In August, eBay’s PayPal business signed an agreement with Discover Financial Services. The agreement will allow customers to use their PayPal accounts at merchants that accept Discover cards. In our opinion, the agreement signals that PayPal is becoming a more universally accepted form of payment, both offline (at retailers) and online.
| 1. | Please refer to pages M-2 and M-3 for additional explanations and disclosure regarding the Portfolios, their benchmark indices and service providers mentioned in the reports. |
| 2. | The terms “spread” and “yield spread” may refer to the difference in yield between a security or type of security and comparable U.S. Treasury issues. The terms may also refer to the difference in yield between two specific securities or types of securities at a given time. |
| | | | |
| mainstayinvestments.com | | | M-291 | |
In the equity portion of the Portfolio, the most substantial detractors included oil & gas companies Canadian Natural Resources and Hess and lodging company MGM Resorts International. Canadian Natural Resources continued to suffer outages at its Horizon oil sands facility in northwestern Canada. Investor concerns about the company’s aggressive capital expenditure plans prompted us to sell the position from the equity portion of the Portfolio during the reporting period. Hess announced a higher capital expenditure budget for 2013, at a time when many investors were already questioning the returns they were receiving from Hess’s capital spending. Even so, the company has taken some shareholder-friendly steps, including announcing some asset sales. We like that Hess is selling marginal properties to fund development of conventional assets. We also believe that the company is well positioned in the oil-rich Bakken shale formation. We reduced the position but continue to hold the stock in the equity portion of the Portfolio. Despite weak results from MGM Resorts International, we like the casino resort owner for its improving demand metrics, particularly a rebound in its convention business. We also appreciate that the company has reduced debt and improved its liquidity profile. MGM Resorts International also has exposure to the growing gaming market in Macau, a special administrative region of the People’s Republic of China. The company also has the potential to expand in other parts of Asia.
Did the equity portion of the Portfolio make any significant purchases or sales during the reporting period?
During the reporting period, the equity portion of the Portfolio established a position in specialty retailer Home Depot. We believe that the housing recovery will continue and that Home Depot will benefit from it. We also purchased shares of Microsoft. We believe that Microsoft is well positioned to benefit from a strong shift to multi-year agreements and services—now the majority of the enterprise revenues—and from significant traction in key lock-in products like System Center. Microsoft’s Xbox gaming platform has also gained market share and expanded product offerings in the living room.
As previously noted, the equity portion of the Portfolio sold its position in Canadian Natural Resources. Continued outages at the Horizon oil
sands facility and concerns about whether aggressive capital expenditure plans would lead to sufficient returns prompted the sale. The equity portion of the Portfolio also sold its position in social networking web- site operator Facebook. After the company’s initial public offering, we faced growing concern regarding the company’s ability to monetize its mobile platform. Upon realizing that even at lower levels the stock was overvalued, we eliminated the position.
How did sector weightings change in the equity portion of the Portfolio during the reporting period?
In the equity portion of the Portfolio, we modestly increased exposure to health care, industrials and materials. In the same portion of the Portfolio, we reduced exposure to information technology, consumer staples and energy.
How was the equity portion of the Portfolio positioned at the end of the reporting period?
As of December 31, 2012, the Portfolio was overweight consumer discretionary, health care and materials compared with the S&P 500® Index. It was underweight consumer staples, energy, industrials, information technology and financials.
What was the duration3 strategy of the fixed-income portion of the Portfolio during the reporting period?
In the fixed-income portion of the Portfolio, we did not significantly lengthen or shorten duration during the reporting period.
What specific factors, risks or market forces prompted significant decisions for the fixed-income portion of the Portfolio during the reporting period?
Near the end of the year, we trimmed the corporate credit position in the fixed-income portion of the Portfolio in favor of U.S. Treasury securities. We believed that the move was prudent as we saw uncertainty surface around the fiscal cliff and political issues. We believe that in many industries, revenue growth may be less than robust next year, and we have tried to position the fixed-income portion of the Portfolio accordingly. We continue to worry about aggressive dividend issuance and other shareholder-friendly activity.
| 3. | Duration is a measure of the price sensitivity of a fixed-income investment to changes in interest rates. Duration is expressed as a number of years and is considered a more accurate sensitivity gauge than average maturity. |
| | |
| M-292 | | MainStay VP Janus Balanced Portfolio |
During the reporting period, which market segments in the fixed-income portion of the Portfolio made the strongest positive contributions to the Portfolio’s performance and which market segments were particularly weak?
In the fixed-income portion of the Portfolio the strongest positive contributions came from the corporate credit sector. Among the leaders were noncaptive diversified financial companies, brokerages and real estate investment trusts (REITs). Credit sectors that detracted from the performance of the fixed-income portion of the Portfolio included metals & mining, property-casualty insurers and wireline communications.
Did the fixed-income portion of the Portfolio make any significant purchases or sales during the reporting period?
The fixed-income portion of the Portfolio established a position in pharmaceutical company Watson Pharmaceuticals. The company made a large acquisition funded by debt that we felt would be highly accretive to Watson Pharmaceutical’s business. The company’s generic footprint expanded to global markets at a time when many leading drugs, including Lipitor, are going generic. The bonds were issued at a premium, offering beneficial yield in which the Portfolio participated. As management delivers on its commitment to rapid deleveraging, we anticipate beneficial spread compression.
The fixed-income portion of the Portfolio also established a position in integrated oil company Shell International, which we believe has the best relative-value position in its market segment. We believe that supply and demand characteristics are favorable, the company has good balance sheet discipline, and that the securities offer attractive yield for their profile. We view Shell International as a defensive holding.
The fixed-income portion of the Portfolio sold its position in real estate investment trust Rouse when the bonds were called by the issuer. We also sold Arkle Master Issuer floaters that we purchased at about 170 basis points over LIBOR.1 (A basis point is one hundredth of a percentage point.) When the spread compressed to about 50 basis points over LIBOR, we sold the bonds on valuation. The Funding for Lending program in Europe reduced issuance and made these bonds very dear in the market. Once that program expires, issuance may pick up again, and spreads are likely to widen.
During the reporting period, how did sector weightings change in the fixed-income portion of the Portfolio?
During the reporting period, the fixed-income por-tion of the Portfolio increased its weighting in U.S. industrials. Over the same period, the fixed-income portion of the Portfolio decreased its weightings in U.S. finance, U.S. utilities, non-U.S. industrials and non-U.S. finance.
How was the fixed-income portion of the Portfolio positioned at the end of the reporting period?
As of December 31, 2012, the fixed-income portion of the Portfolio was substantially overweight relative to the Barclays U.S. Aggregate Bond Index in corporate credit, modestly overweight in asset-backed securities and cash. (Cash is not a part of this Index and is not an active strategy in the Portfolio. Cash is used primarily as a frictional component of the day-to-day investment process.)
As of the same date, the fixed-income portion of the Portfolio was underweight relative to the Barclays U.S. Aggregate Bond Index in U.S. Treasury securities, mortgage-backed securities and commercial mortgage-backed securities.
The opinions expressed are those of the portfolio managers as of the date of this report and are subject to change. There is no guarantee that any forecasts made will come to pass. This material does not constitute investment advice and is not intended as an endorsement of any specific investment.
Not all MainStay VP Portfolios and/or share classes are available under all policies.
| | | | |
| mainstayinvestments.com | | | M-293 | |
Portfolio of Investments December 31, 2012
| | | | | | | | |
| | | Principal
Amount | | | Value | |
Long-Term Bonds 44.2%† Asset-Backed Securities 0.2% | | | | | |
Automobile 0.1% | | | | | | | | |
AmeriCredit Automobile Receivables Trust
Series 2012-4, Class D
2.68%, due 10/9/18 | | $ | 457,000 | | | $ | 461,808 | |
Santander Drive Auto Receivables Trust
Series 2012-6, Class D
2.52%, due 9/17/18 | | | 375,000 | | | | 374,801 | |
Series 2012-5, Class D
3.30%, due 9/17/18 | | | 395,000 | | | | 406,930 | |
| | | | | | | | |
| | | | | | | 1,243,539 | |
| | | | | | | | |
Other ABS 0.1% | | | | | | | | |
Beacon Container Finance LLC
Series 2012-1A, Class A
3.72%, due 9/20/27 (a) | | | 697,144 | | | | 716,489 | |
| | | | | | | | |
Total Asset-Backed Securities
(Cost $1,923,790) | | | | | | | 1,960,028 | |
| | | | | | | | |
|
| Corporate Bonds 23.8% | |
Aerospace & Defense 0.2% | | | | | | | | |
Exelis, Inc. | | | | | | | | |
4.25%, due 10/1/16 | | | 868,000 | | | | 915,072 | |
5.55%, due 10/1/21 | | | 393,000 | | | | 428,882 | |
TransDigm, Inc.
7.75%, due 12/15/18 | | | 249,000 | | | | 275,456 | |
| | | | | | | | |
| | | | | | | 1,619,410 | |
| | | | | | | | |
Airlines 0.1% | | | | | | | | |
Southwest Airlines Co.
5.125%, due 3/1/17 | | | 776,000 | | | | 858,721 | |
| | | | | | | | |
| | |
Auto Parts & Equipment 0.0%‡ | | | | | | | | |
Continental Rubber of America Corp.
4.50%, due 9/15/19 (a) | | | 261,000 | | | | 267,106 | |
| | | | | | | | |
| | |
Banks 3.2% | | | | | | | | |
Bank of America Corp. | | | | | | | | |
1.50%, due 10/9/15 | | | 1,231,000 | | | | 1,237,294 | |
3.625%, due 3/17/16 | | | 1,010,000 | | | | 1,070,193 | |
3.75%, due 7/12/16 | | | 975,000 | | | | 1,042,204 | |
4.50%, due 4/1/15 | | | 235,000 | | | | 250,493 | |
8.00%, due 12/29/49 (b) | | | 1,084,000 | | | | 1,198,991 | |
¨CIT Group, Inc. | | | | | | | | |
4.25%, due 8/15/17 | | | 1,321,000 | | | | 1,360,289 | |
5.25%, due 4/1/14 (a) | | | 1,272,000 | | | | 1,316,520 | |
5.50%, due 2/15/19 (a) | | | 1,212,000 | | | | 1,321,080 | |
| | | | | | | | |
| | | Principal
Amount | | | Value | |
Banks (continued) | | | | | | | | |
Citigroup, Inc. | | | | | | | | |
5.00%, due 9/15/14 | | $ | 2,276,000 | | | $ | 2,394,552 | |
5.95%, due 12/29/49 (b) | | | 372,000 | | | | 376,650 | |
Goldman Sachs Group, Inc. (The)
3.625%, due 2/7/16 | | | 2,643,000 | | | | 2,797,676 | |
HSBC Bank USA N.A.
4.875%, due 8/24/20 | | | 750,000 | | | | 835,829 | |
JPMorgan Chase & Co. | | | | | | | | |
4.50%, due 1/24/22 | | | 1,597,000 | | | | 1,806,585 | |
7.90%, due 4/29/49 (b) | | | 495,000 | | | | 560,840 | |
Morgan Stanley | | | | | | | | |
3.45%, due 11/2/15 | | | 1,074,000 | | | | 1,119,010 | |
4.00%, due 7/24/15 | | | 400,000 | | | | 418,514 | |
4.20%, due 11/20/14 | | | 221,000 | | | | 230,589 | |
4.75%, due 3/22/17 | | | 405,000 | | | | 441,839 | |
4.875%, due 11/1/22 | | | 905,000 | | | | 937,032 | |
5.30%, due 3/1/13 | | | 358,000 | | | | 359,956 | |
5.50%, due 7/28/21 | | | 1,054,000 | | | | 1,196,684 | |
SVB Financial Group
5.375%, due 9/15/20 | | | 1,100,000 | | | | 1,234,471 | |
U.S. Bancorp.
2.95%, due 7/15/22 | | | 626,000 | | | | 632,401 | |
Zions BanCorp. | | | | | | | | |
4.50%, due 3/27/17 | | | 704,000 | | | | 735,505 | |
7.75%, due 9/23/14 | | | 1,610,000 | | | | 1,758,370 | |
| | | | | | | | |
| | | | | | | 26,633,567 | |
| | | | | | | | |
Beverages 0.5% | | | | | | | | |
Anheuser-Busch InBev Worldwide, Inc.
2.50%, due 7/15/22 | | | 1,898,000 | | | | 1,909,882 | |
SABMiller Holdings, Inc. | | | | | | | | |
2.45%, due 1/15/17 (a) | | | 800,000 | | | | 833,916 | |
3.75%, due 1/15/22 (a) | | | 1,129,000 | | | | 1,219,129 | |
| | | | | | | | |
| | | | | | | 3,962,927 | |
| | | | | | | | |
Biotechnology 0.0%‡ | | | | | | | | |
Bio Rad Labs
8.00%, due 9/15/16 | | | 185,000 | | | | 201,096 | |
| | | | | | | | |
| |
Broadcast Services and Programming 0.1% | | | | | |
A+E Communications Communication
3.63%, due 8/22/22 (a)(c) | | | 1,000,000 | | | | 1,016,260 | |
| | | | | | | | |
| | |
Chemicals 0.9% | | | | | | | | |
CF Industries, Inc. | | | | | | | | |
6.875%, due 5/1/18 | | | 1,704,000 | | | | 2,081,629 | |
7.125%, due 5/1/20 | | | 815,000 | | | | 1,025,708 | |
| † | Percentages indicated are based on Portfolio net assets. |
| ¨ | | Among the Portfolio’s 10 largest holdings or issuers held, as of December 31, 2012, excluding short-term investment. May be subject to change daily. |
| | | | |
| M-294 | | MainStay VP Janus Balanced Portfolio | | The notes to the financial statements are an integral part of,
and should be read in conjunction with, the financial statements. |
| | | | | | | | |
| | | Principal
Amount | | | Value | |
| Corporate Bonds (continued) | |
Chemicals (continued) | | | | | | | | |
Ecolab, Inc. | | | | | | | | |
3.00%, due 12/8/16 | | $ | 853,000 | | | $ | 906,495 | |
4.35%, due 12/8/21 | | | 899,000 | | | | 1,003,447 | |
Sherwin-Williams Co. (The)
3.125%, due 12/15/14 | | | 928,000 | | | | 971,303 | |
Valspar Corp.
4.20%, due 1/15/22 | | | 1,374,000 | | | | 1,500,955 | |
| | | | | | | | |
| | | | | | | 7,489,537 | |
| | | | | | | | |
Commercial Services 0.8% | | | | | | | | |
Aramark Corp.
8.50%, due 2/1/15 | | | 708,000 | | | | 711,547 | |
Verisk Analytics, Inc. | | | | | | | | |
4.125%, due 9/12/22 | | | 1,139,000 | | | | 1,166,310 | |
4.875%, due 1/15/19 | | | 696,000 | | | | 745,837 | |
5.80%, due 5/1/21 | | | 3,354,000 | | | | 3,758,647 | |
| | | | | | | | |
| | | | | | | 6,382,341 | |
| | | | | | | | |
Diversified Financial Services 0.6% | | | | | | | | |
General Electric Capital Corp. | | | | | | | | |
5.55%, due 5/4/20 | | | 1,228,000 | | | | 1,459,819 | |
6.25%, due 12/15/49 (b) | | | 900,000 | | | | 980,082 | |
6.375%, due 11/15/67 (b) | | | 108,000 | | | | 113,940 | |
7.125%, due 12/15/49 (b) | | | 2,000,000 | | | | 2,260,580 | |
| | | | | | | | |
| | | | | | | 4,814,421 | |
| | | | | | | | |
Electric 0.5% | | | | | | | | |
AES Corp. (The)
7.75%, due 10/15/15 | | | 228,000 | | | | 255,930 | |
CMS Energy Corp. | | | | | | | | |
4.25%, due 9/30/15 | | | 1,076,000 | | | | 1,141,700 | |
5.05%, due 2/15/18 | | | 808,000 | | | | 909,836 | |
Great Plains Energy, Inc.
4.85%, due 6/1/21 | | | 720,000 | | | | 793,248 | |
PPL Energy Supply LLC
4.60%, due 12/15/21 | | | 1,080,000 | | | | 1,170,936 | |
| | | | | | | | |
| | | | | | | 4,271,650 | |
| | | | | | | | |
Electronics 0.5% | | | | | | | | |
Amphenol Corp. | | | | | | | | |
4.00%, due 2/1/22 | | | 551,000 | | | | 582,672 | |
4.75%, due 11/15/14 | | | 1,672,000 | | | | 1,781,529 | |
FLIR Systems, Inc.
3.75%, due 9/1/16 | | | 886,000 | | | | 908,356 | |
Thermo Fisher Scientific, Inc.
3.15%, due 1/15/23 | | | 1,212,000 | | | | 1,238,634 | |
| | | | | | | | |
| | | | | | | 4,511,191 | |
| | | | | | | | |
Engineering & Construction 0.2% | | | | | | | | |
URS Corp. | | | | | | | | |
3.85%, due 4/1/17 (a) | | | 861,000 | | | | 886,950 | |
5.00%, due 4/1/22 (a) | | | 822,000 | | | | 846,222 | |
| | | | | | | | |
| | | | | | | 1,733,172 | |
| | | | | | | | |
| | | | | | | | |
| | | Principal
Amount | | | Value | |
Finance—Auto Loans 0.9% | | | | | | | | |
Ford Motor Credit Co. LLC | | | | | | | | |
3.00%, due 6/12/17 | | $ | 594,000 | | | $ | 610,290 | |
3.875%, due 1/15/15 | | | 2,400,000 | | | | 2,502,823 | |
5.00%, due 5/15/18 | | | 1,000,000 | | | | 1,103,436 | |
5.625%, due 9/15/15 | | | 274,000 | | | | 300,039 | |
5.875%, due 8/2/21 | | | 1,520,000 | | | | 1,770,098 | |
6.625%, due 8/15/17 | | | 800,000 | | | | 934,773 | |
8.00%, due 6/1/14 | | | 222,000 | | | | 242,066 | |
| | | | | | | | |
| | | | | | | 7,463,525 | |
| | | | | | | | |
Finance—Consumer Loans 0.1% | | | | | | | | |
SLM Corp.
6.25%, due 1/25/16 | | | 770,000 | | | | 837,375 | |
| | | | | | | | |
| | |
Finance—Credit Card 0.2% | | | | | | | | |
American Express Co.
6.80%, due 9/1/66 (b) | | | 1,192,000 | | | | 1,279,910 | |
| | | | | | | | |
| |
Finance—Investment Banker/Broker 1.0% | | | | | |
Charles Schwab Corp. (The)
7.00%, due 2/28/49 (b) | | | 676,000 | | | | 773,655 | |
Lazard Group LLC | | | | | | | | |
6.85%, due 6/15/17 | | | 292,000 | | | | 337,498 | |
7.125%, due 5/15/15 | | | 805,000 | | | | 894,905 | |
Raymond James Financial, Inc. | | | | | | | | |
4.25%, due 4/15/16 | | | 1,440,000 | | | | 1,513,986 | |
5.625%, due 4/1/24 | | | 2,911,000 | | | | 3,258,457 | |
TD Ameritrade Holding Corp. | | | | | | | | |
4.15%, due 12/1/14 | | | 900,000 | | | | 959,176 | |
5.60%, due 12/1/19 | | | 512,000 | | | | 607,652 | |
| | | | | | | | |
| | | | | | | 8,345,329 | |
| | | | | | | | |
Food 1.2% | | | | | | | | |
Kraft Foods Group, Inc. | | | | | | | | |
2.25%, due 6/5/17 (a) | | | 1,213,000 | | | | 1,254,625 | |
3.50%, due 6/6/22 (a) | | | 2,498,000 | | | | 2,666,283 | |
5.00%, due 6/4/42 (a) | | | 1,669,000 | | | | 1,876,789 | |
Tyson Foods, Inc. | | | | | | | | |
4.50%, due 6/15/22 | | | 948,000 | | | | 1,026,225 | |
6.60%, due 4/1/16 | | | 2,780,000 | | | | 3,185,727 | |
| | | | | | | | |
| | | | | | | 10,009,649 | |
| | | | | | | | |
Hand & Machine Tools 0.1% | | | | | | | | |
Kennametal, Inc.
2.65%, due 11/1/19 | | | 847,000 | | | | 848,244 | |
| | | | | | | | |
| | |
Health Care—Products 0.1% | | | | | | | | |
Boston Scientific Corp.
4.50%, due 1/15/15 | | | 498,000 | | | | 529,346 | |
| | | | | | | | |
| | | | | | |
The notes to the financial statements are an integral part of,
and should be read in conjunction with, the financial statements. | | mainstayinvestments.com | | | M-295 | |
Portfolio of Investments December 31, 2012 (continued)
| | | | | | | | |
| | | Principal
Amount | | | Value | |
| Corporate Bonds (continued) | |
Health Care—Services 0.1% | | | | | | | | |
Laboratory Corp. of America Holdings
3.75%, due 8/23/22 | | $ | 1,158,000 | | | $ | 1,228,021 | |
| | | | | | | | |
| | |
Home Builders 0.2% | | | | | | | | |
DR Horton, Inc.
4.75%, due 5/15/17 | | | 449,000 | | | | 477,062 | |
MDC Holdings, Inc.
5.375%, due 12/15/14 | | | 559,000 | | | | 598,222 | |
Toll Brothers Finance Corp.
5.875%, due 2/15/22 | | | 306,000 | | | | 347,108 | |
| | | | | | | | |
| | | | | | | 1,422,392 | |
| | | | | | | | |
Insurance 0.9% | | | | | | | | |
American International Group, Inc. | | | | | | | | |
4.25%, due 9/15/14 | | | 1,360,000 | | | | 1,432,623 | |
4.875%, due 6/1/22 | | | 131,000 | | | | 149,552 | |
5.45%, due 5/18/17 | | | 742,000 | | | | 852,198 | |
5.60%, due 10/18/16 | | | 345,000 | | | | 393,977 | |
6.25%, due 3/15/37 | | | 545,000 | | | | 581,788 | |
8.175%, due 5/15/58 (b) | | | 951,000 | | | | 1,238,678 | |
Berkshire Hathaway, Inc.
3.20%, due 2/11/15 | | | 994,000 | | | | 1,046,466 | |
Primerica, Inc.
4.75%, due 7/15/22 | | | 2,018,000 | | | | 2,209,645 | |
| | | | | | | | |
| | | | | | | 7,904,927 | |
| | | | | | | | |
Investment Management/Advisory Services 0.4% | |
Ameriprise Financial, Inc.
7.518%, due 6/1/66 (b) | | | 1,538,000 | | | | 1,684,110 | |
FMR LLC
6.45%, due 11/15/39 (a) | | | 500,000 | | | | 623,428 | |
Neuberger Berman Group LLC / Neuberger Berman Finance Corp. | | | | | | | | |
5.625%, due 3/15/20 (a) | | | 721,000 | | | | 755,247 | |
5.875%, due 3/15/22 (a) | | | 547,000 | | | | 579,820 | |
| | | | | | | | |
| | | | | | | 3,642,605 | |
| | | | | | | | |
Lodging 0.1% | | | | | | | | |
Hyatt Hotels Corp.
5.75%, due 8/15/15 (a) | | | 516,000 | | | | 566,452 | |
Marriott International, Inc.
3.00%, due 3/1/19 | | | 350,000 | | | | 360,222 | |
Starwood Hotels & Resorts Worldwide, Inc.
6.75%, due 5/15/18 | | | 190,000 | | | | 230,993 | |
| | | | | | | | |
| | | | | | | 1,157,667 | |
| | | | | | | | |
Media 0.2% | | | | | | | | |
CC Holdings GS V LLC
2.381%, due 12/15/17 (a) | | | 265,000 | | | | 266,295 | |
Comcast Corp.
3.125%, due 7/15/22 | | | 1,590,000 | | | | 1,656,518 | |
| | | | | | | | |
| | | Principal
Amount | | | Value | |
Media (continued) | | | | | | | | |
Gannett Co., Inc.
6.375%, due 9/1/15 | | $ | 116,000 | | | $ | 127,600 | |
| | | | | | | | |
| | | | | | | 2,050,413 | |
| | | | | | | | |
Metal Fabricate & Hardware 0.2% | | | | | | | | |
Precision Castparts Corp. | | | | | | | | |
1.25%, due 1/15/18 | | | 540,000 | | | | 540,891 | |
2.50%, due 1/15/23 | | | 789,000 | | | | 794,056 | |
3.90%, due 1/15/43 | | | 343,000 | | | | 351,879 | |
| | | | | | | | |
| | | | | | | 1,686,826 | |
| | | | | | | | |
Miscellaneous—Manufacturing 0.3% | | | | | | | | |
Eaton Corp.
2.75%, due 11/2/22 (a) | | | 1,744,000 | | | | 1,738,618 | |
GE Capital Trust I
6.375%, due 11/15/67 (b) | | | 478,000 | | | | 503,692 | |
| | | | | | | | |
| | | | | | | 2,242,310 | |
| | | | | | | | |
Oil & Gas 2.2% | | | | | | | | |
Anadarko Petroleum Corp.
6.45%, due 9/15/36 | | | 1,490,000 | | | | 1,866,623 | |
¨Chevron Corp.
2.355%, due 12/5/22 | | | 2,279,000 | | | | 2,282,740 | |
Cimarex Energy Co.
5.875%, due 5/1/22 | | | 803,000 | | | | 879,285 | |
Continental Resources, Inc.
5.00%, due 9/15/22 | | | 2,259,000 | | | | 2,434,072 | |
Motiva Enterprises LLC
5.75%, due 1/15/20 (a) | | | 804,000 | | | | 974,106 | |
Nabors Industries, Inc.
5.00%, due 9/15/20 | | | 1,990,000 | | | | 2,162,412 | |
PetroHawk Energy Corp. | | | | | | | | |
6.25%, due 6/1/19 | | | 846,000 | | | | 963,337 | |
7.25%, due 8/15/18 | | | 152,000 | | | | 171,600 | |
10.50%, due 8/1/14 | | | 760,000 | | | | 809,400 | |
Phillips 66 | | | | | | | | |
2.95%, due 5/1/17 (a) | | | 2,439,000 | | | | 2,584,942 | |
4.30%, due 4/1/22 (a) | | | 445,000 | | | | 497,251 | |
QEP Resources, Inc.
5.25%, due 5/1/23 | | | 1,128,000 | | | | 1,206,960 | |
Rowan Cos., Inc.
5.00%, due 9/1/17 | | | 554,000 | | | | 615,439 | |
Sunoco Logistics Partners Operations, L.P.
4.65%, due 2/15/22 | | | 584,000 | | | | 636,204 | |
| | | | | | | | |
| | | | | | | 18,084,371 | |
| | | | | | | | |
Packaging & Containers 0.2% | | | | | | | | |
Packaging Corp. of America
3.90%, due 6/15/22 | | | 398,000 | | | | 412,149 | |
| | | | |
| M-296 | | MainStay VP Janus Balanced Portfolio | | The notes to the financial statements are an integral part of,
and should be read in conjunction with, the financial statements. |
| | | | | | | | |
| | | Principal
Amount | | | Value | |
| Corporate Bonds (continued) | |
Packaging & Containers (continued) | | | | | | | | |
Rock-Tenn Co. | | | | | | | | |
4.00%, due 3/1/23 (a) | | $ | 374,000 | | | $ | 379,943 | |
4.45%, due 3/1/19 (a) | | | 278,000 | | | | 299,928 | |
4.90%, due 3/1/22 (a) | | | 532,000 | | | | 574,924 | |
| | | | | | | | |
| | | | | | | 1,666,944 | |
| | | | | | | | |
Pharmaceuticals 2.2% | | | | | | | | |
AbbVie, Inc. | | | | | | | | |
1.75%, due 11/6/17 (a) | | | 1,987,000 | | | | 2,008,613 | |
2.00%, due 11/6/18 (a) | | | 975,000 | | | | 987,602 | |
2.90%, due 11/6/22 (a) | | | 1,202,000 | | | | 1,224,093 | |
4.40%, due 11/6/42 (a) | | | 593,000 | | | | 630,438 | |
¨Express Scripts Holding Co. | | | | | | | | |
2.10%, due 2/12/15 (a) | | | 970,000 | | | | 988,095 | |
2.65%, due 2/15/17 (a) | | | 3,360,000 | | | | 3,492,347 | |
3.125%, due 5/15/16 | | | 766,000 | | | | 807,588 | |
3.90%, due 2/15/22 (a) | | | 802,000 | | | | 864,758 | |
4.75%, due 11/15/21 (a) | | | 1,085,000 | | | | 1,231,285 | |
Medco Health Solutions, Inc.
4.125%, due 9/15/20 | | | 306,000 | | | | 334,431 | |
Watson Pharmaceuticals, Inc. | | | | | | | | |
1.875%, due 10/1/17 | | | 1,551,000 | | | | 1,571,394 | |
3.25%, due 10/1/22 | | | 4,291,000 | | | | 4,380,459 | |
| | | | | | | | |
| | | | | | | 18,521,103 | |
| | | | | | | | |
Pipelines 1.9% | | | | | | | | |
Colorado Interstate Gas Co. LLC
6.85%, due 6/15/37 | | | 392,000 | | | | 476,318 | |
DCP Midstream Operating, L.P. | | | | | | | | |
3.25%, due 10/1/15 | | | 724,000 | | | | 745,079 | |
4.95%, due 4/1/22 | | | 1,591,000 | | | | 1,688,301 | |
El Paso Pipeline Partners Operating Co. LLC | | | | | | | | |
5.00%, due 10/1/21 | | | 566,000 | | | | 641,428 | |
6.50%, due 4/1/20 | | | 196,000 | | | | 238,989 | |
Energy Transfer Partners, L.P.
4.65%, due 6/1/21 | | | 544,000 | | | | 597,710 | |
Kinder Morgan Energy Partners, L.P.
3.45%, due 2/15/23 | | | 917,000 | | | | 944,418 | |
Kinder Morgan Finance Co. ULC
5.70%, due 1/5/16 | | | 1,591,000 | | | | 1,739,172 | |
Magellan Midstream Partners, L.P.
4.25%, due 2/1/21 | | | 696,000 | | | | 768,706 | |
Plains All American Pipeline, L.P. / PAA Finance Corp. | | | | | | | | |
2.85%, due 1/31/23 | | | 589,000 | | | | 583,564 | |
3.95%, due 9/15/15 | | | 1,200,000 | | | | 1,293,020 | |
4.30%, due 1/31/43 | | | 707,000 | | | | 707,631 | |
8.75%, due 5/1/19 | | | 304,000 | | | | 413,565 | |
TC Pipelines, L.P.
4.65%, due 6/15/21 | | | 532,000 | | | | 565,697 | |
| | | | | | | | |
| | | Principal
Amount | | | Value | |
Pipelines (continued) | | | | | | | | |
Western Gas Partners, L.P. | | | | | | | | |
4.00%, due 7/1/22 | | $ | 988,000 | | | $ | 1,039,860 | |
5.375%, due 6/1/21 | | | 2,698,000 | | | | 3,084,866 | |
Williams Cos., Inc. (The)
3.70%, due 1/15/23 | | | 790,000 | | | | 796,837 | |
| | | | | | | | |
| | | | | | | 16,325,161 | |
| | | | | | | | |
Real Estate 0.3% | | | | | | | | |
CBRE Services, Inc.
6.625%, due 10/15/20 | | | 388,000 | | | | 424,375 | |
Jones Lang Lasalle, Inc.
4.40%, due 11/15/22 | | | 1,216,000 | | | | 1,242,209 | |
Post Apartment Homes, L.P.
4.75%, due 10/15/17 | | | 704,000 | | | | 777,945 | |
ProLogis, L.P.
6.875%, due 3/15/20 | | | 135,000 | | | | 163,423 | |
| | | | | | | | |
| | | | | | | 2,607,952 | |
| | | | | | | | |
Real Estate Investment Trusts 1.1% | | | | | | | | |
Alexandria Real Estate Equities, Inc.
4.60%, due 4/1/22 | | | 1,640,000 | | | | 1,760,342 | |
Host Hotels & Resorts, L.P.
Series Q
6.75%, due 6/1/16 | | | 860,000 | | | | 879,350 | |
Reckson Operating Partnership, L.P.
6.00%, due 3/31/16 | | | 395,000 | | | | 433,091 | |
Rouse Co., L.P. (The)
6.75%, due 11/9/15 | | | 2,270,000 | | | | 2,380,662 | |
Senior Housing Properties Trust | | | | | | | | |
6.75%, due 4/15/20 | | | 346,000 | | | | 393,686 | |
6.75%, due 12/15/21 | | | 562,000 | | | | 648,089 | |
SL Green Realty Corp. | | | | | | | | |
5.00%, due 8/15/18 | | | 840,000 | | | | 912,183 | |
7.75%, due 3/15/20 | | | 1,622,000 | | | | 2,016,814 | |
| | | | | | | | |
| | | | | | | 9,424,217 | |
| | | | | | | | |
Retail 0.6% | | | | | | | | |
Brinker International, Inc.
5.75%, due 6/1/14 | | | 1,208,000 | | | | 1,277,812 | |
Macy’s Retail Holdings, Inc. | | | | | | | | |
5.75%, due 7/15/14 | | | 1,343,000 | | | | 1,440,229 | |
5.875%, due 1/15/13 | | | 640,000 | | | | 640,994 | |
5.90%, due 12/1/16 | | | 555,000 | | | | 652,133 | |
6.90%, due 4/1/29 | | | 578,000 | | | | 697,373 | |
| | | | | | | | |
| | | | | | | 4,708,541 | |
| | | | | | | | |
Semiconductors 0.5% | | | | | | | | |
National Semiconductor Corp.
6.60%, due 6/15/17 | | | 1,084,000 | | | | 1,338,709 | |
Samsung Electronics America, Inc.
1.75%, due 4/10/17 (a) | | | 2,987,000 | | | | 3,022,100 | |
| | | | | | | | |
| | | | | | | 4,360,809 | |
| | | | | | | | |
| | | | | | |
The notes to the financial statements are an integral part of,
and should be read in conjunction with, the financial statements. | | mainstayinvestments.com | | | M-297 | |
Portfolio of Investments December 31, 2012 (continued)
| | | | | | | | |
| | | Principal
Amount | | | Value | |
| Corporate Bonds (continued) | |
Software 0.3% | | | | | | | | |
Autodesk, Inc.
3.60%, due 12/15/22 | | $ | 1,053,000 | | | $ | 1,057,644 | |
Fiserv, Inc. | | | | | | | | |
3.125%, due 10/1/15 | | | 716,000 | | | | 750,692 | |
3.125%, due 6/15/16 | | | 426,000 | | | | 447,501 | |
| | | | | | | | |
| | | | | | | 2,255,837 | |
| | | | | | | | |
Telecommunications 0.4% | | | | | | | | |
Qwest Communications International, Inc. 7.125%, due 4/1/18 | | | 2,692,000 | | | | 2,808,841 | |
SBA Tower Trust
2.933%, due 12/15/17 (a) | | | 647,000 | | | | 673,354 | |
| | | | | | | | |
| | | | | | | 3,482,195 | |
| | | | | | | | |
Textiles 0.1% | | | | | | | | |
Cintas Corp. No 2 | | | | | | | | |
2.85%, due 6/1/16 | | | 497,000 | | | | 522,367 | |
4.30%, due 6/1/21 | | | 520,000 | | | | 578,659 | |
| | | | | | | | |
| | | | | | | 1,101,026 | |
| | | | | | | | |
Transportation 0.2% | | | | | | | | |
CSX Transportation, Inc.
8.375%, due 10/15/14 | | | 502,008 | | | | 557,230 | |
JB Hunt Transport Services, Inc.
3.375%, due 9/15/15 | | | 1,090,000 | | | | 1,120,451 | |
| | | | | | | | |
| | | | | | | 1,677,681 | |
| | | | | | | | |
Trucking & Leasing 0.2% | | | | | | | | |
Penske Truck Leasing Co., L.P. / PTL Finance Corp. | | | | | | | | |
2.50%, due 3/15/16 (a) | | | 202,000 | | | | 202,544 | |
3.375%, due 3/15/18 (a) | | | 1,251,000 | | | | 1,262,217 | |
| | | | | | | | |
| | | | | | | 1,464,761 | |
| | | | | | | | |
Total Corporate Bonds
(Cost $192,284,025) | | | | | | | 200,090,536 | |
| | | | | | | | |
|
| Loan Assignments & Participations 0.2% (d) | |
Hotels, Motels, Inns & Gaming 0.2% | | | | | | | | |
MGM Resorts International
Term Loan B
4.25%, due 12/20/19 | | | 1,280,000 | | | | 1,292,800 | |
| | | | | | | | |
Total Loan Assignments & Participations
(Cost $1,273,600) | | | | | | | 1,292,800 | |
| | | | | | | | |
|
| Mortgage-Backed Securities 0.6% | |
Agency Collateral (Collateralized Mortgage Obligations) 0.2% | |
FREMF Mortgage Trust (Collateralized Mortgage Obligations) | | | | | | | | |
Series 2011-K13, Class B
4.572%, due 1/25/48 (a)(e) | | $ | 500,000 | | | $ | 535,507 | |
| | | | | | | | |
| | | Principal
Amount | | | Value | |
| Mortgage-Backed Securities (continued) | |
Agency Collateral (Collateralized Mortgage Obligations) (continued) | |
Series 2011-K16, Class B
4.594%, due 11/25/46 (a)(e) | | $ | 200,000 | | | $ | 213,297 | |
Series 2011-K15, Class B
4.932%, due 8/25/44 (a)(e) | | | 490,000 | | | | 543,005 | |
Series 2011-K14, Class B
5.159%, due 2/25/47 (a)(e) | | | 340,000 | | | | 377,598 | |
| | | | | | | | |
| | | | | | | 1,669,407 | |
| | | | | | | | |
Commercial Mortgage Loans
(Collateralized Mortgage Obligations) 0.4% | |
Banc of America Large Loan Trust
2007-BMB1
Series 2007-BMB1, Class C
1.309%, due 8/15/29 (a)(b) | | | 173,000 | | | | 166,182 | |
BB-UBS Trust
Series 2012-TFT, Class C
3.468%, due 6/5/30 (a)(e) | | | 571,000 | | | | 541,888 | |
Fontainebleau Miami Beach Trust
Series 2012-FBLU, Class A
2.887%, due 5/5/27 (a) | | | 331,000 | | | | 342,323 | |
Fremf Mortgage Trust
Series 2012-KF01, Class B
2.812%, due 10/25/44 (a)(e) | | | 458,000 | | | | 460,644 | |
GS Mortgage Securities Corp. II
Series 2012-ALOH, Class A
3.551%, due 4/10/34 (a) | | | 1,366,000 | | | | 1,475,594 | |
GS Mortgage Securities Trust
Series 2012-BWTR, Class A
2.954%, due 11/5/34 | | | 235,000 | | | | 238,718 | |
JP Morgan Chase Commercial Mortgage Securities Corp.
Series 2006-LDP7, Class A4
5.871%, due 4/15/45 (e) | | | 370,000 | | | | 425,801 | |
| | | | | | | | |
| | | | | | | 3,651,150 | |
| | | | | | | | |
Total Mortgage-Backed Securities
(Cost $4,982,554) | | | | | | | 5,320,557 | |
| | | | | | | | |
|
| U.S. Government & Federal Agencies 16.9% | |
Federal Home Loan Mortgage Corporation
(Mortgage Pass-Through Securities) 1.3% | |
4.50%, due 1/1/41 | | | 702,457 | | | | 786,729 | |
5.00%, due 1/1/19 | | | 384,749 | | | | 413,944 | |
5.00%, due 2/1/19 | | | 259,020 | | | | 278,674 | |
5.00%, due 1/1/36 | | | 1,380,796 | | | | 1,546,230 | |
5.00%, due 11/1/36 | | | 475,027 | | | | 512,939 | |
5.00%, due 5/1/39 | | | 1,333,117 | | | | 1,467,510 | |
5.00%, due 5/1/41 | | | 1,552,786 | | | | 1,749,016 | |
5.50%, due 8/1/19 | | | 342,501 | | | | 368,356 | |
5.50%, due 12/1/28 | | | 1,138,816 | | | | 1,248,119 | |
5.50%, due 10/1/36 | | | 791,081 | | | | 883,660 | |
| | | | |
| M-298 | | MainStay VP Janus Balanced Portfolio | | The notes to the financial statements are an integral part of,
and should be read in conjunction with, the financial statements. |
| | | | | | | | |
| | | Principal
Amount | | | Value | |
| U.S. Government & Federal Agencies (continued) | |
Federal Home Loan Mortgage Corporation
(Mortgage Pass-Through Securities) (continued) | |
5.50%, due 5/1/38 | | $ | 260,867 | | | $ | 288,820 | |
5.50%, due 1/1/39 | | | 572,815 | | | | 623,275 | |
5.50%, due 10/1/39 | | | 697,292 | | | | 772,010 | |
| | | | | | | | |
| | | | | | | 10,939,282 | |
| | | | | | | | |
¨Federal National Mortgage Association
(Mortgage Pass-Through Securities) 3.6% | |
4.50%, due 10/1/40 | | | 313,624 | | | | 352,906 | |
5.00%, due 9/1/33 | | | 603,425 | | | | 683,453 | |
5.00%, due 11/1/33 | | | 196,320 | | | | 213,891 | |
5.00%, due 12/1/33 | | | 378,400 | | | | 412,267 | |
5.00%, due 2/1/34 | | | 212,120 | | | | 231,104 | |
5.00%, due 10/1/35 | | | 515,799 | | | | 558,639 | |
5.00%, due 2/1/40 | | | 806,957 | | | | 889,770 | |
5.00%, due 6/1/40 | | | 1,245,153 | | | | 1,375,900 | |
5.00%, due 3/1/41 | | | 318,604 | | | | 353,690 | |
5.00%, due 4/1/41 | | | 1,429,377 | | | | 1,614,459 | |
5.00%, due 6/1/41 | | | 819,677 | | | | 903,795 | |
5.50%, due 1/1/25 | | | 379,715 | | | | 411,376 | |
5.50%, due 1/1/33 | | | 233,873 | | | | 258,714 | |
5.50%, due 4/1/34 | | | 664,252 | | | | 730,033 | |
5.50%, due 9/1/34 | | | 1,186,015 | | | | 1,297,535 | |
5.50%, due 5/1/35 | | | 433,473 | | | | 473,690 | |
5.50%, due 7/1/35 | | | 2,740,628 | | | | 2,998,328 | |
5.50%, due 1/1/36 | | | 536,044 | | | | 585,777 | |
5.50%, due 7/1/36 | | | 1,288,008 | | | | 1,409,119 | |
5.50%, due 5/1/37 | | | 1,961,221 | | | | 2,169,536 | |
5.50%, due 7/1/37 | | | 311,773 | | | | 338,799 | |
5.50%, due 3/1/38 | | | 348,545 | | | | 385,566 | |
6.00%, due 10/1/35 | | | 1,250,911 | | | | 1,378,307 | |
6.00%, due 12/1/35 | | | 1,202,522 | | | | 1,345,539 | |
6.00%, due 2/1/37 | | | 192,306 | | | | 219,613 | |
6.00%, due 3/1/37 | | | 314,472 | | | | 346,499 | |
6.00%, due 5/1/37 | | | 320,144 | | | | 350,498 | |
6.00%, due 11/1/38 | | | 1,184,853 | | | | 1,304,195 | |
6.00%, due 1/1/39 | | | 2,665,924 | | | | 2,916,753 | |
6.00%, due 10/1/39 | | | 1,461,703 | | | | 1,628,699 | |
6.00%, due 7/1/40 | | | 1,993,207 | | | | 2,235,752 | |
| | | | | | | | |
| | | | | | | 30,374,202 | |
| | | | | | | | |
¨Government National Mortgage Association
(Mortgage Pass-Through Securities) 2.4% | |
3.50%, due 5/20/42 | | | 331,467 | | | | 362,252 | |
4.50%, due 7/15/41 | | | 215,326 | | | | 237,945 | |
5.00%, due 4/15/39 | | | 428,818 | | | | 470,244 | |
5.00%, due 10/15/39 | | | 524,656 | | | | 580,718 | |
5.00%, due 11/15/39 | | | 818,459 | | | | 904,497 | |
5.00%, due 1/15/40 | | | 273,203 | | | | 299,862 | |
5.00%, due 4/15/40 | | | 536,747 | | | | 601,037 | |
5.00%, due 5/15/40 | | | 357,223 | | | | 396,868 | |
| | | | | | | | |
| | | Principal
Amount | | | Value | |
Government National Mortgage Association
(Mortgage Pass-Through Securities) (continued) | |
5.00%, due 5/20/40 | | $ | 202,345 | | | $ | 224,226 | |
5.00%, due 7/15/40 | | | 1,183,430 | | | | 1,305,449 | |
5.00%, due 2/15/41 | | | 846,872 | | | | 937,240 | |
5.00%, due 5/15/41 | | | 376,069 | | | | 414,987 | |
5.00%, due 10/20/41 | | | 727,326 | | | | 803,271 | |
5.50%, due 9/15/35 | | | 130,274 | | | | 146,958 | |
5.50%, due 3/15/36 | | | 657,461 | | | | 726,419 | |
5.50%, due 5/20/36 | | | 552,649 | | | | 610,355 | |
5.50%, due 4/20/41 | | | 759,268 | | | | 833,329 | |
5.50%, due 9/20/41 | | | 130,860 | | | | 143,624 | |
5.50%, due 1/20/42 | | | 861,335 | | | | 946,429 | |
6.00%, due 11/20/34 | | | 534,108 | | | | 600,754 | |
6.00%, due 10/20/41 | | | 156,629 | | | | 174,803 | |
6.00%, due 12/20/41 | | | 1,800,522 | | | | 2,009,436 | |
6.00%, due 1/20/42 | | | 1,787,772 | | | | 1,995,207 | |
6.00%, due 2/20/42 | | | 1,675,113 | | | | 1,869,477 | |
6.00%, due 3/20/42 | | | 292,518 | | | | 326,458 | |
6.00%, due 4/20/42 | | | 1,451,968 | | | | 1,620,440 | |
6.00%, due 5/20/42 | | | 621,406 | | | | 693,508 | |
| | | | | | | | |
| | | | | | | 20,235,793 | |
| | | | | | | | |
United States Treasury Bonds 0.7% | | | | | | | | |
2.75%, due 8/15/42 | | | 5,110,000 | | | | 4,934,344 | |
2.75%, due 11/15/42 | | | 722,000 | | | | 695,602 | |
3.00%, due 5/15/42 | | | 275,000 | | | | 280,156 | |
| | | | | | | | |
| | | | | | | 5,910,102 | |
| | | | | | | | |
¨United States Treasury Notes 8.9% | | | | | | | | |
0.25%, due 3/31/14 | | | 10,366,000 | | | | 10,370,862 | |
0.25%, due 5/31/14 | | | 3,809,000 | | | | 3,810,786 | |
0.25%, due 8/31/14 | | | 4,731,000 | | | | 4,732,292 | |
0.25%, due 9/15/14 | | | 1,225,000 | | | | 1,225,287 | |
0.25%, due 9/30/14 | | | 3,779,000 | | | | 3,779,884 | |
0.25%, due 10/31/14 | | | 550,000 | | | | 550,129 | |
0.25%, due 11/30/14 | | | 725,000 | | | | 725,028 | |
0.25%, due 1/15/15 | | | 1,352,000 | | | | 1,351,578 | |
0.25%, due 7/15/15 | | | 4,078,000 | | | | 4,071,308 | |
0.375%, due 3/15/15 | | | 14,867,000 | | | | 14,897,195 | |
0.375%, due 6/15/15 | | | 380,000 | | | | 380,594 | |
0.75%, due 6/30/17 | | | 6,067,000 | | | | 6,103,026 | |
0.75%, due 10/31/17 | | | 570,000 | | | | 571,870 | |
0.875%, due 1/31/17 | | | 2,824,000 | | | | 2,861,505 | |
0.875%, due 2/28/17 | | | 232,000 | | | | 235,045 | |
1.00%, due 9/30/19 | | | 1,200,000 | | | | 1,191,750 | |
1.625%, due 8/15/22 | | | 4,240,000 | | | | 4,212,177 | |
1.625%, due 11/15/22 | | | 5,405,000 | | | | 5,345,880 | |
2.125%, due 8/15/21 | | | 2,463,000 | | | | 2,589,229 | |
3.125%, due 5/15/21 | | | 4,660,000 | | | | 5,284,365 | |
| | | | | | | | |
| | | | | | | 74,289,790 | |
| | | | | | | | |
Total U.S. Government & Federal Agencies
(Cost $141,732,023) | | | | | | | 141,749,169 | |
| | | | | | | | |
| | | | | | |
The notes to the financial statements are an integral part of,
and should be read in conjunction with, the financial statements. | | mainstayinvestments.com | | | M-299 | |
Portfolio of Investments December 31, 2012 (continued)
| | | | | | | | |
| | | Principal
Amount | | | Value | |
| Yankee Bonds 2.5% (f) | |
Advertising 0.1% | | | | | | | | |
WPP Finance 2010 | | | | | | | | |
3.625%, due 9/7/22 | | $ | 304,000 | | | $ | 302,379 | |
4.75%, due 11/21/21 | | | 460,000 | | | | 498,224 | |
| | | | | | | | |
| | | | | | | 800,603 | |
| | | | | | | | |
Banks 0.2% | | | | | | | | |
Mizuho Corporate Bank, Ltd.
2.95%, due 10/17/22 (a) | | | 1,312,000 | | | | 1,295,894 | |
Royal Bank of Scotland Group PLC
2.55%, due 9/18/15 | | | 284,000 | | | | 290,648 | |
| | | | | | | | |
| | | | | | | 1,586,542 | |
| | | | | | | | |
Beverages 0.1% | | | | | | | | |
Heineken N.V.
1.40%, due 10/1/17 (a) | | | 555,000 | | | | 553,324 | |
| | | | | | | | |
| | |
Building Materials 0.1% | | | | | | | | |
Hanson PLC
6.125%, due 8/15/16 | | | 1,003,000 | | | | 1,100,792 | |
| | | | | | | | |
| | |
Chemicals 0.4% | | | | | | | | |
LyondellBasell Industries N.V. | | | | | | | | |
5.00%, due 4/15/19 | | | 2,184,000 | | | | 2,413,320 | |
6.00%, due 11/15/21 | | | 703,000 | | | | 824,267 | |
| | | | | | | | |
| | | | | | | 3,237,587 | |
| | | | | | | | |
Computers 0.1% | | | | | | | | |
Seagate Technology
10.00%, due 5/1/14 (a) | | | 914,000 | | | | 983,692 | |
| | | | | | | | |
| | |
Electric 0.2% | | | | | | | | |
PPL WEM Holdings PLC | | | | | | | | |
3.90%, due 5/1/16 (a) | | | 735,000 | | | | 773,995 | |
5.375%, due 5/1/21 (a) | | | 436,000 | | | | 490,368 | |
| | | | | | | | |
| | | | | | | 1,264,363 | |
| | | | | | | | |
Finance—Mortgage Loan/Banker 0.2% | | | | | | | | |
Northern Rock Asset Management PLC
5.625%, due 6/22/17 (a) | | | 1,200,000 | | | | 1,394,327 | |
| | | | | | | | |
| | |
Media 0.1% | | | | | | | | |
UBM PLC
5.75%, due 11/3/20 (a) | | | 1,157,000 | | | | 1,220,560 | |
| | | | | | | | |
| | |
Oil & Gas 0.4% | | | | | | | | |
Shell International Finance B.V.
2.375%, due 8/21/22 | | | 3,319,000 | | | | 3,334,530 | |
| | | | | | | | |
| | | | | | | | |
| | | Principal
Amount | | | Value | |
Real Estate Investment Trusts 0.3% | | | | | | | | |
Goodman Funding Pty, Ltd. | | | | | | | | |
6.375%, due 11/12/20 (a) | | $ | 750,000 | | | $ | 850,339 | |
6.375%, due 4/15/21 (a) | | | 1,750,000 | | | | 1,988,133 | |
| | | | | | | | |
| | | | | | | 2,838,472 | |
| | | | | | | | |
Telecommunications 0.1% | | | | | | | | |
Virgin Media Finance PLC
4.875%, due 2/15/22 | | | 453,000 | | | | 463,193 | |
| | | | | | | | |
| | |
Transportation 0.2% | | | | | | | | |
Asciano Finance, Ltd.
3.125%, due 9/23/15 (a) | | | 196,000 | | | | 200,756 | |
Kansas City Southern de Mexico
S.A. de C.V. | | | | | | | | |
6.625%, due 12/15/20 | | | 452,000 | | | | 513,020 | |
8.00%, due 2/1/18 | | | 1,062,000 | | | | 1,170,855 | |
| | | | | | | | |
| | | | | | | 1,884,631 | |
| | | | | | | | |
Total Yankee Bonds
(Cost $19,928,602) | | | | | | | 20,662,616 | |
| | | | | | | | |
Total Long-Term Bonds
(Cost $362,124,594) | | | | | | | 371,075,706 | |
| | | | | | | | |
| | |
| | | | | | | | |
| | |
Shares | | | | |
| Common Stocks 54.9% | |
Aerospace & Defense 1.6% | | | | | | | | |
Boeing Co. (The) | | | 177,634 | | | | 13,386,498 | |
| | | | | | | | |
| | |
Agriculture 2.6% | | | | | | | | |
Altria Group, Inc. | | | 193,511 | | | | 6,080,116 | |
¨Philip Morris International, Inc. | | | 189,666 | | | | 15,863,664 | |
| | | | | | | | |
| | | | | | | 21,943,780 | |
| | | | | | | | |
Apparel 1.9% | | | | | | | | |
Coach, Inc. | | | 111,592 | | | | 6,194,472 | |
NIKE, Inc. Class B | | | 185,494 | | | | 9,571,490 | |
| | | | | | | | |
| | | | | | | 15,765,962 | |
| | | | | | | | |
Auto Manufacturers 0.3% | | | | | | | | |
Daimler A.G. | | | 52,531 | | | | 2,887,629 | |
| | | | | | | | |
| | |
Banks 3.5% | | | | | | | | |
¨CIT Group, Inc. (g) | | | 247,304 | | | | 9,555,827 | |
Standard Chartered PLC | | | 246,225 | | | | 6,241,475 | |
U.S. Bancorp | | | 416,780 | | | | 13,311,953 | |
| | | | | | | | |
| | | | | | | 29,109,255 | |
| | | | | | | | |
| | | | |
| M-300 | | MainStay VP Janus Balanced Portfolio | | The notes to the financial statements are an integral part of,
and should be read in conjunction with, the financial statements. |
| | | | | | | | |
| | |
Shares | | | Value | |
| Common Stocks (continued) | |
Beverages 0.4% | | | | | | | | |
Diageo PLC | | | 117,337 | | | $ | 3,415,976 | |
| | | | | | | | |
| | |
Chemicals 3.8% | | | | | | | | |
¨E.I. du Pont de Nemours & Co. | | | 310,336 | | | | 13,955,810 | |
LyondellBasell Industries, N.V., Class A | | | 225,837 | | | | 12,893,034 | |
Syngenta A.G., ADR (h) | | | 57,647 | | | | 4,657,878 | |
| | | | | | | | |
| | | | | | | 31,506,722 | |
| | | | | | | | |
Commercial Services 1.4% | | | | | | | | |
MasterCard, Inc. Class A | | | 19,436 | | | | 9,548,518 | |
Western Union Co. (The) | | | 163,645 | | | | 2,227,209 | |
| | | | | | | | |
| | | | | | | 11,775,727 | |
| | | | | | | | |
Computers 2.3% | | | | | | | | |
¨Apple, Inc. | | | 35,969 | | | | 19,172,556 | |
| | | | | | | | |
| | |
Cosmetics & Personal Care 0.5% | | | | | | | | |
Estee Lauder Cos., Inc. (The) Class A | | | 73,208 | | | | 4,382,231 | |
| | | | | | | | |
| | |
Diversified Financial Services 1.1% | | | | | | | | |
Blackstone Group L.P. (The) | | | 578,119 | | | | 9,012,875 | |
| | | | | | | | |
| | |
Electronics 2.4% | | | | | | | | |
Amphenol Corp. Class A | | | 50,788 | | | | 3,285,984 | |
Honeywell International, Inc. | | | 96,277 | | | | 6,110,701 | |
TE Connectivity, Ltd. | | | 288,062 | | | | 10,692,861 | |
| | | | | | | | |
| | | | | | | 20,089,546 | |
| | | | | | | | |
Finance—Investment Banker/Broker 0.2% | | | | | |
Greenhill & Co., Inc. | | | 30,044 | | | | 1,561,988 | |
| | | | | | | | |
| | |
Finance—Other Services 1.3% | | | | | | | | |
NYSE Euronext | | | 342,553 | | | | 10,804,122 | |
| | | | | | | | |
| | |
Food 0.8% | | | | | | | | |
Hershey Co. (The) | | | 91,368 | | | | 6,598,597 | |
| | | | | | | | |
| | |
Health Care—Services 1.2% | | | | | | | | |
Aetna, Inc. | | | 219,483 | | | | 10,162,063 | |
| | | | | | | | |
| | |
Insurance 0.5% | | | | | | | | |
Prudential PLC | | | 319,911 | | | | 4,463,808 | |
| | | | | | | | |
| | |
Internet 1.4% | | | | | | | | |
eBay, Inc. (g) | | | 166,286 | | | | 8,483,912 | |
Priceline.com, Inc. (g) | | | 4,716 | | | | 2,929,579 | |
| | | | | | | | |
| | | | | | | 11,413,491 | |
| | | | | | | | |
Lodging 1.1% | | | | | | | | |
Las Vegas Sands Corp. | | | 197,401 | | | | 9,112,030 | |
| | | | | | | | |
| | | | | | | | |
| | |
Shares | | | Value | |
Media 4.6% | | | | | | | | |
¨CBS Corp. Class B | | | 397,928 | | | $ | 15,141,161 | |
DIRECTV (g) | | | 90,533 | | | | 4,541,135 | |
Time Warner Cable, Inc. | | | 132,580 | | | | 12,885,450 | |
Viacom, Inc. Class B | | | 114,169 | | | | 6,021,273 | |
| | | | | | | | |
| | | | | �� | | 38,589,019 | |
| | | | | | | | |
Metal Fabricate & Hardware 0.4% | | | | | | | | |
Precision Castparts Corp. | | | 19,972 | | | | 3,783,096 | |
| | | | | | | | |
| | |
Mining 0.5% | | | | | | | | |
Freeport-McMoRan Copper & Gold, Inc. | | | 133,240 | | | | 4,556,808 | |
| | | | | | | | |
| | |
Miscellaneous—Manufacturing 0.3% | | | | | | | | |
Dover Corp. | | | 39,135 | | | | 2,571,561 | |
| | | | | | | | |
| | |
Oil & Gas 3.1% | | | | | | | | |
¨Chevron Corp. | | | 127,930 | | | | 13,834,350 | |
Hess Corp. | | | 192,882 | | | | 10,215,031 | |
Valero Energy Corp. | | | 56,651 | | | | 1,932,932 | |
| | | | | | | | |
| | | | | | | 25,982,313 | |
| | | | | | | | |
Oil & Gas Services 0.6% | | | | | | | | |
National-Oilwell Varco, Inc. | | | 69,582 | | | | 4,755,930 | |
| | | | | | | | |
| | |
Pharmaceuticals 6.5% | | | | | | | | |
Abbott Laboratories | | | 37,791 | | | | 2,475,310 | |
AbbVie, Inc. (g) | | | 37,791 | | | | 1,290,941 | |
Allergan, Inc. | | | 70,117 | | | | 6,431,832 | |
AmerisourceBergen Corp. | | | 114,142 | | | | 4,928,652 | |
Bristol-Myers Squibb Co. | | | 192,022 | | | | 6,257,997 | |
¨Express Scripts Holding Co. (g) | | | 214,954 | | | | 11,607,516 | |
Johnson & Johnson | | | 39,212 | | | | 2,748,761 | |
Mylan, Inc. (g) | | | 259,023 | | | | 7,117,952 | |
Shire PLC, Sponsored ADR (h) | | | 71,495 | | | | 6,590,409 | |
Valeant Pharmaceuticals International, Inc. (g) | | | 91,575 | | | | 5,473,438 | |
| | | | | | | | |
| | | | | | | 54,922,808 | |
| | | | | | | | |
Pipelines 1.3% | | | | | | | | |
Enterprise Products Partners, L.P. | | | 216,109 | | | | 10,822,739 | |
| | | | | | | | |
| | |
Real Estate Investment Trusts 0.7% | | | | | | | | |
Ventas, Inc. | | | 92,547 | | | | 5,989,642 | |
| | | | | | | | |
| | |
Retail 1.9% | | | | | | | | |
AutoZone, Inc. (g) | | | 9,530 | | | | 3,377,718 | |
Home Depot, Inc. (The) | | | 58,655 | | | | 3,627,811 | |
McDonald’s Corp. | | | 39,804 | | | | 3,511,111 | |
Nordstrom, Inc. | | | 109,600 | | | | 5,863,600 | |
| | | | | | | | |
| | | | | | | 16,380,240 | |
| | | | | | | | |
| | | | | | |
The notes to the financial statements are an integral part of,
and should be read in conjunction with, the financial statements. | | mainstayinvestments.com | | | M-301 | |
Portfolio of Investments December 31, 2012 (continued)
| | | | | | | | |
| | |
Shares | | | Value | |
| Common Stocks (continued) | |
Software 1.6% | | | | | | | | |
CA, Inc. | | | 117,644 | | | $ | 2,585,815 | |
Intuit, Inc. | | | 81,411 | | | | 4,843,954 | |
Microsoft Corp. | | | 227,230 | | | | 6,073,858 | |
| | | | | | | | |
| | | | | | | 13,503,627 | |
| | | | | | | | |
Telecommunications 1.9% | | | | | | | | |
CenturyLink, Inc. | | | 179,434 | | | | 7,019,458 | |
Motorola Solutions, Inc. | | | 124,682 | | | | 6,942,294 | |
Verizon Communications, Inc. | | | 39,130 | | | | 1,693,155 | |
| | | | | | | | |
| | | | | | | 15,654,907 | |
| | | | | | | | |
Toys, Games & Hobbies 1.3% | | | | | | | | |
Mattel, Inc. | | | 305,398 | | | | 11,183,675 | |
| | | | | | | | |
| | |
Transportation 1.9% | | | | | | | | |
Canadian Pacific Railway, Ltd. | | | 40,706 | | | | 4,136,544 | |
Union Pacific Corp. | | | 92,444 | | | | 11,622,059 | |
| | | | | | | | |
| | | | | | | 15,758,603 | |
| | | | | | | | |
Total Common Stocks
(Cost $441,407,760) | | | | | | | 461,019,824 | |
| | | | | | | | |
|
| Preferred Stocks 0.4% | |
Banks 0.1% | | | | | | | | |
Goldman Sachs Group, Inc. (The)
5.95% (g) | | | 42,190 | | | | 1,053,906 | |
| | | | | | | | |
| | |
Diversified Financial Services 0.2% | | | | | | | | |
Citigroup Capital XIII
7.88% (b) | | | 18,000 | | | | 502,200 | |
Discover Financial Services
6.50% | | | 57,275 | | | | 1,446,194 | |
| | | | | | | | |
| | |
Food 0.1% | | | | | | | | |
HJ Heinz Finance Co.
8.00% (a) | | | 4 | | | | 419,500 | |
| | | | | | | | |
Total Preferred Stocks
(Cost $3,410,591) | | | | | | | 3,421,800 | |
| | | | | | | | |
| | | | | | | | |
| | | Principal
Amount | | | Value | |
| Short-Term Investment 0.2% | |
Repurchase Agreement 0.2% | | | | | | | | |
State Street Bank and Trust Co.
0.01%, dated 12/31/12
due 1/2/13
Proceeds at Maturity $1,642,399 (Collateralized by a Federal National Mortgage Association security with a rate of 2.14% and a maturity date of 11/7/22, with a Principal Amount of $1,670,000 and a Market Value of $1,676,842) | | $ | 1,642,398 | | | $ | 1,642,398 | |
| | | | | | | | |
Total Short-Term Investment
(Cost $1,642,398) | | | | | | | 1,642,398 | |
| | | | | | | | |
Total Investments
(Cost $808,585,343) (i) | | | 99.7 | % | | | 837,159,728 | |
Other Assets, Less Liabilities | | | 0.3 | | | | 2,920,814 | |
Net Assets | | | 100.0 | % | | $ | 840,080,542 | |
| ‡ | Less than one-tenth of a percent. |
| (a) | May be sold to institutional investors only under Rule 144A or securities offered pursuant to Section 4(2) of the Securities Act of 1933, as amended. |
| (b) | Floating rate—Rate shown is the rate in effect as of December 31, 2012. |
| (c) | Illiquid security. The total market value of this security as of December 31, 2012 is $1,016,260, which represents 0.1% of the Portfolio’s net assets. |
| (d) | Floating Rate Loan—generally pays interest at rates which are periodically re-determined at a margin above the London InterBank Offered Rate or other short-term rates. The rate shown is the rate(s) in effect as of December 31, 2012. Floating Rate Loans are generally considered restricted in that the Portfolio is ordinarily contractually obligated to receive consent from the Agent Bank and/or borrower prior to disposition of a Floating Rate Loan. |
| (e) | Collateral strip rate—Bond whose interest is based on the weighted net interest rate of the collateral. Coupon rate adjusts periodically based on a predetermined schedule. Rate shown is the rate in effect as of December 31, 2012. |
| (f) | Yankee Bond—Dollar-denominated bond issued in the United States by a foreign bank or corporation. |
| (g) | Non-income producing security. |
| (h) | ADR—American Depositary Receipt. |
| (i) | As of December 31, 2012, cost is $808,047,850 for federal income tax purposes and net unrealized appreciation is as follows: |
| | | | |
Gross unrealized appreciation | | $ | 42,153,850 | |
Gross unrealized depreciation | | | (13,041,972 | ) |
| | | | |
Net unrealized appreciation | | $ | 29,111,878 | |
| | | | |
| | | | |
| M-302 | | MainStay VP Janus Balanced Portfolio | | The notes to the financial statements are an integral part of,
and should be read in conjunction with, the financial statements. |
The following is a summary of the fair valuations according to the inputs used as of December 31, 2012, for valuing the Portfolio’s assets.
Asset Valuation Inputs
| | | | | | | | | | | | | | | | |
Description | | Quoted Prices
in Active Markets
for Identical Assets
(Level 1) | | | Significant Other
Observable Inputs
(Level 2) | | | Significant
Unobservable
Inputs
(Level 3) | | | Total | |
| Investments in Securities (a) | | | | | | | | | | | | | | | | |
| Long-Term Bonds | | | | | | | | | | | | | | | | |
Asset-Backed Securities | | $ | — | | | $ | 1,960,028 | | | $ | — | | | $ | 1,960,028 | |
Corporate Bonds | | | — | | | | 200,090,536 | | | | — | | | | 200,090,536 | |
Loan Assignments & Participations | | | — | | | | 1,292,800 | | | | — | | | | 1,292,800 | |
Mortgage-Backed Securities | | | — | | | | 5,320,557 | | | | — | | | | 5,320,557 | |
U.S. Government & Federal Agencies | | | — | | | | 141,749,169 | | | | — | | | | 141,749,169 | |
Yankee Bonds | | | — | | | | 20,662,616 | | | | — | | | | 20,662,616 | |
| | | | | | | | | | | | | | | | |
| Total Long-Term Bonds | | | — | | | | 371,075,706 | | | | — | | | | 371,075,706 | |
| | | | | | | | | | | | | | | | |
| Common Stocks | | | | | | | | | | | | | | | | |
Banks | | | 22,867,780 | | | | 6,241,475 | | | | — | | | | 29,109,255 | |
Beverages | | | — | | | | 3,415,976 | | | | — | | | | 3,415,976 | |
Insurance | | | — | | | | 4,463,808 | | | | — | | | | 4,463,808 | |
All Other Industries | | | 424,030,785 | | | | — | | | | — | | | | 424,030,785 | |
| | | | | | | | | | | | | | | | |
| Total Common Stocks | | | 446,898,565 | | | | 14,121,259 | | | | — | | | | 461,019,824 | |
| | | | | | | | | | | | | | | | |
| Preferred Stocks | | | 3,421,800 | | | | — | | | | — | | | | 3,421,800 | |
| Short-Term Investment | | | | | | | | | | | | | | | | |
Repurchase Agreement | | | — | | | | 1,642,398 | | | | — | | | | 1,642,398 | |
| | | | | | | | | | | | | | | | |
| Total Investments in Securities | | $ | 450,320,365 | | | $ | 386,839,363 | | | $ | — | | | $ | 837,159,728 | |
| | | | | | | | | | | | | | | | |
(a) For a complete listing of investments and their industries, see the Portfolio of Investments.
The Portfolio recognizes transfers between the levels as of the beginning of the period.
As of December 31, 2012, the Portfolio did not hold any investments with significant unobservable inputs (Level 3). (See Note 2)
| | | | | | |
The notes to the financial statements are an integral part of,
and should be read in conjunction with, the financial statements. | | mainstayinvestments.com | | | M-303 | |
Statement of Assets and Liabilities as of December 31, 2012
| | | | |
| Assets | |
Investment in securities, at value
(identified cost $808,585,343) | | $ | 837,159,728 | |
Receivables: | | | | |
Dividends and interest | | | 3,289,214 | |
Fund shares sold | | | 467,723 | |
Investment securities sold | | | 271,051 | |
Other assets | | | 2,208 | |
| | | | |
Total assets | | | 841,189,924 | |
| | | | |
| |
| Liabilities | | | | |
Payables: | | | | |
Manager (See Note 3) | | | 370,424 | |
Fund shares redeemed | | | 362,633 | |
Investment securities purchased | | | 182,394 | |
NYLIFE Distributors (See Note 3) | | | 79,513 | |
Shareholder communication | | | 66,762 | |
Professional fees | | | 41,828 | |
Custodian | | | 4,623 | |
Trustees | | | 1,205 | |
| | | | |
Total liabilities | | | 1,109,382 | |
| | | | |
Net assets | | $ | 840,080,542 | |
| | | | |
| |
| Net Assets Consist of | | | | |
Shares of beneficial interest outstanding (par value of $.001 per share) unlimited number of shares authorized | | $ | 79,708 | |
Additional paid-in capital | | | 796,719,170 | |
| | | | |
| | | 796,798,878 | |
Undistributed net investment income | | | 12,705,857 | |
Accumulated net realized gain (loss) on investments and foreign currency transactions | | | 2,001,427 | |
Net unrealized appreciation (depreciation) on investments | | | 28,574,385 | |
Net unrealized appreciation (depreciation) on translation of other assets and liabilities in foreign currencies | | | (5 | ) |
| | | | |
Net assets | | $ | 840,080,542 | |
| | | | |
| | | | |
Initial Class | | | | |
Net assets applicable to outstanding shares | | $ | 461,363,477 | |
| | | | |
Shares of beneficial interest outstanding | | | 43,732,308 | |
| | | | |
Net asset value per share outstanding | | $ | 10.55 | |
| | | | |
Service Class | | | | |
Net assets applicable to outstanding shares | | $ | 378,717,065 | |
| | | | |
Shares of beneficial interest outstanding | | | 35,976,168 | |
| | | | |
Net asset value per share outstanding | | $ | 10.53 | |
| | | | |
| | | | |
| M-304 | | MainStay VP Janus Balanced Portfolio | | The notes to the financial statements are an integral part of,
and should be read in conjunction with, the financial statements. |
Statement of Operations
for the period February 17, 2012 (inception date) through December 31, 2012
| | | | |
| Investment Income (Loss) | | | | |
Income | | | | |
Dividends (a) | | $ | 9,796,438 | |
Interest | | | 8,763,165 | |
| | | | |
Total income | | | 18,559,603 | |
| | | | |
Expenses | | | | |
Manager (See Note 3) | | | 3,934,110 | |
Distribution and service—Service Class (See Note 3) | | | 758,499 | |
Shareholder communication | | | 139,966 | |
Professional fees | | | 83,478 | |
Custodian | | | 29,044 | |
Trustees | | | 17,617 | |
Miscellaneous | | | 37,553 | |
| | | | |
Total expenses before waiver/reimbursement | | | 5,000,267 | |
Expense waiver/reimbursement from Manager (See Note 3) | | | (92,904 | ) |
| | | | |
Net expenses | | | 4,907,363 | |
| | | | |
Net investment income (loss) | | | 13,652,240 | |
| | | | |
|
| Realized and Unrealized Gain (Loss) on Investments and Foreign Currency Transactions | |
Net realized gain (loss) on: | | | | |
Security transactions | | | 1,048,887 | |
Foreign currency transactions | | | 6,157 | |
| | | | |
Net realized gain (loss) on investments and foreign currency transactions | | | 1,055,044 | |
| | | | |
Net change in unrealized appreciation (depreciation) on: | | | | |
Investments | | | 28,574,385 | |
Translation of other assets and liabilities in foreign currencies | | | (5 | ) |
| | | | |
Net change in unrealized appreciation (depreciation) on investments and foreign currency transactions | | | 28,574,380 | |
| | | | |
Net realized and unrealized gain (loss) on investments and foreign currency transactions | | | 29,629,424 | |
| | | | |
Net increase (decrease) in net assets resulting from operations | | $ | 43,281,664 | |
| | | | |
| (a) | Dividends recorded net of foreign withholding taxes in the amount of $204,691. |
| | | | | | |
The notes to the financial statements are an integral part of,
and should be read in conjunction with, the financial statements. | | mainstayinvestments.com | | | M-305 | |
Statements of Changes in Net Assets
for the period February 17, 2012 (inception date) through December 31, 2012
| | | | |
| | | 2012 | |
| Increase (Decrease) in Net Assets | | | | |
Operations: | | | | |
Net investment income (loss) | | $ | 13,652,240 | |
Net realized gain (loss) on investments and foreign currency transactions | | | 1,055,044 | |
Net change in unrealized appreciation (depreciation) on investments and foreign currency transactions | | | 28,574,380 | |
| | | | |
Net increase (decrease) in net assets resulting from operations | | | 43,281,664 | |
| | | | |
Capital share transactions: | | | | |
Net proceeds from sale of shares | | | 896,526,344 | |
Cost of shares redeemed | | | (99,727,466 | ) |
| | | | |
Increase (decrease) in net assets derived from capital share transactions | | | 796,798,878 | |
| | | | |
Net increase (decrease) in net assets | | | 840,080,542 | |
| |
| Net Assets | | | | |
Beginning of period | | | — | |
| | | | |
End of period | | $ | 840,080,542 | |
| | | | |
Undistributed net investment income at end of period | | $ | 12,705,857 | |
| | | | |
| | | | |
| M-306 | | MainStay VP Janus Balanced Portfolio | | The notes to the financial statements are an integral part of,
and should be read in conjunction with, the financial statements. |
Financial Highlights selected per share data and ratios
| | | | |
| | | Initial Class | |
| | | February 17,
2012** through December 31, | |
| | | 2012 | |
Net asset value at beginning of period | | $ | 10.00 | |
| | | | |
Net investment income (loss) (a) | | | 0.18 | |
Net realized and unrealized gain (loss) on investments | | | 0.37 | |
| | | | |
Total from investment operations | | | 0.55 | |
| | | | |
Net asset value at end of period | | $ | 10.55 | |
| | | | |
Total investment return | | | 5.50 | %(b) |
Ratios (to average net assets)/Supplemental Data: | | | | |
Net investment income (loss) | | | 2.01 | %†† |
Net expenses | | | 0.58 | %†† |
Expenses (before waiver/reimbursement) | | | 0.59 | %†† |
Portfolio turnover rate | | | 63 | % |
Net assets at end of period (in 000’s) | | $ | 461,363 | |
| (a) | Per share data based on average shares outstanding during the period. |
| (b) | Total investment return is not annualized. |
| | | | |
| | | Service Class | |
| | | February 17,
2012**
through
December 31, | |
| | | 2012 | |
Net asset value at beginning of period | | $ | 10.00 | |
| | | | |
Net investment income (loss) (a) | | | 0.16 | |
Net realized and unrealized gain (loss) on investments | | | 0.37 | |
| | | | |
Total from investment operations | | | 0.53 | |
| | | | |
Net asset value at end of period | | $ | 10.53 | |
| | | | |
Total investment return | | | 5.30 | %(b)(c) |
Ratios (to average net assets)/Supplemental Data: | | | | |
Net investment income (loss) | | | 1.77 | %†† |
Net expenses | | | 0.83 | %†† |
Expenses (before waiver/reimbursement) | | | 0.84 | %†† |
Portfolio turnover rate | | | 63 | % |
Net assets at end of period (in 000’s) | | $ | 378,717 | |
| (a) | Per share data based on average shares outstanding during the period. |
| (b) | Total investment return is not annualized. |
| (c) | Total investment return may reflect adjustments to conform to generally accepted accounting principles. |
| | | | | | |
The notes to the financial statements are an integral part of,
and should be read in conjunction with, the financial statements. | | mainstayinvestments.com | | | M-307 | |
MainStay VP Large Cap Growth Portfolio
Investment and Performance Comparison1 (Unaudited)
Performance data quoted represents past performance. Past performance is no guarantee of future results. Because of market volatility, current performance may be lower or higher than the figures shown. Investment return and principal value will fluctuate, and as a result, when shares are redeemed, they may be worth more or less than their original cost. The performance table and graph do not reflect any deduction of sales charges, mortality and expense charges, contract charges or administrative charges. Please refer to the Performance Summary appropriate for your policy. For performance information current to the most recent month-end, please call 800-598-2019 or visit www.newyorklife.com.
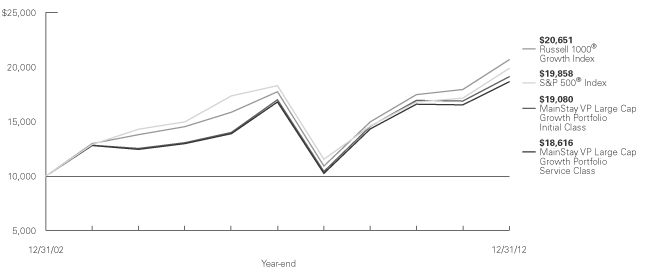
Average Annual Total Returns for the Year Ended December 31, 2012
| | | | | | | | | | | | | | | | |
| Class | | One Year | | | Five Years | | | Ten Years1 | | | Gross Expense Ratio2 | |
| Initial Class Shares | | | 13.11 | % | | | 2.35 | % | | | 6.67 | % | | | 0.80 | % |
| Service Class Shares3 | | | 12.83 | | | | 2.10 | | | | 6.41 | | | | 1.05 | |
| | | | | | | | | | | | |
| Benchmark Performance | | One
Year | | | Five
Years | | | Ten
Years | |
Russell 1000® Growth Index4 | | | 15.26 | % | | | 3.12 | % | | | 7.52 | % |
S&P 500® Index4 | | | 16.00 | | | | 1.66 | | | | 7.10 | |
Average Lipper Variable Products Large-Cap Growth Portfolio5 | | | 16.00 | | | | 1.45 | | | | 7.23 | |
| 1. | Performance figures reflect certain fee waivers and/or expense limitations, without which total returns may have been different. Performance figures shown for the ten-year period ended December 31, 2012 reflect nonrecurring reimbursements from affiliates for printing and mailing costs. If these nonrecurring reimbursements had not been made, the total returns would have been 6.66% for Initial Class shares and 6.40% for Service Class shares for the ten-year period. |
| 2. | The gross expense ratios presented reflect the Portfolio’s “Total Annual Portfolio Operating Expenses” from the most recent Prospectus and may differ from other expense ratios disclosed in this report. |
| 3. | Performance for Service Class shares, first offered June 6, 2003, includes the historical performance of Initial Class shares through June 5, 2003 adjusted to reflect the fees and expenses of Service Class shares. |
| 4. | Please refer to pages M-2 and M-3 for additional explanations and disclosure regarding the Portfolios, their benchmark indices and other indices mentioned in the reports. |
| 5. | The Average Lipper Variable Products Large-Cap Growth Portfolio is representative of portfolios that, by portfolio practice, invest at least 75% of their equity assets in companies with market capitalizations (on a three-year weighted basis) above Lipper’s U.S. diversified equity large-cap floor. Large-cap growth portfolios typically have an above-average price-to-earnings ratio, price-to-book ratio, and three-year sales-per-share growth value, compared to the S&P 500® Index. Lipper Inc. is an independent monitor of fund performance. Results are based on total returns with all dividend and capital gain distributions reinvested. |
| | |
| M-308 | | MainStay VP Large Cap Growth Portfolio |
Cost in Dollars of a $1,000 Investment in MainStay VP Large Cap Growth Portfolio (Unaudited)
The example below is intended to describe the fees and expenses borne by shareholders during the six-month period from July 1, 2012 to December 31, 2012, and the impact of those costs on your investment.
Example
As a shareholder of the Portfolio, you incur two types of costs: (1) transaction costs, including exchange fees and sales charges (loads) on purchases (as applicable), and (2) ongoing costs, including management fees, distribution and/or service (12b-1) fees, and other Portfolio expenses (as applicable). This example is intended to help you understand your ongoing costs (in dollars) of investing in the Portfolio and to compare these costs with the ongoing costs of investing in other Portfolios. The example is based on an investment of $1,000 made at the beginning of the six-month period and held for the entire period from July 1, 2012, to December 31, 2012. Shares are only sold in connection with variable life and annuity contracts and the example does not reflect any contract level or transactional fees or expenses. If these costs had been included, your costs would have been higher.
This example illustrates your Portfolio’s ongoing costs in two ways:
Actual Expenses
The second and third data columns in the table below provide information about actual account values and actual expenses. You may use the information in these columns, together with the amount you invested, to estimate the
expenses that you paid during the six months ended December 31, 2012. Simply divide your account value by $1,000 (for example, an $8,600 account value divided by $1,000 = 8.6), then multiply the result by the number under the heading entitled ‘‘Expenses Paid During Period’’ to estimate the expenses you paid on your account during this period.
Hypothetical Example for Comparison Purposes
The fourth and fifth data columns in the table below provide information about hypothetical account values and hypothetical expenses based on the Portfolio’s actual expense ratio and an assumed rate of return of 5% per year before expenses, which is not the Portfolio’s actual return. The hypothetical account values and expenses may not be used to estimate the actual ending account balances or expenses you paid for the six-month period shown. You may use this information to compare the ongoing costs of investing in the Portfolio with the ongoing costs of investing in other Portfolios. To do so, compare this 5% hypothetical example with the 5% hypothetical examples that appear in the shareholder reports of the other Portfolios.
Please note that the expenses shown in the table are meant to highlight your ongoing costs only and do not reflect any transactional costs, such as exchange fees or sales charges (loads). Therefore, the fourth and fifth data columns of the table are useful in comparing ongoing costs only and will not help you determine the relative total costs of owning different funds. In addition, if these transactional costs were included, your costs would have been higher.
| | | | | | | | | | | | | | | | | | | | |
| | | | | | | | | | | | | | | | |
| Share Class | | Beginning
Account
Value
7/1/12 | | | Ending Account
Value (Based
on Actual
Returns and
Expenses)
12/31/12 | | | Expenses
Paid
During
Period1 | | | Ending Account
Value (Based
on Hypothetical
5% Annualized
Return and
Actual Expenses)
12/31/12 | | | Expenses
Paid
During
Period1 | |
| | | | | |
| Initial Class Shares | | $ | 1,000.00 | | | $ | 1,044.90 | | | $ | 4.01 | | | $ | 1,021.20 | | | $ | 3.96 | |
| | | | | |
| Service Class Shares | | $ | 1,000.00 | | | $ | 1,043.60 | | | $ | 5.29 | | | $ | 1,020.00 | | | $ | 5.23 | |
| 1. | Expenses are equal to the Portfolio’s annualized expense ratio of each class (0.78% for Initial Class and 1.03% for Service Class) multiplied by the average account value over the period, divided by 366 and multiplied by 184 (to reflect the six-month period). The table above represents the actual expenses incurred during the six-month period. |
| | | | |
| mainstayinvestments.com | | | M-309 | |
Industry Composition as of December 31, 2012 (Unaudited)
| | | | |
| IT Services | | | 9.2 | % |
| Internet Software & Services | | | 6.5 | |
| Computers & Peripherals | | | 6.0 | |
| Internet & Catalog Retail | | | 5.0 | |
| Biotechnology | | | 4.9 | |
| Chemicals | | | 4.6 | |
| Software | | | 4.6 | |
| Road & Rail | | | 3.9 | |
| Health Care Providers & Services | | | 3.8 | |
| Health Care Equipment & Supplies | | | 3.7 | |
| Hotels, Restaurants & Leisure | | | 3.7 | |
| Aerospace & Defense | | | 3.5 | |
| Specialty Retail | | | 3.4 | |
| Media | | | 3.3 | |
| Industrial Conglomerates | | | 3.1 | |
| Textiles, Apparel & Luxury Goods | | | 3.1 | |
| Communications Equipment | | | 3.0 | |
| | | | |
| Capital Markets | | | 2.8 | % |
| Food & Staples Retailing | | | 2.7 | |
| Oil, Gas & Consumable Fuels | | | 2.7 | |
| Pharmaceuticals | | | 1.8 | |
| Real Estate Investment Trusts | | | 1.5 | |
| Construction & Engineering | | | 1.4 | |
| Health Care Technology | | | 1.4 | |
| Wireless Telecommunication Services | | | 1.4 | |
| Auto Components | | | 1.3 | |
| Multiline Retail | | | 1.3 | |
| Personal Products | | | 1.1 | |
| Trading Companies & Distributors | | | 1.1 | |
| Commercial Banks | | | 1.0 | |
| Household Durables | | | 0.9 | |
| Energy Equipment & Services | | | 0.8 | |
| Short-Term Investment | | | 1.6 | |
| Other Assets, Less Liabilities | | | (0.1 | ) |
| | | | |
| | | 100.0 | % |
| | | | |
See Portfolio of Investments beginning on page M-313 for specific holdings within these categories.
Top Ten Holdings as of December 31, 2012 (excluding short-term investment) (Unaudited)
| 7. | International Business Machines Corp. |
| | |
| M-310 | | MainStay VP Large Cap Growth Portfolio |
Portfolio Management Discussion and Analysis (Unaudited)
Answers to the questions reflect the views of portfolio managers Clark J. Winslow, Justin H. Kelly, CFA, and R. Bart Wear, CFA, of Winslow Capital Management, Inc., the Portfolio’s Subadvisor.
How did MainStay VP Large Cap Growth Portfolio perform relative to its peers and its benchmarks during the reporting period?
For the 12 months ended December 31, 2012, MainStay VP Large Cap Growth Portfolio returned 13.11% for Initial Class shares and 12.83% for Service Class shares. Both share classes underperformed the 16.00% return of the average Lipper1 Variable Products Large-Cap Growth Portfolio, the 15.26% return of the Russell 1000® Growth Index and the 16.00% return of the S&P 500® Index for the 12 months ended December 31, 2012. The Russell 1000® Growth Index is the Portfolio’s broad-based securities-market index. The S&P 500® Index is the Portfolio’s secondary benchmark.
What factors affected the Portfolio’s relative performance during the reporting period?
The Portfolio’s underperformance of the Russell 1000® Growth Index in the second quarter of 2012 offset outperformance or in-line performance during the remaining quarters and resulted in relative underperformance for the year. Stock selection detracted across six sectors and contributed positively in four. In the aggregate, sector allocations contributed positively to relative performance, led by underweight positions in energy and consumer staples.
Which sectors were the strongest positive contributors to the Portfolio’s relative performance, and which sectors were particularly weak?
The sectors that made the strongest positive contributions to relative performance were consumer staples, information technology and materials. (Contributions take weightings and total returns into account.) The weakest contributions to the Portfolio’s performance relative to the Russell 1000® Growth Index came from health care, consumer discretionary and energy.
During the reporting period, which individual stocks made the strongest positive contributions to the Portfolio’s absolute performance and which stocks detracted the most?
The strongest positive contributions to the Portfolio’s absolute performance came from computers & peripherals company Apple, IT services company Visa
and software company salesforce.com. Visa had stronger-than-expected results in its international credit and debit card business. Apple showed strong results during the year, but because the company’s revenue growth rate is expected to slow, we trimmed the Portfolio’s position. Salesforce.com showed continued strength driven by the movement toward cloud-based software applications.
The weakest absolute contributors were energy equipment & services company FMC Technologies, construction and mining equipment company Caterpillar and software company Autodesk. FMC Technologies suffered from declining oil costs through most of 2012. A one-time adjustment on a recent acquisition caused FMC Technologies to miss its fourth-quarter consensus estimate, and its stock declined. Caterpillar faced increased risk to its earnings estimates, and the position was eliminated from the Portfolio. Autodesk faced macro challenges in its European business, and we sold the Portfolio’s position.
Did the Portfolio make any significant purchases or sales during the reporting period?
The Portfolio established a position in Internet software & services company eBay, as strong execution in PayPal accelerated overall profit growth. We purchased shares of investment manager BlackRock for the Portfolio because, in our opinion, the company had best-in-class fundamentals and a strong business model.
In the second quarter of 2012, we sold the Portfolio’s positions in IT services company Cognizant Technology Solutions and database software provider Oracle as demand slowed in the IT services and software industries.
How did the Portfolio’s sector weightings change during the reporting period?
The Portfolio increased its allocation to the consumer discretionary sector, moving from an underweight to an overweight position relative to the Russell 1000® Growth Index. The Portfolio increased its health care weighting, which remained overweight relative to the Index. The Portfolio reduced its energy position over the reporting period, remaining slightly underweight
| 1. | Please refer to pages M-2 and M-3 for additional explanations and disclosure regarding the Portfolios, their benchmark indices and service providers mentioned in the reports. |
| | | | |
| mainstayinvestments.com | | | M-311 | |
relative to the Russell 1000® Growth Index. During the reporting period, we reduced the Portfolio’s information technology position from overweight to underweight relative to the Index.
How was the Portfolio positioned at the end of the reporting period?
As of December 31, 2012, the Portfolio was overweight relative to the Russell 1000® Growth Index in the consumer discretionary and health care sectors. As of the same date, the Portfolio was underweight in information technology, and it maintained a significantly underweight position relative to the Russell 1000® Growth Index in the consumer staples sector.
The opinions expressed are those of the portfolio managers as of the date of this report and are subject to change. There is no guarantee that any forecasts made will come to pass. This material does not constitute investment advice and is not intended as an endorsement of any specific investment.
Not all MainStay VP Portfolios and/or share classes are available under all policies.
| | |
| M-312 | | MainStay VP Large Cap Growth Portfolio |
Portfolio of Investments December 31, 2012
| | | | | | | | |
| | |
Shares | | | Value | |
| Common Stocks 98.5%† | |
Aerospace & Defense 3.5% | |
Precision Castparts Corp. | | | 62,600 | | | $ | 11,857,692 | |
United Technologies Corp. | | | 141,600 | | | | 11,612,616 | |
| | | | | | | | |
| | | | | | | 23,470,308 | |
| | | | | | | | |
Auto Components 1.3% | |
BorgWarner, Inc. (a) | | | 116,600 | | | | 8,350,892 | |
| | | | | | | | |
|
Biotechnology 4.9% | |
Biogen Idec, Inc. (a) | | | 79,600 | | | | 11,674,932 | |
Celgene Corp. (a) | | | 144,600 | | | | 11,382,912 | |
Gilead Sciences, Inc. (a) | | | 130,900 | | | | 9,614,605 | |
| | | | | | | | |
| | | | | | | 32,672,449 | |
| | | | | | | | |
Capital Markets 2.8% | |
BlackRock, Inc. | | | 39,000 | | | | 8,061,690 | |
Franklin Resources, Inc. | | | 84,100 | | | | 10,571,370 | |
| | | | | | | | |
| | | | | | | 18,633,060 | |
| | | | | | | | |
Chemicals 4.6% | |
Ecolab, Inc. | | | 147,600 | | | | 10,612,440 | |
¨Monsanto Co. | | | 212,389 | | | | 20,102,619 | |
| | | | | | | | |
| | | | | | | 30,715,059 | |
| | | | | | | | |
Commercial Banks 1.0% | |
Wells Fargo & Co. | | | 194,200 | | | | 6,637,756 | |
| | | | | | | | |
|
Communications Equipment 3.0% | |
¨QUALCOMM, Inc. | | | 320,500 | | | | 19,877,410 | |
| | | | | | | | |
|
Computers & Peripherals 6.0% | |
¨Apple, Inc. | | | 62,840 | | | | 33,495,605 | |
EMC Corp. (a) | | | 265,200 | | | | 6,709,560 | |
| | | | | | | | |
| | | | | | | 40,205,165 | |
| | | | | | | | |
Construction & Engineering 1.4% | | | | | | | | |
Fluor Corp. | | | 157,100 | | | | 9,228,054 | |
| | | | | | | | |
| | |
Energy Equipment & Services 0.8% | | | | | | | | |
FMC Technologies, Inc. (a) | | | 117,200 | | | | 5,019,676 | |
| | | | | | | | |
| | |
Food & Staples Retailing 2.7% | | | | | | | | |
Costco Wholesale Corp. | | | 73,800 | | | | 7,289,226 | |
CVS Caremark Corp. | | | 219,300 | | | | 10,603,155 | |
| | | | | | | | |
| | | | | | | 17,892,381 | |
| | | | | | | | |
Health Care Equipment & Supplies 3.7% | | | | | | | | |
Covidien PLC | | | 161,300 | | | | 9,313,462 | |
Edwards Lifesciences Corp. (a) | | | 61,700 | | | | 5,563,489 | |
Intuitive Surgical, Inc. (a) | | | 19,535 | | | | 9,579,378 | |
| | | | | | | | |
| | | | | | | 24,456,329 | |
| | | | | | | | |
| | | | | | | | |
| | |
Shares | | | Value | |
Health Care Providers & Services 3.8% | | | | | | | | |
Express Scripts Holding Co. (a) | | | 184,900 | | | $ | 9,984,600 | |
HCA Holdings, Inc. | | | 176,600 | | | | 5,328,022 | |
UnitedHealth Group, Inc. | | | 187,400 | | | | 10,164,576 | |
| | | | | | | | |
| | | | | | | 25,477,198 | |
| | | | | | | | |
Health Care Technology 1.4% | | | | | | | | |
Cerner Corp. (a) | | | 117,100 | | | | 9,091,644 | |
| | | | | | | | |
| | |
Hotels, Restaurants & Leisure 3.7% | | | | | | | | |
Las Vegas Sands Corp. | | | 157,900 | | | | 7,288,664 | |
Starbucks Corp. | | | 223,600 | | | | 11,989,432 | |
Yum! Brands, Inc. | | | 80,000 | | | | 5,312,000 | |
| | | | | | | | |
| | | | | | | 24,590,096 | |
| | | | | | | | |
Household Durables 0.9% | | | | | | | | |
Lennar Corp. Class A | | | 159,300 | | | | 6,160,131 | |
| | | | | | | | |
| | |
Industrial Conglomerates 3.1% | | | | | | | | |
¨Danaher Corp. | | | 365,600 | | | | 20,437,040 | |
| | | | | | | | |
| | |
Internet & Catalog Retail 5.0% | | | | | | | | |
Amazon.com, Inc. (a) | | | 63,000 | | | | 15,821,820 | |
¨Priceline.com, Inc. (a) | | | 28,530 | | | | 17,722,836 | |
| | | | | | | | |
| | | | | | | 33,544,656 | |
| | | | | | | | |
Internet Software & Services 6.5% | | | | | | | | |
eBay, Inc. (a) | | | 236,600 | | | | 12,071,332 | |
Facebook, Inc. Class A (a) | | | 445,800 | | | | 11,871,654 | |
¨Google, Inc. Class A (a) | | | 27,345 | | | | 19,397,722 | |
| | | | | | | | |
| | | | | | | 43,340,708 | |
| | | | | | | | |
IT Services 9.2% | | | | | | | | |
¨International Business Machines Corp. | | | 103,500 | | | | 19,825,425 | |
MasterCard, Inc. Class A | | | 18,025 | | | | 8,855,322 | |
Teradata Corp. (a) | | | 107,800 | | | | 6,671,742 | |
¨Visa, Inc. Class A | | | 171,700 | | | | 26,026,286 | |
| | | | | | | | |
| | | | | | | 61,378,775 | |
| | | | | | | | |
Media 3.3% | | | | | | | | |
CBS Corp. Class B | | | 191,800 | | | | 7,297,990 | |
McGraw-Hill Cos., Inc. (The) | | | 131,600 | | | | 7,194,572 | |
Sirius XM Radio, Inc. | | | 2,612,700 | | | | 7,550,703 | |
| | | | | | | | |
| | | | | | | 22,043,265 | |
| | | | | | | | |
Multiline Retail 1.3% | | | | | | | | |
Dollar General Corp. (a) | | | 190,400 | | | | 8,394,736 | |
| | | | | | | | |
| | |
Oil, Gas & Consumable Fuels 2.7% | | | | | | | | |
Cabot Oil & Gas Corp. | | | 110,300 | | | | 5,486,322 | |
Range Resources Corp. | | | 99,600 | | | | 6,257,868 | |
Williams Cos., Inc. (The) | | | 199,600 | | | | 6,534,904 | |
| | | | | | | | |
| | | | | | | 18,279,094 | |
| | | | | | | | |
| † | Percentages indicated are based on Portfolio net assets. |
| ¨ | | Among the Portfolio’s 10 largest holdings, as of December 31, 2012, excluding short-term investment. May be subject to change daily. |
| | | | | | |
The notes to the financial statements are an integral part of,
and should be read in conjunction with, the financial statements. | | mainstayinvestments.com | | | M-313 | |
Portfolio of Investments December 31, 2012 (continued)
| | | | | | | | |
| | |
Shares | | | Value | |
| Common Stocks (continued) | |
Personal Products 1.1% | | | | | |
Estee Lauder Cos., Inc. (The) Class A | | | 117,300 | | | $ | 7,021,578 | |
| | | | | | | | |
| |
Pharmaceuticals 1.8% | | | | | |
Allergan, Inc. | | | 62,800 | | | | 5,760,644 | |
GlaxoSmithKline PLC,
Sponsored ADR (b) | | | 150,000 | | | | 6,520,500 | |
| | | | | | | | |
| | | | | | | 12,281,144 | |
| | | | | | | | |
Real Estate Investment Trusts 1.5% | | | | | |
American Tower Corp. | | | 130,900 | | | | 10,114,643 | |
| | | | | | | | |
| |
Road & Rail 3.9% | | | | | |
¨Union Pacific Corp. | | | 206,800 | | | | 25,998,896 | |
| | | | | | | | |
| |
Software 4.6% | | | | | |
Intuit, Inc. | | | 110,400 | | | | 6,568,800 | |
¨Salesforce.com, Inc. (a) | | | 100,800 | | | | 16,944,480 | |
VMware, Inc. Class A (a) | | | 78,700 | | | | 7,408,818 | |
| | | | | | | | |
| | | | | | | 30,922,098 | |
| | | | | | | | |
Specialty Retail 3.4% | | | | | |
Home Depot, Inc. (The) | | | 156,200 | | | | 9,660,970 | |
Ross Stores, Inc. | | | 123,300 | | | | 6,676,695 | |
Ulta Salon Cosmetics & Fragrance, Inc. | | | 65,500 | | | | 6,436,030 | |
| | | | | | | | |
| | | | | | | 22,773,695 | |
| | | | | | | | |
Textiles, Apparel & Luxury Goods 3.1% | | | | | |
Coach, Inc. | | | 104,100 | | | | 5,778,591 | |
Michael Kors Holdings, Ltd. (a) | | | 108,900 | | | | 5,557,167 | |
Ralph Lauren Corp. | | | 62,400 | | | | 9,355,008 | |
| | | | | | | | |
| | | | | | | 20,690,766 | |
| | | | | | | | |
Trading Companies & Distributors 1.1% | | | | | |
W.W. Grainger, Inc. | | | 35,400 | | | | 7,163,898 | |
| | | | | | | | |
| |
Wireless Telecommunication Services 1.4% | | | | | |
SBA Communications Corp. Class A (a) | | | 131,900 | | | | 9,367,538 | |
| | | | | | | | |
Total Common Stocks
(Cost $570,990,269) | | | | | | | 656,230,138 | |
| | | | | | | | |
| | | | | | | | |
| | | Principal
Amount | | | Value | |
| Short-Term Investment 1.6% | |
Repurchase Agreement 1.6% | |
State Street Bank and Trust Co.
0.01%, dated 12/31/12
due 1/2/13
Proceeds at Maturity $10,646,523 (Collateralized by a Federal National Mortgage Association security with a rate of 2.17% and a maturity date of 11/7/22, with a Principal Amount of $10,815,000 and a Market Value of $10,860,607) | | $ | 10,646,517 | | | $ | 10,646,517 | |
| | | | | | | | |
Total Short-Term Investment
(Cost $10,646,517) | | | | | | | 10,646,517 | |
| | | | | | | | |
Total Investments
(Cost $581,636,786) (c) | | | 100.1 | % | | | 666,876,655 | |
Other Assets, Less Liabilities | | | (0.1 | ) | | | (451,801 | ) |
Net Assets | | | 100.0 | % | | $ | 666,424,854 | |
| (a) | Non-income producing security. |
| (b) | ADR—American Depositary Receipt. |
| (c) | As of December 31, 2012, cost is $582,171,814 for federal income tax purposes and net unrealized appreciation is as follows: |
| | | | |
Gross unrealized appreciation | | $ | 89,335,323 | |
Gross unrealized depreciation | | | (4,630,482 | ) |
| | | | |
Net unrealized appreciation | | $ | 84,704,841 | |
| | | | |
| | | | |
| M-314 | | MainStay VP Large Cap Growth Portfolio | | The notes to the financial statements are an integral part of,
and should be read in conjunction with, the financial statements. |
The following is a summary of the fair valuations according to the inputs used as of December 31, 2012, for valuing the Portfolio’s assets.
Asset Valuation Inputs
| | | | | | | | | | | | | | | | |
Description | | Quoted Prices in Active Markets for Identical Assets (Level 1) | | | Significant Other Observable Inputs (Level 2) | | | Significant
Unobservable
Inputs
(Level 3) | | | Total | |
| Investments in Securities (a) | | | | | | | | | | | | | | | | |
| Common Stocks | | $ | 656,230,138 | | | $ | — | | | $ | — | | | $ | 656,230,138 | |
| Short-Term Investment | | | | | | | | | | | | | | | | |
Repurchase Agreement | | | — | | | | 10,646,517 | | | | — | | | | 10,646,517 | |
| | | | | | | | | | | | | | | | |
| Total Investments in Securities | | $ | 656,230,138 | | | $ | 10,646,517 | | | $ | — | | | $ | 666,876,655 | |
| | | | | | | | | | | | | | | | |
| (a) | For a complete listing of investments and their industries, see the Portfolio of Investments. |
The Portfolio recognizes transfers between the levels as of the beginning of the period.
For the year ended December 31, 2012, the Portfolio did not have any transfers between Level 1 and Level 2 fair value measurements. (See Note 2)
As of December 31, 2012, the Portfolio did not hold any investments with significant unobservable inputs (Level 3). (See Note 2)
| | | | | | |
The notes to the financial statements are an integral part of,
and should be read in conjunction with, the financial statements. | | mainstayinvestments.com | | | M-315 | |
Statement of Assets and Liabilities as of December 31, 2012
| | | | |
| Assets | |
Investment in securities, at value
(identified cost $581,636,786) | | $ | 666,876,655 | |
Receivables: | | | | |
Investment securities sold | | | 2,091,640 | |
Fund shares sold | | | 934,598 | |
Dividends and interest | | | 186,666 | |
| | | | |
Total assets | | | 670,089,559 | |
| | | | |
| |
| Liabilities | | | | |
Payables: | | | | |
Investment securities purchased | | | 2,941,792 | |
Manager (See Note 3) | | | 426,921 | |
Fund shares redeemed | | | 158,753 | |
Shareholder communication | | | 52,312 | |
NYLIFE Distributors (See Note 3) | | | 47,997 | |
Professional fees | | | 33,639 | |
Custodian | | | 2,219 | |
Trustees | | | 964 | |
Accrued expenses | | | 108 | |
| | | | |
Total liabilities | | | 3,664,705 | |
| | | | |
Net assets | | $ | 666,424,854 | |
| | | | |
| |
| Net Assets Consist of | | | | |
Shares of beneficial interest outstanding (par value of $.001 per share) unlimited number of shares authorized | | $ | 39,742 | |
Additional paid-in capital | | | 576,196,640 | |
| | | | |
| | | 576,236,382 | |
Undistributed net investment income | | | 1,643,557 | |
Accumulated net realized gain (loss) on investments | | | 3,305,046 | |
Net unrealized appreciation (depreciation) on investments | | | 85,239,869 | |
| | | | |
Net assets | | $ | 666,424,854 | |
| | | | |
| | | | |
Initial Class | | | | |
Net assets applicable to outstanding shares | | $ | 441,225,370 | |
| | | | |
Shares of beneficial interest outstanding | | | 26,144,188 | |
| | | | |
Net asset value per share outstanding | | $ | 16.88 | |
| | | | |
Service Class | | | | |
Net assets applicable to outstanding shares | | $ | 225,199,484 | |
| | | | |
Shares of beneficial interest outstanding | | | 13,597,554 | |
| | | | |
Net asset value per share outstanding | | $ | 16.56 | |
| | | | |
| | | | |
| M-316 | | MainStay VP Large Cap Growth Portfolio | | The notes to the financial statements are an integral part of,
and should be read in conjunction with, the financial statements. |
Statement of Operations for the year ended December 31, 2012
| | | | |
| Investment Income (Loss) | |
Income | | | | |
Dividends | | $ | 6,940,453 | |
Interest | | | 2,032 | |
| | | | |
Total income | | | 6,942,485 | |
| | | | |
Expenses | | | | |
Manager (See Note 3) | | | 4,492,875 | |
Distribution and service—Service Class (See Note 3) | | | 541,944 | |
Shareholder communication | | | 104,731 | |
Professional fees | | | 58,724 | |
Custodian | | | 16,647 | |
Trustees | | | 15,965 | |
Miscellaneous | | | 22,912 | |
| | | | |
Total expenses before waiver/reimbursement | | | 5,253,798 | |
Expense waiver/reimbursement from Manager (See Note 3) | | | (18,830 | ) |
| | | | |
Net expenses | | | 5,234,968 | |
| | | | |
Net investment income (loss) | | | 1,707,517 | |
| | | | |
|
| Realized and Unrealized Gain (Loss) on Investments | |
Net realized gain (loss) on investments | | | 24,165,179 | |
Net change in unrealized appreciation (depreciation) on investments | | | 39,821,979 | |
| | | | |
Net realized and unrealized gain (loss) on investments | | | 63,987,158 | |
| | | | |
Net increase (decrease) in net assets resulting from operations | | $ | 65,694,675 | |
| | | | |
| | | | | | |
The notes to the financial statements are an integral part of,
and should be read in conjunction with, the financial statements. | | mainstayinvestments.com | | | M-317 | |
Statements of Changes in Net Assets
for the years ended December 31, 2012 and December 31, 2011
| | | | | | | | |
| | | 2012 | | | 2011 | |
| Increase (Decrease) in Net Assets | |
Operations: | | | | | | | | |
Net investment income (loss) | | $ | 1,707,517 | | | $ | (479,190 | ) |
Net realized gain (loss) on investments | | | 24,165,179 | | | | 30,081,280 | |
Net change in unrealized appreciation (depreciation) on investments | | | 39,821,979 | | | | (35,848,417 | ) |
| | | | |
Net increase (decrease) in net assets resulting from operations | | | 65,694,675 | | | | (6,246,327 | ) |
| | | | |
Capital share transactions: | | | | | | | | |
Net proceeds from sale of shares | | | 199,091,312 | | | | 222,602,949 | |
Cost of shares redeemed | | | (93,773,584 | ) | | | (69,603,064 | ) |
| | | | |
Increase (decrease) in net assets derived from capital share transactions | | | 105,317,728 | | | | 152,999,885 | |
| | | | |
Net increase (decrease) in net assets | | | 171,012,403 | | | | 146,753,558 | |
|
| Net Assets | |
Beginning of year | | | 495,412,451 | | | | 348,658,893 | |
| | | | |
End of year | | $ | 666,424,854 | | | $ | 495,412,451 | |
| | | | |
Undistributed net investment income at end of year | | $ | 1,643,557 | | | $ | — | |
| | | | |
| | | | |
| M-318 | | MainStay VP Large Cap Growth Portfolio | | The notes to the financial statements are an integral part of,
and should be read in conjunction with, the financial statements. |
Financial Highlights selected per share data and ratios
| | | | | | | | | | | | | | | | | | | | |
| | | Initial Class | |
| | | Year ended December 31, | |
| | | 2012 | | | 2011 | | | 2010 | | | 2009 | | | 2008 | |
Net asset value at beginning of year | | $ | 14.92 | | | $ | 14.96 | | | $ | 12.88 | | | $ | 9.19 | | | $ | 15.04 | |
| | | | | | | | | | | | | | | | | | | | |
Net investment income (loss) (a) | | | 0.06 | | | | (0.00 | )‡ | | | (0.02 | ) | | | 0.00 | ‡ | | | (0.01 | ) |
Net realized and unrealized gain (loss) on investments | | | 1.90 | | | | (0.04 | ) | | | 2.10 | | | | 3.69 | | | | (5.83 | ) |
| | | | | | | | | | | | | | | | | | | | |
Total from investment operations | | | 1.96 | | | | (0.04 | ) | | | 2.08 | | | | 3.69 | | | | (5.84 | ) |
| | | | | | | | | | | | | | | | | | | | |
Less dividends: | | | | | | | | | | | | | | | | | | | | |
From net investment income | | | — | | | | — | | | | — | | | | — | | | | (0.01 | ) |
| | | | | | | | | | | | | | | | | | | | |
Net asset value at end of year | | $ | 16.88 | | | $ | 14.92 | | | $ | 14.96 | | | $ | 12.88 | | | $ | 9.19 | |
| | | | | | | | | | | | | | | | | | | | |
Total investment return | | | 13.14 | %(b) | | | (0.27 | %) | | | 16.15 | % (b) | | | 40.15 | %(b) | | | (38.80 | %) |
Ratios (to average net assets)/Supplemental Data: | | | | | | | | | | | | | | | | | | | | |
Net investment income (loss) | | | 0.38 | % | | | (0.00 | %)(c) | | | (0.16 | %) | | | 0.00 | %(c) | | | (0.05 | %) |
Net expenses | | | 0.78 | % | | | 0.79 | % | | | 0.80 | % | | | 0.80 | % | | | 0.76 | % |
Expenses (before waiver/reimbursement) | | | 0.78 | % | | | 0.80 | % | | | 0.81 | % | | | 0.81 | % | | | 0.78 | % |
Portfolio turnover rate | | | 69 | % | | | 50 | % | | | 98 | % | | | 68 | % | | | 111 | % |
Net assets at end of year (in 000’s) | | $ | 441,225 | | | $ | 314,013 | | | $ | 184,348 | | | $ | 230,769 | | | $ | 184,911 | |
| ‡ | Less than one cent per share. |
| (a) | Per share data based on average shares outstanding during the year. |
| (b) | Total investment returns may reflect adjustments to conform to generally accepted accounting principles. |
| (c) | Less than one-hundredth of a percent. |
| | | | | | | | | | | | | | | | | | | | |
| | | Service Class | |
| | | Year ended December 31, | |
| | | 2012 | | | 2011 | | | 2010 | | | 2009 | | | 2008 | |
Net asset value at beginning of year | | $ | 14.68 | | | $ | 14.75 | | | $ | 12.73 | | | $ | 9.11 | | | $ | 14.93 | |
| | | | | | | | | | | | | | | | | | | | |
Net investment income (loss) (a) | | | 0.02 | | | | (0.04 | ) | | | (0.05 | ) | | | (0.03 | ) | | | (0.04 | ) |
Net realized and unrealized gain (loss) on investments | | | 1.86 | | | | (0.03 | ) | | | 2.07 | | | | 3.65 | | | | (5.78 | ) |
| | | | | | | | | | | | | | | | | | | | |
Total from investment operations | | | 1.88 | | | | (0.07 | ) | | | 2.02 | | | | 3.62 | | | | (5.82 | ) |
| | | | | | | | | | | | | | | | | | | | |
Net asset value at end of year | | $ | 16.56 | | | $ | 14.68 | | | $ | 14.75 | | | $ | 12.73 | | | $ | 9.11 | |
| | | | | | | | | | | | | | | | | | | | |
Total investment return | | | 12.81 | %(b) | | | (0.47 | %)(b) | | | 15.87 | % (b) | | | 39.74 | % (b) | | | (38.94 | %) |
Ratios (to average net assets)/Supplemental Data: | | | | | | | | | | | | | | | | | | | | |
Net investment income (loss) | | | 0.10 | % | | | (0.27 | %) | | | (0.39 | %) | | | (0.26 | %) | | | (0.29 | %) |
Net expenses | | | 1.03 | % | | | 1.04 | % | | | 1.05 | % | | | 1.05 | % | | | 1.01 | % |
Expenses (before waiver/reimbursement) | | | 1.03 | % | | | 1.05 | % | | | 1.06 | % | | | 1.06 | % | | | 1.03 | % |
Portfolio turnover rate | | | 69 | % | | | 50 | % | | | 98 | % | | | 68 | % | | | 111 | % |
Net assets at end of year (in 000’s) | | $ | 225,199 | | | $ | 181,399 | | | $ | 164,311 | | | $ | 118,113 | | | $ | 68,887 | |
| (a) | Per share data based on average shares outstanding during the year. |
| (b) | Total investment returns may reflect adjustments to conform to generally accepted accounting principles. |
��
| | | | | | |
The notes to the financial statements are an integral part of,
and should be read in conjunction with, the financial statements. | | mainstayinvestments.com | | | M-319 | |
MainStay VP MFS® Utilities Portfolio
Investment and Performance Comparison1 (Unaudited)
Performance data quoted represents past performance. Past performance is no guarantee of future results. Because of market volatility, current performance may be lower or higher than the figures shown. Investment return and principal value will fluctuate, and as a result, when shares are redeemed, they may be worth more or less than their original cost. The performance table and graph do not reflect any deduction of sales charges, mortality and expense charges, contract charges or administrative charges. Please refer to the Performance Summary appropriate for your policy. For performance information current to the most recent month-end, please call 800-598-2019 or visit www.newyorklife.com.
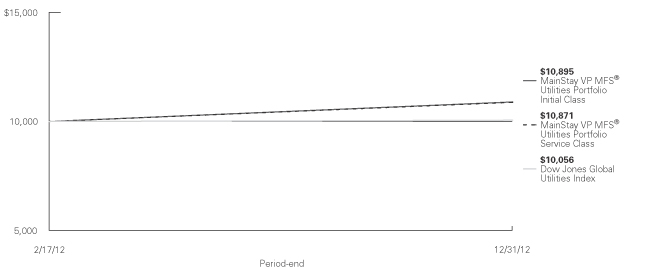
Total Returns for the Period Ended December 31, 2012
| | | | | | | | |
| Class | | Since Inception
(2/17/12) | | | Gross Expense Ratio2 | |
| Initial Class Shares | | | 8.95 | % | | | 0.78 | % |
| Service Class Shares | | | 8.71 | | | | 1.03 | |
| | | | |
| Benchmark Performance | | Since Inception
(2/17/12) | |
Dow Jones Global Utilities Index3 | | | 0.56 | % |
Average Lipper Variable Products Utility Portfolio4 | | | 8.83 | |
| 1. | Performance figures reflect certain fee waivers and/or expense limitations, without which total returns may have been different. For information on current fee waivers and/or expense limitations, please refer to the notes to the financial statements. |
| 2. | The gross expense ratios presented reflect the Portfolio’s “Total Annual Portfolio Operating Expenses” from the most recent Prospectus and may differ from other expense ratios disclosed in this report. |
| 3. | Please refer to pages M-2 and M-3 for additional explanations and disclosure regarding the Portfolios, their benchmark indices and other indices mentioned in the reports. |
| 4. | The Average Lipper Variable Products Utility Portfolio is representative of portfolios that, by portfolio practice, invest primarily in the equity securities of domestic and foreign companies providing utilities. Lipper Inc. is an independent monitor of fund performance. Results are based on total returns with all dividend and capital gain distributions reinvested. |
| | |
| M-320 | | MainStay VP MFS® Utilities Portfolio |
Cost in Dollars of a $1,000 Investment in MainStay VP MFS® Utilities Portfolio (Unaudited)
The example below is intended to describe the fees and expenses borne by shareholders during the period from July 1, 2012, to December 31, 2012, and the impact of those costs on your investment.
Example
As a shareholder of the Portfolio, you incur two types of costs: (1) transaction costs, including exchange fees and sales charges (loads) on purchases (as applicable), and (2) ongoing costs, including management fees, distribution and/or service (12b-1) fees, and other Portfolio expenses (as applicable). This example is intended to help you understand your ongoing costs (in dollars) of investing in the Portfolio and to compare these costs with the ongoing costs of investing in other Portfolios. The example is based on an investment of $1,000 made at the beginning of the six-month period and held for the entire period from July 1, 2012, to December 31, 2012. Shares are only sold in connection with variable life and annuity contracts and the example does not reflect any contract level or transactional fees or expenses. If these costs had been included, your costs would have been higher.
This example illustrates your Portfolio’s ongoing costs in two ways:
Actual Expenses
The second and third data columns in the table below provide information about actual account values and actual expenses. You may use the information in these columns, together with the amount you invested, to estimate the
expenses that you paid during the six months ended December 31, 2012. Simply divide your account value by $1,000 (for example, an $8,600 account value divided by $1,000 = 8.6), then multiply the result by the number under the heading entitled ‘‘Expenses Paid During Period’’ to estimate the expenses you paid on your account during this period.
Hypothetical Example for Comparison Purposes
The fourth and fifth data columns in the table below provide information about hypothetical account values and hypothetical expenses based on the Portfolio’s actual expense ratio and an assumed rate of return of 5% per year before expenses, which is not the Portfolio’s actual return. The hypothetical account values and expenses may not be used to estimate the actual ending account balances or expenses you paid for the six-month period shown. You may use this information to compare the ongoing costs of investing in the Portfolio with the ongoing costs of investing in other Portfolios. To do so, compare this 5% hypothetical example with the 5% hypothetical examples that appear in the shareholder reports of the other Portfolios.
Please note that the expenses shown in the table are meant to highlight your ongoing costs only and do not reflect any transactional costs, such as exchange fees or sales charges (loads). Therefore, the fourth and fifth data columns of the table are useful in comparing ongoing costs only and will not help you determine the relative total costs of owning different funds. In addition, if these transactional costs were included, your costs would have been higher.
| | | | | | | | | | | | | | | | | | | | |
| | | | | | | | | | | | | | | | |
| Share Class | | Beginning
Account
Value
7/1/12 | | | Ending Account
Value (Based
on Actual
Returns and
Expenses)
12/31/12 | | | Expenses
Paid
During
Period1 | | | Ending Account
Value (Based on
Hypothetical
5% Annualized
Return and
Actual Expenses)
12/31/12 | | | Expenses
Paid
During
Period1 | |
| | | | | |
| Initial Class Shares | | $ | 1,000.00 | | | $ | 1,081.50 | | | $ | 4.24 | | | $ | 1,021.10 | | | $ | 4.12 | |
| | | | | |
| Service Class Shares | | $ | 1,000.00 | | | $ | 1,080.10 | | | $ | 5.59 | | | $ | 1,019.80 | | | $ | 5.43 | |
| 1. | Expenses are equal to the Portfolio’s annualized expense ratio of each class (0.81% for Initial Class and 1.07% for Service Class) multiplied by the average account value over the period, divided by 366 and multiplied by 184 (to reflect the six-month period). The table above represents the actual expenses incurred during the six-month period. |
| | | | |
| mainstayinvestments.com | | | M-321 | |
Portfolio Composition as of December 31, 2012 (Unaudited)
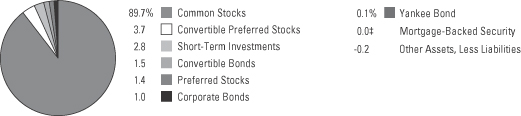
See Portfolio of Investments beginning on page M-325 for specific holdings within these categories.
| ‡ | Less than one-tenth of a percent. |
Top Ten Holdings as of December 31, 2012 (excluding short-term investments) (Unaudited)
| 6. | Energias de Portugal S.A. |
| 10. | Time Warner Cable, Inc. |
| | |
| M-322 | | MainStay VP MFS® Utilities Portfolio |
Portfolio Management Discussion and Analysis (Unaudited)
Answers to the questions reflect the views of portfolio managers Maura A. Shaughnessy, CFA, and Robert D. Persons, CFA, of Massachusetts Financial Services Company (“MFS”), the Portfolio’s Subadvisor.
How did MainStay VP MFS® Utilities Portfolio perform relative to its peers and its benchmark from February 17 through December 31, 2012?
The inception date for MainStay VP MFS® Utilities Portfolio was February 17, 2012. From February 17 through December 31, 2012, MainStay VP MFS® Utilities Portfolio returned 8.95% for Initial Class shares and 8.71% for Service Class shares. Over the same period, Initial Class shares outperformed—and Service Class shares underperformed—the 8.83% return of the average Lipper1 Variable Products Utility Portfolio, and both share classes outperformed the 0.56% return of the Dow Jones Global Utilities Index.1 The Dow Jones Global Utilities Index is the Portfolio’s broad-based securities-market index.
What factors affected the Portfolio’s relative performance during the reporting period?
Compared to 2011, investors were generally willing to assume risk and broaden their sector exposure during 2012. This positive market environment for domestic and international equities—as well as nontraditional utilities—helped the Portfolio’s performance relative to its average peer Portfolio and the Dow Jones Global Utilities Index.
Which industries were the strongest positive contributors to the Portfolio’s relative performance, and which industries were particularly weak?
The industries that made the strongest positive contributions to the Portfolio’s performance relative to the Dow Jones Global Utilities Index included cable TV, electric power and natural gas pipeline. (Contributions take weightings and total returns into account.) The industries that made the weakest contributions to the Portfolio’s relative performance included natural gas distribution, wireless communications and telephone services.
During the reporting period, which individual stocks made the strongest positive contributions to the Portfolio’s absolute performance, and which stocks detracted the most?
The individual stocks that made the strongest positive contributions to the Portfolio’s absolute performance included telecommunications company Virgin Media, media company Comcast and telecommunications company SBA Communications. Virgin Media provided
strong returns, as the company continued to improve its free cash flow and customer satisfaction rates. The company also lowered its churn rates. Comcast advanced, driven by higher average revenue per user from its cable unit and by the company’s focus on returning cash to shareholders through stock buybacks. SBA Communications outperformed the Dow Jones Global Utilities Index because of higher revenue growth from site leasing and higher-than-expected guidance for 2013.
Among the stocks that detracted most substantially from the Portfolio’s absolute performance were Italian communications company Telecom Italia and international communications company Nii Holdings. Telecom Italia continued to be hard-hit by the macro environment in Italy and by challenges in its Brazilian operations. Nii Holdings detracted from performance as the company experienced higher churn in Brazil as well as lower average revenue per user because of foreign currency exchange and increased competition.
Did the Portfolio make any significant purchases or sales during the reporting period?
We added U.S. utility Duke Energy to the Portfolio because the company announced it had settled with North Carolina over an ongoing rate case and the company has a sizable weighting in the Dow Jones Global Utilities Index. U.S. natural gas distribution company Nisource was also added to the Portfolio because it benefited from a regulatory recovery in most of its jurisdictions and from visible growth.
Natural gas pipeline company El Paso is no longer in the Portfolio because the company accepted a merger with oil, gas & consumable fuels company Kinder Morgan. International Power, a U.K. utility, is no longer in the Portfolio because the company was purchased by multi-utilities company GDF Suez.
How did the Portfolio’s sector weightings change during the reporting period?
During the reporting period, the Portfolio added to its exposure to natural gas distribution and electric power sectors. Over the same period, the Portfolio reduced its exposure to the wireless communications and natural gas pipeline sectors.
| 1. | Please refer to pages M-2 and M-3 for additional explanations and disclosure regarding the Portfolios, their benchmark indices and service providers mentioned in the reports. |
| | | | |
| mainstayinvestments.com | | | M-323 | |
How was the Portfolio positioned at the end of the reporting period?
As of December 31, 2012, the Portfolio was most significantly overweight relative to the Dow Jones Global Utilities Index in cable TV and telephone services. As of the same date, the Portfolio was most significantly underweight relative to the Index in electric power and natural gas distribution.
The opinions expressed are those of the portfolio managers as of the date of this report and are subject to change. There is no guarantee that any forecasts made will come to pass. This material does not constitute investment advice and is not intended as an endorsement of any specific investment.
Not all MainStay VP Portfolios and/or share classes are available under all policies.
| | |
| M-324 | | MainStay VP MFS® Utilities Portfolio |
Portfolio of Investments December 31, 2012
| | | | | | | | |
| | | Principal
Amount | | | Value | |
Long-Term Bonds 2.6%† Convertible Bonds 1.5% | |
Telecommunications 1.5% | |
SBA Communications Corp.
4.00%, due 10/1/14 | | $ | 2,682,193 | | | $ | 6,355,121 | |
¨Virgin Media, Inc.
6.50%, due 11/15/16 | | | 3,094,441 | | | | 6,384,219 | |
| | | | | | | | |
| | | | | | | 12,739,340 | |
| | | | | | | | |
Total Convertible Bonds
(Cost $9,218,702) | | | | | | | 12,739,340 | |
| | | | | | | | |
|
| Corporate Bonds 1.0% | |
Electric 0.4% | |
GenOn Energy, Inc.
9.875%, due 10/15/20 | | | 2,869,000 | | | | 3,313,695 | |
| | | | | | | | |
|
Oil & Gas 0.6% | |
EP Energy LLC / EP Energy Finance, Inc.
9.375%, due 5/1/20 | | | 4,435,000 | | | | 5,000,463 | |
| | | | | | | | |
Total Corporate Bonds
(Cost $7,047,239) | | | | | | | 8,314,158 | |
| | | | | | | | |
|
| Mortgage-Backed Security 0.0%‡ | |
Commercial Mortgage Loan
(Collateralized Mortgage Obligation) 0.0%‡ | |
Falcon Franchise Loan LLC
Series 2001-1, Class IO
6.015%, due 1/5/23 (a)(b)(e) | | | 37,686 | | | | 4,100 | |
| | | | | | | | |
Total Mortgage-Backed Security
(Cost $2,243) | | | | | | | 4,100 | |
| | | | | | | | |
|
| Yankee Bond 0.1% (c) | |
Electric 0.1% | |
Viridian Group FundCo II
11.125%, due 4/1/17 (b)(d)(e) | | | 1,150,000 | | | | 1,196,000 | |
| | | | | | | | |
Total Yankee Bond
(Cost $1,117,057) | | | | | | | 1,196,000 | |
| | | | | | | | |
Total Long-Term Bonds
(Cost $17,385,241) | | | | | | | 22,253,598 | |
| | | | | | | | |
| | |
| | | | | | | | |
| | | | | | | | |
| | |
Shares | | | Value | |
| Common Stocks 89.7% | |
Diversified Telecommunication Services 9.2% | |
Bezeq—The Israeli Telecommunication Corp., Ltd. | | | 5,681,949 | | | $ | 6,561,628 | |
BT Group PLC | | | 655,980 | | | | 2,472,714 | |
CenturyLink, Inc. | | | 153,169 | | | | 5,991,971 | |
China Unicom, Ltd. | | | 674,000 | | | | 1,091,140 | |
Frontier Communications Corp. | | | 701,157 | | | | 3,000,952 | |
Portugal Telecom SGPS S.A. Registered | | | 370,967 | | | | 1,855,675 | |
TDC A/S | | | 1,372,143 | | | | 9,723,981 | |
Telecom Italia S.p.A. | | | 13,230,772 | | | | 10,469,544 | |
Telefonica Brasil S.A., ADR (f) | | | 281,911 | | | | 6,782,779 | |
Telefonica Deutschland Holding A.G. (d)(g) | | | 282,230 | | | | 2,152,793 | |
Verizon Communications, Inc. | | | 212,860 | | | | 9,210,452 | |
Windstream Corp. | | | 553,090 | | | | 4,579,585 | |
XL Axiata Tbk PT | | | 6,357,000 | | | | 3,774,802 | |
Ziggo N.V. | | | 325,114 | | | | 10,507,343 | |
| | | | | | | | |
| | | | | | | 78,175,359 | |
| | | | | | | | |
Electric Utilities 25.0% | |
American Electric Power Co., Inc. | | | 286,203 | | | | 12,215,144 | |
CEZ AS | | | 167,671 | | | | 6,030,681 | |
Cheung Kong Infrastructure Holdings, Ltd. | | | 18,000 | | | | 110,574 | |
Cia Paranaense de Energia, Sponsored ADR (f) | | | 161,523 | | | | 2,479,378 | |
Cleco Corp. | | | 10,170 | | | | 406,902 | |
CLP Holdings, Ltd. | | | 530,000 | | | | 4,460,848 | |
Duke Energy Corp. | | | 198,230 | | | | 12,647,074 | |
¨Edison International | | | 502,782 | | | | 22,720,719 | |
EDP—Energias do Brasil S.A. | | | 1,099,200 | | | | 6,757,085 | |
Enel OGK-5 OJSC (g)(h) | | | 3,357,482 | | | | 178,027 | |
¨Energias de Portugal S.A. | | | 7,676,291 | | | | 23,074,063 | |
Exelon Corp. | | | 311,810 | | | | 9,273,229 | |
FirstEnergy Corp. | | | 310,600 | | | | 12,970,656 | |
Great Plains Energy, Inc. | | | 236,328 | | | | 4,799,822 | |
Iberdrola S.A. | | | 1,273,991 | | | | 7,104,265 | |
ITC Holdings Corp. | | | 121,969 | | | | 9,380,636 | |
Light S.A. | | | 432,820 | | | | 4,750,373 | |
NextEra Energy, Inc. | | | 169,218 | | | | 11,708,193 | |
Northeast Utilities | | | 215,250 | | | | 8,411,970 | |
NV Energy, Inc. | | | 220,146 | | | | 3,993,448 | |
OGE Energy Corp. | | | 255,395 | | | | 14,381,293 | |
Portland General Electric Co. | | | 76,140 | | | | 2,083,190 | |
¨PPL Corp. | | | 374,924 | | | | 10,734,074 | |
Red Electrica Corp. S.A. | | | 193,955 | | | | 9,582,845 | |
SSE PLC | | | 332,086 | | | | 7,674,867 | |
Transmissora Alianca de Energia Eletrica S.A. | | | 191,940 | | | | 2,044,675 | |
Xcel Energy, Inc. | | | 107,870 | | | | 2,881,208 | |
| | | | | | | | |
| | | | | | | 212,855,239 | |
| | | | | | | | |
| † | Percentages indicated are based on Portfolio net assets. |
| ¨ | | Among the Portfolio’s 10 largest holdings, as of December 31, 2012, excluding short-term investments. May be subject to change daily. |
| | | | | | |
The notes to the financial statements are an integral part of,
and should be read in conjunction with, the financial statements. | | mainstayinvestments.com | | | M-325 | |
Portfolio of Investments December 31, 2012 (continued)
| | | | | | | | |
| | |
Shares | | | Value | |
| Common Stocks (continued) | |
Gas Utilities 2.7% | |
AGL Resources, Inc. | | | 33,105 | | | $ | 1,323,207 | |
APA Group | | | 168,826 | | | | 974,513 | |
Atmos Energy Corp. | | | 24,500 | | | | 860,440 | |
China Resources Gas Group, Ltd. | | | 176,000 | | | | 364,022 | |
Enagas S.A. | | | 553,797 | | | | 11,850,737 | |
Gas Natural SDG S.A. | | | 24,580 | | | | 449,467 | |
ONEOK, Inc. | | | 168,734 | | | | 7,213,379 | |
| | | | | | | | |
| | | | | | | 23,035,765 | |
| | | | | | | | |
Independent Power Producers & Energy Traders 8.6% | |
AES Corp. (The) | | | 1,364,066 | | | | 14,595,506 | |
AES Gener S.A. | | | 438,210 | | | | 282,825 | |
¨Calpine Corp. (g) | | | 1,077,668 | | | | 19,538,121 | |
China Hydroelectric Corp., ADR (f)(g) | | | 76,531 | | | | 131,633 | |
China Longyuan Power Group Corp. | | | 3,388,000 | | | | 2,379,979 | |
E.ON Russia JSC (h) | | | 11,805,349 | | | | 1,010,444 | |
EDP Renovaveis S.A. (g) | | | 2,580,464 | | | | 13,760,674 | |
¨NRG Energy, Inc. | | | 860,147 | | | | 19,774,789 | |
Tractebel Energia S.A. | | | 123,100 | | | | 2,005,617 | |
| | | | | | | | |
| | | | | | | 73,479,588 | |
| | | | | | | | |
Media 11.6% | |
Astro Malaysia Holdings Bhd | | | 4,536,900 | | | | 4,467,803 | |
Charter Communications, Inc. Class A (g) | | | 35,660 | | | | 2,718,718 | |
¨Comcast Corp. Class A | | | 878,345 | | | | 31,576,503 | |
Kabel Deutschland Holding A.G. | | | 85,689 | | | | 6,407,681 | |
Liberty Global, Inc. Class A (g) | | | 94,816 | | | | 5,972,460 | |
News Corp. Class A | | | 17,140 | | | | 437,756 | |
¨Time Warner Cable, Inc. | | | 195,207 | | | | 18,972,168 | |
¨Virgin Media, Inc. | | | 756,069 | | | | 27,785,536 | |
| | | | | | | | |
| | | | | | | 98,338,625 | |
| | | | | | | | |
Multi-Utilities 12.2% | |
AGL Energy, Ltd. | | | 111,610 | | | | 1,792,314 | |
Alliant Energy Corp. | | | 9,260 | | | | 406,607 | |
CenterPoint Energy, Inc. | | | 434,084 | | | | 8,356,117 | |
¨CMS Energy Corp. | | | 1,153,211 | | | | 28,115,284 | |
Dominion Resources, Inc. | | | 33,180 | | | | 1,718,724 | |
DTE Energy Co. | | | 33,970 | | | | 2,039,899 | |
GDF Suez S.A. | | | 453,983 | | | | 9,353,826 | |
National Grid PLC | | | 291,765 | | | | 3,342,001 | |
NiSource, Inc. | | | 441,614 | | | | 10,991,772 | |
PG&E Corp. | | | 148,990 | | | | 5,986,418 | |
Public Service Enterprise Group, Inc. | | | 526,229 | | | | 16,102,607 | |
RWE A.G. | | | 82,928 | | | | 3,423,494 | |
Sempra Energy | | | 147,888 | | | | 10,491,175 | |
Suez Environnement Co. | | | 164,310 | | | | 1,981,208 | |
| | | | | | | | |
| | | | | | | 104,101,446 | |
| | | | | | | | |
Oil, Gas & Consumable Fuels 13.5% | |
Cabot Oil & Gas Corp. | | | 81,179 | | | | 4,037,844 | |
Cheniere Energy, Inc. (g) | | | 61,673 | | | | 1,158,219 | |
| | | | | | | | |
| | |
Shares | | | Value | |
Oil, Gas & Consumable Fuels (continued) | |
El Paso Pipeline Partners, L.P. | | | 34,215 | | | $ | 1,264,929 | |
Enbridge, Inc. | | | 92,110 | | | | 3,983,686 | |
Energen Corp. | | | 101,314 | | | | 4,568,248 | |
EQT Corp. | | | 206,531 | | | | 12,181,198 | |
¨Kinder Morgan, Inc. | | | 784,238 | | | | 27,707,129 | |
Noble Energy, Inc. | | | 40,500 | | | | 4,120,470 | |
QEP Resources, Inc. | | | 257,510 | | | | 7,794,828 | |
Spectra Energy Corp. | | | 527,243 | | | | 14,435,913 | |
TransCanada Corp. | | | 36,060 | | | | 1,704,575 | |
Williams Cos., Inc. (The) | | | 553,673 | | | | 18,127,254 | |
Williams Partners, L.P. | | | 216,711 | | | | 10,545,157 | |
WPX Energy, Inc. (g) | | | 184,898 | | | | 2,751,282 | |
| | | | | | | | |
| | | | | | | 114,380,732 | |
| | | | | | | | |
Real Estate Investment Trusts 0.8% | |
American Tower Corp. | | | 87,402 | | | | 6,753,552 | |
| | | | | | | | |
|
Water Utilities 1.2% | |
Aguas Andinas S.A. Class A | | | 4,322,460 | | | | 3,084,118 | |
Cia de Saneamento Basico do Estado de Sao Paulo | | | 86,000 | | | | 3,608,404 | |
Cia de Saneamento de Minas
Gerais—COPASA | | | 159,000 | | | | 3,419,309 | |
| | | | | | | | |
| | | | | | | 10,111,831 | |
| | | | | | | | |
Wireless Telecommunication Services 4.9% | |
Cellcom Israel, Ltd. | | | 277,253 | | | | 2,295,655 | |
ENTEL Chile S.A. | | | 169,746 | | | | 3,508,509 | |
Mobile Telesystems OJSC, Sponsored ADR (f) | | | 483,949 | | | | 9,025,649 | |
SBA Communications Corp. Class A (g) | | | 84,822 | | | | 6,024,058 | |
Tim Participacoes S.A., ADR (f) | | | 468,981 | | | | 9,295,203 | |
Turkcell Iletisim Hizmetleri AS (g) | | | 609,710 | | | | 3,944,812 | |
Vodafone Group PLC | | | 3,173,648 | | | | 7,981,300 | |
| | | | | | | | |
| | | | | | | 42,075,186 | |
| | | | | | | | |
Total Common Stocks
(Cost $730,465,393) | | | | | | | 763,307,323 | |
| | | | | | | | |
|
| Convertible Preferred Stocks 3.7% | |
Electric Utilities 3.7% | |
NextEra Energy, Inc. | | | | | | | | |
5.89% | | | 117,130 | | | | 5,863,528 | |
7.00% | | | 149,608 | | | | 7,929,224 | |
¨PPL Corp. | | | | | | | | |
8.75% | | | 165,991 | | | | 8,918,696 | |
9.50% | | | 166,397 | | | | 8,704,227 | |
| | | | | | | | |
| | | | | | | 31,415,675 | |
| | | | | | | | |
Total Convertible Preferred Stocks
(Cost $31,878,603) | | | | | | | 31,415,675 | |
| | | | | | | | |
| | | | |
| M-326 | | MainStay VP MFS® Utilities Portfolio | | The notes to the financial statements are an integral part of,
and should be read in conjunction with, the financial statements. |
| | | | | | | | |
| | |
Shares | | | Value | |
| Preferred Stocks 1.4% | |
Electric Utilities 1.4% | |
Cia Energetica de Minas Gerais
0.949% | | | 695,450 | | | $ | 7,553,161 | |
Cia Paranaense de Energia Class B
0.748% | | | 261,300 | | | | 4,025,515 | |
| | | | | | | | |
| | | | | | | 11,578,676 | |
| | | | | | | | |
Total Preferred Stocks
(Cost $15,856,462) | | | | | | | 11,578,676 | |
| | | | | | | | |
| | |
| | | | | | | | |
| | | Principal
Amount | | | | |
| Short-Term Investments 2.8% | |
Financial Company Commercial Paper 2.5% | |
Barclays U.S. Funding LLC
0.15%, due 1/2/13 (i) | | | $21,137,000 | | | | 21,136,912 | |
| | | | | | | | |
Total Financial Company Commercial Paper (Cost $21,136,912) | | | | | | | 21,136,912 | |
| | | | | | | | |
|
Repurchase Agreement 0.3% | |
State Street Bank and Trust Co.
0.01%, dated 12/31/12
due 1/2/13
Proceeds at Maturity $2,279,584 (Collateralized by a Federal National Mortgage Association security with a rate of 2.14% and a maturity date of 11/7/22, with a Principal Amount of $2,320,000 and a Market Value of $2,329,505) | | | 2,279,582 | | | | 2,279,582 | |
| | | | | | | | |
Total Repurchase Agreement
(Cost $2,279,582) | | | | | | | 2,279,582 | |
| | | | | | | | |
Total Short-Term Investments
(Cost $23,416,494) | | | | | | | 23,416,494 | |
| | | | | | | | |
Total Investments
(Cost $819,002,193) (j) | | | 100.2 | % | | | 851,971,766 | |
Other Assets, Less Liabilities | | | (0.2 | ) | | | (1,504,831 | ) |
Net Assets | | | 100.0 | % | | $ | 850,466,935 | |
| ‡ | Less than one-tenth of a percent. |
| (a) | Collateral strip rate—Bond whose interest is based on the weighted net interest rate of the collateral. Coupon rate adjusts periodically based on a predetermined schedule. Rate shown is the rate in effect as of December 31, 2012. |
| (c) | Yankee Bond—Dollar-denominated bond issued in the United States by a foreign bank or corporation. |
| (d) | May be sold to institutional investors only under Rule 144A or securities offered pursuant to Section 4(2) of the Securities Act of 1933, as amended. |
| (e) | Illiquid security. The total market value of this security as of December 31, 2012 is $1,200,100, which represents 0.1% of the Portfolio’s net assets. |
| (f) | ADR—American Depositary Receipt. |
| (g) | Non-income producing security. |
| (h) | Fair valued security. The total market value of these securities as of December 31, 2012 is $1,188,471, which represents 0.1% of the Portfolio’s net assets. |
| (i) | Interest rate presented is yield to maturity. |
| (j) | As of December 31, 2012, cost is $819,571,870 for federal income tax purposes and net unrealized appreciation is as follows: |
| | | | |
Gross unrealized appreciation | | $ | 68,205,579 | |
Gross unrealized depreciation | | | (35,805,683 | ) |
| | | | |
Net unrealized appreciation | | $ | 32,399,896 | |
| | | | |
| | | | | | |
The notes to the financial statements are an integral part of,
and should be read in conjunction with, the financial statements. | | mainstayinvestments.com | | | M-327 | |
Portfolio of Investments December 31, 2012 (continued)
As of December 31, 2012, the Portfolio held the following foreign currency forward contracts:
| | | | | | | | | | | | | | | | | | | | | | | | | | | | | | | | | | | | |
Foreign Currency Buy Contracts | | Expiration
Date | | | Counterparty | | | Contract
Amount
Purchased | | | Contract
Amount Sold | | | Unrealized
Appreciation
(Depreciation) | |
Euro vs. U.S. Dollar | | | 1/11/13 | | | | Credit Suisse Group A.G. | | | | EUR | | | | 2,212,878 | | | | USD | | | | 2,877,082 | | | USD | | | 44,005 | |
Euro vs. U.S. Dollar | | | 1/11/13 | | | | Deutsche Bank A.G. | | | | EUR | | | | 1,974,257 | | | | | | | | 2,576,563 | | | | | | 29,537 | |
Euro vs. U.S. Dollar | | | 1/11/13 | | | | JPMorgan Chase Bank | | | | EUR | | | | 533,561 | | | | | | | | 683,551 | | | | | | 20,771 | |
Euro vs. U.S. Dollar | | | 1/11/13 | | | | Merrill Lynch International Bank | | | | EUR | | | | 359,335 | | | | | | | | 469,813 | | | | | | 4,524 | |
Euro vs. U.S. Dollar | | | 1/11/13 | | | | UBS A.G. | | | | EUR | | | | 5,027,990 | | | | | | | | 6,571,459 | | | | | | 65,693 | |
Euro vs. U.S. Dollar | | | 3/18/13 | | | | UBS A.G. | | | | EUR | | | | 7,089,000 | | | | | | | | 9,277,431 | | | | | | 85,882 | |
Pound Sterling vs. U.S. Dollar | | | 1/11/13 | | | | Barclays Bank PLC | | | | GBP | | | | 1,160,730 | | | | | | | | 1,865,780 | | | | | | 19,727 | |
Pound Sterling vs. U.S. Dollar | | | 1/11/13 | | | | Credit Suisse Group A.G. | | | | GBP | | | | 1,349,784 | | | | | | | | 2,152,561 | | | | | | 40,049 | |
Pound Sterling vs. U.S. Dollar | | | 1/11/13 | | | | Deutsche Bank A.G. | | | | GBP | | | | 1,268,302 | | | | | | | | 2,032,934 | | | | | | 27,315 | |
Pound Sterling vs. U.S. Dollar | | | 1/11/13 | | | | Goldman Sachs International | | | | GBP | | | | 277,829 | | | | | | | | 448,094 | | | | | | 3,216 | |
Pound Sterling vs. U.S. Dollar | | | 1/11/13 | | | | JPMorgan Chase Bank | | | | GBP | | | | 316,491 | | | | | | | | 509,431 | | | | | | 4,682 | |
Pound Sterling vs. U.S. Dollar | | | 1/11/13 | | | | UBS A.G. | | | | GBP | | | | 445,521 | | | | | | | | 721,770 | | | | | | 1,943 | |
| | | | | | | | | | | |
| | | | | | | | | | | | | | | | | | | | | | | | | | | | | | | | | | | | |
Foreign Currency Sales Contracts | | | | | | | | | | | Contract
Amount
Sold | | | | | | Contract
Amount
Purchased | | | | | | |
Euro vs. U.S. Dollar | | | 1/11/13 | | | | Credit Suisse Group A.G. | | | | EUR | | | | 1,084,678 | | | | USD | | | | 1,420,975 | | | USD | | | (10,844 | ) |
Euro vs. U.S. Dollar | | | 1/11/13 | | | | Deutsche Bank A.G. | | | | EUR | | | | 17,663,735 | | | | | | | | 22,768,656 | | | | | | (548,195 | ) |
Euro vs. U.S. Dollar | | | 1/11/13 | | | | JPMorgan Chase Bank | | | | EUR | | | | 47,152,729 | | | | | | | | 60,767,238 | | | | | | (1,476,288 | ) |
Euro vs. U.S. Dollar | | | 1/11/13 | | | | Merrill Lynch International Bank | | | | EUR | | | | 157,918 | | | | | | | | 204,153 | | | | | | (4,305 | ) |
Euro vs. U.S. Dollar | | | 1/11/13 | | | | UBS A.G. | | | | EUR | | | | 1,165,143 | | | | | | | | 1,518,058 | | | | | | (19,979 | ) |
Pound Sterling vs. U.S. Dollar | | | 1/11/13 | | | | Barclays Bank PLC | | | | GBP | | | | 13,095,325 | | | | | | | | 20,937,382 | | | | | | (334,857 | ) |
Pound Sterling vs. U.S. Dollar | | | 1/11/13 | | | | Credit Suisse Group A.G. | | | | GBP | | | | 327,954 | | | | | | | | 521,555 | | | | | | (11,178 | ) |
Pound Sterling vs. U.S. Dollar | | | 1/11/13 | | | | Deutsche Bank A.G. | | | | GBP | | | | 12,680,088 | | | | | | | | 20,267,979 | | | | | | (329,745 | ) |
Net unrealized appreciation (depreciation) on foreign currency forward contracts | | | USD | | | (2,388,047 | ) |
| | | | |
| M-328 | | MainStay VP MFS® Utilities Portfolio | | The notes to the financial statements are an integral part of,
and should be read in conjunction with, the financial statements. |
The following is a summary of the fair valuations according to the inputs used as of December 31, 2012, for valuing the Portfolio’s assets and liabilities.
Asset Valuation Inputs
| | | | | | | | | | | | | | | | |
Description | | Quoted Prices in
Active Markets
for Identical Assets
(Level 1) | | | Significant Other
Observable Inputs
(Level 2) | | | Significant
Unobservable
Inputs
(Level 3) | | | Total | |
| Investments in Securities (a) | | | | | | | | | | | | | | | | |
| Long-Term Bonds | | | | | | | | | | | | | | | | |
Convertible Bonds | | $ | — | | | $ | 12,739,340 | | | $ | — | | | $ | 12,739,340 | |
Corporate Bonds | | | — | | | | 8,314,158 | | | | — | | | | 8,314,158 | |
Mortgage-Backed Security | | | — | | | | 4,100 | | | | — | | | | 4,100 | |
Yankee Bond | | | — | | | | 1,196,000 | | | | — | | | | 1,196,000 | |
| | | | | | | | | | | | | | | | |
| Total Long-Term Bonds | | | — | | | | 22,253,598 | | | | — | | | | 22,253,598 | |
| | | | | | | | | | | | | | | | |
| Common Stocks (b) | | | | | | | | | | | | | | | | |
Diversified Telecommunication Services | | | 29,565,739 | | | | 48,609,620 | | | | — | | | | 78,175,359 | |
Electric Utilities | | | 141,086,936 | | | | 71,590,276 | | | | 178,027 | | | | 212,855,239 | |
Gas Utilities | | | 9,397,026 | | | | 13,638,739 | | | | — | | | | 23,035,765 | |
Independent Power Producers & Energy Traders | | | 54,040,049 | | | | 18,429,095 | | | | 1,010,444 | | | | 73,479,588 | |
Media | | | 87,463,141 | | | | 10,875,484 | | | | — | | | | 98,338,625 | |
Multi-Utilities | | | 84,208,603 | | | | 19,892,843 | | | | — | | | | 104,101,446 | |
Water Utilities | | | — | | | | 10,111,831 | | | | — | | | | 10,111,831 | |
Wireless Telecommunication Services | | | 26,640,565 | | | | 15,434,621 | | | | — | | | | 42,075,186 | |
All Other Industries | | | 121,134,284 | | | | — | | | | — | | | | 121,134,284 | |
| | | | | | | | | | | | | | | | |
| Total Common Stocks | | | 553,536,343 | | | | 208,582,509 | | | | 1,188,471 | | | | 763,307,323 | |
| | | | | | | | | | | | | | | | |
| Convertible Preferred Stocks | | | 31,415,675 | | | | — | | | | — | | | | 31,415,675 | |
| Preferred Stocks | | | — | | | | 11,578,676 | | | | — | | | | 11,578,676 | |
| Short-Term Investments | | | | | | | | | | | | | | | | |
Financial Company Commercial Paper | | | — | | | | 21,136,912 | | | | — | | | | 21,136,912 | |
Repurchase Agreement | | | — | | | | 2,279,582 | | | | — | | | | 2,279,582 | |
| | | | | | | | | | | | | | | | |
| Total Short-Term Investments | | | — | | | | 23,416,494 | | | | — | | | | 23,416,494 | |
| | | | | | | | | | | | | | | | |
| Total Investments in Securities | | $ | 584,952,018 | | | $ | 265,831,277 | | | $ | 1,188,471 | | | $ | 851,971,766 | |
| | | | | | | | | | | | | | | | |
| Other Financial Instruments | | | | | | | | | | | | | | | | |
Foreign Currency Forward Contracts (c) | | | — | | | | 347,344 | | | | — | | | | 347,344 | |
| | | | | | | | | | | | | | | | |
| Total Investments in Securities and Other Financial Instruments | | $ | 584,952,018 | | | $ | 266,178,621 | | | $ | 1,188,471 | | | $ | 852,319,110 | |
| | | | | | | | | | | | | | | | |
Liability Valuation Inputs
| | | | | | | | | | | | | | | | |
Description | | Quoted Prices in
Active Markets
for Identical Assets
(Level 1) | | | Significant Other
Observable Inputs
(Level 2) | | | Significant
Unobservable
Inputs
(Level 3) | | | Total | |
| Other Financial Instruments | | | | | | | | | | | | | | | | |
Foreign Currency Forward Contracts (c) | | $ | — | | | $ | (2,735,391 | ) | | $ | — | | | $ | (2,735,391 | ) |
| | | | | | | | | | | | | | | | |
| Total Other Financial Instruments | | $ | — | | | $ | (2,735,391 | ) | | $ | — | | | $ | (2,735,391 | ) |
| | | | | | | | | | | | | | | | |
| (a) | For a complete listing of investments and their industries, see the Portfolio of Investments. |
| (b) | The Level 3 securities valued at $178,027 and $1,010,444 are held in Electric Utilities and Independent Power Producers & Energy Traders within the Common Stocks section of the Portfolio of Investments. |
| (c) | The value listed for these securities reflects unrealized appreciation (depreciation) as shown on the Portfolio of Investments. |
The Portfolio recognizes transfers between the levels as of the beginning of the period.
| | | | | | |
The notes to the financial statements are an integral part of,
and should be read in conjunction with, the financial statements. | | mainstayinvestments.com | | | M-329 | |
Portfolio of Investments December 31, 2012 (continued)
The following is a reconciliation of investments in which significant unobservable inputs (Level 3) were used in determining value:
| | | | | | | | | | | | | | | | | | | | | | | | | | | | | | | | | | | | | | | | |
Investments in
Securities | | Balance
as of
February 17,
2012 (a) | | | Accrued
Discounts
(Premiums) | | | Realized
Gain
(Loss) | | | Change in
Unrealized
Appreciation
(Depreciation) | | | Purchases | | | Sales | | | Transfers
in to
Level 3 | | | Transfers
out of
Level 3 | | | Balance
as of
December 31,
2012 | | | Change in
Unrealized
Appreciation
(Depreciation)
from
Investments
Still Held at
December 31,
2012 (b) | |
| Common Stocks | | | | | | | | | | | | | | | | | | | | | | | | | | | | | | | | | | | | | | | | |
Electric Utilities | | | | | | $ | — | | | $ | (161,446 | ) | | $ | (60,911 | ) | | $ | 903,246 | | | $ | (502,862 | ) | | $ | — | | | $ | — | | | $ | 178,027 | | | $ | (60,911 | ) |
Independent Power Producers & Energy Traders | | | — | | | | — | | | | — | | | | (46,581 | ) | | $ | 1,057,025 | | | | — | | | | — | | | | — | | | $ | 1,010,444 | | | | (46,581 | ) |
| | | | | | | | | | | | | | | | | | | | | | | | | | | | | | | | | | | | | | | | |
| Total | | $ | — | | | $ | — | | | $ | (161,446 | ) | | $ | (107,492 | ) | | $ | 1,960,271 | | | $ | (502,862 | ) | | $ | — | | | $ | — | | | $ | 1,188,471 | | | $ | (107,492 | ) |
| | | | | | | | | | | | | | | | | | | | | | | | | | | | | | | | | | | | | | | | |
| (b) | Included in “Net change in unrealized appreciation (depreciation) on investments” in the Statement of Operations. |
| | | | |
| M-330 | | MainStay VP MFS® Utilities Portfolio | | The notes to the financial statements are an integral part of,
and should be read in conjunction with, the financial statements. |
Statement of Assets and Liabilities as of December 31, 2012
| | | | |
| Assets | | | | |
Investment in securities, at value
(identified cost $819,002,193) | | $ | 851,971,766 | |
Cash denominated in foreign currencies
(identified cost $58,883) | | | 58,757 | |
Receivables: | | | | |
Dividends and interest | | | 3,394,964 | |
Investment securities sold | | | 3,265,776 | |
Fund shares sold | | | 793,570 | |
Other assets | | | 1,458 | |
Unrealized appreciation on foreign currency forward contracts | | | 347,344 | |
| | | | |
Total assets | | | 859,833,635 | |
| | | | |
| |
| Liabilities | | | | |
Payables: | | | | |
Investment securities purchased | | | 5,568,272 | |
Manager (See Note 3) | | | 521,041 | |
Fund shares redeemed | | | 230,860 | |
NYLIFE Distributors (See Note 3) | | | 166,594 | |
Shareholder communication | | | 67,007 | |
Professional fees | | | 38,370 | |
Custodian | | | 37,965 | |
Trustees | | | 1,200 | |
Unrealized depreciation on foreign currency forward contracts | | | 2,735,391 | |
| | | | |
Total liabilities | | | 9,366,700 | |
| | | | |
Net assets | | $ | 850,466,935 | |
| | | | |
| |
| Net Assets Consist of | | | | |
Shares of beneficial interest outstanding (par value of $.001 per share) unlimited number of shares authorized | | $ | 78,223 | |
Additional paid-in capital | | | 782,694,952 | |
| | | | |
| | | 782,773,175 | |
Undistributed net investment income | | | 24,304,489 | |
Accumulated net realized gain (loss) on investments and foreign currency transactions | | | 12,794,104 | |
Net unrealized appreciation (depreciation) on investments | | | 32,969,573 | |
Net unrealized appreciation (depreciation) on translation of other assets and liabilities in foreign currencies and foreign currency forward contracts | | | (2,374,406 | ) |
| | | | |
Net assets | | $ | 850,466,935 | |
| | | | |
| | | | |
Initial Class | | | | |
Net assets applicable to outstanding shares | | $ | 56,565,395 | |
| | | | |
Shares of beneficial interest outstanding | | | 5,191,955 | |
| | | | |
Net asset value per share outstanding | | $ | 10.89 | |
| | | | |
Service Class | | | | |
Net assets applicable to outstanding shares | | $ | 793,901,540 | |
| | | | |
Shares of beneficial interest outstanding | | | 73,031,132 | |
| | | | |
Net asset value per share outstanding | | $ | 10.87 | |
| | | | |
| | | | | | |
The notes to the financial statements are an integral part of,
and should be read in conjunction with, the financial statements. | | mainstayinvestments.com | | | M-331 | |
Statement of Operations
for the period February 17, 2012 (inception date) through December 31, 2012
| | | | |
| Investment Income (Loss) | |
Income | | | | |
Dividends (a) | | $ | 28,892,095 | |
Interest | | | 1,221,175 | |
| | | | |
Total income | | | 30,113,270 | |
| | | | |
Expenses | | | | |
Manager (See Note 3) | | | 5,092,923 | |
Distribution and service—Service Class (See Note 3) | | | 1,644,937 | |
Custodian | | | 226,949 | |
Shareholder communication | | | 138,876 | |
Professional fees | | | 74,796 | |
Trustees | | | 17,173 | |
Miscellaneous | | | 37,018 | |
| | | | |
Total expenses | | | 7,232,672 | |
| | | | |
Net investment income (loss) | | | 22,880,598 | |
| | | | |
|
| Realized and Unrealized Gain (Loss) on Investments and Foreign Currency Transactions | |
Net realized gain (loss) on: | | | | |
Security transactions | | | 11,970,891 | |
Foreign currency transactions | | | 2,247,104 | |
| | | | |
Net realized gain (loss) on investments and foreign currency transactions | | | 14,217,995 | |
| | | | |
Net change in unrealized appreciation (depreciation) on: | | | | |
Investments | | | 32,969,573 | |
Translation of other assets and liabilities in foreign currencies and foreign currency forward contracts | | | (2,374,406 | ) |
| | | | |
Net change in unrealized appreciation (depreciation) on investments and foreign currency transactions | | | 30,595,167 | |
| | | | |
Net realized and unrealized gain (loss) on investments and foreign currency transactions | | | 44,813,162 | |
| | | | |
Net increase (decrease) in net assets resulting from operations | | $ | 67,693,760 | |
| | | | |
| (a) | Dividends recorded net of foreign withholding taxes in the amount of $1,823,936. |
| | | | |
| M-332 | | MainStay VP MFS® Utilities Portfolio | | The notes to the financial statements are an integral part of,
and should be read in conjunction with, the financial statements. |
Statements of Changes in Net Assets
for the period February 17, 2012 (inception date) through December 31, 2012
| | | | |
| | | 2012 | |
| Increase (Decrease) in Net Assets | | | | |
Operations: | | | | |
Net investment income (loss) | | $ | 22,880,598 | |
Net realized gain (loss) on investments and foreign currency transactions | | | 14,217,995 | |
Net change in unrealized appreciation (depreciation) on investments and foreign currency transactions | | | 30,595,167 | |
| | | | |
Net increase (decrease) in net assets resulting from operations | | | 67,693,760 | |
| | | | |
Capital share transactions: | | | | |
Net proceeds from sale of shares | | | 874,557,510 | |
Cost of shares redeemed | | | (91,784,335 | ) |
| | | | |
Increase (decrease) in net assets derived from capital share transactions | | | 782,773,175 | |
| | | | |
Net increase (decrease) in net assets | | | 850,466,935 | |
| |
| Net Assets | | | | |
Beginning of period | | | — | |
| | | | |
End of period | | $ | 850,466,935 | |
| | | | |
Undistributed net investment income at end of period | | $ | 24,304,489 | |
| | | | |
| | | | | | |
The notes to the financial statements are an integral part of,
and should be read in conjunction with, the financial statements. | | mainstayinvestments.com | | | M-333 | |
Financial Highlights selected per share data and ratios
| | | | |
| | | Initial Class | |
| | | February 17,
2012**
through
December 31, | |
| | | 2012 | |
Net asset value at beginning of period | | $ | 10.00 | |
| | | | |
Net investment income (loss) (a) | | | 0.33 | |
Net realized and unrealized gain (loss) on investments | | | 0.56 | |
Net realized and unrealized gain (loss) on foreign currency transactions | | | (0.00 | )‡ |
| | | | |
Total from investment operations | | | 0.89 | |
| | | | |
Net asset value at end of period | | $ | 10.89 | |
| | | | |
Total investment return | | | 8.90 | %(b)(c) |
Ratios (to average net assets)/Supplemental Data: | | | | |
Net investment income (loss) | | | 3.66 | %†† |
Net expenses | | | 0.80 | %†† |
Portfolio turnover rate | | | 43 | % |
Net assets at end of period (in 000’s) | | $ | 56,565 | |
| ‡ | Less than one cent per share. |
| (a) | Per share data based on average shares outstanding during the period. |
| (b) | Total investment return is not annualized. |
| (c) | Total investment return may reflect adjustments to conform to generally accepted accounting principles. |
| | | | |
| | | Service Class | |
| | | February 17,
2012**
through
December 31, | |
| | | 2012 | |
Net asset value at beginning of period | | $ | 10.00 | |
| | | | |
Net investment income (loss) (a) | | | 0.30 | |
Net realized and unrealized gain (loss) on investments | | | 0.57 | |
Net realized and unrealized gain (loss) on foreign currency transactions | | | (0.00 | )‡ |
| | | | |
Total from investment operations | | | 0.87 | |
| | | | |
Net asset value at end of period | | $ | 10.87 | |
| | | | |
Total investment return | | | 8.70 | %(b)(c) |
Ratios (to average net assets)/Supplemental Data: | | | | |
Net investment income (loss) | | | 3.26 | %†† |
Net expenses | | | 1.05 | %†† |
Portfolio turnover rate | | | 43 | % |
Net assets at end of period (in 000’s) | | $ | 793,902 | |
| ‡ | Less than one cent per share. |
| (a) | Per share data based on average shares outstanding during the period. |
| (b) | Total investment return is not annualized. |
| (c) | Total investment return may reflect adjustments to conform to generally accepted accounting principles. |
| | | | |
| M-334 | | MainStay VP MFS® Utilities Portfolio | | The notes to the financial statements are an integral part of,
and should be read in conjunction with, the financial statements. |
MainStay VP Mid Cap Core Portfolio
Investment and Performance Comparison (Unaudited)
Performance data quoted represents past performance. Past performance is no guarantee of future results. Because of market volatility, current performance may be lower or higher than the figures shown. Investment return and principal value will fluctuate, and as a result, when shares are redeemed, they may be worth more or less than their original cost. The performance table and graph do not reflect any deduction of sales charges, mortality and expense charges, contract charges or administrative charges. Please refer to the Performance Summary appropriate for your policy. For performance information current to the most recent month-end, please call 800-598-2019 or visit www.newyorklife.com.
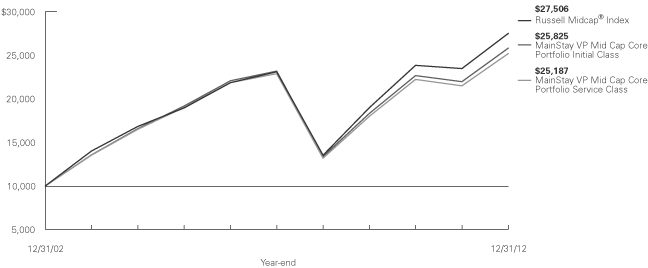
Average Annual Total Returns for the Year Ended December 31, 2012
| | | | | | | | | | | | | | | | |
| Class | | One Year | | | Five Years | | | Ten Years | | | Gross
Expense
Ratio1 | |
| Initial Class Shares | | | 17.52 | % | | | 2.20 | % | | | 9.95 | % | | | 0.90 | % |
| Service Class Shares2 | | | 17.22 | | | | 1.94 | | | | 9.68 | | | | 1.15 | |
| | | | | | | | | | | | |
| Benchmark Performance | | One
Year | | | Five
Years | | | Ten
Years | |
Russell Midcap® Index3 | | | 17.28 | % | | | 3.57 | % | | | 10.65 | % |
Average Lipper Variable Products Mid-Cap Core Portfolio4 | | | 16.07 | | | | 2.82 | | | | 8.96 | |
| 1. | The gross expense ratios presented reflect the Portfolio’s “Total Annual Portfolio Operating Expenses” from the most recent Prospectus and may differ from other expense ratios disclosed in this report. |
| 2. | Performance for Service Class shares, first offered June 5, 2003, includes the historical performance of Initial Class shares through June 4, 2003 adjusted to reflect the fees and expenses of Service Class shares. |
| 3. | Please refer to pages M-2 and M-3 for additional explanations and disclosure regarding the Portfolios, their benchmark indices and other indices mentioned in the reports. |
| 4. | The Average Lipper Variable Products Mid-Cap Core Portfolio is representative of portfolios that, by portfolio practice, invest at least 75% of their equity assets in companies with market capitalizations (on a three-year weighted basis) below Lipper’s U.S. diversified equity large-cap floor. Mid-cap core portfolios have more latitude in the companies in which they invest. These portfolios typically have an average price-to-earnings ratio, price-to-book ratio, and three-year sales-per-share growth value, compared to the S&P MidCap 400® Index. Lipper Inc. is an independent monitor of fund performance. Results are based on total returns with all dividend and capital gain distributions reinvested. |
| | |
| mainstayinvestments.com | | M-335 |
Cost in Dollars of a $1,000 Investment in MainStay VP Mid Cap Core Portfolio (Unaudited)
The example below is intended to describe the fees and expenses borne by shareholders during the six-month period from July 1, 2012 to December 31, 2012, and the impact of those costs on your investment.
Example
As a shareholder of the Portfolio, you incur two types of costs: (1) transaction costs, including exchange fees and sales charges (loads) on purchases (as applicable), and (2) ongoing costs, including management fees, distribution and/or service (12b-1) fees, and other Portfolio expenses (as applicable). This example is intended to help you understand your ongoing costs (in dollars) of investing in the Portfolio and to compare these costs with the ongoing costs of investing in other Portfolios. The example is based on an investment of $1,000 made at the beginning of the six-month period and held for the entire period from July 1, 2012, to December 31, 2012. Shares are only sold in connection with variable life and annuity contracts and the example does not reflect any contract level or transactional fees or expenses. If these costs had been included, your costs would have been higher.
This example illustrates your Portfolio’s ongoing costs in two ways:
Actual Expenses
The second and third data columns in the table below provide information about actual account values and actual expenses. You may use the information in these columns, together with the amount you invested, to estimate the expenses that you paid during the six months ended
December 31, 2012. Simply divide your account value by $1,000 (for example, an $8,600 account value divided by $1,000 = 8.6), then multiply the result by the number under the heading entitled ‘‘Expenses Paid During Period’’ to estimate the expenses you paid on your account during this period.
Hypothetical Example for Comparison Purposes
The fourth and fifth data columns in the table below provide information about hypothetical account values and hypothetical expenses based on the Portfolio’s actual expense ratio and an assumed rate of return of 5% per year before expenses, which is not the Portfolio’s actual return. The hypothetical account values and expenses may not be used to estimate the actual ending account balances or expenses you paid for the six-month period shown. You may use this information to compare the ongoing costs of investing in the Portfolio with the ongoing costs of investing in other Portfolios. To do so, compare this 5% hypothetical example with the 5% hypothetical examples that appear in the shareholder reports of the other Portfolios.
Please note that the expenses shown in the table are meant to highlight your ongoing costs only and do not reflect any transactional costs, such as exchange fees or sales charges (loads). Therefore, the fourth and fifth data columns of the table are useful in comparing ongoing costs only and will not help you determine the relative total costs of owning different funds. In addition, if these transactional costs were included, your costs would have been higher.
| | | | | | | | | | | | | | | | | | | | |
| | | | | | | | | | | | | | | | |
| Share Class | | Beginning
Account
Value
7/1/12 | | | Ending Account
Value (Based
on Actual
Returns and
Expenses)
12/31/12 | | | Expenses
Paid
During
Period1 | | | Ending Account
Value (Based
on Hypothetical
5% Annualized
Return and
Actual Expenses)
12/31/12 | | | Expenses
Paid
During
Period1 | |
| | | | | |
| Initial Class Shares | | $ | 1,000.00 | | | $ | 1,092.20 | | | $ | 4.68 | | | $ | 1,020.70 | | | $ | 4.52 | |
| | | | | |
| Service Class Shares | | $ | 1,000.00 | | | $ | 1,090.80 | | | $ | 5.99 | | | $ | 1,019.40 | | | $ | 5.79 | |
| 1. | Expenses are equal to the Portfolio’s annualized expense ratio of each class (0.89% for Initial Class and 1.14% for Service Class) multiplied by the average account value over the period, divided by 366 and multiplied by 184 (to reflect the six-month period). The table above represents the actual expenses incurred during the six-month period. |
| | |
| M-336 | | MainStay VP Mid Cap Core Portfolio |
Industry Composition as of December 31, 2012 (Unaudited)
| | | | |
| Insurance | | | 6.5 | % |
| Specialty Retail | | | 5.9 | |
| Real Estate Investment Trusts | | | 5.6 | |
| Chemicals | | | 5.0 | |
| Health Care Providers & Services | | | 4.8 | |
| Media | | | 4.8 | |
| Oil, Gas & Consumable Fuels | | | 4.7 | |
| Software | | | 4.5 | |
| IT Services | | | 4.1 | |
| Food Products | | | 3.5 | |
| Health Care Equipment & Supplies | | | 2.9 | |
| Capital Markets | | | 2.6 | |
| Biotechnology | | | 2.5 | |
| Machinery | | | 2.5 | |
| Aerospace & Defense | | | 2.2 | |
| Airlines | | | 1.9 | |
| Internet Software & Services | | | 1.9 | |
| Energy Equipment & Services | | | 1.8 | |
| Communications Equipment | | | 1.7 | |
| Multiline Retail | | | 1.7 | |
| Pharmaceuticals | | | 1.7 | |
| Commercial Banks | | | 1.5 | |
| Food & Staples Retailing | | | 1.5 | |
| Household Durables | | | 1.5 | |
| Wireless Telecommunication Services | | | 1.5 | |
| Auto Components | | | 1.3 | |
| Hotels, Restaurants & Leisure | | | 1.2 | |
| Textiles, Apparel & Luxury Goods | | | 1.2 | |
| Computers & Peripherals | | | 1.1 | |
| Independent Power Producers & Energy Traders | | | 1.1 | |
| Commercial Services & Supplies | | | 1.0 | |
| | | | |
| Diversified Telecommunication Services | | | 1.0 | % |
| Electric Utilities | | | 1.0 | |
| Internet & Catalog Retail | | | 1.0 | |
| Semiconductors & Semiconductor Equipment | | | 1.0 | |
| Paper & Forest Products | | | 0.9 | |
| Professional Services | | | 0.8 | |
| Beverages | | | 0.7 | |
| Construction & Engineering | | | 0.7 | |
| Exchange Traded Funds | | | 0.7 | |
| Life Sciences Tools & Services | | | 0.7 | |
| Building Products | | | 0.6 | |
| Containers & Packaging | | | 0.6 | |
| Automobiles | | | 0.5 | |
| Diversified Financial Services | | | 0.5 | |
| Household Products | | | 0.5 | |
| Multi-Utilities | | | 0.5 | |
| Personal Products | | | 0.5 | |
| Trading Companies & Distributors | | | 0.4 | |
| Electrical Equipment | | | 0.3 | |
| Electronic Equipment & Instruments | | | 0.3 | |
| Gas Utilities | | | 0.3 | |
| Road & Rail | | | 0.3 | |
| Health Care Technology | | | 0.2 | |
| Tobacco | | | 0.2 | |
| Thrifts & Mortgage Finance | | | 0.1 | |
| Metals & Mining | | | 0.0 | ‡ |
| Real Estate Management & Development | | | 0.0 | ‡ |
| Short-Term Investment | | | 0.1 | |
| Other Assets, Less Liabilities | | | (0.1 | ) |
| | | | |
| | | 100.0 | % |
| | | | |
See Portfolio of Investments beginning on page M-340 for specific holdings within these categories.
| ‡ | Less than one-tenth of a percent. |
Top Ten Holdings as of December 31, 2012 (excluding short-term investment) (Unaudited)
| 1. | Marathon Petroleum Corp. |
| 8. | AmerisourceBergen Corp. |
| | | | |
| mainstayinvestments.com | | | M-337 | |
Portfolio Management Discussion and Analysis (Unaudited)
Answers to the questions reflect the views of portfolio managers Harvey J. Fram, CFA, and Migene Kim, CFA, of Madison Square Investors LLC,1 the Portfolio’s Subadvisor.
How did MainStay VP Mid Cap Core Portfolio perform relative to its peers and its benchmark during the 12 months ended December 31, 2012?
For the 12 months ended December 31, 2012, MainStay VP Mid Cap Core Portfolio returned 17.52% for Initial Class shares and 17.22% for Service Class shares. Over the same period, both share classes outperformed the 16.07% return of the average Lipper2 Variable Products Mid-Cap Core Portfolio. Initial Class shares outperformed—and Service Class shares underperformed—the 17.28% return of the Russell Midcap® Index2 for the 12 months ended December 31, 2012. The Russell Midcap® Index is the Portfolio’s broad-based securities-market index.
What factors affected the Portfolio’s relative performance during the reporting period?
In 2012, stock market performance was affected by concerns about Europe, the fiscal cliff, stubbornly slow (though positive) economic growth in the United States and slowing growth in China. The most important factor that affected the relative performance of the Portfolio, however, was the remarkably low valuation levels at which many stocks started the year. By year-end, almost all of them had not only survived but had seen their multiples expand. The best example of this was in the energy sector, where refinery stocks were particularly strong contributors. (Contributions take weightings and total returns into account.) The turnaround in the housing market also affected relative performance. The price of PulteGroup shares almost tripled, and the Portfolio held an overweight position in the stock.
Which sectors were the strongest positive contributors to the Portfolio’s relative performance, and which sectors were particularly weak?
Relative to the Russell Midcap® Index, energy, materials and consumer discretionary made the strongest positive sector contributions to the Portfolio’s excess returns, all helped by favorable stock selection. Energy was by far the strongest positive contributor, as refinery stocks such as Tesoro, Valero Energy and HollyFrontier outperformed, after starting the year at extremely attractive valuations. Favorable stock selection in the materials sector, including overweight positions in chemical companies PPG Industries and
Sherwin-Williams, also helped the Portfolio’s relative performance. Overweight positions in home construction stocks such as PulteGroup helped relative performance in the consumer discretionary sector.
Industrials, telecommunication services and information technology were the sectors that detracted the most from the Portfolio’s relative performance. Unfavorable stock selection in industrials and telecommunication services hurt performance. The information technology sector underperformed the Russell Midcap® Index; and the Portfolio held an overweight position in the sector, which detracted from relative performance.
During the reporting period, which individual stocks made the strongest positive contributions to the Portfolio’s absolute performance, and which stocks detracted the most?
The strongest individual positive contributions to the Portfolio’s absolute performance came from oil, gas & consumable fuels companies Tesoro and Valero Energy and from chemical company PPG Industries. Oil refiners like Tesoro and Valero Energy did well after starting the year at extremely attractive valuations. Through divestiture, acquisition, and good old-fashioned growth, PPG Industries moved its product mix toward coatings and optical products—businesses that helped it provide relatively stable results.
Negative absolute performers included semiconductor company Advanced Micro Devices, energy equipment & services company Superior Energy Services and retailer J.C. Penney. Advanced Micro Devices has not been a substantial participant in the smart-phone boom and has been hurt as tablet computers have eroded sales of traditional PCs. Shares of Superior Energy Services suffered as the company lowered its guidance on its 2012 non-GAAP adjusted earnings from continuing operations. J.C. Penney’s performance was hurt by macro worries and growth constraints, along with uncertainty regarding a transformation engineered by the new executive
team led by CEO Ron Johnson.
| 1. | Effective on or about January 25, 2013, Madison Square Investors LLC changed its name to Cornerstone Capital Management Holdings LLC. |
| 2. | Please refer to pages M-2 and M-3 for additional explanations and disclosure regarding the Portfolios, their benchmark indices and service providers mentioned in the reports. |
| | |
| M-338 | | MainStay VP Mid Cap Core Portfolio |
Did the Portfolio make any significant purchases or sales during the reporting period?
Among the Portfolio positions that we sold or reduced during 2012 were real estate investment trust (REIT) Annaly Capital Management and food products company ConAgra Foods. Annaly Capital Management underperformed when the market took a negative view of the company’s possible acquisition of Crexus, a mortgage REIT. We sold ConAgra Foods as the stock became more expensive after its run-up during the year.
We increased the Portfolio’s positions in stocks such as real estate investment trust Ventas and household durables company Whirlpool. Ventas has benefited from growth in its asset base from $5.8 billion at the close of 2010 to nearly $18 billion. Shares of appliance maker Whirlpool advanced as the company benefited from the housing recovery.
How did the Portfolio’s sector weightings change during the reporting period?
During 2012, the Portfolio’s most substantial sector-weighting increases relative to the Russell Midcap® Index were in utilities and information technology. Over the same period, we decreased the Portfolio’s weightings in the health care and telecommunication services sectors.
How was the Portfolio positioned at the end of the reporting period?
As of December 31, 2012, the Portfolio’s most substantially overweight sector positions relative to the Russell Midcap® Index were in consumer discretionary and information technology. As of the same date, the Portfolio’s most substantially underweight sector positions were in financials and industrials.
The opinions expressed are those of the portfolio managers as of the date of this report and are subject to change. There is no guarantee that any forecasts made will come to pass. This material does not constitute investment advice and is not intended as an endorsement of any specific investment.
Not all MainStay VP Portfolios and/or share classes are available under all policies.
| | | | |
| mainstayinvestments.com | | | M-339 | |
Portfolio of Investments December 31, 2012
| | | | | | | | |
| | |
Shares | | | Value | |
| | | | | | | | |
| Common Stocks 99.3%† | |
Aerospace & Defense 2.2% | |
Alliant Techsystems, Inc. | | | 34,328 | | | $ | 2,126,963 | |
Engility Holdings, Inc. (a) | | | 60,489 | | | | 1,165,018 | |
Huntington Ingalls Industries, Inc. | | | 71,835 | | | | 3,113,329 | |
L-3 Communications Holdings, Inc. | | | 28,627 | | | | 2,193,401 | |
Spirit Aerosystems Holdings, Inc.
Class A (a) | | | 72,797 | | | | 1,235,365 | |
Textron, Inc. | | | 65,208 | | | | 1,616,506 | |
| | | | | | | | |
| | | | | | | 11,450,582 | |
| | | | | | | | |
Airlines 1.9% | |
Copa Holdings S.A. Class A | | | 2,343 | | | | 233,011 | |
Delta Air Lines, Inc. (a) | | | 306,240 | | | | 3,635,069 | |
Southwest Airlines Co. | | | 233,068 | | | | 2,386,616 | |
United Continental Holdings, Inc. (a) | | | 158,930 | | | | 3,715,784 | |
| | | | | | | | |
| | | | | | | 9,970,480 | |
| | | | | | | | |
Auto Components 1.3% | |
Delphi Automotive PLC (a) | | | 104,846 | | | | 4,010,359 | |
Goodyear Tire & Rubber Co. (The) (a) | | | 190,744 | | | | 2,634,175 | |
| | | | | | | | |
| | | | | | | 6,644,534 | |
| | | | | | | | |
Automobiles 0.5% | |
Thor Industries, Inc. | | | 70,422 | | | | 2,635,895 | |
| | | | | | | | |
|
Beverages 0.7% | |
Constellation Brands, Inc. Class A (a) | | | 96,042 | | | | 3,398,926 | |
| | | | | | | | |
|
Biotechnology 2.5% | |
Alexion Pharmaceuticals, Inc. (a) | | | 9,232 | | | | 866,054 | |
Ariad Pharmaceuticals, Inc. (a) | | | 49,934 | | | | 957,734 | |
BioMarin Pharmaceutical, Inc. (a) | | | 10,423 | | | | 513,333 | |
Myriad Genetics, Inc. (a) | | | 106,560 | | | | 2,903,760 | |
Onyx Pharmaceuticals, Inc. (a) | | | 34,499 | | | | 2,605,710 | |
Regeneron Pharmaceuticals, Inc. (a) | | | 2,799 | | | | 478,825 | |
United Therapeutics Corp. (a) | | | 33,153 | | | | 1,771,033 | |
Vertex Pharmaceuticals, Inc. (a) | | | 65,061 | | | | 2,728,658 | |
| | | | | | | | |
| | | | | | | 12,825,107 | |
| | | | | | | | |
Building Products 0.6% | |
Lennox International, Inc. | | | 10,245 | | | | 538,067 | |
Masco Corp. | | | 157,306 | | | | 2,620,718 | |
| | | | | | | | |
| | | | | | | 3,158,785 | |
| | | | | | | | |
Capital Markets 2.6% | |
American Capital Ltd. (a) | | | 184,900 | | | | 2,218,800 | |
Eaton Vance Corp. | | | 4,420 | | | | 140,777 | |
Janus Capital Group, Inc. | | | 351,100 | | | | 2,991,372 | |
Lazard, Ltd. Class A | | | 4,649 | | | | 138,726 | |
Northern Trust Corp. | | | 54,287 | | | | 2,723,036 | |
| | | | | | | | |
| | |
Shares | | | Value | |
| | | | | | | | |
Capital Markets (continued) | |
T. Rowe Price Group, Inc. | | | 46,285 | | | $ | 3,014,542 | |
TD Ameritrade Holding Corp. | | | 20,881 | | | | 351,010 | |
Waddell & Reed Financial, Inc. Class A | | | 47,726 | | | | 1,661,819 | |
| | | | | | | | |
| | | | | | | 13,240,082 | |
| | | | | | | | |
Chemicals 5.0% | |
CF Industries Holdings, Inc. | | | 19,890 | | | | 4,040,852 | |
Huntsman Corp. | | | 191,847 | | | | 3,050,367 | |
NewMarket Corp. | | | 6,379 | | | | 1,672,574 | |
¨PPG Industries, Inc. | | | 40,115 | | | | 5,429,565 | |
Sherwin-Williams Co. (The) | | | 25,012 | | | | 3,847,346 | |
Valspar Corp. (The) | | | 17,652 | | | | 1,101,485 | |
W.R. Grace & Co. (a) | | | 50,655 | | | | 3,405,536 | |
Westlake Chemical Corp. | | | 37,927 | | | | 3,007,611 | |
| | | | | | | | |
| | | | | | | 25,555,336 | |
| | | | | | | | |
Commercial Banks 1.5% | |
CapitalSource, Inc. | | | 52,592 | | | | 398,647 | |
East West Bancorp, Inc. | | | 20,241 | | | | 434,979 | |
First Citizens BancShares, Inc. Class A | | | 1,065 | | | | 174,128 | |
KeyCorp | | | 375,120 | | | | 3,158,510 | |
Regions Financial Corp. | | | 379,033 | | | | 2,698,715 | |
SunTrust Banks, Inc. | | | 18,723 | | | | 530,797 | |
SVB Financial Group (a) | | | 7,073 | | | | 395,876 | |
| | | | | | | | |
| | | | | | | 7,791,652 | |
| | | | | | | | |
Commercial Services & Supplies 1.0% | |
Avery Dennison Corp. | | | 94,162 | | | | 3,288,137 | |
Cintas Corp. | | | 3,313 | | | | 135,502 | |
Iron Mountain, Inc. | | | 56,515 | | | | 1,754,791 | |
KAR Auction Services, Inc. | | | 2,271 | | | | 45,965 | |
| | | | | | | | |
| | | | | | | 5,224,395 | |
| | | | | | | | |
Communications Equipment 1.7% | |
Brocade Communications Systems, Inc. (a) | | | 303,229 | | | | 1,616,211 | |
EchoStar Corp. Class A (a) | | | 4,825 | | | | 165,111 | |
Harris Corp. | | | 70,490 | | | | 3,451,190 | |
Juniper Networks, Inc. (a) | | | 77 | | | | 1,515 | |
Riverbed Technology, Inc. (a) | | | 172,814 | | | | 3,407,892 | |
| | | | | | | | |
| | | | | | | 8,641,919 | |
| | | | | | | | |
Computers & Peripherals 1.1% | |
NetApp, Inc. (a) | | | 87,393 | | | | 2,932,035 | |
Western Digital Corp. | | | 63,194 | | | | 2,685,113 | |
| | | | | | | | |
| | | | | | | 5,617,148 | |
| | | | | | | | |
Construction & Engineering 0.7% | |
AECOM Technology Corp. (a) | | | 74,584 | | | | 1,775,099 | |
Chicago Bridge & Iron Co. N.V. | | | 29,657 | | | | 1,374,602 | |
Shaw Group, Inc. (The) (a) | | | 7,811 | | | | 364,071 | |
| | | | | | | | |
| | | | | | | 3,513,772 | |
| | | | | | | | |
| † | Percentages indicated are based on Portfolio net assets. |
| ¨ | Among the Portfolio’s 10 largest holdings, as of December 31, 2012, excluding short-term investment. May be subject to change daily. |
| | | | |
| M-340 | | MainStay VP Mid Cap Core Portfolio | | The notes to the financial statements are an integral part of,
and should be read in conjunction with, the financial statements. |
| | | | | | | | |
| | |
Shares | | | Value | |
| | | | | | | | |
| Common Stocks (continued) | |
Containers & Packaging 0.6% | |
Ball Corp. | | | 41,263 | | | $ | 1,846,519 | |
Greif, Inc. Class A | | | 33,502 | | | | 1,490,839 | |
| | | | | | | | |
| | | | | | | 3,337,358 | |
| | | | | | | | |
Diversified Financial Services 0.5% | |
Interactive Brokers Group, Inc. Class A | | | 54,417 | | | | 744,425 | |
IntercontinentalExchange, Inc. (a) | | | 656 | | | | 81,219 | |
Leucadia National Corp. | | | 61,869 | | | | 1,471,864 | |
Moody’s Corp. | | | 4,888 | | | | 245,964 | |
| | | | | | | | |
| | | | | | | 2,543,472 | |
| | | | | | | | |
Diversified Telecommunication Services 1.0% | |
Frontier Communications Corp. | | | 694,784 | | | | 2,973,676 | |
tw telecom, Inc. (a) | | | 90,713 | | | | 2,310,460 | |
| | | | | | | | |
| | | | | | | 5,284,136 | |
| | | | | | | | |
Electric Utilities 1.0% | |
Edison International | | | 61,361 | | | | 2,772,904 | |
Entergy Corp. | | | 20,973 | | | | 1,337,029 | |
Xcel Energy, Inc. | | | 30,751 | | | | 821,359 | |
| | | | | | | | |
| | | | | | | 4,931,292 | |
| | | | | | | | |
Electrical Equipment 0.3% | |
Eaton Corp. PLC | | | 10,523 | | | | 570,347 | |
General Cable Corp. (a) | | | 38,812 | | | | 1,180,273 | |
| | | | | | | | |
| | | | | | | 1,750,620 | |
| | | | | | | | |
Electronic Equipment & Instruments 0.3% | |
Itron, Inc. (a) | | | 16,910 | | | | 753,341 | |
Jabil Circuit, Inc. | | | 41,366 | | | | 797,950 | |
Tech Data Corp. (a) | | | 3,681 | | | | 167,596 | |
| | | | | | | | |
| | | | | | | 1,718,887 | |
| | | | | | | | |
Energy Equipment & Services 1.8% | |
Diamond Offshore Drilling, Inc. | | | 49,280 | | | | 3,349,069 | |
Helmerich & Payne, Inc. | | | 52,012 | | | | 2,913,192 | |
RPC, Inc. | | | 198,965 | | | | 2,435,332 | |
Unit Corp. (a) | | | 13,226 | | | | 595,831 | |
| | | | | | | | |
| | | | | | | 9,293,424 | |
| | | | | | | | |
Food & Staples Retailing 1.5% | |
¨Kroger Co. (The) | | | 170,407 | | | | 4,433,990 | |
Safeway, Inc. | | | 102,209 | | | | 1,848,961 | |
Whole Foods Market, Inc. | | | 18,124 | | | | 1,655,265 | |
| | | | | | | | |
| | | | | | | 7,938,216 | |
| | | | | | | | |
Food Products 3.5% | |
ConAgra Foods, Inc. | | | 2,789 | | | | 82,275 | |
Dean Foods Co. (a) | | | 188,688 | | | | 3,115,239 | |
H.J. Heinz Co. | | | 1,420 | | | | 81,906 | |
Hershey Co. (The) | | | 2,726 | | | | 196,872 | |
Hillshire Brands Co. | | | 93,142 | | | | 2,621,016 | |
| | | | | | | | |
| | |
Shares | | | Value | |
| | | | | | | | |
Food Products (continued) | | | | | | | | |
Ingredion, Inc. | | | 52,081 | | | $ | 3,355,579 | |
J.M. Smucker Co. (The) | | | 12,987 | | | | 1,119,999 | |
Ralcorp Holdings, Inc. (a) | | | 3,164 | | | | 283,652 | |
Smithfield Foods, Inc. (a) | | | 146,356 | | | | 3,156,899 | |
Tyson Foods, Inc. Class A | | | 186,026 | | | | 3,608,904 | |
WhiteWave Foods Co. Class A (a) | | | 17,816 | | | | 276,861 | |
| | | | | | | | |
| | | | | | | 17,899,202 | |
| | | | | | | | |
Gas Utilities 0.3% | |
ONEOK, Inc. | | | 31,220 | | | | 1,334,655 | |
UGI Corp. | | | 1,088 | | | | 35,588 | |
| | | | | | | | |
| | | | | | | 1,370,243 | |
| | | | | | | | |
Health Care Equipment & Supplies 2.9% | |
Boston Scientific Corp. (a) | | | 666,309 | | | | 3,817,950 | |
Hill-Rom Holdings, Inc. | | | 69,849 | | | | 1,990,696 | |
ResMed, Inc. | | | 82,686 | | | | 3,437,257 | |
St. Jude Medical, Inc. | | | 88,176 | | | | 3,186,681 | |
Varian Medical Systems, Inc. (a) | | | 2,957 | | | | 207,700 | |
Zimmer Holdings, Inc. | | | 31,462 | | | | 2,097,257 | |
| | | | | | | | |
| | | | | | | 14,737,541 | |
| | | | | | | | |
Health Care Providers & Services 4.8% | |
¨AmerisourceBergen Corp. | | | 95,006 | | | | 4,102,359 | |
Cigna Corp. | | | 54,250 | | | | 2,900,205 | |
Community Health Systems, Inc. | | | 104,367 | | | | 3,208,242 | |
Coventry Health Care, Inc. | | | 15,849 | | | | 710,511 | |
DaVita, Inc. (a) | | | 18,461 | | | | 2,040,494 | |
HCA Holdings, Inc. | | | 107,750 | | | | 3,250,817 | |
Health Management Associates, Inc.
Class A (a) | | | 363,405 | | | | 3,386,935 | |
Health Net, Inc. (a) | | | 16,133 | | | | 392,032 | |
Laboratory Corp. of America Holdings (a) | | | 16,589 | | | | 1,436,939 | |
Omnicare, Inc. | | | 77,715 | | | | 2,805,512 | |
Patterson Cos., Inc. | | | 474 | | | | 16,225 | |
Tenet Healthcare Corp. (a) | | | 9,635 | | | | 312,848 | |
| | | | | | | | |
| | | | | | | 24,563,119 | |
| | | | | | | | |
Health Care Technology 0.2% | |
Allscripts Healthcare Solutions, Inc. (a) | | | 82,608 | | | | 778,167 | |
| | | | | | | | |
|
Hotels, Restaurants & Leisure 1.2% | |
Brinker International, Inc. | | | 99,307 | | | | 3,077,524 | |
Darden Restaurants, Inc. | | | 1,003 | | | | 45,205 | |
Starwood Hotels & Resorts Worldwide, Inc. | | | 37,039 | | | | 2,124,557 | |
Wynn Resorts, Ltd. | | | 6,883 | | | | 774,269 | |
| | | | | | | | |
| | | | | | | 6,021,555 | |
| | | | | | | | |
Household Durables 1.5% | |
Leggett & Platt, Inc. | | | 1,895 | | | | 51,582 | |
PulteGroup, Inc. (a) | | | 201,873 | | | | 3,666,014 | |
Whirlpool Corp. | | | 36,942 | | | | 3,758,848 | |
| | | | | | | | |
| | | | | | | 7,476,444 | |
| | | | | | | | |
| | | | | | |
The notes to the financial statements are an integral part of,
and should be read in conjunction with, the financial statements. | | mainstayinvestments.com | | | M-341 | |
Portfolio of Investments December 31, 2012 (continued)
| | | | | | | | |
| | |
Shares | | | Value | |
| | | | | | | | |
| Common Stocks (continued) | |
Household Products 0.5% | |
Energizer Holdings, Inc. | | | 31,822 | | | $ | 2,545,124 | |
| | | | | | | | |
|
Independent Power Producers & Energy Traders 1.1% | |
AES Corp. (The) | | | 238,363 | | | | 2,550,484 | |
NRG Energy, Inc. | | | 136,976 | | | | 3,149,078 | |
| | | | | | | | |
| | | | | | | 5,699,562 | |
| | | | | | | | |
Insurance 6.5% | |
Alleghany Corp. (a) | | | 1,851 | | | | 620,862 | |
Allied World Assurance Co. Holdings, A.G. | | | 30,416 | | | | 2,396,781 | |
American National Insurance Co. | | | 3,249 | | | | 221,874 | |
Aspen Insurance Holdings, Ltd. | | | 59,651 | | | | 1,913,604 | |
Assurant, Inc. | | | 54,167 | | | | 1,879,595 | |
Assured Guaranty, Ltd. | | | 97,759 | | | | 1,391,111 | |
Axis Capital Holdings, Ltd. | | | 85,828 | | | | 2,973,082 | |
CNA Financial Corp. | | | 20,087 | | | | 562,637 | |
Everest Re Group, Ltd. | | | 29,674 | | | | 3,262,656 | |
Fidelity National Financial, Inc. Class A | | | 145,680 | | | | 3,430,764 | |
Hartford Financial Services Group, Inc. (The) | | | 126,686 | | | | 2,842,834 | |
PartnerRe, Ltd. | | | 28,944 | | | | 2,329,702 | |
Principal Financial Group, Inc. | | | 43,282 | | | | 1,234,403 | |
ProAssurance Corp. | | | 10,062 | | | | 424,516 | |
Protective Life Corp. | | | 52,803 | | | | 1,509,110 | |
Reinsurance Group of America, Inc. | | | 12,042 | | | | 644,488 | |
RenaissanceRe Holdings, Ltd. | | | 1,436 | | | | 116,689 | |
StanCorp Financial Group, Inc. | | | 81,293 | | | | 2,981,014 | |
Validus Holdings, Ltd. | | | 74,489 | | | | 2,575,830 | |
| | | | | | | | |
| | | | | | | 33,311,552 | |
| | | | | | | | |
Internet & Catalog Retail 1.0% | |
Expedia, Inc. | | | 33,781 | | | | 2,075,843 | |
Liberty Interactive Corp. Class A (a) | | | 158,227 | | | | 3,113,907 | |
| | | | | | | | |
| | | | | | | 5,189,750 | |
| | | | | | | | |
Internet Software & Services 1.9% | |
Akamai Technologies, Inc. (a) | | | 68,751 | | | | 2,812,604 | |
AOL, Inc. (a) | | | 51,812 | | | | 1,534,153 | |
Equinix, Inc. (a) | | | 707 | | | | 145,783 | |
IAC / InterActiveCorp | | | 40,246 | | | | 1,903,636 | |
VeriSign, Inc. (a) | | | 88,893 | | | | 3,450,826 | |
| | | | | | | | |
| | | | | | | 9,847,002 | |
| | | | | | | | |
IT Services 4.1% | |
Alliance Data Systems Corp. (a) | | | 14,032 | | | | 2,031,272 | |
Booz Allen Hamilton Holding Corp. | | | 85,918 | | | | 1,195,978 | |
Broadridge Financial Solutions, Inc. | | | 74,511 | | | | 1,704,812 | |
Computer Sciences Corp. | | | 55,333 | | | | 2,216,087 | |
CoreLogic, Inc. (a) | | | 117,870 | | | | 3,173,060 | |
Fidelity National Information Services, Inc. | | | 2,412 | | | | 83,962 | |
Gartner, Inc. (a) | | | 14,239 | | | | 655,279 | |
| | | | | | | | |
| | |
Shares | | | Value | |
| | | | | | | | |
IT Services (continued) | | | | | | | | |
Global Payments, Inc. | | | 41,100 | | | $ | 1,861,830 | |
Lender Processing Services, Inc. | | | 95,513 | | | | 2,351,530 | |
NeuStar, Inc. Class A (a) | | | 66,904 | | | | 2,805,285 | |
Total System Services, Inc. | | | 33,231 | | | | 711,808 | |
Western Union Co. (The) | | | 156,775 | | | | 2,133,708 | |
| | | | | | | | |
| | | | | | | 20,924,611 | |
| | | | | | | | |
Life Sciences Tools & Services 0.7% | |
Agilent Technologies, Inc. | | | 86,462 | | | | 3,539,754 | |
Charles River Laboratories International, Inc. (a) | | | 527 | | | | 19,747 | |
Covance, Inc. (a) | | | 5,058 | | | | 292,201 | |
| | | | | | | | |
| | | | | | | 3,851,702 | |
| | | | | | | | |
Machinery 2.5% | |
Gardner Denver, Inc. | | | 10,642 | | | | 728,977 | |
¨ Ingersoll-Rand PLC | | | 84,428 | | | | 4,049,167 | |
Oshkosh Corp. (a) | | | 107,899 | | | | 3,199,205 | |
Terex Corp. (a) | | | 89,478 | | | | 2,515,227 | |
Toro Co. (The) | | | 57,124 | | | | 2,455,190 | |
WABCO Holdings, Inc. (a) | | | 1,860 | | | | 121,253 | |
| | | | | | | | |
| | | | | | | 13,069,019 | |
| | | | | | | | |
Media 4.8% | |
Cablevision Systems Corp. Class A | | | 212,211 | | | | 3,170,432 | |
Charter Communications, Inc. Class A (a) | | | 41,911 | | | | 3,195,295 | |
Cinemark Holdings, Inc. | | | 119,527 | | | | 3,105,311 | |
DISH Network Corp. Class A | | | 54,964 | | | | 2,000,690 | |
Gannett Co., Inc. | | | 185,663 | | | | 3,343,791 | |
Liberty Global, Inc. Class A (a) | | | 15,796 | | | | 994,990 | |
Omnicom Group, Inc. | | | 19,734 | | | | 985,911 | |
Regal Entertainment Group Class A | | | 198,350 | | | | 2,766,982 | |
¨Virgin Media, Inc. | | | 113,239 | | | | 4,161,533 | |
Washington Post Co. Class B | | | 2,437 | | | | 890,017 | |
| | | | | | | | |
| | | | | | | 24,614,952 | |
| | | | | | | | |
Metals & Mining 0.0%‡ | |
United States Steel Corp. | | | 140 | | | | 3,342 | |
| | | | | | | | |
|
Multi-Utilities 0.5% | |
Ameren Corp. | | | 2,737 | | | | 84,080 | |
CenterPoint Energy, Inc. | | | 36,047 | | | | 693,905 | |
DTE Energy Co. | | | 27,320 | | | | 1,640,566 | |
| | | | | | | | |
| | | | | | | 2,418,551 | |
| | | | | | | | |
Multiline Retail 1.7% | |
Dillard���s, Inc. Class A | | | 36,434 | | | | 3,052,076 | |
Kohl’s Corp. | | | 75,324 | | | | 3,237,426 | |
Macy’s, Inc. | | | 63,495 | | | | 2,477,575 | |
| | | | | | | | |
| | | | | | | 8,767,077 | |
| | | | | | | | |
Oil, Gas & Consumable Fuels 4.7% | |
EXCO Resources, Inc. | | | 261,780 | | | | 1,772,251 | |
HollyFrontier Corp. | | | 86,923 | | | | 4,046,266 | |
| | | | |
| M-342 | | MainStay VP Mid Cap Core Portfolio | | The notes to the financial statements are an integral part of,
and should be read in conjunction with, the financial statements. |
| | | | | | | | |
| | |
Shares | | | Value | |
| | | | | | | | |
| Common Stocks (continued) | |
Oil, Gas & Consumable Fuels (continued) | |
¨Marathon Petroleum Corp. | | | 87,475 | | | $ | 5,510,925 | |
¨Murphy Oil Corp. | | | 68,856 | | | | 4,100,375 | |
Tesoro Corp. | | | 84,332 | | | | 3,714,824 | |
¨Valero Energy Corp. | | | 152,893 | | | | 5,216,709 | |
WPX Energy, Inc. (a) | | | 5,517 | | | | 82,093 | |
| | | | | | | | |
| | | | | | | 24,443,443 | |
| | | | | | | | |
Paper & Forest Products 0.9% | |
Domtar Corp. | | | 31,981 | | | | 2,671,053 | |
International Paper Co. | | | 43,605 | | | | 1,737,223 | |
| | | | | | | | |
| | | | | | | 4,408,276 | |
| | | | | | | | |
Personal Products 0.5% | |
Nu Skin Enterprises, Inc. Class A | | | 71,738 | | | | 2,657,893 | |
| | | | | | | | |
|
Pharmaceuticals 1.7% | |
Forest Laboratories, Inc. (a) | | | 101,435 | | | | 3,582,684 | |
Salix Pharmaceuticals, Ltd. (a) | | | 36,050 | | | | 1,459,304 | |
Warner Chilcott PLC Class A | | | 235,478 | | | | 2,835,155 | |
Watson Pharmaceuticals, Inc. (a) | | | 7,515 | | | | 646,290 | |
| | | | | | | | |
| | | | | | | 8,523,433 | |
| | | | | | | | |
Professional Services 0.8% | |
Equifax, Inc. | | | 11,010 | | | | 595,861 | |
Robert Half International, Inc. | | | 112,638 | | | | 3,584,141 | |
| | | | | | | | |
| | | | | | | 4,180,002 | |
| | | | | | | | |
Real Estate Investment Trusts 5.6% | |
Annaly Capital Management, Inc. | | | 1,216 | | | | 17,073 | |
Boston Properties, Inc. | | | 8,343 | | | | 882,773 | |
CBL & Associates Properties, Inc. | | | 138,581 | | | | 2,939,303 | |
Chimera Investment Corp. | | | 975 | | | | 2,545 | |
Digital Realty Trust, Inc. | | | 2,799 | | | | 190,024 | |
Essex Property Trust, Inc. | | | 884 | | | | 129,639 | |
Extra Space Storage, Inc. | | | 11,943 | | | | 434,606 | |
General Growth Properties, Inc. | | | 123,316 | | | | 2,447,822 | |
HCP, Inc. | | | 85,043 | | | | 3,842,243 | |
Health Care REIT, Inc. | | | 47,319 | | | | 2,900,181 | |
Hospitality Properties Trust | | | 134,066 | | | | 3,139,826 | |
Host Hotels & Resorts, Inc. | | | 66,796 | | | | 1,046,693 | |
Kimco Realty Corp. | | | 8,310 | | | | 160,549 | |
Plum Creek Timber Co., Inc. | | | 30,212 | | | | 1,340,506 | |
Tanger Factory Outlet Centers, Inc. | | | 79,015 | | | | 2,702,313 | |
Taubman Centers, Inc. | | | 5,317 | | | | 418,554 | |
¨Ventas, Inc. | | | 77,250 | | | | 4,999,620 | |
Weyerhaeuser Co. | | | 44,363 | | | | 1,234,179 | |
| | | | | | | | |
| | | | | | | 28,828,449 | |
| | | | | | | | |
Real Estate Management & Development 0.0%‡ | |
Alexander & Baldwin, Inc. (a) | | | 1,890 | | | | 55,509 | |
| | | | | | | | |
| | | | | | | | |
| | |
Shares | | | Value | |
| | | | | | | | |
Road & Rail 0.3% | |
Hertz Global Holdings, Inc. (a) | | | 98,336 | | | $ | 1,599,927 | |
| | | | | | | | |
|
Semiconductors & Semiconductor Equipment 1.0% | |
Applied Materials, Inc. | | | 6,735 | | | | 77,048 | |
Lam Research Corp. (a) | | | 47,250 | | | | 1,707,143 | |
Micron Technology, Inc. (a) | | | 455,608 | | | | 2,893,111 | |
NVIDIA Corp. | | | 57,691 | | | | 709,022 | |
| | | | | | | | |
| | | | 5,386,324 | |
| | | | | | | | |
Software 4.5% | |
Activision Blizzard, Inc. | | | 290,568 | | | | 3,085,832 | |
Autodesk, Inc. (a) | | | 12,698 | | | | 448,874 | |
BMC Software, Inc. (a) | | | 86,477 | | | | 3,429,678 | |
CA, Inc. | | | 65,144 | | | | 1,431,865 | |
Cadence Design Systems, Inc. (a) | | | 244,764 | | | | 3,306,762 | |
Electronic Arts, Inc. (a) | | | 36,343 | | | | 528,064 | |
Intuit, Inc. | | | 14,839 | | | | 882,920 | |
Rovi Corp. (a) | | | 172,418 | | | | 2,660,410 | |
¨Symantec Corp. (a) | | | 235,453 | | | | 4,428,871 | |
Synopsys, Inc. (a) | | | 87,413 | | | | 2,783,230 | |
Zynga, Inc. Class A (a) | | | 175,728 | | | | 416,475 | |
| | | | | | | | |
| | | | 23,402,981 | |
| | | | | | | | |
Specialty Retail 5.9% | |
Abercrombie & Fitch Co. Class A | | | 34,667 | | | | 1,662,976 | |
Advance Auto Parts, Inc. | | | 23,076 | | | | 1,669,549 | |
American Eagle Outfitters, Inc. | | | 138,782 | | | | 2,846,419 | |
Ascena Retail Group, Inc. (a) | | | 78,201 | | | | 1,445,936 | |
Bed Bath & Beyond, Inc. (a) | | | 19,122 | | | | 1,069,111 | |
Best Buy Co., Inc. | | | 64,195 | | | | 760,711 | |
Chico’s FAS, Inc. | | | 170,626 | | | | 3,149,756 | |
Foot Locker, Inc. | | | 102,067 | | | | 3,278,392 | |
GameStop Corp. Class A | | | 69,355 | | | | 1,740,117 | |
Gap, Inc. (The) | | | 78,116 | | | | 2,424,721 | |
O’Reilly Automotive, Inc. (a) | | | 44,684 | | | | 3,995,643 | |
PetSmart, Inc. | | | 53,060 | | | | 3,626,120 | |
Ross Stores, Inc. | | | 44,536 | | | | 2,411,624 | |
Sears Hometown and Outlet Stores, Inc. (a) | | | 10,162 | | | | 330,875 | |
| | | | | | | | |
| | | | 30,411,950 | |
| | | | | | | | |
Textiles, Apparel & Luxury Goods 1.2% | |
Carter’s, Inc. (a) | | | 57,150 | | | | 3,180,397 | |
Hanesbrands, Inc. (a) | | | 81,869 | | | | 2,932,548 | |
PVH Corp. | | | 2,198 | | | | 244,000 | |
| | | | | | | | |
| | | | 6,356,945 | |
| | | | | | | | |
Thrifts & Mortgage Finance 0.1% | |
Hudson City Bancorp, Inc. | | | 32,610 | | | | 265,119 | |
| | | | | | | | |
|
Tobacco 0.2% | |
Lorillard, Inc. | | | 9,981 | | | | 1,164,483 | |
| | | | | | | | |
| | | | | | |
The notes to the financial statements are an integral part of,
and should be read in conjunction with, the financial statements. | | mainstayinvestments.com | | | M-343 | |
Portfolio of Investments December 31, 2012 (continued)
| | | | | | | | |
| | |
Shares | | | Value | |
| | | | | | | | |
| Common Stocks (continued) | |
Trading Companies & Distributors 0.4% | |
W.W. Grainger, Inc. | | | 2,844 | | | $ | 575,540 | |
WESCO International, Inc. (a) | | | 23,536 | | | | 1,587,033 | |
| | | | | | | | |
| | | | | | | 2,162,573 | |
| | | | | | | | |
Wireless Telecommunication Services 1.5% | |
Clearwire Corp. Class A (a) | | | 9,168 | | | | 26,496 | |
Crown Castle International Corp. (a) | | | 5,163 | | | | 372,562 | |
MetroPCS Communications, Inc. (a) | | | 170,552 | | | | 1,695,287 | |
Sprint Nextel Corp. (a) | | | 541,044 | | | | 3,067,719 | |
Telephone & Data Systems, Inc. | | | 104,178 | | | | 2,306,501 | |
United States Cellular Corp. (a) | | | 14,396 | | | | 507,315 | |
| | | | | | | | |
| | | | | | | 7,975,880 | |
| | | | | | | | |
Total Common Stocks
(Cost $442,806,743) | | | | | | | 511,377,720 | |
| | | | | | | | |
|
| Exchange Traded Funds 0.7% (b) | |
S&P 500 Index—SPDR Trust
Series 1 | | | 12,072 | | | | 1,720,501 | |
S&P Midcap 400 Index—Midcap SPDR Trust Series 1 | | | 9,231 | | | | 1,714,289 | |
| | | | | | | | |
Total Exchange Traded Funds
(Cost $3,271,612) | | | | | | | 3,434,790 | |
| | | | | | | | |
|
| Warrants 0.0% ‡ | |
Oil, Gas & Consumable Fuels 0.0%‡ | |
Kinder Morgan, Inc.
Strike Price $40.00
Expires 2/15/17 (a) | | | 51,583 | | | | 194,984 | |
| | | | | | | | |
Total Warrants
(Cost $99,080) | | | | | | | 194,984 | |
| | | | | | | | |
| | | | | | | | |
| | | Principal
Amount | | | Value | |
| | | | | | | | |
| Short-Term Investment 0.1% | |
Repurchase Agreement 0.1% | |
State Street Bank and Trust Co.
0.01%, dated 12/31/12
due 1/2/13
Proceeds at Maturity $277,820 (Collateralized by a Federal National Mortgage Association security with a rate of 2.11% and a maturity date of 11/7/22, with a Principal Amount of $285,000 and a Market Value of $286,332) | | $ | 277,820 | | | $ | 277,820 | |
| | | | | | | | |
Total Short-Term Investment
(Cost $277,820) | | | | | | | 277,820 | |
| | | | | | | | |
Total Investments
(Cost $446,455,255) (c) | | | 100.1 | % | | | 515,285,314 | |
Other Assets, Less Liabilities | | | (0.1 | ) | | | (554,510 | ) |
Net Assets | | | 100.0 | % | | $ | 514,730,804 | |
| ‡ | Less than one-tenth of a percent. |
| (a) | Non-income producing security. |
| (b) | Exchange Traded Fund—An investment vehicle that represents a basket of securities that is traded on an exchange. |
| (c) | As of December 31, 2012, cost is $451,764,339 for federal income tax purposes and net unrealized appreciation is as follows: |
| | | | |
Gross unrealized appreciation | | $ | 69,427,868 | |
Gross unrealized depreciation | | | (5,906,893 | ) |
| | | | |
Net unrealized appreciation | | $ | 63,520,975 | |
| | | | |
The following abbreviation is used in the above portfolio:
SPDR —Standard & Poor’s Depositary Receipt
| | | | |
| M-344 | | MainStay VP Mid Cap Core Portfolio | | The notes to the financial statements are an integral part of,
and should be read in conjunction with, the financial statements. |
The following is a summary of the fair valuations according to the inputs used as of December 31, 2012, for valuing the Portfolio’s assets.
Asset Valuation Inputs
| | | | | | | | | | | | | | | | |
Description | | Quoted Prices
in Active Markets
for Identical Assets (Level 1) | | | Significant Other
Observable Inputs (Level 2) | | | Significant
Unobservable
Inputs
(Level 3) | | | Total | |
| Investments in Securities (a) | | | | | | | | | | | | | | | | |
| Common Stocks | | $ | 511,377,720 | | | $ | — | | | $ | — | | | $ | 511,377,720 | |
| Exchange Traded Funds | | | 3,434,790 | | | | — | | | | — | | | | 3,434,790 | |
| Warrants | | | 194,984 | | | | — | | | | — | | | | 194,984 | |
| Short-Term Investment | | | | | | | | | | | | | | | | |
Repurchase Agreement | | | — | | | | 277,820 | | | | — | | | | 277,820 | |
| | | | | | | | | | | | | | | | |
| Total Investments in Securities | | $ | 515,007,494 | | | $ | 277,820 | | | $ | — | | | $ | 515,285,314 | |
| | | | | | | | | | | | | | | | |
| (a) | For a complete listing of investments and their industries, see the Portfolio of Investments. |
The Portfolio recognizes transfers between the levels as of the beginning of the period.
For the year ended December 31, 2012, the Portfolio did not have any transfers between Level 1 and Level 2 fair value measurements. (See Note 2)
As of December 31, 2012, the Portfolio did not hold any investments with significant unobservable inputs (Level 3). (See Note 2)
| | | | | | |
The notes to the financial statements are an integral part of,
and should be read in conjunction with, the financial statements. | | mainstayinvestments.com | | | M-345 | |
Statement of Assets and Liabilities as of December 31, 2012
| | | | |
| Assets | | | | |
Investment in securities, at value
(identified cost $446,455,255) | | $ | 515,285,314 | |
Receivables: | | | | |
Investment securities sold | | | 29,402,404 | |
Dividends and interest | | | 380,389 | |
Fund shares sold | | | 150,110 | |
Other assets | | | 394 | |
| | | | |
Total assets | | | 545,218,611 | |
| | | | |
| |
| Liabilities | | | | |
Payables: | | | | |
Investment securities purchased | | | 29,664,795 | |
Manager (See Note 3) | | | 368,908 | |
Fund shares redeemed | | | 311,641 | |
NYLIFE Distributors (See Note 3) | | | 59,708 | |
Shareholder communication | | | 41,698 | |
Professional fees | | | 33,612 | |
Custodian | | | 6,712 | |
Trustees | | | 733 | |
| | | | |
Total liabilities | | | 30,487,807 | |
| | | | |
Net assets | | $ | 514,730,804 | |
| | | | |
| |
| Net Assets Consist of | | | | |
Shares of beneficial interest outstanding (par value of $.001 per share) unlimited number of shares authorized | | $ | 42,265 | |
Additional paid-in capital | | | 400,029,300 | |
| | | | |
| | | 400,071,565 | |
Undistributed net investment income | | | 6,790,770 | |
Accumulated net realized gain (loss) on investments | | | 39,038,410 | |
Net unrealized appreciation (depreciation) on investments | | | 68,830,059 | |
| | | | �� |
Net assets | | $ | 514,730,804 | |
| | | | |
| | | | |
Initial Class | | | | |
Net assets applicable to outstanding shares | | $ | 231,959,017 | |
| | | | |
Shares of beneficial interest outstanding | | | 18,961,592 | |
| | | | |
Net asset value per share outstanding | | $ | 12.23 | |
| | | | |
Service Class | | | | |
Net assets applicable to outstanding shares | | $ | 282,771,787 | |
| | | | |
Shares of beneficial interest outstanding | | | 23,303,837 | |
| | | | |
Net asset value per share outstanding | | $ | 12.13 | |
| | | | |
| | | | |
| M-346 | | MainStay VP Mid Cap Core Portfolio | | The notes to the financial statements are an integral part of,
and should be read in conjunction with, the financial statements. |
Statement of Operations for the year ended December 31, 2012
| | | | |
| Investment Income (Loss) | | | | |
Income | | | | |
Dividends | | $ | 12,559,942 | |
Interest | | | 3,188 | |
| | | | |
Total income | | | 12,563,130 | |
| | | | |
Expenses | | | | |
Manager (See Note 3) | | | 4,675,525 | |
Distribution and service—Service Class (See Note 3) | | | 702,698 | |
Shareholder communication | | | 86,136 | |
Professional fees | | | 60,233 | |
Custodian | | | 37,788 | |
Trustees | | | 14,835 | |
Miscellaneous | | | 19,386 | |
| | | | |
Total expenses | | | 5,596,601 | |
| | | | |
Net investment income (loss) | | | 6,966,529 | |
| | | | |
|
| Realized and Unrealized Gain (Loss) on Investments | |
Net realized gain (loss) on investments | | | 47,420,938 | |
Net change in unrealized appreciation (depreciation) on investments | | | 34,681,767 | |
| | | | |
Net realized and unrealized gain (loss) on investments | | | 82,102,705 | |
| | | | |
Net increase (decrease) in net assets resulting from operations | | $ | 89,069,234 | |
| | | | |
| | | | | | |
The notes to the financial statements are an integral part of,
and should be read in conjunction with, the financial statements. | | mainstayinvestments.com | | | M-347 | |
Statements of Changes in Net Assets
for the years ended December 31, 2012 and December 31, 2011
| | | | | | | | |
| | | 2012 | | | 2011 | |
| Increase (Decrease) in Net Assets | |
Operations: | | | | | | | | |
Net investment income (loss) | | $ | 6,966,529 | | | $ | 3,268,276 | |
Net realized gain (loss) on investments | | | 47,420,938 | | | | 82,719,835 | |
Net change in unrealized appreciation (depreciation) on investments | | | 34,681,767 | | | | (94,874,899 | ) |
| | | | |
Net increase (decrease) in net assets resulting from operations | | | 89,069,234 | | | | (8,886,788 | ) |
| | | | |
Dividends and distributions to shareholders: | | | | | | | | |
From net investment income: | | | | | | | | |
Initial Class | | | (1,800,386 | ) | | | (2,663,540 | ) |
Service Class | | | (1,444,408 | ) | | | (1,833,872 | ) |
| | | | |
| | | (3,244,794 | ) | | | (4,497,412 | ) |
| | | | |
From net realized gain on investments: | | | | | | | | |
Initial Class | | | (18,994,762 | ) | | | — | |
Service Class | | | (22,948,043 | ) | | | — | |
| | | | |
| | | (41,942,805 | ) | | | — | |
| | | | |
Total dividends and distributions to shareholders | | | (45,187,599 | ) | | | (4,497,412 | ) |
| | | | |
Capital share transactions: | | | | | | | | |
Net proceeds from sale of shares | | | 50,029,189 | | | | 79,742,025 | |
Net asset value of shares issued to shareholders in reinvestment of dividends and distributions | | | 45,187,599 | | | | 4,497,412 | |
Cost of shares redeemed | | | (187,346,420 | ) | | | (225,381,856 | ) |
| | | | |
Increase (decrease) in net assets derived from capital share transactions | | | (92,129,632 | ) | | | (141,142,419 | ) |
| | | | |
Net increase (decrease) in net assets | | | (48,247,997 | ) | | | (154,526,619 | ) |
|
| Net Assets | |
Beginning of year | | | 562,978,801 | | | | 717,505,420 | |
| | | | |
End of year | | $ | 514,730,804 | | | $ | 562,978,801 | |
| | | | |
Undistributed net investment income at end of year | | $ | 6,790,770 | | | $ | 3,280,048 | |
| | | | |
| | | | |
| M-348 | | MainStay VP Mid Cap Core Portfolio | | The notes to the financial statements are an integral part of,
and should be read in conjunction with, the financial statements. |
Financial Highlights selected per share data and ratios
| | | | | | | | | | | | | | | | | | | | |
| | | Initial Class | |
| | | Year ended December 31, | |
| | | 2012 | | | 2011 | | | 2010 | | | 2009 | | | 2008 | |
Net asset value at beginning of year | | $ | 11.40 | | | $ | 11.87 | | | $ | 9.63 | | | $ | 7.07 | | | $ | 14.86 | |
| | | | | | | | | | | | | | | | | | | | |
Net investment income (loss) | | | 0.17 | (a) | | | 0.08 | (a) | | | 0.10 | | | | 0.07 | (a) | | | 0.06 | |
Net realized and unrealized gain (loss) on investments | | | 1.80 | | | | (0.44 | ) | | | 2.18 | | | | 2.54 | | | | (6.29 | ) |
| | | | | | | | | | | | | | | | | | | | |
Total from investment operations | | | 1.97 | | | | (0.36 | ) | | | 2.28 | | | | 2.61 | | | | (6.23 | ) |
| | | | | | | | | | | | | | | | | | | | |
Less dividends and distributions: | | | | | | | | | | | | | | | | | | | | |
From net investment income | | | (0.10 | ) | | | (0.11 | ) | | | (0.04 | ) | | | (0.05 | ) | | | (0.04 | ) |
From net realized gain on investments | | | (1.04 | ) | | | — | | | | — | | | | — | | | | (1.52 | ) |
| | | | | | | | | | | | | | | | | | | | |
Total dividends and distributions | | | (1.14 | ) | | | (0.11 | ) | | | (0.04 | ) | | | (0.05 | ) | | | (1.56 | ) |
| | | | | | | | | | | | | | | | | | | | |
Net asset value at end of year | | $ | 12.23 | | | $ | 11.40 | | | $ | 11.87 | | | $ | 9.63 | | | $ | 7.07 | |
| | | | | | | | | | | | | | | | | | | | |
Total investment return | | | 17.52 | % | | | (2.99 | %) | | | 23.64 | % | | | 36.93 | % | | | (42.24 | %) |
Ratios (to average net assets)/Supplemental Data: | | | | | | | | | | | | | | | | | | | | |
Net investment income (loss) | | | 1.38 | % | | | 0.63 | % | | | 0.86 | % | | | 0.84 | % | | | 0.54 | % |
Net expenses | | | 0.89 | % | | | 0.90 | % | | | 0.90 | % | | | 0.94 | % | | | 0.93 | % |
Portfolio turnover rate | | | 186 | % | | | 161 | % | | | 169 | % | | | 192 | % | | | 173 | % |
Net assets at end of year (in 000’s) | | $ | 231,959 | | | $ | 295,511 | | | $ | 417,904 | | | $ | 348,595 | | | $ | 108,882 | |
| (a) | Per share data based on average shares outstanding during the year. |
| | | | | | | | | | | | | | | | | | | | |
| | | Service Class | |
| | | Year ended December 31, | |
| | | 2012 | | | 2011 | | | 2010 | | | 2009 | | | 2008 | |
Net asset value at beginning of year | | $ | 11.31 | | | $ | 11.78 | | | $ | 9.57 | | | $ | 7.02 | | | $ | 14.75 | |
| | | | | | | | | | | | | | | | | | | | |
Net investment income (loss) | | | 0.15 | (a) | | | 0.05 | (a) | | | 0.07 | | | | 0.05 | (a) | | | 0.03 | |
Net realized and unrealized gain (loss) on investments | | | 1.78 | | | | (0.44 | ) | | | 2.17 | | | | 2.52 | | | | (6.24 | ) |
| | | | | | | | | | | | | | | | | | | | |
Total from investment operations | | | 1.93 | | | | (0.39 | ) | | | 2.24 | | | | 2.57 | | | | (6.21 | ) |
| | | | | | | | | | | | | | | | | | | | |
Less dividends and distributions: | | | | | | | | | | | | | | | | | | | | |
From net investment income | | | (0.07 | ) | | | (0.08 | ) | | | (0.03 | ) | | | (0.02 | ) | | | (0.00 | )‡ |
From net realized gain on investments | | | (1.04 | ) | | | — | | | | — | | | | — | | | | (1.52 | ) |
| | | | | | | | | | | | | | | | | | | | |
Total dividends and distributions | | | (1.11 | ) | | | (0.08 | ) | | | (0.03 | ) | | | (0.02 | ) | | | (1.52 | ) |
| | | | | | | | | | | | | | | | | | | | |
Net asset value at end of year | | $ | 12.13 | | | $ | 11.31 | | | $ | 11.78 | | | $ | 9.57 | | | $ | 7.02 | |
| | | | | | | | | | | | | | | | | | | | |
Total investment return | | | 17.22 | % | | | (3.23 | %) | | | 23.33 | % | | | 36.58 | % | | | (42.38 | %) |
Ratios (to average net assets)/Supplemental Data: | | | | | | | | | | | | | | | | | | | | |
Net investment income (loss) | | | 1.26 | % | | | 0.39 | % | | | 0.61 | % | | | 0.61 | % | | | 0.29 | % |
Net expenses | | | 1.14 | % | | | 1.15 | % | | | 1.15 | % | | | 1.19 | % | | | 1.18 | % |
Portfolio turnover rate | | | 186 | % | | | 161 | % | | | 169 | % | | | 192 | % | | | 173 | % |
Net assets at end of year (in 000’s) | | $ | 282,772 | | | $ | 267,468 | | | $ | 299,601 | | | $ | 256,533 | | | $ | 91,805 | |
| ‡ | Less than one cent per share. |
| (a) | Per share data based on average shares outstanding during the year. |
| | | | | | |
The notes to the financial statements are an integral part of,
and should be read in conjunction with, the financial statements. | | mainstayinvestments.com | | | M-349 | |
MainStay VP Moderate Allocation Portfolio
Investment and Performance Comparison1 (Unaudited)
Performance data quoted represents past performance. Past performance is no guarantee of future results. Because of market volatility, current performance may be lower or higher than the figures shown. Investment return and principal value will fluctuate, and as a result, when shares are redeemed, they may be worth more or less than their original cost. The performance table and graph do not reflect any deduction of sales charges, mortality and expense charges, contract charges or administrative charges. Please refer to the Performance Summary appropriate for your policy. For performance information current to the most recent month-end, please call 800-598-2019 or visit www.newyorklife.com.
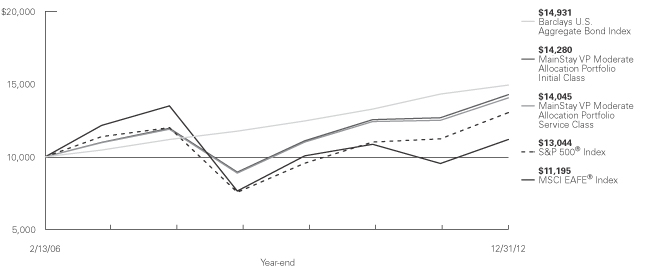
Average Annual Total Returns for the Period Ended December 31, 2012
| | | | | | | | | | | | | | |
| Class | | One Year | | Five Years | | | Since
Inception
(2/13/06) | | | Gross
Expense
Ratio2 | |
| Initial Class Shares | | 12.61% | | | 3.62 | % | | | 5.31 | % | | | 0.95 | % |
| Service Class Shares | | 12.33 | | | 3.37 | | | | 5.06 | | | | 1.20 | |
| | | | | | | | | | | | |
| Benchmark Performance | | One
Year | | | Five
Years | | | Since Inception
(2/13/06) | |
S&P 500® Index3 | | | 16.00 | % | | | 1.66 | % | | | 3.93 | % |
MSCI EAFE® Index3 | | | 17.32 | | | | –3.69 | | | | 1.65 | |
Barclays U.S. Aggregate Bond Index3 | | | 4.22 | | | | 5.95 | | | | 5.99 | |
Average Lipper Variable Products Mixed-Asset Target Allocation Moderate Portfolio4 | | | 11.20 | | | | 2.78 | | | | 3.51 | |
| 1. | Performance figures reflect certain fee waivers and/or expense limitations, without which total returns may have been different. For information on current fee waivers and/or expense limitations, please refer to the notes to the financial statements. |
| 2. | The gross expense ratios presented reflect the Portfolio’s “Total Annual Portfolio Operating Expenses” from the most recent Prospectus and may differ from other expense ratios disclosed in this report. |
| 3. | Please refer to pages M-2 and M-3 for additional explanations and disclosure regarding the Portfolios, their benchmark indices and other indices mentioned in the reports. |
| 4. | The Average Lipper Variable Products Mixed-Asset Target Allocation Moderate Portfolio is representative of portfolios that, by portfolio practice, maintain a mix of between 40%-60% equity securities, with the remainder invested in bonds, cash, and cash equivalents. Lipper Inc. is an independent monitor of fund performance. Results are based on total returns with all dividend and capital gain distributions reinvested. |
| | |
| M-350 | | MainStay VP Moderate Allocation Portfolio |
Cost in Dollars of a $1,000 Investment in MainStay VP Moderate Allocation Portfolio (Unaudited)
The example below is intended to describe the fees and expenses borne by shareholders during the six-month period from July 1, 2012 to December 31, 2012, and the impact of those costs on your investment.
Example
As a shareholder of the Portfolio, you incur two types of costs: (1) transaction costs, including exchange fees and sales charges (loads) on purchases (as applicable), and (2) ongoing costs, including management fees, distribution and/or service (12b-1) fees, and other Portfolio expenses (as applicable). This example is intended to help you understand your ongoing costs (in dollars) of investing in the Portfolio and to compare these costs with the ongoing costs of investing in other Portfolios. The example is based on an investment of $1,000 made at the beginning of the six-month period and held for the entire period from July 1, 2012, to December 31, 2012. Shares are only sold in connection with variable life and annuity contracts and the example does not reflect any contract level or transactional fees or expenses. If these costs had been included, your costs would have been higher.
This example illustrates your Portfolio’s ongoing costs in two ways:
Actual Expenses
The second and third data columns in the table below provide information about actual account values and actual expenses. You may use the information in these columns, together with the amount you invested, to estimate the
expenses that you paid during the six months ended December 31, 2012. Simply divide your account value by $1,000 (for example, an $8,600 account value divided by $1,000 = 8.6), then multiply the result by the number under the heading entitled ‘‘Expenses Paid During Period’’ to estimate the expenses you paid on your account during this period.
Hypothetical Example for Comparison Purposes
The fourth and fifth data columns in the table below provide information about hypothetical account values and hypothetical expenses based on the Portfolio’s actual expense ratio and an assumed rate of return of 5% per year before expenses, which is not the Portfolio’s actual return. The hypothetical account values and expenses may not be used to estimate the actual ending account balances or expenses you paid for the six-month period shown. You may use this information to compare the ongoing costs of investing in the Portfolio with the ongoing costs of investing in other Portfolios. To do so, compare this 5% hypothetical example with the 5% hypothetical examples that appear in the shareholder reports of the other Portfolios.
Please note that the expenses shown in the table are meant to highlight your ongoing costs only and do not reflect any transactional costs, such as exchange fees or sales charges (loads). Therefore, the fourth and fifth data columns of the table are useful in comparing ongoing costs only and will not help you determine the relative total costs of owning different funds. In addition, if these transactional costs were included, your costs would have been higher.
| | | | | | | | | | | | | | | | | | | | |
| | | | | | | | | | | | | | | | |
| Share Class | | Beginning
Account
Value
7/1/12 | | | Ending Account
Value (Based
on Actual
Returns and
Expenses)
12/31/12 | | | Expenses
Paid
During
Period1 | | | Ending Account
Value (Based
on Hypothetical
5% Annualized
Return and
Actual Expenses)
12/31/12 | | | Expenses
Paid
During
Period1 | |
| | | | | |
| Initial Class Shares | | $ | 1,000.00 | | | $ | 1,064.00 | | | $ | 0.16 | | | $ | 1,025.00 | | | $ | 0.15 | |
| | | | | |
| Service Class Shares | | $ | 1,000.00 | | | $ | 1,062.70 | | | $ | 1.45 | | | $ | 1,023.70 | | | $ | 1.42 | |
| 1. | Expenses are equal to the Portfolio’s annualized expense ratio of each class (0.03% for Initial Class and 0.28% for Service Class) multiplied by the average account value over the period, divided by 366 and multiplied by 184 (to reflect the six-month period). The table above represents the actual expenses incurred during the six-month period. In addition to the fees and expenses which the Portfolio bears directly, the Portfolio indirectly bears a pro rata share of the fees and expenses of the Underlying Portfolios/Funds in which it invests. Such indirect expenses are not included in the above-reported expense figures. |
| | | | |
| mainstayinvestments.com | | | M-351 | |
Investment Objectives of Underlying Portfolios/Funds as of December 31, 2012 (Unaudited)
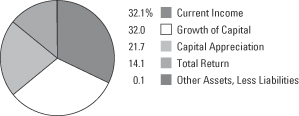
See Portfolio of Investments beginning on page M-356 for specific holdings within these categories.
| | |
| M-352 | | MainStay VP Moderate Allocation Portfolio |
Portfolio Management Discussion and Analysis (Unaudited)
Answers to the questions reflect the views of portfolio managers Jae S. Yoon, CFA, and Jonathan Swaney of New York Life Investments,1 the Portfolio’s Manager.
How did MainStay VP Moderate Allocation Portfolio perform relative to its peers and its benchmarks during the 12 months ended December 31, 2012?
For the 12 months ended December 31, 2012, MainStay VP Moderate Allocation Portfolio returned 12.61% for Initial Class shares and 12.33% for Service Class shares. Over the same period, both share classes outperformed the 11.20% return of the average Lipper2 Variable Products Mixed-Asset Target Allocation Moderate Portfolio and underperformed the 16.00% return of the S&P 500® Index.2 The S&P 500® Index is the Portfolio’s broad-based securities-market index. For the 12 months ended December 31, 2012, both share classes underperformed the 17.32% return of the MSCI EAFE® Index,2 which is the secondary benchmark for the Portfolio. Over the same period, both share classes outperformed the 4.22% return of the Barclays U.S. Aggregate Bond Index,2 which is an additional benchmark for the Portfolio.
What factors affected the Portfolio’s relative performance during the reporting period?
The Portfolio is a “fund of funds” that invests primarily in other MainStay Portfolios and other Funds managed by New York Life Investments (the “Underlying Portfolios/Funds”). The Underlying Portfolios/Funds may invest in fixed-income securities or in domestic or international stocks at various capitalization levels. The Portfolio’s primary benchmark, on the other hand, consists entirely of U.S. large-cap stocks. These differences—particularly the Portfolio’s significant allocation to Underlying Portfolios/Funds that invest in fixed-income securities—accounted for many of the challenges the Portfolio experienced in terms of relative performance.
Our effort to manage the risk posture of the Portfolio by adjusting its mix of stocks and bonds contributed positively to the Portfolio’s relative performance. Within the allocation ranges outlined in the Prospectus, the Portfolio at times adopted a small bias in favor of Underlying Portfolios/Funds that invest in stocks over Underlying Portfolios/Funds that invest in bonds. This bias was used early in the reporting period, early in the summer and near year-end, and the bias was
beneficial each time. Persistent exposure to lower-quality bonds and loans also boosted returns, although efforts to lower the Portfolio’s sensitivity to interest rates by investing in Underlying Portfolios/Funds that held shorter-maturity instruments detracted slightly, as interest rates fell to levels we did not anticipate.
Among the Underlying Portfolios/Funds in which the Portfolio invested, results were mixed. Several fared quite well relative to their respective peers and benchmarks. Among these were MainStay VP Flexible Bond Opportunities Portfolio and MainStay 130/30 International Fund. Other substantial holdings experienced challenges. Among these were MainStay VP Large Cap Growth Portfolio, MainStay Epoch U.S. All Cap Fund and MainStay VP High Yield Corporate Bond Portfolio. While asset-class positioning generally added to the Portfolio’s returns, some returns among the Underlying Portfolios/Funds detracted moderately from the Portfolio’s relative performance.
How did you allocate the Portfolio’s assets during the reporting period and why?
In managing the Portfolio, we considered a variety of information, including the portfolio-level characteristics of the Underlying Portfolios/Funds, such as capitalization, style biases, sector exposures, credit quality and duration.3 We also examined the attributes of the individual holdings of the Underlying Portfolios/Funds, such as valuation metrics, earnings data and technical indicators. Finally, we evaluated the historical success of the portfolio managers responsible for the Underlying Portfolios/Funds. Generally speaking, we seek to invest in Underlying Portfolios/Funds that occupy attractively valued segments of the market, invest in fairly priced securities and are steered by individuals who have consistently demonstrated capable management in the past.
The Portfolio’s blend of stocks and bonds varied slightly over the course of the reporting period in response to the changing environment. In the equity portion of the Portfolio, we placed a mild emphasis on two themes. First, we viewed Underlying Portfolios/Funds that invest in large-capitalization stocks favorably in relation to Underlying Portfolios/Funds that
| 1. | “New York Life Investments” is a service mark used by New York Life Investment Management LLC. |
| 2. | Please refer to pages M-2 and M-3 for additional explanations and disclosure regarding the Portfolios, their benchmark indices and service providers mentioned in the reports. |
| 3. | Duration is a measure of the price sensitivity of a fixed-income investment to changes in interest rates. Duration is expressed as a number of years and is considered a more accurate sensitivity gauge than average maturity. |
| | | | |
| mainstayinvestments.com | | | M-353 | |
invest in small-cap stocks. We adopted this positioning because we believed that large-cap stocks were more attractively valued, had superior access to capital and were better positioned to benefit from growth in the developing world. Second, we preferred Underlying Portfolios/Funds that invest in U.S. stocks over Underlying Portfolios/Funds that invest in stocks of other developed markets. Both of these positioning strategies contributed positively to the Portfolio’s returns during the first half of the year but surrendered their gains in the second half. The result was relatively neutral for the year as a whole.
The fixed-income portion of the Portfolio had a slightly shorter duration than the Barclays U.S. Aggregate Bond Index. We also tilted the Portfolio heavily toward Underlying Portfolios/Funds that invest in corporate bonds over those that invest in government-backed issues. This positioning reflected our view that corporations have improved the quality of their balance sheets significantly in the past few years by reducing leverage, accumulating cash and controlling operating costs. In our opinion, if corporate default rates remain low for the next few years, investors are likely to find the yields available on corporate bonds attractive relative to the yields available on U.S. Treasury instruments. The Portfolio’s credit exposure had a positive influence on relative results, but interest rates have not yet moved in the direction we anticipated.
How did the Portfolio’s allocations change over the course of the reporting period?
In the equity portion of the Portfolio, the primary allocation changes came as several new options were introduced to the pool of eligible investments. We established new positions in MainStay VP T. Rowe Price Equity Income Portfolio and MainStay VP DFA / DuPont Capital Emerging Markets Equity Portfolio, with funding coming from a variety of sources, including selling shares of MainStay ICAP Equity Fund and MainStay Epoch U.S. All Cap Fund. We also materially increased the Portfolio’s holdings of MainStay VP S&P 500® Index Portfolio and MainStay VP Large Cap Growth Portfolio.
As of December 31, 2012, the Portfolio was in the process of exiting positions in certain Underlying Portfolios/Funds that occupy specialized segments of the investable universe. Among these were MainStay Epoch International Small Cap Fund and MainStay VP
Convertible Portfolio. In our opinion, the risk-adjusted return potential of these Underlying Portfolios/Funds has become less compelling than it was in previous periods.
In the fixed-income portion of the Portfolio, we emphasized two general themes. First, we sought to reduce exposure to the lowest-quality credits. This led us to cut the Portfolio’s holdings of MainStay VP Flexible Bond Opportunities Portfolio in half while shifting some of the proceeds into the MainStay VP Bond Portfolio. While we believed that government bonds represented a very poor value proposition, we were also wary of the junk bond market, which we believed had become increasingly speculative. In light of these concerns, we believed that emphasizing the middle of the quality spectrum would be a prudent strategy. Second, we shortened the Portfolio’s duration in an effort to reduce the Portfolio’s sensitivity to a potential rise in interest rates. Our primary tool in this effort was to increase the size of the Portfolio’s position in MainStay VP Floating Rate Portfolio. With the same goal in mind, we also established a position in the new MainStay Short Duration High Yield Fund.
Which Underlying Equity Portfolios/Funds had the highest total returns during the reporting period, and which Underlying Equity Portfolios/Funds had the lowest total returns?
Among the Underlying Equity Portfolios/Funds in which the Portfolio invested, MainStay 130/30 International Fund had the highest return for 2012, followed by MainStay VP International Equity Portfolio and MainStay Epoch International Small Cap Fund. Although all Underlying Equity Portfolios/Funds in which the Portfolio invested generated positive returns for the reporting period, the lowest total returns came from MainStay Epoch U.S. All Cap Fund and MainStay VP U.S. Small Cap Portfolio.
Which Underlying Equity Portfolios/Funds made the strongest positive contributions to the Portfolio’s overall performance, and which Underlying Equity Portfolios/Funds were the greatest detractors?
The most significant contributions to the Portfolio’s equity performance came from MainStay 130/30 Core Fund and MainStay MAP Fund. (Contributions take weightings and total returns into account.) The weakest equity contributions came from MainStay VP Eagle Small Cap Growth Portfolio and MainStay
| | |
| M-354 | | MainStay VP Moderate Allocation Portfolio |
Marketfield Fund. That some positions made only marginal contributions tended to reflect position size and timing as much as the returns of the Underlying Portfolios/Funds.
What factors and risks affected the Portfolio’s Underlying Fixed-Income Portfolio/Fund investments during the reporting period?
Central bank policy played a pivotal role in the fixed-income markets during 2012. Amid slowing global economic growth, distressed European sovereign debt markets and looming fiscal retrenchment in the United States, the Federal Reserve pursued aggressively accommodative policies. The Federal Reserve’s maturity extension program (referred to by some as “Operation Twist”), its loose policy guidance and its additional securities purchases helped keep interest rates suppressed across the entire yield curve.4 These moves proved detrimental to relative performance to the extent that the Portfolio’s duration was shorter than that of the Barclays U.S. Aggregate Bond Index. On the other hand, these same policies helped reduce risk aversion and led to tightening credit spreads5 that benefited the Portfolio on a larger scale.
During the reporting period, which fixed-income market segments were the strongest positive contributors to the Portfolio’s performance and which segments were particularly weak?
Over the course of 2012, high-yield debt generally provided strong results. Over the same period, cash and short-duration bonds issued by the governments of developed nations provided comparatively weak returns.
Which Underlying Fixed-Income Portfolios/Funds made the strongest positive contributions to the Portfolio’s performance, and which Underlying Fixed-Income Portfolios/Funds were the greatest detractors?
The largest contribution to the Portfolio’s fixed-income performance came from MainStay VP Flexible Bond Opportunities Portfolio, followed by MainStay VP Bond Portfolio. While all of the Underlying Fixed-Income Portfolios/Funds in which the Portfolio invested provided positive total returns for 2012, the smallest contributions came from MainStay VP Cash Management Portfolio followed by a small position in MainStay VP Convertibles Portfolio.
| 4. | The yield curve is a line that plots the yields of various securities of similar quality—typically U.S. Treasury issues—across a range of maturities. The U.S. Treasury yield curve serves as a benchmark for other debt and is used in economic forecasting. |
| 5. | The terms “spread” and “yield spread” may refer to the difference in yield between a security or type of security and comparable U.S. Treasury issues. The terms may also refer to the difference in yield between two specific securities or types of securities at a given time. The term “credit spread” usually refers to the yield spread between credit securities and comparable U.S. Treasury securities. |
The opinions expressed are those of the portfolio managers as of the date of this report and are subject to change. There is no guarantee that any forecasts made will come to pass. This material does not constitute investment advice and is not intended as an endorsement of any specific investment.
Not all MainStay VP Portfolios and/or share classes are available under all policies.
| | | | |
| mainstayinvestments.com | | | M-355 | |
Portfolio of Investments December 31, 2012
| | | | | | | | |
| | | Shares | | | Value | |
| Affiliated Investment Companies 99.9%† | |
Equity Funds 63.8% | |
MainStay 130/30 Core Fund Class I (a) | | | 10,934,776 | | | $ | 85,728,646 | |
MainStay 130/30 International Fund Class I (a) | | | 3,491,101 | | | | 24,751,908 | |
MainStay Epoch Global Choice Fund Class I (a) | | | 1,168,266 | | | | 19,813,787 | |
MainStay Epoch International Small Cap Fund Class I | | | 42,775 | | | | 789,207 | |
MainStay Epoch U.S. All Cap Fund Class I (a) | | | 1,224,234 | | | | 27,165,758 | |
MainStay ICAP Equity Fund Class I | | | 804,713 | | | | 32,558,695 | |
MainStay ICAP International Fund Class I | | | 605,850 | | | | 18,236,092 | |
MainStay MAP Fund Class I (a) | | | 3,071,773 | | | | 108,556,452 | |
MainStay Marketfield Fund Class I | | | 214,523 | | | | 3,398,048 | |
MainStay VP Common Stock Portfolio Initial Class | | | 28,764 | | | | 529,267 | |
MainStay VP DFA / DuPont Capital Emerging Markets Equity Portfolio Initial Class (a)(b) | | | 2,176,623 | | | | 22,023,310 | |
MainStay VP Eagle Small Cap Growth Portfolio Initial Class (b) | | | 165,166 | | | | 1,650,833 | |
MainStay VP ICAP Select Equity Portfolio Initial Class | | | 353,197 | | | | 4,859,034 | |
MainStay VP International Equity Portfolio Initial Class | | | 652,011 | | | | 7,913,447 | |
MainStay VP Large Cap Growth Portfolio Initial Class (a)(b) | | | 6,011,151 | | | | 101,447,882 | |
MainStay VP Mid Cap Core Portfolio Initial Class | | | 84,404 | | | | 1,032,528 | |
MainStay VP S&P 500 Index Portfolio Initial Class | | | 1,021,820 | | | | 29,563,263 | |
MainStay VP T. Rowe Price Equity Income Portfolio Initial Class (a)(b) | | | 4,817,842 | | | | 51,971,627 | |
MainStay VP U.S. Small Cap Portfolio Initial Class | | | 297,302 | | | | 2,991,564 | |
| | | | | | | | |
Total Equity Funds
(Cost $515,951,848) | | | | | | | 544,981,348 | |
| | | | | | | | |
|
Fixed Income Funds 36.1% | |
MainStay High Yield Opportunities Fund Class I | | | 186,002 | | | | 2,256,209 | |
MainStay Intermediate Term Bond Fund Class I | | | 2,887,487 | | | | 32,022,227 | |
Mainstay Short Duration High Yield Fund Class I (a) | | | 184,028 | | | | 1,831,080 | |
MainStay VP Bond Portfolio Initial Class (a) | | | 8,470,570 | | | | 125,188,570 | |
MainStay VP Cash Management Portfolio Initial Class | | | 11,664,910 | | | | 11,664,642 | |
MainStay VP Convertible Portfolio Initial Class | | | 236,445 | | | | 2,765,428 | |
| | | | | | | | |
| | | Shares | | | Value | |
Fixed Income Funds (continued) | |
MainStay VP Flexible Bond Opportunities Portfolio Initial Class (a) | | | 4,184,287 | | | $ | 43,166,369 | |
MainStay VP Floating Rate Portfolio Initial Class (a) | | | 7,877,637 | | | | 73,405,295 | |
MainStay VP High Yield Corporate Bond Portfolio Initial Class | | | 1,605,467 | | | | 16,359,506 | |
| | | | | | | | |
Total Fixed Income Funds
(Cost $306,272,281) | | | | | | | 308,659,326 | |
| | | | | | | | |
Total Investments
(Cost $822,224,129) (c) | | | 99.9 | % | | | 853,640,674 | |
Other Assets, Less Liabilities | | | 0.1 | | | | 1,215,602 | |
Net Assets | | | 100.0 | % | | $ | 854,856,276 | |
| † | Percentages indicated are based on Portfolio net assets. |
| (a) | The Portfolio’s ownership exceeds 5% of the outstanding shares of the Underlying Portfolio’s/Fund’s share class. (See Note 3) |
| (b) | Non-income producing Underlying Portfolio/Fund. |
| (c) | As of December 31, 2012, cost is $824,877,874 for federal income tax purposes and net unrealized appreciation is as follows: |
| | | | |
Gross unrealized appreciation | | $ | 33,016,477 | |
Gross unrealized depreciation | | | (4,253,677 | ) |
| | | | |
Net unrealized appreciation | | $ | 28,762,800 | |
| | | | |
| | | | |
| M-356 | | MainStay VP Moderate Allocation Portfolio | | The notes to the financial statements are an integral part of,
and should be read in conjunction with, the financial statements. |
The following is a summary of the fair valuations according to the inputs used as of December 31, 2012, for valuing the Portfolio’s assets.
Asset Valuation Inputs
| | | | | | | | | | | | | | | | |
Description | | Quoted Prices
in Active Markets
for Identical Assets
(Level 1) | | | Significant Other
Observable Inputs (Level 2) | | | Significant
Unobservable
Inputs
(Level 3) | | | Total | |
| Investments (a) | | | | | | | | | | | | | | | | |
| Affiliated Investment Companies | | | | | | | | | | | | | | | | |
Equity Funds | | $ | 544,981,348 | | | $ | — | | | $ | — | | | $ | 544,981,348 | |
Fixed Income Funds | | | 308,659,326 | | | | — | | | | — | | | | 308,659,326 | |
| | | | | | | | | | | | | | | | |
| Total Investments | | $ | 853,640,674 | | | $ | — | | | $ | — | | | $ | 853,640,674 | |
| | | | | | | | | | | | | | | | |
| (a) | For a complete listing of investments, see the Portfolio of Investments. |
The Portfolio recognizes transfers between the levels as of the beginning of the period.
For the year ended December 31, 2012, the Portfolio did not have any transfers between Level 1 and Level 2 fair value measurements. (See Note 2)
As of December 31, 2012, the Portfolio did not hold any investments with significant unobservable inputs (Level 3). (See Note 2)
| | | | | | |
The notes to the financial statements are an integral part of,
and should be read in conjunction with, the financial statements. | | mainstayinvestments.com | | | M-357 | |
Statement of Assets and Liabilities as of December 31, 2012
| | | | |
| Assets | |
Investment in affiliated investment companies, at value (identified cost $822,224,129) | | $ | 853,640,674 | |
Receivables: | | | | |
Fund shares sold | | | 1,878,122 | |
Investment securities sold | | | 1,047,569 | |
Other assets | | | 3,431 | |
| | | | |
Total assets | | | 856,569,796 | |
| | | | |
| |
| Liabilities | | | | |
Payables: | | | | |
Investment securities purchased | | | 1,312,454 | |
NYLIFE Distributors (See Note 3) | | | 172,816 | |
Fund shares redeemed | | | 133,548 | |
Shareholder communication | | | 67,496 | |
Professional fees | | | 25,316 | |
Trustees | | | 1,208 | |
Custodian | | | 682 | |
| | | | |
Total liabilities | | | 1,713,520 | |
| | | | |
Net assets | | $ | 854,856,276 | |
| | | | |
| |
| Net Assets Consist of | | | | |
Shares of beneficial interest outstanding (par value of $.001 per share) unlimited number of shares authorized | | $ | 76,952 | |
Additional paid-in capital | | | 820,252,783 | |
| | | | |
| | | 820,329,735 | |
Undistributed net investment income | | | 18,705,759 | |
Accumulated net realized gain (loss) on investments | | | (15,595,763 | ) |
Net unrealized appreciation (depreciation) on investments | | | 31,416,545 | |
| | | | |
Net assets | | $ | 854,856,276 | |
| | | | |
| | | | |
Initial Class | | | | |
Net assets applicable to outstanding shares | | $ | 29,575,016 | |
| | | | |
Shares of beneficial interest outstanding | | | 2,649,468 | |
| | | | |
Net asset value per share outstanding | | $ | 11.16 | |
| | | | |
Service Class | | | | |
Net assets applicable to outstanding shares | | $ | 825,281,260 | |
| | | | |
Shares of beneficial interest outstanding | | | 74,302,324 | |
| | | | |
Net asset value per share outstanding | | $ | 11.11 | |
| | | | |
| | | | |
| M-358 | | MainStay VP Moderate Allocation Portfolio | | The notes to the financial statements are an integral part of,
and should be read in conjunction with, the financial statements. |
Statement of Operations for the year ended December 31, 2012
| | | | |
| Investment Income (Loss) | |
Income | | | | |
Dividend distributions from affiliated investment companies | | $ | 15,078,094 | |
| | | | |
Expenses | | | | |
Distribution and service—Service Class (See Note 3) | | | 1,887,568 | |
Shareholder communication | | | 133,518 | |
Professional fees | | | 56,046 | |
Trustees | | | 20,699 | |
Custodian | | | 4,040 | |
Miscellaneous | | | 21,853 | |
| | | | |
Total expenses | | | 2,123,724 | |
| | | | |
Net investment income (loss) | | | 12,954,370 | |
| | | | |
|
| Realized and Unrealized Gain (Loss) on Investments | |
Net realized gain (loss) on: | | | | |
Affiliated investment company transactions | | | 28,100,182 | |
Realized capital gain distributions from affiliated investment companies | | | 13,015,793 | |
| | | | |
Net realized gain (loss) on investments from affiliated investment companies | | | 41,115,975 | |
| | | | |
Net change in unrealized appreciation (depreciation) on investments | | | 33,840,572 | |
| | | | |
Net realized and unrealized gain (loss) on investments | | | 74,956,547 | |
| | | | |
Net increase (decrease) in net assets resulting from operations | | $ | 87,910,917 | |
| | | | |
| | | | | | |
The notes to the financial statements are an integral part of,
and should be read in conjunction with, the financial statements. | | mainstayinvestments.com | | | M-359 | |
Statements of Changes in Net Assets
for the years ended December 31, 2012 and December 31, 2011
| | | | | | | | |
| | | 2012 | | | 2011 | |
| Increase (Decrease) in Net Assets | |
Operations: | | | | | | | | |
Net investment income (loss) | | $ | 12,954,370 | | | $ | 10,918,637 | |
Net realized gain (loss) on investments from affiliated investment companies transactions | | | 41,115,975 | | | | 51,559,978 | |
Net change in unrealized appreciation (depreciation) on investments | | | 33,840,572 | | | | (60,032,859 | ) |
| | | | |
Net increase (decrease) in net assets resulting from operations | | | 87,910,917 | | | | 2,445,756 | |
| | | | |
Dividends and distributions to shareholders: | | | | | | | | |
From net investment income: | | | | | | | | |
Initial Class | | | (490,591 | ) | | | (445,091 | ) |
Service Class | | | (11,865,785 | ) | | | (10,398,828 | ) |
| | | | |
| | | (12,356,376 | ) | | | (10,843,919 | ) |
| | | | |
From net realized gain on investments: | | | | | | | | |
Initial Class | | | (1,845,798 | ) | | | (55,994 | ) |
Service Class | | | (50,502,457 | ) | | | (1,456,834 | ) |
| | | | |
| | | (52,348,255 | ) | | | (1,512,828 | ) |
| | | | |
Total dividends and distributions to shareholders | | | (64,704,631 | ) | | | (12,356,747 | ) |
| | | | |
Capital share transactions: | | | | | | | | |
Net proceeds from sale of shares | | | 176,450,578 | | | | 176,516,241 | |
Net asset value of shares issued to shareholders in reinvestment of dividends and distributions | | | 64,704,631 | | | | 12,356,747 | |
Cost of shares redeemed | | | (81,394,039 | ) | | | (103,788,006 | ) |
| | | | |
Increase (decrease) in net assets derived from capital share transactions | | | 159,761,170 | | | | 85,084,982 | |
| | | | |
Net increase (decrease) in net assets | | | 182,967,456 | | | | 75,173,991 | |
|
| Net Assets | |
Beginning of year | | | 671,888,820 | | | | 596,714,829 | |
| | | | |
End of year | | $ | 854,856,276 | | | $ | 671,888,820 | |
| | | | |
Undistributed net investment income at end of year | | $ | 18,705,759 | | | $ | 12,356,371 | |
| | | | |
| | | | |
| M-360 | | MainStay VP Moderate Allocation Portfolio | | The notes to the financial statements are an integral part of,
and should be read in conjunction with, the financial statements. |
Financial Highlights selected per share data and ratios
| | | | | | | | | | | | | | | | | | | | |
| | | Initial Class | |
| | | Year ended December 31, | |
| | | 2012 | | | 2011 | | | 2010 | | | 2009 | | | 2008 | |
Net asset value at beginning of year | | $ | 10.76 | | | $ | 10.90 | | | $ | 9.85 | | | $ | 8.30 | | | $ | 11.32 | |
| | | | | | | | | | | | | | | | | | | | |
Net investment income (loss) | | | 0.21 | (a) | | | 0.21 | (a) | | | 0.21 | (a) | | | 0.20 | | | | 0.21 | |
Net realized and unrealized gain (loss) on investments | | | 1.14 | | | | (0.12 | ) | | | 1.07 | | | | 1.80 | | | | (3.06 | ) |
| | | | | | | | | | | | | | | | | | | | |
Total from investment operations | | | 1.35 | | | | 0.09 | | | | 1.28 | | | | 2.00 | | | | (2.85 | ) |
| | | | | | | | | | | | | | | | | | | | |
Less dividends and distributions: | | | | | | | | | | | | | | | | | | | | |
From net investment income | | | (0.20 | ) | | | (0.20 | ) | | | (0.23 | ) | | | (0.26 | ) | | | (0.04 | ) |
From net realized gain on investments | | | (0.75 | ) | | | (0.03 | ) | | | — | | | | (0.19 | ) | | | (0.13 | ) |
| | | | | | | | | | | | | | | | | | | | |
Total dividends and distributions | | | (0.95 | ) | | | (0.23 | ) | | | (0.23 | ) | | | (0.45 | ) | | | (0.17 | ) |
| | | | | | | | | | | | | | | | | | | | |
Net asset value at end of year | | $ | 11.16 | | | $ | 10.76 | | | $ | 10.90 | | | $ | 9.85 | | | $ | 8.30 | |
| | | | | | | | | | | | | | | | | | | | |
Total investment return | | | 12.61 | % | | | 0.94 | % | | | 13.09 | % | | | 24.22 | % | | | (25.18 | %) |
Ratios (to average net assets)/Supplemental Data: | | | | | | | | | | | | | | | | | | | | |
Net investment income (loss) | | | 1.88 | % | | | 1.88 | % | | | 2.10 | % | | | 3.00 | % | | | 2.56 | % |
Net expenses (b) | | | 0.03 | % | | | 0.04 | % | | | 0.05 | % | | | 0.05 | % | | | 0.06 | % |
Portfolio turnover rate | | | 55 | % | | | 63 | % | | | 37 | % | | | 40 | % | | | 46 | % |
Net assets at end of year (in 000’s) | | $ | 29,575 | | | $ | 23,369 | | | $ | 24,136 | | | $ | 19,224 | | | $ | 12,681 | |
| (a) | Per share data based on average shares outstanding during the year. |
| (b) | In addition to the fees and expenses which the Portfolio bears directly, the Portfolio indirectly bears a pro-rata share of the fees and expenses of the Underlying Portfolios/Funds in which it invests. Such indirect expenses are not included in the above expense ratios. |
| | | | | | | | | | | | | | | | | | | | |
| | | Service Class | |
| | | Year ended December 31, | |
| | | 2012 | | | 2011 | | | 2010 | | | 2009 | | | 2008 | |
Net asset value at beginning of year | | $ | 10.71 | | | $ | 10.86 | | | $ | 9.82 | | | $ | 8.28 | | | $ | 11.30 | |
| | | | | | | | | | | | | | | | | | | | |
Net investment income (loss) | | | 0.19 | (a) | | | 0.18 | (a) | | | 0.19 | (a) | | | 0.19 | | | | 0.19 | |
Net realized and unrealized gain (loss) on investments | | | 1.14 | | | | (0.12 | ) | | | 1.06 | | | | 1.78 | | | | (3.06 | ) |
| | | | | | | | | | | | | | | | | | | | |
Total from investment operations | | | 1.33 | | | | 0.06 | | | | 1.25 | | | | 1.97 | | | | (2.87 | ) |
| | | | | | | | | | | | | | | | | | | | |
Less dividends and distributions: | | | | | | | | | | | | | | | | | | | | |
From net investment income | | | (0.18 | ) | | | (0.18 | ) | | | (0.21 | ) | | | (0.24 | ) | | | (0.02 | ) |
From net realized gain on investments | | | (0.75 | ) | | | (0.03 | ) | | | — | | | | (0.19 | ) | | | (0.13 | ) |
| | | | | | | | | | | | | | | | | | | | |
Total dividends and distributions | | | (0.93 | ) | | | (0.21 | ) | | | (0.21 | ) | | | (0.43 | ) | | | (0.15 | ) |
| | | | | | | | | | | | | | | | | | | | |
Net asset value at end of year | | $ | 11.11 | | | $ | 10.71 | | | $ | 10.86 | | | $ | 9.82 | | | $ | 8.28 | |
| | | | | | | | | | | | | | | | | | | | |
Total investment return | | | 12.33 | % | | | 0.69 | % | | | 12.81 | % | | | 23.99 | % | | | (25.38 | %) |
Ratios (to average net assets)/Supplemental Data: | | | | | | | | | | | | | | | | | | | | |
Net investment income (loss) | | | 1.65 | % | | | 1.68 | % | | | 1.89 | % | | | 2.76 | % | | | 2.21 | % |
Net expenses (b) | | | 0.28 | % | | | 0.29 | % | | | 0.30 | % | | | 0.30 | % | | | 0.31 | % |
Portfolio turnover rate | | | 55 | % | | | 63 | % | | | 37 | % | | | 40 | % | | | 46 | % |
Net assets at end of year (in 000’s) | | $ | 825,281 | | | $ | 648,520 | | | $ | 572,578 | | | $ | 421,477 | | | $ | 287,680 | |
| (a) | Per share data based on average shares outstanding during the year. |
| (b) | In addition to the fees and expenses which the Portfolio bears directly, the Portfolio indirectly bears a pro-rata share of the fees and expenses of the Underlying Portfolios/Funds in which it invests. Such indirect expenses are not included in the above expense ratios. |
| | | | | | |
The notes to the financial statements are an integral part of,
and should be read in conjunction with, the financial statements. | | mainstayinvestments.com | | | M-361 | |
MainStay VP Moderate Growth Allocation Portfolio
Investment and Performance Comparison1 (Unaudited)
Performance data quoted represents past performance. Past performance is no guarantee of future results. Because of market volatility, current performance may be lower or higher than the figures shown. Investment return and principal value will fluctuate, and as a result, when shares are redeemed, they may be worth more or less than their original cost. The performance table and graph do not reflect any deduction of sales charges mortality and expense charges, contract charges, or administrative charges. Please refer to the Performance Summary appropriate for your policy. For performance information current to the most recent month-end, please call 800-598-2019 or visit www.newyorklife.com.
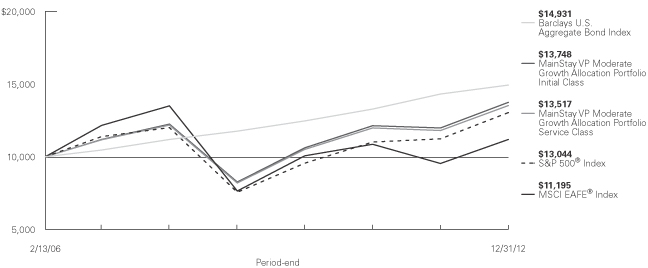
Average Annual Total Returns for the Period Ended December 31, 2012
| | | | | | | | | | | | | | |
| Class | | One Year | | Five Years | | | Since
Inception
(2/13/06) | | | Gross
Expense
Ratio2 | |
| Initial Class Shares | | 14.66% | | | 2.34 | % | | | 4.73 | % | | | 1.03 | % |
| Service Class Shares | | 14.37 | | | 2.09 | | | | 4.47 | | | | 1.28 | |
| | | | | | | | | | | | |
| Benchmark Performance | | One
Year | | | Five
Years | | | Since Inception
(2/13/06) | |
S&P 500® Index3 | | | 16.00 | % | | | 1.66 | % | | | 3.93 | % |
MSCI EAFE® Index3 | | | 17.32 | | | | –3.69 | | | | 1.65 | |
Barclays U.S. Aggregate Bond Index3 | | | 4.22 | | | | 5.95 | | | | 5.99 | |
Average Lipper Variable Products Mixed-Asset Target Allocation Growth Portfolio4 | | | 13.50 | | | | 1.93 | | | | 3.23 | |
| 1. | Performance figures reflect certain fee waivers and/or expense limitations, without which total returns may have been different. For information on current fee waivers and/or expense limitations, please refer to the notes to the financial statements. |
| 2. | The gross expense ratios presented reflect the Portfolio’s “Total Annual Portfolio Operating Expenses” from the most recent Prospectus and may differ from other expense ratios disclosed in this report. |
| 3. | Please refer to pages M-2 and M-3 for additional explanations and disclosure regarding the Portfolios, their benchmark indices and other indices mentioned in the reports. |
| 4. | The Average Lipper Variable Products Mixed-Asset Target Allocation Growth Portfolio is representative of portfolios that, by portfolio practice, maintain a mix of between 60%-80% equity securities, with the remainder invested in bonds, cash, and cash equivalents. Lipper Inc. is an independent monitor of fund performance. Results are based on total returns with all dividend and capital gain distributions reinvested. |
| | |
| M-362 | | MainStay VP Moderate Growth Allocation Portfolio |
Cost in Dollars of a $1,000 Investment in MainStay VP Moderate Growth Allocation Portfolio (Unaudited)
The example below is intended to describe the fees and expenses borne by shareholders during the six-month period from July 1, 2012 to December 31, 2012, and the impact of those costs on your investment.
Example
As a shareholder of the Portfolio, you incur two types of costs: (1) transaction costs, including exchange fees and sales charges (loads) on purchases (as applicable), and (2) ongoing costs, including management fees, distribution and/or service (12b-1) fees, and other Portfolio expenses (as applicable). This example is intended to help you understand your ongoing costs (in dollars) of investing in the Portfolio and to compare these costs with the ongoing costs of investing in other Portfolios. The example is based on an investment of $1,000 made at the beginning of the six-month period and held for the entire period from July 1, 2012, to December 31, 2012. Shares are only sold in connection with variable life and annuity contracts and the example does not reflect any contract level or transactional fees or expenses. If these costs had been included, your costs would have been higher.
This example illustrates your Portfolio’s ongoing costs in two ways:
Actual Expenses
The second and third data columns in the table below provide information about actual account values and actual expenses. You may use the information in these columns, together with the amount you invested, to estimate the
expenses that you paid during the six months ended December 31, 2012. Simply divide your account value by $1,000 (for example, an $8,600 account value divided by $1,000 = 8.6), then multiply the result by the number under the heading entitled ‘‘Expenses Paid During Period’’ to estimate the expenses you paid on your account during this period.
Hypothetical Example for Comparison Purposes
The fourth and fifth data columns in the table below provide information about hypothetical account values and hypothetical expenses based on the Portfolio’s actual expense ratio and an assumed rate of return of 5% per year before expenses, which is not the Portfolio’s actual return. The hypothetical account values and expenses may not be used to estimate the actual ending account balances or expenses you paid for the six-month period shown. You may use this information to compare the ongoing costs of investing in the Portfolio with the ongoing costs of investing in other Portfolios. To do so, compare this 5% hypothetical example with the 5% hypothetical examples that appear in the shareholder reports of the other Portfolios.
Please note that the expenses shown in the table are meant to highlight your ongoing costs only and do not reflect any transactional costs, such as exchange fees or sales charges (loads). Therefore, the fourth and fifth data columns of the table are useful in comparing ongoing costs only and will not help you determine the relative total costs of owning different funds. In addition, if these transactional costs were included, your costs would have been higher.
| | | | | | | | | | | | | | | | | | | | |
| | | | | | | | | | | | | | | | |
| Share Class | | Beginning
Account
Value
7/1/12 | | | Ending Account
Value (Based
on Actual
Returns and
Expenses)
12/31/12 | | | Expenses
Paid
During
Period1 | | | Ending Account
Value (Based
on Hypothetical
5% Annualized
Return and
Actual Expenses)
12/31/12 | | | Expenses
Paid
During
Period1 | |
| | | | | |
| Initial Class Shares | | $ | 1,000.00 | | | $ | 1,078.10 | | | $ | 0.16 | | | $ | 1,025.00 | | | $ | 0.15 | |
| | | | | |
| Service Class Shares | | $ | 1,000.00 | | | $ | 1,076.80 | | | $ | 1.46 | | | $ | 1,023.70 | | | $ | 1.42 | |
| 1. | Expenses are equal to the Portfolio’s annualized expense ratio of each class (0.03% for Initial Class and 0.28% for Service Class) multiplied by the average account value over the period, divided by 366 and multiplied by 184 (to reflect the six-month period). The table above represents the actual expenses incurred during the six-month period. In addition to the fees and expenses which the Portfolio bears directly, the Portfolio indirectly bears a pro rata share of the fees and expenses of the Underlying Portfolios/Funds in which it invests. Such indirect expenses are not included in the above-reported expense figures. |
| | | | |
| mainstayinvestments.com | | | M-363 | |
Investment Objectives of Underlying Portfolios/Funds as of December 31, 2012 (Unaudited)
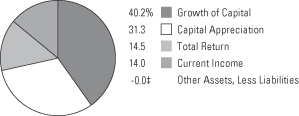
See Portfolio of Investments beginning on page M-368 for specific holdings within these categories.
| ‡ | Less than one-tenth of a percent. |
| | |
| M-364 | | MainStay VP Moderate Growth Allocation Portfolio |
Portfolio Management Discussion and Analysis (Unaudited)
Answers to the questions reflect the views of portfolio managers Jae S. Yoon, CFA, and Jonathan Swaney of New York Life Investments,1 the Portfolio’s Manager.
How did MainStay VP Moderate Growth Allocation Portfolio perform relative to its peers and its benchmarks during the 12 months ended December 31, 2012?
For the 12 months ended December 31, 2012, MainStay VP Moderate Growth Allocation Portfolio returned 14.66% for Initial Class shares and 14.37% for Service Class shares. Over the same period, both share classes outperformed the 13.50% return of the average Lipper2 Variable Products Mixed-Asset Target Allocation Growth Portfolio and underperformed the 16.00% return of the S&P 500® Index.2 The S&P 500® Index is the Portfolio’s broad-based securities-market index. For the 12 months ended December 31, 2012, both share classes underperformed the 17.32% return of the MSCI EAFE® Index,2 which is the secondary benchmark for the Portfolio. Over the same period, both share classes outperformed the 4.22% return of the Barclays U.S. Aggregate Bond Index,2 which is an additional benchmark for the Portfolio.
What factors affected the Portfolio’s relative performance during the reporting period?
The Portfolio is a “fund of funds” that invests primarily in other MainStay Portfolios and other Funds managed by New York Life Investments (the “Underlying Portfolios/Funds”). The Underlying Portfolios/Funds may invest in fixed-income securities or in domestic or international stocks at various capitalization levels. The Portfolio’s primary benchmark, on the other hand, consists entirely of U.S. large-cap stocks. These differences—particularly the Portfolio’s significant allocation to Underlying Portfolios/Funds that invest in fixed-income securities—accounted for many of the challenges the Portfolio experienced in terms of relative performance.
Our effort to manage the risk posture of the Portfolio by adjusting its mix of stocks and bonds contributed positively to the Portfolio’s relative performance. Within the allocation ranges outlined in the Prospectus, the Portfolio at times adopted a small bias in favor of Underlying Portfolios/Funds that invest in stocks over Underlying Portfolios/Funds that invest in bonds. This bias was used early in the reporting period, early in the summer and near year-end, and the bias was
beneficial each time. Persistent exposure to lower-quality bonds and loans also boosted returns, although efforts to lower the Portfolio’s sensitivity to interest rates by investing in Underlying Portfolios/Funds that held shorter-maturity instruments detracted slightly, as interest rates fell to levels we did not anticipate.
Among the Underlying Portfolios/Funds in which the Portfolio invested, results were mixed. Several fared quite well relative to their respective peers and benchmarks. Among these were MainStay VP Flexible Bond Opportunities Portfolio and MainStay 130/30 International Fund. Other substantial holdings experienced challenges. Among these were MainStay VP Large Cap Growth Portfolio, MainStay Epoch U.S. All Cap Fund and MainStay VP High Yield Corporate Bond Portfolio. While asset-class positioning generally added to the Portfolio’s returns, some returns among the Underlying Portfolios/Funds detracted from the Portfolio’s relative performance.
How did you allocate the Portfolio’s assets during the reporting period and why?
In managing the Portfolio, we considered a variety of information, including the portfolio-level characteristics of the Underlying Portfolios/Funds, such as capitalization, style biases, sector exposures, credit quality and duration.3 We also examined the attributes of the individual holdings of the Underlying Portfolios/Funds, such as valuation metrics, earnings data and technical indicators. Finally, we evaluated the historical success of the portfolio managers responsible for the Underlying Portfolios/Funds. Generally speaking, we seek to invest in Underlying Portfolios/Funds that occupy attractively valued segments of the market, invest in fairly priced securities and are steered by individuals who have consistently demonstrated capable management in the past.
The Portfolio’s blend of stocks and bonds varied slightly over the course of the reporting period in response to the changing environment. In the equity portion of the Portfolio, we placed a mild emphasis on two themes. First, we viewed Underlying Portfolios/Funds that invest in large-capitalization stocks favorably in relation to Underlying Portfolios/Funds that
| 1. | “New York Life Investments” is a service mark used by New York Life Investment Management LLC. |
| 2. | Please refer to pages M-2 and M-3 for additional explanations and disclosure regarding the Portfolios, their benchmark indices and service providers mentioned in the reports. |
| 3. | Duration is a measure of the price sensitivity of a fixed-income investment to changes in interest rates. Duration is expressed as a number of years and is considered a more accurate sensitivity gauge than average maturity. |
| | | | |
| mainstayinvestments.com | | | M-365 | |
invest in small-cap stocks. We adopted this positioning because we believed that large-cap stocks were more attractively valued, had superior access to capital and were better positioned to benefit from growth in the developing world. Second, we preferred Underlying Portfolios/Funds that invest in U.S. stocks over Underlying Portfolios/Funds that invest in stocks of other developed markets. Both of these positioning strategies contributed positively to the Portfolio’s returns during the first half of the year, but surrendered their gains in the second half. The result was relatively neutral for the year as a whole.
The fixed-income portion of the Portfolio had a slightly shorter duration than the Barclays U.S. Aggregate Bond Index. We also tilted the Portfolio heavily toward Underlying Portfolios/Funds that invest in corporate bonds over those that invest in government-backed issues. This positioning reflected our view that corporations have improved the quality of their balance sheets significantly in the past few years by reducing leverage, accumulating cash and controlling operating costs. In our opinion, if corporate default rates remain low for the next few years, investors are likely to find the yields available on corporate bonds attractive relative to the yields available on U.S. Treasury instruments. The Portfolio’s credit exposure had a positive influence on relative results, but interest rates have not yet moved in the direction we anticipated.
How did the Portfolio’s allocations change over the course of the reporting period?
In the equity portion of the Portfolio, the primary allocation changes came as several new options were introduced to the pool of eligible investments. We established new positions in MainStay VP T. Rowe Price Equity Income Portfolio, MainStay VP Eagle Small Cap Growth Portfolio and MainStay VP DFA / DuPont Capital Emerging Markets Equity Portfolio, with funding coming from a variety of sources, including selling shares of MainStay VP Mid Cap Core Portfolio, MainStay ICAP Equity Fund and MainStay Epoch U.S. All Cap Fund. We also materially increased the Portfolio’s holdings of MainStay VP S&P 500® Index Portfolio and MainStay VP Large Cap Growth Portfolio.
As of December 31, 2012, the Portfolio was in the process of exiting positions in certain Underlying Portfolios/Funds that occupy specialized segments of the investable universe. Among these were MainStay Epoch International Small Cap Fund and MainStay VP Convertible Portfolio. In our opinion, the risk-adjusted return potential of these Underlying Portfolios/Funds has become less compelling than it was in previous periods.
In the fixed-income portion of the Portfolio, we emphasized two general themes. First, we sought to reduce exposure to the lowest-quality credits. This led us to cut the Portfolio’s holdings of MainStay VP Flexible Bond Opportunities Portfolio in half while shifting some of the proceeds into MainStay Intermediate Term Bond Fund. While we believed that government bonds represented a very poor value proposition, we were also wary of the junk bond market, which we believed had become increasingly speculative. In light of these concerns, we believed that emphasizing the middle of the quality spectrum would be a prudent strategy. Second, we shortened the Portfolio’s duration in an effort to reduce the Portfolio’s sensitivity to a potential rise in interest rates. Our primary tool in this effort was to increase the size of the Portfolio’s position in MainStay VP Floating Rate Portfolio. With the same goal in mind, we also established a position in the new MainStay Short Duration High Yield Fund.
Which Underlying Equity Portfolios/Funds had the highest total returns during the reporting period, and which Underlying Equity Portfolios/Funds had the lowest total returns?
Among the Underlying Equity Portfolios/Funds in which the Portfolio invested, MainStay 130/30 International Fund had the highest return for 2012, followed by MainStay VP International Equity Portfolio and MainStay Epoch International Small Cap Fund. Although all Underlying Equity Portfolios/Funds in which the Portfolio invested generated positive returns for the reporting period, the lowest total returns came from MainStay Epoch U.S. All Cap Fund and MainStay VP U.S. Small Cap Portfolio.
| | |
| M-366 | | MainStay VP Moderate Growth Allocation Portfolio |
Which Underlying Equity Portfolios/Funds made the strongest positive contributions to the Portfolio’s overall performance, and which Underlying Equity Portfolios/Funds were the greatest detractors?
The most significant contributions the Portfolio’s equity performance came from large positions in MainStay MAP Fund and VP Large Cap Growth Portfolio. (Contributions take weightings and total returns into account.) The weakest equity contributions came from MainStay VP Eagle Small Cap Growth Portfolio and MainStay Marketfield Fund. That some positions made only marginal contributions tended to reflect position size and timing as much as the returns of the Underlying Portfolios/Funds.
What factors and risks affected the Portfolio’s Underlying Fixed-Income Portfolio/Fund investments during the reporting period?
Central bank policy played a pivotal role in the fixed-income markets during 2012. Amid slowing global economic growth, distressed European sovereign debt markets and looming fiscal retrenchment in the United States, the Federal Reserve pursued aggressively accommodative policies. The Federal Reserve’s maturity extension program (referred to by some as “Operation Twist”), its loose policy guidance and its additional securities purchases helped keep interest rates suppressed across the entire yield curve.4 These moves proved detrimental to relative performance to the extent that the Portfolio’s duration was shorter than that of the Barclays U.S. Aggregate Bond Index. On the other hand, these same policies helped reduce risk aversion and led to tightening credit spreads5 that benefited the Portfolio on a larger scale.
During the reporting period, which fixed-income market segments were the strongest positive contributors to the Portfolio’s performance and which segments were particularly weak?
Over the course of 2012, high-yield debt generally provided strong results. Over the same period, cash and short-duration bonds issued by the governments of developed nations provided comparatively weak returns.
Which Underlying Fixed-Income Portfolios/Funds made the strongest positive contributions to the Portfolio’s performance, and which Underlying Fixed-Income Portfolios/Funds were the greatest detractors?
The largest contribution to the Portfolio’s fixed-income performance came from MainStay VP Flexible Bond Opportunities Portfolio, followed by MainStay Floating Rate Portfolio. While all of the Underlying Fixed-Income Portfolios/Funds in which the Portfolio invested provided positive total returns for 2012, the smallest contributions came from MainStay VP Cash Management Portfolio followed by a small position in MainStay VP Convertibles Portfolio.
| 4. | The yield curve is a line that plots the yields of various securities of similar quality—typically U.S. Treasury issues—across a range of maturities. The U.S. Treasury yield curve serves as a benchmark for other debt and is used in economic forecasting. |
| 5. | The terms “spread” and “yield spread” may refer to the difference in yield between a security or type of security and comparable U.S. Treasury issues. The terms may also refer to the difference in yield between two specific securities or types of securities at a given time. The term “credit spread” usually refers to the yield spread between credit securities and comparable U.S. Treasury securities. |
The opinions expressed are those of the portfolio managers as of the date of this report and are subject to change. There is no guarantee that any forecasts made will come to pass. This material does not constitute investment advice and is not intended as an endorsement of any specific investment.
Not all MainStay VP Portfolios and/or share classes are available under all policies.
| | | | |
| mainstayinvestments.com | | | M-367 | |
Portfolio of Investments December 31, 2012
| | | | | | | | |
| | | Shares | | | Value | |
| Affiliated Investment Companies 100.0%† | |
Equity Funds 83.7% | |
MainStay 130/30 Core Fund Class I (a) | | | 14,760,038 | | | $ | 115,718,694 | |
MainStay 130/30 International Fund Class I (a) | | | 8,600,955 | | | | 60,980,768 | |
MainStay Epoch Global Choice Fund Class I (a) | | | 1,661,232 | | | | 28,174,497 | |
MainStay Epoch International Small Cap Fund Class I | | | 191,805 | | | | 3,538,797 | |
MainStay Epoch U.S. All Cap Fund Class I (a) | | | 1,553,876 | | | | 34,480,510 | |
MainStay ICAP Equity Fund Class I (a) | | | 1,081,546 | | | | 43,759,340 | |
MainStay ICAP International Fund Class I (a) | | | 1,434,147 | | | | 43,167,831 | |
MainStay MAP Fund Class I (a) | | | 5,115,311 | | | | 180,775,077 | |
MainStay Marketfield Fund Class I | | | 290,180 | | | | 4,596,458 | |
MainStay VP Common Stock Portfolio Initial Class | | | 486,889 | | | | 8,958,962 | |
MainStay VP DFA / DuPont Capital Emerging Markets Equity Portfolio Initial Class (a)(b) | | | 2,770,327 | | | | 28,030,472 | |
MainStay VP Eagle Small Cap Growth Portfolio Initial Class (a)(b) | | | 2,834,108 | | | | 28,326,807 | |
MainStay VP ICAP Select Equity Portfolio Initial Class | | | 800,254 | | | | 11,009,338 | |
MainStay VP International Equity Portfolio Initial Class (a) | | | 1,519,843 | | | | 18,446,299 | |
MainStay VP Large Cap Growth Portfolio Initial Class (a)(b) | | | 8,837,271 | | | | 149,143,214 | |
MainStay VP Mid Cap Core Portfolio Initial Class (a) | | | 1,656,166 | | | | 20,260,043 | |
MainStay VP S&P 500 Index Portfolio Initial Class (a) | | | 1,389,286 | | | | 40,194,781 | |
MainStay VP T. Rowe Price Equity Income Portfolio Initial Class (a)(b) | | | 8,500,215 | | | | 91,694,571 | |
MainStay VP U.S. Small Cap Portfolio Initial Class (a) | | | 5,128,199 | | | | 51,601,894 | |
MainStay VP Van Eck Global Hard Assets Portfolio Initial Class (b) | | | 686,773 | | | | 6,236,359 | |
| | | | | | | | |
Total Equity Funds (Cost $904,742,598) | | | | | | | 969,094,712 | |
| | | | | | | | |
|
Fixed Income Funds 16.3% | |
MainStay High Yield Opportunities Fund Class I | | | 200,295 | | | | 2,429,583 | |
MainStay Intermediate Term Bond Fund Class I | | | 2,165,942 | | | | 24,020,299 | |
MainStay Short Duration High Yield Fund Class I (a) | | | 229,619 | | | | 2,284,708 | |
| | | | | | | | |
| | | Shares | | | Value | |
Fixed Income Funds (continued) | |
MainStay VP Cash Management Portfolio Initial Class | | | 7,220,549 | | | $ | 7,220,383 | |
MainStay VP Convertible Portfolio Initial Class | | | 192,359 | | | | 2,249,801 | |
MainStay VP Flexible Bond Opportunities Portfolio Initial Class (a) | | | 4,395,424 | | | | 45,344,517 | |
MainStay VP Floating Rate Portfolio Initial Class (a) | | | 9,119,831 | | | | 84,980,292 | |
MainStay VP High Yield Corporate Bond Portfolio Initial Class | | | 2,003,202 | | | | 20,412,380 | |
| | | | | | | | |
Total Fixed Income Funds
(Cost $184,935,905) | | | | | | | 188,941,963 | |
| | | | | | | | |
Total Investments
(Cost $1,089,678,503) (c) | | | 100.0 | % | | | 1,158,036,675 | |
Other Assets, Less Liabilities | | | (0.0 | )‡ | | | (204,199 | ) |
Net Assets | | | 100.0 | % | | $ | 1,157,832,476 | |
| † | Percentages indicated are based on Portfolio net assets. |
| ‡ | Less than one-tenth of a percent. |
| (a) | The Portfolio’s ownership exceeds 5% of the outstanding shares of the Underlying Portfolio’s/Fund’s share class. (See Note 3) |
| (b) | Non-income producing Underlying Portfolio/Fund. |
| (c) | As of December 31, 2012, cost is $1,101,919,007 for federal income tax purposes and net unrealized appreciation is as follows: |
| | | | |
Gross unrealized appreciation | | $ | 58,615,213 | |
Gross unrealized depreciation | | | (2,497,545 | ) |
| | | | |
Net unrealized appreciation | | $ | 56,117,668 | |
| | | | |
| | | | |
| M-368 | | MainStay VP Moderate Growth Allocation Portfolio | | The notes to the financial statements are an integral part of,
and should be read in conjunction with, the financial statements. |
| | | | | | | | | | | | | | | | |
The following is a summary of the fair valuations according to the inputs used as of December 31, 2012, for valuing the
Portfolio’s assets. Asset Valuation Inputs | |
Description | | Quoted Prices
in Active Markets
for Identical Assets (Level 1) | | | Significant Other
Observable Inputs
(Level 2) | | | Significant
Unobservable
Inputs (Level 3) | | | Total | |
| Investments (a) | | | | | | | | | | | | | | | | |
| Affiliated Investment Companies | | | | | | | | | | | | | | | | |
Equity Funds | | $ | 969,094,712 | | | $ | — | | | $ | — | | | $ | 969,094,712 | |
Fixed Income Funds | | | 188,941,963 | | | | — | | | | — | | | | 188,941,963 | |
| | | | | | | | | | | | | | | | |
| Total Investments | | $ | 1,158,036,675 | | | $ | — | | | $ | — | | | $ | 1,158,036,675 | |
| | | | | | | | | | | | | | | | |
| (a) | For a complete listing of investments, see the Portfolio of Investments. |
The Portfolio recognizes transfers between the levels as of the beginning of the period.
For the year ended December 31, 2012, the Portfolio did not have any transfers between Level 1 and Level 2 fair value measurements. (See Note 2)
As of December 31, 2012, the Portfolio did not hold any investments with significant unobservable inputs (Level 3). (See Note 2)
| | | | | | |
The notes to the financial statements are an integral part of,
and should be read in conjunction with, the financial statements. | | mainstayinvestments.com | | | M-369 | |
Statement of Assets and Liabilities as of December 31, 2012
| | | | |
| Assets | |
Investment in affiliated investment companies, at value (identified cost $1,089,678,503) | | $ | 1,158,036,675 | |
Receivables: | | | | |
Investment securities sold | | | 1,357,212 | |
Fund shares sold | | | 1,022,359 | |
Other assets | | | 4,390 | |
| | | | |
Total assets | | | 1,160,420,636 | |
| | | | |
| |
| Liabilities | | | | |
Payables: | | | | |
Investment securities purchased | | | 1,663,861 | |
Fund shares redeemed | | | 573,842 | |
NYLIFE Distributors (See Note 3) | | | 232,922 | |
Shareholder communication | | | 88,802 | |
Professional fees | | | 26,308 | |
Directors | | | 1,628 | |
Custodian | | | 797 | |
| | | | |
Total liabilities | | | 2,588,160 | |
| | | | |
Net assets | | $ | 1,157,832,476 | |
| | | | |
| |
| Net Assets Consist of | | | | |
Shares of beneficial interest outstanding (par value of $.001 per share) unlimited number of shares authorized | | $ | 105,083 | |
Additional paid-in capital | | | 1,100,983,532 | |
| | | | |
| | | 1,101,088,615 | |
Undistributed net investment income | | | 17,312,764 | |
Accumulated net realized gain (loss) on investments | | | (28,927,075 | ) |
Net unrealized appreciation (depreciation) on investments | | | 68,358,172 | |
| | | | |
Net assets | | $ | 1,157,832,476 | |
| | | | |
| | | | |
Initial Class | | | | |
Net assets applicable to outstanding shares | | $ | 44,210,090 | |
| | | | |
Shares of beneficial interest outstanding | | | 3,992,751 | |
| | | | |
Net asset value per share outstanding | | $ | 11.07 | |
| | | | |
Service Class | | | | |
Net assets applicable to outstanding shares | | $ | 1,113,622,386 | |
| | | | |
Shares of beneficial interest outstanding | | | 101,090,100 | |
| | | | |
Net asset value per share outstanding | | $ | 11.02 | |
| | | | |
| | | | |
| M-370 | | MainStay VP Moderate Growth Allocation Portfolio | | The notes to the financial statements are an integral part of,
and should be read in conjunction with, the financial statements. |
Statement of Operations for the year ended December 31, 2012
| | | | |
| Investment Income (Loss) | |
Income | | | | |
Dividend distributions from affiliated investment companies | | $ | 15,801,832 | |
| | | | |
Expenses | | | | |
Distribution and service—Service Class (See Note 3) | | | 2,439,473 | |
Shareholder communication | | | 174,472 | |
Professional fees | | | 63,346 | |
Directors | | | 26,798 | |
Custodian | | | 5,169 | |
Miscellaneous | | | 26,703 | |
| | | | |
Total expenses | | | 2,735,961 | |
| | | | |
Net investment income (loss) | | | 13,065,871 | |
| | | | |
|
| Realized and Unrealized Gain (Loss) on Investments | |
Net realized gain (loss) on: | | | | |
Affiliated investment company transactions | | | 37,531,643 | |
Realized capital gain distributions from affiliated investment companies | | | 13,093,846 | |
| | | | |
Net realized gain (loss) on investments from affiliated investment companies | | | 50,625,489 | |
| | | | |
Net change in unrealized appreciation (depreciation) on investments | | | 68,751,763 | |
| | | | |
Net realized and unrealized gain (loss) on investments | | | 119,377,252 | |
| | | | |
Net increase (decrease) in net assets resulting from operations | | $ | 132,443,123 | |
| | | | |
| | | | | | |
The notes to the financial statements are an integral part of,
and should be read in conjunction with, the financial statements. | | mainstayinvestments.com | | | M-371 | |
Statements of Changes in Net Assets
for the years ended December 31, 2012 and December 31, 2011
| | | | | | | | |
| | | 2012 | | | 2011 | |
| Increase (Decrease) in Net Assets | |
Operations: | | | | | | | | |
Net investment income (loss) | | $ | 13,065,871 | | | $ | 10,807,746 | |
Net realized gain (loss) on investments from affiliated investment companies transactions | | | 50,625,489 | | | | 39,442,434 | |
Net change in unrealized appreciation (depreciation) on investments | | | 68,751,763 | | | | (65,867,753 | ) |
| | | | |
Net increase (decrease) in net assets resulting from operations | | | 132,443,123 | | | | (15,617,573 | ) |
| | | | |
Dividends and distributions to shareholders: | | | | | |
From net investment income: | | | | | | | | |
Initial Class | | | (501,251 | ) | | | (438,345 | ) |
Service Class | | | (10,462,919 | ) | | | (7,776,100 | ) |
| | | | |
| | | (10,964,170 | ) | | | (8,214,445 | ) |
| | | | |
From net realized gain on investments: | | | | | | | | |
Initial Class | | | (1,682,660 | ) | | | — | |
Service Class | | | (41,196,799 | ) | | | — | |
| | | | |
| | | (42,879,459 | ) | | | — | |
| | | | |
Total dividends and distributions to shareholders | | | (53,843,629 | ) | | | (8,214,445 | ) |
| | | | |
Capital share transactions: | | | | | | | | |
Net proceeds from sale of shares | | | 246,403,101 | | | | 297,522,790 | |
Net asset value of shares issued to shareholders in reinvestment of dividends and distributions | | | 53,843,629 | | | | 8,214,445 | |
Cost of shares redeemed | | | (72,905,965 | ) | | | (72,098,609 | ) |
| | | | |
Increase (decrease) in net assets derived from capital share transactions | | | 227,340,765 | | | | 233,638,626 | |
| | | | |
Net increase (decrease) in net assets | | | 305,940,259 | | | | 209,806,608 | |
|
| Net Assets | |
Beginning of year | | | 851,892,217 | | | | 642,085,609 | |
| | | | |
End of year | | $ | 1,157,832,476 | | | $ | 851,892,217 | |
| | | | |
Undistributed net investment income at end of year | | $ | 17,312,764 | | | $ | 10,964,104 | |
| | | | |
| | | | |
| M-372 | | MainStay VP Moderate Growth Allocation Portfolio | | The notes to the financial statements are an integral part of,
and should be read in conjunction with, the financial statements. |
Financial Highlights selected per share data and ratios
| | | | | | | | | | | | | | | | | | | | |
| | | Initial Class | |
| | | Year ended December 31, | |
| | | 2012 | | | 2011 | | | 2010 | | | 2009 | | | 2008 | |
Net asset value at beginning of year | | $ | 10.16 | | | $ | 10.42 | | | $ | 9.25 | | | $ | 7.55 | | | $ | 11.51 | |
| | | | | | | | | | | | | | | | | | | | |
Net investment income (loss) (a) | | | 0.16 | | | | 0.16 | | | | 0.16 | | | | 0.19 | | | | 0.18 | |
Net realized and unrealized gain (loss) on investments | | | 1.32 | | | | (0.30 | ) | | | 1.16 | | | | 1.93 | | | | (3.92 | ) |
| | | | | | | | | | | | | | | | | | | | |
Total from investment operations | | | 1.48 | | | | (0.14 | ) | | | 1.32 | | | | 2.12 | | | | (3.74 | ) |
| | | | | | | | | | | | | | | | | | | | |
Less dividends and distributions: | | | | | | | | | | | | | | | | | | | | |
From net investment income | | | (0.13 | ) | | | (0.12 | ) | | | (0.15 | ) | | | (0.24 | ) | | | (0.06 | ) |
From net realized gain on investments | | | (0.44 | ) | | | — | | | | — | | | | (0.18 | ) | | | (0.16 | ) |
| | | | | | | | | | | | | | | | | | | | |
Total dividends and distributions | | | (0.57 | ) | | | (0.12 | ) | | | (0.15 | ) | | | (0.42 | ) | | | (0.22 | ) |
| | | | | | | | | | | | | | | | | | | | |
Net asset value at end of year | | $ | 11.07 | | | $ | 10.16 | | | $ | 10.42 | | | $ | 9.25 | | | $ | 7.55 | |
| | | | | | | | | | | | | | | | | | | | |
Total investment return | | | 14.66 | % | | | (1.21 | %) | | | 14.33 | % | | | 28.42 | % | | | (32.49 | %) |
Ratios (to average net assets)/Supplemental Data: | | | | | | | | | | | | | | | | | | | | |
Net investment income (loss) | | | 1.46 | % | | | 1.55 | % | | | 1.69 | % | | | 2.35 | % | | | 1.83 | % |
Net expenses (b) | | | 0.03 | % | | | 0.04 | % | | | 0.05 | % | | | 0.05 | % | | | 0.06 | % |
Portfolio turnover rate | | | 52 | % | | | 52 | % | | | 39 | % | | | 45 | % | | | 43 | % |
Net assets at end of year (in 000’s) | | $ | 44,210 | | | $ | 37,848 | | | $ | 38,098 | | | $ | 30,850 | | | $ | 21,525 | |
| (a) | Per share data based on average shares outstanding during the year. |
| (b) | In addition to the fees and expenses which the Portfolio bears directly, the Portfolio indirectly bears a pro-rata share of the fees and expenses of the Underlying Portfolios/Funds in which it invests. Such indirect expenses are not included in the above expense ratios. |
| | | | | | | | | | | | | | | | | | | | |
| | | Service Class | |
| | | Year ended December 31, | |
| | | 2012 | | | 2011 | | | 2010 | | | 2009 | | | 2008 | |
Net asset value at beginning of year | | $ | 10.12 | | | $ | 10.39 | | | $ | 9.23 | | | $ | 7.53 | | | $ | 11.49 | |
| | | | | | | | | | | | | | | | | | | | |
Net investment income (loss) (a) | | | 0.14 | | | | 0.15 | | | | 0.14 | | | | 0.17 | | | | 0.16 | |
Net realized and unrealized gain (loss) on investments | | | 1.31 | | | | (0.32 | ) | | | 1.15 | | | | 1.93 | | | | (3.92 | ) |
| | | | | | | | | | | | | | | | | | | | |
Total from investment operations | | | 1.45 | | | | (0.17 | ) | | | 1.29 | | | | 2.10 | | | | (3.76 | ) |
| | | | | | | | | | | | | | | | | | | | |
Less dividends and distributions: | | | | | | | | | | | | | | | | | | | | |
From net investment income | | | (0.11 | ) | | | (0.10 | ) | | | (0.13 | ) | | | (0.22 | ) | | | (0.04 | ) |
From net realized gain on investments | | | (0.44 | ) | | | — | | | | — | | | | (0.18 | ) | | | (0.16 | ) |
| | | | | | | | | | | | | | | | | | | | |
Total dividends and distributions | | | (0.55 | ) | | | (0.10 | ) | | | (0.13 | ) | | | (0.40 | ) | | | (0.20 | ) |
| | | | | | | | | | | | | | | | | | | | |
Net asset value at end of year | | $ | 11.02 | | | $ | 10.12 | | | $ | 10.39 | | | $ | 9.23 | | | $ | 7.53 | |
| | | | | | | | | | | | | | | | | | | | |
Total investment return | | | 14.37 | % | | | (1.46 | %) | | | 14.05 | % | | | 28.10 | % | | | (32.65 | %) |
Ratios (to average net assets)/Supplemental Data: | | | | | | | | | | | | | | | | | | | | |
Net investment income (loss) | | | 1.28 | % | | | 1.41 | % | | | 1.52 | % | | | 2.08 | % | | | 1.59 | % |
Net expenses (b) | | | 0.28 | % | | | 0.29 | % | | | 0.30 | % | | | 0.30 | % | | | 0.31 | % |
Portfolio turnover rate | | | 52 | % | | | 52 | % | | | 39 | % | | | 45 | % | | | 43 | % |
Net assets at end of year (in 000’s) | | $ | 1,113,622 | | | $ | 814,044 | | | $ | 603,988 | | | $ | 402,800 | | | $ | 293,907 | |
| (a) | Per share data based on average shares outstanding during the year. |
| (b) | In addition to the fees and expenses which the Portfolio bears directly, the Portfolio indirectly bears a pro-rata share of the fees and expenses of the Underlying Portfolios/Funds in which it invests. Such indirect expenses are not included in the above expense ratios. |
| | | | | | |
The notes to the financial statements are an integral part of,
and should be read in conjunction with, the financial statements. | | mainstayinvestments.com | | | M-373 | |
MainStay VP PIMCO Real Return Portfolio
Investment and Performance Comparison1 (Unaudited)
Performance data quoted represents past performance. Past performance is no guarantee of future results. Because of market volatility, current performance may be lower or higher than the figures shown. Investment return and principal value will fluctuate, and as a result, when shares are redeemed, they may be worth more or less than their original cost. The performance table and graph do not reflect any deduction of sales charges, mortality and expense charges, contract charges or administrative charges. Please refer to the Performance Summary appropriate for your policy. For performance information current to the most recent month-end, please call 800-598-2019 or visit www.newyorklife.com.
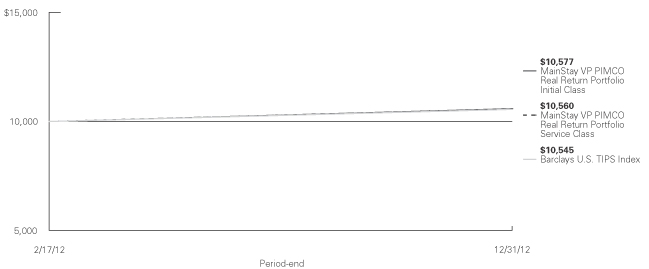
Total Returns for the Period Ended December 31, 2012
| | | | | | | | |
| Class | | Since Inception
(2/17/12) | | | Gross Expense Ratio2 | |
| Initial Class Shares | | | 5.77 | % | | | 0.63 | % |
| Service Class Shares | | | 5.60 | | | | 0.88 | |
| | | | |
| Benchmark Performance | | Since Inception
(2/17/12) | |
Barclays U.S. TIPS Index3 | | | 5.45 | % |
Average Lipper Variable Products Inflation-Protected Bond Portfolio4 | | | 5.68 | |
| 1. | Performance figures reflect certain fee waivers and/or expense limitations, without which total returns may have been different. For information on current fee waivers and/or expense limitations, please refer to the notes to the financial statements. |
| 2. | The gross expense ratios presented reflect the Portfolio’s “Total Annual Portfolio Operating Expenses” from the most recent Prospectus and may differ from other expense ratios disclosed in this report. |
| 3. | Please refer to pages M-2 and M-3 for additional explanations and disclosure regarding the Portfolios, their benchmark indices and other indices mentioned in the reports. |
| 4. | The Average Lipper Variable Products Inflation-Protected Bond Portfolio is representative of portfolios that, by portfolio practice, invest primarily in inflation-indexed fixed income securities. Inflation-linked bonds are fixed income securities structured to provide protection against inflation. Lipper Inc. is an independent monitor of fund performance. Results are based on total returns with all dividend and capital gain distributions reinvested. |
| | |
| M-374 | | MainStay VP PIMCO Real Return Portfolio |
Cost in Dollars of a $1,000 Investment in MainStay VP PIMCO Real Return Portfolio (Unaudited)
The example below is intended to describe the fees and expenses borne by shareholders during the period from July 1, 2012, to December 31, 2012, and the impact of those costs on your investment.
Example
As a shareholder of the Portfolio, you incur two types of costs: (1) transaction costs, including exchange fees and sales charges (loads) on purchases (as applicable), and (2) ongoing costs, including management fees, distribution and/or service (12b-1) fees, and other Portfolio expenses (as applicable). This example is intended to help you understand your ongoing costs (in dollars) of investing in the Portfolio and to compare these costs with the ongoing costs of investing in other Portfolios. The example is based on an investment of $1,000 made at the beginning of the six-month period and held for the entire period from July 1, 2012, to December 31, 2012. Shares are only sold in connection with variable life and annuity contracts and the example does not reflect any contract level or transactional fees or expenses. If these costs had been included, your costs would have been higher.
This example illustrates your Portfolio’s ongoing costs in two ways:
Actual Expenses
The second and third data columns in the table below provide information about actual account values and actual expenses. You may use the information in these columns, together with the amount you invested, to estimate the expenses that you paid during the six months ended
December 31, 2012. Simply divide your account value by $1,000 (for example, an $8,600 account value divided by $1,000 = 8.6), then multiply the result by the number under the heading entitled ‘‘Expenses Paid During Period’’ to estimate the expenses you paid on your account during this period.
Hypothetical Example for Comparison Purposes
The fourth and fifth data columns in the table below provide information about hypothetical account values and hypothetical expenses based on the Portfolio’s actual expense ratio and an assumed rate of return of 5% per year before expenses, which is not the Portfolio’s actual return. The hypothetical account values and expenses may not be used to estimate the actual ending account balances or expenses you paid for the six-month period shown. You may use this information to compare the ongoing costs of investing in the Portfolio with the ongoing costs of investing in other Portfolios. To do so, compare this 5% hypothetical example with the 5% hypothetical examples that appear in the shareholder reports of the other Portfolios.
Please note that the expenses shown in the table are meant to highlight your ongoing costs only and do not reflect any transactional costs, such as exchange fees or sales charges (loads). Therefore, the fourth and fifth data columns of the table are useful in comparing ongoing costs only and will not help you determine the relative total costs of owning different funds. In addition, if these transactional costs were included, your costs would have been higher.
| | | | | | | | | | | | | | | | | | | | |
| | | | | | | | | | | | | | | | |
| Share Class | | Beginning
Account
Value
7/1/12 | | | Ending Account
Value (Based
on Actual
Returns and
Expenses)
12/31/12 | | | Expenses
Paid
During
Period1 | | | Ending Account
Value (Based
on Hypothetical
5% Annualized
Return and
Actual Expenses)
12/31/12 | | | Expenses
Paid
During
Period1 | |
| | | | | |
| Initial Class Shares | | $ | 1,000.00 | | | $ | 1,027.70 | | | $ | 3.16 | | | $ | 1,022.00 | | | $ | 3.15 | |
| | | | | |
| Service Class Shares | | $ | 1,000.00 | | | $ | 1,026.70 | | | $ | 4.13 | | | $ | 1,021.10 | | | $ | 4.12 | |
| 1. | Expenses are equal to the Portfolio’s annualized expense ratio of each class (0.62% for Initial Class and 0.81% for Service Class) multiplied by the average account value over the period, divided by 366 and multiplied by 184 (to reflect the six-month period). The table above represents the actual expenses incurred during the six-month period. |
| | | | |
| mainstayinvestments.com | | | M-375 | |
Portfolio Composition as of December 31, 2012 (Unaudited)
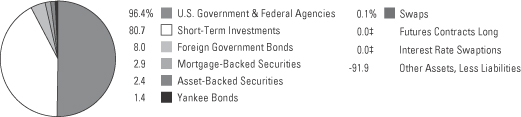
See Portfolio of Investments beginning on page M-379 for specific holdings within these categories.
| ‡ | Less than one-tenth of a percent. |
Top Ten Issuers Held as of December 31, 2012 (excluding short-term investments) (Unaudited)
| 1. | United States Treasury Inflation—Indexed Notes, 0.125%–2.625%, due 7/15/13–7/15/22 |
| 2. | United States Treasury Inflation—Indexed Bonds, 0.75%–3.625%, due 1/15/25–2/15/42 |
| 3. | First Franklin Mortgage Loan Asset Backed Certificates, 0.55%–0.59%, due 9/25/35–11/25/35 |
| 4. | United Kingdom Gilt Inflation Linked, 0.125%–2.50%, due 7/26/16–11/22/32 |
| 5. | BCAP LLC Trust, 5.25%, due 8/26/37 |
| 6. | Italy Buoni Poliennali Del Tesoro, 2.10%–2.35%, due 9/15/16–9/15/21 |
| 7. | Australia Government Bonds, 3.00%–4.00%, due 8/20/15–9/20/25 |
| 8. | Canadian Government Bonds, 1.50%–4.25%, due 12/1/21–12/1/44 |
| 9. | Dexia Credit Local S.A., 0.793%, due 4/29/14 |
| 10. | Federal National Mortgage Association, 2.70%, due 3/28/22 |
| | |
| M-376 | | MainStay VP PIMCO Real Return Portfolio |
Portfolio Management Discussion and Analysis (Unaudited)
Answers to the questions reflect the views of portfolio manager Mihir Worah of Pacific Investment Management Company LLC (“PIMCO”), the Portfolio’s Subadvisor.
How did MainStay VP PIMCO Real Return Portfolio perform relative to its peers and its benchmark from February 17 through December 31, 2012?
The inception date for MainStay VP PIMCO Real Return Portfolio was February 17, 2012. From February 17 through December 31, 2012, the Portfolio returned 5.77% for Initial Class shares and 5.60% for Service Class shares. Over the same period, Initial Class shares outperformed—and Service Class shares underperformed—the 5.68% return of the average Lipper1 Variable Products Inflation-Protected Bond Portfolio. Both share classes outperformed the 5.45% return of the Barclays U.S. TIPS Index1 from February 17 through December 31, 2012. The Barclays U.S. TIPS Index is the Portfolio’s broad-based securities-market index.
What factors affected the Portfolio’s relative performance during the reporting period?
The Portfolio’s outperformance of the Barclays U.S. TIPS Index resulted from several strategies. Tactical positioning on the U.S. Treasury Inflation Protected Securities (TIPS) yield curve2 added to returns as real yields rose at the short end of the curve and fell at the long end. Exposure to Australian Inflation-Linked Bonds (ILBs) added to returns as real yields fell in Australia. Modest exposure to Mexico also added to returns as rates continued to fall in this emerging market. An additional contributor was selective mortgage exposure, including an allocation to non-agency mortgages amid continued investor demand.
The primary detractor from relative performance was currency positioning, including exposure to the Australian dollar, which depreciated during the reporting period.
What was the Portfolio’s duration3 strategy during the reporting period?
The Portfolio was underweight nominal duration in the United States relative to the Index over the reporting period. However, the Portfolio had out-of-Index duration exposure in Europe, the U.K., Canada and Australia.
What specific factors, risks or market forces prompted significant decisions for the Portfolio during the reporting period?
During the second half of 2012, favorable moves by the European Central Bank (ECB) and the Federal Reserve caused risk appetite to return to financial markets. As investors responded to the unconventional monetary policy, breakeven inflation (or the difference between nominal Treasury yields and yields on maturity-matched TIPS) widened during the quarter. The widening of breakeven inflation was the market’s expression of longer-term inflationary concerns given the Federal Reserve’s new bond buying program. In response, we increased the Portfolio’s exposure to TIPS which outperformed nominal U.S. Treasury securities. The Portfolio also increased exposure to global ILBs following comments from ECB President, Mario Draghi, that the central bank would do “whatever it takes” to support the euro and the Euro zone by unveiling the ECB’s Outright Monetary Transactions (OMT).
During the reporting period, which market segments were the strongest positive contributors to the Portfolio’s performance, and which market segments were particularly weak?
The strongest positive contribution came from the Portfolio’s tactical positioning on the U.S. TIPS curve. (Contributions take weightings and total returns into account.) Exposure to Australian ILBs and Mexican bonds also made positive contributions to the Portfolio’s performance, as did selective mortgage exposure, including an allocation to non-agency mortgages.
The Portfolio’s currency positioning—especially Australian dollar exposure—detracted from the Portfolio’s performance during the reporting period.
Did the Portfolio make any significant purchases or sales during the reporting period?
All of the Portfolio’s purchases early in the reporting period were significant in establishing the Portfolio’s initial positioning. Once the ramp-up phase was
| 1. | Please refer to pages M-2 and M-3 for additional explanations and disclosure regarding the Portfolios, their benchmark indices and service providers mentioned in the reports. |
| 2. | The yield curve is a line that plots the yields of various securities of similar quality—typically U.S. Treasury issues—across a range of maturities. The U.S. Treasury yield curve serves as a benchmark for other debt and is used in economic forecasting. |
| 3. | Duration is a measure of the price sensitivity of a fixed-income investment to changes in interest rates. Duration is expressed as a number of years and is considered a more accurate sensitivity gauge than average maturity. |
| | | | |
| mainstayinvestments.com | | | M-377 | |
complete, there were maintenance trades and periodic tactical positioning trades during the reporting period.
How did the Portfolio’s sector weightings change during the reporting period?
During the reporting period, the Portfolio increased its exposure to U.S. TIPS but remained underweight relative to the Index. The Portfolio also increased its exposure to bonds of non-U.S. developed nations. Over the same period, the Portfolio decreased its overall exposure to the mortgage sector.
How was the Portfolio positioned at the end of the reporting period?
As of December 31, 2012, the Portfolio was underweight U.S. TIPS relative to the Barclays U.S. TIPS Index. As of the same date, the Portfolio had out-of-index exposure to non-agency mortgages, non-U.S. developed market bonds and emerging-market securities.
The opinions expressed are those of the portfolio manager as of the date of this report and are subject to change. There is no guarantee that any forecasts made will come to pass. This material does not constitute investment advice and is not intended as an endorsement of any specific investment.
Not all MainStay VP Portfolios and/or share classes are available under all policies.
| | |
| M-378 | | MainStay VP PIMCO Real Return Portfolio |
Portfolio of Investments December 31, 2012
| | | | | | | | |
| | | Principal
Amount | | | Value | |
| | | | | | | | |
| | | | | | | | |
Long-Term Bonds 111.1%† Asset-Backed Securities 2.4% | |
Home Equity 0.4% | |
HSBC Home Equity Loan Trust
Series 2006-2, Class A1
0.361%, due 3/20/36 (a)(b) | | $ | 1,919,861 | | | $ | 1,892,787 | |
| | | | | | | | |
|
Student Loans 2.0% | |
¨First Franklin Mortgage Loan Asset Backed Certificates | | | | | | | | |
Series 2005-FF11, Class A2D 0.549%, due 11/25/35 (a)(b) | | | 2,401,834 | | | | 2,331,128 | |
Series 2005-FF8, Class A2D 0.589%, due 9/25/35 (a)(b) | | | 7,776,006 | | | | 7,658,013 | |
| | | | | | | | |
| | | | | | | 9,989,141 | |
| | | | | | | | |
Total Asset-Backed Securities
(Cost $11,128,085) | | | | | | | 11,881,928 | |
| | | | | | | | |
|
| Foreign Government Bonds 8.0% | |
Australia 1.5% | |
¨Australia Government Bond | | | | | | | | |
3.00%, due 9/20/25 | | A$ | 2,800,000 | | | | 3,989,221 | |
4.00%, due 8/20/15 | | | 1,700,000 | | | | 3,198,364 | |
| | | | | | | | |
| | | | | | | 7,187,585 | |
| | | | | | | | |
Canada 1.2% | |
¨Canadian Government Bond | | | | | | | | |
1.50%, due 12/1/44 | | C$ | 1,374,152 | | | | 1,825,590 | |
4.25%, due 12/1/21 | | | 2,941,680 | | | | 4,164,990 | |
| | | | | | | | |
| | | | | | | 5,990,580 | |
| | | | | | | | |
Italy 1.7% | |
¨Italy Buoni Poliennali Del Tesoro | | | | | | | | |
2.10%, due 9/15/16 | | € | 2,864,673 | | | | 3,829,665 | |
2.10%, due 9/15/17 | | | 1,554,998 | | | | 2,067,503 | |
2.10%, due 9/15/21 | | | 1,717,984 | | | | 2,144,521 | |
2.35%, due 9/15/19 | | | 329,133 | | | | 430,699 | |
| | | | | | | | |
| | | | | | | 8,472,388 | |
| | | | | | | | |
Mexico 1.1% | |
Mexican Udibonos
2.00%, due 6/9/22 | | M$ | 62,395,187 | | | | 5,064,546 | |
| | | | | | | | |
|
Spain 0.5% | |
Instituto de Credito Oficial
Series Reg S
1.934%, due 3/25/14 (a) | | € | 2,000,000 | | | | 2,556,309 | |
| | | | | | | | |
| | | | | | | | |
| | | Principal
Amount | | | Value | |
| | | | | | | | |
| | | | | | | | |
United Kingdom 2.0% | |
¨United Kingdom Gilt Inflation Linked | | | | | | | | |
0.125%, due 3/22/24 | | £ | 2,127,153 | | | $ | 3,760,328 | |
1.25%, due 11/22/32 | | | 282,725 | | | | 584,732 | |
1.875%, due 11/22/22 | | | 1,791,000 | | | | 3,741,126 | |
Series Reg S 2.50%, due 7/26/16 | | | 300,000 | | | | 1,674,873 | |
| | | | | | | | |
| | | | | | | 9,761,059 | |
| | | | | | | | |
Total Foreign Government Bonds
(Cost $38,036,328) | | | | | | | 39,032,467 | |
| | | | | | | | |
|
| Mortgage-Backed Securities 2.9% | |
Agency Collateral (Collateralized Mortgage Obligation) 0.3% | |
Federal Home Loan Mortgage Corporation Strips (Collateralized Mortgage Obligation)
Series 278, Class F1
0.659%, due 9/15/42 (a) | | $ | 1,391,188 | | | | 1,393,736 | |
| | | | | | | | |
|
Whole Loan Collateral (Collateralized Mortgage Obligations) 2.6% | |
¨BCAP LLC Trust
Series 2011-RR5, Class 5A1
5.25%, due 8/26/37 (c) | | | 9,537,090 | | | | 9,475,099 | |
Bear Stearns Adjustable Rate
Mortgage Trust
Series 2004-10, Class 21A1
3.126%, due 1/25/35 (d) | | | 3,353,780 | | | | 3,339,483 | |
| | | | | | | | |
| | | | | | | 12,814,582 | |
| | | | | | | | |
Total Mortgage-Backed Securities
(Cost $13,883,064) | | | | | | | 14,208,318 | |
| | | | | | | | |
|
| U.S. Government & Federal Agencies 96.4% | |
Federal Home Loan Mortgage Corp. 1.0% | |
2.00%, due 3/14/19 | | | 2,600,000 | | | | 2,607,826 | |
2.50%, due 10/2/19 | | | 2,100,000 | | | | 2,173,752 | |
| | | | | | | | |
| | | | | | | 4,781,578 | |
| | | | | | | | |
¨Federal National Mortgage Association 1.1% | |
2.70%, due 3/28/22 | | | 5,400,000 | | | | 5,426,174 | |
| | | | | | | | |
|
Federal National Mortgage Association
(Mortgage Pass-Through Securities) 1.0% | |
1.366%, due 6/1/43 (a) | | | 1,009,234 | | | | 1,022,692 | |
2.492%, due 11/1/34 (a) | | | 1,738,972 | | | | 1,871,060 | |
4.485%, due 12/1/36 (a) | | | 1,949,863 | | | | 2,061,982 | |
| | | | | | | | |
| | | | | | | 4,955,734 | |
| | | | | | | | |
| † | Percentages indicated are based on Portfolio net assets. |
| ¨ | | Among the Portfolio’s 10 largest issuers held, as of December 31, 2012, excluding short-term investments. May be subject to change daily. |
| | | | | | |
The notes to the financial statements are an integral part of,
and should be read in conjunction with, the financial statements. | | mainstayinvestments.com | | | M-379 | |
Portfolio of Investments December 31, 2012 (continued)
| | | | | | | | |
| | | Principal
Amount | | | Value | |
| | | | | | | | |
| U.S. Government & Federal Agencies (continued) | |
¨United States Treasury Inflation—Indexed Bonds 28.6% | |
0.75%, due 2/15/42 (e) | | $ | 6,545,646 | | | $ | 7,169,014 | |
1.75%, due 1/15/28 (e) | | | 27,477,250 | | | | 35,568,009 | |
2.00%, due 1/15/26 (e) | | | 29,002,750 | | | | 38,034,380 | |
2.375%, due 1/15/25 (e) | | | 32,647,266 | | | | 44,040,639 | |
2.375%, due 1/15/27 | | | 114,705 | | | | 158,150 | |
2.50%, due 1/15/29 | | | 5,387,050 | | | | 7,683,280 | |
3.625%, due 4/15/28 | | | 4,290,600 | | | | 6,801,270 | |
| | | | | | | | |
| | | | | | | 139,454,742 | |
| | | | | | | | |
¨United States Treasury Inflation—Indexed Notes 64.7% | |
0.125%, due 4/15/16 (e) | | | 27,122,160 | | | | 28,558,794 | |
0.125%, due 4/15/17 (e) | | | 13,483,008 | | | | 14,438,400 | |
0.125%, due 1/15/22 (e) | | | 31,537,230 | | | | 34,247,476 | |
0.125%, due 7/15/22 (e) | | | 66,237,090 | | | | 71,903,474 | |
0.50%, due 4/15/15 (e) | | | 26,987,500 | | | | 28,159,783 | |
0.625%, due 7/15/21 (e) | | | 4,392,966 | | | | 4,993,568 | |
1.125%, due 1/15/21 (e) | | | 49,685,164 | | | | 58,356,765 | |
1.25%, due 4/15/14 (e) | | | 1,849,600 | | | | 1,906,823 | |
1.25%, due 7/15/20 | | | 4,773,105 | | | | 5,662,096 | |
1.375%, due 1/15/20 (e) | | | 25,775,061 | | | | 30,553,525 | |
1.625%, due 1/15/15 (e) | | | 4,823,520 | | | | 5,124,614 | |
1.875%, due 7/15/13 (e) | | | 16,924,680 | | | | 17,197,066 | |
1.875%, due 7/15/15 | | | 832,475 | �� | | | 907,593 | |
2.00%, due 7/15/14 (e) | | | 9,283,704 | | | | 9,796,480 | |
2.00%, due 1/15/16 (e) | | | 2,088,198 | | | | 2,315,290 | |
2.625%, due 7/15/17 (e) | | | 1,777,552 | | | | 2,130,007 | |
| | | | | | | | |
| | | | | | | 316,251,754 | |
| | | | | | | | |
Total U.S. Government & Federal Agencies
(Cost $458,014,395) | | | | | | | 470,869,982 | |
| | | | | | | | |
|
| Yankee Bonds 1.4% (f) | |
Banks 1.4% | |
Achmea Hypotheekbank N.V.
3.20%, due 11/3/14 (c) | | | 459,000 | | | | 481,165 | |
¨Dexia Credit Local S.A.
0.793%, due 4/29/14 (a)(c) | | | 6,000,000 | | | | 5,919,600 | |
Eksportfinans ASA
2.375%, due 5/25/16 | | | 500,000 | | | | 477,002 | |
| | | | | | | | |
Total Yankee Bonds
(Cost $6,695,645) | | | | | | | 6,877,767 | |
| | | | | | | | |
Total Long-Term Bonds
(Cost $527,757,517) | | | | | | | 542,870,462 | |
| | | | | | | | |
|
| Short-Term Investments 80.7% | |
Other Commercial Paper 2.4% | |
Abbey National North America LLC
0.466%, due 4/3/13 (g) | | | 1,400,000 | | | | 1,396,422 | |
Banco Bilbao Vizcaya Argentaria S.A. 1.938%, due 10/21/13 (c)(g) | | | 1,100,000 | | | | 1,072,067 | |
| | | | | | | | |
| | | Principal
Amount | | | Value | |
| | | | | | | | |
Other Commercial Paper (continued) | |
Bank Of Nova Scotia
0.53%, due 3/27/14 (g) | | $ | 300,000 | | | $ | 299,822 | |
Dexia Credit Local S.A.
1.52%, due 9/20/13 (g) | | | 3,200,000 | | | | 3,200,000 | |
Santander Commercial Paper S.A.
1.102%, due 4/2/13 (c)(g)(h) | | | 2,200,000 | | | | 2,187,766 | |
Standard Chartered Bank
0.563%, due 10/1/13 (c)(g) | | | 3,600,000 | | | | 3,574,065 | |
| | | | | | | | |
Total Other Commercial Paper
(Cost $11,730,142) | | | | | | | 11,730,142 | |
| | | | | | | | |
|
Repurchase Agreements 77.6% | |
Bank of America
0.14%, dated 12/31/12
due 1/4/13
Proceeds at Maturity $50,000,583 (Collateralized by a United States Treasury Note with a rate of 0.75% and a maturity date of 8/15/13, with a Principal Amount of $50,798,000 and a Market Value of $50,996,417) | | | 50,000,000 | | | | 50,000,000 | |
Bank of America
0.23%, dated 12/31/12
due 1/2/13
Proceeds at Maturity $36,700,703 (Collateralized by a United States Treasury Note with a rate of 0.13% and a maturity date of 12/31/14, with a Principal Amount of $37,524,000 and a Market Value of $37,436,044) | | | 36,700,000 | | | | 36,700,000 | |
Bank of America
0.24%, dated 12/31/12
due 1/3/13
Proceeds at Maturity $50,001,000 (Collateralized by a United States Treasury Note with a rate of 0.63% and a maturity date of 8/31/17, with a Principal Amount of $51,063,000 and a Market Value of $51,023,120) | | | 50,000,000 | | | | 50,000,000 | |
Barclays Capital, Inc.
0.16%, dated 12/31/12
due 1/11/13
Proceeds at Maturity $22,000,293 (Collateralized by a United States Treasury Note with a rate of 0.25% and a maturity date of 9/15/15, with a Principal Amount of $22,485,000 and a Market Value of $22,439,333) | | | 22,000,000 | | | | 22,000,000 | |
| | | | |
| M-380 | | MainStay VP PIMCO Real Return Portfolio | | The notes to the financial statements are an integral part of,
and should be read in conjunction with, the financial statements. |
| | | | | | | | |
| | | Principal
Amount | | | Value | |
| | | | | | | | |
| Short-Term Investments (continued) | |
Repurchase Agreements (continued) | |
Barclays Capital, Inc.
0.23%, dated 12/31/12
due 1/2/13
Proceeds at Maturity $94,501,811 (Collateralized by a United States Treasury securities with a rate of 0.13% and a maturity date of 4/15/16, with a Principal Amount of $91,513,806 and a Market Value of $96,418,396) | | $ | 94,500,000 | | | $ | 94,500,000 | |
Credit Suisse Securities LLC
0.22%, dated 12/31/12
due 1/2/13
Proceeds at Maturity $31,800,583 (Collateralized by a United States Treasury Note with a rate of 2.13% and a maturity date of 12/31/15, with a Principal Amount of $30,921,000 and a Market Value of $32,541,941) | | | 31,800,000 | | | | 31,800,000 | |
Credit Suisse Securities LLC
0.23%, dated 12/31/12
due 1/2/13
Proceeds at Maturity $4,100,079 (Collateralized by a United States Treasury Note with a rate of 2.13% and a maturity date of 12/31/15, with a Principal Amount of $3,987,000 and a Market Value of $4,196,007) | | | 4,100,000 | | | | 4,100,000 | |
JPMorgan Chase Bank
0.25%, dated 12/31/12
due 1/2/13
Proceeds at Maturity $23,600,492 (Collateralized by a United States Treasury Note with a rate of 1.75% and a maturity date of 7/31/15, with a Principal Amount of $23,086,900 and a Market Value of $23,934,628) | | | 23,600,000 | | | | 23,600,000 | |
RBS Securities, Inc.
0.24%, dated 12/31/12
due 1/2/13
Proceeds at Maturity $32,600,652 (Collateralized by a Federal National Mortgage Association security with a rate of 4.63% and a maturity date of 10/15/14, with a Principal Amount of $30,590,000 and a Market Value of $32,971,279) | | | 32,600,000 | | | | 32,600,000 | |
| | | | | | | | |
| | | Principal
Amount | | | Value | |
| | | | | | | | |
Repurchase Agreements (continued) | |
State Street Bank and Trust Co.
0.01%, dated 12/31/12
due 1/2/13
Proceeds at Maturity $1,317,854 (Collateralized by a Federal National Mortgage Association security with a rate of 2.14% and a maturity date of 11/7/22, with a Principal Amount of $1,340,000 and a Market Value of $1,345,490) | | $ | 1,317,853 | | | $ | 1,317,853 | |
UBS Securities LLC
0.25%, dated 12/31/12
due 1/2/13
Proceeds at Maturity $32,600,679 (Collateralized by a United States Treasury Bond with a rate of 9.88% and a maturity date of 11/15/15, with a Principal Amount of $25,927,500 and a Market Value of $32,954,267) | | | 32,600,000 | | | | 32,600,000 | |
| | | | | | | | |
Total Repurchase Agreement
(Cost $379,217,853) | | | | | | | 379,217,853 | |
| | | | | | | | |
U.S. Government 0.7% | |
United States Treasury Bills | | | | | | | | |
0.134%, due 10/17/13 (g) | | | 226,000 | | | | 225,760 | |
0.144%, due 12/12/13 (g) | | | 3,157,000 | | | | 3,152,707 | |
| | | | | | | | |
Total U.S. Government
(Cost $3,378,370) | | | | | | | 3,378,467 | |
| | | | | | | | |
Total Short-Term Investments
(Cost $394,326,365) | | | | | | | 394,326,462 | |
| | | | | | | | |
Total Investments
(Cost $922,083,882) (j) | | | 191.8 | % | | | 937,196,924 | |
Other Assets, Less Liabilities | | | (91.8 | ) | | | (448,747,676 | ) |
Net Assets | | | 100.0 | % | | $ | 488,449,248 | |
| | |
| | | | | | | | |
| | | | | | | | |
| | | Contracts
Long | | | Unrealized
Appreciation
(Depreciation) (i) | |
| Futures Contracts 0.0%‡ | |
90-Day Eurodollar
March 2016 | | | 145 | | | | $36,086 | |
| | | | | | | | |
Total Futures Contracts (Settlement Value $35,883,875) | | | | | | | $36,086 | |
| | | | | | | | |
| ‡ | Less than one-tenth of a percent. |
| | | | | | |
The notes to the financial statements are an integral part of,
and should be read in conjunction with, the financial statements. | | mainstayinvestments.com | | | M-381 | |
Portfolio of Investments December 31, 2012 (continued)
| (a) | Floating rate—Rate shown is the rate in effect as of December 31, 2012. |
| (b) | Subprime mortgage investment and other asset-backed securities. The total market value of these securities as of December 31, 2012 is $11,881,928, which represents 2.4% of the Portfolio’s net assets. |
| (c) | May be sold to institutional investors only under Rule 144A or securities offered pursuant to Section 4(2) of the Securities Act of 1933, as amended. |
| (d) | Collateral strip rate—Bond whose interest is based on the weighted net interest rate of the collateral. Coupon rate adjusts periodically based on a predetermined schedule. Rate shown is the rate in effect as of December 31, 2012. |
| (e) | Delayed delivery security. |
| (f) | Yankee Bond—Dollar-denominated bond issued in the United States by a foreign bank or corporation. |
| (g) | Interest rate presented is yield to maturity. |
| (h) | Illiquid security. The total market value of this security as of December 31, 2012 is $2,187,766, which represents 0.5% of the Portfolio’s net assets. |
| (i) | Represents the difference between the value of the contracts at the time they were opened and the value as of December 31, 2012. |
| (j) | As of December 31, 2012, cost is $923,367,066 for federal income tax purposes and net unrealized appreciation is as follows: |
| | | | |
Gross unrealized appreciation | | $ | 14,285,717 | |
Gross unrealized depreciation | | | (455,859 | ) |
| | | | |
Net unrealized appreciation | | $ | 13,829,858 | |
| | | | |
The following abbreviations are used in the above portfolio:
£—British Pound Sterling
€—Euro
A$—Australian Dollar
C$—Canadian Dollar
M$—Mexican Peso
As of December 31, 2012, the Portfolio held the following foreign currency forward contracts:
| | | | | | | | | | | | | | | | | | | | | | | | | | | | | | | | |
Foreign Currency Buy Contracts | | Expiration
Date | | | Counterparty | | | | | | Contract
Amount
Purchased | | | | | | Contract
Amount
Sold | | | | | | Unrealized
Appreciation
(Depreciation) | |
Brazilian Real vs. U.S. Dollar | | | 2/4/13 | | | | JPMorgan Chase Bank | | | | BRL | | | | 4,557,280 | | | | USD | | | | 2,174,171 | | | | USD | | | | 42,243 | |
| | | | | | | | |
| | | | | | | | | | | | | | | | | | | | | | | | | | | | | | | | |
Foreign Currency Sales Contracts | | | | | | | | | | | Contract
Amount
Sold | | | | | | Contract
Amount
Purchased | | | | | | | |
Australian Dollar vs. U.S. Dollar | | | 1/10/13 | | | | JPMorgan Chase Bank | | | | AUD | | | | 7,029,000 | | | | USD | | | | 7,265,434 | | | | USD | | | | (30,040 | ) |
Canadian Dollar vs. U.S. Dollar | | | 3/21/13 | | | | JPMorgan Chase Bank | | | | CAD | | | | 5,965,000 | | | | | | | | 6,043,254 | | | | | | | | 56,359 | |
Euro vs. U.S. Dollar | | | 3/18/13 | | | | Credit Suisse International | | | | EUR | | | | 8,122,000 | | | | | | | | 10,627,272 | | | | | | | | (100,451 | ) |
Euro vs. U.S. Dollar | | | 3/18/13 | | | | JPMorgan Chase Bank | | | | | | | | 321,000 | | | | | | | | 417,758 | | | | | | | | (6,226 | ) |
Mexican Peso vs. U.S. Dollar | | | 4/3/13 | | | | JPMorgan Chase Bank | | | | MXN | | | | 64,083,070 | | | | | | | | 4,903,253 | | | | | | | | (12,864 | ) |
Pound Sterling vs. U.S. Dollar | | | 3/12/13 | | | | Credit Suisse International | | | | GBP | | | | 1,095,000 | | | | | | | | 1,775,429 | | | | | | | | (2,971 | ) |
Pound Sterling vs. U.S. Dollar | | | 3/12/13 | | | | JPMorgan Chase Bank | | | | | | | | 4,926,000 | | | | | | | | 7,890,475 | | | | | | | | (109,887 | ) |
Net unrealized appreciation (depreciation) on foreign currency forward contracts | | | | | | | | | | | | | | | | | | | | USD | | | | (163,837 | ) |
| | | | |
| M-382 | | MainStay VP PIMCO Real Return Portfolio | | The notes to the financial statements are an integral part of,
and should be read in conjunction with, the financial statements. |
Written Interest Rate Swaptions
| | | | | | | | | | | | | | | | | | | | | | | | | | | | | | |
Description | | Counterparty | | | Floating Rate Index | | Pay/
Receive
Floating
Rate | | | Exercise
Rate | | | Expiration
Date | | | Notional Amount | | | Premium
Received | | | Market Value | |
| Put—OTC 5-Year | | | Credit Suisse | | | 3-Month-USD-LIBOR | | | Pay | | | | 1.40 | % | | | 3/18/2013 | | | $ | (13,800,000 | ) | | $ | 35,190 | | | $ | (4,306 | ) |
| Interest Rate Swap | | | | | | | | | | | | | | | | | | | | | | | | | | | | | | |
| Call—OTC 5-Year | | | Credit Suisse | | | 3-Month-USD-LIBOR | | | Receive | | | | 0.75 | % | | | 3/18/2013 | | | $ | (13,800,000 | ) | | | 30,360 | | | | (13,965 | ) |
Interest Rate Swap | | | | | | | | | | | | | | | | | | | | | | | | | | | | | | |
| | | | | | | | | | | | | | | | | | | | | | | | | $ | 65,550 | | | $ | (18,271 | ) |
Swap Contracts
OTC interest rate swap agreements as of December 31, 2012 were as follows:
| | | | | | | | | | | | | | | | | | | | | | | | | | |
Notional Amount | | Currency | | | Expiration Date | | | Counterparty | | | Payments
Made by
Portfolio | | Payments
Received by Portfolio | | | Unrealized
Appreciation /
(Depreciation) | | | Value | |
$ 8,000,000 | | | USD | | | | 11/16/2017 | | | | Credit Suisse | | | Fixed 2.32% | | | 12-Month USD-CPI | | | $ | 30,138 | | | $ | 30,138 | |
Centrally cleared interest rate swap agreements as of December 31, 2012 were as follows:
| | | | | | | | | | | | | | | | | | | | | | | | | | |
Notional Amount | | Currency | | | Expiration Date | | | Counterparty | | | Payments
Made by
Portfolio | | Payments
Received by Portfolio | | | Unrealized
Appreciation /
(Depreciation) | | | Value | |
$ 8,700,000 | | | USD | | | | 12/19/2042 | | | | Credit Suisse | | | 3-Month USD-LIBOR | | | Fixed 2.50 | % | | $ | 537,488 | | | $ | 537,488 | |
The following is a summary of the fair valuations according to the inputs used as of December 31, 2012, for valuing the Portfolio’s assets and liabilities.
Asset Valuation Inputs
| | | | | | | | | | | | | | | | |
Description | | Quoted Prices
in Active Markets
for Identical Assets
(Level 1) | | | Significant Other
Observable Inputs (Level 2) | | | Significant
Unobservable
Inputs
(Level 3) | | | Total | |
| Investments in Securities (a) | | | | | | | | | | | | | | | | |
| Long-Term Bonds | | | | | | | | | | | | | | | | |
Asset-Backed Securities | | $ | — | | | $ | 11,881,928 | | | $ | — | | | $ | 11,881,928 | |
Foreign Government Bonds | | | — | | | | 39,032,467 | | | | — | | | | 39,032,467 | |
Mortgage-Backed Securities | | | — | | | | 14,208,318 | | | | — | | | | 14,208,318 | |
U.S. Government & Federal Agencies | | | — | | | | 470,869,982 | | | | — | | | | 470,869,982 | |
Yankee Bonds | | | — | | | | 6,877,767 | | | | — | | | | 6,877,767 | |
| | | | | | | | | | | | | | | | |
| Total Long-Term Bonds | | | — | | | | 542,870,462 | | | | — | | | | 542,870,462 | |
| | | | | | | | | | | | | | | | |
| Short-Term Investments | | | | | | | | | | | | | | | | |
Other Commercial Paper | | | — | | | | 11,730,142 | | | | — | | | | 11,730,142 | |
Repurchase Agreement | | | — | | | | 379,217,853 | | | | — | | | | 379,217,853 | |
U.S. Government | | | — | | | | 3,378,467 | | | | — | | | | 3,378,467 | |
| | | | | | | | | | | | | | | | |
| Total Short-Term Investments | | | — | | | | 394,326,462 | | | | — | | | | 394,326,462 | |
| | | | | | | | | | | | | | | | |
| Total Investments in Securities | | | — | | | | 937,196,924 | | | | — | | | | 937,196,924 | |
| | | | | | | | | | | | | | | | |
| Other Financial Instruments | | | | | | | | | | | | | | | | |
Futures Contracts Long (b) | | | 36,086 | | | | — | | | | — | | | | 36,086 | |
Foreign Currency Forward Contracts (b) | | �� | — | | | | 98,602 | | | | — | | | | 98,602 | |
Swap Contracts | | | — | | | | 567,626 | | | | — | | | | 567,626 | |
| | | | | | | | | | | | | | | | |
| Total Investments in Securities and Other Financial Instruments | | $ | 36,086 | | | $ | 937,863,152 | | | $ | — | | | $ | 937,899,238 | |
| | | | | | | | | | | | | | | | |
| | | | | | |
The notes to the financial statements are an integral part of,
and should be read in conjunction with, the financial statements. | | mainstayinvestments.com | | | M-383 | |
Portfolio of Investments December 31, 2012 (continued)
Liability Valuation Inputs
| | | | | | | | | | | | | | | | |
Description | | Quoted Prices
in Active Markets
for Identical Assets (Level 1) | | | Significant Other
Observable Inputs (Level 2) | | | Significant
Unobservable
Inputs
(Level 3) | | | Total | |
| Other Financial Instruments | | | | | | | | | | | | | | | | |
Foreign Currency Forward Contracts (b) | | $ | — | | | $ | (262,439 | ) | | $ | — | | | $ | (262,439 | ) |
Interest Rate Swaptions | | | — | | | | (18,271 | ) | | | — | | | | (18,271 | ) |
| | | | | | | | | | | | | | | | |
| Total Other Financial Instruments | | $ | — | | | $ | (280,710 | ) | | $ | — | | | $ | (280,710 | ) |
| | | | | | | | | | | | | | | | |
| (a) | For a complete listing of investments and their industries, see the Portfolio of Investments. |
| (b) | The value listed for these securities reflects unrealized appreciation (depreciation) as shown on the Portfolio of Investments. |
The Portfolio recognizes transfers between the levels as of the beginning of the period.
For the period ended December 31, 2012, the Portfolio did not have any transfers between Level 1 and Level 2 fair value measurements. (See Note 2)
As of December 31, 2012, the Portfolio did not hold any investments with significant unobservable inputs (Level 3). (See Note 2)
| | | | |
| M-384 | | MainStay VP PIMCO Real Return Portfolio | | The notes to the financial statements are an integral part of,
and should be read in conjunction with, the financial statements. |
Statement of Assets and Liabilities as of December 31, 2012
| | | | |
| Assets | | | | |
Investment in securities, at value
(identified cost $542,866,029) | | $ | 557,979,071 | |
Repurchase agreements, at value
(identified cost $379,217,853) | | | 379,217,853 | |
Cash denominated in foreign currencies
(identified cost $88,464) | | | 87,557 | |
Receivables: | | | | |
Investment securities sold | | | 2,807,322 | |
Fund shares sold | | | 1,340,056 | |
Interest | | | 881,142 | |
Variation margin on derivative instruments | | | 127,652 | |
Unrealized appreciation on swap contracts | | | 30,138 | |
Unrealized appreciation on foreign currency forward contracts | | | 98,602 | |
Other assets | | | 622 | |
| | | | |
Total assets | | | 942,570,015 | |
| | | | |
| |
| Liabilities | | | | |
Written options, at value (premiums received $65,550) | | | 18,271 | |
Due to custodian | | | 694 | |
Payables: | | | | |
Dollar roll transactions | | | 403,246,860 | |
Investment securities purchased | | | 50,000,000 | |
Manager (See Note 3) | | | 180,371 | |
Fund shares redeemed | | | 150,006 | |
Professional fees | | | 119,880 | |
NYLIFE Distributors (See Note 3) | | | 99,891 | |
Shareholder communication | | | 35,432 | |
Custodian | | | 4,417 | |
Variation margin on futures contracts | | | 1,813 | |
Trustees | | | 693 | |
Unrealized depreciation on foreign currency forward contracts | | | 262,439 | |
| | | | |
Total liabilities | | | 454,120,767 | |
| | | | |
Net assets | | $ | 488,449,248 | |
| | | | |
| |
| Net Assets Consist of | | | | |
Shares of beneficial interest outstanding (par value of $.001 per share) unlimited number of shares authorized | | $ | 46,178 | |
Additional paid-in capital | | | 467,359,265 | |
| | | | |
| | | 467,405,443 | |
Undistributed net investment income | | | 4,320,491 | |
Accumulated net realized gain (loss) on investments, futures transactions, written options, swap transactions and foreign currency transactions | | | 1,350,477 | |
Net unrealized appreciation (depreciation) on investments, swap contracts, futures contracts and written options | | | 15,542,920 | |
Net unrealized appreciation (depreciation) on translation of other assets and liabilities in foreign currencies and foreign currency forward contracts | | | (170,083 | ) |
| | | | |
Net assets | | $ | 488,449,248 | |
| | | | |
| | | | |
Initial Class | | | | |
Net assets applicable to outstanding shares | | $ | 12,641,859 | |
| | | | |
Shares of beneficial interest outstanding | | | 1,193,330 | |
| | | | |
Net asset value per share outstanding | | $ | 10.59 | |
| | | | |
Service Class | | | | |
Net assets applicable to outstanding shares | | $ | 475,807,389 | |
| | | | |
Shares of beneficial interest outstanding | | | 44,984,269 | |
| | | | |
Net asset value per share outstanding | | $ | 10.58 | |
| | | | |
| | | | | | |
The notes to the financial statements are an integral part of,
and should be read in conjunction with, the financial statements. | | mainstayinvestments.com | | | M-385 | |
Statement of Operations
for the period February 17, 2012 (inception date) through December 31, 2012
| | | | |
| Investment Income (Loss) | |
Income | | | | |
Interest | | $ | 7,316,279 | |
| | | | |
Expenses | | | | |
Manager (See Note 3) | | | 1,721,953 | |
Distribution and service—Service Class (See Note 3) | | | 839,575 | |
Interest expense | | | 155,442 | |
Professional fees | | | 147,493 | |
Shareholder communication | | | 69,309 | |
Custodian | | | 25,560 | |
Trustees | | | 8,332 | |
Miscellaneous | | | 13,762 | |
| | | | |
Total expenses before waiver/reimbursement | | | 2,981,426 | |
| | | | |
Expense waiver/reimbursement from Manager (See Note 3) | | | (224,297 | ) |
| | | | |
Net expenses | | | 2,757,129 | |
| | | | |
Net investment income (loss) | | | 4,559,150 | |
| | | | |
|
| Realized and Unrealized Gain (Loss) on Investments, Futures Contracts, Swap Contracts, Written Options and Foreign Currency Transactions | |
Net realized gain (loss) on: | | | | |
Security transactions | | | 1,611,415 | |
Futures transactions | | | (75,736 | ) |
Swap transactions | | | (96 | ) |
Foreign currency transactions | | | (423,765 | ) |
| | | | |
Net realized gain (loss) on investments, futures transactions, swap transactions and foreign currency transactions | | | 1,111,818 | |
| | | | |
Net change in unrealized appreciation (depreciation) on: | | | | |
Investments | | | 15,113,042 | |
Futures contracts | | | 36,086 | |
Swap contracts | | | 346,513 | |
Written option contracts | | | 47,279 | |
Translation of other assets and liabilities in foreign currencies and foreign currency forward contracts | | | (170,083 | ) |
| | | | |
Net change in unrealized appreciation (depreciation) on investments, futures contracts, swap contracts, written options and foreign currency transactions | | | 15,372,837 | |
| | | | |
Net realized and unrealized gain (loss) on investments, futures transactions, written options, swap transactions and foreign currency transactions | | | 16,484,655 | |
| | | | |
Net increase (decrease) in net assets resulting from operations | | $ | 21,043,805 | |
| | | | |
| | | | |
| M-386 | | MainStay VP PIMCO Real Return Portfolio | | The notes to the financial statements are an integral part of,
and should be read in conjunction with, the financial statements. |
Statements of Changes in Net Assets
for the period February 17, 2012 (inception date) through December 31, 2012
| | | | |
| | | 2012 | |
| Increase (Decrease) in Net Assets | | | | |
Operations: | | | | |
Net investment income (loss) | | $ | 4,559,150 | |
Net realized gain (loss) on investments, futures transactions, swap transactions and foreign currency transactions | | | 1,111,818 | |
Net change in unrealized appreciation (depreciation) on investments, futures contracts, written options, swap contracts and foreign currency transactions | | | 15,372,837 | |
| | | | |
Net increase (decrease) in net assets resulting from operations | | | 21,043,805 | |
| | | | |
Capital share transactions: | | | | |
Net proceeds from sale of shares | | | 503,426,030 | |
Cost of shares redeemed | | | (36,020,587 | ) |
| | | | |
Increase (decrease) in net assets derived from capital share transactions | | | 467,405,443 | |
| | | | |
Net increase (decrease) in net assets | | | 488,449,248 | |
| |
| Net Assets | | | | |
Beginning of period | | | — | |
| | | | |
End of period | | $ | 488,449,248 | |
| | | | |
Undistributed net investment income at end of period | | $ | 4,320,491 | |
| | | | |
| | | | | | |
The notes to the financial statements are an integral part of,
and should be read in conjunction with, the financial statements. | | mainstayinvestments.com | | | M-387 | |
Statement of Cash Flows for the period ended December 31, 2012
| | | | |
| Cash flows used in operating activities: | |
Net increase in net assets resulting from operations | | $ | 21,043,805 | |
Adjustments to reconcile net increase in net assets resulting from operations to net cash used in operating activities: | | | | |
Investments purchased | | | (2,373,946,191 | ) |
Investments sold | | | 1,842,971,437 | |
Purchase of short term investments, net | | | (394,326,365 | ) |
Amortization (accretion) of discount and premium, net | | | 4,566,539 | |
Increase in investment securities sold receivable | | | (2,807,322 | ) |
Increase in interest receivable | | | (881,142 | ) |
Increase in other assets | | | (622 | ) |
Increase in receivable for open forward foreign currency contracts | | | (98,602 | ) |
Increase in receivable for open swap contracts | | | (30,138 | ) |
Increase in premiums from written options | | | 65,550 | |
Increase in investment securities purchased payable | | | 50,000,000 | |
Increase in payable for dollar rolls | | | 403,246,860 | |
Increase in professional fees payable | | | 119,880 | |
Increase in payable for open swap contracts | | | 214,834 | |
Increase in custodian payable | | | 4,417 | |
Increase in shareholder communication payable | | | 35,432 | |
Increase in due to directors | | | 693 | |
Increase in due to manager | | | 180,371 | |
Increase in due to NYLIFE Distributors | | | 99,891 | |
Increase in payable for open forward foreign currency contracts | | | 262,439 | |
Decrease in variation margin on derivative instruments | | | (125,839 | ) |
Net change in unrealized (appreciation) depreciation on investments | | | (15,113,042 | ) |
Net realized gain from investments | | | (1,611,415 | ) |
| | | | |
Net cash used in operating activities | | | (466,128,530 | ) |
| | | | |
| |
| Cash flows from financing activities: | | | | |
Proceeds from shares sold | | | 502,085,974 | |
Payment on shares redeemed | | | (35,870,581 | ) |
Due to custodian | | | 694 | |
| | | | |
Net cash from financing activities | | | 466,216,087 | |
| | | | |
Net increase in cash: | | | 87,557 | |
| | | | |
Cash at beginning of year | | | — | |
| | | | |
Cash at end of year | | $ | 87,557 | |
| | | | |
| | | | |
| M-388 | | MainStay VP PIMCO Real Return Portfolio | | The notes to the financial statements are an integral part of,
and should be read in conjunction with, the financial statements. |
Financial Highlights selected per share data and ratios
| | | | |
| | | Initial Class | |
| | | February 17,
2012**
through
December 31, | |
| | | 2012 | |
Net asset value at beginning of period | | $ | 10.00 | |
| | | | |
Net investment income (loss) (a) | | | 0.14 | |
Net realized and unrealized gain (loss) on investments | | | 0.47 | |
Net realized and unrealized gain (loss) on foreign currency transactions | | | (0.02 | ) |
| | | | |
Total from investment operations | | | 0.59 | |
| | | | |
Net asset value at end of period | | $ | 10.59 | |
| | | | |
Total investment return | | | 5.90 | %(b)(c) |
Ratios (to average net assets)/Supplemental Data: | | | | |
Net investment income (loss) | | | 1.51 | %†† |
Net expenses | | | 0.62 | %††(d) |
Portfolio turnover rate | | | 44 | %(e) |
Net assets at end of period (in 000’s) | | $ | 12,642 | |
| (a) | Per share data based on average shares outstanding during the period. |
| (b) | Total investment return is not annualized. |
| (c) | Total investment return may reflect adjustments to conform to generally accepted accounting principles. |
| (d) | Includes interest expenses of 0.05% incurred as a result of entering into reverse repurchase agreements and dollar roll transactions. |
| (e) | The portfolio turnover rate not including dollar rolls was 43% for the period ended December 31, 2012. |
| | | | |
| | | Service Class | |
| | | February 17,
2012**
through
December 31, | |
| | | 2012 | |
Net asset value at beginning of period | | $ | 10.00 | |
| | | | |
Net investment income (loss) (a) | | | 0.12 | |
Net realized and unrealized gain (loss) on investments | | | 0.48 | |
Net realized and unrealized gain (loss) on foreign currency transactions | | | (0.02 | ) |
| | | | |
Total from investment operations | | | 0.58 | |
| | | | |
Net asset value at end of period | | $ | 10.58 | |
| | | | |
Total investment return | | | 5.80 | %(b)(c) |
Ratios (to average net assets)/Supplemental Data: | | | | |
Net investment income (loss) | | | 1.32 | %†† |
Net expenses | | | 0.81 | %††(d) |
Expenses (before waiver/reimbursement) | | | 0.87 | %††(d) |
Portfolio turnover rate | | | 44 | %(e) |
Net assets at end of period (in 000’s) | | $ | 475,807 | |
| (a) | Per share data based on average shares outstanding during the period. |
| (b) | Total investment return is not annualized. |
| (c) | Total investment return may reflect adjustments to conform to generally accepted accounting principles. |
| (d) | Includes interest expenses of 0.05% incurred as a result of entering into reverse repurchase agreements and dollar roll transactions. |
| (e) | The portfolio turnover rate not including dollar rolls was 43% for the period ended December 31, 2012. |
| | | | | | |
The notes to the financial statements are an integral part of,
and should be read in conjunction with, the financial statements. | | mainstayinvestments.com | | | M-389 | |
MainStay VP S&P 500 Index Portfolio
Investment and Performance Comparison1 (Unaudited)
Performance data quoted represents past performance. Past performance is no guarantee of future results. Because of market volatility, current performance may be lower or higher than the figures shown. Investment return and principal value will fluctuate, and as a result, when shares are redeemed, they may be worth more or less than their original cost. The performance table and graph do not reflect any deduction of sales charges, mortality and expense charges, contract charges or administrative charges. Please refer to the Performance Summary appropriate for your policy. For performance information current to the most recent month-end, please call 800-598-2019 or visit www.newyorklife.com.
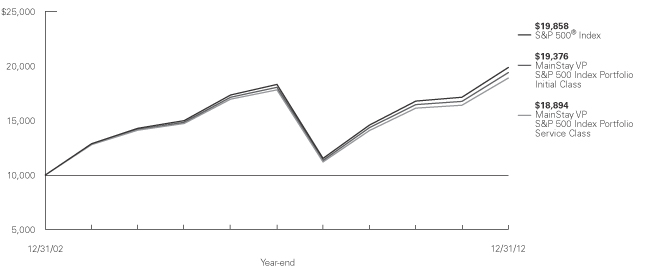
Average Annual Total Returns for the Year Ended December 31, 2012
| | | | | | | | | | | | | | | | |
| Class | | One Year | | | Five Years | | | Ten Years1 | | | Gross
Expense
Ratio2 | |
| Initial Class Shares | | | 15.66 | % | | | 1.45 | % | | | 6.84 | % | | | 0.34 | % |
| Service Class Shares3 | | | 15.37 | | | | 1.20 | | | | 6.57 | | | | 0.59 | |
| | | | | | | | | | | | |
| Benchmark Performance | | One
Year | | | Five
Years | | | Ten
Years | |
S&P 500® Index4 | | | 16.00 | % | | | 1.66 | % | | | 7.10 | % |
Average Lipper Variable Products S&P 500 Index Objective Portfolio5 | | | 15.39 | | | | 1.29 | | | | 6.73 | |
| 1. | Performance figures reflect certain fee waivers, without which total returns may have been different. Current waivers are voluntary and may be discontinued at any time. Performance figures shown for the ten-year period ended December 31, 2012 reflect nonrecurring reimbursements from affiliates for printing and mailing costs. If these non-recurring reimbursements had not been made, the total returns would have been 6.82% for Initial Class shares and 6.56% for Service Class shares for the ten-year period. |
| 2. | The gross expense ratios presented reflect the Portfolio’s “Total Annual Portfolio Operating Expenses” from the most recent Prospectus and may differ from other expense ratios disclosed in this report. |
| 3. | Performance for Service Class shares, first offered June 5, 2003, includes the historical performance of Initial Class shares through June 4, 2003 adjusted to reflect the fees and expenses of Service Class shares. |
| 4. | Please refer to pages M-2 and M-3 for additional explanations and disclosure regarding the Portfolios, their benchmark indices and other indices mentioned in the reports. |
| 5. | The Average Lipper Variable Products S&P 500 Index Objective Portfolio is representative of portfolios that are passively managed and commit by prospectus language to replicate the performance of the S&P 500® Index (including reinvested dividends). In addition, S&P 500 Index Objective portfolios have limited expenses (advisor fee no higher than 0.50%). Lipper Inc. is an independent monitor of fund performance. Results are based on total returns with all dividend and capital gain distributions reinvested. |
| | |
| M-390 | | MainStay VP S&P 500 Index Portfolio |
Cost in Dollars of a $1,000 Investment in MainStay VP S&P 500 Index Portfolio (Unaudited)
The example below is intended to describe the fees and expenses borne by shareholders during the six-month period from July 1, 2012 to December 31, 2012, and the impact of those costs on your investment.
Example
As a shareholder of the Portfolio, you incur two types of costs: (1) transaction costs, including exchange fees and sales charges (loads) on purchases (as applicable), and (2) ongoing costs, including management fees, distribution and/or service (12b-1) fees, and other Portfolio expenses (as applicable). This example is intended to help you understand your ongoing costs (in dollars) of investing in the Portfolio and to compare these costs with the ongoing costs of investing in other Portfolios. The example is based on an investment of $1,000 made at the beginning of the six-month period and held for the entire period from July 1, 2012, to December 31, 2012. Shares are only sold in connection with variable life and annuity contracts and the example does not reflect any contract level or transactional fees or expenses. If these costs had been included, your costs would have been higher.
This example illustrates your Portfolio’s ongoing costs in two ways:
Actual Expenses
The second and third data columns in the table below provide information about actual account values and actual expenses. You may use the information in these columns, together with the amount you invested, to estimate the
expenses that you paid during the six months ended December 31, 2012. Simply divide your account value by $1,000 (for example, an $8,600 account value divided by $1,000 = 8.6), then multiply the result by the number under the heading entitled ‘‘Expenses Paid During Period’’ to estimate the expenses you paid on your account during this period.
Hypothetical Example for Comparison Purposes
The fourth and fifth data columns in the table below provide information about hypothetical account values and hypothetical expenses based on the Portfolio’s actual expense ratio and an assumed rate of return of 5% per year before expenses, which is not the Portfolio’s actual return. The hypothetical account values and expenses may not be used to estimate the actual ending account balances or expenses you paid for the six-month period shown. You may use this information to compare the ongoing costs of investing in the Portfolio with the ongoing costs of investing in other Portfolios. To do so, compare this 5% hypothetical example with the 5% hypothetical examples that appear in the shareholder reports of the other Portfolios.
Please note that the expenses shown in the table are meant to highlight your ongoing costs only and do not reflect any transactional costs, such as exchange fees or sales charges (loads). Therefore, the fourth and fifth data columns of the table are useful in comparing ongoing costs only and will not help you determine the relative total costs of owning different funds. In addition, if these transactional costs were included, your costs would have been higher.
| | | | | | | | | | | | | | | | | | | | |
| | | | | | | | | | | | | | | | |
| Share Class | | Beginning
Account
Value
7/1/12 | | | Ending Account
Value (Based
on Actual
Returns and
Expenses)
12/31/12 | | | Expenses
Paid
During
Period1 | | | Ending Account
Value (Based
on Hypothetical
5% Annualized
Return and
Actual Expenses)
12/31/12 | | | Expenses
Paid
During
Period1 | |
| | | | | |
| Initial Class Shares | | $ | 1,000.00 | | | $ | 1,057.90 | | | $ | 1.45 | | | $ | 1,023.70 | | | $ | 1.42 | |
| | | | | |
| Service Class Shares | | $ | 1,000.00 | | | $ | 1,056.60 | | | $ | 2.74 | | | $ | 1,022.50 | | | $ | 2.69 | |
| 1. | Expenses are equal to the Portfolio’s annualized expense ratio of each class (0.28% for Initial Class and 0.53% for Service Class) multiplied by the average account value over the period, divided by 366 and multiplied by 184 (to reflect the six-month period). The table above represents the actual expenses incurred during the six-month period. |
| | | | |
| mainstayinvestments.com | | | M-391 | |
Industry Composition as of December 31, 2012 (Unaudited)
| | | | |
| Oil, Gas & Consumable Fuels | | | 8.4 | % |
| Pharmaceuticals | | | 4.9 | |
| Computers & Peripherals | | | 4.6 | |
| Insurance | | | 3.7 | |
| IT Services | | | 3.5 | |
| Diversified Financial Services | | | 3.3 | |
| Media | | | 3.3 | |
| Software | | | 3.2 | |
| Commercial Banks | | | 2.6 | |
| Diversified Telecommunication Services | | | 2.5 | |
| Health Care Equipment & Supplies | | | 2.4 | |
| Chemicals | | | 2.3 | |
| Industrial Conglomerates | | | 2.3 | |
| Aerospace & Defense | | | 2.2 | |
| Beverages | | | 2.2 | |
| Food & Staples Retailing | | | 2.2 | |
| Household Products | | | 2.0 | |
| Internet Software & Services | | | 2.0 | |
| Real Estate Investment Trusts | | | 2.0 | |
| Specialty Retail | | | 2.0 | |
| Capital Markets | | | 1.8 | |
| Communications Equipment | | | 1.8 | |
| Electric Utilities | | | 1.8 | |
| Health Care Providers & Services | | | 1.8 | |
| Machinery | | | 1.8 | |
| Semiconductors & Semiconductor Equipment | | | 1.8 | |
| Energy Equipment & Services | | | 1.7 | |
| Hotels, Restaurants & Leisure | | | 1.7 | |
| Tobacco | | | 1.7 | |
| Food Products | | | 1.6 | |
| Biotechnology | | | 1.5 | |
| Multi-Utilities | | | 1.1 | |
| Internet & Catalog Retail | | | 1.0 | |
| Consumer Finance | | | 0.9 | |
| Air Freight & Logistics | | | 0.7 | |
| | | | |
| Metals & Mining | | | 0.7 | % |
| Multiline Retail | | | 0.7 | |
| Road & Rail | | | 0.7 | |
| Electrical Equipment | | | 0.6 | |
| Textiles, Apparel & Luxury Goods | | | 0.6 | |
| Commercial Services & Supplies | | | 0.5 | |
| Automobiles | | | 0.4 | |
| Electronic Equipment & Instruments | | | 0.4 | |
| Life Sciences Tools & Services | | | 0.4 | |
| Auto Components | | | 0.3 | |
| Household Durables | | | 0.3 | |
| Wireless Telecommunication Services | | | 0.3 | |
| Construction & Engineering | �� | | 0.2 | |
| Paper & Forest Products | | | 0.2 | |
| Personal Products | | | 0.2 | |
| Trading Companies & Distributors | | | 0.2 | |
| Airlines | | | 0.1 | |
| Construction Materials | | | 0.1 | |
| Containers & Packaging | | | 0.1 | |
| Distributors | | | 0.1 | |
| Diversified Consumer Services | | | 0.1 | |
| Gas Utilities | | | 0.1 | |
| Health Care Technology | | | 0.1 | |
| Independent Power Producers & Energy Traders | | | 0.1 | |
| Leisure Equipment & Products | | | 0.1 | |
| Office Electronics | | | 0.1 | |
| Professional Services | | | 0.1 | |
| Thrifts & Mortgage Finance | | | 0.1 | |
| Building Products | | | 0.0 | ‡ |
| Real Estate Management & Development | | | 0.0 | ‡ |
| Short-Term Investments | | | 7.6 | |
| Other Assets, Less Liabilities | | | 0.2 | |
| | | | |
| | | 100.0 | % |
| | | | |
See Portfolio of Investments beginning on page M-394 for specific holdings within these categories.
| ‡ | Less than one-tenth of a percent. |
Top Ten Holdings as of December 31, 2012 (excluding short-term investments) (Unaudited)
| 5. | International Business Machines Corp. |
| 10. | Procter & Gamble Co. (The) |
| | |
| M-392 | | MainStay VP S&P 500 Index Portfolio |
Portfolio Management Discussion and Analysis (Unaudited)
Answers to the questions reflect the views of portfolio managers Francis J. Ok and Lee Baker of Madison Square Investors LLC,1 the Portfolio’s Subadvisor.
How did MainStay VP S&P 500 Index Portfolio perform relative to its peers and its benchmark during the 12 months ended December 31, 2012?
For the 12 months ended December 31, 2012, MainStay VP S&P 500 Index Portfolio returned 15.66% for Initial Class shares and 15.37% for Service Class shares. Over the same period, Initial Class shares outperformed and Service Class shares underperformed the 15.39% return of the average Lipper2 Variable Products S&P 500 Index Objective Portfolio. Both share classes underperformed the 16.00% return of the S&P 500® Index for the 12 months ended December 31, 2012. The S&P 500® Index is the Portfolio’s broad-based securities-market index.
During the reporting period, how was the Portfolio’s performance materially affected by investments in derivatives?
The MainStay VP S&P 500 Index Portfolio invests in futures contracts to provide an efficient means of maintaining liquidity while remaining fully invested in the market. This had a positive effect on the Portfolio’s performance.
During the reporting period, which S&P 500® industries had the highest total returns, and which industries had the lowest total returns?
In 2012, the S&P 500® industries with the highest total returns were wireless telecommunication services, household durables and building products. The industries with the lowest total returns were diversified consumer services, office electronics and metals & mining.
During the reporting period, which S&P 500® industries made the strongest positive contributions to the Portfolio’s performance and which industries made the weakest contributions?
During 2012, the industries that made the greatest positive contributions to the Portfolio’s performance were diversified financial services, media, and computers & peripherals. (Contributions take weightings and total returns into account.) Over the same period, the industries that made the weakest contributions to the Portfolio’s performance were electric utilities,
metals & mining and semiconductors & semiconductor equipment.
During the reporting period, which individual stocks in the S&P 500® Index had the highest total returns, and which individual stocks had the lowest total returns?
During 2012, the S&P 500® stocks with the highest total returns were household durables company PulteGroup, wireless telecommunication services company Sprint Nextel and household durables company Whirlpool.
Over the same period, the S&P 500® stocks with the lowest total returns were diversified consumer services company Apollo Group, food & staples retailer SUPERVALU and semiconductor company Advanced Micro Devices.
During the reporting period, which S&P 500® stocks made the strongest positive contributions to the Portfolio’s absolute performance and which S&P 500® stocks made the weakest contributions?
During 2012, the S&P 500® stocks that made the strongest positive contributions to the Portfolio’s performance were computers & peripherals company Apple and diversified financial services companies Bank of America and JPMorgan Chase.
Over the same period, the S&P 500® stocks that made the weakest contributions to the Portfolio’s performance were computers & peripherals company Hewlett-Packard; semiconductor company Intel; and oil, gas & consumable fuels company Occidental Petroleum.
Were there any changes in the S&P 500® Index during the reporting period?
During the 12 months ended December 31, 2012, there were 18 additions to and 18 deletions from the S&P 500® Index. In terms of index weight, significant additions to the Index included pharmaceutical company AbbVie, which was spun off from Abbott Laboratories,3 and food products company Kraft Foods Group. Significant deletions included health care providers & services company Medco Health Solutions and oil, gas & consumable fuels company El Paso.
| 1. | Effective on or about January 25, 2013, Madison Square Investors LLC changed its name to Cornerstone Capital Management Holdings LLC. |
| 2. | Please refer to pages M-2 and M-3 for additional explanations and disclosure regarding the Portfolios, their benchmark indices and service providers mentioned in the reports. |
| 3. | Because of the date of the corporate action, the new holding AbbVie Inc. is not reflected in the Portfolio of Investments until January 2, 2013. |
The opinions expressed are those of the portfolio managers as of the date of this report and are subject to change. There is no guarantee that any forecasts made will come to pass. This material does not constitute investment advice and is not intended as an endorsement of any specific investment.
Not all MainStay VP Portfolios and/or share classes are available under all policies.
| | | | |
| mainstayinvestments.com | | | M-393 | |
Portfolio of Investments December 31, 2012
| | | | | | | | |
| | |
Shares | | | Value | |
| Common Stocks 92.2%† | |
Aerospace & Defense 2.2% | | | | | | | | |
Boeing Co. (The) | | | 50,142 | | | $ | 3,778,701 | |
General Dynamics Corp. | | | 24,451 | | | | 1,693,721 | |
Honeywell International, Inc. | | | 57,871 | | | | 3,673,072 | |
L-3 Communications Holdings, Inc. | �� | | 6,952 | | | | 532,662 | |
Lockheed Martin Corp. | | | 19,858 | | | | 1,832,695 | |
Northrop Grumman Corp. | | | 18,228 | | | | 1,231,848 | |
Precision Castparts Corp. | | | 10,749 | | | | 2,036,076 | |
Raytheon Co. | | | 24,481 | | | | 1,409,126 | |
Rockwell Collins, Inc. | | | 10,486 | | | | 609,971 | |
Textron, Inc. | | | 20,713 | | | | 513,475 | |
United Technologies Corp. | | | 62,292 | | | | 5,108,567 | |
| | | | | | | | |
| | | | | | | 22,419,914 | |
| | | | | | | | |
Air Freight & Logistics 0.7% | | | | | | | | |
C.H. Robinson Worldwide, Inc. | | | 11,909 | | | | 752,887 | |
Expeditors International of Washington, Inc. | | | 15,522 | | | | 613,895 | |
FedEx Corp. | | | 21,531 | | | | 1,974,823 | |
United Parcel Service, Inc. Class B | | | 52,860 | | | | 3,897,368 | |
| | | | | | | | |
| | | | | | | 7,238,973 | |
| | | | | | | | |
Airlines 0.1% | | | | | | | | |
Southwest Airlines Co. | | | 54,795 | | | | 561,101 | |
| | | | | | | | |
| | |
Auto Components 0.3% | | | | | | | | |
BorgWarner, Inc. (a) | | | 8,644 | | | | 619,083 | |
Delphi Automotive PLC (a) | | | 21,803 | | | | 833,965 | |
Goodyear Tire & Rubber Co. (The) (a) | | | 18,044 | | | | 249,188 | |
Johnson Controls, Inc. | | | 50,429 | | | | 1,548,170 | |
| | | | | | | | |
| | | | | | | 3,250,406 | |
| | | | | | | | |
Automobiles 0.4% | | | | | | | | |
Ford Motor Co. | | | 281,236 | | | | 3,642,006 | |
Harley-Davidson, Inc. | | | 16,805 | | | | 820,756 | |
| | | | | | | | |
| | | | | | | 4,462,762 | |
| | | | | | | | |
Beverages 2.2% | | | | | | | | |
Beam, Inc. | | | 11,680 | | | | 713,531 | |
Brown-Forman Corp. Class B | | | 11,164 | | | | 706,123 | |
Coca-Cola Co. (The) | | | 284,966 | | | | 10,330,018 | |
Coca-Cola Enterprises, Inc. | | | 20,012 | | | | 634,981 | |
Constellation Brands, Inc. Class A (a) | | | 11,282 | | | | 399,270 | |
Dr. Pepper Snapple Group, Inc. | | | 15,529 | | | | 686,071 | |
Molson Coors Brewing Co. Class B | | | 11,474 | | | | 490,973 | |
Monster Beverage Corp. (a) | | | 11,015 | | | | 582,473 | |
PepsiCo., Inc. | | | 114,273 | | | | 7,819,701 | |
| | | | | | | | |
| | | | | | | 22,363,141 | |
| | | | | | | | |
| | | | | | | | |
| | |
Shares | | | Value | |
Biotechnology 1.5% | | | | | | | | |
Alexion Pharmaceuticals, Inc. (a) | | | 14,355 | | | $ | 1,346,642 | |
Amgen, Inc. | | | 56,695 | | | | 4,893,912 | |
Biogen Idec, Inc. (a) | | | 17,507 | | | | 2,567,752 | |
Celgene Corp. (a) | | | 31,251 | | | | 2,460,079 | |
Gilead Sciences, Inc. (a) | | | 55,971 | | | | 4,111,070 | |
| | | | | | | | |
| | | | | | | 15,379,455 | |
| | | | | | | | |
Building Products 0.0%‡ | | | | | | | | |
Masco Corp. | | | 26,332 | | | | 438,691 | |
| | | | | | | | |
| | |
Capital Markets 1.8% | | | | | | | | |
Ameriprise Financial, Inc. | | | 15,282 | | | | 957,112 | |
Bank of New York Mellon Corp. (The) | | | 86,368 | | | | 2,219,658 | |
BlackRock, Inc. | | | 9,268 | | | | 1,915,788 | |
Charles Schwab Corp. (The) | | | 80,795 | | | | 1,160,216 | |
E*TRADE Financial Corp. (a) | | | 18,936 | | | | 169,477 | |
Federated Investors, Inc. Class B | | | 4,422 | | | | 89,457 | |
Franklin Resources, Inc. | | | 10,191 | | | | 1,281,009 | |
Goldman Sachs Group, Inc. (The) | | | 32,634 | | | | 4,162,793 | |
Invesco, Ltd. | | | 32,828 | | | | 856,482 | |
Legg Mason, Inc. | | | 8,863 | | | | 227,956 | |
Morgan Stanley | | | 101,972 | | | | 1,949,705 | |
Northern Trust Corp. | | | 16,141 | | | | 809,633 | |
State Street Corp. | | | 34,322 | | | | 1,613,477 | |
T. Rowe Price Group, Inc. | | | 18,715 | | | | 1,218,908 | |
| | | | | | | | |
| | | | | | | 18,631,671 | |
| | | | | | | | |
Chemicals 2.3% | | | | | | | | |
Air Products & Chemicals, Inc. | | | 15,721 | | | | 1,320,878 | |
Airgas, Inc. | | | 5,240 | | | | 478,360 | |
CF Industries Holdings, Inc. | | | 4,623 | | | | 939,209 | |
Dow Chemical Co. (The) | | | 88,345 | | | | 2,855,310 | |
E.I. du Pont de Nemours & Co. | | | 68,892 | | | | 3,098,073 | |
Eastman Chemical Co. | | | 11,275 | | | | 767,264 | |
Ecolab, Inc. | | | 19,415 | | | | 1,395,939 | |
FMC Corp. | | | 10,124 | | | | 592,457 | |
International Flavors & Fragrances, Inc. | | | 6,010 | | | | 399,905 | |
LyondellBasell Industries, N.V., Class A | | | 27,979 | | | | 1,597,321 | |
Monsanto Co. | | | 39,496 | | | | 3,738,296 | |
Mosaic Co. (The) | | | 20,439 | | | | 1,157,461 | |
PPG Industries, Inc. | | | 11,260 | | | | 1,524,041 | |
Praxair, Inc. | | | 21,989 | | | | 2,406,696 | |
Sherwin-Williams Co. (The) | | | 6,282 | | | | 966,297 | |
Sigma-Aldrich Corp. | | | 8,908 | | | | 655,451 | |
| | | | | | | | |
| | | | | | | 23,892,958 | |
| | | | | | | | |
Commercial Banks 2.6% | | | | | | | | |
BB&T Corp. | | | 51,550 | | | | 1,500,621 | |
Comerica, Inc. | | | 14,268 | | | | 432,891 | |
| † | Percentages indicated are based on Portfolio net assets. |
| ¨ | | Among the Portfolio’s 10 largest holdings, as of December 31, 2012, excluding short-term investments. May be subject to change daily. |
| | | | |
| M-394 | | MainStay VP S&P 500 Index Portfolio | | The notes to the financial statements are an integral part of,
and should be read in conjunction with, the financial statements. |
| | | | | | | | |
| | |
Shares | | | Value | |
| Common Stocks (continued) | |
Commercial Banks (continued) | | | | | | | | |
Fifth Third Bancorp | | | 66,306 | | | $ | 1,007,188 | |
First Horizon National Corp. | | | 18,346 | | | | 181,809 | |
Huntington Bancshares, Inc. | | | 63,297 | | | | 404,468 | |
KeyCorp | | | 69,572 | | | | 585,796 | |
M&T Bank Corp. | | | 8,984 | | | | 884,654 | |
PNC Financial Services Group, Inc. | | | 39,037 | | | | 2,276,247 | |
Regions Financial Corp. | | | 104,214 | | | | 742,004 | |
SunTrust Banks, Inc. | | | 39,708 | | | | 1,125,722 | |
U.S. Bancorp | | | 138,922 | | | | 4,437,169 | |
Wells Fargo & Co. | | | 361,697 | | | | 12,362,803 | |
Zions Bancorp. | | | 13,575 | | | | 290,505 | |
| | | | | | | | |
| | | | | | | 26,231,877 | |
| | | | | | | | |
Commercial Services & Supplies 0.5% | | | | | |
ADT Corp. (The) | | | 17,177 | | | | 798,559 | |
Avery Dennison Corp. | | | 7,484 | | | | 261,341 | |
Cintas Corp. | | | 7,934 | | | | 324,500 | |
Iron Mountain, Inc. | | | 12,555 | | | | 389,833 | |
Pitney Bowes, Inc. | | | 14,792 | | | | 157,387 | |
Republic Services, Inc. | | | 22,085 | | | | 647,753 | |
Stericycle, Inc. (a) | | | 6,422 | | | | 598,980 | |
Tyco International, Ltd. | | | 34,405 | | | | 1,006,346 | |
Waste Management, Inc. | | | 32,128 | | | | 1,083,999 | |
| | | | | | | | |
| | | | | | | 5,268,698 | |
| | | | | | | | |
Communications Equipment 1.8% | | | | | |
Cisco Systems, Inc. | | | 392,217 | | | | 7,707,064 | |
F5 Networks, Inc. (a) | | | 5,825 | | | | 565,899 | |
Harris Corp. | | | 8,347 | | | | 408,669 | |
JDS Uniphase Corp. (a) | | | 17,100 | | | | 231,534 | |
Juniper Networks, Inc. (a) | | | 38,092 | | | | 749,269 | |
Motorola Solutions, Inc. | | | 20,863 | | | | 1,161,652 | |
QUALCOMM, Inc. | | | 125,890 | | | | 7,807,698 | |
| | | | | | | | |
| | | | | | | 18,631,785 | |
| | | | | | | | |
Computers & Peripherals 4.6% | | | | | |
¨Apple, Inc. | | | 69,493 | | | | 37,041,854 | |
Dell, Inc. | | | 107,444 | | | | 1,088,408 | |
EMC Corp. (a) | | | 155,641 | | | | 3,937,717 | |
Hewlett-Packard Co. | | | 144,984 | | | | 2,066,022 | |
NetApp, Inc. (a) | | | 26,471 | | | | 888,102 | |
SanDisk Corp. (a) | | | 17,808 | | | | 775,716 | |
Seagate Technology PLC | | | 24,949 | | | | 760,446 | |
Western Digital Corp. | | | 16,407 | | | | 697,133 | |
| | | | | | | | |
| | | | | | | 47,255,398 | |
| | | | | | | | |
Construction & Engineering 0.2% | | | | | | | | |
Fluor Corp. | | | 12,314 | | | | 723,324 | |
Jacobs Engineering Group, Inc. (a) | | | 9,564 | | | | 407,140 | |
Quanta Services, Inc. (a) | | | 15,751 | | | | 429,845 | |
| | | | | | | | |
| | | | | | | 1,560,309 | |
| | | | | | | | |
| | | | | | | | |
| | |
Shares | | | Value | |
Construction Materials 0.1% | | | | | | | | |
Vulcan Materials Co. | | | 9,542 | | | $ | 496,661 | |
| | | | | | | | |
| | |
Consumer Finance 0.9% | | | | | | | | |
American Express Co. | | | 71,929 | | | | 4,134,479 | |
Capital One Financial Corp. | | | 42,842 | | | | 2,481,837 | |
Discover Financial Services | | | 37,294 | | | | 1,437,684 | |
SLM Corp. | | | 34,613 | | | | 592,920 | |
| | | | | | | | |
| | | | | | | 8,646,920 | |
| | | | | | | | |
Containers & Packaging 0.1% | | | | | | | | |
Ball Corp. | | | 11,407 | | | | 510,463 | |
Bemis Co., Inc. | | | 7,617 | | | | 254,865 | |
Owens-Illinois, Inc. (a) | | | 12,174 | | | | 258,941 | |
Sealed Air Corp. | | | 14,320 | | | | 250,743 | |
| | | | | | | | |
| | | | | | | 1,275,012 | |
| | | | | | | | |
Distributors 0.1% | | | | | | | | |
Genuine Parts Co. | | | 11,437 | | | | 727,164 | |
| | | | | | | | |
| |
Diversified Consumer Services 0.1% | | | | | |
Apollo Group, Inc. Class A (a) | | | 7,440 | | | | 155,645 | |
H&R Block, Inc. | | | 19,990 | | | | 371,214 | |
| | | | | | | | |
| | | | | | | 526,859 | |
| | | | | | | | |
Diversified Financial Services 3.3% | | | | | | | | |
Bank of America Corp. | | | 796,275 | | | | 9,236,790 | |
Citigroup, Inc. | | | 216,650 | | | | 8,570,674 | |
CME Group, Inc. | | | 22,658 | | | | 1,148,987 | |
IntercontinentalExchange, Inc. (a) | | | 5,368 | | | | 664,612 | |
JPMorgan Chase & Co. | | | 280,826 | | | | 12,347,919 | |
Leucadia National Corp. | | | 14,607 | | | | 347,501 | |
Moody’s Corp. | | | 14,261 | | | | 717,614 | |
NASDAQ OMX Group, Inc. (The) | | | 8,738 | | | | 218,537 | |
NYSE Euronext | | | 18,140 | | | | 572,136 | |
| | | | | | | | |
| | | | | | | 33,824,770 | |
| | | | | | | | |
Diversified Telecommunication Services 2.5% | |
¨AT&T, Inc. | | | 419,606 | | | | 14,144,918 | |
CenturyLink, Inc. | | | 45,909 | | | | 1,795,960 | |
Frontier Communications Corp. | | | 73,627 | | | | 315,124 | |
Verizon Communications, Inc. | | | 210,831 | | | | 9,122,658 | |
Windstream Corp. | | | 43,358 | | | | 359,004 | |
| | | | | | | | |
| | | | | | | 25,737,664 | |
| | | | | | | | |
Electric Utilities 1.8% | | | | | | | | |
American Electric Power Co., Inc. | | | 35,756 | | | | 1,526,066 | |
Duke Energy Corp. | | | 51,919 | | | | 3,312,432 | |
Edison International | | | 24,024 | | | | 1,085,645 | |
Entergy Corp. | | | 13,074 | | | | 833,467 | |
Exelon Corp. | | | 62,943 | | | | 1,871,925 | |
FirstEnergy Corp. | | | 30,837 | | | | 1,287,753 | |
NextEra Energy, Inc. | | | 31,266 | | | | 2,163,295 | |
Northeast Utilities | | | 23,139 | | | | 904,272 | |
| | | | | | |
The notes to the financial statements are an integral part of,
and should be read in conjunction with, the financial statements. | | mainstayinvestments.com | | | M-395 | |
Portfolio of Investments December 31, 2012 (continued)
| | | | | | | | |
| | |
Shares | | | Value | |
| Common Stocks (continued) | |
Electric Utilities (continued) | | | | | | | | |
Pepco Holdings, Inc. | | | 16,879 | | | $ | 330,997 | |
Pinnacle West Capital Corp. | | | 8,074 | | | | 411,612 | |
PPL Corp. | | | 42,820 | | | | 1,225,937 | |
Southern Co. (The) | | | 64,506 | | | | 2,761,502 | |
Xcel Energy, Inc. | | | 35,955 | | | | 960,358 | |
| | | | | | | | |
| | | | | | | 18,675,261 | |
| | | | | | | | |
Electrical Equipment 0.6% | | | | | | | | |
Eaton Corp. PLC | | | 34,029 | | | | 1,844,372 | |
Emerson Electric Co. | | | 53,630 | | | | 2,840,245 | |
Rockwell Automation, Inc. | | | 10,271 | | | | 862,661 | |
Roper Industries, Inc. | | | 7,212 | | | | 803,994 | |
| | | | | | | | |
| | | | | | | 6,351,272 | |
| | | | | | | | |
Electronic Equipment & Instruments 0.4% | | | | | |
Amphenol Corp. Class A | | | 11,872 | | | | 768,118 | |
Corning, Inc. | | | 109,796 | | | | 1,385,625 | |
FLIR Systems, Inc. | | | 11,142 | | | | 248,578 | |
Jabil Circuit, Inc. | | | 13,789 | | | | 265,990 | |
Molex, Inc. | | | 10,154 | | | | 277,509 | |
TE Connectivity, Ltd. | | | 31,107 | | | | 1,154,692 | |
| | | | | | | | |
| | | | | | | 4,100,512 | |
| | | | | | | | |
Energy Equipment & Services 1.7% | | | | | | | | |
Baker Hughes, Inc. | | | 32,415 | | | | 1,323,829 | |
Cameron International Corp. (a) | | | 18,162 | | | | 1,025,426 | |
Diamond Offshore Drilling, Inc. | | | 5,125 | | | | 348,295 | |
Ensco PLC Class A | | | 17,107 | | | | 1,014,103 | |
FMC Technologies, Inc. (a) | | | 17,579 | | | | 752,908 | |
Halliburton Co. | | | 68,414 | | | | 2,373,282 | |
Helmerich & Payne, Inc. | | | 7,794 | | | | 436,542 | |
Nabors Industries, Ltd. (a) | | | 21,413 | | | | 309,418 | |
National-Oilwell Varco, Inc. | | | 31,442 | | | | 2,149,061 | |
Noble Corp. | | | 18,626 | | | | 648,557 | |
Rowan Cos. PLC (a) | | | 9,158 | | | | 286,371 | |
Schlumberger, Ltd. | | | 98,107 | | | | 6,797,834 | |
| | | | | | | | |
| | | | | | | 17,465,626 | |
| | | | | | | | |
Food & Staples Retailing 2.2% | | | | | | | | |
Costco Wholesale Corp. | | | 31,877 | | | | 3,148,491 | |
CVS Caremark Corp. | | | 92,292 | | | | 4,462,318 | |
Kroger Co. (The) | | | 37,883 | | | | 985,716 | |
Safeway, Inc. | | | 17,660 | | | | 319,469 | |
Sysco Corp. | | | 43,622 | | | | 1,381,073 | |
Wal-Mart Stores, Inc. | | | 123,570 | | | | 8,431,181 | |
Walgreen Co. | | | 63,491 | | | | 2,349,802 | |
Whole Foods Market, Inc. | | | 12,661 | | | | 1,156,329 | |
| | | | | | | | |
| | | | | | | 22,234,379 | |
| | | | | | | | |
Food Products 1.6% | | | | | | | | |
Archer-Daniels-Midland Co. | | | 48,564 | | | | 1,330,168 | |
Campbell Soup Co. | | | 13,280 | | | | 463,339 | |
| | | | | | | | |
| | |
Shares | | | Value | |
| | | | | | | | |
Food Products (continued) | | | | | | | | |
ConAgra Foods, Inc. | | | 29,945 | | | $ | 883,378 | |
Dean Foods Co. (a) | | | 13,627 | | | | 224,982 | |
General Mills, Inc. | | | 47,804 | | | | 1,931,760 | |
H.J. Heinz Co. | | | 23,611 | | | | 1,361,882 | |
Hershey Co. (The) | | | 11,045 | | | | 797,670 | |
Hormel Foods Corp. | | | 9,888 | | | | 308,604 | |
J.M. Smucker Co. (The) | | | 8,074 | | | | 696,302 | |
Kellogg Co. | | | 18,199 | | | | 1,016,414 | |
Kraft Foods Group, Inc. | | | 43,616 | | | | 1,983,220 | |
McCormick & Co., Inc. | | | 9,778 | | | | 621,196 | |
Mead Johnson Nutrition Co. | | | 15,028 | | | | 990,195 | |
Mondelez International, Inc. Class A | | | 131,290 | | | | 3,343,956 | |
Tyson Foods, Inc. Class A | | | 21,355 | | | | 414,287 | |
| | | | | | | | |
| | | | | | | 16,367,353 | |
| | | | | | | | |
Gas Utilities 0.1% | | | | | | | | |
AGL Resources, Inc. | | | 8,664 | | | | 346,300 | |
ONEOK, Inc. | | | 15,124 | | | | 646,551 | |
| | | | | | | | |
| | | | | | | 992,851 | |
| | | | | | | | |
Health Care Equipment & Supplies 2.4% | | | | | | | | |
Abbott Laboratories | | | 116,771 | | | | 7,648,501 | |
Baxter International, Inc. | | | 40,589 | | | | 2,705,663 | |
Becton, Dickinson & Co. | | | 14,538 | | | | 1,136,726 | |
Boston Scientific Corp. (a) | | | 101,773 | | | | 583,159 | |
C.R. Bard, Inc. | | | 5,752 | | | | 562,200 | |
CareFusion Corp. (a) | | | 16,362 | | | | 467,626 | |
Covidien PLC | | | 35,093 | | | | 2,026,270 | |
DENTSPLY International, Inc. | | | 10,456 | | | | 414,162 | |
Edwards Lifesciences Corp. (a) | | | 8,531 | | | | 769,240 | |
Intuitive Surgical, Inc. (a) | | | 2,942 | | | | 1,442,669 | |
Medtronic, Inc. | | | 74,721 | | | | 3,065,055 | |
St. Jude Medical, Inc. | | | 22,769 | | | | 822,872 | |
Stryker Corp. | | | 21,318 | | | | 1,168,653 | |
Varian Medical Systems, Inc. (a) | | | 8,163 | | | | 573,369 | |
Zimmer Holdings, Inc. | | | 12,882 | | | | 858,714 | |
| | | | | | | | |
| | | | | | | 24,244,879 | |
| | | | | | | | |
Health Care Providers & Services 1.8% | | | | | |
Aetna, Inc. | | | 24,643 | | | | 1,140,971 | |
AmerisourceBergen Corp. | | | 17,363 | | | | 749,734 | |
Cardinal Health, Inc. | | | 25,152 | | | | 1,035,759 | |
Cigna Corp. | | | 21,266 | | | | 1,136,880 | |
Coventry Health Care, Inc. | | | 9,874 | | | | 442,651 | |
DaVita, Inc. (a) | | | 6,135 | | | | 678,102 | |
Express Scripts Holding Co. (a) | | | 60,315 | | | | 3,257,010 | |
Humana, Inc. | | | 11,649 | | | | 799,471 | |
Laboratory Corp. of America Holdings (a) | | | 7,071 | | | | 612,490 | |
McKesson Corp. | | | 17,402 | | | | 1,687,298 | |
Patterson Cos., Inc. | | | 6,268 | | | | 214,554 | |
Quest Diagnostics, Inc. | | | 11,710 | | | | 682,342 | |
Tenet Healthcare Corp. (a) | | | 7,683 | | | | 249,467 | |
| | | | |
| M-396 | | MainStay VP S&P 500 Index Portfolio | | The notes to the financial statements are an integral part of,
and should be read in conjunction with, the financial statements. |
| | | | | | | | |
| | |
Shares | | | Value | |
| Common Stocks (continued) | |
Health Care Providers & Services (continued) | |
UnitedHealth Group, Inc. | | | 75,324 | | | $ | 4,085,574 | |
WellPoint, Inc. | | | 22,437 | | | | 1,366,862 | |
| | | | | | | | |
| | | | | | | 18,139,165 | |
| | | | | | | | |
Health Care Technology 0.1% | | | | | | | | |
Cerner Corp. (a) | | | 10,729 | | | | 833,000 | |
| | | | | | | | |
| | |
Hotels, Restaurants & Leisure 1.7% | | | | | | | | |
Carnival Corp. | | | 32,976 | | | | 1,212,527 | |
Chipotle Mexican Grill, Inc. (a) | | | 2,337 | | | | 695,164 | |
Darden Restaurants, Inc. | | | 9,453 | | | | 426,047 | |
International Game Technology | | | 19,695 | | | | 279,078 | |
Marriott International, Inc. | | | 18,237 | | | | 679,693 | |
McDonald’s Corp. | | | 74,174 | | | | 6,542,889 | |
Starbucks Corp. | | | 54,936 | | | | 2,945,668 | |
Starwood Hotels & Resorts Worldwide, Inc. | | | 14,490 | | | | 831,146 | |
Wyndham Worldwide Corp. | | | 10,486 | | | | 557,960 | |
Wynn Resorts, Ltd. | | | 5,855 | | | | 658,629 | |
Yum! Brands, Inc. | | | 33,379 | | | | 2,216,366 | |
| | | | | | | | |
| | | | | | | 17,045,167 | |
| | | | | | | | |
Household Durables 0.3% | | | | | | | | |
D.R. Horton, Inc. | | | 20,484 | | | | 405,174 | |
Garmin, Ltd. | | | 8,038 | | | | 328,111 | |
Harman International Industries, Inc. | | | 4,955 | | | | 221,191 | |
Leggett & Platt, Inc. | | | 10,368 | | | | 282,217 | |
Lennar Corp. Class A | | | 12,005 | | | | 464,234 | |
Newell Rubbermaid, Inc. | | | 21,296 | | | | 474,262 | |
PulteGroup, Inc. (a) | | | 24,901 | | | | 452,202 | |
Whirlpool Corp. | | | 5,715 | | | | 581,501 | |
| | | | | | | | |
| | | | | | | 3,208,892 | |
| | | | | | | | |
Household Products 2.0% | | | | | | | | |
Clorox Co. (The) | | | 9,705 | | | | 710,600 | |
Colgate-Palmolive Co. | | | 32,865 | | | | 3,435,707 | |
Kimberly-Clark Corp. | | | 28,909 | | | | 2,440,787 | |
¨Procter & Gamble Co. (The) | | | 201,989 | | | | 13,713,033 | |
| | | | | | | | |
| | | | | | | 20,300,127 | |
| | | | | | | | |
Independent Power Producers & Energy Traders 0.1% | |
AES Corp. (The) | | | 45,777 | | | | 489,814 | |
NRG Energy, Inc. | | | 23,728 | | | | 545,507 | |
| | | | | | | | |
| | | | | | | 1,035,321 | |
| | | | | | | | |
Industrial Conglomerates 2.3% | | | | | | | | |
3M Co. | | | 47,027 | | | | 4,366,457 | |
Danaher Corp. | | | 43,070 | | | | 2,407,613 | |
¨General Electric Co. | | | 774,668 | | | | 16,260,281 | |
| | | | | | | | |
| | | | | | | 23,034,351 | |
| | | | | | | | |
| | | | | | | | |
| | |
Shares | | | Value | |
Insurance 3.7% | | | | | | | | |
ACE, Ltd. | | | 25,103 | | | $ | 2,003,219 | |
Aflac, Inc. | | | 34,531 | | | | 1,834,287 | |
Allstate Corp. (The) | | | 35,756 | | | | 1,436,319 | |
American International Group, Inc. (a) | | | 109,067 | | | | 3,850,065 | |
Aon PLC | | | 23,545 | | | | 1,309,102 | |
Assurant, Inc. | | | 5,980 | | | | 207,506 | |
Berkshire Hathaway, Inc. Class B (a) | | | 134,751 | | | | 12,087,165 | |
Chubb Corp. (The) | | | 19,349 | | | | 1,457,367 | |
Cincinnati Financial Corp. | | | 10,788 | | | | 422,458 | |
Genworth Financial, Inc. Class A (a) | | | 36,250 | | | | 272,238 | |
Hartford Financial Services Group, Inc. (The) | | | 32,135 | | | | 721,109 | |
Lincoln National Corp. | | | 20,588 | | | | 533,229 | |
Loews Corp. | | | 23,043 | | | | 939,002 | |
Marsh & McLennan Cos., Inc. | | | 40,128 | | | | 1,383,212 | |
MetLife, Inc. | | | 80,602 | | | | 2,655,030 | |
Principal Financial Group, Inc. | | | 20,455 | | | | 583,377 | |
Progressive Corp. (The) | | | 41,323 | | | | 871,915 | |
Prudential Financial, Inc. | | | 34,362 | | | | 1,832,525 | |
Torchmark Corp. | | | 7,035 | | | | 363,498 | |
Travelers Cos., Inc. (The) | | | 28,177 | | | | 2,023,672 | |
Unum Group | | | 20,654 | | | | 430,016 | |
XL Group PLC | | | 22,542 | | | | 564,903 | |
| | | | | | | | |
| | | | | | | 37,781,214 | |
| | | | | | | | |
Internet & Catalog Retail 1.0% | | | | | | | | |
Amazon.com, Inc. (a) | | | 26,774 | | | | 6,724,022 | |
Expedia, Inc. | | | 6,909 | | | | 424,558 | |
Netflix, Inc. (a) | | | 4,092 | | | | 379,656 | |
Priceline.com, Inc. (a) | | | 3,672 | | | | 2,281,046 | |
TripAdvisor, Inc. (a) | | | 8,082 | | | | 339,121 | |
| | | | | | | | |
| | | | | | | 10,148,403 | |
| | | | | | | | |
Internet Software & Services 2.0% | | | | | | | | |
Akamai Technologies, Inc. (a) | | | 13,074 | | | | 534,857 | |
eBay, Inc. (a) | | | 86,039 | | | | 4,389,710 | |
¨Google, Inc. Class A (a) | | | 19,662 | | | | 13,947,633 | |
VeriSign, Inc. (a) | | | 11,533 | | | | 447,711 | |
Yahoo!, Inc. (a) | | | 76,872 | | | | 1,529,753 | |
| | | | | | | | |
| | | | | | | 20,849,664 | |
| | | | | | | | |
IT Services 3.5% | | | | | | | | |
Accenture PLC Class A | | | 47,172 | | | | 3,136,938 | |
Automatic Data Processing, Inc. | | | 35,726 | | | | 2,036,739 | |
Cognizant Technology Solutions Corp. Class A (a) | | | 22,178 | | | | 1,642,281 | |
Computer Sciences Corp. | | | 11,452 | | | | 458,653 | |
Fidelity National Information Services, Inc. | | | 18,464 | | | | 642,732 | |
Fiserv, Inc. (a) | | | 9,877 | | | | 780,579 | |
¨International Business Machines Corp. | | | 78,501 | | | | 15,036,867 | |
MasterCard, Inc. Class A | | | 7,912 | | | | 3,887,007 | |
Paychex, Inc. | | | 23,810 | | | | 741,443 | |
| | | | | | |
The notes to the financial statements are an integral part of,
and should be read in conjunction with, the financial statements. | | mainstayinvestments.com | | | M-397 | |
Portfolio of Investments December 31, 2012 (continued)
| | | | | | | | |
| | |
Shares | | | Value | |
| Common Stocks (continued) | |
IT Services (continued) | |
SAIC, Inc. | | | 20,919 | | | $ | 236,803 | |
Teradata Corp. (a) | | | 12,432 | | | | 769,417 | |
Total System Services, Inc. | | | 11,923 | | | | 255,391 | |
Visa, Inc. Class A | | | 38,512 | | | | 5,837,649 | |
Western Union Co. (The) | | | 44,420 | | | | 604,556 | |
| | | | | | | | |
| | | | | | | 36,067,055 | |
| | | | | | | | |
Leisure Equipment & Products 0.1% | | | | | | | | |
Hasbro, Inc. | | | 8,546 | | | | 306,801 | |
Mattel, Inc. | | | 25,391 | | | | 929,819 | |
| | | | | | | | |
| | | | | | | 1,236,620 | |
| | | | | | | | |
Life Sciences Tools & Services 0.4% | | | | | |
Agilent Technologies, Inc. | | | 25,690 | | | | 1,051,749 | |
Life Technologies Corp. (a) | | | 12,613 | | | | 619,046 | |
PerkinElmer, Inc. | | | 8,414 | | | | 267,060 | |
Thermo Fisher Scientific, Inc. | | | 26,636 | | | | 1,698,844 | |
Waters Corp. (a) | | | 6,467 | | | | 563,405 | |
| | | | | | | | |
| | | | | | | 4,200,104 | |
| | | | | | | | |
Machinery 1.8% | | | | | | | | |
Caterpillar, Inc. | | | 48,309 | | | | 4,327,520 | |
Cummins, Inc. | | | 13,059 | | | | 1,414,943 | |
Deere & Co. | | | 28,883 | | | | 2,496,069 | |
Dover Corp. | | | 13,318 | | | | 875,126 | |
Flowserve Corp. | | | 3,694 | | | | 542,279 | |
Illinois Tool Works, Inc. | | | 31,502 | | | | 1,915,637 | |
Ingersoll-Rand PLC | | | 20,679 | | | | 991,765 | |
Joy Global, Inc. | | | 7,809 | | | | 498,058 | |
PACCAR, Inc. | | | 26,066 | | | | 1,178,444 | |
Pall Corp. | | | 8,263 | | | | 497,928 | |
Parker Hannifin Corp. | | | 11,016 | | | | 937,021 | |
Pentair, Ltd. | | | 15,455 | | | | 759,613 | |
Snap-On, Inc. | | | 4,292 | | | | 339,025 | |
Stanley Black & Decker, Inc. | | | 12,395 | | | | 916,858 | |
Xylem, Inc. | | | 13,686 | | | | 370,890 | |
| | | | | | | | |
| | | | | | | 18,061,176 | |
| | | | | | | | |
Media 3.3% | | | | | | | | |
Cablevision Systems Corp. Class A | | | 15,913 | | | | 237,740 | |
CBS Corp. Class B | | | 43,889 | | | | 1,669,976 | |
Comcast Corp. Class A | | | 196,303 | | | | 7,337,806 | |
DIRECTV (a) | | | 44,543 | | | | 2,234,277 | |
Discovery Communications, Inc. Class A (a) | | | 17,512 | | | | 1,111,662 | |
Gannett Co., Inc. | | | 17,063 | | | | 307,305 | |
Interpublic Group of Cos., Inc. (The) | | | 32,231 | | | | 355,186 | |
McGraw-Hill Cos., Inc. (The) | | | 20,661 | | | | 1,129,537 | |
News Corp. Class A | | | 148,953 | | | | 3,804,260 | |
Omnicom Group, Inc. | | | 19,585 | | | | 978,467 | |
Scripps Networks Interactive Class A | | | 6,371 | | | | 369,008 | |
| | | | | | | | |
| | |
Shares | | | Value | |
Media (continued) | | | | | | | | |
Time Warner Cable, Inc. | | | 22,297 | | | $ | 2,167,045 | |
Time Warner, Inc. | | | 69,970 | | | | 3,346,665 | |
Viacom, Inc. Class B | | | 34,221 | | | | 1,804,815 | |
Walt Disney Co. (The) | | | 130,914 | | | | 6,518,208 | |
Washington Post Co. Class B | | | 332 | | | | 121,250 | |
| | | | | | | | |
| | | | | | | 33,493,207 | |
| | | | | | | | |
Metals & Mining 0.7% | | | | | | | | |
Alcoa, Inc. | | | 78,671 | | | | 682,864 | |
Allegheny Technologies, Inc. | | | 7,905 | | | | 239,996 | |
Cliffs Natural Resources, Inc. | | | 10,508 | | | | 405,189 | |
Freeport-McMoRan Copper & Gold, Inc. | | | 69,992 | | | | 2,393,726 | |
Newmont Mining Corp. | | | 36,589 | | | | 1,699,193 | |
Nucor Corp. | | | 23,412 | | | | 1,010,930 | |
Titanium Metals Corp. | | | 5,420 | | | | 89,484 | |
United States Steel Corp. | | | 10,640 | | | | 253,977 | |
| | | | | | | | |
| | | | | | | 6,775,359 | |
| | | | | | | | |
Multi-Utilities 1.1% | | | | | | | | |
Ameren Corp. | | | 17,889 | | | | 549,550 | |
CenterPoint Energy, Inc. | | | 31,516 | | | | 606,683 | |
CMS Energy Corp. | | | 19,541 | | | | 476,410 | |
Consolidated Edison, Inc. | | | 21,598 | | | | 1,199,553 | |
Dominion Resources, Inc. | | | 42,451 | | | | 2,198,962 | |
DTE Energy Co. | | | 12,668 | | | | 760,713 | |
Integrys Energy Group, Inc. | | | 5,744 | | | | 299,952 | |
NiSource, Inc. | | | 22,869 | | | | 569,209 | |
PG&E Corp. | | | 31,768 | | | | 1,276,438 | |
Public Service Enterprise Group, Inc. | | | 37,304 | | | | 1,141,502 | |
SCANA Corp. | | | 9,682 | | | | 441,887 | |
Sempra Energy | | | 16,576 | | | | 1,175,901 | |
TECO Energy, Inc. | | | 15,013 | | | | 251,618 | |
Wisconsin Energy Corp. | | | 16,989 | | | | 626,045 | |
| | | | | | | | |
| | | | | | | 11,574,423 | |
| | | | | | | | |
Multiline Retail 0.7% | | | | | | | | |
Big Lots, Inc. (a) | | | 4,395 | | | | 125,082 | |
Dollar General Corp. (a) | | | 19,597 | | | | 864,032 | |
Dollar Tree, Inc. (a) | | | 16,982 | | | | 688,790 | |
Family Dollar Stores, Inc. | | | 7,153 | | | | 453,572 | |
J.C. Penney Co., Inc. | | | 10,500 | | | | 206,955 | |
Kohl’s Corp. | | | 15,633 | | | | 671,906 | |
Macy’s, Inc. | | | 29,204 | | | | 1,139,540 | |
Nordstrom, Inc. | | | 11,267 | | | | 602,784 | |
Target Corp. | | | 48,080 | | | | 2,844,894 | |
| | | | | | | | |
| | | | | | | 7,597,555 | |
| | | | | | | | |
Office Electronics 0.1% | | | | | | | | |
Xerox Corp. | | | 93,625 | | | | 638,523 | |
| | | | | | | | |
| | |
Oil, Gas & Consumable Fuels 8.4% | | | | | | | | |
Anadarko Petroleum Corp. | | | 36,847 | | | | 2,738,101 | |
Apache Corp. | | | 28,846 | | | | 2,264,411 | |
| | | | |
| M-398 | | MainStay VP S&P 500 Index Portfolio | | The notes to the financial statements are an integral part of,
and should be read in conjunction with, the financial statements. |
| | | | | | | | |
| | |
Shares | | | Value | |
| Common Stocks (continued) | |
Oil, Gas & Consumable Fuels (continued) | |
Cabot Oil & Gas Corp. | | | 15,485 | | | $ | 770,224 | |
Chesapeake Energy Corp. | | | 38,270 | | | | 636,047 | |
¨Chevron Corp. | | | 144,681 | | | | 15,645,803 | |
ConocoPhillips | | | 89,555 | | | | 5,193,295 | |
CONSOL Energy, Inc. | | | 16,783 | | | | 538,734 | |
Denbury Resources, Inc. (a) | | | 28,846 | | | | 467,305 | |
Devon Energy Corp. | | | 27,740 | | | | 1,443,590 | |
EOG Resources, Inc. | | | 20,015 | | | | 2,417,612 | |
EQT Corp. | | | 11,031 | | | | 650,608 | |
¨ExxonMobil Corp. | | | 336,818 | | | | 29,151,598 | |
Hess Corp. | | | 21,908 | | | | 1,160,248 | |
Kinder Morgan, Inc. | | | 46,654 | | | | 1,648,286 | |
Marathon Oil Corp. | | | 51,985 | | | | 1,593,860 | |
Marathon Petroleum Corp. | | | 24,946 | | | | 1,571,598 | |
Murphy Oil Corp. | | | 13,605 | | | | 810,178 | |
Newfield Exploration Co. (a) | | | 9,955 | | | | 266,595 | |
Noble Energy, Inc. | | | 13,111 | | | | 1,333,913 | |
Occidental Petroleum Corp. | | | 59,857 | | | | 4,585,645 | |
Peabody Energy Corp. | | | 19,784 | | | | 526,452 | |
Phillips 66 | | | 46,226 | | | | 2,454,601 | |
Pioneer Natural Resources Co. | | | 9,070 | | | | 966,771 | |
QEP Resources, Inc. | | | 13,111 | | | | 396,870 | |
Range Resources Corp. | | | 11,982 | | | | 752,829 | |
Southwestern Energy Co. (a) | | | 25,676 | | | | 857,835 | |
Spectra Energy Corp. | | | 49,187 | | | | 1,346,740 | |
Tesoro Corp. | | | 10,309 | | | | 454,111 | |
Valero Energy Corp. | | | 40,674 | | | | 1,387,797 | |
Williams Cos., Inc. (The) | | | 49,568 | | | | 1,622,856 | |
WPX Energy, Inc. (a) | | | 14,674 | | | | 218,349 | |
| | | | | | | | |
| | | | | | | 85,872,862 | |
| | | | | | | | |
Paper & Forest Products 0.2% | | | | | | | | |
International Paper Co. | | | 32,246 | | | | 1,284,681 | |
MeadWestvaco Corp. | | | 12,801 | | | | 407,968 | |
| | | | | | | | |
| | | | | | | 1,692,649 | |
| | | | | | | | |
Personal Products 0.2% | | | | | | | | |
Avon Products, Inc. | | | 31,862 | | | | 457,538 | |
Estee Lauder Cos., Inc. (The) Class A | | | 17,897 | | | | 1,071,315 | |
| | | | | | | | |
| | | | | | | 1,528,853 | |
| | | | | | | | |
Pharmaceuticals 4.9% | | | | | | | | |
Allergan, Inc. | | | 22,718 | | | | 2,083,922 | |
Bristol-Myers Squibb Co. | | | 122,034 | | | | 3,977,088 | |
Eli Lilly & Co. | | | 75,301 | | | | 3,713,845 | |
Forest Laboratories, Inc. (a) | | | 17,240 | | | | 608,917 | |
Hospira, Inc. (a) | | | 12,174 | | | | 380,316 | |
¨ Johnson & Johnson | | | 204,741 | | | | 14,352,344 | |
Merck & Co., Inc. | | | 224,576 | | | | 9,194,142 | |
Mylan, Inc. (a) | | | 29,930 | | | | 822,476 | |
Perrigo Co. | | | 6,482 | | | | 674,323 | |
| | | | | | | | |
| | |
Shares | | | Value | |
Pharmaceuticals (continued) | | | | | | | | |
Pfizer, Inc. | | | 543,702 | | | $ | 13,636,046 | |
Watson Pharmaceuticals, Inc. (a) | | | 9,409 | | | | 809,174 | |
| | | | | | | | |
| | | | | | | 50,252,593 | |
| | | | | | | | |
Professional Services 0.1% | | | | | | | | |
Dun & Bradstreet Corp. | | | 3,311 | | | | 260,410 | |
Equifax, Inc. | | | 8,841 | | | | 478,475 | |
Robert Half International, Inc. | | | 10,456 | | | | 332,710 | |
| | | | | | | | |
| | | | | | | 1,071,595 | |
| | | | | | | | |
Real Estate Investment Trusts 2.0% | | | | | |
American Tower Corp. | | | 29,212 | | | | 2,257,211 | |
Apartment Investment & Management Co. Class A | | | 10,729 | | | | 290,327 | |
AvalonBay Communities, Inc. | | | 8,517 | | | | 1,154,820 | |
Boston Properties, Inc. | | | 11,120 | | | | 1,176,607 | |
Equity Residential | | | 23,767 | | | | 1,346,876 | |
HCP, Inc. | | | 33,293 | | | | 1,504,178 | |
Health Care REIT, Inc. | | | 19,308 | | | | 1,183,387 | |
Host Hotels & Resorts, Inc. | | | 53,283 | | | | 834,945 | |
Kimco Realty Corp. | | | 30,011 | | | | 579,812 | |
Plum Creek Timber Co., Inc. | | | 11,909 | | | | 528,402 | |
ProLogis, Inc. | | | 33,971 | | | | 1,239,602 | |
Public Storage | | | 10,626 | | | | 1,540,345 | |
Simon Property Group, Inc. | | | 22,851 | | | | 3,612,515 | |
Ventas, Inc. | | | 21,782 | | | | 1,409,731 | |
Vornado Realty Trust | | | 12,611 | | | | 1,009,889 | |
Weyerhaeuser Co. | | | 40,148 | | | | 1,116,917 | |
| | | | | | | | |
| | | | | | | 20,785,564 | |
| | | | | | | | |
Real Estate Management & Development 0.0%‡ | |
CBRE Group, Inc. (a) | | | 22,269 | | | | 443,153 | |
| | | | | | | | |
| | |
Road & Rail 0.7% | | | | | | | | |
CSX Corp. | | | 76,199 | | | | 1,503,406 | |
Norfolk Southern Corp. | | | 23,346 | | | | 1,443,717 | |
Ryder System, Inc. | | | 3,768 | | | | 188,136 | |
Union Pacific Corp. | | | 34,750 | | | | 4,368,770 | |
| | | | | | | | |
| | | | | | | 7,504,029 | |
| | | | | | | | |
Semiconductors & Semiconductor Equipment 1.8% | |
Advanced Micro Devices, Inc. (a) | | | 44,346 | | | | 106,430 | |
Altera Corp. | | | 23,589 | | | | 812,405 | |
Analog Devices, Inc. | | | 22,267 | | | | 936,550 | |
Applied Materials, Inc. | | | 89,002 | | | | 1,018,183 | |
Broadcom Corp. Class A (a) | | | 38,336 | | | | 1,273,139 | |
First Solar, Inc. (a) | | | 4,424 | | | | 136,613 | |
Intel Corp. | | | 367,622 | | | | 7,584,042 | |
KLA-Tencor Corp. | | | 12,277 | | | | 586,350 | |
Lam Research Corp. (a) | | | 12,634 | | | | 456,466 | |
Linear Technology Corp. | | | 16,982 | | | | 582,483 | |
LSI Corp. (a) | | | 41,116 | | | | 291,101 | |
| | | | | | |
The notes to the financial statements are an integral part of,
and should be read in conjunction with, the financial statements. | | mainstayinvestments.com | | | M-399 | |
Portfolio of Investments December 31, 2012 (continued)
| | | | | | | | |
| | |
Shares | | | Value | |
| Common Stocks (continued) | |
Semiconductors & Semiconductor Equipment (continued) | |
Microchip Technology, Inc. | | | 14,283 | | | $ | 465,483 | |
Micron Technology, Inc. (a) | | | 75,028 | | | | 476,428 | |
NVIDIA Corp. | | | 45,681 | | | | 561,419 | |
Teradyne, Inc. (a) | | | 13,833 | | | | 233,639 | |
Texas Instruments, Inc. | | | 82,799 | | | | 2,561,801 | |
Xilinx, Inc. | | | 19,334 | | | | 694,091 | |
| | | | | | | | |
| | | | | | | 18,776,623 | |
| | | | | | | | |
Software 3.2% | | | | | | | | |
Adobe Systems, Inc. (a) | | | 36,577 | | | | 1,378,221 | |
Autodesk, Inc. (a) | | | 16,731 | | | | 591,441 | |
BMC Software, Inc. (a) | | | 10,528 | | | | 417,540 | |
CA, Inc. | | | 24,772 | | | | 544,489 | |
Citrix Systems, Inc. (a) | | | 13,789 | | | | 906,627 | |
Electronic Arts, Inc. (a) | | | 22,257 | | | | 323,394 | |
Intuit, Inc. | | | 20,561 | | | | 1,223,380 | |
¨Microsoft Corp. | | | 559,584 | | | | 14,957,680 | |
Oracle Corp. | | | 277,754 | | | | 9,254,763 | |
Red Hat, Inc. (a) | | | 14,231 | | | | 753,674 | |
Salesforce.com, Inc. (a) | | | 9,651 | | | | 1,622,333 | |
Symantec Corp. (a) | | | 51,265 | | | | 964,295 | |
| | | | | | | | |
| | | | | | | 32,937,837 | |
| | | | | | | | |
Specialty Retail 2.0% | | | | | | | | |
Abercrombie & Fitch Co. Class A | | | 5,881 | | | | 282,112 | |
AutoNation, Inc. (a) | | | 2,846 | | | | 112,986 | |
AutoZone, Inc. (a) | | | 2,715 | | | | 962,277 | |
Bed Bath & Beyond, Inc. (a) | | | 16,958 | | | | 948,122 | |
Best Buy Co., Inc. | | | 19,614 | | | | 232,426 | |
Carmax, Inc. (a) | | | 16,834 | | | | 631,948 | |
GameStop Corp. Class A | | | 9,099 | | | | 228,294 | |
Gap, Inc. (The) | | | 21,989 | | | | 682,539 | |
Home Depot, Inc. (The) | | | 110,455 | | | | 6,831,642 | |
Limited Brands, Inc. | | | 17,594 | | | | 827,974 | |
Lowe’s Cos., Inc. | | | 83,092 | | | | 2,951,428 | |
O’Reilly Automotive, Inc. (a) | | | 8,388 | | | | 750,055 | |
PetSmart, Inc. | | | 7,978 | | | | 545,216 | |
Ross Stores, Inc. | | | 16,510 | | | | 894,016 | |
Staples, Inc. | | | 50,319 | | | | 573,637 | |
Tiffany & Co. | | | 8,775 | | | | 503,158 | |
TJX Cos., Inc. | | | 53,880 | | | | 2,287,206 | |
Urban Outfitters, Inc. (a) | | | 8,045 | | | | 316,651 | |
| | | | | | | | |
| | | | | | | 20,561,687 | |
| | | | | | | | |
Textiles, Apparel & Luxury Goods 0.6% | | | | | |
Coach, Inc. | | | 21,030 | | | | 1,167,375 | |
Fossil, Inc. (a) | | | 4,041 | | | | 376,217 | |
NIKE, Inc. Class B | | | 53,924 | | | | 2,782,478 | |
| | | | | | | | |
| | |
Shares | | | Value | |
Textiles, Apparel & Luxury Goods (continued) | | | | | |
Ralph Lauren Corp. | | | 4,505 | | | $ | 675,390 | |
VF Corp. | | | 6,482 | | | | 978,588 | |
| | | | | | | | |
| | | | | | | 5,980,048 | |
| | | | | | | | |
Thrifts & Mortgage Finance 0.1% | | | | | |
Hudson City Bancorp, Inc. | | | 35,048 | | | | 284,940 | |
People’s United Financial, Inc. | | | 25,904 | | | | 313,180 | |
| | | | | | | | |
| | | | | | | 598,120 | |
| | | | | | | | |
Tobacco 1.7% | | | | | | | | |
Altria Group, Inc. | | | 149,894 | | | | 4,709,670 | |
Lorillard, Inc. | | | 9,630 | | | | 1,123,532 | |
Philip Morris International, Inc. | | | 123,411 | | | | 10,322,096 | |
Reynolds American, Inc. | | | 23,952 | | | | 992,331 | |
| | | | | | | | |
| | | | | | | 17,147,629 | |
| | | | | | | | |
Trading Companies & Distributors 0.2% | | | | | |
Fastenal Co. | | | 19,872 | | | | 927,824 | |
W.W. Grainger, Inc. | | | 4,417 | | | | 893,868 | |
| | | | | | | | |
| | | | | | | 1,821,692 | |
| | | | | | | | |
Wireless Telecommunication Services 0.3% | | | | | |
Crown Castle International Corp. (a) | | | 21,605 | | | | 1,559,017 | |
MetroPCS Communications, Inc. (a) | | | 23,316 | | | | 231,761 | |
Sprint Nextel Corp. (a) | | | 221,243 | | | | 1,254,448 | |
| | | | | | | | |
| | | | | | | 3,045,226 | |
| | | | | | | | |
Total Common Stocks
(Cost $507,487,632) | | | | | | | 941,293,808 | (b) |
| | | | | | | | |
| | |
| | | | | | | | |
| | | Principal
Amount | | | | |
| Short-Term Investments 7.6% | |
Repurchase Agreement 0.0%‡ | |
State Street Bank and Trust Co.
0.01%, dated 12/31/12
due 1/2/13
Proceeds at Maturity $54,194 (Collateralized by a Federal National Mortgage Association security with a rate of 2.11% and a maturity date of 11/7/22, with a Principal Amount of $60,000 and a Market Value of $60,281 | | $ | 54,194 | | | | 54,194 | |
| | | | | | | | |
Total Repurchase Agreement
(Cost $54,194) | | | | | | | 54,194 | |
| | | | | | | | |
| | | | |
| M-400 | | MainStay VP S&P 500 Index Portfolio | | The notes to the financial statements are an integral part of,
and should be read in conjunction with, the financial statements. |
| | | | | | | | |
| | | Principal
Amount | | | Value | |
| Short-Term Investments (continued) | |
U.S. Government 7.6% | |
United States Treasury Bills | | | | | | | | |
0.059%, due 1/10/13 (c)(d) | | $ | 72,800,000 | | | $ | 72,798,905 | |
0.094%, due 1/24/13 (c)(d) | | | 5,200,000 | | | | 5,199,679 | |
Total U.S. Government
(Cost $77,998,584) | | | | | | | 77,998,584 | |
| | | | | | | | |
Total Short-Term Investments
(Cost $78,052,778) | | | | | | | 78,052,778 | |
| | | | | | | | |
Total Investments
(Cost $585,540,410) (f) | | | 99.8 | % | | | 1,019,346,586 | |
Other Assets, Less Liabilities | | | 0.2 | | | | 1,970,246 | |
Net Assets | | | 100.0 | % | | $ | 1,021,316,832 | |
| | |
| | | | | | | | |
| | | | | | | | |
| | | Contracts
Long | | | Unrealized
Appreciation
(Depreciation)
(e) | |
| Futures Contracts (0.1%) | |
Standard & Poor’s 500 Index
Mini March 2013 | | | 1,115 | | | | $(678,649 | ) |
| | | | | | | | |
Total Futures Contracts
(Settlement Value $79,170,575) (b) | | | | | | | $(678,649 | ) |
| | | | | | | | |
| ‡ | Less than one-tenth of a percent. |
| (a) | Non-income producing security. |
| (b) | The combined market value of common stocks and settlement value of Standard & Poor’s 500 Index futures contracts represents 99.9% of net assets. |
| (c) | Represents a security, or a portion thereof, which is maintained at a broker as collateral for futures contracts. |
| (d) | Interest rate presented is yield to maturity. |
| (e) | Represents the difference between the value of the contracts at the time they were opened and the value as of December 31, 2012. |
| (f) | As of December 31, 2012, cost is $611,080,981 for federal income tax purposes and net unrealized appreciation is as follows: |
| | | | |
Gross unrealized appreciation | | $ | 436,719,083 | |
Gross unrealized depreciation | | | (28,453,478 | ) |
| | | | |
Net unrealized appreciation | | $ | 408,265,605 | |
| | | | |
The following is a summary of the fair valuations according to the inputs used as of December 31, 2012, for valuing the Portfolio’s assets and liabilities.
Asset Valuation Inputs
| | | | | | | | | | | | | | | | |
Description | | Quoted Prices in Active Markets
for Identical Assets (Level 1) | | | Significant Other Observable Inputs (Level 2) | | | Significant
Unobservable
Inputs
(Level 3) | | | Total | |
| Investments in Securities (a) | | | | | | | | | | | | | | | | |
| Common Stocks | | $ | 941,293,808 | | | $ | — | | | $ | — | | | $ | 941,293,808 | |
| | | | | | | | | | | | | | | | |
| Short-Term Investments | | | | | | | | | | | | | | | | |
Repurchase Agreement | | | — | | | | 54,194 | | | | — | | | | 54,194 | |
U.S. Government | | | — | | | | 77,998,584 | | | | — | | | | 77,998,584 | |
| | | | | | | | | | | | | | | | |
| Total Short-Term Investments | | | — | | | | 78,052,778 | | | | — | | | | 78,052,778 | |
| | | | | | | | | | | | | | | | |
| Total Investments in Securities | | $ | 941,293,808 | | | $ | 78,052,778 | | | $ | — | | | $ | 1,019,346,586 | |
| | | | | | | | | | | | | | | | |
Liability Valuation Inputs
| | | | | | | | | | | | | | | | |
Description | | Quoted Prices
in Active Markets
for Identical Assets
(Level 1) | | | Significant Other
Observable Inputs
(Level 2) | | | Significant
Unobservable
Inputs
(Level 3) | | | Total | |
| Other Financial Instruments | | | | | | | | | | | | | | | | |
Futures Contracts Long (b) | | $ | (678,649 | ) | | $ | — | | | $ | — | | | $ | (678,649 | ) |
| | | | | | | | | | | | | | | | |
| Total Other Financial Instruments | | $ | (678,649 | ) | | $ | — | | | $ | — | | | $ | (678,649 | ) |
| | | | | | | | | | | | | | | | |
| (a) | For a complete listing of investments and their industries, see the Portfolio of Investments. |
| (b) | The value listed for these securities reflects unrealized appreciation (depreciation) as shown on the Portfolio of Investments. |
| | | | | | |
The notes to the financial statements are an integral part of,
and should be read in conjunction with, the financial statements. | | mainstayinvestments.com | | | M-401 | |
Portfolio of Investments December 31, 2012 (continued)
The Portfolio recognizes transfers between the levels as of the beginning of the period.
For the year ended December 31, 2012, the Portfolio did not have any transfers between Level 1 and Level 2 fair value measurements. (See Note 2)
As of December 31, 2012, the Portfolio did not hold any investments with significant unobservable inputs (Level 3). (See Note 2)
The following is a reconciliation of investments in which significant unobservable inputs (Level 3) were used in determining value:
| | | | | | | | | | | | | | | | | | | | | | | | | | | | | | | | | | | | | | | | |
Investments in
Securities | | Balance as of
December 31, 2011 | | | Accrued Discounts (Premiums) | | | Realized Gain (Loss) | | | Change in
Unrealized
Appreciation
(Depreciation) | | | Purchases | | | Sales | | | Transfers
in to
Level 3 | | | Transfers
out of
Level 3 | | | Balance as of
December 31,
2012 | | | Change in Unrealized Appreciation (Depreciation) from Investments Still Held at December 31, 2012 | |
| Common Stocks | | | | | | | | | | | | | | | | | | | | | | | | | | | | | | | | | | | | | | | | |
Specialty Retail | | $ | 21 | | | $ | — | | | $ | (5,969 | ) | | $ | 9,171 | | | $ | — | | | $ | (3,223 | ) | | $ | — | | | $ | — | | | $ | — | | | $ | — | |
Convertible Preferred Stocks | | | | | | | | | | | | | | | | | | | | | | | | | | | | | | | | | | | | | | | | |
Specialty Retail | | | 21 | | | | — | | | | (222 | ) | | | 259 | | | | | | | | (58 | ) | | | — | | | | — | | | | — | | | $ | — | |
| | | | | | | | | | | | | | | | | | | | | | | | | | | | | | | | | | | | | | | | |
| Total | | $ | 42 | | | $ | — | | | $ | (6,191 | ) | | $ | 9,430 | | | $ | — | | | $ | (3,281 | ) | | $ | — | | | $ | — | | | $ | — | | | $ | — | |
| | | | | | | | | | | | | | | | | | | | | | | | | | | | | | | | | | | | | | | | |
| | | | |
| M-402 | | MainStay VP S&P 500 Index Portfolio | | The notes to the financial statements are an integral part of,
and should be read in conjunction with, the financial statements. |
Statement of Assets and Liabilities as of December 31, 2012
| | | | |
| Assets | | | | |
Investment in securities, at value
(identified cost $585,540,410) | | $ | 1,019,346,586 | |
Receivables: | | | | |
Variation margin on futures contracts | | | 2,025,619 | |
Dividends and interest | | | 1,038,169 | |
Fund shares sold | | | 192,443 | |
| | | | |
Total assets | | | 1,022,602,817 | |
| | | | |
| |
| Liabilities | | | | |
Due to custodian | | | 13,044 | |
Payables: | | | | |
Investment securities purchased | | | 467,942 | |
Fund shares redeemed | | | 387,741 | |
Manager (See Note 3) | | | 215,790 | |
Shareholder communication | | | 79,592 | |
NYLIFE Distributors (See Note 3) | | | 52,520 | |
Professional fees | | | 38,469 | |
Custodian | | | 8,100 | |
Trustees | | | 1,466 | |
Accrued expenses | | | 21,321 | |
| | | | |
Total liabilities | | | 1,285,985 | |
| | | | |
Net assets | | $ | 1,021,316,832 | |
| | | | |
| |
| Net Assets Consist of | | | | |
Shares of beneficial interest outstanding (par value of $.001 per share) unlimited number of shares authorized | | $ | 35,329 | |
Additional paid-in capital | | | 664,731,537 | |
| | | | |
| | | 664,766,866 | |
Undistributed net investment income | | | 18,075,303 | |
Accumulated net realized gain (loss) on investments, futures transactions and foreign currency transactions | | | (94,652,864 | ) |
Net unrealized appreciation (depreciation) on investments and futures contracts | | | 433,127,527 | |
| | | | |
Net assets | | $ | 1,021,316,832 | |
| | | | |
| | | | |
Initial Class | | | | |
Net assets applicable to outstanding shares | | $ | 773,232,995 | |
| | | | |
Shares of beneficial interest outstanding | | | 26,725,895 | |
| | | | |
Net asset value per share outstanding | | $ | 28.93 | |
| | | | |
Service Class | | | | |
Net assets applicable to outstanding shares | | $ | 248,083,837 | |
| | | | |
Shares of beneficial interest outstanding | | | 8,603,269 | |
| | | | |
Net asset value per share outstanding | | $ | 28.84 | |
| | | | |
| | | | | | |
The notes to the financial statements are an integral part of,
and should be read in conjunction with, the financial statements. | | mainstayinvestments.com | | | M-403 | |
Statement of Operations for the year ended December 31, 2012
| | | | |
| Investment Income (Loss) | | | | |
Income | | | | |
Dividends (a) | | $ | 21,676,756 | |
Interest | | | 39,923 | |
| | | | |
Total income | | | 21,716,679 | |
| | | | |
Expenses | | | | |
Manager (See Note 3) | | | 2,938,668 | |
Distribution and service—Service Class (See Note 3) | | | 608,340 | |
Shareholder communication | | | 164,039 | |
Professional fees | | | 75,976 | |
Custodian | | | 41,949 | |
Trustees | | | 26,082 | |
Miscellaneous | | | 42,640 | |
| | | | |
Total expenses before waiver/reimbursement | | | 3,897,694 | |
Expense waiver/reimbursement from Manager (See Note 3) | | | (489,968 | ) |
| | | | |
Net expenses | | | 3,407,726 | |
| | | | |
Net investment income (loss) | | | 18,308,953 | |
| | | | |
|
| Realized and Unrealized Gain (Loss) on Investments, Futures Contracts and Foreign Currency Transactions | |
Net realized gain (loss) on: | | | | |
Security transactions | | | 13,676,400 | |
Futures transactions | | | 8,740,509 | |
Foreign currency transactions | | | (10,413 | ) |
| | | | |
Net realized gain (loss) on investments, futures transactions and foreign currency transactions | | | 22,406,496 | |
| | | | |
Net change in unrealized appreciation (depreciation) on: | | | | |
Investments | | | 99,828,395 | |
Futures contracts | | | (1,064,374 | ) |
| | | | |
Net change in unrealized appreciation (depreciation) on investments and futures contracts | | | 98,764,021 | |
| | | | |
Net realized and unrealized gain (loss) on investments, futures transactions and foreign currency transactions | | | 121,170,517 | |
| | | | |
Net increase (decrease) in net assets resulting from operations | | $ | 139,479,470 | |
| | | | |
| (a) | Dividends recorded net of foreign withholding taxes in the amount of $11,477. |
| | | | |
| M-404 | | MainStay VP S&P 500 Index Portfolio | | The notes to the financial statements are an integral part of,
and should be read in conjunction with, the financial statements. |
Statements of Changes in Net Assets
for the years ended December 31, 2012 and December 31, 2011
| | | | | | | | |
| | | 2012 | | | 2011 | |
| Increase (Decrease) in Net Assets | | | | | |
Operations: | | | | | | | | |
Net investment income (loss) | | $ | 18,308,953 | | | $ | 15,598,215 | |
Net realized gain (loss) on investments, futures transactions and foreign currency transactions | | | 22,406,496 | | | | 16,160,462 | |
Net change in unrealized appreciation (depreciation) on investments and futures contracts | | | 98,764,021 | | | | (14,243,163 | ) |
| | | | |
Net increase (decrease) in net assets resulting from operations | | | 139,479,470 | | | | 17,515,514 | |
| | | | |
Dividends to shareholders: | | | | | | | | |
From net investment income: | | | | | | | | |
Initial Class | | | (11,913,117 | ) | | | (11,366,034 | ) |
Service Class | | | (3,494,658 | ) | | | (3,431,463 | ) |
| | | | |
Total dividends to shareholders | | | (15,407,775 | ) | | | (14,797,497 | ) |
| | | | |
Capital share transactions: | | | | | | | | |
Net proceeds from sale of shares | | | 265,116,333 | | | | 30,643,617 | |
Net asset value of shares issued to shareholders in reinvestment of dividends | | | 15,407,775 | | | | 14,797,497 | |
Cost of shares redeemed | | | (254,221,769 | ) | | | (139,430,511 | ) |
| | | | |
Increase (decrease) in net assets derived from capital share transactions | | | 26,302,339 | | | | (93,989,397 | ) |
| | | | |
Net increase (decrease) in net assets | | | 150,374,034 | | | | (91,271,380 | ) |
| | |
| Net Assets | | | | | | | | |
Beginning of year | | | 870,942,798 | | | | 962,214,178 | |
| | | | |
End of year | | $ | 1,021,316,832 | | | $ | 870,942,798 | |
| | | | |
Undistributed net investment income at end of year | | $ | 18,075,303 | | | $ | 15,596,644 | |
| | | | |
| | | | | | |
The notes to the financial statements are an integral part of,
and should be read in conjunction with, the financial statements. | | mainstayinvestments.com | | | M-405 | |
Financial Highlights selected per share data and ratios
| | | | | | | | | | | | | | | | | | | | |
| | | Initial Class | |
| | | Year ended December 31, | |
| | | 2012 | | | 2011 | | | 2010 | | | 2009 | | | 2008 | |
Net asset value at beginning of year | | $ | 25.42 | | | $ | 25.45 | | | $ | 22.58 | | | $ | 18.35 | | | $ | 30.05 | |
| | | | | | | | | | | | | | | | | | | | |
Net investment income (loss) | | | 0.54 | | | | 0.45 | (a) | | | 0.40 | (a) | | | 0.39 | (a) | | | 0.51 | (a) |
Net realized and unrealized gain (loss) on investments | | | 3.45 | | | | (0.03 | ) | | | 2.90 | | | | 4.40 | | | | (11.61 | ) |
| | | �� | | | | | | | | | | | | | | | | | |
Total from investment operations | | | 3.99 | | | | 0.42 | | | | 3.30 | | | | 4.79 | | | | (11.10 | ) |
| | | | | | | | | | | | | | | | | | | | |
Less dividends: | | | | | | | | | | | | | | | | | | | | |
From net investment income | | | (0.48 | ) | | | (0.45 | ) | | | (0.43 | ) | | | (0.56 | ) | | | (0.60 | ) |
| | | | | | | | | | | | | | | | | | | | |
Net asset value at end of year | | $ | 28.93 | | | $ | 25.42 | | | $ | 25.45 | | | $ | 22.58 | | | $ | 18.35 | |
| | | | | | | | | | | | | | | | | | | | |
Total investment return | | | 15.66 | % | | | 1.85 | % | | | 14.73 | % | | | 26.26 | % | | | (37.01 | %) |
Ratios (to average net assets)/Supplemental Data: | | | | | | | | | | | | | | | | | | | | |
Net investment income (loss) | | | 1.93 | % | | | 1.75 | % | | | 1.71 | % | | | 1.99 | % | | | 2.04 | % |
Net expenses | | | 0.29 | % | | | 0.29 | % | | | 0.30 | % | | | 0.30 | % | | | 0.30 | % |
Expenses (before waiver/reimbursement) | | | 0.34 | % | | | 0.34 | % | | | 0.35 | % | | | 0.35 | % | | | 0.35 | % |
Portfolio turnover rate | | | 10 | % | | | 4 | % | | | 4 | % | | | 15 | % | | | 5 | % |
Net assets at end of year (in 000’s) | | $ | 773,233 | | | $ | 644,141 | | | $ | 719,103 | | | $ | 709,736 | | | $ | 630,244 | |
| (a) | Per share data based on average shares outstanding during the year. |
| | | | | | | | | | | | | | | | | | | | |
| | | Service Class | |
| | | Year ended December 31, | |
| | | 2012 | | | 2011 | | | 2010 | | | 2009 | | | 2008 | |
Net asset value at beginning of year | | $ | 25.34 | | | $ | 25.36 | | | $ | 22.52 | | | $ | 18.30 | | | $ | 29.91 | |
| | | | | | | | | | | | | | | | | | | | |
Net investment income (loss) | | | 0.47 | | | | 0.39 | (a) | | | 0.34 | (a) | | | 0.34 | (a) | | | 0.45 | (a) |
Net realized and unrealized gain (loss) on investments | | | 3.44 | | | | (0.03 | ) | | | 2.88 | | | | 4.38 | | | | (11.54 | ) |
| | | | | | | | | | | | | | | | | | | | |
Total from investment operations | | | 3.91 | | | | 0.36 | | | | 3.22 | | | | 4.72 | | | | (11.09 | ) |
| | | | | | | | | | | | | | | | | | | | |
Less dividends: | | | | | | | | | | | | | | | | | | | | |
From net investment income | | | (0.41 | ) | | | (0.38 | ) | | | (0.38 | ) | | | (0.50 | ) | | | (0.52 | ) |
| | | | | | | | | | | | | | | | | | | | |
Net asset value at end of year | | $ | 28.84 | | | $ | 25.34 | | | $ | 25.36 | | | $ | 22.52 | | | $ | 18.30 | |
| | | | | | | | | | | | | | | | | | | | |
Total investment return | | | 15.37 | % | | | 1.59 | % | | | 14.44 | % | | | 25.95 | % | | | (37.17 | %) |
Ratios (to average net assets)/Supplemental Data: | | | | | | | | | | | | | | | | | | | | |
Net investment income (loss) | | | 1.67 | % | | | 1.50 | % | | | 1.46 | % | | | 1.74 | % | | | 1.79 | % |
Net expenses | | | 0.54 | % | | | 0.54 | % | | | 0.55 | % | | | 0.55 | % | | | 0.55 | % |
Expenses (before waiver/reimbursement) | | | 0.59 | % | | | 0.59 | % | | | 0.60 | % | | | 0.60 | % | | | 0.60 | % |
Portfolio turnover rate | | | 10 | % | | | 4 | % | | | 4 | % | | | 15 | % | | | 5 | % |
Net assets at end of year (in 000’s) | | $ | 248,084 | | | $ | 226,802 | | | $ | 243,111 | | | $ | 220,788 | | | $ | 179,715 | |
| (a) | Per share data based on average shares outstanding during the year. |
| | | | |
| M-406 | | MainStay VP S&P 500 Index Portfolio | | The notes to the financial statements are an integral part of,
and should be read in conjunction with, the financial statements. |
MainStay VP T. Rowe Price Equity Income Portfolio
Investment and Performance Comparison1 (Unaudited)
Performance data quoted represents past performance. Past performance is no guarantee of future results. Because of market volatility, current performance may be lower or higher than the figures shown. Investment return and principal value will fluctuate, and as a result, when shares are redeemed, they may be worth more or less than their original cost. The performance table and graph do not reflect any deduction of sales charges, mortality and expense charges, contract charges or administrative charges. Please refer to the Performance Summary appropriate for your policy. For performance information current to the most recent month-end, please call 800-598-2019 or visit www.newyorklife.com.
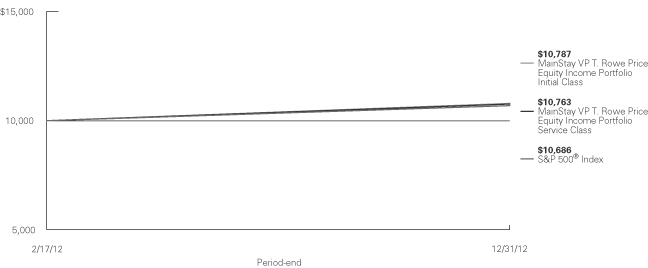
Total Returns for the Period Ended December 31, 2012
| | | | | | | | |
| Class | | Since Inception (2/17/12) | | | Gross Expense Ratio2 | |
| Initial Class Shares | | | 7.87 | % | | | 0.85 | % |
| Service Class Shares | | | 7.63 | | | | 1.10 | |
| | | | |
| Benchmark Performance | | Since Inception
(2/17/12) | |
S&P 500® Index3 | | | 6.86 | % |
Average Lipper Variable Products Equity Income Portfolio4 | | | 7.75 | |
| 1. | Performance figures reflect certain fee waivers and/or expense limitations, without which total returns may have been different. For information on current fee waivers and/or expense limitations, please refer to the notes to the financial statements. |
| 2. | The gross expense ratios presented reflect the Portfolio’s “Total Annual Portfolio Operating Expenses” from the most recent Prospectus and may differ from other expense ratios disclosed in this report. |
| 3. | Please refer to pages M-2 and M-3 for additional explanations and disclosure regarding the Portfolios, their benchmark indices and other indices mentioned in the reports. |
| 4. | The Average Lipper Variable Products Equity Income Portfolio is representative of portfolios that, by portfolio practice, seek relatively high current income and growth of income through investing 65% or more of their portfolio in equities. Lipper Inc. is an independent monitor of fund performance. Results are based on total returns with all dividend and capital gain distributions reinvested. |
| | | | |
| mainstayinvestments.com | | | M-407 | |
Cost in Dollars of a $1,000 Investment in MainStay VP T. Rowe Price Equity Income Portfolio (Unaudited)
The example below is intended to describe the fees and expenses borne by shareholders during the period from July 1, 2012, to December 31, 2012, and the impact of those costs on your investment.
Example
As a shareholder of the Portfolio, you incur two types of costs: (1) transaction costs, including exchange fees and sales charges (loads) on purchases (as applicable), and (2) ongoing costs, including management fees, distribution and/or service (12b-1) fees, and other Portfolio expenses (as applicable). This example is intended to help you understand your ongoing costs (in dollars) of investing in the Portfolio and to compare these costs with the ongoing costs of investing in other Portfolios. The example is based on an investment of $1,000 made at the beginning of the period and held for the entire period from July 1, 2012, to December 31, 2012. Shares are only sold in connection with variable life and annuity contracts and the example does not reflect any contract level or transactional fees or expenses. If these costs had been included, your costs would have been higher.
This example illustrates your Portfolio’s ongoing costs in two ways:
Actual Expenses
The second and third data columns in the table below provide information about actual account values and actual expenses. You may use the information in these columns, together with the amount you invested, to estimate the expenses that you paid during the six months ended
December 31, 2012. Simply divide your account value by $1,000 (for example, an $8,600 account value divided by $1,000 = 8.6), then multiply the result by the number under the heading entitled ‘‘Expenses Paid During Period’’ to estimate the expenses you paid on your account during this period.
Hypothetical Example for Comparison Purposes
The fourth and fifth data columns in the table below provide information about hypothetical account values and hypothetical expenses based on the Portfolio’s actual expense ratio and an assumed rate of return of 5% per year before expenses, which is not the Portfolio’s actual return. The hypothetical account values and expenses may not be used to estimate the actual ending account balances or expenses you paid for the six-month period shown. You may use this information to compare the ongoing costs of investing in the Portfolio with the ongoing costs of investing in other Portfolios. To do so, compare this 5% hypothetical example with the 5% hypothetical examples that appear in the shareholder reports of the other Portfolios.
Please note that the expenses shown in the table are meant to highlight your ongoing costs only and do not reflect any transactional costs, such as exchange fees or sales charges (loads). Therefore, the fourth and fifth data columns of the table are useful in comparing ongoing costs only and will not help you determine the relative total costs of owning different funds. In addition, if these transactional costs were included, your costs would have been higher.
| | | | | | | | | | | | | | | | | | | | |
| | | | | | | | | | | | | | | | |
| Share Class | | Beginning
Account
Value
7/1/12 | | | Ending Account
Value (Based
on Actual
Returns and
Expenses)
12/31/12 | | | Expenses
Paid
During
Period1 | | | Ending Account
Value (Based
on Hypothetical
5% Annualized
Return and
Actual Expenses)
12/31/12 | | | Expenses
Paid
During
Period1 | |
| | | | | |
| Initial Class Shares | | $ | 1,000.00 | | | $ | 1,084.10 | | | $ | 4.14 | | | $ | 1,021.20 | | | $ | 4.01 | |
| | | | | |
| Service Class Shares | | $ | 1,000.00 | | | $ | 1,082.70 | | | $ | 5.44 | | | $ | 1,019.90 | | | $ | 5.28 | |
| 1. | Expenses are equal to the Portfolio’s annualized expense ratio of each class (0.79% for Initial Class and 1.04% for Service Class) multiplied by the average account value over the period, divided by 366 and multiplied by 184 (to reflect the six-month period). The table above represents the actual expenses incurred during the six-month period. |
| | |
| M-408 | | MainStay VP T. Rowe Price Equity Income Portfolio |
Industry Composition as of December 31, 2012 (Unaudited)
| | | | |
| Oil, Gas & Consumable Fuels | | | 12.3 | % |
| Commercial Banks | | | 5.7 | |
| Media | | | 5.1 | |
| Insurance | | | 4.6 | |
| Pharmaceuticals | | | 4.5 | |
| Electric Utilities | | | 4.2 | |
| Industrial Conglomerates | | | 4.0 | |
| Diversified Financial Services | | | 3.9 | |
| Diversified Telecommunication Services | | | 3.5 | |
| Consumer Finance | | | 2.9 | |
| Food Products | | | 2.6 | |
| Aerospace & Defense | | | 2.5 | |
| Capital Markets | | | 2.3 | |
| Machinery | | | 2.1 | |
| Semiconductors & Semiconductor Equipment | | | 2.1 | |
| Communications Equipment | | | 2.0 | |
| Paper & Forest Products | | | 1.9 | |
| Energy Equipment & Services | | | 1.7 | |
| Life Sciences Tools & Services | | | 1.7 | |
| Electrical Equipment | | | 1.6 | |
| Household Products | | | 1.6 | |
| Metals & Mining | | | 1.6 | |
| Multiline Retail | | | 1.5 | |
| Leisure Equipment & Products | | | 1.4 | |
| Software | | | 1.4 | |
| Multi-Utilities | | | 1.2 | |
| | | | |
| Automobiles | | | 1.1 | % |
| Air Freight & Logistics | | | 1.0 | |
| Computers & Peripherals | | | 1.0 | |
| Road & Rail | | | 1.0 | |
| IT Services | | | 0.9 | |
| Beverages | | | 0.8 | |
| Building Products | | | 0.8 | |
| Construction Materials | | | 0.8 | |
| Airlines | | | 0.7 | |
| Electronic Equipment & Instruments | | | 0.7 | |
| Household Durables | | | 0.7 | |
| Real Estate Investment Trusts | | | 0.7 | |
| Specialty Retail | | | 0.7 | |
| Personal Products | | | 0.6 | |
| Auto Components | | | 0.5 | |
| Biotechnology | | | 0.5 | |
| Chemicals | | | 0.5 | |
| Distributors | | | 0.5 | |
| Health Care Providers & Services | | | 0.5 | |
| Hotels, Restaurants & Leisure | | | 0.5 | |
| Commercial Services & Supplies | | | 0.3 | |
| Independent Power Producers & Energy Traders | | | 0.3 | |
| Wireless Telecommunication Services | | | 0.3 | |
| Short-Term Investment | | | 4.7 | |
| Other Assets, Less Liabilities | | | 0.0 | ‡ |
| | | | |
| | | 100.0 | % |
| | | | |
See Portfolio of Investments beginning on page M-413 for specific holdings within these categories.
| ‡ | Less than one-tenth of a percent. |
Top Ten Holdings as of December 31, 2012 (excluding short-term investment) (Unaudited)
| 7. | Royal Dutch Shell PLC, ADR |
| 10. | International Paper Co. |
| | | | |
| mainstayinvestments.com | | | M-409 | |
Portfolio Management Discussion and Analysis (Unaudited)
Answers to the questions reflect the views of portfolio manager Brian C. Rogers of T. Rowe Price Associates, Inc. (“T. Rowe”), the Portfolio’s Subadvisor
How did MainStay VP T. Rowe Price Equity Income Portfolio perform relative to its peers and its benchmark during the reporting period?
The inception date for MainStay VP T. Rowe Price Equity Income Portfolio was February 17, 2012. From February 17 through December 31, 2012, MainStay VP T. Rowe Price Equity Income Portfolio returned 7.87% for Initial Class shares and 7.63% for Service Class shares. Over the same period, Initial Class shares outperformed—and Service Class shares underperformed—the 7.75% return of the average Lipper1 Variable Products Equity Income Portfolio. Both share classes outperformed the 6.86% return of the S&P 500® Index1 from February 17 through December 31, 2012. The S&P 500® Index is the Portfolio’s broad-based securities-market index.
What factors affected the Portfolio’s relative performance during the reporting period?
According to Russell data, value stocks outperformed growth stocks at all capitalization levels from February 17 through December 31. Since the Portfolio is typically managed with value approach, its orientation had a positive influence on returns in relation to the S&P 500® Index, which includes both growth and value stocks. Positive stock selection and sector weighting also helped the Portfolio’s relative returns.
Which sectors were the strongest positive contributors to the Portfolio’s relative performance, and which sectors were particularly weak?
The industrials sector was the strongest positive contributor to the Portfolio’s returns relative to the S&P 500® Index during the reporting period because of stock selection. (Contributions take weightings and total returns into account.) The combination of an overweight position and stock selection in the financials sector also made a positive contribution to relative results. As the housing market improved, financials provided a strong positive contribution to results in the S&P 500® Index. Investors were encouraged by cost cutting by large banks and their plans to return capital to investors in 2013. Stock selection and an overweight position in the consumer discretionary sector also supported relative results.
Stock selection in the utilities sector detracted from relative performance. Low natural gas prices more than offset improvements in the supply-and-demand balance for power. This resulted in lower power prices
and reduced earnings potential for coal and nuclear power producers. An overweight position in the energy sector also detracted from relative returns as falling oil prices weighed on many energy companies. During the reporting period, the energy sector posted the most significantly negative absolute returns in the S&P 500® Index. Although telecommunication services was the best-performing sector in the S&P 500® Index during the reporting period, stock selection detracted from the Portfolio’s relative performance. Fortunately, an overweight position in the sector helped offset some of the negative impact of stock selection.
During the reporting period, which individual stocks made the strongest positive contributions to the absolute performance of the Portfolio and which individual stocks detracted the most?
During the reporting period, the three strongest positive individual contributions to the Portfolio’s absolute performance came from diversified financial services company Bank of America, household appliance company Whirlpool and media company Time Warner.
Bank of America benefited from improving credit and had significantly reduced its long-term debt and interest expense. While the interest-rate environment may remain challenging, we believed that Bank of America was poised to benefit from its cost-cutting and an improving housing market in 2013.
Whirlpool saw its shares rise during the second half of 2012, as the company reported improving North American margins driven by price increases. In our view, the company was well positioned for a housing recovery and had attractive international exposure.
During the reporting period, Time Warner reaffirmed its 2012 guidance and provided an updated outlook for 2013, including promising affiliate renewal agreements at its U.S. cable networks, which drove the company’s shares higher.
Two of the Portfolio’s most substantial detractors from absolute performance were electric utilities Exelon and Entergy. Both suffered as low natural gas prices more than offset improvements in the supply-and-demand balance for power. These dynamics resulted in lower power prices and lower earnings potential for coal and nuclear power producers. During the fourth quarter, Exelon also announced that it may lower its dividend unless power prices increase.
| 1. | Please refer to pages M-2 and M-3 for additional explanations and disclosure regarding the Portfolios, their benchmark indices and service providers mentioned in the reports. |
| | |
| M-410 | | MainStay VP T. Rowe Price Equity Income Portfolio |
PC maker Hewlett-Packard also detracted from the Portfolio’s absolute performance. The company has been challenged by disappointing earnings across multiple business lines. We reduced the Portfolio’s position during the reporting period to fund other ideas that we believe have more compelling risk/return profiles. Nevertheless, we were encouraged by management’s announcement of a major restructuring and a potential uptick in PC sales.
Shares of Microsoft struggled after the software company announced weaker-than-expected results driven by declining PC sales and softness in Europe. However, we believed that Microsoft might soon benefit from improved revenue and earnings growth resulting from the release of Windows 8, as well as upgrades to Windows server and Office software.
Were there other stocks in the Portfolio that were particularly noteworthy during the reporting period?
Diversified financial services company JPMorgan Chase was one of the most substantial contributors to the Portfolio’s relative and absolute results during the reporting period. The company has largely recovered from a 2012 episode in which its London office generated major trading losses. We continued to believe that JPMorgan Chase had a strong balance sheet, a good management team and significant earnings power.
Did the Portfolio make any significant purchases or sales during the reporting period?
Because the Portfolio was building initial positions between February 17 and the end of that month, we have focused on significant positions established or sold after February 28, 2012. Among these were railroad company Norfolk Southern and oil & gas companies Hess and Apache.
Weakness in coal volumes created earnings pressure for Norfolk Southern. We believed that the company had the pricing structure to benefit when volumes normalize. Norfolk Southern maintained a strong balance sheet and had been repurchasing shares.
Hess experienced setbacks in its exploration pipe- line, which caused the stock to trade at a discount to Hess’s peers. Concerns about capital expenditures also weighed on the company’s shares. However, Hess had several attractive development projects, particularly in the Bakken shale region, which could support higher volumes as execution improves.
Commodities pressures weighed on shares of Apache, bringing the valuation to attractive levels. Geopolitical uncertainty in the Middle East also provided headwinds, but we believed that Apache was a high-quality company with diverse global operations, expanding production and drilling inventory, and ample room to grow margins.
Cooper Industries’ shares rose throughout the reporting period after diversified power management company Eaton announced that it would acquire Cooper Industries at a premium. The Portfolio eliminated its position when the deal closed in the fourth quarter.
Personal care products maker Kimberly-Clark experienced strong performance driven by organic sales growth trends largely attributed to the company’s emerging-markets exposure. We eliminated the Portfolio’s position on strength as we sought to reduce exposure to potential commodity headwinds that the company may face.
The seed business at agricultural products company Monsanto has achieved high penetration in the United States and abroad. Since the company may face regulatory delays and slower farm spending, we sold the Portfolio’s position on strength.
How did sector weightings change in the Portfolio during the reporting period?
The Portfolio uses a diversified, bottom-up investment strategy with a long-term focus that has historically resulted in relatively low turnover in relation to peers. Changes to the Portfolio’s sector positioning are the result of our bottom-up stock selection process and fundamental analysis at the individual company level. Positioning changes do not result from a broad sector viewpoint.
Sector weightings varied widely during the initial ramp-up period. By the end of March, however, the basic structure of the Portfolio was relatively well established. We continued to add to the Portfolio’s energy and industrials holdings, however, because certain stocks with cyclical headwinds had valuations that we viewed as compelling.
By the end of the reporting period industrials had overtaken financials as the most substantially overweight sector relative to the S&P 500® Index. Although we added to the Portfolio’s information technology and health care positions, by the end of the reporting period, these sectors—as well as consumer staples—remained underweight relative to the Index.
| | | | |
| mainstayinvestments.com | | | M-411 | |
How was the Portfolio positioned at the end of the reporting period?
As of December 31, 2012, the Portfolio sectors that were most substantially overweight relative to the S&P 500® Index were industrials and financials. In industrials, our largest exposures were in the industrial conglomerates and aerospace & defense industries. In financials, the Portfolio held significant positions in commercial banks, insurance and diversified financial services. We believed that these industries might benefit from an improving U.S. economy and a firming housing market.
As of December 31, 2012, the Portfolio was most substantially underweight in the information technology and consumer staples sectors. In information technology, our largest exposures were to the semiconductors & semiconductor equipment industry and the software industry. In consumer staples, we typically focus on companies with strong brands that are trading at attractive valuations relative to their history. We also liked the stable earnings and dividend yields that consumer staples stocks tend to provide. At the end of the reporting period, however, we remained underweight in the sector because we believed that other sectors offered more attractive opportunities.
The opinions expressed are those of the portfolio manager as of the date of this report and are subject to change. There is no guarantee that any forecasts made will come to pass. This material does not constitute investment advice and is not intended as an endorsement of any specific investment.
Not all MainStay VP Portfolios and/or share classes are available under all policies.
| | |
| M-412 | | MainStay VP T. Rowe Price Equity Income Portfolio |
Portfolio of Investments December 31, 2012
| | | | | | | | |
| | |
Shares | | | Value | |
| | | | | | | | |
| Common Stocks 94.7%† | |
Aerospace & Defense 2.5% | |
Boeing Co. (The) | | | 67,800 | | | $ | 5,109,408 | |
Honeywell International, Inc. | | | 105,500 | | | | 6,696,085 | |
Lockheed Martin Corp. | | | 29,800 | | | | 2,750,242 | |
United Technologies Corp. | | | 12,600 | | | | 1,033,326 | |
| | | | | | | | |
| | | | | | | 15,589,061 | |
| | | | | | | | |
Air Freight & Logistics 1.0% | |
United Parcel Service, Inc. Class B | | | 79,200 | | | | 5,839,416 | |
| | | | | | | | |
|
Airlines 0.7% | |
United Continental Holdings, Inc. (a) | | | 190,000 | | | | 4,442,200 | |
| | | | | | | | |
|
Auto Components 0.5% | |
Johnson Controls, Inc. | | | 107,600 | | | | 3,303,320 | |
| | | | | | | | |
|
Automobiles 0.5% | |
Ford Motor Co. | | | 253,300 | | | | 3,280,235 | |
| | | | | | | | |
|
Beverages 0.8% | |
PepsiCo., Inc. | | | 75,900 | | | | 5,193,837 | |
| | | | | | | | |
|
Biotechnology 0.5% | |
Amgen, Inc. | | | 33,000 | | | | 2,848,560 | |
| | | | | | | | |
|
Building Products 0.8% | |
Masco Corp. | | | 183,000 | | | | 3,048,780 | |
USG Corp. (a) | | | 73,200 | | | | 2,054,724 | |
| | | | | | | | |
| | | | | | | 5,103,504 | |
| | | | | | | | |
Capital Markets 2.3% | |
Bank of New York Mellon Corp. (The) | | | 148,200 | | | | 3,808,740 | |
Legg Mason, Inc. | | | 157,700 | | | | 4,056,044 | |
Northern Trust Corp. | | | 114,000 | | | | 5,718,240 | |
Och-Ziff Capital Management Group LLC Class A | | | 65,500 | | | | 622,250 | |
| | | | | | | | |
| | | | | | | 14,205,274 | |
| | | | | | | | |
Chemicals 0.5% | |
E.I. du Pont de Nemours & Co. | | | 66,800 | | | | 3,003,996 | |
| | | | | | | | |
|
Commercial Banks 5.7% | |
PNC Financial Services Group, Inc. | | | 107,400 | | | | 6,262,494 | |
Regions Financial Corp. | | | 278,900 | | | | 1,985,768 | |
SunTrust Banks, Inc. | | | 192,900 | | | | 5,468,715 | |
¨U.S. Bancorp | | | 310,100 | | | | 9,904,594 | |
¨Wells Fargo & Co. | | | 337,400 | | | | 11,532,332 | |
| | | | | | | | |
| | | | | | | 35,153,903 | |
| | | | | | | | |
| | | | | | | | |
| | |
Shares | | | Value | |
| | | | | | | | |
Commercial Services & Supplies 0.3% | |
Avery Dennison Corp. | | | 46,200 | | | $ | 1,613,304 | |
| | | | | | | | |
|
Communications Equipment 2.0% | |
Cisco Systems, Inc. | | | 261,200 | | | | 5,132,580 | |
Harris Corp. | | | 116,300 | | | | 5,694,048 | |
Nokia Oyj, Sponsored ADR (b) | | | 371,000 | | | | 1,465,450 | |
| | | | | | | | |
| | | | | | | 12,292,078 | |
| | | | | | | | |
Computers & Peripherals 1.0% | |
Dell, Inc. | | | 418,100 | | | | 4,235,353 | |
Hewlett-Packard Co. | | | 150,100 | | | | 2,138,925 | |
| | | | | | | | |
| | | | | | | 6,374,278 | |
| | | | | | | | |
Construction Materials 0.8% | |
Vulcan Materials Co. | | | 92,300 | | | | 4,804,215 | |
| | | | | | | | |
|
Consumer Finance 2.9% | |
¨American Express Co. | | | 163,600 | | | | 9,403,728 | |
Capital One Financial Corp. | | | 71,600 | | | | 4,147,788 | |
SLM Corp. | | | 254,000 | | | | 4,351,020 | |
| | | | | | | | |
| | | | | | | 17,902,536 | |
| | | | | | | | |
Distributors 0.5% | |
Genuine Parts Co. | | | 49,600 | | | | 3,153,568 | |
| | | | | | | | |
|
Diversified Financial Services 3.9% | |
Bank of America Corp. | | | 663,700 | | | | 7,698,920 | |
¨JPMorgan Chase & Co. | | | 364,400 | | | | 16,022,668 | |
| | | | | | | | |
| | | | | | | 23,721,588 | |
| | | | | | | | |
Diversified Telecommunication Services 3.5% | |
¨AT&T, Inc. | | | 326,000 | | | | 10,989,460 | |
CenturyLink, Inc. | | | 79,500 | | | | 3,110,040 | |
Telefonica S.A. | | | 129,995 | | | | 1,765,167 | |
Verizon Communications, Inc. | | | 126,800 | | | | 5,486,636 | |
| | | | | | | | |
| | | | | | | 21,351,303 | |
| | | | | | | | |
Electric Utilities 4.2% | |
Duke Energy Corp. | | | 123,645 | | | | 7,888,551 | |
Entergy Corp. | | | 95,100 | | | | 6,062,625 | |
Exelon Corp. | | | 177,500 | | | | 5,278,850 | |
FirstEnergy Corp. | | | 57,200 | | | | 2,388,672 | |
Xcel Energy, Inc. | | | 148,600 | | | | 3,969,106 | |
| | | | | | | | |
| | | | | | | 25,587,804 | |
| | | | | | | | |
Electrical Equipment 1.6% | |
Eaton Corp. PLC | | | 55,784 | | | | 3,023,493 | |
Emerson Electric Co. | | | 133,900 | | | | 7,091,344 | |
| | | | | | | | |
| | | | | | | 10,114,837 | |
| | | | | | | | |
Electronic Equipment & Instruments 0.7% | |
Corning, Inc. | | | 353,700 | | | | 4,463,694 | |
| | | | | | | | |
| † | Percentages indicated are based on Portfolio net assets. |
| ¨ | | Among the Portfolio’s 10 largest holdings, as of December 31, 2012, excluding short-term investment. May be subject to change daily. |
| | | | | | |
The notes to the financial statements are an integral part of,
and should be read in conjunction with, the financial statements. | | mainstayinvestments.com | | | M-413 | |
Portfolio of Investments December 31, 2012 (continued)
| | | | | | | | |
| | |
Shares | | | Value | |
| | | | | | | | |
| Common Stocks (continued) | |
Energy Equipment & Services 1.7% | |
Diamond Offshore Drilling, Inc. | | | 69,700 | | | $ | 4,736,812 | |
Schlumberger, Ltd. | | | 83,000 | | | | 5,751,070 | |
| | | | | | | | |
| | | | | | | 10,487,882 | |
| | | | | | | | |
Food Products 2.6% | |
Archer-Daniels-Midland Co. | | | 189,100 | | | | 5,179,449 | |
Campbell Soup Co. | | | 150,300 | | | | 5,243,967 | |
ConAgra Foods, Inc. | | | 96,700 | | | | 2,852,650 | |
McCormick & Co., Inc. | | | 44,500 | | | | 2,827,085 | |
| | | | | | | | |
| | | | | | | 16,103,151 | |
| | | | | | | | |
Health Care Providers & Services 0.5% | |
Quest Diagnostics, Inc. | | | 55,700 | | | | 3,245,639 | |
| | | | | | | | |
|
Hotels, Restaurants & Leisure 0.5% | |
Carnival Corp. | | | 88,700 | | | | 3,261,499 | |
| | | | | | | | |
|
Household Durables 0.7% | |
Whirlpool Corp. | | | 41,500 | | | | 4,222,625 | |
| | | | | | | | |
|
Household Products 1.6% | |
Clorox Co. (The) | | | 82,100 | | | | 6,011,362 | |
Energizer Holdings, Inc. | | | 31,700 | | | | 2,535,366 | |
Procter & Gamble Co. (The) | | | 19,000 | | | | 1,289,910 | |
| | | | | | | | |
| | | | | | | 9,836,638 | |
| | | | | | | | |
Independent Power Producers & Energy Traders 0.3% | |
AES Corp. (The) | | | 158,400 | | | | 1,694,880 | |
| | | | | | | | |
| | |
Industrial Conglomerates 4.0% | | | | | | | | |
3M Co. | | | 90,300 | | | | 8,384,355 | |
¨General Electric Co. | | | 787,600 | | | | 16,531,724 | |
| | | | | | | | |
| | | | | | | 24,916,079 | |
| | | | | | | | |
Insurance 4.6% | |
Allstate Corp. (The) | | | 165,900 | | | | 6,664,203 | |
Chubb Corp. (The) | | | 37,100 | | | | 2,794,372 | |
Lincoln National Corp. | | | 119,900 | | | | 3,105,410 | |
Loews Corp. | | | 50,500 | | | | 2,057,875 | |
Marsh & McLennan Cos., Inc. | | | 193,100 | | | | 6,656,157 | |
Sun Life Financial, Inc. | | | 91,400 | | | | 2,424,842 | |
Willis Group Holdings PLC | | | 82,300 | | | | 2,759,519 | |
XL Group PLC | | | 78,900 | | | | 1,977,234 | |
| | | | | | | | |
| | | | | | | 28,439,612 | |
| | | | | | | | |
IT Services 0.9% | |
Computer Sciences Corp. | | | 130,900 | | | | 5,242,545 | |
| | | | | | | | |
|
Leisure Equipment & Products 1.4% | |
Hasbro, Inc. | | | 58,100 | | | | 2,085,790 | |
Mattel, Inc. | | | 169,900 | | | | 6,221,738 | |
| | | | | | | | |
| | | | | | | 8,307,528 | |
| | | | | | | | |
| | | | | | | | |
| | |
Shares | | | Value | |
| | | | | | | | |
Life Sciences Tools & Services 1.7% | |
Agilent Technologies, Inc. | | | 57,000 | | | $ | 2,333,580 | |
Thermo Fisher Scientific, Inc. | | | 126,700 | | | | 8,080,926 | |
| | | | | | | | |
| | | | | | | 10,414,506 | |
| | | | | | | | |
Machinery 2.1% | |
Illinois Tool Works, Inc. | | | 126,300 | | | | 7,680,303 | |
Ingersoll-Rand PLC | | | 77,800 | | | | 3,731,288 | |
Xylem, Inc. | | | 57,500 | | | | 1,558,250 | |
| | | | | | | | |
| | | | | | | 12,969,841 | |
| | | | | | | | |
Media 5.1% | |
Cablevision Systems Corp. Class A | | | 169,800 | | | | 2,536,812 | |
Comcast Corp. Class A | | | 102,100 | | | | 3,816,498 | |
Madison Square Garden Co. Class A (a) | | | 53,300 | | | | 2,363,855 | |
McGraw-Hill Cos., Inc. (The) | | | 100,600 | | | | 5,499,802 | |
New York Times Co. (The) Class A (a) | | | 183,300 | | | | 1,563,549 | |
Time Warner, Inc. | | | 166,100 | | | | 7,944,563 | |
Walt Disney Co. (The) | | | 113,200 | | | | 5,636,228 | |
WPP PLC | | | 136,328 | | | | 1,981,837 | |
| | | | | | | | |
| | | | | | | 31,343,144 | |
| | | | | | | | |
Metals & Mining 1.6% | |
Cliffs Natural Resources, Inc. | | | 51,300 | | | | 1,978,128 | |
Newmont Mining Corp. | | | 34,800 | | | | 1,616,112 | |
Nucor Corp. | | | 144,600 | | | | 6,243,828 | |
| | | | | | | | |
| | | | | | | 9,838,068 | |
| | | | | | | | |
Multi-Utilities 1.2% | |
NiSource, Inc. | | | 253,600 | | | | 6,312,104 | |
TECO Energy, Inc. | | | 59,200 | | | | 992,192 | |
| | | | | | | | |
| | | | | | | 7,304,296 | |
| | | | | | | | |
Multiline Retail 1.5% | |
Kohl’s Corp. | | | 126,800 | | | | 5,449,864 | |
Macy’s, Inc. | | | 94,300 | | | | 3,679,586 | |
| | | | | | | | |
| | | | | | | 9,129,450 | |
| | | | | | | | |
Oil, Gas & Consumable Fuels 12.3% | |
Anadarko Petroleum Corp. | | | 80,600 | | | | 5,989,386 | |
Apache Corp. | | | 65,700 | | | | 5,157,450 | |
BP PLC, Sponsored ADR (b) | | | 82,700 | | | | 3,443,628 | |
¨Chevron Corp. | | | 135,900 | | | | 14,696,226 | |
ConocoPhillips | | | 42,100 | | | | 2,441,379 | |
CONSOL Energy, Inc. | | | 133,000 | | | | 4,269,300 | |
¨ExxonMobil Corp. | | | 153,600 | | | | 13,294,080 | |
Hess Corp. | | | 101,100 | | | | 5,354,256 | |
Murphy Oil Corp. | | | 116,800 | | | | 6,955,440 | |
Petroleo Brasileiro S.A., ADR (b) | | | 88,700 | | | | 1,726,989 | |
¨Royal Dutch Shell PLC, ADR (b) | | | 147,400 | | | | 10,163,230 | |
Spectra Energy Corp. | | | 81,500 | | | | 2,231,470 | |
| | | | | | | | |
| | | | | | | 75,722,834 | |
| | | | | | | | |
| | | | |
| M-414 | | MainStay VP T. Rowe Price Equity Income Portfolio | | The notes to the financial statements are an integral part of,
and should be read in conjunction with, the financial statements. |
| | | | | | | | |
| | |
Shares | | | Value | |
| | | | | | | | |
| Common Stocks (continued) | |
Paper & Forest Products 1.9% | |
¨International Paper Co. | | | 219,500 | | | $ | 8,744,880 | |
MeadWestvaco Corp. | | | 100,800 | | | | 3,212,496 | |
| | | | | | | | |
| | | | | | | 11,957,376 | |
| | | | | | | | |
Personal Products 0.6% | |
Avon Products, Inc. | | | 254,900 | | | | 3,660,364 | |
| | | | | | | | |
|
Pharmaceuticals 4.5% | |
Bristol-Myers Squibb Co. | | | 148,600 | | | | 4,842,874 | |
Johnson & Johnson | | | 117,400 | | | | 8,229,740 | |
Merck & Co., Inc. | | | 167,800 | | | | 6,869,732 | |
Pfizer, Inc. | | | 311,300 | | | | 7,807,404 | |
| | | | | | | | |
| | | | | | | 27,749,750 | |
| | | | | | | | |
Real Estate Investment Trusts 0.7% | |
Weyerhaeuser Co. | | | 165,500 | | | | 4,604,210 | |
| | | | | | | | |
|
Road & Rail 1.0% | |
Norfolk Southern Corp. | | | 101,400 | | | | 6,270,576 | |
| | | | | | | | |
|
Semiconductors & Semiconductor Equipment 2.1% | |
Analog Devices, Inc. | | | 104,700 | | | | 4,403,682 | |
Applied Materials, Inc. | | | 319,000 | | | | 3,649,360 | |
First Solar, Inc. (a) | | | 32,900 | | | | 1,015,952 | |
Texas Instruments, Inc. | | | 121,000 | | | | 3,743,740 | |
| | | | | | | | |
| | | | | | | 12,812,734 | |
| | | | | | | | |
Software 1.4% | |
CA, Inc. | | | 63,200 | | | | 1,389,136 | |
Microsoft Corp. | | | 276,000 | | | | 7,377,480 | |
| | | | | | | | |
| | | | | | | 8,766,616 | |
| | | | | | | | |
Specialty Retail 0.7% | |
Staples, Inc. | | | 323,000 | | | | 3,682,200 | |
Tiffany & Co. | | | 6,300 | | | | 361,242 | |
| | | | | | | | |
| | | | | | | 4,043,442 | |
| | | | | | | | |
Wireless Telecommunication Services 0.3% | |
Vodafone Group PLC | | | 792,973 | | | | 1,994,221 | |
| | | | | | | | |
Total Common Stocks
(Cost $559,488,162) | | | | | | | 583,682,017 | |
| | | | | | | | |
| | |
| | | | | | | | |
| Convertible Preferred Stock 0.6% | |
Automobiles 0.6% | |
General Motors Co. 4.75% | | | 87,450 | | | | 3,859,169 | |
| | | | | | | | |
Total Convertible Preferred Stock
(Cost $3,726,064) | | | | | | | 3,859,169 | |
| | | | | | | | |
| | | | | | | | |
| | | Principal
Amount | | | Value | |
| | | | | | | | |
| Short-Term Investment 4.7% | |
Repurchase Agreement 4.7% | |
State Street Bank and Trust Co.
0.01%, dated 12/31/12
due 1/2/13
Proceeds at Maturity $28,646,107 (Collateralized by a Federal Home Loan Mortgage Corp. security with a rate of 2.07% and a maturity date of 11/7/22, with a Principal Amount of $29,495,000 and a Market Value of $29,223,204) | | $ | 28,646,091 | | | $ | 28,646,091 | |
| | | | | | | | |
Total Short-Term Investment
(Cost $28,646,091) | | | | | | | 28,646,091 | |
| | | | | | | | |
Total Investments
(Cost $591,860,317) (c) | | | 100.0 | % | | | 616,187,277 | |
Other Assets, Less Liabilities | | | 0.0 | ‡ | | | 215,529 | |
Net Assets | | | 100.0 | % | | $ | 616,402,806 | |
| ‡ | Less than one-tenth of a percent. |
| (a) | Non-income producing security. |
| (b) | ADR—American Depositary Receipt. |
| (c) | As of December 31, 2012, cost is $591,936,316 for federal income tax purposes and net unrealized appreciation is as follows: |
| | | | |
Gross unrealized appreciation | | $ | 39,000,517 | |
Gross unrealized depreciation | | | (14,749,556 | ) |
| | | | |
Net unrealized appreciation | | $ | 24,250,961 | |
| | | | |
| | | | | | |
The notes to the financial statements are an integral part of,
and should be read in conjunction with, the financial statements. | | mainstayinvestments.com | | | M-415 | |
Portfolio of Investments December 31, 2012 (continued)
The following is a summary of the fair valuations according to the inputs used as of December 31, 2012, for valuing the Portfolio’s assets.
Asset Valuation Inputs
| | | | | | | | | | | | | | | | |
Description | | Quoted Prices in
Active Markets
for Identical Assets
(Level 1) | | | Significant Other
Observable Inputs
(Level 2) | | | Significant
Unobservable
Inputs (Level 3) | | | Total | |
| Investments in Securities (a) | | | | | | | | | | | | | | | | |
| Common Stocks | | | | | | | | | | | | | | | | |
Diversified Telecommunication Services | | $ | 19,586,136 | | | $ | 1,765,167 | | | $ | — | | | $ | 21,351,303 | |
Media | | | 29,361,307 | | | | 1,981,837 | | | | — | | | | 31,343,144 | |
Wireless Telecommunication Services | | | — | | | | 1,994,221 | | | | — | | | | 1,994,221 | |
All Other Industries | | | 528,993,349 | | | | — | | | | — | | | | 528,993,349 | |
| | | | | | | | | | | | | | | | |
| Total Common Stocks | | | 577,940,792 | | | | 5,741,225 | | | | — | | | | 583,682,017 | |
| | | | | | | | | | | | | | | | |
| Convertible Preferred Stock | | | 3,859,169 | | | | — | | | | — | | | | 3,859,169 | |
| Short-Term Investment | | | | | | | | | | | | | | | | |
Repurchase Agreement | | | — | | | | 28,646,091 | | | | — | | | | 28,646,091 | |
| | | | | | | | | | | | | | | | |
| Total Investments in Securities | | $ | 581,799,961 | | | $ | 34,387,316 | | | $ | — | | | $ | 616,187,277 | |
| | | | | | | | | | | | | | | | |
| (a) | For a complete listing of investments and their industries, see the Portfolio of Investments. |
The Portfolio recognizes transfers between the levels as of the beginning of the period.
As of December 31, 2012, the Portfolio did not hold any investments with significant unobservable inputs (Level 3). (See Note 2)
| | | | |
| M-416 | | MainStay VP T. Rowe Price Equity Income Portfolio | | The notes to the financial statements are an integral part of,
and should be read in conjunction with, the financial statements. |
Statement of Assets and Liabilities as of December 31, 2012
| | | | |
| Assets | |
Investment in securities, at value (identified cost $591,860,317) | | $ | 616,187,277 | |
Cash | | | 28,078 | |
Cash denominated in foreign currencies
(identified cost $5) | | | 5 | |
Receivables: | | | | |
Fund shares sold | | | 2,272,899 | |
Dividends and interest | | | 713,029 | |
Other assets | | | 750 | |
| | | | |
Total assets | | | 619,202,038 | |
| | | | |
| |
| Liabilities | | | | |
Payables: | | | | |
Investment securities purchased | | | 1,964,558 | |
Manager (See Note 3) | | | 383,889 | |
Fund shares redeemed | | | 309,112 | |
NYLIFE Distributors (See Note 3) | | | 51,181 | |
Shareholder communication | | | 47,102 | |
Professional fees | | | 39,004 | |
Custodian | | | 3,520 | |
Trustees | | | 866 | |
| | | | |
Total liabilities | | | 2,799,232 | |
| | | | |
Net assets | | $ | 616,402,806 | |
| | | | |
| |
| Net Assets Consist of | | | | |
Shares of beneficial interest outstanding (par value of $.001 per share) unlimited number of shares authorized | | $ | 57,191 | |
Additional paid-in capital | | | 577,560,523 | |
| | | | |
| | | 577,617,714 | |
Undistributed net investment income | | | 8,775,690 | |
Accumulated net realized gain (loss) on investments and foreign currency transactions | | | 5,681,598 | |
Net unrealized appreciation (depreciation) on investments | | | 24,326,960 | |
Net unrealized appreciation (depreciation) on translation of other assets and liabilities in foreign currencies | | | 844 | |
| | | | |
Net assets | | $ | 616,402,806 | |
| | | | |
| | | | |
Initial Class | | | | |
Net assets applicable to outstanding shares | | $ | 374,321,632 | |
| | | | |
Shares of beneficial interest outstanding | | | 34,700,139 | |
| | | | |
Net asset value per share outstanding | | $ | 10.79 | |
| | | | |
Service Class | | | | |
Net assets applicable to outstanding shares | | $ | 242,081,174 | |
| | | | |
Shares of beneficial interest outstanding | | | 22,490,517 | |
| | | | |
Net asset value per share outstanding | | $ | 10.76 | |
| | | | |
| | | | | | |
The notes to the financial statements are an integral part of,
and should be read in conjunction with, the financial statements. | | mainstayinvestments.com | | | M-417 | |
Statement of Operations
for the period February 17, 2012 (inception date) through December 31, 2012
| | | | |
| Investment Income (Loss) | |
Income | | | | |
Dividends (a) | | $ | 12,963,115 | |
Interest | | | 2,025 | |
| | | | |
Total income | | | 12,965,140 | |
| | | | |
Expenses | | | | |
Manager (See Note 3) | | | 3,541,711 | |
Distribution and service—Service Class (See Note 3) | | | 521,254 | |
Shareholder communication | | | 89,968 | |
Professional fees | | | 63,515 | |
Custodian | | | 19,549 | |
Trustees | | | 10,940 | |
Miscellaneous | | | 16,920 | |
| | | | |
Total expenses before waiver/reimbursement | | | 4,263,857 | |
| | | | |
Expense waiver/reimbursement from Manager (See Note 3) | | | (221,855 | ) |
| | | | |
Net expenses | | | 4,042,002 | |
| | | | |
Net investment income (loss) | | | 8,923,138 | |
| | | | |
|
| Realized and Unrealized Gain (Loss) on Investments and Foreign Currency Transactions | |
Net realized gain (loss) on: | | | | |
Security transactions | | | 5,535,638 | |
Foreign currency transactions | | | (1,488 | ) |
| | | | |
Net realized gain (loss) on investments and foreign currency transactions | | | 5,534,150 | |
| | | | |
Net change in unrealized appreciation (depreciation) on: | | | | |
Investments | | | 24,326,960 | |
Translation of other assets and liabilities in foreign currencies | | | 844 | |
| | | | |
Net change in unrealized appreciation (depreciation) on investments and foreign currency transactions | | | 24,327,804 | |
| | | | |
Net realized and unrealized gain (loss) on investments and foreign currency transactions | | | 29,861,954 | |
| | | | |
Net increase (decrease) in net assets resulting from operations | | $ | 38,785,092 | |
| | | | |
| (a) | Dividends recorded net of foreign withholding taxes in the amount of $89,979. |
| | | | |
| M-418 | | MainStay VP T. Rowe Price Equity Income Portfolio | | The notes to the financial statements are an integral part of,
and should be read in conjunction with, the financial statements. |
Statements of Changes in Net Assets
for the period February 17, 2012 (inception date) through December 31, 2012
| | | | |
| | | 2012 | |
| Increase (Decrease) in Net Assets | |
Operations: | | | | |
Net investment income (loss) | | $ | 8,923,138 | |
Net realized gain (loss) on investments and foreign currency transactions | | | 5,534,150 | |
Net change in unrealized appreciation (depreciation) on investments and foreign currency transactions | | | 24,327,804 | |
| | | | |
Net increase (decrease) in net assets resulting from operations | | | 38,785,092 | |
| | | | |
Capital share transactions: | | | | |
Net proceeds from sale of shares | | | 655,547,131 | |
Cost of shares redeemed | | | (77,929,417 | ) |
| | | | |
Increase (decrease) in net assets derived from capital share transactions | | | 577,617,714 | |
| | | | |
Net increase (decrease) in net assets | | | 616,402,806 | |
|
| Net Assets | |
Beginning of period | | | — | |
| | | | |
End of period | | $ | 616,402,806 | |
| | | | |
Undistributed net investment income at end of period | | $ | 8,775,690 | |
| | | | |
| | | | | | |
The notes to the financial statements are an integral part of,
and should be read in conjunction with, the financial statements. | | mainstayinvestments.com | | | M-419 | |
Financial Highlights selected per share data and ratios
| | | | |
| | | Initial Class | |
| | | February 17,
2012** through
December 31, | |
| | | 2012 | |
Net asset value at beginning of period | | $ | 10.00 | |
| | | | |
Net investment income (loss) (a) | | | 0.19 | |
Net realized and unrealized gain (loss) on investments | | | 0.60 | |
| | | | |
Total from investment operations | | | 0.79 | |
| | | | |
Net asset value at end of period | | $ | 10.79 | |
| | | | |
Total investment return | | | 7.90 | %(b)(c) |
Ratios (to average net assets)/Supplemental Data: | | | | |
Net investment income (loss) | | | 2.15 | %†† |
Net expenses | | | 0.79 | %†† |
Expenses (before waiver/reimbursement) | | | 0.84 | %†† |
Portfolio turnover rate | | | 15 | % |
Net assets at end of period (in 000’s) | | $ | 374,322 | |
| (a) | Per share data based on average shares outstanding during the period. |
| (b) | Total investment return is not annualized. |
| (c) | Total investment return may reflect adjustments to conform to generally accepted accounting principles. |
| | | | |
| | | Service Class | |
| | | February 17,
2012**
through
December 31, | |
| | | 2012 | |
Net asset value at beginning of period | | $ | 10.00 | |
| | | | |
Net investment income (loss) (a) | | | 0.17 | |
Net realized and unrealized gain (loss) on investments | | | 0.59 | |
| | | | |
Total from investment operations | | | 0.76 | |
| | | | |
Net asset value at end of period | | $ | 10.76 | |
| | | | |
Total investment return | | | 7.60 | %(b)(c) |
Ratios (to average net assets)/Supplemental Data: | | | | |
Net investment income (loss) | | | 1.85 | %†† |
Net expenses | | | 1.04 | %†† |
Expenses (before waiver/reimbursement) | | | 1.09 | %†† |
Portfolio turnover rate | | | 15 | % |
Net assets at end of period (in 000’s) | | $ | 242,081 | |
| (a) | Per share data based on average shares outstanding during the period. |
| (b) | Total investment return is not annualized. |
| (c) | Total investment return may reflect adjustments to conform to generally accepted accounting principles. |
| | | | |
| M-420 | | MainStay VP T. Rowe Price Equity Income Portfolio | | The notes to the financial statements are an integral part of,
and should be read in conjunction with, the financial statements. |
MainStay VP U.S. Small Cap Portfolio
Investment and Performance Comparison (Unaudited)
Performance data quoted represents past performance. Past performance is no guarantee of future results. Because of market volatility, current performance may be lower or higher than the figures shown. Investment return and principal value will fluctuate, and as a result, when shares are redeemed, they may be worth more or less than their original cost. The performance table and graph do not reflect any deduction of sales charges, mortality and expense charges, contract charges or administrative charges. Please refer to the Performance Summary appropriate for your policy. For performance information current to the most recent month-end, please call 800-598-2019 or visit www.newyorklife.com.
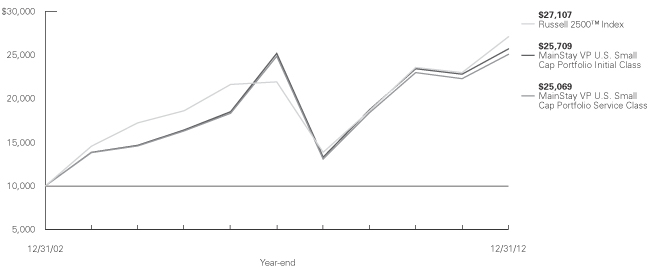
Average Annual Total Returns for the Year Ended December 31, 2012
| | | | | | | | | | | | |
| Class | | One Year | | Five Years | | Ten Years1 | | | Gross Expense Ratio2 | |
| Initial Class Shares | | 12.80% | | 0.41% | | | 9.90 | % | | | 0.85 | % |
| Service Class Shares3 | | 12.52 | | 0.17 | | | 9.63 | | | | 1.10 | |
| | | | | | | | | | | | |
| Benchmark Performance | | One
Year | | | Five
Years | | | Ten
Years | |
Russell 2500™ Index4 | | | 17.88 | % | | | 4.34 | % | | | 10.49 | % |
Average Lipper Variable Products Small-Cap Core Portfolio5 | | | 15.68 | | | | 3.41 | | | | 9.03 | |
| 1. | Performance figures shown for the ten-year period ended December 31, 2012 reflect nonrecurring reimbursements from affiliates for printing and mailing costs. If these nonrecurring reimbursements had not been made, the total returns would have been 9.89% for Initial Class shares and 9.62% for Service Class shares for the ten-year period. |
| 2. | The gross expense ratios presented reflect the Portfolio’s “Total Annual Portfolio Operating Expenses” from the most recent Prospectus and may differ from other expense ratios disclosed in this report. |
| 3. | Performance for Service Class shares, first offered June 5, 2003, includes the historical performance of Initial Class shares through June 4, 2003 adjusted to reflect the fees and expenses for Service Class shares. |
| 4. | Please refer to pages M-2 and M-3 for additional explanations and disclosure regarding the Portfolios, their benchmark indices and other indices mentioned in the reports. |
| 5. | The Average Lipper Variable Products Small-Cap Core Portfolio is representative of portfolios that, by portfolio practice, invest at least 75% of their equity assets in companies with market capitalizations (on a three-year weighted basis) below Lipper’s U.S. Diversified Equity small-cap ceiling. Small-cap core portfolios have more latitude in the companies in which they invest. These portfolios typically have an average price-to-earnings ratio, price-to-book ratio, and three-year sales-per share growth value compared to the S&P SmallCap 600® Index. Lipper Inc. is an independent monitor of fund performance. Results are based on total returns with all dividend and capital gain distributions reinvested. |
| | | | |
| mainstayinvestments.com | | | M-421 | |
Cost in Dollars of a $1,000 Investment in MainStay VP U.S. Small Cap Portfolio (Unaudited)
The example below is intended to describe the fees and expenses borne by shareholders during the six-month period from July 1, 2012 to December 31, 2012, and the impact of those costs on your investment.
Example
As a shareholder of the Portfolio, you incur two types of costs: (1) transaction costs, including exchange fees and sales charges (loads) on purchases (as applicable), and (2) ongoing costs, including management fees, distribution and/or service (12b-1) fees, and other Portfolio expenses (as applicable). This example is intended to help you understand your ongoing costs (in dollars) of investing in the Portfolio and to compare these costs with the ongoing costs of investing in other Portfolios. The example is based on an investment of $1,000 made at the beginning of the six-month period and held for the entire period from July 1, 2012, to December 31, 2012. Shares are only sold in connection with variable life and annuity contracts and the example does not reflect any contract level or transactional fees or expenses. If these costs had been included, your costs would have been higher.
This example illustrates your Portfolio’s ongoing costs in two ways:
Actual Expenses
The second and third data columns in the table below provide information about actual account values and actual expenses. You may use the information in these columns, together with the amount you invested, to estimate the expenses that you paid during the six months ended
December 31, 2012. Simply divide your account value by $1,000 (for example, an $8,600 account value divided by $1,000 = 8.6), then multiply the result by the number under the heading entitled ‘‘Expenses Paid During Period’’ to estimate the expenses you paid on your account during this period.
Hypothetical Example for Comparison Purposes
The fourth and fifth data columns in the table below provide information about hypothetical account values and hypothetical expenses based on the Portfolio’s actual expense ratio and an assumed rate of return of 5% per year before expenses, which is not the Portfolio’s actual return. The hypothetical account values and expenses may not be used to estimate the actual ending account balances or expenses you paid for the six-month period shown. You may use this information to compare the ongoing costs of investing in the Portfolio with the ongoing costs of investing in other Portfolios. To do so, compare this 5% hypothetical example with the 5% hypothetical examples that appear in the shareholder reports of the other Portfolios.
Please note that the expenses shown in the table are meant to highlight your ongoing costs only and do not reflect any transactional costs, such as exchange fees or sales charges (loads). Therefore, the fourth and fifth data columns of the table are useful in comparing ongoing costs only and will not help you determine the relative total costs of owning different funds. In addition, if these transactional costs were included, your costs would have been higher.
| | | | | | | | | | | | | | | | | | | | |
| | | | | | | | | | | | | | | | |
| Share Class | | Beginning
Account
Value
7/1/12 | | | Ending Account
Value (Based
on Actual
Returns and
Expenses)
12/31/12 | | | Expenses
Paid
During
Period1 | | | Ending Account
Value (Based
on Hypothetical
5% Annualized
Return and
Actual Expenses)
12/31/12 | | | Expenses
Paid
During
Period1 | |
| | | | | |
| Initial Class Shares | | $ | 1,000.00 | | | $ | 1,076.00 | | | $ | 4.33 | | | $ | 1,021.00 | | | $ | 4.22 | |
| | | | | |
| Service Class Shares | | $ | 1,000.00 | | | $ | 1,074.60 | | | $ | 5.63 | | | $ | 1,019.70 | | | $ | 5.48 | |
| 1. | Expenses are equal to the Portfolio’s annualized expense ratio of each class (0.83% for Initial Class and 1.08% for Service Class) multiplied by the average account value over the period, divided by 366 and multiplied by 184 (to reflect the six-month period). The table above represents the actual expenses incurred during the six-month period. |
| | |
| M-422 | | MainStay VP U.S. Small Cap Portfolio |
Industry Composition as of December 31, 2012 (Unaudited)
| | | | |
| Machinery | | | 10.4 | % |
| Health Care Equipment & Supplies | | | 7.9 | |
| Textiles, Apparel & Luxury Goods | | | 5.5 | |
| Commercial Banks | | | 4.7 | |
| Hotels, Restaurants & Leisure | | | 4.6 | |
| Semiconductors & Semiconductor Equipment | | | 4.1 | |
| Chemicals | | | 4.0 | |
| Specialty Retail | | | 3.6 | |
| Electric Utilities | | | 3.4 | |
| Auto Components | | | 3.3 | |
| IT Services | | | 3.2 | |
| Food Products | | | 3.1 | |
| Health Care Providers & Services | | | 3.1 | |
| Aerospace & Defense | | | 3.0 | |
| Road & Rail | | | 3.0 | |
| Electronic Equipment & Instruments | | | 2.6 | |
| Building Products | | | 2.4 | |
| Diversified Consumer Services | | | 1.8 | |
| Biotechnology | | | 1.7 | |
| Containers & Packaging | | | 1.7 | |
| | | | |
| Multi-Utilities | | | 1.7 | % |
| Communications Equipment | | | 1.5 | |
| Household Durables | | | 1.5 | |
| Insurance | | | 1.5 | |
| Pharmaceuticals | | | 1.5 | |
| Diversified Financial Services | | | 1.4 | |
| Thrifts & Mortgage Finance | | | 1.4 | |
| Computers & Peripherals | | | 1.3 | |
| Real Estate Investment Trusts | | | 1.1 | |
| Commercial Services & Supplies | | | 1.0 | |
| Energy Equipment & Services | | | 1.0 | |
| Food & Staples Retailing | | | 1.0 | |
| Capital Markets | | | 0.9 | |
| Trading Companies & Distributors | | | 0.8 | |
| Professional Services | | | 0.7 | |
| Software | | | 0.7 | |
| Diversified Telecommunication Services | | | 0.6 | |
| Short-Term Investment | | | 3.5 | |
| Other Assets, Less Liabilities | | | (0.2 | ) |
| | | | |
| | | 100.0 | % |
| | | | |
See Portfolio of Investments beginning on page M-426 for specific holdings within these categories.
Top Ten Holdings as of December 31, 2012 (excluding short-term investment) (Unaudited)
| 1. | Mueller Industries, Inc. |
| 2. | Genesee & Wyoming, Inc. Class A |
| 8. | Service Corp. International |
| | | | |
| mainstayinvestments.com | | | M-423 | |
Portfolio Management Discussion and Analysis (Unaudited)
Answers to the questions reflect the views of portfolio managers David Pearl, Michael Welhoelter, CFA, William Priest, CFA, and Janet K. Navon of Epoch Investment Partners, Inc., the Portfolio’s Subadvisor.
How did MainStay VP U.S. Small Cap Portfolio perform relative to its peers and its benchmark during the reporting period?
For the 12 months ended December 31, 2012, MainStay VP U.S. Small Cap Portfolio returned 12.80% for Initial Class shares and 12.52% for Service Class shares. Both share classes underperformed the 15.68% return of the average Lipper1 Variable Products Small-Cap Core Portfolio and the 17.88% return of the Russell 2500™ Index1 for the 12 months ended December 31, 2012. The Russell 2500™ Index is the Portfolio’s broad-based securities-market index.
What factors affected the Portfolio’s relative performance during the reporting period?
A handful of companies that ran into difficulty during the year hampered the Portfolio’s overall results. The Portfolio’s cash position also weighed on returns in a fast-rising market.
Which sectors were the strongest positive contributors to the Portfolio’s relative performance, and which sectors were particularly weak?
The strongest positive contributions to relative returns came from the consumer discretionary and materials sectors. (Contributions take weightings and total returns into account.) In both cases stock selection was the primary reason; however, having a larger-than-index position in the consumer discretionary sector also helped. Over the course of the year we viewed parts of the energy sector as vulnerable, and this sector ended the year with the weakest results. Having less exposure to this sector relative to the Russell 2500™ Index was a positive factor.
The weakest sectors in terms of relative returns were industrials, health care and information technology. In each sector, stock selection hampered results.
During the reporting period, which individual stocks made the strongest positive contributions to the Portfolio’s absolute performance and which stocks detracted the most?
Among the stocks with the strongest contributions to returns were gaming systems maker Multimedia Games, home builder Ryland Group and clinical test-ing services company Bio-Reference Laboratories. Multimedia Games experienced strong demand for its games and systems from casino operators. Ryland Group rallied with the stabilization of the housing
market and its subsequent upturn. In October, new housing starts rose to their highest annualized levels since 2008. Bio-Reference Laboratories, which specializes in women’s health and has the bulk of its offices in the New York metro area, continued to see strong growth in free cash flow.
Among the stocks that detracted the most from the Portfolio’s results were drug manufacturer Endo Health Solutions, apparel retailer Express and audio technology company DTS. Endo Health Solutions declined on fears of generic competition, and prescriptions for the crush-proof version of the company’s Opana ER pain medication were less than expected. Express missed earnings and issued downbeat guidance, causing the stock to sell off. We continue to hold the security because we believe that this is a short-term issue. Michael Weiss, the architect of the brand’s early success, returned as CEO in 2007 and has improved store productivity, introduced high-margin products and launched online shopping for the brand. At current valuations, we feel the stock has significant upside potential. DTS reported disappointing earnings and revised estimates downward. The culprit was slow Blu-ray sales. Network-connected device revenue growth was strong, and revenue surpassed that of Blu-ray. While we expect the growth in new connected and mobile device initiatives to drive renewed growth over time, we eliminated the position from the Portfolio.
Did the Portfolio make any significant purchases or sales during the reporting period?
The Portfolio made several significant purchases during the year, including managed care company Wellcare Health Plans and orthopedic device company Wright Medical Group. WellCare Health Plans appears well positioned to benefit from the expansion of Medicaid and from state governments seeking to save costs by turning their Medicaid membership over to private plans. Wright Medical Group generates strong cash flow from hip and knee replacements and is poised to grow in other areas of joint reconstruction.
Sales during the year included regional bank Texas Capital Bancshares and auto repair company Monro
Muffler Brake. We sold Texas Capital Bancshares on strength after it approached our target price. We chose to sell Monro Muffler Brake because our investment thesis, which was predicated on aging car fleets, began to wane as new car sales increased.
| 1. | Please refer to pages M-2 and M-3 for additional explanations and disclosure regarding the Portfolios, their benchmark indices and service providers mentioned in the reports. |
| | |
| M-424 | | MainStay VP U.S. Small Cap Portfolio |
How did the Portfolio’s sector weightings change during the reporting period?
We increased the Portfolio’s already large exposure to consumer discretionary and health care companies. We also raised exposure to the information technology sector. We reduced the Portfolio’s exposure to financials, telecommunication services and utilities. These moves were the result of stock-specific decisions; they were not top-down predictions for indi- vidual sectors.
How was the Portfolio positioned at the end of the reporting period?
As of December 31, 2012, the Portfolio’s largest sector positions in absolute terms and relative to the Russell 2500™ Index were in industrials and consumer discretionary. The Portfolio also had substantially more exposure to the health care sector than the Index.
As of the same date, the financials sector represented the largest deviation from the Index, with the Portfolio having roughly half the exposure to the sector. The Portfolio also held a substantially underweight position in the energy sector.
The opinions expressed are those of the portfolio managers as of the date of this report and are subject to change. There is no guarantee that any forecasts made will come to pass. This material does not constitute investment advice and is not intended as an endorsement of any specific investment.
Not all MainStay VP Portfolios and/or share classes are available under all policies.
| | | | |
| mainstayinvestments.com | | | M-425 | |
Portfolio of Investments December 31, 2012
| | | | | | | | |
| | |
Shares | | | Value | |
| | | | | | | | |
| Common Stocks 96.7%† | | | | | | | | |
Aerospace & Defense 3.0% | |
Curtiss-Wright Corp. | | | 99,500 | | | $ | 3,266,585 | |
HEICO Corp. Class A | | | 3,000 | | | | 95,940 | |
Hexcel Corp. (a) | | | 153,050 | | | | 4,126,228 | |
| | | | | | | | |
| | | | | | | 7,488,753 | |
| | | | | | | | |
Auto Components 3.3% | |
Dana Holding Corp. | | | 191,800 | | | | 2,993,998 | |
Tenneco, Inc. (a) | | | 85,500 | | | | 3,001,905 | |
Visteon Corp. (a) | | | 43,000 | | | | 2,314,260 | |
| | | | | | | | |
| | | | | | | 8,310,163 | |
| | | | | | | | |
Biotechnology 1.7% | |
¨Alkermes PLC (a) | | | 236,949 | | | | 4,388,295 | |
| | | | | | | | |
|
Building Products 2.4% | |
Armstrong World Industries, Inc. | | | 43,350 | | | | 2,199,146 | |
Masco Corp. | | | 111,850 | | | | 1,863,421 | |
Simpson Manufacturing Co., Inc. | | | 63,300 | | | | 2,075,607 | |
| | | | | | | | |
| | | | | | | 6,138,174 | |
| | | | | | | | |
Capital Markets 0.9% | |
Waddell & Reed Financial, Inc. Class A | | | 68,650 | | | | 2,390,393 | |
| | | | | | | | |
|
Chemicals 4.0% | |
Chemtura Corp. (a) | | | 148,550 | | | | 3,158,173 | |
Flotek Industries, Inc. (a) | | | 263,900 | | | | 3,219,580 | |
Methanex Corp. | | | 121,350 | | | | 3,867,424 | |
| | | | | | | | |
| | | | | | | 10,245,177 | |
| | | | | | | | |
Commercial Banks 4.7% | |
Bank of Hawaii Corp. | | | 79,050 | | | | 3,482,152 | |
BankUnited, Inc. | | | 138,750 | | | | 3,391,050 | |
CVB Financial Corp. | | | 85,255 | | | | 886,652 | |
Investors Bancorp, Inc. | | | 238,400 | | | | 4,238,752 | |
| | | | | | | | |
| | | | | | | 11,998,606 | |
| | | | | | | | |
Commercial Services & Supplies 1.0% | |
Waste Connections, Inc. | | | 76,250 | | | | 2,576,488 | |
| | | | | | | | |
|
Communications Equipment 1.5% | |
Harmonic, Inc. (a) | | | 755,073 | | | | 3,828,220 | |
| | | | | | | | |
|
Computers & Peripherals 1.3% | |
Diebold, Inc. | | | 105,750 | | | | 3,237,008 | |
| | | | | | | | |
|
Containers & Packaging 1.7% | |
Silgan Holdings, Inc. | | | 100,560 | | | | 4,182,290 | |
| | | | | | | | |
| | | | | | | | |
| | |
Shares | | | Value | |
| | | | | | | | |
Diversified Consumer Services 1.8% | |
¨Service Corp. International | | | 323,000 | | | $ | 4,460,630 | |
| | | | | | | | |
|
Diversified Financial Services 1.4% | |
CBOE Holdings, Inc. | | | 121,900 | | | | 3,591,174 | |
| | | | | | | | |
|
Diversified Telecommunication Services 0.6% | |
Lumos Networks Corp. | | | 149,100 | | | | 1,493,982 | |
| | | | | | | | |
| | | | | | | | |
|
Electric Utilities 3.4% | |
Great Plains Energy, Inc. | | | 211,150 | | | | 4,288,456 | |
¨Westar Energy, Inc. | | | 152,550 | | | | 4,365,981 | |
| | | | | | | | |
| | | | | | | 8,654,437 | |
| | | | | | | | |
Electronic Equipment & Instruments 2.6% | |
MTS Systems Corp. | | | 62,000 | | | | 3,157,660 | |
National Instruments Corp. | | | 128,694 | | | | 3,321,592 | |
| | | | | | | | |
| | | | | | | 6,479,252 | |
| | | | | | | | |
Energy Equipment & Services 1.0% | |
Dril-Quip, Inc. (a) | | | 34,931 | | | | 2,551,710 | |
| | | | | | | | |
|
Food & Staples Retailing 1.0% | |
Spartan Stores, Inc. | | | 161,300 | | | | 2,477,568 | |
| | | | | | | | |
|
Food Products 3.1% | |
¨Ingredion, Inc. | | | 77,250 | | | | 4,977,217 | |
TreeHouse Foods, Inc. (a) | | | 52,700 | | | | 2,747,251 | |
| | | | | | | | |
| | | | | | | 7,724,468 | |
| | | | | | | | |
Health Care Equipment & Supplies 7.9% | |
Alere, Inc. (a) | | | 60,400 | | | | 1,117,400 | |
Haemonetics Corp. (a) | | | 98,500 | | | | 4,022,740 | |
Integra LifeSciences Holdings Corp. (a) | | | 70,980 | | | | 2,766,091 | |
Sirona Dental Systems, Inc. (a) | | | 56,484 | | | | 3,640,959 | |
¨Teleflex, Inc. | | | 63,850 | | | | 4,553,143 | |
Wright Medical Group, Inc. (a) | | | 182,485 | | | | 3,830,360 | |
| | | | | | | | |
| | | | | | | 19,930,693 | |
| | | | | | | | |
Health Care Providers & Services 3.1% | |
Bio-Reference Laboratories, Inc. (a) | | | 143,005 | | | | 4,102,813 | |
WellCare Health Plans, Inc. (a) | | | 77,720 | | | | 3,784,187 | |
| | | | | | | | |
| | | | | | | 7,887,000 | |
| | | | | | | | |
Hotels, Restaurants & Leisure 4.6% | |
Brinker International, Inc. | | | 118,370 | | | | 3,668,286 | |
Life Time Fitness, Inc. (a) | | | 40,280 | | | | 1,982,179 | |
Multimedia Games Holding Co., Inc. (a) | | | 196,995 | | | | 2,897,797 | |
SHFL Entertainment, Inc. (a) | | | 216,300 | | | | 3,136,350 | |
| | | | | | | | |
| | | | | | | 11,684,612 | |
| | | | | | | | |
| † | Percentages indicated are based on Portfolio net assets. |
| ¨ | | Among the Portfolio’s 10 largest holdings, as of December 31, 2012, excluding short-term investment. May be subject to change daily. |
| | | | |
| M-426 | | MainStay VP U.S. Small Cap Portfolio | | The notes to the financial statements are an integral part of,
and should be read in conjunction with, the financial statements. |
| | | | | | | | |
| | |
Shares | | | Value | |
| | | | | | | | |
| Common Stocks (continued) | | | | | | | | |
Household Durables 1.5% | |
Ryland Group, Inc. (The) | | | 102,750 | | | $ | 3,750,375 | |
| | | | | | | | |
|
Insurance 1.5% | |
Arthur J. Gallagher & Co. | | | 109,350 | | | | 3,788,978 | |
| | | | | | | | |
|
IT Services 3.2% | |
Forrester Research, Inc. | | | 114,335 | | | | 3,064,178 | |
¨NeuStar, Inc. Class A (a) | | | 118,900 | | | | 4,985,477 | |
| | | | | | | | |
| | | | | | | 8,049,655 | |
| | | | | | | | |
Machinery 10.4% | |
Actuant Corp. Class A | | | 48,450 | | | | 1,352,240 | |
Colfax Corp. (a) | �� | | 34,950 | | | | 1,410,232 | |
Harsco Corp. | | | 169,050 | | | | 3,972,675 | |
Kennametal, Inc. | | | 52,531 | | | | 2,101,240 | |
¨Mueller Industries, Inc. | | | 112,709 | | | | 5,638,831 | |
Navistar International Corp. (a) | | | 56,050 | | | | 1,220,209 | |
¨Wabtec Corp. | | | 61,287 | | | | 5,365,064 | |
¨Woodward, Inc. | | | 135,500 | | | | 5,166,615 | |
| | | | | | | | |
| | | | | | | 26,227,106 | |
| | | | | | | | |
Multi-Utilities 1.7% | |
Vectren Corp. | | | 145,350 | | | | 4,273,290 | |
| | | | | | | | |
|
Pharmaceuticals 1.5% | |
Endo Health Solutions, Inc. (a) | | | 143,200 | | | | 3,761,864 | |
| | | | | | | | |
|
Professional Services 0.7% | |
Resources Connection, Inc. | | | 150,000 | | | | 1,791,000 | |
| | | | | | | | |
|
Real Estate Investment Trusts 1.1% | |
Tanger Factory Outlet Centers, Inc. | | | 84,250 | | | | 2,881,350 | |
| | | | | | | | |
|
Road & Rail 3.0% | |
Con-way, Inc. | | | 81,550 | | | | 2,268,721 | |
¨Genesee & Wyoming, Inc. Class A (a) | | | 71,366 | | | | 5,429,525 | |
| | | | | | | | |
| | | | | | | 7,698,246 | |
| | | | | | | | |
Semiconductors & Semiconductor Equipment 4.1% | |
Cypress Semiconductor Corp. (a) | | | 278,750 | | | | 3,021,650 | |
Teradyne, Inc. (a) | | | 169,200 | | | | 2,857,788 | |
Veeco Instruments, Inc. (a) | | | 79,420 | | | | 2,344,479 | |
Volterra Semiconductor Corp. (a) | | | 126,360 | | | | 2,169,601 | |
| | | | | | | | |
| | | | | | | 10,393,518 | |
| | | | | | | | |
Software 0.7% | |
Solera Holdings, Inc. | | | 34,050 | | | | 1,820,654 | |
| | | | | | | | |
| | | | | | | | |
| | |
Shares | | | Value | |
Specialty Retail 3.6% | |
Express, Inc. (a) | | | 209,000 | | | $ | 3,153,810 | |
JoS. A. Bank Clothiers, Inc. (a) | | | 56,300 | | | | 2,397,254 | |
Sonic Automotive, Inc. | | | 176,750 | | | | 3,692,307 | |
| | | | | | | | |
| | | | | | | 9,243,371 | |
| | | | | | | | |
Textiles, Apparel & Luxury Goods 5.5% | |
G-III Apparel Group, Ltd. (a) | | | 79,000 | | | | 2,704,170 | |
Iconix Brand Group, Inc. (a) | | | 191,800 | | | | 4,280,976 | |
Perry Ellis International, Inc. | | | 145,350 | | | | 2,892,465 | |
Warnaco Group, Inc. (The) (a) | | | 57,150 | | | | 4,090,225 | |
| | | | | | | | |
| | | | | | | 13,967,836 | |
| | | | | | | | |
Thrifts & Mortgage Finance 1.4% | |
Brookline Bancorp, Inc. | | | 410,650 | | | | 3,490,525 | |
| | | | | | | | |
|
Trading Companies & Distributors 0.8% | |
Titan Machinery, Inc. (a) | | | 79,060 | | | | 1,952,782 | |
| | | | | | | | |
Total Common Stocks
(Cost $216,290,909) | | | | | | | 244,809,643 | |
| | | | | | | | |
| | |
| | | | | | | | |
| | | Principal
Amount | | | | |
| | | | | | | | |
| Short-Term Investment 3.5% | |
Repurchase Agreement 3.5% | |
State Street Bank and Trust Co.
0.01%, dated 12/31/12
due 1/2/13
Proceeds at Maturity $8,886,679 (Collateralized by a Federal National Mortgage Association security with a rate of 2.17% and a maturity date of 11/7/22, with a Principal Amount of $9,030,000 and a Market Value of $9,068,080) | | $ | 8,886,674 | | | | 8,886,674 | |
| | | | | | | | |
Total Short-Term Investment
(Cost $8,886,674) | | | | | | | 8,886,674 | |
| | | | | | | | |
Total Investments
(Cost $225,177,583) (b) | | | 100.2 | % | | | 253,696,317 | |
Other Assets, Less Liabilities | | | (0.2 | ) | | | (477,052 | ) |
Net Assets | | | 100.0 | % | | $ | 253,219,265 | |
| (a) | Non-income producing security. |
| (b) | As of December 31, 2012, cost is $225,470,337 for federal income tax purposes and net unrealized appreciation is as follows: |
| | | | |
Gross unrealized appreciation | | $ | 38,189,556 | |
Gross unrealized depreciation | | | (9,963,576 | ) |
| | | | |
Net unrealized appreciation | | $ | 28,225,980 | |
| | | | |
| | | | | | |
The notes to the financial statements are an integral part of,
and should be read in conjunction with, the financial statements. | | mainstayinvestments.com | | | M-427 | |
Portfolio of Investments December 31, 2012 (continued)
The following is a summary of the fair valuations according to the inputs used as of December 31, 2012, for valuing the Portfolio’s assets.
Asset Valuation Inputs
| | | | | | | | | | | | | | | | |
Description | | Quoted Prices
in Active Markets
for Identical Assets (Level 1) | | | Significant Other
Observable Inputs (Level 2) | | | Significant
Unobservable
Inputs (Level 3) | | | Total | |
| Investments in Securities (a) | | | | | | | | | | | | | | | | |
| Common Stocks | | $ | 244,809,643 | | | $ | — | | | $ | — | | | $ | 244,809,643 | |
| Short-Term Investment | | | | | | | | | | | | | | | | |
Repurchase Agreement | | | — | | | | 8,886,674 | | | | — | | | | 8,886,674 | |
| | | | | | | | | | | | | | | | |
| Total Investments in Securities | | $ | 244,809,643 | | | $ | 8,886,674 | | | $ | — | | | $ | 253,696,317 | |
| | | | | | | | | | | | | | | | |
| (a) | For a complete listing of investments and their industries, see the Portfolio of Investments. |
The Portfolio recognizes transfers between the levels as of the beginning of the period.
For the year ended December 31, 2012, the Portfolio did not have any transfers between Level 1 and Level 2 fair value measurements. (See Note 2)
As of December 31, 2012, the Portfolio did not hold any investments with significant unobservable inputs (Level 3). (See Note 2)
| | | | |
| M-428 | | MainStay VP U.S. Small Cap Portfolio | | The notes to the financial statements are an integral part of,
and should be read in conjunction with, the financial statements. |
Statement of Assets and Liabilities as of December 31, 2012
| | | | |
| Assets | |
Investment in securities, at value
(identified cost $225,177,583) | | $ | 253,696,317 | |
Receivables: | | | | |
Investment securities sold | | | 885,353 | |
Fund shares sold | | | 100,934 | |
Dividends and interest | | | 99,215 | |
| | | | |
Total assets | | | 254,781,819 | |
| | | | |
| |
| Liabilities | | | | |
Payables: | | | | |
Investment securities purchased | | | 1,165,024 | |
Manager (See Note 3) | | | 167,501 | |
Fund shares redeemed | | | 148,070 | |
Professional fees | | | 34,042 | |
NYLIFE Distributors (See Note 3) | | | 26,119 | |
Shareholder communication | | | 20,103 | |
Custodian | | | 1,224 | |
Trustees | | | 358 | |
Accrued expenses | | | 113 | |
| | | | |
Total liabilities | | | 1,562,554 | |
| | | | |
Net assets | | $ | 253,219,265 | |
| | | | |
| |
| Net Assets Consist of | | | | |
Shares of beneficial interest outstanding (par value of $.001 per share) unlimited number of shares authorized | | $ | 25,495 | |
Additional paid-in capital | | | 236,582,508 | |
| | | | |
| | | 236,608,003 | |
Undistributed net investment income | | | 2,223,915 | |
Accumulated net realized gain (loss) on investments | | | (14,131,387 | ) |
Net unrealized appreciation (depreciation) on investments | | | 28,518,734 | |
| | | | |
Net assets | | $ | 253,219,265 | |
| | | | |
| | | | |
Initial Class | | | | |
Net assets applicable to outstanding shares | | $ | 128,575,966 | |
| | | | |
Shares of beneficial interest outstanding | | | 12,777,887 | |
| | | | |
Net asset value per share outstanding | | $ | 10.06 | |
| | | | |
Service Class | | | | |
Net assets applicable to outstanding shares | | $ | 124,643,299 | |
| | | | |
Shares of beneficial interest outstanding | | | 12,717,335 | |
| | | | |
Net asset value per share outstanding | | $ | 9.80 | |
| | | | |
| | | | | | |
The notes to the financial statements are an integral part of,
and should be read in conjunction with, the financial statements. | | mainstayinvestments.com | | | M-429 | |
Statement of Operations for the year ended December 31, 2012
| | | | |
| Investment Income (Loss) | |
Income | | | | |
Dividends (a) | | $ | 4,717,006 | |
Interest | | | 917 | |
| | | | |
Total income | | | 4,717,923 | |
| | | | |
Expenses | | | | |
Manager (See Note 3) | | | 2,071,285 | |
Distribution and service—Service Class (See Note 3) | | | 302,980 | |
Professional fees | | | 47,404 | |
Shareholder communication | | | 42,164 | |
Custodian | | | 9,411 | |
Trustees | | | 7,079 | |
Miscellaneous | | | 13,594 | |
| | | | |
Total expenses | | | 2,493,917 | |
| | | | |
Net investment income (loss) | | | 2,224,006 | |
| | | | |
|
| Realized and Unrealized Gain (Loss) on Investments | |
Net realized gain (loss) on investments | | | 10,201,224 | |
Net change in unrealized appreciation (depreciation) on investments | | | 18,501,297 | |
| | | | |
Net realized and unrealized gain (loss) on investments | | | 28,702,521 | |
| | | | |
Net increase (decrease) in net assets resulting from operations | | $ | 30,926,527 | |
| | | | |
| (a) | Dividends recorded net of foreign withholding taxes in the amount of $14,378. |
| | | | |
| M-430 | | MainStay VP U.S. Small Cap Portfolio | | The notes to the financial statements are an integral part of,
and should be read in conjunction with, the financial statements. |
Statements of Changes in Net Assets
for the years ended December 31, 2012 and December 31, 2011
| | | | | | | | |
| | | 2012 | | | 2011 | |
| Increase (Decrease) in Net Assets | |
Operations: | | | | | | | | |
Net investment income (loss) | | $ | 2,224,006 | | | $ | 879,973 | |
Net realized gain (loss) on investments | | | 10,201,224 | | | | 11,096,565 | |
Net change in unrealized appreciation (depreciation) on investments | | | 18,501,297 | | | | (21,027,296 | ) |
| | | | |
Net increase (decrease) in net assets resulting from operations | | | 30,926,527 | | | | (9,050,758 | ) |
| | | | |
Dividends to shareholders: | | | | | | | | |
From net investment income: | | | | | | | | |
Initial Class | | | (618,731 | ) | | | (1,185,152 | ) |
Service Class | | | (261,257 | ) | | | (828,201 | ) |
| | | | |
Total dividends to shareholders | | | (879,988 | ) | | | (2,013,353 | ) |
| | | | |
Capital share transactions: | | | | | | | | |
Net proceeds from sale of shares | | | 46,215,355 | | | | 105,132,159 | |
Net asset value of shares issued to shareholders in reinvestment of dividends | | | 879,988 | | | | 2,013,353 | |
Cost of shares redeemed | | | (80,685,957 | ) | | | (79,851,073 | ) |
| | | | |
Increase (decrease) in net assets derived from capital share transactions | | | (33,590,614 | ) | | | 27,294,439 | |
| | | | |
Net increase (decrease) in net assets | | | (3,544,075 | ) | | | 16,230,328 | |
|
| Net Assets | |
Beginning of year | | | 256,763,340 | | | | 240,533,012 | |
| | | | |
End of year | | $ | 253,219,265 | | | $ | 256,763,340 | |
| | | | |
Undistributed net investment income at end of year | | $ | 2,223,915 | | | $ | 879,966 | |
| | | | |
| | | | | | |
The notes to the financial statements are an integral part of,
and should be read in conjunction with, the financial statements. | | mainstayinvestments.com | | | M-431 | |
Financial Highlights selected per share data and ratios
| | | | | | | | | | | | | | | | | | | | |
| | | Initial Class | |
| | | Year ended December 31, | |
| | | 2012 | | | 2011 | | | 2010 | | | 2009 | | | 2008 | |
Net asset value at beginning of year | | $ | 8.96 | | | $ | 9.31 | | | $ | 7.45 | | | $ | 5.28 | | | $ | 14.98 | |
| | | | | | | | | | | | | | | | | | | | |
Net investment income (loss) (a) | | | 0.09 | | | | 0.04 | | | | 0.08 | | | | (0.00 | )‡ | | | (0.01 | ) |
Net realized and unrealized gain (loss) on investments | | | 1.05 | | | | (0.33 | ) | | | 1.78 | | | | 2.17 | | | | (6.90 | ) |
| | | | | | | | | | | | | | | | | | | | |
Total from investment operations | | | 1.14 | | | | (0.29 | ) | | | 1.86 | | | | 2.17 | | | | (6.91 | ) |
| | | | | | | | | | | | | | | | | | | | |
Less dividends and distributions: | | | | | | | | | | | | | | | | | | | | |
From net investment income | | | (0.04 | ) | | | (0.06 | ) | | | (0.00 | )‡ | | | — | | | | — | |
From net realized gain on investments | | | — | | | | — | | | | — | | | | — | | | | (2.79 | ) |
| | | | | | | | | | | | | | | | | | | | |
Total dividends and distributions | | | (0.04 | ) | | | (0.06 | ) | | | (0.00 | )‡ | | | — | | | | (2.79 | ) |
| | | | | | | | | | | | | | | | | | | | |
Net asset value at end of year | | $ | 10.06 | | | $ | 8.96 | | | $ | 9.31 | | | $ | 7.45 | | | $ | 5.28 | |
| | | | | | | | | | | | | | | | | | | | |
Total investment return | | | 12.80 | % | | | (2.75 | %) | | | 25.03 | % | | | 41.10 | % (b) | | | (47.22 | %) |
Ratios (to average net assets)/Supplemental Data: | | | | | | | | | | | | | | | | | | | | |
Net investment income (loss) | | | 0.98 | % | | | 0.46 | % | | | 0.98 | % | | | (0.02 | %) | | | (0.13 | %) |
Net expenses | | | 0.83 | % | | | 0.84 | % | | | 0.85 | % | | | 1.08 | % | | | 0.95 | % |
Portfolio turnover rate | | | 32 | % | | | 46 | % | | | 70 | % | | | 186 | % | | | 279 | % |
Net assets at end of year (in 000’s) | | $ | 128,576 | | | $ | 141,113 | | | $ | 107,627 | | | $ | 76,143 | | | $ | 14,963 | |
| ‡ | Less than one cent per share. |
| (a) | Per share data based on average shares outstanding during the year. |
| (b) | Total investment returns may reflect adjustments to conform to generally accepted accounting principles. |
| | | | | | | | | | | | | | | | | | | | |
| | | Service Class | |
| | | Year ended December 31, | |
| | | 2012 | | | 2011 | | | 2010 | | | 2009 | | | 2008 | |
Net asset value at beginning of year | | $ | 8.73 | | | $ | 9.07 | | | $ | 7.27 | | | $ | 5.17 | | | $ | 14.80 | |
| | | | | | | | | | | | | | | | | | | | |
Net investment income (loss) (a) | | | 0.06 | | | | 0.02 | | | | 0.07 | | | | (0.02 | ) | | | (0.04 | ) |
Net realized and unrealized gain (loss) on investments | | | 1.03 | | | | (0.30 | ) | | | 1.73 | | | | 2.12 | | | | (6.80 | ) |
| | | | | | | | | | | | | | | | | | | | |
Total from investment operations | | | 1.09 | | | | (0.28 | ) | | | 1.80 | | | | 2.10 | | | | (6.84 | ) |
| | | | | | | | | | | | | | | | | | | | |
Less dividends and distributions: | | | | | | | | | | | | | | | | | | | | |
From net investment income | | | (0.02 | ) | | | (0.06 | ) | | | — | | | | — | | | | — | |
From net realized gain on investments | | | — | | | | — | | | | — | | | | — | | | | (2.79 | ) |
| | | | | | | | | | | | | | | | | | | | |
Total dividends and distributions | | | (0.02 | ) | | | (0.06 | ) | | | — | | | | — | | | | (2.79 | ) |
| | | | | | | | | | | | | | | | | | | | |
Net asset value at end of year | | $ | 9.80 | | | $ | 8.73 | | | $ | 9.07 | | | $ | 7.27 | | | $ | 5.17 | |
| | | | | | | | | | | | | | | | | | | | |
Total investment return | | | 12.52 | % | | | (2.99 | %) | | | 24.76 | %(b) | | | 40.62 | % (b) | | | (47.35 | %) |
Ratios (to average net assets)/Supplemental Data: | | | | | | | | | | | | | | | | | | | | |
Net investment income (loss) | | | 0.69 | % | | | 0.19 | % | | | 0.84 | % | | | (0.39 | %) | | | (0.38 | %) |
Net expenses | | | 1.08 | % | | | 1.09 | % | | | 1.10 | % | | | 1.33 | % | | | 1.20 | % |
Portfolio turnover rate | | | 32 | % | | | 46 | % | | | 70 | % | | | 186 | % | | | 279 | % |
Net assets at end of year (in 000’s) | | $ | 124,643 | | | $ | 115,651 | | | $ | 132,906 | | | $ | 109,781 | | | $ | 33,458 | |
| (a) | Per share data based on average shares outstanding during the year. |
| (b) | Total investment returns may reflect adjustments to conform to generally accepted accounting principles. |
| | | | |
| M-432 | | MainStay VP U.S. Small Cap Portfolio | | The notes to the financial statements are an integral part of,
and should be read in conjunction with, the financial statements. |
MainStay VP Van Eck Global Hard Assets Portfolio
Investment and Performance Comparison1 (Unaudited)
Performance data quoted represents past performance. Past performance is no guarantee of future results. Because of market volatility, current performance may be lower or higher than the figures shown. Investment return and principal value will fluctuate, and as a result, when shares are redeemed, they may be worth more or less than their original cost. The performance table and graph do not reflect any deduction of sales charges, mortality and expense charges, contract charges or administrative charges. Please refer to the Performance Summary appropriate for your policy. For performance information current to the most recent month-end, please call 800-598-2019 or visit www.newyorklife.com.
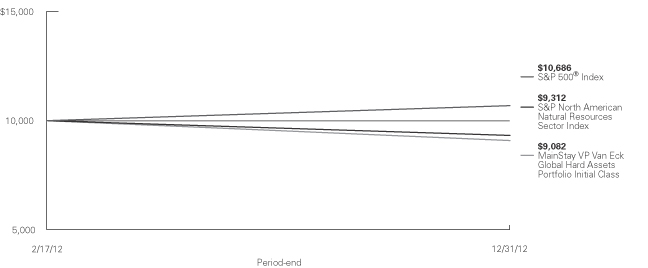
Total Returns for the Period Ended December 31, 2012
| | | | | | | | |
| Class | | Since Inception (2/17/12) | | | Gross Expense Ratio2 | |
| Initial Class Shares | | | –9.18 | % | | | 0.96 | % |
| | | | |
| Benchmark Performance | | Since Inception
(2/17/12) | |
S&P North American Natural Resources Sector Index3 | | | –6.88 | % |
S&P 500® Index3 | | | 6.86 | |
Average Lipper Variable Products Natural Resources Portfolio4 | | | –9.18 | |
| 1. | Performance figures reflect certain fee waivers and/or expense limitations, without which total returns may have been different. For information on current fee waivers and/or expense limitations, please refer to the notes to the financial statements. |
| 2. | The gross expense ratios presented reflect the Portfolio’s “Total Annual Portfolio Operating Expenses” from the most recent Prospectus and may differ from other expense ratios disclosed in this report. |
| 3. | Please refer to pages M-2 and M-3 for additional explanations and disclosure regarding the Portfolios, their benchmark indices and other indices mentioned in the reports. |
| 4. | The Average Lipper Variable Products Natural Resources Portfolio is representative of portfolios that, by portfolio practice, invest primarily in the equity securities of domestic companies engaged in the exploration, development, production, or distribution of natural resources. Lipper Inc. is an independent monitor of fund performance. Results are based on total returns with all dividend and capital gain distributions reinvested. |
| | | | |
| mainstayinvestments.com | | | M-433 | |
Cost in Dollars of a $1,000 Investment in MainStay VP Van Eck Global Hard Assets Portfolio (Unaudited)
The example below is intended to describe the fees and expenses borne by shareholders during the period from July 1, 2012, to December 31, 2012, and the impact of those costs on your investment.
Example
As a shareholder of the Portfolio, you incur two types of costs: (1) transaction costs, including exchange fees and sales charges (loads) on purchases (as applicable), and (2) ongoing costs, including management fees, distribution and/or service (12b-1) fees, and other Portfolio expenses (as applicable). This example is intended to help you understand your ongoing costs (in dollars) of investing in the Portfolio and to compare these costs with the ongoing costs of investing in other Portfolios. The example is based on an investment of $1,000 made at the beginning of the six-month period and held for the entire period from July 1, 2012, to December 31, 2012. Shares are only sold in connection with variable life and annuity contracts and the example does not reflect any contract level or transactional fees or expenses. If these costs had been included, your costs would have been higher.
This example illustrates your Portfolio’s ongoing costs in two ways:
Actual Expenses
The second and third data columns in the table below provide information about actual account values and actual expenses. You may use the information in these columns, together with the amount you invested, to estimate the expenses that you paid during the six months ended
December 31, 2012. Simply divide your account value by $1,000 (for example, an $8,600 account value divided by $1,000 = 8.6), then multiply the result by the number under the heading entitled ‘‘Expenses Paid During Period’’ to estimate the expenses you paid on your account during this period.
Hypothetical Example for Comparison Purposes
The fourth and fifth data columns in the table below provide information about hypothetical account values and hypothetical expenses based on the Portfolio’s actual expense ratio and an assumed rate of return of 5% per year before expenses, which is not the Portfolio’s actual return. The hypothetical account values and expenses may not be used to estimate the actual ending account balances or expenses you paid for the six-month period shown. You may use this information to compare the ongoing costs of investing in the Portfolio with the ongoing costs of investing in other Portfolios. To do so, compare this 5% hypothetical example with the 5% hypothetical examples that appear in the shareholder reports of the other Portfolios.
Please note that the expenses shown in the table are meant to highlight your ongoing costs only and do not reflect any transactional costs, such as exchange fees or sales charges (loads). Therefore, the fourth and fifth data columns of the table are useful in comparing ongoing costs only and will not help you determine the relative total costs of owning different funds. In addition, if these transactional costs were included, your costs would have been higher.
| | | | | | | | | | | | | | | | | | | | |
| | | | | | | | | | | | | | | | |
| Share Class | | Beginning
Account
Value
7/1/12 | | | Ending Account
Value (Based
on Actual
Returns and
Expenses)
12/31/12 | | | Expenses
Paid
During
Period1 | | | Ending Account
Value (Based
on Hypothetical
5% Annualized
Return and
Actual Expenses)
12/31/12 | | | Expenses
Paid
During
Period1 | |
| | | | | |
| Initial Class Shares | | $ | 1,000.00 | | | $ | 1,116.30 | | | $ | 5.00 | | | $ | 1,020.40 | | | $ | 4.77 | |
| 1. | Expenses are equal to the Portfolio’s annualized expense ratio of 0.94% multiplied by the average account value over the period, divided by 366 and multiplied by 184 (to reflect the six-month period). The table above represents the actual expenses incurred during the six-month period. |
| | |
| M-434 | | MainStay VP Van Eck Global Hard Assets Portfolio |
Portfolio Composition as of December 31, 2012 (Unaudited)
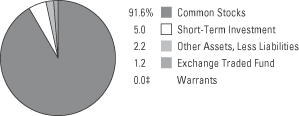
See Portfolio of Investments beginning on page M-438 for specific holdings within these categories.
| ‡ | Less than one-tenth of a percent. |
Top Ten Holdings as of December 31, 2012 (excluding short-term investment) (Unaudited)
| 1. | Anadarko Petroleum Corp. |
| 5. | Pioneer Natural Resources Co. |
| 8. | Rio Tinto PLC, Sponsored ADR |
| 9. | Occidental Petroleum Corp. |
| 10. | First Quantum Minerals, Ltd. |
| | | | |
| mainstayinvestments.com | | | M-435 | |
Portfolio Management Discussion and Analysis (Unaudited)
Answers to the questions reflect the views of co-portfolio managers Charles T. Cameron and Shawn Reynolds of Van Eck Associates Corporation, the Portfolio’s Subadvisor.
How did MainStay VP Van Eck Global Hard Assets Portfolio perform relative to its peers and its benchmark from February 17 through December 31, 2012?
The inception date for MainStay VP Van Eck Global Hard Assets Portfolio was February 17, 2012. From February 17 through December 31, 2012, the Portfo-lio returned –9.18% for Initial class shares. Over the same period, the Portfolio matched the –9.18% return of the average Lipper1 Variable Products Natural Resources Portfolio but underperformed the –6.88% return of the S&P North American Natural Resources Sector Index.1 The S&P North American Natural Resources Sector Index is the Portfolio’s broad-based securities-market index. The Portfolio also underperformed the 6.86% return of the S&P 500® Index1 for the period from February 17 through December 31, 2012. The S&P 500® Index is the Portfolio’s secondary benchmark.
What factors affected the Portfolio’s relative performance during the reporting period?
The Portfolio underperformed its benchmark in large part because of an overweight in the steel subindustry, as well as an overweight in oil-levered exploration & production companies relative to integrated oil & gas companies. Nevertheless, stock selection strengthened the Portfolio’s performance in several subindustries, including diversified metals & mining, oil & gas drilling, oil & gas equipment & services, as well as coal & consumable fuels.
Which subindustries were the strongest positive contributors to the Portfolio’s relative performance, and which subindustries were particularly weak?
The three subindustries that made the strongest positive contributions to performance relative to the S&P North American Natural Resources Sector Index were forest products, oil & gas drilling, and diversified metals & mining. (Contributions take weighting and total returns into account.) The three weakest-contributing subindustries to performance relative to the Index were steel, oil & gas exploration & production, and integrated oil & gas.
During the reporting period, which individual stocks made the strongest positive contributions to the Portfolio’s absolute performance and which stocks detracted the most?
Two of the strongest positive contributors to the Portfolio’s absolute performance were both oil refiners—HollyFrontier and Western Refining. Both benefited from differentials in the pricing of West Texas Intermediate and Brent crude oil during the reporting period. Strong crack spreads further supported each of these refiners’ share price gains. (Crack spreads represent the differential between the price of crude oil and petroleum products extracted from it.) Another strong performer during the reporting period was building materials manufacturer Louisiana-Pacific. The company’s shares rose because of an improved housing market and strength in lumber and wood panel prices.
Among the stocks that detracted from the Portfolio’s absolute performance were U.S. iron ore and coal mining company Cliffs Natural Resources, oil & gas exploration & production company SM Energy and gold company Newmont Mining. Shares of Cliffs Natural Resources declined because of weak iron ore pricing during the reporting period. SM Energy was hurt by falling natural gas liquids prices.
Did the Portfolio make any significant purchases or sales during the reporting period?
During the reporting period, we established a new position in integrated oil company Marathon Oil. We also initiated positions in Canadian gold mining companies Eldorado Gold and diversified metals & mining company Freeport-McMoRan Copper & Gold.
During the reporting period, we sold the Portfolio’s positions in integrated oil company Pacific Rubiales Energy. We also eliminated the Portfolio’s positions in agricultural chemicals company Potash Corp. of Saskatchewan.
| 1. | Please refer to pages M-2 and M-3 for additional explanations and disclosure regarding the Portfolios, their benchmark indices and service providers mentioned in the reports. |
| | |
| M-436 | | MainStay VP Van Eck Global Hard Assets Portfolio |
How did the Portfolio’s sector weightings change during the reporting period?
To a modest degree, we increased the Portfolio’s allocation to steel companies, as we anticipate that a demand recovery in China may continue and that U.S. steel prices may rebound. In energy, we increased the Portfolio’s allocation to companies in oil services and exploration and production.
We decreased exposure to integrated oil companies and to coal companies. We reduced the Portfolio’s allocation to agricultural companies, taking profits on relative strength. We also reduced the Portfolio’s allocation to gold mining companies.
How was the Portfolio positioned at the end of the reporting period?
As of December 31, 2012, the Portfolio maintained an underweight position relative to the S&P North American Natural Resources Sector Index in energy stocks overall, but remained overweight among oil & gas drilling and, to a lesser extent, oil & gas explora-tion & production, and oil & gas equipment & services. The Portfolio was also overweight in diversified metals & mining and steel. As of the same date, the Portfolio was significantly underweight relative to the Index in integrated oil companies.
The opinions expressed are those of the portfolio managers as of the date of this report and are subject to change. There is no guarantee that any forecasts made will come to pass. This material does not constitute investment advice and is not intended as an endorsement of any specific investment.
Not all MainStay VP Portfolios and/or share classes are available under all policies.
| | | | |
| mainstayinvestments.com | | | M-437 | |
Portfolio of Investments December 31, 2012
| | | | | | | | |
| | |
| | | Shares | | | Value | |
| | | | | | | | |
| Common Stocks 91.6%† | |
Bermuda 2.5% | |
African Minerals, Ltd. (Metals & Mining) (a) | | | 427,000 | | | $ | 2,226,546 | |
Seadrill, Ltd. (Energy Equipment & Services) | | | 352,000 | | | | 12,972,675 | |
| | | | | | | | |
| | | | | | | 15,199,221 | |
| | | | | | | | |
Canada 10.6% | |
Eldorado Gold Corp. (Metals & Mining) | | | 609,700 | | | | 7,852,936 | |
¨First Quantum Minerals, Ltd. (Metals & Mining) | | | 673,200 | | | | 14,828,403 | |
Goldcorp, Inc. (Metals & Mining) | | | 261,600 | | | | 9,600,720 | |
IAMGOLD Corp. (Metals & Mining) | | | 786,700 | | | | 9,023,449 | |
Kinross Gold Corp. (Metals & Mining) | | | 645,900 | | | | 6,278,148 | |
New Gold, Inc. (Metals & Mining) (a) | | | 854,000 | | | | 9,419,620 | |
Osisko Mining Corp. (Metals & Mining) (a) | | | 923,300 | | | | 7,425,756 | |
| | | | | | | | |
| | | | | | | 64,429,032 | |
| | | | | | | | |
Switzerland 2.0% | |
Noble Corp. (Energy Equipment & Services) | | | 213,500 | | | | 7,434,070 | |
Weatherford International, Ltd. (Energy Equipment & Services) (a) | | | 436,600 | | | | 4,885,554 | |
| | | | | | | | |
| | | | | | | 12,319,624 | |
| | | | | | | | |
United Kingdom 14.7% | |
Afren PLC (Oil, Gas & Consumable Fuels) (a) | | | 4,903,000 | | | | 10,750,093 | |
BHP Billiton PLC (Metals & Mining) | | | 363,500 | | | | 12,773,209 | |
Ensco PLC Class A (Energy Equipment & Services) | | | 205,800 | | | | 12,199,824 | |
Ophir Energy PLC (Oil, Gas & Consumable Fuels) (a) | | | 402,000 | | | | 3,349,012 | |
Randgold Resources, Ltd., ADR (Metals & Mining) (b) | | | 105,800 | | | | 10,500,650 | |
¨Rio Tinto PLC, Sponsored ADR (Metals & Mining) (b) | | | 282,800 | | | | 16,427,852 | |
¨Xstrata PLC (Metals & Mining) | | | 1,313,700 | | | | 23,365,558 | |
| | | | | | | | |
| | | | | | | 89,366,198 | |
| | | | | | | | |
United States 61.8% | |
Alpha Natural Resources, Inc. (Oil, Gas & Consumable Fuels) (a) | | | 143,400 | | | | 1,396,716 | |
¨Anadarko Petroleum Corp. (Oil, Gas & Consumable Fuels) | | | 357,800 | | | | 26,588,118 | |
Apache Corp. (Oil, Gas & Consumable Fuels) | | | 84,600 | | | | 6,641,100 | |
Berry Petroluem Co. Class A (Oil, Gas & Consumable Fuels) | | | 78,900 | | | | 2,647,095 | |
Cameron International Corp. (Energy Equipment & Services) (a) | | | 162,600 | | | | 9,180,396 | |
¨Cimarex Energy Co. (Oil, Gas & Consumable Fuels) | | | 317,400 | | | | 18,323,502 | |
Cliffs Natural Resources, Inc. (Metals & Mining) | | | 232,700 | | | | 8,972,912 | |
| | | | | | | | |
| | |
| | | Shares | | | Value | |
| | | | | | | | |
United States (continued) | | | | | | | | |
Cloud Peak Energy, Inc. (Oil, Gas & Consumable Fuels) (a) | | | 171,200 | | | $ | 3,309,296 | |
Concho Resources, Inc. (Oil, Gas & Consumable Fuels) (a) | | | 148,100 | | | | 11,930,936 | |
CONSOL Energy, Inc. (Oil, Gas & Consumable Fuels) | | | 348,200 | | | | 11,177,220 | |
Cummins, Inc. (Machinery) | | | 71,200 | | | | 7,714,520 | |
Diamond Offshore Drilling, Inc. (Energy Equipment & Services) | | | 203,900 | | | | 13,857,044 | |
Diamondback Energy, Inc. (Oil, Gas & Consumable Fuels) (a) | | | 88,500 | | | | 1,692,120 | |
Dril-Quip, Inc. (Energy Equipment & Services) (a) | | | 159,600 | | | | 11,658,780 | |
Freeport-McMoRan Copper & Gold, Inc. (Metals & Mining) | | | 205,800 | | | | 7,038,360 | |
Green Plains Renewable Energy, Inc. (Oil, Gas & Consumable Fuels) (a) | | | 78,900 | | | | 624,099 | |
Gulfport Energy Corp. (Oil, Gas & Consumable Fuels) (a) | | | 113,500 | | | | 4,337,970 | |
¨Halliburton Co. (Energy Equipment & Services) | | | 707,800 | | | | 24,553,582 | |
HollyFrontier Corp. (Oil, Gas & Consumable Fuels) | | | 223,100 | | | | 10,385,305 | |
Jacobs Engineering Group, Inc. (Construction & Engineering) (a) | | | 76,900 | | | | 3,273,633 | |
Key Energy Services, Inc. (Energy Equipment & Services) (a) | | | 234,700 | | | | 1,631,165 | |
Louisiana-Pacific Corp. (Paper & Forest Products) (a) | | | 688,600 | | | | 13,303,752 | |
¨Marathon Oil Corp. (Oil, Gas & Consumable Fuels) | | | 540,500 | | | | 16,571,730 | |
Mosaic Co. (The) (Chemicals) | | | 113,500 | | | | 6,427,505 | |
National-Oilwell Varco, Inc. (Energy Equipment & Services) | | | 192,300 | | | | 13,143,705 | |
Newfield Exploration Co. (Oil, Gas & Consumable Fuels) (a) | | | 298,100 | | | | 7,983,118 | |
Newmont Mining Corp. (Metals & Mining) | | | 307,800 | | | | 14,294,232 | |
¨Occidental Petroleum Corp. (Oil, Gas & Consumable Fuels) | | | 213,500 | | | | 16,356,235 | |
Patterson-UTI Energy, Inc. (Energy Equipment & Services) | | | 398,200 | | | | 7,418,466 | |
¨Pioneer Natural Resources Co. (Oil, Gas & Consumable Fuels) | | | 184,700 | | | | 19,687,173 | |
¨Schlumberger, Ltd. (Energy Equipment & Services) | | | 346,200 | | | | 23,988,198 | |
SM Energy Co. (Oil, Gas & Consumable Fuels) | | | 257,700 | | | | 13,454,517 | |
Steel Dynamics, Inc. (Metals & Mining) | | | 277,000 | | | | 3,803,210 | |
Tesoro Corp. (Oil, Gas & Consumable Fuels) | | | 165,400 | | | | 7,285,870 | |
| † | Percentages indicated are based on Portfolio net assets. |
| ¨ | | Among the Portfolio’s 10 largest holdings, as of December 31, 2012, excluding short-term investment. May be subject to change daily. |
| | | | |
| M-438 | | MainStay VP Van Eck Global Hard Assets Portfolio | | The notes to the financial statements are an integral part of,
and should be read in conjunction with, the financial statements. |
| | | | | | | | |
| | |
| | | Shares | | | Value | |
| | | | | | | | |
| Common Stocks (continued) | |
United States (continued) | | | | | | | | |
United States Steel Corp. (Metals & Mining) | | | 223,100 | | | $ | 5,325,397 | |
Western Refining, Inc. (Oil, Gas & Consumable Fuels) | | | 321,200 | | | | 9,054,628 | |
Whiting Petroleum Corp. (Oil, Gas & Consumable Fuels) (a) | | | 257,700 | | | | 11,176,449 | |
| | | | | | | | |
| | | | | | | 376,208,054 | |
| | | | | | | | |
Total Common Stocks
(Cost $616,070,267) | | | | | | | 557,522,129 | |
| | | | | | | | |
|
| Exchange Traded Fund 1.2%(c) | |
United States 1.2% | |
SPDR Gold Shares (Capital Markets) (a) | | | 46,200 | | | | 7,484,862 | |
| | | | | | | | |
Total Exchange Traded Fund
(Cost $7,716,910) | | | | | | | 7,484,862 | |
| | | | | | | | |
| | |
| | | | | | | | |
| | | Number of
Warrants | | | | |
| | | | | | | | |
| Warrants 0.0%‡ | |
Canada 0.0%‡ | |
Kinross Gold Corp.
Strike Price $21.30
Expires 9/17/14 (Metals & Mining) (a) | | | 34,300 | | | | 10,173 | |
| | | | | | | | |
Total Warrants
(Cost $36,859) | | | | | | | 10,173 | |
| | | | | | | | |
| | |
| | | | | | | | |
| | | Principal
Amount | | | | |
| | | | | | | | |
| Short-Term Investment 5.0% | |
Repurchase Agreement 5.0% | |
United States 5.0% | | | | | | | | |
State Street Bank and Trust Co.
0.01%, dated 12/31/12
due 1/2/13
Proceeds at Maturity $30,461,325 (Collateralized by a Federal Home Loan Mortgage Corp. security with a rate of 2.07% and a maturity date of 11/7/22, with a Principal Amount of $31,360,000 and a Market Value of $31,071,018) (Capital Markets) | | $ | 30,461,308 | | | | 30,461,308 | |
| | | | | | | | |
Total Short-Term Investment
(Cost $30,461,308) | | | | | | | 30,461,308 | |
| | | | | | | | |
Total Investments
(Cost $654,285,344) (d) | | | 97.8 | % | | | 595,478,472 | |
Other Assets, Less Liabilities | | | 2.2 | | | | 13,499,833 | |
Net Assets | | | 100.0 | % | | $ | 608,978,305 | |
| ‡ | Less than one-tenth of a percent. |
| (a) | Non-income producing security. |
| (b) | ADR—American Depositary Receipt. |
| (c) | Exchange Traded Fund—An investment vehicle that represents a basket of securities that is traded on an exchange. |
| (d) | As of December 31, 2012, cost is $655,154,255 for federal income tax purposes and net unrealized depreciation is as follows: |
| | | | |
Gross unrealized appreciation | | $ | 22,167,420 | |
Gross unrealized depreciation | | | (81,843,203 | ) |
| | | | |
Net unrealized depreciation | | $ | (59,675,783 | ) |
| | | | |
The following abbreviation is used in the above portfolio:
SPDR—Standard & Poor’s Depositary Receipt
| | | | | | |
The notes to the financial statements are an integral part of,
and should be read in conjunction with, the financial statements. | | mainstayinvestments.com | | | M-439 | |
Portfolio of Investments December 31, 2012 (continued)
The following is a summary of the fair valuations according to the inputs used as of December 31, 2012, for valuing the Portfolio’s assets.
Asset Valuation Inputs
| | | | | | | | | | | | | | | | |
Description | | Quoted Prices in
Active Markets
for Identical Assets
(Level 1) | | | Significant Other
Observable Inputs
(Level 2) | | | Significant
Unobservable
Inputs
(Level 3) | | | Total | |
| Investments in Securities (a) | | | | | | | | | | | | | | | | |
| Common Stocks | | | | | | | | | | | | | | | | |
Bermuda | | $ | — | | | $ | 15,199,221 | | | $ | — | | | $ | 15,199,221 | |
United Kingdom | | | 39,128,326 | | | | 50,237,872 | | | | — | | | | 89,366,198 | |
All Other Countries | | | 452,956,710 | | | | — | | | | — | | | | 452,956,710 | |
| | | | | | | | | | | | | | | | |
| Total Common Stocks | | | 492,085,036 | | | | 65,437,093 | | | | — | | | | 557,522,129 | |
| | | | | | | | | | | | | | | | |
| Exchange Traded Fund | | | 7,484,862 | | | | — | | | | — | | | | 7,484,862 | |
| Warrants | | | 10,173 | | | | — | | | | — | | | | 10,173 | |
| Short-Term Investment | | | | | | | | | | | | | | | | |
Repurchase Agreement (b) | | | — | | | | 30,461,308 | | | | — | | | | 30,461,308 | |
| | | | | | | | | | | | | | | | |
| Total Investments in Securities | | $ | 499,580,071 | | | $ | 95,898,401 | | | $ | — | | | $ | 595,478,472 | |
| | | | | | | | | | | | | | | | |
| (a) | For a complete listing of investments and their industries, see the Portfolio of Investments. |
The Portfolio recognizes transfers between the levels as of the beginning of the period.
As of December 31, 2012, the Portfolio did not hold any investments with significant unobservable inputs (Level 3). (See Note 2)
The table below sets forth the diversification of MainStay VP Van Eck Global Hard Assets Portfolio investments by industry.
Industry Diversification (Unaudited)
| | | | | | | | |
| | | Value | | | Percent † | |
Capital Markets | | $ | 37,946,170 | | | | 6.2 | % |
Chemicals | | | 6,427,505 | | | | 1.0 | |
Construction & Engineering | | | 3,273,633 | | | | 0.5 | |
Energy Equipment & Services | | | 142,923,459 | | | | 23.5 | |
Machinery | | | 7,714,520 | | | | 1.3 | |
Metals & Mining | | | 169,167,131 | | | | 27.8 | |
Oil, Gas & Consumable Fuels | | | 214,722,302 | | | | 35.3 | |
Paper & Forest Products | | | 13,303,752 | | | | 2.2 | |
| | | | | | | | |
| | | 595,478,472 | | | | 97.8 | |
Other Assets, Less Liabilities | | | 13,499,833 | | | | 2.2 | |
| | | | | | | | |
Net Assets | | $ | 608,978,305 | | | | 100.0 | % |
| | | | | | | | |
| † | Percentages indicated are based on Portfolio net assets. |
| | | | |
| M-440 | | MainStay VP Van Eck Global Hard Assets Portfolio | | The notes to the financial statements are an integral part of,
and should be read in conjunction with, the financial statements. |
Statement of Assets and Liabilities as of December 31, 2012
| | | | |
| Assets | |
Investment in securities, at value
(identified cost $654,285,344) | | $ | 595,478,472 | |
Cash denominated in foreign currencies
(identified cost $208) | | | 211 | |
Receivables: | | | | |
Investment securities sold | | | 14,332,278 | |
Dividends and interest | | | 209,770 | |
Fund shares sold | | | 91,574 | |
Other assets | | | 1,357 | |
| | | | |
Total assets | | | 610,113,662 | |
| | | | |
| |
| Liabilities | | | | |
Payables: | | | | |
Fund shares redeemed | | | 580,993 | |
Manager (See Note 3) | | | 454,283 | |
Shareholder communication | | | 49,584 | |
Professional fees | | | 45,529 | |
Custodian | | | 4,105 | |
Trustees | | | 863 | |
| | | | |
Total liabilities | | | 1,135,357 | |
| | | | |
Net assets | | $ | 608,978,305 | |
| | | | |
| |
| Net Assets Consist of | | | | |
Shares of beneficial interest outstanding (par value of $.001 per share) unlimited number of shares authorized | | $ | 67,063 | |
Additional paid-in capital | | | 675,565,219 | |
| | | | |
| | | 675,632,282 | |
Undistributed net investment income | | | 5,855,465 | |
Accumulated net realized gain (loss) on investments and foreign currency transactions | | | (13,702,122 | ) |
Net unrealized appreciation (depreciation) on investments | | | (58,806,872 | ) |
Net unrealized appreciation (depreciation) on translation of other assets and liabilities in foreign currencies | | | (448 | ) |
| | | | |
Net assets applicable to outstanding shares | | $ | 608,978,305 | |
| | | | |
Shares of beneficial interest outstanding | | | 67,063,142 | |
| | | | |
Net asset value per share outstanding | | $ | 9.08 | |
| | | | |
| | | | | | |
The notes to the financial statements are an integral part of,
and should be read in conjunction with, the financial statements. | | mainstayinvestments.com | | | M-441 | |
Statement of Operations
for the period February 17, 2012 (inception date) through December 31, 2012
| | | | |
| Investment Income (Loss) | |
Income | | | | |
Dividends (a) | | $ | 10,563,112 | |
Interest | | | 3,375 | |
| | | | |
Total income | | | 10,566,487 | |
| | | | |
Expenses | | | | |
Manager (See Note 3) | | | 4,907,728 | |
Shareholder communication | | | 104,889 | |
Professional fees | | | 77,334 | |
Custodian | | | 23,226 | |
Trustees | | | 13,445 | |
Miscellaneous | | | 33,601 | |
| | | | |
Total expenses | | | 5,160,223 | |
| | | | |
Net investment income (loss) | | | 5,406,264 | |
| | | | |
|
| Realized and Unrealized Gain (Loss) on Investments and Foreign Currency Transactions | |
Net realized gain (loss) on: | | | | |
Security transactions | | | (13,221,483 | ) |
Foreign currency transactions | | | (31,438 | ) |
| | | | |
Net realized gain (loss) on investments and foreign
currency transactions | | | (13,252,921 | ) |
| | | | |
Net change in unrealized appreciation (depreciation) on: | | | | |
Investments | | | (58,806,872 | ) |
Translation of other assets and liabilities in
foreign currencies | | | (448 | ) |
| | | | |
Net change in unrealized appreciation (depreciation) on investments and foreign currency transactions | | | (58,807,320 | ) |
| | | | |
Net realized and unrealized gain (loss) on investments and foreign currency transactions | | | (72,060,241 | ) |
| | | | |
Net increase (decrease) in net assets resulting
from operations | | $ | (66,653,977 | ) |
| | | | |
| (a) | Dividends recorded net of foreign withholding taxes in the amount of $148,562. |
| | | | |
| M-442 | | MainStay VP Van Eck Global Hard Assets Portfolio | | The notes to the financial statements are an integral part of,
and should be read in conjunction with, the financial statements. |
Statements of Changes in Net Assets
for the period February 17, 2012 (inception date) through December 31, 2012
| | | | |
| | | 2012 | |
| Increase (Decrease) in Net Assets | | | | |
Operations: | | | | |
Net investment income (loss) | | $ | 5,406,264 | |
Net realized gain (loss) on investments and foreign currency transactions | | | (13,252,921 | ) |
Net change in unrealized appreciation (depreciation) on investments and foreign currency transactions | | | (58,807,320 | ) |
| | | | |
Net increase (decrease) in net assets resulting
from operations | | | (66,653,977 | ) |
| | | | |
Capital share transactions: | | | | |
Net proceeds from sale of shares | | | 784,047,718 | |
Cost of shares redeemed | | | (108,415,436 | ) |
| | | | |
Increase (decrease) in net assets derived from capital share transactions | | | 675,632,282 | |
| | | | |
Net increase (decrease) in net assets | | | 608,978,305 | |
| |
| Net Assets | | | | |
Beginning of period | | | — | |
| | | | |
End of period | | $ | 608,978,305 | |
| | | | |
Undistributed net investment income at end of period | | $ | 5,855,465 | |
| | | | |
| | | | | | |
The notes to the financial statements are an integral part of,
and should be read in conjunction with, the financial statements. | | mainstayinvestments.com | | | M-443 | |
Financial Highlights selected per share data and ratios
| | | | |
| | | Initial Class | |
| | | February 17,
2012**
through
December 31, | |
| | | 2012 | |
Net asset value at beginning of period | | $ | 10.00 | |
| | | | |
Net investment income (loss) | | | 0.08 | |
Net realized and unrealized gain (loss) on investments | | | (1.00 | ) |
| | | | |
Total from investment operations | | | (0.92 | ) |
| | | | |
Net asset value at end of period | | $ | 9.08 | |
| | | | |
Total investment return | | | (9.20 | %)(a)(b) |
Ratios (to average net assets)/Supplemental Data: | | | | |
Net investment income (loss) | | | 0.98 | % †† |
Net expenses | | | 0.94 | % †† |
Portfolio turnover rate | | | 24 | % |
Net assets at end of period (in 000’s) | | $ | 608,978 | |
| (a) | Total investment return is not annualized. |
| (b) | Total investment return may reflect adjustments to conform to generally accepted accounting principles. |
| | | | |
| M-444 | | MainStay VP Van Eck Global Hard Assets Portfolio | | The notes to the financial statements are an integral part of,
and should be read in conjunction with, the financial statements. |
Notes to Financial Statements
Note 1–Organization and Business
MainStay VP Funds Trust (the “Fund”) was organized as a Delaware statutory trust on February 1, 2011. The Fund is registered under the Investment Company Act of 1940, as amended (the “1940 Act”), as an open-end investment management company and is comprised of twenty-eight separate series (each a “Portfolio” and collectively, the “Portfolios”). Effective April 29, 2011, each Portfolio that was a series of MainStay VP Series Fund, Inc., a Maryland corporation, merged into a corresponding “shell” series of the Fund. Each shell series succeeded to the accounting and performance histories of its corresponding predecessor portfolio. Therefore, for periods prior to April 29, 2011, any such historical information provided for each Portfolio is that of the corresponding predecessor portfolio. On April 29, 2011, the Fund assumed MainStay VP Series Fund, Inc.‘s registration statement pursuant to Rule 414 under the Securities Act of 1933, as amended, and the 1940 Act.
The Portfolios commenced operations on the dates indicated below:
| | |
Commencement
of Operations | | Portfolios |
January 23, 1984 | | Bond and Common Stock |
January 29, 1993 | | Cash Management, Government, Growth Equity,(a) Income Builder and S&P 500 Index |
May 1, 1995 | | High Yield Corporate Bond and International Equity |
October 1, 1996 | | Convertible |
May 1, 1998 | | ICAP Select Equity, Large Cap Growth and U.S. Small Cap |
July 2, 2001 | | Mid Cap Core |
May 2, 2005 | | Balanced and Floating Rate |
February 13, 2006 | | Conservative Allocation, Growth Allocation, Moderate Allocation and Moderate Growth Allocation |
April 29, 2011 | | Flexible Bond Opportunities(b) |
February 17, 2012 | | DFA / DuPont Capital Emerging Markets Equity, Eagle Small Cap Growth, Janus Balanced, MFS® Utilities, PIMCO Real Return, T. Rowe Price Equity Income and Van Eck Global Hard Assets |
| (a) | Effective May 1, 2013, the name of MainStay VP Growth Equity Portfolio will change to MainStay VP Cornerstone Growth Portfolio. Please see the supplement dated January 11, 2013, to the Prospectus dated May 1, 2012 for more information. |
| (b) | Effective May 1, 2013, the name of MainStay VP Flexible Bond Opportunities Portfolio will change to MainStay VP Unconstrained Bond Portfolio. Please see the supplement dated December 13, 2012, to the Prospectus dated May 1, 2012 for more information. |
Shares of the Portfolios are currently offered to New York Life Insurance and Annuity Corporation (“NYLIAC”), a wholly-owned subsidiary of New York Life Insurance Company (“New York Life”). NYLIAC allocates shares of the Portfolios to, among others, NYLIAC Variable Annuity Separate Accounts-I, II, III and IX, VUL Separate Account-I
and CSVUL Separate Account-I (collectively, the “Separate Accounts”). The Separate Accounts are used to fund flexible premium deferred variable annuity contracts and variable life insurance policies. Shares of the Portfolios are also offered to the Asset Allocation Portfolios (as defined below), which may invest in and own shares in any of the Portfolios or other MainStay Funds.
On May 13, 2003, the Board of Directors of MainStay VP Series Fund Inc. adopted a Multiple Class Plan under which the existing shares of each of the predecessor portfolios, except the Cash Management Portfolio, were re-classified as Initial Class shares, and a second class of shares, the Service Class was established. On April 5, 2011, the Board of Trustees (“Board”) of the Fund adopted a Multiple Class Plan that is the same in all material respects as the May 13, 2003 Multiple Class Plan. Under the terms of the Multiple Class Plan, the classes differ in that, pursuant to a plan adopted in accordance with Rule 12b-1 under the 1940 Act, Service Class shares pay a combined distribution and service fee of 0.25% of average daily net assets to the Distributor (as defined below) of their shares. Contract owners of variable annuity contracts purchased after June 2, 2003 are permitted to invest only in the Service Class shares.
The Service Class of each Portfolio commenced operations on the dates indicated below:
| | |
Commencement
of Operations | | Portfolios |
June 4, 2003 | | Bond, Government, High Yield Corporate Bond and Income Builder |
June 5, 2003 | | Common Stock, Convertible, Growth Equity, ICAP Select Equity, International Equity, Mid Cap Core, S&P 500 Index and U.S. Small Cap |
June 6, 2003 | | Large Cap Growth |
May 2, 2005 | | Balanced and Floating Rate |
February 13, 2006 | | Conservative Allocation, Growth Allocation, Moderate Allocation and Moderate Growth Allocation |
April 29, 2011 | | Flexible Bond Opportunities |
February 17, 2012 | | DFA / DuPont Capital Emerging Markets Equity, Eagle Small Cap Growth, Janus Balanced, MFS® Utilities, PIMCO Real Return and T. Rowe Price Equity Income |
The investment objective for each Portfolio is as follows:
Balanced: seeks total return.
Bond: seeks total return.
Cash Management: seeks a high level of current income while preserving capital and maintaining liquidity.
Common Stock: seeks long-term growth of capital.
Conservative Allocation: seeks current income and, secondarily, long-term growth of capital.
Convertible: seeks capital appreciation together with current income.
| | | | |
| mainstayinvestments.com | | | M-445 | |
Notes to Financial Statements (continued)
DFA / DuPont Capital Emerging Markets Equity: seeks long-term capital appreciation.
Eagle Small Cap Growth: seeks long-term capital appreciation.
Flexible Bond Opportunities: seeks current income and total return by investing primarily in domestic and foreign debt securities. Effective May 1, 2013, the Portfolio’s investment objective will be revised to: seeks total return by investing primarily in domestic and foreign debt securities. Please see the supplement dated December 13, 2012, to the Prospectus dated May 1, 2012 for more information.
Floating Rate: seeks high current income.
Government: seeks current income.
Growth Allocation: seeks long-term growth of capital.
Growth Equity: seeks long-term growth of capital.
High Yield Corporate Bond: seeks maximum current income through investment in a diversified portfolio of high-yield debt securities. Capital appreciation is a secondary objective.
ICAP Select Equity: seeks total return.
Income Builder: seeks current income consistent with reasonable opportunity for future growth of capital and income.
International Equity: seeks long-term growth of capital.
Janus Balanced: seeks long-term capital growth, consistent with preservation of capital and balanced current income.
Large Cap Growth: seeks long-term growth of capital.
MFS® Utilities: seeks total return.
Mid Cap Core: seeks long-term growth of capital.
Moderate Allocation: seeks long-term growth of capital and, secondarily, current income.
Moderate Growth Allocation: seeks long-term growth of capital and, secondarily, current income.
PIMCO Real Return: seeks maximum real return, consistent with preservation of real capital and prudent investment management.
S&P 500 Index: seeks investment results that correspond to the total return performance (reflecting reinvestment of dividends) of common stocks in the aggregate as represented by the S&P 500® Index.
T. Rowe Price Equity Income: seeks substantial dividend income as well as long-term growth of capital through investments in the common stocks of established companies.
U.S. Small Cap: seeks long-term capital appreciation by investing primarily in securities of small-cap companies.
Van Eck Global Hard Assets: seeks long-term capital appreciation by investing primarily in hard asset securities. Income is a secondary consideration.
The Conservative Allocation, Growth Allocation, Moderate Allocation and Moderate Growth Allocation Portfolios (collectively, the “Asset Allocation Portfolios”) operate as “funds-of-funds.” The Asset Allocation Portfolios may invest in other Portfolios of the Fund as well as funds of The MainStay Funds, a Massachusetts business trust, Eclipse Funds Inc., a Maryland corporation, and MainStay Funds Trust, a Delaware statutory trust, for which New York Life Investment Management LLC also serves as manager (the “Underlying Portfolios/Funds”).
Prior to May 1, 2012, the investment objectives of certain Portfolios were as follows:
Balanced: seeks high total return.
Bond: seeks the highest income over the long term consistent with preservation of principal.
Common Stock: seeks long-term growth of capital, with income as a secondary consideration.
Government: seeks a high level of current income, consistent with safety of principal.
ICAP Select Equity: seeks a superior total return.
International Equity: seeks to provide long-term growth of capital commensurate with an acceptable level of risk by investing in a portfolio consisting primarily of non-U.S. equity securities. Current income is a secondary objective.
Note 2–Significant Accounting Policies
Each Portfolio prepares its financial statements in accordance with generally accepted accounting principles (“GAAP”) in the United States of America and follows the significant accounting policies described below.
In December 2011, the FASB issued new accounting guidance that requires additional disclosures on financial instruments and derivative instruments that are either offset in accordance with existing accounting guidance or are subject to an enforceable master netting arrangement or similar agreement. The new requirements do not change the accounting guidance on netting, but rather enhance the disclosures to more clearly show the impact of netting arrangements on a company’s financial position. This new accounting guidance will be effective, on a retrospective basis for all comparative periods presented, beginning on January 1, 2013. Management is currently evaluating the impact the adoption of this accounting guidance will have on the financial statements of the Portfolios.
(A) Securities Valuation. Investments are valued as of the close of regular trading on the New York Stock Exchange (“Exchange”) (generally 4:00 p.m. Eastern time) on each day the Portfolios are open for business (“valuation date”).
The Board has adopted procedures for the valuation of each Portfolio’s securities and has delegated the responsibility
| | |
| M-446 | | MainStay VP Funds Trust |
for valuation determination under those procedures to the Valuation Committee of the Portfolios (the “Valuation Committee”). The Board has authorized the Valuation Committee to appoint a Valuation Sub-Committee (the “Sub-Committee”) to deal in the first instance with questions that arise or cannot be resolved under these procedures. The Sub-Committee will meet (in person, via electronic mail or via teleconference) on an as-needed basis. The Valuation Committee shall meet at a later time, as necessary, to ensure that actions taken by the Sub-Committee were appropriate. The procedures recognize that, subject to the oversight of the Board and unless otherwise noted, the responsibility for day-to-day valuation of portfolio assets (including securities for which market prices are not readily available) rests with New York Life Investment Management LLC (“New York Life Investments” or the “Manager”), aided to whatever extent necessary by the Subadvisor (as defined in Note 3(A)) of each Portfolio.
To assess the appropriateness of security valuations, the Manager or the Fund’s third party service provider who is subject to oversight by the Manager, regularly compares prior day prices, prices on comparable securities and the sale prices to the prior and current day prices and challenges prices exceeding certain tolerance levels with third party pricing services or broker sources. For those securities valued by recommendation, whether through a standardized fair valuation methodology or a fair valuation determination, the Valuation Committee reviews and affirms the reasonableness of the valuation based on such methodologies and determinations on a regular basis after considering all relevant information that is reasonably available.
“Fair value” is defined as the price that a Portfolio would receive upon selling an investment in an orderly transaction to an independent buyer in the principal or most advantageous market of the investment. Fair value measurements are determined within a framework that has established a three-tier hierarchy which maximizes the use of observable market data and minimizes the use of unobservable inputs to establish classification of fair value measurements for disclosure purposes. “Inputs” refer broadly to the assumptions that market participants would use in pricing the asset or liability, including assumptions about risk, such as the risk inherent in a particular valuation technique used to measure fair value using a pricing model and/or the risk inherent in the inputs for the valuation technique. Inputs may be observable or unobservable. Observable inputs reflect the assumptions market participants would use in pricing the asset or liability based on market data obtained from sources independent of each Portfolio. Unobservable inputs reflect each Portfolio’s own assumptions about the assumptions market participants would use in pricing the asset or liability developed based on the information available in the circumstances. The inputs or methodology used for valuing securities may not be an indication of the risks associated with investing in those securities. The three-tier hierarchy of inputs is summarized in the three broad Levels listed below.
| • | | Level 1—quoted prices in active markets for identical investments |
| • | | Level 2—other significant observable inputs (including quoted prices for similar investments in active markets, interest rates and yield curves, prepayment speeds, credit risks, etc.) |
| • | | Level 3—significant unobservable inputs (including each Portfolio’s own assumptions about the assumptions that market participants would use in determining the fair value of investments) |
The aggregate value by input level, as of December 31, 2012, for each Portfolio’s investments is included at the end of each Portfolio’s respective Portfolio of Investments.
The valuation techniques used by the Portfolios to measure fair value maximize the use of observable inputs and minimize the use of unobservable inputs. The Portfolios may utilize third party vendor evaluations, whose prices may be derived from one or more of the following standard inputs:
| | |
• Benchmark Yields | | • Reported Trades |
• Broker Dealer Quotes | | • Issuer Spreads |
• Two-sided markets | | • Benchmark securities |
• Bids / Offers | | • Reference Data (corporate actions or material event notices) |
• Industry and economic events | | • Comparable bonds |
• Equity and credit default swap curves | | • Monthly payment information |
Securities for which market value cannot be determined using the methodologies described above are valued by methods deemed in good faith by the Portfolios’ Valuation Committee, following the procedures established by the Board, to represent fair value. Under these procedures, the Portfolios primarily employ a market-based approach which may use related or comparable assets or liabilities, recent transactions, market multiples, book values, and other relevant information. The Portfolios may also use an income-based valuation approach in which the anticipated future cash flows of the investment are discounted to calculate fair value. Discounts may also be applied due to the nature or duration of any restrictions on the disposition of the investments. Due to the inherent uncertainty of valuations of such investments, the fair values may differ significantly from the values that would have been used had an active market existed. For the year ended, December 31, 2012, there have been no changes to the fair value methodologies.
Equity and non-equity securities which may be valued in this manner include, but are not limited to: (i) a security for which the trading has been halted or suspended; (ii) a debt security that has recently gone into default and for which there is not a current market quotation; (iii) a security of an issuer that has entered into a restructuring; (iv) a security that has been de-listed from a national exchange; (v) a security for which
| | | | |
| mainstayinvestments.com | | | M-447 | |
Notes to Financial Statements (continued)
the market price is not available from a third party pricing source or, if so provided, does not, in the opinion of a Portfolio’s Manager or Subadvisors reflect the security’s market value; and (vi) a security whose principal market is temporarily closed at a time when, under normal conditions, it would be open. Securities for which market quotations or observable inputs are not readily available are generally categorized as Level 3 in the hierarchy. As of December 31, 2012, the Convertible, DFA / DuPont Capital Emerging Markets Equity, Floating Rate, High Yield Corporate Bond, Income Builder and MFS® Utilities Portfolios held securities with values of $234, $43,079, $394,896, $29,651,935, $62,776 and $1,188,471, respectively, that were valued in such a manner.
Certain events may occur between the time that foreign markets close, on which securities held by certain of the Portfolios principally trade, including the DFA / DuPont Capital Emerging Markets Equity, Income Builder, Janus Balanced, International Equity, MFS® Utilities and Van Eck Global Hard Assets Portfolios, and the time at which the Portfolios’ net asset values (“NAV(s)”) are calculated. These events may include, but are not limited to, situations relating to a single issuer in a market sector, significant fluctuations in U.S. or foreign markets, natural disasters, armed conflicts, governmental actions or other developments not tied directly to the securities markets. Should the Manager or Subadvisors conclude that such events may have affected the accuracy of the last price of such securities reported on the local foreign market, the Manager or Subadvisors may, pursuant to procedures adopted by the Board, adjust the value of the local price to reflect the impact on the price of such securities as a result of such events. In this instance, securities are generally categorized as Level 3 in the hierarchy. Additionally, foreign equity securities are also fair valued whenever the movement of a particular index exceeds certain thresholds. In such cases, the securities are fair valued by applying factors provided by a third party vendor in accordance with a Portfolio’s policies and procedures and are generally categorized as Level 2 in the hierarchy. As of December 31, 2012, certain foreign equity securities held by the Portfolios were fair valued in such a manner.
Investments in Underlying Portfolios/Funds are valued at their NAV at the close of business each day. Securities held by the Underlying Portfolios/Funds are valued using policies consistent with those used by the Underlying Portfolios/Funds, as described in the paragraphs below. These securities are generally categorized as Level 1 in the hierarchy.
Equity securities and Exchange Traded Funds are valued at the latest quoted sales prices as of the close of regular trading on the Exchange on each valuation date. Securities that are not traded on the valuation date are valued at the mean of the latest quoted bid and ask prices. Prices normally are taken from the principal market in which each security trades. Futures contracts are valued at the last posted settlement price on the market where such futures are primarily traded. Options contracts are valued at the last posted settlement price on the market where such options are principally traded.
Investments in other mutual funds, including money market funds, are valued at their respective NAV as of the close of the Exchange on the valuation date. These securities are generally categorized as Level 1 in the hierarchy.
Debt securities (other than convertible bonds and municipal debt securities) are valued at the evaluated bid prices (evaluated mean bid prices in the case of convertible bonds and municipal debt securities) supplied by a pricing agent or brokers selected by the Portfolio’s Manager in consultation with the Portfolio’s Subadvisor, if any, whose prices reflect broker/dealer supplied valuations and electronic data processing techniques, if such prices are deemed by the Portfolio’s Manager, in consultation with the Portfolio’s Subadvisor, if any, to be representative of market values, at the regular close of trading of the Exchange on each valuation date. Debt securities, including corporate bonds, U.S. government and federal agency bonds, foreign bonds, Yankee bonds, convertible bonds, asset-backed securities and mortgage-backed securities, are generally categorized as Level 2 in the hierarchy.
The Cash Management Portfolio seeks to maintain a NAV of $1.00 per share, although there is no assurance that it will be able to do so on a continuous basis, and it has adopted certain investment, portfolio and dividend and distribution policies designed to enable it to do as such. An investment in the Cash Management Portfolio is not insured or guaranteed by the Federal Deposit Insurance Corporation or any other government agency. Securities in the Cash Management Portfolio are valued at their amortized cost in accordance with the requirements of Rule 2a-7 under the 1940 Act. The amortized cost method involves valuing a security at its cost on the date of purchase and thereafter assuming a constant amortization to maturity of the difference between such cost and the value on maturity date. Amortized cost approximates the current fair value of a security. Securities valued at amortized cost are not obtained from a quoted price in an active market.
Temporary cash investments acquired over 60 days to maturity are valued using the latest bid prices or using valuations based on a matrix system (which considers such factors as security prices, yields, maturities, and ratings), both as furnished by independent pricing services. Other temporary cash investments which mature in 60 days or less (“Short-Term Investments”) are valued at amortized cost. Securities valued at amortized cost are not valued using a quoted price in an active market. These securities are generally categorized as Level 2 in the hierarchy.
Fixed income securities purchased on a delayed delivery basis are marked to market daily until settlement at the forward settlement date and are generally categorized as Level 2 of the fair value hierarchy.
Foreign currency forward contracts are valued at their fair market values determined on the basis of the mean between the last current bid and ask prices based on dealer or exchange quotations and are generally categorized as Level 2 in the hierarchy.
| | |
| M-448 | | MainStay VP Funds Trust |
Loan assignments, participations and commitments are valued at the average of bid quotations obtained from the engaged independent pricing service, and are generally categorized as Level 2 in the hierarchy. Certain loan assignments, participations and commitments may be valued by single broker quotes obtained from the engaged independent pricing service with significant unobservable inputs and are generally categorized as Level 3 in the hierarchy. For these loan assignments, participations and commitments, the Manager may consider additional factors such as the liquidity of the Portfolios’ investments. As of
December 31, 2012, the Floating Rate and High Yield Corporate Bond Portfolios held securities with a value of $24,372,593 and $5,038,982, respectively, that were valued by single broker quotes and/or deemed to be illiquid.
The valuation techniques and significant amounts of unobservable inputs used in the fair valuation measurement of each Portfolio’s Level 3 securities are outlined in the tables below. A significant increase or decrease in any of those inputs in isolation would result in a significantly higher or lower fair value measurement.
| | | | | | | | | | |
Floating Rate | | | | | | | | | | |
| Asset Class | |
| Fair Value
at 12/31/12 |
| | Valuation Technique | | Unobservable Inputs | | Range |
Common Stock (1 position) | | $ | 394,896 | | | Market Approach | | Offered Quotes | | $35.50 -$36.75 |
Floating Rate Loans (13 positions) | | | 24,372,593 | | | Market Approach | | Offered Quotes | | $96.50 -$101.50 |
Total | | $ | 24,767,489 | | | | | | | |
High Yield Corporate Bond
| | | | | | | | | | |
| Asset Class | |
| Fair Value
at 12/31/12 |
| | Valuation Technique | | Unobservable Inputs | | Range |
Common Stocks (3 positions) | | $ | 1,724,433 | | | Income/Market Approach | | Estimated Remaining Claims/Value | | $0.01 |
| | | | | | | | | Liquidity Discount | | 10% - 20% |
| | | | | | | | | Discount Rate | | 12% |
| | | | | | | | | EBITDA Multiple | | 5.5 |
Convertible Bonds (3 positions) | | | 1,920,889 | | | Income /Market Approach | | Estimated Recovery Rate | | $0.00 - $0.01 |
| | | | | | | | | Liquidity Discount | | 20% |
| | | | | | | | | Discount Rate | | 9% |
Corporate Bonds (6 positions) | | | 17,388,834 | | | Income/Market Approach | | Estimated Remaining Cash/Collateral | | $324M |
| | | | | | | | | Liquidity Discount | | 15% |
| | | | | | | | | Offered Quotes | | $101.75 |
| | | | | | | | | Acquisition Price | | $100 |
| | | | | | | | | Discount Rate | | 30% |
| | | | | | | | | Distribution Percentage | | 73% |
| | | | | | | | | Probability of Success/Recoupment | | 20% - 50% |
| | | | | | | | | EBITDA Multiple | | 12 |
Loan Assignments & Participations (4 positions) | | | 13,652,732 | | | Income/Market Approach | | Asset Coverage | | 1.83x- 3.26x |
| | | | | | | | | Offered Quotes | | $94.50 -$100 |
| | | | | | | | | Call Price | | $103 |
Warrants (2 positions) | | | 7 | | | Income Approach | | Probability of Liquidity Event | | 0% |
Total | | $ | 34,686,895 | | | | | | | |
| | | | |
| mainstayinvestments.com | | | M-449 | |
Notes to Financial Statements (continued)
Generally, a security is considered illiquid if it cannot be sold or disposed of in the ordinary course of business at approximately the price at which it is valued. Its illiquidity might prevent the sale of such security at a time when the Manager or Subadvisor might wish to sell, and these securities could have the effect of decreasing the overall level of a Portfolio’s liquidity. Further, the lack of an established secondary market may make it more difficult to value illiquid securities, requiring a Portfolio to rely on judgments that may be somewhat subjective in determining value, which could vary from the amount that a Portfolio could realize upon disposition. Difficulty in selling illiquid securities may result in a loss or may be costly to a Portfolio. Under the supervision of the Board, the Manager or Subadvisor determines the liquidity of a Portfolio’s investments; in doing so, the Manager or Subadvisor may consider various factors, including (i) the frequency of trades and quotations, (ii) the number of dealers and prospective purchasers, (iii) dealer undertakings to make a market, and (iv) the nature of the security and the market in which it trades (e.g., the time needed to dispose of the security, the method of soliciting offers and the mechanics of transfer). Illiquid securities generally will be valued in good faith in such a manner as the Board deems appropriate to reflect their fair value.
(B) Income Taxes. Each of the Portfolios is treated as a separate entity for federal income tax purposes. The Fund’s policy is to comply with the requirements of the Internal Revenue Code of 1986, as amended (the “Internal Revenue Code”), applicable to regulated investment companies and to distribute all of the taxable income to the shareholders of each Portfolio within the allowable time limits. Therefore, no federal, state and local income tax provision is required.
Management evaluates its tax positions to determine if the tax positions taken meet the minimum recognition threshold in connection with accounting for uncertainties in income tax positions taken or expected to be taken for the purposes of measuring and recognizing tax liabilities in the financial statements. Recognition of tax benefits of an uncertain tax position is required only when the position is “more likely than not” to be sustained assuming examination by taxing authorities. Management has analyzed the Portfolios’ tax positions taken on federal, state and local income tax returns for all open tax years (for up to three tax years), and has concluded that no provision for federal, state and local income tax are required in the Portfolios’ financial statements. The Portfolios’ federal, state or local income and federal excise tax returns for tax years for which the applicable statutes of limitations have not expired are subject to examination by the Internal Revenue Service and state and local departments of revenue.
(C) Foreign Taxes. The Portfolios may be subject to foreign taxes on income and other transaction-based taxes imposed by certain countries in which they invest, gains on investments or currency purchases/repatriation, a portion
of which may be recoverable. The Portfolios will accrue such taxes and recoveries as applicable, based upon their current interpretation of tax rules and regulations that exist in the markets in which they invest.
Capital gains taxes relating to positions still held are reflected as a liability on the Statement of Assets and Liabilities, as well as an adjustment to the Portfolio’s net unrealized appreciation (depreciation). Taxes related to capital gains realized during the year ended December 31, 2012, if any, are reflected as part of net realized gain (loss) in the Statement of Operations. Changes in tax liabilities related to capital gains taxes on unrealized investment gains, if any, are reflected as part of the change in net unrealized appreciation (depreciation) on investments in the Statement Operations.
(D) Dividends and Distributions to Shareholders. Dividends and distributions are recorded on the ex-dividend date. For the Cash Management and Floating Rate Portfolios, dividends, if any, are declared daily and paid at least monthly and distributions of net realized capital gains, if any, are declared and paid at least annually. Each of the other Portfolios intend to declare and pay dividends of net investment income and distributions of net realized capital and currency gains, if any, at least annually. All dividends and distributions are reinvested in shares of the applicable Portfolio’s NAV. Dividends and distributions to shareholders are determined in accordance with federal income tax regulations and may differ from GAAP.
(E) Security Transactions and Investment Income. Each Portfolio records security transactions on the trade date. Realized gains and losses on security transactions are determined using the identified cost method. Dividend income is recognized on the ex-dividend date, net of any foreign tax withheld at the source, and interest income is accrued as earned using the effective interest rate method. Dividends and distributions received by the Asset Allocation Portfolios from the Underlying Portfolios/Funds are recorded on the ex-dividend date. Discounts and premiums on securities purchased, other than Short-Term Investments, for all Portfolios are accreted and amortized, respectively, on the effective interest rate method over the life of the respective securities. Discounts and premiums on Short-Term Investments are accreted and amortized, respectively, on the straight-line method. Income from payment-in-kind securities is recorded daily based on the effective interest method of accrual.
Investment income and realized and unrealized gains and losses on investments of each Portfolio are allocated to the separate classes of shares pro rata based upon their relative net assets on the date the income is earned or realized and unrealized gains and losses are incurred.
(F) Expenses. Expenses of the Fund are allocated to the individual Portfolios in proportion to the net assets of the respective Portfolios when the expenses are incurred,
| | |
| M-450 | | MainStay VP Funds Trust |
except where direct allocations of expenses can be made. Expenses (other than fees incurred under the distribution and service plans, further discussed in Note 3(B)), which are charged directly to the Service Class shares) are allocated to separate classes of shares pro rata based upon their relative net assets on the date the expenses are incurred. The expenses borne by each Portfolio, including those incurred with related parties of each Portfolio, are shown on each Portfolio’s Statement of Operations.
In addition, each Asset Allocation Portfolio bears a pro rata share of the fees and expenses of the Underlying Portfolios/Funds in which it invests. Because the Underlying Portfolios/Funds have varied expense and fee levels and the Asset Allocation Portfolios may own different proportions of the Underlying Portfolios/Funds at different times, the amount of fees and expenses incurred indirectly by each Asset Allocation Portfolio may vary. These indirect expenses of the Underlying Portfolios/Funds are not included in the amounts shown as expenses on each Portfolio’s Statement of Operations or in the expense ratios included in the Financial Highlights.
(G) Use of Estimates. In preparing financial statements in conformity with GAAP, management makes estimates and assumptions that affect the reported amounts and disclosures in the financial statements. Actual results could differ from those estimates.
(H) Repurchase Agreements. Each Portfolio may enter into repurchase agreements to earn income. The Portfolios may enter into repurchase agreements only with financial institutions that are deemed by the Manager or Subadvisor, if any, to be creditworthy, pursuant to guidelines established by the Board. During the term of any repurchase agreement, the Manager or Subadvisor will continue to monitor the creditworthiness of the seller. Under the 1940 Act, repurchase agreements are considered to be collateralized loans by a Portfolio to the seller secured by the securities transferred to the Portfolio.
When a Portfolio invests in repurchase agreements, a custodian takes possession of the collateral pledged for investments in the repurchase agreement. The underlying collateral is valued daily on a mark-to-market basis to determine that the value, including accrued interest, exceeds the repurchase price. In the event of the seller’s default on the obligation to repurchase, a Portfolio has the right to liquidate the collateral and apply the proceeds in satisfaction of the obligation. Under certain circumstances, such as in the event of default or bankruptcy by the counterparty to the agreement, realization and/or retention of the collateral may be subject to legal proceedings and possible realized loss to the Portfolios.
(I) Reverse Repurchase Agreements. A Portfolio may enter into reverse repurchase agreements with banks or broker/dealers, which involve the sale of a security by a Portfolio and its agreement to repurchase the instrument at a specified time and price. Under a reverse repurchase
agreement, the Portfolio continues to receive any principal and interest payments on the underlying security during the term of the agreement. These agreements involve the sale of debt securities, or Obligations, held by a Portfolio, with an agreement to repurchase the Obligations at an agreed upon price, date and interest payment. The proceeds will be used to purchase other debt securities either maturing, or under an agreement to resell, at a date simultaneous with or prior to the expiration of the reverse repurchase agreement. Reverse repurchase agreements will be utilized, only when the interest income to be earned from the investment of the proceeds from the transaction is greater than the interest expense of the reverse repurchase transaction.
The use of reverse repurchase agreements by a Portfolio creates leverage that increases a Portfolio’s investment risk. If the income and gains on securities purchased with the proceeds of reverse repurchase agreements exceed the cost of the agreements, the Portfolio’s earnings or NAV will increase faster than otherwise would be the case; conversely, if the income and gains fail to exceed the costs, earnings or NAV would decline faster than otherwise would be the case. If the buyer of the Obligation subject to the reverse repurchase agreement becomes bankrupt, realization upon the underlying securities may be delayed and there is a risk of loss due to any decline in their value. During the period ended December 31, 2012, PIMCO Real Return Portfolio’s average amount of borrowings under reverse repurchase agreements while outstanding was $17,987,788 at a weighted average interest rate of 3.26%. As of December 31, 2012, the Portfolios did not hold any reverse repurchase agreements.
(J) Loan Assignments, Participations and Commitments. The Flexible Bond Opportunities, Floating Rate, High Yield Corporate Bond, Income Builder and Janus Balanced Portfolios may invest in loan assignments and participations. Loan assignments and participations (“loans”) are agreements to make money available (a “commitment”) to a borrower in a specified amount, at a specified rate and within a specified time. Such loans are typically senior, secured and collateralized in nature. The Portfolios record an investment when the borrower withdraws money and record interest as earned. These loans pay interest at rates that are periodically reset by reference to a base lending rate plus a spread. These base lending rates are generally the prime rate offered by a designated U.S. bank or the London InterBank Offered Rate.
The loans in which the Portfolios may invest are generally readily marketable, but may be subject to some restrictions on resale. For example, a Portfolio may be contractually obligated to receive approval from the agent bank and/or borrower prior to the sale of these investments. A Portfolio assumes the credit risk of the borrower, the selling participant and any other persons interpositioned between the Portfolio and the borrower (“intermediate participants”). In the event that the borrower, selling participant or intermediate participants
| | | | |
| mainstayinvestments.com | | | M-451 | |
Notes to Financial Statements (continued)
become insolvent or enter into bankruptcy, a Portfolio may incur certain costs and delays in realizing payment, or may suffer a loss of principal and/or interest.
Unfunded commitments represent the remaining obligation of a Portfolio to the borrower. At any point in time, up to the maturity date of the issue, the borrower may demand the unfunded portion. The unfunded amounts, if any, are marked to market and any unrealized gains and losses are recorded in the Portfolio’s Statement of Asset and Liabilities. (See Note 7)
(K) Futures Contracts. A futures contract is an agreement to purchase or sell a specified quantity of an underlying instrument at a specified future date and price, or to make or receive a cash payment based on the value of a financial instrument (i.e., foreign currency, interest rate, security, or securities index). The Portfolios are subject to market price risk and/or interest rate risk in the normal course of investing in these transactions. The Portfolios may enter into futures contracts for hedging purposes in managing the duration and yield curve profile, market exposure or to enhance income. During the period the futures contract is open, changes in the value of the contract are recognized as unrealized appreciation or depreciation by “marking-to-market” such contract on a daily basis to reflect the market value of the contract at the end of each day’s trading. A Portfolio agrees to receive from or pay to the broker an amount of cash equal to the daily fluctuation in the value of the contract. Such receipts or payments are known as “variation margin.” When the futures contract is closed, the Portfolio records a realized gain or loss equal to the difference between the proceeds from (or cost of) the closing transaction and the Portfolio’s basis in the contract.
The use of futures contracts involves, to varying degrees, elements of market risk in excess of the amount recognized in a Portfolio’s Statement of Assets and Liabilities. The contract or notional amounts and variation margin reflect the extent of a Portfolio’s involvement in open futures positions. Risks arise from the possible imperfect correlation in movements in the price of futures contracts, interest rates and the underlying hedged assets, and the possible inability of counterparties to meet the terms of their contracts. However, each Portfolio’s activities in futures contracts have minimal counterparty risk as they are conducted through regulated exchanges that guarantee the futures against default by the counterparty. In the event of a bankruptcy or insolvency of a futures commission merchant that holds margin on behalf of the Portfolios, the Portfolios may not be entitled to the return of all of the margin owed to the Portfolios, potentially resulting in a loss. The Bond, Flexible Bond Opportunities and Income Builder Portfolios invest in futures contracts to help manage the duration and yield curve of their investment portfolios while minimizing the exposure to wider bid/ask spreads in traditional bonds. The Growth Equity and S&P 500 Index Portfolios invest in futures contracts to provide an efficient means of maintaining liquidity while being fully invested in the market. The
International Equity Portfolio may also enter into futures contracts traded on foreign futures exchanges such as those located in Frankfurt, Tokyo, London or Paris as long as trading on foreign exchanges does not subject the Portfolio to risks that are materially greater than the risks associated with trading on U.S. exchanges. The International Equity Portfolio’s investment in futures contracts and other derivatives may increase the volatility of the International Equity Portfolio’s NAV and may result in a loss to the International Equity Portfolio. The International Equity Portfolio invests in futures contracts to reduce the Portfolio’s return volatility. A Portfolio’s investment in futures contracts and other derivatives may increase the volatility of the Portfolio’s NAV and may result in a loss to the Portfolio.
(L) Securities Sold Short. Certain Portfolios engage in sales of securities they do not own (“short sales”) as part of their investment strategy. When a Portfolio enters into a short sale, it must segregate the cash proceeds from the security sold short or other securities as collateral for its obligation to deliver the security upon conclusion of the sale. A gain, limited to the price at which the Portfolio sold the security short, or a loss, unlimited as to dollar amount, will be recognized upon termination of a short sale if the market price on the date the short position is closed out is less or greater, respectively, than the proceeds originally received. Interest on short positions held is accrued daily while dividends declared on short positions existing on the record date are recorded on the ex-dividend date. Both the interest and dividends paid on short sales are recorded as expenses on the Statement of Operations. Short sales involve risk of loss in excess of the related amounts reflected on the Statement of Assets and Liabilities.
(M) Delayed Delivery Transactions. Certain Portfolios may purchase or sell securities on a delayed delivery basis. These transactions involve a commitment by a Portfolio to purchase or sell securities for a predetermined price or yield, with payment and delivery taking place beyond the customary settlement period. When delayed delivery purchases are outstanding, a Portfolio will designate liquid assets in an amount sufficient to meet the purchase price. When purchasing a security on a delayed delivery basis, a Portfolio assumes the rights and risks of ownership of the security, including the risk of price and yield fluctuations, and takes such fluctuations into account when determining its NAV. A Portfolio may dispose of or renegotiate a delayed delivery transaction after it is entered into, and may sell delayed delivery securities before they are delivered, which may result in a capital gain or loss, When a Portfolio has sold a security on a delayed delivery basis, the Portfolio does not participate in future gains and losses with respect to the security.
(N) Foreign Currency Forward Contracts. Certain Portfolios may enter into foreign currency forward contracts, which are agreements to buy or sell currencies of different countries on a specified future date at a specified
| | |
| M-452 | | MainStay VP Funds Trust |
rate. These Portfolios are subject to foreign currency exchange rate risk in the normal course of investing in these transactions. During the period the forward contract is open, changes in the value of the contract are recognized as unrealized appreciation or depreciation by ‘‘marking-to-market’’ such contract on a daily basis to reflect the market value of the contract at the end of each day’s trading. Cash movement occurs on settlement date. When the forward contract is closed, a Portfolio records a realized gain or loss equal to the difference between the proceeds from (or cost of) the closing transaction and the Portfolio’s basis in the contract. The Flexible Bond Opportunities, Income Builder and International Equity Portfolios may enter into foreign currency forward contracts to reduce currency risk versus the benchmark or for trade settlement.
The use of foreign currency forward contracts involves, to varying degrees, elements of market risk in excess of the amount recognized in a Portfolio’s Statement of Assets and Liabilities. The contract amount reflects the extent of a Portfolio’s involvement in these financial instruments. Risks arise from the possible movements in the foreign exchange rates underlying these instruments. While a Portfolio may enter into forward contracts to reduce currency exchange risks, changes in currency exchange rates may result in poorer overall performance for the Portfolio than if it had not engaged in such transactions. Exchange rate movements can be large, depending on the currency, and can last for extended periods of time, affecting the value of a Portfolio’s assets. Moreover, there may be an imperfect correlation between a Portfolio’s holdings of securities denominated in a particular currency and forward contracts entered into by the Portfolio. Such imperfect correlation may prevent a Portfolio from achieving the intended hedge or expose the Portfolio to the risk of currency exchange loss. The unrealized appreciation on forward contracts reflects a Portfolio’s exposure at the valuation date to credit loss in the event of a counterparty’s failure to perform its obligations.
(O) Foreign Currency Transactions. The books and records of the Portfolios are kept in U.S. dollars. Prices of securities denominated in foreign currency amounts are translated into U.S. dollars using 4:00 p.m. Eastern time exchange rates provided by an independent third party at the following dates:
| (i) | market value of investment securities, other assets and liabilities — at the valuation date; and |
| (ii) | purchases and sales of investment securities, income and expenses — at the date of such transactions. |
The assets and liabilities that are denominated in foreign currency amounts are presented at the exchange rates and market values at the close of the period. The realized and unrealized changes in net assets arising from fluctuations in exchange rates and market prices of securities are not separately presented.
Net realized gain (loss) on foreign currency transactions represents net gains and losses on foreign currency forward contracts, net currency gains or losses realized as a result of differences between the amounts of securities sale proceeds or purchase cost, dividends, interest and withholding taxes as recorded on a Portfolio’s books and the U.S. dollar equivalent amount actually received or paid. Net currency gains or losses from valuing such foreign currency denominated assets and liabilities, other than investments at valuation date exchange rates, are reflected in unrealized foreign exchange gains or losses.
(P) Swap Contracts. Certain Portfolios may enter into credit default, interest rate, index and currency exchange rate contracts (“swaps”) for the purpose of attempting to obtain a desired return at a lower cost to the Portfolio, rather than directly investing in an instrument yielding that desired return or to hedge against credit and interest rate risk. In a typical swap transaction, two parties agree to exchange the returns (or differentials in rates of returns) earned or realized on a particular investment or instruments. The gross returns to be exchanged or “swapped” between the parties are calculated with respect to a notional amount. The payments may be adjusted for transaction costs, interest payments, the amount of interest paid on the investment or instrument or other factors. Collateral, in the form of cash or securities, may be required to be held in segregated accounts with the custodian bank or broker in accordance with the swap. Swaps agreements are privately negotiated in the over the counter market (“OTC swaps”) and may be executed in a multilateral or other trade facilities platform, such as a registered commodities exchange (“centrally cleared swaps”).
Credit default swaps, in particular, are contracts whereby one party makes periodic payments to a counterparty in exchange for the right to receive a specified return in the event of a default by a third party on its obligation. Such periodic payments are accrued daily and recorded as a realized gain or loss. Credit default swaps may be used to provide a measure of protection against defaults of sovereign or corporate issuers.
Certain clearinghouses currently offer clearing for limited types of derivatives transactions, principally credit derivatives. In a cleared derivative transaction, a Portfolio typically enters into the transaction with a financial institution counterparty, and performance of the transaction is effectively guaranteed by a central clearinghouse, thereby reducing or eliminating the Portfolio’s exposure to the credit risk of its original counterparty. The Portfolio will be required to post specified levels of margin with the clearinghouse or at the instruction of the clearinghouse; the margin required by a clearinghouse may be greater than the margin the Portfolio would be required to post in an uncleared transaction. Only a limited number of transactions are currently eligible for clearing.
| | | | |
| mainstayinvestments.com | | | M-453 | |
Notes to Financial Statements (continued)
Swaps are “marked-to-market” daily based upon quotations from pricing agents, brokers, or market makers and the change in value, if any, is recorded as unrealized appreciation or depreciation. Any payments made or received upon entering a swap would be amortized or accreted over the life of the swap and recorded as a realized gain or loss. Early termination of a swap is recorded as a realized gain or loss. Daily changes in valuation of centrally cleared swaps, if any, are recorded as a receivable or payable for the change in value as appropriate (“variation margin”) on the Statements of Assets and Liabilities.
A Portfolio bears the risk of loss of the amount expected to be received under a swap in the event of the default or bankruptcy of the swap counterparty. A Portfolio may be able to eliminate its exposure under a swap either by assignment or other disposition, or by entering into an offsetting swap with the same party or a similar creditworthy party. Swaps are not actively traded on financial markets. Entering into swaps involves elements of credit, market, and documentation risk in excess of the amounts recognized on the Statement of Assets and Liabilities. Such risks involve the possibilities that there will be no liquid market for these swaps, that the counterparty to the swaps may default on its obligation to perform or disagree as to the meaning of the contractual terms in the swaps and that there may be unfavorable changes in interest rates, the price of the index or the security underlying these transactions. As of December 31, 2012, PIMCO Real Return Portfolio held swap contracts.
(Q) Options Contracts. A Portfolio may write call and put options on securities and financial derivative instruments it owns or in which it may invest. A Portfolio, as a writer of an option, has no control over whether the underlying instrument may be sold (call) or purchased (put) and as a result bears the market risk of an unfavorable change in the price of the instrument underlying the written option. As a result, writing put options tends to increase a Portfolio’s exposure to the underlying instrument. Writing call options tends to decrease the Portfolio’s exposure to the underlying instrument. When a Portfolio writes a call or put, an amount equal to the premium received is recorded as a liability and subsequently marked to market to reflect the current value of the option written. These liabilities are reflected as written options outstanding on the Statement of Assets and Liabilities. Premiums received from writing options which expire are treated as realized gains. Premiums received from writing options which are exercised or closed are added to the proceeds or offset against amounts paid on the underlying futures, swaps, security or currency transaction to determine the realized gain or loss. Certain options may be written with premiums to be determined on a future date. There is the risk the Portfolio may not be able to enter into a closing transaction because of an illiquid market.
The Portfolio may also purchase put and call options. Purchasing call options tends to increase the Portfolio’s exposure to the underlying instrument. Purchasing put
options tends to decrease the Portfolio’s exposure to the underlying instrument. The Portfolio pays a premium which is included on the Portfolio’s Statement of Assets and Liabilities as an investment and subsequently marked to market to reflect the current value of the option. Premiums paid for purchasing options which expire are treated as realized losses. Certain options may be purchased with premiums to be determined on a future date. The premiums for these options are based upon implied volatility parameters at specified terms. The risk associated with purchasing put and call options is limited to the premium paid. Premiums paid for purchasing options which are exercised or closed are added to the amounts paid or offset against the proceeds on the underlying investment transaction to determine the realized gain or loss when the underlying transaction is sold.
(R) Interest Rate Swaptions. The Portfolio may enter into interest rate swaption agreements. A swaption is an option to enter into a pre-defined swap agreement by some specified date in the future. The writer of the swaption becomes the counterparty to the swap if the buyer exercises. The interest rate swaption agreement will specify whether the buyer of the swaption will be a fixed-rate receiver or a fixed rate buyer. As of December 31, 2012, PIMCO Real Return Portfolio held Interest Rate Swaptions.
During the period ended December 31, 2012, PIMCO Real Return had the following transactions in interest rate swaptions:
| | | | | | | | |
Interest Rate Swaptions | | Notional
Amount | | | Premium | |
Options Outstanding at January 1, 2012 | | | — | | | $ | — | |
Options—Written | | | 27,600,000 | | | | 65,550 | |
Options—Expired | | | — | | | | — | |
Options—Canceled in closing transactions | | | — | | | | — | |
Options Outstanding at December 31, 2012 | | | 27,600,000 | | | | 65,550 | |
(S) Dollar Rolls. Certain Portfolios may enter into dollar roll transactions in which they sell securities from their portfolios to a counterparty from whom they simultaneously agree to buy a similar security on a delayed delivery basis. The dollar roll transactions of the Portfolios are generally classified as purchase and sale transactions other than in the PIMCO Real Return Portfolio. If certain criteria are met, these dollar roll transactions may be considered financing transactions, whereby the difference in the sales price and the future purchase price is recorded as an adjustment to interest income. The PIMCO Real Return Portfolio generally enters into dollar roll transactions that are considered financing transactions.
When accounted for as purchase and sales, the securities sold in connection the securities sold in connection with the dollar rolls are removed from a portfolio and a realized gain or loss is recognized. The securities the Portfolios have agreed to acquire are included at market value in the Portfolio of Investments and liabilities for such purchase
| | |
| M-454 | | MainStay VP Funds Trust |
commitments are included as payables for investments purchased. During the roll period, a Portfolio foregoes principal and interest paid on the securities. A Portfolio is compensated by the difference between the current sales price and the forward price for the future as well as by the earnings on the cash proceeds of the initial sale. Dollar rolls may be renewed without physical delivery of the securities subject to the contract. The Portfolios maintain liquid assets from their respective portfolios having a value not less than the repurchase price, including accrued interest. Dollar roll transactions involve certain risks, including the risk that the securities returned to the Portfolios at the end of the roll period, while substantially similar, could be inferior to what was initially sold to the counterparty.
A Portfolio accounts for a dollar roll transaction as a purchase and sale whereby the difference in the sales price and purchase price of the security sold is recorded as a realized gain (loss). During the period ended December 31, 2012, PIMCO Real Return Portfolio’s average amount of borrowings through dollar rolls was $55,649,648 at a weighted average interest rate of 0.27%.
(T) Treasury Inflation-Protected Securities. The PIMCO Real Return Portfolio invests in Treasury Inflation-Protected Securities (“TIPS”) which are specially structured bonds in which the principal amount is adjusted to keep pace with inflation. The inflation (deflation) adjustment is applied to the principal of each bond on a monthly basis and is accounted for as interest income on the Statements of Operations. TIPS are subject to interest rate risk.
(U) Securities Lending. In order to realize additional income, each Portfolio, other than the Asset Allocation and Cash Management Portfolios, may engage in securities lending, subject to the limitations set forth in the 1940 Act. In the event the Portfolios do engage in securities lending, the Portfolios will lend through their custodian, State Street Bank and Trust Company (“State Street”). State Street will manage the Portfolios’ cash collateral in accordance with a lending agreement between the Portfolios and State Street, and indemnify the Portfolios against counterparty risk. The loans will be collateralized by cash or securities at least equal at all times to the market value of the securities loaned. Collateral will consist of U.S. Government securities, cash equivalents or irrevocable letters of credit. The Portfolios may bear the risk of delay in recovery of, or loss of rights in, the securities loaned should the borrower of the securities experience financial difficulty. The Portfolios may also record a realized gain or loss on securities deemed sold due to the borrower’s inability to return securities on loan. The Portfolios will receive compensation for lending their securities in the form of fees or they will retain a portion of interest on the investment of any cash received as collateral. The Portfolios will also continue to receive interest and dividends on the securities loaned and any gain or loss in the market price of the securities loaned that may occur during the term of the loan will be for the account of the Portfolios.
Although the Portfolios and New York Life Investments have temporarily suspended securities lending, the Portfolios and New York Life Investments reserve the right to reinstitute lending when deemed appropriate. The Portfolios had no portfolio securities on loan as of December 31, 2012.
(V) Rights and Warrants. A right is a certificate that permits the holder to purchase a certain number of shares, or a fractional share, of a new stock from the issuer at a specific price. A warrant is an instrument that entitles the holder to buy an equity security at a specific price for a specific period of time. The Portfolios may enter into rights and warrants when securities are acquired through a corporate action. With respect to warrants in international markets, the securities may be purchased only when the underlying security cannot be purchased due to the many restrictions an industry and/or country might place on foreign investors. These investments can provide a greater potential for profit or loss than an equivalent investment in the underlying security. Prices of these investments do not necessarily move in tandem with the prices of the underlying securities.
There is risk involved in the purchase of rights and warrants in that these investments are speculative investments. A Portfolio could also lose the entire value of its investment in warrants if the warrant is not exercised by the date of its expiration. The securities are sold as soon as the opportunity becomes available. The International Equity Portfolio may invest in warrants when the underlying security cannot be purchased due to restrictions an industry and/or country places on foreign investors. The Convertible, Flexible Bond Opportunities, High Yield Corporate Bond, Income Builder and U.S. Small Cap Portfolios may invest in warrants only if received as part of a corporate action. The Portfolios are exposed to risk until the sale or exercise of each right or warrant is completed.
(W) Restricted Securities. A restricted security is a security which has been purchased through a private offering and cannot be resold to the general public without prior registration under the Securities Act of 1933, as amended. The Convertible, High Yield Corporate Bond and Income Builder Portfolios may not have the right to demand that such securities be registered. Disposal of these securities may involve time-consuming negotiations and expenses, and it may be difficult to obtain a prompt sale at an acceptable price. (See Note 6)
(X) Concentration of Risk. The Flexible Bond Opportunities and High Yield Corporate Bond Portfolios invest in high-yield securities (sometimes called “junk bonds”), which are generally considered speculative because they present a greater risk of loss, including default, than higher quality debt securities. These securities pay investors a premium—higher interest rate or yield—because of the increased risk of loss. These securities can also be subject to greater price volatility.
| | | | |
| mainstayinvestments.com | | | M-455 | |
Notes to Financial Statements (continued)
The Flexible Bond Opportunities, Floating Rate, High Yield Corporate Bond, Income Builder and Janus Balanced Portfolios may invest in loans. The loans in which the Portfolios principally invest are usually rated less than investment grade and are generally considered speculative because they present a greater risk of loss, including default, than higher quality debt securities. These securities pay investors a higher interest rate because of the increased risk of loss. Although certain loans are collateralized, there is no guarantee that the value of the collateral will be sufficient to repay the loan. In a recession or serious credit event, the value of these securities could decline significantly.
There are certain risks involved in investing in foreign securities that are in addition to the usual risks inherent in domestic instruments. These risks include those resulting from currency fluctuations, future adverse political or economic developments and possible imposition of currency exchange blockages or other foreign governmental laws or restrictions. These risks are likely to be greater in emerging markets than in developed markets. The ability of issuers of debt securities held by the Portfolios to meet their obligations may be affected by economic or political developments in a specific country, industry or region.
The Portfolios may enter into investment transactions which may represent off-balance sheet risk. Off-balance sheet risk exists when the maximum potential loss on a particular investment is greater than the value of such investment, as reflected in the Statement of Assets and Liabilities. Off-balance sheet risk generally arises from the use of derivative financial instruments or short sales.
(Y) Indemnifications. Under the Fund’s organizational documents, its officers and directors are indemnified against certain liabilities that may arise out of performance of their duties to the Fund. Additionally, in the normal course of business, the Portfolios enter into contracts with third-party service providers that contain a variety of representations and warranties and which may provide general indemnifications. The Portfolios’ maximum exposure under these arrangements is unknown, as this would involve future claims that may be made against the Portfolios that have not yet occurred. Based on experience, management is of the view that the risk of loss in connection with these potential indemnification obligations is remote. However, there can be no assurance that material liabilities related to such obligations will not arise in the future, which could adversely impact the Portfolios.
(Z) Quantitative Disclosure of Derivative Holdings. The following tables show additional disclosures about the Bond, Convertible, DFA / DuPont Capital Emerging Markets Equity, Flexible Bond Opportunities, Growth Equity, High Yield Corporate Bond, Income Builder, International Equity, MFS® Utilities, Mid Cap Core, PIMCO Real Return, S&P 500 Index, T. Rowe Price Equity Income and Van Eck Global Hard Assets Portfolios’ derivative and hedging activities, including how such activities are accounted for and their effect on the Portfolios’ financial positions, performance and cash flows. These derivatives are not accounted for as hedging instruments.
Bond
Fair value of derivatives instruments as of December 31, 2012:
Realized Gain (Loss)
| | | | | | | | | | | | | | |
| | | Statement of Operations Location | | Equity
Contracts
Risk | | | Interest Rate
Contracts
Risk | | | Total | |
Futures Contracts | | Net realized gain (loss) on futures transactions | | $ | — | | | $ | (64,820 | ) | | $ | (64,820 | ) |
| | | | | | |
Total Realized Gain (Loss) | | | | $ | — | | | $ | (64,820 | ) | | $ | (64,820 | ) |
| | | | | | |
Number of Contracts, Notional Amounts or Shares/Units
| | | | | | | | | | | | |
| | | Equity
Contracts
Risk | | | Interest Rate
Contracts
Risk | | | Total | |
Futures Contracts Long (1) | | | — | | | | 319 | | | | 319 | |
| | | | |
Futures Contracts Short (1) | | | — | | | | 394 | | | | 394 | |
| | | | |
Futures Contracts Short (2) | | | — | | | | (120 | ) | | | (120 | ) |
| | | | |
| (1) | Amount disclosed represents the weighted average held during the year ended December 31, 2012. |
| (2) | Amount disclosed represents the actual average held during the year ended December 31, 2012. |
| | |
| M-456 | | MainStay VP Funds Trust |
Convertible
Fair value of derivatives instruments as of December 31, 2012:
Asset Derivatives
| | | | | | | | | | |
| | | Statement of Assets and Liabilities Location | | Equity
Contracts
Risk | | | Total | |
Warrants | | Investments in securities, at value | | $ | 20,281 | | | $ | 20,281 | |
| | | | | | |
Total Fair Value | | | | $ | 20,281 | | | $ | 20,281 | |
| | | | | | |
Change in Unrealized Appreciation (Depreciation)
| | | | | | | | | | |
| | | Statement of Operations Location | | Equity
Contracts
Risk | | | Total | |
Warrants | | Net change in unrealized appreciation (depreciation) on investments | | $ | 7,886 | | | $ | 7,886 | |
| | | | | | |
Total Change in Unrealized Appreciation (Depreciation) | | | | $ | 7,886 | | | $ | 7,886 | |
| | | | | | |
Number of Contracts, Notional Amounts or Shares/Units (1)
| | | | | | | | |
| | | Equity
Contracts
Risk | | | Total | |
Warrants | | | 1,268 | | | | 1,268 | |
| | | | |
| (1) | Amount disclosed represents the weighted average held during the year ended December 31, 2012. |
DFA / DuPont Capital Emerging Markets Equity
Fair value of derivatives instruments as of December 31, 2012:
Asset Derivatives
| | | | | | | | | | |
| | | Statement of Assets and Liabilities Location | | Equity
Contracts
Risk | | | Total | |
Rights | | Investments in securities, at value | | $ | 17,226 | | | $ | 17,226 | |
Warrants | | Investments in securities, at value | | | 1,628 | | | | 1,628 | |
| | | | | | |
Total Fair Value | | | | $ | 18,854 | | | $ | 18,854 | |
| | | | | | |
The effect of derivative instruments on the Statement of Operations for the year ended December 31, 2012:
Realized Gain (Loss)
| | | | | | | | | | |
| | | Statement of Operations Location | | Equity
Contracts
Risk | | | Total | |
Rights | | Net realized gain (loss) on investments/security transactions | | $ | 10,303 | | | $ | 10,303 | |
| | | | | | |
Total Realized Gain (Loss) | | | | $ | 10,303 | | | $ | 10,303 | |
| | | | | | |
Change in Unrealized Appreciation (Depreciation)
| | | | | | | | | | |
| | | Statement of Operations Location | | Equity
Contracts
Risk | | | Total | |
Rights | | Net change in unrealized appreciation (depreciation) on investments | | $ | 17,226 | | | $ | 17,226 | |
Warrants | | Net change in unrealized appreciation (depreciation) on investments | | | (192 | ) | | | (192 | ) |
| | | | | | |
Total Change in Unrealized Appreciation (Depreciation) | | $ | 17,034 | | | $ | 17,034 | |
| | | | | | |
| | | | |
| mainstayinvestments.com | | | M-457 | |
Notes to Financial Statements (continued)
Number of Contracts, Notional Amounts or Shares/Units (1)
| | | | | | | | |
| | | Equity
Contracts
Risk | | | Total | |
Rights | | | 166,648 | | | | 166,648 | |
Warrants | | | 16,880 | | | | 16,880 | |
| | | | |
| (1) | Amount disclosed represents the weighted average held during the year ended December 31, 2012. |
Flexible Bond Opportunities
Fair value of derivatives instruments as of December 31, 2012:
Asset Derivatives
| | | | | | | | | | | | | | | | | | |
| | | Statement of Assets and Liabilities Location | | Foreign
Exchange
Contracts
Risk | | | Equity
Contracts
Risk | | | Interest
Rate
Contracts
Risk | | | Total | |
Warrants | | Investments in securities, at value | | $ | — | | | $ | 237,526 | | | $ | — | | | $ | 237,526 | |
Futures Contracts | | Net Assets—Net unrealized appreciation (depreciation) on investments
and futures contracts (a) | | | — | | | | — | | | | 91,697 | | | | 91,697 | |
| | | | | | |
Total Fair Value | | | | $ | — | | | $ | 237,526 | | | $ | 91,697 | | | $ | 329,223 | |
| | | | | | |
Liability Derivatives
| | | | | | | | | | | | | | | | | | |
| | | Statement of Assets and Liabilities Location | | Foreign
Exchange
Contracts
Risk | | | Equity
Contracts
Risk | | | Interest
Rate
Contracts
Risk | | | Total | |
Futures Contracts | | Net Assets—Net unrealized appreciation (depreciation) on investments and futures contracts (a) | | $ | — | | | $ | — | | | $ | (294,077 | ) | | $ | (294,077 | ) |
Forward Contracts | | Unrealized depreciation on foreign currency forward contracts | | | (61,966 | ) | | | — | | | | — | | | | (61,966 | ) |
| | | | | | |
Total Fair Value | | | | $ | (61,966 | ) | | $ | — | | | $ | (294,077 | ) | | $ | (356,043 | ) |
| | | | | | |
| (a) | Includes cumulative appreciation (depreciation) of futures contracts as reported in the Portfolio of Investments. Only current day's variation margin is reported within the Statement of Assets and Liabilities. |
The effect of derivative instruments on the Statement of Operations for the year ended December 31, 2012:
Realized Gain (Loss)
| | | | | | | | | | | | | | | | | | |
| | | Statement of Operations Location | | Foreign
Exchange
Contracts
Risk | | | Equity
Contracts
Risk | | | Interest
Rate
Contracts
Risk | | | Total | |
Futures Contracts | | Net realized gain (loss) on futures transactions | | $ | — | | | $ | — | | | $ | (856,257 | ) | | $ | (856,257 | ) |
Forward Contracts | | Net realized gain (loss) on foreign currency transactions | | | (171,028 | ) | | | — | | | | — | | | | (171,028 | ) |
| | | | | | |
Total Realized Gain (Loss) | | | | $ | (171,028 | ) | | $ | — | | | $ | (856,257 | ) | | $ | (1,027,285 | ) |
| | | | | | |
Change in Unrealized Appreciation (Depreciation)
| | | | | | | | | | | | | | | | | | |
| | | Statement of Operations Location | | Foreign
Exchange
Contracts
Risk | | | Equity
Contracts
Risk | | | Interest
Rate
Contracts
Risk | | | Total | |
Warrants | | Net change in unrealized appreciation (depreciation) on investments | | $ | — | | | $ | 92,367 | | | $ | — | | | $ | 92,367 | |
Futures Contracts | | Net change in unrealized appreciation (depreciation) on futures contracts | | | — | | | | — | | | | (92,797 | ) | | | (92,797 | ) |
Forward Contracts | | Net change in unrealized appreciation (depreciation) on translation of other assets and liabilities in foreign currencies and foreign currency forward contracts | | | (68,250 | ) | | | — | | | | — | | | | (68,250 | ) |
| | | | | | |
Total Change in Unrealized Appreciation (Depreciation) | | $ | (68,250 | ) | | $ | 92,367 | | | $ | (92,797 | ) | | $ | (68,680 | ) |
| | | | | | |
| | |
| M-458 | | MainStay VP Funds Trust |
Number of Contracts, Notional Amounts or Shares/Units (1)
| | | | | | | | | | | | | | | | |
| | | Foreign
Exchange
Contracts
Risk | | | Equity
Contracts
Risk | | | Interest
Rate
Contracts
Risk | | | Total | |
Warrants | | | — | | | | 14,850 | | | | — | | | | 14,850 | |
Futures Contracts Long | | | — | | | | — | | | | 115 | | | | 115 | |
Futures Contracts Short | | | — | | | | — | | | | (528 | ) | | | (528 | ) |
Forward Contracts Long | | $ | 435,074 | | | $ | — | | | $ | — | | | $ | 435,074 | |
Forward Contracts Short | | $ | (7,744,856 | ) | | $ | — | | | $ | — | | | $ | (7,744,856 | ) |
| | | | |
| (1) | Amount disclosed represents the weighted average held during the year ended December 31, 2012. |
Growth Equity
Fair value of derivatives instruments as of December 31, 2012:
Liability Derivatives
| | | | | | | | | | |
| | | Statement of Assets and Liabilities Location | | Equity
Contracts
Risk | | | Total | |
Futures Contracts | | Net Assets—Net unrealized appreciation (depreciation) on investments and futures contracts (a) | | $ | (56,918 | ) | | $ | (56,918 | ) |
| | | | | | | | | | |
Total Fair Value | | | | $ | (56,918 | ) | | $ | (56,918 | ) |
| | | | | | |
| (a) | Includes cumulative appreciation (depreciation) of futures contracts as reported in the Portfolio of Investments. Only current day's variation margin is reported within the Statement of Assets and Liabilities. |
The effect of derivative instruments on the Statement of Operations for the year ended December 31, 2012:
Realized Gain (Loss)
| | | | | | | | | | |
| | | Statement of Operations Location | | Equity
Contracts
Risk | | | Total | |
Futures Contracts | | Net realized gain (loss) on futures transactions | | $ | 948,720 | | | $ | 948,720 | |
| | | | | | | | | | |
Total Realized Gain (Loss) | | $ | 948,720 | | | $ | 948,720 | |
| | | | | | |
Change in Unrealized Appreciation (Depreciation)
| | | | | | | | | | |
| | | Statement of Operations Location | | Equity
Contracts
Risk | | | Total | |
Futures Contracts | | Net change in unrealized appreciation (depreciation) on futures contracts | | $ | (164,688 | ) | | $ | (164,688 | ) |
| | | | | | | | | | |
Total Change in Unrealized Appreciation (Depreciation) | | $ | (164,688 | ) | | $ | (164,688 | ) |
| | | | | | |
Number of Contracts, Notional Amounts or Shares/Units (1)
| | | | | | | | |
| | | Equity
Contracts
Risk | | | Total | |
Futures Contracts Long | | | 82 | | | | 82 | |
| | | | |
| (1) | Amount disclosed represents the weighted average held during the year ended December 31, 2012. |
| | | | |
| mainstayinvestments.com | | | M-459 | |
Notes to Financial Statements (continued)
High Yield Corporate Bond Portfolio
Fair value of derivatives instruments as of December 31, 2012:
Asset Derivatives
| | | | | | | | | | |
| | | Statement of Assets and Liabilities Location | | Equity
Contracts
Risk | | | Total | |
Warrants | | Investments in securities, at value | | $ | 101,107 | | | $ | 101,107 | |
| | | | | | |
Total Fair Value | | | | $ | 101,107 | | | $ | 101,107 | |
| | | | | | |
The effect of derivative instruments on the Statement of Operations for the year ended December 31, 2012:
Change in Unrealized Appreciation (Depreciation)
| | | | | | | | | | |
| | | Statement of Operations Location | | Equity
Contracts
Risk | | | Total | |
Warrants | | Net change in unrealized appreciation (depreciation) on investments | | $ | (153,335 | ) | | $ | (153,335 | ) |
| | | | | | |
Total Change in Unrealized Appreciation (Depreciation) | | | | $ | (153,335 | ) | | $ | (153,335 | ) |
| | | | | | |
Number of Contracts, Notional Amounts or Shares/Units (1)
| | | | | | | | |
| | | Equity
Contracts
Risk | | | Total | |
Warrants | | | 4,095 | | | | 4,095 | |
| | | | |
| (1) | Amount disclosed represents the weighted average held during the year ended December 31, 2012. |
Income Builder
Fair value of derivatives instruments as of December 31, 2012:
Asset Derivatives
| | | | | | | | | | | | | | | | | | |
| | | Statement of Assets and Liabilities Location | | Foreign
Exchange
Contracts
Risk | | | Equity
Contracts
Risk | | | Interest
Rate
Contracts
Risk | | | Total | |
Warrants | | Investments in securities, at value | | $ | — | | | $ | 0 | (a) | | $ | — | | | $ | 0 | (a) |
Futures Contracts | | Net Assets—Net unrealized appreciation (depreciation) on investments and futures contracts (b) | | | — | | | | 252,679 | | | | 15,529 | | | | 268,208 | |
| | | | | | |
Total Fair Value | | | | $ | — | | | $ | 252,679 | | | $ | 15,529 | | | $ | 268,208 | |
| | | | | | |
Liability Derivatives
| | | | | | | | | | | | | | | | | | |
| | | Statement of Assets and Liabilities Location | | Foreign
Exchange
Contracts
Risk | | | Equity
Contracts
Risk | | | Interest
Rate
Contracts
Risk | | | Total | |
Forward Contracts | | Unrealized depreciation on foreign currency forward contracts | | $ | (252,982 | ) | | $ | — | | | $ | — | | | $ | (252,982 | ) |
| | | | | | |
Total Fair Value | | | | $ | (252,982 | ) | | $ | — | | | $ | — | | | $ | (252,982 | ) |
| | | | | | |
| (b) | Includes cumulative appreciation (depreciation) of futures contracts as reported in the Portfolio of Investments. Only current day's variation margin is reported within the Statement of Assets and Liabilities. |
| | |
| M-460 | | MainStay VP Funds Trust |
The effect of derivative instruments on the Statement of Operations for the year ended December 31, 2012:
Realized Gain (Loss)
| | | | | | | | | | | | | | | | | | |
| | | Statement of Operations Location | | Foreign
Exchange
Contracts
Risk | | | Equity
Contracts
Risk | | | Interest
Rate
Contracts
Risk | | | Total | |
Futures Contracts | | Net realized gain (loss) on futures transactions | | $ | — | | | $ | 6,061,489 | | | $ | (329,781 | ) | | $ | 5,731,708 | |
Forward Contracts | | Net realized gain (loss) on foreign currency transactions | | | 717,999 | | | | — | | | | — | | | | 717,999 | |
| | | | | | |
Total Realized Gain (Loss) | | $ | 717,999 | | | $ | 6,061,489 | | | $ | (329,781 | ) | | $ | 6,449,707 | |
| | | | | | |
Change in Unrealized Appreciation (Depreciation)
| | | | | | | | | | | | | | | | | | |
| | | Statement of Operations Location | | Foreign
Exchange
Contracts
Risk | | | Equity
Contracts
Risk | | | Interest
Rate
Contracts
Risk | | | Total | |
Futures Contracts | | Net change in unrealized appreciation (depreciation) on futures contracts | | $ | — | | | $ | 383,018 | | | $ | 18,377 | | | $ | 401,395 | |
Forward Contracts | | Net change in unrealized appreciation (depreciation) on translation of other assets and liabilities in foreign currencies and foreign currency forward contracts | | | (397,378 | ) | | | — | | | | — | | | | (397,378 | ) |
| | | | | | |
Total Change in Unrealized Appreciation (Depreciation) | | $ | (397,378 | ) | | $ | 383,018 | | | $ | 18,377 | | | $ | 4,017 | |
| | | | | | |
Number of Contracts, Notional Amounts or Shares/Units (1)
| | | | | | | | | | | | | | | | |
| | | Foreign
Exchange
Contracts
Risk | | | Equity
Contracts
Risk | | | Interest
Rate
Contracts
Risk | | | Total | |
Warrants | | | — | | | | 8 | | | | — | | | | 8 | |
Futures Contracts Long | | | — | | | | 734 | | | | 45 | | | | 779 | |
Futures Contracts Short | | | — | | | | — | | | | (173 | ) | | | (173 | ) |
Forward Contracts Long | | $ | 14,695,625 | | | $ | — | | | $ | — | | | $ | 14,695,625 | |
Forward Contracts Short | | $ | (42,597,541 | ) | | $ | — | | | $ | — | | | $ | (42,597,541 | ) |
| | | | |
| (1) | Amount disclosed represents the weighted average held during the year ended December 31, 2012. |
International Equity
The effect of derivative instruments on the Statement of Operations for the year ended December 31, 2012:
Realized Gain (Loss)
| | | | | | | | | | |
| | | Statement of Operations Location | | Equity
Contracts
Risk | | | Total | |
Rights | | Net realized gain (loss) on investments/security transactions | | $ | 283,689 | | | $ | 283,689 | |
| | | | | | |
Total Realized Gain (Loss) | | | | $ | 283,689 | | | $ | 283,689 | |
| | | | | | |
Number of Contracts, Notional Amounts or Shares/Units (1)
| | | | | | | | |
| | | Equity
Contracts
Risk | | | Total | |
Rights | | | 566,104 | | | | 566,104 | |
| | | | |
| (1) | Amount disclosed represents the actual average held during the year ended December 31, 2012. |
| | | | |
| mainstayinvestments.com | | | M-461 | |
Notes to Financial Statements (continued)
MFS® Utilities
Fair value of derivatives instruments as of December 31, 2012:
Asset Derivatives
| | | | | | | | | | | | | | |
| | | Statement of Assets and Liabilities Location | | Foreign
Exchange
Contracts
Risk | | | Equity
Contracts
Risk | | | Total | |
Forward Contracts | | Unrealized appreciation on foreign currency forward contracts | | $ | 347,344 | | | $ | — | | | $ | 347,344 | |
| | | | | | |
Total Fair Value | | | | $ | 347,344 | | | $ | — | | | $ | 347,344 | |
| | | | | | |
Liability Derivatives
| | | | | | | | | | | | | | |
| | | Statement of Assets and Liabilities Location | | Foreign
Exchange
Contracts
Risk | | | Equity
Contracts
Risk | | | Total | |
Forward Contracts | | Unrealized depreciation on foreign currency forward contracts | | $ | (2,735,391 | ) | | $ | — | | | $ | (2,735,391 | ) |
| | | | |
Total Fair Value | | | | $ | (2,735,391 | ) | | $ | — | | | $ | (2,735,391 | ) |
| | | | |
Realized Gain (Loss)
| | | | | | | | | | | | | | |
| | | Statement of Operations Location | | Foreign
Exchange
Contracts
Risk | | | Equity
Contracts
Risk | | | Total | |
Rights | | Net realized gain (loss) on investments/security transactions | | $ | — | | | $ | (10,802 | ) | | $ | (10,802 | ) |
Warrants | | Net realized gain (loss) on investments/security transactions | | | — | | | | 203,087 | | | | 203,087 | |
Forward Contracts | | Net realized gain (loss) on foreign currency transactions | | | 254 | | | | — | | | | 254 | |
| | | | | | |
Total Realized Gain (Loss) | | | | $ | 254 | | | $ | 192,285 | | | $ | 192,539 | |
| | | | | | |
Change in Unrealized Appreciation (Depreciation)
| | | | | | | | | | | | | | |
| | | Statement of Operations Location | | Foreign
Exchange
Contracts
Risk | | | Equity
Contracts
Risk | | | Total | |
Forward Contracts | | Net change in unrealized appreciation (depreciation) on translation of other assets and liabilities in foreign currencies and foreign currency forward contracts | | $ | (2,388,047 | ) | | $ | — | | | $ | (2,388,047 | ) |
| | | | | | |
Total Change in Unrealized Appreciation (Depreciation) | | $ | (2,388,047 | ) | | $ | — | | | $ | (2,388,047 | ) |
| | | | | | |
Number of Contracts, Notional Amounts or Shares/Units (1)
| | | | | | | | | | | | |
| | | Foreign
Exchange
Contracts
Risk | | | Equity
Contracts
Risk | | | Total | |
Warrants | | | — | | | | 463,527 | | | | 463,527 | |
Forward Contracts Long | | $ | 21,145,392 | | | $ | — | | | $ | 21,145,392 | |
| | | | |
Forward Contracts Short | | $ | (131,587,725 | ) | | $ | — | | | $ | (131,587,725 | ) |
| | | | |
| (1) | Amount disclosed represents the weighted average held during the year ended December 31, 2012. |
| | |
| M-462 | | MainStay VP Funds Trust |
Mid Cap Core
Fair value of derivatives instruments as of December 31, 2012:
Asset Derivatives
| | | | | | | | | | |
| | | Statement of Assets and Liabilities Location | | Equity
Contracts
Risk | | | Total | |
Warrants | | Investments in securities, at value | | $ | 194,984 | | | $ | 194,984 | |
| | | | | | |
Total Fair Value | | | | $ | 194,984 | | | $ | 194,984 | |
| | | | | | |
Realized Gain (Loss)
| | | | | | | | | | |
| | | Statement of Operations Location | | Equity
Contracts
Risk | | | Total | |
Rights | | Net realized gain (loss) on investments/security transactions | | $ | 2,119 | | | $ | 2,119 | |
Warrants | | Net realized gain (loss) on investments/security transactions | | | (1 | ) | | | (1 | ) |
| | | | | | |
Total Realized Gain (Loss) | | | | $ | 2,118 | | | $ | 2,118 | |
| | | | | | |
Change in Unrealized Appreciation (Depreciation)
| | | | | | | | | | |
| | | Statement of Operations Location | | Equity
Contracts
Risk | | | Total | |
Warrants | | Net change in unrealized appreciation (depreciation) on investments | | $ | 95,904 | | | $ | 95,904 | |
| | | | | | |
Total Change in Unrealized Appreciation (Depreciation) | | | | $ | 95,904 | | | $ | 95,904 | |
| | | | | | |
Number of Contracts, Notional Amounts or Shares/Units (1)
| | | | | | | | |
| | | Equity
Contracts
Risk | | | Total | |
Rights | | | 496 | | | | 496 | |
Warrants | | | 51,583 | | | | 51,583 | |
| | | | |
| (1) | Amount disclosed represents the weighted average held during the year ended December 31, 2012. |
PIMCO Real Return
Fair value of derivatives instruments as of December 31, 2012:
Asset Derivatives
| | | | | | | | | | | | | | |
| | | Statement of Assets and Liabilities Location | | Foreign
Exchange
Contracts
Risk | | | Interest
Rate
Contracts
Risk | | | Total | |
Futures Contracts | | Net Assets—Net unrealized appreciation (depreciation) on investments and futures contracts (a) | | $ | — | | | $ | 36,086 | | | $ | 36,086 | |
Swap Contracts | | Open swap agreements, at value (b) | | | — | | | | 567,626 | | | | 567,626 | |
Forward Contracts | | Unrealized appreciation on foreign currency forward contracts | | | 98,602 | | | | — | | | | 98,602 | |
| | | | | | |
Total Fair Value | | | | $ | 98,602 | | | $ | 603,712 | | | $ | 702,314 | |
| | | | | | |
| | | | |
| mainstayinvestments.com | | | M-463 | |
Notes to Financial Statements (continued)
Liability Derivatives
| | | | | | | | | | | | | | |
| | | Statement of Assets and Liabilities Location | | Foreign
Exchange
Contracts
Risk | | | Interest
Rate
Contracts
Risk | | | Total | |
Interest Rate Swaptions | | Unrealized depreciation on interest rate swaption contracts | | $ | — | | | $ | (18,271 | ) | | $ | (18,271 | ) |
Forward Contracts | | Unrealized depreciation on foreign currency forward contracts | | | (262,439 | ) | | | — | | | | (262,439 | ) |
| | | | | | |
Total Fair Value | | | | $ | (262,439 | ) | | $ | (18,271 | ) | | $ | (280,710 | ) |
| | | | | | |
| (a) | Includes cumulative appreciation (depreciation) of futures contracts as reported in the Portfolio of Investments. Only the current day's variation margin is reported within the Statement of Assets and Liabilities. |
| (b) | Includes open swap agreements at value as reported in the Portfolio of Investments. Only the current day's variation margin of centrally cleared swaps is reported within the Statement of Assets and Liabilities. |
The effect of derivative instruments on the Statement of Operations for the year ended December 31, 2012:
Realized Gain (Loss)
| | | | | | | | | | | | | | |
| | | Statement of Operations Location | | Foreign
Exchange
Contracts
Risk | | | Interest
Rate
Contracts
Risk | | | Total | |
Futures Contracts | | Net realized gain (loss) on futures transactions | | $ | — | | | $ | (75,736 | ) | | $ | (75,736 | ) |
Swap Contracts | | Net realized gain (loss) on swap transactions | | | — | | | | (96 | ) | | | (96 | ) |
Forward Contracts | | Net realized gain (loss) on foreign currency transactions | | | 897 | | | | — | | | | 897 | |
| | | | | | |
Total Realized Gain (Loss) | | | | $ | 897 | | | $ | (75,832 | ) | | $ | (74,935 | ) |
| | | | | | |
Change in Unrealized Appreciation (Depreciation)
| | | | | | | | | | | | | | |
| | | Statement of Operations Location | | Foreign
Exchange
Contracts
Risk | | | Interest
Rate
Contracts
Risk | | | Total | |
Written Options | | Net change in unrealized appreciation (depreciation) on interest rate swaption contracts | | $ | — | | | $ | 47,279 | | | $ | 47,279 | |
Futures Contracts | | Net change in unrealized appreciation (depreciation) on futures contracts | | | — | | | | 36,086 | | | | 36,086 | |
Swap Contracts | | Net change in unrealized appreciation (depreciation) on swap contracts | | | — | | | | 346,513 | | | | 346,513 | |
Forward Contracts | | Net change in unrealized appreciation (depreciation) on translation of other assets and liabilities in foreign currencies and foreign currency forward contracts | | | (163,837 | ) | | | — | | | | (163,837 | ) |
| | | | | | |
Total Change in Unrealized Appreciation (Depreciation) | | $ | (163,837 | ) | | $ | 429,878 | | | $ | 266,041 | |
| | | | | | |
Number of Contracts, Notional Amounts or Shares/Units (1)
| | | | | | | | | | | | |
| | | Foreign
Exchange
Contracts
Risk | | | Interest
Rate
Contracts
Risk | | | Total | |
Interest Rate Swaption Contracts | | | — | | | | (27,600,000 | ) | | | (27,600,000 | ) |
Futures Contracts Long | | | — | | | | 111 | | | | 111 | |
Futures Contracts Short | | | — | | | | (18 | ) | | | (18 | ) |
Forward Contracts Long | | $ | 3,782,103 | | | $ | — | | | $ | 3,782,103 | |
Forward Contracts Short | | $ | (27,427,561 | ) | | $ | — | | | $ | (27,427,561 | ) |
| | | | |
| (1) | Amount disclosed represents the weighted average held during the year ended December 31, 2012. |
| | |
| M-464 | | MainStay VP Funds Trust |
S&P 500 Index
Fair value of derivatives instruments as of December 31, 2012:
Liability Derivatives
| | | | | | | | | | |
| | | Statement of Assets and Liabilities Location | | Equity
Contracts
Risk | | | Total | |
Futures Contracts | | Net Assets—Net unrealized appreciation (depreciation) on investments and futures contracts (a) | | $ | (678,649 | ) | | $ | (678,649 | ) |
| | | | | | |
Total Fair Value | | | | $ | (678,649 | ) | | $ | (678,649 | ) |
| | | | | | |
| (a) | Includes cumulative appreciation (depreciation) of futures contracts as reported in the Portfolio of Investments. Only the current day's variation margin is reported within the Statement of Assets and Liabilities. |
The effect of derivative instruments on the Statement of Operations for the year ended December 31, 2012:
Realized Gain (Loss)
| | | | | | | | | | |
| | | Statement of Operations Location | | Equity
Contracts
Risk | | | Total | |
Warrants | | Net realized gain (loss) on security transactions | | $ | 3,744 | | | $ | 3,744 | |
Futures Contracts | | Net realized gain (loss) on futures transactions | | | 8,740,509 | | | | 8,740,509 | |
| | | | | | |
Total Realized Gain (Loss) | | | | $ | 8,744,253 | | | $ | 8,744,253 | |
| | | | | | |
Change in Unrealized Appreciation (Depreciation)
| | | | | | | | | | |
| | | Statement of Operations Location | | Equity
Contracts
Risk | | | Total | |
Futures Contracts | | Net change in unrealized appreciation (depreciation) on futures contracts | | $ | (1,064,374 | ) | | $ | (1,064,374 | ) |
| | | | | | |
Total Change in Unrealized Appreciation (Depreciation) | | $ | (1,064,374 | ) | | $ | (1,064,374 | ) |
| | | | | | |
Number of Contracts, Notional Amounts or Shares/Units
| | | | | | | | |
| | | Equity
Contracts
Risk | | | Total | |
Warrants (1) | | | 38,123 | | | | 38,123 | |
Futures Contracts Long (2) | | | 832 | | | | 832 | |
| | | | |
| (1) | Amount disclosed represents the actual average held during the year ended December 31, 2012. |
| (2) | Amount disclosed represents the weighted average held during the year ended December 31, 2012. |
T. Rowe Price Equity Income
The effect of derivative instruments on the Statement of Operations for the period ended December 31, 2012:
Realized Gain (Loss)
| | | | | | | | | | |
| | | Statement of Operations Location | | Equity
Contracts
Risk | | | Total | |
Rights | | Net realized gain (loss) on security transactions | | $ | (1 | ) | | $ | (1 | ) |
| | | | | | |
Total Realized Gain (Loss) | | | | $ | (1 | ) | | $ | (1 | ) |
| | | | | | |
| | | | |
| mainstayinvestments.com | | | M-465 | |
Notes to Financial Statements (continued)
Number of Contracts, Notional Amounts or Shares/Units (1)
| | | | | | | | |
| | | Equity
Contracts
Risk | | | Total | |
Rights | | | 94,886 | | | | 94,886 | |
| | | | |
| (1) | Amount disclosed represents the weighted average held during the period ended December 31, 2012. |
Van Eck Global Hard Assets
Fair value of derivatives instruments as of December 31, 2012:
Asset Derivatives
| | | | | | | | | | |
| | | Statement of Assets and Liabilities Location | | Equity
Contracts
Risk | | | Total | |
Warrants | | Investments in securities, at value | | $ | 10,173 | | | $ | 10,173 | |
| | | | | | |
Total Fair Value | | | | $ | 10,173 | | | $ | 10,173 | |
| | | | | | |
The effect of derivative instruments on the Statement of Operations for the period ended December 31, 2012:
Change in Unrealized Appreciation (Depreciation)
| | | | | | | | | | |
| | | Statement of Operations Location | | Equity
Contracts
Risk | | | Total | |
Warrants | | Net change in unrealized appreciation (depreciation) on investments | | $ | (26,686 | ) | | $ | (26,686 | ) |
| | | | | | |
Total Change in Unrealized Appreciation (Depreciation) | | | | $ | (26,686 | ) | | $ | (26,686 | ) |
| | | | | | |
Number of Contracts, Notional Amounts or Shares/Units (1)
| | | | | | | | | | |
| | | | | Equity Contracts Risk | | | Total | |
Warrants | | | | | 34,300 | | | | 34,300 | |
| | | | | | |
| (1) | Amount disclosed represents the weighted average held during the period ended December 31, 2012. |
Note 3–Fees and Related Party Transactions
(A) Investment Advisory, Subadvisory and Administration Fees. New York Life Investments, a registered investment adviser and an indirect, wholly-owned subsidiary of New York Life, serves as the Portfolios’ investment manager pursuant to an Amended and Restated Management Agreement (“Management Agreement”). New York Life Investments manages the Bond, Cash Management, Conservative Allocation, Floating Rate, Growth Allocation, Moderate Allocation and Moderate Growth Allocation Portfolios and the fixed-income portion of the Balanced Portfolio directly without the use of a subadvisor.
Effective January 11, 2013, Cornerstone Capital Management LLC (“Cornerstone Capital”), a registered investment adviser, will serve as the Subadvisor to the Growth Equity Portfolio pursuant to the terms of a Subadvisory
Agreement with New York Life Investments. Cornerstone Capital is an affiliate of New York Life Investments.
Dimensional Fund Advisors LP (“DFA”) and DuPont Capital Management Corporation (“DuPont Capital”), each a registered investment adviser, serve as Subadvisors to the DFA / DuPont Capital Emerging Markets Equity Portfolio and manage a portion of that Portfolio’s assets, as designated by New York Life Investments from time to time, subject to the oversight of New York Life Investments. Each Subadvisor is responsible for the day-to-day portfolio management of the Portfolio with respect to its allocated portion of the Portfolio’s assets.
Eagle Asset Management, Inc. (“Eagle”), a registered investment adviser, serves as Subadvisor to the Eagle Small Cap Growth Portfolio pursuant to the terms of a Subadvisory Agreement with New York Life Investments.
| | |
| M-466 | | MainStay VP Funds Trust |
Epoch Investment Partners, Inc. (“Epoch”), a registered investment adviser, serves as Subadvisor to the U.S. Small Cap Portfolio and the equity portion of the Income Builder Portfolio pursuant to the terms of an Amended and Restated Subadvisory Agreement with New York Life Investments.
Institutional Capital LLC (“ICAP”), a registered investment adviser and an indirect, wholly-owned subsidiary of New
York Life, serves as Subadvisor to the ICAP Select Equity Portfolio pursuant to the terms of a Subadvisory Agreement with New York Life Investments.
Janus Capital Management LLC (“Janus”), a registered investment adviser and wholly owned subsidiary of Janus Capital Group, Inc. (“JCGI”), serves as Subadvisor to the Janus Balanced Portfolio pursuant to the terms of a Subadvisory Agreement with New York Life Investments
MacKay Shields LLC (“MacKay Shields”), a registered investment adviser and an indirect, wholly-owned subsidiary of New York Life, serves as Subadvisor to the following Portfolios: Convertible, Flexible Bond Opportunities, Government, High Yield Corporate Bond and the overall asset allocation and fixed-income portion of the Income Builder Portfolio, pursuant to the terms of a Subadvisory Agreement with New York Life Investments.
Cornerstone Capital Management Holdings LLC (“Cornerstone Holdings”), a registered investment adviser and an indirect, wholly-owned subsidiary of New York Life, serves as Subadvisor to the following Portfolios: Common Stock, Growth Equity, International Equity, Mid Cap Core, S&P 500 Index, and the equity portion of Balanced Portfolio, pursuant to the terms of a Subadvisory Agreement with New York Life Investments. Effective January 25, 2013, Madison Square Investors LLC will become known as Cornerstone Holdings.
Massachusetts Financial Services Company (“MFS”), a registered investment adviser and an indirect majority-owned subsidiary of Sun Life Financial Inc. (a diversified financial services company), serves as Subadvisor to the MFS® Utilities Portfolio pursuant to the terms of a Subadvisory Agreement with New York Life Investments.
Pacific Investment Management Company LLC (“PIMCO”), a registered investment adviser, serves as Subadvisor to the PIMCO Real Return Portfolio pursuant to the terms of a Subadvisory Agreement with New York Life Investments.
T. Rowe Price Associates, Inc. (“T. Rowe Price”), a registered investment adviser, serves as Subadvisor to the T. Rowe Price Equity Portfolio pursuant to the terms of a Subadvisory Agreement with New York Life Investments.
Van Eck Associates Corporation (“Van Eck”), a registered investment adviser, serves as Subadvisor to the Van Eck Global Hard Assets Portfolio pursuant to the terms of a Subadvisory Agreement with New York Life Investments.
Winslow Capital Management, Inc. (“Winslow”), a registered investment adviser, serves as Subadvisor to the Large Cap Growth Portfolio pursuant to the terms of a Subadvisory Agreement with New York Life Investments.
Pursuant to the terms of Subadvisory Agreements between New York Life Investments and the Subadvisors, New York Life Investments pays for the services of each Subadvisor.
Pursuant to the Management Agreement referenced above, New York Life Investments also serves as administrator for the Portfolios. New York Life Investments provides offices, conducts clerical, recordkeeping and bookkeeping services, and keeps most of the financial and accounting records required to be maintained by the Portfolios. Except for the portion of salaries and expenses that are the responsibility of the Portfolios, the Manager pays the salaries and expenses of all personnel affiliated with the Portfolios and the operational expenses of the Portfolios. The Portfolios reimburse New York Life Investments in an amount equal to a portion of the salary of the Chief Compliance Officer of the Portfolios. For allocation methodology please see Note 2 (F).
State Street, 1 Lincoln Street, Boston, Massachusetts, 02111, provides sub-administration and sub-accounting services to the Portfolios pursuant to an agreement with New York Life Investments. These services include calculating the daily NAVs of the Portfolios, maintaining the general ledger and sub-ledger accounts for the calculation of the Portfolios’ respective NAVs, and assisting New York Life Investments in conducting various aspects of the Portfolios’ administrative operations. For providing these services to the Portfolios, State Street is compensated by New York Life Investments.
The Fund, on behalf of each Portfolio, pays New York Life Investments in its capacity as the Portfolios’ investment manager and administrator, a monthly fee for the services performed and the facilities furnished at an approximate annual percentage of the average daily net assets of each Portfolio set forth in the table below. Where indicated, New York Life Investments has voluntarily agreed to waive fees and/or reimburse expenses with respect to certain Portfolios. The voluntary waivers/reimbursements may be discontinued at any time. From time to time, the Manager may voluntarily limit the Cash Management Portfolio’s expenses to the extent it deems appropriate to enhance the Portfolio’s yield during periods when expenses may have a significant impact on yield because of low interest rates. This limitation may be revised or terminated by the Manager at any time without notice.
| | | | |
| mainstayinvestments.com | | | M-467 | |
Notes to Financial Statements (continued)
| | | | | | | | |
Portfolio | | Annual Rate
on Average
Daily Net
Assets | | | Effective
Management
Fee Rate* | |
Balanced | | | 0.75% | (a) | | | 0.75% | |
Bond | | | 0.50% | (b) | | | 0.49% | |
Cash Management | | | 0.45% | (c) | | | 0.43% | |
Common Stock | | | 0.55% | (d) | | | 0.55% | |
Conservative Allocation | | | 0.00% | | | | 0.00% | |
Convertible | | | 0.60% | (e) | | | 0.60% | |
DFA / DuPont Capital Emerging Markets Equity | | | 1.20% | (f) | | | 1.20% | |
Eagle Small Cap Growth | | | 0.81% | (g) | | | 0.81% | |
Flexible Bond Opportunities | | | 0.60% | (h) | | | 0.60% | |
Floating Rate | | | 0.60% | | | | 0.60% | |
Government | | | 0.50% | (b) | | | 0.50% | |
Growth Allocation | | | 0.00% | | | | 0.00% | |
Growth Equity | | | 0.61% | (e) | | | 0.61% | |
High Yield Corporate Bond | | | 0.57% | (i) | | | 0.56% | |
ICAP Select Equity | | | 0.80% | (j) | | | 0.76% | |
Income Builder | | | 0.57% | (k) | | | 0.57% | |
International Equity | | | 0.89% | (l) | | | 0.89% | |
Janus Balanced | | | 0.55% | (m) | | | 0.55% | |
Large Cap Growth | | | 0.75% | (n) | | | 0.75% | |
MFS® Utilities | | | 0.73% | (o) | | | 0.73% | |
Mid Cap Core | | | 0.85% | (p) | | | 0.85% | |
Moderate Allocation | | | 0.00% | | | | 0.00% | |
Moderate Growth Allocation | | | 0.00% | | | | 0.00% | |
PIMCO Real Return | | | 0.50% | (q) | | | 0.50% | |
S&P 500 Index | | | 0.30% | (r) | | | 0.30% | |
T. Rowe Price Equity Income | | | 0.80% | (s) | | | 0.80% | |
U.S. Small Cap | | | 0.80% | (t) | | | 0.79% | |
Van Eck Global Hard Assets | | | 0.89% | (u) | | | 0.89% | |
| * | The effective management fee rate is exclusive of any applicable waivers/reimbursements. |
| (a) | Up to $1 billion and 0.70% in excess of $1 billion. New York Life Investments has voluntarily agreed to waive a portion of its management fee to 0.70% on assets up to $1 billion and 0.65% on assets over $1 billion. This waiver is voluntary and may be discontinued at any time. For the year ended December 31, 2012, the Manager waived its fees in the amount of $93,256. |
| (b) | Up to $500 million; 0.475% from $500 million to $1 billion and 0.45% in excess of $1 billion. |
| (c) | Up to $500 million; 0.40% from $500 million to $1 billion and 0.35% in excess of $1 billion. From time to time, the Manager may limit expenses of the Portfolio to the extent it deems appropriate to enhance the yield of the Portfolio during periods when expenses have a significant impact on the yield of the Portfolio because of low interest rates. This expense limitation policy is voluntary and may be revised or terminated by the Manager at any time without notice. For the year ended December 31, 2012, the Manager waived its fees in the amount of $2,129,590. |
| (d) | Up to $500 million; 0.525% from $500 million to $1 billion and 0.50% in excess of $1 billion. |
| (e) | Up to $1 billion and 0.50% in excess of $1 billion. |
| (f) | New York Life Investments has contractually agreed to waive fees and/or reimburse expenses so that total annual operating expenses do not exceed 1.60% for Initial Class and 1.65% for Service Class. This agreement expires on May 1, 2014 and may not be amended or terminated prior to that date. Additionally, New York Life Investments has contractually agreed to waive 0.01% of its management fee on assets in excess of $1 billion. This agreement expires on May 1, 2013 and may only be amended or terminated prior to that date by action of the Board. |
| (g) | New York Life Investments has contractually agreed to waive fees and/or reimburse expenses so that total annual operating expenses do not exceed 0.95% for Initial Class and 1.22% for Service Class. This agreement expires on May 1, 2014 and may not be amended or terminated prior to that date. Additionally, New York Life Investments has contractually agreed to waive 0.025% of its management fee on assets in excess of $1 billion. This agreement expires on May 1, 2013 and may only be amended or terminated prior to that date by action of the Board. |
| (h) | Up to $500 million; 0.55% from $500 million to $1 billion and 0.50% in excess of $1 billion. New York Life Investments had voluntarily agreed to waive fees and/or reimburse expense so that total ordinary operating expenses would not exceed 0.85% with respect to Initial Class Shares. An equivalent reimbursement was applied to Service Class Shares. The waiver is voluntary and was discontinued at as of May 1, 2012. |
| (i) | Up to $1 billion; 0.55% from $1 billion to $5 billion and 0.525% in excess of $5 billion. |
| (j) | Up to $250 million; 0.75% from $250 million to $1 billion and 0.74% in excess of $1 billion. |
| (k) | Up to $1 billion and 0.55% in excess of $1 billion. |
| (l) | Up to $500 million and 0.85% in excess of $500 million. |
| (m) | New York Life Investments has contractually agreed to waive fees and/or reimburse expenses so that total annual operating expenses do not exceed 0.58% for Initial Class and 0.83% for Service Class. This agreement expires on May 1, 2014 and may not be amended or terminated prior to that date. Additionally, New York Life Investments has contractually agreed to waive 0.025% of its management fee on assets in excess of $1 billion. This agreement expires on May 1, 2013 and may only be amended or terminated prior to that date by action of the Board. For the year ended December 31, 2012, the Manager waived its fees in the amount of $92,904. |
| (n) | Up to $500 million; 0.725% from $500 million to $1 billion and 0.70% in excess of $1 billion. New York Life Investments has voluntarily agreed to waive a portion of its management fee when the subadvisory fee is reduced as a result of achieving breakpoints in the subadvisory fee schedule. The savings resulting from the reduced subadvisory fee will be shared equally with the Portfolio provided that the amount of the management fee retained by New York Life Investments, after payment of the subadvisory fee, exceeds 0.35% of the average daily net assets of the Portfolio. Additionally, the Manager has voluntarily agreed to waive $12,500 annually of its management fee for the Portfolio. These waivers may be discontinued at any time. For the year ended December 31, 2012, the Manager waived its fees in the amount of $18,830. |
| | |
| M-468 | | MainStay VP Funds Trust |
| (o) | New York Life Investments has contractually agreed to waive fees and/or reimburse expenses so that total annual operating expenses do not exceed 0.81% for Initial Class and 1.06% for Service Class. This agreement expires on May 1, 2014 and may not be amended or terminated prior to that date. Additionally, New York Life Investments has contractually agreed to waive 0.03% of its management fee on assets in excess of $1 billion. This agreement expires on May 1, 2013 and may only be amended or terminated prior to that date by action of the Board. |
| (p) | Up to $1 billion and 0.80% in excess of $1 billion. |
| (q) | New York Life Investments has contractually agreed to waive fees and/or reimburse expenses so that total annual operating expenses do not exceed 0.66% for Initial Class and 0.76% for Service Class. This agreement expires on May 1, 2014 and may not be amended or terminated prior to that date. For the year ended December 31, 2012, the Manager waived its fees in the amount of $224,297. |
| (r) | Up to $1 billion; 0.275% from $1 billion to $2 billion; 0.265% from $2 billion to $3 billion and 0.25% in excess of $3 billion. New York Life Investments has voluntarily agreed to waive a portion of its management fee to 0.25% up to $1 billion, 0.225% from $1 billion to $2 billion, 0.215% from $2 billion to $3 billion and 0.20% in excess of $3 billion. This waiver is voluntary and may be revised or terminated at any time. For the year ended December 31, 2012, the Manager waived its fees in the amount of $489,968. |
| (s) | Up to $500 million and 0.775% on assets in excess of $500 million. New York Life Investments has contractually agreed to waive its management fee to 0.75% on assets up to $500 million and 0.725% on assets in excess of $500 million. Additionally, New York Life Investments has contractually agreed to waive fees and/or reimburse expenses so that total annual operating expenses do not exceed 0.85% for Initial Class and 1.10% for Service Class. This agreement expires on May 1, 2014 and may not be amended or terminated prior to that date. Additionally, New York Life Investments has contractually agreed to waive 0.01% of its management fee on assets in excess of $1 billion. This agreement expires on May 1, 2013 and may only be amended or terminated prior to that date by action of the Board. For the year ended December 31, 2012, the Manager waived its fees in the amount of $221,855. |
| (t) | Up to $200 million; 0.75% from $200 million to $500 million; 0.725% from $500 million to $1 billion and 0.70% in excess of $1 billion. |
| (u) | New York Life Investments has contractually agreed to waive fees and/or reimburse expenses so that total annual operating expenses do not exceed 0.97% for Initial Class. This agreement expires on May 1, 2014 and may not be amended or terminated prior to that date. Additionally, New York Life Investments has contractually agreed to waive 0.01% of its management fees on assets in excess of $1 billion. This agreement expires on May 1, 2013 and may only be amended or terminated prior to that date by action of the Board. |
(B) Distribution and Service Fees. NYLIFE Distributors LLC (the “Distributor”), an indirect, wholly-owned subsidiary of New York Life, serves as distributor to the Service Class shares of all Portfolios offering such shares, pursuant to a Distribution and Service Agreement. The Fund has adopted on behalf of each Portfolio (except the Cash Management and Van Eck Global Hard Assets Portfolios) a Distribution
and Service Plan in accordance with the provisions of Rule 12b-1 under the 1940 Act. Under the Distribution and Service Plan, the Distributor has agreed to provide, through its affiliates or independent third parties, various distribution-related, shareholder and administrative support services to Service Class shareholders. For its services, the Distributor is entitled to a combined distribution and service fee accrued daily and paid monthly at an annual rate of 0.25% of the average daily net assets attributable to the Service Class shares of each Portfolio.
(C) Capital. As of December 31, 2012, the Asset Allocation Portfolios held the following percentages of outstanding shares of affiliated investment companies:
| | | | |
Conservative Allocation | | | | |
MainStay 130/30 Core Fund Class I | | | 11.24 | % |
MainStay 130/30 International Fund Class I | | | 4.87 | |
MainStay Epoch International Small Cap Fund Class I | | | 0.04 | |
MainStay Epoch U.S. All Cap Fund Class I | | | 2.76 | |
MainStay High Yield Opportunities Fund Class I | | | 1.51 | |
MainStay ICAP Equity Fund Class I | | | 2.56 | |
MainStay ICAP International Fund Class I | | | 0.89 | |
MainStay Intermediate Term Bond Fund Class I | | | 3.60 | |
MainStay MAP Fund Class I | | | 4.81 | |
MainStay Marketfield Fund Class I | | | 0.07 | |
MainStay Short Duration High Yield Fund Class I | | | 11.22 | |
MainStay VP Bond Portfolio Initial Class | | | 34.16 | |
MainStay VP Cash Management Portfolio Initial Class | | | 1.56 | |
MainStay VP Convertible Portfolio Initial Class | | | 0.73 | |
MainStay VP DFA / DuPont Capital Emerging Markets Equity Portfolio Initial Class | | | 7.20 | |
MainStay VP Eagle Small Cap Growth Portfolio Initial Class | | | 0.15 | |
MainStay VP Flexible Bond Opportunities Portfolio Initial Class | | | 25.39 | |
MainStay VP Floating Rate Portfolio Initial Class | | | 27.33 | |
MainStay VP High Yield Corporate Bond Portfolio Initial Class | | | 2.77 | |
MainStay VP ICAP Select Equity Portfolio Initial Class | | | 0.21 | |
MainStay VP International Equity Portfolio Initial Class | | | 1.62 | |
MainStay VP Large Cap Growth Portfolio Initial Class | | | 14.12 | |
MainStay VP Mid Cap Core Portfolio Initial Class | | | 0.01 | |
MainStay VP S&P 500 Index Portfolio Initial Class | | | 2.97 | |
MainStay VP T. Rowe Price Equity Income Portfolio Initial | | | 7.58 | |
MainStay VP U.S. Small Cap Portfolio Initial Class | | | 0.21 | |
| |
| | | | |
Growth Allocation | | | | |
MainStay 130/30 Core Fund Class I | | | 6.25 | % |
MainStay 130/30 International Fund Class I | | | 9.87 | |
MainStay Epoch Global Choice Fund Class I | | | 6.33 | |
MainStay Epoch International Small Cap Fund Class I | | | 0.17 | |
MainStay Epoch U.S. All Cap Fund Class I | | | 1.44 | |
| | | | |
| mainstayinvestments.com | | | M-469 | |
Notes to Financial Statements (continued)
| | | | |
Growth Allocation (continued) | | | | |
MainStay ICAP Equity Fund Class I | | | 1.23 | % |
MainStay ICAP International Fund Class I | | | 1.72 | |
MainStay MAP Fund Class I | | | 3.72 | |
MainStay Marketfield Fund Class I | | | 0.03 | |
MainStay VP Common Stock Portfolio Initial Class | | | 0.92 | |
MainStay VP DFA / DuPont Capital Emerging Markets Equity Portfolio Initial Class | | | 3.38 | |
MainStay VP Eagle Small Cap Growth Portfolio Initial Class | | | 3.58 | |
MainStay VP ICAP Select Equity Portfolio Initial Class | | | 0.45 | |
MainStay VP International Equity Portfolio Initial Class | | | 3.10 | |
MainStay VP Large Cap Growth Portfolio Initial Class | | | 9.28 | |
MainStay VP Mid Cap Core Portfolio Initial Class | | | 1.03 | |
MainStay VP S&P 500 Index Portfolio Initial Class | | | 0.84 | |
MainStay VP T. Rowe Price Equity Income Portfolio Initial Class | | | 7.27 | |
MainStay VP U.S. Small Cap Portfolio Initial Class | | | 13.05 | |
MainStay VP Van Eck Global Hard Assets Portfolio Initial Class | | | 0.19 | |
| |
| | | | |
Moderate Allocation | | | | |
MainStay 130/30 Core Fund Class I | | | 18.06 | % |
MainStay 130/30 International Fund Class I | | | 13.40 | |
MainStay Epoch Global Choice Fund Class I | | | 18.75 | |
MainStay Epoch International Small Cap Fund Class I | | | 0.52 | |
MainStay Epoch U.S. All Cap Fund Class I | | | 6.39 | |
MainStay High Yield Opportunities Fund Class I | | | 0.44 | |
MainStay ICAP Equity Fund Class I | | | 3.98 | |
MainStay ICAP International Fund Class I | | | 2.47 | |
MainStay Intermediate Term Bond Fund Class I | | | 4.35 | |
MainStay MAP Fund Class I | | | 7.83 | |
MainStay Marketfield Fund Class I | | | 0.08 | |
MainStay Short Duration High Yield Fund Class I | | | 9.23 | |
MainStay VP Bond Portfolio Initial Class | | | 20.57 | |
MainStay VP Cash Management Portfolio Initial Class | | | 1.60 | |
MainStay VP Common Stock Portfolio Initial Class | | | 0.11 | |
MainStay VP Convertible Portfolio Initial Class | | | 1.85 | |
MainStay VP DFA / DuPont Capital Emerging Markets Equity Portfolio Initial Class | | | 11.55 | |
MainStay VP Eagle Small Cap Growth Portfolio Initial Class | | | 0.60 | |
MainStay VP Flexible Bond Opportunities Portfolio Initial Class | | | 32.25 | |
MainStay VP Floating Rate Portfolio Initial Class | | | 25.96 | |
MainStay VP High Yield Corporate Bond Portfolio Initial Class | | | 2.28 | |
MainStay VP ICAP Select Equity Portfolio Initial Class | | | 0.80 | |
MainStay VP International Equity Portfolio Initial Class | | | 4.39 | |
MainStay VP Large Cap Growth Portfolio Initial Class | | | 22.99 | |
MainStay VP Mid Cap Core Portfolio Initial Class | | | 0.45 | |
MainStay VP S&P 500 Index Portfolio Initial Class | | | 3.82 | |
| | | | |
Moderate Allocation (continued) | | | | |
MainStay VP T. Rowe Price Equity Income Portfolio Initial Class | | | 13.88 | % |
MainStay VP U.S. Small Cap Portfolio Initial Class | | | 2.33 | |
| |
| | | | |
Moderate Growth Allocation | | | | |
MainStay 130/30 Core Fund Class I | | | 24.38 | % |
MainStay 130/30 International Fund Class I | | | 33.00 | |
MainStay Epoch Global Choice Fund Class I | | | 26.67 | |
MainStay Epoch International Small Cap Fund Class I | | | 2.35 | |
MainStay Epoch U.S. All Cap Fund Class I | | | 8.11 | |
MainStay High Yield Opportunities Fund Class I | | | 0.47 | |
MainStay ICAP Equity Fund Class I | | | 5.35 | |
MainStay ICAP International Fund Class I | | | 5.85 | |
MainStay Intermediate Term Bond Fund Class I | | | 3.26 | |
MainStay MAP Fund Class I | | | 13.05 | |
MainStay Marketfield Fund Class I | | | 0.11 | |
MainStay Short Duration High Yield Fund Class I | | | 11.52 | |
MainStay VP Cash Management Portfolio Initial Class | | | 0.99 | |
MainStay VP Common Stock Portfolio Initial Class | | | 1.90 | |
MainStay VP Convertible Portfolio Initial Class | | | 1.50 | |
MainStay VP DFA / DuPont Capital Emerging Markets Equity Portfolio Initial Class | | | 14.70 | |
MainStay VP Eagle Small Cap Growth Portfolio Initial Class | | | 10.38 | |
MainStay VP Flexible Bond Opportunities Portfolio Initial Class | | | 33.88 | |
MainStay VP Floating Rate Portfolio Initial Class | | | 30.06 | |
MainStay VP High Yield Corporate Bond Portfolio Initial Class | | | 2.84 | |
MainStay VP ICAP Select Equity Portfolio Initial Class | | | 1.82 | |
MainStay VP International Equity Portfolio Initial Class | | | 10.24 | |
MainStay VP Large Cap Growth Portfolio Initial Class | | | 33.80 | |
MainStay VP Mid Cap Core Portfolio Initial Class | | | 8.73 | |
MainStay VP S&P 500 Index Portfolio Initial Class | | | 5.20 | |
MainStay VP T. Rowe Price Equity Income Portfolio Initial Class | | | 24.50 | |
MainStay VP U.S. Small Cap Portfolio Initial Class | | | 40.13 | |
MainStay VP Van Eck Global Hard Assets Portfolio Initial Class | | | 1.02 | |
Effective February 28, 2013, the MainStay 130/30 Core Fund will change its name to MainStay U.S. Equity Opportunities Fund.
Effective February 28, 2013, the MainStay 130/30 International Fund will change its name to MainStay International Opportunities Fund.
| | |
| M-470 | | MainStay VP Funds Trust |
Note 4–Federal Income Tax
As of December 31, 2012, the components of accumulated gain (loss) on a tax basis were as follows:
| | | | | | | | | | | | | | | | | | | | | | | | |
Portfolio | | Ordinary
Income | | | Late Year
Ordinary and
Post October
Loss Deferrals | | | Accumulated
Capital and Other
Gain (Loss) | | | Other
Temporary
Differences | | | Unrealized
Appreciated
(Depreciation) | | | Total Accumulated
Gain (Loss) | |
Balanced | | $ | 2,535,109 | | | $ | — | | | $ | (1,093,873 | ) | | $ | — | | | $ | 15,461,589 | | | $ | 16,902,825 | |
Bond | | | 33,456,700 | | | | — | | | | 2,105,788 | | | | — | | | | 29,882,998 | | | | 65,445,486 | |
Cash Management | | | 112 | | | | — | | | | — | | | | — | | | | — | | | | 112 | |
Common Stock | | | 9,226,345 | | | | — | | | | (143,124,168 | ) | | | — | | | | 65,197,260 | | | | (68,700,563 | ) |
Conservative Allocation | | | 22,562,405 | | | | — | | | | 17,254,905 | | | | (24,783,492 | ) | | | 18,414,364 | | | | 33,448,182 | |
Convertible | | | 19,289,845 | | | | — | | | | 26,847,712 | | | | (2,450,772 | ) | | | 12,190,768 | | | | 55,877,553 | |
DFA / DuPont Capital Emerging Markets Equity | | | 2,559,146 | | | | — | | | | (3,466,613 | ) | | | — | | | | 7,462,766 | | | | 6,555,299 | |
Eagle Small Cap Growth | | | 250,633 | | | | — | | | | (7,222,998 | ) | | | — | | | | 6,486,173 | | | | (486,192 | ) |
Flexible Bond Opportunities | | | 20,674 | | | | (578,136 | ) | | | — | | | | (26,946 | ) | | | 9,660,230 | | | | 9,075,822 | |
Floating Rate | | | 139,458 | | | | — | | | | (10,629,777 | ) | | | (14,402 | ) | | | 7,049,961 | | | | (3,454,760 | ) |
Government | | | 9,732,153 | | | | — | | | | 562,623 | | | | — | | | | 21,048,783 | | | | 31,343,559 | |
Growth Allocation | | | 4,274,960 | | | | — | | | | 13,603,526 | | | | (38,211,805 | ) | | | 15,603,257 | | | | (4,730,062 | ) |
Growth Equity | | | 4,350,401 | | | | — | | | | (31,444,736 | ) | | | — | | | | 80,142,581 | | | | 53,048,246 | |
High Yield Corporate Bond | | | 148,068,222 | | | | — | | | | (120,197,731 | ) | | | — | | | | 147,611,565 | | | | 175,482,056 | |
ICAP Select Equity | | | 18,023,969 | | | | — | | | | (194,452,755 | ) | | | — | | | | 156,744,814 | | | | (19,683,972 | ) |
Income Builder | | | 11,875,527 | | | | — | | | | (11,268,854 | ) | | | — | | | | 31,967,476 | | | | 32,574,149 | |
International Equity | | | 5,029,955 | | | | — | | | | (135,335,353 | ) | | | — | | | | 59,081,345 | | | | (71,224,053 | ) |
Janus Balanced | | | 14,148,217 | | | | — | | | | 21,574 | | | | — | | | | 29,111,873 | | | | 43,281,664 | |
Large Cap Growth | | | 1,643,557 | | | | — | | | | 3,840,074 | | | | — | | | | 84,704,841 | | | | 90,188,472 | |
MFS® Utilities | | | 35,283,100 | | | | — | | | | — | | | | — | | | | 32,410,660 | | | | 67,693,760 | |
Mid Cap Core | | | 21,476,704 | | | | — | | | | 29,661,560 | | | | — | | | | 63,520,975 | | | | 114,659,239 | |
Moderate Allocation | | | 21,645,101 | | | | — | | | | 30,394,394 | | | | (46,275,754 | ) | | | 28,762,800 | | | | 34,526,541 | |
Moderate Growth Allocation | | | 20,603,438 | | | | — | | | | 40,789,531 | | | | (60,766,776 | ) | | | 56,117,668 | | | | 56,743,861 | |
PIMCO Real Return | | | 7,021,826 | | | | — | | | | 60,777 | | | | — | | | | 13,961,202 | | | | 21,043,805 | |
T. Rowe Price Equity Income | | | 14,453,627 | | | | — | | | | 79,660 | | | | — | | | | 24,251,805 | | | | 38,785,092 | |
S&P 500 Index | | | 18,070,017 | | | | — | | | | (69,785,657 | ) | | | — | | | | 408,265,606 | | | | 356,549,966 | |
U.S. Small Cap | | | 2,223,915 | | | | — | | | | (13,838,633 | ) | | | — | | | | 28,225,980 | | | | 16,611,262 | |
Van Eck Global Hard Assets | | | 6,454,496 | | | | — | | | | (13,438,256 | ) | | | — | | | | (59,670,217 | ) | | | (66,653,977 | ) |
The difference between book-basis and tax-basis unrealized appreciation (depreciation) is primarily due to wash sale adjustments, return of capital distributions received, Passive Foreign Investment Companies (PFICs), partnerships, straddle deferrals, modified debt instruments and Real Estate Investment Trusts (REITs).
The other temporary differences are primarily due to loss deferrals from related party transactions, Contingent Payment Debt Instruments (CPDI) and defaulted bond income accruals.
Certain Portfolios intend to elect, to the extent provided by the regulations, to treat certain qualifying capital and/or ordinary losses that arose after October 31, 2012, as if they arose on January 1, 2013.
| | | | |
| mainstayinvestments.com | | | M-471 | |
Notes to Financial Statements (continued)
The following table discloses the current year reclassifications between accumulated undistributed net investment income (loss), accumulated net realized gain (loss) on investments and additional paid-in capital, arising from permanent differences; net assets as of December 31, 2012 are not affected.
| | | | | | | | | | | | |
Portfolio | | Undistributed Net
Investment
Income (Loss) | | | Accumulated
Net Realized
Gain (Loss) on Investments | | | Additional
Paid-in Capital | |
Balanced | | $ | (80,257 | ) | | $ | 80,257 | | | $ | — | |
Bond | | | 1,670,061 | | | | (1,670,061 | ) | | | — | |
Cash Management | | | — | | | | — | | | | — | |
Common Stock | | | (126,313 | ) | | | 126,313 | | | | — | |
Conservative Allocation | | | 5,924,784 | | | | (5,924,784 | ) | | | — | |
Convertible | | | 2,987,457 | | | | (2,987,457 | ) | | | — | |
DFA / DuPont Capital Emerging Markets Equity | | | (950,977 | ) | | | 950,977 | | | | — | |
Flexible Bond Opportunities | | | (302,915 | ) | | | 302,915 | | | | — | |
Floating Rate | | | (21,750 | ) | | | 21,750 | | | | — | |
Eagle Small Cap Growth | | | (198,027 | ) | | | 198,027 | | | | — | |
Government | | | 88,987 | | | | (88,987 | ) | | | — | |
Growth Allocation | | | 960,628 | | | | (960,628 | ) | | | — | |
Growth Equity | | | (30,770 | ) | | | 30,770 | | | | — | |
High Yield Corporate Bond | | | (1,633,692 | ) | | | 1,633,692 | | | | — | |
ICAP Select Equity | | | — | | | | — | | | | — | |
Income Builder | | | (1,067,841 | ) | | | 889,632 | | | | 178,209 | |
International Equity | | | 610,993 | | | | (610,993 | ) | | | — | |
Janus Balanced | | | (946,383 | ) | | | 946,383 | | | | — | |
Large Cap Growth | | | (63,960 | ) | | | 63,960 | | | | — | |
MFS® Utilities | | | 1,423,891 | | | | (1,423,891 | ) | | | — | |
Mid Cap Core | | | (211,013 | ) | | | 211,013 | | | | — | |
Moderate Allocation | | | 5,751,394 | | | | (5,751,394 | ) | | | — | |
Moderate Growth Allocation | | | 4,246,959 | | | | (4,246,959 | ) | | | — | |
PIMCO Real Return | | | (238,659 | ) | | | 238,659 | | | | | |
S&P 500 Index | | | (422,519 | ) | | | 422,519 | | | | — | |
T. Rowe Price Equity Income | | | (147,448 | ) | | | 147,448 | | | | — | |
U.S. Small Cap | | | (69 | ) | | | 69 | | | | — | |
Van Eck Global Hard Assets | | | 449,201 | | | | (449,201 | ) | | | — | |
The reclassifications for the Portfolios are primarily due to return of capital distributions received, dollar rolls, REITs, short term distributions received from underlying investment companies, defaulted bond income accruals, CPDI, foreign currency gain (loss), foreign capital gains, PFICs, partnerships, consent fees and treasury inflation protection securities.
Under the Regulated Investment Company Modernization Act of 2010, the Portfolios are permitted to carry forward capital losses incurred in taxable years beginning after December 22, 2010, for an unlimited period. However, any losses incurred during those future years will be required to be utilized prior to the losses incurred in pre-enactment tax years. As a result of this ordering rule, pre-enactment
capital loss carryforwards may be more likely to expire unused. Additionally, post-enactment capital losses that are carried forward will retain their character as either short-term or long-term capital losses rather than being considered all short-term as under previous law.
As of December 31, 2012, for federal income tax purposes, capital loss carryforwards, as shown in the table below, were available to the extent provided by the regulations to offset future realized gains of each respective Portfolio through the years indicated. Accordingly, no capital gains distributions are expected to be paid to shareholders until net gains have been realized in excess of such amounts.
| | |
| M-472 | | MainStay VP Funds Trust |
| | | | | | | | | | | | |
Portfolio | | Capital Loss
Available
Through | | | Short-Term
Amounts
(000’s) | | | Long-Term
Amounts
(000’s) | |
Balanced | | | 2017 | | | $ | 1,094 | | | $ | — | |
Common Stock | | | 2016 | | | $ | 33,077 | | | $ | — | |
| | | | 2017 | | | | 110,047 | | | | — | |
Total | | | | | | $ | 143,124 | | | $ | — | |
DFA/DuPont Capital Emerging Markets Equity Unlimited | | | Unlimited | | | $ | 3,467 | | | $ | — | |
Floating Rate | | | 2016 | | | $ | 8,168 | | | $ | — | |
| | | | 2017 | | | | 2,462 | | | | — | |
Total | | | | | | $ | 10,630 | | | $ | — | |
Eagle Small Cap Growth | | | Unlimited | | | $ | 7,223 | | | $ | — | |
Growth Equity | | | 2016 | | | $ | 4,583 | | | $ | — | |
| | | | 2017 | | | | 26,862 | | | | — | |
Total | | | | | | $ | 31,445 | | | $ | — | |
High Yield Corporate Bond | | | 2016 | | | $ | 26,533 | | | $ | — | |
| | | | 2017 | | | | 93,665 | | | | — | |
Total | | | | | | $ | 120,198 | | | $ | — | |
ICAP Select Equity | | | 2017 | | | $ | 194,453 | | | $ | — | |
Income Builder | | | 2017 | | | $ | 11,269 | | | | — | |
International Equity | | | 2016 | | | $ | 47,174 | | | $ | — | |
| | | 2017 | | | | 39,290 | | | | — | |
| | | | Unlimited | | | | 21,548 | | | | 27,324 | |
Total | | | | | | $ | 108,012 | | | $ | 27,324 | |
S&P 500 Index | | | 2014 | | | $ | 27,990 | | | $ | — | |
| | | 2016 | | | | 18,017 | | | | — | |
| | | | 2017 | | | | 23,779 | | | | — | |
Total | | | | | | $ | 69,786 | | | $ | — | |
U.S. Small Cap | | | 2016 | | | $ | 11,005 | | | $ | — | |
| | | | 2017 | | | | 2,834 | | | | — | |
Total | | | | | | $ | 13,839 | | | $ | — | |
Van Eck Global Hard Assets | | | Unlimited | | | $ | 13,438 | | | | — | |
The following Portfolios utilized capital loss carryforwards during the year ended December 31, 2012:
| | | | |
Portfolio | | Capital Loss
Carryforward
Utilized | |
Balanced | | $ | 6,872,516 | |
Common Stock | | | 35,056,659 | |
Floating Rate | | | 76,136 | |
Government | | | 31,826 | |
Growth Equity | | | 16,045,832 | |
High Yield Corporate Bond | | | 14,172,102 | |
ICAP Select Equity | | | 30,169,180 | |
Income Builder | | | 10,112,387 | |
Large Cap Growth | | | 19,562,574 | |
S&P 500 Index | | | 20,976,546 | |
U.S. Small Cap | | | 10,018,008 | |
| | | | |
| mainstayinvestments.com | | | M-473 | |
Notes to Financial Statements (continued)
The tax character of distributions paid during the years ended December 31, 2012 and December 31, 2011 shown in the Statements of Changes in Net Assets was as follows:
| | | | | | | | | | | | | | | | |
| | | 2012 | | | 2011 | |
Portfolio | | Tax-Based
Distributions from
Ordinary Income | | | Tax-Based
Distributions from
Long-Term
Gains | | | Tax-Based
Distributions from
Ordinary Income | | | Tax-Based
Distributions from
Long-Term
Gains | |
Balanced | | $ | 2,232,826 | | | $ | — | | | $ | 2,302,514 | | | $ | — | |
Bond | | | 43,905,456 | | | | 14,610,565 | | | | 36,809,108 | | | | 2,844,847 | |
Cash Management | | | 74,363 | | | | — | | | | 77,843 | | | | — | |
Common Stock | | | 8,428,942 | | | | — | | | | 8,260,478 | | | | — | |
Conservative Allocation | | | 14,827,547 | | | | 34,144,384 | | | | 10,831,780 | | | | 1,438,553 | |
Convertible | | | 13,508,301 | | | | 1,815,023 | | | | 11,899,020 | | | | — | |
Flexible Bond Opportunities | | | 14,703,960 | | | | 445,137 | | | | 5,974,005 | | | | — | |
Floating Rate | | | 27,052,712 | | | | — | | | | 22,481,118 | | | | — | |
Government | | | 10,547,054 | | | | — | | | | 14,154,256 | | | | 35,317 | |
Growth Allocation | | | 2,060,343 | | | | 17,092,173 | | | | 1,802,559 | | | | — | |
Growth Equity | | | 1,643,158 | | | | — | | | | 1,907,991 | | | | — | |
High Yield Corporate Bond | | | 133,183,824 | | | | — | | | | 117,667,804 | | | | — | |
ICAP Select Equity | | | 21,988,842 | | | | — | | | | 15,244,973 | | | | — | |
Income Builder | | | 12,654,013 | | | | — | | | | 10,895,968 | | | | — | |
International Equity | | | 7,471,178 | | | | — | | | | 14,967,559 | | | | — | |
Large Cap Growth | | | — | | | | — | | | | — | | | | — | |
Mid Cap Core | | | 3,244,794 | | | | 41,942,805 | | | | 4,497,412 | | | | — | |
Moderate Allocation | | | 15,069,587 | | | | 49,635,044 | | | | 10,843,919 | | | | 1,512,828 | |
Moderate Growth Allocation | | | 10,964,170 | | | | 42,879,459 | | | | 8,214,445 | | | | — | |
S&P 500 Index | | | 15,407,775 | | | | — | | | | 14,797,497 | | | | — | |
U.S. Small Cap | | | 879,988 | | | | — | | | | 2,013,353 | | | | — | |
| | |
| M-474 | | MainStay VP Funds Trust |
Note 5–Foreign Currency Holdings
DFA / DuPont Capital Emerging Markets Equity
As of December 31, 2012, the Portfolio held the following foreign currencies:
| | | | | | | | | | | | | | | | | | | | | | | | |
| | | | | | Currency | | | | | | Cost | | | | | | Value | |
Brazilian Real | | | BRL | | | | 17,268 | | | | USD | | | | 8,429 | | | | USD | | | | 8,434 | |
Chilean Peso | | | CLP | | | | 1,811,351 | | | | | | | | 3,768 | | | | | | | | 3,784 | |
Czech Koruna | | | CZK | | | | 616 | | | | | | | | 31 | | | | | | | | 32 | |
Egyptian Pound | | | EGP | | | | 1,274 | | | | | | | | 208 | | | | | | | | 200 | |
Hong Kong Dollar | | | HKD | | | | 802,153 | | | | | | | | 103,484 | | | | | | | | 103,492 | |
Hungarian Forint | | | HUF | | | | 565 | | | | | | | | 3 | | | | | | | | 3 | |
Indonesian Rupiah | | | IDR | | | | 805 | | | | | | | | 0 | (a) | | | | | | | 0 | (a) |
Malaysian Ringgit | | | MYR | | | | 139,180 | | | | | | | | 45,427 | | | | | | | | 45,513 | |
Mexican Peso | | | MXN | | | | 4,909 | | | | | | | | 382 | | | | | | | | 380 | |
New Taiwan Dollar | | | TWD | | | | 3,046,844 | | | | | | | | 104,901 | | | | | | | | 104,923 | |
Philippine Peso | | | PHP | | | | 983 | | | | | | | | 24 | | | | | | | | 24 | |
Polish Zloty | | | PLN | | | | 83 | | | | | | | | 25 | | | | | | | | 27 | |
Pound Sterling (b) | | | GBP | | | | (2 | ) | | | | | | | (4 | ) | | | | | | | (4 | ) |
South African Rand | | | ZAR | | | | 630,015 | | | | | | | | 73,939 | | | | | | | | 74,316 | |
South Korean Won | | | KRW | | | | 382,489,989 | | | | | | | | 356,053 | | | | | | | | 357,275 | |
Thailand Baht | | | THB | | | | 290,433 | | | | | | | | 9,483 | | | | | | | | 9,494 | |
Turkish Lira | | | YTL | | | | 3,357 | | | | | | | | 1,873 | | | | | | | | 1,882 | |
Total | | | | | | | | | | | USD | | | | 708,026 | | | | USD | | | | 709,775 | |
| (b) | Currency was overdrawn as of December 31, 2012. |
Flexible Bond Opportunities
As of December 31, 2012, the Portfolio held the following foreign currencies:
| | | | | | | | | | | | | | | | | | | | | | | | |
| | | | | | Currency | | | | | | Cost | | | | | | Value | |
Euro | | | EUR | | | | 110,640 | | | | USD | | | | 146,499 | | | | USD | | | | 146,040 | |
Pound Sterling | | | GBP | | | | 92,247 | | | | | | | | 148,290 | | | | | | | | 149,851 | |
Total | | | | USD | | | | 294,789 | | | | USD | | | | 295,891 | |
Income Builder
As of December 31, 2012, the Portfolio held the following foreign currencies:
| | | | | | | | | | | | | | | | | | | | | | | | |
| | | | | | Currency | | | | | | Cost | | | | | | Value | |
Canadian Dollar | | | CAD | | | | 1 | | | | USD | | | | 0 | (a) | | | USD | | | | 1 | |
Euro | | | EUR | | | | 212,056 | | | | | | | | 277,709 | | | | | | | | 279,903 | |
Pound Sterling | | | GBP | | | | 62,510 | | | | | | | | 100,554 | | | | | | | | 101,545 | |
Total | | | | | | | | | | | USD | | | | 378,263 | | | | USD | | | | 381,449 | |
| | | | |
| mainstayinvestments.com | | | M-475 | |
Notes to Financial Statements (continued)
International Equity
As of December 31, 2012, the Portfolio held the following foreign currencies:
| | | | | | | | | | | | | | | | | | | | | | | | |
| | | | | | Currency | | | | | | Cost | | | | | | Value | |
Australian Dollar | | | AUD | | | | 688,147 | | | | USD | | | | 713,366 | | | | USD | | | | 714,606 | |
Brazilian Real | | | BRL | | | | 268,779 | | | | | | | | 131,840 | | | | | | | | 131,272 | |
Danish Krone | | | DKK | | | | 7,529,134 | | | | | | | | 1,300,057 | | | | | | | | 1,332,048 | |
Euro | | | EUR | | | | 222,242 | | | | | | | | 294,683 | | | | | | | | 293,349 | |
Indonesian Rupiah (a) | | | IDR | | | | (8 | ) | | | | | | | 0 | (b) | | | | | | | 0 | (b) |
Japanese Yen | | | JPY | | | | 4,423,639 | | | | | | | | 53,662 | | | | | | | | 51,061 | |
Pound Sterling | | | GBP | | | | 31,804 | | | | | | | | 51,743 | | | | | | | | 51,663 | |
South African Rand | | | ZAR | | | | 16,613,786 | | | | | | | | 1,896,837 | | | | | | | | 1,959,751 | |
Swedish Krona | | | SEK | | | | 14,527,747 | | | | | | | | 2,227,966 | | | | | | | | 2,233,955 | |
Swiss Franc | | | CHF | | | | 293,601 | | | | | | | | 313,441 | | | | | | | | 320,998 | |
Thailand Baht | | | THB | | | | 4,543,110 | | | | | | | | 148,166 | | | | | | | | 148,516 | |
Total | | | | | | | | | | | USD | | | | 7,131,761 | | | | USD | | | | 7,237,219 | |
| (a) | Currency was overdrawn as of December 31, 2012. |
MFS® Utilities
As of December 31, 2012, the Portfolio held the following foreign currencies:
| | | | | | | | | | | | | | | | | | | | | | | | |
| | | | | | Currency | | | | | | Cost | | | | | | Value | |
Chilean Peso | | | CLP | | | | 23,050,953 | | | | USD | | | | 48,257 | | | | USD | | | | 48,148 | |
Euro | | | EUR | | | | 8,037 | | | | | | | | 10,625 | | | | | | | | 10,608 | |
Israeli Shekel | | | ILS | | | | 1 | | | | | | | | 1 | | | | | | | | 1 | |
Total | | | | USD | | | | 58,883 | | | | USD | | | | 58,757 | |
PIMCO Real Return
As of December 31, 2012, the Portfolio held the following foreign currencies:
| | | | | | | | | | | | | | | | | | | | | | | | |
| | | | | | Currency | | | | | | Cost | | | | | | Value | |
Australian Dollar | | | AUD | | | | 22,768 | | | | USD | | | | 23,873 | | | | USD | | | | 23,643 | |
Canadian Dollar | | | CAD | | | | 365 | | | | | | | | 370 | | | | | | | | 367 | |
Euro | | | EUR | | | | 10,731 | | | | | | | | 14,204 | | | | | | | | 14,165 | |
Mexican Peso | | | MXN | | | | 630,624 | | | | | | | | 49,421 | | | | | | | | 48,786 | |
Pound Sterling | | | GBP | | | | 367 | | | | | | | | 596 | | | | | | | | 596 | |
Total | | | | USD | | | | 88,464 | | | | USD | | | | 87,557 | |
T. Rowe Price Equity Income
As of December 31, 2012, the Portfolio held the following foreign currency:
| | | | | | | | | | | | | | | | | | | | | | | | |
| | | Currency | | | Cost | | | Value | |
Euro | | | EUR | | | | 4 | | | | USD | | | | 5 | | | | USD | | | | 5 | |
Van Eck Global Hard Assets
As of December 31, 2012, the Portfolio held the following foreign currency:
| | | | | | | | | | | | | | | | | | | | | | | | |
| | | Currency | | | Cost | | | Value | |
Pound Sterling | | | GBP | | | | 130 | | | | USD | | | | 208 | | | | USD | | | | 211 | |
| | |
| M-476 | | MainStay VP Funds Trust |
Note 6–Restricted Securities
As of December 31, 2012, the following Portfolios held restricted securities:
Convertible
| | | | | | | | | | | | | | | | | | | | |
| | | Date of
Acquisition | | | Principal
Amount | | | Cost | | | 12/31/12
Value | | | Percent of Net Assets | |
At Home Corp. Convertible Bond 4.75%, due 12/31/49 | | | 8/31/01 | | | $ | 2,335,418 | | | $ | 0 | (a) | | $ | 234 | | | | 0.0% | ‡ |
| ‡ | Less than one-tenth of a percent. |
High Yield Corporate Bond
| | | | | | | | | | | | | | | | | | | | |
Security | | Date(s) of
Acquisition | | | Principal
Amount/
Number of
Warrants/
Shares | | | Cost | | | 12/31/12
Value | | | Percent of
Net Assets | |
Adelphia Contingent Value Vehicle | | | | | | | | | | | | | | | | | | | | |
Common Stock | | | 5/17/02 | | | | 2,207,279 | | | $ | 690,475 | | | $ | 22,073 | | | | 0.0 | %‡ |
At Home Corp. | | | | | | | | | | | | | | | | | | | | |
Convertible Bond 0.525%, due 12/28/18 | | | 8/31/01 | | | $ | 1,869,975 | | | | 0 | (a) | | | 187 | | | | 0.0 | ‡ |
Convertible Bond 4.75%, due 12/31/49 | | | 8/27/01 | | | $ | 9,032,054 | | | | 58,488 | | | | 903 | | | | 0.0 | ‡ |
AES Eastern Energy, L.P. (Escrow Shares) | | | | | | | | | | | | | | | | | | | | |
Corporate Bond 9.00%, due 1/2/17 | | | 6/29/12 | | | $ | 3,526,011 | | | | 599,422 | | | | 599,422 | | | | 0.0 | ‡ |
ASG Corp. | | | | | | | | | | | | | | | | | | | | |
Warrant Expires 5/18/18 | | | 4/30/10 | | | | 3,370 | | | | — | | | | 101,100 | | | | 0.0 | ‡ |
ION Media Networks, Inc. | | | | | | | | | | | | | | | | | | | | |
Warrant, Second Lien, Expires 12/18/39 | | | 12/20/10 | | | | 365 | | | | — | | | | 4 | | | | 0.0 | ‡ |
Warrant, Unsecured Debt, Expires 12/18/16 | | | 3/12/10 | | | | 360 | | | | 1,099 | | | | 3 | | | | 0.0 | ‡ |
Lear Corp. (Escrow Shares) | | | | | | | | | | | | | | | | | | | | |
Corporate Bond 8.75%, due 12/1/16 | | | 11/18/09 | | | $ | 2,681,000 | | | | — | | | | 4,022 | | | | 0.0 | ‡ |
Quebecor World, Inc. (Litigation Recovery Trust—Escrow Shares) | | | | | | | | | | | | | | | | | | | | |
Corporate Bond 6.50% due 8/01/49 | | | 1/23/08 | | | $ | 150,000 | | | | — | | | | 2,400 | | | | 0.0 | ‡ |
Corporate Bond 9.75% due 8/01/49 | | | 1/23/08 | | | $ | 8,530,000 | | | | — | | | | 136,480 | | | | 0.0 | ‡ |
Somerset Cayuga Holding Co., Inc. | | | | | | | | | | | | | | | | | | | | |
Convertible Bond 20.00%, due 6/15/17 | | | 6/29/12-12/15/12 | | | $ | 1,422,073 | | | | 1,432,200 | | | | 1,919,799 | | | | 0.1 | |
Sterling Entertainment Enterprise, LLC | | | | | | | | | | | | | | | | | | | | |
Corporate Bond 9.75%, due 12/31/19 | | | 12/21/12 | | | $ | 10,000,000 | | | | 10,000,000 | | | | 10,000,000 | | | | 0.4 | |
TreeHouse Foods, Inc. | | | | | | | | | | | | | | | | | | | | |
Corporate Bond 6.03%, due 9/30/13 | | | 2/22/10-2/24/10 | | | $ | 6,300,000 | | | | 6,205,500 | | | | 6,394,500 | | | | 0.3 | |
Unifi, Inc. | | | | | | | | | | | | | | | | | | | | |
Loan Assignments & Participations
8.75%, due 5/1/17 | | | 4/24/12 | | | $ | 2,625,000 | | | | 2,601,982 | | | | 2,703,750 | | | | 0.1 | |
Upstate NY Power Producers | | | | | | | | | | | | | | | | | | | | |
Common Stock | | | 6/29/12 | | | | 19,474 | | | | 331,050 | | | | 331,058 | | | | 0.0 | ‡ |
Total | | | | | | | | | | $ | 21,920,216 | | | $ | 22,215,701 | | | | 0.9 | % |
| ‡ | Less than one-tenth of a percent. |
| | | | |
| mainstayinvestments.com | | | M-477 | |
Notes to Financial Statements (continued)
Income Builder
| | | | | | | | | | | | | | | | | | | | |
Security | | Date(s) of
Acquisition | | | Number
of
Warrants | | | Cost | | | 12/31/12
Value | | | Percent
of Net
Assets | |
ION Media Networks, Inc. | | | | | | | | | | | | | | | | | | | | |
Warrant, Second Lien, Expires 12/12/39 | | | 12/20/10 | | | | 4 | | | $ | — | | | $ | 0 | (a) | | | 0.0% | ‡ |
Warrant, Unsecured Debt, Expires 12/18/16 | | | 3/12/10 | | | | 4 | | | | 13 | | | | 0 | (a) | | | 0.0 | |
Total | | | | | | | 8 | | | $ | 13 | | | $ | 0 | (a) | | | 0.0% | ‡ |
| ‡ | Less than one-tenth of a percent. |
MFS Utilities
| | | | | | | | | | | | | | | | | | | | |
Security | | Date(s) of
Acquisition | | | Principal
Amount | | | Cost | | | 12/31/12
Value | | | Percent
of Net
Assets | |
Falcon Franchise Loan LLC | | | 2/17/12 | | | | 37,686 | | | $ | 2,243 | | | $ | 4,100 | | | | 0.0% | ‡ |
Viridian Group FundCo II | | | 3/1/12 | | | | 1,150,000 | | | | 1,117,057 | | | | 1,196,000 | | | | 0.1 | |
Total | | | | | | | | | | $ | 1,119,300 | | | $ | 1,200,100 | | | | 0.1% | |
| ‡ | Less than one-tenth of a percent. |
Note 7–Commitments and Contingencies
As of December 31, 2012, the following Portfolio had unfunded loan commitments pursuant to the following loan agreement:
Floating Rate Portfolio
| | | | | | | | |
Borrower | | Unfunded
Commitment | | | Unrealized
Appreciation | |
Leslie’s Poolmart, Inc. | | | | | | | | |
New Term Loan B due 10/16/19 | | $ | 57,600 | | | $ | 616 | |
Total | | | | | | $ | 616 | |
The commitment is available until maturity date of the security.
Note 8–Custodian
State Street is the custodian of the cash and the securities of the Portfolios. Custodial fees are charged to the Portfolios based on the market value of securities in the Portfolios and the number of certain cash transactions incurred by the Portfolios.
Note 9–Line of Credit
The Portfolios, except for the Cash Management Portfolio, and certain affiliated funds maintain a line of credit with a syndicate of banks in order to secure a source of funds for temporary purposes to meet unanticipated or excessive redemption requests.
Effective August 29, 2012, under a second and restated agreement, the aggregate commitment amount is $200,000,000 with an optional maximum amount of $250,000,000. The commitment fee is an annual rate of 0.08% of the average commitment amount payable quarterly, regardless of usage, to Bank of New York Mellon, which serves as the agent to the syndicate. The commitment fee is allocated among certain Portfolios and affiliated funds based upon net assets and other factors. Interest on any revolving credit loan is charged based upon the Federal Funds Advances rate or the one month London InterBank Offered Rate, whichever is higher. The amended credit agreement expires on August 28, 2013, although the Portfolios, affiliated funds and the syndicate of banks may renew the amended credit agreement for an additional year on the same or different terms. Prior to August 29, 2012, the aggregate commitment amount was $125,000,000 with an optional maximum amount of $175,000,000. There were no borrowings made or outstanding with respect to the Portfolios on the amended credit agreement during the year ended December 31, 2012.
| | |
| M-478 | | MainStay VP Funds Trust |
Note 10–Purchases and Sales of Securities (in 000’s)
During the year ended December 31, 2012, purchases and sales of securities, other than short-term securities and securities subject to repurchase transactions, were as follows:
| | | | | | | | | | | | | | | | |
| | | U.S. Government Securities | | | Other | |
Portfolio | | Purchases | | | Sales | | | Purchases | | | Sales | |
Balanced | | $ | 167,409 | | | $ | 172,664 | | | $ | 221,673 | | | $ | 202,638 | |
Bond | | | 2,740,916 | | | | 2,764,823 | | | | 431,876 | | | | 291,077 | |
Common Stock | | | — | | | | — | | | | 696,524 | | | | 745,164 | |
Conservative Allocation | | | — | | | | — | | | | 455,774 | | | | 326,408 | |
Convertible | | | — | | | | — | | | | 322,528 | | | | 358,785 | |
DFA / DuPont Capital Emerging Markets Equity | | | — | | | | — | | | | 749,759 | | | | 315,528 | |
Eagle Small Cap Growth | | | — | | | | — | | | | 427,054 | | | | 235,552 | |
Flexible Bond Opportunities | | | — | | | | 1,736 | | | | 109,017 | | | | 87,930 | |
Floating Rate | | | — | | | | — | | | | 448,155 | | | | 286,695 | |
Government | | | 139,233 | | | | 149,996 | | | | 5,878 | | | | 4,386 | |
Growth Allocation | | | — | | | | — | | | | 107,244 | | | | 116,352 | |
Growth Equity | | | — | | | | — | | | | 177,767 | | | | 215,348 | |
High Yield Corporate Bond | | | — | | | | — | | | | 1,101,318 | | | | 625,329 | |
ICAP Select Equity | | | — | | | | — | | | | 633,849 | | | | 746,743 | |
Income Builder | | | 6,581 | | | | 9,082 | | | | 97,655 | | | | 83,486 | |
International Equity | | | — | | | | — | | | | 182,992 | | | | 202,876 | |
Janus Balanced | | | 217,154 | | | | 144,728 | | | | 337,096 | | | | 364,395 | |
Large Cap Growth | | | — | | | | — | | | | 518,294 | | | | 401,432 | |
MFS® Utilities | | | — | | | | — | | | | 413,288 | | | | 330,878 | |
Mid Cap Core | | | — | | | | — | | | | 1,021,551 | | | | 1,144,960 | |
Moderate Allocation | | | — | | | | — | | | | 550,661 | | | | 430,820 | |
Moderate Growth Allocation | | | — | | | | — | | | | 728,574 | | | | 528,991 | |
PIMCO Real Return | | | 602,700 | | | | 145,485 | | | | 111,974 | | | | 45,138 | |
S&P 500 Index | | | — | | | | — | | | | 88,947 | | | | 105,994 | |
T. Rowe Price Equity Income | | | — | | | | — | | | | 245,710 | | | | 71,796 | |
U.S. Small Cap | | | — | | | | — | | | | 79,753 | | | | 105,380 | |
Van Eck Global Hard Assets | | | — | | | | — | | | | 139,813 | | | | 140,869 | |
| | | | |
| mainstayinvestments.com | | | M-479 | |
Notes to Financial Statements (continued)
Note 11–In-Kind Transfer of Securities
On May 5, 2011, the Flexible Bond Opportunities Portfolio sold shares of beneficial interest to certain Asset Allocation Portfolios in exchange for cash and securities. The cash and securities were transferred in at their market value at the close of business on the date of transaction.
| | | | | | | | |
Transferring Portfolio | | Shares | | | Purchase Value | |
Conservative Allocation Initial Class | | | 2,773,932 | | | $ | 27,728,356 | |
Moderate Allocation Initial Class | | | 3,159,927 | | | | 31,586,788 | |
Moderate Growth Allocation Initial Class | | | 2,066,564 | | | | 20,657,473 | |
| | | | | | | | |
| | | | | | $ | 79,972,617 | |
| | | | | | | | |
On February 17, 2012, an affiliate of the Manager made an in-kind contribution of securities into the following Portfolios:
| | | | | | | | |
Receiving Portfolio | | Shares | | | Purchase Value | |
Eagle Small Cap Growth | | | 13,054,133 | | | $ | 130,541,325 | |
| | | | | | | | |
Janus Balanced | | | 80,451,627 | | | $ | 804,516,267 | |
| | | | | | | | |
MFS Utilities | | | 68,355,812 | | | $ | 683,558,115 | |
| | | | | | | | |
T. Rowe Price Equity Income | | | 38,659,173 | | | $ | 386,591,726 | |
| | | | | | | | |
Van Eck Global Hard Assets | | | 63,810,482 | | | $ | 638,104,820 | |
| | | | | | | | |
On May 1, 2012, an affiliate of the Manager made an in-kind contribution of securities into the following Portfolio:
| | | | | | | | |
Receiving Portfolio | | Shares | | | Purchase Value | |
MFS Utilities | | | 3,128,970 | | | $ | 31,915,497 | |
Note 12–Capital Share Transactions
Transactions in capital shares including the in-kind transfer of securities for the year ended December 31, 2012, and the year ended December 31, 2011, were as follows:
Balanced
| | | | | | | | |
Initial Class | | Shares | | | Amount | |
Year ended December 31, 2012: | | | | | | | | |
Shares sold | | | 81,036 | | | $ | 950,885 | |
Shares issued to shareholders in reinvestment of dividends | | | 11,127 | | | | 133,941 | |
Shares redeemed | | | (128,536 | ) | | | (1,505,171 | ) |
| | | | | | | | |
Net increase (decrease) | | | (36,373 | ) | | $ | (420,345 | ) |
| | | | | | | | |
Year ended December 31, 2011: | | | | | | | | |
Shares sold | | | 70,715 | | | $ | 784,512 | |
Shares issued to shareholders in reinvestment of dividends | | | 14,464 | | | | 148,427 | |
Shares redeemed | | | (104,114 | ) | | | (1,157,835 | ) |
| | | | | | | | |
Net increase (decrease) | | | (18,935 | ) | | $ | (224,896 | ) |
| | | | | | | | |
| | |
| | | | | | | | |
| | | | | | | | |
Service Class | | Shares | | | Amount | |
Year ended December 31, 2012: | | | | | | | | |
Shares sold | | | 2,820,726 | | | $ | 32,985,550 | |
Shares issued to shareholders in reinvestment of dividends | | | 175,239 | | | | 2,098,885 | |
Shares redeemed | | | (1,855,548 | ) | | | (21,676,387 | ) |
| | | | | | | | |
Net increase (decrease) | | | 1,140,417 | | | $ | 13,408,048 | |
| | | | | | | | |
Year ended December 31, 2011: | | | | | | | | |
Shares sold | | | 3,027,215 | | | $ | 33,444,144 | |
Shares issued to shareholders in reinvestment of dividends | | | 210,876 | | | | 2,154,087 | |
Shares redeemed | | | (2,304,668 | ) | | | (25,256,060 | ) |
| | | | | | | | |
Net increase (decrease) | | | 933,423 | | | $ | 10,342,171 | |
| | | | | | | | |
Bond
| | | | | | | | |
Initial Class | | Shares | | | Amount | |
Year ended December 31, 2012: | | | | | | | | |
Shares sold | | | 10,034,381 | | | $ | 152,758,736 | |
Shares issued to shareholders in reinvestment of dividends and distributions | | | 2,369,613 | | | | 35,040,150 | |
Shares redeemed | | | (6,631,775 | ) | | | (100,138,004 | ) |
| | | | | | | | |
Net increase (decrease) | | | 5,772,219 | | | $ | 87,660,882 | |
| | | | | | | | |
Year ended December 31, 2011: | | | | | | | | |
Shares sold | | | 10,473,356 | | | $ | 155,890,584 | |
Shares issued to shareholders in reinvestment of dividends and distributions | | | 1,610,583 | | | | 23,789,318 | |
Shares redeemed | | | (14,590,963 | ) | | | (218,185,721 | ) |
| | | | | | | | |
Net increase (decrease) | | | (2,507,024 | ) | | $ | (38,505,819 | ) |
| | | | | | | | |
| | |
| | | | | | | | |
Service Class | | Shares | | | Amount | |
Year ended December 31, 2012: | | | | | | | | |
Shares sold | | | 6,993,901 | | | $ | 104,959,452 | |
Shares issued to shareholders in reinvestment of dividends and distributions | | | 1,601,268 | | | | 23,475,871 | |
Shares redeemed | | | (3,556,739 | ) | | | (53,425,684 | ) |
| | | | | | | | |
Net increase (decrease) | | | 5,038,430 | | | $ | 75,009,639 | |
| | | | | | | | |
Year ended December 31, 2011: | | | | | | | | |
Shares sold | | | 6,574,033 | | | $ | 97,883,441 | |
Shares issued to shareholders in reinvestment of dividends and distributions | | | 1,082,249 | | | | 15,864,637 | |
Shares redeemed | | | (4,570,128 | ) | | | (67,508,149 | ) |
| | | | | | | | |
Net increase (decrease) | | | 3,086,154 | | | $ | 46,239,929 | |
| | | | | | | | |
| | |
| M-480 | | MainStay VP Funds Trust |
Cash Management
| | | | | | |
Initial Class (at $1 per share) | | Shares | | | |
Year ended December 31, 2012: | | | | | | |
Shares sold | | | 608,165,429 | | | |
Shares issued to shareholders in reinvestment of dividends and distributions | | | 73,901 | | | |
Shares redeemed | | | (768,859,618 | ) | | |
| | | | | | |
Net increase (decrease) | | | (160,620,288 | ) | | |
| | | | | | |
Year ended December 31, 2011: | | | | | | |
Shares sold | | | 751,275,176 | | | |
Shares issued to shareholders in reinvestment of dividends and distributions | | | 77,845 | | | |
Shares redeemed | | | (533,308,407 | ) | | |
| | | | | | |
Net increase (decrease) | | | 218,044,614 | | | |
| | | | | | |
Common Stock
| | | | | | | | |
Initial Class | | Shares | | | Amount | |
Year ended December 31, 2012: | | | | | | | | |
Shares sold | | | 857,164 | | | $ | 15,594,548 | |
Shares issued to shareholders in reinvestment of dividends | | | 409,353 | | | | 7,607,005 | |
Shares redeemed | | | (3,873,199 | ) | | | (67,942,684 | ) |
| | | | | | | | |
Net increase (decrease) | | | (2,606,682 | ) | | $ | (44,741,131 | ) |
| | | | | | | | |
Year ended December 31, 2011: | | | | | | | | |
Shares sold | | | 1,508,395 | | | $ | 24,926,185 | |
Shares issued to shareholders in reinvestment of dividends | | | 515,458 | | | | 7,500,653 | |
Shares redeemed | | | (9,570,482 | ) | | | (155,090,070 | ) |
| | | | | | | | |
Net increase (decrease) | | | (7,546,629 | ) | | $ | (122,663,232 | ) |
| | | | | | | | |
| | |
| | | | | | | | |
Service Class | | Shares | | | Amount | |
Year ended December 31, 2012: | | | | | | | | |
Shares sold | | | 327,485 | | | $ | 5,790,825 | |
Shares issued to shareholders in reinvestment of dividends | | | 44,421 | | | | 821,937 | |
Shares redeemed | | | (703,634 | ) | | | (12,415,732 | ) |
| | | | | | | | |
Net increase (decrease) | | | (331,728 | ) | | $ | (5,802,970 | ) |
| | | | | | | | |
Year ended December 31, 2011: | | | | | | | | |
Shares sold | | | 249,524 | | | $ | 4,018,956 | |
Shares issued to shareholders in reinvestment of dividends | | | 52,439 | | | | 759,825 | |
Shares redeemed | | | (855,298 | ) | | | (13,770,007 | ) |
| | | | | | | | |
Net increase (decrease) | | | (553,335 | ) | | $ | (8,991,226 | ) |
| | | | | | | | |
Conservative Allocation
| | | | | | | | |
Initial Class | | Shares | | | Amount | |
Year ended December 31, 2012: | | | | | | | | |
Shares sold | | | 386,241 | | | $ | 4,553,836 | |
Shares issued to shareholders in reinvestment of dividends and distributions | | | 78,339 | | | | 904,671 | |
Shares redeemed | | | (192,243 | ) | | | (2,287,155 | ) |
| | | | | | | | |
Net increase (decrease) | | | 272,337 | | | $ | 3,171,352 | |
| | | | | | | | |
Year ended December 31, 2011: | | | | | | | | |
Shares sold | | | 301,283 | | | $ | 3,434,647 | |
Shares issued to shareholders in reinvestment of dividends and distributions | | | 20,966 | | | | 224,930 | |
Shares redeemed | | | (204,029 | ) | | | (2,329,738 | ) |
| | | | | | | | |
Net increase (decrease) | | | 118,220 | | | $ | 1,329,839 | |
| | | | | | | | |
| | |
| | | | | | | | |
Service Class | | Shares | | | Amount | |
Year ended December 31, 2012: | | | | | | | | |
Shares sold | | | 14,291,367 | | | $ | 168,209,406 | |
Shares issued to shareholders in reinvestment of dividends and distributions | | | 4,190,446 | | | | 48,067,260 | |
Shares redeemed | | | (5,526,999 | ) | | | (64,871,982 | ) |
| | | | | | | | |
Net increase (decrease) | | | 12,954,814 | | | $ | 151,404,684 | |
| | | | | | | | |
Year ended December 31, 2011: | | | | | | | | |
Shares sold | | | 14,756,208 | | | $ | 168,770,192 | |
Shares issued to shareholders in reinvestment of dividends and distributions | | | 1,128,988 | | | | 12,045,403 | |
Shares redeemed | | | (6,088,934 | ) | | | (69,492,651 | ) |
| | | | | | | | |
Net increase (decrease) | | | 9,796,262 | | | $ | 111,322,944 | |
| | | | | | | | |
Convertible
| | | | | | | | |
Initial Class | | Shares | | | Amount | |
Year ended December 31, 2012: | | | | | | | | |
Shares sold | | | 564,931 | | | $ | 6,596,597 | |
Shares issued to shareholders in reinvestment of dividends and distributions | | | 460,210 | | | | 5,338,562 | |
Shares redeemed | | | (3,906,141 | ) | | | (45,820,131 | ) |
| | | | | | | | |
Net increase (decrease) | | | (2,881,000 | ) | | $ | (33,884,972 | ) |
| | | | | | | | |
Year ended December 31, 2011: | | | | | | | | |
Shares sold | | | 1,251,137 | | | $ | 15,225,695 | |
Shares issued to shareholders in reinvestment of dividends | | | 439,398 | | | | 4,471,908 | |
Shares redeemed | | | (4,707,949 | ) | | | (56,724,125 | ) |
| | | | | | | | |
Net increase (decrease) | | | (3,017,414 | ) | | $ | (37,026,522 | ) |
| | | | | | | | |
| | |
| | | | | | | | |
| | | | |
| mainstayinvestments.com | | | M-481 | |
Notes to Financial Statements (continued)
| | | | | | | | |
Service Class | | Shares | | | Amount | |
Year ended December 31, 2012: | | | | | | | | |
Shares sold | | | 2,303,354 | | | $ | 26,721,363 | |
Shares issued to shareholders in reinvestment of dividends and distributions | | | 866,235 | | | | 9,984,762 | |
Shares redeemed | | | (4,557,028 | ) | | | (52,597,258 | ) |
| | | | | | | | |
Net increase (decrease) | | | (1,387,439 | ) | | $ | (15,891,133 | ) |
| | | | | | | | |
Year ended December 31, 2011: | | | | | | | | |
Shares sold | | | 5,800,626 | | | $ | 69,465,084 | |
Shares issued to shareholders in reinvestment of dividends | | | 734,361 | | | | 7,427,112 | |
Shares redeemed | | | (4,236,794 | ) | | | (48,429,658 | ) |
| | | | | | | | |
Net increase (decrease) | | | 2,298,193 | | | $ | 28,462,538 | |
| | | | | | | | |
DFA / DuPont Capital Emerging Markets Equity
| | | | | | | | |
Initial Class (a) | | Shares | | | Amount | |
Period ended December 31, 2012: | | | | | | | | |
Shares sold | | | 21,275,466 | | | $ | 207,915,142 | |
Shares redeemed | | | (2,429,245 | ) | | | (22,614,665 | ) |
| | | | | | | | |
Net increase (decrease) | | | 18,846,221 | | | $ | 185,300,477 | |
| | | | | | | | |
| | |
| | | | | | | | |
Service Class (a) | | Shares | | | Amount | |
Period ended December 31, 2012: | | | | | | | | |
Shares sold | | | 29,047,349 | | | $ | 289,065,033 | |
Shares redeemed | | | (3,726,412 | ) | | | (34,601,198 | ) |
| | | | | | | | |
Net increase (decrease) | | | 25,320,937 | | | $ | 254,463,835 | |
| | | | | | | | |
| (a) | The inception date of the Portfolio was February 17, 2012. |
Eagle Small Cap Growth
| | | | | | | | |
Initial Class (a) | | Shares | | | Amount | |
Period ended December 31, 2012: | | | | | | | | |
Shares sold | | | 32,186,774 | | | $ | 319,740,447 | |
Shares redeemed | | | (4,882,245 | ) | | | (46,758,126 | ) |
| | | | | | | | |
Net increase (decrease) | | | 27,304,529 | | | $ | 272,982,321 | |
| | | | | | | | |
| | |
| | | | | | | | |
Service Class (a) | | Shares | | | Amount | |
Period ended December 31, 2012: | | | | | | | | |
Shares sold | | | 5,514,765 | | | $ | 55,080,104 | |
Shares redeemed | | | (970,798 | ) | | | (9,350,292 | ) |
| | | | | | | | |
Net increase (decrease) | | | 4,543,967 | | | $ | 45,729,812 | |
| | | | | | | | |
| (a) | The inception date of the Portfolio was February 17, 2012. |
Flexible Bond Opportunities
| | | | | | | | |
Initial Class | | Shares | | | Amount | |
Year ended December 31, 2012: | | | | | | | | |
Shares sold | | | 4,003,771 | | | $ | 40,371,349 | |
Shares issued to shareholders in reinvestment of dividends and distributions | | | 738,080 | | | | 7,603,953 | |
Shares redeemed | | | (11,379,328 | ) | | | (116,375,153 | ) |
| | | | | | | | |
Net increase (decrease) | | | (6,637,477 | ) | | $ | (68,399,851 | ) |
| | | | | | | | |
Period ended December 31, 2011 (a): | | | | | | | | |
Shares sold (b) | | | 21,005,907 | | | $ | 208,463,245 | |
Shares issued to shareholders in reinvestment of dividends | | | 521,279 | | | | 4,981,114 | |
Shares redeemed | | | (1,916,083 | ) | | | (18,625,153 | ) |
| | | | | | | | |
Net increase (decrease) | | | 19,611,103 | | | $ | 194,819,206 | |
| | | | | | | | |
| | |
| | | | | | | | |
Service Class | | Shares | | | Amount | |
Year ended December 31, 2012: | | | | | | | | |
Shares sold | | | 10,379,513 | | | $ | 107,389,661 | |
Shares issued to shareholders in reinvestment of dividends and distributions | | | 734,540 | | | | 7,545,144 | |
Shares redeemed | | | (800,513 | ) | | | (8,181,837 | ) |
| | | | | | | | |
Net increase (decrease) | | | 10,313,540 | | | $ | 106,752,968 | |
| | | | | | | | |
Period ended December 31, 2011(a): | | | | | | | | |
Shares sold | | | 4,527,594 | | | $ | 44,276,371 | |
Shares issued to shareholders in reinvestment of dividends | | | 103,978 | | | | 992,891 | |
Shares redeemed | | | (481,634 | ) | | | (4,680,647 | ) |
| | | | | | | | |
Net increase (decrease) | | | 4,149,938 | | | $ | 40,588,615 | |
| | | | | | | | |
| (a) | The inception date of the Portfolio was April 29, 2011. |
| (b) | Includes a subscription in-kind in the amount of 8,000,423 shares and $79,972,617, respectively. (See Note 11) |
Floating Rate
| | | | | | | | |
Initial Class | | Shares | | | Amount | |
Year ended December 31, 2012: | | | | | | | | |
Shares sold | | | 16,485,847 | | | $ | 152,042,252 | |
Shares issued to shareholders in reinvestment of dividends | | | 1,118,171 | | | | 10,330,192 | |
Shares redeemed | | | (5,069,999 | ) | | | (46,867,874 | ) |
| | | | | | | | |
Net increase (decrease) | | | 12,534,019 | | | $ | 115,504,570 | |
| | | | | | | | |
Year ended December 31, 2011: | | | | | | | | |
Shares sold | | | 5,831,590 | | | $ | 53,338,874 | |
Shares issued to shareholders in reinvestment of dividends | | | 719,269 | | | | 6,591,162 | |
Shares redeemed | | | (4,502,569 | ) | | | (41,460,057 | ) |
| | | | | | | | |
Net increase (decrease) | | | 2,048,290 | | | $ | 18,469,979 | |
| | | | | | | | |
| | |
| M-482 | | MainStay VP Funds Trust |
| | | | | | | | |
Service Class | | Shares | | | Amount | |
Year ended December 31, 2012: | | | | | | | | |
Shares sold | | | 10,824,188 | | | $ | 100,051,970 | |
Shares issued to shareholders in reinvestment of dividends | | | 1,809,637 | | | | 16,722,520 | |
Shares redeemed | | | (7,203,492 | ) | | | (66,471,859 | ) |
| | | | | | | | |
Net increase (decrease) | | | 5,430,333 | | | $ | 50,302,631 | |
| | | | | | | | |
Year ended December 31, 2011: | | | | | | | | |
Shares sold | | | 12,049,719 | | | $ | 111,008,469 | |
Shares issued to shareholders in reinvestment of dividends | | | 1,732,940 | | | | 15,889,956 | |
Shares redeemed | | | (11,464,125 | ) | | | (104,517,764 | ) |
| | | | | | | | |
Net increase (decrease) | | | 2,318,534 | | | $ | 22,380,661 | |
| | | | | | | | |
Government
| | | | | | | | |
Initial Class | | Shares | | | Amount | |
Year ended December 31, 2012: | | | | | | | | |
Shares sold | | | 573,360 | | | $ | 6,842,120 | |
Shares issued to shareholders in reinvestment of dividends | | | 304,571 | | | | 3,610,388 | |
Shares redeemed | | | (2,349,665 | ) | | | (28,023,167 | ) |
| | | | | | | | |
Net increase (decrease) | | | (1,471,734 | ) | | $ | (17,570,659 | ) |
| | | | | | | | |
Year ended December 31, 2011: | | | | | | | | |
Shares sold | | | 911,109 | | | $ | 10,796,681 | |
Shares issued to shareholders in reinvestment of dividends and distributions | | | 473,574 | | | | 5,495,025 | |
Shares redeemed | | | (3,286,294 | ) | | | (38,455,665 | ) |
| | | | | | | | |
Net increase (decrease) | | | (1,901,611 | ) | | $ | (22,163,959 | ) |
| | | | | | | | |
| | |
| | | | | | | | |
Service Class | | Shares | | | Amount | |
Year ended December 31, 2012: | | | | | | | | |
Shares sold | | | 5,388,782 | | | $ | 63,678,452 | |
Shares issued to shareholders in reinvestment of dividends | | | 589,676 | | | | 6,936,666 | |
Shares redeemed | | | (4,300,303 | ) | | | (50,797,170 | ) |
| | | | | | | | |
Net increase (decrease) | | | 1,678,155 | | | $ | 19,817,948 | |
| | | | | | | | |
Year ended December 31, 2011: | | | | | | | | |
Shares sold | | | 5,556,538 | | | $ | 64,984,590 | |
Shares issued to shareholders in reinvestment of dividends and distributions | | | 754,674 | | | | 8,694,548 | |
Shares redeemed | | | (5,504,227 | ) | | | (63,836,952 | ) |
| | | | | | | | |
Net increase (decrease) | | | 806,985 | | | $ | 9,842,186 | |
| | | | | | | | |
Growth Allocation
| | | | | | | | |
Initial Class | | Shares | | | Amount | |
Year ended December 31, 2012: | | | | | | | | |
Shares sold | | | 300,054 | | | $ | 3,026,131 | |
Shares issued to shareholders in reinvestment of dividends and distributions | | | 227,892 | | | | 2,278,393 | |
Shares redeemed | | | (270,535 | ) | | | (2,745,504 | ) |
| | | | | | | | |
Net increase (decrease) | | | 257,411 | | | $ | 2,559,020 | |
| | | | | | | | |
Year ended December 31, 2011: | | | | | | | | |
Shares sold | | | 340,968 | | | $ | 3,409,729 | |
Shares issued to shareholders in reinvestment of dividends | | | 29,805 | | | | 258,010 | |
Shares redeemed | | | (610,529 | ) | | | (6,222,789 | ) |
| | | | | | | | |
Net increase (decrease) | | | (239,756 | ) | | $ | (2,555,050 | ) |
| | | | | | | | |
| | |
| | | | | | | | |
Service Class | | Shares | | | Amount | |
Year ended December 31, 2012: | | | | | | | | |
Shares sold | | | 1,761,882 | | | $ | 17,745,268 | |
Shares issued to shareholders in reinvestment of dividends and distributions | | | 1,692,987 | | | | 16,874,123 | |
Shares redeemed | | | (3,147,573 | ) | | | (31,829,362 | ) |
| | | | | | | | |
Net increase (decrease) | | | 307,296 | | | $ | 2,790,029 | |
| | | | | | | | |
Year ended December 31, 2011: | | | | | | | | |
Shares sold | | | 2,701,280 | | | $ | 26,563,633 | |
Shares issued to shareholders in reinvestment of dividends | | | 178,919 | | | | 1,544,549 | |
Shares redeemed | | | (3,228,661 | ) | | | (31,541,879 | ) |
| | | | | | | | |
Net increase (decrease) | | | (348,462 | ) | | $ | (3,433,697 | ) |
| | | | | | | | |
Growth Equity
| | | | | | | | |
Initial Class | | Shares | | | Amount | |
Year ended December 31, 2012: | | | | | | | | |
Shares sold | | | 102,891 | | | $ | 2,782,873 | |
Shares issued to shareholders in reinvestment of dividends | | | 54,594 | | | | 1,542,898 | |
Shares redeemed | | | (1,783,236 | ) | | | (48,088,962 | ) |
| | | | | | | | |
Net increase (decrease) | | | (1,625,751 | ) | | $ | (43,763,191 | ) |
| | | | | | | | |
Year ended December 31, 2011: | | | | | | | | |
Shares sold | | | 122,799 | | | $ | 3,082,122 | |
Shares issued to shareholders in reinvestment of dividends | | | 80,025 | | | | 1,796,656 | |
Shares redeemed | | | (2,190,754 | ) | | | (54,525,255 | ) |
| | | | | | | | |
Net increase (decrease) | | | (1,987,930 | ) | | $ | (49,646,477 | ) |
| | | | | | | | |
| | | | |
| mainstayinvestments.com | | | M-483 | |
Notes to Financial Statements (continued)
| | | | | | | | |
Service Class | | Shares | | | Amount | |
Year ended December 31, 2012: | | | | | | | | |
Shares sold | | | 494,071 | | | $ | 13,225,580 | |
Shares issued to shareholders in reinvestment of dividends | | | 3,561 | | | | 100,260 | |
Shares redeemed | | | (415,067 | ) | | | (11,175,610 | ) |
| | | | | | | | |
Net increase (decrease) | | | 82,565 | | | $ | 2,150,230 | |
| | | | | | | | |
Year ended December 31, 2011: | | | | | | | | |
Shares sold | | | 255,933 | | | $ | 6,273,827 | |
Shares issued to shareholders in reinvestment of dividends | | | 4,976 | | | | 111,335 | |
Shares redeemed | | | (390,078 | ) | | | (9,509,996 | ) |
| | | | | | | | |
Net increase (decrease) | | | (129,169 | ) | | $ | (3,124,834 | ) |
| | | | | | | | |
High Yield Corporate Bond
| | | | | | | | |
Initial Class | | Shares | | | Amount | |
Year ended December 31, 2012: | | | | | | | | |
Shares sold | | | 8,348,865 | | | $ | 83,984,771 | |
Shares issued to shareholders in reinvestment of dividends | | | 4,050,548 | | | | 40,276,749 | |
Shares redeemed | | | (11,466,667 | ) | | | (114,968,282 | ) |
| | | | | | | | |
Net increase (decrease) | | | 932,746 | | | $ | 9,293,238 | |
| | | | | | | | |
Year ended December 31, 2011: | | | | | | | | |
Shares sold | | | 7,196,708 | | | $ | 69,880,052 | |
Shares issued to shareholders in reinvestment of dividends | | | 4,633,208 | | | | 41,276,486 | |
Shares redeemed | | | (18,311,426 | ) | | | (179,567,740 | ) |
| | | | | | | | |
Net increase (decrease) | | | (6,481,510 | ) | | $ | (68,411,202 | ) |
| | | | | | | | |
| | |
| | | | | | | | |
Service Class | | Shares | | | Amount | |
Year ended December 31, 2012: | | | | | | | | |
Shares sold | | | 45,027,384 | | | $ | 449,296,200 | |
Shares issued to shareholders in reinvestment of dividends | | | 9,422,058 | | | | 92,907,075 | |
Shares redeemed | | | (10,563,747 | ) | | | (105,150,032 | ) |
| | | | | | | | |
Net increase (decrease) | | | 43,885,695 | | | $ | 437,053,243 | |
| | | | | | | | |
Year ended December 31, 2011: | | | | | | | | |
Shares sold | | | 28,124,513 | | | $ | 272,744,056 | |
Shares issued to shareholders in reinvestment of dividends | | | 8,636,865 | | | | 76,391,318 | |
Shares redeemed | | | (17,305,709 | ) | | | (168,383,132 | ) |
| | | | | | | | |
Net increase (decrease) | | | 19,455,669 | | | $ | 180,752,242 | |
| | | | | | | | |
ICAP Select Equity
| | | | | | | | |
Initial Class | | Shares | | | Amount | |
Year ended December 31, 2012: | | | | | | | | |
Shares sold | | | 2,003,777 | | | $ | 25,929,207 | |
Shares issued to shareholders in reinvestment of dividends | | | 948,919 | | | | 12,939,217 | |
Shares redeemed | | | (9,058,657 | ) | | | (120,397,386 | ) |
| | | | | | | | |
Net increase (decrease) | | | (6,105,961 | ) | | $ | (81,528,962 | ) |
| | | | | | | | |
Year ended December 31, 2011: | | | | | | | | |
Shares sold | | | 2,937,084 | | | $ | 37,878,937 | |
Shares issued to shareholders in reinvestment of dividends | | | 864,962 | | | | 9,445,779 | |
Shares redeemed | | | (12,052,780 | ) | | | (148,933,188 | ) |
| | | | | | | | |
Net increase (decrease) | | | (8,250,734 | ) | | $ | (101,608,472 | ) |
| | | | | | | | |
| | | | | | | | |
Service Class | | Shares | | | Amount | |
Year ended December 31, 2012: | | | | | | | | |
Shares sold | | | 2,195,604 | | | $ | 28,663,734 | |
Shares issued to shareholders in reinvestment of dividends | | | 669,261 | | | | 9,049,625 | |
Shares redeemed | | | (5,466,721 | ) | | | (71,524,124 | ) |
| | | | | | | | |
Net increase (decrease) | | | (2,601,856 | ) | | $ | (33,810,765 | ) |
| | | | | | | | |
Year ended December 31, 2011: | | | | | | | | |
Shares sold | | | 3,797,605 | | | $ | 47,010,324 | |
Shares issued to shareholders in reinvestment of dividends | | | 535,388 | | | | 5,799,194 | |
Shares redeemed | | | (5,559,629 | ) | | | (67,664,671 | ) |
| | | | | | | | |
Net increase (decrease) | | | (1,226,636 | ) | | $ | (14,855,153 | ) |
| | | | | | | | |
Income Builder
| | | | | | | | |
Initial Class | | Shares | | | Amount | |
Year ended December 31, 2012: | | | | | | | | |
Shares sold | | | 316,962 | | | $ | 4,887,632 | |
Shares issued to shareholders in reinvestment of dividends | | | 584,285 | | | | 9,029,798 | |
Shares redeemed | | | (1,947,243 | ) | | | (29,619,891 | ) |
| | | | | | | | |
Net increase (decrease) | | | (1,045,996 | ) | | $ | (15,702,461 | ) |
| | | | | | | | |
Year ended December 31, 2011: | | | | | | | | |
Shares sold | | | 693,657 | | | $ | 10,103,305 | |
Shares issued to shareholders in reinvestment of dividends | | | 642,044 | | | | 8,429,136 | |
Shares redeemed | | | (2,219,281 | ) | | | (32,041,155 | ) |
| | | | | | | | |
Net increase (decrease) | | | (883,580 | ) | | $ | (13,508,714 | ) |
| | | | | | | | |
| | |
| | | | | | | | |
Service Class | | Shares | | | Amount | |
Year ended December 31, 2012: | | | | | | | | |
Shares sold | | | 2,426,522 | | | $ | 37,183,058 | |
Shares issued to shareholders in reinvestment of dividends | | | 235,652 | | | | 3,624,215 | |
Shares redeemed | | | (766,344 | ) | | | (11,586,093 | ) |
| | | | | | | | |
Net increase (decrease) | | | 1,895,830 | | | $ | 29,221,180 | |
| | | | | | | | |
Year ended December 31, 2011: | | | | | | | | |
Shares sold | | | 1,258,346 | | | $ | 18,155,828 | |
Shares issued to shareholders in reinvestment of dividends | | | 188,641 | | | | 2,466,832 | |
Shares redeemed | | | (851,344 | ) | | | (12,217,459 | ) |
| | | | | | | | |
Net increase (decrease) | | | 595,643 | | | $ | 8,405,201 | |
| | | | | | | | |
International Equity
| | | | | | | | |
Initial Class | | Shares | | | Amount | |
Year ended December 31, 2012: | | | | | | | | |
Shares sold | | | 3,281,368 | | | $ | 36,011,439 | |
Shares issued to shareholders in reinvestment of dividends | | | 264,690 | | | | 3,187,864 | |
Shares redeemed | | | (2,994,160 | ) | | | (34,563,020 | ) |
| | | | | | | | |
Net increase (decrease) | | | 551,898 | | | $ | 4,636,283 | |
| | | | | | | | |
Year ended December 31, 2011: | | | | | | | | |
Shares sold | | | 1,891,756 | | | $ | 22,618,772 | |
Shares issued to shareholders in reinvestment of dividends | | | 618,007 | | | | 6,058,841 | |
Shares redeemed | | | (8,933,656 | ) | | | (111,347,069 | ) |
| | | | | | | | |
Net increase (decrease) | | | (6,423,893 | ) | | $ | (82,669,456 | ) |
| | | | | | | | |
| | |
| M-484 | | MainStay VP Funds Trust |
| | | | | | | | |
Service Class | | Shares | | | Amount | |
Year ended December 31, 2012: | | | | | | | | |
Shares sold | | | 1,426,902 | | | $ | 16,221,731 | |
Shares issued to shareholders in reinvestment of dividends | | | 358,298 | | | | 4,283,314 | |
Shares redeemed | | | (3,824,386 | ) | | | (44,004,338 | ) |
| | | | | | | | |
Net increase (decrease) | | | (2,039,186 | ) | | $ | (23,499,293 | ) |
| | | | | | | | |
Year ended December 31, 2011: | | | | | | | | |
Shares sold | | | 3,387,348 | | | $ | 40,396,199 | |
Shares issued to shareholders in reinvestment of dividends | | | 915,397 | | | | 8,908,718 | |
Shares redeemed | | | (2,785,094 | ) | | | (33,314,618 | ) |
| | | | | | | | |
Net increase (decrease) | | | 1,517,651 | | | $ | 15,990,299 | |
| | | | | | | | |
Janus Balanced
| | | | | | | | |
Initial Class (a) | | Shares | | | Amount | |
Period ended December 31, 2012: | | | | | | | | |
Shares sold | | | 50,651,008 | | | $ | 506,919,366 | |
Shares redeemed | | | (6,918,700 | ) | | | (70,517,337 | ) |
| | | | | | | | |
Net increase (decrease) | | | 43,732,308 | | | $ | 436,402,029 | |
| | | | �� | | | | |
| | |
| | | | | | | | |
Service Class (a) | | Shares | | | Amount | |
Period ended December 31, 2012: | | | | | | | | |
Shares sold | | | 38,844,099 | | | $ | 389,606,978 | |
Shares redeemed | | | (2,867,931 | ) | | | (29,210,129 | ) |
| | | | | | | | |
Net increase (decrease) | | | 35,976,168 | | | $ | 360,396,849 | |
| | | | | | | | |
| (a) | The inception date of the Portfolio was February 17, 2012. |
Large Cap Growth
| | | | | | | | |
Initial Class | | Shares | | | Amount | |
Year ended December 31, 2012: | | | | | | | | |
Shares sold | | | 8,997,069 | | | $ | 148,021,277 | |
Shares redeemed | | | (3,899,688 | ) | | | (62,761,644 | ) |
| | | | | | | | |
Net increase (decrease) | | | 5,097,381 | | | $ | 85,259,633 | |
| | | | | | | | |
Year ended December 31, 2011: | | | | | | | | |
Shares sold | | | 11,551,544 | | | $ | 176,536,295 | |
Shares redeemed | | | (2,827,734 | ) | | | (42,562,032 | ) |
| | | | | | | | |
Net increase (decrease) | | | 8,723,810 | | | $ | 133,974,263 | |
| | | | | | | | |
| | |
| | | | | | | | |
Service Class | | Shares | | | Amount | |
Year ended December 31, 2012: | | | | | | | | |
Shares sold | | | 3,142,054 | | | $ | 51,070,035 | |
Shares redeemed | | | (1,903,099 | ) | | | (31,011,940 | ) |
| | | | | | | | |
Net increase (decrease) | | | 1,238,955 | | | $ | 20,058,095 | |
| | | | | | | | |
Year ended December 31, 2011: | | | | | | | | |
Shares sold | | | 3,032,083 | | | $ | 46,066,654 | |
Shares redeemed | | | (1,809,990 | ) | | | (27,041,032 | ) |
| | | | | | | | |
Net increase (decrease) | | | 1,222,093 | | | $ | 19,025,622 | |
| | | | | | | | |
MFS® Utilities
| | | | | | | | |
Initial Class (a) | | Shares | | | Amount | |
Period ended December 31, 2012: | | | | | | | | |
Shares sold | | | 5,712,020 | | | $ | 57,945,272 | |
Shares redeemed | | | (520,065 | ) | | | (5,346,936 | ) |
| | | | | | | | |
Net increase (decrease) | | | 5,191,955 | | | $ | 52,598,336 | |
| | | | | | | | |
| | |
| | | | | | | | |
Service Class (a) | | Shares | | | Amount | |
Period ended December 31, 2012: | | | | | | | | |
Shares sold | | | 81,436,887 | | | $ | 816,612,238 | |
Shares redeemed | | | (8,405,755 | ) | | | (86,437,399 | ) |
| | | | | | | | |
Net increase (decrease) | | | 73,031,132 | | | $ | 730,174,839 | |
| | | | | | | | |
| (a) | The inception date of the Portfolio was February 17, 2012. |
Mid Cap Core
| | | | | | | | |
Initial Class | | Shares | | | Amount | |
Year ended December 31, 2012: | | | | | | | | |
Shares sold | | | 2,522,673 | | | $ | 30,411,407 | |
Shares issued to shareholders in reinvestment of dividends and distributions | | | 1,728,497 | | | | 20,795,148 | |
Shares redeemed | | | (11,221,288 | ) | | | (138,791,573 | ) |
| | | | | | | | |
Net increase (decrease) | | | (6,970,118 | ) | | $ | (87,585,018 | ) |
| | | | | | | | |
Year ended December 31, 2011: | | | | | | | | |
Shares sold | | | 4,608,685 | | | $ | 52,935,754 | |
Shares issued to shareholders in reinvestment of dividends | | | 258,893 | | | | 2,663,540 | |
Shares redeemed | | | (14,152,532 | ) | | | (175,522,193 | ) |
| | | | | | | | |
Net increase (decrease) | | | (9,284,954 | ) | | $ | (119,922,899 | ) |
| | | | | | | | |
| | |
| | | | | | | | |
Service Class | | Shares | | | Amount | |
Year ended December 31, 2012: | | | | | | | | |
Shares sold | | | 1,608,665 | | | $ | 19,617,782 | |
Shares issued to shareholders in reinvestment of dividends and distributions | | | 2,042,802 | | | | 24,392,451 | |
Shares redeemed | | | (3,995,369 | ) | | | (48,554,847 | ) |
| | | | | | | | |
Net increase (decrease) | | | (343,902 | ) | | $ | (4,544,614 | ) |
| | | | | | | | |
Year ended December 31, 2011: | | | | | | | | |
Shares sold | | | 2,268,221 | | | $ | 26,806,271 | |
Shares issued to shareholders in reinvestment of dividends | | | 179,490 | | | | 1,833,872 | |
Shares redeemed | | | (4,242,265 | ) | | | (49,859,663 | ) |
| | | | | | | | |
Net increase (decrease) | | | (1,794,554 | ) | | $ | (21,219,520 | ) |
| | | | | | | | |
| | | | |
| mainstayinvestments.com | | | M-485 | |
Notes to Financial Statements (continued)
Moderate Allocation
| | | | | | | | |
Initial Class | | Shares | | | Amount | |
Year ended December 31, 2012: | | | | | | | | |
Shares sold | | | 601,321 | | | $ | 6,828,325 | |
Shares issued to shareholders in reinvestment of dividends and distributions | | | 211,055 | | | | 2,336,389 | |
Shares redeemed | | | (335,175 | ) | | | (3,786,945 | ) |
| | | | | | | | |
Net increase (decrease) | | | 477,201 | | | $ | 5,377,769 | |
| | | | | | | | |
Year ended December 31, 2011: | | | | | | | | |
Shares sold | | | 280,936 | | | $ | 3,097,390 | |
Shares issued to shareholders in reinvestment of dividends and distributions | | | 49,926 | | | | 501,085 | |
Shares redeemed | | | (372,988 | ) | | | (4,035,614 | ) |
| | | | | | | | |
Net increase (decrease) | | | (42,126 | ) | | $ | (437,139 | ) |
| | | | | | | | |
| | |
| | | | | | | | |
Service Class | | Shares | | | Amount | |
Year ended December 31, 2012: | | | | | | | | |
Shares sold | | | 15,021,722 | | | $ | 169,622,253 | |
Shares issued to shareholders in reinvestment of dividends and distributions | | | 5,658,691 | | | | 62,368,242 | |
Shares redeemed | | | (6,907,248 | ) | | | (77,607,094 | ) |
| | | | | | | | |
Net increase (decrease) | | | 13,773,165 | | | $ | 154,383,401 | |
| | | | | | | | |
Year ended December 31, 2011: | | | | | | | | |
Shares sold | | | 15,804,338 | | | $ | 173,418,851 | |
Shares issued to shareholders in reinvestment of dividends and distributions | | | 1,185,359 | | | | 11,855,662 | |
Shares redeemed | | | (9,176,537 | ) | | | (99,752,392 | ) |
| | | | | | | | |
Net increase (decrease) | | | 7,813,160 | | | $ | 85,522,121 | |
| | | | | | | | |
Moderate Growth Allocation
| | | | | | | | |
Initial Class | | Shares | | | Amount | |
Year ended December 31, 2012: | | | | | | | | |
Shares sold | | | 401,400 | | | $ | 4,376,439 | |
Shares issued to shareholders in reinvestment of dividends and distributions | | | 199,712 | | | | 2,183,911 | |
Shares redeemed | | | (332,068 | ) | | | (3,616,659 | ) |
| | | | | | | | |
Net increase (decrease) | | | 269,044 | | | $ | 2,943,691 | |
| | | | | | | | |
Year ended December 31, 2011: | | | | | | | | |
Shares sold | | | 356,620 | | | $ | 3,745,365 | |
Shares issued to shareholders in reinvestment of dividends | | | 46,840 | | | | 438,345 | |
Shares redeemed | | | (336,016 | ) | | | (3,531,347 | ) |
| | | | | | | | |
Net increase (decrease) | | | 67,444 | | | $ | 652,363 | |
| | | | | | | | |
| | | | | | | | |
Service Class | | Shares | | | Amount | |
Year ended December 31, 2012: | | | | | | | | |
Shares sold | | | 22,305,684 | | | $ | 242,026,662 | |
Shares issued to shareholders in reinvestment of dividends and distributions | | | 4,745,460 | | | | 51,659,718 | |
Shares redeemed | | | (6,378,345 | ) | | | (69,289,306 | ) |
| | | | | | | | |
Net increase (decrease) | | | 20,672,799 | | | $ | 224,397,074 | |
| | | | | | | | |
Year ended December 31, 2011: | | | | | | | | |
Shares sold | | | 28,041,888 | | | $ | 293,777,425 | |
Shares issued to shareholders in reinvestment of dividends | | | 833,835 | | | | 7,776,100 | |
Shares redeemed | | | (6,609,086 | ) | | | (68,567,262 | ) |
| | | | | | | | |
Net increase (decrease) | | | 22,266,637 | | | $ | 232,986,263 | |
| | | | | | | | |
PIMCO Real Return
| | | | | | | | |
Initial Class (a) | | Shares | | | Amount | |
Period ended December 31, 2012: | | | | | | | | |
Shares sold | | | 1,314,010 | | | $ | 13,363,847 | |
Shares redeemed | | | (120,680 | ) | | | (1,251,607 | ) |
| | | | | | | | |
Net increase (decrease) | | | 1,193,330 | | | $ | 12,112,240 | |
| | | | | | | | |
| | |
| | | | | | | | |
Service Class (a) | | Shares | | | Amount | |
Period ended December 31, 2012: | | | | | | | | |
Shares sold | | | 48,359,131 | | | $ | 490,062,183 | |
Shares redeemed | | | (3,374,862 | ) | | | (34,768,980 | ) |
| | | | | | | | |
Net increase (decrease) | | | 44,984,269 | | | $ | 455,293,203 | |
| | | | | | | | |
| (a) | The inception date of the Portfolio was February 17, 2012. |
S&P 500 Index
| | | | | | | | |
Initial Class | | Shares | | | Amount | |
Year ended December 31, 2012: | | | | | | | | |
Shares sold | | | 8,548,262 | | | $ | 234,122,666 | |
Shares issued to shareholders in reinvestment of dividends | | | 406,816 | | | | 11,913,117 | |
Shares redeemed | | | (7,567,329 | ) | | | (210,337,284 | ) |
| | | | | | | | |
Net increase (decrease) | | | 1,387,749 | | | $ | 35,698,499 | |
| | | | | | | | |
Year ended December 31, 2011: | | | | | | | | |
Shares sold | | | 402,325 | | | $ | 10,395,187 | |
Shares issued to shareholders in reinvestment of dividends | | | 493,834 | | | | 11,366,034 | |
Shares redeemed | | | (3,818,536 | ) | | | (99,016,577 | ) |
| | | | | | | | |
Net increase (decrease) | | | (2,922,377 | ) | | $ | (77,255,356 | ) |
| | | | | | | | |
| | |
| | | | | | | | |
Service Class | | Shares | | | Amount | |
Year ended December 31, 2012: | | | | | | | | |
Shares sold | | | 1,105,130 | | | $ | 30,993,667 | |
Shares issued to shareholders in reinvestment of dividends | | | 119,662 | | | | 3,494,658 | |
Shares redeemed | | | (1,570,955 | ) | | | (43,884,485 | ) |
| | | | | | | | |
Net increase (decrease) | | | (346,163 | ) | | $ | (9,396,160 | ) |
| | | | | | | | |
Year ended December 31, 2011: | | | | | | | | |
Shares sold | | | 792,923 | | | $ | 20,248,430 | |
Shares issued to shareholders in reinvestment of dividends | | | 149,468 | | | | 3,431,463 | |
Shares redeemed | | | (1,578,169 | ) | | | (40,413,934 | ) |
| | | | | | | | |
Net increase (decrease) | | | (635,778 | ) | | $ | (16,734,041 | ) |
| | | | | | | | |
| | |
| M-486 | | MainStay VP Funds Trust |
T. Rowe Price Equity Income
| | | | | | | | |
Initial Class (a) | | Shares | | | Amount | |
Period ended December 31, 2012: | | | | | | | | |
Shares sold | | | 38,773,915 | | | $ | 394,465,320 | |
Shares redeemed | | | (4,073,776 | ) | | | (41,278,761 | ) |
| | | | | | | | |
Net increase (decrease) | | | 34,700,139 | | | $ | 353,186,559 | |
| | | | | | | | |
| | |
| | | | | | | | |
Service Class (a) | | Shares | | | Amount | |
Period ended December 31, 2012: | | | | | | | | |
Shares sold | | | 26,078,184 | | | $ | 261,081,811 | |
Shares redeemed | | | (3,587,667 | ) | | | (36,650,656 | ) |
| | | | | | | | |
Net increase (decrease) | | | 22,490,517 | | | $ | 224,431,155 | |
| | | | | | | | |
| (a) | The inception date of the Portfolio was February 17, 2012. |
U.S. Small Cap
| | | | | | | | |
Initial Class | | Shares | | | Amount | |
Year ended December 31, 2012: | | | | | | | | |
Shares sold | | | 3,221,540 | | | $ | 30,811,492 | |
Shares issued to shareholders in reinvestment of dividends | | | 63,323 | | | | 618,731 | |
Shares redeemed | | | (6,253,080 | ) | | | (60,116,042 | ) |
| | | | | | | | |
Net increase (decrease) | | | (2,968,217 | ) | | $ | (28,685,819 | ) |
| | | | | | | | |
Year ended December 31, 2011: | | | | | | | | |
Shares sold | | | 9,717,025 | | | $ | 90,837,963 | |
Shares issued to shareholders in reinvestment of dividends | | | 148,723 | | | | 1,185,152 | |
Shares redeemed | | | (5,678,649 | ) | | | (52,127,423 | ) |
| | | | | | | | |
Net increase (decrease) | | | 4,187,099 | | | $ | 39,895,692 | |
| | | | | | | | |
| | |
| | | | | | | | |
Service Class | | Shares | | | Amount | |
Year ended December 31, 2012: | | | | | | | | |
Shares sold | | | 1,647,002 | | | $ | 15,403,863 | |
Shares issued to shareholders in reinvestment of dividends | | | 27,434 | | | | 261,257 | |
Shares redeemed | | | (2,205,100 | ) | | | (20,569,915 | ) |
| | | | | | | | |
Net increase (decrease) | | | (530,664 | ) | | $ | (4,904,795 | ) |
| | | | | | | | |
Year ended December 31, 2011: | | | | | | | | |
Shares sold | | | 1,609,503 | | | $ | 14,294,196 | |
Shares issued to shareholders in reinvestment of dividends | | | 106,629 | | | | 828,201 | |
Shares redeemed | | | (3,121,001 | ) | | | (27,723,650 | ) |
| | | | | | | | |
Net increase (decrease) | | | (1,404,869 | ) | | $ | (12,601,253 | ) |
| | | | | | | | |
Van Eck Global Hard Assets
| | | | | | | | |
Initial Class (a) | | Shares | | | Amount | |
Period ended December 31, 2012: | | | | | | | | |
Shares sold | | | 79,206,473 | | | $ | 784,047,718 | |
Shares redeemed | | | (12,143,331 | ) | | | (108,415,436 | ) |
| | | | | | | | |
Net increase (decrease) | | | 67,063,142 | | | $ | 675,632,282 | |
| | | | | | | | |
| (a) | The inception date of the Portfolio was February 17, 2012. |
Note 13–Litigation
The Common Stock, Mid Cap Core and S&P 500 Index Portfolios have been named as defendants and as putative members of the proposed defendant group of shareholders in the case entitled Official Committee of Unsecured Creditors of the Tribune Company v. FitzSimons, et al. (In re Tribune Company), No. 12-2652 (S.D.N.Y.) (the “FitzSimons action”) as a result of its ownership of shares in the Tribune Company (“Tribune”) in 2007 when Tribune effected a leveraged buyout transaction (“LBO”) by which Tribune converted to a privately-held company. In its complaint, which was served on the Fund in October 2012, the plaintiff asserts claims against certain insiders, shareholders, professional advisers, and others involved in the LBO. Separately, the complaint also seeks to recover proceeds received by shareholders through the LBO from a putative defendant class comprised of former Tribune shareholders other than the insiders, major shareholders and certain other defendants. The sole claim and cause of action brought against the Portfolios either as a named defendant or as a member of the putative defendant class is for fraudulent conveyance pursuant to United States Bankruptcy Code Section 548(a)(1)(A).
In June 2011, certain Tribune creditors filed numerous additional actions asserting state law constructive fraudulent conveyance claims (the “SLCFC actions”) against specifically-named former Tribune shareholders and, in some cases, putative defendant classes comprised of former Tribune shareholders. One of the SLCFC actions, entitled Deutsche Bank Trust Co. Americas v. Blackrock Institutional Trust Co., No. 11-9319 (S.D.N.Y.) (the “Deutsche Bank action”), named the Portfolios as defendants.
The FitzSimons and Deutsche Bank actions have been consolidated with the majority of the other Tribune LBO-related lawsuits in a multidistrict litigation proceeding entitled In re Tribune Co. Fraudulent Conveyance Litig., No. 11-md-2296 (S.D.N.Y.) (the “MDL Proceeding”). On November 6, 2012, the defendants moved to dismiss the SLCFC actions. The Court has not yet issued a decision on the motion.
These lawsuits do not allege any misconduct on the part of the Portfolios. The value of the proceeds received by the Portfolios in connection with the LBO and the Portfolio’s cost basis in shares of Tribune was as follows:
| | | | | | | | |
Portfolio | | Proceeds | | | Cost
Basis | |
MainStay VP Common Stock Portfolio | | $ | 1,300,602 | | | $ | 1,174,184 | |
MainStay VP Mid Cap Core Portfolio | | $ | 808,180 | | | $ | 790,269 | |
MainStay VP S&P 500 Index Portfolio | | $ | 682,856 | | | $ | 527,309 | |
At this stage of the proceedings management is not able to assess with any reasonable certainty the probable outcome of the pending litigation or the effect, if any, on the Portfolios net asset values.
| | | | |
| mainstayinvestments.com | | | M-487 | |
Notes to Financial Statements (continued)
Note 14–Subsequent Events
In connection with the preparation of the financial statements of the Portfolios as of and for the year ended December 31, 2012, events and transactions subsequent to December 31, 2012 through the date the financial statements were issued have been evaluated by the Portfolios’ management for possible adjustment and/or disclosure. No subsequent events requiring financial statement adjustment or disclosure have been identified.
| | |
| M-488 | | MainStay VP Funds Trust |
Report of Independent Registered Public Accounting Firm
To the Board of Trustees and Shareholders of
MainStay VP Funds Trust
In our opinion, the accompanying statements of assets and liabilities, including the portfolios of investments, and the related statements of operations, of changes in net assets and of cash flows and the financial highlights present fairly, in all material respects, the financial position of each of the portfolios constituting MainStay VP Funds Trust (as listed in Note 1 to the financial statements and hereafter referred to collectively as the “Funds”) at December 31, 2012, and the results of each of their operations, the changes in each of their net assets, the cash flows of MainStay VP PIMCO Real Return Portfolio and the financial highlights for each of the periods presented, in conformity with accounting principles generally accepted in the United States of America. These financial statements and financial highlights (hereafter referred to as “financial statements”) are the responsibility of the Funds’ management. Our responsibility is to express an opinion on these financial statements based on our audits. We conducted our audits of these financial statements in accordance with the standards of the Public Company Accounting Oversight Board (United States). Those standards require that we plan and perform the audit to obtain reasonable assurance about whether the financial statements are free of material misstatement. An audit includes examining, on a test basis, evidence supporting the amounts and disclosures in the financial statements, assessing the accounting principles used and significant estimates made by management, and evaluating the overall financial statement presentation. We believe that our audits, which included confirmation of securities at December 31, 2012 by correspondence with the custodian, agent banks, brokers and transfer agents of the underlying funds and the application of alternative auditing procedures where securities purchased confirmations had not been received, provide a reasonable basis for our opinion.
PricewaterhouseCoopers LLP
New York, New York
February 19, 2013
| | |
| mainstayinvestments.com | | M-489 |
Board Consideration and Approval of Management Agreements
and Subadvisory Agreements (Unaudited)
Section 15(c) of the Investment Company Act of 1940, as amended (the “1940 Act”) requires that each mutual fund’s board of trustees, including a majority of the independent trustees, annually review and approve the fund’s investment advisory agreements. At its December 10-12, 2012 meeting, the Board of Trustees (the “Board”) of MainStay VP Funds Trust (the “Trust”) unanimously approved the Management Agreements between New York Life Investment Management LLC (“New York Life Investments”) and the Trust, on behalf of each of the Trust’s Portfolios, and the Subadvisory Agreements between New York Life Investments and each of Epoch Investment Partners, Inc. (“Epoch”), Institutional Capital LLC (“ICAP”), MacKay Shields LLC (“MacKay”), Madison Square Investors LLC, subsequently renamed Cornerstone Capital Management Holdings LLC (“Cornerstone Capital Management”), and Winslow Capital Management, Inc. (“Winslow”) (collectively, the “Subadvisors”), which serve as subadvisors to certain Portfolios (the “Subadvised Portfolios”).
In reaching its decision to approve the Agreements, the Board considered information furnished by New York Life Investments and the Subadvisors in connection with a contract review process that took place at various meetings of the Board and its Contracts Committee between September 2012 and December 2012, as well as other relevant information furnished to the Board throughout the year by New York Life Investments and the Subadvisors. Information requested by and furnished to the Board in connection with the contract review process included, among other items, reports on each Portfolio prepared by Strategic Insight Mutual Fund Research and Consulting LLC (“Strategic Insight”), an independent third-party service provider engaged by the Board to report objectively on each Portfolio’s investment performance, management and subadvisory fees and ordinary operating expenses. The Board also considered information provided by New York Life Investments and the Subadvisors on the fees charged to other investment advisory clients (including institutional separate accounts) that follow investment strategies similar to the Portfolios, and the rationale for any differences in a Portfolio’s management and subadvisory fees and the fees charged to those other investment advisory clients. In addition, the Board requested and received information on the profitability of the Portfolios to New York Life Investments and its affiliates and certain Subadvisors, and responses from New York Life Investments and the Subadvisors to a series of questions encompassing a variety of topics prepared on behalf of the Board by independent legal counsel to the Board and its independent trustees (the “Independent Trustees”). Information provided to the Board at its meetings throughout the year included, among other items, detailed investment performance reports on each Portfolio prepared by the Investment Consulting Group at New York Life Investments. The structure and format for this regular reporting was developed in consultation with the Board. The Board also received from New York Life Investments
throughout the year, among other items, periodic reports on legal and compliance matters, portfolio turnover, and sales and marketing activity.
In determining to approve the Agreements, the members of the Board reviewed and evaluated all of the information and factors they believed to be relevant and appropriate in light of legal advice furnished to them by independent legal counsel and through the exercise of their own business judgment. The broad factors considered by the Board are discussed in greater detail below, and included, among other items: (i) the nature, scope and quality of the services provided to the Portfolios by New York Life Investments and the Subadvisors; (ii) the investment performance of each Portfolio, New York Life Investments and the Subadvisors; (iii) the costs of the services provided, and profits realized, by New York Life Investments and each Subadvisor from their relationships with the Portfolios; (iv) the extent to which economies of scale may be realized as the Portfolios grow, and the extent to which economies of scale may benefit Portfolio investors; and (v) the reasonableness of each Portfolio’s management and subadvisory fees and overall total ordinary operating expenses, particularly as compared to similar funds and accounts managed by New York Life Investments and the Subadvisors and third-party “peer funds” identified by Strategic Insight.
While individual members of the Board may have weighed certain factors differently, the Board’s decisions to approve the Agreements were based on a consideration of all the information provided to the Board, including information provided to the Board throughout the year and specifically in connection with the contract review process. The Board’s conclusions with respect to the Agreements also were based, in part, on the Board’s consideration of the Agreements in prior years. In addition to considering the above-referenced factors, the Board observed that in the marketplace there are a range of investment options available to variable life insurance policyholders and variable annuity contract owners that invest in the Portfolios, and that these policyholders and contract owners, having had the opportunity to consider other investment options, have chosen to invest in the Portfolios. A more detailed discussion of the factors that figured prominently in the Board’s decisions to approve the Agreements is provided below.
Nature, Scope and Quality of Services to Be Provided by New York Life Investments and the Subadvisors
The Board examined the nature, scope and quality of the services that New York Life Investments provides to the Portfolios. The Board evaluated New York Life Investments’ experience in serving as manager of the Portfolios, noting that New York Life Investments manages other mutual funds, serves a variety of other investment advisory clients, including other pooled investment vehicles, and has experience with overseeing mutual fund service providers, including subadvisors. The Board considered the experience
| | |
| M-490 | | MainStay VP Funds Trust |
of senior personnel at New York Life Investments providing management and administrative services to the Portfolios, as well as New York Life Investments’ reputation and financial condition. The Board also considered the full range of non-advisory services that New York Life Investments supplies to the Portfolios under the terms of the Management Agreement, including: (i) fund accounting services provided by New York Life Investments’ Fund Accounting and Administration Group; (ii) investment oversight and analytical services provided by New York Life Investments’ Investment Consulting Group; (iii) compliance services provided by New York Life Investments’ compliance department, including oversight and implementation of each Portfolio’s compliance program; and (iv) legal services provided by New York Life Investments’ Office of the General Counsel. Additional information about the non-advisory services provided by New York Life Investments is set forth in each Portfolio’s Management Agreement. The Board also considered New York Life Investments’ willingness to invest in personnel that benefit the Portfolios, and noted that New York Life Investments is responsible for compensating each Portfolio’s officers.
The Board also examined the nature, scope and quality of the advisory services that New York Life Investments provides to the non-Subadvised Portfolios and the Subadvisors provide to the Subadvised Portfolios. The Board evaluated New York Life Investments’ and the Subadvisors’ experience in serving as investment adviser and subadvisor, respectively, to the Portfolios and managing other portfolios. It examined New York Life Investments’ and the Subadvisors’ track record and experience in providing investment advisory services, the experience of investment advisory, senior management and administrative personnel at New York Life Investments and the Subadvisors, and New York Life Investments’ and the Subadvisors’ overall legal and compliance environment. The Board also reviewed New York Life Investments’ and the Subadvisors’ willingness to invest in personnel that benefit the Portfolios. In this regard, the Board considered the experience of each Portfolio’s portfolio managers, the number of accounts managed by the portfolio managers and the method for compensating portfolio managers.
Based on these considerations, the Board concluded, within the context of its overall determinations regarding the Agreements, that the Portfolios should continue to benefit from the nature, scope and quality of these services as a result of New York Life Investments’ and the Subadvisors’ experience, personnel, operations and resources.
Investment Performance
In evaluating each Portfolio’s investment performance, the Board considered investment performance results in light of a Portfolio’s investment objective, strategies and risks, as disclosed in the Portfolio’s prospectus. The Board particularly considered detailed investment reports on the
Portfolios’ performance provided to the Board throughout the year by the Investment Consulting Group of New York Life Investments. These reports include, among other items, information on each Portfolio’s gross and net returns, each Portfolio’s investment performance relative to relevant investment categories and Portfolio benchmarks, each Portfolio’s risk-adjusted investment performance, and each Portfolio’s investment performance as compared to similar competitor funds, as appropriate. The Board also considered information provided by Strategic Insight showing the investment performance of each Portfolio as compared to peer funds.
In evaluating the performance of certain Portfolios, the Board considered that the Portfolios had not been in operation for a sufficient time period to establish a meaningful investment performance track record. In considering the other Portfolios’ investment performance, the Board focused principally on the Portfolios’ long-term performance track record. The Board also gave weight to its ongoing discussions with senior management at New York Life Investments concerning each Portfolio’s investment performance, as well as discussions between a Portfolio’s portfolio managers and the Board that occur typically on an annual basis. In addition, the Board considered any specific actions that New York Life Investments or the Subadvisors had taken, or had agreed with the Board to take, to enhance Portfolio investment performance, and the results of those actions.
Because the MainStay VP Conservative Allocation Portfolio, MainStay VP Moderate Allocation Portfolio, Main-Stay VP Moderate Growth Allocation Portfolio and MainStay VP Growth Allocation Portfolio (the “Asset Allocation Portfolios”) invest substantially all of their assets in other funds advised by New York Life Investments (including the Portfolios), the Board considered the rationale for the allocation among and selection of the underlying funds in which the Asset Allocation Portfolios invest, including the investment performance of the underlying funds.
Based on these considerations, the Board concluded, within the context of its overall determinations regarding the Agreements, that the long-term investment performance of the Portfolios, along with ongoing efforts by New York Life Investments and the Subadvisors to enhance investment returns, supported a determination to approve the Agreements. The Portfolios disclose more information about investment performance in the Portfolio Management Discussion and Analysis, Investment and Performance Comparison and Financial Highlights sections of this Annual Report and in the Portfolios’ prospectus.
Costs of the Services Provided, and Profits Realized, by New York Life Investments and the Subadvisors
The Board considered the costs of the services provided by New York Life Investments and the Subadvisors under the Agreements, and the profits realized by New York Life Investments and its affiliates and the Subadvisors due to
| | | | |
| mainstayinvestments.com | | | M-491 | |
Board Consideration and Approval of Management Agreement
and Subsidiary Agreement (Unaudited) (continued)
their relationships with the Portfolios. Because MacKay Shields, Cornerstone Capital Management and ICAP are affiliates of New York Life Investments whose subadvisory fees are paid directly by New York Life Investments, the Board considered cost and profitability information for New York Life Investments and these Subadvisors in the aggregate. Because the subadvisory fees of Epoch and Winslow are negotiated at arm’s-length by New York Life Investments and are paid by New York Life Investments, not the Portfolios, the Board principally considered the profits realized by New York Life Investments and its affiliates with respect to the Portfolios.
The Board noted that the Asset Allocation Portfolios do not pay a management fee, but that shareholders of the Asset Allocation Portfolios indirectly pay the fees and expenses of the underlying funds in which the Asset Allocation Portfolios invest. The Board considered that the Asset Allocation Portfolios’ investments in underlying funds managed by New York Life Investments indirectly benefit New York Life Investments.
In evaluating the costs and profits of New York Life Investments and its affiliates and the Subadvisors, the Board considered, among other factors, each party’s investments in personnel, systems, equipment and other resources necessary to manage the Portfolios, and that New York Life Investments is responsible for paying the subadvisory fees for the Subadvised Portfolios. The Board acknowledged that New York Life Investments and the Subadvisors must be in a position to pay and retain experienced professional personnel to provide services to the Portfolios, and that the ability to maintain a strong financial position is important in order for New York Life Investments and the Subadvisors to continue to provide high-quality services to the Portfolios. The Board also noted that the Portfolios benefit from the allocation of certain fixed costs across the MainStay Group of Funds. In addition, the Board requested and received information regarding the profitability to New York Life Investments of managing the Portfolios as compared with managing retail MainStay Funds (“Retail Funds”).
In addition, the Board noted the difficulty in obtaining reliable comparative data about mutual fund managers’ profitability, since such information generally is not publicly available and may be impacted by numerous factors, including the structure of a fund manager’s organization, the types of funds it manages, the methodology used to allocate certain fixed costs to specific funds, and the manager’s capital structure and costs of capital. While recognizing the difficulty in evaluating a manager’s profitability with respect to the Portfolios, and noting that other profitability methodologies may also be reasonable, the Board concluded that the profitability methodology presented by New York Life Investments to the Board, which was developed by New York Life Investments in consultation with an independent consultant, was reasonable in all material respects.
In considering the costs and profitability of the Portfolios, the Board also considered certain fall-out benefits that may be realized by New York Life Investments and its affiliates due to their relationships with the Portfolios. The Board recognized, for example, the benefits to the Subadvisors from legally permitted “soft-dollar” arrangements by which brokers provide research and other services to the Subadvisors in exchange for commissions paid by a Subadvised Portfolio with respect to trades on the Subadvised Portfolio’s portfolio securities. The Board also requested and received information from New York Life Investments, Epoch and Winslow concerning other business relationships between Epoch and Winslow and their affiliates and New York Life Investments and its affiliates.
The Board further considered that, in addition to fees earned by New York Life Investments for managing the Portfolios, New York Life Investments’ affiliates also earn revenues from serving the Portfolios in various other capacities, including as the Portfolios’ distributor. The Board observed that information about these other revenues, and their impact on the profitability of the Portfolios to New York Life Investments and its affiliates, was furnished to the Board as part of the 15(c) process. The Board noted that, although it assessed the overall profitability of the Portfolios to New York Life Investments and its affiliates as part of the contract review process, when considering the reasonableness of the fees to be paid to New York Life Investments and its affiliates under the Agreements, the Board considered the profitability of New York Life Investments’ relationship with the Portfolios on a pre-tax basis, and without regard to distribution expenses.
After evaluating the information presented to the Board, the Board concluded, within the context of its overall determinations regarding the Agreements, that any profits realized by New York Life Investments and its affiliates and the Subadvisors due to their relationships with the Portfolios supported the Board’s decision to approve the Agreements. With respect to Epoch and Winslow, the Board concluded that any profits realized by Epoch and Winslow due to their relationships with the Portfolios are the result of arm’s-length negotiations between New York Life Investments and Epoch and Winslow, and are based on fees paid to Epoch and Winslow by New York Life Investments, not the Portfolios.
Extent to Which Economies of Scale May Be Realized as the Portfolios Grow
The Board also considered whether each Portfolio’s expense structure permitted economies of scale to be shared with Portfolio investors. The Board reviewed information from New York Life Investments showing how each Portfolio’s management fee schedule compared to fee schedules of other funds and accounts managed by New York Life Investments. The Board also reviewed information from Strategic Insight showing how the each Portfolio’s management fee schedule hypothetically would compare
| | |
| M-492 | | MainStay VP Funds Trust |
with fees paid for similar services by peer funds at varying asset levels. While recognizing the difficulty of determining economies of scale with precision, the Board acknowledged that economies of scale may be shared with the Portfolios in a number of ways, including, for example, through the imposition of management fee breakpoints and by initially setting relatively lower management fees. The Board noted that the Asset Allocation Portfolios do not pay a management fee, and that the Board separately considers economies of scale as part of its review of the management agreements of underlying funds in which the Asset Allocation Portfolios invest.
Based on this information, the Board concluded, within the context of its overall determinations regarding the Agreements, that each Portfolio’s expense structure appropriately reflects economies of scale for the benefit of Portfolio investors. The Board noted, however, that it would continue to evaluate the reasonableness of each Portfolio’s expense structure as the Portfolio grows over time.
Management and Subadvisory Fees and Total Ordinary Operating Expenses
The Board evaluated the reasonableness of the fees to be paid under the Agreements and each Portfolio’s expected total ordinary operating expenses. With respect to the Subadvised Portfolios, the Board primarily considered the reasonableness of the management fees paid by the Portfolios to New York Life Investments, since the fees paid to the Subadvisors are paid by New York Life Investments, not the Subadvised Portfolios.
In assessing the reasonableness of each Portfolio’s fees and expenses, the Board primarily considered comparative data provided by Strategic Insight on the fees and expenses charged by similar mutual funds managed by other investment advisers. Because the Asset Allocation Portfolios do not pay a management fee to New York Life Investments, the Board considered the reasonableness of fees and expenses the Asset Allocation Portfolios indirectly pay by investing in underlying funds that charge management fees. The Board considered New York Life Investments’ process for monitoring and disclosing potential conflicts in the selection of underlying funds. In addition, the Board considered information provided by New York Life Investments and the Subadvisors on fees charged to other investment advisory clients, including institutional separate accounts and other funds with similar investment objectives as the Portfolios. In this regard, the Board took into account the explanation provided by New York Life Investments about the different scope of services provided to mutual funds as compared with other investment advisory clients. The Board also took into account the impact of any expense limitation arrangements on each Portfolio’s net management fee and expenses. The Board also evaluated differences in the contractual management fee schedules of the Portfolios and Retail Funds with similar investment
objectives, investment strategies and portfolio management processes, taking into account New York Life Investments’ rationale for any differences in fee schedules.
After considering all of the factors outlined above, the Board concluded that each Portfolio’s management and subadvisory fees and total ordinary operating expenses were within a range that is competitive and, within the context of the Board’s overall conclusions regarding the Agreements, support a conclusion that these fees and expenses are reasonable.
Conclusion
On the basis of the information provided to it and its evaluation thereof, the Board, including the Independent Trustees, unanimously voted to approve the Agreements.
| | | | |
| mainstayinvestments.com | | | M-493 | |
Proxy Voting Policies and Procedures
A description of the policies and procedures that New York Life Investments uses to vote proxies related to the Portfolios’ securities is available without charge, upon request, (i) by calling 800-598-2019 and (ii) on the Securities and Exchange Commission’s (“SEC”) website at www.sec.gov.
The Fund is required to file with the SEC the proxy voting records for each Portfolio for the 12-month period ending June 30 on Form N-PX. The most recent Form N-PX or relevant Portfolio proxy voting record is available free of charge upon request by calling 800-598-2019 or on the SEC’s website at www.sec.gov.
Portfolio Holdings Disclosure
Each Portfolio is required to file its complete schedule of portfolio holdings with the SEC for its first and third fiscal quarters on Form N-Q. In addition, the Cash Management Portfolio is required to file its complete schedule of portfolio holdings every month on Form N-MFP and also makes available its complete schedule of portfolio holdings on its website at www.nylim.com, five days after each month-end. The Portfolios’ Form N-Q is available without charge on the SEC’s website at www.sec.gov or by calling New York Life Investments at 800-598-2019. Form N-MFP is made available to the public by the SEC 60 days after the month to which the information pertains, and a link to each of the most recent 12 months of filings on Form N-MFP is provided on the Portfolios’ website. You can also obtain and review copies of Forms N-Q and N-MFP by visiting the SEC’s Public Reference Room in Washington, DC (information on the operation of the Public Reference Room may be obtained by calling 1-800-SEC-0330).
| | |
| M-494 | | MainStay VP Funds Trust |
Board Members and Officers (Unaudited)
The Board Members oversee the MainStay Group of Funds (which is comprised of Funds that are series of The MainStay Funds, Eclipse Funds, Eclipse Funds Inc., MainStay Funds Trust, MainStay VP Funds Trust, Private Advisors Alternative Strategies Master Fund, Private Advisors Alternative Strategies Fund, and MainStay Defined Term Municipal Opportunities Fund) (collectively, the “Fund Complex”), the Manager and, when applicable, the Subadvisor(s) and other service providers to the Fund Complex. Each Board Member serves until his or her successor is elected and qualified or until his or her resignation, death or removal. The Retirement Policy provides that a Board Member shall tender his
or her resignation by the end of the calendar year during which he or she reaches the age of 75.
Officers serve a term of one year and are elected annually by the Board Members. The business address of each Board Member and officer listed below is 51 Madison Avenue, New York, New York 10010.
The Statement of Additional Information applicable to the Fund includes additional information about the Board Members and is available without charge, upon request, by calling 800-MAINSTAY (624-6782) or by going online to mainstayinvestments.com.
| | | | | | | | | | | | |
| | | | | Name and Date of Birth | | Term of Office,
Position(s) Held with
the Fund Complex
and Length of Service | | Principal Occupation(s) During Past Five Years | | Number of
Portfolios in
Fund Complex
Overseen by
Board Member | | Other Directorships
Held by Board Member |
Interested Board Member* | | | | John Y. Kim 9/24/60* | | Indefinite; Eclipse Funds: Trustee since 2008; Eclipse Funds Inc.: Director since 2008 (1 fund); The MainStay Funds: Trustee since 2008 (12 funds); MainStay Funds Trust: Trustee since 2009 (33 funds); MainStay VP Funds Trust: Trustee since 2008 (28 portfolios)**; Private Advisors Alternative Strategies Master Fund: Trustee since 2011; Private Advisors Alternative Strategies Fund: Trustee since 2011; and MainStay DefinedTerm Municipal Opportunities Fund: Trustee since 2011. | | Chief Investment Officer, New York Life Insurance Company (since 2011); President, Investments
Group—New York Life Insurance Company (since 2012); Chairman of the Board of Managers and Chief Executive Officer, New York Life Investment Management LLC and New York Life Investment Management Holdings LLC (since 2008); Member of the Board, MacKay Shields LLC, Institutional Capital LLC, Madison Capital Funding LLC, and Cornerstone Capital Management Holdings LLC (fka Madison Square Investors LLC) (since 2008); Member of the Board of Managers, McMorgan and Company LLC and GoldPoint Partners (fka NYLCAP Manager LLC) (2008-2012); Member of the Board of Private Advisors, L.L.C. (since 2010); Member of the Board of MCF Capital Management LLC (since 2012); and President, Prudential Retirement, a business unit of Prudential Financial, Inc. (2002 to 2007) | | 77 | | None |
| | * | This Board Member is considered to be an “interested person” of the MainStay Group of Funds within the meaning of the 1940 Act because of his affiliation with New York Life Insurance Company, New York Life Investment Management LLC, Cornerstone Capital Management Holdings LLC, MacKay Shields LLC, Private Advisors LLC, Institutional Capital LLC, Epoch Investment Partners, Inc., Markston International, LLC, Winlsow Capital Management, Inc., NYLIFE Securities LLC and/or NYLIFE Distributors LLC, as described in detail above in the column entitled “Principal Occupation(s) During the Past Five Years.” |
| | ** | Includes prior service as a Director of MainStay VP Series Fund, Inc., the predecessor to MainStay VP Funds Trust. |
| | | | |
| mainstayinvestments.com | | | M-495 | |
| | | | | | | | | | | | |
| | | | | Name and Date of Birth | | Term of Office,
Position(s) Held with
the Fund Complex
and Length of Service* | | Principal Occupation(s) During Past Five Years | | Number of
Portfolios in
Fund Complex
Overseen by
Board Member | | Other Directorships
Held by Board Member |
Non-Interested Board Members | | | | Peter Meenan 12/5/41 | | Indefinite; Eclipse Funds: Chairman since January 2013 and Trustee since 2002; Eclipse Funds Inc.: Chairman since January 2013 and Director since 2002 (1 fund); The MainStay Funds: Chairman since January 2013 and Trustee since 2007 (12 funds); MainStay Funds Trust: Chairman since January 2013 and Trustee since 2009 (33 funds); MainStay VP Funds Trust: Chairman since January 2013 and Trustee since 2007 (28 portfolios)*; Private Advisors Alternative Strategies Master Fund: Chairman since January 2013 and Trustee since 2011; Private Advisors Alternative Strategies Fund: Chairman since January 2013 and Trustee since 2011; and MainStay DefinedTerm Municipal Opportunities Fund: Chairman since January 2013 and Trustee since 2011. | | Independent Consultant; President and Chief Executive Officer, Babson—United, Inc. (financial services firm) (2000 to 2004); Independent Consultant (1999 to 2000); Head of Global Funds, Citicorp (1995 to 1999). | | 77 | | None |
| | * | Includes prior service as a Director of MainStay VP Series Fund, Inc., the predecessor to MainStay VP Funds Trust. |
| | |
| M-496 | | MainStay VP Funds Trust |
| | | | | | | | | | | | |
| | | | | Name and
Date of Birth | | Term of Office,
Position(s) Held with
Fund Complex
and Length of Service* | | Principal Occupation(s)
During Past Five Years | | Number of
Portfolios in
Fund Complex
Overseen by
Board Member | | Other Directorships
Held by Board Member |
| Non-Interested Board Members | | | | Susan B. Kerley 8/12/51 | | Indefinite; Eclipse Funds: Trustee since 2000; Eclipse Funds Inc.: Director since 1990 (1 fund); The MainStay Funds: Trustee since 2007 (12 funds); MainStay Funds Trust: Trustee since 2009 (33 funds); MainStay VP Funds Trust: Trustee since 2007 (28 portfolios)*; Private Advisors Alternative Strategies Master Fund: Trustee since 2011; Private Advisors Alternative Strategies Fund: Trustee since 2011; and MainStay DefinedTerm Municipal Opportunities Fund: Trustee since 2011. | | President, Strategic Management Advisors LLC (since 1990) | | 77 | | Trustee, Legg Mason Partners Fund Complex, since 1991 (52 portfolios) |
| | | | Alan R. Latshaw 3/27/51 | | Indefinite; Eclipse Funds: Trustee and Audit Committee Financial Expert since 2007; Eclipse Funds Inc.: Director since 2007 (1 fund); The MainStay Funds: Trustee and Audit Committee Financial Expert since 2006 (12 funds); MainStay Funds Trust: Trustee and Audit Committee Financial Expert since 2009 (33 funds); MainStay VP Funds Trust: Trustee and Audit Committee Financial Expert since 2007 (28 portfolios)*; Private Advisors Alternative Strategies Master Fund: Trustee and Audit Committee Financial Expert since 2011; Private Advisors Alternative Strategies Fund: Trustee and Audit Committee Financial Expert since 2011; and MainStay DefinedTerm Municipal Opportunities Fund: Trustee and Audit Committee Financial Expert since 2011. | | Retired; Partner, Ernst & Young LLP (2002 to 2003); Partner, Arthur Andersen LLP (1989 to 2002); Consultant to the MainStay Funds Audit and Compliance Committee (2004 to 2006) | | 77 | | Trustee, State Farm Associates Funds Trusts since 2005 (4 portfolios); Trustee, State Farm Mutual Fund Trust since 2005 (15 portfolios); Trustee, State Farm Variable Product Trust since 2005 (9 portfolios) |
| | * | Includes prior service as a Director of MainStay VP Series Fund, Inc., the predecessor to MainStay VP Funds Trust. |
| | | | |
| mainstayinvestments.com | | | M-497 | |
| | | | | | | | | | | | |
| | | | | Name and
Date of Birth | | Term of Office,
Position(s) Held with
the Fund Complex
and Length of Service* | | Principal Occupation(s)
During Past Five Years | | Number of
Portfolios in
Fund Complex
Overseen by Board Member | | Other Directorships Held by Board Member |
| Non-Interested Board Members | | | | Richard H. Nolan, Jr.
11/16/46 | | Indefinite; Eclipse Funds: Trustee since 2007; Eclipse Funds Inc.: Director since 2007 (1 fund); The MainStay Funds: Trustee since 2007 (12 funds); MainStay Funds Trust: Trustee since 2009 (33 funds); MainStay VP Funds Trust: Trustee since 2006 (28 portfolios)*; Private Advisors Alternative Strategies Master Fund: Trustee since 2011; Private Advisors Alternative Strategies Fund: Trustee since 2011; and MainStay DefinedTerm Municipal Opportunities Fund: Trustee since 2011. | | Managing Director, ICC Capital Management; President—Shields/ Alliance, Alliance Capital Management (1994 to 2004) | | 77 | | None |
| | | | Richard S. Trutanic
2/13/52 | | Indefinite; Eclipse Funds: Trustee since 2007; Eclipse Funds Inc.: Director since 2007 (1 fund); The MainStay Funds: Trustee since 1994 (12 funds); MainStay Funds Trust: Trustee since 2009 (33 funds); MainStay VP Funds Trust: Trustee since 2007 (28 portfolios)*; Private Advisors Alternative Strategies Master Fund: Trustee since 2011; Private Advisors Alternative Strategies Fund: Trustee since 2011; and MainStay DefinedTerm Municipal Opportunities Fund: Trustee since 2011. | | Chairman and Chief Executive Officer, Somerset & Company (financial advisory firm) (since 2004); Managing Director, The Carlyle Group (private investment firm) (2002 to 2004); Senior Managing Director, Partner and Board Member, Groupe Arnault S.A. (private investment firm) (1999 to 2002) | | 77 | | None |
| | * | Includes prior service as a Director of MainStay VP Series Fund, Inc., the predecessor to MainStay VP Funds Trust. |
| | |
| M-498 | | MainStay VP Funds Trust |
| | | | | | | | | | | | |
| | | | | Name and
Date of Birth | | Term of Office,
Position(s) Held with
the Fund Complex
and Length of Service* | | Principal Occupation(s) During Past Five Years | | Number of Portfolios in Fund Complex
Overseen by Board Member | | Other Directorships Held by Board Member |
Non-Interested Board Members | | | | Roman L. Weil 5/22/40 | | Indefinite; Eclipse Funds: Trustee and Audit Committee Financial Expert since 2007; Eclipse Funds Inc.: Director and Audit Committee Financial Expert since 2007 (1 fund); The MainStay Funds: Trustee and Audit Committee Financial Expert since 2007 (12 funds); MainStay Funds Trust: Trustee and Audit Committee Financial Expert since 2009 (33 funds); MainStay VP Funds Trust: Trustee since 1994 and Audit Committee Financial Expert since 2003 (28 portfolios)*; Private Advisors Alternative Strategies Master Fund: Trustee and Audit Committee Financial Expert since 2011; Private Advisors Alternative Strategies Fund: Trustee and Audit Committee Financial Expert since 2011; and MainStay DefinedTerm Municipal Opportunities Fund: Trustee and Audit Committee Financial Expert since 2011. | | Visiting Professor, University of California—San Diego (since 2012); President, Roman L. Weil Associates, Inc. (consulting firm) (since 1981); Visiting Professor, Southern Methodist University (2011); Visiting Professor, NYU Stem School of Business, New York University (2011); V. Duane Rath Professor Emeritus of Accounting, Chicago Booth School of Business, University of Chicago (1965-2008) | | 77 | | None |
| | | | John A. Weisser 10/22/41 | | Indefinite; Eclipse Funds: Trustee since 2007; Eclipse Funds Inc.: Director since 2007 (1 fund); The MainStay Funds: Trustee since 2007 (12 funds); MainStay Funds Trust: Trustee since 2009 (33 funds); MainStay VP Funds Trust: Trustee since 1997 (28 portfolios)*; Private Advisors Alternative Strategies Master Fund: Trustee since 2011; Private Advisors Alternative Strategies Fund: Trustee since 2011; and MainStay DefinedTerm Municipal Opportunities Fund: Trustee since 2011. | | Retired. Managing Director of Salomon Brothers, Inc. (1971 to 1995) | | 77 | | Trustee, Direxion Funds since 2007 (27 portfolios); Direxion Insurance Trust since 2007 (1 portfolio); Trustee, Direxion Shares ETF Trust, since 2008 (50 portfolios) |
| | * | Includes prior service as a Director of MainStay VP Series Fund, Inc., the predecessor to MainStay VP Funds Trust. |
| | | | |
| mainstayinvestments.com | | | M-499 | |
The following individuals have been appointed by the Board Members to serve as Officers of the MainStay Group of Funds.*
| | | | | | | | |
| | | | | Name and
Date of Birth | | Position(s) Held and
Length of Service** | | Principal Occupation(s) During Past Five Years |
Officers | | | | Jack R. Benintende 5/12/64 | | Treasurer and Principal Financial and Accounting Officer, Eclipse Funds, Eclipse Funds Inc. and The MainStay Funds (since 2007), MainStay Funds Trust (since 2009) | | Assistant Treasurer, New York Life Investment Management Holdings LLC (since 2008); Managing Director, New York Life Investment Management LLC (since 2007); Treasurer and Principal Financial Accounting Officer, Private Advisors Alternative Strategies Master Fund, Private Advisors Alternative Strategies Fund and MainStay DefinedTerm Municipal Opportunities Fund (since 2011); Treasurer and Principal Financial and Accounting Officer, MainStay VP Funds Trust (since 2007)** |
| | | | Jeffrey A. Engelsman 9/28/67 | | Vice President and Chief Compliance Officer, MainStay VP Funds Trust (since 2007)** Eclipse Funds, Eclipse Funds Inc., The MainStay Funds and MainStay Funds Trust (since 2009) | | Managing Director, Compliance (since 2009), Director and Associate General Counsel, New York Life Investment Management LLC (2005 to 2008); Assistant Secretary, NYLIFE Distributors LLC (2006 to 2008); Vice President and Chief Compliance Officer, Private Advisors Alternative Strategies Master Fund, Private Advisors Alternative Strategies Fund, DefinedTerm Municipal Opportunities Fund (since 2011); Assistant Secretary, The MainStay Funds (2006 to 2008); Assistant Secretary, Eclipse Trust, Eclipse Funds, Inc. and MainStay VP Series Fund, Inc. (2005 to 2008) |
| | | | Stephen P. Fisher 2/22/59 | | President, MainStay VP Funds Trust (since 2007)** Eclipse Funds, Eclipse Funds Inc. and The MainStay Funds (since 2007), MainStay Funds Trust (since 2009) | | Manager, President and Chief Operating Officer, NYLIFE Distributors LLC (since 2008); Chairman of the Board, NYLIM Service Company LLC (since 2008); Senior Managing Director and Chief Marketing Officer, New York Life Investment Management LLC (since 2005); President, Private Advisors Alternative Strategies Master Fund, Private Advisors Alternative Strategies Fund and MainStay DefinedTerm Municipal Opportunities Fund (since 2011) |
| | | | J. Kevin Gao 10/13/67 | | Secretary and Chief Legal Officer, MainStay VP Funds Trust (since 2010)** Eclipse Funds, Eclipse Funds Inc., The MainStay Funds and MainStay Funds Trust (since 2010) | | Managing Director and Associate General Counsel, New York Life Investment Management LLC (since 2010); Secretary and Chief Legal Officer, Private Advisors Alternative Strategies Master Fund, Private Advisors Alternative Strategies Fund and MainStay DefinedTerm Municipal Opportunities Fund (since 2011); Director and Counsel of Credit Suisse, Chief Legal Officer and Secretary of Credit Suisse Asset Management, LLC and Credit Suisse Funds (2003 to 2010) |
| | | | Scott T. Harrington 2/8/59 | | Vice President— Administration, MainStay VP Funds Trust (since 2005)** Eclipse Funds, Eclipse Funds Inc. and The MainStay Funds (since 2005), MainStay Funds Trust (since 2009) | | Director, New York Life Investment Management LLC (including predecessor advisory organizations) (since 2000); Executive Vice President, New York Life Trust Company and New York Life Trust Company FSB (since 2006); Vice President—Administration, Private Advisors Alternative Strategies Master Fund, Private Advisors Alternative Strategies Fund and MainStay DefinedTerm Municipal Opportunities Fund (since 2011) |
| | * | The Officers listed above are considered to be “interested persons” of the MainStay Group of Funds within the meaning of the 1940 Act because of their affiliation with New York Life Insurance Company, New York Life Investment Management LLC, NYLIFE Securities LLC and/or NYLIFE Distributors LLC, as described in detail above in the column captioned “Principal Occupation(s) During Past Five Years.” Officers are elected annually by the Board to serve a one-year term. |
| | ** | Includes prior service as an Officer of MainStay VP Series Fund, Inc., the predecessor to MainStay VP Funds Trust. |
| | |
| M-500 | | MainStay VP Funds Trust |
This page intentionally left blank
MainStay VP Portfolios
MainStay VP offers a wide range of Portfolios. The full array of MainStay VP offerings is listed here, with information about the manager, subadvisors, legal counsel, and independent registered public accounting firm.
Equity Portfolios
MainStay VP Common Stock Portfolio
MainStay VP DFA / DuPont Capital Emerging Markets Equity Portfolio
MainStay VP Eagle Small Cap Growth Portfolio
MainStay VP Growth Equity Portfolio
MainStay VP ICAP Select Equity Portfolio
MainStay VP International Equity Portfolio
MainStay VP Large Cap Growth Portfolio
MainStay VP Mid Cap Core Portfolio
MainStay VP S&P 500 Index Portfolio
MainStay VP U.S. Small Cap Portfolio
MainStay VP Van Eck Global Hard Assets Portfolio
Blended Portfolios
MainStay VP Balanced Portfolio
MainStay VP Convertible Portfolio
MainStay VP Income Builder Portfolio
MainStay VP Janus Balanced Portfolio
MainStay VP MFS® Utilities Portfolio
MainStay VP T. Rowe Price Equity Income Portfolio
Income Portfolios
MainStay VP Bond Portfolio
MainStay VP Cash Management Portfolio
MainStay VP Flexible Bond Opportunities Portfolio
MainStay VP Floating Rate Portfolio
MainStay VP Government Portfolio
MainStay VP High Yield Corporate Bond Portfolio
MainStay VP PIMCO Real Return Portfolio
Asset Allocation Portfolios
MainStay VP Conservative Allocation Portfolio
MainStay VP Growth Allocation Portfolio
MainStay VP Moderate Allocation Portfolio
MainStay VP Moderate Growth Allocation Portfolio
Manager
New York Life Investment Management LLC
New York, New York
Subadvisors
Cornerstone Capital Management Holdings LLC*
New York, New York
Cornerstone Capital Management LLC*
Bloomington, Minnesota
Dimensional Fund Advisors LP
Austin, Texas
DuPont Capital Management Corporation
Wilmington, Delaware
Eagle Asset Management, Inc.
St Petersburg, Florida
Epoch Investment Partners, Inc.
New York, New York
Institutional Capital LLC*
Chicago, Illinois
Janus Capital Management LLC
Denver, Colorado
MacKay Shields LLC*
New York, New York
Massachusetts Financial Services Company
Boston, Massachusetts
Pacific Investment Management Company LLC
Newport Beach, California
T. Rowe Price Associates, Inc
Baltimore, Maryland
Van Eck Associates Corporation
New York, New York
Winslow Capital Management, Inc.
Minneapolis, Minnesota
Distributor
NYLIFE Distributors LLC*
Parsippany, New Jersey
Custodian
State Street Bank and Trust Company
Boston, Massachusetts
Independent Registered Public Accounting Firm
PricewaterhouseCoopers LLP
Legal Counsel
Dechert LLP
Some Portfolios may not be available in all products.
* An affiliate of New York Life Investment Management LLC
mainstayinvestments.com
NYLIFE Distributors LLC, 169 Lackawanna Avenue, Parsippany, New Jersey 07054
This report may be distributed only when preceded or accompanied by a current Fund prospectus.
New York Life Investment Management LLC is the investment manager to the MainStay VP Funds Trust
© 2013 by NYLIFE Distributors LLC. All rights reserved.
You may obtain copies of the Prospectus and the Statement of Additional Information free of charge, upon request, by calling toll-free 800-598-2019 or writing to New York Life Insurance and Annuity Corporation, 51 Madison Avenue, New York, NY 10010.
| | | | |
| Not FDIC Insured. | | No Bank Guarantee. | | May Lose Value. |
| | | | |
 | | Not a part of the Annual Report | | MSVP11-02/13 |
Item 2. Code of Ethics.
As of the end of the period covered by this report, the Registrant has adopted a code of ethics (the “Code”) that applies to the Registrant’s principal executive officer (“PEO”) and principal financial officer (“PFO”). A copy of the Code is filed herewith. The Registrant did not grant any waivers, including implicit waivers, from any provisions of the Code to the PEO or PFO during the period covered by this report.
Item 3. Audit Committee Financial Expert.
The Board of Trustees has determined that the Registrant has two audit committee financial experts serving on its Audit Committee. The Audit Committee financial experts are Alan R. Latshaw and Roman L. Weil. Messrs. Latshaw and Weil are “independent” within the meaning of that term under the Investment Company Act of 1940.
Item 4. Principal Accountant Fees and Services.
(a) Audit Fees
The aggregate fees billed for the fiscal year ended December 31, 2012 for professional services rendered by PricewaterhouseCoopers LLP (“PwC”) for the audit of the Registrant’s annual financial statements or services that are normally provided by PwC in connection with statutory and regulatory filings or engagements for that fiscal year were $1,131,765.
The aggregate fees billed for the fiscal year ended December 31, 2011 for professional services rendered by PwC for the audit of the Registrant’s annual financial statements or services that are normally provided by PwC in connection with statutory and regulatory filings or engagements for that fiscal year were $842,785.
(b) Audit-Related Fees
The aggregate fees billed for assurance and related services by PwC that are reasonably related to the performance of the audit of the Registrant’s financial statements and are not reported under paragraph (a) of this Item were: (i) $0 for the fiscal year ended December 31, 2012, and (ii) $0 for the fiscal year ended December 31, 2011. These audit-related services include review of financial highlights for Registrant’s registration statements and issuance of consents to use the auditor’s reports.
(c) Tax Fees
The aggregate fees billed for professional services rendered by PwC for tax compliance, tax advice, and tax planning were: (i) $127,700 during the fiscal year ended December 31, 2012, and (ii) $85,300 during the fiscal year ended December 31, 2011. These services primarily included preparation of federal, state and local income tax returns and excise tax returns, as well as services relating to excise tax distribution requirements.
(d) All Other Fees
The aggregate fees billed for products and services provided by PwC, other than the services reported in paragraphs (a) through (c) of this Item were: (i) $0 during the fiscal year ended December 31, 2012, and (ii) $0 during the fiscal year ended December 31, 2011.
(e) Pre-Approval Policies and Procedures
| | (1) | The Registrant’s Audit Committee has adopted pre-approval policies and procedures (the “Procedures”) to govern the Committee’s pre-approval of (i) all audit services and permissible non-audit services to be provided to the Registrant by its independent accountant, and (ii) all permissible non-audit services to be provided by such independent accountant to the Registrant’s investment adviser and to any entity controlling, controlled by or under common control with the investment adviser that provides ongoing services to the Registrant (collectively, the “Service Affiliates”) if the services directly relate to the Registrant’s operations and financial reporting. In accordance with the Procedures, the Audit Committee is responsible for the engagement of the independent accountant to certify the Registrant’s financial statements for each fiscal year. With respect to the pre-approval of non-audit services provided to the Registrant and its Service Affiliates, the Procedures provide that the Audit Committee may annually pre-approve a list of the types of services that may be provided to the Registrant or its Service Affiliates, or the Audit Committee may pre-approve such services on a project-by-project basis as they arise. Unless a type of service has received general pre-approval, it will require specific pre-approval by the Audit Committee if it is to be provided by the independent accountant. The Procedures also permit the Audit Committee to delegate authority to one or more of its members to pre-approve any proposed non-audit services that have not been previously pre-approved by the Audit Committee, subject to the ratification by the full Audit Committee no later than its next scheduled meeting. To date, the Audit Committee has not delegated such authority. |
| | (2) | With respect to the services described in paragraphs (b) through (d) of this Item 4, no amount was approved by the Audit Committee pursuant to paragraph (c)(7)(i)(C) of Rule 2-01 of Regulation S-X. |
(f) Less than fifty percent of PwC’s engagement to audit the Registrant’s financial statements for the most recent fiscal year was attributable to work performed by persons other than PwC’s full-time, permanent employees.
(g) All non-audit fees billed by PwC for services rendered to the Registrant for the fiscal years ended December 31, 2012 and December 31, 2011 are disclosed in 4(b)-(d) above.
The aggregate non-audit fees billed by PwC for services rendered to the Registrant’s investment adviser (not including any sub-adviser whose role is primarily portfolio management and is subcontracted with or overseen by another investment adviser), and any entity controlling, controlled by, or under common control with the adviser that provides ongoing services to the Registrant were approximately: (i) $2,608,827 for the fiscal year ended December 31, 2012, and (ii) $2,807,847 for the fiscal year ended December 31, 2011.
(h) The Registrant’s Audit Committee has determined that the non-audit services rendered by PwC for the fiscal year ended December 31, 2012 to the Registrant’s investment adviser and any entity controlling, controlled by, or under common control with the Registrant’s investment adviser that provides ongoing services to the Registrant that were not required to be pre-approved by the Audit Committee because they did not relate directly to the operations and financial reporting of the registrant were compatible with maintaining the respective independence of PwC during the relevant time period.
Item 5. Audit Committee of Listed Registrants
Not applicable.
Item 6. Schedule of Investments
The Schedule of Investments is included as part of Item 1 of this report.
Item 7. Disclosure of Proxy Voting Policies and Procedures for Closed-End Management Investment Companies.
Not applicable.
Item 8. Portfolio Managers of Closed-End Management Investment Companies.
Not applicable.
Item 9. Purchases of Equity Securities by Closed-End Management Investment Company and Affiliated Purchasers.
Not Applicable.
Item 10. Submission of Matters to a Vote of Security Holders.
Since the Registrant’s last response to this Item, there have been no material changes to the procedures by which shareholders may recommend nominees to the Registrant’s Board of Directors.
Item 11. Controls and Procedures.
(a) Based on an evaluation of the Registrant’s Disclosure Controls and Procedures (as defined in Rule 30a-3(c) under the Investment Company Act of 1940) (the “Disclosure Controls”), as of a date within 90 days prior to the filing date (the “Filing Date”) of this Form N-CSR (the “Report”), the Registrant’s principal executive officer and principal financial officer have concluded that the Disclosure Controls are reasonably designed to ensure that information required to be disclosed by the Registrant in the Report is recorded, processed, summarized and reported by the Filing Date, including ensuring that information required to be disclosed in the Report is accumulated and communicated to the Registrant's management, including the Registrant's principal executive officer and principal financial officer, as appropriate to allow timely decisions regarding required disclosure.
(b) There were no changes in the Registrant’s internal control over financial reporting (as defined in Rule 30a-3(d)) under the Investment Company Act of 1940 that occurred during the second fiscal quarter of the period covered by this report that has materially affected, or is reasonably likely to materially affect, the Registrant’s internal control over financial reporting.
Item 12. Exhibits.
(a)(1) Code of Ethics
(a)(2) Certifications of principal executive officer and principal financial officer as required by Rule 30a-2 under the Investment Company Act of 1940.
(b) Certifications of principal executive officer and principal financial officer as required by Section 906 of the Sarbanes-Oxley Act of 2002.
SIGNATURES
Pursuant to the requirements of the Securities Exchange Act of 1934 and the Investment Company Act of 1940, the Registrant has duly caused this Report to be signed on its behalf by the undersigned, thereunto duly authorized.
MAINSTAY VP FUNDS TRUST
| | |
| By: | | /s/ Stephen P. Fisher |
| | Stephen P. Fisher President and Principal Executive Officer |
|
| Date: March 7, 2013 |
Pursuant to the requirements of the Securities Exchange Act of 1934 and the Investment Company Act of 1940, this Report has been signed below by the following persons on behalf of the Registrant and in the capacities and on the dates indicated.
| | |
| By: | | /s/ Stephen P. Fisher |
| | Stephen P. Fisher President and Principal Executive Officer |
|
| Date: March 7, 2013 |
| |
| By: | | /s/ Jack R. Benintende |
| | Jack R. Benintende Treasurer and Principal Financial and Accounting Officer |
|
| Date: March 7, 2013 |
EXHIBIT INDEX
| (a)(2) | Certifications of principal executive officer and principal financial officer as required by Rule 30a-2 under the Investment Company Act of 1940. |
| (b) | Certification of principal executive officer and principal financial officer as required by Section 906 of the Sarbanes-Oxley Act of 2002. |