UNITED STATES
SECURITIES AND EXCHANGE COMMISSION
Washington, D.C. 20549
FORM N-CSR
CERTIFIED SHAREHOLDER REPORT OF REGISTERED
MANAGEMENT INVESTMENT COMPANIES
Investment Company Act file number 811-03833
MAINSTAY VP FUNDS TRUST
(Exact name of Registrant as specified in charter)
51 Madison Avenue, New York, NY 10010
(Address of principal executive offices) (Zip code)
J. Kevin Gao, Esq.
169 Lackawanna Avenue
Parsippany, NJ 07054
(Name and address of agent for service)
Registrant’s telephone number, including area code: (212) 576-7000
Date of fiscal year end: December 31
Date of reporting period: December 31, 2013
FORM N-CSR
| Item 1. | Reports to Stockholders. |
MainStay VP Funds Trust
Message from the President and Annual Report
December 31, 2013


Message from the President
The 12 months ended December 31, 2013, was a positive period for many equity investors. Major U.S. stock market indexes provided high double-digit returns. According to Russell data, small- and mid-capitalization stocks tended to outperform large-cap stocks, with small-cap stocks gaining more than 40% for the year. Of course, past performance is no guarantee of future results.
Generally speaking, growth stocks tended to outperform value stocks across all capitalization levels. Results varied, however, when economically sensitive stocks were compared to stocks with defensive characteristics.
In general, international stocks of developed nations advanced during the reporting period, but emerging-market stocks declined. Slower growth in China took a toll on metals & mining companies and some commodities. In the third quarter, economic indicators improved in the United States, Europe and Japan, and emerging-market stocks tended to recover some of the ground they had lost earlier in the year.
Bond investors faced a challenging environment in 2013, and speculation about Federal Reserve policy took center stage. In May, Federal Reserve Chairman Ben Bernanke suggested that the Federal Open Market Committee (“FOMC”) might begin tapering its extensive bond-purchase program, widely known as quantitative easing. Anticipating the loss of a substantial source of demand, the bond market responded with lower prices and sharply higher yields.
In September, the FOMC signaled that economic conditions did not yet warrant the much-anticipated tapering. This news had a calming effect on the bond markets. In December, however, the FOMC stated that tapering would begin in January 2014, and that other accommodative policies—such as maintaining
the federal funds rate in a target range close to zero—would likely to remain in place “for a considerable time after the asset purchase program ends and the economic recovery strengthens.”
Bond yields rose during the reporting period, and U.S. Treasury securities generally recorded negative total returns. High-yield corporate bonds provided solid positive returns. On the whole, convertible securities were even stronger, largely because of the performance of their underlying stocks.
Despite the ups and downs of the markets, the portfolio managers of MainStay VP Portfolios focused on the investment strategies they could employ to pursue the investment objectives of their respective Portfolios. Using time-tested investment strategies and risk-management techniques, they sought to position their Portfolios for long-term results consistent with their mandate.
The reports that follow provide additional insight into the market forces, investment decisions and individual securities that influenced MainStay VP Portfolios in 2013. We invite you to carefully consider the information in the reports and use it as part of your overall financial planning and review.
At MainStay, we know that serving your financial needs is both a privilege and a responsibility. We thank you for choosing MainStay VP Funds Trust, and we look forward to helping you pursue your financial goals for many years to come.
Sincerely,

Stephen P. Fisher
President
Not part of the Annual Report
This page intentionally left blank
Table of Contents
Investors should refer to each Portfolio’s Summary Prospectus and/or the MainStay VP Funds Trust Prospectus and consider each Portfolio’s investment objectives, strategies and risks. The Summary Prospectus and/or the Prospectus contain this and other information about each Portfolio. You may obtain copies of each Portfolio’s Summary Prospectus and/or the Prospectus and the Statement of Additional Information free of charge, upon request, by calling toll-free 800-598-2019, by writing to New York Life Insurance and Annuity Corporation, 51 Madison Avenue, Room 251, New York, New York 10010 or by sending an email to MainStayShareholderServices@nylim.com. These documents are also available at mainstayinvestments.com/vpdocuments.
| | | | |
| mainstayinvestments.com | | | M-1 | |
Index Definitions
The information below is an explanation of the various indices and reference rates cited throughout the Portfolio Investment and Performance Comparisons and the Portfolio Management Discussion and Analysis sections that follow from page M-4 through page M-456. Please use this as a reference.
Please note that you cannot make an investment directly in an index. Past performance is no guarantee of future results. Results for securities indices assume reinvestment of all income and capital gains but do not reflect fees, expenses or taxes. Securities in each Portfolio may not precisely match those in a related index, and as a result, performance of the Portfolio may differ.
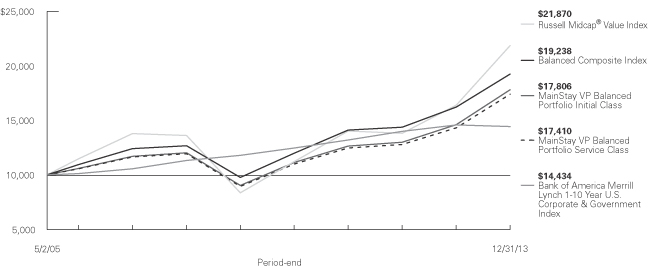
Balanced Composite Index consists of the Russell Midcap® Value Index (60% weighted) and the Bank of America Merrill Lynch 1–10 Year U.S. Corporate & Government Index (40% weighted).
Bank of America Merrill Lynch 1–10 Year U.S. Corporate & Government Index is a market-capitalization-weighted index including U.S. government and fixed-coupon domestic investment-grade corporate bonds.
Bank of America Merrill Lynch All U.S. Convertibles Index is a market-capitalization-weighted index of domestic corporate convertible securities. To be included in the Index, bonds and preferred stocks must be convertible only to common stock.
Bank of America Merrill Lynch U.S. Dollar 3-Month LIBOR Constant Maturity Index represents the London InterBank Offered Rate (“LIBOR”) with a constant 3-month average maturity.
Bank of America Merrill Lynch U.S. High Yield Master II Constrained Index is a market-value-weighted index of all domestic and Yankee high-yield bonds, including deferred-interest bonds and payment-in-kind securities. Issuers included in the Index have maturities of one year or more and have a credit rating lower than BBB–/Baa3, but are not in default. No single issuer may constitute greater than 2% of the Index.
Barclays U.S. Aggregate Bond Index is a broad-based benchmark that measures the investment-grade, U.S. dollar denominated, fixed-rate taxable bond market, including Treasurys, government-related and corporate securities, mortgage-backed securities (agency fixed-rate and hybrid adjustable-rate mortgage pass-throughs), asset-backed securities and commercial mortgage-backed securities.
Barclays U.S. Government Bond Index consists of publicly issued debt of the U.S. Treasury and government agencies.
Barclays U.S. Government/Credit Bond Index includes investment-grade corporate debt issues as well as debt issues of U.S. government agencies and the U.S. Treasury, with maturities of at least one year.
Barclays U.S. TIPS Index includes all publicly issued U.S. Treasury Inflation-Protected Securities (“TIPS”) that have at least one year remaining to maturity and are rated investment grade.
Conservative Allocation Composite Index consists of the S&P 500® Index, the MSCI EAFE® Index and the Barclays U.S.
Aggregate Bond Index weighted 35%, 5% and 60%, respectively.
Credit Suisse High Yield Index is a market-weighted index that includes publicly traded bonds rated below BBB by Standard & Poor’s and below Baa by Moody’s.
Credit Suisse Leveraged Loan Index represents tradable, senior-secured, U.S. dollar denominated non-investment-grade loans.
Dow Jones Global Utilities Index is a free-float market-capitalization-weighted index that measures the performance of utility companies in developed and emerging markets.
Growth Allocation Composite Index consists of the S&P 500® Index and the MSCI EAFE® Index weighted 80% and 20%, respectively.
Income Builder Composite Index consists of the MSCI World Index and the Barclays U.S. Aggregate Bond Index weighted 50%/50%, respectively.
Janus Balanced Composite Index consists of the S&P 500® Index (55% weighted) and the Barclays U.S. Aggregate Bond Index (45% weighted).
LIBOR—London InterBank Offered Rate is a composite of interest rates at which banks borrow from one another in the London market, and it is a widely used benchmark for short-term interest rates.
Lipper Inc. is an independent monitor of fund performance. Results are based on total returns with all dividend and capital-gain distributions reinvested. More information about the Lipper peer group for an individual Portfolio can be found in the Portfolio’s Investment and Performance Comparison.
Moderate Allocation Composite Index consists of the S&P 500® Index, the MSCI EAFE® Index and the Barclays U.S. Aggregate Bond Index weighted 50%, 10% and 40%, respectively.
Moderate Growth Allocation Composite Index consists of the S&P 500® Index, the MSCI EAFE® Index and the Barclays U.S. Aggregate Bond Index weighted 65%, 15% and 20%, respectively.
Morningstar Intermediate Government Category Average is representative of funds that have at least 90% of their bond holdings in bonds backed by U.S. government or by U.S. government-linked agencies. These funds have durations between 3.5 and 6 years and/or average effective maturities between 4 and 10 years.
Morningstar Nontraditional Bond Category Average contains funds that pursue strategies divergent in one or more ways from conventional practice in the broader bond-fund universe. Morningstar category averages are equal-weighted returns based on constituents of the category at the end of the period.
MSCI ACWI® (All Country World Index) Ex U.S. is a free float-adjusted market-capitalization-weighted index that is designed to measure the equity market performance of developed and emerging markets, excluding the United States.
MSCI EAFE® Index consists of international stocks representing the developed world outside of North America.
MSCI Emerging Markets Index is a free float-adjusted market-capitalization-weighted index that is designed to measure equity market performance in the global emerging markets.
MSCI World Index is a free float-adjusted market- capitalization-weighted index that is designed to measure the equity market performance of developed markets.
Russell 1000® Index measures the performance of the large-cap segment of the U.S. equity universe. It is a subset of the Russell 3000® Index and includes approximately 1,000 of the largest securities based on a combination of their market cap and current index membership.
Russell 1000® Growth Index measures the performance of the large-cap growth segment of the U.S. equity universe. It includes those Russell 1000® Index companies with higher price-to-book ratios and higher forecasted growth values.
Russell 1000® Value Index measures the performance of the large-cap value segment of the U.S. equity universe. It includes those Russell 1000® Index companies with lower price-to-book ratios and lower expected growth values.
Russell 2000® Growth Index measures the performance of the small-cap growth segment of the U.S. equity universe. It includes those Russell 2000® Index companies with higher price-to-book ratios and higher forecasted growth values.
Russell 2500™ Index measures the performance of the small- to mid-cap segment of the U.S. equity universe, commonly referred to as “smid” cap. The Russell 2500™ Index is a subset of the Russell 3000® Index. It includes approximately 2,500 of the smallest securities based on a combination of their market cap and current index membership.
Russell 3000® Index measures the performance of the largest 3,000 U.S. companies.
Russell Midcap® Index measures the performance of the mid-cap segment of the U.S. equity universe. The Russell Midcap® Index is a subset of the Russell 1000® Index. It includes approximately 800 of the smallest securities based on a combination of their market cap and current index membership.
Russell Midcap® Value Index measures the performance of the mid-cap value segment of the U.S. equity universe. It includes those Russell Midcap® Index companies with lower price-to-book ratios and lower forecasted growth values.
S&P 500® is a registered trademark of the McGraw-Hill Companies, Inc.
S&P 500® Index is widely regarded as the standard index for measuring large-cap U.S. stock-market performance.
S&P North American Natural Resources Sector Index is a modified capitalization-weighted index designed as a benchmark for U.S. traded natural resource-related stocks. The natural resource sector includes mining, energy, paper and forest products, and plantation-owning companies.
| | | | |
| mainstayinvestments.com | | | M-3 | |
MainStay VP Balanced Portfolio
Investment and Performance Comparison1 (Unaudited)
Performance data quoted represents past performance. Past performance is no guarantee of future results. Because of market volatility, current performance may be lower or higher than the figures shown. Investment return and principal value will fluctuate, and as a result, when shares are redeemed, they may be worth more or less than their original cost. The performance table and graph do not reflect any deduction of sales charges, mortality and expense charges, contract charges or administrative charges. Please refer to the Performance Summary appropriate for your policy. For performance information current to the most recent month-end, please call 800-598-2019 or visit www.newyorklife.com.
Average Annual Total Returns for the Period Ended December 31, 2013
| | | | | | | | | | | | | | | | |
| Class | | One Year | | | Five Years | | | Since Inception (5/2/05) | | | Gross Expense Ratio2 | |
| Initial Class Shares | | | 21.87 | % | | | 14.50 | % | | | 6.88 | % | | | 0.79 | % |
| Service Class Shares | | | 21.57 | | | | 14.21 | | | | 6.60 | | | | 1.04 | |
| | | | | | | | | | | | |
| Benchmark Performance | | One
Year | | | Five
Years | | | Since Inception
(5/2/05) | |
Russell Midcap® Value Index3 | | | 33.46 | % | | | 21.16 | % | | | 9.45 | % |
Balanced Composite Index3 | | | 18.63 | | | | 14.54 | | | | 7.83 | |
Bank of America Merrill Lynch 1-10 Year U.S. Corporate & Government Index3 | | | –1.04 | | | | 4.13 | | | | 4.33 | |
Average Lipper Variable Products Mixed-Asset Target Allocation Growth Portfolio4 | | | 19.36 | | | | 13.98 | | | | 6.87 | |
| 1. | Performance figures reflect certain fee waivers and/or expense limitations, without which total returns may have been different. For information on current fee waivers and/or expense limitations, please refer to the notes to the financial statements. |
| 2. | The gross expense ratios presented reflect the Portfolio’s “Total Annual Portfolio Operating Expenses” from the most recent Prospectus and may differ from other expense ratios disclosed in this report. |
| 3. | Please refer to pages M-2 and M-3 for additional explanations and disclosure regarding the Portfolios, their benchmark indices and other indices mentioned in the reports. |
| 4. | The Average Lipper Variable Products Mixed-Asset Target Allocation Growth Portfolio is representative of portfolios that, by portfolio practice, maintain a mix of between 60%-80% equity securities, with the remainder invested in bonds, cash, and cash equivalents. Lipper Inc. is an independent monitor of fund performance. Results are based on total returns with all dividend and capital gain distributions reinvested. |
| | |
| M-4 | | MainStay VP Balanced Portfolio |
Cost in Dollars of a $1,000 Investment in MainStay VP Balanced Portfolio (Unaudited)
The example below is intended to describe the fees and expenses borne by shareholders during the six-month period from July 1, 2013, to December 31, 2013, and the impact of those costs on your investment.
Example
As a shareholder of the Portfolio, you incur two types of costs: (1) transaction costs, including exchange fees and sales charges (loads) on purchases (as applicable), and (2) ongoing costs, including management fees, distribution and/or service (12b-1) fees, and other Portfolio expenses (as applicable). This example is intended to help you understand your ongoing costs (in dollars) of investing in the Portfolio and to compare these costs with the ongoing costs of investing in other Portfolios. The example is based on an investment of $1,000 made at the beginning of the six-month period and held for the entire period from July 1, 2013, to December 31, 2013. Shares are only sold in connection with variable life and annuity contracts and the example does not reflect any contract level or transactional fees or expenses. If these costs had been included, your costs would have been higher.
This example illustrates your Portfolio’s ongoing costs in two ways:
Actual Expenses
The second and third data columns in the table below provide information about actual account values and actual expenses. You may use the information in these columns, together with the amount you invested, to estimate the expenses that you paid during the six months ended
December 31, 2013. Simply divide your account value by $1,000 (for example, an $8,600 account value divided by $1,000 = 8.6), then multiply the result by the number under the heading entitled ‘‘Expenses Paid During Period’’ to estimate the expenses you paid on your account during this period.
Hypothetical Example for Comparison Purposes
The fourth and fifth data columns in the table below provide information about hypothetical account values and hypothetical expenses based on the Portfolio’s actual expense ratio and an assumed rate of return of 5% per year before expenses, which is not the Portfolio’s actual return. The hypothetical account values and expenses may not be used to estimate the actual ending account balances or expenses you paid for the six-month period shown. You may use this information to compare the ongoing costs of investing in the Portfolio with the ongoing costs of investing in other Portfolios. To do so, compare this 5% hypothetical example with the 5% hypothetical examples that appear in the shareholder reports of the other Portfolios.
Please note that the expenses shown in the table are meant to highlight your ongoing costs only and do not reflect any transactional costs, such as exchange fees or sales charges (loads). Therefore, the fourth and fifth data columns of the table are useful in comparing ongoing costs only and will not help you determine the relative total costs of owning different funds. In addition, if these transactional costs were included, your costs would have been higher.
| | | | | | | | | | | | | | | | | | | | |
| | | | | | | | | | | | | | | | |
| Share Class | | Beginning
Account
Value
7/1/13 | | | Ending Account
Value (Based
on Actual
Returns and
Expenses)
12/31/13 | | | Expenses
Paid
During
Period1 | | | Ending Account
Value (Based
on Hypothetical
5% Annualized
Return and
Actual Expenses)
12/31/13 | | | Expenses
Paid
During
Period1 | |
| | | | | |
| Initial Class Shares | | $ | 1,000.00 | | | $ | 1,107.90 | | | $ | 4.04 | | | $ | 1,021.40 | | | $ | 3.87 | |
| | | | | |
| Service Class Shares | | $ | 1,000.00 | | | $ | 1,106.50 | | | $ | 5.42 | | | $ | 1,020.10 | | | $ | 5.19 | |
| 1. | Expenses are equal to the Portfolio’s annualized expense ratio of each class (0.76% for Initial Class and 1.02% for Service Class) multiplied by the average account value over the period, divided by 365 and multiplied by 184 (to reflect the six-month period). The table above represents the actual expenses incurred during the six-month period. |
| | | | |
| mainstayinvestments.com | | | M-5 | |
Portfolio Composition as of December 31, 2013 (Unaudited)
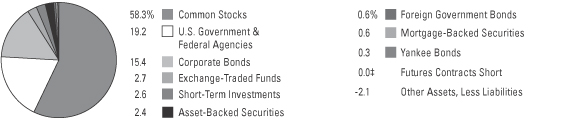
See Portfolio of Investments beginning on page M-11 for specific holdings within these categories.
| ‡ | Less than one-tenth of a percent. |
Top Ten Holdings or Issuers Held as of December 31, 2013 (excluding short-term investments) (Unaudited)
| 1. | United States Treasury Notes, 0.25%–2.50%, due 2/28/15–8/15/23 |
| 2. | S&P Midcap 400 Index–Midcap SPDR Trust Series 1 |
| 3. | Federal National Mortgage Association,
0.375%–2.75%, due 3/13/14–5/21/18 |
| 4. | iShares Intermediate Credit Bond Fund |
| 5. | Federal Home Loan Mortgage Corporation,
0.875%–1.75%, due 9/10/15-10/2/19 |
| 8. | Ford Motor Credit Co. LLC, 3.00%–4.375%, due 6/12/17–8/6/23 |
| | |
| M-6 | | MainStay VP Balanced Portfolio |
Portfolio Management Discussion and Analysis (Unaudited)
Answers to the questions reflect the views of Jae S. Yoon, CFA, Thomas J. Girard, Donald F. Serek, CFA, and George S. Cherpelis of New York Life Investments,1 the Portfolio’s Manager, and Andrew Ver Planck, CFA, of Cornerstone Capital Management Holdings LLC (“Cornerstone Holdings”), the Portfolio’s Subadvisor.
How did MainStay VP Balanced Portfolio perform relative to its benchmark and peers for the 12 months ended December 31, 2013?
For the 12 months ended December 31, 2013, MainStay VP Balanced Portfolio returned 21.87% for Initial Class shares and 21.57% for Service Class shares. Over the same period, both share classes underperformed the 33.46% return of the Russell Midcap® Value Index,2 which is the Portfolio’s broad-based securities-market index. For the 12 months ended December 31, 2013, both share classes outperformed the 18.63% return of the Balanced Composite Index,2 which is a secondary benchmark of the Portfolio, and the –1.04% return of the Bank of America Merrill Lynch 1–10 Year U.S. Corporate & Government Index,2 which is an additional benchmark of the Portfolio. Both share classes outperformed the 19.36% return of the average Lipper2 Variable Products Mixed-Asset Target Allocation Growth Portfolio for the 12 months ended December 31, 2013.
What factors affected the relative performance in the equity portion of the Portfolio during the reporting period?
The equity portion of the Portfolio outperformed the Russell Midcap® Value Index during the reporting period. The underlying quantitative model worked well, with valuation factors based on cash flow and revenue making strong contributions to the model’s performance. (Contributions take weightings and total returns into account.) The model was successful in identifying both winners and losers, but it was particularly effective in identifying stocks that would outperform the Russell Midcap® Value Index, which helped translate the model’s performance to the long-only performance of the equity portion of the Portfolio.
During the reporting period, which sectors were the strongest contributors to relative performance in the equity portion of the Portfolio and which sectors were particularly weak?
In the equity portion of the Portfolio, the financials, industrials and utilities sectors were the strongest positive contributors to performance relative to the Russell Midcap® Value Index. In financials, the Portfolio benefited by avoiding real estate investment trusts
(REITs) and favoring insurance stocks. In industrials, the Portfolio’s overweight position in the transportation industry, including airlines, helped relative performance. An underweight position in the utilities sector, which significantly trailed the Russell Midcap® Value Index, also contributed positively to the Portfolio’s relative performance.
In the equity portion of the Portfolio, the weakest contributions to relative performance came from the telecommunication services, consumer discretionary and energy sectors. Within telecommunication services, stock selection within wireless telecommunication services was weak. Stock selection in the consumer discretionary sector was especially poor among apparel retailers, although the negative effects were partially offset by an overweight position in the sector. Unfavorable stock selection in the energy sector, particularly among oil and gas exploration companies, also hurt performance relative to the Russell Midcap® Value Index.
During the reporting period, which individual stocks made the strongest contributions to the Portfolio’s absolute performance and which stocks detracted the most?
In the equity portion of the Portfolio, semiconductor devices company Micron Technology, cardiovascular device maker Boston Scientific and hard drive manufacturer Western Digital made the strongest positive contributions to the Portfolio’s absolute performance. The Portfolio held a substantial position in Micron Technology because the stock has a large weight in the benchmark and our model showed that the stock’s alpha potential (or ability to outperform the benchmark) was high. The stock returned an impressive 243% in 2013, making it the highest contributor to absolute performance. Boston Scientific, which was also a heavily weighted stock because of its substantial weight in the Russell Midcap® Value Index, returned 110% during the reporting period. Western Digital appreciated more than 100% in 2013.
The stocks that detracted the most from absolute performance in the equity portion of the Portfolio were metals & mining company Newmont Mining, electronic manufacturing service provider Jabil Circuits and specialty retailer Abercrombie & Fitch.
| 1. | “New York Life Investments” is a service mark used by New York Life Investment Management Holdings LLC and its subsidiary New York Life Investment Management LLC. |
| 2. | Please refer to pages M-2 and M-3 for additional explanations and disclosure regarding the Portfolios, their benchmark indices and service providers mentioned in the reports. |
| | | | |
| mainstayinvestments.com | | | M-7 | |
Newmont Mining declined as the price of gold collapsed in 2013. Jabil’s shares dropped after the company missed earnings estimates amid slowing demand for Apple products. Abercrombie struggled to meet earnings expectations in the crowded—and often fickle—retailers-to-teens space.
Did the equity portion of the Portfolio make any significant purchases or sales during the reporting period?
In February 2013, the equity portion of the Portfolio started purchasing shares of Xerox and, by the end of the reporting period, increased the position to as overweight as our model would allow. The stock’s return potential increased on the basis of attractive readings for valuation, sentiment and momentum. The equity portion of the Portfolio started building positions in Chesapeake Energy in July 2013, on the basis of improving valuation and price trend.
The equity portion of the Portfolio sold Symantec, a software and infrastructure company, during 2013, completely exiting the position in September. Despite attractive valuation, the stock’s momentum and sentiment scores were too weak for our model. We reduced the Portfolio’s equity position in oil refiner Marathon Petroleum during the reporting period as a risk control measure when the stock was removed from the benchmark during Russell’s annual index reconstitution.
How did sector weightings in the equity portion of the Portfolio change during the reporting period?
Information technology saw the largest increase in sector weighting relative to the Russell Midcap® Value Index, moving from an underweight position to one that was modestly overweight as the equity portion of the Portfolio purchased stocks in the computer storage and semiconductor industries. In the energy sector, purchases in oil refiners and oil and gas exploration companies caused the equity portion of the Portfolio to shift from a neutral position relative to the benchmark to an overweight position.
The health care sector saw the most substantial decrease in relative sector weightings, moving from a significant overweight to a modestly overweight position as we trimmed health care equipment and life sciences stocks. Consumer staples exposure also
went from an overweight to a modestly overweight position, as the equity portion of the Portfolio disposed of some packaged foods and tobacco stocks.
How was the equity portion of the Portfolio positioned at the end of the reporting period?
As of December 31, 2013, the equity portion of the Portfolio was most significantly overweight relative to the Russell Midcap® Value Index in consumer discretionary and energy. As of the same date, the equity portion of the Portfolio was most substantially underweight relative to the Index in the financials sector, followed by utilities.
What factors affected the relative performance of the fixed-income portion of the Portfolio during the reporting period?
Throughout the reporting period, the fixed-income portion of the Portfolio held overweight positions relative to the Bank of America Merrill Lynch 1–10 Year U.S. Corporate & Government Index in corporate bonds, U.S. government agencies, asset-backed securities and commercial mortgage-backed securities. The corporate sector was the strongest-performing fixed-income sector during the reporting period. Our overweight position in U.S. government agencies also gradually added to performance. The fixed-income portion of the Portfolio started the reporting period with an overweight position in mortgage-backed securities. Rising interest rates and expectations that the Federal Reserve would taper its open-market bond purchases left the mortgage-backed securities sector vulnerable to spread3 widening. This prompted us to reduce the Portfolio’s mortgage-backed securities exposure to neutral during the end of the first half of 2013. Our overweight positioning in the mortgage-backed securities sector during this time frame detracted from performance. During the second half of the year, the positive excess return of the fixed-income portion of the Portfolio in relation to the Bank of America Merrill Lynch 1–10 Year U.S. Corporate & Government Index was driven by the overweight position in U.S. corporate bonds, particularly by holdings in the financial and industrial subsectors.
| 3. | The terms “spread” and “yield spread” may refer to the difference in yield between a security or type of security and comparable U.S. Treasury issues. The terms may also refer to the difference in yield between two specific securities or types of securities at a given time. The term “spread assets” refers to assets that typically trade at a spread to U.S. Treasury securities. |
| | |
| M-8 | | MainStay VP Balanced Portfolio |
What was the duration strategy of the fixed-income portion of the Portfolio during the reporting period?
The duration of the fixed-income portion of the Portfolio varied over the course of the reporting period. During the first half of the reporting period, we held duration close to that of the Bank of America Merrill Lynch 1–10 Year U.S. Corporate & Government Index. In the latter portion of the first half, the duration was positioned to be slightly shorter than the Index. The fixed-income portion of the Portfolio maintained this position throughout the second half of the reporting period. This duration positioning was accretive to performance during the reporting period.
What specific factors, risks, or market forces prompted significant decisions for the fixed-income portion of the Portfolio during the reporting period?
There were four periods where specific factors, risks and market forces prompted asset allocation decisions for the fixed-income portion of the Portfolio. During the middle of the first half of 2013, our expectation that the Japanese quantitative easing program would be beneficial for mortgage-backed securities led us to add an overweight position to that sector. Toward the end of the second quarter, however, our expectation that the Federal Reserve might begin tapering its open-market bond purchases toward the end of 2013 led us to reduce our overweight position in mortgage-backed securities. As the end of the first half neared, lackluster economic growth—along with continuing suggestions that the Federal Reserve might begin tapering its asset purchases—caused spread assets to underperform. We used this opportunity to add to our overweight position in the corporate sector. This allocation decision helped the performance of the fixed-income portion of the Portfolio. The last instance occurred in the fourth quarter of 2013 when we modestly reduced our overweight position in the corporate sector in an effort to mitigate credit risk in the face of tightening valuations. The reduction occurred primarily in the financial and industrial subsectors.
During the reporting period, which market segments were the strongest positive contributors to the Portfolio’s performance and which market segments were particularly weak?
During the reporting period, an overweight position in the corporate bond sector made the strongest positive contribution to the performance of the fixed-income portion of the Portfolio. Within the corporate sector, overweight positions in the financial and industrial subsectors were the main drivers of outperformance relative to the Bank of America Merrill Lynch 1–10 Year U.S. Corporate & Government Index. Positioning in the mortgage-backed securities and asset-backed securities sectors during the reporting period adversely affected the performance of the fixed-income portion of the Portfolio.
Did the fixed-income portion of the Portfolio make any significant purchases or sales during the reporting period?
We made purchases and sales throughout the reporting period, as previously described, when the asset allocation of the fixed-income portion of the Portfolio was modified. The purpose of these purchases and sales, in the aggregate, was to adjust positions in spread assets.
How did sector weightings change in the fixed-income portion of the Portfolio during the reporting period?
The fixed-income portion of the Portfolio held overweight positions relative to the Bank of America Merrill Lynch 1–10 Year U.S. Corporate & Government Index in the financial, industrial and utility subsectors of the corporate bond sector. These overweight positions were maintained during the first half of the reporting period. During the second quarter, these subsector weightings were increased, as we sought to take advantage of attractive valuations. During the fourth quarter, the financial and industrial subsectors were modestly decreased in an effort to reduce the Portfolio’s spread-asset risk. During the first half of the reporting period we added to an already overweight position in the asset-backed securities sector.
| | | | |
| mainstayinvestments.com | | | M-9 | |
How was the fixed-income portion of the Portfolio positioned at the end of the reporting period?
As of December 31, 2013, the fixed-income portion of the Portfolio held overweight allocations to spread assets that were offset by an underweight position in U.S. Treasury securities. The largest overweight allocation within spread assets was in the corporate bond sector. As of December 31, 2013, the duration of the fixed-income portion of the Portfolio was slightly shorter than the duration of the Bank of America Merrill Lynch 1–10 Year U.S. Corporate & Government Index.
The opinions expressed are those of the portfolio managers as of the date of this report and are subject to change. There is no guarantee that any forecasts made will come to pass. This material does not constitute investment advice and is not intended as an endorsement of any specific investment.
Not all MainStay VP Portfolios and/or share classes are available under all policies.
| | |
| M-10 | | MainStay VP Balanced Portfolio |
Portfolio of Investments December 31, 2013
| | | | | | | | |
| | | Principal
Amount | | | Value | |
Long-Term Bonds 38.5%† Asset-Backed Securities 2.4% | |
Auto Floor Plan 0.3% | |
CNH Wholesale Master Note Trust
Series 2013-2A, Class A
0.767%, due 8/15/19 (a)(b) | | $ | 375,000 | | | $ | 375,494 | |
Ford Credit Floorplan Master Owner Trust A
Series 2013-5, Class A2
0.637%, due 9/15/18 (a) | | | 275,000 | | | | 275,674 | |
Series 2013-4, Class A2
0.717%, due 6/15/20 (a) | | | 150,000 | | | | 150,243 | |
Navistar Financial Dealer Note Master Trust
Series 2013-2, Class A
0.845%, due 9/25/18 (a)(b) | | | 175,000 | | | | 175,704 | |
| | | | | | | | |
| | | | | | | 977,115 | |
| | | | | | | | |
Automobile 0.2% | |
Chesapeake Funding LLC
Series 2013-1A, Class A
0.618%, due 1/7/25 (a)(b) | | | 200,000 | | | | 199,518 | |
Huntington Auto Trust
Series 2012-2, Class A3
0.51%, due 4/17/17 | | | 200,000 | | | | 199,584 | |
| | | | | | | | |
| | | | | | | 399,102 | |
| | | | | | | | |
Credit Cards 0.1% | |
American Express Issuance Trust II
Series 2013-2, Class A
0.597%, due 8/15/19 (a) | | | 125,000 | | | | 125,354 | |
Citibank Credit Card Issuance Trust
Series 2013-A7, Class A7
0.60%, due 9/10/20 (a) | | | 150,000 | | | | 150,265 | |
Discover Card Master Trust
Series 2012-A1, Class A1
0.81%, due 8/15/17 | | | 86,000 | | | | 86,301 | |
| | | | | | | | |
| | | | | | | 361,920 | |
| | | | | | | | |
Other ABS 1.8% | |
Apidos CDO
Series 2013-14A, Class A
1.394%, due 4/15/25 (a)(b)(c) | | | 475,000 | | | | 467,875 | |
Ares CLO, Ltd.
2013-2A, Class A1
1.501%, due 7/28/25 (a)(b)(c) | | | 450,000 | | | | 442,800 | |
Babson CLO, Ltd.
Series 2013-IA, Class A
1.342%, due 4/20/25 (a)(b)(c) | | | 450,000 | | | | 441,900 | |
Ballyrock CDO, Ltd.
Series 2013-1A, Class A
1.417%, due 5/20/25 (a)(b) | | | 350,000 | | | | 346,010 | |
| | | | | | | | |
| | | Principal
Amount | | | Value | |
Other ABS (continued) | |
Carlyle Global Market Strategies
Series 2013-3A, Class A1A
1.39%, due 7/15/25 (a)(b)(c) | | $ | 250,000 | | | $ | 245,968 | |
Series 2013-2A, Class A1
1.396%, due 4/18/25 (a)(b) | | | 250,000 | | | | 245,245 | |
Cent CLO, L.P.
Series 2013-18A, Class A
1.366%, due 7/23/25 (a)(b)(c) | | | 375,000 | | | | 368,906 | |
CNH Equipment Trust
Series 2012-C, Class A3
0.57%, due 12/15/17 | | | 200,000 | | | | 199,774 | |
Dryden Senior Loan Fund
Series 2013-26A, Class A
1.344%, due 7/15/25 (a)(b) | | | 280,000 | | | | 274,030 | |
Jamestown CLO, Ltd.
Series 2013-3A, Class A1A
1.693%, due 1/15/26 (a)(b)(c) | | | 450,000 | | | | 446,490 | |
Nomad CLO, Ltd.
Series 2013-1A, Class A1
1.444%, due 1/15/25 (a)(b) | | | 275,000 | | | | 270,707 | |
Octagon Investment Partners XVII, Ltd.
Series 2013-1A, Class A1
1.55%, due 10/25/25 (a)(b)(c) | | | 450,000 | | | | 446,625 | |
OHA Loan Funding, Ltd.
Series 2013-1A, Class A
1.528%, due 7/23/25 (a)(b) | | | 450,000 | | | | 445,131 | |
Race Point VIII CLO, Ltd.
Series 2013-8A, Class A
1.487%, due 2/20/25 (a)(b) | | | 270,000 | | | | 268,229 | |
Sheridan Square CLO, Ltd.
Series 2013-1A, Class A2
1.414%, due 4/15/25 (a)(b) | | | 275,000 | | | | 272,635 | |
| | | | | | | | |
| | | | | | | 5,182,325 | |
| | | | | | | | |
Total Asset-Backed Securities
(Cost $6,979,510) | | | | | | | 6,920,462 | |
| | | | | | | | |
|
| Corporate Bonds 15.4% | |
Aerospace & Defense 0.2% | |
BAE Systems PLC
3.50%, due 10/11/16 (b) | | | 100,000 | | | | 104,535 | |
General Dynamics Corp.
2.25%, due 7/15/16 | | | 50,000 | | | | 51,541 | |
Northrop Grumman Corp.
3.25%, due 8/1/23 | | | 175,000 | | | | 163,232 | |
United Technologies Corp.
1.80%, due 6/1/17 | | | 300,000 | | | | 304,624 | |
| | | | | | | | |
| | | | | | | 623,932 | |
| | | | | | | | |
| † | Percentages indicated are based on Portfolio net assets. |
| ¨ | | Among the Portfolio’s 10 largest holdings or issuers held, as of December 31, 2013, excluding short-term investments. May be subject to change daily. |
| | | | | | |
The notes to the financial statements are an integral part of,
and should be read in conjunction with, the financial statements. | | mainstayinvestments.com | | | M-11 | |
Portfolio of Investments December 31, 2013 (continued)
| | | | | | | | |
| | | Principal
Amount | | | Value | |
| Corporate Bonds (continued) | |
Auto Manufacturers 0.2% | |
Daimler Finance North America LLC
2.375%, due 8/1/18 (b) | | $ | 150,000 | | | $ | 149,668 | |
3.875%, due 9/15/21 (b) | | | 200,000 | | | | 201,840 | |
Volkswagen International Finance N.V.
1.625%, due 3/22/15 (b) | | | 100,000 | | | | 101,129 | |
| | | | | | | | |
| | | | | | | 452,637 | |
| | | | | | | | |
Banks 5.3% | |
Abbey National Treasury Services PLC
3.05%, due 8/23/18 | | | 575,000 | | | | 590,830 | |
¨Bank of America Corp.
2.00%, due 1/11/18 | | | 250,000 | | | | 249,557 | |
2.60%, due 1/15/19 | | | 325,000 | | | | 326,435 | |
4.10%, due 7/24/23 | | | 650,000 | | | | 652,758 | |
5.65%, due 5/1/18 | | | 375,000 | | | | 426,851 | |
BB&T Corp.
1.103%, due 6/15/18 (a) | | | 275,000 | | | | 276,929 | |
1.45%, due 1/12/18 | | | 100,000 | | | | 97,367 | |
Capital One Financial Corp.
1.00%, due 11/6/15 | | | 250,000 | | | | 249,891 | |
2.15%, due 3/23/15 | | | 275,000 | | | | 279,560 | |
3.50%, due 6/15/23 | | | 150,000 | | | | 140,806 | |
¨Citigroup, Inc.
3.375%, due 3/1/23 | | | 75,000 | | | | 71,289 | |
3.50%, due 5/15/23 | | | 650,000 | | | | 605,664 | |
4.587%, due 12/15/15 | | | 160,000 | | | | 170,978 | |
5.375%, due 8/9/20 | | | 250,000 | | | | 284,410 | |
6.00%, due 8/15/17 | | | 100,000 | | | | 113,976 | |
6.01%, due 1/15/15 | | | 17,000 | | | | 17,902 | |
Commonwealth Bank of Australia
0.745%, due 9/20/16 (a)(b) | | | 300,000 | | | | 300,728 | |
Cooperatieve Centrale Raiffeisen-Boerenleenbank B.A.
3.375%, due 1/19/17 | | | 200,000 | | | | 210,578 | |
Credit Agricole S.A.
1.625%, due 4/15/16 (b) | | | 250,000 | | | | 251,541 | |
Goldman Sachs Group, Inc. (The)
2.375%, due 1/22/18 | | | 600,000 | | | | 602,281 | |
3.625%, due 2/7/16 | | | 75,000 | | | | 78,711 | |
5.375%, due 3/15/20 | | | 125,000 | | | | 139,016 | |
6.00%, due 6/15/20 | | | 300,000 | | | | 343,973 | |
HSBC Bank PLC
1.50%, due 5/15/18 (b) | | | 400,000 | | | | 390,588 | |
4.125%, due 8/12/20 (b) | | | 550,000 | | | | 581,949 | |
HSBC USA, Inc.
1.128%, due 9/24/18 (a) | | | 100,000 | | | | 100,139 | |
Huntington Bancshares, Inc.
2.60%, due 8/2/18 | | | 650,000 | | | | 650,380 | |
ING Bank N.V.
5.80%, due 9/25/23 (b) | | | 450,000 | | | | 470,517 | |
| | | | | | | | |
| | | Principal
Amount | | | Value | |
Banks (continued) | |
JPMorgan Chase & Co.
3.375%, due 5/1/23 | | $ | 450,000 | | | $ | 419,400 | |
4.50%, due 1/24/22 | | | 250,000 | | | | 264,433 | |
Korea Development Bank (The)
3.875%, due 5/4/17 | | | 200,000 | | | | 210,806 | |
Lloyds Bank PLC
2.30%, due 11/27/18 | | | 200,000 | | | | 199,481 | |
¨Morgan Stanley
4.10%, due 5/22/23 | | | 575,000 | | | | 556,457 | |
4.875%, due 11/1/22 | | | 300,000 | | | | 307,098 | |
5.50%, due 1/26/20 | | | 600,000 | | | | 673,543 | |
Royal Bank of Scotland Group PLC
2.55%, due 9/18/15 | | | 550,000 | | | | 562,516 | |
Santander UK PLC
5.00%, due 11/7/23 (b) | | | 850,000 | | | | 853,162 | |
Skandinaviska Enskilda Banken AB
1.75%, due 3/19/18 (b) | | | 400,000 | | | | 391,850 | |
Societe Generale S.A.
1.327%, due 10/1/18 (a) | | | 275,000 | | | | 276,579 | |
2.75%, due 10/12/17 | | | 250,000 | | | | 257,675 | |
Sumitomo Mitsui Trust Bank, Ltd.
1.024%, due 9/16/16 (a)(b) | | | 200,000 | | | | 200,963 | |
SunTrust Banks, Inc.
2.35%, due 11/1/18 | | | 200,000 | | | | 198,940 | |
Swedbank AB
1.75%, due 3/12/18 (b) | | | 600,000 | | | | 589,516 | |
Union Bank N.A.
0.996%, due 9/26/16 (a) | | | 250,000 | | | | 252,233 | |
Wells Fargo & Co.
2.15%, due 1/15/19 | | | 425,000 | | | | 423,669 | |
4.125%, due 8/15/23 | | | 225,000 | | | | 221,816 | |
Westpac Banking Corp.
1.125%, due 9/25/15 | | | 100,000 | | | | 101,084 | |
| | | | | | | | |
| | | | | | | 15,636,825 | |
| | | | | | | | |
Beverages 0.2% | | | | | |
Anheuser-Busch InBev Worldwide, Inc.
1.375%, due 7/15/17 | | | 250,000 | | | | 249,475 | |
4.375%, due 2/15/21 | | | 75,000 | | | | 80,193 | |
Diageo Capital PLC
1.50%, due 5/11/17 | | | 100,000 | | | | 99,784 | |
SABMiller Holdings, Inc.
2.45%, due 1/15/17 (b) | | | 250,000 | | | | 255,997 | |
| | | | | | | | |
| | | | | | | 685,449 | |
| | | | | | | | |
Building Materials 0.0%‡ | | | | | |
CRH America, Inc.
4.125%, due 1/15/16 | | | 100,000 | | | | 105,517 | |
| | | | | | | | |
| |
Chemicals 0.3% | | | | | |
Dow Chemical Co. (The)
5.70%, due 5/15/18 | | | 44,000 | | | | 50,306 | |
| | | | |
| M-12 | | MainStay VP Balanced Portfolio | | The notes to the financial statements are an integral part of,
and should be read in conjunction with, the financial statements. |
| | | | | | | | |
| | | Principal
Amount | | | Value | |
| Corporate Bonds (continued) | |
Chemicals (continued) | | | | | |
LYB International Finance B.V.
4.00%, due 7/15/23 | | $ | 400,000 | | | $ | 394,822 | |
NewMarket Corp.
4.10%, due 12/15/22 | | | 400,000 | | | | 381,052 | |
| | | | | | | | |
| | | | | | | 826,180 | |
| | | | | | | | |
Computers 0.2% | | | | | |
Hewlett-Packard Co.
2.35%, due 3/15/15 | | | 425,000 | | | | 431,651 | |
| | | | | | | | |
| |
Cosmetics & Personal Care 0.0%‡ | | | | | |
Procter & Gamble Co. (The)
1.45%, due 8/15/16 | | | 50,000 | | | | 50,730 | |
| | | | | | | | |
| |
Diversified Financial Services 0.3% | | | | | |
General Electric Capital Corp.
2.30%, due 4/27/17 | | | 350,000 | | | | 359,755 | |
5.50%, due 1/8/20 | | | 225,000 | | | | 257,662 | |
6.00%, due 8/7/19 | | | 225,000 | | | | 263,995 | |
| | | | | | | | |
| | | | | | | 881,412 | |
| | | | | | | | |
Electric 1.2% | | | | | |
Commonwealth Edison Co.
1.95%, due 9/1/16 | | | 100,000 | | | | 102,131 | |
Dayton Power & Light Co. (The)
1.875%, due 9/15/16 (b) | | | 150,000 | | | | 151,226 | |
Entergy Louisiana LLC
1.875%, due 12/15/14 | | | 25,000 | | | | 25,333 | |
3.30%, due 12/1/22 | | | 50,000 | | | | 47,017 | |
Entergy Mississippi, Inc.
3.10%, due 7/1/23 | | | 50,000 | | | | 46,452 | |
FirstEnergy Corp.
4.25%, due 3/15/23 | | | 275,000 | | | | 256,342 | |
GDF Suez
1.625%, due 10/10/17 (b) | | | 150,000 | | | | 148,484 | |
Great Plains Energy, Inc.
4.85%, due 6/1/21 | | | 280,000 | | | | 295,019 | |
5.292%, due 6/15/22 (d) | | | 45,000 | | | | 48,280 | |
Hydro-Quebec
2.00%, due 6/30/16 | | | 150,000 | | | | 154,020 | |
Kansas City Power & Light Co.
7.15%, due 4/1/19 | | | 250,000 | | | | 304,922 | |
NextEra Energy Capital Holdings, Inc.
1.20%, due 6/1/15 | | | 100,000 | | | | 100,512 | |
1.339%, due 9/1/15 | | | 550,000 | | | | 553,663 | |
Niagara Mohawk Power Corp.
2.721%, due 11/28/22 (b) | | | 100,000 | | | | 92,014 | |
NiSource Finance Corp.
4.45%, due 12/1/21 | | | 100,000 | | | | 101,325 | |
Pacific Gas & Electric Co.
3.85%, due 11/15/23 | | | 325,000 | | | | 323,251 | |
| | | | | | | | |
| | | Principal
Amount | | | Value | |
Electric (continued) | | | | | |
Pepco Holdings, Inc.
2.70%, due 10/1/15 | | $ | 100,000 | | | $ | 102,539 | |
PPL Capital Funding, Inc.
3.50%, due 12/1/22 | | | 100,000 | | | | 94,441 | |
4.20%, due 6/15/22 | | | 100,000 | | | | 99,817 | |
Progress Energy, Inc.
6.05%, due 3/15/14 | | | 250,000 | | | | 252,782 | |
Westar Energy, Inc.
6.00%, due 7/1/14 | | | 300,000 | | | | 308,252 | |
| | | | | | | | |
| | | | | | | 3,607,822 | |
| | | | | | | | |
Electronics 0.2% | | | | | |
Thermo Fisher Scientific, Inc.
2.40%, due 2/1/19 | | | 625,000 | | | | 619,182 | |
| | | | | | | | |
| |
Finance—Auto Loans 0.7% | | | | | |
American Honda Finance Corp.
0.744%, due 10/7/16 (a) | | | 100,000 | | | | 100,520 | |
2.125%, due 10/10/18 | | | 100,000 | | | | 99,589 | |
¨Ford Motor Credit Co. LLC
3.00%, due 6/12/17 | | | 900,000 | | | | 935,386 | |
4.375%, due 8/6/23 | | | 925,000 | | | | 929,957 | |
| | | | | | | | |
| | | | | | | 2,065,452 | |
| | | | | | | | |
Finance—Commercial 0.1% | | | | | |
Caterpillar Financial Services Corp.
2.05%, due 8/1/16 | | | 225,000 | | | | 230,971 | |
| | | | | | | | |
| |
Finance—Consumer Loans 0.1% | | | | | |
John Deere Capital Corp.
1.70%, due 1/15/20 | | | 250,000 | | | | 235,420 | |
2.80%, due 9/18/17 | | | 50,000 | | | | 52,343 | |
5.75%, due 9/10/18 | | | 75,000 | | | | 87,095 | |
| | | | | | | | |
| | | | | | | 374,858 | |
| | | | | | | | |
Finance—Credit Card 0.3% | | | | | |
American Express Co.
5.50%, due 9/12/16 | | | 250,000 | | | | 278,071 | |
Capital One Bank USA N.A.
2.15%, due 11/21/18 | | | 675,000 | | | | 671,389 | |
| | | | | | | | |
| | | | | | | 949,460 | |
| | | | | | | | |
Finance—Investment Banker/Broker 0.1% | | | | | |
BNP Paribas Home Loan Covered Bonds S.A.
2.20%, due 11/2/15 (b) | | | 175,000 | | | | 179,410 | |
| | | | | | | | |
| |
Finance—Other Services 0.1% | | | | | |
National Rural Utilities Cooperative Finance Corp.
1.90%, due 11/1/15 | | | 100,000 | | | | 102,389 | |
2.35%, due 6/15/20 | | | 175,000 | | | | 169,015 | |
| | | | | | | | |
| | | | | | | 271,404 | |
| | | | | | | | |
| | | | | | |
The notes to the financial statements are an integral part of,
and should be read in conjunction with, the financial statements. | | mainstayinvestments.com | | | M-13 | |
Portfolio of Investments December 31, 2013 (continued)
| | | | | | | | |
| | | Principal
Amount | | | Value | |
| Corporate Bonds (continued) | |
Food 0.4% | | | | | |
Ingredion, Inc.
1.80%, due 9/25/17 | | $ | 75,000 | | | $ | 73,099 | |
4.625%, due 11/1/20 | | | 250,000 | | | | 260,673 | |
Mondelez International, Inc.
4.125%, due 2/9/16 | | | 450,000 | | | | 477,071 | |
Safeway, Inc.
3.40%, due 12/1/16 | | | 250,000 | | | | 260,103 | |
| | | | | | | | |
| | | | | | | 1,070,946 | |
| | | | | | | | |
Gas 0.0%‡ | | | | | |
Sempra Energy
2.30%, due 4/1/17 | | | 75,000 | | | | 75,972 | |
| | | | | | | | |
| |
Hand & Machine Tools 0.0%‡ | | | | | |
Stanley Black & Decker, Inc.
3.40%, due 12/1/21 | | | 50,000 | | | | 49,127 | |
| | | | | | | | |
| |
Health Care—Products 0.0%‡ | | | | | |
Zimmer Holdings, Inc.
1.40%, due 11/30/14 | | | 100,000 | | | | 100,647 | |
| | | | | | | | |
| |
Insurance 1.0% | | | | | |
American International Group, Inc.
4.125%, due 2/15/24 | | | 400,000 | | | | 397,681 | |
Assurant, Inc.
2.50%, due 3/15/18 | | | 300,000 | | | | 293,116 | |
Five Corners Funding Trust
4.419%, due 11/15/23 (b) | | | 300,000 | | | | 295,717 | |
ING U.S., Inc.
2.90%, due 2/15/18 | | | 815,000 | | | | 833,570 | |
Markel Corp.
3.625%, due 3/30/23 | | | 275,000 | | | | 258,830 | |
MetLife, Inc.
1.756%, due 12/15/17 | | | 150,000 | | | | 148,409 | |
Metropolitan Life Global Funding I
5.125%, due 6/10/14 (b) | | | 225,000 | | | | 229,663 | |
Nationwide Financial Services, Inc.
5.375%, due 3/25/21 (b) | | | 100,000 | | | | 107,216 | |
Principal Financial Group, Inc.
8.875%, due 5/15/19 | | | 90,000 | | | | 115,068 | |
QBE Insurance Group, Ltd.
2.40%, due 5/1/18 (b) | | | 200,000 | | | | 192,140 | |
| | | | | | | | |
| | | | | | | 2,871,410 | |
| | | | | | | | |
Iron & Steel 0.1% | | | | | |
ArcelorMittal
4.25%, due 2/25/15 | | | 100,000 | | | | 102,750 | |
Carpenter Technology Corp.
4.45%, due 3/1/23 | | | 125,000 | | | | 119,937 | |
| | | | | | | | |
| | | Principal
Amount | | | Value | |
Iron & Steel (continued) | | | | | |
Reliance Steel & Aluminum Co.
4.50%, due 4/15/23 | | $ | 200,000 | | | $ | 196,184 | |
| | | | | | | | |
| | | | | | | 418,871 | |
| | | | | | | | |
Media 0.1% | | | | | |
COX Communications, Inc.
5.45%, due 12/15/14 | | | 64,000 | | | | 66,883 | |
DIRECTV Holdings LLC / DIRECTV Financing Co., Inc.
3.50%, due 3/1/16 | | | 75,000 | | | | 78,727 | |
Viacom, Inc.
1.25%, due 2/27/15 | | | 100,000 | | | | 100,498 | |
| | | | | | | | |
| | | | | | | 246,108 | |
| | | | | | | | |
Mining 0.6% | | | | | |
Barrick Gold Corp.
4.10%, due 5/1/23 | | | 725,000 | | | | 655,321 | |
BHP Billiton Finance USA, Ltd.
1.875%, due 11/21/16 | | | 150,000 | | | | 153,228 | |
Freeport-McMoRan Copper & Gold, Inc.
3.875%, due 3/15/23 | | | 350,000 | | | | 330,976 | |
Rio Tinto Finance USA PLC
1.084%, due 6/17/16 (a) | | | 250,000 | | | | 251,774 | |
Rio Tinto Finance USA, Ltd.
2.25%, due 9/20/16 | | | 275,000 | | | | 283,024 | |
3.50%, due 11/2/20 | | | 200,000 | | | | 204,194 | |
| | | | | | | | |
| | | | | | | 1,878,517 | |
| | | | | | | | |
Oil & Gas 0.5% | | | | | |
Anadarko Petroleum Corp.
5.95%, due 9/15/16 | | | 275,000 | | | | 306,368 | |
Apache Corp.
3.625%, due 2/1/21 | | | 150,000 | | | | 154,431 | |
BP Capital Markets PLC
1.846%, due 5/5/17 | | | 75,000 | | | | 75,753 | |
Petrobras International Finance Co.
2.875%, due 2/6/15 | | | 200,000 | | | | 203,000 | |
5.375%, due 1/27/21 | | | 500,000 | | | | 496,194 | |
Petroleos Mexicanos
3.50%, due 1/30/23 | | | 100,000 | | | | 91,625 | |
Plains Exploration & Production Co.
6.75%, due 2/1/22 | | | 100,000 | | | | 110,152 | |
Total Capital International S.A.
1.55%, due 6/28/17 | | | 100,000 | | | | 100,022 | |
| | | | | | | | |
| | | | | | | 1,537,545 | |
| | | | | | | | |
Oil & Gas Services 0.0%‡ | | | | | |
Cameron International Corp.
1.60%, due 4/30/15 | | | 50,000 | | | | 50,305 | |
| | | | | | | | |
| |
Packaging & Containers 0.3% | | | | | |
Bemis Co., Inc.
5.65%, due 8/1/14 | | | 215,000 | | | | 221,005 | |
| | | | |
| M-14 | | MainStay VP Balanced Portfolio | | The notes to the financial statements are an integral part of,
and should be read in conjunction with, the financial statements. |
| | | | | | | | |
| | | Principal
Amount | | | Value | |
| Corporate Bonds (continued) | |
Packaging & Containers (continued) | | | | | |
Packaging Corp. of America
4.50%, due 11/1/23 | | $ | 650,000 | | | $ | 651,699 | |
| | | | | | | | |
| | | | | | | 872,704 | |
| | | | | | | | |
Pharmaceuticals 0.3% | | | | | |
Mylan, Inc.
2.60%, due 6/24/18 (b) | | | 125,000 | | | | 125,072 | |
Novartis Securities Investment, Ltd.
5.125%, due 2/10/19 | | | 125,000 | | | | 141,546 | |
Sanofi
1.25%, due 4/10/18 | | | 175,000 | | | | 170,383 | |
4.00%, due 3/29/21 | | | 125,000 | | | | 130,952 | |
Teva Pharmaceutical Finance Co. B.V.
2.40%, due 11/10/16 | | | 175,000 | | | | 180,052 | |
| | | | | | | | |
| | | | | | | 748,005 | |
| | | | | | | | |
Pipelines 0.4% | | | | | |
Energy Transfer Partners, L.P.
4.15%, due 10/1/20 | | | 375,000 | | | | 380,468 | |
Enterprise Products Operating LLC
1.25%, due 8/13/15 | | | 100,000 | | | | 100,664 | |
Plains All American Pipeline, L.P. / PAA Finance Corp.
8.75%, due 5/1/19 | | | 200,000 | | | | 255,811 | |
Spectra Energy Partners, L.P.
2.95%, due 9/25/18 | | | 200,000 | | | | 202,725 | |
Texas Eastern Transmission, L.P.
2.80%, due 10/15/22 (b) | | | 175,000 | | | | 156,486 | |
| | | | | | | | |
| | | | | | | 1,096,154 | |
| | | | | | | | |
Real Estate 0.0%‡ | | | | | |
WEA Finance LLC / WT Finance Australia Property, Ltd.
5.75%, due 9/2/15 (b) | | | 100,000 | | | | 107,863 | |
| | | | | | | | |
| |
Real Estate Investment Trusts 1.1% | | | | | |
Brandywine Operating Partnership, L.P.
5.70%, due 5/1/17 | | | 500,000 | | | | 550,158 | |
CBL & Associates, L.P.
5.25%, due 12/1/23 | | | 700,000 | | | | 699,070 | |
DDR Corp.
4.75%, due 4/15/18 | | | 200,000 | | | | 215,748 | |
Hospitality Properties Trust
6.30%, due 6/15/16 | | | 170,000 | | | | 183,520 | |
Host Hotels & Resorts, L.P.
6.00%, due 10/1/21 | | | 150,000 | | | | 163,323 | |
Liberty Property, L.P.
4.40%, due 2/15/24 | | | 125,000 | | | | 122,738 | |
National Retail Properties, Inc.
6.25%, due 6/15/14 | | | 200,000 | | | | 204,670 | |
| | | | | | | | |
| | | Principal
Amount | | | Value | |
Real Estate Investment Trusts (continued) | | | | | |
ProLogis, L.P.
4.25%, due 8/15/23 | | $ | 550,000 | | | $ | 543,320 | |
6.625%, due 5/15/18 | | | 509,000 | | | | 594,497 | |
| | | | | | | | |
| | | | | | | 3,277,044 | |
| | | | | | | | |
Retail 0.1% | | | | | |
Home Depot, Inc. (The)
4.40%, due 4/1/21 | | | 125,000 | | | | 134,997 | |
| | | | | | | | |
| |
Semiconductors 0.1% | | | | | |
Samsung Electronics America, Inc.
1.75%, due 4/10/17 (b) | | | 200,000 | | | | 198,719 | |
| | | | | | | | |
| |
Software 0.1% | | | | | |
Fiserv, Inc.
4.75%, due 6/15/21 | | | 200,000 | | | | 203,691 | |
| | | | | | | | |
| |
Telecommunications 0.7% | | | | | |
AT&T, Inc.
2.375%, due 11/27/18 | | | 125,000 | | | | 125,107 | |
Orange S.A.
2.75%, due 9/14/16 | | | 200,000 | | | | 207,690 | |
Telefonica Emisiones SAU
5.134%, due 4/27/20 | | | 675,000 | | | | 717,092 | |
Verizon Communications, Inc.
2.00%, due 11/1/16 | | | 100,000 | | | | 102,036 | |
5.15%, due 9/15/23 | | | 750,000 | | | | 805,269 | |
Vodafone Group PLC
1.25%, due 9/26/17 | | | 100,000 | | | | 97,718 | |
| | | | | | | | |
| | | | | | | 2,054,912 | |
| | | | | | | | |
Textiles 0.0%‡ | | | | | |
Mohawk Industries, Inc.
3.85%, due 2/1/23 | | | 100,000 | | | | 95,000 | |
| | | | | | | | |
| |
Transportation 0.1% | | | | | |
Burlington Northern Santa Fe LLC
4.70%, due 10/1/19 | | | 125,000 | | | | 137,126 | |
| | | | | | | | |
Total Corporate Bonds
(Cost $44,969,893) | | | | | | | 45,218,555 | |
| | | | | | | | |
|
| Foreign Government Bonds 0.6% | |
Regional (State & Province) 0.2% | |
Province of Ontario
1.10%, due 10/25/17 | | | 425,000 | | | | 420,198 | |
Province of Quebec
3.50%, due 7/29/20 | | | 200,000 | | | | 207,620 | |
| | | | | | | | |
| | | | | | | 627,818 | |
| | | | | | | | |
| | | | | | |
The notes to the financial statements are an integral part of,
and should be read in conjunction with, the financial statements. | | mainstayinvestments.com | | | M-15 | |
Portfolio of Investments December 31, 2013 (continued)
| | | | | | | | |
| | | Principal
Amount | | | Value | |
| Foreign Government Bonds (continued) | |
Sovereign 0.4% | |
Brazilian Government International Bond
2.625%, due 1/5/23 | | $ | 200,000 | | | $ | 172,000 | |
Italy Government International Bond
4.75%, due 1/25/16 | | | 175,000 | | | | 186,217 | |
Poland Government International Bond
5.00%, due 3/23/22 | | | 50,000 | | | | 53,438 | |
Romanian Government International Bond
4.375%, due 8/22/23 (b) | | | 250,000 | | | | 241,250 | |
Russian Federation
3.50%, due 1/16/19 (b) | | | 400,000 | | | | 406,200 | |
Turkey Government International Bond
6.75%, due 4/3/18 | | | 100,000 | | | | 108,600 | |
| | | | | | | | |
| | | | | | | 1,167,705 | |
| | | | | | | | |
Total Foreign Government Bonds
(Cost $1,829,407) | | | | | | | 1,795,523 | |
| | | | | | | | |
|
| Mortgage-Backed Securities 0.6% | |
Commercial Mortgage Loans
(Collateralized Mortgage Obligations) 0.6% | |
Boca Hotel Portfolio Trust
Series 2013-BOCA, Class A
1.317%, due 8/15/26 (a)(b) | | | 310,992 | | | | 311,523 | |
Commercial Mortgage Pass Through Certificates
Series 2013-THL, Class A2
1.218%, due 6/8/30 (a)(b) | | | 300,000 | | | | 299,267 | |
JP Morgan Chase Commercial
Mortgage Securities Corp.
Series 2012-C6, Class A2
2.206%, due 5/15/45 | | | 100,000 | | | | 101,782 | |
Series 2006-CB15, Class A4
5.814%, due 6/12/43 (a) | | | 141,362 | | | | 152,510 | |
LB-UBS Commercial Mortgage Trust
Series 2006-C7, Class A3
5.347%, due 11/15/38 | | | 200,000 | | | | 219,592 | |
Morgan Stanley Bank of America
Merrill Lynch Trust
Series 2013-C13, Class A2
2.936%, due 11/15/46 (e) | | | 500,000 | | | | 507,767 | |
Morgan Stanley Capital I, Inc.
Series 2007-T25, Class A3
5.514%, due 11/12/49 (a) | | | 200,000 | | | | 221,028 | |
| | | | | | | | |
Total Mortgage-Backed Securities
(Cost $1,832,331) | | | | | | | 1,813,469 | |
| | | | | | | | |
| | | | | | | | |
| | | Principal
Amount | | | Value | |
| U.S. Government & Federal Agencies 19.2% | |
Federal Home Loan Bank 0.2% | |
1.30%, due 6/5/18 | | $ | 200,000 | | | $ | 194,956 | |
1.375%, due 5/28/14 | | | 300,000 | | | | 301,514 | |
| | | | | | | | |
| | | | | | | 496,470 | |
| | | | | | | | |
¨Federal Home Loan Mortgage Corporation 0.8% | |
0.875%, due 3/7/18 | | | 250,000 | | | | 242,847 | |
1.00%, due 9/27/17 | | | 75,000 | | | | 74,025 | |
1.00%, due 9/29/17 | | | 325,000 | | | | 321,193 | |
1.125%, due 5/25/18 | | | 225,000 | | | | 219,138 | |
1.20%, due 6/12/18 | | | 250,000 | | | | 245,498 | |
1.25%, due 10/2/19 | | | 300,000 | | | | 284,201 | |
1.75%, due 9/10/15 | | | 300,000 | | | | 306,995 | |
1.75%, due 5/30/19 | | | 725,000 | | | | 712,168 | |
| | | | | | | | |
| | | | | | | 2,406,065 | |
| | | | | | | | |
¨Federal National Mortgage Association 1.0% | |
0.375%, due 3/16/15 | | | 400,000 | | | | 400,643 | |
0.70%, due 9/6/16 | | | 175,000 | | | | 174,522 | |
0.875%, due 12/20/17 | | | 200,000 | | | | 195,818 | |
0.875%, due 5/21/18 | | | 250,000 | | | | 241,828 | |
1.00%, due 12/28/17 | | | 100,000 | | | | 97,711 | |
1.00%, due 2/15/18 | | | 275,000 | | | | 267,395 | |
1.125%, due 4/27/17 | | | 250,000 | | | | 250,973 | |
1.25%, due 1/30/17 | | | 710,000 | | | | 718,543 | |
1.375%, due 11/15/16 | | | 550,000 | | | | 559,229 | |
2.75%, due 3/13/14 | | | 100,000 | | | | 100,516 | |
| | | | | | | | |
| | | | | | | 3,007,178 | |
| | | | | | | | |
¨United States Treasury Notes 17.2% | |
0.25%, due 2/28/15 | | | 200,000 | | | | 200,125 | |
0.25%, due 10/31/15 | | | 3,200,000 | | | | 3,195,501 | |
0.25%, due 12/15/15 | | | 1,000,000 | | | | 997,773 | |
0.25%, due 12/31/15 | | | 6,000,000 | | | | 5,984,064 | |
0.25%, due 4/15/16 | | | 2,395,000 | | | | 2,382,278 | |
0.375%, due 1/15/16 | | | 325,000 | | | | 324,873 | |
0.375%, due 2/15/16 | | | 2,800,000 | | | | 2,797,374 | |
0.50%, due 6/15/16 | | | 1,825,000 | | | | 1,823,146 | |
0.50%, due 7/31/17 | | | 200,000 | | | | 195,797 | |
0.625%, due 7/15/16 | | | 725,000 | | | | 725,906 | |
0.625%, due 8/15/16 | | | 300,000 | | | | 300,070 | |
0.625%, due 10/15/16 | | | 3,000,000 | | | | 2,994,375 | |
0.625%, due 11/15/16 | | | 4,250,000 | | | | 4,237,050 | |
0.625%, due 12/15/16 | | | 3,000,000 | | | | 2,987,814 | |
0.75%, due 12/31/17 | | | 1,950,000 | | | | 1,906,733 | |
0.875%, due 9/15/16 | | | 2,765,000 | | | | 2,781,419 | |
1.25%, due 10/31/18 | | | 825,000 | | | | 808,823 | |
1.25%, due 11/30/18 | | | 315,000 | | | | 308,257 | |
1.375%, due 7/31/18 | | | 1,590,000 | | | | 1,575,715 | |
1.375%, due 9/30/18 | | | 2,300,000 | | | | 2,271,968 | |
1.50%, due 8/31/18 | | | 2,850,000 | | | | 2,835,528 | |
1.50%, due 12/31/18 | | | 1,200,000 | | | | 1,186,500 | |
| | | | |
| M-16 | | MainStay VP Balanced Portfolio | | The notes to the financial statements are an integral part of,
and should be read in conjunction with, the financial statements. |
| | | | | | | | |
| | | Principal
Amount | | | Value | |
| U.S. Government & Federal Agencies (continued) | |
United States Treasury Notes (continued) | |
1.75%, due 10/31/20 | | $ | 2,700,000 | | | $ | 2,590,312 | |
2.00%, due 7/31/20 | | | 1,500,000 | | | | 1,473,282 | |
2.00%, due 9/30/20 | | | 1,400,000 | | | | 1,368,500 | |
2.25%, due 7/31/18 | | | 1,575,000 | | | | 1,623,603 | |
2.50%, due 8/15/23 | | | 495,000 | | | | 475,354 | |
| | | | | | | | |
| | | | | | | 50,352,140 | |
| | | | | | | | |
Total U.S. Government & Federal Agencies
(Cost $56,490,598) | | | | | | | 56,261,853 | |
| | | | | | | | |
|
| Yankee Bonds 0.3% (f) | |
Banks 0.2% | |
Cooperatieve Centrale Raiffeisen-Boerenleenbank B.A.
4.625%, due 12/1/23 | | | 650,000 | | | | 654,562 | |
| | | | | | | | |
|
Transportation 0.1% | |
Canadian National Railway Co.
1.45%, due 12/15/16 | | | 125,000 | | | | 125,886 | |
| | | | | | | | |
Total Yankee Bonds
(Cost $772,358) | | | | | | | 780,448 | |
| | | | | | | | |
Total Long-Term Bonds
(Cost $112,874,097) | | | | | | | 112,790,310 | |
| | | | | | | | |
| | |
| | | | | | | | |
| | |
Shares | | | | |
| Common Stocks 58.3% | |
Aerospace & Defense 1.1% | |
Exelis, Inc. | | | 9,097 | | | | 173,389 | |
General Dynamics Corp. | | | 4,280 | | | | 408,954 | |
L-3 Communications Holdings, Inc. | | | 6,284 | | | | 671,508 | |
Northrop Grumman Corp. | | | 4,043 | | | | 463,368 | |
Raytheon Co. | | | 4,481 | | | | 406,427 | |
Spirit AeroSystems Holdings, Inc. Class A (g) | | | 24,428 | | | | 832,506 | |
United Technologies Corp. | | | 3,621 | | | | 412,070 | |
| | | | | | | | |
| | | | | | | 3,368,222 | |
| | | | | | | | |
Agriculture 0.7% | | | | | | | | |
Archer-Daniels-Midland Co. | | | 10,207 | | | | 442,984 | |
Bunge, Ltd. | | | 14,444 | | | | 1,185,997 | |
Reynolds American, Inc. | | | 7,092 | | | | 354,529 | |
| | | | | | | | |
| | | | | | | 1,983,510 | |
| | | | | | | | |
Airlines 1.0% | | | | | | | | |
Alaska Air Group, Inc. | | | 8,812 | | | | 646,536 | |
Delta Air Lines, Inc. | | | 43,057 | | | | 1,182,776 | |
Southwest Airlines Co. | | | 62,989 | | | | 1,186,713 | |
| | | | | | | | |
| | | | | | | 3,016,025 | |
| | | | | | | | |
| | | | | | | | |
| | |
Shares | | | Value | |
Apparel 0.2% | | | | | | | | |
Deckers Outdoor Corp. (g) | | | 8,737 | | | $ | 737,927 | |
| | | | | | | | |
| | |
Auto Manufacturers 0.6% | | | | | | | | |
Ford Motor Co. | | | 25,922 | | | | 399,977 | |
General Motors Co. (g) | | | 11,091 | | | | 453,289 | |
Oshkosh Corp. | | | 17,106 | | | | 861,800 | |
PACCAR, Inc. | | | 2,196 | | | | 129,937 | |
| | | | | | | | |
| | | | | | | 1,845,003 | |
| | | | | | | | |
Auto Parts & Equipment 0.5% | | | | | | | | |
Johnson Controls, Inc. | | | 8,911 | | | | 457,134 | |
Lear Corp. | | | 11,056 | | | | 895,205 | |
TRW Automotive Holdings Corp. (g) | | | 998 | | | | 74,241 | |
| | | | | | | | |
| | | | | | | 1,426,580 | |
| | | | | | | | |
Banks 3.7% | | | | | | | | |
¨Bank of America Corp. | | | 21,983 | | | | 342,275 | |
Bank of New York Mellon Corp. | | | 13,196 | | | | 461,068 | |
BB&T Corp. | | | 10,839 | | | | 404,511 | |
Capital One Financial Corp. | | | 6,069 | | | | 464,946 | |
CIT Group, Inc. | | | 21,762 | | | | 1,134,453 | |
¨Citigroup, Inc. | | | 7,644 | | | | 398,329 | |
Comerica, Inc. | | | 22,327 | | | | 1,061,426 | |
Fifth Third Bancorp | | | 69,979 | | | | 1,471,658 | |
First Citizens BancShares, Inc. Class A | | | 108 | | | | 24,044 | |
First Republic Bank | | | 1,979 | | | | 103,601 | |
Goldman Sachs Group, Inc. (The) | | | 1,981 | | | | 351,152 | |
JPMorgan Chase & Co. | | | 7,810 | | | | 456,729 | |
KeyCorp | | | 90,085 | | | | 1,208,941 | |
M&T Bank Corp. | | | 65 | | | | 7,567 | |
¨Morgan Stanley | | | 11,219 | | | | 351,828 | |
PNC Financial Services Group, Inc. | | | 5,881 | | | | 456,248 | |
Regions Financial Corp. | | | 544 | | | | 5,380 | |
State Street Corp. | | | 6,292 | | | | 461,770 | |
SunTrust Banks, Inc. | | | 25,776 | | | | 948,815 | |
U.S. Bancorp | | | 8,647 | | | | 349,339 | |
Wells Fargo & Co. | | | 7,690 | | | | 349,126 | |
| | | | | | | | |
| | | | | | | 10,813,206 | |
| | | | | | | | |
Chemicals 0.8% | | | | | | | | |
Air Products & Chemicals, Inc. | | | 3,121 | | | | 348,865 | |
CF Industries Holdings, Inc. | | | 2,999 | | | | 698,887 | |
Dow Chemical Co. (The) | | | 10,181 | | | | 452,037 | |
Mosaic Co. (The) | | | 7,749 | | | | 366,295 | |
PPG Industries, Inc. | | | 2,412 | | | | 457,460 | |
| | | | | | | | |
| | | | | | | 2,323,544 | |
| | | | | | | | |
Commercial Services 1.6% | | | | | | | | |
ADT Corp. (The) | | | 4,789 | | | | 193,811 | |
Apollo Education Group, Inc. (g) | | | 4,272 | | | | 116,711 | |
Booz Allen Hamilton Holding Corp. | | | 13,696 | | | | 262,278 | |
CoreLogic, Inc. (g) | | | 22,643 | | | | 804,506 | |
DeVry Education Group, Inc. | | | 12,269 | | | | 435,549 | |
| | | | | | |
The notes to the financial statements are an integral part of,
and should be read in conjunction with, the financial statements. | | mainstayinvestments.com | | | M-17 | |
Portfolio of Investments December 31, 2013 (continued)
| | | | | | | | |
| | |
Shares | | | Value | |
| Common Stocks (continued) | |
Commercial Services (continued) | | | | | | | | |
ManpowerGroup, Inc. | | | 11,374 | | | $ | 976,572 | |
R.R. Donnelley & Sons Co. | | | 39,124 | | | | 793,435 | |
Towers Watson & Co. Class A | | | 8,379 | | | | 1,069,244 | |
| | | | | | | | |
| | | | | | | 4,652,106 | |
| | | | | | | | |
Computers 2.4% | | | | | | | | |
Apple, Inc. | | | 820 | | | | 460,110 | |
Brocade Communications Systems, Inc. (g) | | | 93,154 | | | | 826,276 | |
Computer Sciences Corp. | | | 18,621 | | | | 1,040,542 | |
DST Systems, Inc. | | | 7,011 | | | | 636,178 | |
EMC Corp. | | | 16,511 | | | | 415,252 | |
Hewlett-Packard Co. | | | 15,940 | | | | 446,001 | |
Lexmark International, Inc. Class A | | | 20,802 | | | | 738,887 | |
SanDisk Corp. | | | 14,858 | | | | 1,048,083 | |
Western Digital Corp. | | | 17,640 | | | | 1,479,996 | |
| | | | | | | | |
| | | | | | | 7,091,325 | |
| | | | | | | | |
Cosmetics & Personal Care 0.1% | | | | | | | | |
Procter & Gamble Co. (The) | | | 4,227 | | | | 344,120 | |
| | | | | | | | |
| |
Diversified Financial Services 0.2% | | | | | |
Artisan Partners Asset Management, Inc. | | | 10,230 | | | | 666,894 | |
| | | | | | | | |
| | |
Electric 3.6% | | | | | | | | |
AES Corp. (The) | | | 71,463 | | | | 1,036,928 | |
Alliant Energy Corp. | | | 2,996 | | | | 154,594 | |
Ameren Corp. | | | 20,444 | | | | 739,255 | |
American Electric Power Co., Inc. | | | 7,465 | | | | 348,914 | |
CMS Energy Corp. | | | 17,013 | | | | 455,438 | |
Consolidated Edison, Inc. | | | 7,783 | | | | 430,244 | |
Dominion Resources, Inc. | | | 5,367 | | | | 347,191 | |
DTE Energy Co. | | | 16,918 | | | | 1,123,186 | |
Duke Energy Corp. | | | 5,004 | | | | 345,326 | |
Edison International | | | 28,190 | | | | 1,305,197 | |
Entergy Corp. | | | 619 | | | | 39,164 | |
Exelon Corp. | | | 12,720 | | | | 348,401 | |
NextEra Energy, Inc. | | | 4,135 | | | | 354,039 | |
PG&E Corp. | | | 8,608 | | | | 346,730 | |
Pinnacle West Capital Corp. | | | 7,261 | | | | 384,252 | |
PPL Corp. | | | 8,769 | | | | 263,859 | |
Public Service Enterprise Group, Inc. | | | 31,806 | | | | 1,019,064 | |
Southern Co. (The) | | | 8,488 | | | | 348,942 | |
Wisconsin Energy Corp. | | | 6,858 | | | | 283,510 | |
Xcel Energy, Inc. | | | 28,084 | | | | 784,667 | |
| | | | | | | | |
| | | | | | | 10,458,901 | |
| | | | | | | | |
Electrical Components & Equipment 0.4% | | | | | |
Emerson Electric Co. | | | 6,509 | | | | 456,801 | |
Energizer Holdings, Inc. | | | 6,399 | | | | 692,628 | |
| | | | | | | | |
| | | | | | | 1,149,429 | |
| | | | | | | | |
| | | | | | | | |
| | |
Shares | | | Value | |
Electronics 0.5% | | | | | | | | |
Agilent Technologies, Inc. | | | 1,718 | | | $ | 98,252 | |
Jabil Circuit, Inc. | | | 36,556 | | | | 637,537 | |
Thermo Fisher Scientific, Inc. | | | 3,201 | | | | 356,431 | |
Vishay Intertechnology, Inc. (g) | | | 21,648 | | | | 287,053 | |
| | | | | | | | |
| | | | | | | 1,379,273 | |
| | | | | | | | |
Engineering & Construction 0.3% | | | | | |
AECOM Technology Corp. (g) | | | 25,773 | | | | 758,499 | |
| | | | | | | | |
| | |
Entertainment 0.3% | | | | | | | | |
Gaming and Leisure Properties, Inc. (g) | | | 2,988 | | | | 151,820 | |
Regal Entertainment Group Class A | | | 35,784 | | | | 695,999 | |
| | | | | | | | |
| | | | | | | 847,819 | |
| | | | | | | | |
Environmental Controls 0.2% | | | | | | | | |
Waste Management, Inc. | | | 10,184 | | | | 456,956 | |
| | | | | | | | |
| | |
Finance—Credit Card 0.2% | | | | | | | | |
Discover Financial Services | | | 8,292 | | | | 463,937 | |
| | | | | | | | |
| |
Finance—Investment Banker/Broker 0.8% | | | | | |
Charles Schwab Corp. (The) | | | 13,535 | | | | 351,910 | |
Interactive Brokers Group, Inc. Class A | | | 28,667 | | | | 697,755 | |
LPL Financial Holdings, Inc. | | | 14,967 | | | | 703,898 | |
Raymond James Financial, Inc. | | | 9,512 | | | | 496,431 | |
| | | | | | | | |
| | | | | | | 2,249,994 | |
| | | | | | | | |
Finance—Other Services 0.4% | | | | | | | | |
CME Group, Inc. | | | 4,137 | | | | 324,589 | |
NASDAQ OMX Group, Inc. (The) | | | 21,437 | | | | 853,193 | |
| | | | | | | | |
| | | | | | | 1,177,782 | |
| | | | | | | | |
Food 0.8% | | | | | | | | |
Kellogg Co. | | | 5,713 | | | | 348,893 | |
Mondelez International, Inc. Class A | | | 10,056 | | | | 354,977 | |
Safeway, Inc. | | | 28,941 | | | | 942,608 | |
Sysco Corp. | | | 9,548 | | | | 344,683 | |
Tyson Foods, Inc. Class A | | | 13,938 | | | | 466,365 | |
| | | | | | | | |
| | | | | | | 2,457,526 | |
| | | | | | | | |
Forest Products & Paper 0.3% | | | | | | | | |
Domtar Corp. | | | 8,666 | | | | 817,550 | |
| | | | | | | | |
| | |
Gas 0.8% | | | | | | | | |
AGL Resources, Inc. | | | 9,551 | | | | 451,094 | |
CenterPoint Energy, Inc. | | | 29,794 | | | | 690,625 | |
Sempra Energy | | | 3,460 | | | | 310,570 | |
UGI Corp. | | | 20,860 | | | | 864,855 | |
| | | | | | | | |
| | | | | | | 2,317,144 | |
| | | | | | | | |
Health Care—Products 1.3% | | | | | | | | |
Alere, Inc. (g) | | | 11,730 | | | | 424,626 | |
Boston Scientific Corp. (g) | | | 114,004 | | | | 1,370,328 | |
| | | | |
| M-18 | | MainStay VP Balanced Portfolio | | The notes to the financial statements are an integral part of,
and should be read in conjunction with, the financial statements. |
| | | | | | | | |
| | |
Shares | | | Value | |
| Common Stocks (continued) | |
Health Care—Products (continued) | | | | | | | | |
Covidien PLC | | | 5,882 | | | $ | 400,564 | |
Hill-Rom Holdings, Inc. | | | 18,054 | | | | 746,352 | |
Medtronic, Inc. | | | 6,937 | | | | 398,115 | |
Stryker Corp. | | | 5,370 | | | | 403,502 | |
| | | | | | | | |
| | | | | | | 3,743,487 | |
| | | | | | | | |
Health Care—Services 1.9% | | | | | | | | |
Aetna, Inc. | | | 6,708 | | | | 460,102 | |
Cigna Corp. | | | 4,321 | | | | 378,001 | |
Community Health Systems, Inc. (g) | | | 3,651 | | | | 143,375 | |
HCA Holdings, Inc. (g) | | | 24,939 | | | | 1,189,840 | |
Health Net, Inc. (g) | | | 25,460 | | | | 755,398 | |
Humana, Inc. | | | 11,145 | | | | 1,150,387 | |
LifePoint Hospitals, Inc. (g) | | | 12,974 | | | | 685,546 | |
UnitedHealth Group, Inc. | | | 6,174 | | | | 464,902 | |
WellPoint, Inc. | | | 5,036 | | | | 465,276 | |
| | | | | | | | |
| | | | | | | 5,692,827 | |
| | | | | | | | |
Home Furnishing 0.4% | | | | | | | | |
Harman International Industries, Inc. | | | 4,439 | | | | 363,332 | |
Whirlpool Corp. | | | 5,624 | | | | 882,181 | |
| | | | | | | | |
| | | | | | | 1,245,513 | |
| | | | | | | | |
Household Products & Wares 0.1% | | | | | |
Kimberly-Clark Corp. | | | 3,799 | | | | 396,844 | |
| | | | | | | | |
| |
Insurance 5.8% | | | | | |
ACE, Ltd. | | | 3,951 | | | | 409,047 | |
Aflac, Inc. | | | 6,772 | | | | 452,370 | |
Alleghany Corp. (g) | | | 603 | | | | 241,176 | |
Allstate Corp. (The) | | | 7,447 | | | | 406,159 | |
American International Group, Inc. | | | 8,875 | | | | 453,069 | |
American National Insurance Co. | | | 2,279 | | | | 261,037 | |
Aspen Insurance Holdings, Ltd. | | | 11,375 | | | | 469,901 | |
Assurant, Inc. | | | 13,439 | | | | 891,946 | |
Axis Capital Holdings, Ltd. | | | 17,164 | | | | 816,491 | |
Berkshire Hathaway, Inc. Class B (g) | | | 3,408 | | | | 404,052 | |
Chubb Corp. (The) | | | 4,235 | | | | 409,228 | |
Endurance Specialty Holdings, Ltd. | | | 4,825 | | | | 283,083 | |
Everest Re Group, Ltd. | | | 6,361 | | | | 991,489 | |
Fidelity National Financial, Inc. Class A | | | 32,130 | | | | 1,042,618 | |
Genworth Financial, Inc. Class A (g) | | | 63,838 | | | | 991,404 | |
Hartford Financial Services Group, Inc. (The) | | | 2,027 | | | | 73,438 | |
Kemper Corp. | | | 3,003 | | | | 122,763 | |
Lincoln National Corp. | | | 23,696 | | | | 1,223,188 | |
Loews Corp. | | | 7,324 | | | | 353,310 | |
Marsh & McLennan Cos., Inc. | | | 7,202 | | | | 348,289 | |
MetLife, Inc. | | | 7,587 | | | | 409,091 | |
PartnerRe, Ltd. | | | 8,806 | | | | 928,417 | |
Protective Life Corp. | | | 16,772 | | | | 849,670 | |
Prudential Financial, Inc. | | | 3,839 | | | | 354,033 | |
| | | | | | | | |
| | |
Shares | | | Value | |
Insurance (continued) | | | | | |
Reinsurance Group of America, Inc. | | | 11,675 | | | $ | 903,762 | |
StanCorp Financial Group, Inc. | | | 11,974 | | | | 793,277 | |
Travelers Companies, Inc. (The) | | | 5,034 | | | | 455,778 | |
Unum Group | | | 30,664 | | | | 1,075,693 | |
Validus Holdings, Ltd. | | | 10,202 | | | | 411,039 | |
W.R. Berkley Corp. | | | 2,060 | | | | 89,383 | |
XL Group PLC | | | 2,510 | | | | 79,918 | |
| | | | | | | | |
| | | | | | | 16,994,119 | |
| | | | | | | | |
Internet 0.1% | | | | | | | | |
Yahoo!, Inc. (g) | | | 8,612 | | | | 348,269 | |
| | | | | | | | |
| |
Investment Company 0.1% | | | | | |
American Capital Ltd. (g) | | | 18,276 | | | | 285,837 | |
| | | | | | | | |
| |
Investment Management/Advisory Services 0.3% | | | | | |
Ameriprise Financial, Inc. | | | 3,074 | | | | 353,664 | |
BlackRock, Inc. | | | 1,449 | | | | 458,565 | |
Invesco, Ltd. | | | 920 | | | | 33,488 | |
| | | | | | | | |
| | | | | | | 845,717 | |
| | | | | | | | |
Iron & Steel 1.1% | | | | | |
Cliffs Natural Resources, Inc. | | | 31,745 | | | | 832,036 | |
Nucor Corp. | | | 1,810 | | | | 96,618 | |
Reliance Steel & Aluminum Co. | | | 6,555 | | | | 497,131 | |
Steel Dynamics, Inc. | | | 43,687 | | | | 853,644 | |
United States Steel Corp. | | | 30,068 | | | | 887,006 | |
| | | | | | | | |
| | | | | | | 3,166,435 | |
| | | | | | | | |
IT Services 0.1% | | | | | |
Leidos Holdings, Inc. | | | 3,201 | | | | 148,814 | |
| | | | | | | | |
| |
Leisure Time 0.1% | | | | | |
Carnival Corp. | | | 10,423 | | | | 418,692 | |
Royal Caribbean Cruises, Ltd. | | | 470 | | | | 22,287 | |
| | | | | | | | |
| | | | | | | 440,979 | |
| | | | | | | | |
Lodging 0.4% | | | | | |
MGM Resorts International (g) | | | 48,778 | | | | 1,147,259 | |
| | | | | | | | |
| |
Machinery—Construction & Mining 0.2% | | | | | |
Caterpillar, Inc. | | | 5,105 | | | | 463,585 | |
| | | | | | | | |
| |
Machinery—Diversified 0.3% | | | | | |
AGCO Corp. | | | 9,133 | | | | 540,582 | |
Cummins, Inc. | | | 3,257 | | | | 459,140 | |
| | | | | | | | |
| | | | | | | 999,722 | |
| | | | | | | | |
Media 2.6% | | | | | |
CBS Corp. Class B | | | 5,702 | | | | 363,445 | |
Comcast Corp. Class A | | | 8,802 | | | | 457,396 | |
Gannett Co., Inc. | | | 34,822 | | | | 1,030,035 | |
| | | | | | |
The notes to the financial statements are an integral part of,
and should be read in conjunction with, the financial statements. | | mainstayinvestments.com | | | M-19 | |
Portfolio of Investments December 31, 2013 (continued)
| | | | | | | | |
| | |
Shares | | | Value | |
| Common Stocks (continued) | |
Media (continued) | | | | | |
Graham Holdings Co. Class B | | | 1,197 | | | $ | 793,994 | |
John Wiley & Sons, Inc. Class A | | | 9,943 | | | | 548,854 | |
Liberty Global PLC Class A (g) | | | 4,630 | | | | 412,024 | |
Liberty Media Corp. Class A (g) | | | 4,433 | | | | 649,213 | |
McGraw Hill Financial, Inc. | | | 11,257 | | | | 880,297 | |
News Corp. Class A (g) | | | 25,747 | | | | 463,961 | |
Sirius XM Holdings, Inc. (g) | | | 115,631 | | | | 403,552 | |
Thomson Reuters Corp. | | | 10,624 | | | | 401,800 | |
Time Warner, Inc. | | | 5,841 | | | | 407,234 | |
Twenty-First Century Fox, Inc. Class A | | | 10,192 | | | | 358,555 | |
Walt Disney Co. (The) | | | 5,435 | | | | 415,234 | |
| | | | | | | | |
| | | | | | | 7,585,594 | |
| | | | | | | | |
Mining 0.2% | | | | | |
Alcoa, Inc. | | | 33,773 | | | | 359,007 | |
Freeport-McMoRan Copper & Gold, Inc. | | | 9,839 | | | | 371,324 | |
| | | | | | | | |
| | | | | | | 730,331 | |
| | | | | | | | |
Miscellaneous—Manufacturing 1.2% | | | | | |
3M Co. | | | 2,907 | | | | 407,707 | |
Danaher Corp. | | | 5,178 | | | | 399,741 | |
Eaton Corp. PLC | | | 4,648 | | | | 353,806 | |
General Electric Co. | | | 14,517 | | | | 406,911 | |
Illinois Tool Works, Inc. | | | 4,847 | | | | 407,536 | |
Ingersoll-Rand PLC | | | 1,893 | | | | 116,609 | |
Parker Hannifin Corp. | | | 1,111 | | | | 142,919 | |
Pentair, Ltd. | | | 4,472 | | | | 347,340 | |
Trinity Industries, Inc. | | | 14,844 | | | | 809,295 | |
| | | | | | | | |
| | | | | | | 3,391,864 | |
| | | | | | | | |
Office & Business Equipment 0.7% | | | | | |
Pitney Bowes, Inc. | | | 32,872 | | | | 765,918 | |
Xerox Corp. | | | 111,021 | | | | 1,351,125 | |
| | | | | | | | |
| | | | | | | 2,117,043 | |
| | | | | | | | |
Oil & Gas 4.3% | | | | | |
Anadarko Petroleum Corp. | | | 5,656 | | | | 448,634 | |
Apache Corp. | | | 4,580 | | | | 393,605 | |
Chesapeake Energy Corp. | | | 47,547 | | | | 1,290,426 | |
Chevron Corp. | | | 3,218 | | | | 401,960 | |
Cimarex Energy Co. | | | 5,095 | | | | 534,517 | |
ConocoPhillips | | | 5,741 | | | | 405,602 | |
Denbury Resources, Inc. (g) | | | 9,830 | | | | 161,507 | |
Devon Energy Corp. | | | 6,528 | | | | 403,887 | |
Energen Corp. | | | 3,323 | | | | 235,102 | |
EOG Resources, Inc. | | | 2,398 | | | | 402,480 | |
Exxon Mobil Corp. | | | 3,988 | | | | 403,586 | |
Helmerich & Payne, Inc. | | | 120 | | | | 10,090 | |
Hess Corp. | | | 4,924 | | | | 408,692 | |
HollyFrontier Corp. | | | 5,726 | | | | 284,525 | |
Marathon Oil Corp. | | | 11,361 | | | | 401,043 | |
Marathon Petroleum Corp. | | | 5,215 | | | | 478,372 | |
| | | | | | | | |
| | |
Shares | | | Value | |
Oil & Gas (continued) | | | | | |
Murphy Oil Corp. | | | 8,392 | | | $ | 544,473 | |
Nabors Industries, Ltd. | | | 51,818 | | | | 880,388 | |
Newfield Exploration Co. (g) | | | 234 | | | | 5,763 | |
Noble Energy, Inc. | | | 4,784 | | | | 325,838 | |
Occidental Petroleum Corp. | | | 4,809 | | | | 457,336 | |
Patterson-UTI Energy, Inc. | | | 33,217 | | | | 841,054 | |
PBF Energy, Inc. Class A | | | 23,846 | | | | 750,195 | |
Phillips 66 | | | 6,129 | | | | 472,730 | |
SandRidge Energy, Inc. (g) | | | 10,815 | | | | 65,647 | |
Tesoro Corp. | | | 10,510 | | | | 614,835 | |
Valero Energy Corp. | | | 9,579 | | | | 482,782 | |
WPX Energy, Inc. (g) | | | 20,638 | | | | 420,602 | |
| | | | | | | | |
| | | | | | | 12,525,671 | |
| | | | | | | | |
Oil & Gas Services 1.1% | | | | | | | | |
Baker Hughes, Inc. | | | 8,403 | | | | 464,350 | |
MRC Global, Inc. (g) | | | 22,639 | | | | 730,334 | |
National Oilwell Varco, Inc. | | | 5,099 | | | | 405,524 | |
Oil States International, Inc. (g) | | | 8,653 | | | | 880,183 | |
RPC, Inc. | | | 36,201 | | | | 646,188 | |
Superior Energy Services, Inc. (g) | | | 2,820 | | | | 75,040 | |
| | | | | | | | |
| | | | | | | 3,201,619 | |
| | | | | | | | |
Packaging & Containers 0.0%‡ | | | | | | | | |
Greif, Inc. Class A | | | 313 | | | | 16,401 | |
Rock-Tenn Co. Class A | | | 415 | | | | 43,579 | |
| | | | | | | | |
| | | | | | | 59,980 | |
| | | | | | | | |
Pharmaceuticals 2.3% | | | | | | | | |
Abbott Laboratories | | | 9,104 | | | | 348,956 | |
Bristol-Myers Squibb Co. | | | 6,430 | | | | 341,755 | |
¨Cardinal Health, Inc. | | | 24,804 | | | | 1,657,155 | |
Eli Lilly & Co. | | | 8,914 | | | | 454,614 | |
Express Scripts Holding Co. (g) | | | 5,842 | | | | 410,342 | |
Forest Laboratories, Inc. (g) | | | 42 | | | | 2,521 | |
Johnson & Johnson | | | 4,311 | | | | 394,844 | |
Mallinckrodt PLC (g) | | | 7,695 | | | | 402,141 | |
Merck & Co., Inc. | | | 8,128 | | | | 406,806 | |
Omnicare, Inc. | | | 15,632 | | | | 943,548 | |
Pfizer, Inc. | | | 14,555 | | | | 445,820 | |
Quintiles Transnational Holdings, Inc. (g) | | | 5,389 | | | | 249,726 | |
VCA Antech, Inc. (g) | | | 25,094 | | | | 786,948 | |
| | | | | | | | |
| | | | | | | 6,845,176 | |
| | | | | | | | |
Pipelines 0.4% | | | | | | | | |
Kinder Morgan, Inc. | | | 9,960 | | | | 358,560 | |
Spectra Energy Corp. | | | 10,216 | | | | 363,894 | |
Williams Cos., Inc. (The) | | | 9,385 | | | | 361,979 | |
| | | | | | | | |
| | | | | | | 1,084,433 | |
| | | | | | | | |
Real Estate Investment Trusts 4.1% | | | | | | | | |
Apartment Investment & Management Co. Class A | | | 13,988 | | | | 362,429 | |
AvalonBay Communities, Inc. | | | 610 | | | | 72,120 | |
| | | | |
| M-20 | | MainStay VP Balanced Portfolio | | The notes to the financial statements are an integral part of,
and should be read in conjunction with, the financial statements. |
| | | | | | | | |
| | |
Shares | | | Value | |
| Common Stocks (continued) | |
Real Estate Investment Trusts (continued) | |
Boston Properties, Inc. | | | 753 | | | $ | 75,579 | |
Camden Property Trust | | | 7,284 | | | | 414,314 | |
CBL & Associates Properties, Inc. | | | 39,718 | | | | 713,335 | |
DDR Corp. | | | 564 | | | | 8,669 | |
Duke Realty Corp. | | | 18,111 | | | | 272,389 | |
Equity Lifestyle Properties, Inc. | | | 13,097 | | | | 474,504 | |
Equity Residential | | | 6,653 | | | | 345,091 | |
HCP, Inc. | | | 18,776 | | | | 681,944 | |
Health Care REIT, Inc. | | | 17,182 | | | | 920,440 | |
Home Properties, Inc. | | | 12,258 | | | | 657,274 | |
Hospitality Properties Trust | | | 10,757 | | | | 290,762 | |
Host Hotels & Resorts, Inc. | | | 67,260 | | | | 1,307,534 | |
Kilroy Realty Corp. | | | 4,633 | | | | 232,484 | |
Kimco Realty Corp. | | | 37,775 | | | | 746,056 | |
Mack-Cali Realty Corp. | | | 23,866 | | | | 512,642 | |
Piedmont Office Realty Trust, Inc. Class A | | | 3,057 | | | | 50,502 | |
ProLogis, Inc. | | | 12,829 | | | | 474,031 | |
Public Storage | | | 2,290 | | | | 344,691 | |
Regency Centers Corp. | | | 427 | | | | 19,770 | |
Senior Housing Properties Trust | | | 14,664 | | | | 325,981 | |
Simon Property Group, Inc. | | | 2,248 | | | | 342,056 | |
UDR, Inc. | | | 2,840 | | | | 66,314 | |
Ventas, Inc. | | | 17,219 | | | | 986,304 | |
Vornado Realty Trust | | | 13,762 | | | | 1,221,928 | |
Weingarten Realty Investors | | | 642 | | | | 17,604 | |
| | | | | | | | |
| | | | | | | 11,936,747 | |
| | | | | | | | |
Retail 2.3% | | | | | | | | |
Ascena Retail Group, Inc. (g) | | | 35,707 | | | | 755,560 | |
Best Buy Co., Inc. | | | 24,768 | | | | 987,748 | |
Big Lots, Inc. (g) | | | 9,377 | | | | 302,783 | |
CST Brands, Inc. | | | 21,956 | | | | 806,224 | |
CVS Caremark Corp. | | | 5,654 | | | | 404,657 | |
GameStop Corp. Class A | | | 18,840 | | | | 928,058 | |
Guess?, Inc. | | | 21,924 | | | | 681,179 | |
Staples, Inc. | | | 13,680 | | | | 217,375 | |
Target Corp. | | | 6,381 | | | | 403,726 | |
Wal-Mart Stores, Inc. | | | 4,482 | | | | 352,689 | |
Walgreen Co. | | | 7,850 | | | | 450,904 | |
Wendy’s Co. (The) | | | 62,475 | | | | 544,782 | |
World Fuel Services Corp. | | | 547 | | | | 23,609 | |
| | | | | | | | |
| | | | | | | 6,859,294 | |
| | | | | | | | |
Savings & Loans 0.3% | | | | | | | | |
First Niagara Financial Group, Inc. | | | 34,302 | | | | 364,287 | |
People’s United Financial, Inc. | | | 848 | | | | 12,822 | |
Washington Federal, Inc. | | | 20,933 | | | | 487,530 | |
| | | | | | | | |
| | | | | | | 864,639 | |
| | | | | | | | |
Semiconductors 1.7% | | | | | | | | |
Broadcom Corp. Class A | | | 15,552 | | | | 461,117 | |
| | | | | | | | |
| | |
Shares | | | Value | |
Semiconductors (continued) | | | | | | | | |
Fairchild Semiconductor International, Inc. (g) | | | 10,762 | | | $ | 143,673 | |
First Solar, Inc. (g) | | | 13,866 | | | | 757,638 | |
Intel Corp. | | | 17,779 | | | | 461,543 | |
Marvell Technology Group, Ltd. | | | 54,387 | | | | 782,085 | |
Micron Technology, Inc. (g) | | | 33,900 | | | | 737,664 | |
NVIDIA Corp. | | | 67,043 | | | | 1,074,029 | |
Skyworks Solutions, Inc. (g) | | | 24,902 | | | | 711,201 | |
| | | | | | | | |
| | | | | | | 5,128,950 | |
| | | | | | | | |
Software 0.4% | | | | | | | | |
Activision Blizzard, Inc. | | | 48,786 | | | | 869,855 | |
Adobe Systems, Inc. (g) | | | 5,956 | | | | 356,645 | |
| | | | | | | | |
| | | | | | | 1,226,500 | |
| | | | | | | | |
Telecommunications 2.1% | | | | | | | | |
AT&T, Inc. | | | 11,512 | | | | 404,762 | |
CenturyLink, Inc. | | | 14,253 | | | | 453,958 | |
Cisco Systems, Inc. | | | 18,823 | | | | 422,576 | |
Corning, Inc. | | | 25,659 | | | | 457,244 | |
EchoStar Corp. Class A (g) | | | 5,092 | | | | 253,174 | |
Frontier Communications Corp. | | | 180,685 | | | | 840,185 | |
Harris Corp. | | | 13,844 | | | | 966,450 | |
Polycom, Inc. (g) | | | 65,932 | | | | 740,416 | |
Sprint Corp. (g) | | | 42,923 | | | | 461,422 | |
Telephone & Data Systems, Inc. | | | 24,683 | | | | 636,328 | |
United States Cellular Corp. | | | 11,101 | | | | 464,244 | |
Windstream Holdings, Inc. | | | 14,753 | | | | 117,729 | |
| | | | | | | | |
| | | | | | | 6,218,488 | |
| | | | | | | | |
Transportation 0.7% | |
Con-way, Inc. | | | 17,201 | | | | 683,052 | |
CSX Corp. | | | 14,225 | | | | 409,253 | |
FedEx Corp. | | | 3,199 | | | | 459,920 | |
Norfolk Southern Corp. | | | 4,381 | | | | 406,688 | |
| | | | | | | | |
| | | | | | | 1,958,913 | |
| | | | | | | | |
Trucking & Leasing 0.2% | |
AMERCO (g) | | | 2,996 | | | | 712,569 | |
| | | | | | | | |
Total Common Stocks
(Cost $134,103,539) | | | | | | | 171,170,490 | |
| | | | | | | | |
|
| Exchange-Traded Funds 2.7% (h) | |
¨iShares Intermediate Credit Bond Fund | | | 27,845 | | | | 3,003,919 | |
S&P 500 Index—SPDR Trust Series 1 | | | 5,312 | | | | 980,967 | |
¨S&P Midcap 400 Index—Midcap SPDR Trust Series 1 | | | 16,173 | | | | 3,949,446 | |
| | | | | | | | |
Total Exchange-Traded Funds
(Cost $7,608,520) | | | | | | | 7,934,332 | |
| | | | | | | | |
| | | | | | |
The notes to the financial statements are an integral part of,
and should be read in conjunction with, the financial statements. | | mainstayinvestments.com | | | M-21 | |
Portfolio of Investments December 31, 2013 (continued)
| | | | | | | | |
| | | Principal
Amount | | | Value | |
| Short-Term Investments 2.6% | |
Repurchase Agreements 2.6% | |
State Street Bank and Trust Co.
0.00%, dated 12/31/13
due 1/2/14
Proceeds at Maturity $947,377 (Collateralized by Government Agency securities with rates between 2.08% and 2.17% and maturity dates between 11/2/22 and 11/7/22, with a Principal Amount of $1,070,000 and a Market Value of $969,120) | | $ | 947,377 | | | $ | 947,377 | |
TD Securities (U.S.A.) LLC
0.005%, dated 12/31/13
due 1/2/14
Proceeds at Maturity $6,742,002 (Collateralized by a United States Treasury Note with a rate of 5.375% and a maturity date of 2/15/31, with a Principal Amount of $5,497,000 and a Market Value of $6,876,897) | | | 6,742,000 | | | | 6,742,000 | |
| | | | | | | | |
Total Short-Term Investments
(Cost $7,689,377) | | | | | | | 7,689,377 | |
| | | | | | | | |
Total Investments
(Cost $262,275,533) (k) | | | 102.1 | % | | | 299,584,509 | |
Other Assets, Less Liabilities | | | (2.1 | ) | | | (6,241,274 | ) |
Net Assets | | | 100.0 | % | | $ | 293,343,235 | |
| | |
| | | | | | | | |
| | | Contracts
Short | | | Unrealized
Appreciation
(Depreciation) (i) | |
| Futures Contracts 0.0%‡ | |
United States Treasury Note
March 2014 (10 Year) (j) | | | (14 | ) | | $ | 20,079 | |
| | | | | | | | |
Total Futures Contracts
(Notional Amount $1,722,656) | | | | | | $ | 20,079 | |
| | | | | | | | |
| ‡ | Less than one-tenth of a percent. |
| (a) | Floating rate—Rate shown is the rate in effect as of December 31, 2013. |
| (b) | May be sold to institutional investors only under Rule 144A or securities offered pursuant to Section 4(a)(2) of the Securities Act of 1933, as amended. |
| (c) | Fair valued security—The total market value of these securities as of December 31, 2013, is $2,860,564, which represents 1.0% of the Portfolio’s net assets. |
| (d) | Step coupon—Rate shown is the rate in effect as of December 31, 2013. |
| (e) | Collateral strip rate—A bond whose interest is based on the weighted net interest rate of the collateral. The coupon rate adjusts periodically based on a predetermined schedule. Rate shown is the rate in effect as of December 31, 2013. |
| (f) | Yankee Bond—Dollar-denominated bond issued in the United States by a foreign bank or corporation. |
| (g) | Non-income producing security. |
| (h) | Exchange-Traded Fund—An investment vehicle that represents a basket of securities that is traded on an exchange. |
| (i) | Represents the difference between the value of the contracts at the time they were opened and the value as of December 31, 2013. |
| (j) | As of December 31, 2013, cash in the amount of $20,650 is on deposit with the broker for futures transactions. |
| (k) | As of December 31, 2013, cost is $263,757,038 for federal income tax purposes and net unrealized appreciation is as follows: |
| | | | |
Gross unrealized appreciation | | $ | 37,809,687 | |
Gross unrealized depreciation | | | (1,982,216 | ) |
| | | | |
Net unrealized appreciation | | $ | 35,827,471 | |
| | | | |
The following abbreviation is used in the above portfolio:
SPDR—Standard & Poor’s Depositary Receipt
| | | | |
| M-22 | | MainStay VP Balanced Portfolio | | The notes to the financial statements are an integral part of,
and should be read in conjunction with, the financial statements. |
The following is a summary of the fair valuations according to the inputs used as of December 31, 2013, for valuing the Portfolio’s assets.
Asset Valuation Inputs
| | | | | | | | | | | | | | | | |
Description | | Quoted Prices
in Active Markets
for Identical Assets (Level 1) | | | Significant Other
Observable Inputs (Level 2) | | | Significant
Unobservable
Inputs (Level 3) | | | Total | |
| Investments in Securities (a) | | | | | | | | | | | | | | | | |
| Long-Term Bonds | | | | | | | | | | | | | | | | |
Asset-Backed Securities (b) | | $ | — | | | $ | 4,059,898 | | | $ | 2,860,564 | | | $ | 6,920,462 | |
Corporate Bonds | | | — | | | | 45,218,555 | | | | — | | | | 45,218,555 | |
Foreign Government Bonds | | | — | | | | 1,795,523 | | | | — | | | | 1,795,523 | |
Mortgage-Backed Securities | | | — | | | | 1,813,469 | | | | — | | | | 1,813,469 | |
U.S. Government & Federal Agencies | | | — | | | | 56,261,853 | | | | — | | | | 56,261,853 | |
Yankee Bonds | | | — | | | | 780,448 | | | | — | | | | 780,448 | |
| | | | | | | | | | | | | | | | |
| Total Long-Term Bonds | | | — | | | | 109,929,746 | | | | 2,860,564 | | | | 112,790,310 | |
| | | | | | | | | | | | | | | | |
| Common Stocks | | | 171,170,490 | | | | — | | | | — | | | | 171,170,490 | |
| Exchange-Traded Funds | | | 7,934,332 | | | | — | | | | — | | | | 7,934,332 | |
| Short-Term Investments | | | | | | | | | | | | | | | | |
Repurchase Agreements | | | — | | | | 7,689,377 | | | | — | | | | 7,689,377 | |
| | | | | | | | | | | | | | | | |
| Total Investments in Securities | | | 179,104,822 | | | | 117,619,123 | | | | 2,860,564 | | | | 299,584,509 | |
| | | | | | | | | | | | | | | | |
| Other Financial Instruments | | | | | | | | | | | | | | | | |
Futures Contracts Short (c) | | | 20,079 | | | | — | | | | — | | | | 20,079 | |
| | | | | | | | | | | | | | | | |
| Total Investments in Securities and Other Financial Instruments | | $ | 179,124,901 | | | $ | 117,619,123 | | | $ | 2,860,564 | | | $ | 299,604,588 | |
| | | | | | | | | | | | | | | | |
| (a) | For a complete listing of investments and their industries, see the Portfolio of Investments. |
| (b) | The Level 3 securities valued at $2,860,564 are held in Other ABS within the Asset-Backed Securities section of the Portfolio of Investments. |
| (c) | The value listed for these securities reflects unrealized appreciation (depreciation) as shown on the Portfolio of Investments. |
The Portfolio recognizes transfers between the levels as of the beginning of the period.
For the year ended December 31, 2013, the Portfolio did not have any transfers between Level 1 and Level 2 fair value measurements. (See Note 2)
The following is a reconciliation of investments in which significant unobservable inputs (Level 3) were used in determining value:
| | | | | | | | | | | | | | | | | | | | | | | | | | | | | | | | | | | | | | | | | | | | | | | | | | |
Investments
in Securities | | Balance
as of
December 31,
2012 | | Accrued
Discounts
(Premiums) | | Realized
Gain
(Loss) | | Change in
Unrealized
Appreciation
(Depreciation) | | Purchases | | Sales | | Transfers
in to
Level 3 | | Transfers
out of
Level 3 | | Balance
as of
December 31,
2013 | | Change in
Unrealized
Appreciation
(Depreciation)
from
Investments
Still Held at
December 31,
2013 (a) |
| Long-Term Bonds | �� | | | | | | | | | | | | | | | | | | | | | | | | | | | | | | | | | | | | | | | | | | | | | | | | | |
Asset-Backed Securities | | | | | | | | | | | | | | | | | | | | | | | | | | | | | | | | | | | | | | | | | | | | | | | | | | |
Other ABS | | | $ | — | | | | $ | 165 | | | | $ | — | | | | $ | (32,987 | ) | | | $ | 2,893,386 | | | | $ | — | | | | $ | — | | | | $ | — | | | | $ | 2,860,564 | | | | $ | (32,987 | ) |
| | | | | | | | | | | | | | | | | | | | | | | | | | | | | | | | | | | | | | | | | | | | | | | | | | |
| Total | | | $ | — | | | | $ | 165 | | | | $ | — | | | | $ | (32,987 | ) | | | $ | 2,893,386 | | | | $ | — | | | | $ | — | | | | $ | — | | | | $ | 2,860,564 | | | | $ | (32,987 | ) |
| | | | | | | | | | | | | | | | | | | | | | | | | | | | | | | | | | | | | | | | | | | | | | | | | | |
| (a) | Included in “Net change in unrealized appreciation (depreciation) on investments” in the Statement of Operations. |
| | | | | | |
The notes to the financial statements are an integral part of,
and should be read in conjunction with, the financial statements. | | mainstayinvestments.com | | | M-23 | |
Statement of Assets and Liabilities as of December 31, 2013
| | | | |
| Assets | | | | |
Investment in securities, at value
(identified cost $262,275,533) | | $ | 299,584,509 | |
Cash collateral on deposit at broker | | | 20,650 | |
Cash | | | 844 | |
Receivables: | | | | |
Investment securities sold | | | 1,521,765 | |
Dividends and interest | | | 852,539 | |
Fund shares sold | | | 121,087 | |
Variation margin on futures contracts | | | 2,406 | |
| | | | |
Total assets | | | 302,103,800 | |
| | | | |
| |
| Liabilities | | | | |
Payables: | | | | |
Investment securities purchased | | | 8,345,254 | |
Manager (See Note 3) | | | 168,805 | |
Fund shares redeemed | | | 131,302 | |
NYLIFE Distributors (See Note 3) | | | 58,479 | |
Professional fees | | | 30,856 | |
Shareholder communication | | | 14,744 | |
Custodian | | | 7,899 | |
Trustees | | | 371 | |
Accrued expenses | | | 2,855 | |
| | | | |
Total liabilities | | | 8,760,565 | |
| | | | |
Net assets | | $ | 293,343,235 | |
| | | | |
| |
| Net Assets Consist of | | | | |
Shares of beneficial interest outstanding (par value of $.001 per share) unlimited number of shares authorized | | $ | 20,046 | |
Additional paid-in capital | | | 231,793,903 | |
| | | | |
| | | 231,813,949 | |
Undistributed net investment income | | | 2,432,186 | |
Accumulated net realized gain (loss) on investments and futures transactions | | | 21,768,045 | |
Net unrealized appreciation (depreciation) on investments and futures contracts | | | 37,329,055 | |
| | | | |
Net assets | | $ | 293,343,235 | |
| | | | |
| | | | |
Initial Class | | | | |
Net assets applicable to outstanding shares | | $ | 13,016,949 | |
| | | | |
Shares of beneficial interest outstanding | | | 884,056 | |
| | | | |
Net asset value per share outstanding | | $ | 14.72 | |
| | | | |
Service Class | | | | |
Net assets applicable to outstanding shares | | $ | 280,326,286 | |
| | | | |
Shares of beneficial interest outstanding | | | 19,161,557 | |
| | | | |
Net asset value per share outstanding | | $ | 14.63 | |
| | | | |
| | | | |
| M-24 | | MainStay VP Balanced Portfolio | | The notes to the financial statements are an integral part of,
and should be read in conjunction with, the financial statements. |
Statement of Operations for the year ended December 31, 2013
| | | | |
| Investment Income (Loss) | | | | |
Income | | | | |
Dividends (a) | | $ | 3,441,685 | |
Interest | | | 1,607,655 | |
| | | | |
Total income | | | 5,049,340 | |
| | | | |
Expenses | | | | |
Manager (See Note 3) | | | 1,770,495 | |
Distribution and service—Service Class (See Note 3) | | | 590,209 | |
Custodian | | | 59,255 | |
Professional fees | | | 48,744 | |
Shareholder communication | | | 40,570 | |
Trustees | | | 4,909 | |
Miscellaneous | | | 10,463 | |
| | | | |
Total expenses before waiver/reimbursement | | | 2,524,645 | |
Expense waiver/reimbursement from Manager (See Note 3) | | | (35,901 | ) |
| | | | |
Net expenses | | | 2,488,744 | |
| | | | |
Net investment income (loss) | | | 2,560,596 | |
| | | | |
|
| Realized and Unrealized Gain (Loss) on Investments and Futures Contracts | |
Net realized gain (loss) on: | | | | |
Security transactions | | | 24,689,661 | |
Futures transactions | | | 9,983 | |
| | | | |
Net realized gain (loss) on investments and futures transactions | | | 24,699,644 | |
| | | | |
Net change in unrealized appreciation (depreciation) on: | | | | |
Investments | | | 19,860,875 | |
Futures contracts | | | 20,079 | |
| | | | |
Net change in unrealized appreciation (depreciation) on investments and futures contracts | | | 19,880,954 | |
| | | | |
Net realized and unrealized gain (loss) on investments and futures transactions | | | 44,580,598 | |
| | | | |
Net increase (decrease) in net assets resulting from operations | | $ | 47,141,194 | |
| | | | |
| (a) | Dividends recorded net of foreign withholding taxes in the amount of $4,009. |
| | | | | | |
The notes to the financial statements are an integral part of,
and should be read in conjunction with, the financial statements. | | mainstayinvestments.com | | | M-25 | |
Statements of Changes in Net Assets
for the years ended December 31, 2013 and December 31, 2012
| | | | | | | | |
| | | 2013 | | | 2012 | |
| Increase (Decrease) in Net Assets | |
Operations: | | | | | | | | |
Net investment income (loss) | | $ | 2,560,596 | | | $ | 2,610,330 | |
Net realized gain (loss) on investments and futures transactions | | | 24,699,644 | | | | 6,920,598 | |
Net change in unrealized appreciation (depreciation) on investments and futures contracts | | | 19,880,954 | | | | 11,417,977 | |
| | | | |
Net increase (decrease) in net assets resulting from operations | | | 47,141,194 | | | | 20,948,905 | |
| | | | |
Dividends to shareholders: | | | | | | | | |
From net investment income: | | | | | | | | |
Initial Class | | | (136,174 | ) | | | (133,941 | ) |
Service Class | | | (2,378,559 | ) | | | (2,098,885 | ) |
| | | | |
Total dividends to shareholders | | | (2,514,733 | ) | | | (2,232,826 | ) |
| | | | |
Capital share transactions: | | | | | | | | |
Net proceeds from sale of shares | | | 66,911,978 | | | | 33,936,435 | |
Net asset value of shares issued to shareholders in reinvestment of dividends | | | 2,514,733 | | | | 2,232,826 | |
Cost of shares redeemed | | | (22,081,537 | ) | | | (23,181,558 | ) |
| | | | |
Increase (decrease) in net assets derived from capital share transactions | | | 47,345,174 | | | | 12,987,703 | |
| | | | |
Net increase (decrease) in net assets | | | 91,971,635 | | | | 31,703,782 | |
| | |
| Net Assets | | | | | | | | |
Beginning of year | | | 201,371,600 | | | | 169,667,818 | |
| | | | |
End of year | | $ | 293,343,235 | | | $ | 201,371,600 | |
| | | | |
Undistributed net investment income at end of year | | $ | 2,432,186 | | | $ | 2,535,109 | |
| | | | |
| | | | |
| M-26 | | MainStay VP Balanced Portfolio | | The notes to the financial statements are an integral part of,
and should be read in conjunction with, the financial statements. |
Financial Highlights selected per share data and ratios
| | | | | | | | | | | | | | | | | | | | |
| | | Initial Class | |
| | | Year ended December 31, | |
| | | 2013 | | | 2012 | | | 2011 | | | 2010 | | | 2009 | |
Net asset value at beginning of year | | $ | 12.22 | | | $ | 11.02 | | | $ | 10.91 | | | $ | 9.74 | | | $ | 8.15 | |
| | | | | | | | | | | | | | | | | | | | |
Net investment income (loss) | | | 0.17 | (a) | | | 0.19 | (a) | | | 0.17 | (a) | | | 0.19 | | | | 0.15 | (a) |
Net realized and unrealized gain (loss) on investments | | | 2.48 | | | | 1.17 | | | | 0.12 | | | | 1.13 | | | | 1.73 | |
| | | | | | | | | | | | | | | | | | | | |
Total from investment operations | | | 2.65 | | | | 1.36 | | | | 0.29 | | | | 1.32 | | | | 1.88 | |
| | | | | | | | | | | | | | | | | | | | |
Less dividends: | | | | | | | | | | | | | | | | | | | | |
From net investment income | | | (0.15 | ) | | | (0.16 | ) | | | (0.18 | ) | | | (0.15 | ) | | | (0.29 | ) |
| | | | | | | | | | | | | | | | | | | | |
Net asset value at end of year | | $ | 14.72 | | | $ | 12.22 | | | $ | 11.02 | | | $ | 10.91 | | | $ | 9.74 | |
| | | | | | | | | | | | | | | | | | | | |
Total investment return | | | 21.87 | % | | | 12.32 | % | | | 2.79 | % | | | 13.62 | % | | | 23.07 | % |
Ratios (to average net assets)/Supplemental Data: | | | | | | | | | | | | | | | | | | | | |
Net investment income (loss) | | | 1.27 | % | | | 1.62 | % | | | 1.57 | % | | | 1.89 | % | | | 1.69 | % |
Net expenses | | | 0.77 | % | | | 0.78 | % | | | 0.78 | % | | | 0.82 | % | | | 0.84 | % |
Expenses (before waiver/reimbursement) | | | 0.78 | % | | | 0.83 | % | | | 0.83 | % | | | 0.84 | % | | | 0.84 | % |
Portfolio turnover rate | | | 162 | %(b) | | | 202 | %(b) | | | 241 | %(b) | | | 118 | % | | | 176 | % |
Net assets at end of year (in 000’s) | | $ | 13,017 | | | $ | 10,075 | | | $ | 9,492 | | | $ | 9,598 | | | $ | 8,557 | |
| (a) | Per share data based on average shares outstanding during the year. |
| (b) | The portfolio turnover rates not including mortgage dollar rolls were 159%, 195% and 238% for the years ended December 31, 2013, 2012 and 2011, respectively. The Portfolio did not engage in mortgage dollar rolls for the years ended December 31, 2010 and 2009, respectively. |
| | | | | | | | | | | | | | | | | | | | |
| | | Service Class | |
| | | Year ended December 31, | |
| | | 2013 | | | 2012 | | | 2011 | | | 2010 | | | 2009 | |
Net asset value at beginning of year | | $ | 12.15 | | | $ | 10.97 | | | $ | 10.85 | | | $ | 9.69 | | | $ | 8.11 | |
| | | | | | | | | | | | | | | | | | | | |
Net investment income (loss) | | | 0.14 | (a) | | | 0.16 | (a) | | | 0.15 | (a) | | | 0.16 | | | | 0.12 | (a) |
Net realized and unrealized gain (loss) on investments | | | 2.47 | | | | 1.16 | | | | 0.12 | | | | 1.13 | | | | 1.72 | |
| | | | | | | | | | | | | | | | | | | | |
Total from investment operations | | | 2.61 | | | | 1.32 | | | | 0.27 | | | | 1.29 | | | | 1.84 | |
| | | | | | | | | | | | | | | | | | | | |
Less dividends: | | | | | | | | | | | | | | | | | | | | |
From net investment income | | | (0.13 | ) | | | (0.14 | ) | | | (0.15 | ) | | | (0.13 | ) | | | (0.26 | ) |
| | | | | | | | | | | | | | | | | | | | |
Net asset value at end of year | | $ | 14.63 | | | $ | 12.15 | | | $ | 10.97 | | | $ | 10.85 | | | $ | 9.69 | |
| | | | | | | | | | | | | | | | | | | | |
Total investment return | | | 21.57 | % | | | 12.04 | % | | | 2.53 | % | | | 13.34 | % | | | 22.76 | % |
Ratios (to average net assets)/Supplemental Data: | | | | | | | | | | | | | | | | | | | | |
Net investment income (loss) | | | 1.02 | % | | | 1.37 | % | | | 1.32 | % | | | 1.65 | % | | | 1.43 | % |
Net expenses | | | 1.02 | % | | | 1.03 | % | | | 1.03 | % | | | 1.07 | % | | | 1.09 | % |
Expenses (before waiver/reimbursement) | | | 1.03 | % | | | 1.08 | % | | | 1.08 | % | | | 1.09 | % | | | 1.09 | % |
Portfolio turnover rate | | | 162 | %(b) | | | 202 | %(b) | | | 241 | %(b) | | | 118 | % | | | 176 | % |
Net assets at end of year (in 000’s) | | $ | 280,326 | | | $ | 191,296 | | | $ | 160,176 | | | $ | 148,405 | | | $ | 130,119 | |
| (a) | Per share data based on average shares outstanding during the year. |
| (b) | The portfolio turnover rates not including mortgage dollar rolls were 159%, 195% and 238% for the years ended December 31, 2013, 2012 and 2011, respectively. The Portfolio did not engage in mortgage dollar rolls for the years ended December 31, 2010 and 2009, respectively. |
| | | | | | |
The notes to the financial statements are an integral part of,
and should be read in conjunction with, the financial statements. | | mainstayinvestments.com | | | M-27 | |
MainStay VP Bond Portfolio
Investment and Performance Comparison (Unaudited)
Performance data quoted represents past performance. Past performance is no guarantee of future results. Because of market volatility, current performance may be lower or higher than the figures shown. Investment return and principal value will fluctuate, and as a result, when shares are redeemed, they may be worth more or less than their original cost. The performance table and graph do not reflect any deduction of sales charges, mortality and expense charges, contract charges or administrative charges. Please refer to the Performance Summary appropriate for your policy. For performance information current to the most recent month-end, please call 800-598-2019 or visit www.newyorklife.com.
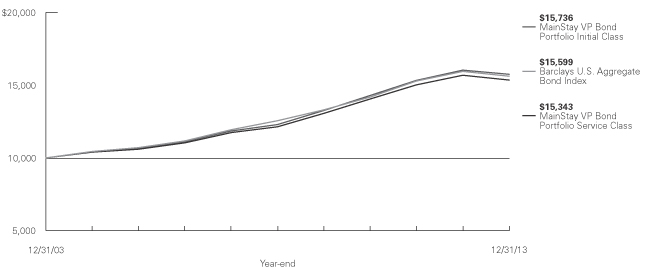
Average Annual Total Returns for the Year Ended December 31, 2013
| | | | | | | | | | | | | | | | |
| Class | | One Year | | | Five Years | | | Ten Years1 | | | Gross Expense Ratio2 | |
| Initial Class Shares | | | –1.82 | % | | | 5.07 | % | | | 4.64 | % | | | 0.53 | % |
| Service Class Shares | | | –2.07 | | | | 4.81 | | | | 4.37 | | | | 0.78 | |
| | | | | | | | | | | | |
| Benchmark Performance | | One
Year | | | Five
Years | | | Ten
Years | |
Barclays U.S. Aggregate Bond Index3 | | | –2.02 | % | | | 4.44 | % | | | 4.55 | % |
Average Lipper Variable Products Core Bond Portfolio4 | | | –1.88 | | | | 6.05 | | | | 4.48 | |
| 1. | Performance figures shown for the ten-year period ended December 31, 2013 reflect nonrecurring reimbursements from affiliates for printing and mailing costs. If these nonrecurring reimbursements had not been made, the total returns would have been 4.62% for Initial Class shares and 4.36% for Service Class shares for the ten-year period. |
| 2. | The gross expense ratios presented reflect the Portfolio’s “Total Annual Portfolio Operating Expenses” from the most recent Prospectus and may differ from other expense ratios disclosed in this report. |
| 3. | Please refer to pages M-2 and M-3 for additional explanations and disclosure regarding the Portfolios, their benchmark indices and other indices mentioned in the reports. |
| 4. | The Average Lipper Variable Products Core Bond Portfolio is representative of portfolios that invest at least 85% in domestic investment-grade debt issues (rated in the top four grades) with any remaining investment in non-benchmark sectors such as high-yield, global and emerging market debt. These portfolios maintain dollar-weighted average maturities of five to ten years. Lipper Inc. is an independent monitor of fund performance. Results are based on total returns with all dividend and capital gain distributions reinvested. |
| | |
| M-28 | | MainStay VP Bond Portfolio |
Cost in Dollars of a $1,000 Investment in MainStay VP Bond Portfolio (Unaudited)
The example below is intended to describe the fees and expenses borne by shareholders during the six-month period from July 1, 2013, to December 31, 2013, and the impact of those costs on your investment.
Example
As a shareholder of the Portfolio, you incur two types of costs: (1) transaction costs, including exchange fees and sales charges (loads) on purchases (as applicable), and (2) ongoing costs, including management fees, distribution and/or service (12b-1) fees, and other Portfolio expenses (as applicable). This example is intended to help you understand your ongoing costs (in dollars) of investing in the Portfolio and to compare these costs with the ongoing costs of investing in other Portfolios. The example is based on an investment of $1,000 made at the beginning of the six-month period and held for the entire period from July 1, 2013, to December 31, 2013. Shares are only sold in connection with variable life and annuity contracts and the example does not reflect any contract level or transactional fees or expenses. If these costs had been included, your costs would have been higher.
This example illustrates your Portfolio’s ongoing costs in two ways:
Actual Expenses
The second and third data columns in the table below provide information about actual account values and actual expenses. You may use the information in these columns, together with the amount you invested, to estimate the expenses that you paid during the six months ended
December 31, 2013. Simply divide your account value by $1,000 (for example, an $8,600 account value divided by $1,000 = 8.6), then multiply the result by the number under the heading entitled “Expenses Paid During Period” to estimate the expenses you paid on your account during this period.
Hypothetical Example for Comparison Purposes
The fourth and fifth data columns in the table below provide information about hypothetical account values and hypothetical expenses based on the Portfolio’s actual expense ratio and an assumed rate of return of 5% per year before expenses, which is not the Portfolio’s actual return. The hypothetical account values and expenses may not be used to estimate the actual ending account balances or expenses you paid for the six-month period shown. You may use this information to compare the ongoing costs of investing in the Portfolio with the ongoing costs of investing in other Portfolios. To do so, compare this 5% hypothetical example with the 5% hypothetical examples that appear in the shareholder reports of the other Portfolios.
Please note that the expenses shown in the table are meant to highlight your ongoing costs only and do not reflect any transactional costs, such as exchange fees or sales charges (loads). Therefore, the fourth and fifth data columns of the table are useful in comparing ongoing costs only and will not help you determine the relative total costs of owning different funds. In addition, if these transactional costs were included, your costs would have been higher.
| | | | | | | | | | | | | | | | | | | | |
| | | | | | | | | | | | | | | | |
| Share Class | | Beginning
Account
Value
7/1/13 | | | Ending Account
Value (Based
on Actual
Returns and
Expenses)
12/31/13 | | | Expenses
Paid
During
Period1 | | | Ending Account
Value (Based
on Hypothetical
5% Annualized
Return and
Actual Expenses)
12/31/13 | | | Expenses
Paid
During
Period1 | |
| | | | | |
| Initial Class Shares | | $ | 1,000.00 | | | $ | 1,011.20 | | | $ | 2.69 | | | $ | 1,022.50 | | | $ | 2.70 | |
| | | | | |
| Service Class Shares | | $ | 1,000.00 | | | $ | 1,009.90 | | | $ | 3.95 | | | $ | 1,021.30 | | | $ | 3.97 | |
| 1. | Expenses are equal to the Portfolio’s annualized expense ratio of each class (0.53% for Initial Class and 0.78% for Service Class) multiplied by the average account value over the period, divided by 365 and multiplied by 184 (to reflect the six-month period). The table above represents the actual expenses incurred during the six-month period. |
| | | | |
| mainstayinvestments.com | | | M-29 | |
Portfolio Composition as of December 31, 2013 (Unaudited)
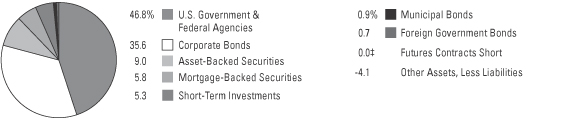
See Portfolio of Investments beginning on page M-33 for specific holdings within these categories.
| ‡ | Less than one-tenth of a percent. |
Top Ten Issuers Held as of December 31, 2013 (excluding short-term investments) (Unaudited)
| 1. | Federal National Mortgage Association (Mortgage Pass-Through Securities), 2.249%–7.50%, due 5/1/16–1/1/44 |
| 2. | United States Treasury Notes, 0.25%–2.75%, due 12/31/15–11/15/23 |
| 3. | Federal Home Loan Mortgage Corporation (Mortgage Pass-Through Securities), 2.414%–7.00%, due 3/1/15–8/1/43 |
| 4. | Government National Mortgage Association (Mortgage Pass-Through Securities), 3.00%–7.00%, due 7/15/31–11/20/43 |
| 5. | Federal National Mortgage Association, 0.625%–2.75%, due 3/13/14–11/27/18 |
| 6. | Federal Home Loan Mortgage Corporation, 1.00%–4.75%, due 1/19/16–1/13/22 |
| 7. | United States Treasury Bonds, 2.75%–4.25%, due 5/15/39–11/15/43 |
| 8. | Citigroup, Inc., 3.50%–6.01%, due 1/15/15–5/15/23 |
| 9. | JP Morgan Chase Commercial Mortgage Securities Corp., 2.206%–5.814%, due 1/12/43–5/15/45 |
| 10. | Goldman Sachs Group, Inc. (The), 2.375%–6.25%, due 1/22/18–2/1/41 |
| | |
| M-30 | | MainStay VP Bond Portfolio |
Portfolio Management Discussion and Analysis (Unaudited)
Answers to the questions reflect the views of portfolio managers Donald F. Serek, CFA, Thomas J. Girard and George S. Cherpelis of New York Life Investments,1 the Portfolio’s Manager.
How did MainStay VP Bond Portfolio perform relative to its benchmark and peers during the 12 months ended December 31, 2013?
During the 12 months ended December 31, 2013, MainStay VP Bond Portfolio returned –1.82% for Initial Class shares and –2.07% for Service Class shares. Over the same period, Initial Class shares outperformed—and Service Class shares underperformed—the –2.02% return of the Barclays U.S. Aggregate Bond Index, which is the Portfolio’s broad-based securities-market index. Initial Class shares outperformed—and Service Class shares underperformed—the –1.88% return of the average Lipper2 Variable Products Core Bond Portfolio for the 12 months ended December 31, 2013.
What factors affected the Portfolio’s relative performance during the reporting period?
The Portfolio had overweight positions in the corporate, U.S. government agencies, asset-backed securities and commercial mortgage-backed securities sectors throughout the reporting period. The corporate bond sector was the best-performing sector during 2013. Overweight positions in asset-backed securities and U.S. government agencies were also accretive to performance during the reporting period. The Portfolio started the period with an overweight position in mortgage-backed securities. Rising interest rates and expectations that the Federal Reserve would taper its direct asset purchases (widely known as quantitative easing) left the mortgage-backed securities sector vulnerable to spread3 widening, which prompted us to reduce the Portfolio to a neutral weighting during the second quarter of 2013. Until the reduction was completed, our overweight positioning in mortgage-backed securities detracted from performance relative to the Barclays U.S. Aggregate Bond Index. During the second half of 2013, the Portfolio outperformed the Barclays U.S. Aggregate Bond Index, primarily because of an overweight position in U.S. corporate bonds, particularly in the financial and industrial subsectors.
What was the Portfolio’s duration strategy during the reporting period?
The Portfolio’s duration varied over the course of the reporting period. During most of the first half, we held the Portfolio’s duration close to that of the Barclays U.S. Aggregate Bond Index. During the second quarter, however, we shortened the Portfolio’s duration slightly in relation to that of the benchmark. The Portfolio maintained this positioning throughout the second half of the reporting period. Overall, duration positioning detracted from performance during the reporting period.
What specific factors, risks or market forces prompted significant decisions for the Portfolio during the reporting period?
There were four periods where specific factors, risks and market forces prompted asset allocation decisions for the Portfolio. During the middle of the first half of 2013, our expectation that the Japanese quantitative easing program would be beneficial for mortgage-backed securities led us to add an overweight position in the sector. Toward the end of the second quarter, however, our expectation that the Federal Reserve would begin tapering its open-market bond purchases toward the end of 2013 led us to reduce our overweight position in mortgage-backed securities. As the end of the first half neared, lackluster economic growth—along with continuing suggestions that the Federal Reserve might begin tapering its asset purchases—caused spread assets to underperform. We used this opportunity to add to the Portfolio’s overweight position in the corporate sector. This allocation decision had a favorable impact on the Portfolio’s performance. The last instance occurred in the fourth quarter of 2013 when we modestly reduced our overweight position in the corporate bond sector in an effort to mitigate credit risk in the face of tightening valuations. The reduction occurred primarily in the financial and industrial subsectors.
| 1. | “New York Life Investments” is a service mark used by New York Life Investment Management Holdings LLC and its subsidiary New York Life Investment Management LLC. |
| 2. | Please refer to pages M-2 and M-3 for additional explanations and disclosure regarding the Portfolios, their benchmark indices and service providers mentioned in the reports. |
| 3. | The terms “spread” and “yield spread” may refer to the difference in yield between a security or type of security and comparable U.S. Treasury issues. The terms may also refer to the difference in yield between two specific securities or types of securities at a given time. The term “spread assets” refers to assets that typically trade at a spread to U.S. Treasurys. |
| | | | |
| mainstayinvestments.com | | | M-31 | |
During the reporting period, which market segments were the strongest positive contributors to the Portfolio’s performance and which market segments were particularly weak?
During the reporting period, an overweight position in the corporate bond sector made the strongest positive contribution to the Portfolio’s performance. Within the corporate bond sector, the Portfolio’s overweight positions in the financial and industrial subsectors were the main drivers of performance in relation to the Barclays U.S. Aggregate Bond Index. Duration and curve positioning, along with our positioning in mortgage-backed securities and commercial mortgage-backed securities, adversely affected the Portfolio’s performance during the reporting period.
Did the Portfolio make any significant purchases or sales during the reporting period?
We made purchases and sales throughout the reporting period, as previously described, when the asset allocation of the Portfolio was modified. The purpose of these sales and purchases, in the aggregate, was to adjust positions in spread assets.
How did the Portfolio’s sector weightings change during the reporting period?
The Portfolio held overweight positions relative to the Barclays U.S. Aggregate Bond Index within the finan-
cial, industrial and utility subsectors of the corporate bond sector. These overweight positions were maintained during the first half of the reporting period. During the second quarter, these industry weightings were increased as we sought to take advantage of attractive valuations. During the fourth quarter, the financial and industrial subsectors were modestly decreased in an effort to reduce spread-asset risk. Throughout the reporting period, we added to an already overweight position in the asset-backed securities sector. The majority of the increase, however, occurred during the first half of 2013.
How was the Portfolio positioned at the end of the reporting period?
As of December 31, 2013, the Portfolio held overweight positions in spread assets that were offset by an underweight position relative to the Barclays U.S. Aggregate Bond Index in U.S. Treasury securities. The largest overweight allocation within spread assets was in the corporate bond sector. As of the same date, the overall duration of the Portfolio was slightly shorter than the duration of the Barclays U.S. Aggregate Bond Index.
The opinions expressed are those of the portfolio managers as of the date of this report and are subject to change. There is no guarantee that any forecasts will come to pass. This material does not constitute investment advice and is not intended as an endorsement of any specific investment.
Not all MainStay VP Portfolios and/or share classes are available under all policies.
| | |
| M-32 | | MainStay VP Bond Portfolio |
Portfolio of Investments December 31, 2013
| | | | | | | | |
| | | Principal
Amount | | | Value | |
Long-Term Bonds 98.8%† Asset-Backed Securities 9.0% | |
Auto Floor Plan 1.0% | |
CNH Wholesale Master Note Trust
Series 2013-2A, Class A
0.767%, due 8/15/19 (a)(b) | | $ | 4,200,000 | | | $ | 4,205,532 | |
Ford Credit Floorplan Master
Owner Trust A | | | | | | | | |
Series 2013-5, Class A2
0.637%, due 9/15/18 (a) | | | 3,000,000 | | | | 3,007,359 | |
Series 2013-4, Class A2
0.717%, due 6/15/20 (a) | | | 1,600,000 | | | | 1,602,590 | |
Navistar Financial Dealer Note
Master Trust
Series 2013-2, Class A
0.845%, due 9/25/18 (a)(b) | | | 1,900,000 | | | | 1,907,640 | |
| | | | | | | | |
| | | | | | | 10,723,121 | |
| | | | | | | | |
Automobile 0.5% | |
Chesapeake Funding LLC
Series 2013-1A, Class A
0.618%, due 1/7/25 (a)(b) | | | 2,000,000 | | | | 1,995,180 | |
Huntington Auto Trust
Series 2012-2, Class A3
0.51%, due 4/17/17 | | | 3,300,000 | | | | 3,293,129 | |
| | | | | | | | |
| | | | | | | 5,288,309 | |
| | | | | | | | |
Credit Cards 0.4% | |
American Express Issuance Trust II
Series 2013-2, Class A
0.597%, due 8/15/19 (a) | | | 1,200,000 | | | | 1,203,397 | |
Citibank Credit Card Issuance Trust
Series 2013-A7, Class A7
0.60%, due 9/10/20 (a) | | | 1,500,000 | | | | 1,502,649 | |
Discover Card Master Trust
Series 2012-A1, Class A1
0.81%, due 8/15/17 | | | 1,157,000 | | | | 1,161,050 | |
| | | | | | | | |
| | | | | | | 3,867,096 | |
| | | | | | | | |
Home Equity 1.0% | |
Chase Funding Mortgage Loan Asset-Backed Certificates
Series 2002-2, Class 1A5
6.333%, due 4/25/32 (c)(d) | | | 374,988 | | | | 382,973 | |
CIT Group Home Equity Loan Trust
Series 2003-1, Class A4
3.93%, due 3/20/32 (c)(d) | | | 577,854 | | | | 587,788 | |
Citifinancial Mortgage Securities, Inc.
Series 2003-3, Class AF5
5.053%, due 8/25/33 (c)(d) | | | 289,930 | | | | 287,790 | |
| | | | | | | | |
| | | Principal
Amount | | | Value | |
Home Equity (continued) | |
Citigroup Mortgage Loan Trust, Inc.
Series 2006-WF2, Class A2C
5.852%, due 5/25/36 (c) | | $ | 160,497 | | | $ | 100,938 | |
Countrywide Asset-Backed Certificates | | | | | | | | |
Series 2006-S8, Class A3
5.555%, due 4/25/36 (a)(d) | | | 924,580 | | | | 841,057 | |
Series 2007-S1, Class A3
5.81%, due 11/25/36 (a)(d) | | | 475,002 | | | | 445,357 | |
Credit-Based Asset Servicing and Securitization LLC | | | | | | | | |
Series 2007-CB2, Class A2C
4.936%, due 2/25/37 (c)(d) | | | 972,817 | | | | 704,398 | |
Series 2007-CB4, Class A2B
4.936%, due 4/25/37 (c)(d) | | | 500,000 | | | | 344,528 | |
Equity One ABS, Inc.
Series 2003-4, Class AF6
5.333%, due 10/25/34 (c)(d) | | | 651,857 | | | | 660,988 | |
JPMorgan Mortgage Acquisition Corp. | | | | | | | | |
Series 2007-CH2, Class AF3
5.052%, due 1/25/37 (c)(d) | | | 1,000,000 | | | | 716,091 | |
Series 2007-CH1, Class AF3
5.338%, due 11/25/36 (c)(d) | | | 835,893 | | | | 847,414 | |
Series 2006-WF1, Class A6
6.00%, due 7/25/36 (c)(d) | | | 739,185 | | | | 442,534 | |
Morgan Stanley Mortgage Loan Trust
Series 2006-17XS, Class A3A
5.651%, due 10/25/46 (c) | | | 1,513,903 | | | | 1,005,763 | |
Popular ABS Mortgage Pass-Through Trust
Series 2005-5, Class AF3
4.807%, due 11/25/35 (a)(d) | | | 1,327,602 | | | | 1,301,364 | |
RAMP Trust
Series 2003-RZ5, Class A7
5.47%, due 9/25/33 (c) | | | 204,649 | | | | 211,658 | |
Saxon Asset Securities Trust
Series 2003-1, Class AF5
5.455%, due 6/25/33 (c)(d) | | | 1,357,771 | | | | 1,420,238 | |
| | | | | | | | |
| | | | | | | 10,300,879 | |
| | | | | | | | |
Other ABS 6.1% | | | | | | | | |
Apidos CDO
Series 2013-14A, Class A
1.394%, due 4/15/25 (a)(b)(e) | | | 5,300,000 | | | | 5,220,500 | |
Ares CLO, Ltd.
2013-2A, Class A1
1.501%, due 7/28/25 (a)(b)(e) | | | 5,200,000 | | | | 5,116,800 | |
Babson CLO, Ltd.
Series 2013-IA, Class A
1.342%, due 4/20/25 (a)(b)(e) | | | 5,400,000 | | | | 5,302,800 | |
| † | Percentages indicated are based on Portfolio net assets. |
| ¨ | | Among the Portfolio’s 10 largest issuers held, as of December 31, 2013, excluding short-term investments. May be subject to change daily. |
| | | | | | |
The notes to the financial statements are an integral part of,
and should be read in conjunction with, the financial statements. | | mainstayinvestments.com | | | M-33 | |
Portfolio of Investments December 31, 2013 (continued)
| | | | | | | | |
| | | Principal
Amount | | | Value | |
| Asset-Backed Securities (continued) | |
Other ABS (continued) | | | | | | | | |
Ballyrock CDO, Ltd.
Series 2013-1A, Class A
1.417%, due 5/20/25 (a)(b) | | $ | 4,300,000 | | | $ | 4,250,980 | |
Carlyle Global Market Strategies
Series 2013-3A, Class A1A
1.39%, due 7/15/25 (a)(b)(e) | | | 3,200,000 | | | | 3,148,384 | |
Series 2013-2A, Class A1
1.396%, due 4/18/25 (a)(b) | | | 2,100,000 | | | | 2,060,058 | |
Cent CLO, L.P.
Series 2013-18A, Class A
1.366%, due 7/23/25 (a)(b)(e) | | | 4,250,000 | | | | 4,180,938 | |
CNH Equipment Trust
Series 2012-C, Class A3
0.57%, due 12/15/17 | | | 2,200,000 | | | | 2,197,518 | |
Dryden Senior Loan Fund
Series 2013-26A, Class A
1.344%, due 7/15/25 (a)(b) | | | 4,300,000 | | | | 4,208,324 | |
Entergy Texas Restoration Funding LLC
Series 2009-A, Class A1
2.12%, due 2/1/16 | | | 296,146 | | | | 298,430 | |
Jamestown CLO, Ltd.
Series 2013-3A, Class A1A
1.693%, due 1/15/26 (a)(b)(e) | | | 4,600,000 | | | | 4,564,120 | |
Marriott Vacation Club Owner Trust
Series 2007-2A, Class A
5.808%, due 10/20/29 (b) | | | 762,115 | | | | 788,775 | |
Nomad CLO, Ltd.
Series 2013-1A, Class A1
1.444%, due 1/15/25 (a)(b) | | | 4,100,000 | | | | 4,035,999 | |
Octagon Investment Partners XVII, Ltd.
Series 2013-1A, Class A1
1.55%, due 10/25/25 (a)(b)(e) | | | 5,200,000 | | | | 5,161,000 | |
OHA Loan Funding, Ltd.
Series 2013-1A, Class A
1.528%, due 7/23/25 (a)(b) | | | 5,200,000 | | | | 5,143,736 | |
Race Point VIII CLO, Ltd.
Series 2013-8A, Class A
1.487%, due 2/20/25 (a)(b) | | | 4,000,000 | | | | 3,973,760 | |
Sheridan Square CLO, Ltd.
Series 2013-1A, Class A2
1.414%, due 4/15/25 (a)(b) | | | 4,100,000 | | | | 4,064,740 | |
| | | | | | | | |
| | | | | | | 63,716,862 | |
| | | | | | | | |
Total Asset-Backed Securities
(Cost $96,084,058) | | | | 93,896,267 | |
| | | | | | | | |
|
| Corporate Bonds 35.6% | |
Aerospace & Defense 0.2% | | | | | | | | |
BAE Systems PLC
4.75%, due 10/11/21 (b) | | | 2,000,000 | | | | 2,084,880 | |
| | | | | | | | |
| | | | | | | | |
| | | Principal
Amount | | | Value | |
Auto Manufacturers 0.3% | | | | | | | | |
Daimler Finance North America LLC | | | | | | | | |
2.375%, due 8/1/18 (b) | | $ | 1,725,000 | | | $ | 1,721,184 | |
3.875%, due 9/15/21 (b) | | | 1,625,000 | | | | 1,639,950 | |
| | | | | | | | |
| | | | 3,361,134 | |
| | | | | | | | |
Banks 10.7% | | | | | | | | |
Abbey National Treasury Services PLC
3.05%, due 8/23/18 | | | 3,575,000 | | | | 3,673,420 | |
American Express Bank FSB
6.00%, due 9/13/17 | | | 750,000 | | | | 862,772 | |
Bank of America Corp. | | | | | | | | |
2.00%, due 1/11/18 | | | 3,000,000 | | | | 2,994,678 | |
2.60%, due 1/15/19 | | | 3,000,000 | | | | 3,013,242 | |
4.10%, due 7/24/23 | | | 2,750,000 | | | | 2,761,668 | |
5.625%, due 7/1/20 | | | 925,000 | | | | 1,057,010 | |
BB&T Corp.
1.103%, due 6/15/18 (a) | | | 3,400,000 | | | | 3,423,848 | |
Capital One Financial Corp. | | | | | | | | |
1.00%, due 11/6/15 | | | 3,250,000 | | | | 3,248,583 | |
3.50%, due 6/15/23 | | | 2,000,000 | | | | 1,877,416 | |
¨Citigroup, Inc.
3.50%, due 5/15/23 | | | 4,000,000 | | | | 3,727,164 | |
4.587%, due 12/15/15 | | | 1,745,000 | | | | 1,864,731 | |
5.375%, due 8/9/20 | | | 3,016,000 | | | | 3,431,128 | |
6.00%, due 8/15/17 | | | 2,000,000 | | | | 2,279,520 | |
6.01%, due 1/15/15 | | | 775,000 | | | | 816,108 | |
Cooperatieve Centrale Raiffeisen-Boerenleenbank B.A. | | | | | | | | |
3.375%, due 1/19/17 | | | 550,000 | | | | 579,090 | |
5.75%, due 12/1/43 | | | 4,000,000 | | | | 4,240,344 | |
Credit Agricole S.A.
1.625%, due 4/15/16 (b) | | | 3,000,000 | | | | 3,018,498 | |
Export-Import Bank of Korea
1.75%, due 2/27/18 | | | 600,000 | | | | 583,837 | |
¨Goldman Sachs Group, Inc. (The) | | | | | |
2.375%, due 1/22/18 | | | 2,750,000 | | | | 2,760,453 | |
2.90%, due 7/19/18 | | | 4,000,000 | | | | 4,070,696 | |
5.375%, due 3/15/20 | | | 850,000 | | | | 945,310 | |
6.15%, due 4/1/18 | | | 1,250,000 | | | | 1,433,346 | |
6.25%, due 2/1/41 | | | 550,000 | | | | 633,820 | |
HSBC Bank PLC | | | | | | | | |
1.50%, due 5/15/18 (b) | | | 3,200,000 | | | | 3,124,704 | |
4.125%, due 8/12/20 (b) | | | 1,300,000 | | | | 1,375,516 | |
HSBC Bank USA N.A.
4.875%, due 8/24/20 | | | 1,500,000 | | | | 1,618,846 | |
HSBC USA, Inc.
1.128%, due 9/24/18 (a) | | | 2,800,000 | | | | 2,803,886 | |
Huntington Bancshares, Inc.
2.60%, due 8/2/18 | | | 3,350,000 | | | | 3,351,960 | |
ING Bank N.V.
5.80%, due 9/25/23 (b) | | | 4,000,000 | | | | 4,182,376 | |
| | | | |
| M-34 | | MainStay VP Bond Portfolio | | The notes to the financial statements are an integral part of,
and should be read in conjunction with, the financial statements. |
| | | | | | | | |
| | | Principal
Amount | | | Value | |
| Corporate Bonds (continued) | |
Banks (continued) | | | | | | | | |
JPMorgan Chase & Co.
1.80%, due 1/25/18 | | $ | 1,550,000 | | | $ | 1,536,394 | |
5.40%, due 1/6/42 | | | 2,425,000 | | | | 2,610,646 | |
Korea Development Bank (The)
3.875%, due 5/4/17 | | | 1,300,000 | | | | 1,370,239 | |
Lloyds Bank PLC
2.30%, due 11/27/18 | | | 1,175,000 | | | | 1,171,952 | |
Morgan Stanley | | | | | | | | |
4.10%, due 5/22/23 | | | 3,000,000 | | | | 2,903,253 | |
4.875%, due 11/1/22 | | | 1,675,000 | | | | 1,714,632 | |
5.50%, due 1/26/20 | | | 800,000 | | | | 898,058 | |
5.625%, due 9/23/19 | | | 800,000 | | | | 909,349 | |
6.625%, due 4/1/18 | | | 600,000 | | | | 702,056 | |
Royal Bank of Scotland Group PLC
2.55%, due 9/18/15 | | | 2,400,000 | | | | 2,454,617 | |
Santander UK PLC
5.00%, due 11/7/23 (b) | | | 4,175,000 | | | | 4,190,531 | |
Skandinaviska Enskilda Banken AB
1.75%, due 3/19/18 (b) | | | 3,000,000 | | | | 2,938,878 | |
Societe Generale S.A.
1.327%, due 10/1/18 (a) | | | 3,000,000 | | | | 3,017,223 | |
2.75%, due 10/12/17 | | | 1,950,000 | | | | 2,009,865 | |
Sumitomo Mitsui Trust Bank, Ltd.
1.024%, due 9/16/16 (a)(b) | | | 2,150,000 | | | | 2,160,348 | |
SunTrust Banks, Inc.
2.35%, due 11/1/18 | | | 1,425,000 | | | | 1,417,450 | |
UBS A.G.
2.25%, due 1/28/14 | | | 1,627,000 | | | | 1,629,094 | |
Union Bank N.A.
0.996%, due 9/26/16 (a) | | | 1,000,000 | | | | 1,008,931 | |
Wells Fargo & Co. | | | | | | | | |
2.15%, due 1/15/19 | | | 1,000,000 | | | | 996,868 | |
5.375%, due 11/2/43 | | | 4,500,000 | | | | 4,608,027 | |
Westpac Banking Corp.
1.125%, due 9/25/15 | | | 1,050,000 | | | | 1,061,386 | |
| | | | | | | | |
| | | | 111,063,767 | |
| | | | | | | | |
Building Materials 0.1% | | | | | | | | |
CRH America, Inc.
4.125%, due 1/15/16 | | | 675,000 | | | | 712,239 | |
| | | | | | | | |
| | |
Chemicals 0.8% | | | | | | | | |
Cabot Corp.
5.00%, due 10/1/16 | | | 2,100,000 | | | | 2,298,962 | |
Dow Chemical Co. (The)
5.70%, due 5/15/18 | | | 345,000 | | | | 394,443 | |
NewMarket Corp.
4.10%, due 12/15/22 | | | 5,536,000 | | | | 5,273,760 | |
| | | | | | | | |
| | | | 7,967,165 | |
| | | | | | | | |
| | | | | | | | |
| | | Principal
Amount | | | Value | |
Computers 0.5% | |
Hewlett-Packard Co. | | | | | | | | |
2.35%, due 3/15/15 | | $ | 2,600,000 | | | $ | 2,640,687 | |
3.30%, due 12/9/16 | | | 2,750,000 | | | | 2,878,222 | |
| | | | | | | | |
| | | | | | | 5,518,909 | |
| | | | | | | | |
Cosmetics & Personal Care 0.1% | | | | | | | | |
Procter & Gamble Co. (The)
1.45%, due 8/15/16 | | | 1,000,000 | | | | 1,014,593 | |
| | | | | | | | |
| | |
Diversified Financial Services 0.4% | | | | | | | | |
General Electric Capital Corp. | | | | | | | | |
4.65%, due 10/17/21 | | | 625,000 | | | | 680,905 | |
5.50%, due 1/8/20 | | | 2,300,000 | | | | 2,633,875 | |
5.875%, due 1/14/38 | | | 1,000,000 | | | | 1,139,114 | |
| | | | | | | | |
| | | | | | | 4,453,894 | |
| | | | | | | | |
Electric 3.7% | | | | | | | | |
Appalachian Power Co.
6.375%, due 4/1/36 | | | 1,750,000 | | | | 1,946,175 | |
Arizona Public Service Co.
5.50%, due 9/1/35 | | | 1,275,000 | | | | 1,368,356 | |
Dayton Power & Light Co. (The)
1.875%, due 9/15/16 (b) | | | 1,725,000 | | | | 1,739,093 | |
Duke Energy Progress, Inc.
6.125%, due 9/15/33 | | | 500,000 | | | | 560,190 | |
Entergy Louisiana LLC | | | | | | | | |
1.875%, due 12/15/14 | | | 375,000 | | | | 379,995 | |
3.30%, due 12/1/22 | | | 800,000 | | | | 752,278 | |
Entergy Mississippi, Inc.
3.10%, due 7/1/23 | | | 675,000 | | | | 627,107 | |
FirstEnergy Corp.
4.25%, due 3/15/23 | | | 3,200,000 | | | | 2,982,890 | |
GDF Suez
1.625%, due 10/10/17 (b) | | | 1,150,000 | | | | 1,138,374 | |
Great Plains Energy, Inc.
4.85%, due 6/1/21 | | | 385,000 | | | | 405,651 | |
5.292%, due 6/15/22 (c) | | | 340,000 | | | | 364,779 | |
Kansas City Power & Light Co.
7.15%, due 4/1/19 | | | 900,000 | | | | 1,097,718 | |
NextEra Energy Capital Holdings, Inc.
1.20%, due 6/1/15 | | | 1,450,000 | | | | 1,457,430 | |
1.339%, due 9/1/15 | | | 3,500,000 | | | | 3,523,310 | |
Nisource Finance Corp.
4.80%, due 2/15/44 | | | 1,325,000 | | | | 1,195,501 | |
5.65%, due 2/1/45 | | | 4,300,000 | | | | 4,404,679 | |
Ohio Edison Co.
6.875%, due 7/15/36 | | | 2,500,000 | | | | 2,931,937 | |
Pacific Gas & Electric Co.
5.125%, due 11/15/43 | | | 5,250,000 | | | | 5,421,449 | |
Pepco Holdings, Inc.
2.70%, due 10/1/15 | | | 1,000,000 | | | | 1,025,391 | |
| | | | | | |
The notes to the financial statements are an integral part of,
and should be read in conjunction with, the financial statements. | | mainstayinvestments.com | | | M-35 | |
Portfolio of Investments December 31, 2013 (continued)
| | | | | | | | |
| | | Principal
Amount | | | Value | |
| Corporate Bonds (continued) | |
Electric (continued) | | | | | | | | |
PPL Capital Funding, Inc. | | | | | | | | |
3.50%, due 12/1/22 | | $ | 875,000 | | | $ | 826,358 | |
4.20%, due 6/15/22 | | | 2,000,000 | | | | 1,996,332 | |
Union Electric Co.
6.70%, due 2/1/19 | | | 1,500,000 | | | | 1,799,739 | |
| | | | | | | | |
| | | | | | | 37,944,732 | |
| | | | | | | | |
Electronics 0.5% | | | | | | | | |
Thermo Fisher Scientific, Inc. | | | | | | | | |
2.40%, due 2/1/19 | | | 2,200,000 | | | | 2,179,520 | |
5.30%, due 2/1/44 | | | 3,350,000 | | | | 3,387,436 | |
| | | | | | | | |
| | | | | | | 5,566,956 | |
| | | | | | | | |
Finance—Auto Loans 0.9% | | | | | | | | |
American Honda Finance Corp. | | | | | | | | |
0.744%, due 10/7/16 (a) | | | 1,000,000 | | | | 1,005,201 | |
2.125%, due 10/10/18 | | | 1,125,000 | | | | 1,120,368 | |
2.60%, due 9/20/16 (b) | | | 1,500,000 | | | | 1,560,620 | |
Ford Motor Credit Co. LLC | | | | | | | | |
3.00%, due 6/12/17 | | | 1,775,000 | | | | 1,844,789 | |
4.375%, due 8/6/23 | | | 4,275,000 | | | | 4,297,910 | |
| | | | | | | | |
| | | | | | | 9,828,888 | |
| | | | | | | | |
Finance—Consumer Loans 0.1% | | | | | | | | |
John Deere Capital Corp.
1.70%, due 1/15/20 | | | 1,000,000 | | | | 941,681 | |
| | | | | | | | |
| | |
Finance—Credit Card 0.1% | | | | | | | | |
Capital One Bank USA N.A.
2.15%, due 11/21/18 | | | 1,325,000 | | | | 1,317,911 | |
| | | | | | | | |
| |
Finance—Investment Banker/Broker 0.1% | | | | | |
BNP Paribas Home Loan Covered Bonds S.A.
2.20%, due 11/2/15 (b) | | | 500,000 | | | | 512,600 | |
Credit Suisse A.G. / Guernsey
2.60%, due 5/27/16 (b) | | | 575,000 | | | | 598,094 | |
| | | | | | | | |
| | | | | | | 1,110,694 | |
| | | | | | | | |
Finance—Other Services 0.2% | | | | | | | | |
National Rural Utilities Cooperative Finance Corp.
2.35%, due 6/15/20 | | | 1,850,000 | | | | 1,786,730 | |
| | | | | | | | |
| |
Food 0.9% | | | | | |
Ingredion, Inc. | | | | | | | | |
1.80%, due 9/25/17 | | | 1,600,000 | | | | 1,559,449 | |
4.625%, due 11/1/20 | | | 2,150,000 | | | | 2,241,788 | |
Kroger Co. (The) | | | | | | | | |
5.15%, due 8/1/43 | | | 2,250,000 | | | | 2,194,884 | |
7.70%, due 6/1/29 | | | 1,000,000 | | | | 1,227,182 | |
| | | | | | | | |
| | | Principal
Amount | | | Value | |
Food (continued) | | | | | |
Safeway, Inc.
3.40%, due 12/1/16 | | $ | 2,500,000 | | | $ | 2,601,030 | |
| | | | | | | | |
| | | | | | | 9,824,333 | |
| | | | | | | | |
Gas 0.5% | | | | | | | | |
Boston Gas Co.
4.487%, due 2/15/42 (b) | | | 1,250,000 | | | | 1,181,639 | |
KeySpan Gas East Corp.
5.819%, due 4/1/41 (b) | | | 2,000,000 | | | | 2,243,756 | |
Sempra Energy
2.30%, due 4/1/17 | | | 1,725,000 | | | | 1,747,344 | |
| | | | | | | | |
| | | | | | | 5,172,739 | |
| | | | | | | | |
Hand & Machine Tools 0.1% | | | | | | | | |
Stanley Black & Decker, Inc.
3.40%, due 12/1/21 | | | 1,150,000 | | | | 1,129,926 | |
| | | | | | | | |
| | |
Insurance 3.6% | | | | | | | | |
Arch Capital Group U.S., Inc.
5.144%, due 11/1/43 | | | 4,500,000 | | | | 4,499,514 | |
Assurant, Inc.
2.50%, due 3/15/18 | | | 2,500,000 | | | | 2,442,635 | |
Berkshire Hathaway Finance Corp.
4.30%, due 5/15/43 | | | 2,750,000 | | | | 2,476,664 | |
Farmers Exchange Capital II
6.151%, due 11/1/53 (a)(b) | | | 3,000,000 | | | | 3,071,193 | |
Five Corners Funding Trust
4.419%, due 11/15/23 (b) | | | 3,300,000 | | | | 3,252,883 | |
ING U.S., Inc.
2.90%, due 2/15/18 | | | 1,350,000 | | | | 1,380,761 | |
5.70%, due 7/15/43 | | | 3,575,000 | | | | 3,735,146 | |
Markel Corp.
5.00%, due 3/30/43 | | | 1,125,000 | | | | 1,052,093 | |
MetLife, Inc.
1.756%, due 12/15/17 | | | 1,950,000 | | | | 1,929,316 | |
Metropolitan Life Global Funding I
3.125%, due 1/11/16 (b) | | | 1,325,000 | | | | 1,381,103 | |
Nationwide Financial Services, Inc.
5.375%, due 3/25/21 (b) | | | 1,850,000 | | | | 1,983,490 | |
Pacific LifeCorp
5.125%, due 1/30/43 (b) | | | 4,900,000 | | | | 4,505,256 | |
Principal Financial Group, Inc.
8.875%, due 5/15/19 | | | 810,000 | | | | 1,035,609 | |
QBE Insurance Group, Ltd.
2.40%, due 5/1/18 (b) | | | 1,875,000 | | | | 1,801,313 | |
XLIT, Ltd.
5.25%, due 12/15/43 | | | 2,625,000 | | | | 2,642,582 | |
| | | | | | | | |
| | | | | | | 37,189,558 | |
| | | | | | | | |
Investment Management/Advisory Services 0.2% | |
Invesco Finance PLC
5.375%, due 11/30/43 | | | 2,500,000 | | | | 2,522,115 | |
| | | | | | | | |
| | | | |
| M-36 | | MainStay VP Bond Portfolio | | The notes to the financial statements are an integral part of,
and should be read in conjunction with, the financial statements. |
| | | | | | | | |
| | | Principal
Amount | | | Value | |
| Corporate Bonds (continued) | |
Iron & Steel 0.5% | |
ArcelorMittal
4.25%, due 2/25/15 | | $ | 1,325,000 | | | $ | 1,361,438 | |
Carpenter Technology Corp.
4.45%, due 3/1/23 | | | 1,825,000 | | | | 1,751,087 | |
Reliance Steel & Aluminum Co.
4.50%, due 4/15/23 | | | 2,300,000 | | | | 2,256,114 | |
| | | | | | | | |
| | | | | | | 5,368,639 | |
| | | | | | | | |
Machinery—Diversified 0.1% | | | | | | | | |
Deere & Co.
5.375%, due 10/16/29 | | | 1,100,000 | | | | 1,235,120 | |
| | | | | | | | |
| | |
Media 0.3% | | | | | | | | |
21st Century Fox America, Inc.
6.40%, due 12/15/35 | | | 2,500,000 | | | | 2,841,885 | |
COX Communications, Inc.
5.45%, due 12/15/14 | | | 480,000 | | | | 501,625 | |
| | | | | | | | |
| | | | | | | 3,343,510 | |
| | | | | | | | |
Mining 1.0% | | | | | | | | |
Barrick Gold Corp.
4.10%, due 5/1/23 | | | 5,275,000 | | | | 4,768,025 | |
Freeport-McMoRan Copper & Gold, Inc.
3.875%, due 3/15/23 | | | 1,750,000 | | | | 1,654,879 | |
Rio Tinto Finance USA PLC
1.084%, due 6/17/16 (a) | | | 3,000,000 | | | | 3,021,285 | |
Rio Tinto Finance USA, Ltd.
3.75%, due 9/20/21 | | | 750,000 | | | | 757,198 | |
| | | | | | | | |
| | | | | | | 10,201,387 | |
| | | | | | | | |
Miscellaneous—Manufacturing 0.5% | | | | | | | | |
Carlisle Cos., Inc.
6.125%, due 8/15/16 | | | 2,500,000 | | | | 2,760,588 | |
General Electric Co.
4.125%, due 10/9/42 | | | 2,075,000 | | | | 1,917,005 | |
| | | | | | | | |
| | | | | | | 4,677,593 | |
| | | | | | | | |
Oil & Gas 1.7% | | | | | | | | |
Anadarko Petroleum Corp.
5.95%, due 9/15/16 | | | 3,600,000 | | | | 4,010,634 | |
BP Capital Markets PLC
3.125%, due 10/1/15 | | | 1,400,000 | | | | 1,462,648 | |
Pemex Project Funding Master Trust
5.75%, due 3/1/18 | | | 2,000,000 | | | | 2,230,000 | |
Petrobras International Finance Co. | | | | | | | | |
2.875%, due 2/6/15 | | | 2,350,000 | | | | 2,385,255 | |
5.375%, due 1/27/21 | | | 4,150,000 | | | | 4,118,410 | |
Petroleos Mexicanos
3.50%, due 1/30/23 | | | 1,575,000 | | | | 1,443,094 | |
Plains Exploration & Production Co.
6.75%, due 2/1/22 | | | 1,000,000 | | | | 1,101,524 | |
| | | | | | | | |
| | | Principal
Amount | | | Value | |
Oil & Gas (continued) | | | | | | | | |
Statoil ASA
3.125%, due 8/17/17 | | $ | 350,000 | | | $ | 367,405 | |
Valero Energy Corp.
6.625%, due 6/15/37 | | | 550,000 | | | | 627,404 | |
| | | | | | | | |
| | | | | | | 17,746,374 | |
| | | | | | | | |
Oil & Gas Services 0.1% | | | | | | | | |
Cameron International Corp.
1.60%, due 4/30/15 | | | 500,000 | | | | 503,054 | |
| | | | | | | | |
| | |
Packaging & Containers 0.4% | | | | | | | | |
Packaging Corp. of America
4.50%, due 11/1/23 | | | 3,800,000 | | | | 3,809,929 | |
| | | | | | | | |
| | |
Pharmaceuticals 0.7% | | | | | | | | |
Cardinal Health, Inc.
1.90%, due 6/15/17 | | | 2,165,000 | | | | 2,169,594 | |
Merck Sharp & Dohme Corp.
5.95%, due 12/1/28 | | | 1,200,000 | | | | 1,399,497 | |
Mylan, Inc.
2.60%, due 6/24/18 (b) | | | 1,750,000 | | | | 1,751,013 | |
Novartis Securities Investment, Ltd.
5.125%, due 2/10/19 | | | 800,000 | | | | 905,896 | |
Sanofi
4.00%, due 3/29/21 | | | 1,000,000 | | | | 1,047,613 | |
| | | | | | | | |
| | | | | | | 7,273,613 | |
| | | | | | | | |
Pipelines 1.4% | | | | | | | | |
Energy Transfer Partners, L.P. | | | | | | | | |
4.15%, due 10/1/20 | | | 5,975,000 | | | | 6,062,122 | |
6.50%, due 2/1/42 | | | 1,300,000 | | | | 1,397,180 | |
Enterprise Products Operating LLC
1.25%, due 8/13/15 | | | 1,550,000 | | | | 1,560,298 | |
Kinder Morgan Energy Partners, L.P.
6.375%, due 3/1/41 | | | 400,000 | | | | 431,518 | |
Spectra Energy Partners, L.P.
2.95%, due 9/25/18 | | | 2,750,000 | | | | 2,787,469 | |
Texas Eastern Transmission, L.P.
2.80%, due 10/15/22 (b) | | | 2,350,000 | | | | 2,101,377 | |
| | | | | | | | |
| | | | | | | 14,339,964 | |
| | | | | | | | |
Real Estate 0.2% | | | | | | | | |
Regency Centers, L.P.
4.80%, due 4/15/21 | | | 1,050,000 | | | | 1,098,794 | |
WEA Finance LLC / WT Finance Australia Property, Ltd.
5.75%, due 9/2/15 (b) | | | 877,000 | | | | 945,954 | |
| | | | | | | | |
| | | | | | | 2,044,748 | |
| | | | | | | | |
Real Estate Investment Trusts 2.3% | | | | | | | | |
Brandywine Operating Partnership, L.P.
5.70%, due 5/1/17 | | | 3,157,000 | | | | 3,473,701 | |
| | | | | | |
The notes to the financial statements are an integral part of,
and should be read in conjunction with, the financial statements. | | mainstayinvestments.com | | | M-37 | |
Portfolio of Investments December 31, 2013 (continued)
| | | | | | | | |
| | | Principal
Amount | | | Value | |
| Corporate Bonds (continued) | |
Real Estate Investment Trusts (continued) | |
CBL & Associates, L.P.
5.25%, due 12/1/23 | | $ | 5,000,000 | | | $ | 4,993,355 | |
DDR Corp.
4.625%, due 7/15/22 | | | 1,500,000 | | | | 1,529,966 | |
4.75%, due 4/15/18 | | | 2,000,000 | | | | 2,157,476 | |
Hospitality Properties Trust
6.30%, due 6/15/16 | | | 1,325,000 | | | | 1,430,380 | |
Host Hotels & Resorts, L.P.
6.00%, due 10/1/21 | | | 1,700,000 | | | | 1,850,994 | |
Kilroy Realty, L.P.
3.80%, due 1/15/23 | | | 1,000,000 | | | | 932,555 | |
Liberty Property, L.P.
4.40%, due 2/15/24 | | | 1,850,000 | | | | 1,816,526 | |
ProLogis, L.P. | | | | | | | | |
4.25%, due 8/15/23 | | | 2,325,000 | | | | 2,296,763 | |
6.625%, due 5/15/18 | | | 1,770,000 | | | | 2,067,307 | |
6.875%, due 3/15/20 | | | 1,500,000 | | | | 1,766,716 | |
| | | | | | | | |
| | | | | | | 24,315,739 | |
| | | | | | | | |
Semiconductors 0.2% | | | | | | | | |
Samsung Electronics America, Inc.
1.75%, due 4/10/17 (b) | | | 2,475,000 | | | | 2,459,150 | |
| | | | | | | | |
| | |
Software 0.1% | | | | | | | | |
Fiserv, Inc.
4.75%, due 6/15/21 | | | 1,355,000 | | | | 1,380,009 | |
| | | | | | | | |
| | |
Telecommunications 1.8% | | | | | | | | |
AT&T, Inc.
2.375%, due 11/27/18 | | | 1,500,000 | | | | 1,501,287 | |
Cellco Partnership / Verizon Wireless Capital LLC
8.50%, due 11/15/18 | | | 1,500,000 | | | | 1,899,199 | |
Deutsche Telekom International Finance B.V. | | | | | | | | |
2.25%, due 3/6/17 (b) | | | 1,150,000 | | | | 1,166,382 | |
3.125%, due 4/11/16 (b) | | | 1,000,000 | | | | 1,041,532 | |
Orange S.A.
5.375%, due 1/13/42 | | | 1,675,000 | | | | 1,682,256 | |
Telecom Italia Capital S.A.
5.25%, due 10/1/15 | | | 250,000 | | | | 262,813 | |
Telefonica Emisiones SAU
5.134%, due 4/27/20 | | | 4,275,000 | | | | 4,541,585 | |
Verizon Communications, Inc.
5.15%, due 9/15/23 | | | 3,000,000 | | | | 3,221,076 | |
6.40%, due 9/15/33 | | | 2,250,000 | | | | 2,587,772 | |
7.35%, due 4/1/39 | | | 1,000,000 | | | | 1,241,993 | |
| | | | | | | | |
| | | | | | | 19,145,895 | |
| | | | | | | | |
| | | | | | | | |
| | | Principal
Amount | | | Value | |
Textiles 0.1% | | | | | | | | |
Mohawk Industries, Inc.
3.85%, due 2/1/23 | | $ | 925,000 | | | $ | 878,750 | |
| | | | | | | | |
| | |
Transportation 0.2% | | | | | | | | |
Norfolk Southern Corp.
5.64%, due 5/17/29 | | | 1,400,000 | | | | 1,514,846 | |
| | | | | | | | |
Total Corporate Bonds
(Cost $366,010,948) | | | | | | | 370,751,164 | |
| | | | | | | | |
| |
| Foreign Government Bonds 0.7% | | | | | |
Sovereign 0.7% | | | | | | | | |
Brazilian Government
International Bond
2.625%, due 1/5/23 | | | 3,000,000 | | | | 2,580,000 | |
Italy Government
International Bond
4.75%, due 1/25/16 | | | 2,500,000 | | | | 2,660,250 | |
Poland Government
International Bond
5.00%, due 3/23/22 | | | 350,000 | | | | 374,063 | |
Turkey Government International Bond
6.75%, due 4/3/18 | | | 1,250,000 | | | | 1,357,500 | |
| | | | | | | | |
Total Foreign Government Bonds
(Cost $7,319,319) | | | | | | | 6,971,813 | |
| | | | | | | | |
| |
| Mortgage-Backed Securities 5.8% | | | | | |
Commercial Mortgage Loans
(Collateralized Mortgage
Obligations) 5.6% | |
Bear Stearns Commercial Mortgage Securities Trust
Series 2006-PW11, Class A3
5.439%, due 3/11/39 (f) | | | 1,000,000 | | | | 1,013,642 | |
Series 2006-PW11, Class AM
5.439%, due 3/11/39 (f) | | | 500,000 | | | | 541,205 | |
Series 2006-PW12, Class AAB
5.685%, due 9/11/38 (f) | | | 259,926 | | | | 260,242 | |
Series 2007-PW16, Class A4
5.706%, due 6/11/40 (f) | | | 1,700,000 | | | | 1,906,438 | |
Boca Hotel Portfolio Trust
Series 2013-BOCA, Class A
1.317%, due 8/15/26 (a)(b) | | | 3,420,913 | | | | 3,426,756 | |
CGBAM Commercial
Mortgage Trust
Series 2013-BREH, Class B
1.967%, due 5/15/30 (a)(b) | | | 2,500,000 | | | | 2,502,845 | |
Citigroup Commercial
Mortgage Trust
Series 2006-C5, Class A4
5.431%, due 10/15/49 | | | 3,700,000 | | | | 4,036,955 | |
Commercial Mortgage Pass Through Certificates
Series 2013-THL, Class A2
1.218%, due 6/8/30 (a)(b) | | | 3,400,000 | | | | 3,391,690 | |
Series 2007-C9, Class A4
5.80%, due 12/10/49 (f) | | | 2,370,000 | | | | 2,672,488 | |
| | | | |
| M-38 | | MainStay VP Bond Portfolio | | The notes to the financial statements are an integral part of,
and should be read in conjunction with, the financial statements. |
| | | | | | | | |
| | | Principal
Amount | | | Value | |
| Mortgage-Backed Securities (continued) | | | | | |
Commercial Mortgage Loans
(Collateralized Mortgage Obligations) (continued) | |
Credit Suisse Mortgage Capital Certificates
Series 2006-C1, Class AM
5.465%, due 2/15/39 (a) | | $ | 2,300,000 | | | $ | 2,457,647 | |
¨JP Morgan Chase Commercial Mortgage Securities Corp. | | | | | | | | |
Series 2012-C6, Class A2
2.206%, due 5/15/45 | | | 2,400,000 | | | | 2,442,766 | |
Series 2005-CB13, Class A4
5.244%, due 1/12/43 (f) | | | 1,170,000 | | | | 1,241,860 | |
Series 2006-CB17, Class A4
5.429%, due 12/12/43 | | | 5,000,000 | | | | 5,411,415 | |
Series 2006-CB15, Class A4
5.814%, due 6/12/43 (a) | | | 1,602,103 | | | | 1,728,451 | |
LB-UBS Commercial Mortgage Trust
Series 2006-C7, Class A3
5.347%, due 11/15/38 | | | 2,300,000 | | | | 2,525,306 | |
Series 2007-C7, Class A3
5.866%, due 9/15/45 (a) | | | 3,033,124 | | | | 3,363,911 | |
Merrill Lynch / Countrywide Commercial Mortgage Trust
Series 2006-4, Class A3
5.172%, due 12/12/49 | | | 2,080,000 | | | | 2,255,047 | |
ML-CFC Commercial Mortgage TrustSeries 2007-6, Class A4
5.485%, due 3/12/51 (a) | | | 4,350,000 | | | | 4,784,904 | |
Morgan Stanley Bank of America Merrill Lynch Trust
Series 2013-C13, Class A4
4.039%, due 11/15/46 (a) | | | 2,900,000 | | | | 2,922,808 | |
Morgan Stanley Capital I, Inc.
Series 2011-C2, Class A2
3.476%, due 6/15/44 (b) | | | 600,000 | | | | 632,095 | |
Series 2006-HQ10, Class A4
5.328%, due 11/12/41 | | | 726,437 | | | | 792,604 | |
Series 2007-T25, Class A3
5.514%, due 11/12/49 (a) | | | 2,300,000 | | | | 2,541,817 | |
Series 2006-IQ11, Class A4
5.665%, due 10/15/42 (f) | | | 383,298 | | | | 411,032 | |
Series 2007-IQ16, Class A4 5.809%, due 12/12/49 | | | 4,000,000 | | | | 4,471,748 | |
Wachovia Bank Commercial Mortgage Trust
Series 2006-C29, Class A4
5.308%, due 11/15/48 | | | 500,000 | | | | 546,447 | |
| | | | | | | | |
| | | Principal
Amount | | | Value | |
Commercial Mortgage Loans
(Collateralized Mortgage Obligations) (continued) | |
WFRBS Commercial Mortgage Trust
Series 2013-C11, Class A2
2.029%, due 3/15/45 | | $ | 200,000 | | | $ | 199,536 | |
| | | | | | | | |
| | | | | | | 58,481,655 | |
| | | | | | | | |
Whole Loan Collateral (Collateralized Mortgage Obligations) 0.2% | |
Banc of America Funding Corp.
Series 2006-7, Class T2A3
5.695%, due 10/25/36 (a) | | | 519,601 | | | | 392,687 | |
Structured Adjustable Rate Mortgage Loan Trust
Series 2006-8, Class 4A3
5.245%, due 9/25/36 (f) | | | 973,168 | | | | 815,496 | |
TBW Mortgage-Backed
Pass-Through Certificates
Series 2006-6, Class A2B
5.66%, due 1/25/37 (c) | | | 1,447,592 | | | | 811,995 | |
| | | | | | | | |
| | | | | | | 2,020,178 | |
| | | | | | | | |
Total Mortgage-Backed Securities
(Cost $61,191,272) | | | | | | | 60,501,833 | |
| | | | | | | | |
| | |
| Municipal Bonds 0.9% | | | | | | | | |
California 0.2% | | | | | | | | |
Sacramento Municipal Utility District
6.322%, due 5/15/36 | | | 1,650,000 | | | | 1,820,280 | |
| | | | | | | | |
| | |
Connecticut 0.2% | | | | | | | | |
State of Connecticut Special Tax Revenue
5.74%, due 12/1/29 | | | 1,720,000 | | | | 1,806,344 | |
| | | | | | | | |
| | |
Texas 0.5% | | | | | | | | |
City of San Antonio, Texas, Water System Revenue
5.502%, due 5/15/29 | | | 2,000,000 | | | | 2,141,820 | |
Dallas Area Rapid Transit
5.022%, due 12/1/48 | | | 700,000 | | | | 718,991 | |
Texas Transportation Commission
5.178%, due 4/1/30 | | | 2,150,000 | | | | 2,315,056 | |
| | | | | | | | |
| | | | | | | 5,175,867 | |
| | | | | | | | |
Washington 0.0%‡ | | | | | | | | |
City of Seattle, Washington, Water System Revenue
5.62%, due 8/1/30 | | | 340,000 | | | | 373,051 | |
| | | | | | | | |
Total Municipal Bonds
(Cost $10,202,329) | | | | | | | 9,175,542 | |
| | | | | | | | |
| | | | | | |
The notes to the financial statements are an integral part of,
and should be read in conjunction with, the financial statements. | | mainstayinvestments.com | | | M-39 | |
Portfolio of Investments December 31, 2013 (continued)
| | | | | | | | |
| | | Principal
Amount | | | Value | |
| U.S. Government & Federal Agencies 46.8% | |
Federal Home Loan Bank 0.1% | | | | | | | | |
1.30%, due 6/5/18 | | $ | 1,500,000 | | | $ | 1,462,173 | |
| | | | | | | | |
|
¨Federal Home Loan Mortgage Corporation 1.5% | |
1.00%, due 9/27/17 | | | 1,325,000 | | | | 1,307,775 | |
1.00%, due 1/11/18 | | | 1,600,000 | | | | 1,565,776 | |
1.125%, due 5/25/18 | | | 1,700,000 | | | | 1,655,712 | |
1.25%, due 10/2/19 | | | 2,000,000 | | | | 1,894,674 | |
1.75%, due 5/30/19 | | | 3,000,000 | | | | 2,946,900 | |
2.375%, due 1/13/22 | | | 4,000,000 | | | | 3,823,860 | |
4.75%, due 1/19/16 | | | 2,000,000 | | | | 2,175,128 | |
| | | | | | | | |
| | | | 15,369,825 | |
| | | | | | | | |
¨Federal Home Loan Mortgage Corporation
(Mortgage Pass-Through Securities) 8.3% | |
2.414%, due 12/1/41 (a) | | | 1,170,763 | | | | 1,189,867 | |
2.50%, due 6/1/28 | | | 5,400,365 | | | | 5,356,562 | |
3.00%, due 9/1/26 TBA (g) | | | 5,300,000 | | | | 5,398,133 | |
3.00%, due 9/1/33 | | | 3,367,195 | | | | 3,325,906 | |
3.00%, due 8/1/43 | | | 11,481,156 | | | | 10,890,569 | |
3.50%, due 8/1/25 TBA (g) | | | 4,100,000 | | | | 4,274,250 | |
3.50%, due 4/1/42 TBA (g) | | | 10,800,000 | | | | 10,715,625 | |
4.00%, due 3/1/15 | | | 66,484 | | | | 70,158 | |
4.00%, due 7/1/23 | | | 500,924 | | | | 530,446 | |
4.00%, due 8/1/25 | | | 229,949 | | | | 242,845 | |
4.00%, due 1/1/31 | | | 548,643 | | | | 573,910 | |
4.00%, due 3/1/41 TBA (g) | | | 4,200,000 | | | | 4,313,203 | |
4.00%, due 11/1/41 | | | 235,750 | | | | 242,297 | |
4.00%, due 1/1/42 | | | 265,886 | | | | 273,285 | |
4.00%, due 4/1/42 | | | 5,824,960 | | | | 5,986,551 | |
4.00%, due 5/1/42 | | | 479,893 | | | | 493,240 | |
4.50%, due 4/1/22 | | | 163,257 | | | | 173,456 | |
4.50%, due 4/1/23 | | | 38,966 | | | | 41,784 | |
4.50%, due 6/1/24 | | | 95,840 | | | | 102,786 | |
4.50%, due 7/1/24 | | | 222,731 | | | | 238,864 | |
4.50%, due 5/1/25 | | | 577,057 | | | | 619,249 | |
4.50%, due 4/1/31 | | | 542,983 | | | | 584,798 | |
4.50%, due 9/1/35 | | | 267,015 | | | | 282,999 | |
4.50%, due 2/1/39 | | | 472,385 | | | | 499,592 | |
4.50%, due 4/1/39 | | | 377,695 | | | | 399,521 | |
4.50%, due 6/1/39 | | | 846,654 | | | | 897,006 | |
4.50%, due 6/1/39 TBA (g) | | | 2,200,000 | | | | 2,327,789 | |
4.50%, due 11/1/39 | | | 3,398,111 | | | | 3,599,107 | |
4.50%, due 12/1/39 | | | 387,700 | | | | 410,762 | |
4.50%, due 8/1/40 | | | 297,551 | | | | 315,349 | |
4.50%, due 9/1/40 | | | 1,632,994 | | | | 1,730,516 | |
4.50%, due 11/1/40 | | | 951,971 | | | | 1,011,519 | |
5.00%, due 3/1/23 | | | 16,806 | | | | 17,801 | |
5.00%, due 6/1/23 | | | 225,404 | | | | 243,388 | |
5.00%, due 8/1/23 | | | 30,277 | | | | 32,687 | |
5.00%, due 7/1/24 | | | 186,194 | | | | 200,988 | |
| | | | | | | | |
| | | Principal
Amount | | | Value | |
Federal Home Loan Mortgage Corporation
(Mortgage Pass-Through Securities) (continued) | |
5.00%, due 3/1/25 | | $ | 446,405 | | | $ | 481,920 | |
5.00%, due 6/1/30 | | | 461,742 | | | | 498,175 | |
5.00%, due 8/1/35 | | | 188,076 | | | | 203,274 | |
5.00%, due 4/1/37 | | | 3,079,189 | | | | 3,325,280 | |
5.00%, due 8/1/37 | | | 663,005 | | | | 713,758 | |
5.00%, due 3/1/40 | | | 2,704,132 | | | | 2,925,758 | |
5.50%, due 12/1/18 | | | 170,057 | | | | 181,443 | |
5.50%, due 9/1/21 | | | 219,102 | | | | 238,268 | |
5.50%, due 9/1/22 | | | 140,308 | | | | 152,277 | |
5.50%, due 9/1/37 | | | 1,417,576 | | | | 1,544,979 | |
5.50%, due 8/1/38 | | | 638,484 | | | | 695,960 | |
5.50%, due 12/1/38 | | | 1,574,466 | | | | 1,716,013 | |
6.00%, due 7/1/21 | | | 610,078 | | | | 667,867 | |
6.00%, due 8/1/36 | | | 677,941 | | | | 752,651 | |
6.00%, due 9/1/37 | | | 738,851 | | | | 814,642 | |
6.00%, due 5/1/40 | | | 1,559,361 | | | | 1,734,494 | |
6.50%, due 7/1/17 | | | 30,214 | | | | 30,353 | |
6.50%, due 11/1/35 | | | 69,423 | | | | 77,328 | |
6.50%, due 8/1/37 | | | 125,886 | | | | 139,887 | |
6.50%, due 11/1/37 | | | 232,745 | | | | 258,873 | |
6.50%, due 9/1/39 | | | 494,650 | | | | 549,925 | |
7.00%, due 1/1/33 | | | 589,586 | | | | 667,015 | |
7.00%, due 9/1/33 | | | 195,247 | | | | 221,736 | |
| | | | | | | | |
| | | | 86,198,684 | |
| | | | | | | | |
¨Federal National Mortgage Association 3.7% | |
0.625%, due 8/26/16 | | | 8,500,000 | | | | 8,485,924 | |
0.70%, due 9/6/16 | | | 2,000,000 | | | | 1,994,532 | |
1.00%, due 12/28/17 | | | 1,500,000 | | | | 1,465,667 | |
1.00%, due 2/15/18 | | | 2,700,000 | | | | 2,625,334 | |
1.25%, due 1/30/17 | | | 5,000,000 | | | | 5,060,165 | |
1.375%, due 11/15/16 | | | 6,000,000 | | | | 6,100,680 | |
1.625%, due 11/27/18 | | | 8,300,000 | | | | 8,230,761 | |
2.75%, due 3/13/14 | | | 4,600,000 | | | | 4,623,754 | |
| | | | | | | | |
| | | | 38,586,817 | |
| | | | | | | | |
¨Federal National Mortgage Association
(Mortgage Pass-Through Securities) 13.3% | |
2.249%, due 6/1/42 (a) | | | 1,264,021 | | | | 1,301,411 | |
2.50%, due 9/1/27 TBA (g) | | | 1,800,000 | | | | 1,781,437 | |
2.50%, due 2/1/28 | | | 3,931,815 | | | | 3,895,799 | |
2.50%, due 5/1/28 | | | 4,626,040 | | | | 4,583,665 | |
2.50%, due 9/1/28 | | | 980,216 | | | | 971,238 | |
2.50%, due 5/1/43 | | | 900,000 | | | | 815,510 | |
2.719%, due 1/1/42 (a) | | | 2,793,559 | | | | 2,922,551 | |
3.00%, due 4/1/27 TBA (g) | | | 4,800,000 | | | | 4,898,437 | |
3.00%, due 7/1/43 | | | 5,847,324 | | | | 5,557,920 | |
3.00%, due 8/1/43 | | | 15,908,604 | | | | 15,120,980 | |
3.50%, due 10/1/20 | | | 1,407,078 | | | | 1,478,905 | |
3.50%, due 4/1/26 TBA (g) | | | 3,600,000 | | | | 3,764,672 | |
3.50%, due 2/1/32 | | | 942,935 | | | | 960,151 | |
| | | | |
| M-40 | | MainStay VP Bond Portfolio | | The notes to the financial statements are an integral part of,
and should be read in conjunction with, the financial statements. |
| | | | | | | | |
| | | Principal
Amount | | | Value | |
| U.S. Government & Federal Agencies (continued) | |
Federal National Mortgage Association
(Mortgage Pass-Through Securities) (continued) | |
3.50%, due 4/1/32 | | $ | 1,281,865 | | | $ | 1,317,459 | |
3.50%, due 11/1/40 | | | 530,937 | | | | 528,050 | |
3.50%, due 3/1/42 | | | 499,999 | | | | 497,210 | |
3.50%, due 9/1/42 | | | 600,000 | | | | 596,638 | |
3.50%, due 10/1/43 | | | 13,500,002 | | | | 13,424,563 | |
3.50%, due 12/1/43 | | | 300,000 | | | | 298,325 | |
3.50%, due 1/1/44 | | | 5,700,000 | | | | 5,668,184 | |
4.00%, due 8/1/18 | | | 746,941 | | | | 791,551 | |
4.00%, due 10/1/20 | | | 242 | | | | 257 | |
4.00%, due 3/1/22 | | | 168,658 | | | | 180,497 | |
4.00%, due 4/1/24 | | | 1,442,294 | | | | 1,529,467 | |
4.00%, due 12/1/24 | | | 121,852 | | | | 129,230 | |
4.00%, due 12/1/25 | | | 2,584,131 | | | | 2,739,575 | |
4.00%, due 4/1/31 | | | 850,689 | | | | 888,715 | |
4.00%, due 12/1/39 | | | 267,835 | | | | 276,079 | |
4.00%, due 7/1/40 | | | 1,340,165 | | | | 1,379,747 | |
4.00%, due 6/1/41 TBA (g) | | | 5,900,000 | | | | 6,073,312 | |
4.00%, due 11/1/41 | | | 2,811,083 | | | | 2,895,911 | |
4.00%, due 3/1/42 | | | 1,773,284 | | | | 1,826,537 | |
4.00%, due 5/1/42 | | | 2,907,009 | | | | 2,994,588 | |
4.50%, due 5/1/24 | | | 808,580 | | | | 862,099 | |
4.50%, due 7/1/26 | | | 1,129,138 | | | | 1,202,281 | |
4.50%, due 4/1/31 | | | 806,459 | | | | 866,805 | |
4.50%, due 11/1/35 | | | 571,462 | | | | 606,574 | |
4.50%, due 10/1/39 TBA (g) | | | 3,350,000 | | | | 3,549,560 | |
4.50%, due 4/1/41 | | | 1,472,383 | | | | 1,560,819 | |
4.50%, due 5/1/41 | | | 2,116,991 | | | | 2,250,508 | |
4.50%, due 7/1/41 | | | 4,496,152 | | | | 4,765,336 | |
4.50%, due 9/1/41 | | | 1,708,283 | | | | 1,811,990 | |
5.00%, due 12/1/23 | | | 882,658 | | | | 952,664 | |
5.00%, due 4/1/29 | | | 145,579 | | | | 158,714 | |
5.00%, due 4/1/31 | | | 635,601 | | | | 693,141 | |
5.00%, due 3/1/34 | | | 1,063,649 | | | | 1,173,083 | |
5.00%, due 4/1/34 | | | 1,342,610 | | | | 1,482,164 | |
5.00%, due 4/1/35 | | | 618,003 | | | | 671,129 | |
5.00%, due 2/1/36 | | | 591,647 | | | | 642,121 | |
5.00%, due 3/1/37 TBA (g) | | | 400,000 | | | | 434,406 | |
5.00%, due 5/1/37 | | | 1,264 | | | | 1,371 | |
5.00%, due 6/1/37 | | | 714,518 | | | | 774,411 | |
5.00%, due 2/1/38 | | | 2,079,483 | | | | 2,253,791 | |
5.00%, due 5/1/38 | | | 1,319,507 | | | | 1,430,113 | |
5.00%, due 7/1/38 | | | 647,526 | | | | 708,001 | |
5.00%, due 10/1/39 | | | 565,546 | | | | 620,625 | |
5.50%, due 5/1/16 | | | 5,478 | | | | 5,816 | |
5.50%, due 1/1/21 | | | 7,095 | | | | 7,746 | |
5.50%, due 12/1/21 | | | 19,239 | | | | 21,100 | |
5.50%, due 1/1/22 | | | 90,629 | | | | 99,423 | |
5.50%, due 2/1/22 | | | 4,480 | | | | 4,915 | |
5.50%, due 10/1/28 | | | 1,422,927 | | | | 1,566,880 | |
| | | | | | | | |
| | | Principal
Amount | | | Value | |
Federal National Mortgage Association
(Mortgage Pass-Through Securities) (continued) | |
5.50%, due 4/1/34 | | $ | 346,312 | | | $ | 381,510 | |
5.50%, due 7/1/35 | | | 58,471 | | | | 64,306 | |
5.50%, due 2/1/37 | | | 1,974,337 | | | | 2,168,645 | |
5.50%, due 8/1/37 | | | 347,192 | | | | 381,457 | |
5.50%, due 2/1/38 | | | 262,952 | | | | 288,810 | |
5.50%, due 3/1/38 | | | 1,213,935 | | | | 1,332,464 | |
5.50%, due 6/1/38 | | | 900,000 | | | | 988,618 | |
5.50%, due 7/1/38 | | | 249,683 | | | | 274,063 | |
5.50%, due 1/1/39 | | | 1,846,590 | | | | 2,028,997 | |
5.50%, due 2/1/39 | | | 725,105 | | | | 796,929 | |
5.50%, due 11/1/39 | | | 361,151 | | | | 396,431 | |
5.50%, due 6/1/40 | | | 267,413 | | | | 293,716 | |
6.00%, due 3/1/36 | | | 135,824 | | | | 150,805 | |
6.00%, due 11/1/37 | | | 367,548 | | | | 406,598 | |
6.00%, due 10/1/38 | | | 1,665,986 | | | | 1,844,175 | |
6.00%, due 12/1/38 | | | 1,168,659 | | | | 1,292,823 | |
6.00%, due 4/1/40 | | | 560,846 | | | | 622,246 | |
6.00%, due 10/1/40 | | | 900,000 | | | | 996,673 | |
6.50%, due 10/1/36 | | | 160,231 | | | | 180,718 | |
6.50%, due 1/1/37 | | | 332,260 | | | | 369,004 | |
6.50%, due 8/1/37 | | | 33,322 | | | | 36,999 | |
6.50%, due 10/1/37 | | | 260,063 | | | | 288,760 | |
7.00%, due 9/1/37 | | | 107,081 | | | | 121,418 | |
7.00%, due 10/1/37 | | | 3,102 | | | | 3,504 | |
7.00%, due 11/1/37 | | | 12,257 | | | | 14,303 | |
7.50%, due 7/1/28 | | | 43,470 | | | | 49,139 | |
| | | | | | | | |
| | | | 139,039,268 | |
| | | | | | | | |
¨Government National Mortgage Association
(Mortgage Pass-Through Securities) 7.3% | |
3.00%, due 11/1/42 TBA (g) | | | 300,000 | | | | 289,852 | |
3.00%, due 7/15/43 | | | 1,090,542 | | | | 1,055,519 | |
3.00%, due 7/20/43 | | | 498,015 | | | | 482,020 | |
3.00%, due 8/15/43 | | | 1,989,370 | | | | 1,924,998 | |
3.00%, due 8/20/43 | | | 10,789,459 | | | | 10,442,117 | |
3.00%, due 9/15/43 | | | 497,310 | | | | 481,218 | |
3.50%, due 7/1/42 TBA (g) | | | 900,000 | | | | 907,910 | |
3.50%, due 4/15/43 | | | 8,890,559 | | | | 8,989,377 | |
3.50%, due 8/20/43 | | | 4,181,151 | | | | 4,224,716 | |
3.50%, due 11/20/43 | | | 4,291,741 | | | | 4,339,305 | |
4.00%, due 8/1/40 TBA (g) | | | 1,500,000 | | | | 1,558,652 | |
4.00%, due 11/1/41 TBA (g) | | | 1,000,000 | | | | 1,039,727 | |
4.00%, due 1/20/42 | | | 3,436,694 | | | | 3,578,040 | |
4.00%, due 2/20/42 | | | 1,397,458 | | | | 1,454,908 | |
4.00%, due 8/20/43 | | | 3,951,234 | | | | 4,132,348 | |
4.00%, due 10/20/43 | | | 1,293,834 | | | | 1,348,311 | |
4.50%, due 6/15/39 | | | 3,545,340 | | | | 3,787,634 | |
4.50%, due 5/15/40 | | | 453,820 | | | | 489,260 | |
4.50%, due 6/1/40 TBA (g) | | | 400,000 | | | | 427,656 | |
4.50%, due 6/15/40 | | | 696,501 | | | | 744,690 | |
4.50%, due 6/20/40 | | | 1,662,331 | | | | 1,779,975 | |
| | | | | | |
The notes to the financial statements are an integral part of,
and should be read in conjunction with, the financial statements. | | mainstayinvestments.com | | | M-41 | |
Portfolio of Investments December 31, 2013 (continued)
| | | | | | | | |
| | | Principal
Amount | | | Value | |
| U.S. Government & Federal Agencies (continued) | |
Government National Mortgage Association
(Mortgage Pass-Through Securities) (continued) | |
4.50%, due 9/15/40 | | $ | 4,101,486 | | | $ | 4,422,222 | |
4.50%, due 3/15/41 | | | 271,898 | | | | 291,730 | |
4.50%, due 3/20/41 | | | 634,425 | | | | 681,097 | |
4.50%, due 4/20/41 | | | 518,704 | | | | 555,412 | |
4.50%, due 9/20/41 | | | 930,397 | | | | 996,303 | |
4.50%, due 12/20/41 | | | 166,696 | | | | 178,337 | |
4.50%, due 4/20/42 | | | 354,613 | | | | 380,336 | |
5.00%, due 1/15/39 | | | 129,993 | | | | 141,084 | |
5.00%, due 3/15/39 | | | 60,669 | | | | 65,796 | |
5.00%, due 4/1/39 TBA (g) | | | 300,000 | | | | 325,066 | |
5.00%, due 8/15/39 | | | 163,309 | | | | 177,128 | |
5.00%, due 9/15/39 | | | 1,308,853 | | | | 1,420,824 | |
5.00%, due 6/15/40 | | | 1,115,117 | | | | 1,212,920 | |
5.00%, due 7/15/40 | | | 871,313 | | | | 948,079 | |
5.00%, due 9/20/40 | | | 4,094,359 | | | | 4,484,023 | |
5.00%, due 10/20/41 | | | 277,339 | | | | 301,635 | |
5.50%, due 1/20/35 | | | 13,133 | | | | 14,604 | |
5.50%, due 7/15/35 | | | 181,555 | | | | 200,864 | |
5.50%, due 8/15/35 | | | 140,054 | | | | 155,584 | |
5.50%, due 5/15/36 | | | 156,859 | | | | 173,265 | |
5.50%, due 6/15/38 | | | 185,921 | | | | 204,617 | |
5.50%, due 1/15/39 | | | 290,978 | | | | 319,996 | |
5.50%, due 3/20/39 | | | 1,105,878 | | | | 1,219,011 | |
5.50%, due 7/15/39 | | | 284,310 | | | | 312,782 | |
5.50%, due 12/15/39 | | | 98,627 | | | | 108,503 | |
5.50%, due 2/15/40 | | | 551,520 | | | | 606,480 | |
6.00%, due 1/15/36 | | | 192,681 | | | | 214,253 | |
6.00%, due 11/15/37 | | | 96,799 | | | | 107,622 | |
6.00%, due 12/15/37 | | | 810,009 | | | | 901,327 | |
6.00%, due 9/15/38 | | | 625,069 | | | | 695,707 | |
6.00%, due 10/15/38 | | | 234,632 | | | | 261,122 | |
6.50%, due 1/15/36 | | | 319,584 | | | | 356,784 | |
6.50%, due 3/15/36 | | | 116,524 | | | | 130,129 | |
6.50%, due 6/15/36 | | | 126,864 | | | | 141,567 | |
6.50%, due 9/15/36 | | | 44,944 | | | | 50,157 | |
6.50%, due 7/15/37 | | | 137,832 | | | | 153,814 | |
7.00%, due 7/15/31 | | | 42,438 | | | | 46,192 | |
| | | | | | | | |
| | | | 76,434,605 | |
| | | | | | | | |
¨United States Treasury Bonds 1.4% | |
2.75%, due 11/15/42 | | | 2,000,000 | | | | 1,581,250 | |
3.125%, due 11/15/41 | | | 1,500,000 | | | | 1,295,625 | |
3.625%, due 8/15/43 | | | 250,000 | | | | 236,094 | |
3.75%, due 11/15/43 | | | 3,000,000 | | | | 2,899,686 | |
4.25%, due 5/15/39 | | | 6,000,000 | | | | 6,398,436 | |
4.25%, due 11/15/40 | | | 1,800,000 | | | | 1,915,594 | |
| | | | | | | | |
| | | | 14,326,685 | |
| | | | | | | | |
| | | | | | | | |
| | | Principal
Amount | | | Value | |
¨United States Treasury Notes 11.2% | |
0.25%, due 12/31/15 | | $ | 17,000,000 | | | $ | 16,954,848 | |
0.625%, due 11/15/16 | | | 10,150,000 | | | | 10,119,073 | |
0.625%, due 12/15/16 | | | 33,600,000 | | | | 33,463,517 | |
1.25%, due 10/31/18 | | | 7,975,000 | | | | 7,818,618 | |
1.25%, due 11/30/18 | | | 25,350,000 | | | | 24,807,358 | |
1.50%, due 12/31/18 | | | 10,000,000 | | | | 9,887,500 | |
1.75%, due 10/31/20 | | | 11,200,000 | | | | 10,745,000 | |
2.00%, due 1/31/16 | | | 400,000 | | | | 413,125 | |
2.75%, due 11/15/23 | | | 2,075,000 | | | | 2,029,933 | |
| | | | | | | | |
| | | | 116,238,972 | |
| | | | | | | | |
Total U.S. Government & Federal Agencies
(Cost $489,174,375) | | | | 487,657,029 | |
| | | | | | | | |
Total Long-Term Bonds
(Cost $1,029,982,301) | | | | 1,028,953,648 | |
| | | | | | | | |
|
| Short-Term Investments 5.3% | |
Federal Agency 0.5% | | | | | | | | |
Federal Home Loan Bank Discount Note
0.035%, due 1/13/14 (h) | | | 5,300,000 | | | | 5,299,938 | |
| | | | | | | | |
Total Federal Agency
(Cost $5,299,938) | | | | | | | 5,299,938 | |
| | | | | | | | |
| |
Financial Company Commercial Paper 1.0% | | | | | |
John Deere Credit, Inc.
0.071%, due 1/6/14 (b)(h) | | | 5,000,000 | | | | 4,999,951 | |
PACCAR Financial Corp.
0.051%, due 1/8/14 (h) | | | 5,175,000 | | | | 5,174,950 | |
| | | | | | | | |
Total Financial Company Commercial Paper
(Cost $10,174,901) | | | | 10,174,901 | |
| | | | | | | | |
| |
Other Commercial Paper 3.5% | | | | | |
Oglethorpe Power Corp.
0.162%, due 1/6/14 (b)(h) | | | 5,000,000 | | | | 4,999,889 | |
0.162%, due 1/7/14 (b)(h) | | | 10,000,000 | | | | 9,999,733 | |
UnitedHealth Group, Inc.
0.16%, due 1/10/14 (b)(h) | | | 10,000,000 | | | | 9,999,600 | |
Washington Gas Light Co.
0.142%, due 1/9/14 (h) | | | 1,880,000 | | | | 1,879,942 | |
WGL Holdings, Inc.
0.132%, due 1/8/14 (b)(h) | | | 9,400,000 | | | | 9,399,762 | |
| | | | | | | | |
Total Other Commercial Paper
(Cost $36,278,926) | | | | 36,278,926 | |
| | | | | | | | |
| | | | |
| M-42 | | MainStay VP Bond Portfolio | | The notes to the financial statements are an integral part of,
and should be read in conjunction with, the financial statements. |
| | | | | | | | |
| | | Principal
Amount | | | Value | |
| Short-Term Investments (continued) | |
Repurchase Agreement 0.3% | | | | | | | | |
TD Securities (U.S.A.) LLC
0.005%, dated 12/31/13
due 1/2/14
Proceeds at Maturity $3,372,001
(Collateralized by United States
Treasury Bonds with rates
between 5.25% and 5.375% and
maturity dates between 11/15/28
and 2/15/31, with a Principal
Amount of $2,772,400 and a
Market Value of $3,439,449) | | $ | 3,372,000 | | | $ | 3,372,000 | |
| | | | | | | | |
Total Repurchase Agreement
(Cost $3,372,000) | | | | 3,372,000 | |
| | | | | | | | |
Total Short-Term Investments
(Cost $55,125,765) | | | | 55,125,765 | |
| | | | | | | | |
Total Investments (Cost $1,085,108,066) (k) | | | 104.1 | % | | | 1,084,079,413 | |
Other Assets, Less Liabilities | | | (4.1 | ) | | | (42,789,221 | ) |
Net Assets | | | 100.0 | % | | $ | 1,041,290,192 | |
| | |
| | | | | | | | |
| | | Contracts
Short | | | Unrealized
Appreciation
(Depreciation) (i) | |
| Futures Contracts 0.0%‡ | | | | | | | | |
United States Treasury Note March 2014 (10 Year) (j) | | | (128 | ) | | $ | 183,583 | |
Total Futures Contracts
(Notional Amount $15,750,000) | | | $ | 183,583 | |
| ‡ | Less than one-tenth of a percent. |
| (a) | Floating rate—Rate shown is the rate in effect as of December 31, 2013. |
| (b) | May be sold to institutional investors only under Rule 144A or securities offered pursuant to Section 4(a)(2) of the Securities Act of 1933, as amended. |
| (c) | Step coupon—Rate shown is the rate in effect as of December 31, 2013. |
| (d) | Subprime mortgage investment or other asset-backed security. The total market value of these securities as of December 31, 2013, is $8,982,520, which represents 0.9% of the Portfolio’s net assets. |
| (e) | Fair valued security—The total market value of these securities as of December 31, 2013, is $32,694,542, which represents 3.1% of the Portfolio’s net assets. |
| (f) | Collateral strip rate—A bond whose interest is based on the weighted net interest rate of the collateral. The coupon rate adjusts periodically based on a predetermined schedule. Rate shown is the rate in effect as of December 31, 2013. |
| (g) | TBA—Securities purchased on a forward commitment basis with an approximate principal amount and maturity date. The actual principal amount and maturity date will be determined upon settlement. The market value of these securities as of December 31, 2013, is $52,079,687, which represents 5.0% of the Portfolio’s net assets. All or a portion of these securities were acquired under a mortgage dollar roll agreement. |
| (h) | Interest rate shown represents yield to maturity. |
| (i) | Represents the difference between the value of the contracts at the time they were opened and the value as of December 31, 2013. |
| (j) | As of December 31, 2013, cash in the amount of $188,800 is on deposit with a broker for futures transactions. |
| (k) | As of December 31, 2013, cost is $1,085,176,444 for federal income tax purposes and net unrealized depreciation is as follows: |
| | | | |
Gross unrealized appreciation | | $ | 14,736,611 | |
Gross unrealized depreciation | | | (15,833,642 | ) |
| | | | |
Net unrealized depreciation | | $ | (1,097,031 | ) |
| | | | |
| | | | | | |
The notes to the financial statements are an integral part of,
and should be read in conjunction with, the financial statements. | | mainstayinvestments.com | | | M-43 | |
Portfolio of Investments December 31, 2013 (continued)
The following is a summary of the fair valuations according to the inputs used as of December 31, 2013, for valuing the Portfolio’s assets.
Asset Valuation Inputs
| | | | | | | | | | | | | | | | |
Description | | Quoted Prices
in Active Markets
for Identical Assets
(Level 1) | | | Significant Other
Observable Inputs (Level 2) | | | Significant
Unobservable
Inputs (Level 3) | | | Total | |
| Investments in Securities (a) | | | | | | | | | | | | | | | | |
| Long-Term Bonds | | | | | | | | | | | | | | | | |
Asset-Backed Securities (b) | | $ | — | | | $ | 61,201,725 | | | $ | 32,694,542 | | | $ | 93,896,267 | |
Corporate Bonds | | | — | | | | 370,751,164 | | | | — | | | | 370,751,164 | |
Foreign Government Bonds | | | — | | | | 6,971,813 | | | | — | | | | 6,971,813 | |
Mortgage-Backed Securities | | | — | | | | 60,501,833 | | | | — | | | | 60,501,833 | |
Municipal Bonds | | | — | | | | 9,175,542 | | | | — | | | | 9,175,542 | |
U.S. Government & Federal Agencies | | | — | | | | 487,657,029 | | | | — | | | | 487,657,029 | |
| | | | | | | | | | | | | | | | |
| Total Long-Term Bonds | | | — | | | | 996,259,106 | | | | 32,694,542 | | | | 1,028,953,648 | |
| | | | | | | | | | | | | | | | |
| Short-Term Investments | | | | | | | | | | | | | | | | |
Federal Agency | | | — | | | | 5,299,938 | | | | — | | | | 5,299,938 | |
Financial Company Commercial Paper | | | — | | | | 10,174,901 | | | | — | | | | 10,174,901 | |
Other Commercial Paper | | | — | | | | 36,278,926 | | | | — | | | | 36,278,926 | |
Repurchase Agreement | | | — | | | | 3,372,000 | | | | — | | | | 3,372,000 | |
| | | | | | | | | | | | | | | | |
| Total Short-Term Investments | | | — | | | | 55,125,765 | | | | — | | | | 55,125,765 | |
| | | | | | | | | | | | | | | | |
| Total Investments in Securities | | | — | | | | 1,051,384,871 | | | | 32,694,542 | | | | 1,084,079,413 | |
| | | | | | | | | | | | | | | | |
| Other Financial Instruments | | | | | | | | | | | | | | | | |
Futures Contracts Short (c) | | | 183,583 | | | | — | | | | — | | | | 183,583 | |
| | | | | | | | | | | | | | | | |
| Total Investments in Securities and Other Financial Instruments | | $ | 183,583 | | | $ | 1,051,384,871 | | | $ | 32,694,542 | | | $ | 1,084,262,996 | |
| | | | | | | | | | | | | | | | |
| (a) | For a complete listing of investments and their industries, see the Portfolio of Investments. |
| (b) | The Level 3 securities valued at $32,694,542 are held in Other ABS within the Asset-Backed Securities section of the Portfolio of Investments. |
| (c) | The value listed for these securities reflects unrealized appreciation (depreciation) as shown on the Portfolio of Investments. |
The Portfolio recognizes transfers between the levels as of the beginning of the period.
For the year ended December 31, 2013, the Portfolio did not have any transfers between Level 1 and Level 2 fair value measurements. (See Note 2)
The following is a reconciliation of investments in which significant unobservable inputs (Level 3) were used in determining value:
| | | | | | | | | | | | | | | | | | | | | | | | | | | | | | | | | | | | | | | | |
Investments in
Securities | | Balance as of
December 31,
2012 | | | Accrued
Discounts
(Premiums) | | | Realized
Gain
(Loss) | | | Change in
Unrealized
Appreciation
(Depreciation) | | | Purchases | | | Sales | | | Transfers
in to
Level 3 | | | Transfers
out of
Level 3 | | | Balance as of
December 31,
2013 | | | Change in
Unrealized
Appreciation
(Depreciation)
from
Investments
Still Held at
December 31,
2013 (a) | |
| Long-Term Bonds | | | | | | | | | | | | | | | | | | | | | | | | | | | | | | | | | | | | | | | | |
Asset-Backed Securities | | | | | | | | | | | | | | | | | | | | | | | | | | | | | | | | | | | | | | | | |
Other ABS | | $ | — | | | $ | 1,864 | | | $ | — | | | $ | (384,811 | ) | | $ | 33,077,489 | | | $ | — | | | $ | — | | | $ | — | | | $ | 32,694,542 | | | $ | (384,811 | ) |
| | | | | | | | | | | | | | | | | | | | | | | | | | | | | | | | | | | | | | | | |
Total | | $ | — | | | $ | 1,864 | | | $ | — | | | $ | (384,811 | ) | | $ | 33,077,489 | | | $ | — | | | $ | — | | | $ | — | | | $ | 32,694,542 | | | $ | (384,811 | ) |
| | | | | | | | | | | | | | | | | | | | | | | | | | | | | | | | | | | | | | | | |
| (a) | Included in “Net change in unrealized appreciation (depreciation) on investments” in the Statement of Operations. |
| | | | |
| M-44 | | MainStay VP Bond Portfolio | | The notes to the financial statements are an integral part of,
and should be read in conjunction with, the financial statements. |
Statement of Assets and Liabilities as of December 31, 2013
| | | | |
| Assets | |
Investment in securities, at value
(identified cost $1,085,108,066) | | $ | 1,084,079,413 | |
Cash collateral on deposit at broker | | | 188,800 | |
Cash | | | 720 | |
Receivables: | | | | |
Investment securities sold | | | 56,885,440 | |
Interest | | | 5,576,531 | |
Fund shares sold | | | 3,792,833 | |
Variation margin on futures contracts | | | 22,000 | |
| | | | |
Total assets | | | 1,150,545,737 | |
| | | | |
| |
| Liabilities | | | | |
Payables: | | | | |
Investment securities purchased | | | 108,344,790 | |
Manager (See Note 3) | | | 426,257 | |
Fund shares redeemed | | | 276,226 | |
NYLIFE Distributors (See Note 3) | | | 78,254 | |
Shareholder communication | | | 68,418 | |
Professional fees | | | 41,551 | |
Custodian | | | 15,274 | |
Trustees | | | 1,468 | |
Accrued expenses | | | 3,307 | |
| | | | |
Total liabilities | | | 109,255,545 | |
| | | | |
Net assets | | $ | 1,041,290,192 | |
| | | | |
| |
| Net Assets Consist of | | | | |
Shares of beneficial interest outstanding (par value of $.001 per share) unlimited number of shares authorized | | $ | 74,608 | |
Additional paid-in capital | | | 1,032,144,346 | |
| | | | |
| | | 1,032,218,954 | |
Undistributed net investment income | | | 20,760,367 | |
Accumulated net realized gain (loss) on investments and futures transactions | | | (10,844,059 | ) |
Net unrealized appreciation (depreciation) on investments and futures contracts | | | (845,070 | ) |
| | | | |
Net assets | | $ | 1,041,290,192 | |
| | | | |
| | | | |
Initial Class | | | | |
Net assets applicable to outstanding shares | | $ | 676,544,362 | |
| | | | |
Shares of beneficial interest outstanding | | | 48,314,481 | |
| | | | |
Net asset value per share outstanding | | $ | 14.00 | |
| | | | |
Service Class | | | | |
Net assets applicable to outstanding shares | | $ | 364,745,830 | |
| | | | |
Shares of beneficial interest outstanding | | | 26,293,461 | |
| | | | |
Net asset value per share outstanding | | $ | 13.87 | |
| | | | |
| | | | | | |
The notes to the financial statements are an integral part of,
and should be read in conjunction with, the financial statements. | | mainstayinvestments.com | | | M-45 | |
Statement of Operations for the year ended December 31, 2013
| | | | |
| Investment Income (Loss) | |
Income | | | | |
Interest | | $ | 24,559,737 | |
| | | | |
Expenses | | | | |
Manager (See Note 3) | | | 5,099,684 | |
Distribution and service—Service Class (See Note 3) | | | 1,025,528 | |
Shareholder communication | | | 176,986 | |
Professional fees | | | 95,285 | |
Custodian | | | 85,357 | |
Trustees | | | 22,044 | |
Miscellaneous | | | 31,684 | |
| | | | |
Total expenses | | | 6,536,568 | |
| | | | |
Net investment income (loss) | | | 18,023,169 | |
| | | | |
|
| Realized and Unrealized Gain (Loss) on Investments and Futures Contracts | |
Net realized gain (loss) on: | | | | |
Security transactions | | | (6,664,845 | ) |
Futures transactions | | | (187,843 | ) |
| | | | |
Net realized gain (loss) on investments and futures transactions | | | (6,852,688 | ) |
| | | | |
Net change in unrealized appreciation (depreciation) on: | | | | |
Investments | | | (32,165,663 | ) |
Futures contracts | | | 183,583 | |
| | | | |
Net change in unrealized appreciation (depreciation) on investments and futures contracts | | | (31,982,080 | ) |
| | | | |
Net realized and unrealized gain (loss) on investments and futures transactions | | | (38,834,768 | ) |
| | | | |
Net increase (decrease) in net assets resulting from operations | | $ | (20,811,599 | ) |
| | | | |
| | | | |
| M-46 | | MainStay VP Bond Portfolio | | The notes to the financial statements are an integral part of,
and should be read in conjunction with, the financial statements. |
Statements of Changes in Net Assets
for the years ended December 31, 2013 and December 31, 2012
| | | | | | | | |
| | | 2013 | | | 2012 | |
| Increase (Decrease) in Net Assets | |
Operations: | | | | | | | | |
Net investment income (loss) | | $ | 18,023,169 | | | $ | 17,166,327 | |
Net realized gain (loss) on investments and futures transactions | | | (6,852,688 | ) | | | 18,795,348 | |
Net change in unrealized appreciation (depreciation) on investments and futures contracts | | | (31,982,080 | ) | | | 7,240,680 | |
| | | | |
Net increase (decrease) in net assets resulting from operations | | | (20,811,599 | ) | | | 43,202,355 | |
| | | | |
Dividends and distributions to shareholders: | | | | | | | | |
From net investment income: | | | | | | | | |
Initial Class | | | (12,434,419 | ) | | | (14,699,699 | ) |
Service Class | | | (6,401,990 | ) | | | (9,360,380 | ) |
| | | | |
| | | (18,836,409 | ) | | | (24,060,079 | ) |
| | | | |
From net realized gain on investments: | | | | | | | | |
Initial Class | | | (10,475,475 | ) | | | (20,340,451 | ) |
Service Class | | | (6,250,765 | ) | | | (14,115,491 | ) |
| | | | |
| | | (16,726,240 | ) | | | (34,455,942 | ) |
| | | | |
Total dividends and distributions to shareholders | | | (35,562,649 | ) | | | (58,516,021 | ) |
| | | | |
Capital share transactions: | | | | | | | | |
Net proceeds from sale of shares | | | 213,110,696 | | | | 257,718,188 | |
Net asset value of shares issued to shareholders in reinvestment of dividends and distributions | | | 35,562,649 | | | | 58,516,021 | |
Cost of shares redeemed | | | (202,519,561 | ) | | | (153,563,688 | ) |
| | | | |
Increase (decrease) in net assets derived from capital share transactions | | | 46,153,784 | | | | 162,670,521 | |
| | | | |
Net increase (decrease) in net assets | | | (10,220,464 | ) | | | 147,356,855 | |
| | |
| Net Assets | | | | | | | | |
Beginning of year | | | 1,051,510,656 | | | | 904,153,801 | |
| | | | |
End of year | | $ | 1,041,290,192 | | | $ | 1,051,510,656 | |
| | | | |
Undistributed net investment income at end of year | | $ | 20,760,367 | | | $ | 18,836,342 | |
| | | | |
| | | | | | |
The notes to the financial statements are an integral part of,
and should be read in conjunction with, the financial statements. | | mainstayinvestments.com | | | M-47 | |
Financial Highlights selected per share data and ratios
| | | | | | | | | | | | | | | | | | | | |
| | | Initial Class | |
| | | Year ended December 31, | |
| | | 2013 | | | 2012 | | | 2011 | | | 2010 | | | 2009 | |
Net asset value at beginning of year | | $ | 14.78 | | | $ | 14.97 | | | $ | 14.63 | | | $ | 14.17 | | | $ | 13.82 | |
| | | | | | | | | | | | | | | | | | | | |
Net investment income (loss) (a) | | | 0.26 | | | | 0.28 | | | | 0.40 | | | | 0.48 | | | | 0.56 | |
Net realized and unrealized gain (loss) on investments | | | (0.54 | ) | | | 0.41 | | | | 0.66 | | | | 0.64 | | | | 0.51 | |
| | | | | | | | | | | | | | | | | | | | |
Total from investment operations | | | (0.28 | ) | | | 0.69 | | | | 1.06 | | | | 1.12 | | | | 1.07 | |
| | | | | | | | | | | | | | | | | | | | |
Less dividends and distributions: | | | | | | | | | | | | | | | | | | | | |
From net investment income | | | (0.27 | ) | | | (0.37 | ) | | | (0.49 | ) | | | (0.47 | ) | | | (0.67 | ) |
From net realized gain on investments | | | (0.23 | ) | | | (0.51 | ) | | | (0.23 | ) | | | (0.19 | ) | | | (0.05 | ) |
| | | | | | | | | | | | | | | | | | | | |
Total dividends and distributions | | | (0.50 | ) | | | (0.88 | ) | | | (0.72 | ) | | | (0.66 | ) | | | (0.72 | ) |
| | | | | | | | | | | | | | | | | | | | |
Net asset value at end of year | | $ | 14.00 | | | $ | 14.78 | | | $ | 14.97 | | | $ | 14.63 | | | $ | 14.17 | |
| | | | | | | | | | | | | | | | | | | | |
Total investment return | | | (1.82 | %) | | | 4.66 | % | | | 7.24 | % | | | 7.84 | % | | | 7.77 | % |
Ratios (to average net assets)/Supplemental Data: | | | | | | | | | | | | | | | | | | | | |
Net investment income (loss) | | | 1.82 | % | | | 1.84 | % | | | 2.70 | % | | | 3.26 | % | | | 3.97 | % |
Net expenses | | | 0.53 | % | | | 0.53 | % | | | 0.54 | % | | | 0.55 | % | | | 0.55 | % |
Portfolio turnover rate (b) | | | 327 | % | | | 311 | % | | | 293 | % | | | 127 | % | | | 158 | % |
Net assets at end of year (in 000’s) | | $ | 676,544 | | | $ | 608,651 | | | $ | 530,001 | | | $ | 554,818 | | | $ | 515,186 | |
| (a) | Per share data based on average shares outstanding during the year. |
| (b) | The portfolio turnover rates not including mortgage dollar rolls were 170%, 222%, 231%, 97% and 151% for the years ended December 31, 2013, 2012, 2011, 2010 and 2009, respectively. |
| | | | | | | | | | | | | | | | | | | | |
| | | Service Class | |
| | | Year ended December 31, | |
| | | 2013 | | | 2012 | | | 2011 | | | 2010 | | | 2009 | |
Net asset value at beginning of year | | $ | 14.64 | | | $ | 14.85 | | | $ | 14.53 | | | $ | 14.09 | | | $ | 13.75 | |
| | | | | | | | | | | | | | | | | | | | |
Net investment income (loss) (a) | | | 0.22 | | | | 0.24 | | | | 0.36 | | | | 0.44 | | | | 0.52 | |
Net realized and unrealized gain (loss) on investments | | | (0.52 | ) | | | 0.40 | | | | 0.65 | | | | 0.63 | | | | 0.51 | |
| | | | | | | | | | | | | | | | | | | | |
Total from investment operations | | | (0.30 | ) | | | 0.64 | | | | 1.01 | | | | 1.07 | | | | 1.03 | |
| | | | | | | | | | | | | | | | | | | | |
Less dividends and distributions: | | | | | | | | | | | | | | | | | | | | |
From net investment income | | | (0.24 | ) | | | (0.34 | ) | | | (0.46 | ) | | | (0.44 | ) | | | (0.64 | ) |
From net realized gain on investments | | | (0.23 | ) | | | (0.51 | ) | | | (0.23 | ) | | | (0.19 | ) | | | (0.05 | ) |
| | | | | | | | | | | | | | | | | | | | |
Total dividends and distributions | | | (0.47 | ) | | | (0.85 | ) | | | (0.69 | ) | | | (0.63 | ) | | | (0.69 | ) |
| | | | | | | | | | | | | | | | | | | | |
Net asset value at end of year | | $ | 13.87 | | | $ | 14.64 | | | $ | 14.85 | | | $ | 14.53 | | | $ | 14.09 | |
| | | | | | | | | | | | | | | | | | | | |
Total investment return | | | (2.07 | %) | | | 4.40 | % | | | 6.98 | % | | | 7.58 | % | | | 7.50 | % |
Ratios (to average net assets)/Supplemental Data: | | | | | | | | | | | | | | | | | | | | |
Net investment income (loss) | | | 1.55 | % | | | 1.59 | % | | | 2.43 | % | | | 2.99 | % | | | 3.70 | % |
Net expenses | | | 0.78 | % | | | 0.78 | % | | | 0.79 | % | | | 0.80 | % | | | 0.80 | % |
Portfolio turnover rate (b) | | | 327 | % | | | 311 | % | | | 293 | % | | | 127 | % | | | 158 | % |
Net assets at end of year (in 000’s) | | $ | 364,746 | | | $ | 442,860 | | | $ | 374,152 | | | $ | 321,271 | | | $ | 222,830 | |
| (a) | Per share data based on average shares outstanding during the year. |
| (b) | The portfolio turnover rates not including mortgage dollar rolls were 170%, 222%, 231%, 97% and 151%, for the years ended December 31, 2013, 2012, 2011, 2010 and 2009, respectively. |
| | | | |
| M-48 | | MainStay VP Bond Portfolio | | The notes to the financial statements are an integral part of,
and should be read in conjunction with, the financial statements. |
MainStay VP Cash Management Portfolio
Investment and Performance Comparison1 (Unaudited)
Performance data quoted represents past performance. Past performance is no guarantee of future results. Because of market volatility, current performance may be lower or higher than the figures shown. Investment return and principal value will fluctuate, and as a result, when shares are redeemed, they may be worth more or less than their original cost. The performance table and graph do not reflect any deduction of sales charges, mortality and expense charges, contract charges or administrative charges. Please refer to the Performance Summary appropriate for your policy. For performance information current to the most recent month-end, please call 800-598-2019 or visit www.newyorklife.com.
An investment in the Portfolio is not insured or guaranteed by the Federal Deposit Insurance Corporation or any other government agency. Although the Portfolio seeks to preserve the value of your investment at $1.00 per share, it is possible to lose money by investing in the Portfolio.

Average Annual Total Returns for the Year Ended December 31, 2013
| | | | | | | | | | | | | | | | |
| Class | | One Year | | | Five Years | | | Ten Years2 | | | Gross Expense Ratio3 | |
| Initial Class Shares | | | 0.02 | % | | | 0.02 | % | | | 1.53 | % | | | 0.47 | % |
| |
| 7-Day Current Yield: 0.01%4 | | | | | |
| | | | | | | | | | | | |
| Benchmark Performance | | One
Year | | | Five
Years | | | Ten
Years | |
Average Lipper Variable Products Money Market Portfolio5 | | | –0.03% | | | | 0.02% | | | | 1.51% | |
| 1. | Performance figures reflect certain fee waivers and/or expense limitations, without which total returns may have been different. For information on current fee waivers and/or expense limitations, please refer to the notes to the financial statements. |
| 2. | Performance for the ten-year period ended December 31, 2013 reflects nonrecurring reimbursements from affiliates for printing and mailing costs. If these nonrecurring reimbursements had not been made, the total return would have been 1.51% for Initial Class shares for the ten-year period. |
| 3. | The gross expense ratios presented reflect the Portfolio’s “Total Annual Portfolio Operating Expenses” from the most recent Prospectus and may differ from other expense ratios disclosed in this report. |
| 4. | As of December 31, 2013, MainStay VP Cash Management Portfolio had an effective 7-day yield of 0.01% and a 7-day |
| | current yield of 0.01%. These yields reflect certain expense limitations. Had these expense limitations not been in effect, the effective 7-day yield would have been –0.37% and the 7-day current yield would have been –0.37%. The current yield is more reflective of the Portfolio’s earnings than the total return. |
| 5. | The Average Lipper Variable Products Money Market Portfolio is an equally weighted performance average adjusted for capital gains distributions and income dividends of all of the money market portfolios in the Lipper universe which may include portfolios that do not maintain a stable net asset value of $1.00 per share. Lipper Inc. is an independent monitor of fund performance. Results are based on total returns with all dividend and capital gain distributions reinvested. |
| | | | |
| mainstayinvestments.com | | | M-49 | |
Cost in Dollars of a $1,000 Investment in MainStay VP Cash Management Portfolio (Unaudited)
The example below is intended to describe the fees and expenses borne by shareholders during the six-month period from July 1, 2013, to December 31, 2013, and the impact of those costs on your investment.
Example
As a shareholder of the Portfolio, you incur two types of costs: (1) transaction costs, including exchange fees and sales charges (loads) on purchases (as applicable), and (2) ongoing costs, including management fees, distribution and/or service (12b-1) fees, and other Portfolio expenses (as applicable). This example is intended to help you understand your ongoing costs (in dollars) of investing in the Portfolio and to compare these costs with the ongoing costs of investing in other Portfolios. The example is based on an investment of $1,000 made at the beginning of the six-month period and held for the entire period from July 1, 2013, to December 31, 2013. Shares are only sold in connection with variable life and annuity contracts and the example does not reflect any contract level or transactional fees or expenses. If these costs had been included, your costs would have been higher.
This example illustrates your Portfolio’s ongoing costs in two ways:
Actual Expenses
The second and third data columns in the table below provide information about actual account values and actual expenses. You may use the information in these columns, together with the amount you invested, to estimate the expenses that you paid during the six months ended
December 31, 2013. Simply divide your account value by $1,000 (for example, an $8,600 account value divided by $1,000 = 8.6), then multiply the result by the number under the heading entitled “Expenses Paid During Period” to estimate the expenses you paid on your account during this period.
Hypothetical Example for Comparison Purposes
The fourth and fifth data columns in the table below provide information about hypothetical account values and hypothetical expenses based on the Portfolio’s actual expense ratio and an assumed rate of return of 5% per year before expenses, which is not the Portfolio’s actual return. The hypothetical account values and expenses may not be used to estimate the actual ending account balances or expenses you paid for the six-month period shown. You may use this information to compare the ongoing costs of investing in the Portfolio with the ongoing costs of investing in other Portfolios. To do so, compare this 5% hypothetical example with the 5% hypothetical examples that appear in the shareholder reports of the other Portfolios.
Please note that the expenses shown in the table are meant to highlight your ongoing costs only and do not reflect any transactional costs, such as exchange fees or sales charges (loads). Therefore, the fourth and fifth data columns of the table are useful in comparing ongoing costs only and will not help you determine the relative total costs of owning different funds. In addition, if these transactional costs were included, your costs would have been higher.
| | | | | | | | | | | | | | | | | | | | |
| | | | | | | | | | | | | | | | |
| Share Class | | Beginning
Account
Value
7/1/13 | | | Ending Account
Value (Based
on Actual
Returns and
Expenses)
12/31/13 | | | Expenses
Paid
During
Period1 | | | Ending Account
Value (Based
on Hypothetical
5% Annualized
Return and
Actual Expenses)
12/31/13 | | | Expenses
Paid
During
Period1 | |
| | | | | |
| Initial Class Shares | | $ | 1,000.00 | | | $ | 1,000.00 | | | $ | 0.60 | | | $ | 1,024.60 | | | $ | 0.61 | |
| 1. | Expenses are equal to the Portfolio’s net annualized expense ratio of 0.12% multiplied by the average account value over the period, divided by 365 and multiplied by 184 (to reflect the six-month period). The table above represents the actual expenses incurred during the six-month period. |
| | |
| M-50 | | MainStay VP Cash Management Portfolio |
Portfolio Composition as of December 31, 2013 (Unaudited)
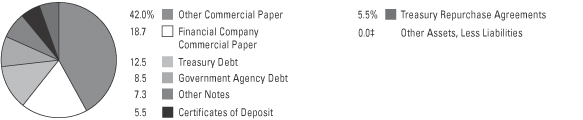
See Portfolio of Investments beginning on page M-54 for specific holdings within these categories.
| ‡ | Less than one-tenth of a percent. |
| | | | |
| mainstayinvestments.com | | | M-51 | |
Portfolio Management Discussion and Analysis (Unaudited)
Answers to the questions reflect the views of Thomas J. Girard and David E. Clement, CFA, of New York Life Investments,1 the Portfolio’s Manager.
How did MainStay VP Cash Management Portfolio perform relative to its peers during the 12 months ended December 31, 2013?
As of December 31, 2013, MainStay VP Cash Management Portfolio Initial Class shares provided a 7-day current yield of 0.01% and a 7-day effective yield of 0.01%. For the 12 months ended December 31, 2013, Initial Class shares of MainStay VP Cash Management Portfolio returned 0.02%. The Portfolio outperformed the –0.03% return of the average Lipper2 Variable Products Money Market Portfolio for the 12 months ended December 31, 2013. Performance figures for the Portfolio reflect certain fee waivers and/or expense limitations, without which total returns may have been different.
What were the most significant factors and risks that influenced the markets in which the Portfolio invested during the 12 months ended December 31, 2013?
In June 2013, the Securities and Exchange Commission released its proposed money market fund reform, which focused on two principal alternatives that could be adopted alone or in combination. The first alternative would require a floating net asset value (“NAV”) for prime institutional money market funds. The second would require liquidity fees and allow redemption gates in times of stress. Liquidity and diversification measures were also proposed. The proposals had no immediate effect on the Portfolio but did add a degree of uncertainty in the market regarding how the proposals might affect the popularity of money market funds and what changes they might create in liquidity management.
Concerns that the Federal Reserve would begin tapering its bond purchases (widely known as quantitative easing) caused volatility in the longer-maturity markets but had minimal impact on the money markets. In October 2013, a shutdown of the U.S. government caused massive volatility in short-maturity instruments, particularly among U.S. Treasury securities.
What was the Portfolio’s duration3 strategy during the reporting period?
During 2013, the Portfolio had a target duration of 45 to 55 days. The weighted average maturity was shortened in order to participate in the primary asset-backed securities market and was lengthened after investments in these securities were made. The U.S. Treasury coupon market (which offers 13 month maturities) also added to the Portfolio’s duration.
When the Federal Reserve put tapering on hold in September, the likelihood of higher short-term rates seemed diminished, which allowed the Portfolio’s weighted average maturity to drift depending on the supply of attractive longer-maturity securities. (The yield curve,4 though flatter, remained upward-sloping during the reporting period.) In December, however, the Federal Open Market Committee announced that it would begin tapering in January 2014.
What specific factors, risks, or market forces prompted significant decisions for the Portfolio during the reporting period?
With the Federal Reserve likely to remain accommodative during the reporting period, the Portfolio continued to look to longer maturities (U.S. Treasury coupons and asset-backed securities) for yield advantages. An upward-sloping yield curve during the reporting period added to the attractiveness of longer-dated maturities. The U.S. government shutdown caused increased volatility for shorter-maturity instruments toward the end of the reporting period. As supply decreased and spreads5 tightened, the investment environment became increasingly challenging.
During the reporting period, which market segments were the strongest contributors to the Portfolio’s performance and which market segments were particularly weak?
From a value perspective, not much changed from last year. Asset-backed securities and floating-rate corporate bonds continued to offer relative value and remained the Portfolio’s strongest contributors to
| 1. | “New York Life Investments” is a service mark used by New York Life Investment Management Holdings LLC and its subsidiary New York Life Investment Management LLC. |
| 2. | Please refer to pages M-2 and M-3 for additional explanations and disclosure regarding the Portfolios, their benchmark indices and service providers mentioned in the reports. |
| 3. | Duration is a measure of the price sensitivity of a fixed-income investment to changes in interest rates. Duration is expressed as a number of years and is considered a more accurate sensitivity gauge than average maturity. |
| 4. | The yield curve is a line that plots the yields of various securities of similar quality—typically U.S. Treasury issues—across a range of maturities. The U.S. Treasury yield curve serves as a benchmark for other debt and is used in economic forecasting. |
| 5. | The terms “spread” and “yield spread” may refer to the difference in yield between a security or type of security and comparable U.S. Treasury issues. The terms may also refer to the difference in yield between two specific securities or types of securities at a given time. |
| | |
| M-52 | | MainStay VP Cash Management Portfolio |
performance. (Contributions take weightings and total returns into account.) As supply in other sectors (industrial commercial paper and repurchase agreements) declined, however, these sectors saw spreads tighten during the reporting period.
Industrial commercial paper traded at very tight spreads to U.S. Treasury bills for much of the reporting period and detracted from the Portfolio’s performance. Declining supply for repurchase agreements caused yields to rally in this sector as well, which detracted further from the performance of the Portfolio.
Did the Portfolio make any significant purchases or sales during the reporting period?
Significant purchases during the reporting period included National Rural Utilities Cooperative Finance
Floating Rate Notes due 2/18/14; E.I. du Pont de Nemours Floating Rate Notes due 3/25/14; an ARI Fleet Lease Trust 2013-A A1 ABS Note due 4/15/14; and a CarMax Auto Owner Trust 2013-4 A1 ABS Note due 11/17/14.
Because the Portfolio typically holds securities until their maturity, there were no significant sales during the reporting period.
How did the Portfolio’s sector weightings change during the reporting period?
During 2013, the Portfolio increased its exposure to U.S. government agency securities and decreased its exposure to repurchase agreements.
The opinions expressed are those of the portfolio managers as of the date of this report and are subject to change. There is no guarantee that any forecasts made will come to pass. This material does not constitute investment advice and is not intended as an endorsement of any specific investment.
Not all MainStay VP Portfolios and/or share classes are available under all policies.
| | | | |
| mainstayinvestments.com | | | M-53 | |
Portfolio of Investments December 31, 2013
| | | | | | | | |
| | | Principal
Amount | | | Amortized
Cost | |
| Short-Term Investments 100.0%† | |
Certificates of Deposit 5.5% | |
Royal Bank of Canada
0.167%, due 3/13/14 (a) | | $ | 6,065,000 | | | $ | 6,065,000 | |
0.247%, due 4/15/14 (a) | | | 6,075,000 | | | | 6,075,000 | |
0.31%, due 1/30/14 (a) | | | 6,225,000 | | | | 6,225,000 | |
Toronto-Dominion Bank (The)
0.217%, due 9/2/14 (a) | | | 6,020,000 | | | | 6,020,000 | |
0.225%, due 11/18/14 (a) | | | 6,185,000 | | | | 6,185,000 | |
Wells Fargo Bank NA
0.197%, due 6/16/14 (a) | | | 6,210,000 | | | | 6,210,000 | |
0.218%, due 3/7/14 (a) | | | 6,000,000 | | | | 6,000,000 | |
| | | | | | | | |
| | | | | | | 42,780,000 | |
| | | | | | | | |
Financial Company Commercial Paper 18.7% | |
Bank of Nova Scotia
0.09%, due 3/3/14 (b) | | | 10,000,000 | | | | 9,998,475 | |
0.155%, due 3/13/14 (b) | | | 10,000,000 | | | | 9,996,943 | |
CPPIB Capital, Inc.
0.13%, due 2/4/14 (b)(c) | | | 15,460,000 | | | | 15,458,102 | |
John Deere Bank SA
0.08%, due 1/21/14 (b)(c) | | | 7,000,000 | | | | 6,999,689 | |
0.10%, due 1/16/14 (b)(c) | | | 7,000,000 | | | | 6,999,708 | |
JPMorgan Chase & Co.
0.326%, due 1/16/14 (b) | | | 6,200,000 | | | | 6,200,000 | |
Massachusetts Mutual Life Insurance Co.
0.14%, due 1/8/14 (b)(c) | | | 15,500,000 | | | | 15,499,578 | |
National Australia Funding Delaware, Inc.
0.14%, due 3/26/14 (b)(c) | | | 15,000,000 | | | | 14,995,100 | |
National Rural Utilities Cooperative Finance Corp.
0.09%, due 1/15/14 (b) | | | 3,100,000 | | | | 3,099,892 | |
0.10%, due 1/23/14 (b) | | | 4,000,000 | | | | 3,999,756 | |
0.10%, due 1/24/14 (b) | | | 6,165,000 | | | | 6,164,606 | |
Nationwide Life Insurance Co.
0.12%, due 1/27/14 (b)(c) | | | 4,000,000 | | | | 3,999,653 | |
0.15%, due 1/22/14 (b)(c) | | | 6,160,000 | | | | 6,159,461 | |
0.16%, due 1/3/14 (b)(c) | | | 9,315,000 | | | | 9,314,917 | |
PACCAR Financial Corp.
0.08%, due 1/2/14 (b) | | | 2,355,000 | | | | 2,354,995 | |
U.S. Bank NA
0.13%, due 1/7/14 (b) | | | 15,470,000 | | | | 15,470,000 | |
Westpac Banking Corp.
0.14%, due 3/26/14 (b)(c) | | | 10,000,000 | | | | 9,996,733 | |
| | | | | | | | |
| | | | | | | 146,707,608 | |
| | | | | | | | |
Government Agency Debt 8.5% | |
Farmer Mac
(zero coupon), due 1/10/14 | | | 4,000,000 | | | | 3,999,950 | |
0.13%, due 6/6/14 | | | 8,000,000 | | | | 7,995,493 | |
| | | | | | | | |
| | | Principal
Amount | | | Amortized
Cost | |
Government Agency Debt (continued) | |
Federal Home Loan Bank
0.06%, due 1/10/14 | | $ | 4,700,000 | | | $ | 4,699,930 | |
0.06%, due 1/24/14 | | | 6,540,000 | | | | 6,539,749 | |
0.075%, due 3/28/14 | | | 10,000,000 | | | | 9,998,208 | |
Federal Home Loan Mortgage Corp.
0.085%, due 2/10/14 | | | 7,500,000 | | | | 7,499,292 | |
Federal National Mortgage Association
0.06%, due 1/22/14 | | | 6,600,000 | | | | 6,599,769 | |
0.07%, due 2/3/14 | | | 3,899,000 | | | | 3,898,750 | |
Tennessee Valley Authority
(zero coupon), due 1/2/14 | | | 620,000 | | | | 620,000 | |
0.02%, due 2/6/14 | | | 8,700,000 | | | | 8,699,826 | |
0.025%, due 2/6/14 | | | 6,000,000 | | | | 5,999,850 | |
| | | | | | | | |
| | | | | | | 66,550,817 | |
| | | | | | | | |
Other Commercial Paper 42.0% | |
Air Products & Chemicals, Inc.
0.06%, due 1/24/14 (b)(c) | | | 3,705,000 | | | | 3,704,858 | |
0.08%, due 1/9/14 (b)(c) | | | 10,000,000 | | | | 9,999,822 | |
0.12%, due 2/12/14 (b)(c) | | | 6,160,000 | | | | 6,159,138 | |
Baker Hughes, Inc.
0.07%, due 1/6/14 (b)(c) | | | 15,475,000 | | | | 15,474,849 | |
Brown-Forman Corp.
0.11%, due 1/10/14 (b)(c) | | | 12,370,000 | | | | 12,369,660 | |
0.11%, due 1/17/14 (b)(c) | | | 5,500,000 | | | | 5,499,731 | |
Coca-Cola Co. (The)
0.10%, due 3/4/14 (b)(c) | | | 3,100,000 | | | | 3,099,466 | |
0.11%, due 3/20/14 (b)(c) | | | 9,315,000 | | | | 9,312,780 | |
ConocoPhillips Qatar Funding Ltd.
0.14%, due 2/18/14 (b)(c) | | | 9,315,000 | | | | 9,313,261 | |
Emerson Electric Co.
0.09%, due 3/20/14 (b)(c) | | | 9,265,000 | | | | 9,263,193 | |
0.10%, due 2/26/14 (b)(c) | | | 9,280,000 | | | | 9,278,556 | |
Exxon Mobil Corp.
0.07%, due 1/6/14 (b) | | | 6,165,000 | | | | 6,164,940 | |
Google, Inc.
0.10%, due 2/20/14 (b)(c) | | | 13,000,000 | | | | 12,998,194 | |
Honeywell International, Inc.
0.10%, due 2/19/14 (b)(c) | | | 6,000,000 | | | | 5,999,183 | |
Illinois Tool Works, Inc.
0.08%, due 1/14/14 (b)(c) | | | 1,860,000 | | | | 1,859,946 | |
0.08%, due 1/15/14 (b)(c) | | | 8,060,000 | | | | 8,059,749 | |
0.10%, due 2/3/14 (b)(c) | | | 2,470,000 | | | | 2,469,774 | |
International Business Machines Corp.
0.05%, due 1/17/14 (b)(c) | | | 9,310,000 | | | | 9,309,793 | |
0.06%, due 1/16/14 (b)(c) | | | 8,010,000 | | | | 8,009,800 | |
Merck & Co., Inc.
0.07%, due 2/13/14 (b)(c) | | | 9,310,000 | | | | 9,309,222 | |
| † | Percentages indicated are based on Portfolio net assets. |
| | | | |
| M-54 | | MainStay VP Cash Management Portfolio | | The notes to the financial statements are an integral part of,
and should be read in conjunction with, the financial statements. |
| | | | | | | | |
| | | Principal
Amount | | | Amortized
Cost | |
| Short-Term Investments (continued) | |
Other Commercial Paper (continued) | |
Microsoft Corp.
0.08%, due 2/12/14 (b)(c) | | $ | 9,925,000 | | | $ | 9,924,074 | |
NetJets, Inc.
0.05%, due 1/3/14 (b)(c) | | | 20,000,000 | | | | 19,999,944 | |
NSTAR Electric Co.
0.07%, due 1/2/14 (b) | | | 2,117,000 | | | | 2,116,996 | |
PepsiCo, Inc.
0.06%, due 2/3/14 (b)(c) | | | 6,175,000 | | | | 6,174,660 | |
Procter & Gamble Co. (The)
0.08%, due 3/5/14 (b)(c) | | | 6,185,000 | | | | 6,184,134 | |
Province of British Columbia
0.09%, due 3/24/14 (b) | | | 1,155,000 | | | | 1,154,763 | |
Province of Ontario Canada
0.07%, due 1/2/14 (b) | | | 9,895,000 | | | | 9,894,981 | |
0.09%, due 1/31/14 (b) | | | 1,520,000 | | | | 1,519,886 | |
0.09%, due 2/3/14 (b) | | | 9,265,000 | | | | 9,264,236 | |
Province of Quebec Canada
0.09%, due 1/13/14 (b)(c) | | | 10,000,000 | | | | 9,999,700 | |
0.09%, due 1/21/14 (b)(c) | | | 3,085,000 | | | | 3,084,846 | |
0.10%, due 1/24/14 (b)(c) | | | 1,850,000 | | | | 1,849,882 | |
0.10%, due 1/29/14 (b)(c) | | | 1,739,000 | | | | 1,738,865 | |
Sigma-Aldrich Corp.
0.05%, due 1/3/14 (b)(c) | | | 3,705,000 | | | | 3,704,990 | |
Southern Co. (The)
0.14%, due 1/27/14 (b)(c) | | | 9,270,000 | | | | 9,269,063 | |
Southern Co. Funding Corp.
0.18%, due 1/9/14 (b)(c) | | | 9,235,000 | | | | 9,234,631 | |
St. Jude Medical, Inc.
0.20%, due 3/28/14 (b)(c) | | | 12,335,000 | | | | 12,329,107 | |
UnitedHealth Group, Inc.
0.16%, due 1/10/14 (b)(c) | | | 6,195,000 | | | | 6,194,752 | |
0.17%, due 1/2/14 (b)(c) | | | 12,710,000 | | | | 12,709,940 | |
Walt Disney Co. (The)
0.06%, due 2/27/14 (b)(c) | | | 7,095,000 | | | | 7,094,326 | |
0.12%, due 4/8/14 (b)(c) | | | 6,175,000 | | | | 6,173,003 | |
Washington Gas Light Co.
0.10%, due 1/17/14 (b) | | | 4,330,000 | | | | 4,329,808 | |
0.10%, due 1/21/14 (b) | | | 6,170,000 | | | | 6,169,657 | |
WGL Holdings, Inc.
0.15%, due 1/15/14 (b)(c) | | | 6,210,000 | | | | 6,209,638 | |
0.16%, due 1/24/14 (b)(c) | | | 5,695,000 | | | | 5,694,418 | |
| | | | | | | | |
| | | | | | | 329,676,215 | |
| | | | | | | | |
Other Notes 7.3% | |
American Honda Finance Corp.
0.242%, due 12/5/14 (a) | | | 6,185,000 | | | | 6,185,000 | |
ARI Fleet Lease Trust
Series 2013-A, Class A1
0.26%, due 4/15/14 (c) | | | 777,099 | | | | 777,099 | |
| | | | | | | | |
| | | Principal
Amount | | | Amortized
Cost | |
Other Notes (continued) | |
CarMax Auto Owner Trust
Series 2013-4 A1
0.24%, due 11/17/14 | | $ | 2,550,652 | | | $ | 2,550,652 | |
CCG Receivables Trust
Series 2013-1, Class A1
0.37%, due 4/14/14 (c) | | | 344,146 | | | | 344,146 | |
Coca-Cola Co. (The)
0.193%, due 3/14/14 (a) | | | 6,195,000 | | | | 6,195,230 | |
E.I. du Pont de Nemours & Co.
0.666%, due 3/25/14 (a) | | | 5,945,000 | | | | 5,951,413 | |
Enterprise Fleet Financing LLC
Series 2013-1, Class A1
0.26%, due 3/20/14 (c) | | | 327,228 | | | | 327,228 | |
Series 2013-2, Class A1
0.29%, due 8/20/14 (c) | | | 1,865,292 | | | | 1,865,292 | |
Ford Credit Auto Owner Trust
Series 2013-D, Class A1
0.24%, due 12/15/14 (c) | | | 1,461,948 | | | | 1,461,948 | |
Honda Auto Receivables Owner Trust
Series 2013-4, Class A1
0.24%, due 11/18/14 | | | 2,892,427 | | | | 2,892,427 | |
Hyundai Auto Receivables Trust
Series 2013-B, Class A1
0.25%, due 7/15/14 | | | 1,337,936 | | | | 1,337,936 | |
John Deere Owner Trust
Series 2013-B, Class A1
0.25%, due 9/26/14 | | | 2,192,224 | | | | 2,192,224 | |
M&T Bank Auto Receivables Trust
Series 2013-1A, Class A1
0.25%, due 9/15/14 (c) | | | 1,760,429 | | | | 1,760,429 | |
Mercedes-Benz Auto Lease Trust
Series 2013-B, Class A1
0.26%, due 12/15/14 | | | 1,211,371 | | | | 1,211,371 | |
Series 2013-A, Class A1
0.27%, due 5/15/14 | | | 356,927 | | | | 356,927 | |
MetLife Institutional Funding II
0.314%, due 1/10/14 (a)(c) | | | 6,250,000 | | | | 6,250,000 | |
MMAF Equipment Finance LLC
Series 2013-AA, Class A1
0.28%, due 9/5/14 (c) | | | 2,184,713 | | | | 2,184,713 | |
National Rural Utilities Cooperative Finance Corp.
0.318%, due 2/18/14 (a) | | | 6,200,000 | | | | 6,200,000 | |
Nissan Auto Lease Trust
Series 2013-A, Class A1
0.23%, due 6/16/14 | | | 235,134 | | | | 235,134 | |
Procter & Gamble Co. (The)
0.139%, due 2/14/14 (a) | | | 6,210,000 | | | | 6,209,717 | |
Volvo Financial Equipment LLC
Series 2013-1A, Class A1
0.26%, due 4/15/14 (c) | | | 368,610 | | | | 368,610 | |
| | | | | | |
The notes to the financial statements are an integral part of,
and should be read in conjunction with, the financial statements. | | mainstayinvestments.com | | | M-55 | |
Portfolio of Investments December 31, 2013 (continued)
| | | | | | | | |
| | | Principal
Amount | | | Amortized
Cost | |
| Short-Term Investments (continued) | |
Other Notes (continued) | |
World Omni Auto Receivables Trust
Series 2013-A, Class A1
0.23%, due 6/16/14 | | $ | 460,881 | | | $ | 460,881 | |
| | | | | | | | |
| | | | | | | 57,318,377 | |
| | | | | | | | |
Treasury Debt 12.5% | |
United States Treasury Bills
(zero coupon), due 2/13/14 (b) | | | 3,000,000 | | | | 2,999,964 | |
0.013%, due 1/16/14 (b) | | | 21,550,000 | | | | 21,549,888 | |
United States Treasury Notes
0.125%, due 7/31/14 | | | 6,000,000 | | | | 5,999,277 | |
0.125%, due 12/31/14 | | | 6,205,000 | | | | 6,202,926 | |
0.25%, due 1/31/14 | | | 6,210,000 | | | | 6,210,333 | |
0.25%, due 2/28/14 | | | 6,205,000 | | | | 6,205,685 | |
0.25%, due 3/31/14 | | | 6,160,000 | | | | 6,161,783 | |
0.25%, due 4/30/14 | | | 6,135,000 | | | | 6,137,015 | |
0.25%, due 5/31/14 | | | 6,165,000 | | | | 6,167,367 | |
0.25%, due 8/31/14 | | | 6,225,000 | | | | 6,228,690 | |
0.25%, due 9/30/14 | | | 6,155,000 | | | | 6,159,956 | |
0.25%, due 10/31/14 | | | 6,105,000 | | | | 6,111,198 | |
0.25%, due 11/30/14 | | | 6,170,000 | | | | 6,176,024 | |
2.625%, due 6/30/14 | | | 6,000,000 | | | | 6,073,458 | |
| | | | | | | | |
| | | | | | | 98,383,564 | |
| | | | | | | | |
Treasury Repurchase Agreements 5.5% | |
Bank of America N.A.
0.005%, dated 12/31/13
due 1/2/14
Proceeds at Maturity $18,000,005 (Collateralized by United States Treasury Notes/Bonds with rates between 0.00% and 1.25% and maturity dates between 7/15/20 and 8/15/25, with a Principal Amount of $19,256,471 and a Market Value of $18,360,000) | | | 18,000,000 | | | | 18,000,000 | |
Deutsche Bank Securities, Inc.
0.02%, dated 12/31/13
due 1/2/14
Proceeds at Maturity $15,285,017 (Collateralized by a United States Treasury Note with a rate of 1.75% and a maturity date of 5/15/23, with a Principal Amount of $17,211,900 and a Market Value of $15,590,776) | | | 15,285,000 | | | | 15,285,000 | |
| | | | | | | | |
| | | Principal
Amount | | | Amortized
Cost | |
Treasury Repurchase Agreements (continued) | |
TD Securities (U.S.A.) LLC
0.005%, dated 12/31/13
due 1/2/14
Proceeds at Maturity $10,000,003 (Collateralized by a United States Treasury Bond with a rate of 5.375% and a maturity date of 2/15/31, with a Principal Amount of $8,153,900 and a Market Value of $10,200,009) | | $ | 10,000,000 | | | $ | 10,000,000 | |
| | | | | | | | |
| | | | | | | 43,285,000 | |
| | | | | | | | |
Total Short-Term Investments
(Amortized Cost $784,701,581) (d) | | | 100.0 | % | | | 784,701,581 | |
Other Assets, Less Liabilities | | | 0.0 | ‡ | | | 140,674 | |
Net Assets | | | 100.0 | % | | $ | 784,842,255 | |
| ‡ | Less than one-tenth of a percent. |
| (a) | Floating rate—Rate shown is the rate in effect as of December 31, 2013. |
| (b) | Interest rate shown represents yield to maturity. |
| (c) | May be sold to institutional investors only under Rule 144A or securities offered pursuant to Section 4(a)(2) of the Securities Act of 1933, as amended. |
| (d) | The amortized cost also represents the aggregate cost for federal income tax purposes. |
| | | | |
| M-56 | | MainStay VP Cash Management Portfolio | | The notes to the financial statements are an integral part of,
and should be read in conjunction with, the financial statements. |
The following is a summary of the fair valuations according to the inputs used as of December 31, 2013, for valuing the Portfolio’s assets.
Asset Valuation Inputs
| | | | | | | | | | | | | | | | |
Description | | Quoted Prices in
Active Markets
for Identical Assets (Level 1) | | | Significant Other
Observable Inputs (Level 2) | | | Significant
Unobservable
Inputs (Level 3) | | | Total | |
| Investments in Securities (a) | | | | | | | | | | | | | | | | |
| Short-Term Investments | | | | | | | | | | | | | | | | |
Certificates of Deposit | | $ | — | | | $ | 42,780,000 | | | $ | — | | | $ | 42,780,000 | |
Financial Company Commercial Paper | | | — | | | | 146,707,608 | | | | — | | | | 146,707,608 | |
Government Agency Debt | | | — | | | | 66,550,817 | | | | — | | | | 66,550,817 | |
Other Commercial Paper | | | — | | | | 329,676,215 | | | | — | | | | 329,676,215 | |
Other Notes | | | — | | | | 57,318,377 | | | | — | | | | 57,318,377 | |
Treasury Debt | | | — | | | | 98,383,564 | | | | — | | | | 98,383,564 | |
Treasury Repurchase Agreements | | | — | | | | 43,285,000 | | | | — | | | | 43,285,000 | |
| | | | | | | | | | | | | | | | |
| Total Investments in Securities | | $ | — | | | $ | 784,701,581 | | | $ | — | | | $ | 784,701,581 | |
| | | | | | | | | | | | | | | | |
| (a) | For a complete listing of investments, see the Portfolio of Investments. |
The Portfolio recognizes transfers between the levels as of the beginning of the period.
For the year ended December 31, 2013, the Portfolio did not have any transfers between Level 1 and Level 2 fair value measurements. (See Note 2)
As of December 31, 2013, the Portfolio did not hold any investments with significant unobservable inputs (Level 3). (See Note 2)
| | | | | | |
The notes to the financial statements are an integral part of,
and should be read in conjunction with, the financial statements. | | mainstayinvestments.com | | | M-57 | |
Portfolio of Investments December 31, 2013 (continued)
The table below sets forth the diversification of MainStay VP Cash Management Portfolio investments by industry.
Industry Diversification (Unaudited)
| | | | | | | | |
| | | Amortized
Cost | | | Percent† | |
Automobile ABS | | $ | 15,237,324 | | | | 1.9 | % |
Banks | | | 109,437,251 | | | | 13.9 | |
Beverages | | | 42,651,527 | | | | 5.4 | |
Chemicals | | | 29,520,221 | | | | 3.8 | |
Computers | | | 17,319,593 | | | | 2.2 | |
Cosmetics & Personal Care | | | 12,393,851 | | | | 1.6 | |
Electric | | | 20,620,690 | | | | 2.6 | |
Electrical Components & Equipment | | | 18,541,749 | | | | 2.4 | |
Electronics | | | 5,999,183 | | | | 0.8 | |
Finance—Auto Loans | | | 8,539,995 | | | | 1.1 | |
Finance—Investment Fund | | | 15,458,102 | | | | 2.0 | |
Finance—Other Services | | | 19,464,254 | | | | 2.5 | |
Gas | | | 22,403,521 | | | | 2.8 | |
Health Care—Products | | | 12,329,107 | | | | 1.6 | |
Health Care—Services | | | 18,904,692 | | | | 2.4 | |
Insurance | | | 41,223,609 | | | | 5.2 | |
Internet | | | 12,998,194 | | | | 1.7 | |
Machinery—Diversified | | | 13,999,397 | | | | 1.8 | |
Media | | | 13,267,329 | | | | 1.7 | |
Miscellaneous—Manufacturing | | | 12,389,469 | | | | 1.6 | |
Oil & Gas | | | 15,478,201 | | | | 2.0 | |
Oil & Gas Services | | | 15,474,849 | | | | 2.0 | |
Pharmaceuticals | | | 9,309,222 | | | | 1.2 | |
Regional (State & Province) | | | 38,507,159 | | | | 4.9 | |
Repurchase Agreements | | | 43,285,000 | | | | 5.5 | |
Software | | | 9,924,074 | | | | 1.3 | |
Sovereign | | | 164,934,381 | | | | 21.0 | |
Student Loans | | | 5,089,693 | | | | 0.6 | |
Transportation | | | 19,999,944 | | | | 2.5 | |
| | | | | | | | |
| | | 784,701,581 | | | | 100.0 | |
Other Assets, Less Liabilities | | | 140,674 | | | | 0.0 | ‡ |
| | | | | | | | |
Net Assets | | $ | 784,842,255 | | | | 100.0 | % |
| | | | | | | | |
| † | Percentages indicated are based on Portfolio net assets. |
| ‡ | Less than one-tenth of a percent. |
| | | | |
| M-58 | | MainStay VP Cash Management Portfolio | | The notes to the financial statements are an integral part of,
and should be read in conjunction with, the financial statements. |
Statement of Assets and Liabilities as of December 31, 2013
| | | | |
| Assets | | | | |
Investment in securities, at value
(amortized cost $784,701,581) | | $ | 784,701,581 | |
Cash | | | 222 | |
Receivables: | | | | |
Fund shares sold | | | 1,510,863 | |
Interest | | | 62,554 | |
| | | | |
Total assets | | | 786,275,220 | |
| | | | |
| |
| Liabilities | | | | |
Payables: | | | | |
Fund shares redeemed | | | 1,303,476 | |
Shareholder communication | | | 51,819 | |
Manager (See Note 3) | | | 37,265 | |
Professional fees | | | 31,508 | |
Custodian | | | 5,007 | |
Trustees | | | 682 | |
Accrued expenses | | | 3,208 | |
| | | | |
Total liabilities | | | 1,432,965 | |
| | | | |
Net assets | | $ | 784,842,255 | |
| | | | |
| |
| Net Assets Consist of | | | | |
Shares of beneficial interest outstanding (par value of $.001 per share) unlimited number of shares authorized | | $ | 784,781 | |
Additional paid-in capital | | | 784,057,338 | |
| | | | |
| | | 784,842,119 | |
Undistributed net investment income | | | 84 | |
Accumulated net realized gain (loss) on investments | | | 52 | |
| | | | |
Net assets applicable to outstanding shares | | $ | 784,842,255 | |
| | | | |
Shares of beneficial interest outstanding | | | 784,781,437 | |
| | | | |
Net asset value per share outstanding | | $ | 1.00 | |
| | | | |
| | | | | | |
The notes to the financial statements are an integral part of,
and should be read in conjunction with, the financial statements. | | mainstayinvestments.com | | | M-59 | |
Statement of Operations for the year ended December 31, 2013
| | | | |
| Investment Income (Loss) | | | | |
Income | | | | |
Interest | | $ | 1,062,008 | |
| | | | |
Expenses | | | | |
Manager (See Note 3) | | | 3,058,958 | |
Shareholder communication | | | 122,972 | |
Professional fees | | | 67,266 | |
Custodian | | | 26,484 | |
Trustees | | | 14,820 | |
Miscellaneous | | | 19,661 | |
| | | | |
Total expenses before waiver/reimbursement | | | 3,310,161 | |
Expense waiver/reimbursement from Manager (See Note 3) | | | (2,318,351 | ) |
| | | | |
Net expenses | | | 991,810 | |
| | | | |
Net investment income (loss) | | | 70,198 | |
| | | | |
|
| Realized and Unrealized Gain (Loss) on Investments | |
Net realized gain (loss) on investments | | | 52 | |
| | | | |
Net increase (decrease) in net assets resulting from operations | | $ | 70,250 | |
| | | | |
| | | | |
| M-60 | | MainStay VP Cash Management Portfolio | | The notes to the financial statements are an integral part of,
and should be read in conjunction with, the financial statements. |
Statements of Changes in Net Assets
for the years ended December 31, 2013 and December 31, 2012
| | | | | | | | |
| | | 2013 | | | 2012 | |
| Increase (Decrease) in Net Assets | |
Operations: | | | | | | | | |
Net investment income (loss) | | $ | 70,198 | | | $ | 74,363 | |
Net realized gain (loss) on investments | | | 52 | | | | 112 | |
| | | | |
Net increase (decrease) in net assets resulting from operations | | | 70,250 | | | | 74,475 | |
| | | | |
Dividends to shareholders: | | | | | | | | |
From net investment income | | | (70,226 | ) | | | (74,363 | ) |
| | | | |
Capital share transactions: | | | | | | | | |
Net proceeds from sale of shares | | | 706,607,301 | | | | 608,218,552 | |
Net asset value of shares issued to shareholders in reinvestment of dividends | | | 70,226 | | | | 74,363 | |
Cost of shares redeemed | | | (650,541,552 | ) | | | (768,841,980 | ) |
| | | | |
Increase (decrease) in net assets derived from capital share transactions | | | 56,135,975 | | | | (160,549,065 | ) |
| | | | |
Net increase (decrease) in net assets | | | 56,135,999 | | | | (160,548,953 | ) |
| | |
| Net Assets | | | | | | | | |
Beginning of year | | | 728,706,256 | | | | 889,255,209 | |
| | | | |
End of year | | $ | 784,842,255 | | | $ | 728,706,256 | |
| | | | |
Undistributed net investment income at end of year | | $ | 84 | | | $ | — | |
| | | | |
| | | | | | |
The notes to the financial statements are an integral part of,
and should be read in conjunction with, the financial statements. | | mainstayinvestments.com | | | M-61 | |
Financial Highlights selected per share data and ratios
| | | | | | | | | | | | | | | | | | | | |
| | | Year ended December 31, | |
| | | 2013 | | | 2012 | | | 2011 | | | 2010 | | | 2009 | |
Net asset value at beginning of year | | $ | 1.00 | | | $ | 1.00 | | | $ | 1.00 | | | $ | 1.00 | | | $ | 1.00 | |
| | | | | | | | | | | | | | | | | | | | |
Net investment income (loss) | | | 0.00 | ‡ | | | 0.00 | ‡ | | | 0.00 | ‡ | | | 0.00 | ‡ | | | 0.00 | ‡ |
Net realized and unrealized gain (loss) on investments | | | 0.00 | ‡ | | | 0.00 | ‡ | | | 0.00 | ‡ | | | 0.00 | ‡ | | | 0.00 | ‡ |
| | | | | | | | | | | | | | | | | | | | |
Total from investment operations | | | 0.00 | ‡ | | | 0.00 | ‡ | | | 0.00 | ‡ | | | 0.00 | ‡ | | | 0.00 | ‡ |
| | | | | | | | | | | | | | | | | | | | |
Less dividends: | | | | | | | | | | | | | | | | | | | | |
From net investment income | | | (0.00 | )‡ | | | (0.00 | )‡ | | | (0.00 | )‡ | | | (0.00 | )‡ | | | (0.00 | )‡ |
| | | | | | | | | | | | | | | | | | | | |
Net asset value at end of year | | $ | 1.00 | | | $ | 1.00 | | | $ | 1.00 | | | $ | 1.00 | | | $ | 1.00 | |
| | | | | | | | | | | | | | | | | | | | |
Total investment return | | | 0.02 | % | | | 0.01 | % | | | 0.01 | % | | | 0.01 | % | | | 0.05 | % |
Ratios (to average net assets)/Supplemental Data: | | | | | | | | | | | | | | | | | | | | |
Net investment income (loss) | | | 0.01 | % | | | 0.01 | % | | | 0.01 | % | | | 0.01 | % | | | 0.05 | % |
Net expenses | | | 0.14 | % | | | 0.18 | % | | | 0.15 | % | | | 0.25 | % | | | 0.41 | % |
Expenses (before waiver/reimbursement) | | | 0.47 | % | | | 0.47 | % | | | 0.47 | % | | | 0.50 | % | | | 0.51 | % |
Net assets at end of year (in 000’s) | | $ | 784,842 | | | $ | 728,706 | | | $ | 889,255 | | | $ | 671,210 | | | $ | 765,118 | |
| ‡ | Less than one cent per share. |
| | | | |
| M-62 | | MainStay VP Cash Management Portfolio | | The notes to the financial statements are an integral part of,
and should be read in conjunction with, the financial statements. |
MainStay VP Common Stock Portfolio
Investment and Performance Comparison (Unaudited)
Performance data quoted represents past performance. Past performance is no guarantee of future results. Because of market volatility, current performance may be lower or higher than the figures shown. Investment return and principal value will fluctuate, and as a result, when shares are redeemed, they may be worth more or less than their original cost. The performance table and graph do not reflect any deduction of sales charges, mortality and expense charges, contract charges or administrative charges. Please refer to the Performance Summary appropriate for your policy. For performance information current to the most recent month-end, please call 800-598-2019 or visit www.newyorklife.com.
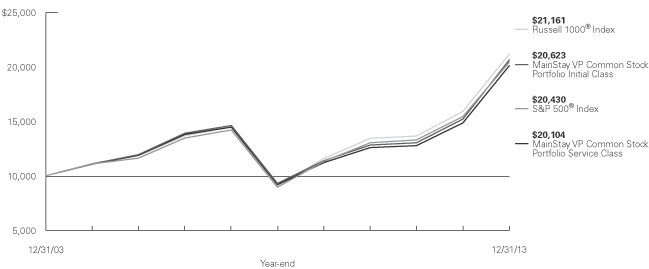
Average Annual Total Returns for the Year Ended December 31, 2013
| | | | | | | | | | | | | | | | |
| Class | | One Year | | | Five Years | | | Ten Years1 | | | Gross Expense Ratio2 | |
| Initial Class Shares | | | 35.66 | % | | | 17.26 | % | | | 7.51 | % | | | 0.59 | % |
| Service Class Shares | | | 35.32 | | | | 16.96 | | | | 7.23 | | | | 0.84 | |
| | | | | | | | | | | | |
| Benchmark Performance | | One
Year | | | Five
Years | | | Ten
Years | |
S&P 500® Index3 | | | 32.39 | % | | | 17.94 | % | | | 7.41 | % |
Russell 1000® Index3 | | | 33.11 | | | | 18.59 | | | | 7.78 | |
Average Lipper Variable Products Large-Cap Core Portfolio4 | | | 32.42 | | | | 17.10 | | | | 6.96 | |
| 1. | Performance figures shown for the ten-year period ended December 31, 2013 reflect nonrecurring reimbursements from affiliates for printing and mailing costs. If these nonrecurring reimbursements had not been made, the total returns would have been 7.49% for Initial Class shares and 7.22% for Service Class shares for the ten-year period. |
| 2. | The gross expense ratios presented reflect the Portfolio’s “Total Annual Portfolio Operating Expenses” from the most recent Prospectus and may differ from other expense ratios disclosed in this report. |
| 3. | Please refer to pages M-2 and M-3 for additional explanations and disclosure regarding the Portfolios, their benchmark indices and other indices mentioned in the reports. |
| 4. | The Average Lipper Variable Products Large-Cap Core Portfolio is representative of portfolios that, by portfolio practice, invest at least 75% of their equity assets in companies with market capitalizations (on a three-year weighted basis) above Lipper’s U.S. diversified equity large-cap floor. Large-cap core portfolios have more latitude in the companies in which they invest. These portfolios typically have average characteristics compared to the S&P 500® Index. Lipper Inc. is an independent monitor of fund performance. Results are based on total returns with all dividend and capital gain distributions reinvested. |
| | |
| mainstayinvestments.com | | M-63 |
Cost in Dollars of a $1,000 Investment in MainStay VP Common Stock Portfolio (Unaudited)
The example below is intended to describe the fees and expenses borne by shareholders during the six-month period from July 1, 2013, to December 31, 2013, and the impact of those costs on your investment.
Example
As a shareholder of the Portfolio, you incur two types of costs: (1) transaction costs, including exchange fees and sales charges (loads) on purchases (as applicable), and (2) ongoing costs, including management fees, distribution and/or service (12b-1) fees, and other Portfolio expenses (as applicable). This example is intended to help you understand your ongoing costs (in dollars) of investing in the Portfolio and to compare these costs with the ongoing costs of investing in other Portfolios. The example is based on an investment of $1,000 made at the beginning of the six-month period and held for the entire period from July 1, 2013, to December 31, 2013. Shares are only sold in connection with variable life and annuity contracts and the example does not reflect any contract level or transactional fees or expenses. If these costs had been included, your costs would have been higher.
This example illustrates your Portfolio’s ongoing costs in two ways:
Actual Expenses
The second and third data columns in the table below provide information about actual account values and actual expenses. You may use the information in these columns, together with the amount you invested, to estimate the expenses that you paid during the six months ended
December 31, 2013. Simply divide your account value by $1,000 (for example, an $8,600 account value divided by $1,000 = 8.6), then multiply the result by the number under the heading entitled ‘‘Expenses Paid During Period’’ to estimate the expenses you paid on your account during this period.
Hypothetical Example for Comparison Purposes
The fourth and fifth data columns in the table below provide information about hypothetical account values and hypothetical expenses based on the Portfolio’s actual expense ratio and an assumed rate of return of 5% per year before expenses, which is not the Portfolio’s actual return. The hypothetical account values and expenses may not be used to estimate the actual ending account balances or expenses you paid for the six-month period shown. You may use this information to compare the ongoing costs of investing in the Portfolio with the ongoing costs of investing in other Portfolios. To do so, compare this 5% hypothetical example with the 5% hypothetical examples that appear in the shareholder reports of the other Portfolios.
Please note that the expenses shown in the table are meant to highlight your ongoing costs only and do not reflect any transactional costs, such as exchange fees or sales charges (loads). Therefore, the fourth and fifth data columns of the table are useful in comparing ongoing costs only and will not help you determine the relative total costs of owning different funds. In addition, if these transactional costs were included, your costs would have been higher.
| | | | | | | | | | | | | | | | | | | | |
| | | | | | | | | | | | | | | | |
| Share Class | | Beginning
Account
Value
7/1/13 | | | Ending Account
Value (Based
on Actual
Returns and
Expenses)
12/31/13 | | | Expenses
Paid
During
Period1 | | | Ending Account
Value (Based
on Hypothetical
5% Annualized
Return and
Actual Expenses)
12/31/13 | | | Expenses
Paid
During
Period1 | |
| | | | | |
| Initial Class Shares | | $ | 1,000.00 | | | $ | 1,175.30 | | | $ | 3.18 | | | $ | 1,022.30 | | | $ | 2.96 | |
| | | | | |
| Service Class Shares | | $ | 1,000.00 | | | $ | 1,173.80 | | | $ | 4.55 | | | $ | 1,021.00 | | | $ | 4.23 | |
| 1. | Expenses are equal to the Portfolio’s annualized expense ratio of each class (0.58% for Initial Class and 0.83% for Service Class) multiplied by the average account value over the period, divided by 365 and multiplied by 184 (to reflect the six-month period). The table above represents the actual expenses incurred during the six-month period. |
| | |
| M-64 | | MainStay VP Common Stock Portfolio |
Industry Composition as of December 31, 2013 (Unaudited)
| | | | |
| Oil, Gas & Consumable Fuels | | | 7.4 | % |
| Pharmaceuticals | | | 6.3 | |
| Computers & Peripherals | | | 5.9 | |
| Diversified Financial Services | | | 5.5 | |
| Insurance | | | 4.7 | |
| Media | | | 4.5 | |
| Specialty Retail | | | 3.9 | |
| Health Care Providers & Services | | | 3.8 | |
| Software | | | 3.6 | |
| Food & Staples Retailing | | | 3.3 | |
| IT Services | | | 3.3 | |
| Diversified Telecommunication Services | | | 3.1 | |
| Internet Software & Services | | | 2.7 | |
| Semiconductors & Semiconductor Equipment | | | 2.6 | |
| Energy Equipment & Services | | | 2.4 | |
| Tobacco | | | 2.2 | |
| Biotechnology | | | 2.1 | |
| Beverages | | | 1.9 | |
| Machinery | | | 1.8 | |
| Chemicals | | | 1.7 | |
| Food Products | | | 1.7 | |
| Industrial Conglomerates | | | 1.6 | |
| Hotels, Restaurants & Leisure | | | 1.5 | |
| Aerospace & Defense | | | 1.4 | |
| Commercial Banks | | | 1.4 | |
| Household Products | | | 1.4 | |
| Airlines | | | 1.3 | |
| Air Freight & Logistics | | | 1.2 | |
| Capital Markets | | | 1.2 | |
| | | | |
| Internet & Catalog Retail | | | 1.2 | % |
| Communications Equipment | | | 1.1 | |
| Consumer Finance | | | 1.0 | |
| Exchange-Traded Fund | | | 1.0 | |
| Textiles, Apparel & Luxury Goods | | | 1.0 | |
| Diversified Consumer Services | | | 0.9 | |
| Health Care Equipment & Supplies | | | 0.9 | |
| Professional Services | | | 0.9 | |
| Multiline Retail | | | 0.8 | |
| Commercial Services & Supplies | | | 0.7 | |
| Electronic Equipment & Instruments | | | 0.7 | |
| Auto Components | | | 0.5 | |
| Electric Utilities | | | 0.5 | |
| Independent Power Producers & Energy Traders | | | 0.5 | |
| Office Electronics | | | 0.5 | |
| Trading Companies & Distributors | | | 0.5 | |
| Metals & Mining | | | 0.4 | |
| Road & Rail | | | 0.4 | |
| Electrical Equipment | | | 0.3 | |
| Containers & Packaging | | | 0.2 | |
| Real Estate Management & Development | | | 0.2 | |
| Building Products | | | 0.1 | |
| Household Durables | | | 0.1 | |
| Real Estate Investment Trusts | | | 0.1 | |
| Short-Term Investment | | | 0.0 | ‡ |
| Other Assets, Less Liabilities | | | 0.1 | |
| | | | |
| | | 100.0 | % |
| | | | |
See Portfolio of Investments beginning on page M-68 for specific holdings within these categories.
| ‡ | Less than one-tenth of a percent. |
Top Ten Holdings as of December 31, 2013 (excluding short-term investment) (Unaudited)
| 7. | Berkshire Hathaway, Inc. Class B |
| 9. | International Business Machines Corp. |
| | | | |
| mainstayinvestments.com | | | M-65 | |
Portfolio Management Discussion and Analysis (Unaudited)
Answers to the questions reflect the views of portfolio managers Migene Kim, CFA, and Andrew Ver Planck, CFA, of Cornerstone Capital Management Holdings LLC, the Portfolio’s Subadvisor.
How did MainStay VP Common Stock Portfolio perform relative to its benchmark and peers during 12 months ended December 31, 2013?
For the 12 months ended December 31, 2013, MainStay VP Common Stock Portfolio returned 35.66% for Initial Class shares and 35.32% for Service Class shares. Over the same period, both share classes outperformed the 32.39% return of the S&P 500® Index1 and the 33.11% return of the Russell 1000® Index.1 The S&P 500® Index is the Portfolio’s broad-based securities-market index, and the Russell 1000® Index is a secondary benchmark of the Portfolio. Both share classes outperformed the 32.42% return of the average Lipper1 Variable Products Large-Cap Core Portfolio for the 12 months ended December 31, 2013.
What factors affected the Portfolio’s relative performance during the reporting period?
Quantitative factors, such as valuation and momentum, generally worked well in 2013, which translated into solid relative returns for many domestic quantitative strategies. The Portfolio recorded its best annual relative performance since inception, helped by the strength of the underlying stock-selection model. The model’s performance was robust in that our suites of valuation and momentum factors both worked well. The model was particularly effective in selecting top performers relative to the S&P 500® Index, which is important for long-only strategies. Share-issuance/repurchase, sales-multiple and credit-spread factors also worked well, while earnings momentum and sentiment factor were less effective.
Which sectors were the strongest positive contributors to the Portfolio’s relative performance, and which sectors were particularly weak?
The strongest positive sector contributions to the Portfolio’s relative performance came from health care, information technology and financials. (Contributions take weightings and total returns into account.) In each of these sectors, the main driver was stock selection. The sectors that detracted the most from the Portfolio’s relative performance were consumer discretionary and energy. Unfavorable stock selection was the primary reason in both sectors. Telecommunication services was another weak contributor to relative performance, even though the
sector provided a positive return. An overweight
position in the sector detracted, but positive stock selection more than offset the allocation effect.
During the reporting period, which individual stocks made the strongest positive contributions to the Portfolio’s absolute performance and which stocks detracted the most?
The strongest positive contributors to the Portfolio’s absolute performance were Internet software & services company Google, software company Microsoft and biotechnology company Gilead Sciences. The Portfolio held a large position in Google, as it carries a substantial weight in the benchmark. Additionally, our stock-selection model suggested that the shares had high alpha2 potential. The stock returned an impressive 58.4% in 2013, making it the highest-contributing stock in the Portfolio. Microsoft is also heavily weighted in the S&P 500® Index. The Portfolio held a large position in Microsoft because of its weight in the Index and the return potential we perceived in the stock. The shares appreciated 44.3% in 2013. Gilead Sciences, the largest biotechnology company in the S&P 500® Index, appreciated more than 100% in 2013.
The Portfolio held large positions in independent oil exploration and production company Anadarko Petroleum and specialty retailers Abercrombie & Fitch and American Eagle Outfitters, which were the weakest contributors to absolute performance. Anadarko Petroleum was held in the Portfolio to manage risk by avoiding an excessively underweight position among oil exploration companies. The share price of Anadarko was hurt when a judge ruled that the company’s Kerr-McGee unit would be held liable for the spin-off and subsequent bankruptcy of Tronox. Abercrombie & Fitch and American Eagle Outfitters struggled to meet earnings expectations, as they tried to compete in the crowded—and often fickle—retailers-to-teens segment.
Did the Portfolio make any significant purchases or sales during the reporting period?
The Portfolio bought United Health Group, the largest managed care stock in the S&P 500® Index. In November 2013, the Portfolio shifted from an underweight to a neutral position. In December, the Portfolio moved to a position that was as overweight as our model would allow. We took on the overweight position when we viewed the stock’s valuation as
| 1. | Please refer to pages M-2 and M-3 for additional explanations and disclosure regarding the Portfolios, their benchmark indices and service providers mentioned in the reports. |
| 2. | Alpha is a measure of risk-adjusted performance in relation to a benchmark. The risk-adjusted performance of a portfolio is compared with the performance of a benchmark, and any excess return (positive or negative) is the portfolio’s alpha. |
| | |
| M-66 | | MainStay VP Common Stock Portfolio |
attractive following an October earnings disappointment. The Portfolio also purchased Berkshire Hathaway, a holding company with various lines of businesses including insurance, railroads and chemicals. The Portfolio shifted from an underweight to an overweight position in September, as the stock’s return prospect improved in August. Our model indicated that this large, stable, low-risk stock was attractively valued.
Shares of soft-drink company Coca-Cola and networking company Cisco were sold in large quantities, as the Portfolio moved from overweight to underweight positions in these stocks. Our model deemed Coca-Cola expensive and lacking in positive sentiment. Cisco’s return expectation diminished because of poor momentum and credit spread readings, even though the model found the stock’s valuation attractive.
How did the Portfolio’s sector weightings change during the reporting period?
Industrials saw the most substantial increase in relative sector weighting during the reporting period. The Portfolio moved from a significantly underweight position to one that was modestly underweight. The increase resulted from purchases of stocks in
construction, human resources & employment, and airlines. Purchases among steel and diversified chemicals companies reduced the degree to which the Portfolio was underweight in the materials sector.
Health care saw the most substantial decrease in relative sector weighting, as the Portfolio moved from an overweight position to a neutral position. Trimming biotechnology and health care equipment stocks accounted for the decrease. Consumer staples went from a significantly overweight position to one that was modestly overweight as the Portfolio sold shares of distillers and packaged-food companies.
How was the Portfolio positioned at the end of the reporting period?
As of December 31, 2013, the Portfolio was most substantially overweight in the consumer discretionary sector, followed by information technology. This positioning has generally been maintained throughout the reporting period. As of the same date, the Portfolio’s most substantially underweight sector was financials, followed by utilities. The Portfolio’s stance on these sectors remained consistently negative throughout the reporting period.
The opinions expressed are those of the portfolio managers as of the date of this report and are subject to change. There is no guarantee that any forecasts made will come to pass. This material does not constitute investment advice and is not intended as an endorsement of any specific investment.
Not all MainStay VP Portfolios and/or share classes are available under all policies.
| | | | |
| mainstayinvestments.com | | | M-67 | |
Portfolio of Investments December 31, 2013
| | | | | | | | |
| | |
Shares | | | Value | |
| Common Stocks 98.9%† | |
Aerospace & Defense 1.4% | |
Boeing Co. (The) | | | 48,505 | | | $ | 6,620,447 | |
L-3 Communications Holdings, Inc. | | | 8,251 | | | | 881,702 | |
Northrop Grumman Corp. | | | 9,627 | | | | 1,103,351 | |
United Technologies Corp. | | | 7,441 | | | | 846,786 | |
| | | | | | | | |
| | | | 9,452,286 | |
| | | | | | | | |
Air Freight & Logistics 1.2% | |
FedEx Corp. | | | 19,091 | | | | 2,744,713 | |
United Parcel Service, Inc. Class B | | | 51,339 | | | | 5,394,702 | |
| | | | | | | | |
| | | | 8,139,415 | |
| | | | | | | | |
Airlines 1.3% | |
Alaska Air Group, Inc. | | | 39,148 | | | | 2,872,289 | |
Delta Air Lines, Inc. | | | 84,247 | | | | 2,314,265 | |
Southwest Airlines Co. | | | 182,405 | | | | 3,436,510 | |
| | | | | | | | |
| | | | 8,623,064 | |
| | | | | | | | |
Auto Components 0.5% | |
Delphi Automotive PLC | | | 1,333 | | | | 80,153 | |
Goodyear Tire & Rubber Co. (The) | | | 138,429 | | | | 3,301,532 | |
| | | | | | | | |
| | | | 3,381,685 | |
| | | | | | | | |
Beverages 1.9% | |
Coca-Cola Co. (The) | | | 117,094 | | | | 4,837,153 | |
PepsiCo., Inc. | | | 95,367 | | | | 7,909,739 | |
| | | | | | | | |
| | | | 12,746,892 | |
| | | | | | | | |
Biotechnology 2.1% | |
Amgen, Inc. | | | 47,623 | | | | 5,436,642 | |
Biogen Idec, Inc. (a) | | | 2,702 | | | | 755,884 | |
Celgene Corp. (a) | | | 16,871 | | | | 2,850,524 | |
Cubist Pharmaceuticals, Inc. (a) | | | 1,492 | | | | 102,754 | |
Gilead Sciences, Inc. (a) | | | 20,447 | | | | 1,536,592 | |
United Therapeutics Corp. (a) | | | 28,546 | | | | 3,227,982 | |
| | | | | | | | |
| | | | 13,910,378 | |
| | | | | | | | |
Building Products 0.1% | |
Masco Corp. | | | 26,166 | | | | 595,800 | |
| | | | | | | | |
|
Capital Markets 1.2% | |
Ameriprise Financial, Inc. | | | 34,228 | | | | 3,937,931 | |
BlackRock, Inc. | | | 5,667 | | | | 1,793,436 | |
Goldman Sachs Group, Inc. (The) | | | 36 | | | | 6,381 | |
Raymond James Financial, Inc. | | | 19,329 | | | | 1,008,781 | |
State Street Corp. | | | 12,400 | | | | 910,036 | |
| | | | | | | | |
| | | | 7,656,565 | |
| | | | | | | | |
Chemicals 1.7% | |
CF Industries Holdings, Inc. | | | 7,395 | | | | 1,723,331 | |
Dow Chemical Co. (The) | | | 115,869 | | | | 5,144,583 | |
LyondellBasell Industries, N.V. Class A | | | 54,208 | | | | 4,351,818 | |
PPG Industries, Inc. | | | 1,218 | | | | 231,006 | |
| | | | | | | | |
| | | | 11,450,738 | |
| | | | | | | | |
| | | | | | | | |
| | |
Shares | | | Value | |
Commercial Banks 1.4% | |
Comerica, Inc. | | | 30,825 | | | $ | 1,465,420 | |
KeyCorp | | | 141,829 | | | | 1,903,345 | |
Wells Fargo & Co. | | | 126,019 | | | | 5,721,263 | |
| | | | | | | | |
| | | | 9,090,028 | |
| | | | | | | | |
Commercial Services & Supplies 0.7% | |
Pitney Bowes, Inc. | | | 131,395 | | | | 3,061,503 | |
R.R. Donnelley & Sons Co. | | | 72,432 | | | | 1,468,921 | |
Tyco International, Ltd. | | | 9,295 | | | | 381,467 | |
| | | | | | | | |
| | | | 4,911,891 | |
| | | | | | | | |
Communications Equipment 1.1% | |
Cisco Systems, Inc. | | | 78,932 | | | | 1,772,023 | |
Harris Corp. | | | 46,790 | | | | 3,266,410 | |
QUALCOMM, Inc. | | | 27,917 | | | | 2,072,837 | |
| | | | | | | | |
| | | | 7,111,270 | |
| | | | | | | | |
Computers & Peripherals 5.9% | |
¨Apple, Inc. | | | 40,953 | | | | 22,979,138 | |
Hewlett-Packard Co. | | | 183,955 | | | | 5,147,061 | |
SanDisk Corp. | | | 48,165 | | | | 3,397,559 | |
Seagate Technology PLC | | | 67,921 | | | | 3,814,443 | |
Western Digital Corp. | | | 44,784 | | | | 3,757,378 | |
| | | | | | | | |
| | | | 39,095,579 | |
| | | | | | | | |
Consumer Finance 1.0% | |
American Express Co. | | | 70,001 | | | | 6,351,191 | |
| | | | | | | | |
|
Containers & Packaging 0.2% | |
Sealed Air Corp. | | | 40,107 | | | | 1,365,643 | |
| | | | | | | | |
|
Diversified Consumer Services 0.9% | |
Graham Holdings Co. Class B | | | 4,610 | | | | 3,057,905 | |
Sotheby’s | | | 55,628 | | | | 2,959,410 | |
| | | | | | | | |
| | | | 6,017,315 | |
| | | | | | | | |
Diversified Financial Services 5.5% | |
Bank of America Corp. | | | 235,765 | | | | 3,670,861 | |
¨Berkshire Hathaway, Inc. Class B (a) | | | 91,613 | | | | 10,861,637 | |
Citigroup, Inc. | | | 65,189 | | | | 3,396,999 | |
¨JPMorgan Chase & Co. | | | 200,153 | | | | 11,704,948 | |
McGraw Hill Financial, Inc. | | | 26,541 | | | | 2,075,506 | |
Moody’s Corp. | | | 23,335 | | | | 1,831,098 | |
NASDAQ OMX Group, Inc. (The) | | | 78,208 | | | | 3,112,678 | |
| | | | | | | | |
| | | | 36,653,727 | |
| | | | | | | | |
Diversified Telecommunication Services 3.1% | |
AT&T, Inc. | | | 249,659 | | | | 8,778,010 | |
Frontier Communications Corp. | | | 642,864 | | | | 2,989,318 | |
Verizon Communications, Inc. | | | 171,483 | | | | 8,426,675 | |
| | | | | | | | |
| | | | 20,194,003 | |
| | | | | | | | |
| † | Percentages indicated are based on Portfolio net assets. |
| ¨ | | Among the Portfolio’s 10 largest holdings, as of December 31, 2013, excluding short-term investment. May be subject to change daily. |
| | | | |
| M-68 | | MainStay VP Common Stock Portfolio | | The notes to the financial statements are an integral part of,
and should be read in conjunction with, the financial statements. |
| | | | | | | | |
| | |
Shares | | | Value | |
| Common Stocks (continued) | |
Electric Utilities 0.5% | |
Duke Energy Corp. | | | 14,449 | | | $ | 997,126 | |
Edison International | | | 22,053 | | | | 1,021,054 | |
Southern Co. (The) | | | 27,676 | | | | 1,137,760 | |
| | | | | | | | |
| | | | 3,155,940 | |
| | | | | | | | |
Electrical Equipment 0.3% | |
Emerson Electric Co. | | | 4,009 | | | | 281,352 | |
Rockwell Automation, Inc. | | | 15,460 | | | | 1,826,753 | |
| | | | | | | | |
| | | | 2,108,105 | |
| | | | | | | | |
Electronic Equipment & Instruments 0.7% | |
FLIR Systems, Inc. | | | 34,576 | | | | 1,040,737 | |
Jabil Circuit, Inc. | | | 75,647 | | | | 1,319,284 | |
TE Connectivity, Ltd. | | | 35,883 | | | | 1,977,512 | |
| | | | | | | | |
| | | | 4,337,533 | |
| | | | | | | | |
Energy Equipment & Services 2.4% | |
Baker Hughes, Inc. | | | 54,086 | | | | 2,988,792 | |
Halliburton Co. | | | 88,555 | | | | 4,494,166 | |
Helmerich & Payne, Inc. | | | 18,587 | | | | 1,562,795 | |
Nabors Industries, Ltd. | | | 127,061 | | | | 2,158,766 | |
Oil States International, Inc. (a) | | | 13,855 | | | | 1,409,331 | |
Patterson-UTI Energy, Inc. | | | 57,689 | | | | 1,460,686 | |
Schlumberger, Ltd. | | | 21,954 | | | | 1,978,275 | |
| | | | | | | | |
| | | | 16,052,811 | |
| | | | | | | | |
Food & Staples Retailing 3.3% | |
CVS Caremark Corp. | | | 38,212 | | | | 2,734,833 | |
Kroger Co. (The) | | | 92,080 | | | | 3,639,922 | |
Safeway, Inc. | | | 97,952 | | | | 3,190,297 | |
Wal-Mart Stores, Inc. | | | 100,299 | | | | 7,892,528 | |
Walgreen Co. | | | 80,729 | | | | 4,637,074 | |
| | | | | | | | |
| | | | 22,094,654 | |
| | | | | | | | |
Food Products 1.7% | |
Archer-Daniels-Midland Co. | | | 93,536 | | | | 4,059,462 | |
General Mills, Inc. | | | 77,791 | | | | 3,882,549 | |
Kraft Foods Group, Inc. | | | 11,993 | | | | 646,663 | |
Mondelez International, Inc. Class A | | | 35,786 | | | | 1,263,246 | |
Tyson Foods, Inc. Class A | | | 48,572 | | | | 1,625,219 | |
| | | | | | | | |
| | | | 11,477,139 | |
| | | | | | | | |
Health Care Equipment & Supplies 0.9% | |
Abbott Laboratories | | | 61,558 | | | | 2,359,518 | |
Boston Scientific Corp. (a) | | | 297,881 | | | | 3,580,530 | |
| | | | | | | | |
| | | | 5,940,048 | |
| | | | | | | | |
Health Care Providers & Services 3.8% | |
Aetna, Inc. | | | 17,199 | | | | 1,179,679 | |
Cardinal Health, Inc. | | | 56,816 | | | | 3,795,877 | |
Express Scripts Holding Co. (a) | | | 74,584 | | | | 5,238,780 | |
Humana, Inc. | | | 5,676 | | | | 585,877 | |
McKesson Corp. | | | 26,940 | | | | 4,348,116 | |
| | | | | | | | |
| | |
Shares | | | Value | |
Health Care Providers & Services (continued) | |
UnitedHealth Group, Inc. | | | 79,709 | | | $ | 6,002,088 | |
WellPoint, Inc. | | | 43,505 | | | | 4,019,427 | |
| | | | | | | | |
| | | | 25,169,844 | |
| | | | | | | | |
Hotels, Restaurants & Leisure 1.5% | |
International Game Technology | | | 175,264 | | | | 3,182,794 | |
McDonald’s Corp. | | | 21,828 | | | | 2,117,971 | |
Wyndham Worldwide Corp. | | | 45,525 | | | | 3,354,737 | |
Wynn Resorts, Ltd. | | | 7,701 | | | | 1,495,611 | |
| | | | | | | | |
| | | | 10,151,113 | |
| | | | | | | | |
Household Durables 0.1% | |
Whirlpool Corp. | | | 4,494 | | | | 704,929 | |
| | | | | | | | |
|
Household Products 1.4% | |
Energizer Holdings, Inc. | | | 26,128 | | | | 2,828,095 | |
Kimberly-Clark Corp. | | | 5,484 | | | | 572,859 | |
Procter & Gamble Co. (The) | | | 73,633 | | | | 5,994,462 | |
| | | | | | | | |
| | | | 9,395,416 | |
| | | | | | | | |
Independent Power Producers & Energy Traders 0.5% | |
AES Corp. (The) | | | 222,062 | | | | 3,222,120 | |
| | | | | | | | |
|
Industrial Conglomerates 1.6% | |
3M Co. | | | 13,506 | | | | 1,894,217 | |
General Electric Co. | | | 297,948 | | | | 8,351,482 | |
| | | | | | | | |
| | | | 10,245,699 | |
| | | | | | | | |
Insurance 4.7% | |
Aflac, Inc. | | | 57,654 | | | | 3,851,287 | |
American International Group, Inc. | | | 116,317 | | | | 5,937,983 | |
Assurant, Inc. | | | 19,884 | | | | 1,319,701 | |
Chubb Corp. (The) | | | 5,267 | | | | 508,950 | |
Everest Re Group, Ltd. | | | 18,271 | | | | 2,847,901 | |
Genworth Financial, Inc. Class A (a) | | | 209,829 | | | | 3,258,644 | |
Lincoln National Corp. | | | 66,413 | | | | 3,428,239 | |
Protective Life Corp. | | | 57,833 | | | | 2,929,820 | |
Travelers Companies, Inc. (The) | | | 43,897 | | | | 3,974,434 | |
Unum Group | | | 93,881 | | | | 3,293,346 | |
| | | | | | | | |
| | | | 31,350,305 | |
| | | | | | | | |
Internet & Catalog Retail 1.2% | |
Amazon.com, Inc. (a) | | | 11,373 | | | | 4,535,438 | |
Expedia, Inc. | | | 48,271 | | | | 3,362,558 | |
| | | | | | | | |
| | | | 7,897,996 | |
| | | | | | | | |
Internet Software & Services 2.7% | |
AOL, Inc. (a) | | | 32,064 | | | | 1,494,824 | |
Facebook, Inc. Class A (a) | | | 64,187 | | | | 3,508,461 | |
¨Google, Inc. Class A (a) | | | 8,429 | | | | 9,446,465 | |
VeriSign, Inc. (a) | | | 54,941 | | | | 3,284,373 | |
| | | | | | | | |
| | | | 17,734,123 | |
| | | | | | | | |
| | | | | | |
The notes to the financial statements are an integral part of,
and should be read in conjunction with, the financial statements. | | mainstayinvestments.com | | | M-69 | |
Portfolio of Investments December 31, 2013 (continued)
| | | | | | | | |
| | |
Shares | | | Value | |
| Common Stocks (continued) | |
IT Services 3.3% | |
Alliance Data Systems Corp. (a) | | | 6,571 | | | $ | 1,727,713 | |
Broadridge Financial Solutions, Inc. | | | 44,380 | | | | 1,753,898 | |
Computer Sciences Corp. | | | 58,840 | | | | 3,287,979 | |
¨International Business Machines Corp. | | | 53,982 | | | | 10,125,404 | |
MasterCard, Inc. Class A | | | 452 | | | | 377,628 | |
Visa, Inc. Class A | | | 6,543 | | | | 1,456,995 | |
Western Union Co. (The) | | | 192,506 | | | | 3,320,728 | |
| | | | | | | | |
| | | | 22,050,345 | |
| | | | | | | | |
Machinery 1.8% | |
AGCO Corp. | | | 24,870 | | | | 1,472,055 | |
Caterpillar, Inc. | | | 45,270 | | | | 4,110,969 | |
Cummins, Inc. | | | 1,649 | | | | 232,460 | |
Dover Corp. | | | 21,348 | | | | 2,060,936 | |
Oshkosh Corp. | | | 57,954 | | | | 2,919,722 | |
Trinity Industries, Inc. | | | 26,017 | | | | 1,418,447 | |
| | | | | | | | |
| | | | 12,214,589 | |
| | | | | | | | |
Media 4.5% | |
Cablevision Systems Corp. Class A | | | 18,237 | | | | 326,989 | |
Comcast Corp. Class A | | | 160,293 | | | | 8,329,626 | |
DIRECTV (a) | | | 63,388 | | | | 4,379,477 | |
Gannett Co., Inc. | | | 97,169 | | | | 2,874,259 | |
Time Warner Cable, Inc. | | | 33,628 | | | | 4,556,594 | |
Twenty-First Century Fox, Inc. Class A | | | 78,302 | | | | 2,754,664 | |
Viacom, Inc. Class B | | | 51,678 | | | | 4,513,557 | |
Walt Disney Co. (The) | | | 25,153 | | | | 1,921,689 | |
| | | | | | | | |
| | | | 29,656,855 | |
| | | | | | | | |
Metals & Mining 0.4% | |
Steel Dynamics, Inc. | | | 38,717 | | | | 756,530 | |
United States Steel Corp. | | | 52,854 | | | | 1,559,193 | |
| | | | | | | | |
| | | | 2,315,723 | |
| | | | | | | | |
Multiline Retail 0.8% | |
Macy’s, Inc. | | | 34,696 | | | | 1,852,766 | |
Target Corp. | | | 49,521 | | | | 3,133,194 | |
| | | | | | | | |
| | | | 4,985,960 | |
| | | | | | | | |
Office Electronics 0.5% | |
Xerox Corp. | | | 291,554 | | | | 3,548,212 | |
| | | | | | | | |
|
Oil, Gas & Consumable Fuels 7.4% | |
Anadarko Petroleum Corp. | | | 49,826 | | | | 3,952,198 | |
Chesapeake Energy Corp. | | | 100,270 | | | | 2,721,328 | |
¨Chevron Corp. | | | 99,630 | | | | 12,444,783 | |
ConocoPhillips | | | 37,837 | | | | 2,673,184 | |
¨Exxon Mobil Corp. | | | 194,945 | | | | 19,728,434 | |
Marathon Petroleum Corp. | | | 46,605 | | | | 4,275,077 | |
Occidental Petroleum Corp. | | | 1,861 | | | | 176,981 | |
Phillips 66 | | | 31,137 | | | | 2,401,597 | |
SM Energy Co. | | | 5,299 | | | | 440,400 | |
| | | | | | | | |
| | | | 48,813,982 | |
| | | | | | | | |
| | | | | | | | |
| | |
Shares | | | Value | |
Pharmaceuticals 6.3% | |
AbbVie, Inc. | | | 63,069 | | | $ | 3,330,674 | |
Bristol-Myers Squibb Co. | | | 10,282 | | | | 546,488 | |
Eli Lilly & Co. | | | 95,871 | | | | 4,889,421 | |
Endo Health Solutions, Inc. (a) | | | 43,976 | | | | 2,966,621 | |
¨Johnson & Johnson | | | 142,960 | | | | 13,093,707 | |
Merck & Co., Inc. | | | 117,008 | | | | 5,856,250 | |
¨Pfizer, Inc. | | | 352,457 | | | | 10,795,758 | |
| | | | | | | | |
| | | | 41,478,919 | |
| | | | | | | | |
Professional Services 0.9% | |
ManpowerGroup, Inc. | | | 34,642 | | | | 2,974,362 | |
Towers Watson & Co. Class A | | | 23,312 | | | | 2,974,844 | |
| | | | | | | | |
| | | | 5,949,206 | |
| | | | | | | | |
Real Estate Investment Trusts 0.1% | |
Public Storage | | | 934 | | | | 140,586 | |
Simon Property Group, Inc. | | | 1,262 | | | | 192,026 | |
| | | | | | | | |
| | | | 332,612 | |
| | | | | | | | |
Real Estate Management & Development 0.2% | |
CBRE Group, Inc. Class A (a) | | | 60,605 | | | | 1,593,911 | |
| | | | | | | | |
|
Road & Rail 0.4% | |
Union Pacific Corp. | | | 14,088 | | | | 2,366,784 | |
| | | | | | | | |
|
Semiconductors & Semiconductor Equipment 2.6% | |
Broadcom Corp. Class A | | | 46,805 | | | | 1,387,768 | |
First Solar, Inc. (a) | | | 51,224 | | | | 2,798,879 | |
Intel Corp. | | | 312,752 | | | | 8,119,042 | |
NVIDIA Corp. | | | 206,181 | | | | 3,303,020 | |
Skyworks Solutions, Inc. (a) | | | 52,016 | | | | 1,485,577 | |
| | | | | | | | |
| | | | 17,094,286 | |
| | | | | | | | |
Software 3.6% | |
¨Microsoft Corp. | | | 378,958 | | | | 14,184,398 | |
Oracle Corp. | | | 219,345 | | | | 8,392,140 | |
Symantec Corp. | | | 48,814 | | | | 1,151,034 | |
| | | | | | | | |
| | | | 23,727,572 | |
| | | | | | | | |
Specialty Retail 3.9% | |
Advance Auto Parts, Inc. | | | 27,856 | | | | 3,083,102 | |
Best Buy Co., Inc. | | | 80,005 | | | | 3,190,600 | |
GameStop Corp. Class A | | | 60,385 | | | | 2,974,565 | |
Gap, Inc. (The) | | | 53,966 | | | | 2,108,991 | |
Home Depot, Inc. (The) | | | 81,171 | | | | 6,683,620 | |
Lowe’s Companies, Inc. | | | 99,695 | | | | 4,939,887 | |
Staples, Inc. | | | 197,533 | | | | 3,138,800 | |
| | | | | | | | |
| | | | 26,119,565 | |
| | | | | | | | |
Textiles, Apparel & Luxury Goods 1.0% | |
Coach, Inc. | | | 7,665 | | | | 430,236 | |
Fossil Group, Inc. (a) | | | 25,257 | | | | 3,029,325 | |
Hanesbrands, Inc. | | | 41,439 | | | | 2,911,919 | |
VF Corp. | | | 4,528 | | | | 282,275 | |
| | | | | | | | |
| | | | 6,653,755 | |
| | | | | | | | |
| | | | |
| M-70 | | MainStay VP Common Stock Portfolio | | The notes to the financial statements are an integral part of,
and should be read in conjunction with, the financial statements. |
| | | | | | | | |
| | |
Shares | | | Value | |
| Common Stocks (continued) | |
Tobacco 2.2% | |
Altria Group, Inc. | | | 148,352 | | | $ | 5,695,233 | |
Lorillard, Inc. | | | 27,817 | | | | 1,409,766 | |
Philip Morris International, Inc. | | | 89,099 | | | | 7,763,196 | |
| | | | | | | | |
| | | | | | | 14,868,195 | |
| | | | | | | | |
Trading Companies & Distributors 0.5% | | | | | | | | |
United Rentals, Inc. (a) | | | 40,086 | | | | 3,124,704 | |
| | | | | | | | |
Total Common Stocks
(Cost $519,384,773) | | | | | | | 654,680,420 | |
| | | | | | | | |
|
| Exchange-Traded Fund 1.0% (b) | |
S&P 500 Index—SPDR Trust Series 1 | | | 35,460 | | | | 6,548,398 | |
| | | | | | | | |
Total Exchange-Traded Fund
(Cost $6,527,124) | | | | | | | 6,548,398 | |
| | | | | | | | |
| | |
| | | | | | | | |
| | | Principal
Amount | | | | |
| | | | | | | | |
| Short-Term Investment 0.0%‡ | |
Repurchase Agreement 0.0%‡ | |
State Street Bank and Trust Co.
0.00%, dated 12/31/13
due 1/2/14
Proceeds at Maturity $147,987 (Collateralized by a Federal National Mortgage Association security with a rate of 2.17% and a maturity date of 11/7/22, with a Principal Amount of $170,000 and a Market Value of $154,754) | | $ | 147,987 | | | | 147,987 | |
| | | | | | | | |
Total Short-Term Investment
(Cost $147,987) | | | | | | | 147,987 | |
| | | | | | | | |
Total Investments
(Cost $526,059,884) (c) | | | 99.9 | % | | | 661,376,805 | |
Other Assets, Less Liabilities | | | 0.1 | | | | 421,954 | |
Net Assets | | | 100.0 | % | | $ | 661,798,759 | |
| ‡ | Less than one-tenth of a percent. |
| (a) | Non-income producing security. |
| (b) | Exchange-Traded Fund—An investment vehicle that represents a basket of securities that is traded on an exchange. |
| (c) | As of December 31, 2013, cost is $529,527,372 for federal income tax purposes and net unrealized appreciation is as follows: |
| | | | |
Gross unrealized appreciation | | $ | 133,879,180 | |
Gross unrealized depreciation | | | (2,029,747 | ) |
| | | | |
Net unrealized appreciation | | $ | 131,849,433 | |
| | | | |
The following abbreviation is used in the above portfolio:
SPDR—Standard & Poor’s Depositary Receipt
| | | | | | |
The notes to the financial statements are an integral part of,
and should be read in conjunction with, the financial statements. | | mainstayinvestments.com | | | M-71 | |
Portfolio of Investments December 31, 2013 (continued)
The following is a summary of the fair valuations according to the inputs used as of December 31, 2013, for valuing the Portfolio’s assets.
Asset Valuation Inputs
| | | | | | | | | | | | | | | | |
Description | | Quoted Prices
in Active Markets
for Identical Assets
(Level 1) | | | Significant Other
Observable Inputs (Level 2) | | | Significant
Unobservable
Inputs
(Level 3) | | | Total | |
| Investments in Securities (a) | | | | | | | | | | | | | | | | |
| Common Stocks | | $ | 654,680,420 | | | $ | — | | | $ | — | | | $ | 654,680,420 | |
| Exchange-Traded Fund | | | 6,548,398 | | | | — | | | | — | | | | 6,548,398 | |
| Short-Term Investment | | | | | | | | | | | | | | | | |
Repurchase Agreement | | | — | | | | 147,987 | | | | — | | | | 147,987 | |
| | | | | | | | | | | | | | | | |
| Total Investments in Securities | | $ | 661,228,818 | | | $ | 147,987 | | | $ | — | | | $ | 661,376,805 | |
| | | | | | | | | | | | | | | | |
| (a) | For a complete listing of investments and their industries, see the Portfolio of Investments. |
The Portfolio recognizes transfers between the levels as of the beginning of the period.
For the year ended December 31, 2013, the Portfolio did not have any transfers between Level 1 and Level 2 fair value measurements. (See Note 2)
As of December 31, 2013, the Portfolio did not hold any investments with significant unobservable inputs (Level 3). (See Note 2)
| | | | |
| M-72 | | MainStay VP Common Stock Portfolio | | The notes to the financial statements are an integral part of,
and should be read in conjunction with, the financial statements. |
Statement of Assets and Liabilities as of December 31, 2013
| | | | |
| Assets | |
Investment in securities, at value
(identified cost $526,059,884) | | $ | 661,376,805 | |
Receivables: | | | | |
Investment securities sold | | | 61,187,014 | |
Dividends and interest | | | 731,324 | |
Fund shares sold | | | 39,921 | |
Other assets | | | 4 | |
| | | | |
Total assets | | | 723,335,068 | |
| | | | |
| |
| Liabilities | | | | |
Payables: | | | | |
Investment securities purchased | | | 61,023,904 | |
Manager (See Note 3) | | | 300,407 | |
Fund shares redeemed | | | 117,935 | |
Shareholder communication | | | 43,010 | |
Professional fees | | | 25,497 | |
NYLIFE Distributors (See Note 3) | | | 18,706 | |
Custodian | | | 3,084 | |
Trustees | | | 756 | |
Accrued expenses | | | 3,010 | |
| | | | |
Total liabilities | | | 61,536,309 | |
| | | | |
Net assets | | $ | 661,798,759 | |
| | | | |
| |
| Net Assets Consist of | | | | |
Shares of beneficial interest outstanding (par value of $.001 per share) unlimited number of shares authorized | | $ | 26,949 | |
Additional paid-in capital | | | 558,787,309 | |
| | | | |
| | | 558,814,258 | |
Undistributed net investment income | | | 8,614,285 | |
Accumulated net realized gain (loss) on investments | | | (40,946,705 | ) |
Net unrealized appreciation (depreciation) on investments | | | 135,316,921 | |
| | | | |
Net assets | | $ | 661,798,759 | |
| | | | |
| | | | |
Initial Class | | | | |
Net assets applicable to outstanding shares | | $ | 570,986,083 | |
| | | | |
Shares of beneficial interest outstanding | | | 23,233,301 | |
| | | | |
Net asset value per share outstanding | | $ | 24.58 | |
| | | | |
Service Class | | | | |
Net assets applicable to outstanding shares | | $ | 90,812,676 | |
| | | | |
Shares of beneficial interest outstanding | | | 3,715,884 | |
| | | | |
Net asset value per share outstanding | | $ | 24.44 | |
| | | | |
| | | | | | |
The notes to the financial statements are an integral part of,
and should be read in conjunction with, the financial statements. | | mainstayinvestments.com | | | M-73 | |
Statement of Operations for the year ended December 31, 2013
| | | | |
| Investment Income (Loss) | |
Income | | | | |
Dividends (a) | | $ | 12,323,267 | |
Interest | | | 16 | |
| | | | |
Total income | | | 12,323,283 | |
| | | | |
Expenses | | | | |
Manager (See Note 3) | | | 3,264,053 | |
Distribution and service—Service Class (See Note 3) | | | 185,282 | |
Shareholder communication | | | 105,659 | |
Professional fees | | | 64,882 | |
Custodian | | | 19,104 | |
Trustees | | | 12,029 | |
Miscellaneous | | | 18,851 | |
| | | | |
Total expenses | | | 3,669,860 | |
| | | | |
Net investment income (loss) | | | 8,653,423 | |
| | | | |
|
| Realized and Unrealized Gain (Loss) on Investments | |
Net realized gain (loss) on investments | | | 109,150,579 | |
Net change in unrealized appreciation (depreciation) on investments | | | 63,107,241 | |
| | | | |
Net realized and unrealized gain (loss) on investments | | | 172,257,820 | |
| | | | |
Net increase (decrease) in net assets resulting from operations | | $ | 180,911,243 | |
| | | | |
| (a) | Dividends recorded net of foreign withholding taxes in the amount of $7,612. |
| | | | |
| M-74 | | MainStay VP Common Stock Portfolio | | The notes to the financial statements are an integral part of,
and should be read in conjunction with, the financial statements. |
Statements of Changes in Net Assets
for the years ended December 31, 2013 and December 31, 2012
| | | | | | | | |
| | | 2013 | | | 2012 | |
| Increase (Decrease) in Net Assets | |
Operations: | | | | | | | | |
Net investment income (loss) | | $ | 8,653,423 | | | $ | 9,314,801 | |
Net realized gain (loss) on investments | | | 109,150,579 | | | | 39,816,997 | |
Net change in unrealized appreciation (depreciation) on investments | | | 63,107,241 | | | | 31,716,272 | |
| | | | |
Net increase (decrease) in net assets resulting from operations | | | 180,911,243 | | | | 80,848,070 | |
| | | | |
Dividends to shareholders: | | | | | | | | |
From net investment income: | | | | | | | | |
Initial Class | | | (8,145,224 | ) | | | (7,607,005 | ) |
Service Class | | | (1,080,957 | ) | | | (821,937 | ) |
| | | | |
Total dividends to shareholders | | | (9,226,181 | ) | | | (8,428,942 | ) |
| | | | |
Capital share transactions: | | | | | | | | |
Net proceeds from sale of shares | | | 30,616,323 | | | | 21,385,373 | |
Net asset value of shares issued to shareholders in reinvestment of dividends | | | 9,226,181 | | | | 8,428,942 | |
Cost of shares redeemed | | | (81,381,919 | ) | | | (80,358,416 | ) |
| | | | |
Increase (decrease) in net assets derived from capital share transactions | | | (41,539,415 | ) | | | (50,544,101 | ) |
| | | | |
Net increase (decrease) in net assets | | | 130,145,647 | | | | 21,875,027 | |
| | |
| Net Assets | | | | | | | | |
Beginning of year | | | 531,653,112 | | | | 509,778,085 | |
| | | | |
End of year | | $ | 661,798,759 | | | $ | 531,653,112 | |
| | | | |
Undistributed net investment income at end of year | | $ | 8,614,285 | | | $ | 9,226,345 | |
| | | | |
| | | | | | |
The notes to the financial statements are an integral part of,
and should be read in conjunction with, the financial statements. | | mainstayinvestments.com | | | M-75 | |
Financial Highlights selected per share data and ratios
| | | | | | | | | | | | | | | | | | | | |
| | | Initial Class | |
| | | Year ended December 31, | |
| | | 2013 | | | 2012 | | | 2011 | | | 2010 | | | 2009 | |
Net asset value at beginning of year | | $ | 18.40 | | | $ | 16.02 | | | $ | 16.04 | | | $ | 14.48 | | | $ | 12.06 | |
| | | | | | | | | | | | | | | | | | | | |
Net investment income (loss) | | | 0.37 | | | | 0.32 | (a) | | | 0.25 | (a) | | | 0.20 | (a) | | | 0.21 | (a) |
Net realized and unrealized gain (loss) on investments | | | 6.16 | | | | 2.36 | | | | (0.02 | ) | | | 1.60 | | | | 2.48 | |
| | | | | | | | | | | | | | | | | | | | |
Total from investment operations | | | 6.53 | | | | 2.68 | | | | 0.23 | | | | 1.80 | | | | 2.69 | |
| | | | | | | | | | | | | | | | | | | | |
Less dividends: | | | | | | | | | | | | | | | | | | | | |
From net investment income | | | (0.35 | ) | | | (0.30 | ) | | | (0.25 | ) | | | (0.24 | ) | | | (0.27 | ) |
| | | | | | | | | | | | | | | | | | | | |
Net asset value at end of year | | $ | 24.58 | | | $ | 18.40 | | | $ | 16.02 | | | $ | 16.04 | | | $ | 14.48 | |
| | | | | | | | | | | | | | | | | | | | |
Total investment return | | | 35.66 | % | | | 16.72 | % | | | 1.57 | % | | | 12.60 | % | | | 22.40 | % |
Ratios (to average net assets)/Supplemental Data: | | | | | | | | | | | | | | | | | | | | |
Net investment income (loss) | | | 1.48 | % | | | 1.80 | % | | | 1.45 | % | | | 1.40 | % | | | 1.66 | % |
Net expenses | | | 0.58 | % | | | 0.59 | % | | | 0.59 | % | | | 0.61 | % | | | 0.60 | % |
Portfolio turnover rate | | | 108 | % | | | 132 | % | | | 102 | % | | | 107 | % | | | 100 | % |
Net assets at end of year (in 000’s) | | $ | 570,986 | | | $ | 472,324 | | | $ | 452,849 | | | $ | 574,582 | | | $ | 573,296 | |
| (a) | Per share data based on average shares outstanding during the year. |
| | | | | | | | | | | | | | | | | | | | |
| | | Service Class | |
| | | Year ended December 31, | |
| | | 2013 | | | 2012 | | | 2011 | | | 2010 | | | 2009 | |
Net asset value at beginning of year | | $ | 18.31 | | | $ | 15.94 | | | $ | 15.96 | | | $ | 14.41 | | | $ | 12.00 | |
| | | | | | | | | | | | | | | | | | | | |
Net investment income (loss) | | | 0.26 | | | | 0.27 | (a) | | | 0.21 | (a) | | | 0.17 | (a) | | | 0.17 | (a) |
Net realized and unrealized gain (loss) on investments | | | 6.17 | | | | 2.35 | | | | (0.02 | ) | | | 1.59 | | | | 2.47 | |
| | | | | | | | | | | | | | | | | | | | |
Total from investment operations | | | 6.43 | | | | 2.62 | | | | 0.19 | | | | 1.76 | | | | 2.64 | |
| | | | | | | | | | | | | | | | | | | | |
Less dividends: | | | | | | | | | | | | | | | | | | | | |
From net investment income | | | (0.30 | ) | | | (0.25 | ) | | | (0.21 | ) | | | (0.21 | ) | | | (0.23 | ) |
| | | | | | | | | | | | | | | | | | | | |
Net asset value at end of year | | $ | 24.44 | | | $ | 18.31 | | | $ | 15.94 | | | $ | 15.96 | | | $ | 14.41 | |
| | | | | | | | | | | | | | | | | | | | |
Total investment return | | | 35.32 | % | | | 16.43 | % | | | 1.31 | % | | | 12.32 | % | | | 22.08 | % |
Ratios (to average net assets)/Supplemental Data: | | | | | | | | | | | | | | | | | | | | |
Net investment income (loss) | | | 1.23 | % | | | 1.54 | % | | | 1.21 | % | | | 1.15 | % | | | 1.39 | % |
Net expenses | | | 0.83 | % | | | 0.84 | % | | | 0.84 | % | | | 0.86 | % | | | 0.85 | % |
Portfolio turnover rate | | | 108 | % | | | 132 | % | | | 102 | % | | | 107 | % | | | 100 | % |
Net assets at end of year (in 000’s) | | $ | 90,813 | | | $ | 59,329 | | | $ | 56,929 | | | $ | 65,829 | | | $ | 62,413 | |
| (a) | Per share data based on average shares outstanding during the year. |
| | | | |
| M-76 | | MainStay VP Common Stock Portfolio | | The notes to the financial statements are an integral part of,
and should be read in conjunction with, the financial statements. |
MainStay VP Conservative Allocation Portfolio
Investment and Performance Comparison1 (Unaudited)
Performance data quoted represents past performance. Past performance is no guarantee of future results. Because of market volatility, current performance may be lower or higher than the figures shown. Investment return and principal value will fluctuate, and as a result, when shares are redeemed, they may be worth more or less than their original cost. The performance table and graph do not reflect any deduction of sales charges, mortality and expense charges, contract charges, or administrative charges. Please refer to the Performance Summary appropriate for your policy. For performance information current to the most recent month-end, please call 800-598-2019 or visit www.newyorklife.com.
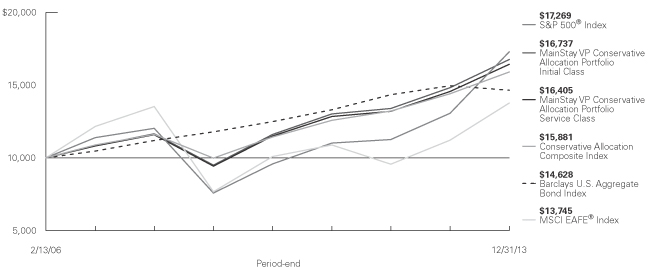
Average Annual Total Returns for the Period Ended December 31, 2013
| | | | | | | | | | | | | | | | |
| Class | | One Year | | | Five Years | | | Since Inception (2/13/06) | | | Gross Expense Ratio2 | |
Initial Class Shares | | | 13.03 | % | | | 12.02 | % | | | 6.75 | % | | | 0.88 | % |
Service Class Shares | | | 12.75 | | | | 11.73 | | | | 6.48 | | | | 1.13 | |
| | | | | | | | | | | | |
| Benchmark Performance | | One
Year | | | Five
Years | | | Since Inception
(2/13/06) | |
S&P 500® Index3 | | | 32.39 | % | | | 17.94 | % | | | 7.17 | % |
MSCI EAFE® Index3 | | | 22.78 | | | | 12.44 | | | | 4.12 | |
Barclays U.S. Aggregate Bond Index3 | | | –2.02 | | | | 4.44 | | | | 4.94 | |
Conservative Allocation Composite Index3 | | | 10.28 | | | | 9.76 | | | | 6.04 | |
Average Lipper Variable Products Mixed-Asset Target Allocation Conservative Portfolio4 | | | 8.02 | | | | 9.66 | | | | 5.24 | |
| 1. | Performance figures reflect certain fee waivers and/or expense limitations, without which total returns may have been different. For information on current fee waivers and/or expense limitations, please refer to the notes to the financial statements. |
| 2. | The gross expense ratios presented reflect the Portfolio’s “Total Annual Portfolio Operating Expenses” from the most recent Prospectus and may differ from other expense ratios disclosed in this report. |
| 3. | Please refer to pages M-2 and M-3 for additional explanations and disclosure regarding the Portfolios, their benchmark indices and other indices mentioned in the reports. |
| 4. | The Average Lipper Variable Products Mixed-Asset Target Allocation Conservative Portfolio is representative of portfolios that, by portfolio practice, maintain a mix of between 20%–40% equity securities, with the remainder invested in bonds, cash and cash equivalents. Lipper Inc. is an independent monitor of fund performance. Results are based on total returns with all dividend and capital gain distributions reinvested. |
| | | | |
| mainstayinvestments.com | | | M-77 | |
Cost in Dollars of a $1,000 Investment in MainStay VP Conservative Allocation Portfolio (Unaudited)
The example below is intended to describe the fees and expenses borne by shareholders during the six-month period from July 1, 2013, to December 31, 2013, and the impact of those costs on your investment.
Example
As a shareholder of the Portfolio, you incur two types of costs: (1) transaction costs, including exchange fees and sales charges (loads) on purchases (as applicable), and (2) ongoing costs, including management fees, distribution and/or service (12b-1) fees, and other Portfolio expenses (as applicable). This example is intended to help you understand your ongoing costs (in dollars) of investing in the Portfolio and to compare these costs with the ongoing costs of investing in other Portfolios. The example is based on an investment of $1,000 made at the beginning of the six-month period and held for the entire period from July 1, 2013, to December 31, 2013. Shares are only sold in connection with variable life and annuity contracts and the example does not reflect any contract level or transactional fees or expenses. If these costs had been included, your costs would have been higher.
This example illustrates your Portfolio’s ongoing costs in two ways:
Actual Expenses
The second and third data columns in the table below provide information about actual account values and actual expenses. You may use the information in these columns, together with the amount you invested, to estimate the expenses that you paid during the six months ended
December 31, 2013. Simply divide your account value by $1,000 (for example, an $8,600 account value divided by $1,000 = 8.6), then multiply the result by the number under the heading entitled ‘‘Expenses Paid During Period’’ to estimate the expenses you paid on your account during this period.
Hypothetical Example for Comparison Purposes
The fourth and fifth data columns in the table below provide information about hypothetical account values and hypothetical expenses based on the Portfolio’s actual expense ratio and an assumed rate of return of 5% per year before expenses, which is not the Portfolio’s actual return. The hypothetical account values and expenses may not be used to estimate the actual ending account balances or expenses you paid for the six-month period shown. You may use this information to compare the ongoing costs of investing in the Portfolio with the ongoing costs of investing in other Portfolios. To do so, compare this 5% hypothetical example with the 5% hypothetical examples that appear in the shareholder reports of the other Portfolios.
Please note that the expenses shown in the table are meant to highlight your ongoing costs only and do not reflect any transactional costs, such as exchange fees or sales charges (loads). Therefore, the fourth and fifth data columns of the table are useful in comparing ongoing costs only and will not help you determine the relative total costs of owning different funds. In addition, if these transactional costs were included, your costs would have been higher.
| | | | | | | | | | | | | | | | | | | | |
| | | | | | | | | | | | | | | | |
| Share Class | | Beginning
Account
Value
7/1/13 | | | Ending Account
Value (Based
on Actual
Returns and
Expenses)
12/31/13 | | | Expenses
Paid
During
Period1 | | | Ending Account
Value (Based
on Hypothetical
5% Annualized
Return and
Actual Expenses)
12/31/13 | | | Expenses
Paid
During
Period1 | |
| | | | | |
| Initial Class Shares | | $ | 1,000.00 | | | $ | 1,083.60 | | | $ | 0.16 | | | $ | 1,025.10 | | | $ | 0.15 | |
| | | | | |
| Service Class Shares | | $ | 1,000.00 | | | $ | 1,082.30 | | | $ | 1.47 | | | $ | 1,023.80 | | | $ | 1.43 | |
| 1. | Expenses are equal to the Portfolio’s annualized expense ratio of each class (0.03% for Initial Class and 0.28% for Service Class) multiplied by the average account value over the period, divided by 365 and multiplied by 184 (to reflect the six-month period). The table above represents the actual expenses incurred during the six-month period. In addition to the fees and expenses which the Portfolio bears directly, the Portfolio indirectly bears a pro rata share of the fees and expenses of the Underlying Portfolios/Funds in which it invests. Such indirect expenses are not included in the above-reported expense figures. |
| | |
| M-78 | | MainStay VP Conservative Allocation Portfolio |
Investment Objectives of Underlying Portfolios/Funds as of December 31, 2013 (Unaudited)
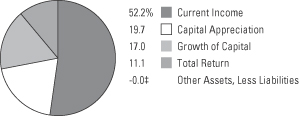
See Portfolio of Investments on page M-83 for specific holdings within these categories.
| ‡ | Less than one-tenth of a percent. |
| | | | |
| mainstayinvestments.com | | | M-79 | |
Portfolio Management Discussion and Analysis (Unaudited)
Answers to the questions reflect the views of portfolio managers Jae S. Yoon, CFA, Jonathan Swaney and Poul Kristensen, CFA, of New York Life Investments,1 the Portfolio’s Manager.
How did MainStay VP Conservative Allocation Portfolio perform relative to its benchmark and peers during the 12 months ended December 31, 2013?
For the 12 months ended December 31, 2013, MainStay VP Conservative Allocation Portfolio returned 13.03% for Initial Class shares and 12.75% for Service Class shares. Over the same period, both share classes underperformed the 32.39% return of the S&P 500® Index,2 which is the Portfolio’s broad-based securities-market index, and the 22.78% return of the MSCI EAFE® Index,2 which is a secondary benchmark of the Portfolio. Over the same period, both share classes outperformed the –2.02% return of the Barclays U.S. Aggregate Bond Index2 and the 10.28% return of the Conservative Allocation Composite Index,2 which are additional benchmarks of the Portfolio. Both share classes also outperformed the 8.02% return of the average Lipper2 Variable Products Mixed-Asset Target Allocation Conservative Portfolio for the 12 months ended December 31, 2013.
What factors affected the Portfolio’s relative performance during the reporting period?
The Portfolio is a “fund of funds,” meaning that it seeks to achieve its investment objective by investing primarily in other MainStay VP Portfolios and other funds managed by New York Life Investments (the “Underlying Portfolios/Funds”). The Underlying Portfolios/Funds may invest in fixed-income securities or in domestic or international stocks at various capitalization levels. The Portfolio’s primary benchmark, on the other hand, consists entirely of U.S. large-cap stocks. These differences—particularly the Portfolio’s substantial allocation to Underlying Portfolios/Funds that invest in fixed-income securities—accounted for many of the challenges the Portfolio experienced in terms of relative performance. Fixed-income securities generally underperformed equities during the reporting period.
The Portfolio’s performance was very strong compared to its peers and the Conservative Allocation Composite Index. Much of those excess returns were a product of our asset allocation decisions. We maintained a bias favoring stocks over bonds in varying measure over most of the reporting period. This bias contributed substantially to the Portfolio’s perform-
ance. Well-timed preferences for small companies over large companies and growth stocks over value stocks provided positive results. Some of the gains, however, were offset by overweight positions in emerging-market equities. Within the fixed-income portion of the Portfolio, exposure to speculative-grade credit instruments was rewarded, while defensive positioning against a potential rise in interest rates helped shield against losses in the high-grade part of the Portfolio.
Although asset-class positioning added substantially to returns, performance among the Underlying Portfolios/Funds in which the Portfolio invested was mixed. Among the larger holdings that enjoyed particularly strong performance were MainStay U.S. Equity Opportunities Fund, MainStay Epoch U.S. All Cap Fund and MainStay VP Unconstrained Bond Portfolio.
How did you allocate the Portfolio’s assets during the reporting period and why?
We considered a variety of information, including the portfolio-level characteristics of the Underlying Portfolios/Funds, such as capitalization, style biases, sector exposures, credit quality and duration.3 We also examined the attributes of the Underlying Portfolios’/Funds’ holdings, such as valuation metrics, earnings data and technical indicators. Finally, we evaluated the historical success of the managers responsible for the Underlying Portfolios/Funds. Generally speaking, we seek to invest in Underlying Portfolios/Funds that occupy attractively valued segments of the market, invest in fairly priced securities and are steered by individuals who have consistently demonstrated capable management in the past.
The Portfolio’s allocations to stocks and bonds varied over the course of the reporting period in response to the changing environment. Within equities, we placed a mild emphasis on two themes. First, our focus shifted from securities of large-cap companies toward securities of smaller companies, which we believed would perform especially well during an uptick in global economic growth. Second, we placed an increasing emphasis on growth over value because we anticipated that the quest for yield that has marked the past couple of years would morph into a quest for growth.
| 1 | “New York Life Investments” is a service mark used by New York Life Investment Management Holdings LLC and its subsidiary New York Life Investment Management LLC. |
| 2. | Please refer to pages M-2 and M-3 for additional explanations and disclosure regarding the Portfolios, their benchmark indices and service providers mentioned in the reports. |
| 3. | Duration is a measure of the price sensitivity of a fixed-income investment to changes in interest rates. Duration is expressed as a number of years and is considered a more accurate sensitivity gauge than average maturity. |
| | |
| M-80 | | MainStay VP Conservative Allocation Portfolio |
Both strategies were modestly profitable during the reporting period.
In the fixed-income portion of the Portfolio, we continued to maintain a shorter duration than the Barclays U.S. Aggregate Bond Index because we believe that interest rates will rise as the economy gains strength and the Federal Reserve gradually disengages from its direct security purchases, widely known as quantitative easing. We also maintained the Portfolio’s tilt that favored corporate bonds over government-backed securities—a preference that has been in place for the last couple of years. This positioning reflects our enduring view that corporations have improved the quality of their balance sheets significantly by reducing leverage, accumulating cash and controlling operating costs. We anticipate that corporate default rates may remain quite low for some time, which could make the higher yields available on corporate bonds attractive.
How did the Portfolio’s allocations change over the course of the reporting period?
The most significant change was a shift from focusing on large-cap stocks to owning more stocks of small- and mid-cap companies. This strategy was visible in a large increase in allocations to MainStay VP Eagle Small Cap Growth Portfolio, MainStay VP U.S. Small Cap Portfolio and MainStay Epoch U.S. All Cap Fund. These increases were primarily funded from sales of MainStay MAP Fund, MainStay VP Large Cap Growth Portfolio and MainStay U.S. Equity Opportunities Fund. Our shift from value to growth was seen in a substantial new position in MainStay VP Cornerstone Growth Portfolio. A new position in a long/short portfolio, MainStay VP Marketfield Portfolio, was also noteworthy, as was our slight shift back into international stocks with new positions in MainStay Epoch Global Choice Fund and MainStay Emerging Markets Opportunities Fund.
In the fixed-income portion of the Portfolio, we shifted assets from MainStay VP Floating Rate Portfolio and MainStay VP Unconstrained Bond Portfolio into a new position in MainStay Short Duration High Yield Fund. We also established a new position in MainStay High Yield Municipal Bond Fund. We believed that prices in the high-yield municipal market might have overreacted to news of the Detroit bankruptcy filing and financial troubles in Puerto Rico.
Which Underlying Equity Portfolios/Funds had the highest total returns during the reporting period, and which Underlying Equity Portfolios/Funds had the lowest total returns?
Among the Underlying Portfolios/Funds in which the Portfolio invested, MainStay VP Mid Cap Core Portfolio had the highest total return in 2013, followed by MainStay U.S. Equity Opportunities Fund and MainStay VP U.S. Small Cap Portfolio. The only Underlying Equity Portfolio/Fund that generated a negative total return was MainStay VP DFA / DuPont Capital Emerging Markets Equity Portfolio. The next-lowest total returns came from MainStay VP International Equity Portfolio and MainStay VP Marketfield Portfolio.
Which Underlying Equity Portfolios/Funds made the strongest positive contributions to the Portfolio’s overall performance, and which Underlying Equity Portfolios/Funds were the greatest detractors?
Contributions reflect the performance of the Underlying Portfolios/Funds and the size of the positions held. Large positive contributions can therefore come from significant positions in Underlying Portfolios/Funds that do reasonably well or from smaller positions in Underlying Portfolios/Funds that do exceptionally well. During the reporting period, the Portfolio had many of its largest holdings in Underlying Portfolios/Funds that performed very well. On that list were MainStay U.S. Equity Opportunities Fund, MainStay MAP Fund and MainStay VP Large Cap Growth Portfolio. The only Underlying Portfolio/Fund with negative performance was MainStay VP DFA / DuPont Capital Emerging Markets Equity Portfolio. Other than that, weaker contributions tended to come from holdings with smaller allocations. Among these were MainStay VP International Equity Portfolio and MainStay VP Marketfield Portfolio.
What factors and risks affected the Portfolio’s Underlying Fixed-Income Portfolio/Fund investments during the reporting period?
Yields on U.S. Treasury bonds rose significantly on signs of a strengthening economy and investors’ growing expectation that the Federal Reserve would gradually back away from stimulative monetary policy. At the same time, absolute yields on speculative-grade credit instruments fell, implying a significant compression of the spread 4 to U.S. Treasury securities. This occurred against a backdrop of improving
| 4. | The terms “spread” and “yield spread” may refer to the difference in yield between a security or type of security and comparable U.S. Treasury issues. The terms may also refer to the difference in yield between two specific securities or types of securities at a given time. |
| | | | |
| mainstayinvestments.com | | | M-81 | |
corporate financial health and significant net inflows to mutual funds and exchange-traded funds that invest in credit instruments.
During the reporting period, which fixed-income market segments were the strongest positive contributors to the Portfolio’s performance and which segments were particularly weak?
Domestic credit markets and short-duration securities were the strongest performers amid signs of economic improvement. For much the same reason, high-grade long-duration bonds provided poor performance.
Which Underlying Fixed-Income Portfolios/Funds made the strongest positive contributions to the Portfolio’s performance, and which Underlying Fixed-Income Portfolios/Funds were the greatest detractors?
In the fixed-income portion of the Portfolio, the largest positive contribution came from MainStay VP Floating Rate Portfolio, which benefited from a short
duration and a speculative profile. This was followed by smaller positions in MainStay VP High Yield Corporate Bond Portfolio and MainStay VP Unconstrained Bond Portfolio. Detracting from performance were positions in MainStay VP Bond Portfolio, MainStay Intermediate Term Bond Fund and MainStay High Yield Municipal Bond Fund.
The opinions expressed are those of the portfolio managers as of the date of this report and are subject to change. There is no guarantee that any forecasts made will come to pass. This material does not constitute investment advice and is not intended as an endorsement of any specific investment.
Not all MainStay VP Portfolios and/or share classes are available under all policies.
| | |
| M-82 | | MainStay VP Conservative Allocation Portfolio |
Portfolio of Investments December 31, 2013
| | | | | | | | |
| | | Shares | | | Value | |
| Affiliated Investment Companies 100.0%† | |
Equity Funds 40.4% | |
MainStay Emerging Markets Opportunities Fund Class I (a) | | | 455,304 | | | $ | 4,407,346 | |
MainStay Epoch Global Choice Fund Class I (a) | | | 1,271,088 | | | | 26,197,126 | |
MainStay Epoch U.S. All Cap Fund Class I (a) | | | 1,273,224 | | | | 35,803,051 | |
MainStay ICAP Equity Fund Class I | | | 372,061 | | | | 19,295,079 | |
MainStay ICAP International Fund Class I | | | 286,781 | | | | 10,312,651 | |
MainStay International Opportunities Fund Class I | | | 894,920 | | | | 8,081,125 | |
MainStay MAP Fund Class I | | | 832,853 | | | | 37,328,487 | |
MainStay U.S. Equity Opportunities Fund Class I (a) | | | 3,458,935 | | | | 29,366,356 | |
MainStay VP Cornerstone Growth Portfolio Initial Class | | | 425,622 | | | | 14,552,801 | |
MainStay VP DFA / DuPont Capital Emerging Markets Equity Portfolio Initial Class | | | 465,607 | | | | 4,422,377 | |
MainStay VP Eagle Small Cap Growth Portfolio Initial Class (a) | | | 1,865,105 | | | | 24,377,671 | |
MainStay VP International Equity Portfolio Initial Class | | | 231,026 | | | | 3,190,949 | |
MainStay VP Large Cap Growth Portfolio Initial Class (a) | | | 1,731,347 | | | | 39,532,571 | |
MainStay VP Marketfield Portfolio Initial Class (a)(b) | | | 1,522,597 | | | | 16,980,558 | |
MainStay VP Mid Cap Core Portfolio Initial Class | | | 1,024,363 | | | | 16,574,680 | |
MainStay VP S&P 500 Index Portfolio Initial Class | | | 38,282 | | | | 1,438,818 | |
MainStay VP T. Rowe Price Equity Income Portfolio Initial Class (a) | | | 2,220,965 | | | | 30,589,602 | |
MainStay VP U.S. Small Cap Portfolio Initial Class (a) | | | 1,635,721 | | | | 22,539,692 | |
| | | | | | | | |
Total Equity Funds
(Cost $299,411,265) | | | | 344,990,940 | |
| | | | | | | | |
| | | | | | | | |
| | | Shares | | | Value | |
Fixed Income Funds 59.6% | | | | | | | | |
MainStay High Yield Municipal Bond Fund Class I | | | 788,458 | | | $ | 8,460,153 | |
MainStay High Yield Opportunities Fund Class I | | | 143,943 | | | | 1,767,620 | |
MainStay Intermediate Term Bond Fund Class I | | | 3,207,969 | | | | 34,068,625 | |
MainStay Short Duration High Yield Fund Class I (a) | | | 2,682,477 | | | | 27,066,192 | |
MainStay VP Bond Portfolio Initial Class (a) | | | 19,120,957 | | | | 267,749,443 | |
MainStay VP Cash Management Portfolio Initial Class | | | 37,943,877 | | | | 37,946,799 | |
MainStay VP Floating Rate Portfolio Initial Class (a) | | | 8,107,136 | | | | 75,649,670 | |
MainStay VP High Yield Corporate Bond Portfolio Initial Class | | | 2,693,843 | | | | 27,638,755 | |
MainStay VP Unconstrained Bond Portfolio Initial Class (a) | | | 2,785,574 | | | | 28,740,412 | |
| | | | | | | | |
Total Fixed Income Funds
(Cost $521,881,195) | | | | | | | 509,087,669 | |
| | | | | | | | |
Total Investments
(Cost $821,292,460) (c) | | | 100.0 | % | | | 854,078,609 | |
Other Assets, Less Liabilities | | | (0.0 | )‡ | | | (118,434 | ) |
Net Assets | | | 100.0 | % | | $ | 853,960,175 | |
| ‡ | Less than one-tenth of a percent. |
| † | Percentages indicated are based on Portfolio net assets. |
| (a) | The Portfolio’s ownership exceeds 5% of the outstanding shares of the Underlying Portfolio’s/Fund’s share class. (See Note 3) |
| (b) | Non-income producing Underlying Portfolio/Fund. |
| (c) | As of December 31, 2013, cost is $821,955,212 for federal income tax purposes and net unrealized appreciation is as follows: |
| | | | |
Gross unrealized appreciation | | $ | 47,318,983 | |
Gross unrealized depreciation | | | (15,195,586 | ) |
| | | | |
Net unrealized appreciation | | $ | 32,123,397 | |
| | | | |
The following is a summary of the fair valuations according to the inputs used as of December 31, 2013, for valuing the Portfolio’s assets.
Asset Valuation Inputs
| | | | | | | | | | | | | | | | |
Description | | Quoted Prices
in Active Markets
for Identical Assets
(Level 1) | | | Significant Other
Observable Inputs
(Level 2) | | | Significant
Unobservable
Inputs
(Level 3) | | | Total | |
| Investments (a) | | | | | | | | | | | | | | | | |
| Affiliated Investment Companies | | | | | | | | | | | | | | | | |
Equity Funds | | $ | 344,990,940 | | | $ | — | | | $ | — | | | $ | 344,990,940 | |
Fixed Income Funds | | | 509,087,669 | | | | — | | | | — | | | | 509,087,669 | |
| | | | | | | | | | | | | | | | |
| Total Investments | | $ | 854,078,609 | | | $ | — | | | $ | — | | | $ | 854,078,609 | |
| | | | | | | | | | | | | | | | |
| (a) | For a complete listing of investments, see the Portfolio of Investments. |
The Portfolio recognizes transfers between the levels as of the beginning of the period.
For the year ended December 31, 2013, the Portfolio did not have any transfers between Level 1 and Level 2 fair value measurements. (See Note 2)
As of December 31, 2013, the Portfolio did not hold any investments with significant unobservable inputs (Level 3). (See Note 2)
| | | | | | |
The notes to the financial statements are an integral part of,
and should be read in conjunction with, the financial statements. | | mainstayinvestments.com | | | M-83 | |
Statement of Assets and Liabilities as of December 31, 2013
| | | | |
| Assets | |
Investment in affiliated investment companies, at value
(identified cost $821,292,460) | | $ | 854,078,609 | |
Cash | | | 964,316 | |
Receivables: | | | | |
Investment securities sold | | | 1,894,395 | |
Fund shares sold | | | 495,132 | |
| | | | |
Total assets | | | 857,432,452 | |
| | | | |
| |
| Liabilities | | | | |
Payables: | | | | |
Investment securities purchased | | | 2,858,711 | |
Fund shares redeemed | | | 366,450 | |
NYLIFE Distributors (See Note 3) | | | 176,415 | |
Shareholder communication | | | 42,651 | |
Professional fees | | | 23,130 | |
Trustees | | | 1,047 | |
Custodian | | | 679 | |
Accrued expenses | | | 3,194 | |
| | | | |
Total liabilities | | | 3,472,277 | |
| | | | |
Net assets | | $ | 853,960,175 | |
| | | | |
| |
| Net Assets Consist of | | | | |
Shares of beneficial interest outstanding (par value of $.001 per share) unlimited number of shares authorized | | $ | 69,023 | |
Additional paid-in capital | | | 766,992,381 | |
| | | | |
| | | 767,061,404 | |
Undistributed net investment income | | | 20,797,945 | |
Accumulated net realized gain (loss) on investments | | | 33,314,677 | |
Net unrealized appreciation (depreciation) on investments | | | 32,786,149 | |
| | | | |
Net assets | | $ | 853,960,175 | |
| | | | |
| | | | |
Initial Class | | | | |
Net assets applicable to outstanding shares | | $ | 14,970,795 | |
| | | | |
Shares of beneficial interest outstanding | | | 1,200,185 | |
| | | | |
Net asset value per share outstanding | | $ | 12.47 | |
| | | | |
Service Class | | | | |
Net assets applicable to outstanding shares | | $ | 838,989,380 | |
| | | | |
Shares of beneficial interest outstanding | | | 67,823,142 | |
| | | | |
Net asset value per share outstanding | | $ | 12.37 | |
| | | | |
| | | | |
| M-84 | | MainStay VP Conservative Allocation Portfolio | | The notes to the financial statements are an integral part of,
and should be read in conjunction with, the financial statements. |
Statement of Operations for the year ended December 31, 2013
| | | | |
| Investment Income (Loss) | |
Income | |
Dividend distributions from affiliated investment companies | | $ | 15,684,957 | |
| | | | |
Expenses | | | | |
Distribution and service—Service Class (See Note 3) | | | 1,915,461 | |
Shareholder communication | | | 122,746 | |
Professional fees | | | 57,474 | |
Trustees | | | 15,843 | |
Custodian | | | 8,520 | |
Miscellaneous | | | 20,680 | |
| | | | |
Total expenses | | | 2,140,724 | |
| | | | |
Net investment income (loss) | | | 13,544,233 | |
| | | | |
|
| Realized and Unrealized Gain (Loss) on Investments | |
Net realized gain (loss) on: | | | | |
Affiliated investment company transactions | | | 49,427,805 | |
Realized capital gain distributions from affiliated investment companies | | | 17,039,875 | |
| | | | |
Net realized gain (loss) on investments from affiliated investment companies | | | 66,467,680 | |
| | | | |
Net change in unrealized appreciation (depreciation) on investments | | | 13,256,070 | |
| | | | |
Net realized and unrealized gain (loss) on investments | | | 79,723,750 | |
| | | | |
Net increase (decrease) in net assets resulting from operations | | $ | 93,267,983 | |
| | | | |
| | | | | | |
The notes to the financial statements are an integral part of,
and should be read in conjunction with, the financial statements. | | mainstayinvestments.com | | | M-85 | |
Statements of Changes in Net Assets
for the years ended December 31, 2013 and December 31, 2012
| | | | | | | | |
| | | 2013 | | | 2012 | |
| Increase (Decrease) in Net Assets | |
Operations: | | | | | | | | |
Net investment income (loss) | | $ | 13,544,233 | | | $ | 12,809,218 | |
Net realized gain (loss) on investments from affiliated investment companies transactions | | | 66,467,680 | | | | 27,916,526 | |
Net change in unrealized appreciation (depreciation) on investments | | | 13,256,070 | | | | 18,395,516 | |
| | | | |
Net increase (decrease) in net assets resulting from operations | | | 93,267,983 | | | | 59,121,260 | |
| | | | |
Dividends and distributions to shareholders: | | | | | | | | |
From net investment income: | | | | | | | | |
Initial Class | | | (357,740 | ) | | | (248,049 | ) |
Service Class | | | (18,376,257 | ) | | | (12,331,529 | ) |
| | | | |
| | | (18,733,997 | ) | | | (12,579,578 | ) |
| | | | |
From net realized gain on investments: | | | | | | | | |
Initial Class | | | (372,497 | ) | | | (656,622 | ) |
Service Class | | | (20,710,900 | ) | | | (35,735,731 | ) |
| | | | |
| | | (21,083,397 | ) | | | (36,392,353 | ) |
| | | | |
Total dividends and distributions to shareholders | | | (39,817,394 | ) | | | (48,971,931 | ) |
| | | | |
Capital share transactions: | | | | | | | | |
Net proceeds from sale of shares | | | 158,625,237 | | | | 172,763,242 | |
Net asset value of shares issued to shareholders in reinvestment of dividends and distributions | | | 39,817,394 | | | | 48,971,931 | |
Cost of shares redeemed | | | (90,918,239 | ) | | | (67,159,137 | ) |
| | | | |
Increase (decrease) in net assets derived from capital share transactions | | | 107,524,392 | | | | 154,576,036 | |
| | | | |
Net increase (decrease) in net assets | | | 160,974,981 | | | | 164,725,365 | |
| | |
| Net Assets | | | | | | | | |
Beginning of year | | | 692,985,194 | | | | 528,259,829 | |
| | | | |
End of year | | $ | 853,960,175 | | | $ | 692,985,194 | |
| | | | |
Undistributed net investment income at end of year | | $ | 20,797,945 | | | $ | 18,733,977 | |
| | | | |
| | | | |
| M-86 | | MainStay VP Conservative Allocation Portfolio | | The notes to the financial statements are an integral part of,
and should be read in conjunction with, the financial statements. |
Financial Highlights selected per share data and ratios
| | | | | | | | | | | | | | | | | | | | |
| | | Initial Class | |
| | | Year ended December 31, | |
| | | 2013 | | | 2012 | | | 2011 | | | 2010 | | | 2009 | |
Net asset value at beginning of year | | $ | 11.62 | | | $ | 11.35 | | | $ | 11.34 | | | $ | 10.37 | | | $ | 8.89 | |
| | | | | | | | | | | | | | | | | | | | |
Net investment income (loss) (a) | | | 0.24 | | | | 0.28 | | | | 0.28 | | | | 0.29 | | | | 0.34 | |
Net realized and unrealized gain (loss) on investments | | | 1.24 | | | | 0.93 | | | | 0.03 | | | | 0.95 | | | | 1.63 | |
| | | | | | | | | | | | | | | | | | | | |
Total from investment operations | | | 1.48 | | | | 1.21 | | | | 0.31 | | | | 1.24 | | | | 1.97 | |
| | | | | | | | | | | | | | | | | | | | |
Less dividends and distributions: | | | | | | | | | | | | | | | | | | | | |
From net investment income | | | (0.31 | ) | | | (0.26 | ) | | | (0.25 | ) | | | (0.27 | ) | | | (0.31 | ) |
From net realized gain on investments | | | (0.32 | ) | | | (0.68 | ) | | | (0.05 | ) | | | — | | | | (0.18 | ) |
| | | | | | | | | | | | | | | | | | | | |
Total dividends and distributions | | | (0.63 | ) | | | (0.94 | ) | | | (0.30 | ) | | | (0.27 | ) | | | (0.49 | ) |
| | | | | | | | | | | | | | | | | | | | |
Net asset value at end of year | | $ | 12.47 | | | $ | 11.62 | | | $ | 11.35 | | | $ | 11.34 | | | $ | 10.37 | |
| | | | | | | | | | | | | | | | | | | | |
Total investment return | | | 13.03 | % | | | 10.69 | % | | | 2.90 | % | | | 12.03 | % | | | 22.28 | % |
Ratios (to average net assets)/Supplemental Data: | | | | | | | | | | | | | | | | | | | | |
Net investment income (loss) | | | 1.96 | % | | | 2.34 | % | | | 2.44 | % | | | 2.66 | % | | | 3.54 | % |
Net expenses (b) | | | 0.03 | % | | | 0.03 | % | | | 0.04 | % | | | 0.05 | % | | | 0.05 | % |
Portfolio turnover rate | | | 56 | % | | | 53 | % | | | 62 | % | | | 26 | % | | | 38 | % |
Net assets at end of year (in 000’s) | | $ | 14,971 | | | $ | 12,866 | | | $ | 9,472 | | | $ | 8,123 | | | $ | 6,827 | |
| (a) | Per share data based on average shares outstanding during the year. |
| (b) | In addition to the fees and expenses which the Portfolio bears directly, the Portfolio indirectly bears a pro-rata share of the fees and expenses of the Underlying Portfolios/Funds in which it invests. Such indirect expenses are not included in the above expense ratios. |
| | | | | | | | | | | | | | | | | | | | |
| | | Service Class | |
| | | Year ended December 31, | |
| | | 2013 | | | 2012 | | | 2011 | | | 2010 | | | 2009 | |
Net asset value at beginning of year | | $ | 11.54 | | | $ | 11.28 | | | $ | 11.28 | | | $ | 10.33 | | | $ | 8.86 | |
| | | | | | | | | | | | | | | | | | | | |
Net investment income (loss) (a) | | | 0.21 | | | | 0.24 | | | | 0.25 | | | | 0.27 | | | | 0.33 | |
Net realized and unrealized gain (loss) on investments | | | 1.23 | | | | 0.93 | | | | 0.03 | | | | 0.94 | | | | 1.61 | |
| | | | | | | | | | | | | | | | | | | | |
Total from investment operations | | | 1.44 | | | | 1.17 | | | | 0.28 | | | | 1.21 | | | | 1.94 | |
| | | | | | | | | | | | | | | | | | | | |
Less dividends and distributions: | | | | | | | | | | | | | | | | | | | | |
From net investment income | | | (0.29 | ) | | | (0.23 | ) | | | (0.23 | ) | | | (0.26 | ) | | | (0.29 | ) |
From net realized gain on investments | | | (0.32 | ) | | | (0.68 | ) | | | (0.05 | ) | | | — | | | | (0.18 | ) |
| | | | | | | | | | | | | | | | | | | | |
Total dividends and distributions | | | (0.61 | ) | | | (0.91 | ) | | | (0.28 | ) | | | (0.26 | ) | | | (0.47 | ) |
| | | | | | | | | | | | | | | | | | | | |
Net asset value at end of year | | $ | 12.37 | | | $ | 11.54 | | | $ | 11.28 | | | $ | 11.28 | | | $ | 10.33 | |
| | | | | | | | | | | | | | | | | | | | |
Total investment return | | | 12.75 | % | | | 10.42 | % | | | 2.65 | % | | | 11.75 | % | | | 21.93 | % |
Ratios (to average net assets)/Supplemental Data: | | | | | | | | | | | | | | | | | | | | |
Net investment income (loss) | | | 1.73 | % | | | 2.07 | % | | | 2.23 | % | | | 2.47 | % | | | 3.39 | % |
Net expenses (b) | | | 0.28 | % | | | 0.28 | % | | | 0.29 | % | | | 0.30 | % | | | 0.30 | % |
Portfolio turnover rate | | | 56 | % | | | 53 | % | | | 62 | % | | | 26 | % | | | 38 | % |
Net assets at end of year (in 000’s) | | $ | 838,989 | | | $ | 680,119 | | | $ | 518,788 | | | $ | 408,238 | | | $ | 291,307 | |
| (a) | Per share data based on average shares outstanding during the year. |
| (b) | In addition to the fees and expenses which the Portfolio bears directly, the Portfolio indirectly bears a pro-rata share of the fees and expenses of the Underlying Portfolios/Funds in which it invests. Such indirect expenses are not included in the above expense ratios. |
| | | | | | |
The notes to the financial statements are an integral part of,
and should be read in conjunction with, the financial statements. | | mainstayinvestments.com | | | M-87 | |
MainStay VP Convertible Portfolio
Investment and Performance Comparison (Unaudited)
Performance data quoted represents past performance. Past performance is no guarantee of future results. Because of market volatility, current performance may be lower or higher than the figures shown. Investment return and principal value will fluctuate, and as a result, when shares are redeemed, they may be worth more or less than their original cost. The performance table and graph do not reflect any deduction of sales charges, mortality and expense charges, contract charges or administrative charges. Please refer to the Performance Summary appropriate for your policy. For performance information current to the most recent month-end, please call 800-598-2019 or visit www.newyorklife.com.

Average Annual Total Returns for the Year Ended December 31, 2013
| | | | | | | | | | | | | | | | |
| Class | | One Year | | | Five Years | | | Ten Years1 | | | Gross Expense Ratio2 | |
| Initial Class Shares | | | 25.35 | % | | | 17.54 | % | | | 7.76 | % | | | 0.64 | % |
| Service Class Shares | | | 25.04 | | | | 17.24 | | | | 7.49 | | | | 0.89 | |
| | | | | | | | | | | | |
| Benchmark Performance | | One
Year | | | Five
Years | | | Ten
Years | |
Bank of America Merrill Lynch All U.S. Convertibles Index3 | | | 24.92 | % | | | 18.85 | % | | | 7.13 | % |
Average Lipper Convertible Securities Fund4 | | | 21.60 | | | | 15.71 | | | | 6.34 | |
| 1. | Performance figures shown for the ten-year period ended December 31, 2013 reflect nonrecurring reimbursements from affiliates for printing and mailing costs. If these nonrecurring reimbursements had not been made, the total returns would have been 7.75% for Initial Class shares and 7.48% for Service Class shares for the ten-year period. |
| 2. | The gross expense ratios presented reflect the Portfolio’s “Total Annual Portfolio Operating Expenses” from the most recent Prospectus and may differ from other expense ratios disclosed in this report. |
| 3. | Please refer to pages M-2 and M-3 for additional explanations and disclosure regarding the Portfolios, their benchmark indices and other indices mentioned in the reports. |
| 4. | The Average Lipper Convertible Securities Fund is representative of funds that invest primarily in convertible bonds and/or convertible preferred stock. Lipper Inc. is an independent monitor of fund performance. Results are based on total returns with all dividend and capital gain distributions reinvested. |
| | |
| M-88 | | MainStay VP Convertible Portfolio |
Cost in Dollars of a $1,000 Investment in MainStay VP Convertible Portfolio (Unaudited)
The example below is intended to describe the fees and expenses borne by shareholders during the six-month period from July 1, 2013, to December 31, 2013, and the impact of those costs on your investment.
Example
As a shareholder of the Portfolio, you incur two types of costs: (1) transaction costs, including exchange fees and sales charges (loads) on purchases (as applicable), and (2) ongoing costs, including management fees, distribution and/or service (12b-1) fees, and other Portfolio expenses (as applicable). This example is intended to help you understand your ongoing costs (in dollars) of investing in the Portfolio and to compare these costs with the ongoing costs of investing in other Portfolios. The example is based on an investment of $1,000 made at the beginning of the six-month period and held for the entire period from July 1, 2013, to December 31, 2013. Shares are only sold in connection with variable life and annuity contracts and the example does not reflect any contract level or transactional fees or expenses. If these costs had been included, your costs would have been higher.
This example illustrates your Portfolio’s ongoing costs in two ways:
Actual Expenses
The second and third data columns in the table below provide information about actual account values and actual expenses. You may use the information in these columns, together with the amount you invested, to estimate the expenses that you paid during the six months ended
December 31, 2013. Simply divide your account value by $1,000 (for example, an $8,600 account value divided by $1,000 = 8.6), then multiply the result by the number under the heading entitled “Expenses Paid During Period” to estimate the expenses you paid on your account during this period.
Hypothetical Example for Comparison Purposes
The fourth and fifth data columns in the table below provide information about hypothetical account values and hypothetical expenses based on the Portfolio’s actual expense ratio and an assumed rate of return of 5% per year before expenses, which is not the Portfolio’s actual return. The hypothetical account values and expenses may not be used to estimate the actual ending account balances or expenses you paid for the six-month period shown. You may use this information to compare the ongoing costs of investing in the Portfolio with the ongoing costs of investing in other Portfolios. To do so, compare this 5% hypothetical example with the 5% hypothetical examples that appear in the shareholder reports of the other Portfolios.
Please note that the expenses shown in the table are meant to highlight your ongoing costs only and do not reflect any transactional costs, such as exchange fees or sales charges (loads). Therefore, the fourth and fifth data columns of the table are useful in comparing ongoing costs only and will not help you determine the relative total costs of owning different funds. In addition, if these transactional costs were included, your costs would have been higher.
| | | | | | | | | | | | | | | | | | | | |
| | | | | | | | | | | | | | | | |
| Share Class | | Beginning
Account
Value
7/1/13 | | | Ending Account
Value (Based
on Actual
Returns and
Expenses)
12/31/13 | | | Expenses
Paid
During
Period1 | | | Ending Account
Value (Based
on Hypothetical
5% Annualized
Return and
Actual Expenses)
12/31/13 | | | Expenses
Paid
During
Period1 | |
| | | | | |
| Initial Class Shares | | $ | 1,000.00 | | | $ | 1,140.60 | | | $ | 3.45 | | | $ | 1,022.00 | | | $ | 3.26 | |
| | | | | |
| Service Class Shares | | $ | 1,000.00 | | | $ | 1,139.20 | | | $ | 4.80 | | | $ | 1,020.70 | | | $ | 4.53 | |
| 1. | Expenses are equal to the Portfolio’s annualized expense ratio of each class (0.64% for Initial Class and 0.89% for Service Class) multiplied by the average account value over the period, divided by 365 and multiplied by 184 (to reflect the six-month period). The table above represents the actual expenses incurred during the six-month period. |
| | | | |
| mainstayinvestments.com | | | M-89 | |
Portfolio Composition as of December 31, 2013 (Unaudited)
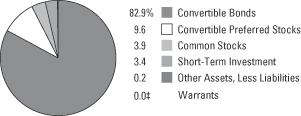
See Portfolio of Investments beginning on page M-93 for specific holdings within these categories.
| ‡ | Less than one-tenth of a percent. |
Top Ten Holdings or Issuers Held as of December 31, 2013 (excluding short-term investment) (Unaudited)
| 1. | JPMorgan Chase & Co. (Convertible into Schlumberger, Ltd.), (zero coupon), due 5/5/15 |
| 2. | Gilead Sciences, Inc., 1.00%, due 5/1/14 |
| 3. | United Technologies Corp., 7.50% |
| 4. | Danaher Corp., (zero coupon), due 1/22/21 |
| 5. | Jarden Corp., 1.875%, due 9/15/18 |
| 6. | Novellus Systems, Inc., 2.625%, due 5/15/41 |
| 7. | Salix Pharmaceuticals, Ltd., 1.50%, due 3/15/19 |
| 9. | Teva Pharmaceutical Finance Co. LLC, 0.25%, due 2/1/26 |
| 10. | Stanley Black & Decker, Inc., 4.75%–6.25% |
| | |
| M-90 | | MainStay VP Convertible Portfolio |
Portfolio Management Discussion and Analysis (Unaudited)
Answers to the questions reflect the views of portfolio manager Edward Silverstein, CFA, of MacKay Shields LLC, the Portfolio’s Subadvisor.
How did MainStay VP Convertible Portfolio perform relative to its benchmark and peers during the 12 months ended December 31, 2013?
For the 12 months ended December 31, 2013, MainStay VP Convertible Portfolio returned 25.35% for Initial Class shares and 25.04% for Service Class shares. Over the same period, both share classes outperformed the 24.92% return of the Bank of America Merrill Lynch All U.S. Convertibles Index,1 which is the Portfolio’s broad-based securities-market index. Both share classes outperformed the 21.60% return of the average Lipper1 Convertible Securities Fund for the 12 months ended December 31, 2013.
What factors affected the Portfolio’s relative performance during the reporting period?
Convertible bond performance is largely determined by the performance of the underlying equity securities. Our decision-making process is guided by our analysis of the underlying equity and whether the convertible security will participate in the equity’s upside and provide some measure of protection on the downside. Our equity analysis looks at the health and prospects of the underlying business, the strength of management, financial stability and valuation.
The Portfolio’s relative performance benefited from a higher equity sensitivity, or delta, than the average convertible bond in the Bank of America Merrill Lynch All U.S. Convertibles Index. The Portfolio tends to avoid securities that have low sensitivity to equity prices, known as “busted” convertible bonds. Busted convertibles tend to underperform the market when equities are rising. They also tend to underperform the market when interest rates are rising and bond prices are falling.
An underweight position in the biotechnology sector detracted from the Portfolio’s performance relative to the Bank of America Merrill Lynch All U.S. Convertibles Index, as the sector was a strong performer in the benchmark.
During the reporting period, which market segments made the strongest positive contributors to the Portfolio’s performance and which market segments were particularly weak?
The biotechnology segment was the strongest contributor to the Portfolio’s performance, followed by industrials and semiconductors. (Contributions take
weightings and total returns into account.) The weakest segments were natural resources, energy exploration & production, and home building.
During the reporting period, which individual Portfolio holdings were the strongest absolute performers and which Portfolio holdings were particularly weak?
The prices of biotechnology securities rose, as investors viewed the segment as having rich growth prospects within the otherwise mature health care sector. Particularly strong biotechnology securities in the Portfolio were the convertible bonds of Gilead Sciences and Salix Pharmaceuticals. Gilead’s stock price rose sharply during the reporting period, as investors anticipated approval for a novel treatment for hepatitis C. Once approved, this therapy is expected to achieve annual sales of several billion dollars. Salix Pharmaceuticals advanced because the company’s product for intestinal disorders seemed likely to receive approval for additional indications.
Shares of many industrial companies rose during the reporting period because any economic recovery enhances their prospects. The convertible bonds of United Technologies and Danaher were strong performers. The convertible preferred shares of aerospace & defense company United Technologies also performed well. United Technologies benefited from increased construction activity, and its aviation businesses are poised to improve. Manufacturing company Danaher benefited from growth in its industrial and life-sciences end markets.
Another strong industry was semiconductors, which benefited from growth in demand and rationalization of supply—a combination that led to improved pricing. Portfolio holdings that benefited from this trend included the convertible bonds of Micron Technology, Microchip Technology and Novellus Systems.
In the natural resources segment, the convertible bonds of Peabody Energy and the convertible preferred shares of Cliffs Natural Resources were particularly weak. Coal and metals prices sank largely as a result of slowing purchases from China. In the energy exploration & production segment, the convertible bonds of Cobalt International Energy and the convertible preferred shares of Energy XXI Bermuda were particularly weak. Cobalt International Energy fell after the company announced disappointing results from a drilling project in Africa. Energy XXI declined after the
| 1. | Please refer to pages M-2 and M-3 for additional explanations and disclosure regarding the Portfolios, their benchmark indices and service providers mentioned in the reports. |
| | | | |
| mainstayinvestments.com | | | M-91 | |
company announced a shortfall in second-quarter production because of operational inefficiencies.
Within the home building segment, the convertible bonds of KB Home and Ryland Group were relatively flat. The home building segment had a strong run early in 2013, but sold off during the second half of the year as some investors concluded that the shares were no longer inexpensive.
Did the Portfolio make any significant purchases or sales during the reporting period?
During 2013, we initiated a position in the convertible preferred shares of cereal maker Post Holdings, seeking to take advantage of the company’s significant free cash-flow generation. We purchased Yahoo convertible bonds in November 2013. We believed that the potential downside in the bonds was limited, given the company’s strong cash flow and balance sheet. We also believed that significant upside in the company’s common shares and convertible bonds could be realized once the company spins off its investment in China-based Alibaba.com, a group of e-commerce businesses.
We sold the convertible bonds of biopharmaceutical company Amarin when we became increasingly
convinced that the company’s drug to treat ultrahigh triglycerides would not receive FDA approval. We also sold the convertible bonds of apparel licenser Iconix Brand Group because we believed that the company’s share price was fully valued.
How did the Portfolio’s sector weightings change during the reporting period?
During 2013, we reduced the Portfolio’s weightings in the energy and health care sectors. Over the same period, we increased the Portfolio’s weightings in the consumer discretionary, industrials and telecommunication services sectors.
How was the Portfolio positioned at the end of the reporting period?
As of December 31, 2013, the Portfolio held overweight positions relative to the Bank of America Merrill Lynch All U.S. Convertibles Index in the energy, industrials, and consumer discretionary sectors. As of the same date, the Portfolio was underweight relative to the Index in the financials sector.
The opinions expressed are those of the portfolio manager as of the date of this report and are subject to change. There is no guarantee that any forecasts made will come to pass. This material does not constitute investment advice and is not intended as an endorsement of any specific investment.
Not all MainStay VP Portfolios and/or share classes are available under all policies.
| | |
| M-92 | | MainStay VP Convertible Portfolio |
Portfolio of Investments December 31, 2013
| | | | | | | | |
| | | Principal
Amount | | | Value | |
Convertible Securities 92.5%† Convertible Bonds 82.9% | |
Aerospace & Defense 0.4% | |
GenCorp, Inc.
4.063%, due 12/31/39 | | $ | 1,218,000 | | | $ | 2,455,793 | |
| | | | | | | | |
|
Airlines 1.6% | |
United Airlines, Inc.
4.50%, due 1/15/15 | | | 4,603,000 | | | | 9,424,642 | |
| | | | | | | | |
|
Auto Manufacturers 2.4% | |
Ford Motor Co.
4.25%, due 11/15/16 | | | 3,233,000 | | | | 5,981,050 | |
Wabash National Corp.
3.375%, due 5/1/18 | | | 5,944,000 | | | | 7,760,635 | |
| | | | | | | | |
| | | | | | | 13,741,685 | |
| | | | | | | | |
Biotechnology 5.3% | |
Cubist Pharmaceuticals, Inc.
1.125%, due 9/1/18 (a) | | | 3,515,000 | | | | 4,053,235 | |
1.875%, due 9/1/20 (a) | | | 4,595,000 | | | | 5,264,147 | |
¨Gilead Sciences, Inc.
1.00%, due 5/1/14 | | | 5,140,000 | | | | 17,090,500 | |
Medicines Co. (The)
1.375%, due 6/1/17 | | | 2,787,000 | | | | 4,204,886 | |
| | | | | | | | |
| | | | | | | 30,612,768 | |
| | | | | | | | |
Chemicals 0.7% | |
RPM International, Inc.
2.25%, due 12/15/20 | | | 3,586,000 | | | | 3,987,184 | |
| | | | | | | | |
|
Commercial Services 1.2% | |
Hertz Global Holdings, Inc.
5.25%, due 6/1/14 | | | 1,805,000 | | | | 6,261,103 | |
ServiceSource International, Inc.
1.50%, due 8/1/18 (a) | | | 823,000 | | | | 778,764 | |
| | | | | | | | |
| | | | | | | 7,039,867 | |
| | | | | | | | |
Computers 4.0% | |
Cadence Design Systems, Inc.
2.625%, due 6/1/15 | | | 2,276,000 | | | | 4,277,458 | |
EMC Corp.
1.75%, due 12/1/13 (b) | | | 5,975,000 | | | | 9,346,513 | |
SanDisk Corp.
0.50%, due 10/15/20 (a) | | | 3,447,000 | | | | 3,429,765 | |
Spansion LLC
2.00%, due 9/1/20 (a) | | | 5,036,000 | | | | 5,895,267 | |
| | | | | | | | |
| | | | | | | 22,949,003 | |
| | | | | | | | |
| | | | | | | | |
| | | Principal
Amount | | | Value | |
Distribution & Wholesale 0.5% | |
WESCO International, Inc.
6.00%, due 9/15/29 | | $ | 912,000 | | | $ | 2,958,300 | |
| | | | | | | | |
|
Electronics 1.1% | |
InvenSense, Inc.
1.75%, due 11/1/18 (a) | | | 5,232,000 | | | | 6,118,170 | |
| | | | | | | | |
|
Energy—Alternate Sources 0.3% | |
Clean Energy Fuels Corp.
5.25%, due 10/1/18 (a) | | | 1,595,000 | | | | 1,630,888 | |
| | | | | | | | |
|
Entertainment 0.8% | |
International Game Technology
3.25%, due 5/1/14 | | | 4,176,000 | | | | 4,431,780 | |
| | | | | | | | |
|
Environmental Controls 1.4% | |
Covanta Holding Corp.
3.25%, due 6/1/14 | | | 6,760,000 | | | | 7,938,775 | |
| | | | | | | | |
|
Finance—Leasing Companies 1.5% | |
Air Lease Corp.
3.875%, due 12/1/18 | | | 6,538,000 | | | | 8,809,955 | |
| | | | | | | | |
|
Health Care—Products 4.1% | |
Hologic, Inc.
2.00%, due 3/1/42 (c) | | | 5,246,000 | | | | 5,370,592 | |
Insulet Corp.
3.75%, due 6/15/16 | | | 2,870,000 | | | | 4,229,663 | |
Teleflex, Inc.
3.875%, due 8/1/17 | | | 5,964,000 | | | | 9,438,030 | |
Wright Medical Group, Inc.
2.00%, due 8/15/17 | | | 3,663,000 | | | | 4,901,552 | |
| | | | | | | | |
| | | | | | | 23,939,837 | |
| | | | | | | | |
Health Care—Services 1.1% | |
WellPoint, Inc.
2.75%, due 10/15/42 | | | 4,852,000 | | | | 6,592,655 | |
| | | | | | | | |
|
Home Builders 0.8% | |
Lennar Corp.
3.25%, due 11/15/21 (a) | | | 2,673,000 | | | | 4,811,400 | |
| | | | | | | | |
|
Household Products & Wares 2.2% | |
¨Jarden Corp.
1.875%, due 9/15/18 | | | 9,099,000 | | | | 12,897,832 | |
| | | | | | | | |
| † | Percentages indicated are based on Portfolio net assets. |
| ¨ | | Among the Portfolio’s 10 largest holdings or issuers held, as of December 31, 2013, excluding short-term investment. May be subject to change daily. |
| | | | | | |
The notes to the financial statements are an integral part of,
and should be read in conjunction with, the financial statements. | | mainstayinvestments.com | | | M-93 | |
Portfolio of Investments December 31, 2013 (continued)
| | | | | | | | |
| | | Principal
Amount | | | Value | |
| Convertible Bonds (continued) | |
Insurance 2.4% | |
American Equity Investment Life Holding Co.
3.50%, due 9/15/15 (a) | | $ | 4,258,000 | | | $ | 9,255,827 | |
Radian Group, Inc.
2.25%, due 3/1/19 | | | 3,014,000 | | | | 4,434,348 | |
| | | | | | | | |
| | | | | | | 13,690,175 | |
| | | | | | | | |
Internet 3.8% | |
At Home Corp.
4.75%, due 12/31/49 (b)(d)(e)(f) | | | 2,335,418 | | | | 234 | |
Blucora, Inc.
4.25%, due 4/1/19 (a) | | | 2,129,000 | | | | 3,149,589 | |
Dealertrack Technologies, Inc.
1.50%, due 3/15/17 | | | 1,206,000 | | | | 1,673,325 | |
priceline.com, Inc.
0.35%, due 6/15/20 (a) | | | 5,116,000 | | | | 5,854,622 | |
Shutterfly, Inc.
0.25%, due 5/15/18 (a) | | | 4,852,000 | | | | 5,212,868 | |
Yahoo!, Inc.
(zero coupon), due 12/1/18 (a) | | | 5,789,000 | | | | 6,009,706 | |
| | | | | | | | |
| | | | | | | 21,900,344 | |
| | | | | | | | |
Iron & Steel 0.8% | |
Allegheny Technologies, Inc.
4.25%, due 6/1/14 | | | 4,259,000 | | | | 4,418,712 | |
| | | | | | | | |
|
Lodging 0.8% | |
MGM Resorts International
4.25%, due 4/15/15 | | | 3,544,000 | | | | 4,881,860 | |
| | | | | | | | |
|
Machinery—Diversified 1.4% | |
Chart Industries, Inc.
2.00%, due 8/1/18 | | | 5,340,000 | | | | 8,273,662 | |
| | | | | | | | |
|
Media 0.7% | |
Liberty Interactive LLC
3.50%, due 1/15/31 | | | 524,000 | | | | 279,685 | |
Liberty Media Corp.
1.375%, due 10/15/23 (a) | | | 3,916,000 | | | | 3,918,447 | |
| | | | | | | | |
| | | | | | | 4,198,132 | |
| | | | | | | | |
Metal Fabricate & Hardware 1.4% | |
RTI International Metals, Inc.
1.625%, due 10/15/19 | | | 7,493,000 | | | | 7,909,798 | |
| | | | | | | | |
|
Miscellaneous—Manufacturing 2.2% | |
¨Danaher Corp.
(zero coupon), due 1/22/21 | | | 5,805,000 | | | | 13,035,853 | |
| | | | | | | | |
| | | | | | | | |
| | | Principal
Amount | | | Value | |
Oil & Gas 1.6% | |
Alon USA Energy, Inc.
3.00%, due 9/15/18 (a) | | $ | 3,169,000 | | | $ | 4,032,552 | |
Energy XXI Bermuda, Ltd.
3.00%, due 12/15/18 (a) | | | 5,418,000 | | | | 5,360,434 | |
| | | | | | | | |
| | | | | | | 9,392,986 | |
| | | | | | | | |
Oil & Gas Services 7.1% | |
Helix Energy Solutions Group, Inc.
3.25%, due 3/15/32 | | | 6,796,000 | | | | 8,159,447 | |
Hornbeck Offshore Services, Inc.
1.50%, due 9/1/19 | | | 2,525,000 | | | | 3,000,016 | |
¨JPMorgan Chase & Co. (Convertible into Schlumberger, Ltd.)
(zero coupon), due 5/5/15 (a)(g) | | | 11,252,000 | | | | 17,752,280 | |
Newpark Resources, Inc.
4.00%, due 10/1/17 | | | 2,427,000 | | | | 3,270,383 | |
SEACOR Holdings, Inc.
2.50%, due 12/15/27 | | | 1,751,000 | | | | 2,154,824 | |
Subsea 7 S.A.
1.00%, due 10/5/17 | | | 2,000,000 | | | | 2,021,600 | |
3.50%, due 10/13/14 | | | 3,700,000 | | | | 4,673,100 | |
| | | | | | | | |
| | | | | | | 41,031,650 | |
| | | | | | | | |
Pharmaceuticals 9.1% | |
Akorn, Inc.
3.50%, due 6/1/16 | | | 2,078,000 | | | | 5,917,105 | |
BioMarin Pharmaceutical, Inc.
0.75%, due 10/15/18 | | | 5,587,000 | | | | 5,946,663 | |
Medivation, Inc.
2.625%, due 4/1/17 | | | 4,036,000 | | | | 5,912,740 | |
Mylan, Inc.
3.75%, due 9/15/15 | | | 1,853,000 | | | | 6,084,789 | |
Omnicare, Inc.
3.50%, due 2/15/44 | | | 6,968,000 | | | | 7,059,455 | |
¨Salix Pharmaceuticals, Ltd.
1.50%, due 3/15/19 | | | 7,899,000 | | | | 11,813,942 | |
¨Teva Pharmaceutical Finance Co. LLC
0.25%, due 2/1/26 | | | 9,464,000 | | | | 10,096,905 | |
| | | | | | | | |
| | | | | | | 52,831,599 | |
| | | | | | | | |
Real Estate Investment Trusts 2.5% | |
Host Hotels & Resorts, L.P.
2.50%, due 10/15/29 (a) | | | 4,322,000 | | | | 6,547,830 | |
SL Green Operating Partnership, L.P.
3.00%, due 10/15/17 (a) | | | 6,391,000 | | | | 7,984,756 | |
| | | | | | | | |
| | | | | | | 14,532,586 | |
| | | | | | | | |
Semiconductors 7.3% | |
Emulex Corp.
1.75%, due 11/15/18 (a) | | | 1,549,000 | | | | 1,522,861 | |
Intel Corp.
3.25%, due 8/1/39 | | | 4,688,000 | | | | 6,381,563 | |
| | | | |
| M-94 | | MainStay VP Convertible Portfolio | | The notes to the financial statements are an integral part of,
and should be read in conjunction with, the financial statements. |
| | | | | | | | |
| | | Principal
Amount | | | Value | |
| Convertible Bonds (continued) | | | | | | | | |
Semiconductors (continued) | | | | | | | | |
Microchip Technology, Inc.
2.125%, due 12/15/37 | | $ | 3,536,000 | | | $ | 6,154,850 | |
Micron Technology, Inc.
1.625%, due 2/15/33 (a) | | | 2,637,000 | | | | 5,359,702 | |
¨Novellus Systems, Inc.
2.625%, due 5/15/41 | | | 7,576,000 | | | | 12,699,270 | |
NVIDIA Corp.
1.00%, due 12/1/18 (a) | | | 7,087,000 | | | | 7,290,751 | |
Rambus, Inc.
1.125%, due 8/15/18 (a) | | | 2,076,000 | | | | 2,183,693 | |
Xilinx, Inc.
2.625%, due 6/15/17 | | | 361,000 | | | | 577,600 | |
| | | | | | | | |
| | | | | | | 42,170,290 | |
| | | | | | | | |
Software 7.3% | |
Bottomline Technologies, Inc.
1.50%, due 12/1/17 | | | 5,946,000 | | | | 7,997,370 | |
Cornerstone OnDemand, Inc.
1.50%, due 7/1/18 (a) | | | 6,756,000 | | | | 8,233,875 | |
Medidata Solutions, Inc.
1.00%, due 8/1/18 (a) | | | 6,356,000 | | | | 8,139,652 | |
NetSuite, Inc.
0.25%, due 6/1/18 (a) | | | 2,619,000 | | | | 2,900,543 | |
Nuance Communications, Inc.
2.75%, due 11/1/31 | | | 5,927,000 | | | | 5,819,573 | |
Proofpoint, Inc.
1.25%, due 12/15/18 (a) | | | 1,537,000 | | | | 1,664,763 | |
Salesforce.com, Inc.
0.25%, due 4/1/18 (a) | | | 5,133,000 | | | | 5,585,346 | |
ServiceNow, Inc.
(zero coupon), due 11/1/18 (a) | | | 2,233,000 | | | | 2,270,682 | |
| | | | | | | | |
| | | | | | | 42,611,804 | |
| | | | | | | | |
Telecommunications 4.3% | |
Ciena Corp.
4.00%, due 12/15/20 | | | 4,844,000 | | | | 7,150,955 | |
Infinera Corp.
1.75%, due 6/1/18 (a) | | | 1,118,000 | | | | 1,203,946 | |
Ixia
3.00%, due 12/15/15 | | | 5,725,000 | | | | 6,197,313 | |
JDS Uniphase Corp.
0.625%, due 8/15/33 (a) | | | 6,601,000 | | | | 6,634,005 | |
SBA Communications Corp.
4.00%, due 10/1/14 | | | 1,173,000 | | | | 3,477,945 | |
| | | | | | | | |
| | | | | | | 24,664,164 | |
| | | | | | | | |
Transportation 0.8% | |
XPO Logistics, Inc.
4.50%, due 10/1/17 | | | 2,887,000 | | | | 4,844,747 | |
| | | | | | | | |
Total Convertible Bonds
(Cost $393,695,287) | | | | | | | 480,728,896 | |
| | | | | | | | |
| | | | | | | | |
| | |
Shares | | | Value | |
| Convertible Preferred Stocks 9.6% | |
Aerospace & Defense 2.3% | |
¨United Technologies Corp.
7.50% | | | 201,554 | | | $ | 13,195,741 | |
| | | | | | | | |
|
Auto Parts & Equipment 0.7% | |
Goodyear Tire & Rubber Co. (The)
5.88% | | | 57,600 | | | | 3,850,560 | |
| | | | | | | | |
|
Food 0.9% | |
Post Holdings, Inc.
2.50% (a) | | | 19,292 | | | | 1,930,406 | |
3.75% (a) | | | 27,639 | | | | 3,289,345 | |
| | | | | | | | |
| | | | | | | 5,219,751 | |
| | | | | | | | |
Hand & Machine Tools 1.7% | |
¨Stanley Black & Decker, Inc.
4.75% | | | 67,155 | | | | 8,335,950 | |
6.25% | | | 14,904 | | | | 1,538,093 | |
| | | | | | | | |
| | | | | | | 9,874,043 | |
| | | | | | | | |
Insurance 2.2% | |
Maiden Holdings, Ltd.
7.25% | | | 40,993 | | | | 1,868,051 | |
¨MetLife, Inc.
5.00% | | | 345,195 | | | | 10,887,450 | |
| | | | | | | | |
| | | | | | | 12,755,501 | |
| | | | | | | | |
Oil & Gas 0.5% | |
Sanchez Energy Corp.
Series A
4.88% | | | 48,100 | | | | 3,006,250 | |
| | | | | | | | |
|
Pharmaceuticals 1.1% | |
Omnicare Capital Trust II
Series B
4.00%
Callable 3/3/14@ $50.00 | | | 84,000 | | | | 6,234,480 | |
| | | | | | | | |
|
Real Estate Investment Trusts 0.2% | |
Health Care REIT, Inc.
Series I
6.50% | | | 26,800 | | | | 1,373,768 | |
| | | | | | | | |
Total Convertible Preferred Stocks
(Cost $46,481,007) | | | | | | | 55,510,094 | |
| | | | | | | | |
Total Convertible Securities
(Cost $440,176,294) | | | | | | | 536,238,990 | |
| | | | | | | | |
|
| Common Stocks 3.9% | |
Auto Manufacturers 0.5% | |
General Motors Co. (h) | | | 72,307 | | | | 2,955,187 | |
| | | | | | | | |
|
Banks 0.2% | |
Citigroup, Inc. | | | 22,229 | | | | 1,158,353 | |
| | | | | | | | |
| | | | | | |
The notes to the financial statements are an integral part of,
and should be read in conjunction with, the financial statements. | | mainstayinvestments.com | | | M-95 | |
Portfolio of Investments December 31, 2013 (continued)
| | | | | | | | |
| | |
Shares | | | Value | |
| Common Stocks (continued) | | | | | | | | |
Internet 0.3% | |
TIBCO Software, Inc. (h) | | | 73,482 | | | $ | 1,651,875 | |
| | | | | | | | |
|
Oil & Gas 0.2% | |
Ensco PLC Class A | | | 19,000 | | | | 1,086,420 | |
| | | | | | | | |
|
Oil & Gas Services 2.0% | |
Baker Hughes, Inc. | | | 75,000 | | | | 4,144,500 | |
Cameron International Corp. (h) | | | 33,365 | | | | 1,986,219 | |
Halliburton Co. | | | 73,392 | | | | 3,724,644 | |
Schlumberger, Ltd. | | | 22,000 | | | | 1,982,420 | |
| | | | | | | | |
| | | | | | | 11,837,783 | |
| | | | | | | | |
Transportation 0.7% | |
Tidewater, Inc. | | | 67,537 | | | | 4,002,918 | |
| | | | | | | | |
Total Common Stocks
(Cost $21,447,838) | | | | | | | 22,692,536 | |
| | | | | | | | |
| | |
| | | | | | | | |
| | | Number of
Warrants | | | | |
| Warrants 0.0%‡ | |
Auto Manufacturers 0.0%‡ | | | | | |
General Motors Co. | | | | | | | | |
Strike Price $10.00 Expires 7/10/16 (h) | | | 634 | | | | 19,756 | |
Strike Price $18.33 Expires 7/10/19 (h) | | | 634 | | | | 14,664 | |
| | | | | | | | |
Total Warrants
(Cost $569) | | | | | | | 34,420 | |
| | | | | | | | |
| | |
| | | | | | | | |
| | | Principal
Amount | | | | |
| Short-Term Investment 3.4% | |
Repurchase Agreement 3.4% | |
State Street Bank and Trust Co.
0.00%, dated 12/31/13
due 1/2/14
Proceeds at Maturity $19,554,128 (Collateralized by a Federal National Mortgage Association security with a rate of 2.17% and a maturity date of 11/7/22, with a Principal Amount of $21,915,000 and a Market Value of $19,949,553) | | $ | 19,554,128 | | | | 19,554,128 | |
| | | | | | | | |
Total Short-Term Investment
(Cost $19,554,128) | | | | | | | 19,554,128 | |
| | | | | | | | |
Total Investments
(Cost $481,178,829) (i) | | | 99.8 | % | | | 578,520,074 | |
Other Assets, Less Liabilities | | | 0.2 | | | | 1,243,591 | |
Net Assets | | | 100.0 | % | | $ | 579,763,665 | |
| ‡ | Less than one-tenth of a percent. |
| (a) | May be sold to institutional investors only under Rule 144A or securities offered pursuant to Section 4(a)(2) of the Securities Act of 1933, as amended. |
| (b) | Fair valued security—The total market value of these securities as of December 31, 2013, is $9,346,747, which represents 1.6% of the Portfolio’s net assets. |
| (c) | Step coupon—Rate shown is the rate in effect as of December 31, 2013. |
| (e) | Illiquid security—The total market value of this security as of December 31, 2013, is $234, which represents less than one-tenth of a percent of the Portfolio’s net assets. |
| (g) | Synthetic Convertible Bond—Security structured by an investment bank that provides exposure to a specific company’s stock, represents 3.1% of the Portfolio’s net assets. |
| (h) | Non-income producing security. |
| (i) | As of December 31, 2013, cost is $482,339,926 for federal income tax purposes and net unrealized appreciation is as follows: |
| | | | |
Gross unrealized appreciation | | $ | 103,382,924 | |
Gross unrealized depreciation | | | (7,202,776 | ) |
| | | | |
Net unrealized appreciation | | $ | 96,180,148 | |
| | | | |
| | | | |
| M-96 | | MainStay VP Convertible Portfolio | | The notes to the financial statements are an integral part of,
and should be read in conjunction with, the financial statements. |
The following is a summary of the fair valuations according to the inputs used as of December 31, 2013, for valuing the Portfolio’s assets.
Asset Valuation Inputs
| | | | | | | | | | | | | | | | |
Description | | Quoted Prices
in Active Markets
for Identical Assets (Level 1) | | | Significant Other
Observable Inputs (Level 2) | | | Significant
Unobservable
Inputs (Level 3) | | | Total | |
| Investments in Securities (a) | | | | | | | | | | | | | | | | |
| Convertible Securities | | | | | | | | | | | | | | | | |
Convertible Bonds (b) | | $ | — | | | $ | 480,728,662 | | | $ | 234 | | | $ | 480,728,896 | |
Convertible Preferred Stocks | | | 52,220,749 | | | | 3,289,345 | | | | — | | | | 55,510,094 | |
| | | | | | | | | | | | | | | | |
| Total Convertible Securities | | | 52,220,749 | | | | 484,018,007 | | | | 234 | | | | 536,238,990 | |
| | | | | | | | | | | | | | | | |
| Common Stocks | | | 22,692,536 | | | | — | | | | — | | | | 22,692,536 | |
| Warrants | | | 34,420 | | | | — | | | | — | | | | 34,420 | |
| Short-Term Investment | | | | | | | | | | | | | | | | |
Repurchase Agreement | | | — | | | | 19,554,128 | | | | — | | | | 19,554,128 | |
| | | | | | | | | | | | | | | | |
| Total Investments in Securities | | $ | 74,947,705 | | | $ | 503,572,135 | | | $ | 234 | | | $ | 578,520,074 | |
| | | | | | | | | | | | | | | | |
| (a) | For a complete listing of investments and their industries, see the Portfolio of Investments. |
| (b) | The Level 3 security valued at $234 is held in Internet, within the Convertible Bonds section of the Portfolio of Investments. |
The Portfolio recognizes transfers between the levels as of the beginning of the period.
The following is a reconciliation of investments in which significant unobservable inputs (Level 3) were used in determining value:
| | | | | | | | | | | | | | | | | | | | | | | | | | | | | | | | | | | | | | | | | | | | | | | | | | |
Investments
in Securities | | Balance
as of
December 31,
2012 | | Accrued
Discounts
(Premiums) | | Realized
Gain
(Loss) | | Change in
Unrealized
Appreciation
(Depreciation) | | Purchases | | Sales | | Transfers
into
Level 3 | | Transfers
out of
Level 3 | | Balance
as of
December 31,
2013 | | Change in
Unrealized
Appreciation
(Depreciation)
from
Investments
Still Held at
December 31,
2013 (a) |
| Convertible Bonds | | | | | | | | | | | | | | | | | | | | | | | | | | | | | | | | | | | | | | | | | | | | | | | | | | |
Internet | | | $ | 234 | | | | $ | — | | | | $ | — | | | | $ | — | | | | $ | — | | | | $ | — | | | | $ | — | | | | $ | — | | | | $ | 234 | | | | $ | — | |
| | | | | | | | | | | | | | | | | | | | | | | | | | | | | | | | | | | | | | | | | | | | | | | | | | |
| Total | | | $ | 234 | | | | $ | — | | | | $ | — | | | | $ | — | | | | $ | — | | | | $ | — | | | | $ | — | | | | $ | — | | | | $ | 234 | | | | $ | — | |
| | | | | | | | | | | | | | | | | | | | | | | | | | | | | | | | | | | | | | | | | | | | | | | | | | |
| (a) | Included in “Net change in unrealized appreciation (depreciation) on investments” in the Statement of Operations. |
| | | | | | |
The notes to the financial statements are an integral part of,
and should be read in conjunction with, the financial statements. | | mainstayinvestments.com | | | M-97 | |
Statement of Assets and Liabilities as of December 31, 2013
| | | | |
| Assets | |
Investment in securities, at value
(identified cost $481,178,829) | | $ | 578,520,074 | |
Cash | | | 88 | |
Receivables: | | | | |
Dividends and interest | | | 1,687,587 | |
Fund shares sold | | | 277,287 | |
Other assets | | | 3 | |
| | | | |
Total assets | | | 580,485,039 | |
| | | | |
| |
| Liabilities | | | | |
Payables: | | | | |
Manager (See Note 3) | | | 286,807 | |
Fund shares redeemed | | | 272,119 | |
NYLIFE Distributors (See Note 3) | | | 87,002 | |
Professional fees | | | 41,415 | |
Shareholder communication | | | 28,821 | |
Custodian | | | 1,618 | |
Trustees | | | 654 | |
Accrued expenses | | | 2,938 | |
| | | | |
Total liabilities | | | 721,374 | |
| | | | |
Net assets | | $ | 579,763,665 | |
| | | | |
| |
| Net Assets Consist of | | | | |
Shares of beneficial interest outstanding (par value of $.001 per share) unlimited number of shares authorized | | $ | 43,587 | |
Additional paid-in capital | | | 456,251,028 | |
| | | | |
| | | 456,294,615 | |
Undistributed net investment income | | | 9,142,891 | |
Accumulated net realized gain (loss) on investments | | | 16,984,914 | |
Net unrealized appreciation (depreciation) on investments | | | 97,341,245 | |
| | | | |
Net assets | | $ | 579,763,665 | |
| | | | |
| | | | |
Initial Class | | | | |
Net assets applicable to outstanding shares | | $ | 160,946,548 | |
| | | | |
Shares of beneficial interest outstanding | | | 12,029,371 | |
| | | | |
Net asset value per share outstanding | | $ | 13.38 | |
| | | | |
Service Class | | | | |
Net assets applicable to outstanding shares | | $ | 418,817,117 | |
| | | | |
Shares of beneficial interest outstanding | | | 31,557,882 | |
| | | | |
Net asset value per share outstanding | | $ | 13.27 | |
| | | | |
| | | | |
| M-98 | | MainStay VP Convertible Portfolio | | The notes to the financial statements are an integral part of,
and should be read in conjunction with, the financial statements. |
Statement of Operations for the year ended December 31, 2013
| | | | |
| Investment Income (Loss) | |
Income | | | | |
Interest | | $ | 5,770,013 | |
Dividends | | | 4,125,193 | |
| | | | |
Total income | | | 9,895,206 | |
| | | | |
Expenses | | | | |
Manager (See Note 3) | | | 3,097,660 | |
Distribution and service—Service Class (See Note 3) | | | 913,370 | |
Professional fees | | | 95,229 | |
Shareholder communication | | | 80,113 | |
Custodian | | | 10,570 | |
Trustees | | | 10,468 | |
Miscellaneous | | | 23,545 | |
| | | | |
Total expenses | | | 4,230,955 | |
| | | | |
Net investment income (loss) | | | 5,664,251 | |
| | | | |
|
| Realized and Unrealized Gain (Loss) on Investments | |
Net realized gain (loss) on investments | | | 27,021,603 | |
Net change in unrealized appreciation (depreciation) on investments | | | 82,673,034 | |
| | | | |
Net realized and unrealized gain (loss) on investments | | | 109,694,637 | |
| | | | |
Net increase (decrease) in net assets resulting from operations | | $ | 115,358,888 | |
| | | | |
| | | | | | |
The notes to the financial statements are an integral part of,
and should be read in conjunction with, the financial statements. | | mainstayinvestments.com | | | M-99 | |
Statements of Changes in Net Assets
for the years ended December 31, 2013 and December 31, 2012
| | | | | | | | |
| | | 2013 | | | 2012 | |
| Increase (Decrease) in Net Assets | |
Operations: | | | | | | | | |
Net investment income (loss) | | $ | 5,664,251 | | | $ | 9,642,533 | |
Net realized gain (loss) on investments | | | 27,021,603 | | | | 35,123,856 | |
Net change in unrealized appreciation (depreciation) on investments | | | 82,673,034 | | | | (2,613,515 | ) |
| | | | |
Net increase (decrease) in net assets resulting from operations | | | 115,358,888 | | | | 42,152,874 | |
| | | | |
Dividends and distributions to shareholders: | | | | | | | | |
From net investment income: | | | | | | | | |
Initial Class | | | (3,650,810 | ) | | | (4,737,544 | ) |
Service Class | | | (8,394,204 | ) | | | (8,770,757 | ) |
| | | | |
| | | (12,045,014 | ) | | | (13,508,301 | ) |
| | | | |
From net realized gain on investments: | | | | | | | | |
Initial Class | | | (10,148,129 | ) | | | (601,018 | ) |
Service Class | | | (25,574,249 | ) | | | (1,214,005 | ) |
| | | | |
| | | (35,722,378 | ) | | | (1,815,023 | ) |
| | | | |
Total dividends and distributions to shareholders | | | (47,767,392 | ) | | | (15,323,324 | ) |
| | | | |
Capital share transactions: | | | | | | | | |
Net proceeds from sale of shares | | | 68,216,417 | | | | 33,317,960 | |
Net asset value of shares issued to shareholders in reinvestment of dividends and distributions | | | 47,767,392 | | | | 15,323,324 | |
Cost of shares redeemed | | | (69,400,964 | ) | | | (98,417,389 | ) |
| | | | |
Increase (decrease) in net assets derived from capital share transactions | | | 46,582,845 | | | | (49,776,105 | ) |
| | | | |
Net increase (decrease) in net assets | | | 114,174,341 | | | | (22,946,555 | ) |
|
| Net Assets | |
Beginning of year | | | 465,589,324 | | | | 488,535,879 | |
| | | | |
End of year | | $ | 579,763,665 | | | $ | 465,589,324 | |
| | | | |
Undistributed net investment income at end of year | | $ | 9,142,891 | | | $ | 10,881,954 | |
| | | | |
| | | | |
| M-100 | | MainStay VP Convertible Portfolio | | The notes to the financial statements are an integral part of,
and should be read in conjunction with, the financial statements. |
Financial Highlights selected per share data and ratios
| | | | | | | | | | | | | | | | | | | | |
| | | Initial Class | |
| | | Year ended December 31, | |
| | | 2013 | | | 2012 | | | 2011 | | | 2010 | | | 2009 | |
Net asset value at beginning of year | | $ | 11.70 | | | $ | 11.09 | | | $ | 11.96 | | | $ | 10.45 | | | $ | 7.29 | |
| | | | | | | | | | | | | | | | | | | | |
Net investment income (loss) (a) | | | 0.17 | | | | 0.25 | | | | 0.29 | | | | 0.30 | | | | 0.38 | |
Net realized and unrealized gain (loss) on investments | | | 2.73 | | | | 0.75 | | | | (0.88 | ) | | | 1.53 | | | | 2.98 | |
| | | | | | | | | | | | | | | | | | | | |
Total from investment operations | | | 2.90 | | | | 1.00 | | | | (0.59 | ) | | | 1.83 | | | | 3.36 | |
| | | | | | | | | | | | | | | | | | | | |
Less dividends and distributions: | | | | | | | | | | | | | | | | | | | | |
From net investment income | | | (0.32 | ) | | | (0.35 | ) | | | (0.28 | ) | | | (0.32 | ) | | | (0.20 | ) |
From net realized gain on investments | | | (0.90 | ) | | | (0.04 | ) | | | — | | | | — | | | | — | |
| | | | | | | | | | | | | | | | | | | | |
Total dividends and distributions | | | (1.22 | ) | | | (0.39 | ) | | | (0.28 | ) | | | (0.32 | ) | | | (0.20 | ) |
| | | | | | | | | | | | | | | | | | | | |
Net asset value at end of year | | $ | 13.38 | | | $ | 11.70 | | | $ | 11.09 | | | $ | 11.96 | | | $ | 10.45 | |
| | | | | | | | | | | | | | | | | | | | |
Total investment return | | | 25.35 | % | | | 9.13 | % | | | (4.75 | %) | | | 17.86 | % | | | 46.08 | % |
Ratios (to average net assets)/Supplemental Data: | | | | | | | | | | | | | | | | | | | | |
Net investment income (loss) | | | 1.29 | % | | | 2.12 | % | | | 2.43 | % | | | 2.77 | % | | | 4.30 | % |
Net expenses | | | 0.64 | % | | | 0.64 | % | | | 0.65 | % | | | 0.66 | % | | | 0.66 | % |
Portfolio turnover rate | | | 77 | % | | | 69 | % | | | 80 | % | | | 83 | % | | | 73 | % |
Net assets at end of year (in 000’s) | | $ | 160,947 | | | $ | 149,653 | | | $ | 173,777 | | | $ | 223,633 | | | $ | 181,366 | |
| (a) | Per share data based on average shares outstanding during the year. |
| | | | | | | | | | | | | | | | | | | | |
| | | Service Class | |
| | | Year ended December 31, | |
| | | 2013 | | | 2012 | | | 2011 | | | 2010 | | | 2009 | |
Net asset value at beginning of year | | $ | 11.61 | | | $ | 11.01 | | | $ | 11.89 | | | $ | 10.39 | | | $ | 7.26 | |
| | | | | | | | | | | | | | | | | | | | |
Net investment income (loss) (a) | | | 0.13 | | | | 0.22 | | | | 0.26 | | | | 0.27 | | | | 0.36 | |
Net realized and unrealized gain (loss) on investments | | | 2.73 | | | | 0.74 | | | | (0.88 | ) | | | 1.53 | | | | 2.95 | |
| | | | | | | | | | | | | | | | | | | | |
Total from investment operations | | | 2.86 | | | | 0.96 | | | | (0.62 | ) | | | 1.80 | | | | 3.31 | |
| | | | | | | | | | | | | | | | | | | | |
Less dividends and distributions: | | | | | | | | | | | | | | | | | | | | |
From net investment income | | | (0.30 | ) | | | (0.32 | ) | | | (0.26 | ) | | | (0.30 | ) | | | (0.18 | ) |
From net realized gain on investments | | | (0.90 | ) | | | (0.04 | ) | | | — | | | | — | | | | — | |
| | | | | | | | | | | | | | | | | | | | |
Total dividends and distributions | | | (1.20 | ) | | | (0.36 | ) | | | (0.26 | ) | | | (0.30 | ) | | | (0.18 | ) |
| | | | | | | | | | | | | | | | | | | | |
Net asset value at end of year | | $ | 13.27 | | | $ | 11.61 | | | $ | 11.01 | | | $ | 11.89 | | | $ | 10.39 | |
| | | | | | | | | | | | | | | | | | | | |
Total investment return | | | 25.04 | % | | | 8.86 | % | | | (4.99 | %) | | | 17.56 | % | | | 45.71 | % |
Ratios (to average net assets)/Supplemental Data: | | | | | | | | | | | | | | | | | | | | |
Net investment income (loss) | | | 1.01 | % | | | 1.87 | % | | | 2.19 | % | | | 2.52 | % | | | 4.03 | % |
Net expenses | | | 0.89 | % | | | 0.89 | % | | | 0.90 | % | | | 0.91 | % | | | 0.91 | % |
Portfolio turnover rate | | | 77 | % | | | 69 | % | | | 80 | % | | | 83 | % | | | 73 | % |
Net assets at end of year (in 000’s) | | $ | 418,817 | | | $ | 315,937 | | | $ | 314,759 | | | $ | 312,518 | | | $ | 227,463 | |
| (a) | Per share data based on average shares outstanding during the year. |
| | | | | | |
The notes to the financial statements are an integral part of,
and should be read in conjunction with, the financial statements. | | mainstayinvestments.com | | | M-101 | |
MainStay VP Cornerstone Growth Portfolio
Investment and Performance Comparison (Unaudited)
Performance data quoted represents past performance. Past performance is no guarantee of future results. Because of market volatility, current performance may be lower or higher than the figures shown. Investment return and principal value will fluctuate, and as a result, when shares are redeemed, they may be worth more or less than their original cost. The performance table and graph do not reflect any deduction of sales charges, mortality and expense charges, contract charges or administrative charges. Please refer to the Performance Summary appropriate for your policy. For performance information current to the most recent month-end, please call 800-598-2019 or visit www.newyorklife.com.
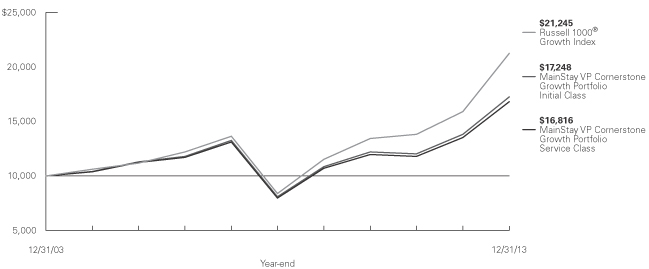
Average Annual Total Returns for the Year Ended December 31, 2013
| | | | | | | | | | | | | | | | | | | | |
| Class | | One Year | | | Five Years | | | Ten Years1 | | | Gross
Expense Ratio2 | |
| Initial Class Shares | | | 24.71 | % | | | 16.31 | % | | | 5.60 | % | | | 0.74 | % |
| Service Class Shares | | | 24.40 | | | | 16.02 | | | | 5.33 | | | | 0.99 | |
| | | | | | | | | | | | |
| Benchmark Performance | | One
Year | | | Five
Years | | | Ten
Years | |
Russell 1000® Growth Index3 | | | 33.48 | % | | | 20.39 | % | | | 7.83 | % |
| Average Lipper Variable Products Large-Cap Growth Portfolio4 | | | 34.67 | | | | 19.82 | | | | 7.67 | |
| 1. | Performance figures shown for the ten-year period ended December 31, 2013 reflect nonrecurring reimbursements from affiliates for printing and mailing costs. If these nonrecurring reimbursements had not been made, the total returns would have been 5.58% for Initial Class shares and 5.31% for Service Class shares for the ten-year period. |
| 2. | The gross expense ratios presented reflect the Portfolio’s “Total Annual Portfolio Operating Expenses” from the most recent Prospectus and may differ from other expense ratios disclosed in this report. |
| 3. | Please refer to pages M-2 and M-3 for additional explanations and disclosure regarding the Portfolios, their benchmark indices and other indices mentioned in the reports. |
| 4. | The Average Lipper Variable Products Large-Cap Growth Portfolio is representative of portfolios that, by portfolio practice, invest at least 75% of their equity assets in companies with market capitalizations (on a three-year weighted basis) above Lipper’s U.S. diversified equity large-cap floor. Large-cap growth portfolios typically have above-average characteristics compared to the S&P 500® Index. Lipper Inc. is an independent monitor of fund performance. Results are based on total returns with all dividend and capital gain distributions reinvested. |
| | |
| M-102 | | MainStay VP Cornerstone Growth Portfolio |
Cost in Dollars of a $1,000 Investment in MainStay VP Cornerstone Growth Portfolio (Unaudited)
The example below is intended to describe the fees and expenses borne by shareholders during the six-month period from July 1, 2013, to December 31, 2013, and the impact of those costs on your investment.
Example
As a shareholder of the Portfolio, you incur two types of costs: (1) transaction costs, including exchange fees and sales charges (loads) on purchases (as applicable), and (2) ongoing costs, including management fees, distribution and/or service (12b-1) fees, and other Portfolio expenses (as applicable). This example is intended to help you understand your ongoing costs (in dollars) of investing in the Portfolio and to compare these costs with the ongoing costs of investing in other Portfolios. The example is based on an investment of $1,000 made at the beginning of the six-month period and held for the entire period from July 1, 2013, to December 31, 2013. Shares are only sold in connection with variable life and annuity contracts and the example does not reflect any contract level or transactional fees or expenses. If these costs had been included, your costs would have been higher.
This example illustrates your Portfolio’s ongoing costs in two ways:
Actual Expenses
The second and third data columns in the table below provide information about actual account values and actual expenses. You may use the information in these columns, together with the amount you invested, to estimate the expenses that you paid during the six months ended
December 31, 2013. Simply divide your account value by $1,000 (for example, an $8,600 account value divided by $1,000 = 8.6), then multiply the result by the number under the heading entitled ‘‘Expenses Paid During Period’’ to estimate the expenses you paid on your account during this period.
Hypothetical Example for Comparison Purposes
The fourth and fifth data columns in the table below provide information about hypothetical account values and hypothetical expenses based on the Portfolio’s actual expense ratio and an assumed rate of return of 5% per year before expenses, which is not the Portfolio’s actual return. The hypothetical account values and expenses may not be used to estimate the actual ending account balances or expenses you paid for the six-month period shown. You may use this information to compare the ongoing costs of investing in the Portfolio with the ongoing costs of investing in other Portfolios. To do so, compare this 5% hypothetical example with the 5% hypothetical examples that appear in the shareholder reports of the other Portfolios.
Please note that the expenses shown in the table are meant to highlight your ongoing costs only and do not reflect any transactional costs, such as exchange fees or sales charges (loads). Therefore, the fourth and fifth data columns of the table are useful in comparing ongoing costs only and will not help you determine the relative total costs of owning different funds. In addition, if these transactional costs were included, your costs would have been higher.
| | | | | | | | | | | | | | | | | | | | |
| | | | | | | | | | | | | | | | |
| Share Class | | Beginning
Account
Value
7/1/13 | | | Ending Account
Value (Based
on Actual
Returns and
Expenses)
12/31/13 | | | Expenses
Paid
During
Period1 | | | Ending Account
Value (Based
on Hypothetical
5% Annualized
Return and
Actual Expenses)
12/31/13 | | | Expenses
Paid
During
Period1 | |
| | | | | |
| Initial Class Shares | | $ | 1,000.00 | | | $ | 1,184.50 | | | $ | 4.02 | | | $ | 1,021.50 | | | $ | 3.72 | |
| | | | | |
| Service Class Shares | | $ | 1,000.00 | | | $ | 1,182.90 | | | $ | 5.45 | | | $ | 1,020.20 | | | $ | 5.04 | |
| 1. | Expenses are equal to the Portfolio’s annualized expense ratio of each class (0.73% for Initial Class and 0.99% for Service Class) multiplied by the average account value over the period, divided by 365 and multiplied by 184 (to reflect the six-month period). The table above represents the actual expenses incurred during the six-month period. |
| | | | |
| mainstayinvestments.com | | | M-103 | |
Industry Composition as of December 31, 2013 (Unaudited)
| | | | |
| Internet Software & Services | | | 13.6 | % |
| Software | | | 8.3 | |
| Specialty Retail | | | 5.7 | |
| Textiles, Apparel & Luxury Goods | | | 5.6 | |
| Health Care Providers & Services | | | 5.4 | |
| Media | | | 4.9 | |
| Trading Companies & Distributors | | | 4.9 | |
| Internet & Catalog Retail | | | 3.8 | |
| Semiconductors & Semiconductor Equipment | | | 3.1 | |
| Aerospace & Defense | | | 2.8 | |
| IT Services | | | 2.8 | |
| Beverages | | | 2.7 | |
| Energy Equipment & Services | | | 2.6 | |
| Health Care Equipment & Supplies | | | 2.6 | |
| Oil, Gas & Consumable Fuels | | | 2.6 | |
| Capital Markets | | | 2.5 | |
| Household Durables | | | 2.5 | |
| | | | |
| Hotels, Restaurants & Leisure | | | 2.3 | % |
| Biotechnology | | | 2.2 | |
| Metals & Mining | | | 2.2 | |
| Chemicals | | | 2.1 | |
| Diversified Financial Services | | | 2.1 | |
| Tobacco | | | 2.1 | |
| Construction & Engineering | | | 1.9 | |
| Computers & Peripherals | | | 1.8 | |
| Machinery | | | 1.8 | |
| Real Estate Investment Trusts | | | 1.5 | |
| Commercial Banks | | | 1.3 | |
| Auto Components | | | 1.0 | |
| Food & Staples Retailing | | | 0.7 | |
| Short-Term Investment | | | 1.4 | |
| Other Assets, Less Liabilities | | | –0.8 | |
| | | | |
| | | 100.0 | % |
| | | | |
See Portfolio of Investments beginning on page M-107 for specific holdings within these categories.
Top Ten Holdings as of December 31, 2013 (excluding short-term investment) (Unaudited)
| 7. | Rackspace Hosting, Inc. |
| 9. | Diageo PLC, Sponsored ADR |
| | |
| M-104 | | MainStay VP Cornerstone Growth Portfolio |
Portfolio Management Discussion and Analysis (Unaudited)
Answers to the questions reflect the views of portfolio manager Thomas G. Kamp, CFA, of Cornerstone Capital Management LLC (“Cornerstone”), the Portfolio’s Subadvisor.
How did MainStay VP Cornerstone Growth Portfolio perform relative to its benchmark and peers during the 12 months ended December 31, 2013?
For the 12 months ended December 31, 2013, MainStay VP Cornerstone Growth Portfolio returned 24.71% for Initial Class shares and 24.40% for Service Class shares. Over the same period, both share classes underperformed the 33.48% return of the Russell 1000® Growth Index1 and the 34.67% return of the average Lipper1 Variable Products Large-Cap Growth Portfolio. The Russell 1000® Growth Index is the Portfolio’s broad-based securities-market index.
What factors affected the Portfolio’s relative performance during the reporting period?
As a result of our cautious observation of the dysfunction in Washington; Europe’s untenable monetary union without a political union, which gave rise to great imbalances, deficits, and a financial crisis; and a slowing economy in China, we sought safety in low-valuation and high-cash flow stocks. We tended to trim or exit positions in stocks whose valuation expanded beyond what we believed was reasonable in light of revised earnings estimates. We added to underperforming names whose valuations became increasingly attractive. While we were true to our process, this trading pattern led our stock selection to be unfavorable compared to positions in the Russell 1000® Growth Index in a period when momentum was strong. We overemphasized the contrarian side of our mantra that “we are short-term contrarians within the context of being long-term fundamental investors.” Our cautionary positioning and the market’s preference for value over growth caused the Portfolio to underperform the Russell 1000® Growth Index in a rapidly rising market.
Which sectors were the strongest positive contributors to the Portfolio’s relative performance, and which sectors were particularly weak?
The strongest positive-contributing sectors to the Portfolio’s performance relative to the Russell 1000® Growth Index were information technology and consumer discretionary. (Contributions take weightings and total returns into account.) The weakest-contributing sectors were health care, consumer staples and industrials.
During the reporting period, which individual stocks made the strongest positive contributions to the Portfolio’s absolute performance and which stocks detracted the most?
The stocks that made the strongest positive contributions to the Portfolio’s absolute performance were money movement and payment service provider Western Union, information technology company Google and additive manufacturing (3-D printing) company Stratasys Ltd. Western Union’s stock recovered more than 50% since its November 2012 lows and has approached our price target. Google reported acceleration in the growth of its core owned and operated network sites and a decline in traffic acquisition costs. As a result, margins expanded and earnings beat expectations. The valuation of Stratasys doubled after we became one of the company’s largest shareholders early in 2013. Sentiment for the stock continued to climb as the number of applications for 3-D printing has grown.
The individual stocks that detracted most from performance were computers & peripherals company Apple, exploration and production company Cobalt International Energy and heart valve company Edwards LifeSciences. The Portfolio only owned its position in Apple for a portion of the reporting period. Although the company’s shares rose as supply and demand for the iPhone 5S improved, which increased investors’ capital return expectations, the stock was still the Portfolio’s most significant negative contributor. Cobalt International Energy’s stock price fell by nearly 50% after a series of disappointing well results in the second half of 2013. Edwards LifeSciences missed expectations for its transcatheter aortic valve replacement product. The shortfall resulted from strict government reimbursement guidelines in the United States, increased competitive intensity, and elevated research and development spending.
Did the Portfolio make any significant purchases or sales during the reporting period?
The Portfolio initiated a new position in home-improvement retailer Home Depot. We felt that after multiple years of home-improvement spending above consensus estimates, the stock had good potential. We also initiated a new position in Starbucks. We felt that the company’s best-in-class same-store sales growth would continue, driven by strong innovation in the Starbucks’ platforms, products and payments. We
| 1. | Please refer to pages M-2 and M-3 for additional explanations and disclosure regarding the Portfolios, their benchmark indices and service providers mentioned in the reports. |
| | | | |
| mainstayinvestments.com | | | M-105 | |
also believed that falling coffee prices might add to the opportunity. The Portfolio added a position in industrial supply company Fastenal in October, after lower margins led the company to fall short of earnings-per-share expectations. Since then, we have made the company our largest position in the industrials sector. From a macro perspective, we like the company’s all North American exposure (with little to no exposure to commodities or to China at the time of purchase). From a micro perspective (and more importantly), we expect to see a sales growth acceleration, as Fastenal has substantially increased its hiring at the store level. As a result, we anticipate strong sales growth in the second quarter of 2014 and beyond.
The Portfolio eliminated its position in network storage company Network Appliance as perception gaps around earnings growth and use of the company’s strong balance sheet closed. We eliminated the Portfolio’s position in communications equipment company QUALCOMM because revenue growth expectations were decreasing and margins were compressing. We believe that these forces may slow earnings-per-share growth as the smartphone
industry matures. We eliminated the Portfolio’s position in Western Union as the stock price approached our target, which was affected by rising compliance costs and competitive intensity.
How did the Portfolio’s sector weightings change during the reporting period?
The Portfolio increased its exposure relative to the Russell 1000® Growth Index in the consumer discretionary and financials sectors during the reporting period. The Portfolio decreased its exposure relative to the Index in health care and materials.
How was the Portfolio positioned at the end of the reporting period?
As of December 31, 2013, the Portfolio was overweight relative to the Russell 1000® Growth Index in the consumer discretionary, information technology and financials sectors. As of the same date, the Portfolio held underweight positions relative to the benchmark in consumer staples, telecommunication services and health care.
The opinions expressed are those of the portfolio manager as of the date of this report and are subject to change. There is no guarantee that any forecasts made will come to pass. This material does not constitute investment advice and is not intended as an endorsement of any specific investment.
Not all MainStay VP Portfolios and/or share classes are available under all policies.
| | |
| M-106 | | MainStay VP Cornerstone Growth Portfolio |
Portfolio of Investments December 31, 2013
| | | | | | | | |
| | |
Shares | | | Value | |
| | | | | | | | |
| Common Stocks 99.4%† | |
Aerospace & Defense 2.8% | | | | | | | | |
Precision Castparts Corp. | | | 35,872 | | | $ | 9,660,330 | |
Textron, Inc. | | | 178,967 | | | | 6,578,827 | |
| | | | | | | | |
| | | | | | | 16,239,157 | |
| | | | | | | | |
Auto Components 1.0% | |
Johnson Controls, Inc. | | | 109,265 | | | | 5,605,295 | |
| | | | | | | | |
| | |
Beverages 2.7% | | | | | | | | |
¨Diageo PLC, Sponsored ADR | | | 119,262 | | | | 15,792,674 | |
| | | | | | | | |
|
Biotechnology 2.2% | |
Gilead Sciences, Inc. (a) | | | 168,362 | | | | 12,652,404 | |
| | | | | | | | |
| | |
Capital Markets 2.5% | | | | | | | | |
Morgan Stanley | | | 206,631 | | | | 6,479,948 | |
T. Rowe Price Group, Inc. | | | 94,501 | | | | 7,916,349 | |
| | | | | | | | |
| | | | | | | 14,396,297 | |
| | | | | | | | |
Chemicals 2.1% | |
Sherwin-Williams Co. (The) | | | 68,777 | | | | 12,620,580 | |
| | | | | | | | |
|
Commercial Banks 1.3% | |
First Republic Bank | | | 144,157 | | | | 7,546,619 | |
| | | | | | | | |
|
Computers & Peripherals 1.8% | |
Stratasys, Ltd. (a) | | | 78,671 | | | | 10,596,984 | |
| | | | | | | | |
|
Construction & Engineering 1.9% | |
Fluor Corp. | | | 141,570 | | | | 11,366,655 | |
| | | | | | | | |
|
Diversified Financial Services 2.1% | |
CME Group, Inc. | | | 156,179 | | | | 12,253,804 | |
| | | | | | | | |
|
Energy Equipment & Services 2.6% | |
Schlumberger, Ltd. | | | 170,386 | | | | 15,353,482 | |
| | | | | | | | |
|
Food & Staples Retailing 0.7% | |
Whole Foods Market, Inc. | | | 76,454 | | | | 4,421,335 | |
| | | | | | | | |
|
Health Care Equipment & Supplies 2.6% | |
Edwards Lifesciences Corp. (a) | | | 228,133 | | | | 15,002,026 | |
| | | | | | | | |
|
Health Care Providers & Services 5.4% | |
¨Catamaran Corp. (a) | | | 504,475 | | | | 23,952,473 | |
Express Scripts Holding Co. (a) | | | 113,720 | | | | 7,987,693 | |
| | | | | | | | |
| | | | | | | 31,940,166 | |
| | | | | | | | |
| | | | | | | | |
| | |
Shares | | | Value | |
| | | | | | | | |
Hotels, Restaurants & Leisure 2.3% | |
Starbucks Corp. | | | 170,280 | | | $ | 13,348,249 | |
| | | | | | | | |
|
Household Durables 2.5% | |
PulteGroup, Inc. | | | 729,680 | | | | 14,863,582 | |
| | | | | | | | |
|
Internet & Catalog Retail 3.8% | |
¨Amazon.com, Inc. (a) | | | 49,752 | | | | 19,840,600 | |
Shutterfly, Inc. (a) | | | 50,887 | | | | 2,591,675 | |
| | | | | | | | |
| | | | | | | 22,432,275 | |
| | | | | | | | |
Internet Software & Services 13.6% | |
eBay, Inc. (a) | | | 117,837 | | | | 6,468,073 | |
¨Google, Inc. Class A (a) | | | 30,812 | | | | 34,531,316 | |
LinkedIn Corp. Class A (a) | | | 45,744 | | | | 9,918,672 | |
¨Rackspace Hosting, Inc. (a) | | | 499,267 | | | | 19,536,318 | |
Zillow, Inc. Class A (a) | | | 116,796 | | | | 9,545,737 | |
| | | | | | | | |
| | | | | | | 80,000,116 | |
| | | | | | | | |
IT Services 2.8% | |
¨Visa, Inc. Class A | | | 73,261 | | | | 16,313,759 | |
| | | | | | | | |
|
Machinery 1.8% | |
Joy Global, Inc. | | | 183,826 | | | | 10,751,983 | |
| | | | | | | | |
|
Media 4.9% | |
¨Comcast Corp. Class A | | | 298,426 | | | | 15,507,707 | |
Walt Disney Co. (The) | | | 170,688 | | | | 13,040,563 | |
| | | | | | | | |
| | | | | | | 28,548,270 | |
| | | | | | | | |
Metals & Mining 2.2% | |
Freeport-McMoRan Copper & Gold, Inc. | | | 340,149 | | | | 12,837,223 | |
| | | | | | | | |
|
Oil, Gas & Consumable Fuels 2.6% | |
Anadarko Petroleum Corp. | | | 85,156 | | | | 6,754,574 | |
Cobalt International Energy, Inc. (a) | | | 501,492 | | | | 8,249,543 | |
| | | | | | | | |
| | | | | | | 15,004,117 | |
| | | | | | | | |
Real Estate Investment Trusts 1.5% | |
Camden Property Trust | | | 156,379 | | | | 8,894,838 | |
| | | | | | | | |
|
Semiconductors & Semiconductor Equipment 3.1% | |
Altera Corp. | | | 179,705 | | | | 5,845,804 | |
Micron Technology, Inc. (a) | | | 559,154 | | | | 12,167,191 | |
| | | | | | | | |
| | | | | | | 18,012,995 | |
| | | | | | | | |
Software 8.3% | |
¨Citrix Systems, Inc. (a) | | | 327,344 | | | | 20,704,508 | |
¨Salesforce.com, Inc. (a) | | | 505,328 | | | | 27,889,052 | |
| | | | | | | | |
| | | | | | | 48,593,560 | |
| | | | | | | | |
| † | Percentages indicated are based on Portfolio net assets. |
| ¨ | | Among the Portfolio’s 10 largest holdings, as of December 31, 2013, excluding short-term investment. May be subject to change daily. |
| | | | | | |
The notes to the financial statements are an integral part of,
and should be read in conjunction with, the financial statements. | | mainstayinvestments.com | | | M-107 | |
Portfolio of Investments December 31, 2013 (continued)
| | | | | | | | |
| | |
Shares | | | Value | |
| | | | | | | | |
| Common Stocks (continued) | |
Specialty Retail 5.7% | |
Dick’s Sporting Goods, Inc. | | | 103,489 | | | $ | 6,012,711 | |
¨Home Depot, Inc. (The) | | | 248,573 | | | | 20,467,501 | |
TJX Cos., Inc. | | | 106,846 | | | | 6,809,295 | |
| | | | | | | | |
| | | | | | | 33,289,507 | |
| | | | | | | | |
Textiles, Apparel & Luxury Goods 5.6% | |
NIKE, Inc. Class B | | | 111,679 | | | | 8,782,436 | |
PVH Corp. | | | 93,247 | | | | 12,683,457 | |
Ralph Lauren Corp. | | | 64,452 | | | | 11,380,290 | |
| | | | | | | | |
| | | | | | | 32,846,183 | |
| | | | | | | | |
Tobacco 2.1% | |
Philip Morris International, Inc. | | | 143,723 | | | | 12,522,585 | |
| | | | | | | | |
|
Trading Companies & Distributors 4.9% | |
Fastenal Co. | | | 307,243 | | | | 14,597,115 | |
United Rentals, Inc. (a) | | | 183,692 | | | | 14,318,791 | |
| | | | | | | | |
| | | | | | | 28,915,906 | |
| | | | | | | | |
Total Common Stocks
(Cost $516,121,001) | | | | | | | 582,962,626 | |
| | | | | | | | |
| | | | | | | | |
| | | Principal
Amount | | | Value | |
| | | | | | | | |
| Short-Term Investment 1.4% | |
Repurchase Agreement 1.4% | |
State Street Bank and Trust Co.
0.00%, dated 12/31/13
due 1/2/14
Proceeds at Maturity $8,162,109 (Collateralized by a Federal Home Loan Mortgage Corp. security with a rate of 1.96% and a maturity date of 11/7/22, with a Principal Amount of $9,320,000 and a Market Value of $8,327,103) | | $ | 8,162,109 | | | $ | 8,162,109 | |
| | | | | | | | |
Total Short-Term Investment
(Cost $8,162,109) | | | | | | | 8,162,109 | |
| | | | | | | | |
Total Investments
(Cost $524,283,110) (b) | | | 100.8 | % | | | 591,124,735 | |
Other Assets, Less Liabilities | | | (0.8 | ) | | | (4,432,250 | ) |
Net Assets | | | 100.0 | % | | $ | 586,692,485 | |
| (a) | Non-income producing security. |
| (b) | As of December 31, 2013, cost is $524,862,701 for federal income tax purposes and net unrealized appreciation is as follows: |
| | | | |
Gross unrealized appreciation | | $ | 80,744,470 | |
Gross unrealized depreciation | | | (14,482,436 | ) |
| | | | |
Net unrealized appreciation | | $ | 66,262,034 | |
| | | | |
The following abbreviation is used in the above portfolio:
ADR—American Depositary Receipt
The following is a summary of the fair valuations according to the inputs used as of December 31, 2013, for valuing the Portfolio’s assets.
Asset Valuation Inputs
| | | | | | | | | | | | | | | | |
Description | | Quoted Prices
in Active Markets
for Identical Assets (Level 1) | | | Significant Other
Observable Inputs (Level 2) | | | Significant
Unobservable
Inputs (Level 3) | | | Total | |
| Investments in Securities (a) | | | | | | | | | | | | | | | | |
| Common Stocks | | $ | 582,962,626 | | | $ | — | | | $ | — | | | $ | 582,962,626 | |
| Short-Term Investment | | | | | | | | | | | | | | | | |
Repurchase Agreement | | | — | | | | 8,162,109 | | | | — | | | | 8,162,109 | |
| | | | | | | | | | | | | | | | |
| Total Investments in Securities | | $ | 582,962,626 | | | $ | 8,162,109 | | | $ | — | | | $ | 591,124,735 | |
| | | | | | | | | | | | | | | | |
| (a) | For a complete listing of investments and their industries, see the Portfolio of Investments. |
The Portfolio recognizes transfers between the levels as of the beginning of the period.
For the year ended December 31, 2013, the Portfolio did not have any transfers between Level 1 and Level 2 fair value measurements. (See Note 2)
As of December 31, 2013, the Portfolio did not hold any investments with significant unobservable inputs (Level 3). (See Note 2)
| | | | |
| M-108 | | MainStay VP Cornerstone Growth Portfolio | | The notes to the financial statements are an integral part of,
and should be read in conjunction with, the financial statements. |
Statement of Assets and Liabilities as of December 31, 2013
| | | | |
| Assets | |
Investment in securities, at value
(identified cost $524,283,110) | | $ | 591,124,735 | |
Receivables: | | | | |
Investment securities sold | | | 3,731,044 | |
Dividends and interest | | | 1,060,506 | |
Fund shares sold | | | 129,402 | |
| | | | |
Total assets | | | 596,045,687 | |
| | | | |
| |
| Liabilities | | | | |
Payables: | | | | |
Investment securities purchased | | | 8,456,605 | |
Fund shares redeemed | | | 476,196 | |
Manager (See Note 3) | | | 338,864 | |
Professional fees | | | 33,149 | |
Shareholder communication | | | 30,028 | |
NYLIFE Distributors (See Note 3) | | | 13,113 | |
Custodian | | | 1,747 | |
Trustees | | | 549 | |
Accrued expenses | | | 2,951 | |
| | | | |
Total liabilities | | | 9,353,202 | |
| | | | |
Net assets | | $ | 586,692,485 | |
| | | | |
| |
| Net Assets Consist of | | | | |
Shares of beneficial interest outstanding (par value of $.001 per share) unlimited number of shares authorized | | $ | 17,168 | |
Additional paid-in capital | | | 424,628,136 | |
| | | | |
| | | 424,645,304 | |
Undistributed net investment income | | | 2,773,558 | |
Accumulated net realized gain (loss) on investments and futures transactions | | | 92,431,998 | |
Net unrealized appreciation (depreciation) on investments | | | 66,841,625 | |
| | | | |
Net assets | | $ | 586,692,485 | |
| | | | |
| | | | |
Initial Class | | | | |
Net assets applicable to outstanding shares | | $ | 522,794,890 | |
| | | | |
Shares of beneficial interest outstanding | | | 15,290,037 | |
| | | | |
Net asset value per share outstanding | | $ | 34.19 | |
| | | | |
Service Class | | | | |
Net assets applicable to outstanding shares | | $ | 63,897,595 | |
| | | | |
Shares of beneficial interest outstanding | | | 1,877,821 | |
| | | | |
Net asset value per share outstanding | | $ | 34.03 | |
| | | | |
| | | | | | |
The notes to the financial statements are an integral part of,
and should be read in conjunction with, the financial statements. | | mainstayinvestments.com | | | M-109 | |
Statement of Operations for the year ended December 31, 2013
| | | | |
| Investment Income (Loss) | |
Income | | | | |
Dividends (a) | | $ | 6,631,434 | |
Interest | | | 843 | |
| | | | |
Total income | | | 6,632,277 | |
| | | | |
Expenses | | | | |
Manager (See Note 3) | | | 3,392,000 | |
Distribution and service—Service Class (See Note 3) | | | 144,654 | |
Shareholder communication | | | 81,169 | |
Professional fees | | | 62,011 | |
Trustees | | | 9,902 | |
Custodian | | | 9,388 | |
Miscellaneous | | | 15,854 | |
| | | | |
Total expenses | | | 3,714,978 | |
| | | | |
Net investment income (loss) | | | 2,917,299 | |
| | | | |
|
| Realized and Unrealized Gain (Loss) on Investments and Futures Contracts | |
Net realized gain (loss) on: | | | | |
Security transactions | | | 123,717,134 | |
Futures transactions | | | 130,859 | |
| | | | |
Net realized gain (loss) on investments and futures transactions | | | 123,847,993 | |
| | | | |
Net change in unrealized appreciation (depreciation) on: | | | | |
Investments | | | (13,472,863 | ) |
Futures contracts | | | 56,918 | |
| | | | |
Net change in unrealized appreciation (depreciation) on investments and futures contracts | | | (13,415,945 | ) |
| | | | |
Net realized and unrealized gain (loss) on investments and futures transactions | | | 110,432,048 | |
| | | | |
Net increase (decrease) in net assets resulting from operations | | $ | 113,349,347 | |
| | | | |
| (a) | Dividends recorded net of foreign withholding taxes in the amount of $32,263. |
| | | | |
| M-110 | | MainStay VP Cornerstone Growth Portfolio | | The notes to the financial statements are an integral part of,
and should be read in conjunction with, the financial statements. |
Statements of Changes in Net Assets
for the years ended December 31, 2013 and December 31, 2012
| | | | | | | | |
| | | 2013 | | | 2012 | |
| Increase (Decrease) in Net Assets | |
Operations: | | | | | | | | |
Net investment income (loss) | | $ | 2,917,299 | | | $ | 4,381,181 | |
Net realized gain (loss) on investments, futures transactions and foreign currency transactions | | | 123,847,993 | | | | 16,977,415 | |
Net change in unrealized appreciation (depreciation) on investments and futures contracts | | | (13,415,945 | ) | | | 37,995,574 | |
| | | | |
Net increase (decrease) in net assets resulting from operations | | | 113,349,347 | | | | 59,354,170 | |
| | | | |
Dividends to shareholders: | | | | | | | | |
From net investment income: | | | | | | | | |
Initial Class | | | (3,996,351 | ) | | | (1,542,898 | ) |
Service Class | | | (354,061 | ) | | | (100,260 | ) |
| | | | |
Total dividends to shareholders | | | (4,350,412 | ) | | | (1,643,158 | ) |
| | | | |
Capital share transactions: | | | | | | | | |
Net proceeds from sale of shares | | | 119,332,189 | | | | 16,008,453 | |
Net asset value of shares issued to shareholders in reinvestment of dividends | | | 4,350,412 | | | | 1,643,158 | |
Cost of shares redeemed | | | (67,800,003 | ) | | | (59,264,572 | ) |
| | | | |
Increase (decrease) in net assets derived from capital share transactions | | | 55,882,598 | | | | (41,612,961 | ) |
| | | | |
Net increase (decrease) in net assets | | | 164,881,533 | | | | 16,098,051 | |
| | |
| Net Assets | | | | | | | | |
Beginning of year | | | 421,810,952 | | | | 405,712,901 | |
| | | | |
End of year | | $ | 586,692,485 | | | $ | 421,810,952 | |
| | | | |
Undistributed net investment income at end of year | | $ | 2,773,558 | | | $ | 4,350,401 | |
| | | | |
| | | | | | |
The notes to the financial statements are an integral part of,
and should be read in conjunction with, the financial statements. | | mainstayinvestments.com | | | M-111 | |
Financial Highlights selected per share data and ratios
| | | | | | | | | | | | | | | | | | | | |
| | | Initial Class | |
| | | Year ended December 31, | |
| | | 2013 | | | 2012 | | | 2011 | | | 2010 | | | 2009 | |
Net asset value at beginning of year | | $ | 27.64 | | | $ | 24.14 | | | $ | 24.62 | | | $ | 22.04 | | | $ | 16.52 | |
| | | | | | | | | | | | | | | | | | | | |
Net investment income (loss) | | | 0.19 | (a) | | | 0.31 | | | | 0.12 | | | | 0.13 | | | | 0.12 | |
Net realized and unrealized gain (loss) on investments | | | 6.62 | | | | 3.30 | | | | (0.48 | ) | | | 2.57 | | | | 5.51 | |
| | | | | | | | | | | | | | | | | | | | |
Total from investment operations | | | 6.81 | | | | 3.61 | | | | (0.36 | ) | | | 2.70 | | | | 5.63 | |
| | | | | | | | | | | | | | | | | | | | |
Less dividends: | | | | | | | | | | | | | | | | | | | | |
From net investment income | | | (0.26 | ) | | | (0.11 | ) | | | (0.12 | ) | | | (0.12 | ) | | | (0.11 | ) |
| | | | | | | | | | | | | | | | | | | | |
Net asset value at end of year | | $ | 34.19 | | | $ | 27.64 | | | $ | 24.14 | | | $ | 24.62 | | | $ | 22.04 | |
| | | | | | | | | | | | | | | | | | | | |
Total investment return | | | 24.71 | % | | | 14.94 | % | | | (1.37 | %) | | | 12.21 | % | | | 34.18 | % |
Ratios (to average net assets)/Supplemental Data: | | | | | | | | | | | | | | | | | | | | |
Net investment income (loss) | | | 0.61 | % | | | 1.04 | % | | | 0.40 | % | | | 0.48 | % | | | 0.57 | % |
Net expenses | | | 0.71 | % | | | 0.65 | % | | | 0.66 | % | | | 0.65 | % | | | 0.68 | % |
Portfolio turnover rate | | | 164 | % | | | 42 | % | | | 97 | % | | | 126 | % | | | 157 | % |
Net assets at end of year (in 000’s) | | $ | 522,795 | | | $ | 368,442 | | | $ | 361,067 | | | $ | 417,194 | | | $ | 423,086 | |
| (a) | Per share data based on average shares outstanding during the year. |
| | | | | | | | | | | | | | | | | | | | |
| | | Service Class | |
| | | Year ended December 31, | |
| | | 2013 | | | 2012 | | | 2011 | | | 2010 | | | 2009 | |
Net asset value at beginning of year | | $ | 27.52 | | | $ | 24.04 | | | $ | 24.52 | | | $ | 21.96 | | | $ | 16.45 | |
| | | | | | | | | | | | | | | | | | | | |
Net investment income (loss) | | | 0.11 | (a) | | | 0.22 | | | | 0.04 | | | | 0.05 | | | | 0.05 | |
Net realized and unrealized gain (loss) on investments | | | 6.59 | | | | 3.31 | | | | (0.46 | ) | | | 2.58 | | | | 5.51 | |
| | | | | | | | | | | | | | | | | | | | |
Total from investment operations | | | 6.70 | | | | 3.53 | | | | (0.42 | ) | | | 2.63 | | | | 5.56 | |
| | | | | | | | | | | | | | | | | | | | |
Less dividends: | | | | | | | | | | | | | | | | | | | | |
From net investment income | | | (0.19 | ) | | | (0.05 | ) | | | (0.06 | ) | | | (0.07 | ) | | | (0.05 | ) |
| | | | | | | | | | | | | | | | | | | | |
Net asset value at end of year | | $ | 34.03 | | | $ | 27.52 | | | $ | 24.04 | | | $ | 24.52 | | | $ | 21.96 | |
| | | | | | | | | | | | | | | | | | | | |
Total investment return | | | 24.40 | % | | | 14.66 | % | | | (1.62 | %) | | | 11.93 | % | | | 33.85 | % |
Ratios (to average net assets)/Supplemental Data: | | | | | | | | | | | | | | | | | | | | |
Net investment income (loss) | | | 0.36 | % | | | 0.82 | % | | | 0.15 | % | | | 0.23 | % | | | 0.32 | % |
Net expenses | | | 0.96 | % | | | 0.90 | % | | | 0.91 | % | | | 0.90 | % | | | 0.93 | % |
Portfolio turnover rate | | | 164 | % | | | 42 | % | | | 97 | % | | | 126 | % | | | 157 | % |
Net assets at end of year (in 000’s) | | $ | 63,898 | | | $ | 53,369 | | | $ | 44,646 | | | $ | 48,698 | | | $ | 44,427 | |
| (a) | Per share data based on average shares outstanding during the year. |
| | | | |
| M-112 | | MainStay VP Cornerstone Growth Portfolio | | The notes to the financial statements are an integral part of,
and should be read in conjunction with, the financial statements. |
MainStay VP DFA / DuPont Capital Emerging Markets Equity Portfolio
Investment and Performance Comparison (Unaudited)
Performance data quoted represents past performance. Past performance is no guarantee of future results. Because of market volatility, current performance may be lower or higher than the figures shown. Investment return and principal value will fluctuate, and as a result, when shares are redeemed, they may be worth more or less than their original cost. The performance table and graph do not reflect any deduction of sales charges, mortality and expense charges, contract charges or administrative charges. Please refer to the Performance Summary appropriate for your policy. For performance information current to the most recent month-end, please call 800-598-2019 or visit www.newyorklife.com.
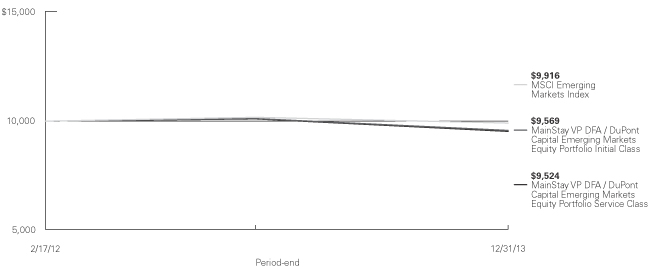
Average Annual Total Returns for the Period Ended December 31, 2013
| | | | | | | | | | | | |
| Class | | One Year | | | Since Inception (2/17/12) | | | Gross Expense Ratio1 | |
| Initial Class Shares | | | –5.43 | % | | | –2.33 | % | | | 1.43 | % |
| Service Class Shares | | | –5.67 | | | | –2.57 | | | | 1.68 | |
| | | | | | | | |
| Benchmark Performance | | One Year | | | Since Inception
(2/17/12) | |
MSCI Emerging Markets Index2 | | | –2.60 | % | | | –0.45 | % |
Average Lipper Variable Products Emerging Markets Portfolio3 | | | 0.17 | | | | 2.22 | |
| 1. | The gross expense ratios presented reflect the Portfolio’s “Total Annual Portfolio Operating Expenses” from the most recent Prospectus and may differ from other expense ratios disclosed in this report. |
| 2. | Please refer to pages M-2 and M-3 for additional explanations and disclosure regarding the Portfolios, their benchmark indices and other indices mentioned in the reports. |
| 3. | The Average Lipper Variable Products Emerging Markets Portfolio is representative of portfolios that, by portfolio |
| | practice, seek long-term capital appreciation by investing primarily in emerging market equity securities, where “emerging market” is defined by a country’s per-capita GNP or other economic measures. Lipper Inc. is an independent monitor of fund performance. Results are based on total returns with all dividend and capital gain distributions reinvested. |
| | | | |
| mainstayinvestments.com | | | M-113 | |
Cost in Dollars of a $1,000 Investment in MainStay VP DFA / DuPont Capital Emerging Markets Equity Portfolio (Unaudited)
The example below is intended to describe the fees and expenses borne by shareholders during the period from July 1, 2013, to December 31, 2013, and the impact of those costs on your investment.
Example
As a shareholder of the Portfolio, you incur two types of costs: (1) transaction costs, including exchange fees and sales charges (loads) on purchases (as applicable), and (2) ongoing costs, including management fees, distribution and/or service (12b-1) fees, and other Portfolio expenses (as applicable). This example is intended to help you understand your ongoing costs (in dollars) of investing in the Portfolio and to compare these costs with the ongoing costs of investing in other Portfolios. The example is based on an investment of $1,000 made at the beginning of the six-month period and held for the entire period from July 1, 2013, to December 31, 2013. Shares are only sold in connection with variable life and annuity contracts and the example does not reflect any contract level or transactional fees or expenses. If these costs had been included, your costs would have been higher.
This example illustrates your Portfolio’s ongoing costs in two ways:
Actual Expenses
The second and third data columns in the table below provide information about actual account values and actual expenses. You may use the information in these columns, together with the amount you invested, to estimate the expenses that you paid during the six months ended
December 31, 2013. Simply divide your account value by $1,000 (for example, an $8,600 account value divided by $1,000 = 8.6), then multiply the result by the number under the heading entitled ‘‘Expenses Paid During Period’’ to estimate the expenses you paid on your account during this period.
Hypothetical Example for Comparison Purposes
The fourth and fifth data columns in the table below provide information about hypothetical account values and hypothetical expenses based on the Portfolio’s actual expense ratio and an assumed rate of return of 5% per year before expenses, which is not the Portfolio’s actual return. The hypothetical account values and expenses may not be used to estimate the actual ending account balances or expenses you paid for the six-month period shown. You may use this information to compare the ongoing costs of investing in the Portfolio with the ongoing costs of investing in other Portfolios. To do so, compare this 5% hypothetical example with the 5% hypothetical examples that appear in the shareholder reports of the other Portfolios.
Please note that the expenses shown in the table are meant to highlight your ongoing costs only and do not reflect any transactional costs, such as exchange fees or sales charges (loads). Therefore, the fourth and fifth data columns of the table are useful in comparing ongoing costs only and will not help you determine the relative total costs of owning different funds. In addition, if these transactional costs were included, your costs would have been higher.
| | | | | | | | | | | | | | | | | | | | |
| | | | | | | | | | | | | | | | |
| Share Class | | Beginning
Account
Value
7/1/13 | | | Ending Account
Value (Based
on Actual
Returns and
Expenses)
12/31/13 | | | Expenses
Paid
During
Period1 | | | Ending Account
Value (Based
on Hypothetical
5% Annualized
Return and
Actual Expenses)
12/31/13 | | | Expenses
Paid
During
Period1 | |
| | | | | |
| Initial Class Shares | | $ | 1,000.00 | | | $ | 1,092.30 | | | $ | 7.01 | | | $ | 1,018.50 | | | $ | 6.77 | |
| | | | | |
| Service Class Shares | | $ | 1,000.00 | | | $ | 1,090.90 | | | $ | 8.33 | | | $ | 1,017.20 | | | $ | 8.03 | |
| 1. | Expenses are equal to the Portfolio’s annualized expense ratio of each class (1.33% for Initial Class and 1.58% for Service Class) multiplied by the average account value over the period, divided by 365 and multiplied by 184 (to reflect the six-month period). The table above represents the actual expenses incurred during the six-month period. |
| | |
| M-114 | | MainStay VP DFA / DuPont Capital Emerging Markets Equity Portfolio |
Country Composition as of December 31, 2013 (Unaudited)
| | | | |
| Republic of Korea | | | 22.1 | % |
| China | | | 15.3 | |
| Mexico | | | 7.7 | |
| Taiwan | | | 7.7 | |
| Brazil | | | 7.5 | |
| South Africa | | | 6.8 | |
| Russia | | | 6.6 | |
| Poland | | | 4.8 | |
| Indonesia | | | 4.7 | |
| Thailand | | | 3.0 | |
| India | | | 2.7 | |
| Malaysia | | | 2.7 | |
| | | | |
| Czech Republic | | | 2.1 | % |
| United States | | | 1.9 | |
| Colombia | | | 1.3 | |
| Chile | | | 0.8 | |
| Turkey | | | 0.7 | |
| Peru | | | 0.5 | |
| Panama | | | 0.4 | |
| Jordan | | | 0.3 | |
| Hungary | | | 0.2 | |
| Philippines | | | 0.2 | |
| Other Assets, Less Liabilities | | | –0.0 | ‡ |
| | | | |
| | | 100.0 | % |
| | | | |
See Portfolio of Investments beginning on page M-120 for specific holdings within these categories.
| ‡ | Less than one-tenth of a percent. |
Top Ten Holdings as of December 31, 2013 (excluding short-term investment) (Unaudited)
| 1. | Shinhan Financial Group Co., Ltd. |
| 2. | America Movil S.A.B. de C.V. Series L |
| 5. | Hyundai Heavy Industries Co., Ltd. |
| 6. | Ternium S.A., Sponsored ADR |
| 8. | Gazprom OAO, Sponsored ADR |
| 9. | Novolipetsk Steel OJSC, GDR |
| | | | |
| mainstayinvestments.com | | | M-115 | |
Portfolio Management Discussion and Analysis (Unaudited)
Answers to the questions reflect the views of portfolio managers Karen Umland, CFA, Joseph H. Chi, CFA, Jed S. Fogdall and Henry F. Gray of Dimensional Fund Advisors LP (“DFA”), which is a Subadvisor of the Portfolio, and portfolio manager Rafi U. Zaman, CFA, of DuPont Capital Management Corporation (“DuPont Capital”), which is a Subadvisor of the Portfolio.
How did MainStay VP DFA / DuPont Capital Emerging Markets Equity Portfolio perform relative to its benchmark and peers during the 12 months ended December 31, 2013?
For the 12 months ended December 31, 2013, MainStay VP DFA / DuPont Capital Emerging Markets Equity Portfolio returned –5.43% for Initial Class shares and –5.67% for Service Class shares. Over the same period, both share classes underperformed the –2.60% return of the MSCI Emerging Markets Index,1 which is the Portfolio’s broad-based securities-market index. Both share classes also underperformed the 0.17% return of the average Lipper1 Variable Products Emerging Markets Portfolio for the 12 months ended December 31, 2013.
What factors affected the Portfolio’s relative performance during the reporting period?
DFA
Our portion of the Portfolio is designed to capture the returns of emerging-market value stocks across the market-capitalization spectrum. During the reporting period, value stocks performed poorly compared to growth stocks. For this reason, the positioning of our portion of the Portfolio detracted from performance relative to the style-neutral MSCI Emerging Markets Index. The effect was partially offset by the relatively good performance of small-cap stocks in emerging markets. Because our portion of the Portfolio has exposure across a broader spectrum of market capitalizations, it enjoyed greater exposure to relatively smaller-capitalization stocks than the MSCI Emerging Markets Index, which is concentrated in large- to mid-cap stocks.
DuPont Capital
In the first half of 2013, sector allocation had a negative impact on relative performance in our portion of the Portfolio. We increased exposure to economically sensitive areas of the market during the first half and decreased exposure to defensive areas (those that are less economically sensitive). The shift occurred as we found more attractive investment opportunities in sectors such as materials and consumer discretionary. This positioning detracted from performance during the first several months of the year, when economically sensitive stocks tended to underperform. During this portion of the reporting period, investors sought
yield and stability in parts of the market that are considered to be more defensive.
The relative performance of our portion of the Portfolio improved from mid-May to the end of the third quarter. The Portfolio had been underweight financials in countries that were relying on inexpensive U.S. dollar funding to support their growth. When the U.S. Federal Reserve signaled its intention to begin reducing monetary stimulus, financial stocks in these countries sold off sharply, and the underweight exposure benefited relative performance. Late in the third quarter, however, global economic growth prospects began to show signs of improvement. Improving growth in China, Europe and the United States helped cyclical shares outperform relative to defensive areas of the market. This shift had a positive effect on relative performance in our portion of the Portfolio because of an overweight position in sectors that are more cyclical. Positive economic indicators in developed Europe helped shares in Eastern Europe outperform. Our portion of the Portfolio was overweight the Eastern European region, which helped relative performance.
Which sectors were the strongest positive contributors to the Portfolio’s relative performance, and which sectors were particularly weak?
DFA
In our portion of the Portfolio, the sectors that made the strongest positive contributions to performance relative to the MSCI Emerging Markets Index were financials, materials and industrials. (Contributions take weightings and total returns into account.) Financials and industrials held in our portion of the Portfolio outperformed the Index, and our portion of the Portfolio held overweight positions relative to the Index in these sectors. In materials, which had negative total returns, individual holdings in our portion of the Portfolio outperformed sector-related positions in the Index. These holdings were the primary source of the positive contribution rather than the Portfolio’s relative sector weighting.
The weakest-contributing sectors in our portion of the Portfolio were information technology, energy and consumer discretionary. The information technology sector significantly outperformed the Index, but our portion of the Portfolio held an underweight position in the sector. In our portion of the Portfolio, the
| 1. | Please refer to pages M-2 and M-3 for additional explanations and disclosure regarding the Portfolios, their benchmark indices and service providers mentioned in the reports. |
| | |
| M-116 | | MainStay VP DFA / DuPont Capital Emerging Markets Equity Portfolio |
energy sector provided a negative absolute return and underperformed the Index strongly. An overweight position in the sector detracted from relative performance. In the consumer discretionary sector, holdings in our portion of the Portfolio underperformed sector-related positions in the Index, which detracted from relative performance.
In our portion of the Portfolio, the level of exposure to individual sectors relative to the Index is generally a result of our Portfolio construction processes and should not be interpreted as tactical sector allocation decisions.
Dupont Capital
In our portion of the Portfolio, the most substantial sector contributions to performance relative to the MSCI Emerging Market Index came from financials, industrials and consumer discretionary. Favorable stock selection in the financials sector contributed positively to the Portfolio’s relative performance. Our portion of the Portfolio held an underweight position in financials in countries with high external funding needs. Financial stocks in these countries underperformed sharply when the U.S. Federal Reserve began to signal a reduction in monetary stimulus. Our portion of the Portfolio also benefited from positions in Eastern European bank stocks that performed well. An overweight position in the consumer discretionary sector also helped performance relative to the Index, as this sector was one of the few that had a positive return for the year. Favorable stock selection within the industrials sector also had a positive impact on relative performance.
In our portion of the Portfolio, technology, energy and utilities were the weakest-contributing sectors relative to the MSCI Emerging Markets Index. Stock selection and an underweight position in the technology sector detracted from performance. The energy sector was hurt by an overweight position in companies involved in coal mining, which fell as a result of weak coal prices. Stock selection in the utilities sector also took a toll on relative performance in our portion of the Portfolio.
During the reporting period, which individual stocks made the strongest positive contributions to the Portfolio’s absolute performance and which stocks detracted the most?
DFA
In our portion of the Portfolio, the strongest positive contributors to absolute performance during the
reporting period were Taiwan chip manufacturer Inotera Memories, Korean financial holding company Shinhan Financial Group and Mexico-based cement company Cemex S.A.B. de C.V.
The greatest detractors from absolute performance in our portion of the Portfolio were Brazilian oil company Petroleo Brasileiro S.A., South African gold producer Gold Fields Ltd. and Russian gas producer Gazprom OAO.
Our strategy is designed and managed to capture the returns and diversification benefits of a broad cross-section of deep-value securities across the market-capitalization spectrum in emerging-market countries. Recent absolute performance and contribution to Portfolio returns generally do not affect our view of any particular holding, unless a security’s price movement has changed its designation as a value security. As a result, no action would generally be taken on this basis. However, associated price momentum may affect the timing of sales or purchases of a particular security.
DuPont Capital
In our portion of the Portfolio, strong performers included Mexico-based steel manufacturer Ternium, Korean financial services firm Shinhan Financial Group and Panama-based airline Copa Holdings. Ternium shares rose with improving steel prices in Brazil and Mexico. Stable earnings and credit quality helped lift the shares of Shinhan Financial Group. Shares of Copa Holdings advanced along with strong growth in the number of passengers the airline serviced. The Portfolio reduced each of these positions over the course of the year as other investment opportunities became more attractive.
Among the stocks that detracted from absolute performance in our portion of the Portfolio were South African gold miner AngloGold Ashanti, Chinese coal miner Yanzhou Coal Mining and touch-screen manufacturer TPK Holdings. Shares of AngloGold Ashanti and Yanzhou Coal Mining fell with the drop in gold prices and, in the case of AngloGold Ashanti, an increase in labor costs. Weak orders and increased competition hurt the shares of TPK holdings. With the exception of Yanzhou Coal, we maintained positions in these detractors.
| | | | |
| mainstayinvestments.com | | | M-117 | |
Did the Portfolio make any significant purchases or sales during the reporting period?
DFA
Security weights in our portion of the Portfolio generally do not change significantly from month to month. This is a result of our long-term investment approach and the large number of securities held. Changes typically occur because of new securities coming into the buy range, securities moving into the sell range, and fluctuations in market performance. Security weightings in the Portfolio could also be affected to the extent that a company’s market cap or price-to-book characteristics change.
In 2013, our portion of the Portfolio purchased a number of names that moved into the value range. These names include Korean ship builder Hyundai Heavy Industries, which rose to a 0.4% weight by the end of the reporting period. We also initiated a position in Indonesian bank Bank Mandiri Persero, which represented 0.3% of our portion of the Portfolio as of December 31, 2013. These two names were among the largest new positions in our portion of the Portfolio.
When stocks migrate into the growth range, we will be inclined to sell positions from our portion of the Portfolio. In 2013, our position in Mexico-based industrial conglomerate ALFA S.A.B. was sold down entirely from its starting weight of 1.0% of net assets in our portion of the Portfolio. Our position in Brazilian paper pulp manufacturer Fibria Celulose was reduced from a weight of 0.9% at the beginning of the reporting period, to a weight of 0.5% at year-end.
Dupont Capital
Among the large purchases in our portion of the Portfolio were South Korean automotive manufacturer Hyundai Motor and Russian steel producer Novolipetsk Steel. Hyundai Motor is a well-run company with a very strong financial position. The company has made great strides in improving its global product portfolio. The shares came under pressure as the Japanese yen weakened relative to the Korean won, which created a buying opportunity for the Portfolio. The Portfolio increased its position in the shares of Novolipetsk Steel as its shares came under pressure because of global growth concerns.
Among the largest sales in our portion of the Portfolio were Russian energy company Gazprom OAO and Chilean beverage company Compania Cervecerias Unidas. We reduced our position in Gazprom OAO, as
high capital expenditures have increased the risk that future returns on capital may not be attractive. The position in Compania Cervecerias Unidas was sold during the second half of 2013 because of concerns about capital allocation plans and a decision to issue equity to fund acquisitions.
How did the Portfolio’s sector weightings change during the reporting period?
DFA
In our portion of the Portfolio, weightings relative to the MSCI Emerging Markets Index are a residual of a construction process that targets value stocks. With the exception of excluding REITs and certain highly regulated utilities, we generally do not make an active decision to time or weight sectors or industries.
At the beginning of the reporting period, our portion of the Portfolio held overweight positions relative to the MSCI Emerging Markets Index in materials, financials and industrials, and underweight positions in information technology, telecommunication services and consumer staples. During the reporting period, we increased holdings relative to the Index in energy, financials and materials, while we decreased holdings in the information technology, consumer discretionary and health care sectors.
Dupont Capital
Our portion of the Portfolio decreased its weighting in energy, moving from an overweight position relative to the MSCI Emerging Markets Index to a position that was neutral to the benchmark. The decrease in weight was due primarily to reducing positions in Gazprom OAO as well as China Petroleum and Chemical. An underweight position in consumer staples became more substantially underweight as this sector of the market has become unattractively valued relative to more economically sensitive areas.
Our portion of the Portfolio increased its weighting in materials, moving from neutral to an overweight position relative to the MSCI Emerging Markets Index. Shares in the materials sector came under pressure during the year because of concerns about global growth, particularly in China. With the decline in shares, we were able to find a number of investment opportunities that in our opinion were more attractive. Our portion of the Portfolio also increased its overweight position in the consumer discretionary sector during 2013. The increase was driven by
| | |
| M-118 | | MainStay VP DFA / DuPont Capital Emerging Markets Equity Portfolio |
purchases of auto-related shares in Korea and China that became attractively valued.
How was the Portfolio positioned at the end of the reporting period?
DFA
As of December 31, 2013, our portion of the Portfolio held its most substantially overweight positions relative to the MSCI Emerging Markets Index in energy, financials and materials, with Portfolio weights being greater by at least five percentage points in each instance. As of the same date, the most substantially underweight sectors in our portion of the Portfolio were information technology, telecommunication services and consumer staples, with Portfolio weights being smaller by at least four percentage points in each instance.
DuPont Capital
As of December 31, 2013, our portion of the Portfolio held overweight positions relative to the MSCI
Emerging Markets Index in the materials, consumer discretionary and industrial sectors. We were overweight economically sensitive areas of the market because we believed those areas presented the most attractive investment opportunities.
As of the same date, our portion of the Portfolio held underweight positions in the consumer staples sector and among large-cap information technology companies. In our opinion, these market segments, which are less economically sensitive, are not attractively valued relative to the broader market. Our portion of the Portfolio is also underweight the financials sector, which we believe is not priced attractively relative to other opportunities, particularly in certain areas of emerging markets such as China and Brazil.
The opinions expressed are those of the portfolio managers as of the date of this report and are subject to change. There is no guarantee that any forecasts will come to pass. This material does not constitute investment advice and is not intended as an endorsement of any specific investment.
Not all MainStay VP Portfolios and/or share classes are available under all policies.
| | | | |
| mainstayinvestments.com | | | M-119 | |
Portfolio of Investments December 31, 2013
| | | | | | | | |
| | | Shares | | | Value | |
| Common Stocks 94.2%† | | | | | | | | |
Brazil 4.7% | | | | | | | | |
Banco do Brasil S.A. (Commercial Banks) | | | 60,288 | | | $ | 623,515 | |
Banco Santander Brasil S.A., ADR (Commercial Banks) | | | 107,652 | | | | 656,677 | |
Bematech S.A. (Computers & Peripherals) | | | 7,200 | | | | 28,107 | |
BR Properties S.A. (Real Estate Management & Development) | | | 346,600 | | | | 2,732,546 | |
BrasilAgro—Companhia Brasileira de Propriedades Agricolas (Food Products) | | | 12,600 | | | | 50,469 | |
Brookfield Incorporacoes S.A. (Household Durables) (a) | | | 58,216 | | | | 28,377 | |
Cia Providencia Industria e Comercio S.A. (Textiles, Apparel & Luxury Goods) | | | 14,400 | | | | 48,158 | |
Embraer S.A. (Aerospace & Defense) | | | 621,720 | | | | 4,977,976 | |
Even Construtora e Incorporadora S.A. (Household Durables) | | | 370,700 | | | | 1,280,579 | |
Fibria Celulose S.A., Sponsored ADR (Paper & Forest Products) (a) | | | 36,576 | | | | 427,208 | |
Gafisa S.A., ADR (Household Durables) | | | 43,491 | | | | 136,127 | |
Gerdau S.A. (Metals & Mining) | | | 17,100 | | | | 109,373 | |
Gerdau S.A., Sponsored ADR (Metals & Mining) | | | 48,512 | | | | 380,334 | |
Industrias Romi S.A. (Machinery) (a) | | | 3,600 | | | | 9,079 | |
JBS S.A. (Food Products) | | | 105,500 | | | | 392,173 | |
Kepler Weber S.A. (Machinery) | | | 3,300 | | | | 57,349 | |
Log-in Logistica Intermodal S.A. (Marine) (a) | | | 1,900 | | | | 6,604 | |
Magnesita Refratarios S.A. (Construction Materials) | | | 29,271 | | | | 73,201 | |
Marfrig Alimentos S.A. (Food Products) (a) | | | 53,600 | | | | 90,876 | |
MMX Mineracao e Metalicos S.A. (Metals & Mining) (a) | | | 15,588 | | | | 4,625 | |
MRV Engenharia e Participacoes S.A. (Household Durables) | | | 5,400 | | | | 19,295 | |
Paranapanema S.A. (Metals & Mining) (a) | | | 40,300 | | | | 88,996 | |
PDG Realty S.A. Empreendimentos e Participacoes (Household Durables) (a) | | | 180,340 | | | | 138,356 | |
Petroleo Brasileiro S.A. (Oil, Gas & Consumable Fuels) | | | 18,407 | | | | 124,755 | |
Petroleo Brasileiro S.A., ADR (Oil, Gas & Consumable Fuels) | | | 108,074 | | | | 1,489,260 | |
Petroleo Brasileiro S.A., Sponsored ADR (Oil, Gas & Consumable Fuels) | | | 179,729 | | | | 2,640,219 | |
Positivo Informatica S.A. (Computers & Peripherals) | | | 9,900 | | | | 12,043 | |
Profarma Distribuidora de Produtos Farmaceuticos S.A. (Health Care Providers & Services) | | | 100 | | | | 790 | |
| | | | | | | | |
| | | Shares | | | Value | |
Brazil (continued) | | | | | | | | |
Rodobens Negocios Imobiliarios S.A. (Household Durables) | | | 2,000 | | | $ | 11,105 | |
Rossi Residencial S.A. (Household Durables) (a) | | | 84,287 | | | | 72,881 | |
SLC Agricola S.A. (Food Products) | | | 12,308 | | | | 106,425 | |
Tecnisa S.A. (Household Durables) (a) | | | 5,700 | | | | 21,648 | |
Tereos Internacional S.A. (Food Products) | | | 16,700 | | | | 17,626 | |
TPI—Triunfo Participacoes e Investimentos S.A. (Transportation Infrastructure) | | | 7,500 | | | | 30,200 | |
Vanguarda Agro S.A. (Food Products) (a) | | | 60,632 | | | | 88,150 | |
| | | | | | | | |
| | | | | | | 16,975,102 | |
| | | | | | | | |
Chile 0.8% | | | | | | | | |
Aguas Andinas S.A. Class A (Water Utilities) | | | 2,335,832 | | | | 1,510,989 | |
Cia General de Electricidad S.A. (Electric Utilities) | | | 9,843 | | | | 53,200 | |
Cia Sud Americana de Vapores S.A. (Marine) (a) | | | 394,861 | | | | 20,666 | |
Corpbanca S.A. (Commercial Banks) | | | 1,873,312 | | | | 25,840 | |
Empresas CMPC S.A. (Paper & Forest Products) | | | 161,200 | | | | 392,715 | |
Empresas Iansa S.A. (Food Products) | | | 96,500 | | | | 3,223 | |
Enersis S.A., Sponsored ADR (Electric Utilities) | | | 51,039 | | | | 765,075 | |
Inversiones Aguas Metropolitanas S.A. (Water Utilities) | | | 26,299 | | | | 44,545 | |
Masisa S.A. (Paper & Forest Products) | | | 430,626 | | | | 28,192 | |
Ripley Corp. S.A. (Multiline Retail) | | | 62,190 | | | | 44,975 | |
Salfacorp S.A. (Construction & Engineering) | | | 9,316 | | | | 8,865 | |
Sociedad Matriz SAAM S.A. (Transportation Infrastructure) | | | 188,394 | | | | 17,031 | |
Socovesa S.A. (Household Durables) | | | 26,762 | | | | 6,570 | |
| | | | | | | | |
| | | | | | | 2,921,886 | |
| | | | | | | | |
China 15.3% | | | | | | | | |
Agile Property Holdings, Ltd. (Real Estate Management & Development) | | | 108,000 | | | | 115,740 | |
Agricultural Bank of China, Ltd. Class H (Commercial Banks) | | | 1,639,000 | | | | 805,307 | |
Air China, Ltd. (Airlines) | | | 54,000 | | | | 40,390 | |
Aluminum Corp. of China, Ltd. (Metals & Mining) (a) | | | 60,000 | | | | 20,814 | |
Aluminum Corp. of China, Ltd., ADR (Metals & Mining) (a) | | | 8,650 | | | | 75,255 | |
AMVIG Holdings, Ltd. (Containers & Packaging) | | | 60,000 | | | | 28,552 | |
Angang Steel Co., Ltd. Class H (Metals & Mining) (a) | | | 112,000 | | | | 83,195 | |
Anhui Conch Cement Co., Ltd. (Construction Materials) | | | 490,500 | | | | 1,818,588 | |
| † | Percentages indicated are based on Portfolio net assets. |
| ¨ | | Among the Portfolio’s 10 largest holdings, as of December 31, 2013, excluding short-term investment. May be subject to change daily. |
| | | | |
| M-120 | | MainStay VP DFA / DuPont Capital Emerging Markets Equity Portfolio | | The notes to the financial statements are an integral part of,
and should be read in conjunction with, the financial statements. |
| | | | | | | | |
| | | Shares | | | Value | |
| Common Stocks (continued) | | | | | | | | |
China (continued) | | | | | | | | |
Asia Cement China Holdings Corp. (Construction Materials) | | | 66,000 | | | $ | 41,621 | |
Asian Citrus Holdings, Ltd. (Food Products) | | | 69,000 | | | | 18,953 | |
Bank of China, Ltd. Class H (Commercial Banks) | | | 4,844,000 | | | | 2,230,128 | |
Bank of Communications Co., Ltd. Class H (Commercial Banks) | | | 664,000 | | | | 467,539 | |
BBMG Corp. Class H (Construction Materials) | | | 42,500 | | | | 36,996 | |
Beijing Capital International Airport Co., Ltd. Class H (Transportation Infrastructure) | | | 106,000 | | | | 83,249 | |
Beijing Capital Land, Ltd. Class H (Real Estate Management & Development) | | | 90,000 | | | | 30,641 | |
BYD Electronic International Co., Ltd. (Communications Equipment) (a) | | | 89,000 | | | | 51,764 | |
C C Land Holdings, Ltd. (Real Estate Management & Development) | | | 187,000 | | | | 47,267 | |
China Aerospace International Holdings, Ltd. (Electronic Equipment, Instruments & Components) | | | 198,000 | | | | 22,215 | |
China Agri-Industries Holdings, Ltd. (Food Products) | | | 165,800 | | | | 82,319 | |
China Aoyuan Property Group, Ltd. (Real Estate Management & Development) | | | 222,000 | | | | 46,666 | |
China Automation Group, Ltd. (Machinery) | | | 110,000 | | | | 24,967 | |
China Citic Bank Corp., Ltd. Class H (Commercial Banks) | | | 632,000 | | | | 342,313 | |
China Coal Energy Co., Ltd. (Oil, Gas & Consumable Fuels) | | | 339,000 | | | | 190,609 | |
China Communications Construction Co., Ltd. Class H (Construction & Engineering) | | | 349,000 | | | | 281,296 | |
China Construction Bank Corp. Class H (Commercial Banks) | | | 2,816,000 | | | | 2,124,447 | |
China Dongxiang Group Co. (Textiles, Apparel & Luxury Goods) | | | 165,000 | | | | 28,088 | |
China Everbright, Ltd. (Capital Markets) | | | 68,000 | | | | 107,687 | |
China Glass Holdings, Ltd. (Building Products) (a) | | | 172,000 | | | | 19,519 | |
China Haidian Holdings, Ltd. (Textiles, Apparel & Luxury Goods) (a) | | | 130,000 | | | | 12,741 | |
China High Speed Transmission Equipment Group Co., Ltd. (Electrical Equipment) (a) | | | 95,000 | | | | 51,578 | |
China Hongqiao Group, Ltd. (Metals & Mining) | | | 104,500 | | | | 71,964 | |
China Huiyuan Juice Group, Ltd. (Food Products) (a) | | | 37,500 | | | | 24,132 | |
China ITS Holdings Co., Ltd. (IT Services) | | | 57,000 | | | | 13,599 | |
China Lumena New Materials Corp. (Chemicals) | | | 260,000 | | | | 50,965 | |
| | | | | | | | |
| | | Shares | | | Value | |
China (continued) | | | | | | | | |
China Merchants Holdings International Co., Ltd. (Transportation Infrastructure) | | | 414,000 | | | $ | 1,510,929 | |
China Metal Recycling Holdings, Ltd. (Metals & Mining) (a)(b)(c) | | | 75,000 | | | | 45,604 | |
¨China Mobile, Ltd. (Wireless Telecommunication Services) | | | 1,103,500 | | | | 11,420,228 | |
China National Building Material Co., Ltd. Class H (Construction Materials) | | | 40,000 | | | | 43,176 | |
China National Materials Co., Ltd. Class H (Machinery) | | | 101,000 | | | | 21,752 | |
China Petroleum & Chemical Corp. Class H (Oil, Gas & Consumable Fuels) | | | 1,942,800 | | | | 1,585,949 | |
China Precious Metal Resources Holdings Co., Ltd. (Metals & Mining) (a) | | | 134,000 | | | | 20,564 | |
China Properties Group, Ltd. (Real Estate Management & Development) (a) | | | 124,000 | | | | 31,662 | |
China Railway Construction Corp., Ltd. Class H (Construction & Engineering) | | | 155,500 | | | | 154,812 | |
China Railway Group, Ltd. Class H (Construction & Engineering) | | | 163,000 | | | | 84,293 | |
China Rare Earth Holdings, Ltd. (Metals & Mining) (a) | | | 130,000 | | | | 18,106 | |
China Rongsheng Heavy Industries Group Holdings, Ltd. (Machinery) (a) | | | 102,000 | | | | 15,916 | |
China SCE Property Holdings, Ltd. (Real Estate Management & Development) | | | 176,400 | | | | 42,085 | |
China Shanshui Cement Group Ltd. (Construction Materials) | | | 48,000 | | | | 20,613 | |
China Shenhua Energy Co., Ltd. Class H (Oil, Gas & Consumable Fuels) | | | 1,803,000 | | | | 5,696,646 | |
China Shipping Container Lines Co., Ltd. Class H (Marine) (a) | | | 364,000 | | | | 94,822 | |
China Shipping Development Co., Ltd. Class H (Marine) (a) | | | 134,000 | | | | 103,684 | |
China South City Holdings, Ltd. (Real Estate Management & Development) | | | 180,000 | | | | 51,068 | |
China Southern Airlines Co., Ltd. Class H (Airlines) | | | 188,000 | | | | 73,461 | |
China Tontine Wines Group, Ltd. (Beverages) (a) | | | 298,000 | | | | 15,372 | |
China Travel International Investment Hong Kong, Ltd. (Hotels, Restaurants & Leisure) | | | 290,000 | | | | 60,960 | |
China Unicom Hong Kong, Ltd., ADR (Diversified Telecommunication Services) | | | 37,272 | | | | 561,316 | |
China Vanadium Titano—Magnetite Mining Co., Ltd. (Metals & Mining) (a) | | | 138,000 | | | | 19,042 | |
China Yurun Food Group, Ltd. (Food Products) (a) | | | 113,000 | | | | 72,426 | |
| | | | | | |
The notes to the financial statements are an integral part of,
and should be read in conjunction with, the financial statements. | | mainstayinvestments.com | | | M-121 | |
Portfolio of Investments December 31, 2013 (continued)
| | | | | | | | |
| | | Shares | | | Value | |
| Common Stocks (continued) | | | | | | | | |
China (continued) | | | | | | | | |
China Zhongwang Holdings, Ltd. (Metals & Mining) (a) | | | 166,000 | | | $ | 51,378 | |
Chongqing Machinery & Electric Co., Ltd. Class H (Industrial Conglomerates) | | | 168,000 | | | | 21,449 | |
Chongqing Rural Commercial Bank Co., Ltd.
Class H (Commercial Banks) | | | 108,000 | | | | 52,090 | |
Citic Pacific, Ltd. (Industrial Conglomerates) | | | 123,000 | | | | 188,125 | |
Citic Resources Holdings, Ltd. (Trading Companies & Distributors) (a) | | | 284,000 | | | | 37,724 | |
Comba Telecom Systems Holdings, Ltd. (Communications Equipment) (a) | | | 79,500 | | | | 27,476 | |
COSCO Pacific, Ltd. (Transportation Infrastructure) | | | 138,584 | | | | 190,157 | |
Dongfeng Motor Group Co., Ltd. Class H (Automobiles) | | | 4,818,000 | | | | 7,505,699 | |
Evergrande Real Estate Group, Ltd. (Real Estate Management & Development) | | | 463,000 | | | | 176,141 | |
Fantasia Holdings Group Co., Ltd. (Real Estate Management & Development) | | | 169,500 | | | | 29,291 | |
Fosun International, Ltd. (Metals & Mining) | | | 72,000 | | | | 71,310 | |
Franshion Properties China, Ltd. (Real Estate Management & Development) | | | 286,000 | | | | 98,846 | |
Global Bio-Chem Technology Group Co., Ltd. (Food Products) (a) | | | 200,000 | | | | 15,475 | |
Glorious Property Holdings, Ltd. (Real Estate Management & Development) (a) | | | 125,000 | | | | 26,921 | |
Golden Meditech Holdings, Ltd. (Health Care Equipment & Supplies) | | | 336,000 | | | | 30,332 | |
GOME Electrical Appliances Holdings, Ltd. (Specialty Retail) | | | 756,000 | | | | 139,417 | |
Greentown China Holdings, Ltd. (Real Estate Management & Development) | | | 40,000 | | | | 61,076 | |
Guangshen Railway Co., Ltd., Sponsored ADR (Road & Rail) | | | 2,500 | | | | 57,750 | |
Harbin Power Equipment Co., Ltd. Class H (Electrical Equipment) | | | 70,000 | | | | 45,317 | |
Heng Tai Consumables Group, Ltd. (Food & Staples Retailing) (a) | | | 1,035,000 | | | | 23,625 | |
Hidili Industry International Development, Ltd. (Oil, Gas & Consumable Fuels) (a) | | | 107,000 | | | | 16,421 | |
HKC Holdings, Ltd. (Construction & Engineering) (a) | | | 248,000 | | | | 8,315 | |
Hopson Development Holdings, Ltd. (Real Estate Management & Development) (a) | | | 30,000 | | | | 36,290 | |
Jiangxi Copper Co., Ltd. Class H (Metals & Mining) | | | 12,000 | | | | 21,665 | |
Ju Teng International Holdings, Ltd. (Electronic Equipment, Instruments & Components) | | | 74,000 | | | | 48,861 | |
| | | | | | | | |
| | | Shares | | | Value | |
China (continued) | | | | | | | | |
Kaisa Group Holdings, Ltd. (Real Estate Management & Development) (a) | | | 69,000 | | | $ | 22,513 | |
Kingboard Chemical Holdings, Ltd. (Electronic Equipment, Instruments & Components) | | | 58,800 | | | | 153,174 | |
Kingboard Laminates Holdings, Ltd. (Electronic Equipment, Instruments & Components) | | | 108,000 | | | | 45,822 | |
KWG Property Holding, Ltd. (Real Estate Management & Development) | | | 77,500 | | | | 43,176 | |
Lonking Holdings, Ltd. (Machinery) (a) | | | 166,000 | | | | 32,539 | |
Maanshan Iron & Steel Class H (Metals & Mining) (a) | | | 176,000 | | | | 47,664 | |
Maoye International Holdings, Ltd. (Multiline Retail) | | | 135,000 | | | | 24,199 | |
Metallurgical Corp. of China, Ltd. Class H (Construction & Engineering) (a) | | | 217,000 | | | | 40,018 | |
MIE Holdings Corp. (Oil, Gas & Consumable Fuels) | | | 76,000 | | | | 16,074 | |
MMG, Ltd. (Metals & Mining) (a) | | | 48,000 | | | | 10,152 | |
New World China Land, Ltd. (Real Estate Management & Development) | | | 98,000 | | | | 47,519 | |
Nine Dragons Paper Holdings, Ltd. (Paper & Forest Products) | | | 31,000 | | | | 26,985 | |
Pacific Basin Shipping, Ltd. (Marine) | | | 3,626,000 | | | | 2,599,920 | |
Parkson Retail Group, Ltd. (Multiline Retail) | | | 149,000 | | | | 45,924 | |
Peak Sport Products Co., Ltd. (Textiles, Apparel & Luxury Goods) | | | 117,000 | | | | 28,517 | |
PetroChina Co., Ltd. Class H (Oil, Gas & Consumable Fuels) | | | 4,461,550 | | | | 4,884,846 | |
Poly Hong Kong Investments, Ltd. (Real Estate Management & Development) | | | 174,000 | | | | 92,674 | |
Real Nutriceutical Group, Ltd. (Personal Products) | | | 97,000 | | | | 25,018 | |
Renhe Commercial Holdings Co., Ltd. (Real Estate Management & Development) (a) | | | 1,082,000 | | | | 69,070 | |
REXLot Holdings, Ltd. (Hotels, Restaurants & Leisure) | | | 667,206 | | | | 90,345 | |
Samson Holding, Ltd. (Household Durables) | | | 212,000 | | | | 28,980 | |
Semiconductor Manufacturing International Corp. (Semiconductors & Semiconductor Equipment) (a) | | | 1,970,000 | | | | 154,972 | |
Shandong Chenming Paper Holdings, Ltd. Class H (Paper & Forest Products) | | | 69,000 | | | | 30,165 | |
Shanghai Industrial Holdings, Ltd. (Industrial Conglomerates) | | | 40,000 | | | | 146,499 | |
Shanghai Industrial Urban Development Group, Ltd. (Real Estate Management & Development) (a) | | | 70,000 | | | | 17,332 | |
Shengli Oil & Gas Pipe Holdings, Ltd. (Energy Equipment & Services) | | | 277,500 | | | | 19,325 | |
| | | | |
| M-122 | | MainStay VP DFA / DuPont Capital Emerging Markets Equity Portfolio | | The notes to the financial statements are an integral part of,
and should be read in conjunction with, the financial statements. |
| | | | | | | | |
| | | Shares | | | Value | |
| Common Stocks (continued) | | | | | | | | |
China (continued) | | | | | | | | |
Shenzhen Investment, Ltd. (Real Estate Management & Development) | | | 230,799 | | | $ | 86,911 | |
Shougang Fushan Resources Group, Ltd. (Metals & Mining) | | | 304,000 | | | | 106,243 | |
Shui On Land, Ltd. (Real Estate Management & Development) | | | 349,833 | | | | 107,373 | |
Sino Oil and Gas Holdings, Ltd. (Oil, Gas & Consumable Fuels) (a) | | | 985,000 | | | | 31,757 | |
Sino-Ocean Land Holdings, Ltd. (Real Estate Management & Development) | | | 358,767 | | | | 234,573 | |
Sinofert Holdings, Ltd. (Chemicals) | | | 216,000 | | | | 35,098 | |
Sinotrans Shipping, Ltd. (Marine) | | | 133,000 | | | | 48,539 | |
Sinotrans, Ltd. Class H (Air Freight & Logistics) | | | 220,000 | | | | 83,128 | |
Sinotruk Hong Kong, Ltd. (Machinery) (b) | | | 3,025,500 | | | | 1,701,144 | |
Soho China, Ltd. (Real Estate Management & Development) | | | 193,000 | | | | 165,266 | |
TCC International Holdings, Ltd. (Construction Materials) | | | 102,000 | | | | 49,985 | |
Tiangong International Co., Ltd. (Metals & Mining) | | | 152,000 | | | | 43,909 | |
Tianjin Port Development Holdings, Ltd. (Transportation Infrastructure) | | | 204,000 | | | | 34,990 | |
Tianneng Power International, Ltd. (Auto Components) | | | 52,000 | | | | 19,112 | |
TPV Technology, Ltd. (Computers & Peripherals) | | | 82,000 | | | | 16,920 | |
VODone, Ltd. (Software) (a) | | | 222,000 | | | | 30,061 | |
Wasion Group Holdings, Ltd. (Electronic Equipment, Instruments & Components) | | | 2,000 | | | | 1,223 | |
Weichai Power Co., Ltd. Class H (Machinery) | | | 882,000 | | | | 3,571,541 | |
Weiqiao Textile Co. Class H (Textiles, Apparel & Luxury Goods) | | | 64,000 | | | | 39,287 | |
West China Cement, Ltd. (Construction Materials) | | | 288,000 | | | | 42,712 | |
Xingda International Holdings, Ltd. (Auto Components) | | | 16,000 | | | | 9,574 | |
Yanchang Petroleum International, Ltd. (Oil, Gas & Consumable Fuels) (a) | | | 70,000 | | | | 4,017 | |
Yanzhou Coal Mining Co., Ltd. Class H (Oil, Gas & Consumable Fuels) | | | 82,000 | | | | 74,869 | |
Yuexiu Property Co., Ltd. (Real Estate Management & Development) | | | 404,000 | | | | 99,511 | |
Zoomlion Heavy Industry Science and Technology Co., Ltd. (Machinery) | | | 49,600 | | | | 46,438 | |
| | | | | | | | |
| | | | | | | 55,664,344 | |
| | | | | | | | |
| | | | | | | | |
| | | Shares | | | Value | |
Colombia 1.3% | | | | | | | | |
BanColombia S.A., Sponsored ADR (Commercial Banks) | | | 88,955 | | | $ | 4,360,574 | |
Cementos Argos S.A. (Construction Materials) | | | 8,300 | | | | 42,145 | |
Grupo de Inversiones Suramericana S.A. (Diversified Financial Services) | | | 5,125 | | | | 89,489 | |
Grupo Nutresa S.A. (Food Products) | | | 4,675 | | | | 64,045 | |
| | | | | | | | |
| | | | | | | 4,556,253 | |
| | | | | | | | |
Czech Republic 2.1% | | | | | | | | |
¨Komercni Banka A.S. (Commercial Banks) | | | 33,858 | | | | 7,537,317 | |
Unipetrol A.S. (Chemicals) (a) | | | 10,000 | | | | 84,595 | |
| | | | | | | | |
| | | | | | | 7,621,912 | |
| | | | | | | | |
Hungary 0.2% | | | | | | | | |
OTP Bank PLC (Commercial Banks) | | | 28,948 | | | | 549,275 | |
| | | | | | | | |
| | |
India 1.7% | | | | | | | | |
Reliance Industries, Ltd., Sponsored GDR (Oil, Gas & Consumable Fuels) (d) | | | 199,337 | | | | 5,788,746 | |
Sesa Sterlite, Ltd., ADR (Metals & Mining) | | | 28,801 | | | | 379,021 | |
State Bank of India, GDR (Commercial Banks) | | | 657 | | | | 37,548 | |
Tata Steel, Ltd., GDR (Metals & Mining) | | | 21,252 | | | | 146,639 | |
| | | | | | | | |
| | | | | | | 6,351,954 | |
| | | | | | | | |
Indonesia 4.7% | | | | | | | | |
Adaro Energy Tbk PT (Oil, Gas & Consumable Fuels) | | | 946,000 | | | | 84,728 | |
Agung Podomoro Land Tbk PT (Real Estate Management & Development) | | | 299,000 | | | | 5,282 | |
AKR Corporindo Tbk PT (Trading Companies & Distributors) | | | 4,302,500 | | | | 1,546,708 | |
Aneka Tambang Persero Tbk PT (Metals & Mining) | | | 368,000 | | | | 32,960 | |
Astra International Tbk PT (Automobiles) | | | 3,560,000 | | | | 1,989,154 | |
Bakrie Sumatera Plantations Tbk PT (Food Products) (a) | | | 1,887,000 | | | | 7,753 | |
Bank Bukopin Tbk PT (Commercial Banks) | | | 584,500 | | | | 29,777 | |
Bank Danamon Indonesia Tbk PT (Commercial Banks) | | | 321,500 | | | | 99,726 | |
Bank Mandiri Persero Tbk PT (Commercial Banks) | | | 406,500 | | | | 262,204 | |
Bank Negara Indonesia Persero Tbk PT (Commercial Banks) | | | 716,500 | | | | 232,554 | |
Bank Pan Indonesia Tbk PT (Commercial Banks) (a) | | | 389,000 | | | | 21,096 | |
Bank Pembangunan Daerah Jawa Barat Dan Banten Tbk PT (Commercial Banks) | | | 227,000 | | | | 16,601 | |
Bank Rakyat Indonesia Persero Tbk PT (Commercial Banks) | | | 3,096,300 | | | | 1,844,550 | |
| | | | | | |
The notes to the financial statements are an integral part of,
and should be read in conjunction with, the financial statements. | | mainstayinvestments.com | | | M-123 | |
Portfolio of Investments December 31, 2013 (continued)
| | | | | | | | |
| | | Shares | | | Value | |
| Common Stocks (continued) | | | | | | | | |
Indonesia (continued) | | | | | | | | |
Bank Tabungan Negara Persero Tbk PT (Commercial Banks) | | | 436,223 | | | $ | 31,184 | |
Barito Pacific Tbk PT (Chemicals) (a) | | | 358,000 | | | | 12,061 | |
Benakat Integra Tbk PT (Oil, Gas & Consumable Fuels) (a) | | | 1,089,000 | | | | 9,933 | |
Berau Coal Energy Tbk PT (Oil, Gas & Consumable Fuels) (a) | | | 314,000 | | | | 4,799 | |
Bhakti Investama Tbk PT (Media) | | | 2,097,500 | | | | 58,599 | |
Bisi International Tbk PT (Food Products) | | | 92,000 | | | | 4,233 | |
Borneo Lumbung Energi & Metal Tbk PT (Metals & Mining) (a) | | | 932,000 | | | | 13,325 | |
Bumi Resources Minerals Tbk PT (Metals & Mining) (a) | | | 552,500 | | | | 9,034 | |
Ciputra Development Tbk PT (Real Estate Management & Development) | | | 684,000 | | | | 42,153 | |
Ciputra Property Tbk PT (Real Estate Management & Development) | | | 565,000 | | | | 28,784 | |
Energi Mega Persada Tbk PT (Oil, Gas & Consumable Fuels) (a) | | | 5,217,000 | | | | 30,007 | |
Gajah Tunggal Tbk PT (Auto Components) | | | 226,500 | | | | 31,267 | |
Garuda Indonesia Persero Tbk PT (Airlines) (a) | | | 301,000 | | | | 12,367 | |
Hexindo Adiperkasa Tbk PT (Trading Companies & Distributors) | | | 34,500 | | | | 9,142 | |
Holcim Indonesia Tbk PT (Construction Materials) | | | 81,000 | | | | 15,142 | |
Indah Kiat Pulp & Paper Corp. Tbk PT (Paper & Forest Products) (a) | | | 279,000 | | | | 32,095 | |
Indika Energy Tbk PT (Oil, Gas & Consumable Fuels) | | | 287,500 | | | | 13,938 | |
Indo Tambangraya Megah Tbk PT (Oil, Gas & Consumable Fuels) | | | 1,444,000 | | | | 3,381,594 | |
Intiland Development Tbk PT (Real Estate Management & Development) | | | 876,000 | | | | 22,674 | |
Kawasan Industri Jababeka Tbk PT (Real Estate Management & Development) | | | 1,951,130 | | | | 30,942 | |
Lippo Karawaci Tbk PT (Real Estate Management & Development) | | | 2,085,500 | | | | 155,941 | |
Medco Energi Internasional Tbk PT (Oil, Gas & Consumable Fuels) | | | 233,000 | | | | 40,206 | |
Multipolar Corp. Tbk PT (Multiline Retail) | | | 288,500 | | | | 8,534 | |
Panin Financial Tbk PT (Insurance) (a) | | | 2,317,000 | | | | 37,125 | |
Perusahaan Perkebunan London Sumatra Indonesia Tbk PT (Food Products) | | | 227,000 | | | | 35,999 | |
Polychem Indonesia Tbk PT (Chemicals) (a) | | | 586,000 | | | | 10,593 | |
Ramayana Lestari Sentosa Tbk PT (Multiline Retail) | | | 4,500 | | | | 392 | |
Salim Ivomas Pratama Tbk PT (Food Products) | | | 169,000 | | | | 10,832 | |
Sampoerna Agro Tbk PT (Food Products) | | | 94,000 | | | | 15,448 | |
| | | | | | | | |
| | | Shares | | | Value | |
Indonesia (continued) | | | | | | | | |
Sentul City Tbk PT (Real Estate Management & Development) (a) | | | 1,963,000 | | | $ | 25,324 | |
Tiga Pilar Sejahtera Food Tbk PT (Food Products) | | | 390,000 | | | | 45,826 | |
Timah Persero Tbk PT (Metals & Mining) | | | 354,500 | | | | 46,606 | |
United Tractors Tbk PT (Machinery) | | | 3,157,500 | | | | 4,929,540 | |
Vale Indonesia Tbk PT (Metals & Mining) | | | 8,088,500 | | | | 1,761,259 | |
| | | | | | | | |
| | | | | | | 17,089,991 | |
| | | | | | | | |
Jordan 0.3% | | | | | | | | |
Hikma Pharmaceuticals PLC (Pharmaceuticals) | | | 62,777 | | | | 1,248,506 | |
| | | | | | | | |
| | |
Malaysia 2.6% | | | | | | | | |
Affin Holdings BHD (Commercial Banks) | | | 48,200 | | | | 61,069 | |
AirAsia BHD (Airlines) | | | 93,600 | | | | 62,867 | |
APM Automotive Holdings BHD (Auto Components) | | | 9,600 | | | | 16,970 | |
Berjaya Corp. BHD (Industrial Conglomerates) | | | 381,100 | | | | 68,646 | |
BIMB Holdings BHD (Commercial Banks) | | | 6,100 | | | | 8,455 | |
Boustead Holdings BHD (Industrial Conglomerates) | | | 58,300 | | | | 100,029 | |
Cahya Mata Sarawak BHD (Industrial Conglomerates) | | | 16,100 | | | | 33,768 | |
Coastal Contracts BHD (Machinery) | | | 20,500 | | | | 21,467 | |
DRB-Hicom BHD (Automobiles) | | | 108,900 | | | | 93,756 | |
Eastern & Oriental BHD (Real Estate Management & Development) | | | 38,200 | | | | 22,042 | |
Evergreen Fibreboard BHD (Paper & Forest Products) (a) | | | 99,100 | | | | 13,917 | |
Faber Group BHD (Health Care Providers & Services) | | | 64,200 | | | | 49,980 | |
Genting BHD (Hotels, Restaurants & Leisure) | | | 1,376,600 | | | | 4,311,988 | |
Genting Malaysia BHD (Hotels, Restaurants & Leisure) | | | 216,900 | | | | 290,039 | |
Glomac BHD (Real Estate Management & Development) | | | 83,300 | | | | 28,483 | |
HAP Seng Consolidated BHD (Industrial Conglomerates) | | | 78,500 | | | | 72,137 | |
HAP Seng Plantations Holdings BHD (Food Products) | | | 11,800 | | | | 9,655 | |
Hong Leong Financial Group BHD (Commercial Banks) | | | 21,000 | | | | 99,246 | |
IGB Corp. BHD (Real Estate Management & Development) | | | 107,800 | | | | 89,518 | |
IJM Corp. BHD (Construction & Engineering) | | | 128,500 | | | | 230,676 | |
IJM Land BHD (Real Estate Management & Development) | | | 44,200 | | | | 34,410 | |
| | | | |
| M-124 | | MainStay VP DFA / DuPont Capital Emerging Markets Equity Portfolio | | The notes to the financial statements are an integral part of,
and should be read in conjunction with, the financial statements. |
| | | | | | | | |
| | | Shares | | | Value | |
| Common Stocks (continued) | | | | | | | | |
Malaysia (continued) | | | | | | | | |
Inch Kenneth Kajang Rubber BHD (Industrial Conglomerates) | | | 39,800 | | | $ | 10,085 | |
Insas BHD (Capital Markets) | | | 73,264 | | | | 19,571 | |
Iris Corp. BHD (Software) | | | 213,600 | | | | 18,259 | |
JAKS Resources BHD (Construction & Engineering) (a) | | | 176,800 | | | | 27,258 | |
JCY International BHD (Computers & Peripherals) | | | 70,400 | | | | 13,648 | |
Karambunai Corp. BHD (Hotels, Restaurants & Leisure) (a) | | | 613,700 | | | | 14,989 | |
Kian JOO CAN Factory BHD (Containers & Packaging) | | | 31,300 | | | | 29,814 | |
KNM Group BHD (Energy Equipment & Services) (a) | | | 120,800 | | | | 16,596 | |
KSL Holdings BHD (Real Estate Management & Development) (a) | | | 69,100 | | | | 46,411 | |
KUB Malaysia BHD (Oil, Gas & Consumable Fuels) (a) | | | 149,300 | | | | 18,460 | |
Kulim Malaysia BHD (Food Products) | | | 60,900 | | | | 63,959 | |
Kwantas Corp. BHD (Food Products) | | | 35,700 | | | | 22,452 | |
Lion Industries Corp. BHD (Metals & Mining) | | | 108,300 | | | | 24,302 | |
Malayan Banking BHD (Commercial Banks) | | | 579,125 | | | | 1,757,442 | |
Malayan Flour Mills BHD (Food Products) | | | 20,300 | | | | 9,420 | |
Malaysian Bulk Carriers BHD (Marine) | | | 30,100 | | | | 16,265 | |
Malaysian Resources Corp. BHD (Construction & Engineering) | | | 146,000 | | | | 57,500 | |
MBM Resources BHD (Distributors) | | | 18,200 | | | | 17,836 | |
Media Prima BHD (Media) | | | 53,700 | | | | 42,953 | |
Metro Kajang Holdings BHD (Real Estate Management & Development) | | | 39,040 | | | | 32,062 | |
MISC BHD (Marine) (a) | | | 139,200 | | | | 242,235 | |
MMC Corp. BHD (Industrial Conglomerates) | | | 113,300 | | | | 99,620 | |
Mudajaya Group BHD (Construction & Engineering) | | | 24,000 | | | | 21,249 | |
Muhibbah Engineering (M) BHD (Construction & Engineering) | | | 2,100 | | | | 1,462 | |
Mulpha International BHD (Diversified Financial Services) (a) | | | 161,400 | | | | 20,203 | |
Multi-Purpose Holdings BHD (Hotels, Restaurants & Leisure) | | | 50,300 | | | | 48,526 | |
Naim Holdings BHD (Real Estate Management & Development) | | | 33,000 | | | | 36,773 | |
OSK Holdings BHD (Capital Markets) | | | 67,700 | | | | 34,103 | |
Parkson Holdings BHD (Multiline Retail) | | | 16,800 | | | | 14,105 | |
PPB Group BHD (Food Products) | | | 60,600 | | | | 298,606 | |
RHB Capital BHD (Commercial Banks) | | | 76,529 | | | | 184,576 | |
Rimbunan Sawit BHD (Food Products) | | | 43,600 | | | | 10,449 | |
Salcon BHD (Water Utilities) | | | 72,400 | | | | 14,588 | |
Sarawak Plantation BHD (Food Products) | | | 30,200 | | | | 23,695 | |
| | | | | | | | |
| | | Shares | | | Value | |
Malaysia (continued) | | | | | | | | |
Scomi Group BHD (Energy Equipment & Services) (a) | | | 139,000 | | | $ | 15,489 | |
Selangor Properties BHD (Real Estate Management & Development) | | | 31,300 | | | | 45,868 | |
Sunway BHD (Real Estate Management & Development) | | | 54,666 | | | | 45,395 | |
Ta Ann Holdings BHD (Paper & Forest Products) | | | 11,100 | | | | 14,131 | |
TA Enterprise BHD (Hotels, Restaurants & Leisure) | | | 174,000 | | | | 41,435 | |
TDM BHD (Food Products) | | | 30,000 | | | | 8,701 | |
TH Plantations BHD (Food Products) | | | 30,300 | | | | 17,391 | |
Time dotCom BHD (Diversified Telecommunication Services) (a) | | | 14,340 | | | | 15,542 | |
Unisem M BHD (Semiconductors & Semiconductor Equipment) | | | 22,900 | | | | 6,991 | |
UOA Development BHD (Real Estate Management & Development) | | | 48,900 | | | | 28,962 | |
Wah Seong Corp. BHD (Energy Equipment & Services) | | | 55,399 | | | | 27,907 | |
WCT Holdings BHD (Construction & Engineering) | | | 97,060 | | | | 60,746 | |
YTL Corp. BHD (Multi-Utilities) | | | 527,360 | | | | 260,822 | |
| | | | | | | | |
| | | | | | | 9,617,970 | |
| | | | | | | | |
Mexico 7.7% | | | | | | | | |
¨America Movil S.A.B. de C.V. Series L (Wireless Telecommunication Services) | | | 10,773,820 | | | | 12,534,318 | |
Axtel S.A.B. de C.V. (Diversified Telecommunication Services) (a) | | | 141,000 | | | | 50,432 | |
Cemex S.A.B. de C.V., Sponsored ADR (Construction Materials) (a) | | | 119,145 | | | | 1,409,485 | |
Cia Minera Autlan S.A.B. de C.V. (Metals & Mining) | | | 21,790 | | | | 16,939 | |
Consorcio ARA S.A.B. de C.V. (Household Durables) (a) | | | 108,695 | | | | 42,457 | |
Controladora Comercial Mexicana S.A.B. de C.V. (Food & Staples Retailing) | | | 61,333 | | | | 266,349 | |
Corporacion GEO S.A.B. de C.V. Series B (Household Durables) (a)(c) | | | 88,600 | | | | 1,661 | |
Desarrolladora Homex S.A.B. de C.V., ADR (Household Durables) (a) | | | 6,900 | | | | 8,073 | |
Empresas ICA S.A.B. de C.V., Sponsored ADR (Construction & Engineering) (a) | | | 17,519 | | | | 148,036 | |
Gruma S.A.B. de C.V. Class B (Food Products) (a) | | | 21,500 | | | | 162,528 | |
Grupo Aeromexico S.A.B. de C.V. (Airlines) (a) | | | 800 | | | | 1,101 | |
Grupo Aeroportuario del Centro Norte S.A.B. de C.V. (Transportation Infrastructure) (a) | | | 5,534 | | | | 18,548 | |
| | | | | | |
The notes to the financial statements are an integral part of,
and should be read in conjunction with, the financial statements. | | mainstayinvestments.com | | | M-125 | |
Portfolio of Investments December 31, 2013 (continued)
| | | | | | | | |
| | | Shares | | | Value | |
| Common Stocks (continued) | | | | | | | | |
Mexico (continued) | | | | | | | | |
Grupo Aeroportuario del Pacifico S.A.B. de C.V. Class B (Transportation Infrastructure) | | | 49,341 | | | $ | 262,227 | |
Grupo Aeroportuario del Sureste S.A.B. de C.V., ADR (Transportation Infrastructure) | | | 4,000 | | | | 498,520 | |
Grupo Comercial Chedraui S.A. de C.V. (Food & Staples Retailing) | | | 31,400 | | | | 110,579 | |
Grupo Famsa S.A.B. de C.V. Class A (Multiline Retail) (a) | | | 1,000 | | | | 1,809 | |
Grupo Financiero Banorte S.A.B. de C.V. Class O (Commercial Banks) | | | 277,268 | | | | 1,939,697 | |
Grupo Financiero Inbursa S.A.B. de C.V. (Commercial Banks) | | | 63,994 | | | | 181,055 | |
Grupo Simec S.A.B. de C.V. Series B (Metals & Mining) (a) | | | 17,499 | | | | 72,910 | |
Industrias Bachoco S.A.B. de C.V., ADR (Food Products) | | | 3,919 | | | | 157,818 | |
Industrias CH S.A.B. de C.V. Series B (Metals & Mining) (a) | | | 25,200 | | | | 170,232 | |
Megacable Holdings S.A.B. de C.V. (Media) | | | 59,751 | | | | 202,046 | |
OHL Mexico S.A.B. de C.V. (Transportation Infrastructure) (a) | | | 76,500 | | | | 194,934 | |
Organizacion Soriana S.A.B. de C.V. Class B (Food & Staples Retailing) (a) | | | 61,941 | | | | 222,972 | |
¨Ternium S.A., Sponsored ADR (Metals & Mining) | | | 290,236 | | | | 9,084,387 | |
TV Azteca S.A.B. de C.V. (Media) | | | 83,664 | | | | 44,599 | |
Urbi Desarrollos Urbanos S.A.B. de C.V. (Household Durables) (a)(b)(c) | | | 101,900 | | | | 10,926 | |
| | | | | | | | |
| | | | | | | 27,814,638 | |
| | | | | | | | |
Panama 0.4% | | | | | | | | |
Copa Holdings S.A. Class A (Airlines) | | | 7,979 | | | | 1,277,518 | |
| | | | | | | | |
| | |
Peru 0.5% | | | | | | | | |
Cia de Minas Buenaventura S.A., ADR (Metals & Mining) | | | 173,726 | | | | 1,949,206 | |
| | | | | | | | |
| | |
Philippines 0.2% | | | | | | | | |
Atlas Consolidated Mining & Development (Metals & Mining) | | | 32,500 | | | | 10,647 | |
BDO Unibank, Inc. (Commercial Banks) | | | 92,670 | | | | 143,236 | |
Cebu Air, Inc. (Airlines) | | | 5,000 | | | | 5,278 | |
China Banking Corp. (Commercial Banks) | | | 35,453 | | | | 47,130 | |
Filinvest Land, Inc. (Real Estate Management & Development) | | | 1,563,000 | | | | 49,655 | |
First Philippine Holdings Corp. (Electric Utilities) | | | 22,100 | | | | 26,740 | |
Global-Estate Resorts, Inc. (Real Estate Management & Development) (a) | | | 570,000 | | | | 17,338 | |
| | | | | | | | |
| | | Shares | | | Value | |
Philippines (continued) | | | | | | | | |
JG Summit Holdings, Inc. (Industrial Conglomerates) | | | 101,200 | | | $ | 87,901 | |
Lopez Holdings Corp. (Media) | | | 273,200 | | | | 24,622 | |
Megaworld Corp. (Real Estate Management & Development) | | | 1,384,000 | | | | 101,034 | |
Philippine National Bank (Commercial Banks) (a) | | | 22,810 | | | | 44,327 | |
Rizal Commercial Banking Corp. (Commercial Banks) | | | 19,780 | | | | 18,941 | |
Robinsons Land Corp. (Real Estate Management & Development) | | | 51,500 | | | | 23,161 | |
San Miguel Corp. (Industrial Conglomerates) | | | 54,870 | | | | 77,269 | |
Top Frontier Investment Holdings Inc. (Industrial Conglomerates) (a)(b)(c) | | | 6,992 | | | | 6,065 | |
Union Bank of Philippines (Commercial Banks) | | | 23,150 | | | | 65,722 | |
Vista Land & Lifescapes, Inc. (Real Estate Management & Development) | | | 484,000 | | | | 56,707 | |
| | | | | | | | |
| | | | | | | 805,773 | |
| | | | | | | | |
Poland 4.8% | | | | | | | | |
Asseco Poland S.A. (Software) | | | 7,269 | | | | 110,609 | |
Bank Handlowy w Warszawie S.A. (Commercial Banks) | | | 104,470 | | | | 3,630,973 | |
Bank Pekao S.A. (Commercial Banks) | | | 118,178 | | | | 7,021,715 | |
Enea S.A. (Electric Utilities) | | | 10,613 | | | | 47,777 | |
Getin Holding S.A. (Commercial Banks) | | | 347 | | | | 433 | |
Grupa Lotos S.A. (Oil, Gas & Consumable Fuels) (a) | | | 164,074 | | | | 1,925,299 | |
KGHM Polska Miedz S.A.
(Metals & Mining) | | | 3,129 | | | | 122,216 | |
Kopex S.A. (Machinery) | | | 2,064 | | | | 7,215 | |
Netia S.A. (Diversified Telecommunication Services) (a) | | | 23,993 | | | | 41,854 | |
PGE S.A. (Electric Utilities) | | | 86,246 | | | | 464,767 | |
Polimex-Mostostal S.A. (Construction & Engineering) (a) | | | 58,304 | | | | 2,509 | |
Polski Koncern Naftowy Orlen S.A. (Oil, Gas & Consumable Fuels) | | | 42,274 | | | | 573,719 | |
Tauron Polska Energia S.A. (Electric Utilities) | | | 138,576 | | | | 200,452 | |
Telekomunikacja Polska S.A. (Diversified Telecommunication Services) | | | 1,044,662 | | | | 3,388,784 | |
| | | | | | | | |
| | | | | | | 17,538,322 | |
| | | | | | | | |
Republic of Korea 22.1% | | | | | | | | |
AUK Corp. (Semiconductors & Semiconductor Equipment) (a) | | | 11,290 | | | | 22,840 | |
BS Financial Group, Inc. (Commercial Banks) | | | 7,900 | | | | 119,771 | |
| | | | |
| M-126 | | MainStay VP DFA / DuPont Capital Emerging Markets Equity Portfolio | | The notes to the financial statements are an integral part of,
and should be read in conjunction with, the financial statements. |
| | | | | | | | |
| | | Shares | | | Value | |
| Common Stocks (continued) | | | | | | | | |
Republic of Korea (continued) | | | | | | | | |
China Ocean Resources Co., Ltd. (Food Products) (a) | | | 7,670 | | | $ | 30,815 | |
COSMO Chemical Co., Ltd. (Chemicals) (a) | | | 2,200 | | | | 14,947 | |
Dae Han Flour Mills Co., Ltd. (Food Products) | | | 258 | | | | 37,526 | |
Daechang Co., Ltd. (Metals & Mining) | | | 25,940 | | | | 24,432 | |
Daelim Industrial Co., Ltd. (Construction & Engineering) | | | 3,531 | | | | 314,841 | |
Daewoo Engineering & Construction Co., Ltd. (Construction & Engineering) (a) | | | 6,440 | | | | 44,973 | |
Daewoo Securities Co., Ltd. (Capital Markets) | | | 7,530 | | | | 63,502 | |
Daishin Securities Co., Ltd. (Capital Markets) | | | 3,040 | | | | 22,612 | |
DGB Financial Group, Inc. (Commercial Banks) | | | 3,260 | | | | 50,969 | |
Dongbu Securities Co., Ltd. (Capital Markets) | | | 7,510 | | | | 23,732 | |
Dongkuk Steel Mill Co., Ltd. (Metals & Mining) | | | 4,860 | | | | 60,557 | |
Dongwha Pharm Co., Ltd. (Pharmaceuticals) | | | 7,240 | | | | 30,117 | |
Doosan Corp. (Industrial Conglomerates) | | | 200 | | | | 26,437 | |
Doosan Engineering & Construction Co., Ltd. (Construction & Engineering) (a) | | | 7 | | | | 12 | |
Doosan Infracore Co., Ltd. (Machinery) (a) | | | 1,610 | | | | 19,222 | |
Eugene Investment & Securities Co., Ltd. (Capital Markets) (a) | | | 10,150 | | | | 20,197 | |
GS Engineering & Construction Corp. (Construction & Engineering) | | | 2,246 | | | | 64,910 | |
GS Holdings (Oil, Gas & Consumable Fuels) | | | 6,691 | | | | 363,286 | |
Gwangju Shinsegae Co., Ltd. (Multiline Retail) | | | 47 | | | | 11,245 | |
Hana Financial Group, Inc. (Commercial Banks) | | | 22,966 | | | | 955,330 | |
Hanil Cement Co., Ltd. (Construction Materials) | | | 446 | | | | 35,922 | |
Hanjin Heavy Industries & Construction Co., Ltd. (Machinery) (a) | | | 5,540 | | | | 63,256 | |
Hanjin Shipping Co., Ltd. (Marine) (a) | | | 10,650 | | | | 77,300 | |
Hanjin Transportation Co., Ltd. (Air Freight & Logistics) | | | 1,660 | | | | 29,964 | |
Hansol Paper Co. (Paper & Forest Products) | | | 4,580 | | | | 49,040 | |
Hanwha Chemical Corp. (Chemicals) | | | 11,020 | | | | 225,026 | |
Hanwha Corp. (Chemicals) | | | 3,560 | | | | 132,233 | |
Hanwha Securities Co. (Capital Markets) (a) | | | 7,600 | | | | 24,485 | |
HMC Investment Securities Co., Ltd. (Capital Markets) | | | 2,540 | | | | 23,610 | |
Hyosung Corp. (Chemicals) | | | 2,989 | | | | 199,106 | |
| | | | | | | | |
| | | Shares | | | Value | |
Republic of Korea (continued) | | | | | | | | |
Hyundai BNG Steel Co., Ltd. (Metals & Mining) (a) | | | 1,180 | | | $ | 14,424 | |
Hyundai Department Store Co., Ltd. (Multiline Retail) | | | 22,548 | | | | 3,439,833 | |
Hyundai Development Co. (Construction & Engineering) | | | 7,400 | | | | 162,676 | |
¨Hyundai Heavy Industries Co., Ltd. (Machinery) | | | 41,939 | | | | 10,213,032 | |
Hyundai Mobis (Auto Components) | | | 25,973 | | | | 7,223,268 | |
¨Hyundai Motor Co. (Automobiles) | | | 50,815 | | | | 11,387,452 | |
Hyundai Securities Co., Ltd. (Capital Markets) | | | 14,040 | | | | 77,826 | |
Hyundai Steel Co. (Metals & Mining) | | | 5,901 | | | | 482,547 | |
Industrial Bank of Korea (Commercial Banks) | | | 17,540 | | | | 201,934 | |
ISU Chemical Co., Ltd. (Chemicals) | | | 1,460 | | | | 17,708 | |
JB Financial Group Co., Ltd. (Commercial Banks) (a) | | | 8,110 | | | | 48,874 | |
Kangwon Land, Inc. (Hotels, Restaurants & Leisure) | | | 95,640 | | | | 2,804,812 | |
KB Financial Group, Inc. (Commercial Banks) | | | 32,310 | | | | 1,293,502 | |
KCC Corp. (Building Products) | | | 552 | | | | 245,048 | |
Keangnam Enterprises, Ltd. (Construction & Engineering) (a) | | | 3,550 | | | | 11,824 | |
KISWIRE, Ltd. (Metals & Mining) | | | 940 | | | | 33,268 | |
Kolon Industries, Inc. (Chemicals) | | | 2,297 | | | | 119,056 | |
Korea Investment Holdings Co., Ltd. (Capital Markets) | | | 5,120 | | | | 197,940 | |
Korea Life Insurance Co., Ltd. (Insurance) | | | 19,850 | | | | 142,760 | |
KTB Investment & Securities Co., Ltd. (Capital Markets) (a) | | | 16,210 | | | | 33,408 | |
Kyobo Securities Co. (Capital Markets) | | | 6,510 | | | | 27,265 | |
LG Chem, Ltd. (Chemicals) | | | 18,985 | | | | 5,387,793 | |
LG Corp. (Industrial Conglomerates) | | | 1,234 | | | | 74,834 | |
LG Display Co., Ltd. (Electronic Equipment, Instruments & Components) (a) | | | 10,790 | | | | 259,181 | |
LG Electronics, Inc. (Household Durables) | | | 6,144 | | | | 396,462 | |
LG International Corp. (Trading Companies & Distributors) | | | 1,820 | | | | 49,581 | |
LIG Insurance Co., Ltd. (Insurance) | | | 300 | | | | 9,366 | |
Lotte Chemical Corp. (Chemicals) | | | 22 | | | | 4,836 | |
Lotte Chilsung Beverage Co., Ltd. (Beverages) | | | 71 | | | | 102,596 | |
Lotte Confectionery Co., Ltd. (Food Products) | | | 80 | | | | 144,938 | |
Lotte Shopping Co., Ltd. (Multiline Retail) | | | 994 | | | | 380,514 | |
Meritz Securities Co., Ltd. (Capital Markets) | | | 31,740 | | | | 52,632 | |
Mirae Asset Securities Co., Ltd. (Capital Markets) | | | 3,030 | | | | 110,250 | |
| | | | | | |
The notes to the financial statements are an integral part of,
and should be read in conjunction with, the financial statements. | | mainstayinvestments.com | | | M-127 | |
Portfolio of Investments December 31, 2013 (continued)
| | | | | | | | |
| | | Shares | | | Value | |
| Common Stocks (continued) | | | | | | | | |
Republic of Korea (continued) | | | | | | | | |
Moorim P&P Co., Ltd. (Paper & Forest Products) | | | 6,320 | | | $ | 34,135 | |
Nexen Corp. (Auto Components) | | | 133 | | | | 9,817 | |
Poongsan Corp. (Metals & Mining) | | | 2,400 | | | | 65,040 | |
Poongsan Holdings Corp. (Metals & Mining) | | | 1,230 | | | | 34,265 | |
¨POSCO (Metals & Mining) | | | 5,450 | | | | 1,686,099 | |
¨POSCO, ADR (Metals & Mining) | | | 90,893 | | | | 7,089,654 | |
S&T Dynamics Co., Ltd. (Aerospace & Defense) | | | 2,240 | | | | 27,062 | |
S&T Motiv Co., Ltd. (Auto Components) | | | 750 | | | | 19,401 | |
Samsung C&T Corp. (Trading Companies & Distributors) | | | 2,909 | | | | 167,040 | |
Samsung Electronics Co., Ltd. (Semiconductors & Semiconductor Equipment) | | | 1,876 | | | | 2,438,880 | |
Samsung Heavy Industries Co., Ltd. (Machinery) | | | 52,190 | | | | 1,881,679 | |
Samsung Life Insurance Co., Ltd. (Insurance) | | | 709 | | | | 69,869 | |
Samsung SDI Co., Ltd. (Electronic Equipment, Instruments & Components) | | | 1,760 | | | | 270,166 | |
¨Shinhan Financial Group Co., Ltd. (Commercial Banks) | | | 284,920 | | | | 12,769,902 | |
Shinsegae Co., Ltd. (Multiline Retail) | | | 15,395 | | | | 3,683,363 | |
Shinsung Solar Energy Co., Ltd. (Semiconductors & Semiconductor Equipment) (a) | | | 11,829 | | | | 12,666 | |
SK Chemicals Co., Ltd. (Chemicals) | | | 1,420 | | | | 74,273 | |
SK Gas Co., Ltd. (Oil, Gas & Consumable Fuels) | | | 664 | | | | 47,125 | |
SK Holdings Co., Ltd. (Industrial Conglomerates) | | | 2,310 | | | | 418,070 | |
SK Innovation Co., Ltd. (Oil, Gas & Consumable Fuels) | | | 3,716 | | | | 498,237 | |
SK Networks Co., Ltd. (Trading Companies & Distributors) | | | 13,210 | | | | 94,630 | |
SK Securities Co., Ltd. (Capital Markets) (a) | | | 29,350 | | | | 19,718 | |
SKC Co., Ltd. (Chemicals) | | | 900 | | | | 26,053 | |
Ssangyong Cement Industrial Co., Ltd. (Construction Materials) (a) | | | 7,890 | | | | 51,212 | |
STX Pan Ocean Co., Ltd. (Marine) (a)(b)(c) | | | 13,480 | | | | 9,733 | |
Taekwang Industrial Co., Ltd. (Chemicals) | | | 30 | | | | 36,670 | |
UNID Co., Ltd. (Chemicals) | | | 639 | | | | 35,845 | |
Woori Finance Holdings Co., Ltd. (Commercial Banks) | | | 32,240 | | | | 406,303 | |
Woori Investment & Securities Co., Ltd. (Capital Markets) | | | 5,890 | | | | 53,523 | |
Youlchon Chemical Co., Ltd. (Containers & Packaging) | | | 4,830 | | | | 53,776 | |
| | | | | | | | |
| | | | | | | 80,417,861 | |
| | | | | | | | |
| | | | | | | | |
| | | Shares | | | Value | |
Russia 6.6% | | | | | | | | |
Federal Hydrogenerating Co. JSC, ADR (Electric Utilities) | | | 165,341 | | | $ | 285,379 | |
¨Gazprom OAO, Sponsored ADR (Oil, Gas & Consumable Fuels) | | | 915,388 | | | | 7,866,112 | |
Magnitogorsk Iron & Steel Works, GDR (Metals & Mining) (a) | | | 18,065 | | | | 54,159 | |
Mechel, Sponsored ADR (Metals & Mining) (a) | | | 1,024 | | | | 2,621 | |
¨Novolipetsk Steel OJSC, GDR (Metals & Mining) | | | 464,926 | | | | 7,852,600 | |
Phosagro OAO, GDR (Chemicals) | | | 160,061 | | | | 1,566,197 | |
Sberbank of Russia, Sponsored ADR (Commercial Banks) | | | 507,079 | | | | 6,379,054 | |
| | | | | | | | |
| | | | | | | 24,006,122 | |
| | | | | | | | |
South Africa 6.8% | | | | | | | | |
Adcorp Holdings, Ltd. (Professional Services) | | | 1,224 | | | | 3,792 | |
African Bank Investments, Ltd. (Diversified Financial Services) | | | 30,700 | | | | 35,266 | |
African Rainbow Minerals, Ltd. (Metals & Mining) | | | 14,451 | | | | 260,366 | |
Allied Electronics Corp., Ltd. (Industrial Conglomerates) | | | 5,283 | | | | 11,961 | |
AngloGold Ashanti, Ltd., Sponsored ADR (Metals & Mining) | | | 172,620 | | | | 2,023,106 | |
ArcelorMittal South Africa, Ltd. (Metals & Mining) (a) | | | 20,652 | | | | 73,434 | |
Aveng, Ltd. (Construction & Engineering) (a) | | | 46,337 | | | | 116,792 | |
Barclays Africa Group, Ltd. (Commercial Banks) | | | 234,127 | | | | 2,951,696 | |
Barloworld, Ltd. (Trading Companies & Distributors) | | | 28,094 | | | | 267,844 | |
Blue Label Telecoms, Ltd. (Commercial Services & Supplies) | | | 45,597 | | | | 36,947 | |
Business Connexion Group, Ltd. (IT Services) | | | 16,350 | | | | 8,557 | |
Clover Industries, Ltd. (Food Products) | | | 4,236 | | | | 7,349 | |
DataTec, Ltd. (Electronic Equipment, Instruments & Components) | | | 15,459 | | | | 76,322 | |
DRDGOLD, Ltd., Sponsored ADR (Metals & Mining) | | | 5,200 | | | | 19,188 | |
Eqstra Holdings, Ltd. (Trading Companies & Distributors) | | | 12,633 | | | | 9,634 | |
Gold Fields, Ltd. (Metals & Mining) | | | 15,436 | | | | 48,398 | |
Gold Fields, Ltd., Sponsored ADR (Metals & Mining) | | | 39,342 | | | | 125,894 | |
Grindrod, Ltd. (Marine) | | | 50,593 | | | | 135,188 | |
Group Five, Ltd. (Construction & Engineering) | | | 16,436 | | | | 63,519 | |
| | | | |
| M-128 | | MainStay VP DFA / DuPont Capital Emerging Markets Equity Portfolio | | The notes to the financial statements are an integral part of,
and should be read in conjunction with, the financial statements. |
| | | | | | | | |
| | | Shares | | | Value | |
| Common Stocks (continued) | | | | | | | | |
South Africa (continued) | | | | | | | | |
Harmony Gold Mining Co., Ltd., Sponsored ADR (Metals & Mining) | | | 52,500 | | | $ | 132,825 | |
Hulamin, Ltd. (Metals & Mining) (a) | | | 3,311 | | | | 1,626 | |
Impala Platinum Holdings, Ltd. (Metals & Mining) | | | 218,168 | | | | 2,558,119 | |
Investec, Ltd. (Capital Markets) | | | 30,427 | | | | 216,093 | |
JD Group, Ltd. (Specialty Retail) | | | 12,447 | | | | 34,422 | |
Lewis Group, Ltd. (Specialty Retail) | | | 11,215 | | | | 75,800 | |
MMI Holdings, Ltd. (Insurance) | | | 134,087 | | | | 323,394 | |
Mondi, Ltd. (Paper & Forest Products) | | | 6,288 | | | | 107,717 | |
Mpact, Ltd. (Containers & Packaging) | | | 3,473 | | | | 8,906 | |
MTN Group, Ltd. (Wireless Telecommunication Services) | | | 312,408 | | | | 6,463,183 | |
Nedbank Group, Ltd. (Commercial Banks) | | | 27,443 | | | | 549,383 | |
Northam Platinum, Ltd. (Metals & Mining) (a) | | | 19,499 | | | | 78,070 | |
Petmin, Ltd. (Metals & Mining) | | | 91,673 | | | | 16,779 | |
PPC, Ltd. (Construction Materials) | | | 410,476 | | | | 1,228,689 | |
Raubex Group, Ltd. (Construction & Engineering) | | | 12,126 | | | | 25,142 | |
Reunert, Ltd. (Industrial Conglomerates) | | | 368,768 | | | | 2,408,066 | |
Royal Bafokeng Platinum, Ltd. (Metals & Mining) (a) | | | 6,699 | | | | 37,678 | |
Sappi, Ltd. (Paper & Forest Products) (a) | | | 422,321 | | | | 1,318,495 | |
Sibanye Gold, Ltd. (Metals & Mining) | | | 15,436 | | | | 18,099 | |
Sibanye Gold, Ltd., Sponsored ADR (Metals & Mining) | | | 9,835 | | | | 47,306 | |
Standard Bank Group, Ltd. (Commercial Banks) | | | 139,880 | | | | 1,725,765 | |
Steinhoff International Holdings, Ltd. (Household Durables) | | | 162,593 | | | | 699,506 | |
Super Group, Ltd. (Specialty Retail) (a) | | | 4,012 | | | | 10,001 | |
Telkom SA SOC, Ltd. (Diversified Telecommunication Services) (a) | | | 35,206 | | | | 93,972 | |
Tongaat Hulett, Ltd. (Food Products) | | | 14,198 | | | | 153,891 | |
Trencor, Ltd. (Marine) | | | 19,868 | | | | 130,686 | |
Zeder Investments, Ltd. (Capital Markets) | | | 33,798 | | | | 13,854 | |
| | | | | | | | |
| | | | | | | 24,752,720 | |
| | | | | | | | |
Taiwan 7.7% | | | | | | | | |
Ability Enterprise Co., Ltd. (Leisure Equipment & Products) | | | 43,000 | | | | 27,124 | |
Accton Technology Corp. (Communications Equipment) | | | 58,000 | | | | 30,651 | |
Acer, Inc. (Computers & Peripherals) (a) | | | 241,000 | | | | 147,979 | |
Advanced Semiconductor Engineering, Inc. (Semiconductors & Semiconductor Equipment) | | | 2,415,000 | | | | 2,244,552 | |
AGV Products Corp. (Food Products) (a) | | | 89,000 | | | | 27,473 | |
| | | | | | | | |
| | | Shares | | | Value | |
Taiwan (continued) | | | | | | | | |
Alpha Networks, Inc. (Communications Equipment) | | | 22,000 | | | $ | 15,944 | |
Altek Corp. (Leisure Equipment & Products) | | | 40,000 | | | | 28,117 | |
Ambassador Hotel (The) (Hotels, Restaurants & Leisure) | | | 21,000 | | | | 20,962 | |
AmTRAN Technology Co., Ltd. (Household Durables) | | | 88,000 | | | | 59,644 | |
Ardentec Corp. (Semiconductors & Semiconductor Equipment) | | | 43,430 | | | | 31,913 | |
Asia Optical Co., Inc. (Leisure Equipment & Products) (a) | | | 31,000 | | | | 30,580 | |
Asia Vital Components Co., Ltd. (Computers & Peripherals) | | | 48,288 | | | | 32,890 | |
AU Optronics Corp., Sponsored ADR (Electronic Equipment, Instruments & Components) (a) | | | 83,462 | | | | 260,401 | |
Audix Corp. (Electrical Equipment) | | | 15,000 | | | | 15,703 | |
AVerMedia Technologies, Inc. (Household Durables) | | | 36,000 | | | | 15,763 | |
Bank of Kaohsiung (Commercial Banks) | | | 111,980 | | | | 35,844 | |
BES Engineering Corp. (Construction & Engineering) | | | 155,000 | | | | 46,755 | |
Biostar Microtech International Corp. (Computers & Peripherals) | | | 68,000 | | | | 29,091 | |
Capital Securities Corp. (Capital Markets) | | | 154,000 | | | | 57,097 | |
Carnival Industrial Corp. (Textiles, Apparel & Luxury Goods) | | | 100,000 | | | | 29,091 | |
Champion Building Materials Co., Ltd. (Building Products) (a) | | | 70,000 | | | | 30,768 | |
Chang Hwa Commercial Bank (Commercial Banks) | | | 442,639 | | | | 272,533 | |
Charoen Pokphand Enterprise Taiwan Co., Ltd. (Food Products) | | | 70,000 | | | | 37,110 | |
Cheng Loong Corp. (Containers & Packaging) | | | 109,000 | | | | 52,482 | |
Cheng Uei Precision Industry Co., Ltd. (Electronic Equipment, Instruments & Components) | | | 14,000 | | | | 28,091 | |
Chia Hsin Cement Corp. (Construction Materials) (a) | | | 78,280 | | | | 41,237 | |
Chien Kuo Construction Co., Ltd. (Construction & Engineering) | | | 73,000 | | | | 34,046 | |
Chimei Innolux Corp. (Electronic Equipment, Instruments & Components) (a) | | | 647,907 | | | | 246,741 | |
China Airlines, Ltd. (Airlines) (a) | | | 212,000 | | | | 77,890 | |
China Development Financial Holding Corp. (Commercial Banks) | | | 1,034,000 | | | | 312,245 | |
China Electric Manufacturing Corp. (Electrical Equipment) | | | 50,000 | | | | 23,990 | |
China General Plastics Corp. (Chemicals) | | | 70,220 | | | | 39,818 | |
| | | | | | |
The notes to the financial statements are an integral part of,
and should be read in conjunction with, the financial statements. | | mainstayinvestments.com | | | M-129 | |
Portfolio of Investments December 31, 2013 (continued)
| | | | | | | | |
| | | Shares | | | Value | |
| Common Stocks (continued) | | | | | | | | |
Taiwan (continued) | | | | | | | | |
China Man-Made Fiber Corp. (Chemicals) (a) | | | 118,000 | | | $ | 49,887 | |
China Motor Corp. (Automobiles) | | | 67,000 | | | | 64,856 | |
China Petrochemical Development Corp. (Chemicals) | | | 192,600 | | | | 87,888 | |
China Synthetic Rubber Corp. (Chemicals) | | | 53,000 | | | | 49,971 | |
Chinese Maritime Transport, Ltd. (Marine) | | | 23,000 | | | | 31,255 | |
Chipbond Technology Corp. (Semiconductors & Semiconductor Equipment) | | | 976,000 | | | | 1,534,236 | |
Chung Hsin Electric & Machinery Manufacturing Corp. (Construction & Engineering) | | | 54,000 | | | | 40,948 | |
Chung Hung Steel Corp. (Metals & Mining) (a) | | | 103,000 | | | | 29,583 | |
Chunghwa Picture Tubes Ltd. (Electronic Equipment, Instruments & Components) (a) | | | 485,000 | | | | 32,546 | |
CMC Magnetics Corp. (Computers & Peripherals) (a) | | | 266,000 | | | | 43,733 | |
Compal Electronics, Inc. (Computers & Peripherals) | | | 8,244,000 | | | | 6,320,580 | |
Compeq Manufacturing Co. (Electronic Equipment, Instruments & Components) | | | 107,000 | | | | 62,649 | |
Continental Holdings Corp. (Construction & Engineering) | | | 82,000 | | | | 29,577 | |
Coretronic Corp. (Electronic Equipment, Instruments & Components) | | | 84,000 | | | | 83,004 | |
Coxon Precise Industrial Co., Ltd. (Electronic Equipment, Instruments & Components) | | | 15,000 | | | | 23,655 | |
CSBC Corp. Taiwan (Machinery) | | | 48,410 | | | | 31,187 | |
D-Link Corp. (Communications Equipment) | | | 70,000 | | | | 42,394 | |
E Ink Holdings, Inc. (Electronic Equipment, Instruments & Components) (a) | | | 75,000 | | | | 41,144 | |
E.Sun Financial Holding Co., Ltd. (Commercial Banks) | | | 460,610 | | | | 306,007 | |
Eastern Media International Corp. (Commercial Services & Supplies) (a) | | | 116,281 | | | | 59,109 | |
Epistar Corp. (Semiconductors & Semiconductor Equipment) (a) | | | 67,000 | | | | 129,039 | |
Eternal Chemical Co., Ltd. (Chemicals) | | | 38,000 | | | | 36,975 | |
Evergreen International Storage & Transport Corp. (Road & Rail) | | | 63,000 | | | | 43,968 | |
Evergreen Marine Corp. Taiwan, Ltd. (Marine) (a) | | | 166,000 | | | | 101,371 | |
Excelsior Medical Co., Ltd. (Health Care Providers & Services) | | | 16,500 | | | | 32,775 | |
| | | | | | | | |
| | | Shares | | | Value | |
Taiwan (continued) | | | | | | | | |
Far Eastern International Bank (Commercial Banks) | | | 154,746 | | | $ | 64,643 | |
First Financial Holding Co., Ltd. (Commercial Banks) | | | 672,909 | | | | 418,825 | |
First Insurance Co., Ltd. (Insurance) | | | 63,000 | | | | 41,537 | |
First Steamship Co., Ltd. (Marine) | | | 12,881 | | | | 8,622 | |
Forhouse Corp. (Semiconductors & Semiconductor Equipment) | | | 52,000 | | | | 19,716 | |
Formosa Epitaxy, Inc. (Semiconductors & Semiconductor Equipment) (a) | | | 41,000 | | | | 23,455 | |
Formosa Taffeta Co., Ltd. (Textiles, Apparel & Luxury Goods) | | | 82,000 | | | | 99,186 | |
Formosan Rubber Group, Inc. (Chemicals) | | | 52,000 | | | | 48,941 | |
FSP Technology, Inc. (Electrical Equipment) | | | 35,000 | | | | 31,943 | |
Fubon Financial Holding Co., Ltd. (Diversified Financial Services) | | | 725,462 | | | | 1,061,290 | |
Fulltech Fiber Glass Corp. (Electronic Equipment, Instruments & Components) (a) | | | 30,772 | | | | 11,977 | |
Fwusow Industry Co., Ltd. (Food Products) | | | 59,976 | | | | 29,582 | |
Gemtek Technology Corp. (Communications Equipment) | | | 36,000 | | | | 34,063 | |
Getac Technology Corp. (Computers & Peripherals) | | | 43,000 | | | | 22,291 | |
Gigabyte Technology Co., Ltd. (Computers & Peripherals) | | | 61,000 | | | | 73,683 | |
Gintech Energy Corp. (Semiconductors & Semiconductor Equipment) (a) | | | 35,000 | | | | 39,928 | |
Global Brands Manufacture, Ltd. (Electronic Equipment, Instruments & Components) (a) | | | 73,257 | | | | 25,809 | |
Gloria Material Technology Corp. (Metals & Mining) | | | 26,250 | | | | 19,201 | |
Gold Circuit Electronics, Ltd. (Electronic Equipment, Instruments & Components) (a) | | | 115,000 | | | | 27,782 | |
Goldsun Development & Construction Co., Ltd. (Construction Materials) | | | 145,000 | | | | 60,328 | |
Grand Pacific Petrochemical Corp. (Chemicals) | | | 95,000 | | | | 73,792 | |
Green Energy Technology, Inc. (Semiconductors & Semiconductor Equipment) (a) | | | 29,825 | | | | 31,423 | |
HannStar Display Corp. (Electronic Equipment, Instruments & Components) (a) | | | 193,000 | | | | 71,557 | |
Harvatek Corp. (Semiconductors & Semiconductor Equipment) (a) | | | 57,570 | | | | 31,679 | |
Hey Song Corp. (Beverages) | | | 22,500 | | | | 26,423 | |
Ho Tung Chemical Corp. (Chemicals) | | | 109,200 | | | | 52,762 | |
| | | | |
| M-130 | | MainStay VP DFA / DuPont Capital Emerging Markets Equity Portfolio | | The notes to the financial statements are an integral part of,
and should be read in conjunction with, the financial statements. |
| | | | | | | | |
| | | Shares | | | Value | |
| Common Stocks (continued) | | | | | | | | |
Taiwan (continued) | | | | | | | | |
Holy Stone Enterprise Co., Ltd. (Electronic Equipment, Instruments & Components) | | | 7,700 | | | $ | 9,766 | |
Hua Nan Financial Holdings Co., Ltd. (Commercial Banks) | | | 250,950 | | | | 146,511 | |
Hung Poo Real Estate Development Corp. (Real Estate Management & Development) | | | 40,000 | | | | 40,398 | |
Inotera Memories, Inc. (Semiconductors & Semiconductor Equipment) (a) | | | 193,000 | | | | 142,466 | |
ITE Technology, Inc. (Semiconductors & Semiconductor Equipment) | | | 25,472 | | | | 21,879 | |
King Yuan Electronics Co., Ltd. (Semiconductors & Semiconductor Equipment) | | | 136,000 | | | | 93,318 | |
Kinpo Electronics (Household Durables) | | | 6,000 | | | | 2,204 | |
Kwong Fong Industries Corp. (Textiles, Apparel & Luxury Goods) | | | 54,400 | | | | 35,684 | |
KYE Systems Corp. (Computers & Peripherals) | | | 71,000 | | | | 29,064 | |
L&K Engineering Co., Ltd. (Commercial Services & Supplies) | | | 23,000 | | | | 21,994 | |
Lealea Enterprise Co., Ltd. (Textiles, Apparel & Luxury Goods) | | | 88,580 | | | | 32,991 | |
Leofoo Development Co. Ltd. (Hotels, Restaurants & Leisure) (a) | | | 27,000 | | | | 11,279 | |
Li Peng Enterprise Co., Ltd. (Textiles, Apparel & Luxury Goods) (a) | | | 49,926 | | | | 24,290 | |
Lien Hwa Industrial Corp. (Food Products) | | | 57,000 | | | | 37,103 | |
Lingsen Precision Industries, Ltd. (Semiconductors & Semiconductor Equipment) | | | 52,000 | | | | 28,178 | |
Lite-On Semiconductor Corp. (Semiconductors & Semiconductor Equipment) | | | 23,000 | | | | 14,933 | |
Macronix International Co., Ltd. (Semiconductors & Semiconductor Equipment) (a) | | | 414,154 | | | | 93,243 | |
Marketech International Corp. (Electronic Equipment, Instruments & Components) | | | 47,000 | | | | 28,071 | |
Masterlink Securities Corp. (Capital Markets) | | | 102,000 | | | | 35,422 | |
Mega Financial Holding Co., Ltd. (Commercial Banks) | | | 1,027,866 | | | | 865,651 | |
Mercuries & Associates, Ltd. (Multiline Retail) | | | 17,280 | | | | 12,234 | |
Micro-Star International Co., Ltd. (Computers & Peripherals) | | | 92,000 | | | | 74,703 | |
Mirle Automation Corp. (Machinery) | | | 46,350 | | | | 39,502 | |
| | | | | | | | |
| | | Shares | | | Value | |
Taiwan (continued) | | | | | | | | |
Mitac Holdings Corp. (Computers & Peripherals) (a) | | | 64,000 | | | $ | 61,845 | |
Nan Ya Printed Circuit Board Corp. (Electronic Equipment, Instruments & Components) (a) | | | 23,000 | | | | 28,785 | |
Nien Hsing Textile Co., Ltd. (Textiles, Apparel & Luxury Goods) | | | 34,909 | | | | 35,959 | |
Novatek Microelectronics Corp. (Semiconductors & Semiconductor Equipment) | | | 1,021,000 | | | | 4,179,442 | |
Opto Technology Corp. (Semiconductors & Semiconductor Equipment) | | | 76,000 | | | | 32,385 | |
Pan-International Industrial Corp. (Electronic Equipment, Instruments & Components) | | | 42,420 | | | | 32,309 | |
Pegatron Corp. (Computers & Peripherals) | | | 157,000 | | | | 202,285 | |
Phihong Technology Co., Ltd. (Electrical Equipment) | | | 20,000 | | | | 12,683 | |
Powertech Technology, Inc. (Semiconductors & Semiconductor Equipment) | | | 119,000 | | | | 181,873 | |
President Securities Corp. (Capital Markets) | | | 88,580 | | | | 52,607 | |
Qisda Corp. (Computers & Peripherals) (a) | | | 176,000 | | | | 43,286 | |
Radium Life Tech Co., Ltd. (Real Estate Management & Development) | | | 5,935 | | | | 4,769 | |
Richtek Technology Corp. (Semiconductors & Semiconductor Equipment) | | | 6,000 | | | | 27,983 | |
Ritek Corp. (Computers & Peripherals) (a) | | | 299,000 | | | | 50,663 | |
Sheng Yu Steel Co., Ltd. (Metals & Mining) | | | 44,000 | | | | 33,144 | |
Shih Wei Navigation Co., Ltd. (Marine) | | | 39,989 | | | | 28,311 | |
Shihlin Electric & Engineering Corp. (Electrical Equipment) | | | 30,000 | | | | 38,251 | |
Shin Kong Financial Holding Co., Ltd. (Insurance) | | | 762,050 | | | | 263,362 | |
Shinkong Synthetic Fibers Corp. (Chemicals) | | | 174,000 | | | | 61,010 | |
Sigurd Microelectronics Corp. (Semiconductors & Semiconductor Equipment) | | | 67,000 | | | | 63,957 | |
Silicon Integrated Systems Corp. (Semiconductors & Semiconductor Equipment) (a) | | | 86,000 | | | | 25,682 | |
Sino-American Silicon Products, Inc. (Semiconductors & Semiconductor Equipment) (a) | | | 44,000 | | | | 74,850 | |
Sinon Corp. (Chemicals) | | | 37,000 | | | | 20,732 | |
SinoPac Financial Holdings Co., Ltd. (Commercial Banks) | | | 614,937 | | | | 306,401 | |
Solar Applied Materials Technology Co. (Chemicals) | | | 22,000 | | | | 18,823 | |
| | | | | | |
The notes to the financial statements are an integral part of,
and should be read in conjunction with, the financial statements. | | mainstayinvestments.com | | | M-131 | |
Portfolio of Investments December 31, 2013 (continued)
| | | | | | | | |
| | | Shares | | | Value | |
| Common Stocks (continued) | | | | | | | | |
Taiwan (continued) | | | | | | | | |
Sunrex Technology Corp. (Computers & Peripherals) | | | 47,000 | | | $ | 18,214 | |
Supreme Electronics Co., Ltd. (Electronic Equipment, Instruments & Components) | | | 64,760 | | | | 32,702 | |
TA Chen Stainless Pipe Co., Ltd. (Metals & Mining) (a) | | | 12,100 | | | | 5,724 | |
Ta Chong Bank, Ltd. (Commercial Banks) (a) | | | 171,124 | | | | 62,298 | |
TA-I Technology Co., Ltd. (Semiconductors & Semiconductor Equipment) | | | 22,278 | | | | 11,399 | |
Tah Hsin Industrial Co., Ltd. (Textiles, Apparel & Luxury Goods) | | | 31,000 | | | | 31,204 | |
Taichung Commercial Bank (Commercial Banks) | | | 169,214 | | | | 62,170 | |
Tainan Enterprises Co., Ltd. (Textiles, Apparel & Luxury Goods) | | | 28,000 | | | | 29,406 | |
Tainan Spinning Co., Ltd. (Textiles, Apparel & Luxury Goods) | | | 113,680 | | | | 80,291 | |
Taishin Financial Holding Co., Ltd. (Commercial Banks) | | | 607,343 | | | | 298,541 | |
Taisun Enterprise Co., Ltd. (Food Products) (a) | | | 9,070 | | | | 4,063 | |
Taiwan Business Bank (Commercial Banks) (a) | | | 364,499 | | | | 110,927 | |
Taiwan Cogeneration Corp. (Independent Power Producers & Energy Traders) | | | 30,000 | | | | 17,515 | |
Taiwan Cooperative Financial Holding (Commercial Banks) | | | 181,260 | | | | 99,134 | |
Taiwan Land Development Corp. (Real Estate Management & Development) (a) | | | 18,046 | | | | 6,630 | |
Taiwan PCB Techvest Co., Ltd. (Electronic Equipment, Instruments & Components) | | | 13,933 | | | | 16,643 | |
Taiwan Surface Mounting Technology Co., Ltd. (Semiconductors & Semiconductor Equipment) | | | 18,900 | | | | 28,537 | |
Taiwan TEA Corp. (Food & Staples Retailing) (a) | | | 61,000 | | | | 51,168 | |
Taiyen Biotech Co., Ltd. (Food Products) | | | 33,082 | | | | 34,133 | |
Tatung Co., Ltd. (Household Durables) (a) | | | 219,000 | | | | 60,769 | |
Thinking Electronic Industrial Co., Ltd. (Electronic Equipment, Instruments & Components) | | | 14,000 | | | | 18,649 | |
Tong-Tai Machine & Tool Co., Ltd. (Machinery) | | | 32,252 | | | | 29,110 | |
| | | | | | | | |
| | | Shares | | | Value | |
Taiwan (continued) | | | | | | | | |
Topoint Technology Co., Ltd. (Electronic Equipment, Instruments & Components) | | | 18,638 | | | $ | 13,164 | |
TPK Holding Co., Ltd. (Electronic Equipment, Instruments & Components) | | | 131,000 | | | | 773,600 | |
Tung Ho Steel Enterprise Corp. (Metals & Mining) | | | 87,000 | | | | 76,481 | |
Tycoons Group Enterprise (Machinery) (a) | | | 156,000 | | | | 29,574 | |
Tyntek Corp. (Semiconductors & Semiconductor Equipment) (a) | | | 85,109 | | | | 22,446 | |
Unimicron Technology Corp. (Electronic Equipment, Instruments & Components) | | | 118,000 | | | | 89,479 | |
United Microelectronics Corp. (Semiconductors & Semiconductor Equipment) | | | 1,187,000 | | | | 491,870 | |
Universal Cement Corp. (Construction Materials) | | | 59,000 | | | | 55,925 | |
UPC Technology Corp. (Chemicals) | | | 73,889 | | | | 35,825 | |
Wafer Works Corp. (Semiconductors & Semiconductor Equipment) (a) | | | 36,000 | | | | 20,112 | |
Wah Lee Industrial Corp. (Electronic Equipment, Instruments & Components) | | | 5,000 | | | | 7,944 | |
Walsin Lihwa Corp. (Electrical Equipment) (a) | | | 246,000 | | | | 78,909 | |
Walton Advanced Engineering, Inc. (Semiconductors & Semiconductor Equipment) (a) | | | 87,000 | | | | 31,235 | |
Wan Hai Lines, Ltd. (Marine) | | | 105,000 | | | | 54,608 | |
Winbond Electronics Corp. (Semiconductors & Semiconductor Equipment) (a) | | | 327,000 | | | | 87,775 | |
Wintek Corp. (Electronic Equipment, Instruments & Components) (a) | | | 177,000 | | | | 61,765 | |
Wistron Corp. (Computers & Peripherals) | | | 175,770 | | | | 147,736 | |
WT Microelectronics Co., Ltd. (Electronic Equipment, Instruments & Components) | | | 7,209 | | | | 8,526 | |
WUS Printed Circuit Co., Ltd. (Electronic Equipment, Instruments & Components) | | | 80,000 | | | | 34,493 | |
Yageo Corp. (Electronic Equipment, Instruments & Components) (a) | | | 142,800 | | | | 51,507 | |
Yang Ming Marine Transport Corp. (Marine) (a) | | | 85,000 | | | | 39,786 | |
Yem Chio Co., Ltd. (Commercial Services & Supplies) | | | 57,565 | | | | 42,976 | |
Yieh Phui Enterprise Co., Ltd. (Metals & Mining) (a) | | | 108,120 | | | | 35,117 | |
| | | | |
| M-132 | | MainStay VP DFA / DuPont Capital Emerging Markets Equity Portfolio | | The notes to the financial statements are an integral part of,
and should be read in conjunction with, the financial statements. |
| | | | | | | | |
| | | Shares | | | Value | |
| Common Stocks (continued) | | | | | | | | |
Taiwan (continued) | | | | | | | | |
Young Fast Optoelectronics Co., Ltd. (Electronic Equipment, Instruments & Components) | | | 7,000 | | | $ | 7,469 | |
Yuanta Financial Holding Co., Ltd. (Capital Markets) | | | 813,000 | | | | 485,560 | |
Yuen Foong Yu Paper Manufacturing Co., Ltd. (Paper & Forest Products) | | | 50,000 | | | | 24,997 | |
Yulon Motor Co., Ltd. (Automobiles) | | | 77,000 | | | | 139,514 | |
Zig Sheng Industrial Co., Ltd. (Textiles, Apparel & Luxury Goods) (a) | | | 83,187 | | | | 28,889 | |
| | | | | | | | |
| | | | | | | 27,952,090 | |
| | | | | | | | |
Thailand 3.0% | | | | | | | | |
AP Thailand PCL (Real Estate Management & Development) | | | 103,800 | | | | 13,899 | |
Bangchak Petroleum PCL (Oil, Gas & Consumable Fuels) | | | 73,400 | | | | 62,544 | |
Bangkok Bank PCL (Commercial Banks) | | | 95,300 | | | | 516,232 | |
Bangkok Expressway PCL (Transportation Infrastructure) | | | 38,000 | | | | 38,740 | |
Bangkokland PCL (Real Estate Management & Development) | | | 973,000 | | | | 45,600 | |
Banpu PCL (Oil, Gas & Consumable Fuels) | | | 116,000 | | | | 106,786 | |
Calcomp Electronics Thailand PCL (Electronic Equipment, Instruments & Components) | | | 35,800 | | | | 3,225 | |
Esso Thailand PCL (Oil, Gas & Consumable Fuels) | | | 184,300 | | | | 33,652 | |
Hana Microelectronics PCL (Electronic Equipment, Instruments & Components) | | | 57,800 | | | | 44,414 | |
IRPC PCL (Oil, Gas & Consumable Fuels) | | | 882,200 | | | | 87,522 | |
Kasikornbank PCL, NVDR (Commercial Banks) | | | 405,600 | | | | 1,925,551 | |
KGI Securities Thailand PCL (Capital Markets) | | | 154,700 | | | | 13,370 | |
Kiatnakin Bank PCL (Commercial Banks) | | | 35,000 | | | | 39,676 | |
Krung Thai Bank PCL (Commercial Banks) | | | 374,800 | | | | 188,198 | |
LH Financial Group PCL (Commercial Banks) | | | 411,783 | | | | 15,414 | |
Polyplex PCL (Containers & Packaging) | | | 67,000 | | | | 18,860 | |
Precious Shipping PCL (Marine) | | | 59,500 | | | | 38,568 | |
Property Perfect PCL (Real Estate Management & Development) | | | 790,500 | | | | 21,892 | |
PTT Global Chemical PCL (Chemicals) | | | 239,900 | | | | 576,753 | |
PTT PCL (Oil, Gas & Consumable Fuels) | | | 63,400 | | | | 551,808 | |
Saha-Union PCL (Textiles, Apparel & Luxury Goods) | | | 31,200 | | | | 34,181 | |
Sahaviriya Steel Industries PCL (Metals & Mining) (a) | | | 1,232,200 | | | | 11,250 | |
| | | | | | | | |
| | | Shares | | | Value | |
Thailand (continued) | | | | | | | | |
Sri Trang Agro-Industry PCL (Auto Components) | | | 70,700 | | | $ | 27,970 | |
Tata Steel Thailand PCL (Metals & Mining) (a) | | | 521,500 | | | | 11,417 | |
Thai Airways International PCL (Airlines) | | | 116,300 | | | | 48,842 | |
Thai Oil PCL (Oil, Gas & Consumable Fuels) | | | 3,713,100 | | | | 6,356,113 | |
Thanachart Capital PCL (Commercial Banks) | | | 70,400 | | | | 69,093 | |
Thoresen Thai Agencies PCL (Marine) (a) | | | 64,120 | | | | 33,953 | |
TPI Polene PCL (Construction Materials) | | | 97,000 | | | | 31,881 | |
Vinythai PCL (Chemicals) | | | 51,000 | | | | 16,296 | |
| | | | | | | | |
| | | | | | | 10,983,700 | |
| | | | | | | | |
Turkey 0.7% | | | | | | | | |
Adana Cimento Sanayii TAS Class A (Construction Materials) | | | 15,372 | | | | 25,823 | |
Akenerji Elektrik Uretim AS (Independent Power Producers & Energy Traders) (a) | | | 33,348 | | | | 18,621 | |
Aksa Akrilik Kimya Sanayii (Textiles, Apparel & Luxury Goods) | | | 13,078 | | | | 48,807 | |
Albaraka Turk Katilim Bankasi AS (Commercial Banks) (a) | | | 15,022 | | | | 10,765 | |
Anadolu Cam Sanayii AS (Containers & Packaging) | | | 22,615 | | | | 20,205 | |
Anadolu Sigorta (Insurance) (a) | | | 55,356 | | | | 34,259 | |
Asya Katilim Bankasi AS (Commercial Banks) (a) | | | 63,974 | | | | 43,165 | |
Dogan Sirketler Grubu Holding AS (Industrial Conglomerates) (a) | | | 111,747 | | | | 37,440 | |
EIS Eczacibasi Ilac ve Sinai ve Finansal Yatirimlar Sanayi ve Ticaret AS (Pharmaceuticals) | | | 33,519 | | | | 32,911 | |
Eregli Demir ve Celik Fabrikalari TAS (Metals & Mining) | | | 113,087 | | | | 135,768 | |
Gentas Genel Metal Sanayi ve Ticaret AS (Commercial Services & Supplies) | | | 39,557 | | | | 21,536 | |
Global Yatirim Holding AS (Diversified Financial Services) | | | 55,866 | | | | 30,416 | |
GSD Holding (Commercial Banks) (a) | | | 33,976 | | | | 13,755 | |
Ihlas Holding AS (Industrial Conglomerates) (a) | | | 87,504 | | | | 17,102 | |
Kardemir Karabuk Demir Celik Sanayi ve Ticaret AS Class A (Metals & Mining) (a) | | | 32,125 | | | | 28,552 | |
Kardemir Karabuk Demir Celik Sanayi ve Ticaret AS Class D (Metals & Mining) (a) | | | 785 | | | | 387 | |
KOC Holding AS (Industrial Conglomerates) | | | 47,218 | | | | 193,354 | |
Petkim Petrokimya Holding AS (Chemicals) (a) | | | 6,352 | | | | 8,069 | |
Polyester Sanayi AS (Chemicals) (a) | | | 47,176 | | | | 19,318 | |
Sekerbank TAS (Commercial Banks) (a) | | | 21,585 | | | | 20,892 | |
Soda Sanayii AS (Chemicals) | | | 23,487 | | | | 28,416 | |
| | | | | | |
The notes to the financial statements are an integral part of,
and should be read in conjunction with, the financial statements. | | mainstayinvestments.com | | | M-133 | |
Portfolio of Investments December 31, 2013 (continued)
| | | | | | | | |
| | | Shares | | | Value | |
| Common Stocks (continued) | | | | | | | | |
Turkey (continued) | | | | | | | | |
Tekfen Holding AS (Construction & Engineering) | | | 14,345 | | | $ | 33,443 | |
Trakya Cam Sanayi AS (Building Products) | | | 27,528 | | | | 32,537 | |
Turcas Petrol AS (Oil, Gas & Consumable Fuels) | | | 19,924 | | | | 23,086 | |
Turkiye Halk Bankasi AS (Commercial Banks) | | | 201,404 | | | | 1,138,696 | |
Turkiye Is Bankasi Class C (Commercial Banks) | | | 143,030 | | | | 309,488 | |
Turkiye Sinai Kalkinma Bankasi AS (Commercial Banks) | | | 39,741 | | | | 33,842 | |
Turkiye Sise ve Cam Fabrikalari AS (Industrial Conglomerates) | | | 42,370 | | | | 53,628 | |
Turkiye Vakiflar Bankasi Tao Class D (Commercial Banks) | | | 68,110 | | | | 121,070 | |
Vestel Elektronik Sanayi ve Ticaret AS (Household Durables) (a) | | | 24,553 | | | | 17,709 | |
| | | | | | | | |
| | | | | | | 2,553,060 | |
| | | | | | | | |
Total Common Stocks
(Cost $352,430,756) | | | | 342,648,203 | |
| | | | | | | | |
| |
| Exchange-Traded Funds 1.5% (e) | | | | | |
India 1.0% | | | | | | | | |
PowerShares India Portfolio (Capital Markets) | | | 199,986 | | | | 3,523,753 | |
| | | | | | | | |
| | |
United States 0.5% | | | | | | | | |
iShares MSCI Emerging Markets Index Fund (Capital Markets) | | | 41,701 | | | | 1,741,851 | |
| | | | | | | | |
Total Exchange-Traded Funds
(Cost $5,871,408) | | | | 5,265,604 | |
| | | | | | | | |
| | |
| Preferred Stocks 2.8% | | | | | | | | |
Brazil 2.8% | | | | | | | | |
Banco Industrial e Comercial S.A.
3.13% (Commercial Banks) | | | 15,600 | | | | 48,931 | |
Cia Ferro Ligas da Bahia—Ferbasa
1.41% (Metals & Mining) | | | 15,311 | | | | 85,600 | |
Cia Paranaense de Energia Class B
5.77% (Electric Utilities) | | | 210,430 | | | | 2,723,080 | |
Eucatex S.A. Industria e Comercio
3.10% (Paper & Forest Products) | | | 8,300 | | | | 23,923 | |
Forjas Taurus S.A.
1.23% (Aerospace & Defense) | | | 49,000 | | | | 47,354 | |
Gerdau S.A.
1.29% (Metals & Mining) | | | 56,000 | | | | 435,325 | |
| | | | | | | | |
| | | Shares | | | Value | |
Brazil (continued) | | | | | | | | |
Petroleo Brasileiro S.A.
4.78% (Oil, Gas & Consumable Fuels) | | | 12,000 | | | $ | 86,875 | |
Suzano Papel e Celulose S.A. Class A
1.04% (Paper & Forest Products) | | | 45,900 | | | | 179,767 | |
Unipar Carbocloro S.A.
1.48% (Chemicals) | | | 200,800 | | | | 45,109 | |
Usinas Siderurgicas de Minas Gerais S.A. Class A
0.00% (Metals & Mining) (a) | | | 59,600 | | | | 358,977 | |
Vale S.A.
5.70% (Metals & Mining) | | | 450,600 | | | | 6,251,198 | |
| | | | | | | | |
| | | | | | | 10,286,139 | |
| | | | | | | | |
Colombia 0.0%‡ | | | | | | | | |
Grupo de Inversiones Suramericana S.A.
2.79% (Diversified Financial Services) | | | 4,182 | | | | 75,796 | |
| | | | | | | | |
Total Preferred Stocks
(Cost $12,577,181) | | | | 10,361,935 | |
| | | | | | | | |
| | |
| | | | | | | | |
| | | Number of
Rights | | | | |
| Rights 0.0%‡ | | | | | | | | |
Indonesia 0.0%‡ | | | | | | | | |
Bank Bukopin Tbk PT
Expires 1/7/14 (Commercial Banks) (a) | | | 194,788 | | | | 16 | |
| | | | | | | | |
| | |
Poland 0.0%‡ | | | | | | | | |
Polimex-Mostostal S.A.
Expires 6/30/14 (Construction & Engineering) (a)(b)(c) | | | 58,304 | | | | 2 | |
| | | | | | | | |
| | |
Republic of Korea 0.0%‡ | | | | | | | | |
JB Financial Group Co., Ltd.
Expires 1/8/14 (Commercial Banks) (a)(c) | | | 2,737 | | | | 3,527 | |
| | | | | | | | |
Total Rights
(Cost $0) | | | | 3,545 | |
| | | | | | | | |
| | |
| | | | | | | | |
| | | Number of
Warrants | | | | |
| Warrants 0.1% | | | | | | | | |
Malaysia 0.1% | | | | | | | | |
Genting BHD
Expires 12/18/18 (Hotels, Restaurants & Leisure) (a) | | | 336,875 | | | | 321,911 | |
| | | | | | | | |
Total Warrants
(Cost $158,729) | | | | 321,911 | |
| | | | | | | | |
| | |
| | | | | | | | |
| | | | |
| M-134 | | MainStay VP DFA / DuPont Capital Emerging Markets Equity Portfolio | | The notes to the financial statements are an integral part of,
and should be read in conjunction with, the financial statements. |
| | | | | | | | |
| | | Principal
Amount | | | Value | |
| Short-Term Investment 1.4% | | | | | |
Repurchase Agreement 1.4% | | | | | | | | |
United States 1.4% | | | | | | | | |
State Street Bank and Trust Co.
0.00%, dated 12/31/13
due 1/2/14
Proceeds at Maturity $5,045,701 (Collateralized by a Federal National Mortgage Association security with a rate of 2.17% and a maturity date of 11/7/22, with a Principal Amount of $5,660,000 and a Market Value of $5,152,383) (Capital Markets) | | $ | 5,045,701 | | | $ | 5,045,701 | |
| | | | | | | | |
Total Short-Term Investment
(Cost $5,045,701) | | | | 5,045,701 | |
| | | | | | | | |
Total Investments
(Cost $376,083,775) (f) | | | 100.0 | % | | | 363,646,899 | |
Other Assets, Less Liabilities | | | (0.0 | )‡ | | | (43,440 | ) |
Net Assets | | | 100.0 | % | | $ | 363,603,459 | |
| ‡ | Less than one-tenth of a percent. |
| (a) | Non-income producing security. |
| (b) | Illiquid security—The total market value of these securities as of December 31, 2013, is $1,773,474, which represents 0.5% of the Portfolio’s net assets. |
| (c) | Fair valued security—The total market value of these securities as of December 31, 2013, is $77,518, which represents less than one-tenth of a percent of the Portfolio’s net assets. |
| (d) | May be sold to institutional investors only under Rule 144A or securities offered pursuant to Section 4(a)(2) of the Securities Act of 1933, as amended. |
| (e) | Exchange-Traded Fund—An investment vehicle that represents a basket of securities that is traded on an exchange. |
| (f) | As of December 31, 2013, cost is $379,733,028 for federal income tax purposes and net unrealized depreciation is as follows: |
| | | | |
Gross unrealized appreciation | | $ | 28,101,032 | |
Gross unrealized depreciation | | | (44,187,161 | ) |
| | | | |
Net unrealized depreciation | | $ | (16,086,129 | ) |
| | | | |
The following abbreviations are used in the above Portfolio:
ADR—American Depositary Receipt
GDR—Global Depositary Receipt
NVDR—Non-Voting Depositary Receipt
| | | | | | |
The notes to the financial statements are an integral part of,
and should be read in conjunction with, the financial statements. | | mainstayinvestments.com | | | M-135 | |
The following is a summary of the fair valuations according to the inputs used as of December 31, 2013, for valuing the Portfolio’s assets.
Asset Valuation Inputs
| | | | | | | | | | | | | | | | |
Description | | Quoted Prices in
Active Markets
for Identical Assets (Level 1) | | | Significant Other
Observable Inputs (Level 2) | | | Significant
Unobservable
Inputs (Level 3) | | | Total | |
| Investments in Securities (a) | | | | | | | | | | | | | | | | |
| Common Stocks (b) | | $ | 342,574,214 | | | $ | 1,661 | | | $ | 72,328 | | | $ | 342,648,203 | |
| Exchange-Traded Funds | | | 5,265,604 | | | | — | | | | — | | | | 5,265,604 | |
| Preferred Stocks | | | 10,361,935 | | | | — | | | | — | | | | 10,361,935 | |
| Rights (c) | | | 16 | | | | — | | | | 3,529 | | | | 3,545 | |
| Warrants | | | 321,911 | | | | — | | | | — | | | | 321,911 | |
| Short-Term Investment | | | | | | | | | | | | | | | | |
Repurchase Agreement | | | — | | | | 5,045,701 | | | | — | | | | 5,045,701 | |
| | | | | | | | | | | | | | | | |
| Total Investments in Securities | | $ | 358,523,680 | | | $ | 5,047,362 | | | $ | 75,857 | | | $ | 363,646,899 | |
| | | | | | | | | | | | | | | | |
| (a) | For a complete listing of investments and their industries, see the Portfolio of Investments. |
| (b) | The Level 3 securities valued at $45,604, $10,926, $6,065 and $9,733 are held in China, Mexico, Philippines and Republic of Korea, respectively, within the Common Stocks section of the Portfolio of Investments. |
| (c) | The Level 3 securities valued at $2 and $3,527 are held in Poland and Republic of Korea, respectively, within the Rights section of the Portfolio of Investments. |
The Portfolio recognizes transfers between the levels as of the beginning of the period.
As of December 31, 2013, certain foreign securities with a market value of $296,269,798 were transferred from Level 2 to Level 1 as the prices of these securities were based on unadjusted quoted prices compared to prior year prices which were adjusted for events after the market close. The December 31, 2012 prices were adjusted by applying factors provided by a
Portfolio of Investments December 31, 2013 (continued)
third party vendor in accordance with the Portfolio’s policies and procedures. Fair values as of December 31, 2013 for these securities were based on quoted prices in active markets for identical investments. (See Note 2)
As of December 31, 2013, certain foreign securities with a market value of $63,932 were transferred from Level 1 to Level 3 as these securities were fair valued when compared to prior year prices which were based on quoted prices. The December 31, 2012 prices were adjusted by applying factors provided by a third party vendor in accordance with the Portfolio’s policies and procedures. (See Note 2)
As of December 31, 2013, certain foreign securities with a market value of $138,818 were transferred from Level 2 to Level 3 as these securities were fair valued when compared to prior year prices which were based on quoted prices. The December 31, 2012 prices were adjusted by applying factors provided by a third party vendor in accordance with the Portfolio’s policies and procedures. (See Note 2)
As of December 31, 2013, a foreign security with a market value of $42,380 was transferred from Level 3 to Level 1 as the price of this security was based on a quoted price compared to prior year price which was fair valued. (See Note 2)
The following is a reconciliation of investments in which significant unobservable inputs (Level 3) were used in determining value:
| | | | | | | | | | | | | | | | | | | | | | | | | | | | | | | | | | | | | | | | |
Investments in
Securities | | Balance
as of December 31, 2012 | | | Accrued
Discounts
(Premiums) | | | Realized
Gain
(Loss) | | | Change in
Unrealized
Appreciation
(Depreciation) | | | Purchases | | | Sales | | | Transfers
in to Level 3 | | | Transfers
out of Level 3 | | | Balance as of December 31, 2013 | | | Change in
Unrealized
Appreciation
(Depreciation)
from
Investments
Still Held at
December 31,
2013 (a) | |
| Common Stocks | | | | | | | | | | | | | | | | | | | | | | | | | | | | | | | | | | | | | | | | |
China | | $ | 42,382 | | | $ | — | | | $ | (34,111 | ) | | $ | 3,008 | | | $ | — | | | $ | (1,991 | ) | | $ | 78,696 | | | $ | (42,380 | ) | | $ | 45,604 | | | $ | (33,093 | ) |
Mexico | | | — | | | | — | | | | — | | | | (53,006 | ) | | | — | | | | — | | | | 63,932 | | | | — | | | | 10,926 | | | | (53,006 | ) |
Philippines | | | — | | | | — | | | | — | | | | (2,591 | ) | | | 8,656 | | | | — | | | | — | | | | — | | | | 6,065 | | | | (2,591 | ) |
Republic of Korea | | | — | | | | — | | | | 240 | | | | (50,389 | ) | | | — | | | | (240 | ) | | | 60,122 | | | | — | | | | 9,733 | | | | (50,389 | ) |
| Rights | | | | | | | | | | | | | | | | | | | | | | | | | | | | | | | | | | | | | | | | |
Poland | | | 697 | | | | — | | | | — | | | | (695 | ) | | | — | | | | — | | | | — | | | | — | | | | 2 | | | | (695 | ) |
Republic of Korea | | | — | | | | — | | | | — | | | | 3,527 | | | | — | | | | — | | | | — | | | | — | | | | 3,527 | | | | 3,527 | |
| | | | | | | | | | | | | | | | | | | | | | | | | | | | | | | | | | | | | | | | |
| Total | | $ | 43,079 | | | $ | — | | | $ | (33,871 | ) | | $ | (100,146 | ) | | $ | 8,656 | | | $ | (2,231 | ) | | $ | 202,750 | | | $ | (42,380 | ) | | $ | 75,857 | | | $ | (136,247 | ) |
| | | | | | | | | | | | | | | | | | | | | | | | | | | | | | | | | | | | | | | | |
| (a) | Included in “Net change in unrealized appreciation (depreciation) on investments” in the Statement of Operations. |
| | | | |
| M-136 | | MainStay VP DFA / DuPont Capital Emerging Markets Equity Portfolio | | The notes to the financial statements are an integral part of,
and should be read in conjunction with, the financial statements. |
The table below sets forth the diversification of MainStay VP DFA / DuPont Capital Emerging Markets Equity Portfolio investments by industry.
Industry Diversification (Unaudited)
| | | | | | | | |
| | | Value | | | Percent† | |
Aerospace & Defense | | $ | 5,052,392 | | | | 1.4 | % |
Air Freight & Logistics | | | 113,092 | | | | 0.0 | ‡ |
Airlines | | | 1,599,714 | | | | 0.4 | |
Auto Components | | | 7,357,379 | | | | 2.0 | |
Automobiles | | | 21,180,431 | | | | 5.8 | |
Beverages | | | 144,391 | | | | 0.0 | ‡ |
Building Products | | | 327,872 | | | | 0.1 | |
Capital Markets | | | 12,097,369 | | | | 3.3 | |
Chemicals | | | 9,303,440 | | | | 2.6 | |
Commercial Banks | | | 72,866,803 | | | | 20.0 | |
Commercial Services & Supplies | | | 182,562 | | | | 0.1 | |
Communications Equipment | | | 202,292 | | | | 0.1 | |
Computers & Peripherals | | | 7,368,761 | | | | 2.0 | |
Construction & Engineering | | | 2,116,495 | | | | 0.6 | |
Construction Materials | | | 5,124,681 | | | | 1.4 | |
Containers & Packaging | | | 212,595 | | | | 0.1 | |
Distributors | | | 17,836 | | | | 0.0 | ‡ |
Diversified Financial Services | | | 1,312,460 | | | | 0.4 | |
Diversified Telecommunication Services | | | 4,151,900 | | | | 1.1 | |
Electric Utilities | | | 4,566,470 | | | | 1.3 | |
Electrical Equipment | | | 298,374 | | | | 0.1 | |
Electronic Equipment, Instruments & Components | | | 3,054,831 | | | | 0.8 | |
Energy Equipment & Services | | | 79,317 | | | | 0.0 | ‡ |
Food & Staples Retailing | | | 674,693 | | | | 0.2 | |
Food Products | | | 2,475,040 | | | | 0.7 | |
Health Care Equipment & Supplies | | | 30,332 | | | | 0.0 | ‡ |
Health Care Providers & Services | | | 83,545 | | | | 0.0 | ‡ |
Hotels, Restaurants & Leisure | | | 8,017,246 | | | | 2.2 | |
Household Durables | | | 3,059,092 | | | | 0.8 | |
Independent Power Producers & Energy Traders | | | 36,136 | | | | 0.0 | ‡ |
Industrial Conglomerates | | | 4,152,485 | | | | 1.1 | |
Insurance | | | 921,672 | | | | 0.3 | |
IT Services | | | 22,156 | | | | 0.0 | ‡ |
Leisure Equipment & Products | | | 85,821 | | | | 0.0 | ‡ |
Machinery | | | 22,745,509 | | | | 6.3 | |
Marine | | | 3,822,116 | | | | 1.1 | |
Media | | | 372,819 | | | | 0.1 | |
Metals & Mining | | | 45,488,154 | | | | 12.5 | |
Multi-Utilities | | | 260,822 | | | | 0.1 | |
Multiline Retail | | | 7,667,127 | | | | 2.1 | |
Oil, Gas & Consumable Fuels | | | 44,709,997 | | | | 12.3 | |
Paper & Forest Products | | | 2,703,482 | | | | 0.7 | |
Personal Products | | | 25,018 | | | | 0.0 | ‡ |
Pharmaceuticals | | | 1,311,534 | | | | 0.4 | |
Professional Services | | | 3,792 | | | | 0.0 | ‡ |
Real Estate Management & Development | | | 5,614,265 | | | | 1.6 | |
Road & Rail | | | 101,718 | | | | 0.0 | ‡ |
| | | | | | | | |
| | | Value | | | Percent† | |
Semiconductors & Semiconductor Equipment | | $ | 12,395,853 | | | | 3.4 | % |
Software | | | 158,929 | | | | 0.0 | ‡ |
Specialty Retail | | | 259,640 | | | | 0.1 | |
Textiles, Apparel & Luxury Goods | | | 666,770 | | | | 0.2 | |
Trading Companies & Distributors | | | 2,182,303 | | | | 0.6 | |
Transportation Infrastructure | | | 2,879,525 | | | | 0.8 | |
Water Utilities | | | 1,570,122 | | | | 0.4 | |
Wireless Telecommunication Services | | | 30,417,729 | | | | 8.4 | |
| | | | | | | | |
| | | 363,646,899 | | | | 100.0 | |
Other Assets, Less Liabilities | | | (43,440 | ) | | | (0.0 | )‡ |
| | | | | | | | |
Net Assets | | $ | 363,603,459 | | | | 100.0 | % |
| | | | | | | | |
| † | Percentages indicated are based on Portfolio net assets. |
| ‡ | Less than one-tenth of a percent. |
| | | | | | |
The notes to the financial statements are an integral part of,
and should be read in conjunction with, the financial statements. | | mainstayinvestments.com | | | M-137 | |
Statement of Assets and Liabilities as of December 31, 2013
| | | | |
| Assets | | | | |
Investment in securities, at value
(identified cost $376,083,775) | | $ | 363,646,899 | |
Cash denominated in foreign currencies
(identified cost $627,496) | | | 623,103 | |
Receivables: | | | | |
Investment securities sold | | | 876,974 | |
Dividends and interest | | | 114,771 | |
Fund shares sold | | | 98,109 | |
| | | | |
Total assets | | | 365,359,856 | |
| | | | |
| |
| Liabilities | | | | |
Payables: | | | | |
Investment securities purchased | | | 975,268 | |
Manager (See Note 3) | | | 377,090 | |
Fund shares redeemed | | | 170,522 | |
Professional fees | | | 77,960 | |
Custodian | | | 67,170 | |
NYLIFE Distributors (See Note 3) | | | 48,638 | |
Shareholder communication | | | 21,451 | |
Foreign capital gains tax (See Note 2(D)) | | | 17,560 | |
Trustees | | | 414 | |
Accrued expenses | | | 324 | |
| | | | |
Total liabilities | | | 1,756,397 | |
| | | | |
Net assets | | $ | 363,603,459 | |
| | | | |
| |
| Net Assets Consist of | | | | |
Shares of beneficial interest outstanding (par value of $.001 per share) unlimited number of shares authorized | | $ | 38,341 | |
Additional paid-in capital | | | 384,510,030 | |
| | | | |
| | | 384,548,371 | |
Undistributed net investment income | | | 3,816,167 | |
Accumulated net realized gain (loss) on investments and foreign currency transactions (a) | | | (12,302,525 | ) |
Net unrealized appreciation (depreciation) on investments (b) | | | (12,454,436 | ) |
Net unrealized appreciation (depreciation) on translation of other assets and liabilities in foreign currencies | | | (4,118 | ) |
| | | | |
Net assets | | $ | 363,603,459 | |
| | | | |
| | | | |
Initial Class | | | | |
Net assets applicable to outstanding shares | | $ | 132,660,936 | |
| | | | |
Shares of beneficial interest outstanding | | | 13,967,107 | |
| | | | |
Net asset value per share outstanding | | $ | 9.50 | |
| | | | |
Service Class | | | | |
Net assets applicable to outstanding shares | | $ | 230,942,523 | |
| | | | |
Shares of beneficial interest outstanding | | | 24,374,206 | |
| | | | |
Net asset value per share outstanding | | $ | 9.47 | |
| | | | |
| (a) | Realized gain (loss) on security transactions recorded net of foreign capital gains tax in the amount of $153,855. |
| (b) | Unrealized appreciation (depreciation) on investments recorded net of foreign capital gains tax in the amount of $17,560. |
| | | | |
| M-138 | | MainStay VP DFA / DuPont Capital Emerging Markets Equity Portfolio | | The notes to the financial statements are an integral part of,
and should be read in conjunction with, the financial statements. |
Statement of Operations for the year ended December 31, 2013
| | | | |
| Investment Income (Loss) | | | | |
Income | | | | |
Dividends (a) | | $ | 10,355,722 | |
Interest (b) | | | 464 | |
| | | | |
Total income | | | 10,356,186 | |
| | | | |
Expenses | | | | |
Manager (See Note 3) | | | 5,015,381 | |
Distribution and service—Service Class (See Note 3) | | | 584,393 | |
Custodian | | | 472,761 | |
Shareholder communication | | | 65,643 | |
Professional fees | | | 30,018 | |
Trustees | | | 8,749 | |
Miscellaneous | | | 22,547 | |
| | | | |
Total expenses | | | 6,199,492 | |
| | | | |
Net investment income (loss) | | | 4,156,694 | |
| | | | |
|
| Realized and Unrealized Gain (Loss) on Investments and Foreign Currency Transactions | |
Net realized gain (loss) on: | | | | |
Security transactions (c) | | | (4,817,950 | ) |
Foreign currency transactions | | | (197,727 | ) |
| | | | |
Net realized gain (loss) on investments and foreign currency transactions | | | (5,015,677 | ) |
| | | | |
Net change in unrealized appreciation (depreciation) on: | | | | |
Investments (d) | | | (24,072,170 | ) |
Translation of other assets and liabilities in foreign currencies | | | (9,884 | ) |
| | | | |
Net change in unrealized appreciation (depreciation) on investments and foreign currency transactions | | | (24,082,054 | ) |
| | | | |
Net realized and unrealized gain (loss) on investments and foreign currency transactions | | | (29,097,731 | ) |
| | | | |
Net increase (decrease) in net assets resulting from operations | | $ | (24,941,037 | ) |
| | | | |
| (a) | Dividends recorded net of foreign withholding taxes in the amount of $1,528,431. |
| (b) | Interest recorded net of foreign withholding taxes in the amount of $18. |
| (c) | Realized gain (loss) on security transactions recorded net of foreign capital gains tax in the amount of $153,855. |
| (d) | Unrealized appreciation (depreciation) on investments recorded net of foreign capital gains tax in the amount of $17,560. |
| | | | | | |
The notes to the financial statements are an integral part of,
and should be read in conjunction with, the financial statements. | | mainstayinvestments.com | | | M-139 | |
Statements of Changes in Net Assets
for the year ended December 31, 2013 and the period February 17, 2012 (inception date) through December 31, 2012
| | | | | | | | |
| | | 2013 | | | 2012 | |
| Increase (Decrease) in Net Assets | | | | | |
Operations: | | | | | | | | |
Net investment income (loss) | | $ | 4,156,694 | | | $ | 3,508,427 | |
Net realized gain (loss) on investments and foreign currency transactions | | | (5,015,677 | ) | | | (8,576,628 | ) |
Net change in unrealized appreciation (depreciation) on investments and foreign currency transactions | | | (24,082,054 | ) | | | 11,623,500 | |
| | | | |
Net increase (decrease) in net assets resulting from operations | | | (24,941,037 | ) | | | 6,555,299 | |
| | | | |
Dividends to shareholders: | | | | | | | | |
From net investment income: | | | | | | | | |
Initial Class | | | (1,360,886 | ) | | | — | |
Service Class | | | (1,198,288 | ) | | | — | |
| | | | |
Total dividends to shareholders | | | (2,559,174 | ) | | | — | |
| | | | |
Capital share transactions: | | | | | | | | |
Net proceeds from sale of shares | | | 86,314,434 | | | | 496,980,175 | |
Net asset value of shares issued to shareholders in reinvestment of dividends | | | 2,559,174 | | | | — | |
Cost of shares redeemed | | | (144,089,549 | ) | | | (57,215,863 | ) |
| | | | |
Increase (decrease) in net assets derived from capital share transactions | | | (55,215,941 | ) | | | 439,764,312 | |
| | | | |
Net increase (decrease) in net assets | | | (82,716,152 | ) | | | 446,319,611 | |
| | |
| Net Assets | | | | | | | | |
Beginning of period | | | 446,319,611 | | | | — | |
| | | | |
End of period | | $ | 363,603,459 | | | $ | 446,319,611 | |
| | | | |
Undistributed net investment income at end of period | | $ | 3,816,167 | | | $ | 2,557,450 | |
| | | | |
| | | | |
| M-140 | | MainStay VP DFA / DuPont Capital Emerging Markets Equity Portfolio | | The notes to the financial statements are an integral part of,
and should be read in conjunction with, the financial statements. |
Financial Highlights selected per share data and ratios
| | | | | | | | |
| | | Initial Class | |
| | | Year ended
December 31, | | | February 17,
2012**
through
December 31, | |
| | | 2013 | | | 2012 | |
Net asset value at beginning of period | | $ | 10.12 | | | $ | 10.00 | |
| | | | | | | | |
Net investment income (loss) (a) | | | 0.11 | | | | 0.09 | |
Net realized and unrealized gain (loss) on investments | | | (0.66 | ) | | | 0.04 | |
Net realized and unrealized gain (loss) on foreign currency transactions | | | (0.00 | )‡ | | | (0.01 | ) |
| | | | | | | | |
Total from investment operations | | | (0.55 | ) | | | 0.12 | |
| | | | | | | | |
Less dividends: | | | | | | | | |
From net investment income | | | (0.07 | ) | | | — | |
| | | | | | | | |
Net asset value at end of period | | $ | 9.50 | | | $ | 10.12 | |
| | | | | | | | |
Total investment return | | | (5.43 | %) | | | 1.20 | %(b)(c) |
Ratios (to average net assets)/Supplemental Data: | | | | | | | | |
Net investment income (loss) | | | 1.17 | % | | | 1.15 | %†† |
Net expenses | | | 1.34 | % | | | 1.40 | %†† |
Portfolio turnover rate | | | 68 | % | | | 81 | % |
Net assets at end of period (in 000’s) | | $ | 132,661 | | | $ | 190,688 | |
| ‡ | Less than one cent per share. |
| (a) | Per share data based on average shares outstanding during the period. |
| (b) | Total investment return is not annualized. |
| (c) | Total investment return may reflect adjustments to conform to generally accepted accounting principles. |
| | | | | | | | |
| | | Service Class | |
| | | Year ended
December 31, | | | February 17,
2012**
through
December 31, | |
| | | 2013 | | | 2012 | |
Net asset value at beginning of period | | $ | 10.10 | | | $ | 10.00 | |
| | | | | | | | |
Net investment income (loss) (a) | | | 0.08 | | | | 0.08 | |
Net realized and unrealized gain (loss) on investments | | | (0.66 | ) | | | 0.04 | |
Net realized and unrealized gain (loss) on foreign currency transactions | | | (0.00 | )‡ | | | (0.02 | ) |
| | | | | | | | |
Total from investment operations | | | (0.58 | ) | | | 0.10 | |
| | | | | | | | |
Less dividends: | | | | | | | | |
From net investment income | | | (0.05 | ) | | | — | |
| | | | | | | | |
Net asset value at end of period | | $ | 9.47 | | | $ | 10.10 | |
| | | | | | | | |
Total investment return | | | (5.67 | %) | | | 1.00 | %(b)(c) |
Ratios (to average net assets)/Supplemental Data: | | | | | | | | |
Net investment income (loss) | | | 0.86 | % | | | 0.96 | %†† |
Net expenses | | | 1.59 | % | | | 1.65 | %†† |
Portfolio turnover rate | | | 68 | % | | | 81 | % |
Net assets at end of period (in 000’s) | | $ | 230,943 | | | $ | 255,631 | |
| ‡ | Less than one cent per share. |
| (a) | Per share data based on average shares outstanding during the period. |
| (b) | Total investment return is not annualized. |
| (c) | Total investment returns may reflect adjustments to conform to generally accepted accounting principles. |
| | | | | | |
The notes to the financial statements are an integral part of,
and should be read in conjunction with, the financial statements. | | mainstayinvestments.com | | | M-141 | |
MainStay VP Eagle Small Cap Growth Portfolio
Investment and Performance Comparison (Unaudited)
Performance data quoted represents past performance. Past performance is no guarantee of future results. Because of market volatility, current performance may be lower or higher than the figures shown. Investment return and principal value will fluctuate, and as a result, when shares are redeemed, they may be worth more or less than their original cost. The performance table and graph do not reflect any deduction of sales charges, mortality and expense charges, contract charges or administrative charges. Please refer to the Performance Summary appropriate for your policy. For performance information current to the most recent month-end, please call 800-598-2019 or visit www.newyorklife.com.
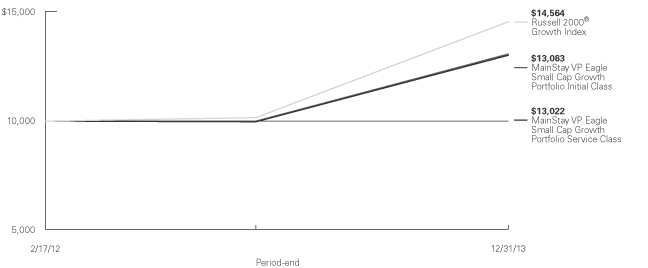
Average Annual Total Returns for the Period Ended December 31, 2013
| | | | | | | | | | | | |
| Class | | One Year | | | Since Inception (2/17/12) | | | Gross Expense Ratio1 | |
| Initial Class Shares | | | 30.89 | % | | | 15.44 | % | | | 0.86 | % |
| Service Class Shares | | | 30.56 | | | | 15.16 | | | | 1.11 | |
| | | | | | | | |
| Benchmark Performance | | One Year | | | Since
Inception
(2/17/12) | |
Russell 2000® Growth Index2 | | | 43.30 | % | | | 22.30 | % |
Average Lipper Variable Products Small-Cap Growth Portfolio3 | | | 42.26 | | | | 20.41 | |
| 1. | The gross expense ratios presented reflect the Portfolio’s “Total Annual Portfolio Operating Expenses” from the most recent Prospectus and may differ from other expense ratios disclosed in this report. |
| 2. | Please refer to pages M-2 and M-3 for additional explanations and disclosure regarding the Portfolios, their benchmark indices and other indices mentioned in the reports. |
| 3. | The Average Lipper Variable Products Small-Cap Growth Portfolio is representative of portfolios that, by portfolio |
| | practice, invest at least 75% of their equity assets in companies with market capitalizations (on a three-year weighted basis) below Lipper’s U.S. Diversified Equity small-cap ceiling. Small-cap growth portfolios typically have above-average characteristics compared to the S&P Small Cap 600 Index. Lipper Inc. is an independent monitor of fund performance. Results are based on total returns with all dividend and capital gain distributions reinvested. |
| | | | |
| | M-142 | | | MainStay VP Eagle Small Cap Growth Portfolio |
Cost in Dollars of a $1,000 Investment in MainStay VP Eagle Small Cap Growth Portfolio (Unaudited)
The example below is intended to describe the fees and expenses borne by shareholders during the period from July 1, 2013, to December 31, 2013, and the impact of those costs on your investment.
Example
As a shareholder of the Portfolio, you incur two types of costs: (1) transaction costs, including exchange fees and sales charges (loads) on purchases (as applicable), and (2) ongoing costs, including management fees, distribution and/or service (12b-1) fees, and other Portfolio expenses (as applicable). This example is intended to help you understand your ongoing costs (in dollars) of investing in the Portfolio and to compare these costs with the ongoing costs of investing in other Portfolios. The example is based on an investment of $1,000 made at the beginning of the six-month period and held for the entire period from July 1, 2013, to December 31, 2013. Shares are only sold in connection with variable life and annuity contracts and the example does not reflect any contract level or transactional fees or expenses. If these costs had been included, your costs would have been higher.
This example illustrates your Portfolio’s ongoing costs in two ways:
Actual Expenses
The second and third data columns in the table below provide information about actual account values and actual expenses. You may use the information in these columns, together with the amount you invested, to estimate the expenses that you paid during the six months ended
December 31, 2013. Simply divide your account value by $1,000 (for example, an $8,600 account value divided by $1,000 = 8.6), then multiply the result by the number under the heading entitled ‘‘Expenses Paid During Period’’ to estimate the expenses you paid on your account during this period.
Hypothetical Example for Comparison Purposes
The fourth and fifth data columns in the table below provide information about hypothetical account values and hypothetical expenses based on the Portfolio’s actual expense ratio and an assumed rate of return of 5% per year before expenses, which is not the Portfolio’s actual return. The hypothetical account values and expenses may not be used to estimate the actual ending account balances or expenses you paid for the six-month period shown. You may use this information to compare the ongoing costs of investing in the Portfolio with the ongoing costs of investing in other Portfolios. To do so, compare this 5% hypothetical example with the 5% hypothetical examples that appear in the shareholder reports of the other Portfolios.
Please note that the expenses shown in the table are meant to highlight your ongoing costs only and do not reflect any transactional costs, such as exchange fees or sales charges (loads). Therefore, the fourth and fifth data columns of the table are useful in comparing ongoing costs only and will not help you determine the relative total costs of owning different funds. In addition, if these transactional costs were included, your costs would have been higher.
| | | | | | | | | | | | | | | | | | | | |
| | | | | | | | | | | | | | | | |
| Share Class | | Beginning
Account
Value
7/1/13 | | | Ending Account
Value (Based
on Actual
Returns and
Expenses)
12/31/13 | | | Expenses
Paid
During
Period1 | | | Ending Account
Value (Based
on Hypothetical
5% Annualized
Return and
Actual Expenses)
12/31/13 | | | Expenses
Paid
During
Period1 | |
| | | | | |
| Initial Class Shares | | $ | 1,000.00 | | | $ | 1,155.40 | | | $ | 4.62 | | | $ | 1,020.90 | | | $ | 4.33 | |
| | | | | |
| Service Class Shares | | $ | 1,000.00 | | | $ | 1,153.90 | | | $ | 5.97 | | | $ | 1,019.70 | | | $ | 5.60 | |
| 1. | Expenses are equal to the Portfolio’s annualized expense ratio of each class (0.85% for Initial Class and 1.10% for Service Class) multiplied by the average account value over the period, divided by 365 and multiplied by 184 (to reflect the six-month period). The table above represents the actual expenses incurred during the six-month period. |
| | | | |
| mainstayinvestments.com | | | M-143 | |
Industry Composition as of December 31, 2013 (Unaudited)
| | | | |
| Software | | | 8.5 | % |
| Biotechnology | | | 7.9 | |
| Health Care Equipment & Supplies | | | 6.9 | |
| Specialty Retail | | | 6.9 | |
| Internet Software & Services | | | 5.0 | |
| Machinery | | | 4.9 | |
| Health Care Providers & Services | | | 4.6 | |
| Hotels, Restaurants & Leisure | | | 4.3 | |
| Semiconductors & Semiconductor Equipment | | | 4.1 | |
| Electronic Equipment, Instruments & Components | | | 3.9 | |
| Food & Staples Retailing | | | 3.2 | |
| Chemicals | | | 2.9 | |
| Textiles, Apparel & Luxury Goods | | | 2.7 | |
| Oil, Gas & Consumable Fuels | | | 2.5 | |
| Energy Equipment & Services | | | 2.2 | |
| Building Products | | | 2.1 | |
| Health Care Technology | | | 2.0 | |
| Real Estate Investment Trusts | | | 2.0 | |
| Construction & Engineering | | | 1.9 | |
| Food Products | | | 1.9 | |
| | | | |
| Aerospace & Defense | | | 1.8 | % |
| Airlines | | | 1.6 | |
| Construction Materials | | | 1.6 | |
| Communications Equipment | | | 1.4 | |
| Road & Rail | | | 1.4 | |
| Commercial Services & Supplies | | | 1.3 | |
| Metals & Mining | | | 1.3 | |
| Household Durables | | | 1.2 | |
| Insurance | | | 1.2 | |
| Pharmaceuticals | | | 1.0 | |
| Thrifts & Mortgage Finance | | | 1.0 | |
| Commercial Banks | | | 0.9 | |
| Auto Components | | | 0.8 | |
| Capital Markets | | | 0.8 | |
| Diversified Consumer Services | | | 0.8 | |
| Life Sciences Tools & Services | | | 0.8 | |
| Electrical Equipment | | | 0.7 | |
| Short-Term Investment | | | 0.0 | ‡ |
| Other Assets, Less Liabilities | | | 0.0 | ‡ |
| | | | |
| | | 100.0 | % |
| | | | |
See Portfolio of Investments beginning on page M-147 for specific holdings within these categories.
| ‡ | Less than one-tenth of a percent. |
Top Ten Holdings as of December 31, 2013 (excluding short-term investment) (Unaudited)
| 2. | United Therapeutics Corp. |
| 4. | GeoSpace Technologies Corp. |
| 5. | Bally Technologies, Inc. |
| 6. | Natural Grocers by Vitamin Cottage, Inc. |
| 8. | WhiteWave Foods Co. Class A |
| 9. | Cornerstone OnDemand, Inc. |
| | |
| M-144 | | MainStay VP Eagle Small Cap Growth Portfolio |
Portfolio Management Discussion and Analysis (Unaudited)
Answers to the questions reflect the views of portfolio managers Bert L. Boksen and Eric Mintz of Eagle Asset Management, Inc.(“Eagle”), the Portfolio’s Subadvisor.
How did MainStay VP Eagle Small Cap Growth Portfolio perform relative to its benchmark and peers for the 12 months ended December 31, 2013?
For the 12 months ended December 31, 2013, MainStay VP Eagle Small Cap Growth Portfolio returned 30.89% for Initial Class shares and 30.56% for Service Class shares. Over the same period, both share classes underperformed the 43.30% return of the Russell 2000® Growth Index,1 which is the Portfolio’s broad-based securities-market index. Both share classes underperformed the 42.26% return of the average Lipper1 Variable Products Small-Cap Growth Portfolio for the 12 months ended December 31, 2013.
What factors affected the Portfolio’s relative performance during the reporting period?
The Portfolio’s underperformance of the Russell 2000® Growth Index was most notable in the information technology and health care sectors and, to a lesser extent, in the consumer discretionary sector. True to the strategy, the primary driver of relative performance (underperformance, in this instance) was stock selection.
Which sectors were the strongest positive contributors to the Portfolio’s relative performance, and which sectors were particularly weak?
One positive contributor during the reporting period was the energy sector, where the Portfolio’s holdings slightly outperformed sector-related stocks in the Russell 2000® Growth Index. (Contributions take weightings and total returns into account.) The outperformance resulted from General Electric’s acquisition of long-time Portfolio holding Lufkin Industries at a substantial premium. The Portfolio also saw solid returns from exploration and production company Gulfport Energy.
The information technology sector was the most substantial detractor from the Portfolio’s performance relative to the Russell 2000® Growth Index. The Portfolio’s information technology stocks had solid absolute performance but lagged the particularly strong results of the information technology stocks in the Index. Relative underperformance was also seen in the health care sector, as returns posted by the strategy’s holdings in the health care equipment & supplies industry failed to keep up with comparable securities in the benchmark.
During the reporting period, which individual stocks made the strongest positive contributions to the Portfolio’s absolute performance and which stocks detracted the most?
On an absolute basis, the Portfolio’s top-performing stocks for the reporting period were biotechnology company United Therapeutics, pharmaceutical company Salix Pharmaceuticals and organic grocery and dietary supplement company Natural Grocers by Vitamin Cottage.
United Therapeutics focuses on the medical needs of patients with chronic and life-threatening conditions. Shares jumped toward the end of the reporting period as the U.S. Food and Drug Administration (FDA) announced approval of United Therapeutics’ new drug designed to make exercise easier for people with high blood pressure in their lungs.
Salix Pharmaceuticals specializes in drugs for gastrointestinal diseases and conditions. The company continues to benefit from a diverse drug lineup and has upside potential from the recent acquisition of a competitor. The acquisition is expected to enhance the scale of Salix’s operations in the gastrointestinal pharmaceutical industry.
Natural Grocers by Vitamin Cottage beat top- and bottom-line estimates earlier in 2013. Secular trends supporting healthy lifestyles have provided tailwinds for the company as it expands square footage, maintains disciplined expense controls and enhances marketing.
The Portfolio’s worst-performing stocks during the reporting period were drug company ARIAD Pharmaceuticals, hands-free device manufacturer Vocera Communications and commercial data storage company Fusion-io.
ARIAD Pharmaceuticals focuses on therapies that target drug-resistant, difficult-to-treat cancers. Investors were caught off-guard by an unexpected FDA halt placed on ARIAD’s late-stage clinical trial that was analyzing the firm’s leukemia drug candidate. The FDA expressed concerns about a greater-than-acceptable incidence of blood clots reported by trial patients. Based on these events, we eliminated the Portfolio’s position in the stock.
Vocera Communications makes hands-free devices used by physicians and hospital personnel. These devices simplify communication between highly mobile and often difficult-to-locate individuals in a
| 1. | Please refer to pages M-2 and M-3 for additional explanations and disclosure regarding the Portfolios, their benchmark indices and service providers mentioned in the reports. |
| | | | |
| mainstayinvestments.com | | | M-145 | |
fast-paced hospital environment. The company reported substantially weaker-than-expected results in the second quarter and lowered guidance on reduced growth visibility in the near term.
Fusion-io is a producer of commercial data storage using “flash” memory. Customer-concentration issues have continued to plague the company in recent periods, exacerbated by multiple management departures during the year. Despite a strong product offering, Fusion-io appears to have temporarily lost its strategic footing, and the stock has suffered.
Did the Portfolio make any significant purchases or sales during the reporting period?
The Portfolio initiated a position in Imperva, a provider of data security software. We expected the company to benefit from rapid cybersecurity expansion amid ongoing data-security issues and hacking threats around the world.
We also initiated a position in Trex, a manufacturer of wood-alternative decking, railing and fencing products. We believed the company should benefit from a recovery in the domestic housing and construction markets.
The Portfolio purchased a position in Deckers Outdoor, which sells performance and casual footwear as well as outerwear and accessories. We believed the stock was poised to benefit from a resurgence and stabilization of demand for the firm’s core UGG footwear line. The recent cold weather has been an unexpected positive.
The Portfolio sold its position in Atlas Air Worldwide Holdings when overcapacity in global airfreight markets tempered the company’s growth expectations. Slower-than-expected economic recoveries, both at home and abroad, have continued to hamper airfreight volume growth.
We sold the Portfolio’s position in Terex, a heavy equipment and machinery manufacturer, when the company’s aerial work-platform segment matured, reducing the company’s growth expectations. We used the proceeds to purchase a position in competitor Manitowoc, which we believe possesses greater leverage to the burgeoning crane cycle.
When General Cable, which manufactures copper, aluminum and fiber-optic cable products, saw lower-
than-expected order volumes in its core North American market (about 40% of revenues) we de- cided to sell the Portfolio’s position in the company. Reduced orders have weighed on earnings while competitive pressures have begun to erode growth prospects in General Cable’s largest geographic revenue segment.
How did the Portfolio’s sector weightings change during the reporting period?
The Portfolio increased its weighting in the consumer staples sector. It is a small sector, and the addition of one or two names boosts its relative weight. Consumer staples shifted from a modest underweight position relative to the Russell 2000® Growth Index to a neutral weighting. We also increased the Portfolio’s weighting in the health care sector, shifting from a roughly neutral position to a modestly overweight position.
The Portfolio’s weighting in the energy sector decreased over the reporting period, moving from an overweight position down to a nominal overweight relative to the Russell 2000® Growth Index. The Portfolio also reduced its allocation to the financials sector, shifting from a slightly underweight position to an underweight position.
How was the Portfolio positioned at the end of the reporting period?
As of December 31, 2013, the Portfolio held modestly overweight positions in health care in light of tailwinds expected from the Affordable Care Act by the Medicaid managed-care industry as well as companies involved in revenue cycle management, as we expected this group to perform well. As of the same date, the Portfolio held a nominal overweight in the energy sector, in light of well-positioned exploration and production holdings, which we believed should do well.
As of December 31, 2013, the Portfolio was underweight in the financials sector, reflecting our view that real estate investment trusts (REITs) do not fit the traditional definition of growth stocks (even though we maintain some exposure to the industry). As of the same date, the Portfolio held a modestly underweight position in information technology, although this was primarily a result of the June 2013 Russell reconstitution that substantially increased the benchmark’s information technology weighting.
The opinions expressed are those of the portfolio managers as of the date of this report and are subject to change. There is no guarantee that any forecasts made will come to pass. This material does not constitute investment advice and is not intended as an endorsement of any specific investment.
Not all MainStay VP Portfolios and/or share classes are available under all policies.
| | |
| M-146 | | MainStay VP Eagle Small Cap Growth Portfolio |
Portfolio of Investments December 31, 2013
| | | | | | | | |
| | |
Shares | | | Value | |
| Common Stocks 100.0%† | |
Aerospace & Defense 1.8% | |
¨Hexcel Corp. (a) | | | 199,462 | | | $ | 8,913,957 | |
| | | | | | | | |
|
Airlines 1.6% | |
American Airlines Group, Inc. (a) | | | 103,316 | | | | 2,608,729 | |
JetBlue Airways Corp. (a) | | | 588,795 | | | | 5,034,197 | |
| | | | | | | | |
| | | | | | | 7,642,926 | |
| | | | | | | | |
Auto Components 0.8% | |
Tenneco, Inc. (a) | | | 73,130 | | | | 4,136,964 | |
| | | | | | | | |
| | |
Biotechnology 7.9% | | | | | | | | |
Acorda Therapeutics, Inc. (a) | | | 127,441 | | | | 3,721,277 | |
Aegerion Pharmaceuticals, Inc. (a) | | | 44,185 | | | | 3,135,368 | |
Cubist Pharmaceuticals, Inc. (a) | | | 66,513 | | | | 4,580,750 | |
Isis Pharmaceuticals, Inc. (a) | | | 63,139 | | | | 2,515,458 | |
Ophthotech Corp. (a) | | | 85,509 | | | | 2,766,216 | |
Seattle Genetics, Inc. (a) | | | 101,384 | | | | 4,044,208 | |
Theravance, Inc. (a) | | | 131,613 | | | | 4,692,003 | |
¨United Therapeutics Corp. (a) | | | 116,526 | | | | 13,176,760 | |
| | | | | | | | |
| | | | | | | 38,632,040 | |
| | | | | | | | |
Building Products 2.1% | |
PGT, Inc. (a) | | | 287,918 | | | | 2,913,730 | |
Trex Co., Inc. (a) | | | 63,533 | | | | 5,052,780 | |
USG Corp. (a) | | | 78,963 | | | | 2,240,970 | |
| | | | | | | | |
| | | | | | | 10,207,480 | |
| | | | | | | | |
Capital Markets 0.8% | |
Stifel Financial Corp. (a) | | | 79,090 | | | | 3,789,993 | |
| | | | | | | | |
|
Chemicals 2.9% | |
Huntsman Corp. | | | 260,380 | | | | 6,405,348 | |
¨Quaker Chemical Corp. | | | 103,876 | | | | 8,005,723 | |
| | | | | | | | |
| | | | | | | 14,411,071 | |
| | | | | | | | |
Commercial Banks 0.9% | |
UMB Financial Corp. | | | 70,602 | | | | 4,538,297 | |
| | | | | | | | |
|
Commercial Services & Supplies 1.3% | |
Waste Connections, Inc. | | | 141,616 | | | | 6,178,706 | |
| | | | | | | | |
|
Communications Equipment 1.4% | |
Aruba Networks, Inc. (a) | | | 170,058 | | | | 3,044,038 | |
Ixia (a) | | | 70,573 | | | | 939,327 | |
Palo Alto Networks, Inc. (a) | | | 50,620 | | | | 2,909,131 | |
| | | | | | | | |
| | | | | | | 6,892,496 | |
| | | | | | | | |
| | | | | | | | |
| | |
Shares | | | Value | |
Construction & Engineering 1.9% | |
Foster Wheeler A.G. (a) | | | 142,077 | | | $ | 4,691,383 | |
Northwest Pipe Co. (a) | | | 118,446 | | | | 4,472,521 | |
| | | | | | | | |
| | | | | | | 9,163,904 | |
| | | | | | | | |
Construction Materials 1.6% | |
Texas Industries, Inc. (a) | | | 111,870 | | | | 7,694,419 | |
| | | | | | | | |
|
Diversified Consumer Services 0.8% | |
Grand Canyon Education, Inc. (a) | | | 47,745 | | | | 2,081,682 | |
Sotheby’s | | | 35,493 | | | | 1,888,228 | |
| | | | | | | | |
| | | | | | | 3,969,910 | |
| | | | | | | | |
Electrical Equipment 0.7% | |
Thermon Group Holdings, Inc. (a) | | | 123,000 | | | | 3,361,590 | |
| | | | | | | | |
|
Electronic Equipment, Instruments & Components 3.9% | |
Coherent, Inc. (a) | | | 76,650 | | | | 5,701,994 | |
InvenSense, Inc. (a) | | | 306,286 | | | | 6,364,623 | |
IPG Photonics Corp. (a) | | | 87,366 | | | | 6,780,475 | |
| | | | | | | | |
| | | | | | | 18,847,092 | |
| | | | | | | | |
Energy Equipment & Services 2.2% | |
¨GeoSpace Technologies Corp. (a) | | | 115,592 | | | | 10,961,589 | |
| | | | | | | | |
| | |
Food & Staples Retailing 3.2% | | | | | | | | |
Fresh Market, Inc. (The) (a) | | | 95,105 | | | | 3,851,753 | |
¨Natural Grocers by Vitamin Cottage, Inc. (a) | | | 210,183 | | | | 8,922,268 | |
United Natural Foods, Inc. (a) | | | 41,400 | | | | 3,121,146 | |
| | | | | | | | |
| | | | | | | 15,895,167 | |
| | | | | | | | |
Food Products 1.9% | |
Pinnacle Foods, Inc. | | | 36,855 | | | | 1,012,038 | |
¨WhiteWave Foods Co. Class A (a) | | | 354,290 | | | | 8,127,413 | |
| | | | | | | | |
| | | | | | | 9,139,451 | |
| | | | | | | | |
Health Care Equipment & Supplies 6.9% | |
Align Technology, Inc. (a) | | | 65,937 | | | | 3,768,300 | |
ArthroCare Corp. (a) | | | 192,151 | | | | 7,732,156 | |
Cooper Cos., Inc. (The) | | | 55,634 | | | | 6,889,715 | |
Cyberonics, Inc. (a) | | | 17,280 | | | | 1,132,013 | |
Endologix, Inc. (a) | | | 67,042 | | | | 1,169,212 | |
Natus Medical, Inc. (a) | | | 46,124 | | | | 1,037,790 | |
Sirona Dental Systems, Inc. (a) | | | 70,136 | | | | 4,923,547 | |
Thoratec Corp. (a) | | | 192,864 | | | | 7,058,822 | |
| | | | | | | | |
| | | | | | | 33,711,555 | |
| | | | | | | | |
Health Care Providers & Services 4.6% | |
Air Methods Corp. (a) | | | 132,025 | | | | 7,701,018 | |
Centene Corp. (a) | | | 135,734 | | | | 8,001,519 | |
| † | Percentages indicated are based on Portfolio net assets. |
| ¨ | | Among the Portfolio’s 10 largest holdings, as of December 31, 2013, excluding short-term investment. May be subject to change daily. |
| | | | | | |
The notes to the financial statements are an integral part of,
and should be read in conjunction with, the financial statements. | | mainstayinvestments.com | | | M-147 | |
Portfolio of Investments December 31, 2013 (continued)
| | | | | | | | |
| | |
Shares | | | Value | |
| Common Stocks (continued) | |
Health Care Providers & Services (continued) | |
MWI Veterinary Supply, Inc. (a) | | | 6,576 | | | $ | 1,121,800 | |
Team Health Holdings, Inc. (a) | | | 119,519 | | | | 5,444,091 | |
| | | | | | | | |
| | | | | | | 22,268,428 | |
| | | | | | | | |
Health Care Technology 2.0% | |
athenahealth, Inc. (a) | | | 18,155 | | | | 2,441,848 | |
MedAssets, Inc. (a) | | | 279,121 | | | | 5,534,969 | |
Medidata Solutions, Inc. (a) | | | 26,282 | | | | 1,591,901 | |
| | | | | | | | |
| | | | | | | 9,568,718 | |
| | | | | | | | |
Hotels, Restaurants & Leisure 4.3% | |
¨Bally Technologies, Inc. (a) | | | 133,788 | | | | 10,495,668 | |
Chuy’s Holdings, Inc. (a) | | | 70,845 | | | | 2,551,837 | |
Orient-Express Hotels, Ltd. (a) | | | 355,525 | | | | 5,371,983 | |
Pinnacle Entertainment, Inc. (a) | | | 106,608 | | | | 2,770,742 | |
| | | | | | | | |
| | | | | | | 21,190,230 | |
| | | | | | | | |
Household Durables 1.2% | |
Universal Electronics, Inc. (a) | | | 149,577 | | | | 5,700,379 | |
| | | | | | | | |
|
Insurance 1.2% | |
Validus Holdings, Ltd. | | | 148,525 | | | | 5,984,072 | |
| | | | | | | | |
|
Internet Software & Services 5.0% | |
Angie’s List, Inc. (a) | | | 199,171 | | | | 3,017,441 | |
¨Cornerstone OnDemand, Inc. (a) | | | 152,030 | | | | 8,109,280 | |
Demandware, Inc. (a) | | | 78,577 | | | | 5,038,357 | |
Marin Software, Inc. (a) | | | 133,454 | | | | 1,366,569 | |
Rocket Fuel, Inc. (a) | | | 21,401 | | | | 1,315,947 | |
Trulia, Inc. (a) | | | 164,544 | | | | 5,803,467 | |
| | | | | | | | |
| | | | | | | 24,651,061 | |
| | | | | | | | |
Life Sciences Tools & Services 0.8% | |
Furiex Pharmaceuticals, Inc. (a) | | | 30,783 | | | | 1,293,194 | |
PAREXEL International Corp. (a) | | | 52,718 | | | | 2,381,799 | |
| | | | | | | | |
| | | | | | | 3,674,993 | |
| | | | | | | | |
Machinery 4.9% | |
Chart Industries, Inc. (a) | | | 44,214 | | | | 4,228,627 | |
Colfax Corp. (a) | | | 92,297 | | | | 5,878,396 | |
Manitowoc Co., Inc. (The) | | | 174,721 | | | | 4,074,494 | |
Trimas Corp. (a) | | | 74,061 | | | | 2,954,293 | |
WABCO Holdings, Inc. (a) | | | 33,520 | | | | 3,131,103 | |
Woodward, Inc. | | | 79,820 | | | | 3,640,590 | |
| | | | | | | | |
| | | | | | | 23,907,503 | |
| | | | | | | | |
Metals & Mining 1.3% | |
RTI International Metals, Inc. (a) | | | 190,390 | | | | 6,513,242 | |
| | | | | | | | |
|
Oil, Gas & Consumable Fuels 2.5% | |
Diamondback Energy, Inc. (a) | | | 31,825 | | | | 1,682,270 | |
Gulfport Energy Corp. (a) | | | 111,682 | | | | 7,052,718 | |
| | | | | | | | |
| | |
Shares | | | Value | |
Oil, Gas & Consumable Fuels (continued) | |
Oasis Petroleum, Inc. (a) | | | 51,863 | | | $ | 2,436,005 | |
Western Refining, Inc. | | | 29,160 | | | | 1,236,676 | |
| | | | | | | | |
| | | | | | | 12,407,669 | |
| | | | | | | | |
Pharmaceuticals 1.0% | |
Salix Pharmaceuticals, Ltd. (a) | | | 55,744 | | | | 5,013,615 | |
| | | | | | | | |
|
Real Estate Investment Trusts 2.0% | |
GEO Group, Inc. (The) | | | 226,442 | | | | 7,295,961 | |
Two Harbors Investment Corp. | | | 292,639 | | | | 2,715,690 | |
| | | | | | | | |
| | | | | | | 10,011,651 | |
| | | | | | | | |
Road & Rail 1.4% | |
Landstar System, Inc. | | | 66,518 | | | | 3,821,459 | |
Quality Distribution, Inc. (a) | | | 221,651 | | | | 2,843,782 | |
| | | | | | | | |
| | | | | | | 6,665,241 | |
| | | | | | | | |
Semiconductors & Semiconductor Equipment 4.1% | |
Cavium, Inc. (a) | | | 160,778 | | | | 5,548,449 | |
EZchip Semiconductor, Ltd. (a) | | | 75,392 | | | | 1,855,397 | |
Kulicke & Soffa Industries, Inc. (a) | | | 89,613 | | | | 1,191,853 | |
Sunedison, Inc. (a) | | | 202,070 | | | | 2,637,013 | |
Teradyne, Inc. (a) | | | 270,984 | | | | 4,774,738 | |
Veeco Instruments, Inc. (a) | | | 116,802 | | | | 3,843,954 | |
| | | | | | | | |
| | | | | | | 19,851,404 | |
| | | | | | | | |
Software 8.5% | |
Aspen Technology, Inc. (a) | | | 120,354 | | | | 5,030,797 | |
Concur Technologies, Inc. (a) | | | 47,519 | | | | 4,903,010 | |
Fortinet, Inc. (a) | | | 278,334 | | | | 5,324,529 | |
Guidewire Software, Inc. (a) | | | 62,814 | | | | 3,082,283 | |
Imperva, Inc. (a) | | | 95,321 | | | | 4,587,800 | |
NICE Systems, Ltd., Sponsored ADR | | | 117,537 | | | | 4,814,316 | |
PTC, Inc. (a) | | | 76,348 | | | | 2,701,956 | |
QLIK Technologies, Inc. (a) | | | 189,990 | | | | 5,059,434 | |
TIBCO Software, Inc. (a) | | | 97,654 | | | | 2,195,262 | |
Ultimate Software Group, Inc. (a) | | | 24,293 | | | | 3,722,173 | |
| | | | | | | | |
| | | | | | | 41,421,560 | |
| | | | | | | | |
Specialty Retail 6.9% | |
Chico’s FAS, Inc. | | | 129,256 | | | | 2,435,183 | |
Container Store Group, Inc. (The) (a) | | | 12,836 | | | | 598,286 | |
¨Genesco, Inc. (a) | | | 205,414 | | | | 15,007,547 | |
Outerwall, Inc. (a) | | | 45,711 | | | | 3,074,979 | |
TravelCenters of America LLC (a) | | | 156,032 | | | | 1,519,752 | |
¨Vitamin Shoppe, Inc. (a) | | | 215,125 | | | | 11,188,651 | |
| | | | | | | | |
| | | | | | | 33,824,398 | |
| | | | | | | | |
Textiles, Apparel & Luxury Goods 2.7% | |
Deckers Outdoor Corp. (a) | | | 61,575 | | | | 5,200,625 | |
Steven Madden, Ltd. (a) | | | 148,087 | | | | 5,418,503 | |
Vince Holding Corp. (a) | | | 87,170 | | | | 2,673,504 | |
| | | | | | | | |
| | | | | | | 13,292,632 | |
| | | | | | | | |
| | | | |
| M-148 | | MainStay VP Eagle Small Cap Growth Portfolio | | The notes to the financial statements are an integral part of,
and should be read in conjunction with, the financial statements. |
| | | | | | | | |
| | |
Shares | | | Value | |
| Common Stocks (continued) | |
Thrifts & Mortgage Finance 1.0% | |
Home Loan Servicing Solutions, Ltd. | | | 206,141 | | | $ | 4,735,059 | |
| | | | | | | | |
Total Common Stocks
(Cost $385,697,649) | | | | | | | 488,770,462 | |
| | | | | | | | |
| | |
| | | | | | | | |
| | | Principal
Amount | | | | |
| Short-Term Investment 0.0%‡ | | | | | | | | |
Repurchase Agreement 0.0%‡ | | | | | | | | |
State Street Bank and Trust Co.
0.00%, dated 12/31/13
due 1/2/14
Proceeds at Maturity $107,962 (Collateralized by a Federal National Mortgage Association security with a rate of 2.17% and a maturity date of 11/7/22, with a Principal Amount of $125,000 and a Market Value of $113,789) | | $ | 107,962 | | | | 107,962 | |
| | | | | | | | |
Total Short-Term Investment
(Cost $107,962) | | | | | | | 107,962 | |
| | | | | | | | |
Total Investments
(Cost $385,805,611) (b) | | | 100.0 | % | | | 488,878,424 | |
Other Assets, Less Liabilities | | | (0.0 | )‡ | | | (49,069 | ) |
Net Assets | | | 100.0 | % | | $ | 488,829,355 | |
| ‡ | Less than one-tenth of a percent. |
| (a) | Non-income producing security. |
| (b) | As of December 31, 2013, cost is $386,710,988 for federal income tax purposes and net unrealized appreciation is as follows: |
| | | | |
Gross unrealized appreciation | | $ | 108,585,537 | |
Gross unrealized depreciation | | | (6,418,101 | ) |
| | | | |
Net unrealized appreciation | | $ | 102,167,436 | |
| | | | |
The following abbreviation is used in the above portfolio:
ADR—American Depositary Receipt
The following is a summary of the fair valuations according to the inputs used as of December 31, 2013, for valuing the Portfolio’s assets.
Asset Valuation Inputs
| | | | | | | | | | | | | | | | |
Description | | Quoted Prices in
Active Markets
for Identical Assets (Level 1) | | | Significant Other
Observable Inputs (Level 2) | | | Significant
Unobservable
Inputs (Level 3) | | | Total | |
| Investments in Securities (a) | | | | | | | | | | | | | | | | |
| Common Stocks | | $ | 488,770,462 | | | $ | — | | | $ | — | | | $ | 488,770,462 | |
| Short-Term Investment | | | | | | | | | | | | | | | | |
Repurchase Agreement | | | — | | | | 107,962 | | | | — | | | | 107,962 | |
| | | | | | | | | | | | | | | | |
| Total Investments in Securities | | $ | 488,770,462 | | | $ | 107,962 | | | $ | — | | | $ | 488,878,424 | |
| | | | | | | | | | | | | | | | |
| (a) | For a complete listing of investments and their industries, see the Portfolio of Investments. |
The Portfolio recognizes transfers between the levels as of the beginning of the period.
For the year ended December 31, 2013, the Portfolio did not have any transfers between Level 1 and Level 2 fair value measurements. (See Note 2)
As of December 31, 2013, the Portfolio did not hold any investments with significant unobservable inputs (Level 3). (See Note 2)
| | | | | | |
The notes to the financial statements are an integral part of,
and should be read in conjunction with, the financial statements. | | mainstayinvestments.com | | | M-149 | |
Statement of Assets and Liabilities as of December 31, 2013
| | | | |
| Assets | | | | |
Investment in securities, at value
(identified cost $385,805,611) | | $ | 488,878,424 | |
Receivables: | | | | |
Investment securities sold | | | 2,056,845 | |
Dividends and interest | | | 70,087 | |
Fund shares sold | | | 61,267 | |
| | | | |
Total assets | | | 491,066,623 | |
| | | | |
| |
| Liabilities | | | | |
Payables: | | | | |
Investment securities purchased | | | 949,964 | |
Fund shares redeemed | | | 887,164 | |
Manager (See Note 3) | | | 328,277 | |
Professional fees | | | 31,413 | |
Shareholder communication | | | 23,513 | |
NYLIFE Distributors (See Note 3) | | | 12,088 | |
Custodian | | | 1,577 | |
Trustees | | | 447 | |
Accrued expenses | | | 2,825 | |
| | | | |
Total liabilities | | | 2,237,268 | |
| | | | |
Net assets | | $ | 488,829,355 | |
| | | | |
| |
| Net Assets Consist of | | | | |
Shares of beneficial interest outstanding (par value of $.001 per share) unlimited number of shares authorized | | $ | 37,416 | |
Additional paid-in capital | | | 384,758,546 | |
| | | | |
| | | 384,795,962 | |
Net investment loss | | | (346,678 | ) |
Accumulated net realized gain (loss) on investments | | | 1,307,258 | |
Net unrealized appreciation (depreciation) on investments | | | 103,072,813 | |
| | | | |
Net assets | | $ | 488,829,355 | |
| | | | |
| | | | |
Initial Class | | | | |
Net assets applicable to outstanding shares | | $ | 430,113,612 | |
| | | | |
Shares of beneficial interest outstanding | | | 32,907,453 | |
| | | | |
Net asset value per share outstanding | | $ | 13.07 | |
| | | | |
Service Class | | | | |
Net assets applicable to outstanding shares | | $ | 58,715,743 | |
| | | | |
Shares of beneficial interest outstanding | | | 4,508,959 | |
| | | | |
Net asset value per share outstanding | | $ | 13.02 | |
| | | | |
| | | | |
| M-150 | | MainStay VP Eagle Small Cap Growth Portfolio | | The notes to the financial statements are an integral part of,
and should be read in conjunction with, the financial statements. |
Statement of Operations for the year ended December 31, 2013
| | | | |
| Investment Income (Loss) | | | | |
Income | | | | |
Dividends (a) | | $ | 2,306,454 | |
Interest | | | 169 | |
| | | | |
Total income | | | 2,306,623 | |
| | | | |
Expenses | | | | |
Manager (See Note 3) | | | 3,226,283 | |
Distribution and service—Service Class (See Note 3) | | | 130,364 | |
Shareholder communication | | | 63,122 | |
Professional fees | | | 51,268 | |
Custodian | | | 12,860 | |
Trustees | | | 7,778 | |
Miscellaneous | | | 15,804 | |
| | | | |
Total expenses | | | 3,507,479 | |
| | | | |
Net investment income (loss) | | | (1,200,856 | ) |
| | | | |
|
| Realized and Unrealized Gain (Loss) on Investments | |
Net realized gain (loss) on investments | | | 10,047,678 | |
Net change in unrealized appreciation (depreciation) on investments | | | 95,169,781 | |
| | | | |
Net realized and unrealized gain (loss) on investments | | | 105,217,459 | |
| | | | |
Net increase (decrease) in net assets resulting from operations | | $ | 104,016,603 | |
| | | | |
| (a) | Dividends recorded net of foreign withholding taxes in the amount of $7,428. |
| | | | | | |
The notes to the financial statements are an integral part of,
and should be read in conjunction with, the financial statements. | | mainstayinvestments.com | | | M-151 | |
Statements of Changes in Net Assets
for the year ended December 31, 2013 and the period February 17, 2012 (inception date) through December 31, 2012
| | | | | | | | |
| | | 2013 | | | 2012 | |
| Increase (Decrease) in Net Assets | | | | | |
Operations: | | | | | | | | |
Net investment income (loss) | | $ | (1,200,856 | ) | | $ | 448,660 | |
Net realized gain (loss) on investments | | | 10,047,678 | | | | (8,837,884 | ) |
Net change in unrealized appreciation (depreciation) on investments | | | 95,169,781 | | | | 7,903,032 | |
| | | | |
Net increase (decrease) in net assets resulting from operations | | | 104,016,603 | | | | (486,192 | ) |
| | | | |
Dividends to shareholders: | | | | | | | | |
From net investment income: | | | | | | | | |
Initial Class | | | (367,498 | ) | | | — | |
| | | | |
Total dividends to shareholders | | | (367,498 | ) | | | — | |
| | | | |
Capital share transactions: | | | | | | | | |
Net proceeds from sale of shares | | | 138,732,315 | | | | 374,820,551 | |
Net asset value of shares issued to shareholders in reinvestment of dividends | | | 367,498 | | | | — | |
Cost of shares redeemed | | | (72,145,504 | ) | | | (56,108,418 | ) |
| | | | |
Increase (decrease) in net assets derived from capital share transactions | | | 66,954,309 | | | | 318,712,133 | |
| | | | |
Net increase (decrease) in net assets | | | 170,603,414 | | | | 318,225,941 | |
| | |
| Net Assets | | | | | | | | |
Beginning of period | | | 318,225,941 | | | | — | |
| | | | |
End of period | | $ | 488,829,355 | | | $ | 318,225,941 | |
| | | | |
Net investment income (loss) at end of period | | $ | (346,678 | ) | | $ | 250,633 | |
| | | | |
| | | | |
| M-152 | | MainStay VP Eagle Small Cap Growth Portfolio | | The notes to the financial statements are an integral part of,
and should be read in conjunction with, the financial statements. |
Financial Highlights selected per share data and ratios
| | | | | | | | |
| | | Initial Class | |
| | | Year ended
December 31, | | | February 17,
2012**
through
December 31, | |
| | | 2013 | | | 2012 | |
Net asset value at beginning of period | | $ | 9.99 | | | $ | 10.00 | |
| | | | | | | | |
Net investment income (loss) | | | (0.03 | ) | | | 0.02 | |
Net realized and unrealized gain (loss) on investments | | | 3.12 | | | | (0.03 | ) |
| | | | | | | | |
Total from investment operations | | | 3.09 | | | | (0.01 | ) |
| | | | | | | | |
Less dividends: | | | | | | | | |
From net investment income | | | (0.01 | ) | | | — | |
| | | | | | | | |
Net asset value at end of period | | $ | 13.07 | | | $ | 9.99 | |
| | | | | | | | |
Total investment return | | | 30.89 | % | | | (0.10 | %)(a)(b) |
Ratios (to average net assets)/Supplemental Data: | | | | | | | | |
Net investment income (loss) | | | (0.27 | %) | | | 0.22 | % †† |
Net expenses | | | 0.85 | % | | | 0.86 | % †† |
Portfolio turnover rate | | | 41 | % | | | 78 | % |
Net assets at end of period (in 000’s) | | $ | 430,114 | | | $ | 272,908 | |
| (a) | Total investment return is not annualized. |
| (b) | Total investment return may reflect adjustments to conform to generally accepted accounting principles. |
| | | | | | | | |
| | | Service Class | |
| | | Year ended
December 31, | | | February 17,
2012**
through
December 31, | |
| | | 2013 | | | 2012 | |
Net asset value at beginning of period | | $ | 9.97 | | | $ | 10.00 | |
| | | | | | | | |
Net investment income (loss) | | | (0.06 | ) | | | (0.01 | ) |
Net realized and unrealized gain (loss) on investments | | | 3.11 | | | | (0.02 | ) |
| | | | | | | | |
Total from investment operations | | | 3.05 | | | | (0.03 | ) |
| | | | | | | | |
Net asset value at end of period | | $ | 13.02 | | | $ | 9.97 | |
| | | | | | | | |
Total investment return (a) | | | 30.56 | % | | | (0.30 | %)(b) |
Ratios (to average net assets)/Supplemental Data: | | | | | | | | |
Net investment income (loss) | | | (0.51 | %) | | | (0.09 | %)†† |
Net expenses | | | 1.10 | % | | | 1.11 | % †† |
Portfolio turnover rate | | | 41 | % | | | 78 | % |
Net assets at end of period (in 000’s) | | $ | 58,716 | | | $ | 45,318 | |
| (a) | Total investment returns may reflect adjustments to conform to generally accepted accounting principles. |
| (b) | Total investment return is not annualized. |
| | | | | | |
The notes to the financial statements are an integral part of,
and should be read in conjunction with, the financial statements. | | mainstayinvestments.com | | | M-153 | |
MainStay VP Floating Rate Portfolio
Investment and Performance Comparison (Unaudited)
Performance data quoted represents past performance. Past performance is no guarantee of future results. Because of market volatility, current performance may be lower or higher than the figures shown. Investment return and principal value will fluctuate, and as a result, when shares are redeemed, they may be worth more or less than their original cost. The performance table and graph do not reflect any deduction of sales charges, mortality and expense charges, contract charges or administrative charges. Please refer to the Performance Summary appropriate for your policy. For performance information current to the most recent month-end, please call 800-598-2019 or visit www.newyorklife.com.
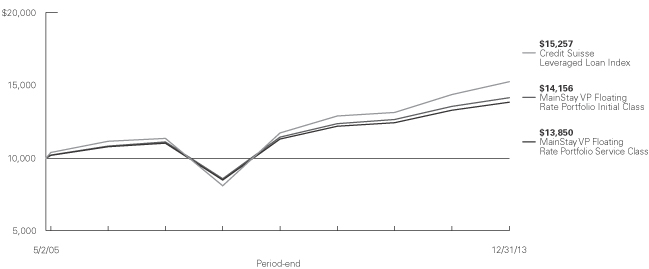
Average Annual Total Returns for the Period Ended December 31, 2013
| | | | | | | | | | | | | | | | |
| Class | | One Year | | | Five Years | | | Since Inception
(5/2/05) | | | Gross Expense Ratio1 | |
| Initial Class Shares | | | 4.46 | % | | | 10.55 | % | | | 4.09 | % | | | 0.65 | % |
| Service Class Shares | | | 4.20 | | | | 10.27 | | | | 3.82 | | | | 0.90 | |
| | | | | | | | | | | | |
| Benchmark Performance | | One
Year | | | Five
Years | | | Since Inception
(5/2/05) | |
Credit Suisse Leveraged Loan Index2 | | | 6.15 | % | | | 13.51 | % | | | 4.99 | % |
Average Lipper Loan Participation Fund3 | | | 5.45 | | | | 12.47 | | | | 3.87 | |
| 1. | The gross expense ratios presented reflect the Portfolio’s “Total Annual Portfolio Operating Expenses” from the most recent Prospectus and may differ from other expense ratios disclosed in this report. |
| 2. | Please refer to pages M-2 and M-3 for additional explanations and disclosure regarding the Portfolios, their benchmark indices and other indices mentioned in the reports. |
| 3. | The Average Lipper Loan Participation Fund is representative of funds that invest primarily in participation interests in collateralized senior corporate loans that have floating or variable rates. Lipper Inc. is an independent monitor of fund performance. Results are based on total returns with all dividend and capital gain distributions reinvested. |
| | | | |
| | M-154 | | | MainStay VP Floating Rate Portfolio |
Cost in Dollars of a $1,000 Investment in MainStay VP Floating Rate Portfolio (Unaudited)
The example below is intended to describe the fees and expenses borne by shareholders during the six-month period from July 1, 2013, to December 31, 2013, and the impact of those costs on your investment.
Example
As a shareholder of the Portfolio, you incur two types of costs: (1) transaction costs, including exchange fees and sales charges (loads) on purchases (as applicable), and (2) ongoing costs, including management fees, distribution and/or service (12b-1) fees, and other Portfolio expenses (as applicable). This example is intended to help you understand your ongoing costs (in dollars) of investing in the Portfolio and to compare these costs with the ongoing costs of investing in other Portfolios. The example is based on an investment of $1,000 made at the beginning of the six-month period and held for the entire period from July 1, 2013, to December 31, 2013. Shares are only sold in connection with variable life and annuity contracts and the example does not reflect any contract level or transactional fees or expenses. If these costs had been included, your costs would have been higher.
This example illustrates your Portfolio’s ongoing costs in two ways:
Actual Expenses
The second and third data columns in the table below provide information about actual account values and actual expenses. You may use the information in these columns, together with the amount you invested, to estimate the expenses that you paid during the six months ended
December 31, 2013. Simply divide your account value by $1,000 (for example, an $8,600 account value divided by $1,000 = 8.6), then multiply the result by the number under the heading entitled “Expenses Paid During Period” to estimate the expenses you paid on your account during this period.
Hypothetical Example for Comparison Purposes
The fourth and fifth data columns in the table below provide information about hypothetical account values and hypothetical expenses based on the Portfolio’s actual expense ratio and an assumed rate of return of 5% per year before expenses, which is not the Portfolio’s actual return. The hypothetical account values and expenses may not be used to estimate the actual ending account balances or expenses you paid for the six-month period shown. You may use this information to compare the ongoing costs of investing in the Portfolio with the ongoing costs of investing in other Portfolios. To do so, compare this 5% hypothetical example with the 5% hypothetical examples that appear in the shareholder reports of the other Portfolios.
Please note that the expenses shown in the table are meant to highlight your ongoing costs only and do not reflect any transactional costs, such as exchange fees or sales charges (loads). Therefore, the fourth and fifth data columns of the table are useful in comparing ongoing costs only and will not help you determine the relative total costs of owning different funds. In addition, if these transactional costs were included, your costs would have been higher.
| | | | | | | | | | | | | | | | | | | | |
| | | | | | | | | | | | | | | | |
| Share Class | | Beginning
Account
Value
7/1/13 | | | Ending Account
Value (Based
on Actual
Returns and
Expenses)
12/31/13 | | | Expenses
Paid
During
Period1 | | | Ending Account
Value (Based
on Hypothetical
5% Annualized
Return and
Actual Expenses)
12/31/13 | | | Expenses
Paid
During
Period1 | |
| | | | | |
| Initial Class Shares | | $ | 1,000.00 | | | $ | 1,028.00 | | | $ | 3.27 | | | $ | 1,022.00 | | | $ | 3.26 | |
| | | | | |
| Service Class Shares | | $ | 1,000.00 | | | $ | 1,026.70 | | | $ | 4.55 | | | $ | 1,020.70 | | | $ | 4.53 | |
| 1. | Expenses are equal to the Portfolio’s annualized expense ratio of each class (0.64% for Initial Class and 0.89% for Service Class) multiplied by the average account value over the period, divided by 365 and multiplied by 184 (to reflect the six-month period). The table above represents the actual expenses incurred during the six-month period. |
| | | | |
| mainstayinvestments.com | | | M-155 | |
Portfolio Composition as of December 31, 2013 (Unaudited)
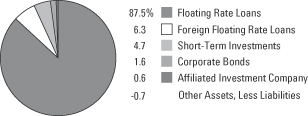
See Portfolio of Investments beginning on page M-159 for specific holdings within these categories.
Top Ten Issuers Held as of December 31, 2013 (excluding short-term investments) (Unaudited)
| 1. | First Data Corp., 4.164%–6.75%, due 3/24/17–11/1/20 |
| 2. | FMG Resources August 2006 Pty, Ltd., 4.25%–6.375%, due 2/1/16–6/28/19 |
| 3. | Onex Carestream Finance, L.P., 5.00%–9.50%, due 6/7/19 |
| 4. | TWCC Holding Corp., 3.50%–7.00%, due 2/13/17–6/26/20 |
| 5. | Hilton Worldwide Finance LLC, 3.75%, due 10/26/20 |
| 6. | Reynolds Group, 4.00%–9.875%, due 12/3/18–8/15/19 |
| 7. | Rexnord LLC, 4.00%, due 8/21/20 |
| 8. | Calpine Corp., 4.00%, due 4/2/18 |
| 9. | Hertz Corp. (The), 3.00%–3.75%, due 3/9/18–3/11/18 |
| 10. | Univision Communications, Inc., 4.00%–4.50%, due 3/2/20 |
| | |
| M-156 | | MainStay VP Floating Rate Portfolio |
Portfolio Management Discussion and Analysis
Answers to the questions reflect the views of portfolio managers Robert H. Dial, Mark A. Campellone and Arthur S. Torrey of New York Life Investments,1 the Portfolio’s Manager.
How did MainStay VP Floating Rate Portfolio perform relative to its benchmark and peers during the 12 months ended December 31, 2013?
For the 12 months ended December 31, 2013, MainStay VP Floating Rate Portfolio returned 4.46% for Initial Class shares and 4.20% for Service Class shares. Over the same period, both share classes underperformed the 6.15% return of the Credit Suisse Leveraged Loan Index,2 which is the Portfolio’s broad-based securities-market index. Both share classes also underperformed the 5.45% return of the average Lipper2 Loan Participation Fund for the 12 months ended December 31, 2013.
What were the most significant factors and risks that influenced the markets in which the Portfolio invested during the 12 months ended December 31, 2013?
Strong demand for the floating-rate loan asset class, driven by significant mutual fund inflows and strong new issuance of collateralized loan obligations, provided substantial support for secondary prices and drove returns during the reporting period. Riskier assets (those rated CCC3 and lower and distressed credits) outperformed less-risky credits (loans rated BB and B)4 during the reporting period. There was a modest decline in market prices, which constrained returns during May and June of 2013, but substantial demand for the asset class through the summer and fall of 2013 provided pricing support to sustain strong returns.
What factors affected the Portfolio’s relative performance during the reporting period?
An overweight position in credits rated BB and cash balances, coupled with an underweight position in
credits rated CCC and lower, unrated credit and distressed credit, contributed to the Portfolio’s underperformance of the Credit Suisse Leveraged Loan Index. We rebalanced exposure during the year, reducing BB exposure in favor of additional exposure to credits rated B. We also increased the Portfolio’s CCC exposure modestly but still remained underweight relative to the Index. We also reduced the Portfolio’s exposure to fixed-rate bonds.
What was the Portfolio’s duration5 strategy during the reporting period?
The Portfolio invested in floating-rate loans that had a weighted average effective duration of less than three months. Floating-rate loans mature, on average, in five to seven years, but loan maturity can be as long as nine years. The underlying interest-rate contracts of the Portfolio’s loans, which are typically pegged to LIBOR, reset every 30, 60, 90 or 180 days. The Portfolio’s weighted average days-to-reset figure at December 31, 2013, was 57 days, which we consider to be a short duration. Since reset dates may vary for different loans, the actual period between a shift in interest rates and the time when the Portfolio would “catch up” may differ.
What specific factors, risks or market forces prompted significant decisions for the Portfolio during the reporting period?
With the Federal Reserve suggesting a possible tapering of its direct bond purchases (widely known as quantitative easing) and a reduced volume of monthly asset purchases, we reduced exposure to high-yield bonds from 10.1% at the beginning of the reporting period to 1.6% as of December 31, 2013.
| 1. | “New York Life Investments” is a service mark used by New York Life Investment Management Holdings LLC and its subsidiary New York Life Investment Management LLC. |
| 2. | Please refer to pages M-2 and M-3 for additional explanations and disclosure regarding the Portfolios, their benchmark indices and service providers mentioned in the reports. |
| 3. | An obligation rated ‘CCC’ by Standard & Poor’s (“S&P”) is deemed by S&P to be currently vulnerable to nonpayment and is dependent upon favorable business, financial and economic conditions for the obligor to meet its financial commitment on the obligation. It is the opinion of S&P that in the event of adverse business, financial or economic conditions, the obligor is not likely to have the capacity to meet its financial commitment on the obligation. When applied to Portfolio holdings, ratings are based solely on the creditworthiness of the bonds in the portfolio and are not meant to represent the security or safety of the Portfolio. |
| 4. | An obligation rated ‘BB’ by S&P is deemed by S&P to be less vulnerable to nonpayment than other speculative issues. In the opinion of S&P, however, the obligor faces major ongoing uncertainties or exposure to adverse business, financial or economic conditions which could lead to the obligor’s inadequate capacity to meet its financial commitment on the obligation. An obligation rated ‘B’ by S&P is deemed by S&P to be more vulnerable to nonpayment than obligations rated ‘BB’, but in the opinion of S&P, the obligor currently has the capacity to meet its financial commitment on the obligation. It is the opinion of S&P that adverse business, financial, or economic conditions will likely impair the obligor’s capacity or willingness to meet its financial commitment on the obligation. When applied to Portfolio holdings, ratings are based solely on the creditworthiness of the bonds in the portfolio and are not meant to represent the security or safety of the Portfolio. |
| 5. | Duration is a measure of the price sensitivity of a fixed-income investment to changes in interest rates. Duration is expressed as a number of years and is considered a more accurate sensitivity gauge than average maturity. |
| | | | |
| mainstayinvestments.com | | | M-157 | |
During the reporting period, which market segments were the strongest positive contributors to the Portfolio’s performance and which market segments were particularly weak?
Security selection contributed positively to the Portfolio’s performance relative to the Credit Suisse Leveraged Loan Index, while sector weightings—including the Portfolio’s cash balance and its underweight position in CCC-rated and unrated and distressed credits—detracted from performance relative to the Index. In addition, we believe that our high-yield bond exposure helped relative performance during the first quarter of the reporting period but likely detracted during the second quarter of 2013. During the third and fourth quarters, the Portfolio’s high-yield bond allocation helped relative performance; but since the allocation had been reduced, the benefit was relatively modest.
How did the Portfolio’s sector weightings change during the reporting period?
The Portfolio’s exposure to BB-rated credit decreased; exposure to B-rated credit increased. The Portfolio’s exposure to CCC-rated credit increased
modestly but still remained well below related exposure in the Credit Suisse Leveraged Loan Index.
At the industry level, exposure to health care decreased to a significantly underweight position relative to the Index because issues in the sector traded to levels that we believed were excessive, which priced value out of the sector. We increased exposure to services, information technology and financials, as we believed that those sectors offered attractive relative value.
How was the Portfolio positioned at the end of the reporting period?
As of December 31, 2013, the Portfolio held an approximately neutral weight relative to the Credit Suisse Leveraged Loan Index in credits rated BB and was slightly overweight relative to the Index in credit rated B. As of the same date, the Portfolio remained underweight relative to the Credit Suisse Leveraged Loan Index in credits rated CCC and lower and unrated credit. As of December 31, 2013, the Portfolio held approximately 1.6% of its net assets in fixed-rate high-yield instruments.
The opinions expressed are those of the portfolio managers as of the date of this report and are subject to change. There is no guarantee that any forecasts will come to pass. This material does not constitute investment advice and is not intended as an endorsement of any specific investment.
Not all MainStay VP Portfolios and/or share classes are available under all policies.
| | |
| M-158 | | MainStay VP Floating Rate Portfolio |
Portfolio of Investments December 31, 2013
| | | | | | | | |
| | | Principal
Amount | | | Value | |
Long-Term Bonds 95.4%† Corporate Bonds 1.6% | |
Aerospace & Defense 0.2% | | | | | | | | |
Oshkosh Corp.
8.25%, due 3/1/17 | | $ | 1,600,000 | | | $ | 1,682,033 | |
| | | | | | | | |
| | |
Buildings & Real Estate 0.3% | | | | | | | | |
Building Materials Corp. of America
6.875%, due 8/15/18 (a) | | | 1,200,000 | | | | 1,275,000 | |
CBRE Services, Inc.
6.625%, due 10/15/20 | | | 900,000 | | | | 963,000 | |
| | | | | | | | |
| | | | | | | 2,238,000 | |
| | | | | | | | |
Chemicals, Plastics & Rubber 0.2% | | | | | | | | |
Ineos Finance PLC
8.375%, due 2/15/19 (a) | | | 1,000,000 | | | | 1,112,500 | |
Kraton Polymers LLC / Kraton Polymers Capital Corp.
6.75%, due 3/1/19 | | | 150,000 | | | | 157,875 | |
| | | | | | | | |
| | | | | | | 1,270,375 | |
| | | | | | | | |
Containers, Packaging & Glass 0.2% | | | | | | | | |
Greif, Inc.
7.75%, due 8/1/19 | | | 650,000 | | | | 737,750 | |
¨Reynolds Group Issuer, Inc. / Reynolds Group Issuer LLC / Reynolds Group Issuer (Luxembourg) S.A.
9.875%, due 8/15/19 | | | 800,000 | | | | 890,000 | |
| | | | | | | | |
| | | | | | | 1,627,750 | |
| | | | | | | | |
Healthcare, Education & Childcare 0.1% | | | | | | | | |
Grifols, Inc.
8.25%, due 2/1/18 | | | 692,000 | | | | 737,845 | |
| | | | | | | | |
|
Mining, Steel, Iron & Non-Precious Metals 0.3% | |
¨FMG Resources August 2006 Pty, Ltd.
6.00%, due 4/1/17 (a) | | | 1,000,000 | | | | 1,062,500 | |
6.375%, due 2/1/16 (a) | | | 1,500,000 | | | | 1,552,500 | |
| | | | | | | | |
| | | | | | | 2,615,000 | |
| | | | | | | | |
Software 0.3% | | | | | | | | |
¨First Data Corp.
6.75%, due 11/1/20 (a) | | | 2,610,000 | | | | 2,714,400 | |
| | | | | | | | |
| | |
Telecommunications 0.0%‡ | | | | | | | | |
MetroPCS Wireless, Inc.
6.25%, due 4/1/21 (a) | | | 400,000 | | | | 415,000 | |
| | | | | | | | |
Total Corporate Bonds
(Cost $12,458,003) | | | | | | | 13,300,403 | |
| | | | | | | | |
| | | | | | | | |
| | | Principal
Amount | | | Value | |
| Floating Rate Loans 87.5% (b) | | | | | | | | |
Aerospace & Defense 3.3% | | | | | | | | |
Aeroflex, Inc.
New Term Loan B
4.50%, due 11/11/19 | | $ | 2,832,122 | | | $ | 2,853,363 | |
American Airlines, Inc.
Exit Term Loan
3.75%, due 6/27/19 | | | 4,196,631 | | | | 4,220,237 | |
Booz Allen Hamilton, Inc.
New Term Loan
3.75%, due 7/31/19 | | | 6,923,693 | | | | 6,937,541 | |
DigitalGlobe, Inc.
New Term Loan B
3.75%, due 1/31/20 | | | 794,000 | | | | 795,985 | |
SI Organization, Inc. (The)
Term Loan B
5.50%, due 11/22/16 | | | 2,764,981 | | | | 2,695,856 | |
Spirit Aerosystems, Inc.
Term Loan B
3.75%, due 4/18/19 | | | 3,242,250 | | | | 3,257,450 | |
TransDigm, Inc.
Term Loan C
3.75%, due 2/28/20 | | | 4,328,717 | | | | 4,335,933 | |
U.S. Airways Group, Inc.
Term Loan B1
4.00%, due 5/23/19 | | | 2,566,667 | | | | 2,582,708 | |
| | | | | | | | |
| | | | | | | 27,679,073 | |
| | | | | | | | |
Automobile 4.4% | | | | | | | | |
Affinia Group Intermediate Holdings, Inc.
Term Loan B2
4.75%, due 4/27/20 | | | 918,023 | | | | 927,203 | |
Allison Transmission, Inc.
Term Loan B2
3.17%, due 8/7/17 | | | 1,046,534 | | | | 1,047,842 | |
New Term Loan B3
3.75%, due 8/23/19 | | | 3,141,371 | | | | 3,155,115 | |
ASP HHI Acquisition Co., Inc.
Additional Term Loan
5.00%, due 10/5/18 | | | 2,234,994 | | | | 2,252,315 | |
Capital Automotive, L.P.
New Term Loan B
4.00%, due 4/10/19 | | | 4,740,859 | | | | 4,771,974 | |
New 2nd Lien Term Loan
6.00%, due 4/30/20 | | | 666,667 | | | | 686,667 | |
Chrysler Group LLC
New Term Loan B
4.25%, due 5/24/17 | | | 3,895,100 | | | | 3,912,118 | |
| † | Percentages indicated are based on Portfolio net assets. |
| ¨ | | Among the Portfolio’s 10 largest issuers held, as of December 31, 2013, excluding short-term investments. May be subject to change daily. |
| | | | | | |
The notes to the financial statements are an integral part of,
and should be read in conjunction with, the financial statements. | | mainstayinvestments.com | | | M-159 | |
Portfolio of Investments December 31, 2013 (continued)
| | | | | | | | |
| | | Principal
Amount | | | Value | |
| Floating Rate Loans (continued) | | | | | | | | |
Automobile (continued) | | | | | | | | |
Federal-Mogul Corp.
Term Loan B
2.108%, due 12/29/14 | | $ | 1,929,367 | | | $ | 1,897,211 | |
Term Loan C
2.108%, due 12/28/15 | | | 1,615,011 | | | | 1,588,094 | |
Goodyear Tire & Rubber Co. (The)
New 2nd Lien Term Loan
4.75%, due 4/30/19 | | | 6,150,000 | | | | 6,205,738 | |
KAR Auction Services, Inc.
Term Loan B
3.75%, due 5/19/17 | | | 3,643,039 | | | | 3,656,700 | |
Metaldyne LLC
REFI Term Loan B
5.00%, due 12/18/18 | | | 2,227,500 | | | | 2,240,865 | |
Tomkins LLC
Term Loan B2
3.75%, due 9/29/16 | | | 3,027,365 | | | | 3,034,177 | |
Tower Automotive Holdings USA LLC
Term Loan B
4.75%, due 4/23/20 | | | 1,990,013 | | | | 1,997,475 | |
| | | | | | | | |
| | | | | | | 37,373,494 | |
| | | | | | | | |
Beverage, Food & Tobacco 2.5% | | | | | | | | |
American Seafoods Group LLC
New Term Loan B
4.25%, due 3/16/18 (c) | | | 1,300,527 | | | | 1,291,993 | |
Del Monte Foods Co.
Term Loan
4.00%, due 3/8/18 | | | 5,975,693 | | | | 5,984,185 | |
H.J. Heinz Co.
Term Loan B2
3.50%, due 6/5/20 | | | 5,870,500 | | | | 5,910,501 | |
Michael Foods Group, Inc.
Term Loan
4.25%, due 2/23/18 | | | 5,558,669 | | | | 5,589,936 | |
Pinnacle Foods Finance LLC
Term Loan G
3.25%, due 4/29/20 | | | 2,382,000 | | | | 2,377,746 | |
| | | | | | | | |
| | | | | | | 21,154,361 | |
| | | | | | | | |
Broadcasting & Entertainment 4.8% | | | | | | | | |
Cequel Communications LLC
Term Loan B
3.50%, due 2/14/19 | | | 3,144,000 | | | | 3,148,914 | |
Charter Communications Operating LLC
Term Loan E
3.00%, due 7/1/20 | | | 1,791,000 | | | | 1,773,090 | |
Clear Channel Communications, Inc.
Term Loan B
4.75%, due 1/29/16 | | | 3,571,628 | | | | 3,459,122 | |
Term Loan D
6.919%, due 1/30/19 | | | 3,500,000 | | | | 3,339,584 | |
| | | | | | | | |
| | | Principal
Amount | | | Value | |
Broadcasting & Entertainment (continued) | |
Cumulus Media Holdings, Inc.
2013 Term Loan
4.25%, due 12/23/20 | | $ | 3,181,049 | | | $ | 3,200,931 | |
Hubbard Radio LLC
Term Loan B
4.50%, due 4/29/19 | | | 2,928,394 | | | | 2,943,036 | |
¨TWCC Holding Corp. | | | | | | | | |
REFI Term Loan B
3.50%, due 2/13/17 | | | 6,218,672 | | | | 6,239,349 | |
2nd Lien Term Loan
7.00%, due 6/26/20 | | | 2,333,333 | | | | 2,396,042 | |
¨Univision Communications, Inc. | | | | | | | | |
Term Loan C3
4.00%, due 3/2/20 | | | 2,382,000 | | | | 2,389,232 | |
Converted Extended Term Loan
4.50%, due 3/2/20 | | | 5,214,163 | | | | 5,239,301 | |
WideOpenWest Finance LLC
Term Loan B
4.75%, due 4/1/19 | | | 6,905,325 | | | | 6,928,865 | |
| | | | | | | | |
| | | | | | | 41,057,466 | |
| | | | | | | | |
Buildings & Real Estate 2.8% | | | | | | | | |
Armstrong World Industries, Inc.
New Term Loan B
3.50%, due 3/16/20 | | | 3,142,950 | | | | 3,143,934 | |
CB Richard Ellis Services, Inc.
New Term Loan B
2.915%, due 3/29/21 | | | 2,038,581 | | | | 2,042,828 | |
Continental Building Products LLC | | | | | | | | |
1st Lien Term Loan
4.75%, due 8/14/20 | | | 1,330,000 | | | | 1,329,169 | |
2nd Lien Term Loan
8.75%, due 2/15/21 | | | 666,667 | | | | 667,778 | |
CPG International, Inc.
New Term Loan
4.75%, due 9/30/20 | | | 2,493,750 | | | | 2,499,984 | |
Realogy Corp.
Extended Term Loan
4.50%, due 3/5/20 | | | 6,897,875 | | | | 6,960,390 | |
USIC Holdings, Inc.
1st Lien Term Loan
4.75%, due 7/10/20 (c) | | | 1,990,000 | | | | 1,995,805 | |
Wilsonart International Holdings LLC
Term Loan B
4.00%, due 10/31/19 | | | 5,279,969 | | | | 5,232,449 | |
| | | | | | | | |
| | | | | | | 23,872,337 | |
| | | | | | | | |
Cargo Transport 0.3% | | | | | | | | |
Swift Transportation Co., Inc.
New Term Loan B1
2.917%, due 12/21/16 | | | 1,060,815 | | | | 1,065,589 | |
| | | | |
| M-160 | | MainStay VP Floating Rate Portfolio | | The notes to the financial statements are an integral part of,
and should be read in conjunction with, the financial statements. |
| | | | | | | | |
| | | Principal
Amount | | | Value | |
| Floating Rate Loans (continued) | | | | | | | | |
Cargo Transport (continued) | | | | | | | | |
Swift Transportation Co., Inc. (continued) | | | | | | | | |
New Term Loan B2
4.00%, due 12/21/17 | | $ | 1,950,408 | | | $ | 1,961,623 | |
| | | | | | | | |
| | | | | | | 3,027,212 | |
| | | | | | | | |
Chemicals, Plastics & Rubber 3.7% | | | | | | | | |
Allnex USA, Inc. | | | | | | | | |
USD Term Loan B1
4.50%, due 10/3/19 | | | 1,462,183 | | | | 1,474,064 | |
USD Term Loan B2
4.50%, due 10/3/19 | | | 758,657 | | | | 764,821 | |
2nd Lien Term Loan
8.25%, due 4/3/20 | | | 400,000 | | | | 411,500 | |
Arysta LifeScience Corp. | | | | | | | | |
1st Lien Term Loan
4.50%, due 5/29/20 | | | 1,194,000 | | | | 1,199,970 | |
2nd Lien Term Loan
8.25%, due 11/30/20 | | | 800,000 | | | | 813,000 | |
Axalta Coating Systems U.S. Holdings, Inc.
Term Loan
4.75%, due 2/1/20 | | | 6,782,050 | | | | 6,823,495 | |
General Chemical Corp.
New Term Loan
5.007%, due 10/6/15 | | | 2,854,093 | | | | 2,861,228 | |
Ineos US Finance LLC
6 Year Term Loan
4.00%, due 5/4/18 | | | 5,236,891 | | | | 5,248,349 | |
MacDermid, Inc.
1st Lien Term Loan
4.00%, due 6/8/20 | | | 3,980,000 | | | | 4,004,875 | |
OXEA Finance LLC
USD Term Loan B2
4.25%, due 1/15/20 | | | 1,000,000 | | | | 1,007,500 | |
Univar, Inc.
Term Loan B
5.00%, due 6/30/17 | | | 6,951,435 | | | | 6,876,130 | |
| | | | | | | | |
| | | | | | | 31,484,932 | |
| | | | | | | | |
Containers, Packaging & Glass 1.7% | | | | | | | | |
Berlin Packaging LLC
1st Lien Term Loan
4.75%, due 4/2/19 | | | 149,250 | | | | 149,810 | |
New 2nd Lien Term Loan
8.75%, due 4/2/20 | | | 2,500,000 | | | | 2,553,125 | |
BWAY Holding Co., Inc.
Term Loan B
4.50%, due 8/7/17 | | | 3,801,600 | | | | 3,820,608 | |
Caraustar Industries, Inc.
Term Loan
7.50%, due 5/1/19 | | | 634,857 | | | | 649,935 | |
| | | | | | | | |
| | | Principal
Amount | | | Value | |
Containers, Packaging & Glass (continued) | |
¨Reynolds Group Holdings, Inc.
New Dollar Term Loan
4.00%, due 12/3/18 | | $ | 7,101,655 | | | $ | 7,160,244 | |
| | | | | | | | |
| | | | | | | 14,333,722 | |
| | | | | | | | |
Diversified/Conglomerate Manufacturing 2.5% | |
Gardner Denver, Inc.
USD Term Loan
4.25%, due 7/30/20 | | | 7,082,250 | | | | 7,087,562 | |
Maxim Crane Works, L.P.
2nd Lien Term Loan
10.25%, due 11/6/18 | | | 937,500 | | | | 938,672 | |
Quikrete Holdings, Inc. | | | | | | | | |
1st Lien Term Loan
4.00%, due 9/28/20 | | | 3,990,000 | | | | 4,006,590 | |
2nd Lien Term Loan
7.00%, due 3/26/21 | | | 700,000 | | | | 714,875 | |
Sensus USA, Inc.
1st Lien Term Loan
4.75%, due 5/9/17 | | | 1,458,760 | | | | 1,457,393 | |
Terex Corp.
New USD Term Loan
3.50%, due 4/28/17 | | | 818,517 | | | | 824,656 | |
TNT Crane & Rigging, Inc. | | | | | | | | |
1st Lien Term Loan
5.50%, due 11/27/20 | | | 1,333,333 | | | | 1,321,667 | |
2nd Lien Term Loan
10.00%, due 11/23/21 | | | 300,000 | | | | 279,000 | |
Veyance Technologies, Inc.
1st Lien Term Loan
5.25%, due 9/8/17 | | | 4,846,670 | | | | 4,855,151 | |
| | | | | | | | |
| | | | | | | 21,485,566 | |
| | | | | | | | |
Diversified/Conglomerate Service 6.9% | | | | | | | | |
Acosta, Inc.
New Term Loan B
4.25%, due 3/2/18 | | | 4,644,193 | | | | 4,667,414 | |
Advantage Sales & Marketing, Inc. | | | | | | | | |
New 1st Lien Term Loan
4.25%, due 12/18/17 | | | 3,414,127 | | | | 3,416,261 | |
New 2nd Lien Term Loan
8.25%, due 6/18/18 | | | 857,143 | | | | 865,714 | |
Brock Holdings III, Inc. | | | | | | | | |
New Term Loan B
6.002%, due 3/16/17 | | | 1,377,868 | | | | 1,382,460 | |
New 2nd Lien Term Loan
10.00%, due 3/16/18 | | | 750,000 | | | | 762,188 | |
CCC Information Services, Inc.
Term Loan
4.00%, due 12/20/19 | | | 1,538,241 | | | | 1,538,882 | |
| | | | | | |
The notes to the financial statements are an integral part of,
and should be read in conjunction with, the financial statements. | | mainstayinvestments.com | | | M-161 | |
Portfolio of Investments December 31, 2013 (continued)
| | | | | | | | |
| | | Principal
Amount | | | Value | |
| Floating Rate Loans (continued) | | | | | | | | |
Diversified/Conglomerate Service (continued) | |
Ceridian Corp.
New Term Loan B
4.415%, due 5/9/17 | | $ | 2,000,000 | | | $ | 2,006,666 | |
CompuCom Systems, Inc.
REFI Term Loan B
4.25%, due 5/11/20 | | | 5,671,500 | | | | 5,659,686 | |
Crossmark Holdings, Inc. | | | | | | | | |
1st Lien Term Loan
4.50%, due 12/20/19 (c) | | | 1,980,000 | | | | 1,965,150 | |
2nd Lien Term Loan
8.75%, due 12/21/20 (c) | | | 1,200,000 | | | | 1,191,000 | |
Emdeon Business Services LLC
Term Loan B2
3.75%, due 11/2/18 | | | 2,257,957 | | | | 2,261,721 | |
¨First Data Corp. | | | | | | | | |
New 2017 Term Loan
4.164%, due 3/24/17 | | | 4,003,173 | | | | 4,008,177 | |
Extended 2018 Term Loan B
4.164%, due 3/23/18 | | | 750,000 | | | | 750,281 | |
2018 Term Loan
4.164%, due 9/24/18 | | | 2,400,000 | | | | 2,401,666 | |
Genesys Telecom Holdings U.S., Inc. | | | | | | | | |
New Term Loan B
4.00%, due 2/7/20 | | | 2,315,860 | | | | 2,298,973 | |
Incremental Term Loan B
4.50%, due 11/13/20 | | | 333,333 | | | | 334,375 | |
Mitchell International, Inc. | | | | | | | | |
New 1st Lien Term Loan
4.50%, due 10/12/20 | | | 1,283,333 | | | | 1,290,285 | |
New 2nd Lien Term Loan
8.50%, due 10/11/21 | | | 875,000 | | | | 885,500 | |
Sabre, Inc.
Term Loan B
5.25%, due 2/19/19 | | | 5,160,927 | | | | 5,191,341 | |
ServiceMaster Co. | | | | | | | | |
New Term Loan
4.25%, due 1/31/17 | | | 1,984,962 | | | | 1,957,669 | |
Extended Term Loan
4.42%, due 1/31/17 | | | 4,313,883 | | | | 4,266,249 | |
Sophia, L.P.
New Term Loan B
4.50%, due 7/19/18 | | | 1,114,067 | | | | 1,119,173 | |
SunGard Data Systems, Inc. | | | | | | | | |
Term Loan C
3.919%, due 2/28/17 | | | 1,835,571 | | | | 1,841,307 | |
Term Loan E
4.00%, due 3/9/20 | | | 2,779,000 | | | | 2,799,843 | |
| | | | | | | | |
| | | Principal
Amount | | | Value | |
Diversified/Conglomerate Service (continued) | |
Verint Systems, Inc.
New Term Loan B
4.00%, due 9/6/19 | | $ | 4,039,620 | | | $ | 4,056,033 | |
| | | | | | | | |
| | | | | | | 58,918,014 | |
| | | | | | | | |
Ecological 0.8% | | | | | | | | |
ADS Waste Holdings, Inc.
New Term Loan B
4.25%, due 10/9/19 | | | 6,435,000 | | | | 6,466,023 | |
| | | | | | | | |
| | |
Electronics 4.4% | | | | | | | | |
Blue Coat Systems, Inc. | | | | | | | | |
1st Lien Term Loan
4.50%, due 5/31/19 | | | 3,280,769 | | | | 3,287,947 | |
2nd Lien Term Loan
9.50%, due 6/26/20 | | | 2,000,000 | | | | 2,030,000 | |
BMC Software Finance, Inc.
USD Term Loan
5.00%, due 9/10/20 | | | 5,450,000 | | | | 5,473,816 | |
CDW LLC
New Term Loan
3.25%, due 4/29/20 | | | 3,497,488 | | | | 3,482,624 | |
Dell, Inc.
USD Term Loan B
4.50%, due 4/29/20 | | | 7,500,000 | | | | 7,507,815 | |
Eagle Parent, Inc.
New Term Loan
4.50%, due 5/16/18 | | | 4,830,201 | | | | 4,849,826 | |
EIG Investors Corp.
2013 Term Loan
5.00%, due 11/9/19 | | | 3,465,066 | | | | 3,478,060 | |
Evertec Group LLC
New Term Loan B
3.50%, due 4/17/20 | | | 3,384,247 | | | | 3,291,180 | |
Infor (US), Inc. | | | | | | | | |
USD Term Loan B3
3.75%, due 6/3/20 | | | 997,484 | | | | 993,743 | |
USD Term Loan B2
5.25%, due 4/5/18 | | | 1,000,000 | | | | 998,750 | |
Sensata Technologies Finance Co. LLC
Term Loan
3.25%, due 5/12/19 | | | 1,648,550 | | | | 1,660,914 | |
| | | | | | | | |
| | | | | | | 37,054,675 | |
| | | | | | | | |
Finance 3.0% | | | | | | | | |
Avis Budget Car Rental LLC
New Term Loan B
3.00%, due 3/15/19 | | | 4,476,945 | | | | 4,469,111 | |
Brand Energy & Infrastructure Services, Inc.
New Term Loan B
4.75%, due 11/26/20 | | | 4,375,000 | | | | 4,388,282 | |
| | | | |
| M-162 | | MainStay VP Floating Rate Portfolio | | The notes to the financial statements are an integral part of,
and should be read in conjunction with, the financial statements. |
| | | | | | | | |
| | | Principal
Amount | | | Value | |
| Floating Rate Loans (continued) | | | | | | | | |
Finance (continued) | | | | | | | | |
Duff & Phelps Investment Management Co.
Term Loan B
4.50%, due 4/23/20 | | $ | 2,987,499 | | | $ | 2,980,030 | |
¨Hertz Corp. (The) | | | | | | | | |
Term Loan B2
3.00%, due 3/11/18 | | | 5,137,737 | | | | 5,129,480 | |
New Synthetic LC
3.75%, due 3/9/18 | | | 2,750,000 | | | | 2,722,500 | |
Ocwen Financial Corp.
Term Loan
5.00%, due 2/15/18 | | | 2,382,000 | | | | 2,404,034 | |
Safe Guard Products International LLC
Term Loan
7.25%, due 12/21/18 | | | 2,672,143 | | | | 2,672,143 | |
StoneRiver Holdings, Inc.
1st Lien Term Loan
4.50%, due 11/29/19 | | | 927,154 | | | | 924,064 | |
| | | | | | | | |
| | | | | | | 25,689,644 | |
| | | | | | | | |
Grocery 0.4% | | | | | | | | |
Roundy’s Supermarkets, Inc.
Term Loan B
5.75%, due 2/13/19 | | | 3,071,983 | | | | 3,068,782 | |
| | | | | | | | |
| | |
Healthcare, Education & Childcare 8.2% | | | | | | | | |
Biomet, Inc.
Term Loan B2
3.67%, due 7/25/17 | | | 3,000,000 | | | | 3,020,607 | |
Community Health Systems, Inc.
Extended Term Loan
3.737%, due 1/25/17 | | | 5,005,724 | | | | 5,037,791 | |
DaVita, Inc.
New Term Loan B
4.50%, due 10/20/16 | | | 7,275,000 | | | | 7,320,469 | |
Envision Healthcare Corp.
Term Loan
4.00%, due 5/25/18 | | | 3,911,361 | | | | 3,918,319 | |
Gentiva Health Services, Inc.
New Term Loan B
6.50%, due 10/18/19 | | | 1,000,000 | | | | 996,250 | |
Grifols, Inc.
New Term Loan B
4.25%, due 6/1/17 | | | 5,871,977 | | | | 5,902,153 | |
HCA, Inc.
Extended Term Loan B4
2.997%, due 5/1/18 | | | 2,864,839 | | | | 2,864,839 | |
Hologic, Inc.
New Term Loan B
3.75%, due 8/1/19 | | | 4,536,643 | | | | 4,558,618 | |
| | | | | | | | |
| | | Principal
Amount | | | Value | |
Healthcare, Education & Childcare (continued) | |
Iasis Healthcare LLC
Term Loan B2
4.50%, due 5/3/18 | | $ | 2,334,420 | | | $ | 2,348,427 | |
IMS Health, Inc.
USD Term Loan B1
3.75%, due 9/1/17 | | | 1,579,640 | | | | 1,584,774 | |
Kinetic Concepts, Inc.
USD Term Loan D1
4.50%, due 5/4/18 | | | 3,430,401 | | | | 3,451,841 | |
One Call Medical, Inc.
1st Lien Term Loan
5.00%, due 11/27/20 | | | 1,500,000 | | | | 1,499,374 | |
¨Onex Carestream Finance, L.P. | | | | | | | | |
1st Lien Term Loan
5.00%, due 6/7/19 | | | 6,142,500 | | | | 6,209,687 | |
2nd Lien Term Loan
9.50%, due 6/7/19 | | | 2,800,000 | | | | 2,835,000 | |
Par Pharmaceutical Companies, Inc.
REFI Term Loan B
4.25%, due 9/30/19 | | | 2,221,931 | | | | 2,231,374 | |
Pharmaceutical Product Development LLC
New Term Loan B
4.00%, due 12/5/18 | | | 3,922,856 | | | | 3,946,645 | |
Quintiles Transnational Corp.
New Term Loan B
3.75%, due 6/8/18 | | | 5,053,285 | | | | 5,049,076 | |
RPI Finance Trust
Term Loan B2
3.25%, due 5/9/18 | | | 5,313,068 | | | | 5,319,709 | |
Select Medical Corp.
Series C Term Loan B
4.003%, due 6/1/18 | | | 1,609,167 | | | | 1,615,872 | |
| | | | | | | | |
| | | | | | | 69,710,825 | |
| | | | | | | | |
Home and Office Furnishings, Housewares & Durable Consumer Products 1.1% | |
Jarden Corp.
Add-On Term Loan B1
2.919%, due 9/30/20 | | | 2,493,750 | | | | 2,488,034 | |
Serta Simmons Holdings LLC
Term Loan
4.25%, due 10/1/19 | | | 4,363,197 | | | | 4,384,978 | |
Tempur-Pedic International, Inc.
REFI Term Loan B
3.50%, due 3/18/20 | | | 2,542,255 | | | | 2,538,548 | |
| | | | | | | | |
| | | | | | | 9,411,560 | |
| | | | | | | | |
Hotels, Motels, Inns & Gaming 5.1% | | | | | | | | |
Bally Technologies, Inc.
Term Loan B
4.25%, due 11/25/20 | | | 4,834,038 | | | | 4,864,169 | |
| | | | | | |
The notes to the financial statements are an integral part of,
and should be read in conjunction with, the financial statements. | | mainstayinvestments.com | | | M-163 | |
Portfolio of Investments December 31, 2013 (continued)
| | | | | | | | |
| | | Principal
Amount | | | Value | |
| Floating Rate Loans (continued) | | | | | | | | |
Hotels, Motels, Inns & Gaming (continued) | |
Caesars Entertainment Operating Co. | | | | | | | | |
Extended Term Loan B5
4.488%, due 1/26/18 | | $ | 2,554,843 | | | $ | 2,404,215 | |
Extended Term Loan B6
5.488%, due 1/26/18 | | | 1,958,066 | | | | 1,866,282 | |
Caesars Entertainment Resort Properties LLC
Term Loan B
7.00%, due 10/12/20 | | | 3,500,000 | | | | 3,473,750 | |
¨Hilton Worldwide Finance LLC
USD Term Loan B2
3.75%, due 10/26/20 | | | 8,400,000 | | | | 8,457,170 | |
MGM Resorts International
Term Loan B
3.50%, due 12/20/19 | | | 3,960,000 | | | | 3,956,701 | |
Pinnacle Entertainment, Inc.
Term Loan B2
3.75%, due 8/13/20 | | | 2,729,143 | | | | 2,739,377 | |
Scientific Games International, Inc.
New Term Loan B
4.25%, due 10/18/20 | | | 7,500,000 | | | | 7,498,440 | |
Station Casinos LLC
New Term Loan B
5.00%, due 3/2/20 | | | 6,252,750 | | | | 6,315,278 | |
Twin River Management Group, Inc.
Term Loan B
5.25%, due 11/9/18 | | | 1,617,407 | | | | 1,635,603 | |
| | | | | | | | |
| | | | | | | 43,210,985 | |
| | | | | | | | |
Insurance 1.9% | | | | | | | | |
Asurion LLC
New Term Loan B1
4.50%, due 5/24/19 | | | 6,326,742 | | | | 6,317,075 | |
Hub International, Ltd.
Term Loan B
4.75%, due 10/2/20 | | | 1,929,647 | | | | 1,953,767 | |
Multiplan, Inc.
New Term Loan B
4.00%, due 8/25/17 | | | 4,543,166 | | | | 4,571,561 | |
Sedgwick CMS Holdings, Inc. | | | | | | | | |
New 1st Lien Term Loan
4.25%, due 6/12/18 | | | 2,985,000 | | | | 2,994,328 | |
New 2nd Lien Term Loan
8.00%, due 12/12/18 | | | 600,000 | | | | 609,000 | |
| | | | | | | | |
| | | | | | | 16,445,731 | |
| | | | | | | | |
Leisure, Amusement, Motion Pictures & Entertainment 3.0% | |
Activision Blizzard, Inc.
Term Loan B
3.25%, due 10/12/20 | | | 2,327,500 | | | | 2,339,535 | |
| | | | | | | | |
| | | Principal
Amount | | | Value | |
Leisure, Amusement, Motion Pictures & Entertainment (continued) | |
AMC Entertainment, Inc.
New Term Loan
3.50%, due 4/30/20 | | $ | 794,000 | | | $ | 794,850 | |
Boyd Gaming Corp.
Term Loan B
4.00%, due 8/14/20 | | | 1,649,200 | | | | 1,656,072 | |
CityCenter Holdings LLC
Term Loan B
5.00%, due 10/16/20 | | | 1,200,000 | | | | 1,216,277 | |
SeaWorld Parks & Entertainment, Inc.
Term Loan B2
3.00%, due 5/14/20 | | | 5,839,786 | | | | 5,772,004 | |
Travelport LLC
REFI Term Loan
6.25%, due 6/26/19 | | | 7,107,806 | | | | 7,285,502 | |
U.S. Finco LLC | | | | | | | | |
1st Lien Term Loan
4.00%, due 5/29/20 | | | 2,109,400 | | | | 2,112,037 | |
2nd Lien Term Loan
8.25%, due 11/30/20 | | | 1,600,000 | | | | 1,624,000 | |
WMG Acquisition Corp.
New Term Loan
3.75%, due 7/1/20 | | | 2,327,502 | | | | 2,328,230 | |
| | | | | | | | |
| | | | | | | 25,128,507 | |
| | | | | | | | |
Machinery (Non-Agriculture, Non-Construct & Non-Electronic) 2.9% | |
Alliance Laundry Systems LLC | | | | | | | | |
REFI Term Loan
4.263%, due 12/10/18 | | | 629,114 | | | | 631,866 | |
2nd Lien Term Loan
9.50%, due 12/10/19 | | | 920,455 | | | | 930,235 | |
Apex Tool Group LLC
Term Loan B
4.50%, due 1/31/20 | | | 3,575,487 | | | | 3,591,577 | |
CPM Acquisition Corp. | | | | | | | | |
1st Lien Term Loan
6.25%, due 8/29/17 | | | 2,073,750 | | | | 2,076,342 | |
2nd Lien Term Loan
10.25%, due 3/1/18 | | | 1,093,700 | | | | 1,101,903 | |
Generac Power Systems, Inc.
Term Loan B
3.50%, due 5/31/20 | | | 3,250,195 | | | | 3,249,181 | |
¨Rexnord LLC
1st Lien Term Loan B
4.00%, due 8/21/20 | | | 7,956,658 | | | | 7,966,540 | |
Silver II US Holdings LLC
Term Loan
4.00%, due 12/13/19 | | | 5,167,896 | | | | 5,166,283 | |
| | | | | | | | |
| | | | | | | 24,713,927 | |
| | | | | | | | |
| | | | |
| M-164 | | MainStay VP Floating Rate Portfolio | | The notes to the financial statements are an integral part of,
and should be read in conjunction with, the financial statements. |
| | | | | | | | |
| | | Principal
Amount | | | Value | |
| Floating Rate Loans (continued) | | | | | | | | |
Mining, Steel, Iron & Non-Precious Metals 1.3% | |
Arch Coal, Inc.
Term Loan B
6.25%, due 5/16/18 | | $ | 4,932,489 | | | $ | 4,859,735 | |
JMC Steel Group, Inc.
Term Loan
4.75%, due 4/3/17 | | | 1,580,362 | | | | 1,584,312 | |
McJunkin Red Man Corp.
New Term Loan
5.00%, due 11/8/19 (c) | | | 1,576,050 | | | | 1,593,780 | |
SunCoke Energy, Inc.
Term Loan B
4.00%, due 7/26/18 | | | 121,336 | | | | 121,033 | |
Walter Energy, Inc.
Term Loan B
6.75%, due 4/2/18 | | | 2,798,298 | | | | 2,741,750 | |
| | | | | | | | |
| | | | | | | 10,900,610 | |
| | | | | | | | |
Oil & Gas 3.3% | | | | | | | | |
Chesapeake Energy Corp.
New Unsecured Term Loan
5.75%, due 12/1/17 | | | 2,733,300 | | | | 2,788,455 | |
Energy Transfer Equity, L.P.
New Term Loan
3.25%, due 12/2/19 | | | 2,475,000 | | | | 2,465,333 | |
EP Energy LLC
Term Loan B2
4.50%, due 4/30/19 | | | 937,500 | | | | 938,672 | |
Fieldwood Energy LLC
2nd Lien Term Loan
TBD, due 9/30/20 (c) | | | 1,500,000 | | | | 1,530,000 | |
Frac Tech International LLC
Term Loan B
8.50%, due 5/6/16 | | | 3,573,544 | | | | 3,584,712 | |
HGIM Corp. Term Loan B
5.50%, due 6/18/20 | | | 1,995,000 | | | | 2,012,456 | |
Peabody Energy Corp.
Term Loan B
TBD, due 9/24/20 (c) | | | 1,500,000 | | | | 1,509,375 | |
Philadelphia Energy Solutions LLC
Term Loan B
6.25%, due 4/4/18 (c) | | | 1,488,750 | | | | 1,306,378 | |
Quicksilver Resources, Inc.
New 2nd Lien Term Loan
7.00%, due 6/21/19 (c) | | | 2,000,000 | | | | 1,975,000 | |
Ruby Western Pipeline Holdings LLC
Term Loan B
3.50%, due 3/27/20 | | | 680,669 | | | | 679,818 | |
Samson Investment Company
New 2nd Lien Term Loan
5.00%, due 9/25/18 | | | 4,300,000 | | | | 4,310,750 | |
| | | | | | | | |
| | | Principal
Amount | | | Value | |
Oil & Gas (continued) | | | | | | | | |
Western Refining, Inc.
Term Loan B
4.25%, due 11/12/20 | | $ | 1,500,000 | | | $ | 1,513,125 | |
Wildhorse Resources LLC
2nd Lien Term Loan
7.50%, due 12/13/18 (c) | | | 3,400,000 | | | | 3,383,000 | |
| | | | | | | | |
| | | | | | | 27,997,074 | |
| | | | | | | | |
Personal & Nondurable Consumer Products (Manufacturing Only) 2.0% | |
ABC Supply Co., Inc.
Term Loan
3.50%, due 4/16/20 | | | 2,992,500 | | | | 2,996,241 | |
Prestige Brands, Inc.
New Term Loan
3.792%, due 1/31/19 | | | 1,352,273 | | | | 1,355,653 | |
Spectrum Brands, Inc.
Term Loan C
3.50%, due 9/4/19 | | | 208,901 | | | | 209,334 | |
SRAM LLC
New Term Loan B
4.026%, due 4/10/20 | | | 3,683,677 | | | | 3,673,319 | |
Sun Products Corp. (The)
New Term Loan
5.50%, due 3/23/20 | | | 4,966,231 | | | | 4,693,089 | |
Visant Corp.
Term Loan B
5.25%, due 12/22/16 | | | 4,121,976 | | | | 4,060,146 | |
| | | | | | | | |
| | | | | | | 16,987,782 | |
| | | | | | | | |
Personal Transportation 0.4% | |
Orbitz Worldwide, Inc. | | | | | | | | |
New Term Loan B
4.50%, due 9/25/17 | | | 316,667 | | | | 317,933 | |
New Term Loan C
5.75%, due 3/25/19 | | | 663,333 | | | | 665,821 | |
United Airlines, Inc.
New Term Loan B
4.00%, due 4/1/19 | | | 2,481,250 | | | | 2,499,859 | |
| | | | | | | | |
| | | | | | | 3,483,613 | |
| | | | | | | | |
Personal, Food & Miscellaneous Services 0.9% | |
Aramark Corp. | | | | | | | | |
Extended Synthetic LOC 3
3.669%, due 7/26/16 | | | 104,933 | | | | 105,064 | |
Extended Term Loan C
3.747%, due 7/26/16 | | | 1,334,749 | | | | 1,336,418 | |
USD Term Loan D
4.00%, due 9/9/19 | | | 2,700,000 | | | | 2,711,251 | |
Weight Watchers International, Inc.
Term Loan B2
3.75%, due 4/2/20 | | | 3,544,643 | | | | 3,156,210 | |
| | | | | | | | |
| | | | | | | 7,308,943 | |
| | | | | | | | |
| | | | | | |
The notes to the financial statements are an integral part of,
and should be read in conjunction with, the financial statements. | | mainstayinvestments.com | | | M-165 | |
Portfolio of Investments December 31, 2013 (continued)
| | | | | | | | |
| | | Principal
Amount | | | Value | |
| Floating Rate Loans (continued) | | | | | | | | |
Printing & Publishing 0.8% | |
Dex Media East LLC
New Term Loan
6.00%, due 12/30/16 | | $ | 322,370 | | | $ | 219,749 | |
Getty Images, Inc.
Term Loan B
4.75%, due 10/18/19 | | | 4,443,778 | | | | 4,142,899 | |
Lamar Media Corp.
Term Loan B
4.00%, due 12/30/16 | | | 149,939 | | | | 150,126 | |
R.H. Donnelley, Inc.
New Term Loan
9.75%, due 12/31/16 | | | 397,303 | | | | 240,369 | |
SNL Financial LC
New Term Loan B
5.50%, due 10/23/18 | | | 1,958,080 | | | | 1,955,632 | |
| | | | | | | | |
| | | | | | | 6,708,775 | |
| | | | | | | | |
Printing, Publishing, & Broadcasting 0.1% | |
Penton Media, Inc.
New 2nd Lien Term Loan
TBD, due 10/1/20 | | | 600,000 | | | | 594,000 | |
| | | | | | | | |
|
Retail Store 5.4% | |
Academy, Ltd.
Term Loan
4.50%, due 8/3/18 | | | 945,332 | | | | 950,058 | |
BJ’s Wholesale Club, Inc.
New 1st Lien Term Loan
4.50%, due 9/26/19 | | | 2,500,000 | | | | 2,513,393 | |
Collective Brands Finance, Inc.
Term Loan
7.25%, due 10/9/19 (c) | | | 1,476,019 | | | | 1,479,694 | |
Harbor Freight Tools USA, Inc.
New 1st Lien Term Loan
4.75%, due 7/26/19 | | | 2,970,056 | | | | 3,003,440 | |
J Crew Group, Inc.
Term Loan B1
TBD, due 3/7/18 | | | 1,500,000 | | | | 1,507,950 | |
Leslie’s Poolmart, Inc.
New Term Loan
4.25%, due 10/16/19 | | | 4,375,386 | | | | 4,391,794 | |
Michaels Stores, Inc.
New Term Loan
3.75%, due 1/28/20 | | | 7,409,666 | | | | 7,435,088 | |
NBTY, Inc.
Term Loan B2
3.50%, due 10/1/17 | | | 1,293,222 | | | | 1,299,419 | |
Neiman Marcus Group, Inc. (The)
New Term Loan B
5.00%, due 10/26/20 | | | 7,333,333 | | | | 7,419,764 | |
| | | | | | | | |
| | | Principal
Amount | | | Value | |
Retail Store (continued) | |
Party City Holdings, Inc.
REFI Term Loan B
4.25%, due 7/29/19 | | $ | 4,295,734 | | | $ | 4,309,695 | |
Petco Animal Supplies, Inc.
New Term Loan
4.00%, due 11/24/17 | | | 3,996,176 | | | | 4,012,828 | |
Pilot Travel Centers LLC | | | | | | | | |
REFI Term Loan B
3.75%, due 3/30/18 | | | 4,143,355 | | | | 4,140,716 | |
Term Loan B2
4.25%, due 8/7/19 | | | 1,185,000 | | | | 1,188,457 | |
Toys ‘R’ US Property Company I LLC
New Term Loan B
6.00%, due 8/21/19 | | | 1,950,000 | | | | 1,862,250 | |
| | | | | | | | |
| | | | | | | 45,514,546 | |
| | | | | | | | |
Telecommunications 5.0% | |
Alcatel-Lucent USA, Inc.
USD Term Loan C
5.75%, due 1/30/19 | | | 4,125,033 | | | | 4,141,360 | |
Arris Group, Inc.
Term Loan B
3.50%, due 4/17/20 | | | 416,454 | | | | 414,372 | |
Avaya, Inc.
Term Loan B5
8.00%, due 3/30/18 | | | 4,461,024 | | | | 4,511,210 | |
Cricket Communications, Inc.
Term Loan C
4.75%, due 3/9/20 | | | 3,047,187 | | | | 3,050,451 | |
Crown Castle International Corp.
New Term Loan
3.25%, due 1/31/19 | | | 4,001,256 | | | | 3,999,891 | |
Level 3 Financing, Inc. | | | | | | | | |
New 2019 Term Loan
4.00%, due 8/1/19 | | | 4,200,000 | | | | 4,221,000 | |
2020 Term Loan B
4.00%, due 1/15/20 | | | 2,000,000 | | | | 2,012,000 | |
LTS Buyer LLC
1st Lien Term Loan
4.50%, due 4/13/20 | | | 2,985,000 | | | | 2,999,925 | |
Syniverse Holdings, Inc. | | | | | | | | |
Term Loan
4.00%, due 4/23/19 | | | 3,816,269 | | | | 3,814,678 | |
Term Loan B
4.00%, due 4/23/19 | | | 2,077,588 | | | | 2,082,782 | |
Telesat LLC
USD Term Loan B2
3.50%, due 3/28/19 | | | 6,796,888 | | | | 6,815,294 | |
Zayo Group LLC
Term Loan B
4.00%, due 7/2/19 | | | 4,473,532 | | | | 4,474,333 | |
| | | | | | | | |
| | | | | | | 42,537,296 | |
| | | | | | | | |
| | | | |
| M-166 | | MainStay VP Floating Rate Portfolio | | The notes to the financial statements are an integral part of,
and should be read in conjunction with, the financial statements. |
| | | | | | | | |
| | | Principal
Amount | | | Value | |
| Floating Rate Loans (continued) | | | | | | | | |
Utilities 4.6% | |
AES Corp.
REFI Term Loan B
3.75%, due 6/1/18 | | $ | 4,604,554 | | | $ | 4,631,689 | |
Alinta Energy U.S. Finance LLC
Term Loan
6.375%, due 8/13/19 | | | 2,527,875 | | | | 2,537,355 | |
Calpine Construction Finance Co., L.P.
Original Term Loan B1
3.00%, due 5/3/20 | | | 1,492,500 | | | | 1,478,694 | |
¨Calpine Corp. | | | | | | | | |
Term Loan B1
4.00%, due 4/2/18 | | | 4,916,640 | | | | 4,945,063 | |
Term Loan B2
4.00%, due 4/2/18 | | | 2,929,900 | | | | 2,945,006 | |
Covanta Energy Corp.
Term Loan
3.50%, due 3/28/19 | | | 1,473,750 | | | | 1,478,049 | |
Dynegy Holdings, Inc.
Term Loan B2
4.00%, due 4/23/20 | | | 3,138,077 | | | | 3,151,153 | |
Equipower Resources Holdings LLC | | | | | | | | |
1st Lien Term Loan
4.25%, due 12/21/18 | | | 3,171,689 | | | | 3,179,618 | |
Term Loan C
4.25%, due 12/31/19 | | | 1,007,439 | | | | 1,009,957 | |
Essential Power LLC
Term Loan B
4.25%, due 8/8/19 | | | 1,088,374 | | | | 1,055,722 | |
GIM Channelview Cogeneration LLC
Term Loan B
4.25%, due 5/8/20 | | | 447,750 | | | | 450,549 | |
La Frontera Generation LLC
Term Loan
4.50%, due 9/30/20 | | | 4,857,478 | | | | 4,904,538 | |
LSP Madison Funding LLC
Term Loan
5.50%, due 6/28/19 | | | 2,944,357 | | | | 2,962,759 | |
Topaz Power Holdings LLC
Term Loan
5.25%, due 2/26/20 | | | 2,376,000 | | | | 2,362,635 | |
TPF II LC LLC
Term Loan B
6.50%, due 8/16/19 | | | 1,990,000 | | | | 1,980,050 | |
| | | | | | | | |
| | | | | | | 39,072,837 | |
| | | | | | | | |
Total Floating Rate Loans
(Cost $738,279,455) | | | | | | | 742,392,312 | |
| | | | | | | | |
| | | | | | | | |
| | | Principal
Amount | | | Value | |
| Foreign Floating Rate Loans 6.3% (b) | |
Broadcasting & Entertainment 1.2% | |
UPC Financing Partnership | | | | | | | | |
USD Term Loan AH
3.25%, due 6/30/21 | | $ | 2,917,292 | | | $ | 2,910,912 | |
USD Term Loan AF
4.00%, due 1/29/21 | | | 2,000,000 | | | | 2,009,166 | |
Virgin Media Investment Holdings, Ltd.
USD Term Loan B
3.50%, due 6/8/20 | | | 5,000,000 | | | | 5,006,250 | |
| | | | | | | | |
| | | | | | | 9,926,328 | |
| | | | | | | | |
Diversified/Conglomerate Service 1.0% | |
ION Trading Technologies S.A.R.L. | | | | | | | | |
1st Lien Term Loan
4.50%, due 5/22/20 | | | 4,548,571 | | | | 4,579,843 | |
2nd Lien Term Loan
8.25%, due 5/21/21 | | | 1,125,000 | | | | 1,139,765 | |
Minimax GmbH & Co. KG
USD Term Loan B
4.50%, due 8/14/20 | | | 2,437,750 | | | | 2,449,939 | |
| | | | | | | | |
| | | | | | | 8,169,547 | |
| | | | | | | | |
Healthcare, Education & Childcare 0.3% | |
Valeant Pharmaceuticals International, Inc. Term Loan E
4.50%, due 8/5/20 | | | 2,835,714 | | | | 2,849,893 | |
| | | | | | | | |
|
Leisure, Amusement, Motion Pictures & Entertainment 0.5% | |
Bombardier Recreational Products, Inc.
New Term Loan B
4.00%, due 1/30/19 | | | 4,265,438 | | | | 4,276,988 | |
| | | | | | | | |
|
Mining, Steel, Iron & Non-Precious Metals 1.3% | |
¨FMG Resources August 2006 Pty, Ltd.
New Term Loan B
4.25%, due 6/28/19 | | | 6,905,071 | | | | 6,997,137 | |
Novelis, Inc.
New Term Loan
3.75%, due 3/10/17 | | | 4,368,735 | | | | 4,385,074 | |
| | | | | | | | |
| | | | | | | 11,382,211 | |
| | | | | | | | |
Oil & Gas 0.2% | |
Pacific Drilling S.A.
Term Loan B
4.50%, due 6/4/18 | | | 1,547,778 | | | | 1,563,901 | |
| | | | | | | | |
|
Printing & Publishing 0.7% | |
Springer Science+Business Media Deutschland GmbH
USD Term Loan B2
5.00%, due 8/10/20 | | | 5,985,000 | | | | 6,012,429 | |
| | | | | | |
The notes to the financial statements are an integral part of,
and should be read in conjunction with, the financial statements. | | mainstayinvestments.com | | | M-167 | |
Portfolio of Investments December 31, 2013 (continued)
| | | | | | | | |
| | | Principal
Amount | | | Value | |
| Foreign Floating Rate Loans (continued) | |
Printing & Publishing (continued) | |
Yell Group PLC
New Term Loan B1
3.917%, due 7/31/14 (d) | | $ | 1,894,129 | | | $ | 414,341 | |
| | | | | | | | |
| | | | | | | 6,426,770 | |
| | | | | | | | |
Retail Store 0.3% | |
Hudson’s Bay Co.
1st Lien Term Loan
4.75%, due 11/4/20 | | | 2,333,333 | | | | 2,368,009 | |
| | | | | | | | |
|
Telecommunications 0.8% | |
Intelsat Jackson Holdings S.A.
Term Loan B2
3.75%, due 6/30/19 | | | 6,439,180 | | | | 6,485,465 | |
| | | | | | | | |
Total Foreign Floating Rate Loans
(Cost $54,364,381) | | | | | | | 53,449,112 | |
| | | | | | | | |
Total Long-Term Bonds
(Cost $805,101,839) | | | | | | | 809,141,827 | |
| | | | | | | | |
| | |
| | | | | | | | |
| | |
Shares | | | | |
| Affiliated Investment Company 0.6% | |
Fixed Income Fund 0.6% | |
MainStay High Yield Corporate Bond Fund Class I | | | 822,368 | | | | 4,975,329 | |
| | | | | | | | |
Total Affiliated Investment Company
(Cost $5,000,000) | | | | | | | 4,975,329 | |
| | | | | | | | |
| | |
| | | | | | | | |
| | | Principal
Amount | | | | |
| Short-Term Investments 4.7% | |
Financial Company Commercial Paper 1.0% | |
John Deere Credit, Inc.
(zero coupon), due 1/24/14 (a)(e) | | $ | 6,516,000 | | | | 6,515,602 | |
PACCAR Financial Corp.
(zero coupon), due 1/8/14 (e) | | | 2,325,000 | | | | 2,324,980 | |
| | | | | | | | |
Total Financial Company Commercial Paper (Cost $8,840,561) | | | | | | | 8,840,582 | |
| | | | | | | | |
|
Other Commercial Paper 1.7% | |
Illinois Tool Works, Inc. | | | | | | | | |
(zero coupon), due 1/15/14 (a)(e) | | | 3,000,000 | | | | 2,999,912 | |
(zero coupon), due 2/3/14 (a)(e) | | | 988,000 | | | | 987,904 | |
Johnson & Johnson
(zero coupon), due 1/9/14 (a)(e) | | | 9,835,000 | | | | 9,834,904 | |
Parker Hannifin Corp.
(zero coupon), due 1/30/14 (a)(e) | | | 791,000 | | | | 790,957 | |
| | | | | | | | |
Total Other Commercial Paper
(Cost $14,613,653) | | | | | | | 14,613,677 | |
| | | | | | | | |
| | | | | | | | |
| | | Principal
Amount | | | Value | |
Repurchase Agreement 0.4% | |
State Street Bank and Trust Co.
0.00%, dated 12/31/13
due 1/2/14
Proceeds at Maturity $3,512,553 (Collateralized by a Federal National Mortgage Association security with a rate of 2.20% and a maturity date of 10/17/22, with a Principal Amount of $3,910,000 and a Market Value of $3,584,105) | | $ | 3,512,553 | | | $ | 3,512,553 | |
| | | | | | | | |
Total Repurchase Agreement
(Cost $3,512,553) | | | | | | | 3,512,553 | |
| | | | | | | | |
|
U.S. Government 1.6% | |
United States Treasury Bills | | | | | | | | |
0.013%, due 2/13/14 (e) | | | 4,960,000 | | | | 4,959,928 | |
0.02%, due 2/27/14 (e) | | | 5,800,000 | | | | 5,799,819 | |
0.034%, due 2/27/14 (e) | | | 3,000,000 | | | | 2,999,844 | |
| | | | | | | | |
Total U.S. Government
(Cost $13,759,583) | | | | | | | 13,759,591 | |
| | | | | | | | |
Total Short-Term Investments
(Cost $40,726,350) | | | | | | | 40,726,403 | |
| | | | | | | | |
Total Investments
(Cost $850,828,189) (f) | | | 100.7 | % | | | 854,843,559 | |
Other Assets, Less Liabilities | | | (0.7 | ) | | | (6,045,564 | ) |
Net Assets | | | 100.0 | % | | $ | 848,797,995 | |
| ‡ | Less than one-tenth of a percent. |
| (a) | May be sold to institutional investors only under Rule 144A or securities offered pursuant to Section 4(a)(2) of the Securities Act of 1933, as amended. |
| (b) | Floating Rate Loan—generally pays interest at rates which are periodically re-determined at a margin above the London InterBank Offered Rate or other short-term rates. The rate shown is the weighted average interest rate of all contracts within the floating rate loan facility as of December 31, 2013. |
| (c) | Illiquid security—The total market value of these securities as of December 31, 2013, is $19,221,175, which represents 2.3% of the Portfolio’s net assets. |
| (e) | Interest rate presented is yield to maturity. |
| (f) | As of December 31, 2013, cost is $851,915,226 for federal income tax purposes and net unrealized appreciation is as follows: |
| | | | |
Gross unrealized appreciation | | $ | 6,594,419 | |
Gross unrealized depreciation | | | (3,666,086 | ) |
| | | | |
Net unrealized appreciation | | $ | 2,928,333 | |
| | | | |
The following abbreviation is used in the above portfolio:
TBD—To be determined
| | | | |
| M-168 | | MainStay VP Floating Rate Portfolio | | The notes to the financial statements are an integral part of,
and should be read in conjunction with, the financial statements. |
The following is a summary of the fair valuations according to the inputs used as of December 31, 2013, for valuing the Portfolio’s assets.
Asset Valuation Inputs
| | | | | | | | | | | | | | | | |
Description | | Quoted Prices
in Active Markets
for Identical Assets
(Level 1) | | | Significant Other
Observable Inputs
(Level 2) | | | Significant
Unobservable
Inputs
(Level 3) | | | Total | |
| Investments in Securities (a) | | | | | | | | | | | | | | | | |
Long-Term Bonds | | | | | | | | | | | | | | | | |
Corporate Bonds | | $ | — | | | $ | 13,300,403 | | | $ | — | | | $ | 13,300,403 | |
Floating Rate Loans (b) | | | — | | | | 722,183,225 | | | | 20,209,087 | | | | 742,392,312 | |
Foreign Floating Rate Loans (c) | | | — | | | | 50,999,173 | | | | 2,449,939 | | | | 53,449,112 | |
| | | | | | | | | | | | | | | | |
| Total Long-Term Bonds | | | — | | | | 786,482,801 | | | | 22,659,026 | | | | 809,141,827 | |
| | | | | | | | | | | | | | | | |
| Affiliated Investment Company | | | | | | | | | | | | | | | | |
Fixed Income Fund | | | 4,975,329 | | | | — | | | | — | | | | 4,975,329 | |
| Short-Term Investments | | | | | | | | | | | | | | | | |
Financial Company Commercial Paper | | | — | | | | 8,840,582 | | | | — | | | | 8,840,582 | |
Other Commercial Paper | | | — | | | | 14,613,677 | | | | — | | | | 14,613,677 | |
Repurchase Agreement | | | — | | | | 3,512,553 | | | | — | | | | 3,512,553 | |
U.S. Government | | | — | | | | 13,759,591 | | | | — | | | | 13,759,591 | |
| | | | | | | | | | | | | | | | |
| Total Short-Term Investments | | | — | | | | 40,726,403 | | | | — | | | | 40,726,403 | |
| | | | | | | | | | | | | | | | |
| Total Investments in Securities | | $ | 4,975,329 | | | $ | 827,209,204 | | | $ | 22,659,026 | | | $ | 854,843,559 | |
| | | | | | | | | | | | | | | | |
| (a) | For a complete listing of investments and their industries, see the Portfolio of Investments. |
| (b) | Includes $20,209,087 of Level 3 securities which represent floating rate loans whose value was obtained from the pricing service which utilized a single broker quote to determine such value as referenced in the Portfolio of Investments. |
| (c) | Includes $2,449,939 of a Level 3 security which represents a foreign floating rate loan whose value was obtained from the pricing service which utilized a single broker quote to determine such value as referenced in the Portfolio of Investments. |
The Portfolio recognizes transfers between the levels as of the beginning of the period.
For the year ended December 31, 2013, the Portfolio did not have any transfers between Level 1 and Level 2 fair value measurements. (See Note 2)
As of December 31, 2013, securities with a total value of $5,064,599 transferred from Level 2 to Level 3. The transfer occurred as a result of the value for certain floating rate loans obtained from the independent pricing service which were derived based on single broker quote.
As of December 31, 2013, securities with a market value of $15,906,844 transferred from Level 3 to Level 2. The transfer occurred as a result of the value for certain floating rate loans obtained from an independent pricing service utilizing the average of multiple bid quotations as of December 31, 2013. The fair value obtained for these loans from an independent pricing service as of December 31, 2012 utilized a single broker quote with significant unobservable inputs.
| | | | | | |
The notes to the financial statements are an integral part of,
and should be read in conjunction with, the financial statements. | | mainstayinvestments.com | | | M-169 | |
Portfolio of Investments December 31, 2013 (continued)
The following is a reconciliation of investments in which significant unobservable inputs (Level 3) were used in determining value:
| | | | | | | | | | | | | | | | | | | | | | | | | | | | | | | | | | | | | | | | |
Investments in
Securities | | Balance
as of
December 31,
2012 | | | Accrued
Discounts
(Premiums) | | | Realized
Gain
(Loss) | | | Change in
Unrealized
Appreciation
(Depreciation) | | | Purchases | | | Sales (a) | | | Transfers
in to
Level 3 | | | Transfers out
of Level 3 | | | Balance
as of
December 31,
2013 | | | Change in
Unrealized
Appreciation
(Depreciation)
from
Investments
Still Held
as of
December 31,
2013 (b) | |
| Long-Term Bonds | | | | | | | | | | | | | | | | | | | | | | | | | | | | | | | | | | | | | | | | |
Floating Rate Loans | | | | | | | | | | | | | | | | | | | | | | | | | | | | | | | | | | | | | | | | |
Aerospace & Defense | | $ | 2,391,000 | | | $ | — | | | $ | — | | | $ | — | | | $ | — | | | $ | — | | | $ | — | | | $ | (2,391,000 | ) | | $ | — | | | $ | — | |
Automobile | | | — | | | | 10,290 | | | | 6,684 | | | | (66,689 | ) | | | — | | | | (3,967,042 | ) | | | 5,064,599 | | | | — | | | | 1,047,842 | | | | (66,689 | ) |
Broadcasting & Entertainment | | | 3,978,330 | | | | 4,495 | | | | 2,061 | | | | 7,757 | | | | — | | | | (284,212 | ) | | | — | | | | (507,500 | ) | | | 3,200,931 | | | | 7,757 | |
Chemicals, Plastics & Rubber | | | 947,455 | | | | — | | | | — | | | | — | | | | — | | | | — | | | | — | | | | (947,455 | ) | | | — | | | | — | |
Containers, Packaging & Glass | | | — | | | | (3,661 | ) | | | — | | | | 11,748 | | | | 2,545,038 | | | | — | | | | — | | | | — | | | | 2,553,125 | | | | 11,748 | |
Diversified/
Conglomerate Manufacturing | | | — | | | | 173 | | | | — | | | | 2,808 | | | | 276,019 | | | | — | | | | — | | | | — | | | | 279,000 | | | | 2,808 | |
Diversified/
Conglomerate Service | | | 3,231,802 | | | | 1,194 | | | | — | | | | 1,632 | | | | 1,188,174 | | | | — | | | | — | | | | (3,231,802 | ) | | | 1,191,000 | | | | 1,632 | |
Electronics | | | 3,500,000 | | | | 4,893 | | | | 328 | | | | 7,635 | | | | — | | | | (34,796 | ) | | | — | | | | — | | | | 3,478,060 | | | | 7,635 | |
Finance | | | — | | | | 14,558 | | | | 9,584 | | | | 71,180 | | | | 2,804,678 | | | | (227,857 | ) | | | — | | | | — | | | | 2,672,143 | | | | 71,180 | |
Healthcare, Education & Childcare | | | 1,499,962 | | | | — | | | | — | | | | — | | | | — | | | | — | | | | — | | | | (1,499,962 | ) | | | — | | | | — | |
Insurance | | | — | | | | 279 | | | | — | | | | 11,683 | | | | 597,038 | | | | — | | | | — | | | | — | | | | 609,000 | | | | 11,683 | |
Machinery (Non-Agriculture, Non-Construct & Non-Electronic) | | | 2,944,278 | | | | 3,993 | | | | — | | | | (3,993 | ) | | | — | | | | — | | | | — | | | | (1,842,375 | ) | | | 1,101,903 | | | | (3,993 | ) |
Mining, Steel, Iron & Non-Precious Metals | | | 5,879,766 | | | | 100 | | | | 1,081 | | | | (499 | ) | | | — | | | | (272,665 | ) | | | — | | | | (5,486,750 | ) | | | 121,033 | | | | (100 | ) |
Oil & Gas | | | — | | | | 6,850 | | | | 18,919 | | | | 29,825 | | | | 2,910,637 | | | | (991,231 | ) | | | — | | | | — | | | | 1,975,000 | | | | 29,825 | |
Utilities | | | — | | | | 2,520 | | | | 242 | | | | 37,065 | | | | 1,950,223 | | | | (10,000 | ) | | | — | | | | — | | | | 1,980,050 | | | | 37,065 | |
| Foreign Floating Rate Loans | | | | | | | | | | | | | | | | | | | | | | | | | | | | | | | | | | | | | | | | |
Diversified/
Conglomerate Service | | | — | | | | 514 | | | | 59 | | | | 23,847 | | | | 2,437,769 | | | | (12,250 | ) | | | — | | | | — | | | | 2,449,939 | | | | 23,847 | |
| Common Stock | | | | | | | | | | | | | | | | | | | | | | | | | | | | | | | | | | | | | | | | |
Leisure, Amusement, Motion Pictures & Entertainment | | | 394,896 | | | | — | | | | 158,703 | | | | (134,952 | ) | | | — | | | | (418,647 | ) | | | — | | | | — | | | | — | | | | — | |
| | | | | | | | | | | | | | | | | | | | | | | | | | | | | | | | | | | | | | | | |
Total | | $ | 24,767,489 | | | $ | 46,198 | | | $ | 197,661 | | | $ | (953 | ) | | $ | 14,709,576 | | | $ | (6,218,700 | ) | | $ | 5,064,599 | | | $ | (15,906,844 | ) | | $ | 22,659,026 | | | $ | 134,398 | |
| | | | | | | | | | | | | | | | | | | | | | | | | | | | | | | | | | | | | | | | |
| (a) | Sales include principal reduction. |
| (b) | Included in “Net change in unrealized appreciation (depreciation) on investments” in the Statement of Operations. |
| | | | |
| M-170 | | MainStay VP Floating Rate Portfolio | | The notes to the financial statements are an integral part of,
and should be read in conjunction with, the financial statements. |
Statement of Assets and Liabilities as of December 31, 2013
| | | | |
| Assets | |
Investment in securities, at value
(identified cost $845,828,189) | | $ | 849,868,230 | |
Investments in affiliated investment company, at value (identified cost $5,000,000) | | | 4,975,329 | |
Receivables: | | | | |
Investment securities sold | | | 9,566,868 | |
Dividends and interest | | | 4,800,496 | |
Fund shares sold | | | 1,911,271 | |
Unrealized appreciation on unfunded commitments | | | 13,069 | |
Other assets | | | 1,175 | |
| | | | |
Total assets | | | 871,136,438 | |
| | | | |
|
| Liabilities | |
Payables: | | | | |
Investment securities purchased | | | 21,385,087 | |
Manager (See Note 3) | | | 424,501 | |
Fund shares redeemed | | | 308,497 | |
NYLIFE Distributors (See Note 3) | | | 119,199 | |
Professional fees | | | 51,005 | |
Shareholder communication | | | 41,450 | |
Custodian | | | 5,856 | |
Trustees | | | 1,120 | |
Accrued expenses | | | 1,728 | |
| | | | |
Total liabilities | | | 22,338,443 | |
| | | | |
Net assets | | $ | 848,797,995 | |
| | | | |
|
| Net Assets Consist of | |
Shares of beneficial interest outstanding (par value of $.001 per share) unlimited number of shares authorized | | $ | 90,905 | |
Additional paid-in capital | | | 851,252,997 | |
| | | | |
| | | 851,343,902 | |
Undistributed net investment income | | | 135,630 | |
Accumulated net realized gain (loss) on investments and unfunded commitments | | | (6,709,976 | ) |
Net unrealized appreciation (depreciation) on investments | | | 4,015,370 | |
Net unrealized appreciation (depreciation) on unfunded commitments | | | 13,069 | |
| | | | |
Net assets | | $ | 848,797,995 | |
| | | | |
| | | | |
Initial Class | | | | |
Net assets applicable to outstanding shares | | $ | 281,957,005 | |
| | | | |
Shares of beneficial interest outstanding | | | 30,213,519 | |
| | | | |
Net asset value per share outstanding | | $ | 9.33 | |
| | | | |
Service Class | | | | |
Net assets applicable to outstanding shares | | $ | 566,840,990 | |
| | | | |
Shares of beneficial interest outstanding | | | 60,691,659 | |
| | | | |
Net asset value per share outstanding | | $ | 9.34 | |
| | | | |
| | | | | | |
The notes to the financial statements are an integral part of,
and should be read in conjunction with, the financial statements. | | mainstayinvestments.com | | | M-171 | |
Statement of Operations for the year ended December 31, 2013
| | | | |
| Investment Income (Loss) | |
Income | | | | |
Interest | | $ | 38,118,219 | |
Dividend distributions from an affiliated investment company | | | 59,704 | |
| | | | |
Total income | | | 38,177,923 | |
| | | | |
Expenses | | | | |
Manager (See Note 3) | | | 4,716,166 | |
Distribution and service—Service Class (See Note 3) | | | 1,253,479 | |
Shareholder communication | | | 120,924 | |
Professional fees | | | 99,069 | |
Custodian | | | 39,024 | |
Trustees | | | 16,213 | |
Miscellaneous | | | 50,942 | |
| | | | |
Total expenses | | | 6,295,817 | |
| | | | |
Net investment income (loss) | | | 31,882,106 | |
| | | | |
|
| Realized and Unrealized Gain (Loss) on Investments | |
Net realized gain (loss) on investments | | | 3,756,661 | |
Net change in unrealized appreciation (depreciation) on investments and unfunded commitments | | | (2,817,142 | ) |
| | | | |
Net realized and unrealized gain (loss) on investments and unfunded commitments | | | 939,519 | |
| | | | |
Net increase (decrease) in net assets resulting from operations | | $ | 32,821,625 | |
| | | | |
| | | | |
| M-172 | | MainStay VP Floating Rate Portfolio | | The notes to the financial statements are an integral part of,
and should be read in conjunction with, the financial statements. |
Statements of Changes in Net Assets
for the years ended December 31, 2013 and December 31, 2012
| | | | | | | | |
| | | 2013 | | | 2012 | |
| Increase (Decrease) in Net Assets | |
Operations: | | | | | | | | |
Net investment income (loss) | | $ | 31,882,106 | | | $ | 27,199,518 | |
Net realized gain (loss) on investments | | | 3,756,661 | | | | 512,687 | |
Net change in unrealized appreciation (depreciation) on investments and unfunded commitments | | | (2,817,142 | ) | | | 16,307,398 | |
| | | | |
Net increase (decrease) in net assets resulting from operations | | | 32,821,625 | | | | 44,019,603 | |
| | | | |
Dividends to shareholders: | | | | | | | | |
From net investment income: | | | | | |
Initial Class | | | (12,037,630 | ) | | | (10,330,192 | ) |
Service Class | | | (19,875,142 | ) | | | (16,722,520 | ) |
| | | | |
Total dividends to shareholders | | | (31,912,772 | ) | | | (27,052,712 | ) |
| | | | |
Capital share transactions: | | | | | | | | |
Net proceeds from sale of shares | | | 254,446,450 | | | | 252,094,222 | |
Net asset value of shares issued to shareholders in reinvestment of dividends | | | 31,912,772 | | | | 27,052,712 | |
Cost of shares redeemed | | | (179,794,976 | ) | | | (113,339,733 | ) |
| | | | |
Increase (decrease) in net assets derived from capital share transactions | | | 106,564,246 | | | | 165,807,201 | |
| �� | | | |
Net increase (decrease) in net assets | | | 107,473,099 | | | | 165,807,201 | |
| | |
| Net Assets | | | | | | | | |
Beginning of year | | | 741,324,896 | | | | 558,550,804 | |
| | | | |
End of year | | $ | 848,797,995 | | | $ | 741,324,896 | |
| | | | |
Undistributed net investment income at end of year | | $ | 135,630 | | | $ | 125,056 | |
| | | | |
| | | | | | |
The notes to the financial statements are an integral part of,
and should be read in conjunction with, the financial statements. | | mainstayinvestments.com | | | M-173 | |
Financial Highlights selected per share data and ratios
| | | | | | | | | | | | | | | | | | | | |
| | | Initial Class | |
| | | Year ended December 31, | |
| | | 2013 | | | 2012 | | | 2011 | | | 2010 | | | 2009 | |
Net asset value at beginning of year | | $ | 9.32 | | | $ | 9.07 | | | $ | 9.26 | | | $ | 8.92 | | | $ | 6.93 | |
| | | | | | | | | | | | | | | | | | | | |
Net investment income (loss) | | | 0.39 | | | | 0.39 | | | | 0.40 | | | | 0.36 | | | | 0.30 | |
Net realized and unrealized gain (loss) on investments | | | 0.01 | | | | 0.25 | | | | (0.19 | ) | | | 0.34 | | | | 1.99 | |
| | | | | | | | | | | | | | | | | | | | |
Total from investment operations | | | 0.40 | | | | 0.64 | | | | 0.21 | | | | 0.70 | | | | 2.29 | |
| | | | | | | | | | | | | | | | | | | | |
Less dividends: | | | | | | | | | | | | | | | | | | | | |
From net investment income | | | (0.39 | ) | | | (0.39 | ) | | | (0.40 | ) | | | (0.36 | ) | | | (0.30 | ) |
| | | | | | | | | | | | | | | | | | | | |
Net asset value at end of year | | $ | 9.33 | | | $ | 9.32 | | | $ | 9.07 | | | $ | 9.26 | | | $ | 8.92 | |
| | | | | | | | | | | | | | | | | | | | |
Total investment return | | | 4.46 | % | | | 7.15 | % | | | 2.19 | % | | | 8.08 | % | | | 33.54 | % |
Ratios (to average net assets)/Supplemental Data: | | | | | | | | | | | | | | | | | | | | |
Net investment income (loss) | | | 4.22 | % | | | 4.25 | % | | | 4.19 | % | | | 4.02 | % | | | 3.70 | % |
Net expenses | | | 0.64 | % | | | 0.65 | % | | | 0.65 | % | | | 0.67 | % | | | 0.68 | % |
Portfolio turnover rate | | | 49 | % | | | 47 | % | | | 13 | % | | | 11 | % | | | 17 | % |
Net assets at end of year (in 000’s) | | $ | 281,957 | | | $ | 282,716 | | | $ | 161,480 | | | $ | 145,965 | | | $ | 106,754 | |
| | | �� | | | | | | | | | | | | | | | | | |
| | | Service Class | |
| | | Year ended December 31, | |
| | | 2013 | | | 2012 | | | 2011 | | | 2010 | | | 2009 | |
Net asset value at beginning of year | | $ | 9.33 | | | $ | 9.08 | | | $ | 9.26 | | | $ | 8.92 | | | $ | 6.93 | |
| | | | | | | | | | | | | | | | | | | | |
Net investment income (loss) | | | 0.37 | | | | 0.37 | | | | 0.36 | | | | 0.34 | | | | 0.28 | |
Net realized and unrealized gain (loss) on investments | | | 0.01 | | | | 0.25 | | | | (0.18 | ) | | | 0.34 | | | | 1.99 | |
| | | | | | | | | | | | | | | | | | | | |
Total from investment operations | | | 0.38 | | | | 0.62 | | | | 0.18 | | | | 0.68 | | | | 2.27 | |
| | | | | | | | | | | | | | | | | | | | |
Less dividends: | | | | | | | | | | | | | | | | | | | | |
From net investment income | | | (0.37 | ) | | | (0.37 | ) | | | (0.36 | ) | | | (0.34 | ) | | | (0.28 | ) |
| | | | | | | | | | | | | | | | | | | | |
Net asset value at end of year | | $ | 9.34 | | | $ | 9.33 | | | $ | 9.08 | | | $ | 9.26 | | | $ | 8.92 | |
| | | | | | | | | | | | | | | | | | | | |
Total investment return | | | 4.20 | % | | | 6.89 | % | | | 1.93 | % | | | 7.81 | % | | | 33.21 | % |
Ratios (to average net assets)/Supplemental Data: | | | | | | | | | | | | | | | | | | | | |
Net investment income (loss) | | | 3.96 | % | | | 4.00 | % | | | 3.94 | % | | | 3.77 | % | | | 3.44 | % |
Net expenses | | | 0.89 | % | | | 0.90 | % | | | 0.90 | % | | | 0.92 | % | | | 0.93 | % |
Portfolio turnover rate | | | 49 | % | | | 47 | % | | | 13 | % | | | 11 | % | | | 17 | % |
Net assets at end of year (in 000’s) | | $ | 566,841 | | | $ | 458,609 | | | $ | 397,071 | | | $ | 383,756 | | | $ | 309,163 | |
| | | | |
| M-174 | | MainStay VP Floating Rate Portfolio | | The notes to the financial statements are an integral part of,
and should be read in conjunction with, the financial statements. |
MainStay VP Government Portfolio
Investment and Performance Comparison (Unaudited)
Performance data quoted represents past performance. Past performance is no guarantee of future results. Because of market volatility, current performance may be lower or higher than the figures shown. Investment return and principal value will fluctuate, and as a result, when shares are redeemed, they may be worth more or less than their original cost. The performance table and graph do not reflect any deduction of sales charges, mortality and expense charges, contract charges or administrative charges. Please refer to the Performance Summary appropriate for your policy. For performance information current to the most recent month-end, please call 800-598-2019 or visit www.newyorklife.com.
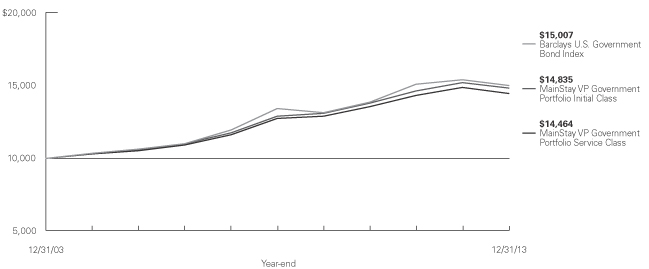
Average Annual Total Returns for the Year Ended December 31, 2013
| | | | | | | | | | | | | | | | |
| Class | | One Year | | | Five Years | | | Ten Years1 | | | Gross Expense Ratio2 | |
| Initial Class Shares | | | –2.46 | % | | | 2.84 | % | | | 4.02 | % | | | 0.54 | % |
| Service Class Shares | | | –2.70 | | | | 2.59 | | | | 3.76 | | | | 0.79 | |
| | | | | | | | | | | | |
| Benchmark Performance | | One
Year | | | Five
Years | | | Ten
Years | |
Barclays U.S. Government Bond Index3 | | | –2.60 | % | | | 2.26 | % | | | 4.14 | % |
Morningstar Intermediate Government Category Average4 | | | –2.52 | | | | 3.40 | | | | 3.89 | |
| 1. | Performance figures shown for the ten-year period ended December 31, 2013 reflect nonrecurring reimbursements from affiliates for printing and mailing costs. If these nonrecurring reimbursements had not been made, the total returns would have been 4.01% for Initial Class shares and 3.75% for Service Class shares for the ten-year period. |
| 2. | The gross expense ratios presented reflect the Portfolio’s “Total Annual Portfolio Operating Expenses” from the most recent Prospectus and may differ from other expense ratios disclosed in this report. |
| 3. | Please refer to pages M-2 and M-3 for additional explanations and disclosure regarding the Portfolios, their benchmark indices and other indices mentioned in the reports. |
| 4. | The Morningstar Intermediate Government Category Average is representative of funds that have at least 90% of their bond holdings in bonds backed by U.S. government or by U.S. government-linked agencies. These funds have durations between 3.5 and 6 years and/or average effective maturities between 4 and 10 years. Results are based on total returns with all dividends and capital gain distributions reinvested. |
| | | | |
| mainstayinvestments.com | | | M-175 | |
Cost in Dollars of a $1,000 Investment in MainStay VP Government Portfolio (Unaudited)
The example below is intended to describe the fees and expenses borne by shareholders during the six-month period from July 1, 2013, to December 31, 2013, and the impact of those costs on your investment.
Example
As a shareholder of the Portfolio, you incur two types of costs: (1) transaction costs, including exchange fees and sales charges (loads) on purchases (as applicable), and (2) ongoing costs, including management fees, distribution and/or service (12b-1) fees, and other Portfolio expenses (as applicable). This example is intended to help you understand your ongoing costs (in dollars) of investing in the Portfolio and to compare these costs with the ongoing costs of investing in other Portfolios. The example is based on an investment of $1,000 made at the beginning of the six-month period and held for the entire period from July 1, 2013, to December 31, 2013. Shares are only sold in connection with variable life and annuity contracts and the example does not reflect any contract level or transactional fees or expenses. If these costs had been included, your costs would have been higher.
This example illustrates your Portfolio’s ongoing costs in two ways:
Actual Expenses
The second and third data columns in the table below provide information about actual account values and actual expenses. You may use the information in these columns, together with the amount you invested, to estimate the expenses that you paid during the six months ended
December 31, 2013. Simply divide your account value by $1,000 (for example, an $8,600 account value divided by $1,000 = 8.6), then multiply the result by the number under the heading entitled ‘‘Expenses Paid During Period’’ to estimate the expenses you paid on your account during this period.
Hypothetical Example for Comparison Purposes
The fourth and fifth data columns in the table below provide information about hypothetical account values and hypothetical expenses based on the Portfolio’s actual expense ratio and an assumed rate of return of 5% per year before expenses, which is not the Portfolio’s actual return. The hypothetical account values and expenses may not be used to estimate the actual ending account balances or expenses you paid for the six-month period shown. You may use this information to compare the ongoing costs of investing in the Portfolio with the ongoing costs of investing in other Portfolios. To do so, compare this 5% hypothetical example with the 5% hypothetical examples that appear in the shareholder reports of the other Portfolios.
Please note that the expenses shown in the table are meant to highlight your ongoing costs only and do not reflect any transactional costs, such as exchange fees or sales charges (loads). Therefore, the fourth and fifth data columns of the table are useful in comparing ongoing costs only and will not help you determine the relative total costs of owning different funds. In addition, if these transactional costs were included, your costs would have been higher.
| | | | | | | | | | | | | | | | | | | | |
| | | | | | | | | | | | | | | | |
| Share Class | | Beginning
Account
Value
7/1/13 | | | Ending Account
Value (Based
on Actual
Returns and
Expenses)
12/31/13 | | | Expenses
Paid
During
Period1 | | | Ending Account
Value (Based
on Hypothetical
5% Annualized
Return and
Actual Expenses)
12/31/13 | | | Expenses
Paid
During
Period1 | |
| | | | | |
| Initial Class Shares | | $ | 1,000.00 | | | $ | 1,001.90 | | | $ | 2.78 | | | $ | 1,022.40 | | | $ | 2.80 | |
| | | | | |
| Service Class Shares | | $ | 1,000.00 | | | $ | 1,000.60 | | | $ | 4.03 | | | $ | 1,021.20 | | | $ | 4.08 | |
| 1. | Expenses are equal to the Portfolio’s annualized expense ratio of each class (0.55% for Initial Class and 0.80% for Service Class) multiplied by the average account value over the period, divided by 365 and multiplied by 184 (to reflect the six-month period). The table above represents the actual expenses incurred during the six-month period. |
| | |
| M-176 | | MainStay VP Government Portfolio |
Portfolio Composition as of December 31, 2013 (Unaudited)
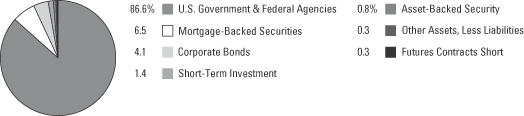
See Portfolio of Investments beginning on page M-181 for specific holdings within these categories.
Top Ten Holdings as of December 31, 2013 (excluding short-term investment) (Unaudited)
| 1. | Federal National Mortgage Association (Mortgage Pass-Through Securities), 3.50%, due 11/1/25 |
| 2. | Federal Home Loan Mortgage Corporation (Mortgage Pass-Through Securities), 4.00%, due 3/1/41 |
| 3. | Government National Mortgage Association (Mortgage Pass-Through Securities), 4.50%, due 5/20/40 |
| 4. | Federal Home Loan Mortgage Corporation (Mortgage Pass-Through Securities), 4.00%, due 2/1/41 |
| 5. | Federal National Mortgage Association (Mortgage Pass-Through Securities), 4.50%, due 1/1/41 |
| 6. | Government National Mortgage Association (Mortgage Pass-Through Securities), 4.00%, due 10/15/41 |
| 7. | Overseas Private Investment Corporation, 5.142%, due 12/15/23 |
| 8. | United States Treasury Note, 0.625%, due 10/15/16 |
| 9. | Federal National Mortgage Association (Mortgage Pass-Through Securities), 4.50%, due 8/1/39 |
| 10. | Federal Home Loan Mortgage Corporation (Mortgage Pass-Through Securities), 4.00%, due 12/1/40 |
| | | | |
| mainstayinvestments.com | | | M-177 | |
Portfolio Management Discussion and Analysis (Unaudited)
Answers to the questions reflect the views of portfolio managers Dan Roberts, Louis N. Cohen and Steven H. Rich of MacKay Shields LLC, the Portfolio’s Subadvisor.
How did MainStay VP Government Portfolio perform relative to its benchmark and peers during the 12 months ended December 31, 2013?
For the 12 months ended December 31, 2013, MainStay VP Government Portfolio returned –2.46% for Initial Class shares and –2.70% for Service Class shares. Over the same period, Initial Class shares outperformed—and Service Class shares underperformed—the –2.60% return of the Barclays U.S. Government Bond Index,1 which is the Portfolio’s broad-based securities-market index. Initial Class shares outperformed—and Service Class shares underperformed—the –2.52% return of the Morningstar Intermediate Government Category Average for the 12 months ended December 31, 2013.
What factors affected the Portfolio’s relative performance during the reporting period?
Duration,2 yield-curve3 posture, sector weighting and issue selection are four factors that affected the Portfolio’s relative performance during the reporting period.
The Portfolio’s duration was consistently shorter than that of the Barclays U.S. Government Bond Index in 2013. Because the Barclays U.S. Government Bond Index has a longer duration, it is more sensitive than the Portfolio to changes in U.S. Treasury yields and would have felt a greater impact as U.S. Treasury yields rose during the reporting period.
During the reporting period, the yield spread between the two- and 30-year benchmark points on the U.S. Treasury yield curve widened. Relative to peers that were more concentrated in longer-duration securities, the Portfolio benefited from the curve reshaping.
The largest class of securities in the Portfolio is agency mortgage pass-through securities.4 Our commitment to agency mortgage pass-throughs imparts a yield advantage over lower-yielding government-related securities, such as U.S. Treasury securities and agency debentures. This effect was a positive contributor to the Portfolio’s absolute return. In addition, agency mortgage pass-throughs outperformed comparable-duration U.S. Treasury securities during the reporting period. As a
result, portfolios with less exposure to mortgages than the Portfolio would have trailed. For the same reason, mortgage sector holdings helped the Portfolio’s performance relative to the Barclays U.S. Government Bond Index, which does not include mortgage-backed securities.
Mortgage-related securities outperformed U.S. Treasury securities primarily because of three factors. First, the Federal Reserve remained a major source of incremental demand for mortgage related securities. Second, with U.S. Treasury yields and mortgage rates rising, refinancing opportunities waned and prepayment rates slowed. Indeed, the premium price risk of the agency residential mortgage-backed sector fell significantly because of higher rates. As the sector’s average price dropped from $108 to $103, the cost of receiving principal prepayments at par ($100) was partially alleviated, and the attractiveness of the sector improved for investors. Third, as prepayment rates slowed with rising interest rates, the average duration of the mortgage sector extended from approximately 3.2 years to 5.6 years. The duration extension relieved the sector of some of its near-term risk, which prompted some investors to favorably reconsider the sector’s return potential.
The performance of mortgages relative to comparable-duration U.S. Treasury securities was tempered by new government policies that aimed to assist underwater homeowners (those who carry more mortgage debt than the current value of their homes). By lowering refinancing barriers, the government policies had the potential to accelerate prepayment rates, especially among higher-coupon pass-throughs where the eligible underwater loans were concentrated.
The Portfolio’s mortgage allocation favors mortgage-backed securities issued by Fannie Mae and Freddie Mac and deemphasizes Ginnie Mae securities. Relative to its peers, the Portfolio may be underweight Ginnie Mae issues. The possibility of Japanese investors looking overseas for better yields buoyed the prospects of Ginnie Mae securities early in the reporting period. When the demand did not materialize, however, Ginnie Mae prices fell sharply.
| 1. | Please refer to pages M-2 and M-3 for additional explanations and disclosure regarding the Portfolios, their benchmark indices and service providers mentioned in the reports. |
| 2. | Duration is a measure of the price sensitivity of a fixed-income investment to changes in interest rates. Duration is expressed as a number of years and is considered a more accurate sensitivity gauge than average maturity. |
| 3. | The yield curve is a line that plots the yields of various securities of similar quality—typically U.S. Treasury issues—across a range of maturities. The U.S. Treasury yield curve serves as a benchmark for other debt and is used in economic forecasting. |
| 4. | Mortgage pass-through securities consist of a pool of residential mortgage loans in which homeowner’s monthly payments of principal, interest and prepayments pass from the original bank through a government agency or investment bank to investors. |
| | |
| M-178 | | MainStay VP Government Portfolio |
Some mortgage pass-through securities tend to be better protected against the borrowers’ call option because of structural features. One example might be a pool of smaller-balance loans. In this case, the small balance tends to reduce the borrower’s incentive to refinance as mortgage rates fall. The Portfolio emphasized call protection among its residential mortgage-backed holdings. We seek to moderate the pace of prepayments in a low-interest rate environment by owning securities in which the borrower’s incentive to refinance is muted. This includes securities backed by 15-year loan terms, securities backed by lower-balance mortgages, and securities backed by newer-production lower-rate loans. In securitizations of higher-rate loans, we have focused attention on mortgages originated in 2003, where loans are less likely to be underwater and less likely to be eligible for government refinancing initiatives. During the reporting period, call-protection stories tended to underperform generic mortgage collateral. Call-protected securities were hampered by rising mortgage rates, which tended to make the call protection less valuable.
The Federal Reserve’s efforts to maintain liquidity (by keeping the federal funds target rate close to zero) and to maintain downward pressure on longer-term rates (through direct security purchases, known as quantitative easing) were aimed at stimulating aggregate demand by making investment more attractive than saving. These efforts helped support credit-related product such as corporate bonds and commercial mortgage-backed securities. The Portfolio’s modest exposure to these sectors, which are not in the benchmark, provided a performance tailwind for the Portfolio’s absolute and relative returns.
Low turnover benefited the Portfolio relative to peers by limiting transaction costs. We also preserved yield by avoiding large cash balances.
What was the Portfolio’s duration strategy during the reporting period?
The Portfolio typically maintains an intermediate duration close to four years. At the end of 2013, the Portfolio’s 4.2 year duration was 0.6 years shorter than the duration of the Barclays U.S. Government Bond Index. In the current market environment, we prefer to keep the Portfolio’s duration on the shorter side because a shorter duration may benefit the
Portfolio relative to the benchmark and longer-duration peers in periods of rising U.S. Treasury yields.
We introduced short positions in U.S. Treasury futures to dampen the Portfolio’s interest-rate sensitivity. This trade allowed us to keep the Portfolio’s duration near the four-year target while mortgage durations extended as U.S. Treasury yields rose.
What other specific factors, risks or market forces prompted significant decisions for the Portfolio during the reporting period?
Agency mortgage pass-through securities are the Portfolio’s largest sector. Mortgage pass-throughs can offer better relative value than comparable-duration U.S. Treasury securities or agency debentures. The use of agency mortgage pass-throughs introduces incremental yield to the Portfolio and positions it to benefit should the yield spread between mortgage-backed securities and comparable-duration U.S. Treasury securities compress.
Most of the Portfolio’s residential mortgage exposure was in mortgage pass-through securities rather than collateralized mortgage obligations (CMOs). In our opinion, the compensation demanded by the market for the better convexity5 of collateralized mortgage obligations was excessive.
The Portfolio maintained a limited allocation to lower-coupon mortgage pass-throughs. These are the longest-duration securities in the sector, and their performance could slow as U.S. Treasury rates and mortgage rates rise. We also deemphasized Ginnie Mae securities on valuation concerns because the price spread between Ginnie Mae and Fannie Mae pass-throughs had exceeded historical norms.
We maintained our moderate exposure to credit risk as a secondary driver of Portfolio performance for two reasons. First, the prospects of credit-related sectors (investment-grade corporate bonds, commercial mortgage-backed securities and asset-backed securities) were aligned with the decision of the Federal Reserve’s monetary policymaking committee to keep the federal funds rate in a range near zero. Second, we believe that low interest rates should spark healthy demand for higher-yielding products. The Portfolio ended the reporting period with 11% of its net assets allocated to non-government-related securities.
| 5. | Convexity is a mathematical measure of the sensitivity of an interest-bearing bond to changes in interest rates. |
| | | | |
| mainstayinvestments.com | | | M-179 | |
During the reporting period, which market segments were the strongest contributors to the Portfolio’s performance and which market segments were particularly weak?
Agency mortgage pass-throughs collateralized by loans less apt to refinance were the weakest performers during 2013. As mortgage rates rose toward the end of the reporting period, the market sharply reassessed the value of call protection. Since these types of loan pools were emphasized in the Portfolio, the revaluation of call protection detracted from the Portfolio’s total return.
Mortgage pass-throughs whose durations are longer than average, such as newer-production lower-coupon securities, would have had weaker performance because the longer durations make the securities’ total returns more sensitive to rising U.S. Treasury yields. The Portfolio benefited by having limited exposure to this mortgage subsector.
The prices of securities issued by Tennessee Valley Authority (about 3% of net assets) softened when a 2014 White House budget proposal recommended divesting the Federal government’s ownership of the utility.
Treasury Inflation-Protected Securities (TIPS) underperformed nominal U.S. Treasury securities during the reporting period because economic growth was uneven, and inflation expectations remained well anchored. Both effects weighed on TIPS pricing. The Portfolio and its benchmark do not hold TIPS. Consequently, TIPS underperformance would have had no impact on the Portfolio’s return versus the bench-mark. However, the Portfolio’s allocation to TIPS may be lower than allocations in peer funds, so the Portfolio may have benefited from the better
performance of nominal U.S. Treasury securities relative to peers.
How did the Portfolio’s sector weightings change during the reporting period?
Sector allocations were generally stable during the reporting period. The bulk of the Portfolio’s trading activity was designed to keep the Portfolio fully invested by reinvesting principal payments from mortgage securities. With the new purchases, we emphasized residential mortgage securities whose collateral is less prone to refinance. We also entered into several mortgage dollar roll6 transactions for security types where we maintain exposure in generic form rather than as specified pools of mortgage loans. A handful of corporate bonds matured or were called away. We recycled the proceeds back into corporates to maintain exposure at approximately 4% of net assets.
During the summer, we established a short position in U.S. Treasury futures to moderate the Portfolio’s interest-rate sensitivity by offsetting the extension of mortgage durations should U.S. Treasury yields rise.
How was the Portfolio positioned at the end of the reporting period?
As of December 31, 2013, the Portfolio held an underweight position relative to the Barclays U.S. Government Index in U.S. Treasury securities and agency debentures. As of the same date, the Portfolio held an overweight position relative to the benchmark in agency mortgage pass-throughs and modestly overweight positions in asset-backed securities, corporate bonds and commercial mortgage-backed securities.
| 6. | A mortgage dollar roll is a transaction in which a portfolio sells mortgage-related securities from its portfolio to a counterparty from whom it simultaneously agrees to buy a similar security on a delayed delivery basis. A portfolio is required to segregate assets having a value not less than the repurchase price. Mortgage dollar roll transactions involve certain risks, including the risk that the mortgage-backed security returned to the Portfolio at the end of the roll, while substantially similar, could be inferior to what was initially sold to the counterparty. |
The opinions expressed are those of the portfolio managers as of the date of this report and are subject to change. There is no guarantee that any forecasts will come to pass. This material does not constitute investment advice and is not intended as an endorsement of any specific investment.
Not all MainStay VP Portfolios and/or share classes are available under all policies.
| | |
| M-180 | | MainStay VP Government Portfolio |
Portfolio of Investments December 31, 2013
| | | | | | | | |
| | | Principal
Amount | | | Value | |
Long-Term Bonds 98.0%† Asset-Backed Security 0.8% | |
Utilities 0.8% | |
Atlantic City Electric Transition Funding LLC
Series 2002-1, Class A4
5.55%, due 10/20/23 | | $ | 1,995,000 | | | $ | 2,282,434 | |
| | | | | | | | |
Total Asset-Backed Security
(Cost $2,029,493) | | | | | | | 2,282,434 | |
| | | | | | | | |
|
| Corporate Bonds 4.1% | |
Agriculture 0.8% | |
Altria Group, Inc. | | | | | | | | |
2.85%, due 8/9/22 | | | 1,170,000 | | | | 1,077,244 | |
9.70%, due 11/10/18 | | | 796,000 | | | | 1,046,256 | |
| | | | | | | | |
| | | | | | | 2,123,500 | |
| | | | | | | | |
Finance—Investment Banker/Broker 0.4% | |
Merrill Lynch & Co., Inc.
6.875%, due 4/25/18 | | | 900,000 | | | | 1,064,131 | |
| | | | | | | | |
|
Pipelines 1.0% | |
Plains All American Pipeline, L.P. / PAA
Finance Corp.
5.00%, due 2/1/21 | | | 2,700,000 | | | | 2,972,195 | |
| | | | | | | | |
|
Real Estate Investment Trusts 0.8% | |
Host Hotels & Resorts, L.P.
3.75%, due 10/15/23 | | | 2,350,000 | | | | 2,178,875 | |
| | | | | | | | |
|
Telecommunications 1.1% | |
Crown Castle Towers LLC
4.883%, due 8/15/20 (a) | | | 3,100,000 | | | | 3,252,288 | |
| | | | | | | | |
Total Corporate Bonds
(Cost $11,675,607) | | | | | | | 11,590,989 | |
| | | | | | | | |
|
| Mortgage-Backed Securities 6.5% | |
Commercial Mortgage Loans (Collateralized Mortgage Obligations) 6.0% | |
Bear Stearns Commercial Mortgage Securities Trust
Series 2005-PW10, Class A4
5.405%, due 12/11/40 (b) | | | 1,550,000 | | | | 1,644,468 | |
CD 2006-CD3 Mortgage Trust
Series 2006-CD3, Class A5
5.617%, due 10/15/48 | | | 802,000 | | | | 873,938 | |
CD 2007-CD5 Mortgage Trust
Series 2007-CD5, Class A4
5.886%, due 11/15/44 (b) | | | 1,465,549 | | | | 1,644,492 | |
| | | | | | | | |
| | | Principal
Amount | | | Value | |
Commercial Mortgage Loans (Collateralized Mortgage Obligations) (continued) | |
CFCRE Commercial Mortgage Trust
Series 2011-C1, Class A2
3.759%, due 4/15/44 (a) | | $ | 2,500,000 | | | $ | 2,621,245 | |
DBUBS Mortgage Trust
Series 2011-LC2A, Class A2
3.386%, due 7/10/44 (a) | | | 660,000 | | | | 688,291 | |
Four Times Square Trust
Series 2006-4TS, Class A
5.401%, due 12/13/28 (a) | | | 530,000 | | | | 585,476 | |
GE Capital Commercial Mortgage Corp.
Series 2004-C2, Class A4
4.893%, due 3/10/40 | | | 298,327 | | | | 298,639 | |
GS Mortgage Securities Corp. II
Series 2004-GG2, Class A6
5.396%, due 8/10/38 (c) | | | 1,549,565 | | | | 1,565,087 | |
GS Mortgage Securities Trust
Series 2011-GC5, Class A2
2.999%, due 8/10/44 | | | 800,000 | | | | 832,065 | |
JP Morgan Chase Commercial Mortgage Securities Trust | | | | | | | | |
Series 2011-C4, Class A3
4.106%, due 7/15/46 (a) | | | 1,500,000 | | | | 1,603,544 | |
Series 2007-CB20, Class A3
5.819%, due 2/12/51 | | | 556,000 | | | | 558,932 | |
LB-UBS Commercial Mortgage Trust
Series 2004-C1, Class A4
4.568%, due 1/15/31 | | | 471,551 | | | | 482,307 | |
Morgan Stanley Capital I Trust
Series 2005-HQ6, Class A4A
4.989%, due 8/13/42 | | | 1,330,000 | | | | 1,389,823 | |
RBSCF Trust
Series 2010-MB1, Class A2
3.686%, due 4/15/24 (a) | | | 800,000 | | | | 821,759 | |
Wachovia Bank Commercial Mortgage Trust
Series 2006-C29, Class A4
5.308%, due 11/15/48 | | | 1,500,000 | | | | 1,639,341 | |
| | | | | | | | |
| | | | | | | 17,249,407 | |
| | | | | | | | |
Residential Mortgages (Collateralized Mortgage Obligations) 0.5% | |
Citigroup Mortgage Loan Trust, Inc.
Series 2006-AR6, Class 1A1
5.604%, due 8/25/36 (c) | | | 544,622 | | | | 495,304 | |
Mortgage Equity Conversion Asset Trust
Series 2007-FF2, Class A
0.60%, due 2/25/42 (a)(b)(d)(e) | | | 1,223,571 | | | | 917,677 | |
| | | | | | | | |
| | | | | | | 1,412,981 | |
| | | | | | | | |
Total Mortgage-Backed Securities
(Cost $18,766,888) | | | | | | | 18,662,388 | |
| | | | | | | | |
| † | Percentages indicated are based on Portfolio net assets. |
| ¨ | | Among the Protfolio’s 10 largest holdings, as of December 31, 2013, execluding short-term investment. May be subject to change daily. |
| | | | | | |
The notes to the financial statements are an integral part of,
and should be read in conjunction with, the financial statements. | | mainstayinvestments.com | | | M-181 | |
Portfolio of Investments December 31, 2013 (continued)
| | | | | | | | |
| | | Principal
Amount | | | Value | |
U.S. Government & Federal
Agencies 86.6% | |
Fannie Mae Strip (Collateralized
Mortgage Obligations) 0.0%‡ | |
Series 360, Class 2, IO
5.00%, due 8/1/35 (f) | | $ | 353,255 | | | $ | 69,419 | |
Series 361, Class 2, IO
6.00%, due 10/1/35 (f) | | | 74,816 | | | | 15,065 | |
| | | | | | | | |
| | | | | | | 84,484 | |
| | | | | | | | |
Federal Home Loan Bank 1.0% | |
5.00%, due 11/17/17 | | | 2,400,000 | | | | 2,738,815 | |
| | | | | | | | |
|
Federal Home Loan Mortgage Corporation (Mortgage Pass-Through Securities) 18.1% | |
2.375%, due 6/1/35 (b) | | | 295,929 | | | | 315,555 | |
2.413%, due 2/1/37 (b) | | | 184,683 | | | | 195,756 | |
2.50%, due 3/1/35 (b) | | | 35,027 | | | | 37,252 | |
3.50%, due 10/1/25 | | | 827,732 | | | | 865,356 | |
3.50%, due 11/1/25 | | | 4,611,066 | | | | 4,821,197 | |
3.50%, due 12/1/41 | | | 464,640 | | | | 462,181 | |
3.50%, due 7/1/42 | | | 484,478 | | | | 481,254 | |
4.00%, due 3/1/25 | | | 1,919,930 | | | | 2,044,005 | |
4.00%, due 7/1/25 | | | 592,869 | | | | 631,249 | |
4.00%, due 8/1/31 | | | 1,180,878 | | | | 1,235,470 | |
4.00%, due 8/1/39 | | | 1,045,502 | | | | 1,080,195 | |
¨4.00%, due 12/1/40 | | | 4,735,781 | | | | 4,888,385 | |
¨4.00%, due 2/1/41 | | | 7,831,771 | | | | 8,077,615 | |
¨4.00%, due 3/1/41 | | | 9,172,134 | | | | 9,469,932 | |
4.00%, due 1/1/42 | | | 4,358,553 | | | | 4,500,177 | |
4.00%, due 12/1/42 | | | 1,487,499 | | | | 1,516,189 | |
4.50%, due 3/1/41 | | | 1,241,335 | | | | 1,323,066 | |
4.50%, due 5/1/41 | | | 1,697,387 | | | | 1,803,911 | |
4.50%, due 8/1/41 | | | 1,973,943 | | | | 2,097,847 | |
5.00%, due 1/1/20 | | | 435,004 | | | | 461,827 | |
5.00%, due 6/1/33 | | | 1,021,327 | | | | 1,105,387 | |
5.00%, due 8/1/33 | | | 580,527 | | | | 628,480 | |
5.00%, due 5/1/36 | | | 385,658 | | | | 415,799 | |
5.00%, due 10/1/39 | | | 1,427,096 | | | | 1,565,445 | |
5.50%, due 1/1/21 | | | 404,744 | | | | 438,961 | |
5.50%, due 1/1/33 | | | 766,671 | | | | 843,550 | |
6.50%, due 4/1/37 | | | 125,473 | | | | 141,151 | |
| | | | | | | | |
| | | | | | | 51,447,192 | |
| | | | | | | | |
Federal National Mortgage Association (Mortgage Pass-Through Securities) 49.8% | |
1.934%, due 11/1/34 (b) | | | 294,831 | | | | 311,515 | |
2.337%, due 4/1/34 (b) | | | 315,039 | | | | 334,460 | |
3.00%, due 10/1/32 | | | 1,617,747 | | | | 1,593,869 | |
3.50%, due 11/1/20 | | | 3,580,148 | | | | 3,763,165 | |
3.50%, due 10/1/25 | | | 1,841,699 | | | | 1,927,952 | |
¨3.50%, due 11/1/25 | | | 12,474,069 | | | | 13,064,794 | |
3.50%, due 9/1/32 | | | 4,515,576 | | | | 4,598,438 | |
3.50%, due 11/1/32 | | | 1,093,423 | | | | 1,113,496 | |
| | | | | | | | |
| | | Principal
Amount | | | Value | |
Federal National Mortgage Association (Mortgage Pass-Through Securities) (continued) | |
3.50%, due 2/1/41 | | $ | 2,652,000 | | | $ | 2,637,362 | |
3.50%, due 11/1/41 | | | 3,589,395 | | | | 3,573,786 | |
3.50%, due 12/1/41 | | | 1,616,244 | | | | 1,609,211 | |
3.50%, due 1/1/42 | | | 3,541,660 | | | | 3,527,427 | |
3.50%, due 3/1/42 | | | 3,445,031 | | | | 3,425,787 | |
3.50%, due 5/1/42 | | | 1,617,753 | | | | 1,608,735 | |
3.50%, due 8/1/42 | | | 3,779,542 | | | | 3,709,145 | |
3.50%, due 11/1/42 | | | 1,454,783 | | | | 1,427,698 | |
3.50%, due 12/1/42 | | | 1,725,251 | | | | 1,717,737 | |
3.50%, due 2/1/43 | | | 1,858,912 | | | | 1,850,824 | |
3.50%, due 5/1/43 | | | 3,568,483 | | | | 3,550,768 | |
4.00%, due 9/1/31 | | | 2,633,164 | | | | 2,750,919 | |
4.00%, due 1/1/41 | | | 1,432,258 | | | | 1,478,723 | |
4.00%, due 2/1/41 | | | 1,093,479 | | | | 1,129,054 | |
4.00%, due 3/1/41 | | | 2,864,662 | | | | 2,962,338 | |
4.00%, due 10/1/41 | | | 854,396 | | | | 883,529 | |
4.00%, due 3/1/42 | | | 2,409,020 | | | | 2,465,037 | |
4.00%, due 6/1/42 | | | 1,025,606 | | | | 1,046,357 | |
4.00%, due 7/1/42 | | | 3,087,422 | | | | 3,148,950 | |
4.00%, due 8/1/42 | | | 1,532,085 | | | | 1,562,872 | |
4.00%, due 9/1/42 | | | 1,534,843 | | | | 1,581,361 | |
4.50%, due 7/1/18 | | | 1,517,763 | | | | 1,615,503 | |
4.50%, due 11/1/18 | | | 1,126,159 | | | | 1,198,541 | |
4.50%, due 6/1/23 | | | 871,694 | | | | 928,393 | |
4.50%, due 6/1/39 | | | 1,361,854 | | | | 1,450,506 | |
4.50%, due 7/1/39 | | | 3,486,774 | | | | 3,727,176 | |
¨4.50%, due 8/1/39 | | | 4,972,562 | | | | 5,296,928 | |
4.50%, due 9/1/40 | | | 4,194,366 | | | | 4,483,675 | |
4.50%, due 12/1/40 | | | 2,647,581 | | | | 2,813,147 | |
¨4.50%, due 1/1/41 | | | 6,832,651 | | | | 7,306,648 | |
4.50%, due 2/1/41 | | | 630,261 | | | | 671,511 | |
4.50%, due 8/1/41 | | | 3,295,454 | | | | 3,503,597 | |
5.00%, due 11/1/17 | | | 716,423 | | | | 762,198 | |
5.00%, due 9/1/20 | | | 52,116 | | | | 55,480 | |
5.00%, due 11/1/33 | | | 1,874,743 | | | | 2,042,343 | |
5.00%, due 7/1/34 | | | 231,239 | | | | 251,252 | |
5.00%, due 6/1/35 | | | 1,419,600 | | | | 1,541,979 | |
5.00%, due 10/1/35 | | | 388,465 | | | | 421,688 | |
5.00%, due 1/1/36 | | | 179,247 | | | | 194,518 | |
5.00%, due 2/1/36 | | | 2,123,678 | | | | 2,304,851 | |
5.00%, due 5/1/36 | | | 2,083,885 | | | | 2,261,601 | |
5.00%, due 3/1/40 | | | 2,319,469 | | | | 2,542,075 | |
5.00%, due 2/1/41 | | | 3,853,967 | | | | 4,257,914 | |
5.50%, due 11/1/17 | | | 481,127 | | | | 514,127 | |
5.50%, due 6/1/19 | | | 529,513 | | | | 573,336 | |
5.50%, due 11/1/19 | | | 627,177 | | | | 679,133 | |
5.50%, due 4/1/21 | | | 865,744 | | | | 943,802 | |
5.50%, due 6/1/21 | | | 53,541 | | | | 58,484 | |
5.50%, due 6/1/33 | | | 2,394,169 | | | | 2,646,512 | |
| | | | |
| M-182 | | MainStay VP Government Portfolio | | The notes to the financial statements are an integral part of,
and should be read in conjunction with, the financial statements. |
| | | | | | | | |
| | | Principal
Amount | | | Value | |
U.S. Government & Federal
Agencies (continued) | |
Federal National Mortgage Association (Mortgage Pass-Through Securities) (continued) | |
5.50%, due 11/1/33 | | $ | 1,558,531 | | | $ | 1,718,107 | |
5.50%, due 12/1/33 | | | 1,594,419 | | | | 1,760,880 | |
5.50%, due 6/1/34 | | | 474,477 | | | | 522,048 | |
5.50%, due 3/1/35 | | | 721,022 | | | | 792,978 | |
5.50%, due 12/1/35 | | | 284,928 | | | | 313,245 | |
5.50%, due 4/1/36 | | | 1,542,648 | | | | 1,695,809 | |
5.50%, due 1/1/37 | | | 412,999 | | | | 462,066 | |
5.50%, due 7/1/37 | | | 312,472 | | | | 350,322 | |
5.50%, due 8/1/37 | | | 366,635 | | | | 403,090 | |
6.00%, due 12/1/16 | | | 34,876 | | | | 36,319 | |
6.00%, due 1/1/33 | | | 241,560 | | | | 271,176 | |
6.00%, due 3/1/33 | | | 264,750 | | | | 297,269 | |
6.00%, due 9/1/34 | | | 52,359 | | | | 58,764 | |
6.00%, due 9/1/35 | | | 765,893 | | | | 861,457 | |
6.00%, due 10/1/35 | | | 147,583 | | | | 165,401 | |
6.00%, due 4/1/36 | | | 642,098 | | | | 716,121 | |
6.00%, due 6/1/36 | | | 481,362 | | | | 534,443 | |
6.00%, due 11/1/36 | | | 664,738 | | | | 738,841 | |
6.00%, due 4/1/37 | | | 127,677 | | | | 137,597 | |
6.50%, due 10/1/31 | | | 98,298 | | | | 112,124 | |
6.50%, due 7/1/32 | | | 27,520 | | | | 30,584 | |
6.50%, due 2/1/37 | | | 91,680 | | | | 104,637 | |
6.50%, due 8/1/47 | | | 88,045 | | | | 95,133 | |
| | | | | | | | |
| | | | | | | 141,580,638 | |
| | | | | | | | |
Government National Mortgage Association (Mortgage Pass-Through Securities) 10.5% | |
4.00%, due 7/15/39 | | | 938,574 | | | | 976,516 | |
4.00%, due 9/20/40 | | | 3,223,455 | | | | 3,378,165 | |
4.00%, due 11/20/40 | | | 435,962 | | | | 456,874 | |
4.00%, due 1/15/41 | | | 3,396,875 | | | | 3,534,319 | |
¨4.00%, due 10/15/41 | | | 6,027,786 | | | | 6,299,298 | |
¨4.50%, due 5/20/40 | | | 8,819,699 | | | | 9,455,348 | |
5.00%, due 4/15/34 | | | 1,260,453 | | | | 1,379,244 | |
5.00%, due 2/20/41 | | | 1,015,722 | | | | 1,109,379 | |
5.50%, due 6/15/33 | | | 1,345,930 | | | | 1,526,731 | |
5.50%, due 12/15/35 | | | 430,068 | | | | 474,885 | |
6.00%, due 8/15/32 | | | 257,160 | | | | 289,849 | |
6.00%, due 10/15/32 | | | 423,234 | | | | 476,916 | |
6.50%, due 7/15/28 | | | 47,440 | | | | 54,946 | |
6.50%, due 8/15/28 | | | 63,594 | | | | 72,437 | |
6.50%, due 7/15/32 | | | 229,746 | | | | 256,074 | |
| | | | | | | | |
| | | | | | | 29,740,981 | |
| | | | | | | | |
¨Overseas Private Investment Corporation 2.2% | |
5.142%, due 12/15/23 | | | 5,633,220 | | | | 6,224,843 | |
| | | | | | | | |
| | | | | | | | |
| | | Principal
Amount | | | Value | |
Tennessee Valley Authority 3.0% | |
4.65%, due 6/15/35 | | $ | 4,395,000 | | | $ | 4,370,537 | |
6.25%, due 12/15/17 | | | 3,485,000 | | | | 4,124,003 | |
| | | | | | | | |
| | | | | | | 8,494,540 | |
| | | | | | | | |
¨United States Treasury Note 2.0% | |
0.625%, due 10/15/16 | | | 5,820,000 | | | | 5,809,087 | |
| | | | | | | | |
Total U.S. Government & Federal Agencies
(Cost $243,075,790) | | | | 246,120,580 | |
| | | | | | | | |
Total Long-Term Bonds
(Cost $275,547,778) | | | | | | | 278,656,391 | |
| | | | | | | | |
|
| Short-Term Investment 1.4% | |
Repurchase Agreement 1.4% | |
State Street Bank and Trust Co.
0.00%, dated 12/31/13
due 1/2/14
Proceeds at Maturity $4,028,891 (Collateralized by a Federal National Mortgage Association security with a rate of 2.17% and a maturity date of 11/7/22, with a Principal Amount of $4,515,000 and a Market Value of $4,110,072) | | | 4,028,891 | | | | 4,028,891 | |
| | | | | | | | |
Total Short-Term Investment
(Cost $4,028,891) | | | | | | | 4,028,891 | |
| | | | | | | | |
Total Investments
(Cost $279,576,669) (i) | | | 99.4 | % | | | 282,685,282 | |
Other Assets, Less Liabilities | | | 0.6 | | | | 1,632,368 | |
Net Assets | | | 100.0 | % | | $ | 284,317,650 | |
| | |
| | | | | | | | |
| | | Contracts
Short | | | Unrealized
Appreciation
(Depreciation) (g) | |
| Futures Contracts 0.3% | |
United States Treasury Note
March 2014 (10 Year) (h) | | | (126 | ) | | $ | 295,042 | |
United States Treasury Note
March 2014 (5 Year) (h) | | | (300 | ) | | | 468,105 | |
| | | | | | | | |
Total Futures Contracts
(Notional Amount $51,297,656) | | | | | | $ | 763,147 | |
| | | | | | | | |
| ‡ | Less than one-tenth of a percent. |
| (a) | May be sold to institutional investors only under Rule 144A or securities offered pursuant to Section 4(a)(2) of the Securities Act of 1933, as amended. |
| (b) | Floating rate—Rate shown is the rate in effect as of December 31, 2013. |
| | | | | | |
The notes to the financial statements are an integral part of,
and should be read in conjunction with, the financial statements. | | mainstayinvestments.com | | | M-183 | |
Portfolio of Investments December 31, 2013 (continued)
| (c) | Collateral strip rate—A bond whose interest is based on the weighted net interest rate of the collateral. The coupon rate adjusts periodically based on a predetermined schedule. Rate shown is the rate in effect as of December 31, 2013. |
| (d) | Illiquid security—The total market value of this security as of December 31, 2013, is $917,677, which represents 0.3% of the Portfolio’s net assets. |
| (e) | Fair valued security—The total market value of this security as of December 31, 2013, is $917,677, which represents 0.3% of the Portfolio’s net assets. |
| (f) | Collateralized Mortgage Obligation Interest Only Strip—Pays a fixed or variable rate of interest based on mortgage loans or mortgage pass-through securities. The principal amount of the underlying pool represents the notional amount on which the current interest is calculated. The value of these stripped |
| | securities may be particularly sensitive to changes in prevailing interest rates and are typically more sensitive to changes in prepayment rates than traditional mortgage-backed securities. |
| (g) | Represents the difference between the value of the contracts at the time they were opened and the value as of December 31, 2013. |
| (h) | As of December 31, 2013, cash in the amount of $455,850 is on deposit with a broker for futures transactions. |
| (i) | As of December 31, 2013, cost is $279,576,669 for federal income tax purposes and net unrealized appreciation is as follows: |
| | | | |
Gross unrealized appreciation | | $ | 8,066,330 | |
Gross unrealized depreciation | | | (4,957,717 | ) |
| | | | |
Net unrealized appreciation | | $ | 3,108,613 | |
| | | | |
The following is a summary of the fair valuations according to the inputs used as of December 31, 2013, for valuing the Portfolio’s assets.
Asset Valuation Inputs
| | | | | | | | | | | | | | | | |
Description | | Quoted Prices
in Active Markets
for Identical Assets (Level 1) | | | Significant Other
Observable Inputs (Level 2) | | | Significant
Unobservable
Inputs (Level 3) | | | Total | |
| Investments in Securities (a) | | | | | | | | | | | | | | | | |
| Long-Term Bonds | | | | | | | | | | | | | | | | |
Asset-Backed Security | | $ | — | | | $ | 2,282,434 | | | $ | — | | | $ | 2,282,434 | |
Corporate Bonds | | | — | | | | 11,590,989 | | | | — | | | | 11,590,989 | |
Mortgage-Backed Securities (b) | | | — | | | | 17,744,711 | | | | 917,677 | | | | 18,662,388 | |
U.S. Government & Federal Agencies | | | — | | | | 246,120,580 | | | | — | | | | 246,120,580 | |
| | | | | | | | | | | | | | | | |
| Total Long-Term Bonds | | | — | | | | 277,738,714 | | | | 917,677 | | | | 278,656,391 | |
| | | | | | | | | | | | | | | | |
| Short-Term Investment | | | | | | | | | | | | | | | | |
Repurchase Agreement | | | — | | | | 4,028,891 | | | | — | | | | 4,028,891 | |
| | | | | | | | | | | | | | | | |
| Total Investments in Securities | | | — | | | | 281,767,605 | | | | 917,677 | | | | 282,685,282 | |
| | | | | | | | | | | | | | | | |
| Other Financial Instruments | | | | | | | | | | | | | | | | |
Futures Contracts Short (c) | | | 763,147 | | | | — | | | | — | | | | 763,147 | |
| | | | | | | | | | | | | | | | |
| Total Other Financial Instruments | | | 763,147 | | | | — | | | | — | | | | 763,147 | |
| | | | | | | | | | | | | | | | |
| Total Investments in Securities and Other Financial Instruments | | $ | 763,147 | | | $ | 281,767,605 | | | $ | 917,677 | | | $ | 283,448,429 | |
| | | | | | | | | | | | | | | | |
| (a) | For a complete listing of investments and their industries, see the Portfolio of Investments. |
| (b) | The Level 3 security valued at $917,677 is held in Residential Mortgages (Collateralized Mortgage Obligations) within the Mortgage-Backed Securities section of the Portfolio of Investments. |
| (c) | The value listed for these securities reflects unrealized appreciation (depreciation) as shown on the Portfolio of Investments. |
The Portfolio recognizes transfers between the levels as of the beginning of the period.
As of December 31, 2013, a security with a market of $1,028,778 was transferred from Level 2 to Level 3 as the security was fair valued when compared to prior year price which was based on a quoted price. As of December 31, 2013, the price was adjusted using significant unobservable inputs due to market quotations not being readily available in accordance with the Portfolio’s policies and procedures. (See Note 2)
| | | | |
| M-184 | | MainStay VP Government Portfolio | | The notes to the financial statements are an integral part of,
and should be read in conjunction with, the financial statements. |
The following is a reconciliation of investments in which significant unobservable inputs (Level 3) were used in determining value:
| | | | | | | | | | | | | | | | | | | | | | | | | | | | | | | | | | | | | | | | | | | | | | | | | | |
Investments in
Securities | | Balance
as of
December 31,
2012 | | Accrued
Discounts
(Premiums) | | Realized
Gain
(Loss) | | Change in
Unrealized
Appreciation
(Depreciation) | | Purchases | | Sales | | Transfers
into
Level 3 | | Transfers
out of
Level 3 | | Balance
as of
December 31,
2013 | | Change in
Unrealized
Appreciation
(Depreciation)
from
Investments
Still Held at
December 31,
2013 (a) |
| Long-Term Bonds | | | | | | | | | | | | | | | | | | | | | | | | | | | | | | | | | | | | | | | | | | | | | | | | | | |
Mortgage-
Backed
Securities | | | | | | | | | | | | | | | | | | | | | | | | | | | | | | | | | | | | | | | | | | | | | | | | | | |
Commercial
Mortgage Loans
(Collateralized Mortgage
Obligations) | | | $ | — | | | | $ | 757 | | | | $ | 3,789 | | | | $ | (69,340 | ) | | | $ | 84,811 | | | | $ | (131,118 | ) | | | $ | 1,028,778 | | | | $ | — | | | | $ | 917,677 | | | | $ | (69,340 | ) |
| | | | | | | | | | | | | | | | | | | | | | | | | | | | | | | | | | | | | | | | | | | | | | | | | | |
| Total | | | $ | — | | | | $ | 757 | | | | $ | 3,789 | | | | $ | (69,340 | ) | | | $ | 84,811 | | | | $ | (131,118 | ) | | | $ | 1,028,778 | | | | $ | — | | | | $ | 917,677 | | | | $ | (69,340 | ) |
| | | | | | | | | | | | | | | | | | | | | | | | | | | | | | | | | | | | | | | | | | | | | | | | | | |
| (a) | Included in “Net change in unrealized appreciation (depreciation) on investments” in the Statement of Operations. |
| | | | | | |
The notes to the financial statements are an integral part of,
and should be read in conjunction with, the financial statements. | | mainstayinvestments.com | | | M-185 | |
Statement of Assets and Liabilities as of December 31, 2013
| | | | |
| Assets | |
Investment in securities, at value
(identified cost $279,576,669) | | $ | 282,685,282 | |
Cash collateral on deposit at broker | | | 455,850 | |
Receivables: | | | | |
Interest | | | 1,019,711 | |
Fund shares sold | | | 561,320 | |
Variation margin on futures contracts | | | 49,781 | |
Investment securities sold | | | 1,539 | |
| | | | |
Total assets | | | 284,773,483 | |
| | | | |
| |
| Liabilities | | | | |
Payables: | | | | |
Fund shares redeemed | | | 237,380 | |
Manager (See Note 3) | | | 121,772 | |
NYLIFE Distributors (See Note 3) | | | 41,797 | |
Professional fees | | | 34,145 | |
Shareholder communication | | | 14,233 | |
Custodian | | | 3,256 | |
Trustees | | | 474 | |
Accrued expenses | | | 2,776 | |
| | | | |
Total liabilities | | | 455,833 | |
| | | | |
Net assets | | $ | 284,317,650 | |
| | | | |
| |
| Net Assets Consist of | | | | |
Shares of beneficial interest outstanding (par value of $.001 per share) unlimited number of shares authorized | | $ | 25,677 | |
Additional paid-in capital | | | 272,504,088 | |
| | | | |
| | | 272,529,765 | |
Undistributed net investment income | | | 7,797,189 | |
Accumulated net realized gain (loss) on investments and futures transactions | | | 118,936 | |
Net unrealized appreciation (depreciation) on investments and futures contracts | | | 3,871,760 | |
| | | | |
Net assets | | $ | 284,317,650 | |
| | | | |
| | | | |
Initial Class | | | | |
Net assets applicable to outstanding shares | | $ | 89,164,936 | |
| | | | |
Shares of beneficial interest outstanding | | | 8,007,848 | |
| | | | |
Net asset value per share outstanding | | $ | 11.13 | |
| | | | |
Service Class | | | | |
Net assets applicable to outstanding shares | | $ | 195,152,714 | |
| | | | |
Shares of beneficial interest outstanding | | | 17,669,301 | |
| | | | |
Net asset value per share outstanding | | $ | 11.04 | |
| | | | |
| | | | |
| M-186 | | MainStay VP Government Portfolio | | The notes to the financial statements are an integral part of,
and should be read in conjunction with, the financial statements. |
Statement of Operations for the year ended December 31, 2013
| | | | |
| Investment Income (Loss) | |
Income | | | | |
Interest | | $ | 10,179,543 | |
| | | | |
Expenses | | | | |
Manager (See Note 3) | | | 1,640,035 | |
Distribution and service—Service Class (See Note 3) | | | 563,717 | |
Professional fees | | | 58,308 | |
Shareholder communication | | | 47,652 | |
Custodian | | | 19,378 | |
Trustees | | | 7,091 | |
Miscellaneous | | | 13,226 | |
| | | | |
Total expenses | | | 2,349,407 | |
| | | | |
Net investment income (loss) | | | 7,830,136 | |
| | | | |
|
| Realized and Unrealized Gain (Loss) on Investments and Futures Contracts | |
Net realized gain (loss) on: | | | | |
Security transactions | | | 838,297 | |
Futures transactions | | | (590,525 | ) |
| | | | |
Net realized gain (loss) on investments and futures transactions | | | 247,772 | |
| | | | |
Net change in unrealized appreciation (depreciation) on: | | | | |
Investments | | | (18,101,929 | ) |
Futures contracts | | | 763,147 | |
| | | | |
Net change in unrealized appreciation (depreciation) on investments and futures contracts | | | (17,338,782 | ) |
| | | | |
Net realized and unrealized gain (loss) on investments and futures transactions | | | (17,091,010 | ) |
| | | | |
Net increase (decrease) in net assets resulting from operations | | $ | (9,260,874 | ) |
| | | | |
| | | | | | |
The notes to the financial statements are an integral part of,
and should be read in conjunction with, the financial statements. | | mainstayinvestments.com | | | M-187 | |
Statements of Changes in Net Assets
for the years ended December 31, 2013 and December 31, 2012
| | | | | | | | |
| | | 2013 | | | 2012 | |
| Increase (Decrease) in Net Assets | |
Operations: | | | | | | | | |
Net investment income (loss) | | $ | 7,830,136 | | | $ | 9,637,579 | |
Net realized gain (loss) on investments and futures transactions | | | 247,772 | | | | 689,044 | |
Net change in unrealized appreciation (depreciation) on investments and futures contracts | | | (17,338,782 | ) | | | 3,318,534 | |
| | | | |
Net increase (decrease) in net assets resulting from operations | | | (9,260,874 | ) | | | 13,645,157 | |
| | | | |
Dividends and distributions to shareholders: | | | | | | | | |
From net investment income: | | | | | | | | |
Initial Class | | | (3,209,825 | ) | | | (3,610,388 | ) |
Service Class | | | (6,516,735 | ) | | | (6,936,666 | ) |
| | | | |
| | | (9,726,560 | ) | | | (10,547,054 | ) |
| | | | |
From net realized gain on investments: | | | | | | | | |
Initial Class | | | (176,469 | ) | | | — | |
Service Class | | | (391,771 | ) | | | — | |
| | | | |
| | | (568,240 | ) | | | — | |
| | | | |
Total dividends and distributions to shareholders | | | (10,294,800 | ) | | | — | |
| | | | |
Capital share transactions: | | | | | | | | |
Net proceeds from sale of shares | | | 27,826,629 | | | | 70,520,572 | |
Net asset value of shares issued to shareholders in reinvestment of dividends and distributions | | | 10,294,800 | | | | 10,547,054 | |
Cost of shares redeemed | | | (107,755,995 | ) | | | (78,820,337 | ) |
| | | | |
Increase (decrease) in net assets derived from capital share transactions | | | (69,634,566 | ) | | | 2,247,289 | |
| | | | |
Net increase (decrease) in net assets | | | (89,190,240 | ) | | | 5,345,392 | |
|
| Net Assets | |
Beginning of year | | | 373,507,890 | | | | 368,162,498 | |
| | | | |
End of year | | $ | 284,317,650 | | | $ | 373,507,890 | |
| | | | |
Undistributed net investment income at end of year | | $ | 7,797,189 | | | $ | 9,726,545 | |
| | | | |
| | | | |
| M-188 | | MainStay VP Government Portfolio | | The notes to the financial statements are an integral part of,
and should be read in conjunction with, the financial statements. |
Financial Highlights selected per share data and ratios
| | | | | | | | | | | | | | | | | | | | |
| | | Initial Class | |
| | | Year ended December 31, | |
| | | 2013 | | | 2012 | | | 2011 | | | 2010 | | | 2009 | |
Net asset value at beginning of year | | $ | 11.84 | | | $ | 11.74 | | | $ | 11.55 | | | $ | 11.47 | | | $ | 11.72 | |
| | | | | | | | | | | | | | | | | | | | |
Net investment income (loss) (a) | | | 0.30 | | | | 0.33 | | | | 0.36 | | | | 0.33 | | | | 0.36 | |
Net realized and unrealized gain (loss) on investments | | | (0.60 | ) | | | 0.13 | | | | 0.32 | | | | 0.30 | | | | (0.17 | ) |
| | | | | | | | | | | | | | | | | | | | |
Total from investment operations | | | (0.30 | ) | | | 0.46 | | | | 0.68 | | | | 0.63 | | | | 0.19 | |
| | | | | | | | | | | | | | | | | | | | |
Less dividends and distributions: | | | | | | | | | | | | | | | | | | | | |
From net investment income | | | (0.39 | ) | | | (0.36 | ) | | | (0.39 | ) | | | (0.37 | ) | | | (0.43 | ) |
From net realized gain on investments | | | (0.02 | ) | | | — | | | | (0.10 | ) | | | (0.18 | ) | | | (0.01 | ) |
| | | | | | | | | | | | | | | | | | | | |
Total dividends and distributions | | | (0.41 | ) | | | (0.36 | ) | | | (0.49 | ) | | | (0.55 | ) | | | (0.44 | ) |
| | | | | | | | | | | | | | | | | | | | |
Net asset value at end of year | | $ | 11.13 | | | $ | 11.84 | | | $ | 11.74 | | | $ | 11.55 | | | $ | 11.47 | |
| | | | | | | | | | | | | | | | | | | | |
Total investment return | | | (2.46 | %) | | | 3.96 | % | | | 5.98 | % | | | 5.35 | % | | | 1.61 | % |
Ratios (to average net assets)/Supplemental Data: | | | | | | | | | | | | | | | | | | | | |
Net investment income (loss) | | | 2.56 | % | | | 2.78 | % | | | 3.04 | % | | | 2.79 | % | | | 3.12 | % |
Net expenses | | | 0.54 | % | | | 0.54 | % | | | 0.55 | % | | | 0.56 | % | | | 0.56 | % |
Portfolio turnover rate (b) | | | 25 | % | | | 40 | % | | | 58 | % | | | 127 | % | | | 141 | % |
Net assets at end of year (in 000’s) | | $ | 89,165 | | | $ | 117,126 | | | $ | 133,395 | | | $ | 153,178 | | | $ | 167,267 | |
| (a) | Per share data based on average shares outstanding during the year. |
| (b) | The portfolio turnover rates not including mortgage dollar rolls were 8%, 20%, 37%, 30% and 24% for the years ended December 31, 2013, 2012, 2011, 2010 and 2009, respectively. |
| | | | | | | | | | | | | | | | | | | | |
| | | Service Class | |
| | | Year ended December 31, | |
| | | 2013 | | | 2012 | | | 2011 | | | 2010 | | | 2009 | |
Net asset value at beginning of year | | $ | 11.74 | | | $ | 11.65 | | | $ | 11.46 | | | $ | 11.40 | | | $ | 11.66 | |
| | | | | | | | | | | | | | | | | | | | |
Net investment income (loss) (a) | | | 0.26 | | | | 0.30 | | | | 0.33 | | | | 0.30 | | | | 0.33 | |
Net realized and unrealized gain (loss) on investments | | | (0.58 | ) | | | 0.13 | | | | 0.33 | | | | 0.28 | | | | (0.17 | ) |
| | | | | | | | | | | | | | | | | | | | |
Total from investment operations | | | (0.32 | ) | | | 0.43 | | | | 0.66 | | | | 0.58 | | | | 0.16 | |
| | | | | | | | | | | | | | | | | | | | |
Less dividends and distributions: | | | | | | | | | | | | | | | | | | | | |
From net investment income | | | (0.36 | ) | | | (0.34 | ) | | | (0.37 | ) | | | (0.34 | ) | | | (0.41 | ) |
From net realized gain on investments | | | (0.02 | ) | | | — | | | | (0.10 | ) | | | (0.18 | ) | | | (0.01 | ) |
| | | | | | | | | | | | | | | | | | | | |
Total dividends and distributions | | | (0.38 | ) | | | (0.34 | ) | | | (0.47 | ) | | | (0.52 | ) | | | (0.42 | ) |
| | | | | | | | | | | | | | | | | | | | |
Net asset value at end of year | | $ | 11.04 | | | $ | 11.74 | | | $ | 11.65 | | | $ | 11.46 | | | $ | 11.40 | |
| | | | | | | | | | | | | | | | | | | | |
Total investment return | | | (2.70 | %) | | | 3.70 | % | | | 5.71 | % | | | 5.09 | % | | | 1.36 | % |
Ratios (to average net assets)/Supplemental Data: | | | | | | | | | | | | | | | | | | | | |
Net investment income (loss) | | | 2.31 | % | | | 2.53 | % | | | 2.79 | % | | | 2.53 | % | | | 2.87 | % |
Net expenses | | | 0.79 | % | | | 0.79 | % | | | 0.80 | % | | | 0.81 | % | | | 0.81 | % |
Portfolio turnover rate (b) | | | 25 | % | | | 40 | % | | | 58 | % | | | 127 | % | | | 141 | % |
Net assets at end of year (in 000’s) | | $ | 195,153 | | | $ | 256,382 | | | $ | 234,768 | | | $ | 221,793 | | | $ | 182,700 | |
| (a) | Per share data based on average shares outstanding during the year. |
| (b) | The portfolio turnover rates not including mortgage dollar rolls were 8%, 20%, 37%, 30% and 24% for the years ended December 31, 2013, 2012, 2011, 2010 and 2009, respectively. |
| | | | | | |
The notes to the financial statements are an integral part of,
and should be read in conjunction with, the financial statements. | | mainstayinvestments.com | | | M-189 | |
MainStay VP Growth Allocation Portfolio
Investment and Performance Comparison1 (Unaudited)
Performance data quoted represents past performance. Past performance is no guarantee of future results. Because of market volatility, current performance may be lower or higher than the figures shown. Investment return and principal value will fluctuate, and as a result, when shares are redeemed, they may be worth more or less than their original cost. The performance table and graph do not reflect any deduction of sales charges, mortality and expense charges, contract charges or administrative charges. Please refer to the Performance Summary appropriate for your policy. For performance information current to the most recent month-end, please call 800-598-2019 or visit www.newyorklife.com.

Average Annual Total Returns for the Period Ended December 31, 2013
| | | | | | | | | | | | | | | | |
| Class | | One Year | | | Five Years | | | Since Inception (2/13/06) | | | Gross Expense Ratio2 | |
| Initial Class Shares | | | 30.85 | % | | | 16.72 | % | | | 6.79 | % | | | 1.18 | % |
| Service Class Shares | | | 30.53 | | | | 16.43 | | | | 6.52 | | | | 1.43 | |
| | | | | | | | | | | | |
| Benchmark Performance | | One Year | | | Five Years | | | Since Inception
(2/13/06) | |
S&P 500® Index3 | | | 32.39 | % | | | 17.94 | % | | | 7.17 | % |
MSCI EAFE® Index3 | | | 22.78 | | | | 12.44 | | | | 4.12 | |
Growth Allocation Composite Index3 | | | 30.49 | | | | 16.89 | | | | 6.62 | |
Average Lipper Variable Products Multi-Cap Core Portfolio4 | | | 28.72 | | | | 17.20 | | | | 5.57 | |
| 1. | Performance figures reflect certain fee waivers and/or expense limitations, without which total returns may have been different. For information on current fee waivers and/or expense limitations, please refer to the notes to the financial statements. |
| 2. | The gross expense ratios presented reflect the Portfolio’s “Total Annual Portfolio Operating Expenses” from the most recent Prospectus and may differ from other expense ratios disclosed in this report. |
| 3. | Please refer to pages M-2 and M-3 for additional explanations and disclosure regarding the Portfolios, their benchmark indices and other indices mentioned in the reports. |
| 4. | The Average Lipper Variable Products Multi-Cap Core Portfolio is representative of portfolios that, by portfolio practice, invest in a variety of market-capitalization ranges without concentrating 75% of their equity assets in any one market-capitalization range over an extended period of time. Multi-cap core portfolios typically have average characteristics compared to the S&P SuperComposite 1500® Index. Lipper Inc. is an independent monitor of fund performance. Results are based on total returns with all dividend and capital gain distributions reinvested. |
| | |
| M-190 | | MainStay VP Growth Allocation Portfolio |
Cost in Dollars of a $1,000 Investment in MainStay VP Growth Allocation Portfolio (Unaudited)
The example below is intended to describe the fees and expenses borne by shareholders during the six-month period from July 1, 2013, to December 31, 2013, and the impact of those costs on your investment.
Example
As a shareholder of the Portfolio, you incur two types of costs: (1) transaction costs, including exchange fees and sales charges (loads) on purchases (as applicable), and (2) ongoing costs, including management fees, distribution and/or service (12b-1) fees, and other Portfolio expenses (as applicable). This example is intended to help you understand your ongoing costs (in dollars) of investing in the Portfolio and to compare these costs with the ongoing costs of investing in other Portfolios. The example is based on an investment of $1,000 made at the beginning of the six-month period and held for the entire period from July 1, 2013, to December 31, 2013. Shares are only sold in connection with variable life and annuity contracts and the example does not reflect any contract level or transactional fees or expenses. If these costs had been included, your costs would have been higher.
This example illustrates your Portfolio’s ongoing costs in two ways:
Actual Expenses
The second and third data columns in the table below provide information about actual account values and actual expenses. You may use the information in these columns, together with the amount you invested, to estimate the expenses that you paid during the six months ended
December 31, 2013. Simply divide your account value by $1,000 (for example, an $8,600 account value divided by $1,000 = 8.6), then multiply the result by the number under the heading entitled “Expenses Paid During Period” to estimate the expenses you paid on your account during this period.
Hypothetical Example for Comparison Purposes
The fourth and fifth data columns in the table below provide information about hypothetical account values and hypothetical expenses based on the Portfolio’s actual expense ratio and an assumed rate of return of 5% per year before expenses, which is not the Portfolio’s actual return. The hypothetical account values and expenses may not be used to estimate the actual ending account balances or expenses you paid for the six-month period shown. You may use this information to compare the ongoing costs of investing in the Portfolio with the ongoing costs of investing in other Portfolios. To do so, compare this 5% hypothetical example with the 5% hypothetical examples that appear in the shareholder reports of the other Portfolios.
Please note that the expenses shown in the table are meant to highlight your ongoing costs only and do not reflect any transactional costs, such as exchange fees or sales charges (loads). Therefore, the fourth and fifth data columns of the table are useful in comparing ongoing costs only and will not help you determine the relative total costs of owning different funds. In addition, if these transactional costs were included, your costs would have been higher.
| | | | | | | | | | | | | | | | | | | | |
| | | | | | | | | | | | | | | | |
| Share Class | | Beginning
Account
Value
7/1/13 | | | Ending Account
Value (Based
on Actual
Returns and
Expenses)
12/31/13 | | | Expenses
Paid
During
Period1 | | | Ending Account
Value (Based
on Hypothetical
5% Annualized
Return and
Actual Expenses)
12/31/13 | | | Expenses
Paid
During
Period1 | |
| | | | | |
| Initial Class Shares | | $ | 1,000.00 | | | $ | 1,171.50 | | | $ | 0.22 | | | $ | 1,025.00 | | | $ | 0.20 | |
| | | | | |
| Service Class Shares | | $ | 1,000.00 | | | $ | 1,170.00 | | | $ | 1.59 | | | $ | 1,023.70 | | | $ | 1.48 | |
| 1. | Expenses are equal to the Portfolio’s annualized expense ratio of each class (0.04% for Initial Class and 0.29% for Service Class) multiplied by the average account value over the period, divided by 365 and multiplied by 184 (to reflect the six-month period). The table above represents the actual expenses incurred during the six-month period. In addition to the fees and expenses which the Portfolio bears directly, the Portfolio indirectly bears a pro rata share of the fees and expenses of the Underlying Portfolios/Funds in which it invests. Such indirect expenses are not included in the above-reported expense figures. |
| | | | |
| mainstayinvestments.com | | | M-191 | |
Investment Objectives of Underlying Portfolios/Funds as of December 31, 2013 (Unaudited)
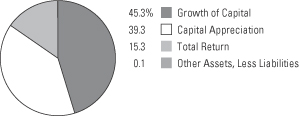
See Portfolio of Investments on page M-195 for specific holdings within these categories.
| | |
| M-192 | | MainStay VP Growth Allocation Portfolio |
Portfolio Management Discussion and Analysis (Unaudited)
Answers to the questions reflect the views of portfolio managers Jae S. Yoon, CFA, Jonathan Swaney and Poul Kristensen, CFA, of New York Life Investments,1 the Portfolio’s Manager.
How did MainStay VP Growth Allocation Portfolio perform relative to its benchmark and peers during the 12 months ended December 31, 2013?
For the 12 months ended December 31, 2013, MainStay VP Growth Allocation Portfolio returned 30.85% for Initial Class shares and 30.53% for Service Class shares. Over the same period, both share classes underperformed the 32.39% return of the S&P 500® Index,2 which is the Portfolio’s broad-based securities-market index. Over the same period, both share classes outperformed the 22.78% return of the MSCI EAFE® Index,2 which is a secondary benchmark of the Portfolio. Both share classes outperformed the 30.49% return of the Growth Allocation Composite Index2 during the reporting period. The Growth Allocation Composite Index is an additional benchmark of the Portfolio. Both share classes outper-formed the 28.72% return of the average Lipper2 Variable Products Multi-Cap Core Portfolio for the 12 months ended December 31, 2013.
What factors affected the Portfolio’s relative performance during the reporting period?
The Portfolio is a “fund of funds,” meaning that it seeks to achieve its investment objective by investing primarily in other MainStay VP Portfolios and other funds managed by New York Life Investments (the “Underlying Portfolios/Funds”). The Underlying Portfolios/Funds may invest in domestic or international stocks at various capitalization levels. The Portfolio’s primary benchmark, on the other hand, consists entirely of U.S. large-cap stocks. These differences—particularly the Portfolio’s allocations to Underlying Portfolios/Funds that invest in emerging-market equities—accounted for many of the challenges the Portfolio experienced in terms of relative performance. Emerging-market equities generally underperformed U.S. equities during the reporting period.
The Portfolio’s performance was above that of its peers and slightly above that of the Growth Allocation Composite Index. Some positive excess returns were generated through well-timed preferences for small companies over large companies. Emphasizing growth stocks over value stocks provided positive results. Any gains, however, were more than offset by overweight positions in emerging-market equities.
Although asset-class positioning added substantially to returns, performance among the Underlying Portfolios/Funds in which the Portfolio invested was mixed. Among the larger holdings that enjoyed particularly strong performance were MainStay U.S. Equity Opportunities Fund and MainStay Epoch U.S. All Cap Fund.
How did you allocate the Portfolio’s assets during the reporting period and why?
We considered a variety of information, including the portfolio-level characteristics of the Underlying Portfolios/Funds, such as capitalization, style biases and sector exposures. We also examined the attributes of the Underlying Portfolios’/Funds’ holdings, such as valuation metrics, earnings data and technical indicators. Finally, we evaluated the historical success of the managers responsible for the Underlying Portfolios/Funds. Generally speaking, we seek to invest in Underlying Portfolios/Funds that occupy attractively valued segments of the market, invest in fairly priced securities and are steered by individuals who have consistently demonstrated capable management in the past.
The Portfolio placed a mild emphasis on two themes. First, our focus shifted from securities of large-cap companies toward securities of smaller companies, which we believed would perform especially well during an uptick in global economic growth. Second, we placed an increasing emphasis on growth over value because we anticipated that the quest for yield that has marked the past couple of years would morph into a quest for growth. Both strategies were modestly profitable during the reporting period.
How did the Portfolio’s allocations change over the course of the reporting period?
The most significant change was a shift from focusing on large-cap stocks to owning more stocks of small- and mid-cap companies. This strategy was visible in a large increase in allocations to MainStay VP Eagle Small Cap Growth Portfolio, MainStay VP U.S. Mid Cap Core Portfolio and MainStay Epoch U.S. All Cap Fund. These increases were primarily funded from sales of MainStay MAP Fund, MainStay VP Large Cap Growth
Portfolio and MainStay U.S. Equity Opportunities Fund. Our shift from value to growth was seen in a
| 1. | “New York Life Investments” is a service mark used by New York Life Investment Management Holdings LLC and its subsidiary New York Life Investment Management LLC. |
| 2. | Please refer to pages M-2 and M-3 for additional explanations and disclosure regarding the Portfolios, their benchmark indices and service providers mentioned in the reports. |
| | | | |
| mainstayinvestments.com | | | M-193 | |
substantial new position in MainStay VP Cornerstone Growth Portfolio. A new position in a long/short portfolio, MainStay VP Marketfield Portfolio, was also noteworthy, as was our slight shift back into international stocks with a new position in MainStay Emerging Markets Opportunities Fund and increased exposure to MainStay ICAP International Fund.
Which Underlying Portfolios/Funds had the highest total returns during the reporting period, and which Underlying Portfolios/Funds had the lowest total returns?
Among the Underlying Portfolios/Funds in which the Portfolio invested, MainStay VP Mid Cap Core Portfolio had the highest total return in 2013, followed by MainStay U.S. Equity Opportunities Fund and MainStay VP U.S. Small Cap Portfolio. The only Underlying Equity Portfolio/Fund that generated a negative total return was MainStay VP DFA / DuPont Capital Emerging Markets Equity Portfolio. The next-lowest total returns came from MainStay VP International Equity Portfolio and MainStay VP Marketfield Portfolio.
Which Underlying Portfolios/Funds made the strongest positive contributions to the Portfolio’s overall performance, and which Underlying Portfolios/Funds were the greatest detractors?
Contributions reflect the performance of the Underlying Portfolios/Funds and the size of the positions held. Large positive contributions can therefore come from significant positions in Underlying Portfolios/Funds that do reasonably well or from smaller positions in Underlying Portfolios/Funds that do exceptionally well. During the reporting period, the Portfolio had many of its largest holdings in Underlying Portfolios/Funds that performed very well. On that list were MainStay U.S. Equity Opportunities Fund, MainStay MAP Fund and MainStay VP Large Cap Growth Portfolio. The only Underlying Portfolio/Fund with negative performance was MainStay VP DFA / DuPont Capital Emerging Markets Equity Portfolio. Other than that, weaker contributions tended to come from holdings with smaller allocations. Among these were MainStay VP ICAP Select Equity Portfolio and MainStay VP Marketfield Portfolio.
The opinions expressed are those of the portfolio managers as of the date of this report and are subject to change. There is no guarantee that any forecasts made will come to pass. This material does not constitute investment advice and is not intended as an endorsement of any specific investment.
Not all MainStay VP Portfolios and/or share classes are available under all policies.
| | |
| M-194 | | MainStay VP Growth Allocation Portfolio |
Portfolio of Investments December 31, 2013
| | | | | | | | |
| | |
Shares | | | Value | |
| Affiliated Investment Companies 99.9%† | |
Equity Funds 99.9% | |
MainStay Emerging Markets Opportunities Fund Class I | | | 278,248 | | | $ | 2,693,441 | |
MainStay Epoch Global Choice Fund Class I (a) | | | 564,046 | | | | 11,624,991 | |
MainStay Epoch U.S. All Cap Fund Class I (a) | | | 1,271,264 | | | | 35,747,948 | |
MainStay ICAP Equity Fund Class I | | | 444,813 | | | | 23,068,012 | |
MainStay ICAP International Fund Class I | | | 817,561 | | | | 29,399,481 | |
MainStay International Opportunities Fund Class I (a) | | | 2,747,670 | | | | 24,811,457 | |
MainStay MAP Fund Class I | | | 945,686 | | | | 42,385,632 | |
MainStay U.S. Equity Opportunities Fund Class I (a) | | | 3,939,765 | | | | 33,448,604 | |
MainStay VP Cornerstone Growth Portfolio Initial Class | | | 441,392 | | | | 15,092,025 | |
MainStay VP DFA / DuPont Capital Emerging Markets Equity Portfolio Initial Class | | | 483,032 | | | | 4,587,880 | |
MainStay VP Eagle Small Cap Growth Portfolio Initial Class (a) | | | 2,043,315 | | | | 26,706,944 | |
MainStay VP International Equity Portfolio Initial Class | | | 711,354 | | | | 9,825,257 | |
MainStay VP Large Cap Growth Portfolio Initial Class (a) | | | 1,785,538 | | | | 40,769,941 | |
MainStay VP Marketfield Portfolio Initial Class (a)(b) | | | 701,067 | | | | 7,818,556 | |
MainStay VP Mid Cap Core Portfolio Initial Class | | | 1,136,005 | | | | 18,381,096 | |
MainStay VP S&P 500 Index Portfolio Initial Class | | | 220,998 | | | | 8,306,041 | |
| | | | | | | | |
| | |
Shares | | | Value | |
Equity Funds (continued) | |
MainStay VP T. Rowe Price Equity Income Portfolio Initial Class (a) | | | 2,451,026 | | | $ | 33,758,264 | |
MainStay VP U.S. Small Cap Portfolio Initial Class (a) | | | 1,879,617 | | | | 25,900,495 | |
MainStay VP Van Eck Global Hard Assets Portfolio Initial Class | | | 9,152 | | | | 91,218 | |
| | | | | | | | |
Total Equity Funds
(Cost $331,778,366) | | | | | | | 394,417,283 | |
| | | | | | | | |
Total Investments
(Cost $331,778,366) (c) | | | 99.9 | % | | | 394,417,283 | |
Other Assets, Less Liabilities | | | 0.1 | | | | 313,908 | |
Net Assets | | | 100.0 | % | | $ | 394,731,191 | |
| † | Percentages indicated are based on Portfolio net assets. |
| (a) | The Portfolio’s ownership exceeds 5% of the outstanding shares of the Underlying Portfolio’s/Fund’s share class. (See Note 3) |
| (b) | Non-income producing Underlying Portfolio/Fund. |
| (c) | As of December 31, 2013, cost is $334,351,864 for federal income tax purposes and net unrealized appreciation is as follows: |
| | | | |
Gross unrealized appreciation | | $ | 60,163,574 | |
Gross unrealized depreciation | | | (98,155 | ) |
| | | | |
Net unrealized appreciation | | $ | 60,065,419 | |
| | | | |
The following is a summary of the fair valuations according to the inputs used as of December 31, 2013, for valuing the Portfolio’s assets.
Asset Valuation Inputs
| | | | | | | | | | | | | | | | |
Description | | Quoted Prices
in Active Markets
for Identical Assets (Level 1) | | | Significant Other
Observable Inputs (Level 2) | | | Significant
Unobservable
Inputs (Level 3) | | | Total | |
| Investments (a) | | | | | | | | | | | | | | | | |
| Affiliated Investment Companies | | | | | | | | | | | | | | | | |
Equity Funds | | $ | 394,417,283 | | | $ | — | | | $ | — | | | $ | 394,417,283 | |
| | | | | | | | | | | | | | | | |
| Total Investments | | $ | 394,417,283 | | | $ | — | | | $ | — | | | $ | 394,417,283 | |
| | | | | | | | | | | | | | | | |
| (a) | For a complete listing of investments, see the Portfolio of Investments. |
The Portfolio recognizes transfers between the levels as of the beginning of the period.
For the year ended December 31, 2013, the Portfolio did not have any transfers between Level 1 and Level 2 fair value measurements. (See Note 2)
As of December 31, 2013, the Portfolio did not hold any investments with significant unobservable inputs (Level 3). (See Note 2)
| | | | | | |
The notes to the financial statements are an integral part of,
and should be read in conjunction with, the financial statements. | | mainstayinvestments.com | | | M-195 | |
Statement of Assets and Liabilities as of December 31, 2013
| | | | |
| Assets | |
Investment in affiliated investment companies, at value (identified cost $331,778,366) | | $ | 394,417,283 | |
Cash | | | 338,496 | |
Receivables: | | | | |
Fund shares sold | | | 641,745 | |
| | | | |
Total assets | | | 395,397,524 | |
| | | | |
| |
| Liabilities | | | | |
Payables: | | | | |
Investment securities purchased | | | 338,496 | |
Fund shares redeemed | | | 211,426 | |
NYLIFE Distributors (See Note 3) | | | 71,548 | |
Professional fees | | | 21,826 | |
Shareholder communication | | | 18,859 | |
Custodian | | | 1,015 | |
Trustees | | | 348 | |
Accrued expenses | | | 2,815 | |
| | | | |
Total liabilities | | | 666,333 | |
| | | | |
Net assets | | $ | 394,731,191 | |
| | | | |
| |
| Net Assets Consist of | | | | |
Shares of beneficial interest outstanding (par value of $.001 per share) unlimited number of shares authorized | | $ | 31,678 | |
Additional paid-in capital | | | 333,987,028 | |
| | | | |
| | | 334,018,706 | |
Undistributed net investment income | | | 6,183,954 | |
Accumulated net realized gain (loss) on investments | | | (8,110,386 | ) |
Net unrealized appreciation (depreciation) on investments | | | 62,638,917 | |
| | | | |
Net assets | | $ | 394,731,191 | |
| | | | |
| | | | |
Initial Class | | | | |
Net assets applicable to outstanding shares | | $ | 43,168,663 | |
| | | | |
Shares of beneficial interest outstanding | | | 3,450,564 | |
| | | | |
Net asset value per share outstanding | | $ | 12.51 | |
| | | | |
Service Class | | | | |
Net assets applicable to outstanding shares | | $ | 351,562,528 | |
| | | | |
Shares of beneficial interest outstanding | | | 28,227,485 | |
| | | | |
Net asset value per share outstanding | | $ | 12.45 | |
| | | | |
| | | | |
| M-196 | | MainStay VP Growth Allocation Portfolio | | The notes to the financial statements are an integral part of,
and should be read in conjunction with, the financial statements. |
Statement of Operations for the year ended December 31, 2013
| | | | |
| Investment Income (Loss) | |
Income | | | | |
Dividend distributions from affiliated investment companies | | $ | 3,276,185 | |
| | | | |
Expenses | | | | |
Distribution and service—Service Class (See Note 3) | | | 689,867 | |
Shareholder communication | | | 49,683 | |
Professional fees | | | 38,791 | |
Trustees | | | 6,138 | |
Custodian | | | 5,101 | |
Miscellaneous | | | 10,638 | |
| | | | |
Total expenses | | | 800,218 | |
| | | | |
Net investment income (loss) | | | 2,475,967 | |
| | | | |
|
| Realized and Unrealized Gain (Loss) on Investments | |
Net realized gain (loss) on: | | | | |
Affiliated investment company transactions | | | 24,288,142 | |
Realized capital gain distributions from affiliated investment companies | | | 12,310,167 | |
| | | | |
Net realized gain (loss) on investments from affiliated investment companies | | | 36,598,309 | |
| | | | |
Net change in unrealized appreciation (depreciation) on investments | | | 44,246,800 | |
| | | | |
Net realized and unrealized gain (loss) on investments | | | 80,845,109 | |
| | | | |
Net increase (decrease) in net assets resulting from operations | | $ | 83,321,076 | |
| | | | |
| | | | | | |
The notes to the financial statements are an integral part of,
and should be read in conjunction with, the financial statements. | | mainstayinvestments.com | | | M-197 | |
Statements of Changes in Net Assets
for the years ended December 31, 2013 and December 31, 2012
| | | | | | | | |
| | | 2013 | | | 2012 | |
| Increase (Decrease) in Net Assets | |
Operations: | | | | | | | | |
Net investment income (loss) | | $ | 2,475,967 | | | $ | 1,733,209 | |
Net realized gain (loss) on investments from affiliated investment companies transactions | | | 36,598,309 | | | | 17,084,177 | |
Net change in unrealized appreciation (depreciation) on investments | | | 44,246,800 | | | | 16,837,613 | |
| | | | |
Net increase (decrease) in net assets resulting from operations | | | 83,321,076 | | | | 35,654,999 | |
| | | | |
Dividends and distributions to shareholders: | | | | | | | | |
From net investment income: | | | | | | | | |
Initial Class | | | (382,274 | ) | | | (302,698 | ) |
Service Class | | | (2,311,559 | ) | | | (1,757,645 | ) |
| | | | |
| | | (2,693,833 | ) | | | (2,060,343 | ) |
| | | | |
From net realized gain on investments: | | | | | | | | |
Initial Class | | | (1,782,808 | ) | | | (1,975,695 | ) |
Service Class | | | (13,401,888 | ) | | | (15,116,478 | ) |
| | | | |
| | | (15,184,696 | ) | | | (17,092,173 | ) |
| | | | |
Total dividends and distributions to shareholders | | | (17,878,529 | ) | | | (19,152,516 | ) |
| | | | |
Capital share transactions: | | | | | | | | |
Net proceeds from sale of shares | | | 81,187,858 | | | | 20,771,399 | |
Net asset value of shares issued to shareholders in reinvestment of dividends and distributions | | | 17,878,529 | | | | 19,152,516 | |
Cost of shares redeemed | | | (29,618,004 | ) | | | (34,574,866 | ) |
| | | | |
Increase (decrease) in net assets derived from capital share transactions | | | 69,448,383 | | | | 5,349,049 | |
| | | | |
Net increase (decrease) in net assets | | | 134,890,930 | | | | 21,851,532 | |
|
| Net Assets | |
Beginning of year | | | 259,840,261 | | | | 237,988,729 | |
| | | | |
End of year | | $ | 394,731,191 | | | $ | 259,840,261 | |
| | | | |
Undistributed net investment income at end of year | | $ | 6,183,954 | | | $ | 2,693,832 | |
| | | | |
| | | | |
| M-198 | | MainStay VP Growth Allocation Portfolio | | The notes to the financial statements are an integral part of,
and should be read in conjunction with, the financial statements. |
Financial Highlights selected per share data and ratios
| | | | | | | | | | | | | | | | | | | | |
| | | Initial Class | |
| | | Year ended December 31, | |
| | | 2013 | | | 2012 | | | 2011 | | | 2010 | | | 2009 | |
Net asset value at beginning of year | | $ | 10.11 | | | $ | 9.47 | | | $ | 9.83 | | | $ | 8.64 | | | $ | 7.02 | |
| | | | | | | | | | | | | | | | | | | | |
Net investment income (loss) | | | 0.10 | | | | 0.10 | | | | 0.10 | | | | 0.09 | (a) | | | 0.12 | (a) |
Net realized and unrealized gain (loss) on investments | | | 2.97 | | | | 1.35 | | | | (0.37 | ) | | | 1.20 | | | | 1.83 | |
| | | | | �� | | | | | | | | | | | | | | | |
Total from investment operations | | | 3.07 | | | | 1.45 | | | | (0.27 | ) | | | 1.29 | | | | 1.95 | |
| | | | | | | | | | | | | | | | | | | | |
Less dividends and distributions: | | | | | | | | | | | | | | | | | | | | |
From net investment income | | | (0.12 | ) | | | (0.11 | ) | | | (0.09 | ) | | | (0.10 | ) | | | (0.18 | ) |
From net realized gain on investments | | | (0.55 | ) | | | (0.70 | ) | | | — | | | | — | | | | (0.15 | ) |
| | | | | | | | | | | | | | | | | | | | |
Total dividends and distributions | | | (0.67 | ) | | | (0.81 | ) | | | (0.09 | ) | | | (0.10 | ) | | | (0.33 | ) |
| | | | | | | | | | | | | | | | | | | | |
Net asset value at end of year | | $ | 12.51 | | | $ | 10.11 | | | $ | 9.47 | | | $ | 9.83 | | | $ | 8.64 | |
| | | | | | | | | | | | | | | | | | | | |
Total investment return | | | 30.85 | % | | | 15.47 | % | | | (2.65 | %) | | | 15.03 | % | | | 28.04 | % |
Ratios (to average net assets)/Supplemental Data: | | | | | | | | | | | | | | | | | | | | |
Net investment income (loss) | | | 0.98 | % | | | 0.92 | % | | | 0.99 | % | | | 1.03 | % | | | 1.56 | % |
Net expenses (b) | | | 0.04 | % | | | 0.04 | % | | | 0.05 | % | | | 0.06 | % | | | 0.06 | % |
Portfolio turnover rate | | | 41 | % | | | 42 | % | | | 54 | % | | | 48 | % | | | 47 | % |
Net assets at end of year (in 000’s) | | $ | 43,169 | | | $ | 31,447 | | | $ | 27,003 | | | $ | 30,384 | | | $ | 24,774 | |
| (a) | Per share data based on average shares outstanding during the year. |
| (b) | In addition to the fees and expenses which the Portfolio bears directly, the Portfolio indirectly bears a pro-rata share of the fees and expenses of the Underlying Portfolios/Funds in which it invests. Such indirect expenses are not included in the above expense ratios. |
| | | | | | | | | | | | | | | | | | | | |
| | | Service Class | |
| | | Year ended December 31, | |
| | | 2013 | | | 2012 | | | 2011 | | | 2010 | | | 2009 | |
Net asset value at beginning of year | | $ | 10.08 | | | $ | 9.44 | | | $ | 9.80 | | | $ | 8.62 | | | $ | 7.00 | |
| | | | | | | | | | | | | | | | | | | | |
Net investment income (loss) | | | 0.06 | | | | 0.06 | | | | 0.08 | | | | 0.07 | (a) | | | 0.10 | (a) |
Net realized and unrealized gain (loss) on investments | | | 2.95 | | | | 1.36 | | | | (0.37 | ) | | | 1.20 | | | | 1.83 | |
| | | | | | | | | | | | | | | | | | | | |
Total from investment operations | | | 3.01 | | | | 1.42 | | | | (0.29 | ) | | | 1.27 | | | | 1.93 | |
| | | | | | | | | | | | | | | | | | | | |
Less dividends and distributions: | | | | | | | | | | | | | | | | | | | | |
From net investment income | | | (0.09 | ) | | | (0.08 | ) | | | (0.07 | ) | | | (0.09 | ) | | | (0.16 | ) |
From net realized gain on investments | | | (0.55 | ) | | | (0.70 | ) | | | — | | | | — | | | | (0.15 | ) |
| | | | | | | | | | | | | | | | | | | | |
Total dividends and distributions | | | (0.64 | ) | | | (0.78 | ) | | | (0.07 | ) | | | (0.09 | ) | | | (0.31 | ) |
| | | | | | | | | | | | | | | | | | | | |
Net asset value at end of year | | $ | 12.45 | | | $ | 10.08 | | | $ | 9.44 | | | $ | 9.80 | | | $ | 8.62 | |
| | | | | | | | | | | | | | | | | | | | |
Total investment return | | | 30.53 | % | | | 15.18 | % | | | (2.89 | %) | | | 14.75 | % | | | 27.72 | % |
Ratios (to average net assets)/Supplemental Data: | | | | | | | | | | | | | | | | | | | | |
Net investment income (loss) | | | 0.76 | % | | | 0.65 | % | | | 0.78 | % | | | 0.77 | % | | | 1.29 | % |
Net expenses (b) | | | 0.29 | % | | | 0.29 | % | | | 0.30 | % | | | 0.31 | % | | | 0.31 | % |
Portfolio turnover rate | | | 41 | % | | | 42 | % | | | 54 | % | | | 48 | % | | | 47 | % |
Net assets at end of year (in 000’s) | | $ | 351,563 | | | $ | 228,393 | | | $ | 210,986 | | | $ | 222,409 | | | $ | 186,844 | |
| (a) | Per share data based on average shares outstanding during the year. |
| (b) | In addition to the fees and expenses which the Portfolio bears directly, the Portfolio indirectly bears a pro-rata share of the fees and expenses of the Underlying Portfolios/Funds in which it invests. Such indirect expenses are not included in the above expense ratios. |
| | | | | | |
The notes to the financial statements are an integral part of,
and should be read in conjunction with, the financial statements. | | mainstayinvestments.com | | | M-199 | |
MainStay VP High Yield Corporate Bond Portfolio
Investment and Performance Comparison (Unaudited)
Performance data quoted represents past performance. Past performance is no guarantee of future results. Because of market volatility, current performance may be lower or higher than the figures shown. Investment return and principal value will fluctuate, and as a result, when shares are redeemed, they may be worth more or less than their original cost. The performance table and graph do not reflect any deduction of sales charges, mortality and expense charges, contract charges or administrative charges. Please refer to the Performance Summary appropriate for your policy. For performance information current to the most recent month-end, please call 800-598-2019 or visit www.newyorklife.com.
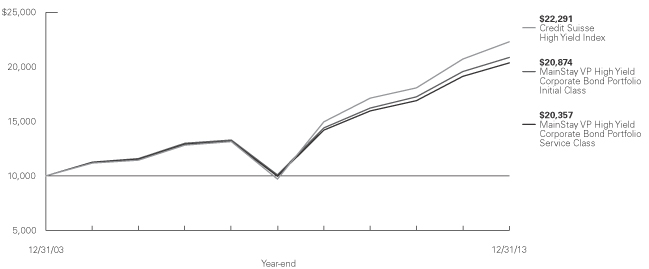
Average Annual Total Returns for the Year Ended December 31, 2013
| | | | | | | | | | | | | | | | |
| Class | | One Year | | | Five Years | | | Ten Years1 | | | Gross Expense Ratio2 | |
| Initial Class Shares | | | 6.63 | % | | | 15.64 | % | | | 7.64 | % | | | 0.59 | % |
| Service Class Shares | | | 6.36 | | | | 15.35 | | | | 7.37 | | | | 0.84 | |
| | | | | | | | | | | | |
| Benchmark Performance | | One
Year | | | Five
Years | | | Ten Years | |
Credit Suisse High Yield Index3 | | | 7.53 | % | | | 18.08 | % | | | 8.35 | % |
Average Lipper Variable Products High Yield Portfolio4 | | | 6.51 | | | | 15.81 | | | | 7.36 | |
| 1. | Performance figures shown for the ten-year period ended December 31, 2013 reflect nonrecurring reimbursements from affiliates for printing and mailing costs. If these nonrecurring reimbursements had not been made, the total returns would have been 7.63% for Initial Class shares and 7.36% for Service Class shares for the ten-year period. |
| 2. | The gross expense ratios presented reflect the Portfolio’s “Total Annual Portfolio Operating Expenses” from the most recent Prospectus and may differ from other expense ratios disclosed in this report. |
| 3. | Please refer to pages M-2 and M-3 for additional explanations and disclosure regarding the Portfolios, their benchmark indices and other indices mentioned in the reports. |
| 4. | The Average Lipper Variable Products High Yield Portfolio is representative of portfolios that aim at high (relative) current yield from fixed-income securities, have no quality or maturity restrictions, and tend to invest in lower-grade debt issues. Lipper Inc. is an independent monitor of fund performance. Results are based on total returns with all dividend and capital gain distributions reinvested. |
| | |
| M-200 | | MainStay VP High Yield Corporate Bond Portfolio |
Cost in Dollars of a $1,000 Investment in MainStay VP High Yield Corporate Bond Portfolio (Unaudited)
The example below is intended to describe the fees and expenses borne by shareholders during the six-month period from July 1, 2013, to December 31, 2013, and the impact of those costs on your investment.
Example
As a shareholder of the Portfolio, you incur two types of costs: (1) transaction costs, including exchange fees and sales charges (loads) on purchases (as applicable), and (2) ongoing costs, including management fees, distribution and/or service (12b-1) fees, and other Portfolio expenses (as applicable). This example is intended to help you understand your ongoing costs (in dollars) of investing in the Portfolio and to compare these costs with the ongoing costs of investing in other Portfolios. The example is based on an investment of $1,000 made at the beginning of the six-month period and held for the entire period from July 1, 2013, to December 31, 2013. Shares are only sold in connection with variable life and annuity contracts and the example does not reflect any contract level or transactional fees or expenses. If these costs had been included, your costs would have been higher.
This example illustrates your Portfolio’s ongoing costs in two ways:
Actual Expenses
The second and third data columns in the table below provide information about actual account values and actual expenses. You may use the information in these columns, together with the amount you invested, to estimate the expenses that you paid during the six months ended
December 31, 2013. Simply divide your account value by $1,000 (for example, an $8,600 account value divided by $1,000 = 8.6), then multiply the result by the number under the heading entitled “Expenses Paid During Period” to estimate the expenses you paid on your account during this period.
Hypothetical Example for Comparison Purposes
The fourth and fifth data columns in the table below provide information about hypothetical account values and hypothetical expenses based on the Portfolio’s actual expense ratio and an assumed rate of return of 5% per year before expenses, which is not the Portfolio’s actual return. The hypothetical account values and expenses may not be used to estimate the actual ending account balances or expenses you paid for the six-month period shown. You may use this information to compare the ongoing costs of investing in the Portfolio with the ongoing costs of investing in other Portfolios. To do so, compare this 5% hypothetical example with the 5% hypothetical examples that appear in the shareholder reports of the other Portfolios.
Please note that the expenses shown in the table are meant to highlight your ongoing costs only and do not reflect any transactional costs, such as exchange fees or sales charges (loads). Therefore, the fourth and fifth data columns of the table are useful in comparing ongoing costs only and will not help you determine the relative total costs of owning different funds. In addition, if these transactional costs were included, your costs would have been higher.
| | | | | | | | | | | | | | | | | | | | |
| | | | | | | | | | | | | | | | |
| Share Class | | Beginning
Account
Value
7/1/13 | | | Ending Account
Value (Based
on Actual
Returns and
Expenses)
12/31/13 | | | Expenses
Paid
During
Period1 | | | Ending Account
Value (Based
on Hypothetical
5% Annualized
Return and
Actual Expenses)
12/31/13 | | | Expenses
Paid
During
Period1 | |
| | | | | |
| Initial Class Shares | | $ | 1,000.00 | | | $ | 1,049.20 | | | $ | 3.05 | | | $ | 1,022.20 | | | $ | 3.01 | |
| | | | | |
| Service Class Shares | | $ | 1,000.00 | | | $ | 1,047.90 | | | $ | 4.34 | | | $ | 1,021.00 | | | $ | 4.28 | |
| 1. | Expenses are equal to the Portfolio’s annualized expense ratio of each class (0.59% for Initial Class and 0.84% for Service Class) multiplied by the average account value over the period, divided by 365 and multiplied by 184 (to reflect the six-month period). The table above represents the actual expenses incurred during the six-month period. |
| | | | |
| mainstayinvestments.com | | | M-201 | |
Portfolio Composition as of December 31, 2013 (Unaudited)
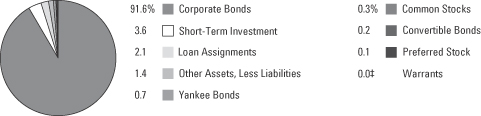
See Portfolio of Investments beginning on page M-205 for specific holdings within these categories.
| ‡ | Less than one-tenth of a percent. |
Top Ten Holdings or Issuers Held as of December 31, 2013 (excluding short-term investment) (Unaudited)
| 1. | Schaeffler Finance B.V., 4.75%–8.50%, due 2/15/17–5/15/21 |
| 2. | Texas Industries, Inc., 9.25%, due 8/15/20 |
| 3. | GenOn Energy, Inc., 7.875%–9.50%, due 6/15/17–10/15/18 |
| 4. | T-Mobile USA, Inc., 6.125%–6.731%, due 4/28/19–1/15/24 |
| 5. | Ally Financial, Inc. (zero coupon)–8.30%, due 2/12/15–11/1/31 |
| 6. | Nationstar Mortgage LLC / Nationstar Capital Corp., 6.50%–10.875%, due 4/1/15–7/1/21 |
| 7. | Seagate HDD Cayman, 4.75%–7.00%, due 11/1/21–6/1/23 |
| 8. | Algeco Scotsman Global Finance PLC, 8.50%–10.75%, due 10/15/18–10/15/19 |
| 9. | Intelsat Jackson Holdings S.A., 5.50%–7.50%, due 4/1/19–8/1/23 |
| 10. | Sprint Capital Corp., 6.875%–6.90%, due 5/1/19–11/15/28 |
| | |
| M-202 | | MainStay VP High Yield Corporate Bond Portfolio |
Portfolio Management Discussion and Analysis (Unaudited)
Answers to the questions reflect the views of J. Matthew Philo, CFA, and Andrew Susser of MacKay Shields LLC, the Portfolio’s Subadvisor.
How did MainStay VP High Yield Corporate Bond Portfolio perform relative to its benchmark and peers during the reporting period?
For the 12 months ended December 31, 2013, MainStay VP High Yield Corporate Bond Portfolio returned 6.63% for Initial Class shares and 6.36% for Service Class shares. Over the same period, both share classes underperformed the 7.53% return of the Credit Suisse High Yield Index,1 which is the Portfolio’s broad-based securities-market index. Initial Class shares outperformed—and Service Class shares underperformed—the 6.51% return of the average Lipper1 Variable Products High Yield Portfolio during the 12 months ended December 31, 2013.
What factors affected the Portfolio’s relative performance during the reporting period?
The Portfolio is managed in a bottom-up investment style, which focuses on individual companies and seeks to maximize risk-adjusted returns. The Portfolio remained conservatively positioned during the reporting period because of the attractive valuations (as measured by spreads) and the resiliency of the credit profiles in the higher-quality portion of the high-yield corporate bond market. In our opinion, valuations in the riskier segment of the high-yield market were generally unattractive. We believed this segment of the market carried unnecessary risks because of weak credit profiles and a potentially challenging outlook for corporate earnings.
Although we stand by our assessment, the Portfolio’s underweight position in credit risk relative to the broad high-yield bond market detracted from relative performance during the reporting period as CCC-rated2 credits significantly outperformed the rest of the market.
What specific factors, risks or market forces prompted significant decisions for the Portfolio during the reporting period?
Because the Portfolio is managed in a bottom-up investment style, the factors that prompt significant decisions are specific to each individual company. As previously noted, however, we believed that valuations and credit profiles among higher-quality high-yield
bonds were attractive, and we remained positioned more conservatively. In our opinion, valuations for credits in the CCC segment of the market were unattractive, and their weaker credit profiles made them vulnerable to higher default rates.
During the reporting period, which market segments were the strongest positive contributors to the Portfolio’s performance and which market segments were particularly weak?
During the reporting period, the Portfolio’s investments in the energy, financials and transportation industries made the strongest positive contributions to absolute performance. (Contributions take weightings and total returns into account.) While no industries generated negative absolute returns, the Portfolio’s investments in the metal & minerals, aerospace and retail industries contributed the least to absolute performance.
Did the Portfolio make any significant purchases or sales during the reporting period?
The Portfolio initiated a position in the bonds of T-Mobile U.S., a telecommunications company owned 74% by Deutsche Telekom. T-Mobile provides low debt with strong asset coverage. We also initiated a position in Carlson Wagonlit. The company is a leading global commercial travel agency with its controlling interests owned by a global bank and a global hospitality and travel company.
We sold the Portfolio’s position in Brazilian oil and gas company OGX Petróleo e Gás Participações after losing confidence in the company’s asset value. The company has had very disappointing production and cost performance. We also sold the Portfolio’s position in department store J.C. Penney. The bonds of gaming company Station Casinos were called.
How did the Portfolio’s sector weightings change during the reporting period?
During the reporting period, there were no material changes to the industry weightings in the Portfolio. There was a small increase in the Portfolio’s exposure to the housing and communications industries because of attractive valuations and yields. The
| 1. | Please refer to pages M-2 and M-3 for additional explanations and disclosure regarding the Portfolios, their benchmark indices and service providers mentioned in the reports. |
| 2. | An obligation rated ‘CCC’ by Standard & Poors (“S&P”) is deemed by S&P to be currently vulnerable to nonpayment and is dependent upon favorable business, financial and economic conditions for the obligor to meet its financial commitment on the obligation. It is the opinion of S&P that in the event of adverse business, financial or economic conditions, the obligor is not likely to have the capacity to meet its financial commitment on the obligation. When applied to Portfolio holdings, ratings are based solely on the creditworthiness of the bonds in the Portfolio and are not meant to represent the security or safety of the Portfolio. |
| | | | |
| mainstayinvestments.com | | | M-203 | |
Portfolio reduced its exposure to the energy and health care industries.
How was the Portfolio positioned at the end of the reporting period?
As of December 31, 2013, the Portfolio held overweight positions relative to the Credit Suisse High Yield Index in transportation, financials and housing. As of the same date, the Portfolio held underweight positions relative to the Index in media, retail and energy.
The opinions expressed are those of the portfolio managers as of the date of this report and are subject to change. There is no guarantee that any forecasts will come to pass. This material does not constitute investment advice and is not intended as an endorsement of any specific investment.
Not all MainStay VP Portfolios and/or share classes are available under all policies.
| | |
| M-204 | | MainStay VP High Yield Corporate Bond Portfolio |
Portfolio of Investments December 31, 2013
| | | | | | | | |
| | | Principal
Amount | | | Value | |
Long-Term Bonds 94.6%† Convertible Bonds 0.2% | |
Electric 0.1% | |
Somerset Cayuga Holding Co., Inc.
20.00%, due 6/15/17 (a)(b)(c)(d)(e) | | $ | 1,720,708 | | | $ | 2,529,441 | |
| | | | | | | | |
|
Internet 0.0%‡ | |
At Home Corp.
0.525%, due 12/28/18 (c)(d)(e)(f) | | | 1,869,975 | | | | 187 | |
4.75%, due 12/15/49 (c)(d)(e)(f) | | | 9,032,054 | | | | 903 | |
| | | | | | | | |
| | | | | | | 1,090 | |
| | | | | | | | |
Investment Management/Advisory Services 0.1% | |
Janus Capital Group, Inc.
3.25%, due 7/15/14 | | | 3,039,000 | | | | 3,160,560 | |
| | | | | | | | |
Total Convertible Bonds
(Cost $4,829,252) | | | | | | | 5,691,091 | |
| | | | | | | | |
|
| Corporate Bonds 91.6% | |
Advertising 0.2% | |
Lamar Media Corp.
5.875%, due 2/1/22 | | | 1,525,000 | | | | 1,563,125 | |
7.875%, due 4/15/18 | | | 3,775,000 | | | | 3,987,344 | |
| | | | | | | | |
| | | | | | | 5,550,469 | |
| | | | | | | | |
Aerospace & Defense 1.7% | |
AAR Corp.
7.25%, due 1/15/22 (a) | | | 4,270,000 | | | | 4,568,900 | |
7.25%, due 1/15/22 | | | 4,490,000 | | | | 4,804,300 | |
Alliant Techsystems, Inc.
6.875%, due 9/15/20 | | | 3,480,000 | | | | 3,754,050 | |
B/E Aerospace, Inc.
5.25%, due 4/1/22 | | | 7,665,000 | | | | 7,779,975 | |
DAE Aviation Holdings, Inc.
11.25%, due 8/1/15 (a) | | | 4,491,000 | | | | 4,502,228 | |
GenCorp, Inc.
7.125%, due 3/15/21 | | | 7,710,000 | | | | 8,249,700 | |
TransDigm, Inc.
5.50%, due 10/15/20 | | | 4,420,000 | | | | 4,320,550 | |
7.75%, due 12/15/18 | | | 7,635,000 | | | | 8,188,537 | |
| | | | | | | | |
| | | | | | | 46,168,240 | |
| | | | | | | | |
Agriculture 0.2% | |
American Rock Salt Co. LLC / American Rock Capital Corp.
8.25%, due 5/1/18 (a) | | | 4,505,000 | | | | 4,538,787 | |
| | | | | | | | |
| | | | | | | | |
| | | Principal
Amount | | | Value | |
Apparel 0.4% | |
William Carter Co. (The)
5.25%, due 8/15/21 (a) | | $ | 5,380,000 | | | $ | 5,460,700 | |
Wolverine World Wide, Inc.
6.125%, due 10/15/20 | | | 4,800,000 | | | | 5,136,000 | |
| | | | | | | | |
| | | | | | | 10,596,700 | |
| | | | | | | | |
Auto Manufacturers 0.8% | |
Allied Specialty Vehicles, Inc.
8.50%, due 11/1/19 (a) | | | 8,250,000 | | | | 8,435,625 | |
Jaguar Land Rover Automotive PLC | | | | | | | | |
4.125%, due 12/15/18 (a) | | | 4,595,000 | | | | 4,623,719 | |
5.625%, due 2/1/23 (a) | | | 1,285,000 | | | | 1,285,000 | |
8.125%, due 5/15/21 (a) | | | 4,095,000 | | | | 4,658,062 | |
Oshkosh Corp. | | | | | | | | |
8.25%, due 3/1/17 | | | 2,810,000 | | | | 2,954,069 | |
8.50%, due 3/1/20 | | | 905,000 | | | | 1,000,025 | |
| | | | | | | | |
| | | | | | | 22,956,500 | |
| | | | | | | | |
Auto Parts & Equipment 4.7% | |
Allison Transmission, Inc.
7.125%, due 5/15/19 (a) | | | 9,182,000 | | | | 9,893,605 | |
Chassix, Inc.
9.25%, due 8/1/18 (a) | | | 5,290,000 | | | | 5,633,850 | |
Cooper-Standard Automotive, Inc.
8.50%, due 5/1/18 | | | 12,945,000 | | | | 13,721,700 | |
Cooper-Standard Holding, Inc.
7.375%, due 4/1/18 (a)(b) | | | 5,210,000 | | | | 5,236,050 | |
Dana Holding Corp.
6.75%, due 2/15/21 | | | 5,519,000 | | | | 5,932,925 | |
Delphi Corp.
5.875%, due 5/15/19 | | | 7,825,000 | | | | 8,274,937 | |
Exide Technologies
8.625%, due 2/1/18 (f) | | | 20,190,000 | | | | 14,435,850 | |
International Automotive Components Group S.A.
9.125%, due 6/1/18 (a) | | | 4,775,000 | | | | 4,977,937 | |
¨Schaeffler Finance B.V. | | | | | | | | |
4.75%, due 5/15/21 (a) | | | 15,280,000 | | | | 15,241,800 | |
7.75%, due 2/15/17 (a) | | | 11,219,000 | | | | 12,733,565 | |
8.50%, due 2/15/19 (a) | | | 6,560,000 | | | | 7,380,000 | |
Schaeffler Holding Finance B.V.
6.875%, due 8/15/18 (a)(b) | | | 11,405,000 | | | | 12,089,300 | |
Tenneco, Inc. | | | | | | | | |
6.875%, due 12/15/20 | | | 1,870,000 | | | | 2,042,975 | |
7.75%, due 8/15/18 | | | 3,395,000 | | | | 3,632,650 | |
Titan International, Inc.
6.875%, due 10/1/20 (a) | | | 2,805,000 | | | | 2,924,213 | |
| † | Percentages indicated are based on Portfolio net assets. |
| ¨ | | Among the Portfolio’s 10 largest holdings or issuers held, as of December 31, 2013, excluding short-term investment. May be subject to change daily. |
| | | | | | |
The notes to the financial statements are an integral part of,
and should be read in conjunction with, the financial statements. | | mainstayinvestments.com | | | M-205 | |
Portfolio of Investments December 31, 2013 (continued)
| | | | | | | | |
| | | Principal
Amount | | | Value | |
| Corporate Bonds (continued) | |
Auto Parts & Equipment (continued) | |
TRW Automotive, Inc. | | | | | | | | |
4.50%, due 3/1/21 (a) | | $ | 2,955,000 | | | $ | 2,984,550 | |
7.25%, due 3/15/17 (a) | | | 2,835,000 | | | | 3,253,163 | |
| | | | | | | | |
| | | | | | | 130,389,070 | |
| | | | | | | | |
Banks 1.4% | |
¨Ally Financial, Inc. | | | | | | | | |
(zero coupon), due 6/15/15 | | | 490,000 | | | | 470,400 | |
5.50%, due 2/15/17 | | | 780,000 | | | | 844,350 | |
6.25%, due 12/1/17 | | | 3,355,000 | | | | 3,740,825 | |
7.50%, due 9/15/20 | | | 7,047,000 | | | | 8,209,755 | |
8.00%, due 11/1/31 | | | 6,505,000 | | | | 7,740,950 | |
8.30%, due 2/12/15 | | | 6,305,000 | | | | 6,777,875 | |
Provident Funding Associates, L.P. | | | | | | | | |
6.75%, due 6/15/21 (a) | | | 6,965,000 | | | | 6,930,175 | |
10.125%, due 2/15/19 (a) | | | 2,450,000 | | | | 2,670,500 | |
| | | | | | | | |
| | | | | | | 37,384,830 | |
| | | | | | | | |
Beverages 0.4% | |
Constellation Brands, Inc. | | | | | | | | |
4.25%, due 5/1/23 | | | 3,565,000 | | | | 3,324,362 | |
8.375%, due 12/15/14 | | | 1,620,000 | | | | 1,725,300 | |
Cott Beverages, Inc. | | | | | | | | |
8.125%, due 9/1/18 | | | 4,290,000 | | | | 4,633,200 | |
8.375%, due 11/15/17 | | | 681,000 | | | | 709,943 | |
| | | | | | | | |
| | | | | | | 10,392,805 | |
| | | | | | | | |
Building Materials 3.5% | |
Boise Cascade Co.
6.375%, due 11/1/20 | | | 6,000,000 | | | | 6,315,000 | |
Building Materials Corp. of America | | | | | | | | |
6.75%, due 5/1/21 (a) | | | 2,110,000 | | | | 2,284,075 | |
6.875%, due 8/15/18 (a) | | | 3,705,000 | | | | 3,936,562 | |
7.00%, due 2/15/20 (a) | | | 3,060,000 | | | | 3,289,500 | |
7.50%, due 3/15/20 (a) | | | 5,640,000 | | | | 6,091,200 | |
Gibraltar Industries, Inc.
6.25%, due 2/1/21 | | | 2,585,000 | | | | 2,656,088 | |
Griffon Corp.
7.125%, due 4/1/18 | | | 4,755,000 | | | | 5,040,300 | |
Headwaters, Inc. | | | | | | | | |
7.25%, due 1/15/19 (a) | | | 5,420,000 | | | | 5,569,050 | |
7.625%, due 4/1/19 | | | 7,457,000 | | | | 8,034,917 | |
Jeld-Wen, Inc.
12.25%, due 10/15/17 (a) | | | 6,860,000 | | | | 7,786,100 | |
¨Texas Industries, Inc.
9.25%, due 8/15/20 | | | 31,130,000 | | | | 34,671,037 | |
USG Corp. | | | | | | | | |
6.30%, due 11/15/16 | | | 3,460,000 | | | | 3,710,850 | |
7.875%, due 3/30/20 (a) | | | 530,000 | | | | 596,250 | |
8.375%, due 10/15/18 (a) | | | 1,165,000 | | | | 1,266,938 | |
| | | | | | | | |
| | | Principal
Amount | | | Value | |
Building Materials (continued) | |
Vulcan Materials Co. | | | | | | | | |
6.50%, due 12/1/16 | | $ | 4,075,000 | | | $ | 4,564,000 | |
7.50%, due 6/15/21 | | | 1,505,000 | | | | 1,715,700 | |
| | | | | | | | |
| | | | 97,527,567 | |
| | | | | | | | |
Chemicals 2.6% | |
Axiall Corp.
4.875%, due 5/15/23 (a) | | | 3,620,000 | | | | 3,420,900 | |
Celanese U.S. Holdings LLC
4.625%, due 11/15/22 | | | 4,215,000 | | | | 4,035,863 | |
Eagle Spinco, Inc.
4.625%, due 2/15/21 (a) | | | 3,815,000 | | | | 3,738,700 | |
Ineos Finance PLC
7.50%, due 5/1/20 (a) | | | 8,635,000 | | | | 9,466,119 | |
Kraton Polymers LLC / Kraton Polymers Capital Corp.
6.75%, due 3/1/19 | | | 6,135,000 | | | | 6,457,087 | |
NOVA Chemicals Corp.
5.25%, due 8/1/23 (a) | | | 5,300,000 | | | | 5,459,000 | |
Olin Corp. | | | | | | | | |
5.50%, due 8/15/22 | | | 3,910,000 | | | | 3,900,225 | |
8.875%, due 8/15/19 | | | 6,675,000 | | | | 7,225,687 | |
Phibro Animal Health Corp.
9.25%, due 7/1/18 (a) | | | 15,335,000 | | | | 16,331,775 | |
PolyOne Corp. | | | | | | | | |
5.25%, due 3/15/23 | | | 7,160,000 | | | | 6,981,000 | |
7.375%, due 9/15/20 | | | 4,665,000 | | | | 5,154,825 | |
| | | | | | | | |
| | | | 72,171,181 | |
| | | | | | | | |
Coal 2.1% | |
Arch Coal, Inc. | | | | | | | | |
7.00%, due 6/15/19 | | | 10,885,000 | | | | 8,653,575 | |
7.25%, due 10/1/20 | | | 1,110,000 | | | | 863,025 | |
8.00%, due 1/15/19 (a) | | | 5,165,000 | | | | 5,152,088 | |
9.875%, due 6/15/19 | | | 2,570,000 | | | | 2,287,300 | |
CONSOL Energy, Inc. | | | | | | | | |
8.00%, due 4/1/17 | | | 11,115,000 | | | | 11,712,431 | |
8.25%, due 4/1/20 | | | 1,590,000 | | | | 1,721,175 | |
Peabody Energy Corp. | | | | | | | | |
6.00%, due 11/15/18 | | | 3,040,000 | | | | 3,237,600 | |
6.25%, due 11/15/21 | | | 4,670,000 | | | | 4,716,700 | |
6.50%, due 9/15/20 | | | 6,935,000 | | | | 7,299,087 | |
7.875%, due 11/1/26 | | | 2,235,000 | | | | 2,268,525 | |
Penn Virginia Resource Partners, L.P. / Penn Virginia Resource Finance Corp.
8.25%, due 4/15/18 | | | 1,340,000 | | | | 1,420,400 | |
Penn Virginia Resource Partners, L.P. / Penn Virginia Resource Finance Corp. II | | | | | | | | |
6.50%, due 5/15/21 (a) | | | 4,150,000 | | | | 4,295,250 | |
8.375%, due 6/1/20 | | | 3,415,000 | | | | 3,765,038 | |
| | | | | | | | |
| | | | 57,392,194 | |
| | | | | | | | |
| | | | |
| M-206 | | MainStay VP High Yield Corporate Bond Portfolio | | The notes to the financial statements are an integral part of,
and should be read in conjunction with, the financial statements. |
| | | | | | | | |
| | | Principal
Amount | | | Value | |
| Corporate Bonds (continued) | |
Commercial Services 4.4% | |
ADT Corp. (The)
6.25%, due 10/15/21 (a) | | $ | 2,800,000 | | | $ | 2,940,000 | |
Alliance Data Systems Corp. | | | | | | | | |
5.25%, due 12/1/17 (a) | | | 7,965,000 | | | | 8,263,687 | |
6.375%, due 4/1/20 (a) | | | 5,385,000 | | | | 5,640,787 | |
American Capital, Ltd.
6.50%, due 9/15/18 (a) | | | 8,020,000 | | | | 8,360,850 | |
Avis Budget Car Rental LLC / Avis Budget Finance, Inc. | | | | | | | | |
5.50%, due 4/1/23 | | | 5,905,000 | | | | 5,720,469 | |
8.25%, due 1/15/19 | | | 1,345,000 | | | | 1,466,050 | |
9.75%, due 3/15/20 | | | 2,895,000 | | | | 3,394,388 | |
Catalent Pharma Solutions, Inc.
7.875%, due 10/15/18 | | | 7,060,000 | | | | 7,183,550 | |
Cenveo Corp.
8.875%, due 2/1/18 | | | 7,339,000 | | | | 7,339,000 | |
Great Lakes Dredge & Dock Corp.
7.375%, due 2/1/19 | | | 9,615,000 | | | | 10,047,675 | |
Hertz Corp. (The) | | | | | | | | |
4.25%, due 4/1/18 | | | 2,660,000 | | | | 2,726,500 | |
5.875%, due 10/15/20 | | | 1,330,000 | | | | 1,378,213 | |
Knowledge Universe Education LLC
7.75%, due 2/1/15 (a) | | | 9,230,000 | | | | 9,045,400 | |
PHH Corp. | | | | | | | | |
7.375%, due 9/1/19 | | | 3,215,000 | | | | 3,432,012 | |
9.25%, due 3/1/16 | | | 2,860,000 | | | | 3,253,250 | |
Quebecor World, Inc. (Litigation Recovery Trust—Escrow Shares) | | | | | | | | |
6.50% (c)(d)(e)(g) | | | 150,000 | | | | 2,205 | |
9.75% (c)(d)(e)(g) | | | 8,530,000 | | | | 125,391 | |
Safway Group Holding LLC / Safway Finance Corp.
7.00%, due 5/15/18 (a) | | | 5,540,000 | | | | 5,844,700 | |
Sotheby’s
5.25%, due 10/1/22 (a) | | | 4,820,000 | | | | 4,518,750 | |
Speedy Cash Intermediate Holdings Corp.
10.75%, due 5/15/18 (a) | | | 7,660,000 | | | | 8,062,150 | |
United Rentals North America, Inc. | | | | | | | | |
5.75%, due 7/15/18 | | | 4,155,000 | | | | 4,440,656 | |
6.125%, due 6/15/23 | | | 1,570,000 | | | | 1,593,550 | |
7.625%, due 4/15/22 | | | 2,920,000 | | | | 3,244,850 | |
9.25%, due 12/15/19 | | | 2,450,000 | | | | 2,731,750 | |
Valassis Communications, Inc.
6.625%, due 2/1/21 | | | 4,740,000 | | | | 4,888,125 | |
WEX, Inc.
4.75%, due 2/1/23 (a) | | | 5,855,000 | | | | 5,386,600 | |
| | | | | | | | |
| | | | | | | 121,030,558 | |
| | | | | | | | |
| | | | | | | | |
| | | Principal
Amount | | | Value | |
Computers 1.7% | |
iGATE Corp.
9.00%, due 5/1/16 | | $ | 5,140,000 | | | $ | 5,461,250 | |
NCR Corp. | | | | | | | | |
4.625%, due 2/15/21 | | | 1,100,000 | | | | 1,053,250 | |
5.00%, due 7/15/22 | | | 4,050,000 | | | | 3,852,562 | |
NCR Escrow Corp. | | | | | | | | |
5.875%, due 12/15/21 (a) | | | 1,425,000 | | | | 1,451,719 | |
6.375%, due 12/15/23 (a) | | | 5,000,000 | | | | 5,106,250 | |
¨ Seagate HDD Cayman
4.75%, due 6/1/23 (a) | | | 23,125,000 | | | | 21,621,875 | |
7.00%, due 11/1/21 | | | 5,220,000 | | | | 5,761,575 | |
SunGard Data Systems, Inc.
4.875%, due 1/15/14 | | | 3,625,000 | | | | 3,625,000 | |
| | | | | | | | |
| | | | 47,933,481 | |
| | | | | | | | |
Distribution & Wholesale 0.7% | |
American Tire Distributors, Inc.
9.75%, due 6/1/17 | | | 14,788,000 | | | | 15,675,280 | |
LKQ Corp.
4.75%, due 5/15/23 (a) | | | 4,695,000 | | | | 4,366,350 | |
| | | | | | | | |
| | | | | | | 20,041,630 | |
| | | | | | | | |
Diversified Financial Services 1.0% | |
CNG Holdings, Inc.
9.375%, due 5/15/20 (a) | | | 5,525,000 | | | | 5,083,000 | |
Community Choice Financial, Inc. | | | | | | | | |
10.75%, due 5/1/19 | | | 11,100,000 | | | | 9,296,250 | |
12.75%, due 5/1/20 (a)(d) | | | 3,000,000 | | | | 2,587,500 | |
Ford Holdings LLC
9.30%, due 3/1/30 | | | 6,970,000 | | | | 9,465,267 | |
National Money Mart Co.
10.375%, due 12/15/16 | | | 1,570,000 | | | | 1,593,550 | |
| | | | | | | | |
| | | | | | | 28,025,567 | |
| | | | | | | | |
Electric 2.0% | |
Calpine Corp. | | | | | | | | |
5.875%, due 1/15/24 (a) | | | 3,840,000 | | | | 3,753,600 | |
6.00%, due 1/15/22 (a) | | | 7,940,000 | | | | 8,138,500 | |
7.50%, due 2/15/21 (a) | | | 888,000 | | | | 969,030 | |
¨GenOn Energy, Inc. | | | | | | | | |
7.875%, due 6/15/17 | | | 14,809,000 | | | | 16,289,900 | |
9.50%, due 10/15/18 | | | 14,273,000 | | | | 16,164,173 | |
GenOn REMA LLC Series C
9.681%, due 7/2/26 | | | 1,190,000 | | | | 1,225,700 | |
Mirant Americas Generation LLC
9.125%, due 5/1/31 | | | 4,910,000 | | | | 4,995,925 | |
PNM Resources, Inc.
9.25%, due 5/15/15 | | | 1,704,000 | | | | 1,895,700 | |
Public Service Co. of New Mexico
7.95%, due 5/15/18 | | | 2,305,000 | | | | 2,739,882 | |
| | | | | | | | |
| | | | | | | 56,172,410 | |
| | | | | | | | |
| | | | | | |
The notes to the financial statements are an integral part of,
and should be read in conjunction with, the financial statements. | | mainstayinvestments.com | | | M-207 | |
Portfolio of Investments December 31, 2013 (continued)
| | | | | | | | |
| | | Principal
Amount | | | Value | |
| Corporate Bonds (continued) | |
Electrical Components & Equipment 1.0% | |
Belden, Inc.
5.50%, due 9/1/22 (a) | | $ | 13,090,000 | | | $ | 12,828,200 | |
General Cable Corp.
6.50%, due 10/1/22 (a)(h) | | | 9,670,000 | | | | 9,476,600 | |
WESCO Distribution, Inc.
5.375%, due 12/15/21 (a) | | | 5,410,000 | | | | 5,410,000 | |
| | | | | | | | |
| | | | | | | 27,714,800 | |
| | | | | | | | |
Electronics 0.4% | |
Kemet Corp.
10.50%, due 5/1/18 | | | 8,305,000 | | | | 8,201,187 | |
Stoneridge, Inc.
9.50%, due 10/15/17 (a) | | | 3,110,000 | | | | 3,374,350 | |
| | | | | | | | |
| | | | | | | 11,575,537 | |
| | | | | | | | |
Engineering & Construction 0.8% | |
New Enterprise Stone & Lime Co., Inc. | | | | | | | | |
11.00%, due 9/1/18 | | | 10,275,000 | | | | 7,500,750 | |
13.00%, due 3/15/18 (b) | | | 10,524,068 | | | | 11,892,197 | |
Weekley Homes LLC / Weekley Finance Corp.
6.00%, due 2/1/23 (a) | | | 1,369,000 | | | | 1,321,085 | |
| | | | | | | | |
| | | | | | | 20,714,032 | |
| | | | | | | | |
Entertainment 2.8% | |
Affinity Gaming LLC / Affinity Gaming Finance Corp.
9.00%, due 5/15/18 | | | 11,715,000 | | | | 12,535,050 | |
Churchill Downs, Inc.
5.375%, due 12/15/21 (a) | | | 6,360,000 | | | | 6,471,300 | |
GLP Capital LP / GLP Financing II, Inc. | | | | | | | | |
4.875%, due 11/1/20 (a) | | | 3,280,000 | | | | 3,280,000 | |
5.375%, due 11/1/23 (a) | | | 2,720,000 | | | | 2,672,400 | |
Isle of Capri Casinos, Inc.
5.875%, due 3/15/21 | | | 4,730,000 | | | | 4,647,225 | |
MU Finance PLC
8.375%, due 2/1/17 (a) | | | 8,260,333 | | | | 8,632,048 | |
NAI Entertainment Holdings / NAI Entertainment Finance Corp.
5.00%, due 8/1/18 (a) | | | 4,830,000 | | | | 4,986,975 | |
Pinnacle Entertainment, Inc.
7.50%, due 4/15/21 | | | 2,597,000 | | | | 2,817,745 | |
Production Resource Group, Inc.
8.875%, due 5/1/19 | | | 6,090,000 | | | | 4,400,025 | |
Rivers Pittsburgh Borrower L.P. / Rivers Pittsburgh Finance Corp.
9.50%, due 6/15/19 (a) | | | 6,234,000 | | | | 6,841,815 | |
Speedway Motorsports, Inc.
6.75%, due 2/1/19 | | | 3,748,000 | | | | 3,982,250 | |
Sterling Entertainment Enterprise LLC
9.75%, due 12/31/19 (c)(d)(e) | | | 10,000,000 | | | | 10,375,000 | |
| | | | | | | | |
| | | Principal
Amount | | | Value | |
Entertainment (continued) | |
United Artists Theatre Circuit, Inc.
Series BA7
9.30%, due 7/1/15 (d)(e) | | $ | 254,740 | | | $ | 178,318 | |
Vail Resorts, Inc.
6.50%, due 5/1/19 | | | 5,415,000 | | | | 5,739,900 | |
| | | | | | | | |
| | | | | | | 77,560,051 | |
| | | | | | | | |
Environmental Controls 0.6% | |
Clean Harbors, Inc. | | | | | | | | |
5.125%, due 6/1/21 | | | 2,735,000 | | | | 2,762,350 | |
5.25%, due 8/1/20 | | | 4,320,000 | | | | 4,449,600 | |
Darling Escrow Corp.
5.375%, due 1/15/22 (a) | | | 4,470,000 | | | | 4,503,525 | |
Darling International, Inc.
8.50%, due 12/15/18 | | | 3,600,000 | | | | 3,969,000 | |
| | | | | | | | |
| | | | | | | 15,684,475 | |
| | | | | | | | |
Finance—Auto Loans 1.2% | |
Credit Acceptance Corp.
9.125%, due 2/1/17 | | | 5,020,000 | | | | 5,271,000 | |
Ford Motor Credit Co. LLC
12.00%, due 5/15/15 | | | 4,455,000 | | | | 5,112,825 | |
General Motors Financial Co., Inc. | | | | | | | | |
4.25%, due 5/15/23 (a) | | | 4,640,000 | | | | 4,413,800 | |
4.75%, due 8/15/17 (a) | | | 6,455,000 | | | | 6,850,369 | |
6.75%, due 6/1/18 | | | 8,850,000 | | | | 10,089,000 | |
| | | | | | | | |
| | | | | | | 31,736,994 | |
| | | | | | | | |
Finance—Consumer Loans 0.2% | |
TMX Finance LLC / TitleMax Finance Corp.
8.50%, due 9/15/18 (a) | | | 5,125,000 | | | | 5,458,125 | |
| | | | | | | | |
|
Finance—Mortgage Loan/Banker 0.1% | |
Prospect Holding Co. LLC / Prospect Holding Finance Co.
10.25%, due 10/1/18 (a) | | | 4,050,000 | | | | 3,807,000 | |
| | | | | | | | |
|
Finance—Other Services 1.5% | |
Cantor Commercial Real Estate Co., L.P.
7.75%, due 2/15/18 (a) | | | 6,985,000 | | | | 7,386,637 | |
¨Nationstar Mortgage LLC / Nationstar Capital Corp. | | | | | | | | |
6.50%, due 8/1/18 | | | 5,925,000 | | | | 6,028,688 | |
6.50%, due 7/1/21 | | | 575,000 | | | | 547,688 | |
7.875%, due 10/1/20 | | | 7,625,000 | | | | 7,910,937 | |
9.625%, due 5/1/19 | | | 2,405,000 | | | | 2,705,625 | |
10.875%, due 4/1/15 | | | 10,060,000 | | | | 10,286,350 | |
SquareTwo Financial Corp.
11.625%, due 4/1/17 | | | 6,485,000 | | | | 6,703,869 | |
| | | | | | | | |
| | | | | | | 41,569,794 | |
| | | | | | | | |
| | | | |
| M-208 | | MainStay VP High Yield Corporate Bond Portfolio | | The notes to the financial statements are an integral part of,
and should be read in conjunction with, the financial statements. |
| | | | | | | | |
| | | Principal
Amount | | | Value | |
| Corporate Bonds (continued) | |
Food 2.4% | |
American Seafoods Group LLC / American Seafoods Finance, Inc.
10.75%, due 5/15/16 (a) | | $ | 4,740,000 | | | $ | 4,905,900 | |
American Stores Co.
8.00%, due 6/1/26 | | | 9,740,000 | | | | 13,538,600 | |
ASG Consolidated LLC / ASG Finance, Inc.
15.00%, due 5/15/17 (a)(b) | | | 5,608,328 | | | | 4,612,850 | |
B&G Foods, Inc.
4.625%, due 6/1/21 | | | 5,820,000 | | | | 5,587,200 | |
C&S Group Enterprises LLC
8.375%, due 5/1/17 (a) | | | 3,139,000 | | | | 3,327,340 | |
Ingles Markets, Inc.
5.75%, due 6/15/23 | | | 8,820,000 | | | | 8,643,600 | |
KeHE Distributors LLC / KeHE Distributors Finance Corp.
7.625%, due 8/15/21 (a) | | | 5,615,000 | | | | 5,951,900 | |
Land O’ Lakes, Inc.
6.00%, due 11/15/22 (a) | | | 9,655,000 | | | | 9,944,650 | |
TreeHouse Foods, Inc.
7.75%, due 3/1/18 | | | 3,070,000 | | | | 3,215,825 | |
Wells Enterprises, Inc.
6.75%, due 2/1/20 (a) | | | 5,120,000 | | | | 5,196,800 | |
| | | | | | | | |
| | | | | | | 64,924,665 | |
| | | | | | | | |
Forest Products & Paper 0.6% | |
Clearwater Paper Corp.
7.125%, due 11/1/18 | | | 4,082,000 | | | | 4,357,535 | |
Georgia-Pacific LLC | | | | | | | | |
7.25%, due 6/1/28 | | | 2,792,000 | | | | 3,365,415 | |
7.375%, due 12/1/25 | | | 1,310,000 | | | | 1,616,514 | |
8.00%, due 1/15/24 | | | 3,469,000 | | | | 4,464,731 | |
Smurfit Kappa Acquisitions
4.875%, due 9/15/18 (a) | | | 2,325,000 | | | | 2,412,188 | |
| | | | | | | | |
| | | | | | | 16,216,383 | |
| | | | | | | | |
Health Care—Products 1.3% | |
ConvaTec Healthcare E S.A.
10.50%, due 12/15/18 (a) | | | 7,315,000 | | | | 8,220,231 | |
Hanger, Inc.
7.125%, due 11/15/18 | | | 7,627,000 | | | | 8,160,890 | |
Hologic, Inc.
6.25%, due 8/1/20 | | | 3,230,000 | | | | 3,407,650 | |
Mallinckrodt International Finance S.A.
4.75%, due 4/15/23 (a) | | | 2,560,000 | | | | 2,362,722 | |
Teleflex, Inc.
6.875%, due 6/1/19 | | | 4,860,000 | | | | 5,103,000 | |
Universal Hospital Services, Inc.
7.625%, due 8/15/20 | | | 8,830,000 | | | | 9,315,650 | |
| | | | | | | | |
| | | | | | | 36,570,143 | |
| | | | | | | | |
| | | | | | | | |
| | | Principal
Amount | | | Value | |
Health Care—Services 2.8% | |
Centene Corp.
5.75%, due 6/1/17 | | $ | 3,905,000 | | | $ | 4,149,062 | |
CHS / Community Health Systems, Inc. | | | | | | | | |
5.125%, due 8/15/18 | | | 1,990,000 | | | | 2,054,675 | |
7.125%, due 7/15/20 | | | 1,000,000 | | | | 1,037,500 | |
DaVita HeathCare Partners, Inc.
6.625%, due 11/1/20 | | | 2,651,000 | | | | 2,843,197 | |
Fresenius Medical Care U.S. Finance, Inc. | | | | | | | | |
6.50%, due 9/15/18 (a) | | | 3,750,000 | | | | 4,237,500 | |
6.875%, due 7/15/17 | | | 40,000 | | | | 45,400 | |
Fresenius Medical Care U.S. Finance II, Inc.
5.625%, due 7/31/19 (a) | | | 460,000 | | | | 496,800 | |
5.875%, due 1/31/22 (a) | | | 2,710,000 | | | | 2,859,050 | |
HCA Holdings, Inc.
6.25%, due 2/15/21 | | | 715,000 | | | | 748,069 | |
HCA, Inc. | | | | | | | | |
4.75%, due 5/1/23 | | | 5,205,000 | | | | 4,892,700 | |
5.875%, due 3/15/22 | | | 5,130,000 | | | | 5,296,725 | |
5.875%, due 5/1/23 | | | 745,000 | | | | 735,688 | |
6.50%, due 2/15/20 | | | 2,125,000 | | | | 2,334,844 | |
7.50%, due 2/15/22 | | | 1,570,000 | | | | 1,723,075 | |
7.58%, due 9/15/25 | | | 575,000 | | | | 596,563 | |
8.00%, due 10/1/18 | | | 4,076,000 | | | | 4,814,775 | |
8.36%, due 4/15/24 | | | 450,000 | | | | 495,000 | |
9.00%, due 12/15/14 | | | 1,520,000 | | | | 1,626,400 | |
Health Management Associates, Inc.
7.375%, due 1/15/20 | | | 2,505,000 | | | | 2,802,469 | |
INC Research LLC
11.50%, due 7/15/19 (a) | | | 7,775,000 | | | | 8,649,687 | |
MPH Intermediate Holding Co. 2
8.375%, due 8/1/18 (a) | | | 8,000,000 | | | | 8,320,000 | |
MultiPlan, Inc.
9.875%, due 9/1/18 (a) | | | 10,145,000 | | | | 11,159,500 | |
ResCare, Inc.
10.75%, due 1/15/19 | | | 3,520,000 | | | | 3,942,400 | |
| | | | | | | | |
| | | | | | | 75,861,079 | |
| | | | | | | | |
Holding Companies—Diversified 0.3% | |
CFG Holdings, Ltd. / CFG Finance LLC
11.50%, due 11/15/19 (a) | | | 6,915,000 | | | | 7,329,900 | |
Leucadia National Corp.
8.125%, due 9/15/15 | | | 1,480,000 | | | | 1,642,800 | |
| | | | | | | | |
| | | | | | | 8,972,700 | |
| | | | | | | | |
Home Builders 2.1% | |
Allegion US Holding Co., Inc.
5.75%, due 10/1/21 (a) | | | 6,720,000 | | | | 6,988,800 | |
Ashton Woods USA LLC / Ashton Woods Finance Co.
6.875%, due 2/15/21 (a) | | | 8,280,000 | | | | 8,176,500 | |
| | | | | | |
The notes to the financial statements are an integral part of,
and should be read in conjunction with, the financial statements. | | mainstayinvestments.com | | | M-209 | |
Portfolio of Investments December 31, 2013 (continued)
| | | | | | | | |
| | | Principal
Amount | | | Value | |
| Corporate Bonds (continued) | |
Home Builders (continued) | |
Brookfield Residential Properties, Inc. | | | | | | | | |
6.125%, due 7/1/22 (a) | | $ | 1,070,000 | | | $ | 1,075,350 | |
6.50%, due 12/15/20 (a) | | | 5,285,000 | | | | 5,483,187 | |
D.R. Horton, Inc.
4.75%, due 2/15/23 | | | 2,925,000 | | | | 2,778,750 | |
Lennar Corp. | | | | | | | | |
4.125%, due 12/1/18 | | | 3,000,000 | | | | 3,015,000 | |
4.75%, due 11/15/22 | | | 3,130,000 | | | | 2,903,075 | |
Meritage Homes Corp.
7.00%, due 4/1/22 | | | 315,000 | | | | 333,113 | |
Ryland Group, Inc. (The) | | | | | | | | |
5.375%, due 10/1/22 | | | 340,000 | | | | 323,000 | |
6.625%, due 5/1/20 | | | 2,460,000 | | | | 2,601,450 | |
Standard Pacific Corp.
8.375%, due 1/15/21 | | | 3,960,000 | | | | 4,613,400 | |
Taylor Morrison Communities, Inc. / Monarch Communities, Inc. | | | | | | | | |
5.25%, due 4/15/21 (a) | | | 3,275,000 | | | | 3,184,938 | |
7.75%, due 4/15/20 (a) | | | 4,978,000 | | | | 5,475,800 | |
Toll Brothers Finance Corp.
4.375%, due 4/15/23 | | | 6,725,000 | | | | 6,237,437 | |
WCI Communities, Inc.
6.875%, due 8/15/21 (a) | | | 4,860,000 | | | | 4,835,700 | |
| | | | | | | | |
| | | | | | | 58,025,500 | |
| | | | | | | | |
Household Products & Wares 0.4% | |
Jarden Corp. | | | | | | | | |
6.125%, due 11/15/22 | | | 945,000 | | | | 1,011,150 | |
7.50%, due 5/1/17 | | | 5,940,000 | | | | 6,875,550 | |
Spectrum Brands Escrow Corp. | | | | | | | | |
6.375%, due 11/15/20 (a) | | | 1,545,000 | | | | 1,649,287 | |
6.625%, due 11/15/22 (a) | | | 1,545,000 | | | | 1,643,494 | |
Spectrum Brands, Inc.
6.75%, due 3/15/20 | | | 710,000 | | | | 764,138 | |
| | | | | | | | |
| | | | | | | 11,943,619 | |
| | | | | | | | |
Housewares 0.2% | |
Libbey Glass, Inc.
6.875%, due 5/15/20 | | | 4,824,000 | | | | 5,209,920 | |
| | | | | | | | |
|
Insurance 0.9% | |
A-S Co-issuer Subsidiary, Inc. / A-S Merger Sub LLC
7.875%, due 12/15/20 (a) | | | 1,405,000 | | | | 1,475,250 | |
American Equity Investment Life Holding Co.
6.625%, due 7/15/21 | | | 6,555,000 | | | | 6,849,975 | |
Fidelity & Guaranty Life Holdings, Inc.
6.375%, due 4/1/21 (a) | | | 6,410,000 | | | | 6,730,500 | |
Ironshore Holdings (U.S.), Inc.
8.50%, due 5/15/20 (a) | | | 4,190,000 | | | | 4,756,597 | |
| | | | | | | | |
| | | Principal
Amount | | | Value | |
Insurance (continued) | |
Onex USI Aquisition Corp.
7.75%, due 1/15/21 (a) | | $ | 5,700,000 | | | $ | 5,828,250 | |
| | | | | | | | |
| | | | | | | 25,640,572 | |
| | | | | | | | |
Internet 0.9% | |
Cogent Communications Group, Inc.
8.375%, due 2/15/18 (a) | | | 9,360,000 | | | | 10,155,600 | |
Equinix, Inc. | | | | | | | | |
5.375%, due 4/1/23 | | | 7,720,000 | | | | 7,546,300 | |
7.00%, due 7/15/21 | | | 5,638,000 | | | | 6,159,515 | |
IAC / InterActiveCorp.
4.75%, due 12/15/22 | | | 1,000,000 | | | | 932,500 | |
| | | | | | | | |
| | | | | | | 24,793,915 | |
| | | | | | | | |
Investment Management/Advisory Services 0.3% | |
Janus Capital Group, Inc.
6.70%, due 6/15/17 | | | 1,743,000 | | | | 1,940,965 | |
Patriot Merger Corp.
9.00%, due 7/15/21 (a) | | | 4,900,000 | | | | 5,145,000 | |
| | | | | | | | |
| | | | | | | 7,085,965 | |
| | | | | | | | |
Iron & Steel 0.8% | |
Allegheny Ludlum Corp.
6.95%, due 12/15/25 | | | 2,545,000 | | | | 2,703,055 | |
Allegheny Technologies, Inc. | | | | | | | | |
5.875%, due 8/15/23 | | | 2,660,000 | | | | 2,686,425 | |
9.375%, due 6/1/19 | | | 2,600,000 | | | | 3,176,560 | |
Bluescope Steel, Ltd. / Bluescope Steel Finance
7.125%, due 5/1/18 (a) | | | 7,900,000 | | | | 8,275,250 | |
Commercial Metals Co.
4.875%, due 5/15/23 | | | 6,044,000 | | | | 5,620,920 | |
| | | | | | | | |
| | | | | | | 22,462,210 | |
| | | | | | | | |
Leisure Time 1.0% | |
Brunswick Corp.
4.625%, due 5/15/21 (a) | | | 7,965,000 | | | | 7,606,575 | |
Carlson Wagonlit B.V.
6.875%, due 6/15/19 (a) | | | 20,180,000 | | | | 20,936,750 | |
| | | | | | | | |
| | | | | | | 28,543,325 | |
| | | | | | | | |
Lodging 1.5% | |
Choice Hotels International, Inc.
5.75%, due 7/1/22 | | | 7,905,000 | | | | 8,250,844 | |
Eldorado Resorts LLC / Eldorado Capital Corp.
8.625%, due 6/15/19 (a) | | | 6,170,000 | | | | 6,586,475 | |
Felcor Lodging, L.P.
5.625%, due 3/1/23 | | | 870,000 | | | | 848,250 | |
Hilton Worldwide Finance LLC / Hilton Worldwide Finance Corp.
5.625%, due 10/15/21 (a) | | | 7,245,000 | | | | 7,516,687 | |
| | | | |
| M-210 | | MainStay VP High Yield Corporate Bond Portfolio | | The notes to the financial statements are an integral part of,
and should be read in conjunction with, the financial statements. |
| | | | | | | | |
| | | Principal
Amount | | | Value | |
| Corporate Bonds (continued) | |
Lodging (continued) | |
MGM Resorts International | | | | | | | | |
6.625%, due 7/15/15 | | $ | 1,000,000 | | | $ | 1,072,500 | |
6.625%, due 12/15/21 | | | 242,000 | | | | 255,915 | |
MTR Gaming Group, Inc.
11.50%, due 8/1/19 | | | 6,452,225 | | | | 7,170,035 | |
Playa Resorts Holding B.V.
8.00%, due 8/15/20 (a) | | | 2,975,000 | | | | 3,157,219 | |
ROC Finance LLC / ROC Finance 1 Corp.
12.125%, due 9/1/18 (a) | | | 2,965,000 | | | | 3,046,537 | |
Starwood Hotels & Resorts Worldwide, Inc.
7.375%, due 11/15/15 | | | 2,580,000 | | | | 2,861,272 | |
| | | | | | | | |
| | | | | | | 40,765,734 | |
| | | | | | | | |
Machinery—Diversified 0.2% | |
Briggs & Stratton Corp.
6.875%, due 12/15/20 | | | 3,660,000 | | | | 4,021,425 | |
SPL Logistics Escrow LLC / SPL Logistics Finance Corp.
8.875%, due 8/1/20 (a) | | | 2,545,000 | | | | 2,704,062 | |
| | | | | | | | |
| | | | | | | 6,725,487 | |
| | | | | | | | |
Media 3.5% | |
CCO Holdings LLC / CCO Holdings Capital Corp. | | | | | | | | |
5.125%, due 2/15/23 | | | 7,920,000 | | | | 7,345,800 | |
5.25%, due 9/30/22 | | | 2,055,000 | | | | 1,918,856 | |
7.25%, due 10/30/17 | | | 1,245,000 | | | | 1,318,144 | |
Cogeco Cable, Inc.
4.875%, due 5/1/20 (a) | | | 5,420,000 | | | | 5,230,300 | |
Crown Media Holdings, Inc.
10.50%, due 7/15/19 | | | 5,023,000 | | | | 5,701,105 | |
CSC Holdings LLC | | | | | | | | |
7.625%, due 7/15/18 | | | 95,000 | | | | 108,656 | |
7.875%, due 2/15/18 | | | 965,000 | | | | 1,102,513 | |
DISH DBS Corp. | | | | | | | | |
4.625%, due 7/15/17 | | | 6,040,000 | | | | 6,326,900 | |
5.125%, due 5/1/20 | | | 11,225,000 | | | | 11,253,062 | |
7.125%, due 2/1/16 | | | 1,085,000 | | | | 1,201,638 | |
7.75%, due 5/31/15 | | | 1,345,000 | | | | 1,459,325 | |
Nielsen Finance LLC / Nielsen Finance Co. | | | | | | | | |
4.50%, due 10/1/20 | | | 9,455,000 | | | | 9,194,987 | |
7.75%, due 10/15/18 | | | 7,560,000 | | | | 8,164,800 | |
ProQuest LLC / ProQuest Notes Co.
9.00%, due 10/15/18 (a) | | | 10,835,000 | | | | 11,214,225 | |
Quebecor Media, Inc. | | | | | | | | |
5.75%, due 1/15/23 | | | 9,100,000 | | | | 8,804,250 | |
7.75%, due 3/15/16 | | | 1,897,000 | | | | 1,920,713 | |
| | | | | | | | |
| | | Principal
Amount | | | Value | |
Media (continued) | |
Videotron, Ltd. | | | | | | | | |
5.00%, due 7/15/22 | | $ | 4,385,000 | | | $ | 4,286,337 | |
6.375%, due 12/15/15 | | | 2,425,000 | | | | 2,431,063 | |
9.125%, due 4/15/18 | | | 5,918,000 | | | | 6,199,105 | |
| | | | | | | | |
| | | | | | | 95,181,779 | |
| | | | | | | | |
Metal Fabricate & Hardware 1.2% | |
A. M. Castle & Co.
12.75%, due 12/15/16 | | | 9,200,000 | | | | 10,304,000 | |
Mueller Water Products, Inc. | | | | | | | | |
7.375%, due 6/1/17 | | | 6,290,000 | | | | 6,447,250 | |
8.75%, due 9/1/20 | | | 4,160,000 | | | | 4,659,200 | |
Shale-Inland Holdings LLC / Shale-Inland Finance Corp.
8.75%, due 11/15/19 (a) | | | 5,570,000 | | | | 5,764,950 | |
Wise Metals Group LLC / Wise Alloys Finance Corp.
8.75%, due 12/15/18 (a) | | | 5,420,000 | | | | 5,704,550 | |
| | | | | | | | |
| | | | | | | 32,879,950 | |
| | | | | | | | |
Mining 1.9% | |
Hecla Mining Co.
6.875%, due 5/1/21 (a) | | | 15,270,000 | | | | 14,659,200 | |
Kaiser Aluminum Corp.
8.25%, due 6/1/20 | | | 6,495,000 | | | | 7,339,350 | |
New Gold, Inc. | | | | | | | | |
6.25%, due 11/15/22 (a) | | | 7,825,000 | | | | 7,570,687 | |
7.00%, due 4/15/20 (a) | | | 7,640,000 | | | | 7,850,100 | |
Novelis, Inc. | | | | | | | | |
8.375%, due 12/15/17 | | | 4,205,000 | | | | 4,488,838 | |
8.75%, due 12/15/20 | | | 2,810,000 | | | | 3,126,125 | |
St. Barbara, Ltd.
8.875%, due 4/15/18 (a) | | | 7,260,000 | | | | 5,971,350 | |
| | | | | | | | |
| | | | | | | 51,005,650 | |
| | | | | | | | |
Miscellaneous—Manufacturing 2.0% | |
Actuant Corp.
5.625%, due 6/15/22 | | | 3,941,000 | | | | 3,990,263 | |
Amsted Industries, Inc.
8.125%, due 3/15/18 (a) | | | 11,265,000 | | | | 11,870,494 | |
CTP Transportation Products LLC / CTP Finance, Inc.
8.25%, due 12/15/19 (a) | | | 5,435,000 | | | | 5,665,987 | |
FGI Operating Co. LLC / FGI Finance, Inc.
7.875%, due 5/1/20 | | | 6,915,000 | | | | 7,399,050 | |
Koppers, Inc.
7.875%, due 12/1/19 | | | 5,005,000 | | | | 5,405,400 | |
LSB Industries, Inc.
7.75%, due 8/1/19 (a) | | | 3,650,000 | | | | 3,832,500 | |
Polypore International, Inc.
7.50%, due 11/15/17 | | | 6,465,000 | | | | 6,836,737 | |
| | | | | | |
The notes to the financial statements are an integral part of,
and should be read in conjunction with, the financial statements. | | mainstayinvestments.com | | | M-211 | |
Portfolio of Investments December 31, 2013 (continued)
| | | | | | | | |
| | | Principal
Amount | | | Value | |
| Corporate Bonds (continued) | |
Miscellaneous—Manufacturing (continued) | |
SPX Corp. | | | | | | | | |
6.875%, due 9/1/17 | | $ | 4,285,000 | | | $ | 4,842,050 | |
7.625%, due 12/15/14 | | | 4,095,000 | | | | 4,309,988 | |
| | | | | | | | |
| | | | | | | 54,152,469 | |
| | | | | | | | |
Office Furnishings 0.3% | |
Interface, Inc.
7.625%, due 12/1/18 | | | 6,627,000 | | | | 7,124,025 | |
| | | | | | | | |
| | |
Oil & Gas 8.1% | | | | | | | | |
Antero Resources Finance Corp.
5.375%, due 11/1/21 (a) | | | 5,390,000 | | | | 5,443,900 | |
Approach Resources, Inc.
7.00%, due 6/15/21 | | | 6,565,000 | | | | 6,729,125 | |
Berry Petroleum Co.
10.25%, due 6/1/14 | | | 3,915,000 | | | | 4,047,131 | |
Calumet Specialty Products Partners, L.P. / Calumet Finance Corp. | | | | | | | | |
7.625%, due 1/15/22 (a) | | | 4,060,000 | | | | 4,100,600 | |
9.375%, due 5/1/19 | | | 11,692,000 | | | | 12,978,120 | |
9.625%, due 8/1/20 | | | 1,770,000 | | | | 1,986,825 | |
Chesapeake Energy Corp.
6.50%, due 8/15/17 | | | 9,615,000 | | | | 10,840,912 | |
Chesapeake Oilfield Operating LLC / Chesapeake Oilfield Finance, Inc.
6.625%, due 11/15/19 | | | 9,345,000 | | | | 9,788,887 | |
Comstock Resources, Inc. | | | | | | | | |
7.75%, due 4/1/19 | | | 6,925,000 | | | | 7,357,813 | |
9.50%, due 6/15/20 | | | 3,750,000 | | | | 4,200,000 | |
Concho Resources, Inc. | | | | | | | | |
5.50%, due 10/1/22 | | | 1,990,000 | | | | 2,054,675 | |
5.50%, due 4/1/23 | | | 656,000 | | | | 675,680 | |
6.50%, due 1/15/22 | | | 7,710,000 | | | | 8,346,075 | |
7.00%, due 1/15/21 | | | 5,485,000 | | | | 6,033,500 | |
Continental Resources, Inc. | | | | | | | | |
5.00%, due 9/15/22 | | | 5,956,000 | | | | 6,186,795 | |
8.25%, due 10/1/19 | | | 3,620,000 | | | | 3,954,850 | |
Linn Energy LLC / Linn Energy Finance Corp. | | | | | | | | |
6.50%, due 5/15/19 | | | 8,305,000 | | | | 8,471,100 | |
7.00%, due 11/1/19 (a) | | | 2,330,000 | | | | 2,353,300 | |
Newfield Exploration Co. | | | | | | | | |
5.625%, due 7/1/24 | | | 5,265,000 | | | | 5,238,675 | |
6.875%, due 2/1/20 | | | 1,630,000 | | | | 1,746,138 | |
Oasis Petroleum, Inc. | | | | | | | | |
6.875%, due 3/15/22 (a) | | | 4,280,000 | | | | 4,536,800 | |
7.25%, due 2/1/19 | | | 9,740,000 | | | | 10,470,500 | |
PDC Energy, Inc.
7.75%, due 10/15/22 | | | 5,435,000 | | | | 5,869,800 | |
| | | | | | | | |
| | | Principal
Amount | | | Value | |
Oil & Gas (continued) | | | | | | | | |
PetroHawk Energy Corp. | | | | | | | | |
7.25%, due 8/15/18 | | $ | 3,285,000 | | | $ | 3,541,230 | |
10.50%, due 8/1/14 | | | 1,410,000 | | | | 1,423,835 | |
PetroQuest Energy, Inc.
10.00%, due 9/1/17 | | | 19,615,000 | | | | 20,350,562 | |
Range Resources Corp. | | | | | | | | |
5.00%, due 8/15/22 | | | 1,660,000 | | | | 1,630,950 | |
5.00%, due 3/15/23 | | | 5,550,000 | | | | 5,425,125 | |
8.00%, due 5/15/19 | | | 2,980,000 | | | | 3,177,425 | |
Rex Energy Corp.
8.875%, due 12/1/20 | | | 11,655,000 | | | | 12,762,225 | |
SM Energy Co. | | | | | | | | |
5.00%, due 1/15/24 (a) | | | 6,670,000 | | | | 6,353,175 | |
6.50%, due 11/15/21 | | | 2,895,000 | | | | 3,068,700 | |
6.625%, due 2/15/19 | | | 3,795,000 | | | | 4,032,188 | |
Stone Energy Corp.
7.50%, due 11/15/22 | | | 3,860,000 | | | | 4,033,700 | |
Summit Midstream Holdings LLC / Summit Midstream Finance Corp.
7.50%, due 7/1/21 (a) | | | 2,300,000 | | | | 2,403,500 | |
W&T Offshore, Inc.
8.50%, due 6/15/19 | | | 8,170,000 | | | | 8,639,775 | |
Whiting Petroleum Corp.
6.50%, due 10/1/18 | | | 7,315,000 | | | | 7,772,188 | |
WPX Energy, Inc.
6.00%, due 1/15/22 | | | 5,365,000 | | | | 5,365,000 | |
| | | | | | | | |
| | | | | | | 223,390,779 | |
| | | | | | | | |
Oil & Gas Services 1.0% | |
Expro Finance Luxembourg SCA
8.50%, due 12/15/16 (a) | | | 8,878,000 | | | | 9,255,315 | |
Forum Energy Technologies, Inc.
6.25%, due 10/1/21 (a) | | | 5,885,000 | | | | 6,179,250 | |
Hiland Partners, L.P. / Hiland Partners Finance Corp.
7.25%, due 10/1/20 (a) | | | 3,560,000 | | | | 3,818,100 | |
Pioneer Energy Services Corp.
9.875%, due 3/15/18 | | | 7,900,000 | | | | 8,374,000 | |
| | | | | | | | |
| | | | | | | 27,626,665 | |
| | | | | | | | |
Packaging & Containers 1.4% | |
AEP Industries, Inc.
8.25%, due 4/15/19 | | | 8,490,000 | | | | 9,126,750 | |
Ball Corp. | | | | | | | | |
5.00%, due 3/15/22 | | | 2,855,000 | | | | 2,826,450 | |
6.75%, due 9/15/20 | | | 835,000 | | | | 908,062 | |
Greif, Inc.
6.75%, due 2/1/17 | | | 3,324,000 | | | | 3,681,330 | |
Owens-Brockway Glass Container, Inc.
7.375%, due 5/15/16 | | | 1,750,000 | | | | 1,964,375 | |
Plastipak Holdings, Inc.
6.50%, due 10/1/21 (a) | | | 8,095,000 | | | | 8,378,325 | |
| | | | |
| M-212 | | MainStay VP High Yield Corporate Bond Portfolio | | The notes to the financial statements are an integral part of,
and should be read in conjunction with, the financial statements. |
| | | | | | | | |
| | | Principal
Amount | | | Value | |
| Corporate Bonds (continued) | |
Packaging & Containers (continued) | |
Silgan Holdings, Inc.
5.00%, due 4/1/20 | | $ | 5,500,000 | | | $ | 5,431,250 | |
Tekni-Plex, Inc.
9.75%, due 6/1/19 (a) | | | 4,688,000 | | | | 5,320,880 | |
| | | | | | | | |
| | | | | | | 37,637,422 | |
| | | | | | | | |
Pharmaceuticals 1.6% | |
Forest Laboratories, Inc.
5.00%, due 12/15/21 (a) | | | 5,420,000 | | | | 5,440,325 | |
Grifols, Inc.
8.25%, due 2/1/18 | | | 7,400,000 | | | | 7,890,250 | |
Lantheus Medical Imaging, Inc.
9.75%, due 5/15/17 | | | 6,855,000 | | | | 6,100,950 | |
NBTY, Inc.
9.00%, due 10/1/18 | | | 6,150,000 | | | | 6,741,937 | |
Salix Pharmaceuticals, Ltd.
6.00%, due 1/15/21 (a) | | | 2,965,000 | | | | 3,039,125 | |
Valeant Pharmaceuticals International, Inc. | | | | | | | | |
5.625%, due 12/1/21 (a) | | | 590,000 | | | | 592,950 | |
6.375%, due 10/15/20 (a) | | | 7,005,000 | | | | 7,381,519 | |
6.50%, due 7/15/16 (a) | | | 2,280,000 | | | | 2,354,100 | |
6.75%, due 10/1/17 (a) | | | 1,010,000 | | | | 1,075,650 | |
6.75%, due 8/15/18 (a) | | | 2,015,000 | | | | 2,213,981 | |
7.00%, due 10/1/20 (a) | | | 835,000 | | | | 899,713 | |
7.50%, due 7/15/21 (a) | | | 640,000 | | | | 702,400 | |
Warner Chilcott Co., LLC / Warner Chilcott Co., LLC
7.75%, due 9/15/18 | | | 500,000 | | | | 541,250 | |
| | | | | | | | |
| | | | | | | 44,974,150 | |
| | | | | | | | |
Pipelines 1.5% | |
Access Midstream Partners, L.P. / ACMP Finance Corp.
6.125%, due 7/15/22 | | | 2,320,000 | | | | 2,482,400 | |
ANR Pipeline Co. | | | | | | | | |
7.375%, due 2/15/24 | | | 395,000 | | | | 477,329 | |
9.625%, due 11/1/21 | | | 5,950,000 | | | | 8,033,660 | |
Atlas Pipeline Partners, L.P. / Atlas Pipeline Finance Corp.
6.625%, due 10/1/20 | | | 7,335,000 | | | | 7,665,075 | |
Crestwood Midstream Partners, L.P. / Crestwood Midstream Finance Corp.
6.00%, due 12/15/20 | | | 2,915,000 | | | | 3,002,450 | |
MarkWest Energy Partners, L.P. / MarkWest Energy Finance Corp. | | | | | | | | |
4.50%, due 7/15/23 | | | 3,000,000 | | | | 2,812,500 | |
6.25%, due 6/15/22 | | | 1,835,000 | | | | 1,940,513 | |
6.75%, due 11/1/20 | | | 6,940,000 | | | | 7,529,900 | |
Northwest Pipeline LLC
7.125%, due 12/1/25 | | | 2,195,000 | | | | 2,641,393 | |
| | | | | | | | |
| | | Principal
Amount | | | Value | |
Pipelines (continued) | |
NuStar Logistics, L.P.
6.75%, due 2/1/21 | | $ | 4,035,000 | | | $ | 4,163,781 | |
| | | | | | | | |
| | | | | | | 40,749,001 | |
| | | | | | | | |
Real Estate 1.2% | |
CBRE Services, Inc.
5.00%, due 3/15/23 | | | 10,700,000 | | | | 10,285,375 | |
Crescent Resources LLC / Crescent Ventures, Inc.
10.25%, due 8/15/17 (a) | | | 3,290,000 | | | | 3,577,875 | |
Howard Hughes Corp. (The)
6.875%, due 10/1/21 (a) | | | 7,530,000 | | | | 7,831,200 | |
Mattamy Group Corp.
6.50%, due 11/15/20 (a) | | | 5,760,000 | | | | 5,702,400 | |
Rialto Holdings LLC / Rialto Corp.
7.00%, due 12/1/18 (a) | | | 5,300,000 | | | | 5,353,000 | |
| | | | | | | | |
| | | | | | | 32,749,850 | |
| | | | | | | | |
Real Estate Investment Trusts 1.0% | |
Geo Group, Inc. (The)
6.625%, due 2/15/21 | | | 5,556,000 | | | | 5,875,470 | |
Host Hotels & Resorts, L.P. | | | | | | | | |
4.75%, due 3/1/23 | | | 5,860,000 | | | | 5,899,825 | |
5.25%, due 3/15/22 | | | 4,055,000 | | | | 4,227,192 | |
5.875%, due 6/15/19 | | | 385,000 | | | | 417,822 | |
Series Q
6.75%, due 6/1/16 | | | 1,763,000 | | | | 1,788,412 | |
RHP Hotel Properties, L.P. / RHP Finance Corp.
5.00%, due 4/15/21 | | | 2,595,000 | | | | 2,562,562 | |
Sabra Health Care, L.P. / Sabra Capital Corp. | | | | | | | | |
5.375%, due 6/1/23 | | | 2,810,000 | | | | 2,732,725 | |
8.125%, due 11/1/18 | | | 2,750,000 | | | | 2,970,000 | |
| | | | | | | | |
| | | | | | | 26,474,008 | |
| | | | | | | | |
Retail 3.6% | |
AmeriGas Finance LLC / AmeriGas Finance Corp.
6.75%, due 5/20/20 | | | 1,970,000 | | | | 2,152,225 | |
AmeriGas Partners, L.P. / AmeriGas Finance Corp. | | | | | | | | |
6.25%, due 8/20/19 | | | 2,180,000 | | | | 2,343,500 | |
6.50%, due 5/20/21 | | | 1,685,000 | | | | 1,798,738 | |
Asbury Automotive Group, Inc.
8.375%, due 11/15/20 | | | 13,176,000 | | | | 14,806,530 | |
AutoNation, Inc.
6.75%, due 4/15/18 | | | 5,495,000 | | | | 6,360,462 | |
Building Materials Holding Corp.
9.00%, due 9/15/18 (a) | | | 6,020,000 | | | | 6,486,550 | |
Cash America International, Inc.
5.75%, due 5/15/18 (a) | | | 7,040,000 | | | �� | 6,688,000 | |
| | | | | | |
The notes to the financial statements are an integral part of,
and should be read in conjunction with, the financial statements. | | mainstayinvestments.com | | | M-213 | |
Portfolio of Investments December 31, 2013 (continued)
| | | | | | | | |
| | | Principal
Amount | | | Value | |
| Corporate Bonds (continued) | |
Retail (continued) | |
DineEquity, Inc.
9.50%, due 10/30/18 | | $ | 17,045,000 | | | $ | 18,919,950 | |
L Brands, Inc. | | | | | | | | |
5.625%, due 10/15/23 | | | 3,785,000 | | | | 3,841,775 | |
6.625%, due 4/1/21 | | | 3,610,000 | | | | 3,961,975 | |
8.50%, due 6/15/19 | | | 1,555,000 | | | | 1,866,000 | |
Penske Automotive Group, Inc.
5.75%, due 10/1/22 | | | 6,670,000 | | | | 6,820,075 | |
PVH Corp. | | | | | | | | |
4.50%, due 12/15/22 | | | 798,000 | | | | 756,105 | |
7.375%, due 5/15/20 | | | 2,540,000 | | | | 2,797,175 | |
Radio Systems Corp.
8.375%, due 11/1/19 (a) | | | 4,100,000 | | | | 4,499,750 | |
Sally Holdings LLC / Sally Capital, Inc. | | | | | | | | |
5.75%, due 6/1/22 | | | 3,075,000 | | | | 3,198,000 | |
6.875%, due 11/15/19 | | | 3,860,000 | | | | 4,265,300 | |
Sonic Automotive, Inc. | | | | | | | | |
5.00%, due 5/15/23 | | | 4,545,000 | | | | 4,260,937 | |
7.00%, due 7/15/22 | | | 3,300,000 | | | | 3,584,625 | |
| | | | | | | | |
| | | | | | | 99,407,672 | |
| | | | | | | | |
Shipbuilding 0.2% | |
Huntington Ingalls Industries, Inc. | | | | | | | | |
6.875%, due 3/15/18 | | | 2,245,000 | | | | 2,424,600 | |
7.125%, due 3/15/21 | | | 1,825,000 | | | | 2,002,938 | |
| | | | | | | | |
| | | | | | | 4,427,538 | |
| | | | | | | | |
Software 0.3% | |
ACI Worldwide, Inc.
6.375%, due 8/15/20 (a) | | | 4,605,000 | | | | 4,812,225 | |
Activision Blizzard, Inc. | | | | | | | | |
5.625%, due 9/15/21 (a) | | | 2,580,000 | | | | 2,670,300 | |
6.125%, due 9/15/23 (a) | | | 1,875,000 | | | | 1,954,687 | |
| | | | | | | | |
| | | | | | | 9,437,212 | |
| | | | | | | | |
Storage & Warehousing 1.0% | |
¨Algeco Scotsman Global Finance PLC | | | | | | | | |
8.50%, due 10/15/18 (a) | | | 13,925,000 | | | | 15,073,812 | |
10.75%, due 10/15/19 (a) | | | 11,405,000 | | | | 12,032,275 | |
Mobile Mini, Inc.
7.875%, due 12/1/20 | | | 280,000 | | | | 310,100 | |
| | | | | | | | |
| | | | | | | 27,416,187 | |
| | | | | | | | |
Telecommunications 7.8% | |
Crown Castle International Corp. | | | | | | | | |
5.25%, due 1/15/23 | | | 15,480,000 | | | | 15,170,400 | |
7.125%, due 11/1/19 | | | 6,835,000 | | | | 7,364,712 | |
DigitalGlobe, Inc.
5.25%, due 2/1/21 (a) | | | 5,410,000 | | | | 5,274,750 | |
Frontier Communications Corp.
9.25%, due 7/1/21 | | | 4,300,000 | | | | 4,955,750 | |
| | | | | | | | |
| | | Principal
Amount | | | Value | |
Telecommunications (continued) | |
GCI, Inc.
8.625%, due 11/15/19 | | $ | 3,025,000 | | | $ | 3,214,063 | |
Hughes Satellite Systems Corp. | | | | | | | | |
6.50%, due 6/15/19 | | | 4,710,000 | | | | 5,098,575 | |
7.625%, due 6/15/21 | | | 4,770,000 | | | | 5,318,550 | |
¨Intelsat Jackson Holdings S.A. | | | | | | | | |
5.50%, due 8/1/23 (a) | | | 2,600,000 | | | | 2,473,250 | |
7.25%, due 4/1/19 | | | 5,295,000 | | | | 5,718,600 | |
7.25%, due 10/15/20 | | | 9,940,000 | | | | 10,871,875 | |
7.50%, due 4/1/21 | | | 3,665,000 | | | | 4,040,663 | |
Lynx I Corp.
5.375%, due 4/15/21 (a) | | | 2,700,000 | | | | 2,700,000 | |
MetroPCS Wireless, Inc. | | | | | | | | |
6.25%, due 4/1/21 (a) | | | 6,960,000 | | | | 7,221,000 | |
6.625%, due 4/1/23 (a) | | | 9,710,000 | | | | 10,025,575 | |
Sable International Finance, Ltd. | | | | | | | | |
7.75%, due 2/15/17 (a) | | | 8,380,000 | | | | 8,746,625 | |
8.75%, due 2/1/20 (a) | | | 3,600,000 | | | | 4,050,000 | |
Satelites Mexicanos S.A. de C.V.
9.50%, due 5/15/17 | | | 12,532,000 | | | | 13,471,900 | |
SBA Telecommunications, Inc. | | | | | | | | |
5.75%, due 7/15/20 | | | 3,750,000 | | | | 3,900,000 | |
8.25%, due 8/15/19 | | | 2,538,000 | | | | 2,722,005 | |
¨Sprint Capital Corp. | | | | | | | | |
6.875%, due 11/15/28 | | | 22,475,000 | | | | 21,182,687 | |
6.90%, due 5/1/19 | | | 1,580,000 | | | | 1,726,150 | |
Sprint Communications, Inc.
9.125%, due 3/1/17 | | | 3,765,000 | | | | 4,423,875 | |
Sprint Corp. | | | | | | | | |
7.125%, due 6/15/24 (a) | | | 7,060,000 | | | | 7,165,900 | |
7.875%, due 9/15/23 (a) | | | 6,150,000 | | | | 6,611,250 | |
¨T-Mobile USA, Inc. | | | | | | | | |
6.125%, due 1/15/22 | | | 3,240,000 | | | | 3,296,700 | |
6.464%, due 4/28/19 | | | 4,595,000 | | | | 4,882,188 | |
6.50%, due 1/15/24 | | | 7,840,000 | | | | 7,938,000 | |
6.731%, due 4/28/22 | | | 13,865,000 | | | | 14,454,262 | |
tw telecom holdings, Inc. | | | | | | | | |
5.375%, due 10/1/22 | | | 3,600,000 | | | | 3,537,000 | |
5.375%, due 10/1/22 (a) | | | 3,380,000 | | | | 3,320,850 | |
Virgin Media Finance PLC
8.375%, due 10/15/19 | | | 4,455,000 | | | | 4,867,088 | |
Virgin Media Secured Finance PLC
5.25%, due 1/15/21 | | | 7,933,000 | | | | 8,093,635 | |
| | | | | | | | |
| | | | | | | 213,837,878 | |
| | | | | | | | |
Transportation 0.7% | |
Florida East Coast Holdings Corp.
10.50%, due 8/1/17 (b) | | | 1,141,740 | | | | 1,175,992 | |
Florida East Coast Railway Corp.
8.125%, due 2/1/17 | | | 16,522,000 | | | | 17,244,838 | |
| | | | | | | | |
| | | | | | | 18,420,830 | |
| | | | | | | | |
| | | | |
| M-214 | | MainStay VP High Yield Corporate Bond Portfolio | | The notes to the financial statements are an integral part of,
and should be read in conjunction with, the financial statements. |
| | | | | | | | |
| | | Principal
Amount | | | Value | |
| Corporate Bonds (continued) | |
Trucking & Leasing 0.6% | |
Flexi-Van Leasing, Inc.
7.875%, due 8/15/18 (a) | | $ | 4,865,000 | | | $ | 5,156,900 | |
NESCO LLC / NESCO Holdings Corp.
11.75%, due 4/15/17 (a) | | | 4,530,000 | | | | 5,096,250 | |
TRAC Intermodal LLC / TRAC Intermodal Corp.
11.00%, due 8/15/19 | | | 6,305,000 | | | | 7,203,462 | |
| | | | | | | | |
| | | | | | | 17,456,612 | |
| | | | | | | | |
Vitamins & Nutrition Products 0.6% | |
Alphabet Holding Co., Inc. | | | | | | | | |
7.75%, due 11/1/17 (a)(b) | | | 5,310,000 | | | | 5,475,937 | |
7.75%, due 11/1/17 (b) | | | 10,915,000 | | | | 11,256,094 | |
| | | | | | | | |
| | | | | | | 16,732,031 | |
| | | | | | | | |
Total Corporate Bonds
(Cost $2,425,366,683) | | | | | | | 2,518,915,722 | |
| | | | | | | | |
|
| Loan Assignments 2.1% (i) | |
Auto Manufacturers 0.1% | |
Chrysler Group LLC
New Term Loan B
4.25%, due 5/24/17 | | | 4,420,655 | | | | 4,439,969 | |
| | | | | | | | |
|
Auto Parts & Equipment 0.8% | |
Exide Technologies, Inc.
DIP Second-Out Term Loan
9.00%, due 10/14/14 | | | 21,812,643 | | | | 22,248,896 | |
| | | | | | | | |
|
Finance—Consumer Loans 0.2% | |
Ocwen Financial Corp.
Term Loan
5.00%, due 2/15/18 | | | 5,200,700 | | | | 5,248,807 | |
| | | | | | | | |
|
Finance—Other Services 0.2% | |
BATS Global Markets, Inc.
Term Loan
7.00%, due 12/14/18 | | | 5,100,000 | | | | 5,112,750 | |
| | | | | | | | |
|
Lodging 0.5% | |
Cannery Casino Resorts, LLC | | | | | | | | |
New Term Loan B
6.00%, due 10/2/18 | | | 2,429,985 | | | | 2,412,975 | |
New 2nd Lien Term Loan
10.00%, due 10/2/19 | | | 5,875,000 | | | | 5,395,207 | |
Four Seasons Holdings, Inc. | | | | | | | | |
1st Lien Term Loan
4.25%, due 6/27/20 | | | 2,339,138 | | | | 2,344,985 | |
| | | | | | | | |
| | | Principal
Amount | | | Value | |
Lodging (continued) | |
Four Seasons Holdings, Inc. (continued) | | | | | | | | |
2nd Lien Term Loan
6.25%, due 12/28/20 | | $ | 2,950,000 | | | $ | 3,016,375 | |
| | | | | | | | |
| | | | | | | 13,169,542 | |
| | | | | | | | |
Media 0.1% | |
ProQuest Co.
Term Loan B
6.00%, due 4/13/18 | | | 3,261,900 | | | | 3,280,248 | |
| | | | | | | | |
|
Miscellaneous—Manufacturing 0.2% | |
FGI Operating Co. LLC
Term Loan
5.50%, due 4/19/19 | | | 5,323,346 | | | | 5,369,925 | |
| | | | | | | | |
Total Loan Assignments
(Cost $57,607,342) | | | | | | | 58,870,137 | |
| | | | | | | | |
|
| Yankee Bonds 0.7% (j) | |
Forest Products & Paper 0.4% | |
Smurfit Kappa Treasury Funding Ltd.
7.50%, due 11/20/25 | | | 10,335,000 | | | | 11,303,906 | |
| | | | | | | | |
| | |
Insurance 0.3% | | | | | | | | |
Fairfax Financial Holdings, Ltd. | | | | | | | | |
7.375%, due 4/15/18 | | | 1,537,000 | | | | 1,724,036 | |
8.30%, due 4/15/26 | | | 4,645,000 | | | | 5,113,802 | |
| | | | | | | | |
| | | | | | | 6,837,838 | |
| | | | | | | | |
Total Yankee Bonds
(Cost $15,331,376) | | | | | | | 18,141,744 | |
| | | | | | | | |
Total Long-Term Bonds
(Cost $2,503,134,653) | | | | | | | 2,601,618,694 | |
| | | | | | | | |
| | |
| | | | | | | | |
| | |
Shares | | | | |
| Common Stocks 0.3% | |
Coal 0.0%‡ | |
Upstate NY Power Producers (c)(d)(e)(g) | | | 19,474 | | | | 370,006 | |
| | | | | | | | |
|
Entertainment 0.1% | |
Affinity Gaming LLC (c)(d)(g) | | | 75,000 | | | | 825,000 | |
| | | | | | | | |
|
Metal Fabricate & Hardware 0.1% | |
Neenah Enterprises, Inc. (c)(d)(e)(g) | | | 230,859 | | | | 2,957,304 | |
| | | | | | | | |
|
Mining 0.1% | |
Goldcorp, Inc. | | | 132,400 | | | | 2,869,108 | |
| | | | | | | | |
Total Common Stocks
(Cost $7,581,628) | | | | | | | 7,021,418 | |
| | | | | | | | |
| | | | | | |
The notes to the financial statements are an integral part of,
and should be read in conjunction with, the financial statements. | | mainstayinvestments.com | | | M-215 | |
Portfolio of Investments December 31, 2013 (continued)
| | | | | | | | |
| | |
Shares | | | Value | |
| Preferred Stock 0.1% | |
Savings & Loans 0.1% | |
GMAC Capital Trust I
8.125% | | | 124,200 | | | $ | 3,321,108 | |
| | | | | | | | |
Total Preferred Stock
(Cost $3,028,995) | | | | | | | 3,321,108 | |
| | | | | | | | |
| | |
| | | | | | | | |
| | | Number of
Warrants | | | | |
| Warrants 0.0%‡ | |
Food 0.0%‡ | |
ASG Corp.
Expires 5/15/18 (c)(d)(g) | | | 3,370 | | | | 421,250 | |
| | | | | | | | |
|
Media 0.0%‡ | |
ION Media Networks, Inc. | | | | | | | | |
Second Lien
Expires 12/18/16 (c)(d)(e)(g) | | | 365 | | | | 4 | |
Unsecured Debt
Expires 12/18/16 (c)(d)(e)(g) | | | 360 | | | | 3 | |
| | | | | | | | |
| | | | | | | 7 | |
| | | | | | | | |
Total Warrants
(Cost $1,099) | | | | | | | 421,257 | |
| | | | | | | | |
| | |
| | | | | | | | |
| | | | | | | | |
| | | Principal
Amount | | | | |
| Short-Term Investment 3.6% | |
Repurchase Agreement 3.6% | |
State Street Bank and Trust Co.
0.00%, dated 12/31/13
due 1/2/14
Proceeds at Maturity $100,242,676 (Collateralized by a Federal Home Loan Mortgage Corp. security with a rate of 1.96% and a maturity date of 11/7/22, with a Principal Amount of $114,440,000 and a Market Value of $102,248,249) | | $ | 100,242,676 | | | | 100,242,676 | |
| | | | | | | | |
Total Short-Term Investment
(Cost $100,242,676) | | | | | | | 100,242,676 | |
| | | | | | | | |
Total Investments
(Cost $2,613,989,051) (k) | | | 98.6 | % | | | 2,712,625,153 | |
Other Assets, Less Liabilities | | | 1.4 | | | | 37,125,108 | |
Net Assets | | | 100.0 | % | | $ | 2,749,750,261 | |
| ‡ | Less than one-tenth of a percent. |
| (a) | May be sold to institutional investors only under Rule 144A or securities offered pursuant to Section 4(a)(2) of the Securities Act of 1933, as amended. |
| (b) | PIK (“Payment in Kind”)—interest or dividend payment is made with additional securities. |
| (d) | Illiquid security—The total market value of these securities as of December 31, 2013, is $20,372,512, which represents 0.7% of the Portfolio’s net assets. |
| (e) | Fair valued security—The total market value of these securities as of December 31, 2013, is $16,538,762, which represents 0.6% of the Portfolio’s net assets. |
| (g) | Non-income producing security. |
| (h) | Step coupon—Rate shown is the rate in effect as of December 31, 2013. |
| (i) | Floating Rate Loan—generally pays interest at rates which are periodically re-determined at a margin above the London InterBank Offered Rate or other short-term rates. The rate shown is the weighted average interest rate of all contracts within the floating rate loan facility as of December 31, 2013. |
| (j) | Yankee Bond—Dollar-denominated bond issued in the United States by a foreign bank or corporation. |
| (k) | As of December 31, 2013, cost is $2,614,032,216 for federal income tax purposes and net unrealized appreciation is as follows: |
| | | | |
Gross unrealized appreciation | | $ | 125,831,026 | |
Gross unrealized depreciation | | | (27,238,089 | ) |
| | | | |
Net unrealized appreciation | | $ | 98,592,937 | |
| | | | |
| | | | |
| M-216 | | MainStay VP High Yield Corporate Bond Portfolio | | The notes to the financial statements are an integral part of,
and should be read in conjunction with, the financial statements. |
The following is a summary of the fair valuations according to the inputs used as of December 31, 2013, for valuing the Portfolio’s assets.
Asset Valuation Inputs
| | | | | | | | | | | | | | | | |
Description | | Quoted Prices
in Active Markets
for Identical Assets (Level 1) | | | Significant Other
Observable Inputs (Level 2) | | | Significant
Unobservable
Inputs (Level 3) | | | Total | |
| Investments in Securities (a) | | | | | | | | | | | | | | | | |
| Long-Term Bonds | | | | | | | | | | | | | | | | |
Convertible Bonds (b) | | $ | — | | | $ | 3,160,560 | | | $ | 2,530,531 | | | $ | 5,691,091 | |
Corporate Bonds (c) | | | — | | | | 2,508,234,808 | | | | 10,680,914 | | | | 2,518,915,722 | |
Loan Assignments (d) | | | — | | | | 53,757,387 | | | | 5,112,750 | | | | 58,870,137 | |
Yankee Bonds | | | — | | | | 18,141,744 | | | | — | | | | 18,141,744 | |
| | | | | | | | | | | | | | | | |
| Total Long-Term Bonds | | | — | | | | 2,583,294,499 | | | | 18,324,195 | | | | 2,601,618,694 | |
| | | | | | | | | | | | | | | | |
| Common Stocks (e) | | | 3,694,108 | | | | — | | | | 3,327,310 | | | | 7,021,418 | |
| Preferred Stock | | | 3,321,108 | | | | — | | | | — | | | | 3,321,108 | |
| Warrants (f) | | | 421,250 | | | | — | | | | 7 | | | | 421,257 | |
| Short-Term Investment | | | | | | | | | | | | | | | | |
Repurchase Agreement | | | — | | | | 100,242,676 | | | | — | | | | 100,242,676 | |
| | | | | | | | | | | | | | | | |
| Total Investments in Securities | | $ | 7,436,466 | | | $ | 2,683,537,175 | | | $ | 21,651,512 | | | $ | 2,712,625,153 | |
| | | | | | | | | | | | | | | | |
| (a) | For a complete listing of investments and their industries, see the Portfolio of Investments. |
| (b) | The Level 3 securities valued at $2,529,441 and $1,090 are held in Electric and Internet, respectively, within the Convertible Bonds section of the Portfolio of Investments. |
| (c) | The Level 3 securities valued at $127,596 and $10,553,318 are held in Commercial Services and Entertainment, respectively, within the Corporate Bonds section of the Portfolio of Investments. |
| (d) | The Level 3 security valued at $5,112,750 is held in Finance—Other Services within Loan Assignments whose value was obtained from an independent pricing service which used a single broker quote to measure such value as referenced in the Portfolio of Investments. |
| (e) | The Level 3 securities valued at $370,006 and $2,957,304 are held in Coal and Metal Fabricate & Hardware, respectively, within the Common Stocks section of the Portfolio of Investments. |
| (f) | The Level 3 securities valued at $7 are held in Media within the Warrants section of the Portfolio of Investments. |
The Portfolio recognizes transfers between the levels as of the beginning of the period.
For the year ended December 31, 2013, the Portfolio did not have any transfers between Level 1 and Level 2 fair value measurements. (See Note 2)
As of December 31, 2013, a security with a market value of $5,820,000 transferred from Level 2 to Level 3. The transfer occurred as a result of the value for certain Loan Assignments obtained from the independent pricing service which were derived based on single a broker quote.
| | | | | | |
The notes to the financial statements are an integral part of,
and should be read in conjunction with, the financial statements. | | mainstayinvestments.com | | | M-217 | |
Portfolio of Investments December 31, 2013 (continued)
The following is a reconciliation of investments in which significant unobservable inputs (Level 3) were used in determining value:
| | | | | | | | | | | | | | | | | | | | | | | | | | | | | | | | | | | | | | | | |
Investments in Securities | | Balance
as of
December 31,
2012 | | | Accrued
Discounts
(Premiums) | | | Realized
Gain
(Loss) | | | Change in
Unrealized
Appreciation
(Depreciation) | | | Purchases | | | Sales | | | Transfers
in to
Level 3 | | | Transfers
out of
Level 3 | | | Balance
as of
December 31,
2013 | | | Change in
Unrealized
Appreciation
(Depreciation)
from
Investments
Still Held at
December 31,
2013 (a) | |
Long-Term Bonds | | | | | | | | | | | | | | | | | | | | | | | | | | | | | | | | | | | | | | | | |
Convertible Bonds | | | | | | | | | | | | | | | | | | | | | | | | | | | | | | | | | | | | | | | | |
Electric | | $ | 1,919,799 | | | $ | — | | | $ | — | | | $ | 311,007 | | | $ | 298,635 | (b) | | $ | — | | | $ | — | | | $ | — | | | $ | 2,529,441 | | | $ | 311,007 | |
Internet | | | 1,090 | | | | — | | | | — | | | | — | | | | — | | | | — | | | | — | | | | — | | | | 1,090 | | | | — | |
Corporate Bonds | | | | | | | | | | | | | | | | | | | | | | | | | | | | | | | | | | | | | | | | |
Auto Parts & Equipment | | | 4,022 | | | | — | | | | — | | | | (4,022 | ) | | | — | | | | — | | | | — | | | | — | | | | — | | | | — | |
Commercial Services | | | 138,880 | | | | — | | | | — | | | | (11,284 | ) | | | — | | | | — | | | | — | | | | — | | | | 127,596 | | | | (11,284 | ) |
Electric | | | 599,422 | | | | — | | | | (90,791 | ) | | | — | | | | — | | | | (508,631 | ) | | | — | | | | — | | | | — | | | | — | |
Entertainment | | | 10,256,032 | | | | 10,755 | | | | 10,763 | | | | 386,788 | | | | — | | | | (111,020 | ) | | | — | | | | — | | | | 10,553,318 | | | | 386,788 | |
Food | | | 6,394,500 | | | | — | | | | 94,500 | | | | (189,000 | ) | | | — | | | | (6,300,000 | ) | | | — | | | | — | | | | — | | | | — | |
Loan Assignments | | | | | | | | | | | | | | | | | | | | | | | | | | | | | | | | | | | | | | | | |
Apparel | | | 2,703,750 | | | | 102 | | | | 101,666 | | | | (101,768 | ) | | | — | | | | (2,703,750 | )(c) | | | — | | | | — | | | | — | | | | — | |
Finance | | | 1,830,707 | | | | 347 | | | | — | | | | (26,792 | ) | | | — | | | | (1,804,262 | )(c) | | | — | | | | — | | | | — | | | | — | |
Finance—Other
Services | | | — | | | | 53,727 | | | | 49,552 | | | | 89,471 | | | | — | | | | (900,000 | )(c) | | | 5,820,000 | | | | — | | | | 5,112,750 | | | | 89,471 | |
Lodging | | | 3,208,275 | | | | 337 | | | | — | | | | 131,419 | | | | — | | | | (3,340,031 | )(c) | | | — | | | | — | | | | — | | | | — | |
Metal, Fabricate & Hardware | | | 5,910,000 | | | | — | | | | — | | | | — | | | | — | | | | (5,910,000 | )(c) | | | — | | | | — | | | | — | | | | — | |
Common Stocks | | | | | | | | | | | | | | | | | | | | | | | | | | | | | | | | | | | | | | | | |
Coal | | | 331,058 | | | | — | | | | — | | | | 38,948 | | | | — | | | | — | | | | — | | | | — | | | | 370,006 | | | | 38,948 | |
Media | | | 22,073 | | | | — | | | | (690,475 | ) | | | 668,402 | | | | — | | | | — | | | | — | | | | — | | | | — | | | | — | |
Metal, Fabricate & Hardware | | | 1,371,302 | | | | — | | | | — | | | | 1,586,002 | | | | — | | | | — | | | | — | | | | — | | | | 2,957,304 | | | | 1,586,002 | |
Warrants | | | | | | | | | | | | | | | | | | | | | | | | | | | | | | | | | | | | | | | | |
Media | | | 7 | | | | — | | | | — | | | | — | | | | — | | | | — | | | | — | | | | — | | | | 7 | | | | — | |
| | | | | | | | | | | | | | | | | | | | | | | | | | | | | | | | | | | | | | | | |
Total | | $ | 34,690,917 | | | $ | 65,268 | | | $ | (524,785 | ) | | $ | 2,879,171 | | | $ | 298,635 | | | $ | (21,577,694 | ) | | $ | 5,820,000 | | | $ | — | | | $ | 21,651,512 | | | $ | 2,400,932 | |
| | | | | | | | | | | | | | | | | | | | | | | | | | | | | | | | | | | | | | | | |
| (a) | Included in “Net change in unrealized appreciation (depreciation) on investments” in the Statement of Operations. |
| (b) | Purchases include securities received from a restructure. |
| (c) | Sales include principal reductions. |
| | | | |
| M-218 | | MainStay VP High Yield Corporate Bond Portfolio | | The notes to the financial statements are an integral part of,
and should be read in conjunction with, the financial statements. |
Statement of Assets and Liabilities as of December 31, 2013
| | | | |
| Assets | | | | |
Investment in securities, at value (identified cost $2,613,989,051) | | $ | 2,712,625,153 | |
Cash | | | 62,341 | |
Receivables: | | | | |
Dividends and interest | | | 42,709,697 | |
Fund shares sold | | | 4,008,016 | |
Investment securities sold | | | 30,653 | |
| | | | |
Total assets | | | 2,759,435,860 | |
| | | | |
| |
| Liabilities | | | | |
Payables: | | | | |
Investment securities purchased | | | 6,870,928 | |
Manager (See Note 3) | | | 1,289,320 | |
Fund shares redeemed | | | 874,679 | |
NYLIFE Distributors (See Note 3) | | | 432,014 | |
Shareholder communication | | | 138,421 | |
Professional fees | | | 65,365 | |
Custodian | | | 6,418 | |
Trustees | | | 3,799 | |
Accrued expenses | | | 4,655 | |
| | | | |
Total liabilities | | | 9,685,599 | |
| | | | |
Net assets | | $ | 2,749,750,261 | |
| | | | |
| |
| Net Assets Consist of | | | | |
Shares of beneficial interest outstanding (par value of $.001 per share) unlimited number of shares authorized | | $ | 270,033 | |
Additional paid-in capital | | | 2,556,683,078 | |
| | | | |
| | | 2,556,953,111 | |
Undistributed net investment income | | | 162,053,021 | |
Accumulated net realized gain (loss) on investments | | | (67,891,973 | ) |
Net unrealized appreciation (depreciation) on investments | | | 98,636,102 | |
| | | | |
Net assets | | $ | 2,749,750,261 | |
| | | | |
| | | | |
Initial Class | | | | |
Net assets applicable to outstanding shares | | $ | 703,361,976 | |
| | | | |
Shares of beneficial interest outstanding | | | 68,553,974 | |
| | | | |
Net asset value per share outstanding | | $ | 10.26 | |
| | | | |
Service Class | | | | |
Net assets applicable to outstanding shares | | $ | 2,046,388,285 | |
| | | | |
Shares of beneficial interest outstanding | | | 201,478,911 | |
| | | | |
Net asset value per share outstanding | | $ | 10.16 | |
| | | | |
| | | | | | |
The notes to the financial statements are an integral part of,
and should be read in conjunction with, the financial statements. | | mainstayinvestments.com | | | M-219 | |
Statement of Operations for the year ended December 31, 2013
| | | | |
| Investment Income (Loss) | | | | |
Income | | | | |
Interest | | $ | 183,057,193 | |
Dividends (a) | | | 456,390 | |
| | | | |
Total income | | | 183,513,583 | |
| | | | |
Expenses | | | | |
Manager (See Note 3) | | | 14,983,819 | |
Distribution and service—Service Class (See Note 3) | | | 4,982,847 | |
Shareholder communication | | | 415,989 | |
Professional fees | | | 197,032 | |
Trustees | | | 55,779 | |
Custodian | | | 42,544 | |
Miscellaneous | | | 71,590 | |
| | | | |
Total expenses | | | 20,749,600 | |
| | | | |
Net investment income (loss) | | | 162,763,983 | |
| | | | |
|
| Realized and Unrealized Gain (Loss) on Investments | |
Net realized gain (loss) on investments | | | 51,722,394 | |
Net change in unrealized appreciation (depreciation) on investments | | | (49,167,320 | ) |
| | | | |
Net realized and unrealized gain (loss) on investments | | | 2,555,074 | |
| | | | |
Net increase (decrease) in net assets resulting from operations | | $ | 165,319,057 | |
| | | | |
| (a) | Dividends recorded net of foreign withholding taxes in the amount of $18,252. |
| | | | |
| M-220 | | MainStay VP High Yield Corporate Bond Portfolio | | The notes to the financial statements are an integral part of,
and should be read in conjunction with, the financial statements. |
Statements of Changes in Net Assets
for the years ended December 31, 2013 and December 31, 2012
| | | | | | | | |
| | | 2013 | | | 2012 | |
| Increase (Decrease) in Net Assets | | | | | |
Operations: | | | | | | | | |
Net investment income (loss) | | $ | 162,763,983 | | | $ | 150,116,522 | |
Net realized gain (loss) on investments and foreign currency transactions | | | 51,722,394 | | | | 12,271,530 | |
Net change in unrealized appreciation (depreciation) on investments and foreign currency transactions | | | (49,167,320 | ) | | | 114,007,767 | |
| | | | |
Net increase (decrease) in net assets resulting from operations | | | 165,319,057 | | | | 276,395,819 | |
| | | | |
Dividends to shareholders: | | | | | | | | |
From net investment income: | | | | | | | | |
Initial Class | | | (37,478,544 | ) | | | (40,276,749 | ) |
Service Class | | | (110,525,419 | ) | | | (92,907,075 | ) |
| | | | |
Total dividends to shareholders | | | (148,003,963 | ) | | | (133,183,824 | ) |
| | | | |
Capital share transactions: | | | | | | | | |
Net proceeds from sale of shares | | | 446,134,642 | | | | 533,280,971 | |
Net asset value of shares issued to shareholders in reinvestment of dividends | | | 148,003,963 | | | | 133,183,824 | |
Cost of shares redeemed | | | (411,205,427 | ) | | | (220,118,314 | ) |
| | | | |
Increase (decrease) in net assets derived from capital share transactions | | | 182,933,178 | | | | 446,346,481 | |
| | | | |
Net increase (decrease) in net assets | | | 200,248,272 | | | | 589,558,476 | |
| | |
| Net Assets | | | | | | | | |
Beginning of year | | | 2,549,501,989 | | | | 1,959,943,513 | |
| | | | |
End of year | | $ | 2,749,750,261 | | | $ | 2,549,501,989 | |
| | | | |
Undistributed net investment income at end of year | | $ | 162,053,021 | | | $ | 148,068,224 | |
| | | | |
| | | | | | |
The notes to the financial statements are an integral part of,
and should be read in conjunction with, the financial statements. | | mainstayinvestments.com | | | M-221 | |
Financial Highlights selected per share data and ratios
| | | | | | | | | | | | | | | | | | | | |
| | | Initial Class | |
| | | Year ended December 31, | |
| | | 2013 | | | 2012 | | | 2011 | | | 2010 | | | 2009 | |
Net asset value at beginning of year | | $ | 10.19 | | | $ | 9.52 | | | $ | 9.59 | | | $ | 9.03 | | | $ | 6.79 | |
| | | | | | | | | | | | | | | | | | | | |
Net investment income (loss) (a) | | | 0.65 | | | | 0.69 | | | | 0.70 | | | | 0.70 | | | | 0.67 | |
Net realized and unrealized gain (loss) on investments | | | 0.01 | | | | 0.57 | | | | (0.14 | ) | | | 0.43 | | | | 2.22 | |
Net realized and unrealized gain (loss) on foreign currency transactions | | | — | | | | — | | | | 0.00 | ‡ | | | 0.00 | ‡ | | | 0.00 | ‡ |
| | | | | | | | | | | | | | | | | | | | |
Total from investment operations | | | 0.66 | | | | 1.26 | | | | 0.56 | | | | 1.13 | | | | 2.89 | |
| | | | | | | | | | | | | | | | | | | | |
Less dividends: | | | | | | | | | | | | | | | | | | | | |
From net investment income | | | (0.59 | ) | | | (0.59 | ) | | | (0.63 | ) | | | (0.57 | ) | | | (0.65 | ) |
| | | | | | | | | | | | | | | | | | | | |
Net asset value at end of year | | $ | 10.26 | | | $ | 10.19 | | | $ | 9.52 | | | $ | 9.59 | | | $ | 9.03 | |
| | | | | | | | | | | | | | | | | | | | |
Total investment return | | | 6.63 | % | | | 13.42 | % | | | 6.26 | % | | | 12.67 | % | | | 42.82 | % |
Ratios (to average net assets)/Supplemental Data: | | | | | | | | | | | | | | | | | | | | |
Net investment income (loss) | | | 6.24 | % | | | 6.86 | % | | | 7.14 | % | | | 7.40 | % | | | 8.23 | % |
Net expenses | | | 0.59 | % | | | 0.59 | % | | | 0.60 | % | | | 0.61 | % | | | 0.62 | % |
Portfolio turnover rate | | | 40 | % | | | 30 | % | | | 39 | % | | | 45 | % | �� | | 43 | % |
Net assets at end of year (in 000’s) | | $ | 703,362 | | | $ | 718,047 | | | $ | 661,780 | | | $ | 729,071 | | | $ | 700,295 | |
| ‡ | Less than one cent per share. |
| (a) | Per share data based on average shares outstanding during the year. |
| | | | | | | | | | | | | | | | | | | | |
| | | Service Class | |
| | | Year ended December 31, | |
| | | 2013 | | | 2012 | | | 2011 | | | 2010 | | | 2009 | |
Net asset value at beginning of year | | $ | 10.10 | | | $ | 9.44 | | | $ | 9.53 | | | $ | 8.98 | | | $ | 6.76 | |
| | | | | | | | | | | | | | | | | | | | |
Net investment income (loss) (a) | | | 0.62 | | | | 0.66 | | | | 0.67 | | | | 0.67 | | | | 0.65 | |
Net realized and unrealized gain (loss) on investments | | | 0.01 | | | | 0.57 | | | | (0.15 | ) | | | 0.44 | | | | 2.21 | |
Net realized and unrealized gain (loss) on foreign currency transactions | | | — | | | | — | | | | 0.00 | ‡ | | | 0.00 | ‡ | | | 0.00 | ‡ |
| | | | | | | | | | | | | | | | | | | | |
Total from investment operations | | | 0.63 | | | | 1.23 | | | | 0.52 | | | | 1.11 | | | | 2.86 | |
| | | | | | | | | | | | | | | | | | | | |
Less dividends: | | | | | | | | | | | | | | | | | | | | |
From net investment income | | | (0.57 | ) | | | (0.57 | ) | | | (0.61 | ) | | | (0.56 | ) | | | (0.64 | ) |
| | | | | | | | | | | | | | | | | | | | |
Net asset value at end of year | | $ | 10.16 | | | $ | 10.10 | | | $ | 9.44 | | | $ | 9.53 | | | $ | 8.98 | |
| | | | | | | | | | | | | | | | | | | | |
Total investment return | | | 6.36 | % | | | 13.14 | % | | | 5.99 | % | | | 12.39 | % | | | 42.47 | % |
Ratios (to average net assets)/Supplemental Data: | | | | | | | | | | | | | | | | | | | | |
Net investment income (loss) | | | 5.99 | % | | | 6.61 | % | | | 6.89 | % | | | 7.16 | % | | | 7.90 | % |
Net expenses | | | 0.84 | % | | | 0.84 | % | | | 0.85 | % | | | 0.86 | % | | | 0.87 | % |
Portfolio turnover rate | | | 40 | % | | | 30 | % | | | 39 | % | | | 45 | % | | | 43 | % |
Net assets at end of year (in 000’s) | | $ | 2,046,388 | | | $ | 1,831,455 | | | $ | 1,298,164 | | | $ | 1,124,089 | | | $ | 859,870 | |
| ‡ | Less than one cent per share. |
| (a) | Per share data based on average shares outstanding during the year. |
| | | | |
| M-222 | | MainStay VP High Yield Corporate Bond Portfolio | | The notes to the financial statements are an integral part of,
and should be read in conjunction with, the financial statements. |
MainStay VP ICAP Select Equity Portfolio
Investment and Performance Comparison1 (Unaudited)
Performance data quoted represents past performance. Past performance is no guarantee of future results. Because of market volatility, current performance may be lower or higher than the figures shown. Investment return and principal value will fluctuate, and as a result, when shares are redeemed, they may be worth more or less than their original cost. The performance table and graph do not reflect any deduction of sales charges, mortality and expense charges, contract charges or administrative charges. Please refer to the Performance Summary appropriate for your policy. For performance information current to the most recent month-end, please call 800-598-2019 or visit www.newyorklife.com.
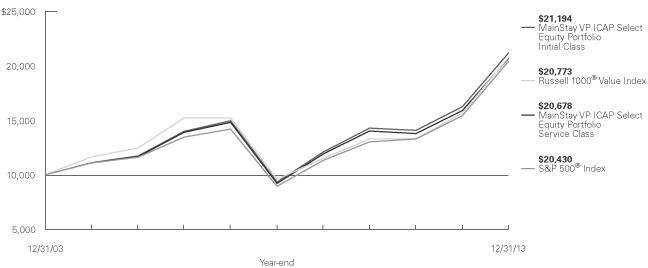
Average Annual Total Returns for the Year Ended December 31, 2013
| | | | | | | | | | | | | | | | |
| Class | | One Year | | | Five Years | | | Ten Years2 | | | Gross
Expense
Ratio3 | |
| Initial Class Shares | | | 30.29 | % | | | 17.80 | % | | | 7.80 | % | | | 0.79 | % |
| Service Class Shares | | | 29.96 | | | | 17.51 | | | | 7.54 | | | | 1.04 | |
| | | | | | | | | | | | |
| Benchmark Performance | | One
Year | | | Five
Years | | | Ten
Years | |
Russell 1000® Value Index4 | | | 32.53 | % | | | 16.67 | % | | | 7.58 | % |
| S&P 500® Index4 | | | 32.39 | | | | 17.94 | | | | 7.41 | |
Average Lipper Variable Products Large-Cap Value Portfolio5 | | | 32.99 | | | | 16.70 | | | | 7.03 | |
| 1. | Performance figures reflect certain fee waivers and/or expense limitations, without which total returns may have been different. For information on current fee waivers and/or expense limitations, please refer to the notes to the financial statements. |
| 2. | Performance figures shown for the ten-year period ended December 31, 2013 reflect nonrecurring reimbursements from affiliates for printing and mailing costs. If these nonrecurring reimbursements had not been made, the total returns would have been 7.79% for Initial Class shares and 7.53% for Service Class shares for the ten-year period. |
| 3. | The gross expense ratios presented reflect the Portfolio’s “Total Annual Portfolio Operating Expenses” from the most recent Prospectus and may differ from other expense ratios disclosed in this report. |
| 4. | Please refer to pages M-2 and M-3 for additional explanations and disclosure regarding the Portfolios, their benchmark indices and other indices mentioned in the reports. |
| 5. | The Average Lipper Variable Products Large-Cap Value Portfolio is representative of portfolios that, by portfolio practice, invest at least 75% of their equity assets in companies with market capitalizations (on a three-year weighted basis) above Lipper’s U.S. diversified equity large-cap floor. Large-cap value portfolios typically have below average characteristics compared to the S&P 500® Index. Lipper Inc. is an independent monitor of fund performance. Results are based on total returns with all dividend and capital gain distributions reinvested. |
| | | | |
| mainstayinvestments.com | | | M-223 | |
Cost in Dollars of a $1,000 Investment in MainStay VP ICAP Select Equity Portfolio (Unaudited)
The example below is intended to describe the fees and expenses borne by shareholders during the six-month period from July 1, 2013, to December 31, 2013, and the impact of those costs on your investment.
Example
As a shareholder of the Portfolio, you incur two types of costs: (1) transaction costs, including exchange fees and sales charges (loads) on purchases (as applicable), and (2) ongoing costs, including management fees, distribution and/or service (12b-1) fees, and other Portfolio expenses (as applicable). This example is intended to help you understand your ongoing costs (in dollars) of investing in the Portfolio and to compare these costs with the ongoing costs of investing in other Portfolios. The example is based on an investment of $1,000 made at the beginning of the six-month period and held for the entire period from July 1, 2013, to December 31, 2013. Shares are only sold in connection with variable life and annuity contracts and the example does not reflect any contract level or transactional fees or expenses. If these costs had been included, your costs would have been higher.
This example illustrates your Portfolio’s ongoing costs in two ways:
Actual Expenses
The second and third data columns in the table below provide information about actual account values and actual expenses. You may use the information in these columns, together with the amount you invested, to estimate the expenses that you paid during the six months ended
December 31, 2013. Simply divide your account value by $1,000 (for example, an $8,600 account value divided by $1,000 = 8.6), then multiply the result by the number under the heading entitled ‘‘Expenses Paid During Period’’ to estimate the expenses you paid on your account during this period.
Hypothetical Example for Comparison Purposes
The fourth and fifth data columns in the table below provide information about hypothetical account values and hypothetical expenses based on the Portfolio’s actual expense ratio and an assumed rate of return of 5% per year before expenses, which is not the Portfolio’s actual return. The hypothetical account values and expenses may not be used to estimate the actual ending account balances or expenses you paid for the six-month period shown. You may use this information to compare the ongoing costs of investing in the Portfolio with the ongoing costs of investing in other Portfolios. To do so, compare this 5% hypothetical example with the 5% hypothetical examples that appear in the shareholder reports of the other Portfolios.
Please note that the expenses shown in the table are meant to highlight your ongoing costs only and do not reflect any transactional costs, such as exchange fees or sales charges (loads). Therefore, the fourth and fifth data columns of the table are useful in comparing ongoing costs only and will not help you determine the relative total costs of owning different funds. In addition, if these transactional costs were included, your costs would have been higher.
| | | | | | | | | | | | | | | | | | | | |
| | | | | | | | | | | | | | | | |
| Share Class | | Beginning
Account
Value
7/1/13 | | | Ending Account
Value (Based
on Actual
Returns and
Expenses)
12/31/13 | | | Expenses
Paid
During
Period1 | | | Ending Account
Value (Based
on Hypothetical
5% Annualized
Return and
Actual Expenses)
12/31/13 | | | Expenses
Paid
During
Period1 | |
| | | | | |
| Initial Class Shares | | $ | 1,000.00 | | | $ | 1,150.70 | | | $ | 4.28 | | | $ | 1,021.20 | | | $ | 4.02 | |
| | | | | |
| Service Class Shares | | $ | 1,000.00 | | | $ | 1,149.30 | | | $ | 5.63 | | | $ | 1,020.00 | | | $ | 5.30 | |
| 1. | Expenses are equal to the Portfolio’s annualized expense ratio of each class (0.79% for Initial Class and 1.04% for Service Class) multiplied by the average account value over the period, divided by 365 and multiplied by 184 (to reflect the six-month period). The table above represents the actual expenses incurred during the six-month period. |
| | |
| M-224 | | MainStay VP ICAP Select Equity Portfolio |
Industry Composition as of December 31, 2013 (Unaudited)
| | | | |
| Oil, Gas & Consumable Fuels | | | 11.3 | % |
| Diversified Financial Services | | | 9.7 | |
| Media | | | 7.9 | |
| Industrial Conglomerates | | | 6.4 | |
| Aerospace & Defense | | | 6.3 | |
| Health Care Equipment & Supplies | | | 6.1 | |
| Pharmaceuticals | | | 6.1 | |
| Software | | | 5.0 | |
| Wireless Telecommunication Services | | | 4.7 | |
| Chemicals | | | 4.2 | |
| Consumer Finance | | | 3.7 | |
| Commercial Banks | | | 3.6 | |
| | | | |
| Auto Components | | | 3.5 | % |
| Food & Staples Retailing | | | 3.4 | |
| Semiconductors & Semiconductor Equipment | | | 3.4 | |
| Energy Equipment & Services | | | 2.8 | |
| Insurance | | | 2.8 | |
| Automobiles | | | 2.6 | |
| Communications Equipment | | | 2.5 | |
| Electric Utilities | | | 2.1 | |
| Short-Term Investment | | | 1.8 | |
| Other Assets, Less Liabilities | | | 0.1 | |
| | | | |
| | | 100.0 | % |
| | | | |
See Portfolio of Investments beginning on page M-228 for specific holdings within these categories.
Top Ten Holdings as of December 31, 2013 (excluding short-term investment) (Unaudited)
| 4. | Vodafone Group PLC, Sponsored ADR |
| 7. | Baxter International, Inc. |
| 8. | Capital One Financial Corp. |
| 9. | PNC Financial Services Group, Inc. |
| | | | |
| mainstayinvestments.com | | | M-225 | |
Portfolio Management Discussion and Analysis (Unaudited)
Answers to the questions reflect the views of portfolio managers Jerrold K. Senser, CFA, Thomas R. Wenzel, CFA, and Thomas M. Cole, CFA, of Institutional Capital LLC (“ICAP”), the Portfolio’s Subadvisor.
How did MainStay VP ICAP Select Equity Portfolio perform relative to its benchmark and peers during the 12 months ended December 31, 2013?
For the 12 months ended December 31, 2013, MainStay VP ICAP Select Equity Portfolio returned 30.29% for Initial Class shares and 29.96% for Service Class shares. Over the same period, both share classes underperformed the 32.53% return of the Russell 1000® Value Index1 and the 32.39% return of the S&P 500® Index.1 The Russell 1000® Value Index is the Portfolio’s broad-based securities-market index, and the S&P 500® Index is a secondary benchmark for the Portfolio. Both share classes underperformed the 32.99% return of the average Lipper1 Variable Products Large-Cap Value Portfolio for the 12 months ended December 31, 2013.
What factors affected the Portfolio’s relative performance during the reporting period?
A number of key drivers affected the Portfolio’s performance in relation to the Russell 1000® Value Index. Positive stock selection in the telecommunication services and consumer discretionary sectors added to relative performance. On the other hand, stock selection in the materials and health care sectors detracted from relative performance. The Portfolio benefited from an overweight position relative to the Index in the consumer discretionary sector, but an overweight position in telecommunication services detracted from relative performance.
Which sectors were the strongest positive contributors to the Portfolio’s relative performance, and which sectors were particularly weak?
The strongest positive-contributing sectors to the Portfolio’s performance relative to the Russell 1000® Value Index were consumer discretionary, telecommunication services and consumer staples. (Contributions take weightings and total returns into account.) Favorable stock selection was the primary driver in telecommunication services and consumer staples, while stock selection and an overweight position in consumer discretionary added to relative performance.
The sectors that detracted the most from relative performance were materials, information technology and health care. Stock selection was the primary driver in each case.
During the reporting period, which individual stocks made the strongest positive contributions to the Portfolio’s absolute performance and which stocks detracted the most?
The stocks that made the strongest positive contributions to the Portfolio’s absolute performance were media companies Time Warner and Viacom and wireless telecommunication services company Vodafone. Time Warner’s stock outperformed the Russell 1000® Value Index as the company maintained strong operational performance and provided expectations of growth in affiliate-fee revenue. Viacom benefited from improved network ratings, as advertising revenue beat expectations. Vodafone had strong performance during the reporting period, as the company announced its intention to sell its stake in Verizon Wireless and return a significant portion of the proceeds to shareholders. Each of these companies returned cash to shareholders through dividends, stock buybacks or both. All of the positions remained in the Portfolio at the end of the year.
Detractors from the Portfolio’s absolute performance included gold miner Barrick Gold, integrated electric utility Exelon and phosphate and potash miner Mosaic. Barrick Gold lagged as production delays and cost overruns hampered the company’s results and outlook. We sold the Portfolio’s position in the stock on concern that these issues would continue rather than be resolved. Exelon underperformed when the results of an electricity price auction suggested that electricity prices might decline. Mosaic lagged when a competitor announced price cuts that generated uncertainty about the company’s revenue outlook. Exelon and Mosaic remained in the Portfolio at the end of the year because we believed that the stocks were attractively valued with strong catalysts for potential appreciation.
Did the Portfolio make any significant purchases or sales during the reporting period?
We continued to look for stocks with attractive valuations and specific catalysts that we believed could trigger appreciation over a 12- to 18-month time frame.
We added a Portfolio position in regional bank PNC Financial. We believe that the company’s new management may improve organic growth and cost efficiencies. We also added a position in diversified financial services company Bank of America. We
| 1. | Please refer to pages M-2 and M-3 for additional explanations and disclosure regarding the Portfolios, their benchmark indices and service providers mentioned in the reports. |
| | |
| M-226 | | MainStay VP ICAP Select Equity Portfolio |
believed that the company’s profits were likely to improve, driven by a meaningful decline in servicing costs for legacy assets, implementation of an $8-billion-per-year cost-cutting program and a gradual improvement in loan and revenue growth.
In addition to the previously mentioned sale, we sold positions in diversified global health care company Novartis and national retail and commercial bank Wells Fargo. Both positions were sold to pursue other positions that we believed had greater potential upside and were more attractive on a relative-valuation basis.
How did the Portfolio’s sector weightings change during the reporting period?
During the reporting period, the Portfolio increased its sector exposure relative to the Russell 1000® Value Index in consumer staples and energy. Despite these increases, the Portfolio remained underweight relative to the benchmark in both sectors.
During the reporting period, the Portfolio decreased its sector weightings relative to the Russell 1000® Value Index in health care and information technology. In health care, the Portfolio moved from an overweight position to a slightly underweight position relative to the Index. In information technology, the Portfolio reduced the degree to which it was overweight relative to the benchmark.
How was the Portfolio positioned at the end of the reporting period?
As of December 31, 2013, the Portfolio was most significantly overweight relative to the Russell 1000® Value Index in the consumer discretionary and industrials sectors. As of the same date, the Portfolio was most significantly underweight relative to the Index in financials and utilities. This positioning reflected our view on the prospects for economic growth and the relative attractiveness of individual holdings in these sectors.
The opinions expressed are those of the portfolio managers as of the date of this report and are subject to change. There is no guarantee that any forecasts made will come to pass. This material does not constitute investment advice and is not intended as an endorsement of any specific investment.
Not all MainStay VP Portfolios and/or share classes are available under all policies.
| | | | |
| mainstayinvestments.com | | | M-227 | |
Portfolio of Investments December 31, 2013
| | | | | | | | |
| | |
Shares | | |
Value | |
| Common Stocks 98.1%† | |
Aerospace & Defense 6.3% | |
Boeing Co. (The) | | | 312,650 | | | $ | 42,673,598 | |
Honeywell International, Inc. | | | 440,500 | | | | 40,248,485 | |
| | | | | | | | |
| | | | | | | 82,922,083 | |
| | | | | | | | |
Auto Components 3.5% | |
Johnson Controls, Inc. | | | 898,250 | | | | 46,080,225 | |
| | | | | | | | |
|
Automobiles 2.6% | |
Ford Motor Co. | | | 2,186,650 | | | | 33,740,010 | |
| | | | | | | | |
|
Chemicals 4.2% | |
Monsanto Co. | | | 336,000 | | | | 39,160,800 | |
Mosaic Co. (The) | | | 359,300 | | | | 16,984,111 | |
| | | | | | | | |
| | | | | | | 56,144,911 | |
| | | | | | | | |
Commercial Banks 3.6% | |
¨PNC Financial Services Group, Inc. | | | 615,000 | | | | 47,711,700 | |
| | | | | | | | |
|
Communications Equipment 2.5% | |
Cisco Systems, Inc. | | | 1,444,100 | | | | 32,420,045 | |
| | | | | | | | |
|
Consumer Finance 3.7% | |
¨Capital One Financial Corp. | | | 633,950 | | | | 48,566,910 | |
| | | | | | | | |
|
Diversified Financial Services 9.7% | |
¨Bank of America Corp. | | | 3,020,350 | | | | 47,026,849 | |
Citigroup, Inc. | | | 859,450 | | | | 44,785,940 | |
JPMorgan Chase & Co. | | | 633,950 | | | | 37,073,396 | |
| | | | | | | | |
| | | | | | | 128,886,185 | |
| | | | | | | | |
Electric Utilities 2.1% | |
Exelon Corp. | | | 1,038,150 | | | | 28,434,929 | |
| | | | | | | | |
|
Energy Equipment & Services 2.8% | |
Halliburton Co. | | | 730,350 | | | | 37,065,263 | |
| | | | | | | | |
|
Food & Staples Retailing 3.4% | |
CVS Caremark Corp. | | | 631,350 | | | | 45,185,720 | |
| | | | | | | | |
|
Health Care Equipment & Supplies 6.1% | |
¨Baxter International, Inc. | | | 710,850 | | | | 49,439,617 | |
Covidien PLC | | | 450,000 | | | | 30,645,000 | |
| | | | | | | | |
| | | | | | | 80,084,617 | |
| | | | | | | | |
Industrial Conglomerates 6.4% | |
¨General Electric Co. | | | 3,037,500 | | | | 85,141,125 | |
| | | | | | | | |
| | | | | | | | |
| | |
Shares | | |
Value | |
Insurance 2.8% | |
ACE, Ltd. | | | 363,600 | | | $ | 37,643,508 | |
| | | | | | | | |
|
Media 7.9% | |
¨Time Warner, Inc. | | | 797,674 | | | | 55,613,831 | |
¨Viacom, Inc. Class B | | | 566,600 | | | | 49,486,844 | |
| | | | | | | | |
| | | | | | | 105,100,675 | |
| | | | | | | | |
Oil, Gas & Consumable Fuels 11.3% | |
Encana Corp. | | | 900,000 | | | | 16,245,000 | |
¨Exxon Mobil Corp. | | | 719,450 | | | | 72,808,340 | |
Marathon Oil Corp. | | | 1,045,100 | | | | 36,892,030 | |
Southwestern Energy Co. (a) | | | 586,450 | | | | 23,065,078 | |
| | | | | | | | |
| | | | | | | 149,010,448 | |
| | | | | | | | |
Pharmaceuticals 6.1% | |
¨Pfizer, Inc. | | | 2,645,500 | | | | 81,031,665 | |
| | | | | | | | |
|
Semiconductors & Semiconductor Equipment 3.4% | |
Texas Instruments, Inc. | | | 1,022,633 | | | | 44,903,815 | |
| | | | | | | | |
|
Software 5.0% | |
Oracle Corp. | | | 1,058,400 | | | | 40,494,384 | |
Symantec Corp. | | | 1,109,850 | | | | 26,170,263 | |
| | | | | | | | |
| | | | | | | 66,664,647 | |
| | | | | | | | |
Wireless Telecommunication Services 4.7% | |
¨Vodafone Group PLC, Sponsored ADR | | | 1,591,050 | | | | 62,544,175 | |
| | | | | | | | |
Total Common Stocks
(Cost $970,700,381) | | | | | | | 1,299,282,656 | |
| | | | | | | | |
| | |
| | | | | | | | |
| | | Principal
Amount | | | | |
| Short-Term Investment 1.8% | |
Repurchase Agreement 1.8% | |
State Street Bank and Trust Co.
0.00%, dated 12/31/13
due 1/2/14
Proceeds at Maturity $23,376,108 (Collateralized by a Federal National Mortgage Association security with a rate of 2.17% and a maturity date of 11/7/22, with a Principal Amount of $26,195,000 and a Market Value of $23,845,701) | | $ | 23,376,108 | | | | 23,376,108 | |
| | | | | | | | |
Total Short-Term Investment
(Cost $23,376,108) | | | | | | | 23,376,108 | |
| | | | | | | | |
Total Investments
(Cost $994,076,489) (b) | | | 99.9 | % | | | 1,322,658,764 | |
Other Assets, Less Liabilities | | | 0.1 | | | | 1,316,773 | |
Net Assets | | | 100.0 | % | | $ | 1,323,975,537 | |
| † | Percentages indicated are based on Portfolio net assets. |
| ¨ | | Among the Portfolio’s 10 largest holdings, as of December 31, 2013, excluding short-term investment. May be subject to change daily. |
| | | | |
| M-228 | | MainStay VP ICAP Select Equity Portfolio | | The notes to the financial statements are an integral part of,
and should be read in conjunction with, the financial statements. |
| (a) | Non-income producing security. |
| (b) | As of December 31, 2013, cost is $995,145,675 for federal income tax purposes and net unrealized appreciation is as follows: |
| | | | |
Gross unrealized appreciation | | $ | 342,335,970 | |
Gross unrealized depreciation | | | (14,822,881 | ) |
| | | | |
Net unrealized appreciation | | $ | 327,513,089 | |
| | | | |
The following abbreviation is used in the above portfolio:
ADR—American Depositary Receipt
The following is a summary of the fair valuations according to the inputs used as of December 31, 2013, for valuing the Portfolio’s assets.
Asset Valuation Inputs
| | | | | | | | | | | | | | | | |
Description | | Quoted Prices
in Active Markets
for Identical Assets (Level 1) | | | Significant Other
Observable Inputs (Level 2) | | | Significant
Unobservable
Inputs (Level 3) | | | Total | |
| Investments in Securities (a) | | | | | | | | | | | | | | | | |
| Common Stocks | | $ | 1,299,282,656 | | | $ | — | | | $ | — | | | $ | 1,299,282,656 | |
| Short-Term Investment | | | | | | | | | | | | | | | | |
Repurchase Agreement | | | — | | | | 23,376,108 | | | | — | | | | 23,376,108 | |
| | | | | | | | | | | | | | | | |
| Total Investments in Securities | | $ | 1,299,282,656 | | | $ | 23,376,108 | | | $ | — | | | $ | 1,322,658,764 | |
| | | | | | | | | | | | | | | | |
| (a) | For a complete listing of investments and their industries, see the Portfolio of Investments. |
The Portfolio recognizes transfers between the levels as of the beginning of the period.
For the year ended December 31, 2013, the Portfolio did not have any transfers between Level 1 and Level 2 fair value measurements. (See Note 2)
As of December 31, 2013, the Portfolio did not hold any investments with significant unobservable inputs (Level 3). (See Note 2)
| | | | | | |
The notes to the financial statements are an integral part of,
and should be read in conjunction with, the financial statements. | | mainstayinvestments.com | | | M-229 | |
Statement of Assets and Liabilities as of December 31, 2013
| | | | |
| Assets | | | | |
Investment in securities, at value
(identified cost $994,076,489) | | $ | 1,322,658,764 | |
Receivables: | | | | |
Dividends and interest | | | 2,445,072 | |
Fund shares sold | | | 302,940 | |
| | | | |
Total assets | | | 1,325,406,776 | |
| | | | |
| |
| Liabilities | | | | |
Payables: | | | | |
Manager (See Note 3) | | | 835,184 | |
Fund shares redeemed | | | 362,538 | |
NYLIFE Distributors (See Note 3) | | | 127,502 | |
Shareholder communication | | | 63,911 | |
Professional fees | | | 35,871 | |
Trustees | | | 1,584 | |
Custodian | | | 1,541 | |
Accrued expenses | | | 3,108 | |
| | | | |
Total liabilities | | | 1,431,239 | |
| | | | |
Net assets | | $ | 1,323,975,537 | |
| | | | |
| |
| Net Assets Consist of | | | | |
Shares of beneficial interest outstanding (par value of $.001 per share) unlimited number of shares authorized | | $ | 75,375 | |
Additional paid-in capital | | | 1,046,168,229 | |
| | | | |
| | | 1,046,243,604 | |
Undistributed net investment income | | | 17,227,683 | |
Accumulated net realized gain (loss) on investments | | | (68,078,025 | ) |
Net unrealized appreciation (depreciation) on investments | | | 328,582,275 | |
| | | | |
Net assets | | $ | 1,323,975,537 | |
| | | | |
| | | | |
Initial Class | | | | |
Net assets applicable to outstanding shares | | $ | 709,112,148 | |
| | | | |
Shares of beneficial interest outstanding | | | 40,191,773 | |
| | | | |
Net asset value per share outstanding | | $ | 17.64 | |
| | | | |
Service Class | | | | |
Net assets applicable to outstanding shares | | $ | 614,863,389 | |
| | | | |
Shares of beneficial interest outstanding | | | 35,183,226 | |
| | | | |
Net asset value per share outstanding | | $ | 17.48 | |
| | | | |
| | | | |
| M-230 | | MainStay VP ICAP Select Equity Portfolio | | The notes to the financial statements are an integral part of,
and should be read in conjunction with, the financial statements. |
Statement of Operations for the year ended December 31, 2013
| | | | |
| Investment Income (Loss) | |
Income | | | | |
Dividends (a) | | $ | 28,119,102 | |
Interest | | | 1,978 | |
| | | | |
Total income | | | 28,121,080 | |
| | | | |
Expenses | | | | |
Manager (See Note 3) | | | 9,177,419 | |
Distribution and service—Service Class (See Note 3) | | | 1,367,685 | |
Shareholder communication | | | 184,979 | |
Professional fees | | | 98,132 | |
Trustees | | | 24,452 | |
Custodian | | | 10,852 | |
Miscellaneous | | | 30,955 | |
| | | | |
Total expenses | | | 10,894,474 | |
| | | | |
Net investment income (loss) | | | 17,226,606 | |
| | | | |
|
| Realized and Unrealized Gain (Loss) on Investments | |
Net realized gain (loss) on investments | | | 129,267,376 | |
Net change in unrealized appreciation (depreciation) on investments | | | 168,945,935 | |
| | | | |
Net realized and unrealized gain (loss) on investments | | | 298,213,311 | |
| | | | |
Net increase (decrease) in net assets resulting from operations | | $ | 315,439,917 | |
| | | | |
| (a) | Dividends recorded net of foreign withholding taxes in the amount of $286,335. |
| | | | | | |
The notes to the financial statements are an integral part of,
and should be read in conjunction with, the financial statements. | | mainstayinvestments.com | | | M-231 | |
Statements of Changes in Net Assets
for the years ended December 31, 2013 and December 31, 2012
| | | | | | | | |
| | | 2013 | | | 2012 | |
| Increase (Decrease) in Net Assets | |
Operations: | | | | | | | | |
Net investment income (loss) | | $ | 17,226,606 | | | $ | 18,024,030 | |
Net realized gain (loss) on investments | | | 129,267,376 | | | | 30,058,160 | |
Net change in unrealized appreciation (depreciation) on investments | | | 168,945,935 | | | | 109,454,583 | |
| | | | |
Net increase (decrease) in net assets resulting from operations | | | 315,439,917 | | | | 157,536,773 | |
| | | | |
Dividends to shareholders: | | | | | | | | |
From net investment income: | | | | | | | | |
Initial Class | | | (10,361,894 | ) | | | (12,939,217 | ) |
Service Class | | | (7,662,118 | ) | | | (9,049,625 | ) |
| | | | |
Total dividends to shareholders | | | (18,024,012 | ) | | | (21,988,842 | ) |
| | | | |
Capital share transactions: | | | | | | | | |
Net proceeds from sale of shares | | | 74,918,432 | | | | 54,592,941 | |
Net asset value of shares issued to shareholders in reinvestment of dividends | | | 18,024,012 | | | | 21,988,842 | |
Cost of shares redeemed | | | (146,983,317 | ) | | | (191,921,510 | ) |
| | | | |
Increase (decrease) in net assets derived from capital share transactions | | | (54,040,873 | ) | | | (115,339,727 | ) |
| | | | |
Net increase (decrease) in net assets | | | 243,375,032 | | | | 20,208,204 | |
|
| Net Assets | |
Beginning of year | | | 1,080,600,505 | | | | 1,060,392,301 | |
| | | | |
End of year | | $ | 1,323,975,537 | | | $ | 1,080,600,505 | |
| | | | |
Undistributed net investment income at end of year | | $ | 17,227,683 | | | $ | 18,023,969 | |
| | | | |
| | | | |
| M-232 | | MainStay VP ICAP Select Equity Portfolio | | The notes to the financial statements are an integral part of,
and should be read in conjunction with, the financial statements. |
Financial Highlights selected per share data and ratios
| | | | | | | | | | | | | | | | | | | | |
| | | Initial Class | |
| | | Year ended December 31, | |
| | | 2013 | | | 2012 | | | 2011 | | | 2010 | | | 2009 | |
Net asset value at beginning of year | | $ | 13.76 | | | $ | 12.15 | | | $ | 12.54 | | | $ | 10.70 | | | $ | 8.41 | |
| | | | | | | | | | | | | | | | | | | | |
Net investment income (loss) | | | 0.28 | | | | 0.29 | | | | 0.25 | (a) | | | 0.18 | | | | 0.11 | |
Net realized and unrealized gain (loss) on investments | | | 3.86 | | | | 1.61 | | | | (0.46 | ) | | | 1.76 | | | | 2.36 | |
| | | | | | | | | | | | | | | | | | | | |
Total from investment operations | | | 4.14 | | | | 1.90 | | | | (0.21 | ) | | | 1.94 | | | | 2.47 | |
| | | | | | | | | | | | | | | | | | | | |
Less dividends: | | | | | | | | | | | | | | | | | | | | |
From net investment income | | | (0.26 | ) | | | (0.29 | ) | | | (0.18 | ) | | | (0.10 | ) | | | (0.18 | ) |
| | | | | | | | | | | | | | | | | | | | |
Net asset value at end of year | | $ | 17.64 | | | $ | 13.76 | | | $ | 12.15 | | | $ | 12.54 | | | $ | 10.70 | |
| | | | | | | | | | | | | | | | | | | | |
Total investment return | | | 30.29 | % | | | 15.58 | % | | | (1.44 | %) | | | 18.12 | % | | | 29.41 | % |
Ratios (to average net assets)/Supplemental Data: | | | | | | | | | | | | | | | | | | | | |
Net investment income (loss) | | | 1.54 | % | | | 1.76 | % | | | 2.01 | % | | | 1.46 | % | | | 1.32 | % |
Net expenses | | | 0.79 | % | | | 0.79 | % | | | 0.80 | % | | | 0.81 | % | | | 0.80 | % |
Expenses (before waiver/reimbursement) | | | 0.79 | % | | | 0.79 | % | | | 0.80 | % | | | 0.81 | % | | | 0.82 | % |
Portfolio turnover rate | | | 50 | % | | | 60 | % | | | 67 | % | | | 57 | % | | | 85 | % |
Net assets at end of year (in 000’s) | | $ | 709,112 | | | $ | 604,786 | | | $ | 608,551 | | | $ | 731,165 | | | $ | 686,907 | |
| (a) | Per share data based on average shares outstanding during the year. |
| | | | | | | | | | | | | | | | | | | | |
| | | Service Class | |
| | | Year ended December 31, | |
| | | 2013 | | | 2012 | | | 2011 | | | 2010 | | | 2009 | |
Net asset value at beginning of year | | $ | 13.63 | | | $ | 12.05 | | | $ | 12.43 | | | $ | 10.62 | | | $ | 8.36 | |
| | | | | | | | | | | | | | | | | | | | |
Net investment income (loss) | | | 0.20 | | | | 0.22 | | | | 0.22 | (a) | | | 0.13 | | | | 0.07 | |
Net realized and unrealized gain (loss) on investments | | | 3.87 | | | | 1.62 | | | | (0.45 | ) | | | 1.76 | | | | 2.35 | |
| | | | | | | | | | | | | | | | | | | | |
Total from investment operations | | | 4.07 | | | | 1.84 | | | | (0.23 | ) | | | 1.89 | | | | 2.42 | |
| | | | | | | | | | | | | | | | | | | | |
Less dividends: | | | | | | | | | | | | | | | | | | | | |
From net investment income | | | (0.22 | ) | | | (0.26 | ) | | | (0.15 | ) | | | (0.08 | ) | | | (0.16 | ) |
| | | | | | | | | | | | | | | | | | | | |
Net asset value at end of year | | $ | 17.48 | | | $ | 13.63 | | | $ | 12.05 | | | $ | 12.43 | | | $ | 10.62 | |
| | | | | | | | | | | | | | | | | | | | |
Total investment return | | | 29.96 | % | | | 15.29 | % | | | (1.69 | %) | | | 17.82 | % | | | 29.09 | % |
Ratios (to average net assets)/Supplemental Data: | | | | | | | | | | | | | | | | | | | | |
Net investment income (loss) | | | 1.29 | % | | | 1.51 | % | | | 1.77 | % | | | 1.21 | % | | | 1.04 | % |
Net expenses | | | 1.04 | % | | | 1.04 | % | | | 1.05 | % | | | 1.06 | % | | | 1.05 | % |
Expenses (before waiver/reimbursement) | | | 1.04 | % | | | 1.04 | % | | | 1.05 | % | | | 1.06 | % | | | 1.07 | % |
Portfolio turnover rate | | | 50 | % | | | 60 | % | | | 67 | % | | | 57 | % | | | 85 | % |
Net assets at end of year (in 000’s) | | $ | 614,863 | | | $ | 475,815 | | | $ | 451,841 | | | $ | 481,355 | | | $ | 400,773 | |
| (a) | Per share data based on average shares outstanding during the year. |
| | | | | | |
The notes to the financial statements are an integral part of,
and should be read in conjunction with, the financial statements. | | mainstayinvestments.com | | | M-233 | |
MainStay VP Income Builder Portfolio
Investment and Performance Comparison (Unaudited)
Performance data quoted represents past performance. Past performance is no guarantee of future results. Because of market volatility, current performance may be lower or higher than the figures shown. Investment return and principal value will fluctuate, and as a result, when shares are redeemed, they may be worth more or less than their original cost. The performance table and graph do not reflect any deduction of sales charges, mortality and expense charges, contract charges or administrative charges. Please refer to the Performance Summary appropriate for your policy. For performance information current to the most recent month-end, please call 800-598-2019 or visit www.newyorklife.com.
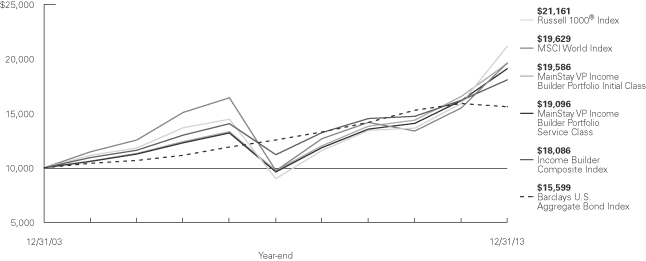
Average Annual Total Returns for the Year Ended December 31, 2013
| | | | | | | | | | | | | | | | |
| Class | | One Year | | | Five Years | | | Ten Years1 | | | Gross
Expense
Ratio2 | |
| Initial Class Shares | | | 18.38 | % | | | 14.98 | % | | | 6.95 | % | | | 0.64 | % |
| Service Class Shares | | | 18.08 | | | | 14.69 | | | | 6.68 | | | | 0.89 | |
| | | | | | | | | | | | |
| Benchmark Performance | | One
Year | | | Five
Years | | | Ten
Years | |
MSCI World Index3 | | | 26.68 | % | | | 15.02 | % | | | 6.98 | % |
Russell 1000® Index3 | | | 33.11 | | | | 18.59 | | | | 7.78 | |
Income Builder Composite Index3 | | | 11.56 | | | | 10.03 | | | | 6.10 | |
Barclays U.S. Aggregate Bond Index3 | | | –2.02 | | | | 4.44 | | | | 4.55 | |
Average Lipper Variable Products Mixed-Asset Target Allocation Growth Portfolio4 | | | 19.36 | | | | 13.98 | | | | 6.74 | |
| 1. | Performance figures shown for the ten-year period ended December 31, 2013 reflect nonrecurring reimbursements from affiliates for printing and mailing costs. If these nonrecurring reimbursements had not been made, the total returns would have been 6.93% for Initial Class shares and 6.66% for Service Class shares for the ten-year period. |
| 2. | The gross expense ratios presented reflect the Portfolio’s “Total Annual Portfolio Operating Expenses” from the most recent Prospectus and may differ from other expense ratios disclosed in this report. |
| 3. | Please refer to pages M-2 and M-3 for additional explanations and disclosure regarding the Portfolios, their benchmark indices and other indices mentioned in the reports. |
| 4. | The Average Lipper Variable Products Mixed-Asset Target Allocation Growth Portfolio is representative of portfolios that, by portfolio practice, maintain a mix of between 60%-80% equity securities, with the remainder invested in bonds, cash, and cash equivalents. Lipper Inc. is an independent monitor of fund performance. Results are based on total returns with all dividend and capital gain distributions reinvested. |
| | |
| M-234 | | MainStay VP Income Builder Portfolio |
Cost in Dollars of a $1,000 Investment in MainStay VP Income Builder Portfolio (Unaudited)
The example below is intended to describe the fees and expenses borne by shareholders during the six-month period from July 1, 2013, to December 31, 2013, and the impact of those costs on your investment.
Example
As a shareholder of the Portfolio, you incur two types of costs: (1) transaction costs, including exchange fees and sales charges (loads) on purchases (as applicable), and (2) ongoing costs, including management fees, distribution and/or service (12b-1) fees, and other Portfolio expenses (as applicable). This example is intended to help you understand your ongoing costs (in dollars) of investing in the Portfolio and to compare these costs with the ongoing costs of investing in other Portfolios. The example is based on an investment of $1,000 made at the beginning of the six-month period and held for the entire period from July 1, 2013, to December 31, 2013. Shares are only sold in connection with variable life and annuity contracts and the example does not reflect any contract level or transactional fees or expenses. If these costs had been included, your costs would have been higher.
This example illustrates your Portfolio’s ongoing costs in two ways:
Actual Expenses
The second and third data columns in the table below provide information about actual account values and actual expenses. You may use the information in these columns, together with the amount you invested, to estimate the
expenses that you paid during the six months ended
December 31, 2013. Simply divide your account value by $1,000 (for example, an $8,600 account value divided by $1,000 = 8.6), then multiply the result by the number under the heading entitled “Expenses Paid During Period” to estimate the expenses you paid on your account during this period.
Hypothetical Example for Comparison Purposes
The fourth and fifth data columns in the table below provide information about hypothetical account values and hypothetical expenses based on the Portfolio’s actual expense ratio and an assumed rate of return of 5% per year before expenses, which is not the Portfolio’s actual return. The hypothetical account values and expenses may not be used to estimate the actual ending account balances or expenses you paid for the six-month period shown. You may use this information to compare the ongoing costs of investing in the Portfolio with the ongoing costs of investing in other Portfolios. To do so, compare this 5% hypothetical example with the 5% hypothetical examples that appear in the shareholder reports of the other Portfolios.
Please note that the expenses shown in the table are meant to highlight your ongoing costs only and do not reflect any transactional costs, such as exchange fees or sales charges (loads). Therefore, the fourth and fifth data columns of the table are useful in comparing ongoing costs only and will not help you determine the relative total costs of owning different funds. In addition, if these transactional costs were included, your costs would have been higher.
| | | | | | | | | | | | | | | | | | | | |
| | | | | | | | | | | | | | | | |
| Share Class | | Beginning
Account
Value
7/1/13 | | | Ending Account
Value (Based
on Actual
Returns and
Expenses)
12/31/13 | | | Expenses
Paid
During
Period1 | | | Ending Account
Value (Based
on Hypothetical
5% Annualized
Return and
Actual Expenses)
12/31/13 | | | Expenses
Paid
During
Period1 | |
| | | | | |
| Initial Class Shares | | $ | 1,000.00 | | | $ | 1,108.30 | | | $ | 3.40 | | | $ | 1,022.00 | | | $ | 3.26 | |
| | | | | |
| Service Class Shares | | $ | 1,000.00 | | | $ | 1,106.90 | | | $ | 4.73 | | | $ | 1,020.70 | | | $ | 4.53 | |
| 1. | Expenses are equal to the Portfolio’s annualized expense ratio of each class (0.64% for Initial Class and 0.89% for Service Class) multiplied by the average account value over the period, divided by 365 and multiplied by 184 (to reflect the six-month period). The table above represents the actual expenses incurred during the six-month period. |
| | | | |
| mainstayinvestments.com | | | M-235 | |
Portfolio Composition as of December 31, 2013 (Unaudited)
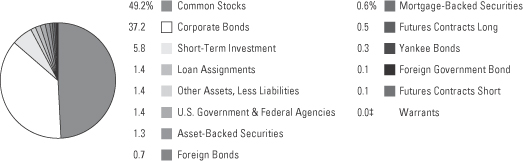
See Portfolio of Investments beginning on page M-242 for specific holdings within these categories.
| ‡ | Less than one-tenth of a percent. |
Top Ten Holdings or Issuers Held as of December 31, 2013 (excluding short-term investment) (Unaudited)
| 2. | AstraZeneca PLC, Sponsored ADR |
| 3. | Imperial Tobacco Group PLC |
| 10. | MGM Resorts International, 6.75%, due 10/1/20 |
| | |
| M-236 | | MainStay VP Income Builder Portfolio |
Portfolio Management Discussion and Analysis (Unaudited)
Answers to the questions reflect the views of portfolio managers Dan Roberts, PhD, Michael Kimble, Louis N. Cohen, and Tayler Wagenseil of MacKay Shields LLC, the Subadvisor for the fixed-income portion of the Portfolio, and Eric Sappenfield, William Priest, CFA, and Michael Welhoelter, CFA, of Epoch Investment Partners, Inc., the Subadvisor for the equity portion of the Portfolio.
How did MainStay VP Income Builder Portfolio perform relative to its benchmark and peers for the 12 months ended December 31, 2013?
For the 12 months ended December 31, 2013, MainStay VP Income Builder Portfolio returned 18.38% for Initial Class shares and 18.08% for Service Class shares. Over the same period, both share classes underperformed the 26.68% return of the MSCI World Index,1 which is the Portfolio’s broad-based securities-market index, and the 33.11% return of the Russell 1000® Index,1 which is a secondary benchmark of the Portfolio. Over the same period, both share classes outperformed the –2.02% return of the Barclays U.S. Aggregate Bond Index1 and the 11.56% return of the Income Builder Composite Index.1 The Barclays U.S. Aggregate Bond Index and the Income Builder Composite Index are additional benchmarks of the Portfolio. Over the same period, both share classes underperformed the 19.36% return of the average Lipper1 Variable Products Mixed-Asset Target Allocation Growth Portfolio.
What factors affected relative performance in the equity portion of the Portfolio during the reporting period?
In the equity portion of the Portfolio, performance relative to the MSCI World Index was hurt by an overweight position in the utilities sector, which lagged the return of the overall market represented by the MSCI World Index. Security selection within telecommunication services was also a detractor from relative performance.
From a country perspective, security selection within the United States reduced returns relative to the MSCI World Index in the equity portion of the Portfolio. An overweight position in the U.K., which underperformed the overall market, also detracted. The materials sector was the most substantially positive contributor, with sector allocation and security selection both adding to relative results. (Contributions take weightings and total returns into account.) Security selection in the industrials sector also helped performance relative to the MSCI World Index.
During the reporting period, how was the Portfolio’s performance materially affected by investments in derivatives?
During the reporting period, Epoch did not use any derivatives. MacKay Shields, however, had a substantial position in S&P 500® Index equity futures to raise the Portfolio’s overall equity sensitivity. This position had a positive impact on the Portfolio’s overall performance. During the reporting period, MacKay Shields also used U.S. Treasury Note futures to lower the duration and interest-rate sensitivity of the fixed-income portion of the Portfolio. This position had a positive impact on performance, but to a lesser degree than the equity futures. Historically, forward currency contracts have been used as a hedge to lower the volatility of the Portfolio’s currency exposure when stocks and/or bonds are purchased in local currencies rather than the U.S. dollar. During the reporting period our currency hedge had a negative impact on performance.
Which sectors were the strongest positive contributors to relative performance in the equity portion of the Portfolio, and which sectors were particularly weak?
Returns in the equity portion of the Portfolio are primarily the result of finding companies that can increase their free cash flow and are committed to returning a significant portion of that cash to shareholders. The majority of stocks in the equity portion of the Portfolio were able to achieve these objectives and increase their dividends during the reporting period. We believe that understanding this steady approach is more helpful to understanding returns than parsing returns in terms of sector weights and relative returns within those sectors. That said, sector commentary may provide additional insight if it is viewed in the proper context for this strategy.
In the equity portion of the Portfolio, the materials sector provided the most significant contribution, with sector allocation and security selection both adding to relative results. Security selection within industrials and information technology also helped. The Portfolio’s overweight position in the utilities sector, which lagged the returns of the overall market represented by the MSCI World Index, was the biggest detractor from relative results. Security selection in
| 1. | Please refer to pages M-2 and M-3 for additional explanations and disclosure regarding the Portfolios, their benchmark indices and service providers mentioned in the reports. |
| | | | |
| mainstayinvestments.com | | | M-237 | |
telecommunication services hurt relative results, and cash was a detractor in a rapidly rising market.
During the reporting period, which individual stocks made the strongest positive contributions to the absolute performance of the equity portion of the Portfolio and which stocks detracted the most?
Global wireless telecommunications company Vodafone was the strongest contributor to absolute performance in the equity portion of the Portfolio. The company continued to benefit from speculation about sector consolidation. Despite challenging operations in Europe and emerging markets, rumors of bids from AT&T, Softbank and others drove Vodafone’s stock price higher. The sale of the company’s 45% stake in Verizon Wireless has received necessary government approvals, and the company is currently seeking shareholder approval. The sale is expected to close in early 2014.
Defense contractor Lockheed Martin was another substantial positive contributor. The stock rose in the fourth quarter of 2013 as the company recovered from the U.S. government shutdown and garnered new business. Further helping defense contractors in general was the year-end budget resolution that softened some of the forced spending cuts in the defense budget. Lockheed’s renewed international focus has helped the company partially offset the negative impact of sequestration. Improved operating efficiencies throughout the year led to strong free cash flow, which was returned to shareholders through cash dividends and share buybacks. Lockheed continues to significantly reduce its pension liabilities with incremental contributions.
Germany-based luxury automobile and truck manufacturer Daimler benefited from an increase in anticipated sales for the new model cycle at Mercedes and the associated earnings momentum and an improvement in truck demand. There are early signs that the company’s operational changes to address relative underperformance in the Chinese auto market are beginning to gain traction. This gave us confidence in the company’s ability to pay an attractive dividend and drive cash flow growth going forward.
Among the major detractors from absolute performance in the equity portion of the Portfolio was FirstGroup, a U.K.-based rail and bus operator. In May, the company issued a dilutive rights offering and canceled its final dividend for 2013. The company’s chairman,
who resigned the next day, designated the proceeds to reduce debt incurred to acquire Laidlaw, now First Student. The equity portion of the Portfolio exited its position in the stock.
Rural U.S. telecommunications provider CenturyLink also detracted. The company’s share price fell significantly during the first quarter of 2013 because of a reduction in the cash dividend. Despite an increase in total shareholder yield from an even larger share buyback program, the stock has not recovered. While the company has generated significant cash and returned more to shareholders than expected, it has not integrated recent acquisitions well enough to meet cash-flow growth expectations.
Health Care REIT, an owner/lessor of senior housing and other health care real estate, also detracted from absolute performance in the equity portion of the Portfolio. As the U.S. economy improved and discussions around reduced Federal Reserve stimulus led to higher interest rates, the stock sold off. One potential offset to higher rates would be an increase in assets under management; but during the last quarter of the year, the market for new properties cooled, slowing growth expectations.
All of these detractors had negative total returns for the reporting period.
Did the Portfolio make any significant equity purchases or sales during the reporting period?
The equity portion of the Portfolio made several significant purchases during the year, including consumer electronics giant Apple and the world’s largest mining company, BHP Billiton. Apple shares were added to the Portfolio after the company announced a significant increase in its capital return program: a 15% increase in the current dividend and a $50 billion increase in the existing share repurchase program. With annual cash payments amounting to about $11 billion, the dividends will represent one of the largest dividends paid in the world. BHP Billiton pays a 3.29% cash dividend. The payout is well covered by operating cash flow less capital expenditures. Growth in cash flow in 2014 is expected to come from higher commodity pricing and operating efficiencies.
We exited several positions, including ATM maker Diebold and U.K.-based rail and bus operator FirstGroup. We sold Diebold stock on the view that an escalating slowdown among U.S. regional banks would hurt earnings and cash flows. We sold FirstGroup, as
| | |
| M-238 | | MainStay VP Income Builder Portfolio |
mentioned above, after a rights offering moved its capital allocation policy away from dividends.
In January, Abbott Laboratories split into two parts. As a result of the deal, we retained and added to AbbVie, the biotechnology and pharmaceutical part of the business, which has a higher dividend commitment. We sold Abbott Labs, which has a lower dividend payment but a higher growth component.
How did sector weightings change in the equity portion of the Portfolio during the reporting period?
Sector weights are generally a function of our bottom-up stock selection process. During the reporting period, the Portfolio reduced exposure to consumer staples, consumer discretionary, information technology and health care. The largest increases in sector weightings in the equity portion of the Portfolio were in materials, utilities and financials.
How was the equity portion of the Portfolio positioned at the end of the reporting period?
The equity portion of the Portfolio continues to seek attractive returns through a diversified group of companies focused on generating significant free cash flow and returning it to shareholders through a combination of dividends, share repurchases and debt reduction. That stock-by-stock selection process often results in the Portfolio having a different composition than the MSCI World Index. Specifically, the benchmark contains many companies that either lack free cash flow or use their free cash flow primarily to reinvest and make acquisitions. The composition of the equity portion of the Portfolio may also differ in terms of sector weights.
As of December 31, 2013, the equity portion of the Portfolio held underweight positions in relation to the MSCI World Index in the financials, information technology and consumer discretionary sectors. As of the same date, the equity portion of the Portfolio held underweight positions relative to the Index in the utilities and telecommunication services sectors.
Our position remains consistent with past practices of seeking high-quality companies producing shareholder yield returns in a steadily improving global economy.
What factors affected relative performance in the fixed-income portion of the Portfolio during the reporting period?
For calendar year 2013, the fixed-income portion of the Portfolio outperformed the Barclays U.S. Aggregate Bond Index. The outperformance was primarily driven by an overweight position in spread2 product, more specifically high-yield corporate bonds. High-yield corporate bonds were the best-performing fixed-income sector in 2013. The best-performing high-yield industries included food & drug, broadcasting and consumer durables while the worst performers were wireless, utility and cable. For the year, $340 billion in new supply was just shy of 2012 levels. Most of the issuance (approximately 60%) was for refinancing activity, whereas in 2008 most high-yield issuers used deal proceeds for acquisitions and buyouts.
In the high-yield sector, the industries we favored during the year included gaming, airlines, autos and energy. Revenue and earnings trends improved over the course of the year as companies showed discipline in maintaining relatively modest leverage ratios. Two-year U.S. Treasury futures contracts remained our preferred means of reducing interest-rate risk. The hedge contributed to overall performance as yields in the front end of the U.S. Treasury yield curve3 rose 10 basis points. (A basis point is one-hundredth of a percentage point.)
Corporate investment-grade bonds were the best-performing investment-grade sector within fixed-income markets during the reporting period. Despite this significant outperformance, U.S. corporate bonds delivered negative total returns in 2013 for the first time since 2008. Within the corporate universe, the return differences for financial and nonfinancial companies were significant. Financial companies returned 0.9%, but nonfinancial companies returned –2.7%. For this reason, an overweight position in the financial sector was beneficial to relative performance in the fixed-income portion of the Portfolio in 2013.
During the reporting period, U.S. Treasury securities and agency mortgages underperformed spread product. Fortunately, the fixed-income portion of the Portfolio held underweight positions in these asset
| 2. | The terms “spread” and “yield spread” may refer to the difference in yield between a security or type of security and comparable U.S. Treasury issues. The terms may also refer to the difference in yield between two specific securities or types of securities at a given time. The term “spread product” is a generic term for individual securities or asset classes that typically trade at a spread to U.S. Treasury securities. |
| 3. | The yield curve is a line that plots the yields of various securities of similar quality—typically U.S. Treasury issues—across a range of maturities. The U.S. Treasury yield curve serves as a benchmark for other debt and is used in economic forecasting. |
| | | | |
| mainstayinvestments.com | | | M-239 | |
classes, which helped performance relative to the Barclays U.S. Aggregate Bond Index.
What was the duration4 strategy of the fixed-income portion of the Portfolio during the reporting period?
The duration of the fixed-income portion of the Portfolio was shorter than that of the Barclays U.S. Aggregate Bond Index throughout the reporting period for two reasons. First, the fixed-income portion of the Portfolio held an overweight position in high-yield corporate bonds. These bonds tend to have shorter durations than investment-grade corporate bonds. They also tend to have a lower correlation to U.S. Treasury securities, so they have a lower sensitivity to interest rates, although they are not immune. Second, we increased exposure to a short position in U.S. Treasury securities through futures to lower the overall duration of the fixed-income portion of the Portfolio and hedge against a rise in interest rates. The exposure to lower-duration high-yield securities positively affected performance in the fixed-income portion of the Portfolio. Our exposure to U.S. Treasury futures also added to performance, but to a lesser extent.
What specific factors, risks or market forces prompted significant decisions for the Portfolio during the reporting period?
During the reporting period, there were many macro factors to consider. Among these were the Federal Reserve’s comments at the end of the second quarter about possibly tapering bond purchases. As a result, the fixed-income portion of the Portfolio experienced some periods of volatility. Nevertheless, we did not make any material changes to the positioning of the fixed-income portion of the Portfolio.
Since the inception of the Portfolio, we had judged the Federal Reserve’s accommodative monetary policy, along with improving economic data, to be a positive for spread product such as high-yield corporate bonds. In addition, improving profitability signaled that many corporations were doing more with less: less leverage, less short-term debt and smaller funding gaps. In our opinion, improving credit fundamentals would support narrower spreads—or less compensation for assuming credit risk—alongside a favorable
balance of supply and demand for corporate debt. For these reasons, the fixed-income portion of the Portfolio has maintained a risk profile that was and is higher than that of the Barclays U.S. Aggregate Bond Index—specifically, an overweight in high-yield bonds.
During the reporting period, which market segments were the strongest positive contributors to the performance of the fixed-income portion of the Portfolio and which market segments were particularly weak?
An overweight position in high-yield bonds, which outperformed the Barclays U.S. Aggregate Bond Index, was the driving force behind the outperformance of the fixed-income portion of the Portfolio in 2013. (The Barclay’s U.S. Aggregate Bond Index consists entirely of investment-grade bonds.) Relative performance in the fixed-income portion of the Portfolio also benefited from positions in convertible bonds and bank loans, but to a lesser degree. Though our positions in investment-grade credit performed well relative to the Barclays U.S. Aggregate Bond Index, investment-grade bonds underperformed high-yield bonds during the reporting period.
With an overweight position in high-yield corporate bonds came underweight positions in U.S. Treasury securities and agency mortgages. These underweight positions contributed to the relative performance of the fixed-income portion of the Portfolio, as U.S. Treasury and agency securities had negative absolute returns for the reporting period. Overall, the positioning of the fixed-income portion of the Portfolio did not change much during the reporting period. Our bias toward more cyclical segments of the market, such as financials, gaming, homebuilders, building materials and steel companies, continued to perform well.
Did the fixed-income portion of the Portfolio make any significant purchases or sales during the reporting period?
While there were no significant changes in the overall positioning of the fixed-income portion of the Portfolio during the reporting period, we added some positions and eliminated others. We purchased bonds of air carrier U.S. Airways Group, drug company Valeant Pharmaceuticals International and tele
| 4. | Duration is a measure of the price sensitivity of a fixed-income investment to changes in interest rates. Duration is expressed as a number of years and is considered a more accurate sensitivity gauge than average maturity. |
| | |
| M-240 | | MainStay VP Income Builder Portfolio |
communications company Sprint. We bought the bonds of U.S. Airways Group because we believed that the fundamental landscape for airlines had improved. With consolidation and more revenue from ancillary services, airlines have been able to book relatively solid results. The Valeant Pharmaceuticals International bonds were issued to fund the company’s acquisition of Bausch and Lomb. The Sprint bonds were issued to fund a comprehensive capital-expenditure program, as the company was being acquired by Softbank, an investment-grade company. We believed that the bonds from Valeant Pharmaceuticals International and Sprint were issued at attractive levels.
During the reporting period, the fixed-income portion of the Portfolio sold positions in oil & gas exploration & production company Plains Exploration & Production, electric utility Energy Future Holdings, and telecommunications equipment company Lucent Technologies. We sold the Plains Exploration & Production bonds after the company was upgraded to investment-grade following its acquisition by Freeport-McMoRan Copper & Gold. The fixed-income portion of the Port-folio had owned the secured bonds of Energy Future Holdings, which performed well during the reporting period. In our view, however, the company had too much debt given its earnings power, and many inves-tors expect the company to file for bankruptcy. In light of these factors, we did not think it prudent to main-tain the position. The bonds of Lucent Technologies rebounded during the reporting period, as the com-pany refinanced debt and produced better results. The bonds, however, rose to a level that, in our view, made them unattractive given their long duration and relatively tight spread.
How did sector weightings change in the fixed-income portion of the Portfolio during the reporting period?
Although there were no significant changes in the positioning of the fixed-income portion of the Portfolio during the reporting period, we did add some new holdings to the Portfolio and eliminate others. Any changes in sector weightings were driven more by individual security selection than by sector rotation.
How was the fixed-income portion of the Portfolio positioned at the end of the reporting period?
In spite of volatility in the markets, our baseline view on Federal Reserve policy, economic fundamentals and valuations within the credit markets has not changed. We firmly believe that economic growth will continue to be moderate and that the Federal Reserve will remain highly accommodative. Our central belief is that monetary policy plays a critical role in the creation of credit and that the Federal Reserve has the ability to control monetary policy through its influence on short-term interest rates.
As of December 31, 2013, the fixed-income portion of the Portfolio maintained an overweight position relative to the Barclays U.S. Aggregate Bond Index in spread product, specifically high-yield bonds. As of the same date, the fixed-income portion of the Portfolio maintained underweight positions in sectors that were more rate sensitive, such as U.S. Treasury and agency securities. As of December 31, the duration of the fixed-income portion of the Portfolio was shorter than that of the Barclays U.S. Aggregate Bond Index.
The opinions expressed are those of the portfolio managers as of the date of this report and are subject to change. There is no guarantee that any forecasts will come to pass. This material does not constitute investment advice and is not intended as an endorsement of any specific investment.
Not all MainStay VP Portfolios and/or share classes are available under all policies.
| | | | |
| mainstayinvestments.com | | | M-241 | |
Portfolio of Investments December 31, 2013
| | | | | | | | |
| | | Principal
Amount | | | Value | |
Long-Term Bonds 43.0%† Asset-Backed Securities 1.3% | |
Airlines 0.3% | |
Northwest Airlines, Inc.
Series 2007-1, Class A
7.027%, due 5/1/21 | | $ | 1,307,282 | | | $ | 1,451,083 | |
| | | | | | | | |
|
Home Equity 0.9% | |
Carrington Mortgage Loan Trust
Series 2006-NC4, Class A5
0.225%, due 10/25/36 (a)(b) | | | 377,257 | | | | 316,785 | |
Citigroup Mortgage Loan Trust
Series 2007-AHL2, Class A3A
0.235%, due 5/25/37 (a)(b) | | | 446,928 | | | | 327,930 | |
GSAA Home Equity Trust
Series 2006-14, Class A1
0.215%, due 9/25/36 (a)(b) | | | 2,611,535 | | | | 1,320,363 | |
HSI Asset Securitization Corp. Trust
Series 2007-NC1, Class A1
0.265%, due 4/25/37 (a)(b) | | | 233,167 | | | | 209,177 | |
JP Morgan Mortgage Acquisition Corp.
Series 2007-HE1, Class AF1
0.265%, due 3/25/47 (a)(b) | | | 389,081 | | | | 282,484 | |
Master Asset Backed Securities Trust
Series 2006-HE4, Class A1
0.215%, due 11/25/36 (a)(b) | | | 328,623 | | | | 137,606 | |
Merrill Lynch Mortgage Investors Trust
Series 2007-MLN1, Class A2A
0.275%, due 3/25/37 (a)(b) | | | 1,322,043 | | | | 877,653 | |
Soundview Home Equity Loan Trust
Series 2006-EQ2, Class A2
0.275%, due 1/25/37 (a)(b) | | | 546,123 | | | | 328,226 | |
Specialty Underwriting & Residential Finance Trust
Series 2006-BC4, Class A2B
0.275%, due 9/25/37 (a)(b) | | | 427,966 | | | | 214,355 | |
| | | | | | | | |
| | | | | | | 4,014,579 | |
| | | | | | | | |
Student Loans 0.1% | |
Keycorp Student Loan Trust
Series 2000-A, Class A2
0.558%, due 5/25/29 (b) | | | 448,634 | | | | 414,729 | |
| | | | | | | | |
Total Asset-Backed Securities
(Cost $6,241,094) | | | | | | | 5,880,391 | |
| | | | | | | | |
|
| Corporate Bonds 37.2% | |
Aerospace & Defense 0.8% | | | | | | | | |
B/E Aerospace, Inc.
5.25%, due 4/1/22 | | | 1,125,000 | | | | 1,141,875 | |
| | | | | | | | |
| | | Principal
Amount | | | Value | |
Aerospace & Defense (continued) | | | | | | | | |
BAE Systems Holdings, Inc.
5.20%, due 8/15/15 (c) | | $ | 1,325,000 | | | $ | 1,406,861 | |
TransDigm, Inc.
7.50%, due 7/15/21 | | | 725,000 | | | | 779,375 | |
| | | | | | | | |
| | | | | | | 3,328,111 | |
| | | | | | | | |
Agriculture 0.0%‡ | |
Lorillard Tobacco Co.
8.125%, due 6/23/19 | | | 165,000 | | | | 200,994 | |
| | | | | | | | |
| | |
Airlines 0.7% | | | | | | | | |
Continental Airlines, Inc.
Series A
7.25%, due 5/10/21 | | | 371,734 | | | | 425,636 | |
7.875%, due 1/2/20 | | | 869,893 | | | | 937,310 | |
U.S. Airways Group, Inc.
Series A
6.25%, due 10/22/24 | | | 628,953 | | | | 687,131 | |
U.S. Airways, Inc.
Class A Series 2012-1 Pass Through Trust
5.90%, due 4/1/26 | | | 1,037,302 | | | | 1,130,659 | |
| | | | | | | | |
| | | | | | | 3,180,736 | |
| | | | | | | | |
Auto Manufacturers 0.7% | | | | | | | | |
Chrysler Group LLC / CG Co-Issuer, Inc.
8.25%, due 6/15/21 | | | 900,000 | | | | 1,023,750 | |
Ford Motor Co.
6.625%, due 10/1/28 | | | 500,000 | | | | 561,355 | |
7.45%, due 7/16/31 | | | 455,000 | | | | 557,224 | |
Navistar International Corp.
8.25%, due 11/1/21 | | | 675,000 | | | | 698,625 | |
| | | | | | | | |
| | | | | | | 2,840,954 | |
| | | | | | | | |
Auto Parts & Equipment 0.7% | | | | | | | | |
Continental Rubber of America Corp.
4.50%, due 9/15/19 (c) | | | 950,000 | | | | 1,006,810 | |
Dana Holding Corp.
5.375%, due 9/15/21 | | | 1,035,000 | | | | 1,038,881 | |
Goodyear Tire & Rubber Co. (The)
6.50%, due 3/1/21 | | | 300,000 | | | | 318,000 | |
8.25%, due 8/15/20 | | | 525,000 | | | | 586,688 | |
| | | | | | | | |
| | | | | | | 2,950,379 | |
| | | | | | | | |
Banks 3.8% | | | | | | | | |
AgriBank FCB
9.125%, due 7/15/19 | | | 200,000 | | | | 255,726 | |
Banco Santander Mexico S.A.
4.125%, due 11/9/22 (c) | | | 1,000,000 | | | | 942,500 | |
| † | Percentages indicated are based on Portfolio net assets. |
| ¨ | | Among the Portfolio’s 10 largest holdings or issuers held, as of December 31, 2013, excluding short-term investment. May be subject to change daily. |
| | | | |
| M-242 | | MainStay VP Income Builder Portfolio | | The notes to the financial statements are an integral part of,
and should be read in conjunction with, the financial statements. |
| | | | | | | | |
| | | Principal
Amount | | | Value | |
| Corporate Bonds (continued) | |
Banks (continued) | | | | | | | | |
Bank of America Corp.
6.50%, due 8/1/16 | | $ | 50,000 | | | $ | 56,454 | |
7.625%, due 6/1/19 | | | 680,000 | | | | 843,422 | |
8.00%, due 12/29/49 (b) | | | 1,000,000 | | | | 1,108,000 | |
Bank of America NA
6.00%, due 10/15/36 | | | 990,000 | | | | 1,136,181 | |
BBVA Bancomer S.A.
6.75%, due 9/30/22 (c) | | | 875,000 | | | | 931,875 | |
CIT Group, Inc.
4.25%, due 8/15/17 | | | 200,000 | | | | 208,250 | |
5.00%, due 5/15/17 | | | 765,000 | | | | 816,638 | |
Citigroup, Inc.
3.375%, due 3/1/23 | | | 795,000 | | | | 755,659 | |
8.50%, due 5/22/19 | | | 87,500 | | | | 112,139 | |
Discover Bank
8.70%, due 11/18/19 | | | 795,000 | | | | 994,238 | |
Goldman Sachs Group, Inc. (The)
3.625%, due 1/22/23 | | | 1,330,000 | | | | 1,287,910 | |
HSBC Holdings PLC
5.10%, due 4/5/21 | | | 40,000 | | | | 44,458 | |
JPMorgan Chase & Co.
7.90%, due 12/31/49 (b) | | | 1,450,000 | | | | 1,598,625 | |
LBG Capital No.1 PLC
8.00%, due 12/29/49 (b)(c) | | | 725,000 | | | | 774,116 | |
Mellon Capital III
6.369%, due 9/5/66 (b) | | £ | 900,000 | | | | 1,505,259 | |
Morgan Stanley
4.875%, due 11/1/22 | | $ | 495,000 | | | | 506,712 | |
5.00%, due 11/24/25 | | | 1,150,000 | | | | 1,153,439 | |
Royal Bank of Scotland Group PLC
6.40%, due 10/21/19 | | | 355,000 | | | | 409,075 | |
UBS A.G.
3.875%, due 1/15/15 | | | 150,000 | | | | 155,078 | |
Wells Fargo & Co.
7.98%, due 3/29/49 (b) | | | 800,000 | | | | 892,000 | |
| | | | | | | | |
| | | | | | | 16,487,754 | |
| | | | | | | | |
Beverages 0.1% | | | | | | | | |
Embotelladora Andina S.A.
5.00%, due 10/1/23 (c) | | | 610,000 | | | | 612,019 | |
| | | | | | | | |
| | |
Biotechnology 0.3% | | | | | | | | |
Amgen, Inc.
5.85%, due 6/1/17 | | | 1,250,000 | | | | 1,418,247 | |
| | | | | | | | |
| | |
Building Materials 0.7% | | | | | | | | |
USG Corp.
6.30%, due 11/15/16 | | | 2,265,000 | | | | 2,429,212 | |
9.75%, due 1/15/18 | | | 545,000 | | | | 644,463 | |
| | | | | | | | |
| | | | | | | 3,073,675 | |
| | | | | | | | |
| | | | | | | | |
| | | Principal
Amount | | | Value | |
Chemicals 0.9% | | | | | | | | |
Dow Chemical Co. (The)
4.125%, due 11/15/21 | | $ | 710,000 | | | $ | 733,406 | |
8.55%, due 5/15/19 | | | 140,000 | | | | 180,767 | |
Hexion U.S. Finance Corp.
6.625%, due 4/15/20 | | | 780,000 | | | | 799,500 | |
Huntsman International LLC
8.625%, due 3/15/21 | | | 1,250,000 | | | | 1,412,500 | |
Rockwood Specialties Group, Inc.
4.625%, due 10/15/20 | | | 675,000 | | | | 689,344 | |
| | | | | | | | |
| | | | | | | 3,815,517 | |
| | | | | | | | |
Coal 0.1% | | | | | | | | |
Alpha Natural Resources, Inc.
6.00%, due 6/1/19 | | | 525,000 | | | | 452,813 | |
6.25%, due 6/1/21 | | | 50,000 | | | | 42,750 | |
| | | | | | | | |
| | | | | | | 495,563 | |
| | | | | | | | |
Commercial Services 0.8% | | | | | | | | |
Avis Budget Car Rental LLC / Avis Budget Finance, Inc.
5.50%, due 4/1/23 | | | 905,000 | | | | 876,719 | |
Hertz Corp. (The)
5.875%, due 10/15/20 | | | 277,000 | | | | 287,041 | |
7.375%, due 1/15/21 | | | 1,200,000 | | | | 1,317,000 | |
Quebecor World, Inc. (Litigation Recovery Trust—Escrow Shares)
9.75% (c)(d)(e)(f)(g) | | | 70,000 | | | | 1,029 | |
United Rentals North America, Inc.
8.375%, due 9/15/20 | | | 725,000 | | | | 808,375 | |
| | | | | | | | |
| | | | | | | 3,290,164 | |
| | | | | | | | |
Computers 0.5% | | | | | | | | |
NCR Corp.
5.00%, due 7/15/22 | | | 1,205,000 | | | | 1,146,256 | |
SunGard Data Systems, Inc.
6.625%, due 11/1/19 | | | 600,000 | | | | 630,000 | |
7.375%, due 11/15/18 | | | 350,000 | | | | 370,563 | |
| | | | | | | | |
| | | | | | | 2,146,819 | |
| | | | | | | | |
Cosmetics & Personal Care 0.2% | | | | | | | | |
Albea Beauty Holdings S.A.
8.375%, due 11/1/19 (c) | | | 800,000 | | | | 832,000 | |
| | | | | | | | |
| | |
Diversified Financial Services 0.5% | | | | | | | | |
Alterra Finance LLC
6.25%, due 9/30/20 | | | 75,000 | | | | 84,381 | |
GE Capital Trust II
5.50%, due 9/15/67 (b) | | € | 810,000 | | | | 1,183,027 | |
General Electric Capital Corp.
Series Reg S
6.50%, due 9/15/67 (b) | | £ | 490,000 | | | | 873,408 | |
| | | | | | | | |
| | | | | | | 2,140,816 | |
| | | | | | | | |
| | | | | | |
The notes to the financial statements are an integral part of,
and should be read in conjunction with, the financial statements. | | mainstayinvestments.com | | | M-243 | |
Portfolio of Investments December 31, 2013 (continued)
| | | | | | | | |
| | | Principal
Amount | | | Value | |
| Corporate Bonds (continued) | |
Electric 0.6% | | | | | | | | |
Abu Dhabi National Energy Co.
3.625%, due 1/12/23 (c) | | $ | 980,000 | | | $ | 911,400 | |
Great Plains Energy, Inc.
5.292%, due 6/15/22 (h) | | | 500,000 | | | | 536,440 | |
Puget Energy, Inc.
5.625%, due 7/15/22 | | | 350,000 | | | | 380,626 | |
Wisconsin Energy Corp.
6.25%, due 5/15/67 (b) | | | 681,520 | | | | 702,818 | |
| | | | | | | | |
| | | | | | | 2,531,284 | |
| | | | | | | | |
Engineering & Construction 0.2% | | | | | | | | |
MasTec, Inc.
4.875%, due 3/15/23 | | | 785,000 | | | | 741,825 | |
| | | | | | | | |
| | |
Entertainment 0.2% | | | | | | | | |
Mohegan Tribal Gaming Authority
9.75%, due 9/1/21 (c) | | | 880,000 | | | | 948,200 | |
| | | | | | | | |
| | |
Finance—Auto Loans 0.3% | | | | | | | | |
Banque PSA Finance S.A.
5.75%, due 4/4/21 (c) | | | 800,000 | | | | 804,584 | |
Ford Motor Credit Co. LLC
5.875%, due 8/2/21 | | | 150,000 | | | | 170,056 | |
General Motors Financial Co., Inc.
3.25%, due 5/15/18 (c) | | | 145,000 | | | | 145,000 | |
| | | | | | | | |
| | | | | | | 1,119,640 | |
| | | | | | | | |
Finance—Consumer Loans 0.6% | | | | | | | | |
HSBC Finance Capital Trust IX
5.911%, due 11/30/35 (b) | | | 1,100,000 | | | | 1,133,000 | |
SLM Corp.
6.25%, due 1/25/16 | | | 750,000 | | | | 810,000 | |
Springleaf Finance Corp.
7.75%, due 10/1/21 | | | 800,000 | | | | 864,000 | |
| | | | | | | | |
| | | | | | | 2,807,000 | |
| | | | | | | | |
Finance—Credit Card 0.2% | | | | | | | | |
American Express Co.
6.80%, due 9/1/66 (b) | | | 700,000 | | | | 745,850 | |
| | | | | | | | |
| |
Finance—Investment Banker/Broker 0.2% | | | | | |
Jefferies Group LLC
5.125%, due 1/20/23 | | | 320,000 | | | | 323,669 | |
6.45%, due 6/8/27 | | | 435,000 | | | | 451,996 | |
| | | | | | | | |
| | | | | | | 775,665 | |
| | | | | | | | |
Finance—Mortgage Loan/Banker 0.1% | | | | | | | | |
Countrywide Financial Corp.
6.25%, due 5/15/16 | | | 520,000 | | | | 573,819 | |
| | | | | | | | |
| | | | | | | | |
| | | Principal
Amount | | | Value | |
Finance—Other Services 0.2% | | | | | | | | |
Icahn Enterprises, L.P./Icahn Enterprises Finance Corp.
8.00%, due 1/15/18 | | $ | 725,000 | | | $ | 754,000 | |
| | | | | | | | |
| | |
Food 1.4% | | | | | | | | |
ARAMARK Corp.
5.75%, due 3/15/20 (c) | | | 1,250,000 | | | | 1,306,250 | |
Grupo Bimbo S.A.B. de C.V.
4.50%, due 1/25/22 (c) | | | 750,000 | | | | 743,693 | |
JBS USA LLC / JBS USA Finance, Inc.
8.25%, due 2/1/20 (c) | | | 435,000 | | | | 471,975 | |
Kerry Group Financial Services
3.20%, due 4/9/23 (c) | | | 1,290,000 | | | | 1,168,055 | |
Minerva Luxembourg S.A.
7.75%, due 1/31/23 (c) | | | 1,100,000 | | | | 1,091,750 | |
Smithfield Foods, Inc.
6.625%, due 8/15/22 | | | 190,000 | | | | 201,400 | |
7.75%, due 7/1/17 | | | 310,000 | | | | 363,475 | |
Virgolino de Oliveira Finance, Ltd.
11.75%, due 2/9/22 (c) | | | 750,000 | | | | 510,000 | |
| | | | | | | | |
| | | | | | | 5,856,598 | |
| | | | | | | | |
Health Care—Products 0.2% | | | | | | | | |
Alere, Inc.
7.25%, due 7/1/18 | | | 825,000 | | | | 906,469 | |
| | | | | | | | |
| | |
Health Care—Services 0.8% | | | | | | | | |
CIGNA Corp.
4.375%, due 12/15/20 | | | 135,000 | | | | 143,634 | |
Fresenius Medical Care
U.S. Finance II, Inc.
5.875%, due 1/31/22 (c) | | | 880,000 | | | | 928,400 | |
HCA, Inc.
8.00%, due 10/1/18 | | | 825,000 | | | | 974,531 | |
Tenet Healthcare Corp.
6.00%, due 10/1/20 (c) | | | 1,250,000 | | | | 1,304,688 | |
| | | | | | | | |
| | | | | | | 3,351,253 | |
| | | | | | | | |
Home Builders 1.3% | | | | | | | | |
Beazer Homes USA, Inc.
7.25%, due 2/1/23 | | | 800,000 | | | | 800,000 | |
K Hovnanian Enterprises, Inc.
7.25%, due 10/15/20 (c) | | | 2,225,000 | | | | 2,389,094 | |
MDC Holdings, Inc.
5.625%, due 2/1/20 | | | 1,100,000 | | | | 1,152,250 | |
Shea Homes, L.P. / Shea Homes Funding Corp.
8.625%, due 5/15/19 | | | 250,000 | | | | 276,875 | |
Standard Pacific Corp.
8.375%, due 5/15/18 | | | 800,000 | | | | 940,000 | |
| | | | | | | | |
| | | | | | | 5,558,219 | |
| | | | | | | | |
| | | | |
| M-244 | | MainStay VP Income Builder Portfolio | | The notes to the financial statements are an integral part of,
and should be read in conjunction with, the financial statements. |
| | | | | | | | |
| | | Principal
Amount | | | Value | |
| Corporate Bonds (continued) | |
Household Products & Wares 0.3% | | | | | | | | |
Reynolds Group Issuer, Inc.
5.75%, due 10/15/20 | | $ | 850,000 | | | $ | 867,000 | |
9.875%, due 8/15/19 | | | 205,000 | | | | 228,063 | |
| | | | | | | | |
| | | | | | | 1,095,063 | |
| | | | | | | | |
Insurance 3.9% | | | | | | | | |
Allstate Corp. (The)
6.50%, due 5/15/67 (b) | | | 1,725,000 | | | | 1,794,862 | |
American International Group, Inc.
4.875%, due 3/15/67 (b) | | € | 500,000 | | | | 680,971 | |
Series A2
5.75%, due 3/15/67 (b) | | £ | 500,000 | | | | 816,549 | |
Chubb Corp. (The)
6.375%, due 3/29/67 (b) | | $ | 730,000 | | | | 790,225 | |
Genworth Holdings, Inc.
7.625%, due 9/24/21 | | | 865,000 | | | | 1,029,345 | |
Hartford Financial Services Group, Inc.
6.10%, due 10/1/41 | | | 1,725,000 | | | | 1,972,434 | |
Hartford Life, Inc.
7.65%, due 6/15/27 | | | 245,000 | | | | 293,149 | |
ING US, Inc.
5.50%, due 7/15/22 | | | 1,265,000 | | | | 1,375,677 | |
Liberty Mutual Group, Inc.
4.25%, due 6/15/23 (c) | | | 145,000 | | | | 140,002 | |
6.50%, due 3/15/35 (c) | | | 130,000 | | | | 141,930 | |
7.80%, due 3/7/87 (c) | | | 1,195,000 | | | | 1,284,625 | |
Oil Insurance, Ltd.
3.229%, due 12/31/49 (b)(c) | | | 580,000 | | | | 507,237 | |
Pacific Life Insurance Co.
7.90%, due 12/30/23 (c) | | | 1,000,000 | | | | 1,256,859 | |
Progressive Corp. (The)
6.70%, due 6/15/67 (b) | | | 1,450,000 | | | | 1,566,000 | |
Protective Life Corp.
8.45%, due 10/15/39 | | | 625,000 | | | | 795,588 | |
Prudential Financial, Inc.
5.625%, due 6/15/43 (b) | | | 795,000 | | | | 779,100 | |
Swiss Re Capital I, L.P.
6.854%, due 5/29/49 (b)(c) | | | 600,000 | | | | 634,200 | |
XL Group PLC
6.50%, due 12/29/49 (b) | | | 945,000 | | | | 929,644 | |
| | | | | | | | |
| | | | | | | 16,788,397 | |
| | | | | | | | |
Investment Company 0.2% | | | | | | | | |
CDP Financial, Inc.
4.40%, due 11/25/19 (c) | | | 900,000 | | | | 990,769 | |
| | | | | | | | |
| | |
Iron & Steel 0.5% | | | | | | | | |
AK Steel Corp.
8.75%, due 12/1/18 | | | 800,000 | | | | 894,000 | |
| | | | | | | | |
| | | Principal
Amount | | | Value | |
Iron & Steel (continued) | | | | | | | | |
Cliffs Natural Resources, Inc.
3.95%, due 1/15/18 | | $ | 325,000 | | | $ | 328,184 | |
5.90%, due 3/15/20 | | | 465,000 | | | | 490,690 | |
Vale S.A.
5.625%, due 9/11/42 | | | 685,000 | | | | 621,831 | |
| | | | | | | | |
| | | | | | | 2,334,705 | |
| | | | | | | | |
Lodging 1.6% | | | | | | | | |
Caesars Entertainment Operating Co., Inc.
9.00%, due 2/15/20 | | | 1,225,000 | | | | 1,191,313 | |
¨MGM Resorts International
6.75%, due 10/1/20 | | | 3,468,000 | | | | 3,710,760 | |
Starwood Hotels & Resorts Worldwide, Inc.
6.75%, due 5/15/18 | | | 865,000 | | | | 1,001,162 | |
7.15%, due 12/1/19 | | | 125,000 | | | | 149,269 | |
Wynn Las Vegas LLC / Wynn Las Vegas Capital Corp.
7.75%, due 8/15/20 | | | 675,000 | | | | 757,687 | |
| | | | | | | | |
| | | | | | | 6,810,191 | |
| | | | | | | | |
Media 0.9% | | | | | | | | |
CCO Holdings LLC / CCO Holdings Capital Corp.
5.75%, due 1/15/24 | | | 690,000 | | | | 652,050 | |
Clear Channel Communications, Inc. 5.50%, due 12/15/16 | | | 35,000 | | | | 30,800 | |
6.875%, due 6/15/18 | | | 675,000 | | | | 573,750 | |
9.00%, due 3/1/21 | | | 275,000 | | | | 277,750 | |
Comcast Corp.
5.70%, due 7/1/19 | | | 800,000 | | | | 924,613 | |
DISH DBS Corp.
7.125%, due 2/1/16 | | | 600,000 | | | | 664,500 | |
NBC Universal Media LLC
5.15%, due 4/30/20 | | | 55,000 | | | | 61,476 | |
Time Warner Cable, Inc.
8.25%, due 2/14/14 | | | 200,000 | | | | 201,717 | |
8.75%, due 2/14/19 | | | 355,000 | | | | 423,459 | |
Time Warner, Inc.
7.70%, due 5/1/32 | | | 115,000 | | | | 147,657 | |
| | | | | | | | |
| | | | | | | 3,957,772 | |
| | | | | | | | |
Mining 0.8% | | | | | | | | |
Aleris International, Inc.
7.875%, due 11/1/20 | | | 850,000 | | | | 903,125 | |
FMG Resources August 2006 Pty, Ltd.
8.25%, due 11/1/19 (c) | | | 900,000 | | | | 1,010,250 | |
Rio Tinto Finance USA, Ltd.
9.00%, due 5/1/19 | | | 650,000 | | | | 848,654 | |
Vedanta Resources PLC
8.25%, due 6/7/21 (c) | | | 820,000 | | | | 823,075 | |
| | | | | | | | |
| | | | | | | 3,585,104 | |
| | | | | | | | |
| | | | | | |
The notes to the financial statements are an integral part of,
and should be read in conjunction with, the financial statements. | | mainstayinvestments.com | | | M-245 | |
Portfolio of Investments December 31, 2013 (continued)
| | | | | | | | |
| | | Principal
Amount | | | Value | |
| Corporate Bonds (continued) | |
Miscellaneous—Manufacturing 0.7% | | | | | | | | |
Amsted Industries, Inc.
8.125%, due 3/15/18 (c) | | $ | 1,400,000 | | | $ | 1,475,250 | |
Bombardier, Inc.
7.75%, due 3/15/20 (c) | | | 1,400,000 | | | | 1,589,000 | |
| | | | | | | | |
| | | | | | | 3,064,250 | |
| | | | | | | | |
Office Equipment/Supplies 0.1% | | | | | | | | |
Xerox Corp.
8.25%, due 5/15/14 | | | 270,000 | | | | 277,236 | |
| | | | | | | | |
| | |
Oil & Gas 3.6% | | | | | | | | |
Berry Petroleum Co.
6.375%, due 9/15/22 | | | 640,000 | | | | 651,200 | |
Chesapeake Energy Corp.
6.625%, due 8/15/20 | | | 1,025,000 | | | | 1,145,437 | |
ConocoPhillips
6.50%, due 2/1/39 | | | 1,000,000 | | | | 1,254,017 | |
Denbury Resources, Inc.
6.375%, due 8/15/21 | | | 1,155,000 | | | | 1,230,075 | |
ENI S.p.A.
4.15%, due 10/1/20 (c) | | | 800,000 | | | | 815,253 | |
EP Energy LLC / EP Energy Finance, Inc.
9.375%, due 5/1/20 | | | 825,000 | | | | 951,844 | |
Gazprom OAO Via Gaz Capital S.A.
4.95%, due 7/19/22 (c) | | | 640,000 | | | | 620,800 | |
Linn Energy LLC / Linn Energy Finance Corp.
8.625%, due 4/15/20 | | | 2,405,000 | | | | 2,597,400 | |
Petrobras Global Finance B.V.
4.375%, due 5/20/23 | | | 1,160,000 | | | | 1,033,435 | |
Plains Exploration & Production Co.
6.125%, due 6/15/19 | | | 750,000 | | | | 820,271 | |
Precision Drilling Corp.
6.50%, due 12/15/21 | | | 675,000 | | | | 718,875 | |
6.625%, due 11/15/20 | | | 295,000 | | | | 314,913 | |
Rosneft Finance S.A.
7.25%, due 2/2/20 (c) | | | 560,000 | | | | 632,100 | |
Samson Investment Co.
10.50%, due 2/15/20 (c) | | | 835,000 | | | | 910,150 | |
SM Energy Co.
5.00%, due 1/15/24 (c) | | | 875,000 | | | | 833,437 | |
Swift Energy Co.
7.875%, due 3/1/22 | | | 825,000 | | | | 816,750 | |
| | | | | | | | |
| | | | | | | 15,345,957 | |
| | | | | | | | |
Oil & Gas Services 0.6% | | | | | | | | |
Basic Energy Services, Inc.
7.75%, due 2/15/19 | | | 1,125,000 | | | | 1,175,625 | |
Hornbeck Offshore Services, Inc.
5.00%, due 3/1/21 | | | 1,375,000 | | | | 1,347,500 | |
| | | | | | | | |
| | | | | | | 2,523,125 | |
| | | | | | | | |
| | | | | | | | |
| | | Principal
Amount | | | Value | |
Pharmaceuticals 0.2% | | | | | | | | |
Valeant Pharmaceuticals International, Inc.
7.50%, due 7/15/21 (c) | | $ | 650,000 | | | $ | 713,375 | |
| | | | | | | | |
| | |
Pipelines 2.3% | | | | | | | | |
Access Midstream Partners, L.P. / ACMP Finance Corp.
4.875%, due 5/15/23 | | | 1,225,000 | | | | 1,182,125 | |
Atlas Pipeline Partners, L.P. / Atlas Pipeline Finance Corp.
6.625%, due 10/1/20 | | | 850,000 | | | | 888,250 | |
Energy Transfer Partners, L.P.
4.65%, due 6/1/21 | | | 650,000 | | | | 668,617 | |
7.60%, due 2/1/24 | | | 290,000 | | | | 345,109 | |
Kinder Morgan, Inc.
5.00%, due 2/15/21 (c) | | | 1,330,000 | | | | 1,310,031 | |
MarkWest Energy Partners, L.P. / MarkWest Energy Finance Corp.
5.50%, due 2/15/23 | | | 925,000 | | | | 931,938 | |
ONEOK, Inc.
6.00%, due 6/15/35 | | | 130,000 | | | | 121,607 | |
Regency Energy Partners, L.P. / Regency Energy Finance Corp.
6.875%, due 12/1/18 | | | 555,000 | | | | 595,238 | |
Spectra Energy Partners, L.P.
4.75%, due 3/15/24 | | | 795,000 | | | | 810,425 | |
Targa Resources Partners, L.P. / Targa Resources Partners Finance Corp.
4.25%, due 11/15/23 (c) | | | 965,000 | | | | 863,675 | |
5.25%, due 5/1/23 | | | 1,735,000 | | | | 1,680,781 | |
Williams Cos., Inc. (The)
3.70%, due 1/15/23 | | | 850,000 | | | | 741,887 | |
| | | | | | | | |
| | | | | | | 10,139,683 | |
| | | | | | | | |
Retail 0.6% | | | | | | | | |
AmeriGas Finance LLC / AmeriGas Finance Corp.
6.75%, due 5/20/20 | | | 325,000 | | | | 355,063 | |
7.00%, due 5/20/22 | | | 610,000 | | | | 661,850 | |
Brinker International, Inc.
2.60%, due 5/15/18 | | | 835,000 | | | | 821,876 | |
CVS Caremark Corp.
5.789%, due 1/10/26 (c)(f) | | | 51,737 | | | | 55,796 | |
Macy’s Retail Holdings, Inc.
3.875%, due 1/15/22 | | | 775,000 | | | | 763,900 | |
| | | | | | | | |
| | | | | | | 2,658,485 | |
| | | | | | | | |
Semiconductors 0.1% | | | | | | | | |
Freescale Semiconductor, Inc.
5.00%, due 5/15/21 (c) | | | 190,000 | | | | 184,775 | |
6.00%, due 1/15/22 (c) | | | 440,000 | | | | 445,500 | |
| | | | | | | | |
| | | | | | | 630,275 | |
| | | | | | | | |
| | | | |
| M-246 | | MainStay VP Income Builder Portfolio | | The notes to the financial statements are an integral part of,
and should be read in conjunction with, the financial statements. |
| | | | | | | | |
| | | Principal
Amount | | | Value | |
| Corporate Bonds (continued) | |
Software 0.6% | | | | | | | | |
Fidelity National Information Services, Inc.
7.875%, due 7/15/20 | | $ | 650,000 | | | $ | 709,123 | |
First Data Corp.
7.375%, due 6/15/19 (c) | | | 1,115,000 | | | | 1,190,262 | |
8.875%, due 8/15/20 (c) | | | 710,000 | | | | 785,438 | |
| | | | | | | | |
| | | | | | | 2,684,823 | |
| | | | | | | | |
Telecommunications 2.5% | | | | | | | | |
CC Holdings GS V LLC / Crown Castle GS III Corp.
2.381%, due 12/15/17 | | | 945,000 | | | | 936,006 | |
CommScope, Inc.
8.25%, due 1/15/19 (c) | | | 1,100,000 | | | | 1,205,875 | |
GTP Towers Issuer LLC
8.112%, due 2/15/15 (c) | | | 650,000 | | | | 667,723 | |
Hughes Satellite Systems Corp.
6.50%, due 6/15/19 | | | 450,000 | | | | 487,125 | |
7.625%, due 6/15/21 | | | 575,000 | | | | 641,125 | |
SBA Tower Trust
4.254%, due 4/15/40 (c) | | | 1,170,000 | | | | 1,184,613 | |
Sprint Communications, Inc.
6.00%, due 11/15/22 | | | 1,100,000 | | | | 1,072,500 | |
Sprint Corp.
7.25%, due 9/15/21 (c) | | | 400,000 | | | | 429,500 | |
T-Mobile USA, Inc.
6.125%, due 1/15/22 | | | 1,600,000 | | | | 1,628,000 | |
Telefonica Emisiones SAU
4.57%, due 4/27/23 | | | 1,139,000 | | | | 1,123,153 | |
5.462%, due 2/16/21 | | | 175,000 | | | | 184,650 | |
Verizon Communications, Inc.
5.15%, due 9/15/23 | | | 1,055,000 | | | | 1,132,745 | |
| | | | | | | | |
| | | | | | | 10,693,015 | |
| | | | | | | | |
Transportation 0.6% | | | | | | | | |
CHC Helicopter S.A.
9.25%, due 10/15/20 | | | 940,000 | | | | 1,012,850 | |
Hapag-Lloyd A.G.
9.75%, due 10/15/17 (c) | | | 300,000 | | | | 315,750 | |
PHI, Inc.
8.625%, due 10/15/18 | | | 658,000 | | | | 707,350 | |
Ukraine Railways via Shortline PLC
9.50%, due 5/21/18 (c) | | | 775,000 | | | | 695,562 | |
| | | | | | | | |
| | | | | | | 2,731,512 | |
| | | | | | | | |
Total Corporate Bonds
(Cost $154,226,345) | | | | | | | 160,507,307 | |
| | | | | | | | |
|
| Foreign Bonds 0.7% | |
Banks 0.3% | |
Barclays Bank PLC
Series Reg S
10.00%, due 5/21/21 | | £ | 525,000 | | | | 1,122,483 | |
| | | | | | | | |
| | | | | | | | |
| | | Principal
Amount | | | Value | |
Diversified Financial Services 0.2% | | | | | | | | |
Ageas Hybrid Financing S.A.
5.125%, due 12/31/49 (b) | | € | 750,000 | | | $ | 1,042,866 | |
| | | | | | | | |
|
Packaging & Containers 0.2% | |
Rexam PLC
6.75%, due 6/29/67 (b) | | | 525,000 | | | | 776,411 | |
| | | | | | | | |
Total Foreign Bonds
(Cost $2,494,169) | | | | | | | 2,941,760 | |
| | | | | | | | |
|
| Foreign Government Bond 0.1% | |
Sovereign 0.1% | |
Portugal Obrigacoes do Tesouro OT
Series Reg S
4.95%, due 10/25/23 | | | 450,000 | | | | 570,478 | |
| | | | | | | | |
Total Foreign Government Bond
(Cost $519,732) | | | | | | | 570,478 | |
| | | | | | | | |
|
| Loan Assignments 1.4% (i) | |
Airlines 0.2% | |
U.S. Airways Group, Inc.
Term Loan B1
4.00%, due 5/23/19 | | $ | 1,000,000 | | | | 1,006,250 | |
| | | | | | | | |
|
Auto Parts & Equipment 0.2% | |
Allison Transmission, Inc.
Term Loan B2
3.17%, due 8/7/17 | | | 198,174 | | | | 198,422 | |
New Term Loan B3
3.75%, due 8/23/19 | | | 594,856 | | | | 597,458 | |
| | | | | | | | |
| | | | | | | 795,880 | |
| | | | | | | | |
Entertainment 0.3% | |
Scientific Games International, Inc.
New Term Loan B
4.25%, due 10/18/20 | | | 1,100,000 | | | | 1,099,771 | |
| | | | | | | | |
|
Media 0.4% | |
Clear Channel Communications, Inc.
Term Loan D
6.919%, due 1/30/19 | | | 1,136,165 | | | | 1,084,091 | |
Virgin Media Investment Holdings, Ltd.
USD Term Loan B
3.50%, due 6/8/20 | | | 750,000 | | | | 750,937 | |
| | | | | | | | |
| | | | | | | 1,835,028 | |
| | | | | | | | |
Mining 0.1% | |
FMG Resources August 2006 Pty, Ltd.
New Term Loan B
4.25%, due 6/28/19 | | | 493,763 | | | | 500,346 | |
| | | | | | | | |
| | | | | | |
The notes to the financial statements are an integral part of,
and should be read in conjunction with, the financial statements. | | mainstayinvestments.com | | | M-247 | |
Portfolio of Investments December 31, 2013 (continued)
| | | | | | | | |
| | | Principal
Amount | | | Value | |
| Loan Assignments (continued) | |
Pharmaceuticals 0.2% | | | | | | | | |
Valeant Pharmaceuticals International, Inc.
Term Loan E
4.50%, due 8/5/20 | | $ | 744,375 | | | $ | 748,097 | |
| | | | | | | | |
Total Loan Assignments
(Cost $5,929,319) | | | | | | | 5,985,372 | |
| | | | | | | | |
|
| Mortgage-Backed Securities 0.6% | |
Commercial Mortgage Loans
(Collateralized Mortgage Obligations) 0.5% | |
Banc of America Commercial Mortgage Trust
Series 2007-2, Class A4
5.623%, due 4/10/49 (j) | | | 290,000 | | | | 321,354 | |
Bayview Commercial Asset Trust
Series 2006-4A, Class A1
0.395%, due 12/25/36 (b)(c)(e) | | | 151,332 | | | | 128,073 | |
Bear Stearns Commercial Mortgage Securities Trust
Series 2005-PW10, Class A4
5.405%, due 12/11/40 (b) | | | 130,000 | | | | 137,923 | |
Series 2007-PW16, Class A4
5.706%, due 6/11/40 (j) | | | 290,000 | | | | 325,216 | |
Citigroup Commercial Mortgage Trust
Series 2008-C7, Class A4
6.132%, due 12/10/49 (j) | | | 150,000 | | | | 169,822 | |
Four Times Square Trust
Series 2006-4TS, Class A
5.401%, due 12/13/28 (c) | | | 480,000 | | | | 530,242 | |
Morgan Stanley Capital I, Trust
Series 2007-IQ15, Class A4
5.91%, due 6/11/49 (j) | | | 200,000 | | | | 223,115 | |
Timberstar Trust 1
Series 2006-1, Class A
5.668%, due 10/15/36 (c) | | | 160,000 | | | | 174,594 | |
| | | | | | | | |
| | | | | | | 2,010,339 | |
| | | | | | | | |
Residential Mortgages
(Collateralized Mortgage Obligations) 0.1% | |
Deutsche ALT-A Securities, Inc. Alternate Loan Trust
Series 2005-5, Class 1A3
5.50%, due 11/25/35 (b) | | | 89,805 | | | | 81,527 | |
Mortgage Equity Conversion Asset Trust
Series 2007-FF2, Class A
0.60%, due 2/25/42 (b)(c)(e)(f) | | | 386,008 | | | | 289,505 | |
WaMu Mortgage Pass-Through Certificates
Series 2006-AR14, Class 1A1
2.065%, due 11/25/36 (j) | | | 275,397 | | | | 231,531 | |
| | | | | | | | |
| | | | | | | 602,563 | |
| | | | | | | | |
Total Mortgage-Backed Securities
(Cost $2,358,031) | | | | | | | 2,612,902 | |
| | | | | | | | |
| | | | | | | | |
| | | Principal
Amount | | | Value | |
| U.S. Government & Federal Agencies 1.4% | |
Federal National Mortgage Association
(Mortgage Pass-Through Securities) 0.0%‡ | |
6.00%, due 4/1/37 | | $ | 114,504 | | | $ | 123,401 | |
| | | | | | | | |
|
United States Treasury Bonds 0.7% | |
2.875%, due 5/15/43 | | | 2,580,000 | | | | 2,091,010 | |
4.375%, due 11/15/39 | | | 800,000 | | | | 869,375 | |
4.375%, due 5/15/40 | | | 150,000 | | | | 162,938 | |
| | | | | | | | |
| | | | | | | 3,123,323 | |
| | | | | | | | |
United States Treasury Notes 0.7% | |
0.25%, due 12/15/15 | | | 640,000 | | | | 638,575 | |
1.25%, due 3/15/14 | | | 175,000 | | | | 175,410 | |
2.00%, due 4/30/16 | | | 2,005,000 | | | | 2,074,234 | |
| | | | | | | | |
| | | | | | | 2,888,219 | |
| | | | | | | | |
Total U.S. Government & Federal Agencies
(Cost $6,067,749) | | | | | | | 6,134,943 | |
| | | | | | | | |
|
| Yankee Bonds 0.3%(k) | |
Banks 0.1% | |
Royal Bank of Scotland Group PLC
6.125%, due 12/15/22 | | | 550,000 | | | | 562,100 | |
| | | | | | | | |
|
Insurance 0.2% | |
Validus Holdings, Ltd.
8.875%, due 1/26/40 | | | 435,000 | | | | 574,376 | |
| | | | | | | | |
Total Yankee Bonds
(Cost $1,131,917) | | | | | | | 1,136,476 | |
| | | | | | | | |
Total Long-Term Bonds
(Cost $178,968,356) | | | | | | | 185,769,629 | |
| | | | | | | | |
| | |
| | | | | | | | |
| | |
Shares | | | | |
| Common Stocks 49.2% | |
Aerospace & Defense 1.5% | |
BAE Systems PLC | | | 467,950 | | | | 3,370,822 | |
Lockheed Martin Corp. | | | 21,865 | | | | 3,250,451 | |
| | | | | | | | |
| | | | | | | 6,621,273 | |
| | | | | | | | |
Agriculture 4.2% | |
¨Altria Group, Inc. | | | 98,440 | | | | 3,779,111 | |
British American Tobacco PLC | | | 28,300 | | | | 1,517,436 | |
¨Imperial Tobacco Group PLC | | | 101,850 | | | | 3,943,236 | |
Lorillard, Inc. | | | 68,610 | | | | 3,477,155 | |
Philip Morris International, Inc. | | | 27,000 | | | | 2,352,510 | |
Reynolds American, Inc. | | | 62,240 | | | | 3,111,378 | |
| | | | | | | | |
| | | | | | | 18,180,826 | |
| | | | | | | | |
| | | | |
| M-248 | | MainStay VP Income Builder Portfolio | | The notes to the financial statements are an integral part of,
and should be read in conjunction with, the financial statements. |
| | | | | | | | |
| | |
Shares | | | Value | |
| Common Stocks (continued) | |
Auto Manufacturers 0.9% | |
Daimler A.G. | | | 34,730 | | | $ | 3,005,239 | |
Ford Motor Co. | | | 52,500 | | | | 810,075 | |
| | | | | | | | |
| | | | | | | 3,815,314 | |
| | | | | | | | |
Banks 1.5% | |
Citigroup, Inc. | | | 16,500 | | | | 859,815 | |
Commonwealth Bank of Australia | | | 16,680 | | | | 1,158,720 | |
Svenska Handelsbanken AB Class A | | | 24,930 | | | | 1,224,823 | |
Wells Fargo & Co. | | | 36,260 | | | | 1,646,204 | |
Westpac Banking Corp. | | | 49,850 | | | | 1,441,269 | |
| | | | | | | | |
| | | | | | | 6,330,831 | |
| | | | | | | | |
Beverages 1.0% | |
Anheuser-Busch InBev N.V. | | | 11,930 | | | | 1,267,998 | |
Coca-Cola Co. (The) | | | 24,590 | | | | 1,015,813 | |
Diageo PLC, Sponsored ADR | | | 8,050 | | | | 1,065,981 | |
PepsiCo., Inc. | | | 13,200 | | | | 1,094,808 | |
| | | | | | | | |
| | | | | | | 4,444,600 | |
| | | | | | | | |
Building Materials 0.1% | |
U.S. Concrete, Inc. (d)(e) | | | 23,726 | | | | 536,919 | |
| | | | | | | | |
|
Chemicals 2.5% | |
BASF S.E. Corp. | | | 28,400 | | | | 3,027,524 | |
Dow Chemical Co. (The) | | | 43,100 | | | | 1,913,640 | |
E.I. du Pont de Nemours & Co. | | | 19,950 | | | | 1,296,151 | |
Potash Corporation of Saskatchewan, Inc. | | | 49,800 | | | | 1,641,408 | |
Yara International ASA | | | 68,220 | | | | 2,935,621 | |
| | | | | | | | |
| | | | | | | 10,814,344 | |
| | | | | | | | |
Commercial Services 0.8% | |
Automatic Data Processing, Inc. | | | 16,920 | | | | 1,367,305 | |
R.R. Donnelley & Sons Co. | | | 96,330 | | | | 1,953,573 | |
| | | | | | | | |
| | | | | | | 3,320,878 | |
| | | | | | | | |
Computers 0.4% | |
Apple, Inc. | | | 3,270 | | | | 1,834,830 | |
| | | | | | | | |
|
Electric 6.1% | |
Ameren Corp. | | | 68,630 | | | | 2,481,661 | |
Dominion Resources, Inc. | | | 17,630 | | | | 1,140,485 | |
Duke Energy Corp. | | | 48,788 | | | | 3,366,860 | |
Electricite de France S.A. | | | 89,550 | | | | 3,164,235 | |
Integrys Energy Group, Inc. | | | 22,810 | | | | 1,241,092 | |
PPL Corp. | | | 102,750 | | | | 3,091,747 | |
Southern Co. (The) | | | 67,055 | | | | 2,756,631 | |
SSE PLC | | | 138,780 | | | | 3,148,434 | |
TECO Energy, Inc. | | | 147,600 | | | | 2,544,624 | |
Terna S.p.A. | | | 707,380 | | | | 3,534,453 | |
| | | | | | | | |
| | | | | | | 26,470,222 | |
| | | | | | | | |
| | | | | | | | |
| | |
Shares | | | Value | |
Electrical Components & Equipment 0.4% | |
Emerson Electric Co. | | | 23,920 | | | $ | 1,678,706 | |
| | | | | | | | |
|
Electronics 0.3% | |
Honeywell International, Inc. | | | 14,540 | | | | 1,328,520 | |
| | | | | | | | |
|
Engineering & Construction 0.9% | |
¨Vinci S.A. | | | 59,020 | | | | 3,874,567 | |
| | | | | | | | |
|
Entertainment 0.4% | |
Regal Entertainment Group Class A | | | 82,630 | | | | 1,607,153 | |
| | | | | | | | |
|
Environmental Controls 0.3% | |
Waste Management, Inc. | | | 28,100 | | | | 1,260,847 | |
| | | | | | | | |
|
Finance—Other Services 0.6% | |
CME Group, Inc. | | | 31,100 | | | | 2,440,106 | |
| | | | | | | | |
|
Food 0.5% | |
Nestle S.A. Registered | | | 17,480 | | | | 1,279,574 | |
WM Morrison Supermarkets PLC | | | 252,010 | | | | 1,089,195 | |
| | | | | | | | |
| | | | | | | 2,368,769 | |
| | | | | | | | |
Food Services 0.3% | |
Compass Group PLC | | | 78,540 | | | | 1,258,964 | |
| | | | | | | | |
|
Gas 1.4% | |
Centrica PLC | | | 396,160 | | | | 2,280,985 | |
¨National Grid PLC | | | 289,820 | | | | 3,781,828 | |
| | | | | | | | |
| | | | | | | 6,062,813 | |
| | | | | | | | |
Household Products & Wares 0.5% | |
Kimberly-Clark Corp. | | | 19,390 | | | | 2,025,479 | |
| | | | | | | | |
|
Insurance 1.6% | |
Arthur J. Gallagher & Co. | | | 26,900 | | | | 1,262,417 | |
Muenchener Rueckversicherungs-Gesellschaft A.G. Registered | | | 13,700 | | | | 3,018,360 | |
SCOR SE | | | 71,450 | | | | 2,611,173 | |
| | | | | | | | |
| | | | | | | 6,891,950 | |
| | | | | | | | |
Machinery—Diversified 0.3% | |
Deere & Co. | | | 12,530 | | | | 1,144,365 | |
| | | | | | | | |
|
Media 1.6% | |
Comcast Corp. Class A | | | 28,100 | | | | 1,401,628 | |
Pearson PLC | | | 101,290 | | | | 2,249,275 | |
Shaw Communications, Inc. | | | 79,650 | | | | 1,938,294 | |
Time Warner, Inc. | | | 18,730 | | | | 1,305,855 | |
| | | | | | | | |
| | | | | | | 6,895,052 | |
| | | | | | | | |
| | | | | | |
The notes to the financial statements are an integral part of,
and should be read in conjunction with, the financial statements. | | mainstayinvestments.com | | | M-249 | |
Portfolio of Investments December 31, 2013 (continued)
| | | | | | | | |
| | |
Shares | | | Value | |
| Common Stocks (continued) | |
Mining 0.4% | |
BHP Billiton, Ltd. | | | 46,170 | | | $ | 1,566,145 | |
| | | | | | | | |
|
Miscellaneous—Manufacturing 0.4% | |
Orkla ASA | | | 227,930 | | | | 1,778,255 | |
| | | | | | | | |
|
Oil & Gas 3.0% | |
ConocoPhillips | | | 28,895 | | | | 2,041,432 | |
Diamond Offshore Drilling, Inc. | | | 36,160 | | | | 2,058,227 | |
Royal Dutch Shell PLC, ADR | | | 45,900 | | | | 3,271,293 | |
Statoil ASA | | | 69,400 | | | | 1,681,994 | |
¨Total S.A. | | | 63,830 | | | | 3,910,219 | |
| | | | | | | | |
| | | | | | | 12,963,165 | |
| | | | | | | | |
Pharmaceuticals 3.9% | |
AbbVie, Inc. | | | 31,690 | | | | 1,673,549 | |
¨AstraZeneca PLC, Sponsored ADR | | | 67,030 | | | | 3,979,571 | |
GlaxoSmithKline PLC | | | 120,190 | | | | 3,207,346 | |
Johnson & Johnson | | | 13,560 | | | | 1,241,960 | |
Merck & Co., Inc. | | | 29,990 | | | | 1,501,000 | |
Novartis A.G. | | | 27,190 | | | | 2,170,201 | |
Roche Holding A.G., Genusscheine | | | 5,635 | | | | 1,574,174 | |
Sanofi | | | 16,200 | | | | 1,718,722 | |
| | | | | | | | |
| | | | | | | 17,066,523 | |
| | | | | | | | |
Pipelines 1.7% | |
Enterprise Products Partners, L.P. | | | 25,310 | | | | 1,678,053 | |
Kinder Morgan Energy Partners, L.P. | | | 35,560 | | | | 2,868,270 | |
MarkWest Energy Partners, L.P. | | | 21,140 | | | | 1,397,988 | |
Targa Resources Partners, L.P. | | | 24,700 | | | | 1,291,810 | |
| | | | | | | | |
| | | | | | | 7,236,121 | |
| | | | | | | | |
Real Estate Investment Trusts 1.2% | |
Corrections Corporation of America | | | 62,450 | | | | 2,002,772 | |
Health Care REIT, Inc. | | | 56,450 | | | | 3,024,026 | |
| | | | | | | | |
| | | | | | | 5,026,798 | |
| | | | | | | | |
Retail 0.3% | |
McDonald’s Corp. | | | 14,130 | | | | 1,371,034 | |
| | | | | | | | |
|
Semiconductors 0.8% | |
KLA-Tencor Corp. | | | 26,810 | | | | 1,728,173 | |
Microchip Technology, Inc. | | | 35,470 | | | | 1,587,282 | |
| | | | | | | | |
| | | | | | | 3,315,455 | |
| | | | | | | | |
Software 0.3% | |
Microsoft Corp. | | | 34,670 | | | | 1,297,698 | |
| | | | | | | | |
|
Telecommunications 7.3% | |
AT&T, Inc. | | | 70,810 | | | | 2,489,680 | |
¨BCE, Inc. | | | 87,700 | | | | 3,797,788 | |
CenturyLink, Inc. | | | 87,180 | | | | 2,776,683 | |
| | | | | | | | |
| | |
Shares | | | Value | |
Telecommunications (continued) | |
¨Deutsche Telekom A.G. | | | 226,220 | | | $ | 3,868,349 | |
Philippine Long Distance Telephone Co., Sponsored ADR | | | 20,165 | | | | 1,211,513 | |
Rogers Communications, Inc. Class B | | | 35,290 | | | | 1,596,978 | |
Swisscom A.G. | | | 6,945 | | | | 3,666,163 | |
Telstra Corp., Ltd. | | | 631,510 | | | | 2,960,346 | |
Verizon Communications, Inc. | | | 50,050 | | | | 2,459,457 | |
Vivendi S.A. | | | 85,538 | | | | 2,254,056 | |
¨Vodafone Group PLC | | | 1,130,780 | | | | 4,437,861 | |
| | | | | | | | |
| | | | | | | 31,518,874 | |
| | | | | | | | |
Toys, Games & Hobbies 0.5% | |
Mattel, Inc. | | | 51,060 | | | | 2,429,435 | |
| | | | | | | | |
|
Transportation 0.3% | |
Deutsche Post A.G. Registered | | | 36,090 | | | | 1,315,698 | |
| | | | | | | | |
|
Water 1.0% | |
Severn Trent PLC | | | 51,210 | | | | 1,445,860 | |
United Utilities Group PLC | | | 253,230 | | | | 2,815,843 | |
| | | | | | | | |
| | | | | | | 4,261,703 | |
| | | | | | | | |
Total Common Stocks
(Cost $169,914,199) | | | | | | | 212,354,232 | |
| | | | | | | | |
| | |
| | | | | | | | |
| | | Number of
Warrants | | | | |
| Warrants 0.0%‡ | |
Media 0.0%‡ | |
ION Media Networks, Inc.
Second Lien
Expires 12/18/16 (d)(e)(f)(g) | | | 4 | | | | 0 | (l) |
Unsecured Debt
Expires 12/18/16 (d)(e)(f)(g) | | | 4 | | | | 0 | (l) |
| | | | | | | | |
Total Warrants
(Cost $13) | | | | | | | 0 | (l) |
| | | | | | | | |
| | |
| | | | | | | | |
| | | | |
| M-250 | | MainStay VP Income Builder Portfolio | | The notes to the financial statements are an integral part of,
and should be read in conjunction with, the financial statements. |
| | | | | | | | |
| | | Principal
Amount | | | Value | |
| Short-Term Investment 5.8% | |
Repurchase Agreement 5.8% | |
State Street Bank and Trust Co. 0.00%, dated 12/31/13
due 1/2/14
Proceeds at Maturity $24,991,071 (Collateralized by Federal National Mortgage Association security with rates between 2.08% and 2.17% and maturity dates between 11/2/22 and 11/7/22, with a Principal Amount of $28,175,000 and a Market Value of $25,492,323) | | $ | 24,991,071 | | | $ | 24,991,071 | |
| | | | | | | | |
Total Short-Term Investment
(Cost $24,991,071) | | | | | | | 24,991,071 | |
| | | | | | | | |
Total Investments
(Cost $373,873,639) (o) | | | 98.0 | % | | | 423,114,932 | |
Other Assets, Less Liabilities | | | 2.0 | | | | 8,717,401 | |
Net Assets | | | 100.0 | % | | $ | 431,832,333 | |
| | |
| | | | | | | | |
| | | Contracts
Long | | | Unrealized
Appreciation
(Depreciation) (m) | |
| Futures Contracts 0.6% | |
Standard & Poor’s 500 Index
Mini March 2014 (n) | | | 895 | | | $ | 1,993,926 | |
| | | | | | | | |
Total Futures Contracts Long (Notional Amount $82,389,225) | | | | | | | 1,993,926 | |
| | | | | | | | |
| | |
| | | | | | | | |
| | | Contracts
Short | | | | |
United States Treasury Notes
March 2014 (2 Year) (n) | | | (355 | ) | | | 96,658 | |
United States Treasury Notes
March 2014 (5 Year) (n) | | | (524 | ) | | | 567,858 | |
| | | | | | | | |
Total Futures Contracts Short
(Notional Amount $140,553,188) | | | | 664,516 | |
| | | | | | | | |
Total Futures Contracts
(Notional Amount $58,163,963) | | | $ | 2,658,442 | |
| | | | | | | | |
| ‡ | Less than one-tenth of a percent. |
| (a) | Subprime mortgage investment or other asset-backed security. The total market value of these securities as of December 31, 2013, is $4,014,579, which represents 0.9% of the Portfolio’s net assets. |
| (b) | Floating rate—Rate shown is the rate in effect as of December 31, 2013. |
| (c) | May be sold to institutional investors only under Rule 144A or securities offered pursuant to Section 4(a)(2) of the Securities Act of 1933, as amended. |
| (d) | Non-income producing security. |
| (e) | Illiquid security—The total market value of these securities as of December 31, 2013, is $955,526, which represents 0.2% of the Portfolio’s net assets. |
| (f) | Fair valued security—The total market value of these securities as of December 31, 2013, is $346,330, which represents 0.1% of the Portfolio’s net assets. |
| (h) | Step coupon—Rate shown is the rate in effect as of December 31, 2013. |
| (i) | Floating Rate Loan—generally pays interest at rates which are periodically re-determined at a margin above the London InterBank Offered Rate or other short-term rates. The rate shown is the weighted average interest rate of all contracts within the floating rate loan facility as of December 31, 2013. |
| (j) | Collateral strip rate—A bond whose interest is based on the weighted net interest rate of the collateral. The coupon rate adjusts periodically based on a predetermined schedule. Rate shown is the rate in effect as of December 31, 2013. |
| (k) | Yankee Bond—Dollar-denominated bond issued in the United States by a foreign bank or corporation. |
| (m) | Represents the difference between the value of the contracts at the time they were opened and the value as of December 31, 2013. |
| (n) | As of December 31, 2013, cash in the amount of $4,229,850 is on deposit with a broker for futures transactions. |
| (o) | As of December 31, 2013, cost is $373,510,283 for federal income tax purposes and net unrealized appreciation is as follows: |
| | | | |
Gross unrealized appreciation | | $ | 54,713,012 | |
Gross unrealized depreciation | | | (5,108,363 | ) |
| | | | |
Net unrealized appreciation | | $ | 49,604,649 | |
| | | | |
The following abbreviations are used in the above portfolio:
€—Euro
£—British Pound Sterling
ADR—American Depositary Receipt
| | | | | | |
The notes to the financial statements are an integral part of,
and should be read in conjunction with, the financial statements. | | mainstayinvestments.com | | | M-251 | |
Portfolio of Investments December 31, 2013 (continued)
As of December 31, 2013, the Portfolio held the following foreign currency forward contracts:
| | | | | | | | | | | | | | | | | | | | | | | | | | | | | | | | |
Foreign Currency Sale Contracts | | Expiration
Date | | | Counterparty | | | Contract Amount Sold | | | Contract Amount Purchased | | | Unrealized
Appreciation
(Depreciation) | |
Euro vs. U.S. Dollar | | | 2/20/14 | | | | JPMorgan Chase Bank | | | | EUR | | | | 20,545,000 | | | | USD | | | | 28,190,514 | | | | USD | | | | (72,694 | ) |
Pound Sterling vs. U.S.Dollar | | | 2/20/14 | | | | JPMorgan Chase Bank | | | | GBP | | | | 11,678,000 | | | | | | | | 19,012,952 | | | | | | | | (318,850 | ) |
Net unrealized appreciation (depreciation) on foreign currency forward contracts | | | | USD | | | | (391,544 | ) |
The following is a summary of the fair valuations according to the inputs used as of December 31, 2013, for valuing the Portfolio’s assets and liabilities.
Asset Valuation Inputs
| | | | | | | | | | | | | | | | |
Description | | Quoted Prices
in Active Markets
for Identical Assets
(Level 1) | | | Significant Other
Observable Inputs (Level 2) | | | Significant
Unobservable
Inputs (Level 3) | | | Total | |
| Investments in Securities (a) | | | | | | | | | | | | | | | | |
| Long-Term Bonds | | | | | | | | | | | | | | | | |
Asset-Backed Securities | | $ | — | | | $ | 5,880,391 | | | $ | — | | | $ | 5,880,391 | |
Corporate Bonds (b) | | | — | | | | 160,450,482 | | | | 56,825 | | | | 160,507,307 | |
Foreign Bonds | | | — | | | | 2,941,760 | | | | — | | | | 2,941,760 | |
Foreign Government Bond | | | — | | | | 570,478 | | | | — | | | | 570,478 | |
Loan Assignments (c) | | | — | | | | 5,786,950 | | | | 198,422 | | | | 5,985,372 | |
Mortgage-Backed Securities (d) | | | — | | | | 2,323,397 | | | | 289,505 | | | | 2,612,902 | |
U.S. Government & Federal Agencies | | | — | | | | 6,134,943 | | | | — | | | | 6,134,943 | |
Yankee Bonds | | | — | | | | 1,136,476 | | | | — | | | | 1,136,476 | |
| | | | | | | | | | | | | | | | |
| Total Long-Term Bonds | | | — | | | | 185,224,877 | | | | 544,752 | | | | 185,769,629 | |
| | | | | | | | | | | | | | | | |
| Common Stocks | | | 212,354,232 | | | | — | | | | — | | | | 212,354,232 | |
| Warrants (e) | | | — | | | | — | | | | 0 | (e) | | | 0 | (e) |
| Short-Term Investment | | | | | | | | | | | | | | | | |
Repurchase Agreement | | | — | | | | 24,991,071 | | | | — | | | | 24,991,071 | |
| | | | | | | | | | | | | | | | |
| Total Investments in Securities | | | 212,354,232 | | | | 210,215,948 | | | | 544,752 | | | | 423,114,932 | |
| | | | | | | | | | | | | | | | |
| Other Financial Instruments | | | | | | | | | | | | | | | | |
Futures Contracts Long (f) | | | 1,993,926 | | | | — | | | | — | | | | 1,993,926 | |
Futures Contracts Short (f) | | | 664,516 | | | | — | | | | — | | | | 664,516 | |
| | | | | | | | | | | | | | | | |
| Total Other Financial Instruments | | | 2,658,442 | | | | — | | | | — | | | | 2,658,442 | |
| | | | | | | | | | | | | | | | |
| Total Investments in Securities and Other Financial Instruments | | $ | 215,012,674 | | | $ | 210,215,948 | | | $ | 544,752 | | | $ | 425,773,374 | |
| | | | | | | | | | | | | | | | |
Liability Valuation Inputs
| | | | | | | | | | | | | | | | |
Description | | Quoted Prices
in Active Markets
for Identical Assets (Level 1) | | | Significant Other
Observable Inputs (Level 2) | | | Significant
Unobservable
Inputs (Level 3) | | | Total | |
| Other Financial Instruments | | | | | | | | | | | | | | | | |
Foreign Currency Forward Contracts (f) | | $ | — | | | $ | (391,544 | ) | | $ | — | | | $ | (391,544 | ) |
| | | | | | | | | | | | | | | | |
| Total Other Financial Instruments | | $ | — | | | $ | (391,544 | ) | | $ | — | | | $ | (391,544 | ) |
| | | | | | | | | | | | | | | | |
| (a) | For a complete listing of investments and their industries, see the Portfolio of Investments. |
| (b) | The Level 3 securities valued at $1,029 and $55,796 are held in Commercial Services and Retail, respectively, within the Corporate Bonds section of the Portfolio of Investments. |
| (c) | The Level 3 security valued at $198,422 represents Loan Assignments whose value was obtained from an independent pricing service which used a single broker quote to measure such value as referenced in the Portfolio of Investments. |
| (d) | The Level 3 security valued at $289,505 is held in Residential Mortgage (Collateralized Mortgage Obligation) within the Mortgage-Backed Securities section of the Portfolio of Investments. |
| | | | |
| M-252 | | MainStay VP Income Builder Portfolio | | The notes to the financial statements are an integral part of,
and should be read in conjunction with, the financial statements. |
| (e) | The Level 3 securities valued less than one dollar are held in Media within the Warrants section of the Portfolio of Investments. |
| (f) | The value listed for these securities reflects unrealized appreciation (depreciation) as shown on the Portfolio of Investments. |
The Portfolio recognizes transfers between the levels as of the beginning of the period.
As of December 31, 2013, certain foreign securities with a market value of $53,800,266 were transferred from Level 2 to Level 1 as the prices of these securities were based on unadjusted quoted prices compared with the prior year prices which were adjusted for events after the market close. The December 31, 2012 prices were adjusted by applying factors provided by a third party vendor in accordance with the Fund’s policies and procedures. Fair values as of December 31, 2013 for these securities were based on quoted prices in active markets for identical investments. (See Note 2)
As of the year ended December 31, 2013, a security with a market value of $959,041 was transferred from Level 2 to Level 3. The transfer occurred as a result of the value for certain Loan Assignments obtained from the independent pricing service which were derived based on single broker quote.
As of the year ended December 31, 2013, a security with a market value of $356,374 was transferred from Level 2 to Level 3 as the security was fair valued when compared to prior year price which were based on a quoted price. As of December 31, 2013, prices were adjusted by applying factors provided by a third party vendor in accordance with the Portfolio’s policies and procedures. (See Note 2)
The following is a reconciliation of investments in which significant unobservable inputs (Level 3) were used in determining value:
| | | | | | | | | | | | | | | | | | | | | | | | | | | | | | | | | | | | | | | | |
Investments in
Securities | | Balance
as of
December 31,
2012 | | | Accrued
Discounts
(Premiums) | | | Realized
Gain
(Loss) | | | Change in
Unrealized
Appreciation
(Depreciation) | | | Purchases | | | Sales | | | Transfers
in to
Level 3 | | | Transfers
out of
Level 3 | | | Balance as of
December 31,
2013 | | | Change in
Unrealized
Appreciation
(Depreciation)
from
Investments
Still Held at
December 31,
2013 (a) | |
Long-Term Bonds | | | | | | | | | | | | | | | | | | | | | | | | | | | | | | | | | | | | | | | | |
Corporate Bonds | | | | | | | | | | | | | | | | | | | | | | | | | | | | | | | | | | | | | | | | |
Commercial Services | | $ | 1,120 | | | $ | — | | | $ | — | | | $ | (91 | ) | | $ | — | | | $ | — | | | $ | — | | | $ | — | | | $ | 1,029 | | | $ | (91 | ) |
Retail | | | 61,656 | | | | (61 | ) | | | (62 | ) | | | (2,741 | ) | | | — | | | | (2,996 | ) | | | — | | | | — | | | | 55,796 | | | | (2,424 | ) |
Loan Assignments | | | | | | | | | | | | | | | | | | | | | | | | | | | | | | | | | | | | | | | | |
Auto Parts & Equipment | | | — | | | | 3,572 | | | | 2,363 | | | | (19,102 | ) | | | — | | | | (747,452 | ) | | | 959,041 | | | | — | | | | 198,422 | | | | (19,102 | ) |
Mortgage-Backed Securities | | | | | | | | | | | | | | | | | | | | | | | | | | | | | | | | | | | | | | | | |
Residential Mortgage (Collateralized Mortgage Obligation) | | | — | | | | — | | | | — | | | | (23,833 | ) | | | — | | | | (43,036 | ) | | | 356,374 | | | | — | | | | 289,505 | | | | (23,833 | ) |
Warrants | | | | | | | | | | | | | | | | | | | | | | | | | | | | | | | | | | | | | | | | |
Media | | | 0 | (b) | | | — | | | | — | | | | — | | | | — | | | | — | | | | — | | | | — | | | | 0 | (b) | | | — | |
| | | | | | | | | | | | | | | | | | | | | | | | | | | | | | | | | | | | | | | | |
Total | | $ | 62,776 | | | $ | 3,511 | | | $ | 2,301 | | | $ | (45,767 | ) | | $ | — | | | $ | (793,484 | ) | | $ | 1,315,415 | | | $ | — | | | $ | 544,752 | | | $ | (45,450 | ) |
| | | | | | | | | | | | | | | | | | | | | | | | | | | | | | | | | | | | | | | | |
| (a) | Included in “Net change in unrealized appreciation (depreciation) on investments” in the Statement of Operations. |
| | | | | | |
The notes to the financial statements are an integral part of,
and should be read in conjunction with, the financial statements. | | mainstayinvestments.com | | | M-253 | |
Statement of Assets and Liabilities as of December 31, 2013
| | | | |
| Assets | |
Investment in securities, at value
(identified cost $373,873,639) | | $ | 423,114,932 | |
Cash collateral on deposit at broker | | | 4,229,850 | |
Cash denominated in foreign currencies
(identified cost $1,214,005) | | | 1,227,879 | |
Cash | | | 281 | |
Receivables: | | | | |
Dividends and interest | | | 3,501,023 | |
Investment securities sold | | | 1,516,116 | |
Variation margin on futures contracts | | | 335,525 | |
Fund shares sold | | | 137,484 | |
| | | | |
Total assets | | | 434,063,090 | |
| | | | |
|
| Liabilities | |
Payables: | | | | |
Investment securities purchased | | | 1,173,197 | |
Fund shares redeemed | | | 337,417 | |
Manager (See Note 3) | | | 205,272 | |
Professional fees | | | 47,522 | |
NYLIFE Distributors (See Note 3) | | | 40,743 | |
Shareholder communication | | | 21,755 | |
Custodian | | | 12,699 | |
Trustees | | | 474 | |
Accrued expenses | | | 134 | |
Unrealized depreciation on foreign currency forward contracts | | | 391,544 | |
| | | | |
Total liabilities | | | 2,230,757 | |
| | | | |
Net assets | | $ | 431,832,333 | |
| | | | |
|
| Net Assets Consist of | |
Shares of beneficial interest outstanding (par value of $.001 per share) unlimited number of shares authorized | | $ | 24,481 | |
Additional paid-in capital | | | 354,126,038 | |
| | | | |
| | | 354,150,519 | |
Undistributed net investment income | | | 7,421,683 | |
Accumulated net realized gain (loss) on investments, futures transactions and foreign currency transactions | | | 18,721,833 | |
Net unrealized appreciation (depreciation) on investments and futures contracts | | | 51,899,735 | |
Net unrealized appreciation (depreciation) on translation of other assets and liabilities in foreign currencies and foreign currency forward contracts | | | (361,437 | ) |
| | | | |
Net assets | | $ | 431,832,333 | |
| | | | |
| | | | |
Initial Class | | | | |
Net assets applicable to outstanding shares | | $ | 234,999,291 | |
| | | | |
Shares of beneficial interest outstanding | | | 13,279,395 | |
| | | | |
Net asset value per share outstanding | | $ | 17.70 | |
| | | | |
Service Class | | | | |
Net assets applicable to outstanding shares | | $ | 196,833,042 | |
| | | | |
Shares of beneficial interest outstanding | | | 11,201,779 | |
| | | | |
Net asset value per share outstanding | | $ | 17.57 | |
| | | | |
| | | | |
| M-254 | | MainStay VP Income Builder Portfolio | | The notes to the financial statements are an integral part of,
and should be read in conjunction with, the financial statements. |
Statement of Operations for the year ended December 31, 2013
| | | | |
| Investment Income (Loss) | | | | |
Income | | | | |
Interest | | $ | 9,783,605 | |
Dividends (a) | | | 7,849,618 | |
| | | | |
Total income | | | 17,633,223 | |
| | | | |
Expenses | | | | |
Manager (See Note 3) | | | 2,151,677 | |
Distribution and service—Service Class (See Note 3) | | | 378,339 | |
Professional fees | | | 82,861 | |
Custodian | | | 63,651 | |
Shareholder communication | | | 59,886 | |
Trustees | | | 7,534 | |
Miscellaneous | | | 38,172 | |
| | | | |
Total expenses | | | 2,782,120 | |
| | | | |
Net investment income (loss) | | | 14,851,103 | |
| | | | |
|
| Realized and Unrealized Gain (Loss) on Investments, Futures Contracts and Foreign Currency Transactions | |
Net realized gain (loss) on: | | | | |
Security transactions | | | 13,119,018 | |
Futures transactions | | | 16,630,396 | |
Foreign currency transactions | | | (1,590,641 | ) |
| | | | |
Net realized gain (loss) on investments, futures transactions and foreign currency transactions | | | 28,158,773 | |
| | | | |
Net change in unrealized appreciation (depreciation) on: | | | | |
Investments | | | 17,135,847 | |
Futures contracts | | | 2,390,234 | |
Translation of other assets and liabilities in foreign currencies and foreign currency forward contracts | | | (115,651 | ) |
| | | | |
Net change in unrealized appreciation (depreciation) on investments, futures contracts and foreign currency transactions | | | 19,410,430 | |
| | | | |
Net realized and unrealized gain (loss) on investments, futures transactions and foreign currency transactions | | | 47,569,203 | |
| | | | |
Net increase (decrease) in net assets resulting from operations | | $ | 62,420,306 | |
| | | | |
| (a) | Dividends recorded net of foreign withholding taxes in the amount of $359,306. |
| | | | | | |
The notes to the financial statements are an integral part of,
and should be read in conjunction with, the financial statements. | | mainstayinvestments.com | | | M-255 | |
Statements of Changes in Net Assets
for the years ended December 31, 2013 and December 31, 2012
| | | | | | | | |
| | | 2013 | | | 2012 | |
| Increase (Decrease) in Net Assets | |
Operations: | | | | | | | | |
Net investment income (loss) | | $ | 14,851,103 | | | $ | 12,845,907 | |
Net realized gain (loss) on investments, futures transactions and foreign currency transactions | | | 28,158,773 | | | | 8,987,097 | |
Net change in unrealized appreciation (depreciation) on investments, futures contracts and foreign currency transactions | | | 19,410,430 | | | | 18,577,305 | |
| | | | |
Net increase (decrease) in net assets resulting from operations | | | 62,420,306 | | | | 40,410,309 | |
| | | | |
Dividends to shareholders: | | | | | | | | |
From net investment income: | | | | | | | | |
Initial Class | | | (9,853,978 | ) | | | (9,029,798 | ) |
Service Class | | | (7,459,029 | ) | | | (3,624,215 | ) |
| | | | |
Total dividends to shareholders | | | (17,313,007 | ) | | | (12,654,013 | ) |
| | | | |
Capital share transactions: | | | | | | | | |
Net proceeds from sale of shares | | | 97,225,621 | | | | 42,070,690 | |
Net asset value of shares issued to shareholders in reinvestment of dividends | | | 17,313,007 | | | | 12,654,013 | |
Cost of shares redeemed | | | (45,074,768 | ) | | | (41,205,984 | ) |
| | | | |
Increase (decrease) in net assets derived from capital share transactions | | | 69,463,860 | | | | 13,518,719 | |
| | | | |
Net increase (decrease) in net assets | | | 114,571,159 | | | | 41,275,015 | |
| | |
| Net Assets | | | | | | | | |
Beginning of year | | | 317,261,174 | | | | 275,986,159 | |
| | | | |
End of year | | $ | 431,832,333 | | | $ | 317,261,174 | |
| | | | |
Undistributed net investment income at end of year | | $ | 7,421,683 | | | $ | 11,610,140 | |
| | | | |
| | | | |
| M-256 | | MainStay VP Income Builder Portfolio | | The notes to the financial statements are an integral part of,
and should be read in conjunction with, the financial statements. |
Financial Highlights selected per share data and ratios
| | | | | | | | | | | | | | | | | | | | |
| | | Initial Class | |
| | | Year ended December 31, | |
| | | 2013 | | | 2012 | | | 2011 | | | 2010 | | | 2009 | |
Net asset value at beginning of year | | $ | 15.63 | | | $ | 14.18 | | | $ | 14.22 | | | $ | 12.78 | | | $ | 10.71 | |
| | | | | | | | | | | | | | | | | | | | |
Net investment income (loss) (a) | | | 0.69 | | | | 0.68 | | | | 0.64 | | | | 0.64 | | | | 0.37 | |
Net realized and unrealized gain (loss) on investments | | | 2.22 | | | | 1.48 | | | | (0.13 | ) | | | 1.31 | | | | 2.12 | |
Net realized and unrealized gain (loss) on foreign currency transactions | | | (0.08 | ) | | | (0.04 | ) | | | 0.03 | | | | (0.08 | ) | | | 0.01 | |
| | | | | | | | | | | | | | | | | | | | |
Total from investment operations | | | 2.83 | | | | 2.12 | | | | 0.54 | | | | 1.87 | | | | 2.50 | |
| | | | | | | | | | | | | | | | | | | | |
Less dividends: | | | | | | | | | | | | | | | | | | | | |
From net investment income | | | (0.76 | ) | | | (0.67 | ) | | | (0.58 | ) | | | (0.43 | ) | | | (0.43 | ) |
| | | | | | | | | | | | | | | | | | | | |
Net asset value at end of year | | $ | 17.70 | | | $ | 15.63 | | | $ | 14.18 | | | $ | 14.22 | | | $ | 12.78 | |
| | | | | | | | | | | | | | | | | | | | |
Total investment return | | | 18.38 | % | | | 15.00 | % | | | 4.12 | % | | | 14.79 | % | | | 23.51 | % |
Ratios (to average net assets)/Supplemental Data: | | | | | | | | | | | | | | | | | | | | |
Net investment income (loss) | | | 4.05 | % | | | 4.44 | % | | | 4.40 | % | | | 4.85 | % | | | 3.26 | % |
Net expenses | | | 0.64 | % | | | 0.64 | % | | | 0.65 | % | | | 0.65 | % | | | 0.71 | % |
Portfolio turnover rate | | | 22 | % | | | 34 | % | | | 31 | % | | | 61 | %(b) | | | 161 | %(b) |
Net assets at end of year (in 000’s) | | $ | 234,999 | | | $ | 214,268 | | | $ | 209,222 | | | $ | 222,426 | | | $ | 224,119 | |
| (a) | Per share data based on average shares outstanding during the year. |
| (b) | The portfolio turnover rates not including mortgage dollar rolls were 60% and 141%, for the years ended December 31, 2010 and 2009, respectively. The Portfolio did not engage in mortgage dollar rolls for the years ended December 31, 2013, 2012 and 2011, respectively. |
| | | | | | | | | | | | | | | | | | | | |
| | | Service Class | |
| | | Year ended December 31, | |
| | | 2013 | | | 2012 | | | 2011 | | | 2010 | | | 2009 | |
Net asset value at beginning of year | | $ | 15.54 | | | $ | 14.12 | | | $ | 14.17 | | | $ | 12.74 | | | $ | 10.67 | |
| | | | | | | | | | | | | | | | | | | | |
Net investment income (loss) (a) | | | 0.63 | | | | 0.63 | | | | 0.60 | | | | 0.61 | | | | 0.35 | |
Net realized and unrealized gain (loss) on investments | | | 2.22 | | | | 1.47 | | | | (0.13 | ) | | | 1.30 | | | | 2.10 | |
Net realized and unrealized gain (loss) on foreign currency transactions | | | (0.08 | ) | | | (0.04 | ) | | | 0.03 | | | | (0.08 | ) | | | 0.01 | |
| | | | | | | | | | | | | | | | | | | | |
Total from investment operations | | | 2.77 | | | | 2.06 | | | | 0.50 | | | | 1.83 | | | | 2.46 | |
| | | | | | | | | | | | | | | | | | | | |
Less dividends: | | | | | | | | | | | | | | | | | | | | |
From net investment income | | | (0.74 | ) | | | (0.64 | ) | | | (0.55 | ) | | | (0.40 | ) | | | (0.39 | ) |
| | | | | | | | | | | | | | | | | | | | |
Net asset value at end of year | | $ | 17.57 | | | $ | 15.54 | | | $ | 14.12 | | | $ | 14.17 | | | $ | 12.74 | |
| | | | | | | | | | | | | | | | | | | | |
Total investment return | | | 18.08 | % | | | 14.71 | % | | | 3.86 | % | | | 14.51 | % | | | 23.21 | % |
Ratios (to average net assets)/Supplemental Data: | | | | | | | | | | | | | | | | | | | | |
Net investment income (loss) | | | 3.75 | % | | | 4.17 | % | | | 4.15 | % | | | 4.59 | % | | | 3.03 | % |
Net expenses | | | 0.89 | % | | | 0.89 | % | | | 0.90 | % | | | 0.90 | % | | | 0.96 | % |
Portfolio turnover rate | | | 22 | % | | | 34 | % | | | 31 | % | | | 61 | %(b) | | | 161 | %(b) |
Net assets at end of year (in 000’s) | | $ | 196,833 | | | $ | 102,993 | | | $ | 66,764 | | | $ | 58,571 | | | $ | 46,691 | |
| (a) | Per share data based on average shares outstanding during the year. |
| (b) | The portfolio turnover rates not including mortgage dollar rolls were 60% and 141%, for the years ended December 31, 2010 and 2009, respectively. The Portfolio did not engage in mortgage dollar rolls for the years ended December 31, 2013, 2012 and 2011, respectively. |
| | | | | | |
The notes to the financial statements are an integral part of,
and should be read in conjunction with, the financial statements. | | mainstayinvestments.com | | | M-257 | |
MainStay VP International Equity Portfolio
Investment and Performance Comparison (Unaudited)
Performance data quoted represents past performance. Past performance is no guarantee of future results. Because of market volatility, current performance may be lower or higher than the figures shown. Investment return and principal value will fluctuate, and as a result, when shares are redeemed, they may be worth more or less than their original cost. The performance table and graph do not reflect any deduction of sales charges, mortality and expense charges, contract charges or administrative charges. Please refer to the Performance Summary appropriate for your policy. For performance information current to the most recent month-end, please call 800-598-2019 or visit www.newyorklife.com.
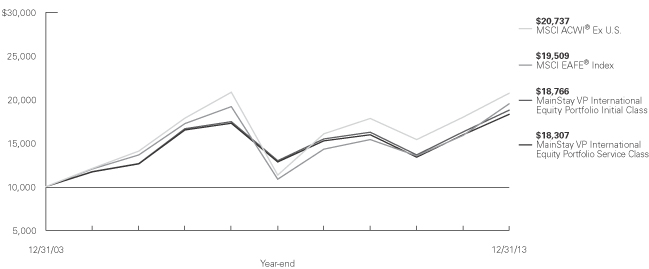
Average Annual Total Returns for the Year Ended December 31, 2013
| | | | | | | | | | | | | | | | |
| Class | | One Year | | | Five Years | | | Ten Years1 | | | Gross
Expense
Ratio2 | |
| Initial Class Shares | | | 15.11 | % | | | 7.65 | % | | | 6.50 | % | | | 0.95 | % |
| Service Class Shares | | | 14.82 | | | | 7.38 | | | | 6.23 | | | | 1.20 | |
| | | | | | | | | | | | |
| Benchmark Performance | | One
Year | | | Five
Years | | | Ten
Years | |
MSCI ACWI® Ex U.S.3 | | | 15.29 | % | | | 12.81 | % | | | 7.57 | % |
MSCI EAFE® Index3 | | | 22.78 | | | | 12.44 | | | | 6.91 | |
Average Lipper Variable Products International Growth Portfolio4 | | | 19.67 | | | | 13.86 | | | | 7.52 | |
| 1. | Performance figures shown for the ten-year period ended December 31, 2013 reflect nonrecurring reimbursements from affiliates for printing and mailing costs. If these nonrecurring reimbursements had not been made, the total returns would have been 6.49% for Initial Class shares and 6.23% for Service Class shares for the ten-year period. |
| 2. | The gross expense ratios presented reflect the Portfolio’s “Total Annual Portfolio Operating Expenses” from the most recent Prospectus and may differ from other expense ratios disclosed in this report. |
| 3. | Please refer to pages M-2 and M-3 for additional explanations and disclosure regarding the Portfolios, their benchmark indices and other indices mentioned in the reports. |
| 4. | The Average Lipper Variable Products International Growth Portfolio is representative of portfolios that, by portfolio practice, invest at least 75% of their equity assets in companies strictly outside of the U.S. International growth portfolios typically have above-average characteristics compared to the MSCI EAFE® Index. |
| | |
| M-258 | | MainStay VP International Equity Portfolio |
Cost in Dollars of a $1,000 Investment in MainStay VP International Equity Portfolio (Unaudited)
The example below is intended to describe the fees and expenses borne by shareholders during the six-month period from July 1, 2013, to December 31, 2013, and the impact of those costs on your investment.
Example
As a shareholder of the Portfolio, you incur two types of costs: (1) transaction costs, including exchange fees and sales charges (loads) on purchases (as applicable), and (2) ongoing costs, including management fees, distribution and/or service (12b-1) fees, and other Portfolio expenses (as applicable). This example is intended to help you understand your ongoing costs (in dollars) of investing in the Portfolio and to compare these costs with the ongoing costs of investing in other Portfolios. The example is based on an investment of $1,000 made at the beginning of the six-month period and held for the entire period from July 1, 2013, to December 31, 2013. Shares are only sold in connection with variable life and annuity contracts and the example does not reflect any contract level or transactional fees or expenses. If these costs had been included, your costs would have been higher.
This example illustrates your Portfolio’s ongoing costs in two ways:
Actual Expenses
The second and third data columns in the table below provide information about actual account values and actual expenses. You may use the information in these columns, together with the amount you invested, to estimate the expenses that you paid during the six months ended
December 31, 2013. Simply divide your account value by $1,000 (for example, an $8,600 account value divided by $1,000 = 8.6), then multiply the result by the number under the heading entitled “Expenses Paid During Period” to estimate the expenses you paid on your account during this period.
Hypothetical Example for Comparison Purposes
The fourth and fifth data columns in the table below provide information about hypothetical account values and hypothetical expenses based on the Portfolio’s actual expense ratio and an assumed rate of return of 5% per year before expenses, which is not the Portfolio’s actual return. The hypothetical account values and expenses may not be used to estimate the actual ending account balances or expenses you paid for the six-month period shown. You may use this information to compare the ongoing costs of investing in the Portfolio with the ongoing costs of investing in other Portfolios. To do so, compare this 5% hypothetical example with the 5% hypothetical examples that appear in the shareholder reports of the other Portfolios.
Please note that the expenses shown in the table are meant to highlight your ongoing costs only and do not reflect any transactional costs, such as exchange fees or sales charges (loads). Therefore, the fourth and fifth data columns of the table are useful in comparing ongoing costs only and will not help you determine the relative total costs of owning different funds. In addition, if these transactional costs were included, your costs would have been higher.
| | | | | | | | | | | | | | | | | | | | |
| | | | | | | | | | | | | | | | |
| Share Class | | Beginning
Account
Value
7/1/13 | | | Ending Account
Value (Based
on Actual
Returns and
Expenses)
12/31/13 | | | Expenses
Paid
During
Period1 | | | Ending Account
Value (Based
on Hypothetical
5% Annualized
Return and
Actual Expenses)
12/31/13 | | | Expenses
Paid
During
Period1 | |
| | | | | |
| Initial Class Shares | | $ | 1,000.00 | | | $ | 1,127.10 | | | $ | 5.15 | | | $ | 1,020.40 | | | $ | 4.89 | |
| | | | | |
| Service Class Shares | | $ | 1,000.00 | | | $ | 1,125.70 | | | $ | 6.48 | | | $ | 1,019.10 | | | $ | 6.16 | |
| 1. | Expenses are equal to the Portfolio’s annualized expense ratio of each class (0.96% for Initial Class and 1.21% for Service Class) multiplied by the average account value over the period, divided by 365 and multiplied by 184 (to reflect the six-month period). The table above represents the actual expenses incurred during the six-month period. |
| | | | |
| mainstayinvestments.com | | | M-259 | |
Country Composition as of December 31, 2013 (Unaudited)
| | | | |
| United Kingdom | | | 25.6 | % |
| Germany | | | 16.1 | |
| France | | | 7.0 | |
| Japan | | | 5.0 | |
| United States | | | 4.6 | |
| Ireland | | | 4.4 | |
| Sweden | | | 4.4 | |
| Switzerland | | | 4.4 | |
| Denmark | | | 4.2 | |
| Spain | | | 4.1 | |
| Israel | | | 3.5 | |
| | | | |
| China | | | 2.9 | % |
| India | | | 2.4 | |
| Canada | | | 2.3 | |
| Brazil | | | 2.0 | |
| Hong Kong | | | 1.9 | |
| Italy | | | 1.9 | |
| Thailand | | | 1.7 | |
| Indonesia | | | 0.7 | |
| Other Assets, Less Liabilities | | | 0.9 | |
| | | | |
| | | 100.0 | % |
| | | | |
See Portfolio of Investments beginning on page M-263 for specific holdings within these categories.
Top Ten Holdings as of December 31, 2013 (excluding short-term investment) (Unaudited)
| 1. | Svenska Handelsbanken AB Class A |
| | |
| M-260 | | MainStay VP International Equity Portfolio |
Portfolio Management Discussion and Analysis (Unaudited)
Answers to the questions reflect the views of portfolio managers Edward Ramos, Carlos Garcia-Tunon and Eve Glatt of Cornerstone Capital Management Holdings LLC, the Portfolio’s Subadvisor.
How did MainStay VP International Equity Portfolio perform relative to its benchmark and peers during the 12 months ended December 31, 2013?
For the 12 months ended December 31, 2013, MainStay VP International Equity Portfolio returned 15.11% for Initial Class shares and 14.82% for Service Class shares. Over the same period, both share classes underperformed the 15.29% return of the MSCI ACWI® (All Country World Index) Ex U.S.,1 which is the Portfolio’s broad-based securities-market Index, and the 22.78% return of the MSCI EAFE® Index,1 which is a secondary benchmark of the Portfolio. Both share classes underperformed the 19.67% return of the average Lipper1 Variable Products International Growth Portfolio for the 12 months ended December 31, 2013.
Were there any changes to the Portfolio during the reporting period?
Effective July 1, 2013, the Portfolio selected the MSCI ACWI® (All Country World Index) Ex. U.S., which at the time was the Portfolio’s secondary benchmark, as its primary benchmark in replacement of the MSCI EAFE® Index. The MSCI EAFE® Index was retained as the Portfolio’s secondary benchmark. The Portfolio selected the MSCI ACWI® Ex U.S. as its primary benchmark because it believes that this Index is more reflective of its current investment style. For more information on this change, see the Supplement dated June 13, 2013, to the Summary Prospectus and Prospectus, each dated May 1, 2013.
What factors affected the Portfolio’s relative performance during the reporting period?
The Portfolio’s performance relative to the MSCI ACWI® Ex U.S. suffered from unfavorable stock selection, partially offset by country and sector allocation. Stock selection suffered from two principal factors. First, our investment philosophy, which focuses on high-quality sustainable-growth companies, tends to underperform in the kind of low-quality beta2 rally that occurred during the reporting period. Second, many stocks that underperformed were domiciled in developed markets but had material exposure to emerging markets that faced growing headwinds during the reporting period. Country
allocation benefited mainly from the Portfolio’s overweight positions in Germany and the United Kingdom and an underweight position in Australia. Sector allocation benefited primarily from an overweight position in health care and underweight positions in materials and energy.
Which sectors were the strongest positive contributors to the Portfolio’s relative performance, and which sectors were particularly weak?
The strongest-contributing sectors to the Portfolio’s relative performance were information technology, materials and health care. (Contributions take weightings and total returns into account.) Information technology was the strongest contributor because of stock selection, but the sector also benefited from an overweight position relative to the MSCI ACWI® Ex U.S. Materials benefited primarily from stock selection and secondarily from an underweight position. The contribution from the health care sector came mainly from our overweight position, as stock selection in the sector detracted from relative performance.
The weakest-contributing sectors to the Portfolio’s relative performance were consumer discretionary, industrials and financials. Consumer discretionary was the greatest detractor primarily because of stock selection but also as a result of an underweight allocation relative to the MSCI ACWI® Ex U.S. Industrials also detracted because of stock selection, although the effect was partially offset by having an overweight position in the sector. Financials detracted primarily because of stock selection but also because of the Portfolio’s underweight position in the sector.
During the reporting period, which individual stocks made the strongest positive contributions to the Portfolio’s absolute performance and which stocks detracted the most?
The stocks that made the strongest positive contributions to the Portfolio’s absolute performance were Swedish banking group Svenska Handelsbanken, German sports clothing and accessories manufacturer Adidas and Spanish plasma therapeutics company Grifols. Svenska Handelsbanken benefited from strength in its Nordic operations and from the company’s expansion strategy in the United Kingdom.
| 1. | Please refer to pages M-2 and M-3 for additional explanations and disclosure regarding the Portfolios, their benchmark indices and service providers mentioned in the reports. |
| 2. | Beta is a measure of volatility in relation to the market as a whole. A beta higher than 1 indicates that a security or portfolio will tend to exhibit higher volatility than the market. A beta lower than 1 indicates that a security or portfolio will tend to exhibit lower volatility than the market. |
| | | | |
| mainstayinvestments.com | | | M-261 | |
Adidas outperformed on strong fundamental execution and valuation multiple expansion. Grifols benefitted from positive industry momentum along with positive operating leverage.
The stocks that detracted the most from the Portfolio’s absolute performance were U.K.-based energy services company Petrofac, Hong Kong consumer goods sourcing company Li & Fung and Brazilian clothing retailer Cia Hering. Petrofac suffered from contract delays in emerging markets owing largely to slower economic growth and market volatility. Li & Fung underperformed because of moderating growth in its core supply-chain management business and misexecution in its newer-owned brands division. Cia Hering suffered from a deepening economic slowdown in Brazil, along with stubbornly high inflation that affected the company’s costs.
Did the Portfolio make any significant purchases or sales during the reporting period?
Noteworthy purchases during the reporting period included new positions in Switzerland-based agrochemical and seed company Syngenta, France-based energy services provider Technip and Japanese media and entertainment company Avex. We believe Syngenta should benefit from growing wealth and food demand, particularly within emerging markets. We believe that Technip is well positioned to benefit from increased spending on complex energy-related research and development. In our view, Avex is well positioned to capitalize on the rapidly expanding consumption of media content on mobile devices.
The Portfolio eliminated its positions in Hong Kong consumer goods sourcing company Li & Fung and Brazilian clothing retailer Cia Hering. In our opinion, prospects for Li & Fung’s business became uncertain following consecutive earnings disappointments and deteriorating visibility for the company’s future growth prospects. Cia Hering faced sales headwinds as the Brazilian economy slowed, inflation risks increased and dovish monetary policy threatened to weaken the nation’s infrastructure.
How did the Portfolio’s sector weightings change during the reporting period?
The Portfolio’s sector allocations remained largely intact. There were, however, marginal increases in the Portfolio’s weightings in the materials and energy sectors. During the reporting period, the Portfolio reduced its weightings in the financials and consumer staples sectors.
How was the Portfolio positioned at the end of the reporting period?
As of December 31, 2013, the Portfolio held its most substantially overweight positions in the health care, information technology and industrials sectors. As of the same date, the Portfolio held its most substantially underweight positions in the financials, consumer staples and telecommunications services sectors.
The opinions expressed are those of the portfolio managers as of the date of this report and are subject to change. There is no guarantee that any forecasts will come to pass. This material does not constitute investment advice and is not intended as an endorsement of any specific investment.
Not all MainStay VP Portfolios and/or share classes are available under all policies.
| | |
| M-262 | | MainStay VP International Equity Portfolio |
Portfolio of Investments December 31, 2013
| | | | | | | | |
| | |
Shares | | | Value | |
| Common Stocks 97.4%† | |
Brazil 2.0% | |
Cielo S.A. (IT Services) | | | 385,140 | | | $ | 10,717,152 | |
| | | | | | | | |
|
Canada 2.3% | |
Open Text Corp. (Software) | | | 130,756 | | | | 12,024,322 | |
| | | | | | | | |
|
China 2.9% | |
China Shenhua Energy Co., Ltd. Class H (Oil, Gas & Consumable Fuels) | | | 2,477,800 | | | | 7,828,702 | |
Mindray Medical International, Ltd., ADR (Health Care Equipment & Supplies) | | | 204,134 | | | | 7,422,312 | |
| | | | | | | | |
| | | | | | | 15,251,014 | |
| | | | | | | | |
Denmark 4.2% | |
Coloplast A/S Class B (Health Care Equipment & Supplies) | | | 128,713 | | | | 8,521,132 | |
FLSmidth & Co. A/S (Construction & Engineering) | | | 244,457 | | | | 13,348,157 | |
| | | | | | | | |
| | | | | | | 21,869,289 | |
| | | | | | | | |
France 7.0% | |
Bureau Veritas S.A. (Professional Services) | | | 355,256 | | | | 10,382,972 | |
Essilor International S.A. (Health Care Equipment & Supplies) | | | 129,871 | | | | 13,807,112 | |
Technip S.A. (Energy Equipment & Services) | | | 131,089 | | | | 12,598,486 | |
| | | | | | | | |
| | | | | | | 36,788,570 | |
| | | | | | | | |
Germany 16.1% | |
¨Adidas A.G. (Textiles, Apparel & Luxury Goods) | | | 159,925 | | | | 20,381,608 | |
Brenntag A.G. (Trading Companies & Distributors) | | | 63,279 | | | | 11,730,376 | |
Fresenius Medical Care A.G. & Co. KGaA (Health Care Providers & Services) | | | 211,980 | | | | 15,085,541 | |
¨Linde A.G. (Chemicals) | | | 92,459 | | | | 19,340,120 | |
United Internet A.G. (Internet Software & Services) | | | 250,766 | | | | 10,666,739 | |
Wirecard A.G. (IT Services) | | | 188,809 | | | | 7,458,561 | |
| | | | | | | | |
| | | | | | | 84,662,945 | |
| | | | | | | | |
Hong Kong 1.9% | |
Samsonite International S.A. (Textiles, Apparel & Luxury Goods) | | | 3,216,900 | | | | 9,749,062 | |
| | | | | | | | |
|
India 2.4% | |
Genpact, Ltd. (IT Services) (a) | | | 335,318 | | | | 6,159,792 | |
Housing Development Finance Corp. (Thrifts & Mortgage Finance) | | | 515,036 | | | | 6,644,551 | |
| | | | | | | | |
| | | | | | | 12,804,343 | |
| | | | | | | | |
| | | | | | | | |
| | |
Shares | | | Value | |
Indonesia 0.7% | |
Media Nusantara Citra Tbk PT (Media) | | | 16,783,500 | | | $ | 3,620,106 | |
| | | | | | | | |
|
Ireland 4.4% | |
ICON PLC (Life Sciences Tools & Services) (a) | | | 154,285 | | | | 6,234,657 | |
¨Shire PLC (Pharmaceuticals) | | | 359,113 | | | | 16,960,078 | |
| | | | | | | | |
| | | | | | | 23,194,735 | |
| | | | | | | | |
Israel 3.5% | |
Check Point Software Technologies, Ltd. (Software) (a) | | | 200,450 | | | | 12,933,034 | |
Teva Pharmaceutical Industries, Ltd., Sponsored ADR (Pharmaceuticals) | | | 140,824 | | | | 5,644,226 | |
| | | | | | | | |
| | | | | | | 18,577,260 | |
| | | | | | | | |
Italy 1.9% | |
DiaSorin S.p.A. (Health Care Equipment & Supplies) | | | 207,210 | | | | 9,717,650 | |
| | | | | | | | |
|
Japan 5.0% | |
Avex Group Holdings, Inc. (Media) | | | 510,900 | | | | 10,964,144 | |
Daito Trust Construction Co., Ltd. (Real Estate Management & Development) | | | 91,100 | | | | 8,503,589 | |
Sysmex Corp. (Health Care Equipment & Supplies) | | | 113,600 | | | | 6,698,851 | |
| | | | | | | | |
| | | | | | | 26,166,584 | |
| | | | | | | | |
Spain 4.1% | |
¨Grifols S.A. (Biotechnology) | | | 453,621 | | | | 21,694,964 | |
| | | | | | | | |
|
Sweden 4.4% | |
¨Svenska Handelsbanken AB Class A (Commercial Banks) | | | 464,528 | | | | 22,822,492 | |
| | | | | | | | |
|
Switzerland 4.4% | |
DKSH Holding A.G. (Professional Services) | | | 76,665 | | | | 5,955,815 | |
¨Syngenta A.G. (Chemicals) | | | 42,675 | | | | 16,992,500 | |
| | | | | | | | |
| | | | | | | 22,948,315 | |
| | | | | | | | |
Thailand 1.7% | |
Kasikornbank PCL (Commercial Banks) | | | 1,877,400 | | | | 9,055,627 | |
| | | | | | | | |
|
United Kingdom 25.6% | |
Aggreko PLC (Commercial Services & Supplies) | | | 561,886 | | | | 15,901,477 | |
¨Experian PLC (Professional Services) | | | 920,216 | | | | 16,975,484 | |
¨Intertek Group PLC (Professional Services) | | | 320,298 | | | | 16,696,912 | |
¨Johnson Matthey PLC (Chemicals) | | | 351,574 | | | | 19,095,797 | |
Petrofac, Ltd. (Energy Equipment & Services) | | | 708,364 | | | | 14,357,707 | |
¨SABMiller PLC (Beverages) | | | 378,784 | | | | 19,450,940 | |
| † | Percentages indicated are based on Portfolio net assets. |
| ¨ | | Among the Portfolio’s 10 largest holdings, as of December 31, 2013, excluding short-term investment. May be subject to change daily. |
| | | | | | |
The notes to the financial statements are an integral part of,
and should be read in conjunction with, the financial statements. | | mainstayinvestments.com | | | M-263 | |
Portfolio of Investments December 31, 2013 (continued)
| | | | | | | | |
| | |
Shares | | | Value | |
| Common Stocks (continued) | |
United Kingdom (continued) | |
Standard Chartered PLC (Commercial Banks) | | | 722,188 | | | $ | 16,264,337 | |
Telecity Group PLC (Internet Software & Services) | | | 486,649 | | | | 5,846,561 | |
Whitbread PLC (Hotels, Restaurants & Leisure) | | | 155,459 | | | | 9,656,286 | |
| | | | | | | | |
| | | | | | | 134,245,501 | |
| | | | | | | | |
United States 2.9% | |
Accenture PLC Class A (IT Services) | | | 68,911 | | | | 5,665,862 | |
ResMed, Inc. (Health Care Equipment & Supplies) | | | 207,788 | | | | 9,782,659 | |
| | | | | | | | |
| | | | | | | 15,448,521 | |
| | | | | | | | |
Total Common Stocks
(Cost $410,190,442) | | | | | | | 511,358,452 | |
| | | | | | | | |
| | |
| | | | | | | | |
| | | Principal
Amount | | | | |
| Short-Term Investment 1.7% | |
Repurchase Agreement 1.7% | |
United States 1.7% | |
State Street Bank and Trust Co.
0.00%, dated 12/31/13
due 1/2/14
Proceeds at Maturity $8,913,487 (Collateralized by a Federal National Mortgage Association security with a rate of 2.17% and a maturity date of 11/7/22, with a Principal Amount of $9,990,000 and a Market Value of $9,094,047) (Capital Markets) | | $ | 8,913,487 | | | | 8,913,487 | |
| | | | | | | | |
Total Short-Term Investment
(Cost $8,913,487) | | | | | | | 8,913,487 | |
| | | | | | | | |
Total Investments
(Cost $419,103,929) (b) | | | 99.1 | % | | | 520,271,939 | |
Other Assets, Less Liabilities | | | 0.9 | | | | 4,746,058 | |
Net Assets | | | 100.0 | % | | $ | 525,017,997 | |
| (a) | Non-income producing security. |
| (b) | As of December 31, 2013, cost is $419,786,202 for federal income tax purposes and net unrealized appreciation is as follows: |
| | | | |
Gross unrealized appreciation | | $ | 113,301,225 | |
Gross unrealized depreciation | | | (12,815,488 | ) |
| | | | |
Net unrealized appreciation | | $ | 100,485,737 | |
| | | | |
The following abbreviation is used in the above portfolio:
ADR—American Depositary Receipt
| | | | |
| M-264 | | MainStay VP International Equity Portfolio | | The notes to the financial statements are an integral part of,
and should be read in conjunction with, the financial statements. |
The following is a summary of the fair valuations according to the inputs used as of December 31, 2013, for valuing the Portfolio’s assets.
Asset Valuation Inputs
| | | | | | | | | | | | | | | | |
Description | | Quoted Prices
in Active Markets
for Identical Assets (Level 1) | | | Significant Other
Observable Inputs (Level 2) | | | Significant
Unobservable
Inputs (Level 3) | | | Total | |
| Investments in Securities (a) | | | | | | | | | | | | | | | | |
| Common Stocks | | $ | 511,358,452 | | | $ | — | | | $ | — | | | $ | 511,358,452 | |
| Short-Term Investment | | | | | | | | | | | | | | | | |
Repurchase Agreement | | | — | | | | 8,913,487 | | | | — | | | | 8,913,487 | |
| | | | | | | | | | | | | | | | |
| Total Investments in Securities | | $ | 511,358,452 | | | $ | 8,913,487 | | | $ | — | | | $ | 520,271,939 | |
| | | | | | | | | | | | | | | | |
| (a) | For a complete listing of investments and their industries, see the Portfolio of Investments. |
The Portfolio recognizes transfers between the levels as of the beginning of the period.
As of December 31, 2013, certain foreign securities with a market value of $314,504,873 were transferred from Level 2 to Level 1 as the prices of these securities were based on unadjusted quoted prices compared to prior year prices which were adjusted for events after the market close. The December 31, 2012 prices were adjusted by applying factors provided by a third party vendor in accordance with the Portfolio’s policies and procedures. Fair values as of December 31, 2013, for these securities were based on quoted prices in active markets for identical investments. (See Note 2)
As of December 31, 2013, the Portfolio did not hold any investments with significant unobservable inputs (Level 3). (See Note 2)
The table below sets forth the diversification of MainStay VP International Equity Portfolio investments by industry.
Industry Diversification (Unaudited)
| | | | | | | | |
| | | Value | | | Percent† | |
Beverages | | $ | 19,450,940 | | | | 3.7 | % |
Biotechnology | | | 21,694,964 | | | | 4.1 | |
Capital Markets | | | 8,913,487 | | | | 1.7 | |
Chemicals | | | 55,428,417 | | | | 10.6 | |
Commercial Banks | | | 48,142,456 | | | | 9.2 | |
Commercial Services & Supplies | | | 15,901,477 | | | | 3.0 | |
Construction & Engineering | | | 13,348,157 | | | | 2.5 | |
Energy Equipment & Services | | | 26,956,193 | | | | 5.1 | |
Health Care Equipment & Supplies | | | 55,949,716 | | | | 10.7 | |
Health Care Providers & Services | | | 15,085,541 | | | | 2.9 | |
Hotels, Restaurants & Leisure | | | 9,656,286 | | | | 1.8 | |
Internet Software & Services | | | 16,513,300 | | | | 3.2 | |
IT Services | | | 30,001,367 | | | | 5.7 | |
Life Sciences Tools & Services | | | 6,234,657 | | | | 1.2 | |
Media | | | 14,584,250 | | | | 2.8 | |
Oil, Gas & Consumable Fuels | | | 7,828,702 | | | | 1.5 | |
Pharmaceuticals | | | 22,604,304 | | | | 4.3 | |
Professional Services | | | 50,011,183 | | | | 9.5 | |
Real Estate Management & Development | | | 8,503,589 | | | | 1.6 | |
Software | | | 24,957,356 | | | | 4.8 | |
Textiles, Apparel & Luxury Goods | | | 30,130,670 | | | | 5.7 | |
Thrifts & Mortgage Finance | | | 6,644,551 | | | | 1.3 | |
Trading Companies & Distributors | | | 11,730,376 | | | | 2.2 | |
| | | | | | | | |
| | | 520,271,939 | | | | 99.1 | |
Other Assets, Less Liabilities | | | 4,746,058 | | | | 0.9 | |
| | | | | | | | |
Net Assets | | $ | 525,017,997 | | | | 100.0 | % |
| | | | | | | | |
| † | Percentages indicated are based on Portfolio net assets. |
| | | | | | |
The notes to the financial statements are an integral part of,
and should be read in conjunction with, the financial statements. | | mainstayinvestments.com | | | M-265 | |
Statement of Assets and Liabilities as of December 31, 2013
| | | | |
| Assets | | | | |
Investment in securities, at value (identified cost $419,103,929) | | $ | 520,271,939 | |
Cash denominated in foreign currencies (identified cost $7,123,007) | | | 7,086,409 | |
Receivables: | | | | |
Dividends and interest | | | 449,577 | |
Fund shares sold | | | 187,001 | |
| | | | |
Total assets | | | 527,994,926 | |
| | | | |
| |
| Liabilities | | | | |
Payables: | | | | |
Investment securities purchased | | | 2,088,455 | |
Manager (See Note 3) | | | 387,524 | |
Fund shares redeemed | | | 205,956 | |
Foreign capital gains tax (See Note 2(D)) | | | 143,718 | |
NYLIFE Distributors (See Note 3) | | | 65,109 | |
Professional fees | | | 41,691 | |
Shareholder communication | | | 26,302 | |
Custodian | | | 16,782 | |
Trustees | | | 590 | |
Accrued expenses | | | 802 | |
| | | | |
Total liabilities | | | 2,976,929 | |
| | | | |
Net assets | | $ | 525,017,997 | |
| | | | |
| |
| Net Assets Consist of | | | | |
Shares of beneficial interest outstanding (par value of $.001 per share) unlimited number of shares authorized | | $ | 38,204 | |
Additional paid-in capital | | | 533,598,159 | |
| | | | |
| | | 533,636,363 | |
Undistributed net investment income | | | 3,049,487 | |
Accumulated net realized gain (loss) on investments and foreign currency transactions (a) | | | (112,665,637 | ) |
Net unrealized appreciation (depreciation) on investments (b) | | | 101,024,292 | |
Net unrealized appreciation (depreciation) on translation of other assets and liabilities in foreign currencies | | | (26,508 | ) |
| | | | |
Net assets | | $ | 525,017,997 | |
| | | | |
| | | | |
Initial Class | | | | |
Net assets applicable to outstanding shares | | $ | 208,807,484 | |
| | | | |
Shares of beneficial interest outstanding | | | 15,117,778 | |
| | | | |
Net asset value per share outstanding | | $ | 13.81 | |
| | | | |
Service Class | | | | |
Net assets applicable to outstanding shares | | $ | 316,210,513 | |
| | | | |
Shares of beneficial interest outstanding | | | 23,086,414 | |
| | | | |
Net asset value per share outstanding | | $ | 13.70 | |
| | | | |
| (a) | Realized gain (loss) on security transactions recorded net of foreign capital gains tax in the amount of $87,028. |
| (b) | Unrealized appreciation (depreciation) on investments recorded net of foreign capital gains tax in the amount of $143,718. |
| | | | |
| M-266 | | MainStay VP International Equity Portfolio | | The notes to the financial statements are an integral part of,
and should be read in conjunction with, the financial statements. |
Statement of Operations for the year ended December 31, 2013
| | | | |
| Investment Income (Loss) | | | | |
Income | | | | |
Dividends (a) | | $ | 8,417,833 | |
Interest (b) | | | 3,445 | |
| | | | |
Total income | | | 8,421,278 | |
| | | | |
Expenses | | | | |
Manager (See Note 3) | | | 4,297,641 | |
Distribution and service—Service Class (See Note 3) | | | 733,183 | |
Custodian | | | 101,303 | |
Shareholder communication | | | 86,382 | |
Professional fees | | | 71,807 | |
Trustees | | | 9,864 | |
Miscellaneous | | | 34,947 | |
| | | | |
Total expenses | | | 5,335,127 | |
| | | | |
Net investment income (loss) | | | 3,086,151 | |
| | | | |
|
| Realized and Unrealized Gain (Loss) on Investments and Foreign Currency Transactions | |
Net realized gain (loss) on: | | | | |
Security transactions (c) | | | 23,411,176 | |
Foreign currency transactions | | | 50,392 | |
| | | | |
Net realized gain (loss) on investments and foreign currency transactions | | | 23,461,568 | |
| | | | |
Net change in unrealized appreciation (depreciation) on: | | | | |
Investments (d) | | | 41,233,207 | |
Translation of other assets and liabilities in foreign currencies | | | (145,256 | ) |
| | | | |
Net change in unrealized appreciation (depreciation) on investments and foreign currency transactions | | | 41,087,951 | |
| | | | |
Net realized and unrealized gain (loss) on investments and foreign currency transactions | | | 64,549,519 | |
| | | | |
Net increase (decrease) in net assets resulting from operations | | $ | 67,635,670 | |
| | | | |
| (a) | Dividends recorded net of foreign withholding taxes in the amount of $791,215. |
| (b) | Interest recorded net of foreign withholding taxes in the amount of $194. |
| (c) | Realized gain (loss) on security transactions recorded net of foreign capital gains tax in the amount of $87,028. |
| (d) | Unrealized appreciation (depreciation) on investments recorded net of foreign capital gains tax in the amount of $143,718. |
| | | | | | |
The notes to the financial statements are an integral part of,
and should be read in conjunction with, the financial statements. | | mainstayinvestments.com | | | M-267 | |
Statements of Changes in Net Assets
for the years ended December 31, 2013 and December 31, 2012
| | | | | | | | |
| | | 2013 | | | 2012 | |
| Increase (Decrease) in Net Assets | |
Operations: | | | | | | | | |
Net investment income (loss) | | $ | 3,086,151 | | | $ | 4,418,992 | |
Net realized gain (loss) on investments and foreign currency transactions | | | 23,461,568 | | | | (783,562 | ) |
Net change in unrealized appreciation (depreciation) on investments and foreign currency transactions | | | 41,087,951 | | | | 74,997,523 | |
| | | | |
Net increase (decrease) in net assets resulting from operations | | | 67,635,670 | | | | 78,632,953 | |
| | | | |
Dividends to shareholders: | | | | | | | | |
From net investment income: | | | | | | | | |
Initial Class | | | (2,225,969 | ) | | | (3,187,864 | ) |
Service Class | | | (2,804,014 | ) | | | (4,283,314 | ) |
| | | | |
Total dividends to shareholders | | | (5,029,983 | ) | | | (7,471,178 | ) |
| | | | |
Capital share transactions: | | | | | | | | |
Net proceeds from sale of shares | | | 66,909,262 | | | | 52,233,170 | |
Net asset value of shares issued to shareholders in reinvestment of dividends | | | 5,029,983 | | | | 7,471,178 | |
Cost of shares redeemed | | | (65,502,350 | ) | | | (78,567,358 | ) |
| | | | |
Increase (decrease) in net assets derived from capital share transactions | | | 6,436,895 | | | | (18,863,010 | ) |
| | | | |
Net increase (decrease) in net assets | | | 69,042,582 | | | | 52,298,765 | |
| | |
| Net Assets | | | | | | | | |
Beginning of year | | | 455,975,415 | | | | 403,676,650 | |
| | | | |
End of year | | $ | 525,017,997 | | | $ | 455,975,415 | |
| | | | |
Undistributed net investment income at end of year | | $ | 3,049,487 | | | $ | 5,029,955 | |
| | | | |
| | | | |
| M-268 | | MainStay VP International Equity Portfolio | | The notes to the financial statements are an integral part of,
and should be read in conjunction with, the financial statements. |
Financial Highlights selected per share data and ratios
| | | | | | | | | | | | | | | | | | | | |
| | | Initial Class | |
| | | Year ended December 31, | |
| | | 2013 | | | 2012 | | | 2011 | | | 2010 | | | 2009 | |
Net asset value at beginning of year | | $ | 12.14 | | | $ | 10.34 | | | $ | 12.82 | | | $ | 12.63 | | | $ | 11.30 | |
| | | | | | | | | | | | | | | | | | | | |
Net investment income (loss) | | | 0.10 | (a) | | | 0.13 | (a) | | | 0.29 | (a) | | | 0.29 | (b) | | | 0.32 | (a) |
Net realized and unrealized gain (loss) on investments | | | 1.72 | | | | 1.86 | | | | (2.35 | ) | | | 0.30 | | | | 1.74 | |
Net realized and unrealized gain (loss) on foreign currency transactions | | | (0.00 | )‡ | | | 0.02 | | | | (0.02 | ) | | | 0.01 | | | | 0.13 | |
| | | | | | | | | | | | | | | | | | | | |
Total from investment operations | | | 1.82 | | | | 2.01 | | | | (2.08 | ) | | | 0.60 | | | | 2.19 | |
| | | | | | | | | | | | | | | | | | | | |
Less dividends: | | | | | | | | | | | | | | | | | | | | |
From net investment income | | | (0.15 | ) | | | (0.21 | ) | | | (0.40 | ) | | | (0.41 | ) | | | (0.86 | ) |
| | | | | | | | | | | | | | | | | | | | |
Net asset value at end of year | | $ | 13.81 | | | $ | 12.14 | | | $ | 10.34 | | | $ | 12.82 | | | $ | 12.63 | |
| | | | | | | | | | | | | | | | | | | | |
Total investment return | | | 15.11 | % | | | 19.48 | % | | | (16.04 | %) | | | 4.90 | % | | | 19.36 | % |
Ratios (to average net assets)/Supplemental Data: | | | | | | | | | | | | | | | | | | | | |
Net investment income (loss) | | | 0.78 | % | | | 1.14 | % | | | 2.40 | % | | | 2.34 | %(b) | | | 2.75 | % |
Net expenses | | | 0.95 | % | | | 0.95 | % | | | 0.95 | % | | | 0.98 | % | | | 0.99 | % |
Portfolio turnover rate | | | 34 | % | | | 42 | % | | | 101 | % | | | 42 | % | | | 83 | % |
Net assets at end of year (in 000’s) | | $ | 208,807 | | | $ | 180,124 | | | $ | 147,740 | | | $ | 265,519 | | | $ | 256,710 | |
| ‡ | Less than one cent per share. |
| (a) | Per share data based on average shares outstanding during the year. |
| (b) | Included in net investment income per share and the ratio of net investment income to average net assets are $0.04 per share and 0.30%, respectively, resulting from a special one-time dividend from Ryanair Holdings PLC that paid $0.30 per share. |
| | | | | | | | | | | | | | | | | | | | |
| | | Service Class | |
| | | Year ended December 31, | |
| | | 2013 | | | 2012 | | | 2011 | | | 2010 | | | 2009 | |
Net asset value at beginning of year | | $ | 12.04 | | | $ | 10.26 | | | $ | 12.72 | | | $ | 12.54 | | | $ | 11.22 | |
| | | | | | | | | | | | | | | | | | | | |
Net investment income (loss) | | | 0.07 | (a) | | | 0.10 | (a) | | | 0.26 | (a) | | | 0.23 | (b) | | | 0.28 | (a) |
Net realized and unrealized gain (loss) on investments | | | 1.71 | | | | 1.84 | | | | (2.33 | ) | | | 0.32 | | | | 1.73 | |
Net realized and unrealized gain (loss) on foreign currency transactions | | | (0.00 | )‡ | | | 0.02 | | | | (0.02 | ) | | | 0.01 | | | | 0.13 | |
| | | | | | | | | | | | | | | | | | | | |
Total from investment operations | | | 1.78 | | | | 1.96 | | | | (2.09 | ) | | | 0.56 | | | | 2.14 | |
| | | | | | | | | | | | | | | | | | | | |
Less dividends: | | | | | | | | | | | | | | | | | | | | |
From net investment income | | | (0.12 | ) | | | (0.18 | ) | | | (0.37 | ) | | | (0.38 | ) | | | (0.82 | ) |
| | | | | | | | | | | | | | | | | | | | |
Net asset value at end of year | | $ | 13.70 | | | $ | 12.04 | | | $ | 10.26 | | | $ | 12.72 | | | $ | 12.54 | |
| | | | | | | | | | | | | | | | | | | | |
Total investment return | | | 14.82 | % | | | 19.18 | % | | | (16.25 | %) | | | 4.63 | % | | | 19.06 | % |
Ratios (to average net assets)/Supplemental Data: | | | | | | | | | | | | | | | | | | | | |
Net investment income (loss) | | | 0.55 | % | | | 0.88 | % | | | 2.17 | % | | | 2.10 | %(b) | | | 2.47 | % |
Net expenses | | | 1.20 | % | | | 1.20 | % | | | 1.20 | % | | | 1.23 | % | | | 1.24 | % |
Portfolio turnover rate | | | 34 | % | | | 42 | % | | | 101 | % | | | 42 | % | | | 83 | % |
Net assets at end of year (in 000’s) | | $ | 316,211 | | | $ | 275,852 | | | $ | 255,937 | | | $ | 298,008 | | | $ | 262,263 | |
| ‡ | Less than one cent per share. |
| (a) | Per share data based on average shares outstanding during the year. |
| (b) | Included in net investment income per share and the ratio of net investment income to average net assets are $0.04 per share and 0.30%, respectively, resulting from a special one-time dividend from Ryanair Holdings PLC that paid $0.30 per share. |
| | | | | | |
The notes to the financial statements are an integral part of,
and should be read in conjunction with, the financial statements. | | mainstayinvestments.com | | | M-269 | |
MainStay VP Janus Balanced Portfolio
Investment and Performance Comparison1 (Unaudited)
Performance data quoted represents past performance. Past performance is no guarantee of future results. Because of market volatility, current performance may be lower or higher than the figures shown. Investment return and principal value will fluctuate, and as a result, when shares are redeemed, they may be worth more or less than their original cost. The performance table and graph do not reflect any deduction of sales charges, mortality and expense charges, contract charges or administrative charges. Please refer to the Performance Summary appropriate for your policy. For performance information current to the most recent month-end, please call 800-598-2019 or visit www.newyorklife.com.
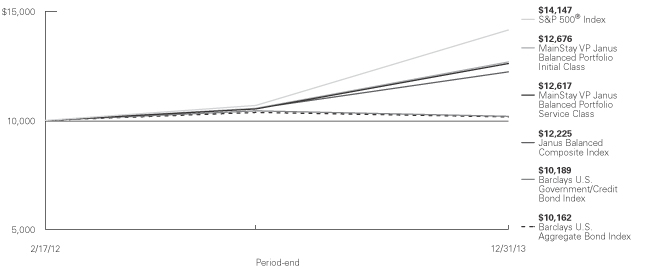
Average Annual Total Returns for the Period Ended December 31, 2013
| | | | | | | | | | | | |
| Class | | One Year | | | Since Inception (2/17/12) | | | Gross Expense Ratio2 | |
| Initial Class Shares | | | 20.15 | % | | | 13.51 | % | | | 0.59 | % |
| Service Class Shares | | | 19.86 | | | | 13.23 | | | | 0.84 | |
| | | | | | | | |
| Benchmark Performance | | One
Year | | | Since Inception
(2/17/12) | |
S&P 500® Index3 | | | 32.39 | % | | | 20.41 | % |
Barclays U.S. Aggregate Bond Index3 | | | –2.02 | | | | 0.86 | |
Barclays U.S. Government/Credit Bond Index3 | | | –2.35 | | | | 1.01 | |
Janus Balanced Composite Index3 | | | 15.81 | | | | 11.33 | |
Average Lipper Variable Products Mixed-Asset Target Allocation Moderate Portfolio4 | | | 14.27 | | | | 10.52 | |
| 1. | Performance figures reflect certain fee waivers and/or expense limitations, without which total returns may have been different. For information on current fee waivers and/or expense limitations, please refer to the notes to the financial statements. |
| 2. | The gross expense ratios presented reflect the Portfolio’s “Total Annual Portfolio Operating Expenses” from the most recent Prospectus and may differ from other expense ratios disclosed in this report. |
| 3. | Please refer to pages M-2 and M-3 for additional explanations and disclosure regarding the Portfolios, their benchmark indices and other indices mentioned in the reports. |
| 4. | The Average Lipper Variable Products Mixed-Asset Target Allocation Moderate Portfolio is representative of portfolios that, by portfolio practice, maintain a mix of between 40%-60% equity securities, with the remainder invested in bonds, cash, and cash equivalents. Lipper Inc. is an independent monitor of fund performance. Results are based on total returns with all dividend and capital gain distributions reinvested. |
| | |
| M-270 | | MainStay VP Janus Balanced Portfolio |
Cost in Dollars of a $1,000 Investment in MainStay VP Janus Balanced Portfolio (Unaudited)
The example below is intended to describe the fees and expenses borne by shareholders during the period from July 1, 2013, to December 31, 2013, and the impact of those costs on your investment.
Example
As a shareholder of the Portfolio, you incur two types of costs: (1) transaction costs, including exchange fees and sales charges (loads) on purchases (as applicable), and (2) ongoing costs, including management fees, distribution and/or service (12b-1) fees, and other Portfolio expenses (as applicable). This example is intended to help you understand your ongoing costs (in dollars) of investing in the Portfolio and to compare these costs with the ongoing costs of investing in other Portfolios. The example is based on an investment of $1,000 made at the beginning of the six-month period and held for the entire period from July 1, 2013, to December 31, 2013. Shares are only sold in connection with variable life and annuity contracts and the example does not reflect any contract level or transactional fees or expenses. If these costs had been included, your costs would have been higher.
This example illustrates your Portfolio’s ongoing costs in two ways:
Actual Expenses
The second and third data columns in the table below provide information about actual account values and actual expenses. You may use the information in these columns, together with the amount you invested, to estimate the expenses that you paid during the six months ended
December 31, 2013. Simply divide your account value by $1,000 (for example, an $8,600 account value divided by $1,000 = 8.6), then multiply the result by the number under the heading entitled ‘‘Expenses Paid During Period’’ to estimate the expenses you paid on your account during this period.
Hypothetical Example for Comparison Purposes
The fourth and fifth data columns in the table below provide information about hypothetical account values and hypothetical expenses based on the Portfolio’s actual expense ratio and an assumed rate of return of 5% per year before expenses, which is not the Portfolio’s actual return. The hypothetical account values and expenses may not be used to estimate the actual ending account balances or expenses you paid for the six-month period shown. You may use this information to compare the ongoing costs of investing in the Portfolio with the ongoing costs of investing in other Portfolios. To do so, compare this 5% hypothetical example with the 5% hypothetical examples that appear in the shareholder reports of the other Portfolios.
Please note that the expenses shown in the table are meant to highlight your ongoing costs only and do not reflect any transactional costs, such as exchange fees or sales charges (loads). Therefore, the fourth and fifth data columns of the table are useful in comparing ongoing costs only and will not help you determine the relative total costs of owning different funds. In addition, if these transactional costs were included, your costs would have been higher.
| | | | | | | | | | | | | | | | | | | | |
| | | | | | | | | | | | | | | | |
| Share Class | | Beginning
Account
Value
7/1/13 | | | Ending Account
Value (Based
on Actual
Returns and
Expenses)
12/31/13 | | | Expenses
Paid
During
Period1 | | | Ending Account
Value (Based
on Hypothetical
5% Annualized
Return and
Actual Expenses)
12/31/13 | | | Expenses
Paid
During
Period1 | |
| | | | | |
| Initial Class Shares | | $ | 1,000.00 | | | $ | 1,112.40 | | | $ | 3.09 | | | $ | 1,022.30 | | | $ | 2.96 | |
| | | | | |
| Service Class Shares | | $ | 1,000.00 | | | $ | 1,111.00 | | | $ | 4.42 | | | $ | 1,021.00 | | | $ | 4.23 | |
| 1. | Expenses are equal to the Portfolio’s annualized expense ratio of each class (0.58% for Initial Class and 0.83% for Service Class) multiplied by the average account value over the period, divided by 365 and multiplied by 184 (to reflect the six-month period). The table above represents the actual expenses incurred during the six-month period. |
| | | | |
| mainstayinvestments.com | | | M-271 | |
Portfolio Composition as of December 31, 2013 (Unaudited)
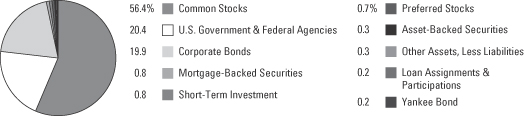
See Portfolio of Investments beginning on page M-277 for specific holdings within these categories.
Top Ten Holdings or Issuers Held as of December 31, 2013 (excluding short-term investment) (Unaudited)
| 1. | United States Treasury Notes, 0.125%–2.50%, due 4/30/15–8/15/23 |
| 2. | Federal National Mortgage Association (Mortgage Pass-Through Securities), 4.50%–7.00%, due 1/1/25–2/1/43 |
| 4. | Government National Mortgage Association (Mortgage Pass-Through Securities), 3.50%–6.00%, due 1/15/32–2/20/43 |
| 6. | E.I. du Pont de Nemours & Co. |
| 7. | Blackstone Group L.P. (The) |
| 8. | LyondellBasell Industries, N.V. Class A |
| 10. | Philip Morris International, Inc. |
| | |
| M-272 | | MainStay VP Janus Balanced Portfolio |
Portfolio Management Discussion and Analysis (Unaudited)
Answers to the questions reflect the views of portfolio managers E. Marc Pinto, CFA, and R. Gibson Smith of Janus Capital Management LLC (“Janus Capital”), the Portfolio’s Subadvisor.
How did MainStay VP Janus Balanced Portfolio perform relative to its benchmark and peers for the 12 months ended December 31, 2013?
For the 12 months ended December 31, 2013, MainStay VP Janus Balanced Portfolio returned 20.15% for Initial Class shares and 19.86% for Service Class shares. Over the same period, both share classes underperformed the 32.39% return of the S&P 500® Index,1 which is the Portfolio’s broad-based securities-market index. Both share classes outperformed the –2.02% return of the Barclays U.S. Aggregate Bond Index,1 the –2.35% return of the Barclays U.S. Government/Credit Bond Index1 and the 15.81% return of the Janus Balanced Composite Index1 for the 12 months ended December 31, 2013. The Barclays U.S. Aggregate Bond Index is the Portfolio’s secondary benchmark. The Barclays U.S. Government/Credit Bond Index and the Janus Balanced Composite Index are additional benchmarks of the Portfolio. For the 12 months ended December 31, 2013, both share classes outperformed the 14.27% return of the average Lipper1 Variable Products Mixed-Asset Target Allocation Moderate Portfolio.
What factors affected the Portfolio’s relative performance during the reporting period?
The equity portion of the Portfolio outperformed the S&P 500® Index during the reporting period, primarily as a result of security selection and overweight positions in the consumer discretionary and industrials sectors. Stock selection in consumer staples was the most substantial detractor from relative performance, although this was balanced to some extent by an underweight position in the sector. Security selection in telecommunication services also detracted, although an underweight position in the sector once again partially offset the effect. The Portfolio, because of the 65% equity limit, will tend to underperform its all-equity primary benchmark during strong equity markets.
The fixed-income portion of the Portfolio outperformed the Barclays U.S. Aggregate Bond Index, largely because of an overweight position and security selection in corporate credit, as well as the additional income (or spread carry) that our credit holdings generated in relation to securities in the Index. From an industry sector standpoint, top credit contributors included wireline communications, banking and non-captive diversified financial companies. (Contributions
take weightings and total returns into account.) Sector detractors were led by consumer cyclical services, property and casualty insurers, and integrated energy companies.
Which sectors in the equity portion of Portfolio were the strongest positive contributors to the Portfolio’s relative performance, and which sectors in the equity portion of the Portfolio were particularly weak?
Favorable stock selection and an overweight in the consumer discretionary sector made the sector a top contributor to performance during the reporting period. Stock selection made industrials the second strongest-contributing sector relative to the S&P 500® Index, while information technology was a strong contributor because of stock selection.
Relative to the S&P 500® Index, the weakest sector contributions during the reporting period came from consumer staples. Stock selection in telecommunications services also detracted from relative performance.
During the reporting period, which individual stocks made the strongest positive contributions to the absolute performance of the equity portion of the Portfolio and which individual stocks detracted the most?
Among individual stocks, aerospace leader Boeing was the top contributor during the reporting period. Earlier issues with Boeing’s new 787 Dreamliner wide-body jet appeared to be resolved, and the plane was put back in service during the reporting period. The strong order book for the Boeing 787—and the newest version of the Boeing 747—gave the market renewed confidence that Boeing’s years-long production backlog would continue to grow. We believe that the company’s cash-flow generation may increase as Boeing reduces capital expenditures and working capital, allowing the company to return more capital to shareholders.
Multimedia company CBS performed well following its decision to spin off its billboard business into a real estate investment trust (REIT). The company used the proceeds to buy back stock and repurchase debt. CBS also effectively won its contract dispute with Time Warner Cable during the reporting period. The victory reinforced our view of the power of content, which CBS certainly has with its ownership of prime sports coverage and other popular programming.
| 1. | Please refer to pages M-2 and M-3 for additional explanations and disclosure regarding the Portfolios, their benchmark indices and service providers mentioned in the reports. |
| | | | |
| mainstayinvestments.com | | | M-273 | |
Asset manager Blackstone Group contributed positively to the Portfolio’s performance. Blackstone’s stock tends to be supported by strength in equity markets. Factors that contributed to the company’s gains in 2013 included the equity rally; increased activity from private equity investors; and the continued recovery in real estate, to which Blackstone has significant exposure through its funds and direct investments.
Did the equity portion of the Portfolio make any significant purchases or sales during the reporting period?
We initiated a position in global financial services provider JPMorgan Chase. We believe that the company offers a compelling risk-adjusted return opportunity for the Portfolio, and we view the company as the best in its class. JPMorgan Chase has executed well on all business lines and has attained industry-leading returns in all segments. In addition, because the Federal Reserve has become more relaxed about letting the company return capital to shareholders, we anticipate continued share repurchases and dividend increases.
We initiated a position in data communications and telecommunications provider Motorola Solutions partly on the strength of its mission- and business-critical communication solutions (e.g., two-way radios, mobile computing and data capture products) for government and business clients. Despite governmental budget pressures, we believed that first-response communications equipment was well positioned in terms of funding, technology migration and political support. We also believed that stability in the company’s gross margins and operating leverage should allow significant margin expansion.
During the reporting period, we eliminated the Portfolio’s equity position in copper, gold and molybdenum mining company Freeport-McMoRan Copper & Gold because it violated our investment thesis. We liked the company because of its large copper position and because it was a low-cost producer. Unfortunately, the company announced two large oil and gas acquisitions, which made the stock incompatible with our approach to investing.
We sold U.K. bank Standard Chartered in the fourth quarter of 2013. Heavy exposure to emerging markets, particularly India, has weighed on near-term results, given those markets’ weaker-than-expected
economic growth during the year. Additionally, continuing regulatory hurdles in the U.K. have hampered Standard Chartered’s earnings potential. We believed that these factors created too many obstacles for the stock to move higher over the short- to medium-term, so we sold the Portfolio’s position.
How did sector weightings change in the equity portion of the Portfolio during the reporting period?
In the equity portion of the Portfolio, we increased our weighting in the health care sector, where we have been seeing opportunities in managed care, biotechnology and large pharmaceutical companies. We also slightly increased our allocation to industrials.
We trimmed our allocation to consumer discretionary stocks during the reporting period, although we still favor the sector in light of strong consumer spending patterns, both in the United States and globally. We also reduced our weighting in information technology, which we view as a challenging sector, particularly for hardware companies facing significant pressures from the growth in virtualization software and software-as-a-service companies.
How was the equity portion of the Portfolio positioned at the end of the reporting period?
As of December 31, 2013, the equity portion of the Portfolio was overweight relative to the S&P 500® Index in the consumer discretionary sector, an area we have long favored in light of consumer spending patterns. As of the same date, the equity portion of the Portfolio held an overweight position in health care, where we are finding companies that we believe will benefit from health care reform and other factors. As of December 31, 2013, the equity portion of the Portfolio held underweight positions relative to the S&P 500® Index in the energy and financials sectors.
What was the duration2 strategy of the fixed-income portion of the Portfolio during the reporting period?
At the beginning of the reporting period, the fixed-income portion of the Portfolio was positioned with a slightly longer duration than the Barclays U.S. Aggregate Bond Index. In May and June, however, we sharply reduced duration as we became concerned about rising interest rates. This strategy proved beneficial as rates did rise. We increased duration in the third quarter on the expectation that the Federal Reserve would not taper quantitative easing in
| 2. | Duration is a measure of the price sensitivity of a fixed-income investment to changes in interest rates. Duration is expressed as a number of years and is considered a more accurate sensitivity gauge than average maturity. |
| | |
| M-274 | | MainStay VP Janus Balanced Portfolio |
September, which proved to be correct. This allowed the fixed-income portion of the Portfolio to reap the benefit of a subsequent drop in long-term U.S. Treasury yields. We increased duration in the fourth quarter before the Federal Reserve announced that it would begin to taper its open market bond purchases (known as quantitative easing) in early 2014. Following the announcement, we reduced duration to reflect our view that longer-term interest rates would continue to move higher in early 2014.
What specific factors, risks, or market forces prompted significant decisions for the fixed-income portion of the Portfolio during the reporting period?
Longer-term U.S. Treasury yields jumped in May and June as improving U.S. economic data led to speculation that the Federal Reserve might soon taper its quantitative easing program. Through this program, the Federal Open Market Committee (“FOMC”) has been buying $85 billion per month in U.S. Treasury bonds and mortgage-backed securities. Concerned about the possibility of rising interest rates, we reduced both the weighting to and the duration of corporate credit at midyear. We also reduced U.S. Treasury duration in the fixed-income portion of the Portfolio.
Fears about tapering eased somewhat in the second half of the year, and we increased duration before the September FOMC meeting. We correctly anticipated that the FOMC would not taper quantitative easing in September, and the fixed-income portion of the Portfolio benefited from the subsequent drop in longer-term U.S. Treasury yields. In December, the Federal Open Market Committee announced that quantitative easing would begin to be tapered in early 2014, and we reduced duration to reflect our view that longer-term interest rates would continue to move higher in early 2014.
During the reporting period, which market segments made the strongest positive contributions to the Portfolio’s performance and which market segments were particularly weak?
Among corporate credits, top contributors included wireline communications, banking and non-captive diversified financial companies. Sectors that detracted from performance included consumer cyclical services, property and casualty insurers and integrated energy companies.
Did the fixed-income portion of the Portfolio make any significant purchases or sales during the reporting period?
We purchased new-issue bonds of telecommunications company Verizon, which agreed to buy back a 45% stake in Verizon Wireless from Vodafone for $130 billion during the reporting period. To help fund the transaction, in September 2013 Verizon issued $49 billion in bonds, by far the largest bond issuance in corporate history. Given the significant supply, we viewed the bonds’ valuation as very attractive. Credit spreads tightened rapidly after the bonds were issued, from sheer demand and also from the commitment of Verizon management to delever over the next few years.
We bought bonds of automotive company General Motors during the reporting period. We believe that GM will outperform Ford fundamentally in 2014 because of the best “new” product lineup in GM’s recent history. In 2013, GM benefited from relatively strong year-over-year U.S. sales, including higher truck sales that resulted from a recovery in the housing industry and improvements in Europe.
The fixed-income portion of the Portfolio sold bonds of Actavis, a generic drug manufacturer. The bonds resulted from the acquisition of Actavis by Watson Pharmaceuticals last year. We believe that the combination will allow the company to expand its footprint to global markets, and we expect Actavis to deliver on its pledge of rapid balance sheet deleveraging. While we continue to believe in the fundamentals of Actavis, we eliminated the position in the 2017 debt to decrease duration in the fixed-income portion of the Portfolio.
The fixed-income portion of the Portfolio sold bonds of AbbVie, a research-based pharmaceuticals company that spun off from Abbott Laboratories. We believe that AbbVie has a solid growth outlook, with minimal near-term patent-cliff exposure and a high-quality product pipeline. The company’s core drug, Humira, used to treat autoimmune diseases including rheumatoid arthritis, is the top-selling drug in the world. Sales continue to grow as a result of pricing increases and expanded therapeutic uses. Humira has patent protection through 2016, and its biologic nature should provide protection from generic competition beyond the life of the patent. In addition, we believe that AbbVie will be the first to market with an all-oral regimen for the treatment of Hepatitis C, which should drive meaningful growth around 2015. While we continue to believe in the fundamentals of AbbVie, we
| | | | |
| mainstayinvestments.com | | | M-275 | |
eliminated the Portfolio’s position in the 2017 debt to decrease duration in the fixed-income portion of the Portfolio.
During the reporting period, how did industry weightings change in the fixed-income portion of the Portfolio?
During the reporting period, we increased the weighting of the fixed-income portion of the Portfolio in capital goods and communications. Over the same period, we decreased our weighting in basic industrials and consumer noncyclicals.
How was the fixed-income portion of the Portfolio positioned at the end of the reporting period?
As of December 31, 2013, the fixed-income portion of the Portfolio was significantly overweight in corporate credit compared with its benchmark, the Barclays U.S. Aggregate Bond Index. As of the same date, the fixed-income portion of the Portfolio was underweight relative to the Index in mortgage-backed securities and U.S. Treasury securities.
The opinions expressed are those of the portfolio managers as of the date of this report and are subject to change. There is no guarantee that any forecasts made will come to pass. This material does not constitute investment advice and is not intended as an endorsement of any specific investment.
Not all MainStay VP Portfolios and/or share classes are available under all policies.
| | |
| M-276 | | MainStay VP Janus Balanced Portfolio |
Portfolio of Investments December 31, 2013
| | | | | | | | |
| | | Principal
Amount | | | Value | |
Long-Term Bonds 41.8%† Asset-Backed Securities 0.3% | |
Automobile 0.2% | |
AmeriCredit Automobile Receivables Trust
Series 2012-4, Class D
2.68%, due 10/9/18 (a) | | $ | 984,000 | | | $ | 992,404 | |
Series 2013-4, Class D
3.31%, due 10/8/19 (a) | | | 317,000 | | | | 321,446 | |
Series 2012-2, Class D
3.38%, due 4/9/18 (a) | | | 602,000 | | | | 623,529 | |
Santander Drive Auto Receivables Trust
Series 2012-6, Class D
2.52%, due 9/17/18 (a) | | | 375,000 | | | | 376,139 | |
Series 2012-5, Class D
3.30%, due 9/17/18 (a) | | | 395,000 | | | | 406,669 | |
| | | | | | | | |
| | | | | | | 2,720,187 | |
| | | | | | | | |
Other ABS 0.1% | |
Beacon Container Finance LLC
Series 2012-1A, Class A
3.72%, due 9/20/27 (b) | | | 627,522 | | | | 628,569 | |
| | | | | | | | |
Total Asset-Backed Securities
(Cost $3,305,978) | | | | | | | 3,348,756 | |
| | | | | | | | |
|
| Corporate Bonds 19.9% | |
Aerospace & Defense 0.2% | |
Exelis, Inc.
4.25%, due 10/1/16 | | | 868,000 | | | | 916,671 | |
5.55%, due 10/1/21 | | | 393,000 | | | | 395,277 | |
TransDigm, Inc.
7.75%, due 12/15/18 | | | 249,000 | | | | 267,053 | |
| | | | | | | | |
| | | | | | | 1,579,001 | |
| | | | | | | | |
Airlines 0.1% | |
Southwest Airlines Co.
5.125%, due 3/1/17 | | | 776,000 | | | | 842,790 | |
| | | | | | | | |
|
Auto Manufacturers 0.9% | |
General Motors Co.
3.50%, due 10/2/18 (b) | | | 1,669,000 | | | | 1,706,553 | |
4.875%, due 10/2/23 (b) | | | 5,497,000 | | | | 5,565,712 | |
6.25%, due 10/2/43 (b) | | | 1,317,000 | | | | 1,368,034 | |
Jaguar Land Rover Automotive PLC
5.625%, due 2/1/23 (b) | | | 514,000 | | | | 514,000 | |
| | | | | | | | |
| | | | | | | 9,154,299 | |
| | | | | | | | |
Auto Parts & Equipment 0.0%‡ | |
Continental Rubber of America Corp.
4.50%, due 9/15/19 (b) | | | 261,000 | | | | 276,608 | |
| | | | | | | | |
| | | | | | | | |
| | | Principal
Amount | | | Value | |
Banks 2.9% | |
Bank of America Corp.
3.625%, due 3/17/16 | | $ | 1,010,000 | | | $ | 1,062,587 | |
3.75%, due 7/12/16 | | | 1,245,000 | | | | 1,323,581 | |
8.00%, due 7/29/49 (c) | | | 1,097,000 | | | | 1,215,476 | |
CIT Group, Inc.
4.25%, due 8/15/17 | | | 2,529,000 | | | | 2,633,321 | |
5.00%, due 8/1/23 | | | 2,051,000 | | | | 1,974,087 | |
5.50%, due 2/15/19 (b) | | | 1,653,000 | | | | 1,772,842 | |
6.625%, due 4/1/18 (b) | | | 354,000 | | | | 397,808 | |
Citigroup, Inc.
5.00%, due 9/15/14 | | | 2,328,000 | | | | 2,394,313 | |
5.35%, due 4/29/49 (c) | | | 146,000 | | | | 128,188 | |
5.90%, due 12/29/49 (c) | | | 1,237,000 | | | | 1,156,595 | |
Goldman Sachs Group, Inc. (The)
2.375%, due 1/22/18 | | | 1,495,000 | | | | 1,500,683 | |
5.625%, due 1/15/17 | | | 443,000 | | | | 488,159 | |
HSBC Bank USA N.A.
4.875%, due 8/24/20 | | | 750,000 | | | | 809,423 | |
Morgan Stanley
3.45%, due 11/2/15 | | | 1,074,000 | | | | 1,117,933 | |
4.00%, due 7/24/15 | | | 400,000 | | | | 417,657 | |
4.10%, due 5/22/23 | | | 2,072,000 | | | | 2,005,180 | |
4.75%, due 3/22/17 | | | 405,000 | | | | 441,984 | |
5.00%, due 11/24/25 | | | 2,352,000 | | | | 2,359,032 | |
Royal Bank of Scotland Group PLC
2.55%, due 9/18/15 | | | 284,000 | | | | 290,463 | |
6.00%, due 12/19/23 | | | 789,000 | | | | 794,618 | |
Santander UK PLC
5.00%, due 11/7/23 (b) | | | 1,003,000 | | | | 1,006,731 | |
SVB Financial Group
5.375%, due 9/15/20 | | | 1,100,000 | | | | 1,211,422 | |
Zions BanCorp.
4.50%, due 3/27/17 | | | 704,000 | | | | 745,413 | |
5.80%, due 12/29/49 (c) | | | 1,707,000 | | | | 1,553,370 | |
| | | | | | | | |
| | | | | | | 28,800,866 | |
| | | | | | | | |
Beverages 0.1% | |
Constellation Brands, Inc.
3.75%, due 5/1/21 | | | 166,000 | | | | 156,040 | |
SABMiller Holdings, Inc.
2.20%, due 8/1/18 (b) | | | 1,209,000 | | | | 1,207,102 | |
| | | | | | | | |
| | | | | | | 1,363,142 | |
| | | | | | | | |
Biotechnology 0.2% | |
Life Technologies Corp.
5.00%, due 1/15/21 | | | 281,000 | | | | 304,237 | |
6.00%, due 3/1/20 | | | 1,379,000 | | | | 1,584,500 | |
| | | | | | | | |
| | | | | | | 1,888,737 | |
| | | | | | | | |
| † | Percentages indicated are based on Portfolio net assets. |
| ¨ | | Among the Portfolio’s 10 largest holdings or issuers held as of December 31, 2013, excluding short-term investments. May be subject to change daily. |
| | | | | | |
The notes to the financial statements are an integral part of,
and should be read in conjunction with, the financial statements. | | mainstayinvestments.com | | | M-277 | |
Portfolio of Investments December 31, 2013 (continued)
| | | | | | | | |
| | | Principal
Amount | | | Value | |
| Corporate Bonds (continued) | |
Building Materials 0.1% | |
Hanson Ltd.
6.125%, due 8/15/16 | | $ | 1,003,000 | | | $ | 1,100,792 | |
| | | | | | | | |
|
Chemicals 0.5% | |
Ashland, Inc.
4.75%, due 8/15/22 | | | 647,000 | | | | 614,650 | |
6.875%, due 5/15/43 | | | 871,000 | | | | 823,095 | |
LyondellBasell Industries N.V.
5.00%, due 4/15/19 | | | 2,402,000 | | | | 2,667,712 | |
Sherwin-Williams Co. (The)
3.125%, due 12/15/14 | | | 928,000 | | | | 950,306 | |
| | | | | | | | |
| | | | | | | 5,055,763 | |
| | | | | | | | |
Commercial Services 0.7% | |
ADT Corp. (The)
4.125%, due 6/15/23 | | | 1,282,000 | | | | 1,137,790 | |
Verisk Analytics, Inc.
4.125%, due 9/12/22 | | | 1,171,000 | | | | 1,133,431 | |
4.875%, due 1/15/19 | | | 696,000 | | | | 736,968 | |
5.80%, due 5/1/21 | | | 3,354,000 | | | | 3,622,122 | |
| | | | | | | | |
| | | | | | | 6,630,311 | |
| | | | | | | | |
Diversified Financial Services 0.4% | |
Carlyle Holdings Finance LLC
3.875%, due 2/1/23 (b) | | | 688,000 | | | | 655,939 | |
General Electric Capital Corp.
6.25%, due 12/29/49 (c) | | | 1,500,000 | | | | 1,548,750 | |
6.375%, due 11/15/67 (c) | | | 108,000 | | | | 117,180 | |
7.125%, due 12/29/49 (c) | | | 1,400,000 | | | | 1,564,500 | |
| | | | | | | | |
| | | | | | | 3,886,369 | |
| | | | | | | | |
Electric 0.2% | |
AES Corp. (The)
7.75%, due 10/15/15 | | | 129,000 | | | | 142,545 | |
CMS Energy Corp.
4.25%, due 9/30/15 | | | 1,076,000 | | | | 1,133,648 | |
PPL WEM Holdings PLC
3.90%, due 5/1/16 (b) | | | 735,000 | | | | 768,082 | |
5.375%, due 5/1/21 (b) | | | 436,000 | | | | 463,595 | |
| | | | | | | | |
| | | | | | | 2,507,870 | |
| | | | | | | | |
Electronics 0.4% | |
Amphenol Corp.
4.75%, due 11/15/14 | | | 1,672,000 | | | | 1,727,669 | |
FLIR Systems, Inc.
3.75%, due 9/1/16 | | | 1,109,000 | | | | 1,156,550 | |
Thermo Fisher Scientific, Inc.
2.40%, due 2/1/19 | | | 276,000 | | | | 273,431 | |
3.15%, due 1/15/23 | | | 234,000 | | | | 217,763 | |
3.60%, due 8/15/21 | | | 219,000 | | | | 217,038 | |
| | | | | | | | |
| | | Principal
Amount | | | Value | |
Electronics (continued) | |
Thermo Fisher Scientific, Inc. (continued) | | | | | | | | |
4.15%, due 2/1/24 | | $ | 588,000 | | | $ | 582,413 | |
5.30%, due 2/1/44 | | | 167,000 | | | | 168,866 | |
| | | | | | | | |
| | | | | | | 4,343,730 | |
| | | | | | | | |
Engineering & Construction 0.2% | |
URS Corp.
4.35%, due 4/1/17 (b) | | | 861,000 | | | | 877,122 | |
5.50%, due 4/1/22 (b) | | | 822,000 | | | | 809,632 | |
| | | | | | | | |
| | | | | | | 1,686,754 | |
| | | | | | | | |
Finance—Auto Loans 0.8% | |
Ford Motor Credit Co. LLC
3.00%, due 6/12/17 | | | 594,000 | | | | 617,355 | |
4.25%, due 2/3/17 | | | 350,000 | | | | 376,519 | |
4.25%, due 9/20/22 | | | 1,309,000 | | | | 1,315,016 | |
5.00%, due 5/15/18 | | | 1,000,000 | | | | 1,113,909 | |
5.875%, due 8/2/21 | | | 1,975,000 | | | | 2,239,075 | |
6.625%, due 8/15/17 | | | 800,000 | | | | 926,746 | |
General Motors Financial Co., Inc.
3.25%, due 5/15/18 (b) | | | 493,000 | | | | 493,000 | |
4.25%, due 5/15/23 (b) | | | 690,000 | | | | 656,363 | |
| | | | | | | | |
| | | | | | | 7,737,983 | |
| | | | | | | | |
Finance—Credit Card 0.1% | |
American Express Co.
6.80%, due 9/1/66 (c) | | | 1,192,000 | | | | 1,270,076 | |
| | | | | | | | |
|
Finance—Investment Banker/Broker 0.9% | |
Charles Schwab Corp. (The)
7.00%, due 2/28/49 (c) | | | 988,000 | | | | 1,094,704 | |
Lazard Group LLC
4.25%, due 11/14/20 | | | 1,290,000 | | | | 1,287,201 | |
6.85%, due 6/15/17 | | | 292,000 | | | | 329,231 | |
Raymond James Financial, Inc.
4.25%, due 4/15/16 | | | 1,440,000 | | | | 1,523,277 | |
5.625%, due 4/1/24 | | | 2,911,000 | | | | 3,053,854 | |
TD Ameritrade Holding Corp.
4.15%, due 12/1/14 | | | 900,000 | | | | 929,214 | |
5.60%, due 12/1/19 | | | 512,000 | | | | 591,011 | |
| | | | | | | | |
| | | | | | | 8,808,492 | |
| | | | | | | | |
Finance—Leasing Companies 0.2% | |
LeasePlan Corp. N.V.
2.50%, due 5/16/18 (b) | | | 2,385,000 | | | | 2,318,697 | |
| | | | | | | | |
|
Finance—Mortgage Loan/Banker 0.1% | |
Northern Rock Asset Management PLC
5.625%, due 6/22/17 (b) | | | 1,200,000 | | | | 1,352,388 | |
| | | | | | | | |
|
Food 1.0% | |
Safeway, Inc.
3.95%, due 8/15/20 | | | 275,000 | | | | 274,899 | |
4.75%, due 12/1/21 | | | 1,277,000 | | | | 1,282,320 | |
| | | | |
| M-278 | | MainStay VP Janus Balanced Portfolio | | The notes to the financial statements are an integral part of,
and should be read in conjunction with, the financial statements. |
| | | | | | | | |
| | | Principal
Amount | | | Value | |
| Corporate Bonds (continued) | |
Food (continued) | |
Sun Merger Sub, Inc.
5.25%, due 8/1/18 (b) | | $ | 299,000 | | | $ | 313,203 | |
Tyson Foods, Inc.
6.60%, due 4/1/16 | | | 3,530,000 | | | | 3,940,387 | |
WM Wrigley Jr Co.
2.40%, due 10/21/18 (b) | | | 1,930,000 | | | | 1,918,163 | |
3.375%, due 10/21/20 (b) | | | 1,929,000 | | | | 1,906,849 | |
| | | | | | | | |
| | | | | | | 9,635,821 | |
| | | | | | | | |
Health Care—Services 0.2% | |
Fresenius Medical Care U.S. Finance II, Inc.
5.875%, due 1/31/22 (b) | | | 543,000 | | | | 572,865 | |
Tenet Healthcare Corp.
8.125%, due 4/1/22 | | | 900,000 | | | | 969,750 | |
| | | | | | | | |
| | | | | | | 1,542,615 | |
| | | | | | | | |
Home Builders 0.2% | |
DR Horton, Inc.
4.75%, due 5/15/17 | | | 449,000 | | | | 474,817 | |
MDC Holdings, Inc.
5.375%, due 12/15/14 | | | 559,000 | | | | 580,347 | |
Toll Brothers Finance Corp.
4.00%, due 12/31/18 | | | 367,000 | | | | 373,423 | |
4.375%, due 4/15/23 | | | 188,000 | | | | 174,370 | |
5.875%, due 2/15/22 | | | 306,000 | | | | 316,710 | |
| | | | | | | | |
| | | | | | | 1,919,667 | |
| | | | | | | | |
Insurance 0.7% | |
American International Group, Inc.
4.25%, due 9/15/14 | | | 1,360,000 | | | | 1,393,993 | |
5.60%, due 10/18/16 | | | 345,000 | | | | 384,381 | |
6.25%, due 3/15/87 | | | 545,000 | | | | 545,000 | |
8.175%, due 5/15/68 (c) | | | 1,618,000 | | | | 1,957,780 | |
ING U.S., Inc.
5.65%, due 5/15/53 (c) | | | 714,000 | | | | 694,365 | |
Primerica, Inc.
4.75%, due 7/15/22 | | | 2,018,000 | | | | 2,078,518 | |
| | | | | | | | |
| | | | | | | 7,054,037 | |
| | | | | | | | |
Investment Management/Advisory Services 0.4% | |
Ameriprise Financial, Inc.
7.518%, due 6/1/66 (c) | | | 1,538,000 | | | | 1,703,335 | |
Neuberger Berman Group LLC / Neuberger Berman Finance Corp.
5.625%, due 3/15/20 (b) | | | 1,397,000 | | | | 1,466,850 | |
5.875%, due 3/15/22 (b) | | | 920,000 | | | | 947,600 | |
| | | | | | | | |
| | | | | | | 4,117,785 | |
| | | | | | | | |
Iron & Steel 0.1% | |
ArcelorMittal
5.00%, due 2/25/17 | | | 603,000 | | | | 646,718 | |
| | | | | | | | |
| | | Principal
Amount | | | Value | |
Iron & Steel (continued) | |
Reliance Steel & Aluminum Co.
4.50%, due 4/15/23 | | $ | 451,000 | | | $ | 442,394 | |
| | | | | | | | |
| | | | | | | 1,089,112 | |
| | | | | | | | |
Lodging 0.1% | |
MGM Resorts International
7.50%, due 6/1/16 | | | 800,000 | | | | 896,000 | |
Wynn Las Vegas LLC / Wynn Las Vegas Capital Corp.
4.25%, due 5/30/23 (b) | | | 588,000 | | | | 551,250 | |
| | | | | | | | |
| | | | | | | 1,447,250 | |
| | | | | | | | |
Machinery—Diversified 0.1% | |
CNH Capital LLC
3.625%, due 4/15/18 | | | 682,000 | | | | 691,377 | |
| | | | | | | | |
|
Media 0.1% | |
Gannett Co., Inc.
6.375%, due 9/1/15 | | | 116,000 | | | | 124,410 | |
UBM PLC
5.75%, due 11/3/20 (b) | | | 1,157,000 | | | | 1,202,835 | |
| | | | | | | | |
| | | | | | | 1,327,245 | |
| | | | | | | | |
Mining 0.1% | |
FMG Resources (August 2006) Pty, Ltd.
7.00%, due 11/1/15 (b) | | | 431,000 | | | | 447,163 | |
8.25%, due 11/1/19 (b) | | | 883,000 | | | | 991,167 | |
| | | | | | | | |
| | | | | | | 1,438,330 | |
| | | | | | | | |
Miscellaneous—Manufacturing 0.2% | |
GE Capital Trust I
6.375%, due 11/15/67 (c) | | | 478,000 | | | | 516,240 | |
Ingersoll-Rand Global Holding Co., Ltd.
4.25%, due 6/15/23 (b) | | | 1,022,000 | | | | 998,199 | |
| | | | | | | | |
| | | | | | | 1,514,439 | |
| | | | | | | | |
Oil & Gas 1.8% | |
Chesapeake Energy Corp.
5.375%, due 6/15/21 | | | 3,206,000 | | | | 3,318,210 | |
5.75%, due 3/15/23 | | | 1,833,000 | | | | 1,887,990 | |
Cimarex Energy Co.
5.875%, due 5/1/22 | | | 803,000 | | | | 849,173 | |
Continental Resources, Inc.
5.00%, due 9/15/22 | | | 2,137,000 | | | | 2,219,809 | |
Devon Energy Corp.
2.25%, due 12/15/18 | | | 935,000 | | | | 925,204 | |
Motiva Enterprises LLC
5.75%, due 1/15/20 (b) | | | 804,000 | | | | 913,036 | |
Nabors Industries, Inc.
4.625%, due 9/15/21 | | | 126,000 | | | | 126,148 | |
5.00%, due 9/15/20 | | | 1,990,000 | | | | 2,070,718 | |
PetroHawk Energy Corp.
6.25%, due 6/1/19 | | | 846,000 | | | | 932,292 | |
7.25%, due 8/15/18 | | | 152,000 | | | | 163,856 | |
| | | | | | |
The notes to the financial statements are an integral part of,
and should be read in conjunction with, the financial statements. | | mainstayinvestments.com | | | M-279 | |
Portfolio of Investments December 31, 2013 (continued)
| | | | | | | | |
| | | Principal
Amount | | | Value | |
| Corporate Bonds (continued) | |
Oil & Gas (continued) | |
Plains Exploration & Production Co.
6.625%, due 5/1/21 | | $ | 183,000 | | | $ | 200,668 | |
6.75%, due 2/1/22 | | | 472,000 | | | | 519,919 | |
6.875%, due 2/15/23 | | | 2,368,000 | | | | 2,640,320 | |
Whiting Petroleum Corp.
5.00%, due 3/15/19 | | | 1,322,000 | | | | 1,351,745 | |
| | | | | | | | |
| | | | | | | 18,119,088 | |
| | | | | | | | |
Pharmaceuticals 0.3% | |
Perrigo Co. PLC
2.30%, due 11/8/18 (b) | | | 260,000 | | | | 256,627 | |
4.00%, due 11/15/23 (b) | | | 715,000 | | | | 701,483 | |
Valeant Pharmaceuticals International, Inc.
6.75%, due 8/15/18 (b) | | | 1,586,000 | | | | 1,742,618 | |
| | | | | | | | |
| | | | | | | 2,700,728 | |
| | | | | | | | |
Pipelines 1.4% | |
DCP Midstream Operating, L.P.
3.25%, due 10/1/15 | | | 724,000 | | | | 747,961 | |
4.95%, due 4/1/22 | | | 1,642,000 | | | | 1,666,783 | |
El Paso LLC
6.50%, due 9/15/20 | | | 58,000 | | | | 62,195 | |
El Paso Pipeline Partners Operating Co. LLC
5.00%, due 10/1/21 | | | 566,000 | | | | 592,779 | |
6.50%, due 4/1/20 | | | 196,000 | | | | 225,090 | |
Energy Transfer Partners, L.P.
4.15%, due 10/1/20 | | | 592,000 | | | | 600,632 | |
Enterprise Products Operating LLC
3.35%, due 3/15/23 | | | 2,013,000 | | | | 1,912,173 | |
Kinder Morgan Finance Co. ULC
5.70%, due 1/5/16 | | | 1,591,000 | | | | 1,708,944 | |
Kinder Morgan, Inc.
5.00%, due 2/15/21 (b) | | | 428,000 | | | | 421,574 | |
5.625%, due 11/15/23 (b) | | | 761,000 | | | | 736,828 | |
Plains All American Pipeline, L.P. / PAA Finance Corp.
3.95%, due 9/15/15 | | | 1,200,000 | | | | 1,261,935 | |
Spectra Energy Partners, L.P.
2.95%, due 9/25/18 | | | 222,000 | | | | 225,025 | |
4.75%, due 3/15/24 | | | 1,152,000 | | | | 1,174,352 | |
Western Gas Partners, L.P.
5.375%, due 6/1/21 | | | 2,151,000 | | | | 2,304,364 | |
Williams Cos., Inc. (The)
3.70%, due 1/15/23 | | | 790,000 | | | | 689,518 | |
| | | | | | | | |
| | | | | | | 14,330,153 | |
| | | | | | | | |
Real Estate 0.2% | |
CBRE Services, Inc.
6.625%, due 10/15/20 | | | 388,000 | | | | 415,160 | |
Jones Lang Lasalle, Inc.
4.40%, due 11/15/22 | | | 1,346,000 | | | | 1,292,778 | |
| | | | | | | | |
| | | Principal
Amount | | | Value | |
Real Estate (continued) | |
Post Apartment Homes, L.P.
4.75%, due 10/15/17 | | $ | 704,000 | | | $ | 761,185 | |
| | | | | | | | |
| | | | | | | 2,469,123 | |
| | | | | | | | |
Real Estate Investment Trusts 0.7% | |
Alexandria Real Estate Equities, Inc.
4.60%, due 4/1/22 | | | 1,640,000 | | | | 1,650,249 | |
Goodman Funding Pty, Ltd.
6.375%, due 11/12/20 (b) | | | 750,000 | | | | 827,165 | |
Host Hotels & Resorts, L.P.
Series Q
6.75%, due 6/1/16 | | | 234,000 | | | | 237,373 | |
Reckson Operating Partnership, L.P.
6.00%, due 3/31/16 | | | 395,000 | | | | 428,016 | |
Retail Opportunity Investments Partnership, L.P.
5.00%, due 12/15/23 | | | 235,000 | | | | 233,974 | |
Senior Housing Properties Trust
6.75%, due 4/15/20 | | | 346,000 | | | | 384,188 | |
6.75%, due 12/15/21 | | | 381,000 | | | | 420,646 | |
SL Green Realty Corp.
5.00%, due 8/15/18 | | | 840,000 | | | | 895,569 | |
7.75%, due 3/15/20 | | | 1,622,000 | | | | 1,905,652 | |
| | | | | | | | |
| | | | | | | 6,982,832 | |
| | | | | | | | |
Retail 0.6% | |
Brinker International, Inc.
3.875%, due 5/15/23 | | | 1,844,000 | | | | 1,659,997 | |
CVS Caremark Corp.
2.25%, due 12/5/18 | | | 944,000 | | | | 943,724 | |
4.00%, due 12/5/23 | | | 1,180,000 | | | | 1,177,503 | |
Macy’s Retail Holdings, Inc. | | | | | | | | |
5.75%, due 7/15/14 | | | 1,343,000 | | | | 1,378,936 | |
5.90%, due 12/1/16 | | | 555,000 | | | | 622,531 | |
| | | | | | | | |
| | | | | | | 5,782,691 | |
| | | | | | | | |
Semiconductors 0.7% | |
National Semiconductor Corp.
6.60%, due 6/15/17 | | | 1,084,000 | | | | 1,266,824 | |
Samsung Electronics America, Inc.
1.75%, due 4/10/17 (b) | | | 2,987,000 | | | | 2,967,871 | |
TSMC Global, Ltd.
1.625%, due 4/3/18 (b) | | | 3,165,000 | | | | 3,030,918 | |
| | | | | | | | |
| | | | | | | 7,265,613 | |
| | | | | | | | |
Software 0.3% | |
Autodesk, Inc.
1.95%, due 12/15/17 | | | 900,000 | | | | 890,312 | |
3.60%, due 12/15/22 | | | 739,000 | | | | 682,408 | |
Fiserv, Inc.
3.125%, due 10/1/15 | | | 716,000 | | | | 741,306 | |
3.125%, due 6/15/16 | | | 426,000 | | | | 444,534 | |
| | | | | | | | |
| | | | | | | 2,758,560 | |
| | | | | | | | |
| | | | |
| M-280 | | MainStay VP Janus Balanced Portfolio | | The notes to the financial statements are an integral part of,
and should be read in conjunction with, the financial statements. |
| | | | | | | | |
| | | Principal
Amount | | | Value | |
| Corporate Bonds (continued) | |
Telecommunications 1.2% | |
SBA Tower Trust
2.933%, due 12/15/42 (b) | | $ | 647,000 | | | $ | 658,520 | |
Sprint Capital Corp.
6.90%, due 5/1/19 | | | 445,000 | | | | 486,163 | |
Sprint Communications, Inc.
7.00%, due 8/15/20 | | | 1,035,000 | | | | 1,120,388 | |
Sprint Corp.
7.25%, due 9/15/21 (b) | | | 913,000 | | | | 980,334 | |
Verizon Communications, Inc.
3.65%, due 9/14/18 | | | 1,461,000 | | | | 1,546,562 | |
5.15%, due 9/15/23 | | | 3,997,000 | | | | 4,291,547 | |
6.40%, due 9/15/33 | | | 1,887,000 | | | | 2,170,278 | |
6.55%, due 9/15/43 | | | 944,000 | | | | 1,104,441 | |
| | | | | | | | |
| | | | | | | 12,358,233 | |
| | | | | | | | |
Textiles 0.1% | |
Cintas Corp. No 2
2.85%, due 6/1/16 | | | 497,000 | | | | 512,653 | |
4.30%, due 6/1/21 | | | 520,000 | | | | 539,850 | |
| | | | | | | | |
| | | | | | | 1,052,503 | |
| | | | | | | | |
Transportation 0.2% | |
Asciano Finance, Ltd.
3.125%, due 9/23/15 (b) | | | 196,000 | | | | 200,435 | |
CSX Transportation, Inc.
8.375%, due 10/15/14 | | | 476,692 | | | | 503,137 | |
JB Hunt Transport Services, Inc.
3.375%, due 9/15/15 | | | 1,090,000 | | | | 1,129,130 | |
| | | | | | | | |
| | | | | | | 1,832,702 | |
| | | | | | | | |
Trucking & Leasing 0.2% | |
Penske Truck Leasing Co., L.P. / PTL Finance Corp.
3.375%, due 3/15/18 (b) | | | 1,251,000 | | | | 1,282,474 | |
4.25%, due 1/17/23 (b) | | | 665,000 | | | | 647,657 | |
4.875%, due 7/11/22 (b) | | | 120,000 | | | | 123,106 | |
| | | | | | | | |
| | | | | | | 2,053,237 | |
| | | | | | | | |
Total Corporate Bonds
(Cost $197,234,327) | | | | | | | 200,087,809 | |
| | | | | | | | |
|
| Loan Assignments 0.2% (d) | |
Healthcare, Education & Childcare 0.1% | |
Quintiles Transnational Corp.
New Term Loan B
3.75%, due 6/8/18 | | | 628,316 | | | | 627,793 | |
| | | | | | | | |
| | | | | | | | |
| | | Principal
Amount | | | Value | |
Lodging 0.1% | |
MGM Resorts International
Term Loan B
3.50%, due 12/20/19 | | $ | 1,267,200 | | | $ | 1,266,144 | |
| | | | | | | | |
Total Loan Assignments
(Cost $1,890,070) | | | | | | | 1,893,937 | |
| | | | | | | | |
|
| Mortgage-Backed Securities 0.8% | |
Agency Collateral (Collateralized Mortgage Obligation) 0.1% | |
FREMF Mortgage Trust
Series 2010-KSCT, Class B
2.00%, due 1/25/20 (b)(e) | | | 1,169,701 | | | | 995,416 | |
| | | | | | | | |
|
Commercial Mortgage Loans (Collateralized Mortgage Obligations) 0.5% | |
Commercial Mortgage Pass Through Certificates
Series 2013-FL3, Class C
3.367%, due 10/13/28 (b)(c) | | | 434,000 | | | | 434,857 | |
Series 2013-WWP, Class A2
3.424%, due 3/10/31 (b) | | | 299,000 | | | | 284,297 | |
GS Mortgage Securities Trust
Series 2013-KYO, Class D
2.768%, due 11/8/29 (b)(c) | | | 726,000 | | | | 721,521 | |
Series 2012-ALOH, Class A
3.551%, due 4/10/34 (b) | | | 398,000 | | | | 391,319 | |
Series 2013-NYC5 E
3.649%, due 1/10/30 (b) | | | 383,000 | | | | 376,847 | |
Hilton USA Trust
Series 2013-HLT, Class DFX
4.407%, due 11/5/30 (b) | | | 683,000 | | | | 683,557 | |
JP Morgan Chase Commercial Mortgage Securities Trust
Series 2013-JWRZ, Class D
3.157%, due 4/15/30 (b)(c) | | | 648,000 | | | | 645,150 | |
Series 2012-FL2, Class C
3.917%, due 8/15/29 (b)(c) | | | 480,398 | | | | 485,438 | |
Wachovia Bank Commercial Mortgage Trust
Series 2007-C30, Class AM
5.383%, due 12/15/43 | | | 1,540,000 | | | �� | 1,657,029 | |
| | | | | | | | |
| | | | | | | 5,680,015 | |
| | | | | | | | |
Whole Loan Collateral (Collateralized Mortgage Obligations) 0.2% | |
American Tower Trust I
Series-2013, Class 1A
1.551%, due 3/15/43 (b) | | | 1,149,000 | | | | 1,121,401 | |
Series-2013, Class 2A
3.07%, due 3/15/48 (b) | | | 969,000 | | | | 906,555 | |
| | | | | | | | |
| | | | | | | 2,027,956 | |
| | | | | | | | |
Total Mortgage-Backed Securities
(Cost $8,873,676) | | | | | | | 8,703,387 | |
| | | | | | | | |
| | | | | | |
The notes to the financial statements are an integral part of,
and should be read in conjunction with, the financial statements. | | mainstayinvestments.com | | | M-281 | |
Portfolio of Investments December 31, 2013 (continued)
| | | | | | | | |
| | | Principal
Amount | | | Value | |
| U.S. Government & Federal Agencies 20.4% | |
Federal Home Loan Mortgage Corporation
(Mortgage Pass-Through Securities) 1.1% | |
4.50%, due 1/1/41 | | $ | 594,195 | | | $ | 632,471 | |
5.00%, due 1/1/19 | | | 255,422 | | | | 270,423 | |
5.00%, due 2/1/19 | | | 163,443 | | | | 173,086 | |
5.00%, due 6/1/20 | | | 307,161 | | | | 326,028 | |
5.00%, due 1/1/36 | | | 983,943 | | | | 1,078,461 | |
5.00%, due 5/1/39 | | | 807,249 | | | | 875,628 | |
5.00%, due 3/1/41 | | | 1,666,821 | | | | 1,804,111 | |
5.00%, due 5/1/41 | | | 1,331,415 | | | | 1,455,539 | |
5.00%, due 9/1/41 | | | 357,462 | | | | 386,959 | |
5.50%, due 8/1/19 | | | 221,411 | | | | 236,200 | |
5.50%, due 12/1/28 | | | 680,865 | | | | 753,469 | |
5.50%, due 10/1/36 | | | 507,597 | | | | 566,853 | |
6.00%, due 4/1/40 | | | 2,265,033 | | | | 2,548,685 | |
| | | | | | | | |
| | | | | | | 11,107,913 | |
| | | | | | | | |
¨ Federal National Mortgage Association
(Mortgage Pass-Through Securities) 3.1% | |
4.50%, due 10/1/40 | | | 232,318 | | | | 247,402 | |
4.50%, due 4/1/41 | | | 302,006 | | | | 321,749 | |
4.50%, due 5/1/41 | | | 568,943 | | | | 606,338 | |
4.50%, due 9/1/42 | | | 4,163,692 | | | | 4,410,674 | |
4.50%, due 11/1/42 | | | 1,087,352 | | | | 1,154,965 | |
4.50%, due 2/1/43 | | | 6,517,479 | | | | 6,936,552 | |
5.00%, due 9/1/29 | | | 661,172 | | | | 720,834 | |
5.00%, due 1/1/30 | | | 279,905 | | | | 307,076 | |
5.00%, due 11/1/33 | | | 124,617 | | | | 135,758 | |
5.00%, due 12/1/33 | | | 244,830 | | | | 266,818 | |
5.00%, due 6/1/40 | | | 1,422,619 | | | | 1,549,666 | |
5.00%, due 2/1/41 | | | 1,891,365 | | | | 2,067,651 | |
5.00%, due 3/1/41 | | | 238,462 | | | | 260,856 | |
5.00%, due 4/1/41 | | | 482,209 | | | | 526,530 | |
5.00%, due 5/1/41 | | | 1,416,177 | | | | 1,550,126 | |
5.00%, due 6/1/41 | | | 555,706 | | | | 606,051 | |
5.00%, due 7/1/41 | | | 1,167,352 | | | | 1,276,512 | |
5.00%, due 9/1/41 | | | 14,570 | | | | 15,910 | |
5.00%, due 2/1/42 | | | 2,958,695 | | | | 3,323,992 | |
5.50%, due 1/1/25 | | | 261,749 | | | | 285,984 | |
5.50%, due 7/1/25 | | | 493,699 | | | | 541,226 | |
5.50%, due 1/1/33 | | | 160,575 | | | | 177,939 | |
6.00%, due 10/1/35 | | | 821,206 | | | | 920,893 | |
6.00%, due 12/1/35 | | | 804,251 | | | | 902,022 | |
6.00%, due 2/1/37 | | | 134,743 | | | | 151,687 | |
6.00%, due 9/1/37 | | | 831,255 | | | | 897,120 | |
6.00%, due 10/1/38 | | | 675,885 | | | | 773,974 | |
7.00%, due 2/1/39 | | | 284,401 | | | | 304,419 | |
| | | | | | | | |
| | | | | | | 31,240,724 | |
| | | | | | | | |
| | | | | | | | |
| | | Principal
Amount | | | Value | |
| U.S. Government & Federal Agencies (continued) | |
¨ Government National Mortgage Association
(Mortgage Pass-Through Securities) 2.3% | |
3.50%, due 5/20/42 | | $ | 321,482 | | | $ | 325,637 | |
4.50%, due 7/15/41 | | | 175,816 | | | | 189,572 | |
4.50%, due 8/15/41 | | | 1,516,761 | | | | 1,656,859 | |
4.50%, due 10/20/41 | | | 1,016,570 | | | | 1,089,317 | |
4.90%, due 10/15/34 | | | 735,838 | | | | 803,506 | |
5.00%, due 10/15/39 | | | 409,067 | | | | 453,642 | |
5.00%, due 11/15/39 | | | 666,170 | | | | 735,491 | |
5.00%, due 1/15/40 | | | 224,711 | | | | 248,991 | |
5.00%, due 4/15/40 | | | 180,894 | | | | 200,477 | |
5.00%, due 5/15/40 | | | 263,902 | | | | 288,760 | |
5.00%, due 7/15/40 | | | 963,300 | | | | 1,067,177 | |
5.00%, due 2/15/41 | | | 698,341 | | | | 768,850 | |
5.00%, due 5/15/41 | | | 286,837 | | | | 319,287 | |
5.00%, due 9/15/41 | | | 178,135 | | | | 194,930 | |
5.10%, due 1/15/32 | | | 699,338 | | | | 781,812 | |
5.50%, due 9/15/35 | | | 103,072 | | | | 116,401 | |
5.50%, due 3/15/36 | | | 459,934 | | | | 511,071 | |
5.50%, due 8/15/39 | | | 2,489,425 | | | | 2,851,787 | |
5.50%, due 10/15/39 | | | 681,945 | | | | 774,655 | |
5.50%, due 9/20/41 | | | 90,215 | | | | 99,326 | |
5.50%, due 1/20/42 | | | 576,327 | | | | 635,436 | |
5.50%, due 7/20/42 | | | 1,130,559 | | | | 1,249,375 | |
6.00%, due 11/20/34 | | | 390,958 | | | | 436,886 | |
6.00%, due 1/20/39 | | | 234,036 | | | | 263,631 | |
6.00%, due 10/20/41 | | | 101,436 | | | | 114,279 | |
6.00%, due 12/20/41 | | | 1,028,639 | | | | 1,155,855 | |
6.00%, due 1/20/42 | | | 1,157,778 | | | | 1,302,645 | |
6.00%, due 2/20/42 | | | 1,155,276 | | | | 1,301,128 | |
6.00%, due 3/20/42 | | | 184,005 | | | | 207,029 | |
6.00%, due 4/20/42 | | | 930,623 | | | | 1,047,077 | |
6.00%, due 5/20/42 | | | 378,819 | | | | 426,260 | |
6.00%, due 7/20/42 | | | 249,266 | | | | 280,701 | |
6.00%, due 8/20/42 | | | 264,878 | | | | 298,349 | |
6.00%, due 9/20/42 | | | 574,000 | | | | 645,910 | |
6.00%, due 11/20/42 | | | 256,804 | | | | 288,238 | |
6.00%, due 2/20/43 | | | 321,205 | | | | 361,760 | |
| | | | | | | | |
| | | | | | | 23,492,107 | |
| | | | | | | | |
United States Treasury Bonds 0.4% | |
3.625%, due 8/15/43 | | | 1,882,000 | | | | 1,777,314 | |
3.75%, due 11/15/43 | | | 1,853,000 | | | | 1,791,039 | |
| | | | | | | | |
| | | | | | | 3,568,353 | |
| | | | | | | | |
¨ United States Treasury Notes 13.5% | |
0.125%, due 4/30/15 | �� | | 8,738,000 | | | | 8,727,759 | |
0.25%, due 5/31/15 | | | 3,434,000 | | | | 3,435,611 | |
0.25%, due 7/15/15 | | | 4,078,000 | | | | 4,078,159 | |
0.25%, due 9/30/15 | | | 3,860,000 | | | | 3,856,534 | |
0.25%, due 10/31/15 | | | 14,208,000 | | | | 14,188,024 | |
0.25%, due 11/30/15 | | | 12,725,000 | | | | 12,699,652 | |
| | | | |
| M-282 | | MainStay VP Janus Balanced Portfolio | | The notes to the financial statements are an integral part of,
and should be read in conjunction with, the financial statements. |
| | | | | | | | |
| | | Principal
Amount | | | Value | |
| U.S. Government & Federal Agencies (continued) | |
United States Treasury Notes (continued) | |
0.25%, due 12/31/15 | | $ | 3,024,000 | | | $ | 3,015,968 | |
0.375%, due 6/15/15 | | | 380,000 | | | | 380,801 | |
0.375%, due 8/31/15 | | | 9,235,000 | | | | 9,249,065 | |
0.375%, due 2/15/16 | | | 770,000 | | | | 769,278 | |
0.75%, due 6/30/17 | | | 6,067,000 | | | | 6,003,011 | |
0.75%, due 10/31/17 | | | 570,000 | | | | 559,669 | |
0.75%, due 12/31/17 | | | 670,000 | | | | 655,134 | |
0.75%, due 3/31/18 | | | 1,250,000 | | | | 1,214,452 | |
0.875%, due 1/31/17 | | | 2,824,000 | | | | 2,826,649 | |
0.875%, due 2/28/17 | | | 232,000 | | | | 231,982 | |
0.875%, due 1/31/18 | | | 330,000 | | | | 323,710 | |
1.00%, due 9/30/19 | | | 1,200,000 | | | | 1,132,874 | |
1.25%, due 10/31/18 | | | 13,503,000 | | | | 13,238,220 | |
1.375%, due 7/31/18 | | | 7,755,000 | | | | 7,685,329 | |
1.375%, due 9/30/18 | | | 17,638,000 | | | | 17,423,028 | |
1.50%, due 8/31/18 | | | 18,251,000 | | | | 18,158,321 | |
2.50%, due 8/15/23 | | | 6,219,000 | | | | 5,972,180 | |
| | | | | | | | |
| | | | | | | 135,825,410 | |
| | | | | | | | |
Total U.S. Government & Federal Agencies
(Cost $206,869,363) | | | | 205,234,507 | |
| | | | | | | | |
|
| Yankee Bond 0.2% (f) | |
Banks 0.2% | |
Royal Bank of Scotland Group PLC
6.10%, due 6/10/23 | | | 1,652,000 | | | | 1,665,375 | |
| | | | | | | | |
Total Yankee Bond
(Cost $1,682,691) | | | | | | | 1,665,375 | |
| | | | | | | | |
Total Long-Term Bonds
(Cost $419,856,105) | | | | | | | 420,933,771 | |
| | | | | | | | |
| | |
| | | | | | | | |
| | |
Shares | | | | |
| Common Stocks 56.4% | |
Aerospace & Defense 2.5% | |
¨Boeing Co. (The) | | | 181,568 | | | | 24,782,216 | |
| | | | | | | | |
|
Agriculture 2.4% | |
Altria Group, Inc. | | | 197,795 | | | | 7,593,350 | |
¨Philip Morris International, Inc. | | | 193,865 | | | | 16,891,458 | |
| | | | | | | | |
| | | | | | | 24,484,808 | |
| | | | | | | | |
Apparel 1.5% | |
NIKE, Inc. Class B | | | 189,601 | | | | 14,910,223 | |
| | | | | | | | |
|
Banks 3.5% | |
CIT Group, Inc. | | | 178,604 | | | | 9,310,626 | |
JPMorgan Chase & Co. | | | 150,804 | | | | 8,819,018 | |
¨U.S. Bancorp | | | 426,007 | | | | 17,210,683 | |
| | | | | | | | |
| | | | | | | 35,340,327 | |
| | | | | | | | |
| | | | | | | | |
| | |
Shares | | | Value | |
Beverages 0.5% | |
Diageo PLC | | | 155,268 | | | $ | 5,142,321 | |
| | | | | | | | |
|
Chemicals 4.4% | |
¨E.I. du Pont de Nemours & Co. | | | 317,207 | | | | 20,608,939 | |
¨LyondellBasell Industries, N.V. Class A | | | 230,838 | | | | 18,531,675 | |
Syngenta A.G., ADR | | | 58,923 | | | | 4,710,304 | |
| | | | | | | | |
| | | | | | | 43,850,918 | |
| | | | | | | | |
Commercial Services 1.9% | |
Automatic Data Processing, Inc. | | | 37,712 | | | | 3,047,507 | |
MasterCard, Inc. Class A | | | 19,866 | | | | 16,597,248 | |
| | | | | | | | |
| | | | | | | 19,644,755 | |
| | | | | | | | |
Computers 1.6% | |
Apple, Inc. | | | 28,646 | | | | 16,073,557 | |
| | | | | | | | |
|
Diversified Financial Services 1.8% | |
¨Blackstone Group L.P. (The) | | | 590,918 | | | | 18,613,917 | |
| | | | | | | | |
|
Electronics 2.8% | |
Amphenol Corp. Class A | | | 34,146 | | | | 3,045,140 | |
Honeywell International, Inc. | | | 98,409 | | | | 8,991,631 | |
TE Connectivity, Ltd. | | | 294,439 | | | | 16,226,533 | |
| | | | | | | | |
| | | | | | | 28,263,304 | |
| | | | | | | | |
Entertainment 0.3% | |
Six Flags Entertainment Corp. | | | 75,688 | | | | 2,786,832 | |
| | | | | | | | |
|
Finance—Credit Card 0.4% | |
American Express Co. | | | 45,253 | | | | 4,105,805 | |
| | | | | | | | |
|
Finance—Investment Banker/Broker 0.2% | |
Greenhill & Co., Inc. | | | 30,709 | | | | 1,779,280 | |
| | | | | | | | |
|
Food 1.4% | |
Hershey Co. (The) | | | 93,392 | | | | 9,080,504 | |
Unilever PLC | | | 129,013 | | | | 5,302,522 | |
| | | | | | | | |
| | | | | | | 14,383,026 | |
| | | | | | | | |
Health Care—Services 1.5% | |
Aetna, Inc. | | | 224,343 | | | | 15,387,686 | |
| | | | | | | | |
|
Insurance 0.7% | |
Prudential PLC | | | 313,822 | | | | 6,963,625 | |
| | | | | | | | |
|
Internet 1.6% | |
Google, Inc. Class A (g) | | | 9,266 | | | | 10,384,499 | |
priceline.com, Inc. (g) | | | 4,821 | | | | 5,603,930 | |
| | | | | | | | |
| | | | | | | 15,988,429 | |
| | | | | | | | |
Lodging 1.4% | |
Las Vegas Sands Corp. | | | 179,885 | | | | 14,187,530 | |
| | | | | | | | |
| | | | | | |
The notes to the financial statements are an integral part of,
and should be read in conjunction with, the financial statements. | | mainstayinvestments.com | | | M-283 | |
Portfolio of Investments December 31, 2013 (continued)
| | | | | | | | |
| | |
Shares | | | Value | |
| Common Stocks (continued) | |
Media 3.7% | |
¨CBS Corp. Class B | | | 363,978 | | | $ | 23,199,958 | |
Time Warner Cable, Inc. | | | 43,497 | | | | 5,893,843 | |
Viacom, Inc. Class B | | | 91,483 | | | | 7,990,125 | |
| | | | | | | | |
| | | | | | | 37,083,926 | |
| | | | | | | | |
Metal Fabricate & Hardware 0.5% | |
Precision Castparts Corp. | | | 20,415 | | | | 5,497,760 | |
| | | | | | | | |
|
Mining 0.2% | |
Rio Tinto PLC, Sponsored ADR | | | 37,317 | | | | 2,105,798 | |
| | | | | | | | |
|
Miscellaneous—Manufacturing 1.0% | |
3M Co. | | | 44,779 | | | | 6,280,255 | |
Dover Corp. | | | 40,002 | | | | 3,861,793 | |
| | | | | | | | |
| | | | | | | 10,142,048 | |
| | | | | | | | |
Oil & Gas 1.8% | |
Chevron Corp. | | | 130,763 | | | | 16,333,606 | |
Noble Corp. PLC | | | 56,591 | | | | 2,120,465 | |
| | | | | | | | |
| | | | | | | 18,454,071 | |
| | | | | | | | |
Pharmaceuticals 8.8% | |
Abbott Laboratories | | | 184,244 | | | | 7,062,073 | |
AbbVie, Inc. | | | 270,289 | | | | 14,273,962 | |
Allergan, Inc. | | | 98,001 | | | | 10,885,951 | |
AmerisourceBergen Corp. | | | 94,197 | | | | 6,622,991 | |
Bristol-Myers Squibb Co. | | | 130,547 | | | | 6,938,573 | |
Express Scripts Holding Co. (g) | | | 187,628 | | | | 13,178,991 | |
Johnson & Johnson | | | 111,375 | | | | 10,200,836 | |
Mylan, Inc. (g) | | | 162,849 | | | | 7,067,647 | |
Shire PLC, Sponsored ADR | | | 57,887 | | | | 8,178,854 | |
Zoetis, Inc. | | | 113,222 | | | | 3,701,227 | |
| | | | | | | | |
| | | | | | | 88,111,105 | |
| | | | | | | | |
Pipelines 1.5% | |
Enterprise Products Partners, L.P. | | | 220,894 | | | | 14,645,272 | |
| | | | | | | | |
|
Real Estate Investment Trusts 0.6% | |
Ventas, Inc. | | | 103,462 | | | | 5,926,303 | |
| | | | | | | | |
|
Retail 1.0% | |
AutoZone, Inc. (g) | | | 9,742 | | | | 4,656,092 | |
Home Depot, Inc. (The) | | | 59,953 | | | | 4,936,530 | |
| | | | | | | | |
| | | | | | | 9,592,622 | |
| | | | | | | | |
Software 2.2% | |
Intuit, Inc. | | | 64,194 | | | | 4,899,286 | |
Microsoft Corp. | | | 284,173 | | | | 10,636,595 | |
Oracle Corp. | | | 184,379 | | | | 7,054,341 | |
| | | | | | | | |
| | | | | | | 22,590,222 | |
| | | | | | | | |
| | | | | | | | |
| | |
Shares | | | Value | |
Telecommunications 1.3% | |
CenturyLink, Inc. | | | 183,406 | | | $ | 5,841,481 | |
Motorola Solutions, Inc. | | | 76,461 | | | | 5,161,117 | |
Verizon Communications, Inc. | | | 39,997 | | | | 1,965,453 | |
| | | | | | | | |
| | | | | | | 12,968,051 | |
| | | | | | | | |
Toys, Games & Hobbies 1.4% | |
Mattel, Inc. | | | 304,081 | | | | 14,468,174 | |
| | | | | | | | |
|
Transportation 2.0% | |
Canadian Pacific Railway, Ltd. | | | 41,607 | | | | 6,295,971 | |
Union Pacific Corp. | | | 79,892 | | | | 13,421,856 | |
| | | | | | | | |
| | | | | | | 19,717,827 | |
| | | | | | | | |
Total Common Stocks
(Cost $404,440,743) | | | | | | | 567,991,738 | |
| | | | | | | | |
|
| Preferred Stocks 0.7% | |
Banks 0.5% | |
Morgan Stanley
6.875% (c) | | | 42,650 | | | | 1,067,530 | |
7.125% (c) | | | 54,150 | | | | 1,415,481 | |
Wells Fargo & Co.
7.50% (c)(g) | | | 87,750 | | | | 2,256,930 | |
| | | | | | | | |
| | | | | | | 4,739,941 | |
| | | | | | | | |
Diversified Financial Services 0.1% | |
Citigroup Capital XIII
7.875% (c) | | | 18,000 | | | | 490,500 | |
| | | | | | | | |
|
Finance—Credit Card 0.1% | |
Discover Financial Services
6.50% | | | 57,275 | | | | 1,319,616 | |
| | | | | | | | |
|
Finance—Investment Banker/Broker 0.0%‡ | |
Charles Schwab Corp. (The)
6.00% | | | 5,375 | | | | 118,196 | |
| | | | | | | | |
Total Preferred Stocks
(Cost $6,673,460) | | | | | | | 6,668,253 | |
| | | | | | | | |
| | | | |
| M-284 | | MainStay VP Janus Balanced Portfolio | | The notes to the financial statements are an integral part of,
and should be read in conjunction with, the financial statements. |
| | | | | | | | |
| | | Principal
Amount | | | Value | |
| Short-Term Investment 0.8% | |
Repurchase Agreement 0.8% | |
State Street Bank and Trust Co.
0.00%, dated 12/31/13
due 1/2/14
Proceeds at Maturity $8,115,489 (Collateralized by a Federal National Mortgage Association security with a rate of 2.17% and a maturity date of 11/7/22, with a Principal Amount of $9,905,000 and a Market Value of $8,279,315) | | $ | 8,115,489 | | | $ | 8,115,489 | |
| | | | | | | | |
Total Short-Term Investment
(Cost $8,115,489) | | | | | | | 8,115,489 | |
| | | | | | | | |
Total Investments
(Cost $839,085,797) (h) | | | 99.7 | % | | | 1,003,709,251 | |
Other Assets, Less Liabilities | | | 0.3 | | | | 2,658,219 | |
Net Assets | | | 100.0 | % | | $ | 1,006,367,470 | |
| ‡ | Less than one-tenth of a percent. |
| (a) | Subprime mortgage investment or other asset-backed security. The total market value of these securities as of December 31, 2013, is $2,720,187, which represents 0.3% of the Portfolio’s net assets. |
| (b) | May be sold to institutional investors only under Rule 144A or securities offered pursuant to Section 4(a)(2) of the Securities Act of 1933, as amended. |
| (c) | Floating rate—Rate shown is the rate in effect as of December 31, 2013. |
| (d) | Floating Rate Loan—generally pays interest at rates which are periodically re-determined at a margin above the London InterBank Offered Rate or other short-term rates. The rate shown is the weighted average interest rate of all contracts within the floating rate loan facility as of December 31, 2013. |
| (e) | Illiquid security—The total market value of this security as of December 31, 2013, is $995,416, which represents 0.1% of the Portfolio’s net assets. |
| (f) | Yankee Bond—Dollar-denominated bond issued in the United States by a foreign bank or corporation. |
| (g) | Non-income producing security. |
| (h) | As of December 31, 2013, cost is $838,828,119 for federal income tax purposes and net unrealized appreciation is as follows: |
| | | | |
Gross unrealized appreciation | | $ | 170,658,692 | |
Gross unrealized depreciation | | | (5,777,560 | ) |
| | | | |
Net unrealized appreciation | | $ | 164,881,132 | |
| | | | |
The following abbreviation is used in the above portfolio:
ADR—American Depositary Receipt
The following is a summary of the fair valuations according to the inputs used as of December 31, 2013, for valuing the Portfolio’s assets.
Asset Valuation Inputs
| | | | | | | | | | | | | | | | |
Description | | Quoted Prices
in Active Markets
for Identical Assets (Level 1) | | | Significant Other
Observable Inputs (Level 2) | | | Significant
Unobservable
Inputs
(Level 3) | | | Total | |
| Investments in Securities (a) | | | | | | | | | | | | | | | | |
| Long-Term Bonds | | | | | | | | | | | | | | | | |
Asset-Backed Securities | | $ | — | | | $ | 3,348,756 | | | $ | — | | | $ | 3,348,756 | |
Corporate Bonds | | | — | | | | 200,087,809 | | | | — | | | | 200,087,809 | |
Loan Assignments | | | — | | | | 1,893,937 | | | | — | | | | 1,893,937 | |
Mortgage-Backed Securities | | | — | | | | 8,703,387 | | | | — | | | | 8,703,387 | |
U.S. Government & Federal Agencies | | | — | | | | 205,234,507 | | | | — | | | | 205,234,507 | |
Yankee Bond | | | — | | | | 1,665,375 | | | | — | | | | 1,665,375 | |
| | | | | | | | | | | | | | | | |
| Total Long-Term Bonds | | | — | | | | 420,933,771 | | | | — | | | | 420,933,771 | |
| | | | | | | | | | | | | | | | |
| Common Stocks | | | 567,991,738 | | | | — | | | | — | | | | 567,991,738 | |
| Preferred Stocks | | | 6,668,253 | | | | — | | | | — | | | | 6,668,253 | |
Short-Term Investment | | | | | | | | | | | | | | | | |
Repurchase Agreement | | | — | | | | 8,115,489 | | | | — | | | | 8,115,489 | |
| | | | | | | | | | | | | | | | |
| Total Investments in Securities | | $ | 574,659,991 | | | $ | 429,049,260 | | | $ | — | | | $ | 1,003,709,251 | |
| | | | | | | | | | | | | | | | |
| (a) | For a complete listing of investments and their industries, see the Portfolio of Investments. |
| | | | | | |
The notes to the financial statements are an integral part of,
and should be read in conjunction with, the financial statements. | | mainstayinvestments.com | | | M-285 | |
Portfolio of Investments December 31, 2013 (continued)
The Portfolio recognizes transfers between the levels as of the beginning of the period.
As of December 31, 2013, certain foreign securities with a market value of $7,879,784 were transferred from Level 2 to Level 1 as the prices of these securities were based on unadjusted quoted prices compared with the prior year prices which were adjusted for events after the market close. The December 31, 2012 prices were adjusted by applying factors provided by a third party vendor in accordance with the Portfolio’s policies and procedures. Fair values as of December 31, 2013, for these securities were based on quoted prices in active markets for identical investments.
As of December 31, 2013, the Portfolio did not hold any investments with significant unobservable inputs (Level 3). (See Note 2)
| | | | |
| M-286 | | MainStay VP Janus Balanced Portfolio | | The notes to the financial statements are an integral part of,
and should be read in conjunction with, the financial statements. |
Statement of Assets and Liabilities as of December 31, 2013
| | | | |
| Assets | |
Investment in securities, at value
(identified cost $839,085,797) | | $ | 1,003,709,251 | |
Cash | | | 7,872 | |
Receivables: | | | | |
Dividends and interest | | | 3,648,965 | |
Investment securities sold | | | 3,303,712 | |
Fund shares sold | | | 110,400 | |
| | | | |
Total assets | | | 1,010,780,200 | |
| | | | |
| |
| Liabilities | | | | |
Payables: | | | | |
Investment securities purchased | | | 3,016,246 | |
Fund shares redeemed | | | 734,262 | |
Manager (See Note 3) | | | 445,817 | |
NYLIFE Distributors (See Note 3) | | | 106,786 | |
Shareholder communication | | | 49,503 | |
Professional fees | | | 48,719 | |
Custodian | | | 7,397 | |
Trustees | | | 1,213 | |
Accrued expenses | | | 2,787 | |
| | | | |
Total liabilities | | | 4,412,730 | |
| | | | |
Net assets | | $ | 1,006,367,470 | |
| | | | |
| |
| Net Assets Consist of | | | | |
Shares of beneficial interest outstanding (par value of $.001 per share) unlimited number of shares authorized | | $ | 80,802 | |
Additional paid-in capital | | | 808,610,676 | |
| | | | |
| | | 808,691,478 | |
Undistributed net investment income | | | 14,161,371 | |
Accumulated net realized gain (loss) on investments and foreign currency transactions | | | 18,891,318 | |
Net unrealized appreciation (depreciation) on investments | | | 164,623,454 | |
Net unrealized appreciation (depreciation) on translation of other assets and liabilities in foreign currencies | | | (151 | ) |
| | | | |
Net assets | | $ | 1,006,367,470 | |
| | | | |
| | | | |
Initial Class | | | | |
Net assets applicable to outstanding shares | | $ | 493,872,482 | |
| | | | |
Shares of beneficial interest outstanding | | | 39,590,551 | |
| | | | |
Net asset value per share outstanding | | $ | 12.47 | |
| | | | |
Service Class | | | | |
Net assets applicable to outstanding shares | | $ | 512,494,988 | |
| | | | |
Shares of beneficial interest outstanding | | | 41,211,069 | |
| | | | |
Net asset value per share outstanding | | $ | 12.44 | |
| | | | |
| | | | | | |
The notes to the financial statements are an integral part of,
and should be read in conjunction with, the financial statements. | | mainstayinvestments.com | | | M-287 | |
Statement of Operations for the year ended December 31, 2013
| | | | |
| Investment Income (Loss) | |
Income | | | | |
Dividends (a) | | $ | 11,875,695 | |
Interest | | | 9,905,217 | |
| | | | |
Total income | | | 21,780,912 | |
| | | | |
Expenses | | | | |
Manager (See Note 3) | | | 5,097,225 | |
Distribution and service—Service Class (See Note 3) | | | 1,121,755 | |
Shareholder communication | | | 143,791 | |
Professional fees | | | 114,581 | |
Custodian | | | 47,273 | |
Trustees | | | 18,827 | |
Miscellaneous | | | 28,832 | |
| | | | |
Total expenses before waiver/reimbursement | | | 6,572,284 | |
Expense waiver/reimbursement from Manager
(See Note 3) | | | (75,419 | ) |
| | | | |
Net expenses | | | 6,496,865 | |
| | | | |
Net investment income (loss) | | | 15,284,047 | |
| | | | |
|
| Realized and Unrealized Gain (Loss) on Investments and Foreign Currency Transactions | |
Net realized gain (loss) on: | | | | |
Security transactions | | | 17,446,982 | |
Foreign currency transactions | | | (2,208 | ) |
| | | | |
Net realized gain (loss) on investments and foreign currency transactions | | | 17,444,774 | |
| | | | |
Net change in unrealized appreciation (depreciation) on: | | | | |
Investments | | | 136,049,069 | |
Translation of other assets and liabilities in foreign currencies | | | (146 | ) |
| | | | |
Net change in unrealized appreciation (depreciation) on investments and foreign currency transactions | | | 136,048,923 | |
| | | | |
Net realized and unrealized gain (loss) on investments and foreign currency transactions | | | 153,493,697 | |
| | | | |
Net increase (decrease) in net assets resulting from operations | | $ | 168,777,744 | |
| | | | |
| (a) | Dividends recorded net of foreign withholding taxes in the amount of $76,311. |
| | | | |
| M-288 | | MainStay VP Janus Balanced Portfolio | | The notes to the financial statements are an integral part of,
and should be read in conjunction with, the financial statements. |
Statements of Changes in Net Assets
for the year ended December 31, 2013 and the period February 17, 2012 (inception date) through December 31, 2012
| | | | | | | | |
| | | 2013 | | | 2012 | |
| Increase (Decrease) in Net Assets | |
Operations: | | | | | | | | |
Net investment income (loss) | | $ | 15,284,047 | | | $ | 13,652,240 | |
Net realized gain (loss) on investments and foreign currency transactions | | | 17,444,774 | | | | 1,055,044 | |
Net change in unrealized appreciation (depreciation) on investments and foreign currency transactions | | | 136,048,923 | | | | 28,574,380 | |
| | | | |
Net increase (decrease) in net assets resulting from operations | | | 168,777,744 | | | | 43,281,664 | |
| | | | |
Dividends and distributions to shareholders: | | | | | | | | |
From net investment income: | | | | | | | | |
Initial Class | | | (6,827,579 | ) | | | — | |
Service Class | | | (6,087,736 | ) | | | — | |
| | | | |
| | | (12,915,315 | ) | | | — | |
| | | | |
From net realized gain on investments: | | | | | | | | |
Initial Class | | | (733,296 | ) | | | — | |
Service Class | | | (735,298 | ) | | | — | |
| | | | |
| | | (1,468,594 | ) | | | — | |
| | | | |
Total dividends and distributions to shareholders | | | (14,383,909 | ) | | | — | |
| | | | |
Capital share transactions: | | | | | | | | |
Net proceeds from sale of shares | | | 93,947,663 | | | | 896,526,344 | |
Net asset value of shares issued to shareholders in reinvestment of dividends and distributions | | | 14,383,909 | | | | — | |
Cost of shares redeemed | | | (96,438,479 | ) | | | (99,727,466 | ) |
| | | | |
Increase (decrease) in net assets derived from capital share transactions | | | 11,893,093 | | | | 796,798,878 | |
| | | | |
Net increase (decrease) in net assets | | | 166,286,928 | | | | 840,080,542 | |
|
| Net Assets | |
Beginning of period | | | 840,080,542 | | | | — | |
| | | | |
End of period | | $ | 1,006,367,470 | | | $ | 840,080,542 | |
| | | | |
Undistributed net investment income at end of period | | $ | 14,161,371 | | | $ | 12,705,857 | |
| | | | |
| | | | | | |
The notes to the financial statements are an integral part of,
and should be read in conjunction with, the financial statements. | | mainstayinvestments.com | | | M-289 | |
Financial Highlights selected per share data and ratios
| | | | | | | | | | | | | | | | | | |
| | | Initial Class | | | | | Service Class | |
| | | Year ended
December 31, | | | February 17,
2012**
through
December 31, | | | | | Year ended
December 31, | | | February 17,
2012**
through
December 31, | |
| | | 2013 | | | 2012 | | | | | 2013 | | | 2012 | |
Net asset value at beginning of period | | $ | 10.55 | | | $ | 10.00 | | | | | $ | 10.53 | | | $ | 10.00 | |
| | | | | | | | | | | | | | | | | | |
Net investment income (loss) (a) | | | 0.20 | | | | 0.18 | | | | | | 0.18 | | | | 0.16 | |
Net realized and unrealized gain (loss) on investments | | | 1.91 | | | | 0.37 | | | | | | 1.90 | | | | 0.37 | |
Net realized and unrealized gain (loss) on foreign currency transactions | | | (0.00 | )‡ | | | (0.00 | )‡ | | | | | (0.00 | )‡ | | | (0.00 | )‡ |
| | | | | | | | | | | | | | | | | | |
Total from investment operations | | | 2.11 | | | | 0.55 | | | | | | 2.08 | | | | 0.53 | |
| | | | | | | | | | | | | | | | | | |
Less dividends and distributions: | | | | | | | | | | | | | | | | | | |
From net investment income | | | (0.17 | ) | | | — | | | | | | (0.15 | ) | | | — | |
From net realized gain on investments | | | (0.02 | ) | | | — | | | | | | (0.02 | ) | | | — | |
| | | | | | | | | | | | | | | | | | |
Total dividends and distributions | | | (0.19 | ) | | | — | | | | | | (0.17 | ) | | | — | |
| | | | | | | | | | | | | | | | | | |
Net asset value at end of period | | $ | 12.47 | | | $ | 10.55 | | | | | $ | 12.44 | | | $ | 10.53 | |
| | | | | | | | | | | | | | | | | | |
Total investment return | | | 20.15 | % | | | 5.50 | %(b) | | | | | 19.86 | % | | | 5.30 | %(b)(c) |
Ratios (to average net assets)/Supplemental Data: | | | | | | | | | | | | | | | | | | |
Net investment income (loss) | | | 1.77 | % | | | 2.01 | %†† | | | | | 1.52 | % | | | 1.77 | %†† |
Net expenses | | | 0.58 | % | | | 0.58 | %†† | | | | | 0.83 | % | | | 0.83 | %†† |
Expenses (before waiver/reimbursement) | | | 0.59 | % | | | 0.59 | %†† | | | | | 0.84 | % | | | 0.84 | %†† |
Portfolio turnover rate | | | 74 | % | | | 63 | % | | | | | 74 | % | | | 63 | % |
Net assets at end of period (in 000’s) | | $ | 493,872 | | | $ | 461,363 | | | | | $ | 512,495 | | | $ | 378,717 | |
| ‡ | Less than one cent per share. |
| (a) | Per share data based on average shares outstanding during the period. |
| (b) | Total investment return is not annualized. |
| (c) | Total investment returns may reflect adjustments to conform to generally accepted accounting principles. |
| | | | |
| M-290 | | MainStay VP Janus Balanced Portfolio | | The notes to the financial statements are an integral part of,
and should be read in conjunction with, the financial statements. |
MainStay VP Large Cap Growth Portfolio
Investment and Performance Comparison1 (Unaudited)
Performance data quoted represents past performance. Past performance is no guarantee of future results. Because of market volatility, current performance may be lower or higher than the figures shown. Investment return and principal value will fluctuate, and as a result, when shares are redeemed, they may be worth more or less than their original cost. The performance table and graph do not reflect any deduction of sales charges, mortality and expense charges, contract charges or administrative charges. Please refer to the Performance Summary appropriate for your policy. For performance information current to the most recent month-end, please call 800-598-2019 or visit www.newyorklife.com.
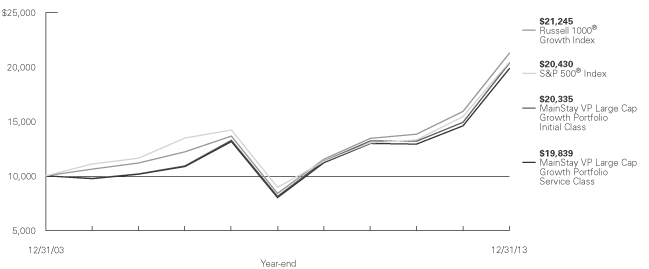
Average Annual Total Returns for the Year Ended December 31, 2013
| | | | | | | | | | | | | | |
| Class | | One Year | | Five Years | | | Ten Years2 | | | Gross Expense Ratio3 | |
| Initial Class Shares | | 36.47% | | | 20.16 | % | | | 7.36 | % | | | 0.78 | % |
| Service Class Shares | | 36.13 | | | 19.86 | | | | 7.09 | | | | 1.03 | |
| | | | | | | | | | | | |
| Benchmark Performance | | One
Year | | | Five
Years | | | Ten
Years | |
Russell 1000® Growth Index4 | | | 33.48 | % | | | 20.39 | % | | | 7.83 | % |
S&P 500® Index4 | | | 32.39 | | | | 17.94 | | | | 7.41 | |
Average Lipper Variable Products Large-Cap Growth Portfolio5 | | | 34.67 | | | | 19.82 | | | | 7.67 | |
| 1. | Performance figures reflect certain fee waivers and/or expense limitations, without which total returns may have been different. For information on current fee waivers and/or expense limitations, please refer to the notes to the financial statements. |
| 2. | Performance figures shown for the ten-year period ended December 31, 2013 reflect nonrecurring reimbursements from affiliates for printing and mailing costs. If these nonrecurring reimbursements had not been made, the total returns would have been 7.34% for Initial Class shares and 7.08% for Service Class shares for the ten-year period. |
| 3. | The gross expense ratios presented reflect the Portfolio’s “Total Annual Portfolio Operating Expenses” from the most recent Prospectus and may differ from other expense ratios disclosed in this report. |
| 4. | Please refer to pages M-2 and M-3 for additional explanations and disclosure regarding the Portfolios, their benchmark indices and other indices mentioned in the reports. |
| 5. | The Average Lipper Variable Products Large-Cap Growth Portfolio is representative of portfolios that, by portfolio practice, invest at least 75% of their equity assets in companies with market capitalizations (on a three-year weighted basis) above Lipper’s U.S. diversified equity large-cap floor. Large-cap growth portfolios typically have above-average characteristics compared to the S&P 500® Index. Lipper Inc. is an independent monitor of fund performance. Results are based on total returns with all dividend and capital gain distributions reinvested. |
| | | | |
| mainstayinvestments.com | | | M-291 | |
Cost in Dollars of a $1,000 Investment in MainStay VP Large Cap Growth Portfolio (Unaudited)
The example below is intended to describe the fees and expenses borne by shareholders during the six-month period from July 1, 2013, to December 31, 2013, and the impact of those costs on your investment.
Example
As a shareholder of the Portfolio, you incur two types of costs: (1) transaction costs, including exchange fees and sales charges (loads) on purchases (as applicable), and (2) ongoing costs, including management fees, distribution and/or service (12b-1) fees, and other Portfolio expenses (as applicable). This example is intended to help you understand your ongoing costs (in dollars) of investing in the Portfolio and to compare these costs with the ongoing costs of investing in other Portfolios. The example is based on an investment of $1,000 made at the beginning of the six-month period and held for the entire period from July 1, 2013, to December 31, 2013. Shares are only sold in connection with variable life and annuity contracts and the example does not reflect any contract level or transactional fees or expenses. If these costs had been included, your costs would have been higher.
This example illustrates your Portfolio’s ongoing costs in two ways:
Actual Expenses
The second and third data columns in the table below provide information about actual account values and actual expenses. You may use the information in these columns, together with the amount you invested, to estimate the expenses that you paid during the six months ended
December 31, 2013. Simply divide your account value by $1,000 (for example, an $8,600 account value divided by $1,000 = 8.6), then multiply the result by the number under the heading entitled ‘‘Expenses Paid During Period’’ to estimate the expenses you paid on your account during this period.
Hypothetical Example for Comparison Purposes
The fourth and fifth data columns in the table below provide information about hypothetical account values and hypothetical expenses based on the Portfolio’s actual expense ratio and an assumed rate of return of 5% per year before expenses, which is not the Portfolio’s actual return. The hypothetical account values and expenses may not be used to estimate the actual ending account balances or expenses you paid for the six-month period shown. You may use this information to compare the ongoing costs of investing in the Portfolio with the ongoing costs of investing in other Portfolios. To do so, compare this 5% hypothetical example with the 5% hypothetical examples that appear in the shareholder reports of the other Portfolios.
Please note that the expenses shown in the table are meant to highlight your ongoing costs only and do not reflect any transactional costs, such as exchange fees or sales charges (loads). Therefore, the fourth and fifth data columns of the table are useful in comparing ongoing costs only and will not help you determine the relative total costs of owning different funds. In addition, if these transactional costs were included, your costs would have been higher.
| | | | | | | | | | | | | | | | | | | | |
| | | | | | | | | | | | | | | | |
| Share Class | | Beginning
Account
Value
7/1/13 | | | Ending Account
Value (Based
on Actual
Returns and
Expenses)
12/31/13 | | | Expenses
Paid
During
Period1 | | | Ending Account
Value (Based
on Hypothetical
5% Annualized
Return and
Actual Expenses)
12/31/13 | | | Expenses
Paid
During
Period1 | |
| | | | | |
| Initial Class Shares | | $ | 1,000.00 | | | $ | 1,229.90 | | | $ | 4.33 | | | $ | 1,021.30 | | | $ | 3.92 | |
| | | | | |
| Service Class Shares | | $ | 1,000.00 | | | $ | 1,228.40 | | | $ | 5.73 | | | $ | 1,020.10 | | | $ | 5.19 | |
| 1. | Expenses are equal to the Portfolio’s annualized expense ratio of each class (0.77% for Initial Class and 1.02% for Service Class) multiplied by the average account value over the period, divided by 365 and multiplied by 184 (to reflect the six-month period). The table above represents the actual expenses incurred during the six-month period. |
| | |
| M-292 | | MainStay VP Large Cap Growth Portfolio |
Industry Composition as of December 31, 2013 (Unaudited)
| | | | |
| Biotechnology | | | 10.4 | % |
| Internet Software & Services | | | 9.7 | |
| Internet & Catalog Retail | | | 7.1 | |
| IT Services | | | 6.8 | |
| Media | | | 5.7 | |
| Hotels, Restaurants & Leisure | | | 5.0 | |
| Road & Rail | | | 4.2 | |
| Chemicals | | | 4.1 | |
| Capital Markets | | | 3.9 | |
| Software | | | 3.4 | |
| Aerospace & Defense | | | 3.2 | |
| Semiconductors & Semiconductor Equipment | | | 3.1 | |
| Specialty Retail | | | 3.0 | |
| Industrial Conglomerates | | | 2.7 | |
| Computers & Peripherals | | | 2.6 | |
| Textiles, Apparel & Luxury Goods | | | 2.5 | |
| Oil, Gas & Consumable Fuels | | | 2.2 | |
| | | | |
| Pharmaceuticals | | | 2.1 | % |
| Food & Staples Retailing | | | 2.0 | |
| Energy Equipment & Services | | | 1.7 | |
| Multiline Retail | | | 1.6 | |
| Health Care Providers & Services | | | 1.5 | |
| Communications Equipment | | | 1.4 | |
| Consumer Finance | | | 1.3 | |
| Real Estate Investment Trusts | | | 1.3 | |
| Auto Components | | | 1.2 | |
| Health Care Technology | | | 1.1 | |
| Wireless Telecommunication Services | | | 1.1 | |
| Diversified Financial Services | | | 1.0 | |
| Personal Products | | | 1.0 | |
| Airlines | | | 0.7 | |
| Short-Term Investment | | | 1.3 | |
| Other Assets, Less Liabilities | | | 0.1 | |
| | | | |
| | | 100.0 | % |
| | | | |
See Portfolio of Investments beginning on page M-296 for specific holdings within these categories.
Top Ten Holdings as of December 31, 2013 (excluding short-term investment) (Unaudited)
| | | | |
| mainstayinvestments.com | | | M-293 | |
Portfolio Management Discussion and Analysis (Unaudited)
Answers to the questions reflect the views of portfolio managers Clark J. Winslow, Justin H. Kelly, CFA, and Patrick M. Burton, CFA, of Winslow Capital Management, LLC, the Portfolio’s Subadvisor.
How did MainStay VP Large Cap Growth Portfolio perform relative to its benchmark and peers for the 12 months ended December 31, 2013?
For the 12 months ended December 31, 2013, MainStay VP Large Cap Growth Portfolio returned 36.47% for Initial Class shares and 36.13% for Service Class shares. Over the same period, both share classes outperformed the 33.48% return of the Russell 1000® Growth Index1 and the 32.39% return of the S&P 500® Index.1 The Russell 1000® Growth Index is the Portfolio’s broad-based securities-market index. The S&P 500® Index is the Portfolio’s secondary benchmark. Both share classes outperformed the 34.67% return of the average Lipper1 Variable Products Large-Cap Growth Portfolio for the 12 months ended December 31, 2013.
What factors affected the Portfolio’s relative performance during the reporting period?
The Portfolio’s strong absolute and relative performance was driven by favorable stock selection. Allocation effect was also positive, largely stemming from our underweight position in the consumer staples sector.
Which sectors were the strongest positive contributors to the Portfolio’s relative performance, and which sectors were particularly weak?
The strongest positive sector contribution to performance relative to the Russell 1000® Growth Index came from consumer discretionary. (Contributions take weightings and total returns into account.) The sector’s average overweight position contributed modestly, but strong stock selection drove the outperformance. The health care sector was the next-strongest relative contributor, with an overweight position contributing positively, although the outperformance was primarily driven by stock selection. The consumer staples sector was another strong contributor to the Portfolio’s relative performance, partly because of stock selection but mostly because of the Portfolio’s long-standing underweight position in the sector.
The industrials sector made the weakest contribution to the Portfolio’s performance relative to the Russell 1000® Growth Index. The weakness resulted from stock selection. The financials sector also underperformed, mostly driven by a slightly overweight position. On average, the Portfolio had a very slight
underweight position in the energy sector, which detracted somewhat; but given our strong stock selection, the Portfolio’s energy holdings outperformed the Index.
During the reporting period, which individual stocks made the strongest positive contributions to the Portfolio’s absolute performance and which stocks detracted the most?
The top individual contributor to absolute performance was online travel company priceline.com. The stock responded to strong earnings growth driven by increasing mobile usage, strengthening economic recovery in Europe and improving economies of scale, particularly in customer-acquisition costs. The stock remains one of the Portfolio’s top five holdings. The next-strongest positive contributor was biopharmaceutical company Celgene. The company benefited from increased usage of its blood cancer drug Revlimid, as well as an expanding drug pipeline in the United States and Europe. Internet software & services company Google was also a strong positive contributor. The company has significantly increased its advertising sales and has enhanced its offerings to better suit growing mobile Internet usage.
The weakest contributor to the Portfolio’s absolute performance was robotic health care company Intuitive Surgical. The company saw sales of its da Vinci robotics slow as hospitals sought to limit spending in the evolving health care spending environment. We sold the Portfolio’s position in the stock during the summer. VMware Inc., a virtualization infrastructure software company, was another weak contributor. The company faced a slower-than-expected demand rebound with clients shifting some of their software to cloud-based applications. We sold the stock in the first quarter of 2013. Data services company Equinix was another weak contributor because of a challenging spending environment for legacy technology companies and increased competition in the industry. We sold the stock during the third quarter.
Did the Portfolio make any significant purchases or sales during the reporting period?
The Portfolio purchased a position in airline Delta Air Lines on the basis of structural improvements in the industry’s competitive intensity. We purchased a position in retailer Best Buy in the second quarter
| 1. | Please refer to pages M-2 and M-3 for additional explanations and disclosure regarding the Portfolios, their benchmark indices and service providers mentioned in the reports. |
| | |
| M-294 | | MainStay VP Large Cap Growth Portfolio |
because we believed that with a new management team, the company was poised for accelerating growth. The position was sold late in the year on relative valuation.
The Portfolio sold its positions in Equinix and Intuitive Surgical for the reasons already cited.
How did the Portfolio’s sector weightings change during the reporting period?
The Portfolio increased its already overweight positions relative to the Russell 1000® Growth Index in the consumer discretionary and financials sectors. The Portfolio went from an underweight to an overweight position in the information technology sector. The Portfolio moved from a moderately overweight position relative to the Russell 1000® Growth Index in the
materials sector at the beginning of the reporting period to a moderately underweight position at the end of 2013.
How was the Portfolio positioned at the end of the reporting period?
As of December 31, 2013, the Portfolio held overweight positions in the consumer discretionary, financials and health care sectors. The Portfolio maintained its long-standing significantly underweight position relative to the Russell 1000® Growth Index in the consumer staples sector. As of the same date, the Portfolio also held underweight positions relative to the Russell 1000® Growth Index in the industrials and telecommunication services sectors.
The opinions expressed are those of the portfolio managers as of the date of this report and are subject to change. There is no guarantee that any forecasts made will come to pass. This material does not constitute investment advice and is not intended as an endorsement of any specific investment.
Not all MainStay VP Portfolios and/or share classes are available under all policies.
| | | | |
| mainstayinvestments.com | | | M-295 | |
Portfolio of Investments December 31, 2013
| | | | | | | | |
| | |
Shares | | | Value | |
| | | | | | | | |
| Common Stocks 98.6%† | |
Aerospace & Defense 3.2% | |
Precision Castparts Corp. | | | 50,300 | | | $ | 13,545,790 | |
United Technologies Corp. | | | 89,700 | | | | 10,207,860 | |
| | | | | | | | |
| | | | | | | 23,753,650 | |
| | | | | | | | |
Airlines 0.7% | |
Delta Air Lines, Inc. | | | 183,500 | | | | 5,040,745 | |
| | | | | | | | |
| | |
Auto Components 1.2% | | | | | | | | |
BorgWarner, Inc. | | | 160,400 | | | | 8,967,964 | |
| | | | | | | | |
|
Biotechnology 10.4% | |
Alexion Pharmaceuticals, Inc. (a) | | | 74,700 | | | | 9,939,582 | |
Amgen, Inc. | | | 123,900 | | | | 14,144,424 | |
Biogen Idec, Inc. (a) | | | 55,400 | | | | 15,498,150 | |
¨Celgene Corp. (a) | | | 140,000 | | | | 23,654,400 | |
Gilead Sciences, Inc. (a) | | | 203,800 | | | | 15,315,570 | |
| | | | | | | | |
| | | | | | | 78,552,126 | |
| | | | | | | | |
Capital Markets 3.9% | |
BlackRock, Inc. | | | 42,935 | | | | 13,587,640 | |
Charles Schwab Corp. (The) | | | 209,000 | | | | 5,434,000 | |
Morgan Stanley | | | 342,100 | | | | 10,728,256 | |
| | | | | | | | |
| | | | | | | 29,749,896 | |
| | | | | | | | |
Chemicals 4.1% | |
Ecolab, Inc. | | | 75,800 | | | | 7,903,666 | |
¨Monsanto Co. | | | 199,789 | | | | 23,285,408 | |
| | | | | | | | |
| | | | | | | 31,189,074 | |
| | | | | | | | |
Communications Equipment 1.4% | |
QUALCOMM, Inc. | | | 138,300 | | | | 10,268,775 | |
| | | | | | | | |
|
Computers & Peripherals 2.6% | |
¨Apple, Inc. | | | 34,800 | | | | 19,526,628 | |
| | | | | | | | |
|
Consumer Finance 1.3% | |
American Express Co. | | | 103,900 | | | | 9,426,847 | |
| | | | | | | | |
|
Diversified Financial Services 1.0% | |
JPMorgan Chase & Co. | | | 127,700 | | | | 7,467,896 | |
| | | | | | | | |
|
Energy Equipment & Services 1.7% | |
Schlumberger, Ltd. | | | 144,300 | | | | 13,002,873 | |
| | | | | | | | |
|
Food & Staples Retailing 2.0% | |
Costco Wholesale Corp. | | | 54,900 | | | | 6,533,649 | |
CVS Caremark Corp. | | | 122,000 | | | | 8,731,540 | |
| | | | | | | | |
| | | | | | | 15,265,189 | |
| | | | | | | | |
| | | | | | | | |
| | |
Shares | | | Value | |
| | | | | | | | |
Health Care Providers & Services 1.5% | |
Catamaran Corp. (a) | | | 135,100 | | | $ | 6,414,548 | |
McKesson Corp. | | | 31,000 | | | | 5,003,400 | |
| | | | | | | | |
| | | | | | | 11,417,948 | |
| | | | | | | | |
Health Care Technology 1.1% | |
Cerner Corp. (a) | | | 152,900 | | | | 8,522,646 | |
| | | | | | | | |
|
Hotels, Restaurants & Leisure 5.0% | |
Chipotle Mexican Grill, Inc. (a) | | | 9,230 | | | | 4,917,559 | |
Hilton Worldwide Holdings, Inc. (a) | | | 274,000 | | | | 6,096,500 | |
Starbucks Corp. | | | 236,000 | | | | 18,500,040 | |
Wynn Resorts, Ltd. | | | 41,000 | | | | 7,962,610 | |
| | | | | | | | |
| | | | | | | 37,476,709 | |
| | | | | | | | |
Industrial Conglomerates 2.7% | |
¨ Danaher Corp. | | | 262,100 | | | | 20,234,120 | |
| | | | | | | | |
|
Internet & Catalog Retail 7.1% | |
¨ Amazon.com, Inc. (a) | | | 68,400 | | | | 27,277,236 | |
¨ priceline.com, Inc. (a) | | | 22,630 | | | | 26,305,112 | |
| | | | | | | | |
| | | | | | | 53,582,348 | |
| | | | | | | | |
Internet Software & Services 9.7% | |
Baidu, Inc., Sponsored ADR (a) | | | 57,900 | | | | 10,299,252 | |
eBay, Inc. (a) | | | 212,400 | | | | 11,658,636 | |
Facebook, Inc. Class A (a) | | | 238,400 | | | | 13,030,944 | |
¨ Google, Inc. Class A (a) | | | 28,300 | | | | 31,716,093 | |
LinkedIn Corp. Class A (a) | | | 28,410 | | | | 6,160,140 | |
| | | | | | | | |
| | | | | | | 72,865,065 | |
| | | | | | | | |
IT Services 6.8% | |
Cognizant Technology Solutions Corp. Class A (a) | | | 96,000 | | | | 9,694,080 | |
MasterCard, Inc. Class A | | | 15,850 | | | | 13,242,041 | |
¨ Visa, Inc. Class A | | | 128,000 | | | | 28,503,040 | |
| | | | | | | | |
| | | | | | | 51,439,161 | |
| | | | | | | | |
Media 5.7% | |
CBS Corp. Class B | | | 156,000 | | | | 9,943,440 | |
Liberty Global PLC Class A (a) | | | 106,600 | | | | 9,486,334 | |
Twenty-First Century Fox, Inc. Class A | | | 424,800 | | | | 14,944,464 | |
Walt Disney Co. (The) | | | 114,200 | | | | 8,724,880 | |
| | | | | | | | |
| | | | | | | 43,099,118 | |
| | | | | | | | |
Multiline Retail 1.6% | |
Dollar General Corp. (a) | | | 201,900 | | | | 12,178,608 | |
| | | | | | | | |
|
Oil, Gas & Consumable Fuels 2.2% | |
Noble Energy, Inc. | | | 128,800 | | | | 8,772,568 | |
Range Resources Corp. | | | 90,800 | | | | 7,655,348 | |
| | | | | | | | |
| | | | | | | 16,427,916 | |
| | | | | | | | |
| † | Percentages indicated are based on Portfolio net assets. |
| ¨ | | Among the Portfolio’s 10 largest holdings, as of December 31, 2013, excluding short-term investment. May be subject to change daily. |
| | | | |
| M-296 | | MainStay VP Large Cap Growth Portfolio | | The notes to the financial statements are an integral part of,
and should be read in conjunction with, the financial statements. |
| | | | | | | | |
| | |
Shares | | | Value | |
| | | | | | | | |
| Common Stocks (continued) | | | | | | | | |
Personal Products 1.0% | |
Estee Lauder Cos., Inc. (The) Class A | | | 104,100 | | | $ | 7,840,812 | |
| | | | | | | | |
| | |
Pharmaceuticals 2.1% | | | | | | | | |
Bristol-Myers Squibb Co. | | | 122,800 | | | | 6,526,820 | |
Zoetis, Inc. | | | 285,400 | | | | 9,329,726 | |
| | | | | | | | |
| | | | | | | 15,856,546 | |
| | | | | | | | |
Real Estate Investment Trusts 1.3% | | | | | | | | |
American Tower Corp. | | | 121,500 | | | | 9,698,130 | |
| | | | | | | | |
| | |
Road & Rail 4.2% | | | | | | | | |
Kansas City Southern | | | 28,900 | | | | 3,578,687 | |
¨ Union Pacific Corp. | | | 166,500 | | | | 27,972,000 | |
| | | | | | | | |
| | | | | | | 31,550,687 | |
| | | | | | | | |
Semiconductors & Semiconductor Equipment 3.1% | |
Applied Materials, Inc. | | | 379,700 | | | | 6,716,893 | |
Arm Holdings PLC, Sponsored ADR | | | 198,700 | | | | 10,876,838 | |
NXP Semiconductors N.V. (a) | | | 124,000 | | | | 5,695,320 | |
| | | | | | | | |
| | | | | | | 23,289,051 | |
| | | | | | | | |
Software 3.4% | |
¨ Salesforce.com, Inc. (a) | | | 340,900 | | | | 18,814,271 | |
ServiceNow, Inc. (a) | | | 90,800 | | | | 5,085,708 | |
Workday, Inc. Class A (a) | | | 17,800 | | | | 1,480,248 | |
| | | | | | | | |
| | | | | | | 25,380,227 | |
| | | | | | | | |
Specialty Retail 3.0% | |
Lowe’s Companies, Inc. | | | 177,800 | | | | 8,809,990 | |
Ross Stores, Inc. | | | 100,100 | | | | 7,500,493 | |
Ulta Salon Cosmetics & Fragrance, Inc. (a) | | | 64,100 | | | | 6,186,932 | |
| | | | | | | | |
| | | | | | | 22,497,415 | |
| | | | | | | | |
Textiles, Apparel & Luxury Goods 2.5% | |
NIKE, Inc. Class B | | | 145,400 | | | | 11,434,256 | |
Ralph Lauren Corp. | | | 41,000 | | | | 7,239,370 | |
| | | | | | | | |
| | | | | | | 18,673,626 | |
| | | | | | | | |
Wireless Telecommunication Services 1.1% | |
SBA Communications Corp. Class A (a) | | | 94,900 | | | | 8,525,816 | |
| | | | | | | | |
Total Common Stocks
(Cost $533,355,864) | | | | | | | 742,767,612 | |
| | | | | | | | |
| | | | | | | | |
| | | Principal
Amount | | | Value | |
| | | | | | | | |
| Short-Term Investment 1.3% | |
Repurchase Agreement 1.3% | |
State Street Bank and Trust Co.
0.00%, dated 12/31/13
due 1/2/14
Proceeds at Maturity $10,016,633 (Collateralized by a Federal National Mortgage Association security with a rate of 2.17% and a maturity date of 11/7/22, with a Principal Amount of $11,225,000 and a Market Value of $10,218,286) | | $ | 10,016,633 | | | $ | 10,016,633 | |
| | | | | | | | |
Total Short-Term Investment
(Cost $10,016,633) | | | | | | | 10,016,633 | |
| | | | | | | | |
Total Investments
(Cost $543,372,497) (b) | | | 99.9 | % | | | 752,784,245 | |
Other Assets, Less Liabilities | | | 0.1 | | | | 370,269 | |
Net Assets | | | 100.0 | % | | $ | 753,154,514 | |
| (a) | Non-income producing security. |
| (b) | As of December 31, 2013, cost is $543,774,286 for federal income tax purposes and net unrealized appreciation is as follows: |
| | | | |
Gross unrealized appreciation | | $ | 209,636,457 | |
Gross unrealized depreciation | | | (626,498 | ) |
| | | | |
Net unrealized appreciation | | $ | 209,009,959 | |
| | | | |
The following abbreviation is used in the above portfolio:
ADR—American Depositary Receipt
| | | | | | |
The notes to the financial statements are an integral part of,
and should be read in conjunction with, the financial statements. | | mainstayinvestments.com | | | M-297 | |
Portfolio of Investments December 31, 2013 (continued)
The following is a summary of the fair valuations according to the inputs used as of December 31, 2013, for valuing the Portfolio’s assets.
Asset Valuation Inputs
| | | | | | | | | | | | | | | | |
Description | | Quoted Prices
in Active Markets
for Identical Assets (Level 1) | | | Significant Other
Observable Inputs (Level 2) | | | Significant
Unobservable
Inputs (Level 3) | | | Total | |
| Investments in Securities (a) | | | | | | | | | | | | | | | | |
| Common Stocks | | $ | 742,767,612 | | | $ | — | | | $ | — | | | $ | 742,767,612 | |
| Short-Term Investment | | | | | | | | | | | | | | | | |
Repurchase Agreement | | | — | | | | 10,016,633 | | | | — | | | | 10,016,633 | |
| | | | | | | | | | | | | | | | |
| Total Investments in Securities | | $ | 742,767,612 | | | $ | 10,016,633 | | | $ | — | | | $ | 752,784,245 | |
| | | | | | | | | | | | | | | | |
| (a) | For a complete listing of investments and their industries, see the Portfolio of Investments. |
The Portfolio recognizes transfers between the levels as of the beginning of the period.
For the year ended December 31, 2013, the Portfolio did not have any transfers between Level 1 and Level 2 fair value measurements. (See Note 2)
As of December 31, 2013, the Portfolio did not hold any investments with significant unobservable inputs (Level 3). (See Note 2)
| | | | |
| M-298 | | MainStay VP Large Cap Growth Portfolio | | The notes to the financial statements are an integral part of,
and should be read in conjunction with, the financial statements. |
Statement of Assets and Liabilities as of December 31, 2013
| | | | |
| Assets | | | | |
Investment in securities, at value
(identified cost $543,372,497) | | $ | 752,784,245 | |
Cash | | | 671 | |
Receivables: | | | | |
Investment securities sold | | | 1,620,204 | |
Dividends and interest | | | 414,778 | |
Fund shares sold | | | 302,983 | |
| | | | |
Total assets | | | 755,122,881 | |
| | | | |
| |
| Liabilities | | | | |
Payables: | | | | |
Investment securities purchased | | | 800,101 | |
Fund shares redeemed | | | 561,080 | |
Manager (See Note 3) | | | 465,568 | |
NYLIFE Distributors (See Note 3) | | | 66,991 | |
Shareholder communication | | | 37,175 | |
Professional fees | | | 30,788 | |
Custodian | | | 2,146 | |
Trustees | | | 801 | |
Accrued expenses | | | 3,717 | |
| | | | |
Total liabilities | | | 1,968,367 | |
| | | | |
Net assets | | $ | 753,154,514 | |
| | | | |
| |
| Net Assets Consist of | | | | |
Shares of beneficial interest outstanding (par value of $.001 per share) unlimited number of shares authorized | | $ | 33,267 | |
Additional paid-in capital | | | 454,592,178 | |
| | | | |
| | | 454,625,445 | |
Accumulated net realized gain (loss) on investments | | | 89,117,321 | |
Net unrealized appreciation (depreciation) on investments | | | 209,411,748 | |
| | | | |
Net assets | | $ | 753,154,514 | |
| | | | |
| | | | |
Initial Class | | | | |
Net assets applicable to outstanding shares | | $ | 428,353,662 | |
| | | | |
Shares of beneficial interest outstanding | | | 18,759,944 | |
| | | | |
Net asset value per share outstanding | | $ | 22.83 | |
| | | | |
Service Class | | | | |
Net assets applicable to outstanding shares | | $ | 324,800,852 | |
| | | | |
Shares of beneficial interest outstanding | | | 14,506,561 | |
| | | | |
Net asset value per share outstanding | | $ | 22.39 | |
| | | | |
| | | | | | |
The notes to the financial statements are an integral part of,
and should be read in conjunction with, the financial statements. | | mainstayinvestments.com | | | M-299 | |
Statement of Operations for the year ended December 31, 2013
| | | | |
| Investment Income (Loss) | | | | |
Income | | | | |
Dividends (a) | | $ | 5,764,512 | |
Interest | | | 832 | |
| | | | |
Total income | | | 5,765,344 | |
| | | | |
Expenses | | | | |
Manager (See Note 3) | | | 5,071,559 | |
Distribution and service—Service Class (See Note 3) | | | 678,636 | |
Shareholder communication | | | 104,997 | |
Professional fees | | | 65,716 | |
Trustees | | | 13,765 | |
Custodian | | | 13,554 | |
Miscellaneous | | | 24,240 | |
| | | | |
Total expenses before waiver/reimbursement | | | 5,972,467 | |
Expense waiver/reimbursement from Manager (See Note 3) | | | (25,102 | ) |
| | | | |
Net expenses | | | 5,947,365 | |
| | | | |
Net investment income (loss) | | | (182,021 | ) |
| | | | |
|
| Realized and Unrealized Gain (Loss) on Investments | |
Net realized gain (loss) on investments | | | 89,834,412 | |
Net change in unrealized appreciation (depreciation) on investments | | | 124,171,879 | |
| | | | |
Net realized and unrealized gain (loss) on investments | | | 214,006,291 | |
| | | | |
Net increase (decrease) in net assets resulting from operations | | $ | 213,824,270 | |
| | | | |
| (a) | Dividends recorded net of foreign withholding taxes in the amount of $32,542. |
| | | | |
| M-300 | | MainStay VP Large Cap Growth Portfolio | | The notes to the financial statements are an integral part of,
and should be read in conjunction with, the financial statements. |
Statements of Changes in Net Assets
for the years ended December 31, 2013 and December 31, 2012
| | | | | | | | |
| | | 2013 | | | 2012 | |
| Increase (Decrease) in Net Assets | |
Operations: | | | | | | | | |
Net investment income (loss) | | $ | (182,021 | ) | | $ | 1,707,517 | |
Net realized gain (loss) on investments | | | 89,834,412 | | | | 24,165,179 | |
Net change in unrealized appreciation (depreciation) on investments | | | 124,171,879 | | | | 39,821,979 | |
| | | | |
Net increase (decrease) in net assets resulting from operations | | | 213,824,270 | | | | 65,694,675 | |
| | | | |
Dividends and distributions to shareholders: | | | | | | | | |
From net investment income: | | | | | | | | |
Initial Class | | | (1,264,962 | ) | | | — | |
Service Class | | | (378,611 | ) | | | — | |
| | | | |
| | | (1,643,573 | ) | | | — | |
| | | | |
From net realized gain on investments: | | | | | | | | |
Initial Class | | | (2,222,617 | ) | | | — | |
Service Class | | | (1,617,483 | ) | | | — | |
| | | | |
| | | (3,840,100 | ) | | | — | |
| | | | |
Total dividends and distributions to shareholders | | | (5,483,673 | ) | | | — | |
| | | | |
Capital share transactions: | | | | | | | | |
Net proceeds from sale of shares | | | 83,879,787 | | | | 199,091,312 | |
Net asset value of shares issued to shareholders in reinvestment of dividends and distributions | | | 5,483,673 | | | | — | |
Cost of shares redeemed | | | (210,974,397 | ) | | | (93,773,584 | ) |
| | | | |
Increase (decrease) in net assets derived from capital share transactions | | | (121,610,937 | ) | | | 105,317,728 | |
| | | | |
Net increase (decrease) in net assets | | | 86,729,660 | | | | 171,012,403 | |
| | |
| Net Assets | | | | | | | | |
Beginning of year | | | 666,424,854 | | | | 495,412,451 | |
| | | | |
End of year | | $ | 753,154,514 | | | $ | 666,424,854 | |
| | | | |
Undistributed net investment income at end of year | | $ | — | | | $ | 1,643,557 | |
| | | | |
| | | | | | |
The notes to the financial statements are an integral part of,
and should be read in conjunction with, the financial statements. | | mainstayinvestments.com | | | M-301 | |
Financial Highlights selected per share data and ratios
| | | | | | | | | | | | | | | | | | | | |
| | | Initial Class | |
| | | Year ended December 31, | |
| | | 2013 | | | 2012 | | | 2011 | | | 2010 | | | 2009 | |
Net asset value at beginning of year | | $ | 16.88 | | | $ | 14.92 | | | $ | 14.96 | | | $ | 12.88 | | | $ | 9.19 | |
| | | | | | | | | | | | | | | | | | | | |
Net investment income (loss) (a) | | | 0.01 | | | | 0.06 | | | | (0.00 | )‡ | | | (0.02 | ) | | | 0.00 | ‡ |
Net realized and unrealized gain (loss) on investments | | | 6.11 | | | | 1.90 | | | | (0.04 | ) | | | 2.10 | | | | 3.69 | |
| | | | | | | | | | | | | | | | | | | | |
Total from investment operations | | | 6.12 | | | | 1.96 | | | | (0.04 | ) | | | 2.08 | | | | 3.69 | |
| | | | | | | | | | | | | | | | | | | | |
Less dividends and distributions: | | | | | | | | | | | | | | | | | | | | |
From net investment income | | | (0.06 | ) | | | — | | | | — | | | | — | | | | — | |
From net realized gain on investments | | | (0.11 | ) | | | — | | | | — | | | | — | | | | — | |
| | | | | | | | | | | | | | | | | | | | |
Total dividends and distributions | | | (0.17 | ) | | | — | | | | — | | | | — | | | | — | |
| | | | | | | | | | | | | | | | | | | | |
Net asset value at end of year | | $ | 22.83 | | | $ | 16.88 | | | $ | 14.92 | | | $ | 14.96 | | | $ | 12.88 | |
| | | | | | | | | | | | | | | | | | | | |
Total investment return | | | 36.47 | % | | | 13.14 | %(b) | | | (0.27 | %) | | | 16.15 | % (b) | | | 40.15 | %(b) |
Ratios (to average net assets)/Supplemental Data: | | | | | | | | | | | | | | | | | | | | |
Net investment income (loss) | | | 0.07 | % | | | 0.38 | % | | | (0.00 | %)(c) | | | (0.16 | %) | | | 0.00 | %(c) |
Net expenses | | | 0.77 | % | | | 0.78 | % | | | 0.79 | % | | | 0.80 | % | | | 0.80 | % |
Expenses (before waiver/reimbursement) | | | 0.77 | % | | | 0.78 | % | | | 0.80 | % | | | 0.81 | % | | | 0.81 | % |
Portfolio turnover rate | | | 74 | % | | | 69 | % | | | 50 | % | | | 98 | % | | | 68 | % |
Net assets at end of year (in 000’s) | | $ | 428,354 | | | $ | 441,225 | | | $ | 314,013 | | | $ | 184,348 | | | $ | 230,769 | |
| ‡ | Less than one cent per share. |
| (a) | Per share data based on average shares outstanding during the year. |
| (b) | Total investment return may reflect adjustments to conform to generally accepted accounting principles. |
| (c) | Less than one-hundredth of a percent. |
| | | | | | | | | | | | | | | | | | | | |
| | | Service Class | |
| | | Year ended December 31, | |
| | | 2013 | | | 2012 | | | 2011 | | | 2010 | | | 2009 | |
Net asset value at beginning of year | | $ | 16.56 | | | $ | 14.68 | | | $ | 14.75 | | | $ | 12.73 | | | $ | 9.11 | |
| | | | | | | | | | | | | | | | | | | | |
Net investment income (loss) (a) | | | (0.03 | ) | | | 0.02 | | | | (0.04 | ) | | | (0.05 | ) | | | (0.03 | ) |
Net realized and unrealized gain (loss) on investments | | | 6.00 | | | | 1.86 | | | | (0.03 | ) | | | 2.07 | | | | 3.65 | |
| | | | | | | | | | | | | | | | | | | | |
Total from investment operations | | | 5.97 | | | | 1.88 | | | | (0.07 | ) | | | 2.02 | | | | 3.62 | |
| | | | | | | | | | | | | | | | | | | | |
Less dividends and distributions: | | | | | | | | | | | | | | | | | | | | |
From net investment income | | | (0.03 | ) | | | — | | | | — | | | | — | | | | — | |
From net realized gain on investments | | | (0.11 | ) | | | — | | | | — | | | | — | | | | — | |
| | | | | | | | | | | | | | | | | | | | |
Total dividends and distributions | | | (0.14 | ) | | | — | | | | — | | | | — | | | | — | |
| | | | | | | | | | | | | | | | | | | | |
Net asset value at end of year | | $ | 22.39 | | | $ | 16.56 | | | $ | 14.68 | | | $ | 14.75 | | | $ | 12.73 | |
| | | | | | | | | | | | | | | | | | | | |
Total investment return | | | 36.13 | % | | | 12.81 | %(b) | | | (0.47 | %)(b) | | | 15.87 | % (b) | | | 39.74 | % (b) |
Ratios (to average net assets)/Supplemental Data: | | | | | | | | | | | | | | | | | | | | |
Net investment income (loss) | | | (0.18 | %) | | | 0.10 | % | | | (0.27 | %) | | | (0.39 | %) | | | (0.26 | %) |
Net expenses | | | 1.02 | % | | | 1.03 | % | | | 1.04 | % | | | 1.05 | % | | | 1.05 | % |
Expenses (before waiver/reimbursement) | | | 1.02 | % | | | 1.03 | % | | | 1.05 | % | | | 1.06 | % | | | 1.06 | % |
Portfolio turnover rate | | | 74 | % | | | 69 | % | | | 50 | % | | | 98 | % | | | 68 | % |
Net assets at end of year (in 000’s) | | $ | 324,801 | | | $ | 225,199 | | | $ | 181,399 | | | $ | 164,311 | | | $ | 118,113 | |
| (a) | Per share data based on average shares outstanding during the year. |
| (b) | Total investment returns may reflect adjustments to conform to generally accepted accounting principles. |
| | | | |
| M-302 | | MainStay VP Large Cap Growth Portfolio | | The notes to the financial statements are an integral part of,
and should be read in conjunction with, the financial statements. |
MainStay VP Marketfield Portfolio
Investment and Performance Comparison1 (Unaudited)
Performance data quoted represents past performance. Past performance is no guarantee of future results. Because of market volatility, current performance may be lower or higher than the figures shown. Investment return and principal value will fluctuate, and as a result, when shares are redeemed, they may be worth more or less than their original cost. The performance table and graph do not reflect any deduction of sales charges, mortality and expense charges, contract charges or administrative charges. Please refer to the Performance Summary appropriate for your policy. For performance information current to the most recent month-end, please call 800-598-2019 or visit www.newyorklife.com.
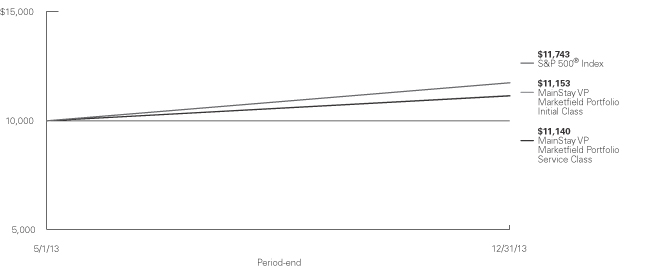
Total Returns for the Period Ended December 31, 2013
| | | | | | |
| Class | | Since Inception (5/1/13) | | Gross Expense Ratio2 | |
| Initial Class Shares | | 11.53% | | | 2.40 | % |
| Service Class Shares | | 11.40 | | | 2.65 | |
| | | | |
| Benchmark Performance | | Since Inception
(5/1/13) | |
S&P 500® Index3 | | | 17.43 | % |
Average Lipper Variable Products Global Flexible Portfolio4 | | | 3.79 | |
| 1. | Performance figures reflect certain fee waivers and/or expense limitations, without which total returns may have been different. For information on current fee waivers and/or expense limitations, please refer to the notes to the financial statements. |
| 2. | The gross expense ratios presented reflect the Portfolio’s “Total Annual Portfolio Operating Expenses” from the most recent Prospectus and may differ from other expense ratios disclosed in this report. |
| 3. | Please refer to pages M-2 and M-3 for additional explanations and disclosure regarding the Portfolios, their benchmark indices and other indices mentioned in the reports. |
| 4. | The Average Lipper Variable Products Global Flexible Portfolio is representative of portfolios that allocate their investments across various asset classes, including both domestic and foreign stocks, bonds and money market instruments, with a focus on total return. At least 25% of their portfolio is invested in securities traded outside of the United States. Lipper Inc. is an independent monitor of fund performance. Results are based on total returns with all dividend and capital gain distributions reinvested. |
| | | | |
| mainstayinvestments.com | | | M-303 | |
Cost in Dollars of a $1,000 Investment in VP Marketfield Portfolio (Unaudited)
The example below is intended to describe the fees and expenses borne by shareholders during the six-month period from July 1, 2013, to December 31, 2013, and the impact of those costs on your investment.
Example
As a shareholder of the Portfolio, you incur two types of costs: (1) transaction costs, including exchange fees and sales charges (loads) on purchases (as applicable), and (2) ongoing costs, including management fees, distribution and/or service (12b-1) fees, and other Portfolio expenses (as applicable). This example is intended to help you understand your ongoing costs (in dollars) of investing in the Portfolio and to compare these costs with the ongoing costs of investing in other Portfolios. The example is based on an investment of $1,000 made at the beginning of the six-month period and held for the entire period from July 1, 2013, to December 31, 2013. Shares are only sold in connection with variable life and annuity contracts and the example does not reflect any contract level or transactional fees or expenses. If these costs had been included, your costs would have been higher.
This example illustrates your Portfolio’s ongoing costs in two ways:
Actual Expenses
The second and third data columns in the table below provide information about actual account values and actual expenses. You may use the information in these columns, together with the amount you invested, to estimate the expenses that you paid during the six months ended
December 31, 2013. Simply divide your account value by $1,000 (for example, an $8,600 account value divided by $1,000 = 8.6), then multiply the result by the number under the heading entitled ‘‘Expenses Paid During Period’’ to estimate the expenses you paid on your account during this period.
Hypothetical Example for Comparison Purposes
The fourth and fifth data columns in the table below provide information about hypothetical account values and hypothetical expenses based on the Portfolio’s actual expense ratio and an assumed rate of return of 5% per year before expenses, which is not the Portfolio’s actual return. The hypothetical account values and expenses may not be used to estimate the actual ending account balances or expenses you paid for the six-month period shown. You may use this information to compare the ongoing costs of investing in the Portfolio with the ongoing costs of investing in other Portfolios. To do so, compare this 5% hypothetical example with the 5% hypothetical examples that appear in the shareholder reports of the other Portfolios.
Please note that the expenses shown in the table are meant to highlight your ongoing costs only and do not reflect any transactional costs, such as exchange fees or sales charges (loads). Therefore, the fourth and fifth data columns of the table are useful in comparing ongoing costs only and will not help you determine the relative total costs of owning different funds. In addition, if these transactional costs were included, your costs would have been higher.
| | | | | | | | | | | | | | | | | | | | |
| | | | | | | | | | | | | | | | |
| Share Class | | Beginning
Account
Value
7/1/13 | | | Ending Account
Value (Based
on Actual
Returns and
Expenses)
12/31/13 | | | Expenses
Paid
During
Period1 | | | Ending Account
Value (Based
on Hypothetical
5% Annualized
Return and
Actual Expenses)
12/31/13 | | | Expenses
Paid
During
Period1 | |
| | | | | |
| Initial Class Shares | | $ | 1,000.00 | | | $ | 1,086.80 | | | $ | 13.15 | | | $ | 1,012.60 | | | $ | 12.68 | |
| | | | | |
| Service Class Shares | | $ | 1,000.00 | | | $ | 1,085.70 | | | $ | 14.51 | | | $ | 1,011.30 | | | $ | 13.99 | |
| 1. | Expenses are equal to the Portfolio’s annualized expense ratio of each class (2.50% for Initial Class and 2.76% for Service Class) multiplied by the average account value over the period, divided by 365 and multiplied by 184 (to reflect the six-month period). The table above represents the actual expenses incurred during the six-month period. |
| | |
| M-304 | | MainStay VP Marketfield Portfolio |
Country Composition as of December 31, 2013 (Unaudited)
| | | | |
| United States | | | 55.3 | % |
| Germany | | | 6.2 | |
| Ireland | | | 4.7 | |
| Japan | | | 4.6 | |
| Italy | | | 4.0 | |
| Spain | | | 3.0 | |
| United Kingdom | | | 3.0 | |
| Switzerland | | | 2.3 | |
| | | | |
| | | | |
| | | | |
| Canada | | | 2.0 | |
| Denmark | | | 0.9 | |
| France | | | 0.9 | |
| Mexico | | | 0.8 | |
| Sweden | | | 0.2 | |
| Other assets, Less Liabilities | | | 40.6 | |
| Investments Sold Short | | | –28.5 | |
| | | | |
| | | 100 | % |
| | | | |
Industry Composition as of December 31, 2013 (Unaudited)
| | | | |
| Commercial Banks | | | 12.6 | % |
| Exchange-Traded Funds | | | 7.2 | |
| Household Durables | | | 5.8 | |
| Construction Materials | | | 5.0 | |
| Metals & Mining | | | 4.8 | |
| Chemicals | | | 4.2 | |
| Machinery | | | 4.1 | |
| Oil, Gas & Consumable Fuels | | | 3.4 | |
| Automobiles | | | 2.7 | |
| Electrical Equipment | | | 2.3 | |
| Energy Equipment & Services | | | 2.2 | |
| Industrial Conglomerates | | | 2.0 | |
| Specialty Retail | | | 2.0 | |
| Trading Companies & Distributors | | | 1.7 | |
| Auto Components | | | 1.6 | |
| Internet Software & Services | | | 1.4 | |
| Real Estate Management & Development | | | 1.2 | |
| Food & Staples Retailing | | | 1.1 | |
| Aerospace & Defense | | | 1.0 | |
| | | | |
| Capital Markets | | | 1.0 | % |
| Consumer Finance | | | 1.0 | |
| IT Services | | | 1.0 | |
| Insurance | | | 1.0 | |
| Semiconductors & Semiconductor Equipment | | | 1.0 | |
| Building Products | | | 0.9 | |
| Diversified Financial Services | | | 0.9 | |
| Internet & Catalog Retail | | | 0.9 | |
| Road & Rail | | | 0.9 | |
| Software | | | 0.9 | |
| Transportation Infrastructure | | | 0.9 | |
| Construction & Engineering | | | 0.7 | |
| Purchased Options | | | 0.7 | |
| Commercial Services & Supplies | | | 0.5 | |
| Real Estate Investment Trusts | | | 0.5 | |
| Investment in Money Market Fund | | | 8.8 | |
| Other Assets, Less Liabilities | | | 40.6 | |
| Investments Sold Short | | | –28.5 | |
| | | | |
| | | 100.0 | % |
| | | | |
See Portfolio of Investments beginning on page M-308 for specific holdings within these categories.
Top Ten Holdings as of December 31, 2013 (excluding short-term investment) (Unaudited)
| 2. | SPDR S&P Regional Banking |
| 3. | iShares MSCI Mexico Investable Market Index Fund |
| 4. | Sumitomo Mitsui Financial Group, Inc. |
| 10. | iShares Dow Jones US Home Construction Index Fund |
Top Five Short Positions as of December 31, 2013 (Unaudited)
| 1. | Vanguard FTSE Emerging Markets |
| 2. | Utilities Select Sector SPDR Fund |
| 4. | iShares JP Morgan USD Emerging Markets Bond |
| | | | |
| mainstayinvestments.com | | | M-305 | |
Portfolio Management Discussion and Analysis (Unaudited)
Answers to the questions reflect the views of portfolio manager Michael C. Aronstein of Marketfield Asset Management LLC, the Portfolio’s Subadvisor.
How did MainStay VP Marketfield Portfolio perform relative to its benchmark and peers from its inception on May 1 through December 31, 2013?
From May 1 through December 31, 2013, MainStay VP Marketfield Portfolio returned 11.53% for Initial Class shares and 11.40% for Service Class shares. Over the same period, both share classes underperformed the 17.43% return of the S&P 500® Index,1 which is the Portfolio’s broad-based securities-market index. Both share classes outperformed the 3.79% return of the average Lipper1 Variable Products Global Flexible Portfolio from May 1 through December 31, 2013.
What factors affected the Portfolio’s relative performance during the reporting period?
The Portfolio takes a top-down investment approach in which the portfolio manager identifies macroeconomic trends and themes, and then determines the most appropriate investment instruments or strategies to express those themes in the Portfolio.
Relative to the S&P 500® Index, the Portfolio’s net long position during the reporting period turned out to be not long enough. However, the Portfolio outperformed most of the relevant alternative indices. The Portfolio’s long Europe and long Capital Spending themes were primary positive drivers of performance. The short safe haven assets and short emerging market themes were the primary themes that pulled performance down.
Which investment themes were the strongest positive contributors to the Portfolio’s relative performance, and which investment themes were particularly weak?
Several of our long themes provided positive contributions to the Portfolio’s performance. (Contributions take weightings and total returns into account.) Our Capital Spending Cycle theme contributed 6.5% to performance. This theme reflects our belief that the combination of the beginning of a broad capital spending cycle and the significant improvement in the global competitiveness of U.S. manufacturing will benefit the U.S. industrial base. Our Europe theme contributed 6.4% to performance. This theme suggests that Europe is broadening its economic recovery that was triggered by the European Central Bank’s 2011 monetary stimulus. Our Consumer Resurgence theme contributed 2.4% to performance. This theme reflects our belief that the balance sheets
of U.S. consumers have been repaired and that consumers are flocking to new retail business models.
Other themes detracted from the Portfolio’s performance. Our short Safe Haven Assets theme detracted from performance by 1.8%. This theme’s rationale is that those assets that investors have considered to be “safe haven” assets are over-owned and overvalued, that interest rates have greater risk to the upside at current historic low yields, and that economic fears are subsiding. Our End of the PC Era theme detracted from performance by 1.2%. This theme reflects our view that the marketplace has become saturated with legacy computers and software and that the new technology era is likely to benefit consumer-driven web-based solutions and service providers. Our short Margin Pressures on Noncyclical Businesses theme detracted from performance by 0.4%. This theme suggests that the Federal Reserve’s continued loose policy, combined with a recovery in the developed world economies, will give rise to pressures on wages and input costs.
During the reporting period, which individual stocks made the strongest positive contributions to the absolute performance of the Portfolio and which individual stocks detracted the most?
From May 1 through December 31, 2013, the strongest individual positive contributors to the Portfolio’s absolute performance were long holdings in Internet software & services company Facebook, Germany-based auto components company Continental A.G. and commercial banking company Bank of Ireland.
Over the same period, the weakest contributions to the Portfolio’s absolute performance came from short holdings in iShares MSCI Emerging Markets ETF, Germany-based insurance company Allianz SE and China-based Internet software & services company Qihoo 360 Technology Co., Ltd.
Did the Portfolio make any significant purchases or sales during the reporting period?
During the reporting period, we initiated long exposure to Japan of 6%, which includes individual equities as well as Tokyo Price Index futures. We increased our long investment in the Bank of Ireland by purchasing Bank of Ireland Trust Preferred Security 10.24%.
| 1. | Please refer to pages M-2 and M-3 for additional explanations and disclosure regarding the Portfolios, their benchmark indices and service providers mentioned in the reports. |
| | |
| M-306 | | MainStay VP Marketfield Portfolio |
During the reporting period, we decreased our short emerging-market bond holding from 5% to 2%, and we covered our equity short holdings in India and Brazil.
How did the Portfolio’s sector weightings change during the reporting period?
Industrials ended May 2013 at 21% of net assets, compared to 15% at the end of December 2013—a decrease of six percentage points. Consumer discretionary ended May 2013 at 11% of net assets, a figure that was unchanged at the end of December 2013. Materials ended May 2013 at 13% of net assets, compared to 14.2% at the end of December 2013—an
increase of 1.2 percentage points. Energy ended May 2013 at 3% compared to 5.6% at the end of December 2013—an increase of 2.6 percentage points. Financials ended May 2013 at 9.2% compared to 9.8% at the end of December 2013—an increase of 0.6 percentage points.
How was the Portfolio positioned at the end of the reporting period?
As of December 31, 2013, the equity portion of the Portfolio was 78% long and 30% short. The net equity exposure was long 48%.3 As of the same date, the futures portion of the Fund was 2% long and 14% short. The net futures exposure was short 12%.
| 3. | See the Portfolio of Investments on page M-308 for information on specific holdings. |
The opinions expressed are those of the portfolio manager as of the date of this report and are subject to change. There is no guarantee that any forecasts made will come to pass. This material does not constitute investment advice and is not intended as an endorsement of any specific investment.
Not all MainStay VP Portfolios and/or share classes are available under all policies.
| | | | |
| mainstayinvestments.com | | | M-307 | |
Portfolio of Investments December 31, 2013
| | | | | | | | |
| | |
Shares | | | Value | |
| | | | | | | | |
| Common Stocks 69.6% † | |
Aerospace & Defense 1.0% | |
Precision Castparts Corp. (a) | | | 12,192 | | | $ | 3,283,306 | |
| | | | | | | | |
|
Auto Components 1.6% | |
¨Continental A.G. | | | 19,736 | | | | 4,327,838 | |
ElringKlinger A.G. | | | 29,101 | | | | 1,183,812 | |
| | | | | | | | |
| | | | | | | 5,511,650 | |
| | | | | | | | |
Automobiles 2.7% | |
Daimler A.G. | | | 40,328 | | | | 3,489,642 | |
Fiat Industrial S.p.A. (b) | | | 396,087 | | | | 3,239,410 | |
Ford Motor Co. | | | 173,370 | | | | 2,675,099 | |
| | | | | | | | |
| | | | | | | 9,404,151 | |
| | | | | | | | |
Building Products 0.9% | |
Geberit A.G. | | | 10,672 | | | | 3,236,115 | |
| | | | | | | | |
|
Capital Markets 1.0% | |
Daiwa Securities Group, Inc. | | | 327,766 | | | | 3,268,012 | |
| | | | | | | | |
|
Chemicals 3.8% | |
Air Liquide S.A. | | | 22,868 | | | | 3,234,036 | |
¨BASF S.E. Corp. | | | 39,045 | | | | 4,162,312 | |
Potash Corporation of Saskatchewan, Inc. | | | 101,673 | | | | 3,351,142 | |
Sherwin-Williams Co. (The) (a) | | | 13,099 | | | | 2,403,666 | |
| | | | | | | | |
| | | | | | | 13,151,156 | |
| | | | | | | | |
Commercial Banks 11.4% | |
Banco Bilbao Vizcaya Argentaria S.A. | | | 299,724 | | | | 3,689,530 | |
¨Bank of Ireland (b) | | | 19,713,694 | | | | 6,834,269 | |
Barclays PLC | | | 730,189 | | | | 3,288,301 | |
BB&T Corp. (a) | | | 88,635 | | | | 3,307,858 | |
CIT Group, Inc. (a) | | | 63,971 | | | | 3,334,808 | |
Fifth Third Bancorp (a) | | | 155,780 | | | | 3,276,054 | |
Grupo Financiero Banorte S.A.B. de C.V. Class O | | | 395,844 | | | | 2,769,225 | |
Lloyds Banking Group PLC (b) | | | 2,741,826 | | | | 3,581,410 | |
¨Sumitomo Mitsui Financial Group, Inc. | | | 95,978 | | | | 4,939,709 | |
UniCredit S.p.A. | | | 523,595 | | | | 3,875,264 | |
| | | | | | | | |
| | | | | | | 38,896,428 | |
| | | | | | | | |
Commercial Services & Supplies 0.5% | |
Bilfinger S.E. | | | 15,529 | | | | 1,741,745 | |
| | | | | | | | |
|
Construction & Engineering 0.7% | |
KBR, Inc. | | | 80,528 | | | | 2,568,038 | |
| | | | | | | | |
| | | | | | | | |
| | |
Shares | | | Value | |
| | | | | | | | |
Construction Materials 5.0% | |
Buzzi Unicem S.p.A. | | | 181,937 | | | $ | 3,281,310 | |
CRH PLC | | | 135,395 | | | | 3,414,678 | |
Eagle Materials, Inc. (a) | | | 45,020 | | | | 3,485,898 | |
HeidelbergCement A.G. | | | 39,297 | | | | 2,981,456 | |
Taiheiyo Cement Corp. | | | 1,008,443 | | | | 3,868,683 | |
| | | | | | | | |
| | | | | | | 17,032,025 | |
| | | | | | | | |
Consumer Finance 1.0% | |
Discover Financial Services (a) | | | 60,534 | | | | 3,386,877 | |
| | | | | | | | |
|
Diversified Financial Services 0.9% | |
CME Group, Inc. | | | 39,056 | | | | 3,064,334 | |
| | | | | | | | |
|
Electrical Equipment 2.3% | |
¨ABB, Ltd. (b) | | | 169,886 | | | | 4,471,637 | |
Emerson Electric Co. (a) | | | 47,051 | | | | 3,302,039 | |
| | | | | | | | |
| | | | | | | 7,773,676 | |
| | | | | | | | |
Energy Equipment & Services 2.2% | |
Baker Hughes, Inc. | | | 60,078 | | | | 3,319,910 | |
Schlumberger, Ltd. (a) | | | 45,808 | | | | 4,127,759 | |
| | | | | | | | |
| | | | | | | 7,447,669 | |
| | | | | | | | |
Food & Staples Retailing 1.1% | |
Costco Wholesale Corp. (a) | | | 32,542 | | | | 3,872,823 | |
| | | | | | | | |
|
Household Durables 5.8% | |
D.R. Horton, Inc. (a) | | | 155,560 | | | | 3,472,099 | |
Mohawk Industries, Inc. (a)(b) | | | 22,888 | | | | 3,408,023 | |
PulteGroup, Inc. (a) | | | 173,567 | | | | 3,535,560 | |
Ryland Group, Inc. (The) (a) | | | 56,939 | | | | 2,471,722 | |
Sekisui House, Ltd. | | | 251,814 | | | | 3,515,018 | |
Toll Brothers, Inc. (a)(b) | | | 91,382 | | | | 3,381,134 | |
| | | | | | | | |
| | | | | | | 19,783,556 | |
| | | | | | | | |
Industrial Conglomerates 2.0% | |
3M Co. (a) | | | 23,915 | | | | 3,354,079 | |
General Electric Co. (a) | | | 119,629 | | | | 3,353,201 | |
| | | | | | | | |
| | | | | | | 6,707,280 | |
| | | | | | | | |
Insurance 1.0% | |
Assicurazioni Generali S.p.A. | | | 142,301 | | | | 3,347,554 | |
| | | | | | | | |
|
Internet & Catalog Retail 0.9% | |
Amazon.com, Inc. (a)(b) | | | 8,012 | | | | 3,195,105 | |
| | | | | | | | |
|
Internet Software & Services 1.4% | |
¨Facebook, Inc. Class A (a)(b) | | | 86,818 | | | | 4,745,472 | |
| | | | | | | | |
| † | Percentages indicated are based on Portfolio net assets. |
| ¨ | | Among the Portfolio’s 10 largest holdings, as of December 31, 2013, excluding short-term investment. May be subject to change daily. |
| | | | |
| M-308 | | MainStay VP Marketfield Portfolio | | The notes to the financial statements are an integral part of,
and should be read in conjunction with, the financial statements. |
| | | | | | | | |
| | |
Shares | | | Value | |
| | | | | | | | |
| Common Stocks (continued) | |
IT Services 1.0% | |
Amadeus IT Holding S.A. Class A | | | 79,008 | | | $ | 3,380,841 | |
| | | | | | | | |
|
Machinery 4.1% | |
Cummins, Inc. (a) | | | 23,555 | | | | 3,320,548 | |
Deere & Co. (a) | | | 36,245 | | | | 3,310,256 | |
Ingersoll-Rand PLC (a) | | | 52,626 | | | | 3,241,762 | |
Joy Global, Inc. | | | 58,983 | | | | 3,449,916 | |
Scania AB Class B | | | 41,006 | | | | 802,670 | |
| | | | | | | | |
| | | | | | | 14,125,152 | |
| | | | | | | | |
Metals & Mining 4.8% | |
¨Alcoa, Inc. (a) | | | 392,570 | | | | 4,173,019 | |
Freeport-McMoRan Copper & Gold, Inc. (a) | | | 102,687 | | | | 3,875,407 | |
Steel Dynamics, Inc. (a) | | | 176,092 | | | | 3,440,838 | |
Teck Resources, Ltd. Class B (a) | | | 131,404 | | | | 3,417,818 | |
Walter Energy, Inc. | | | 85,669 | | | | 1,424,676 | |
| | | | | | | | |
| | | | | | | 16,331,758 | |
| | | | | | | | |
Oil, Gas & Consumable Fuels 3.4% | |
Alpha Natural Resources, Inc. (a)(b) | | | 189,900 | | | | 1,355,886 | |
Apache Corp. (a) | | | 39,660 | | | | 3,408,380 | |
Chesapeake Energy Corp. (a) | | | 130,257 | | | | 3,535,175 | |
Devon Energy Corp. | | | 52,953 | | | | 3,276,202 | |
| | | | | | | | |
| | | | | | | 11,575,643 | |
| | | | | | | | |
Real Estate Investment Trusts 0.5% | |
Green REIT PLC (b) | | | 302,285 | | | | 599,660 | |
Hibernia REIT PLC (b) | | | 611,375 | | | | 984,050 | |
| | | | | | | | |
| | | | | | | 1,583,710 | |
| | | | | | | | |
Real Estate Management & Development 1.2% | |
Deutsche Wohnen A.G. | | | 99,162 | | | | 1,914,614 | |
St. Joe Co. (The) (b) | | | 106,140 | | | | 2,036,827 | |
| | | | | | | | |
| | | | | | | 3,951,441 | |
| | | | | | | | |
Road & Rail 0.9% | |
DSV A/S | | | 96,687 | | | | 3,170,153 | |
| | | | | | | | |
|
Semiconductors & Semiconductor Equipment 1.0% | |
Intel Corp. (a) | | | 129,359 | | | | 3,358,160 | |
| | | | | | | | |
|
Software 0.9% | |
Splunk, Inc. (a)(b) | | | 46,482 | | | | 3,191,919 | |
| | | | | | | | |
|
Specialty Retail 2.0% | |
Home Depot, Inc. (The) (a) | | | 40,670 | | | | 3,348,768 | |
Tractor Supply Co. | | | 43,012 | | | | 3,336,871 | |
| | | | | | | | |
| | | | | | | 6,685,639 | |
| | | | | | | | |
Trading Companies & Distributors 1.7% | |
Beacon Roofing Supply, Inc. (a)(b) | | | 61,526 | | | | 2,478,267 | |
| | | | | | | | |
| | |
Shares | | | Value | |
| | | | | | | | |
Trading Companies & Distributors (continued) | |
Wolseley PLC | | | 58,243 | | | $ | 3,303,327 | |
| | | | | | | | |
| | | | | | | 5,781,594 | |
| | | | | | | | |
Transportation Infrastructure 0.9% | |
Abertis Infraestructuras S.A. | | | 142,344 | | | | 3,162,534 | |
| | | | | | | | |
Total Common Stocks
(Cost $212,014,816) | | | | | | | 237,715,516 | |
| | | | | | | | |
|
| Exchange-Traded Funds 7.2% (d) | |
¨iShares Dow Jones US Home Construction Index Fund (a) | | | 167,101 | | | | 4,150,789 | |
iShares MSCI Italy Index Fund | | | 227,039 | | | | 3,539,538 | |
iShares MSCI Japan Index Fund | | | 263,678 | | | | 3,198,414 | |
¨iShares MSCI Mexico Investable Market Index Fund (a) | | | 73,218 | | | | 4,978,824 | |
SPDR S&P Homebuilders (a) | | | 100,872 | | | | 3,359,038 | |
¨SPDR S&P Regional Banking (a) | | | 130,495 | | | | 5,299,402 | |
| | | | | | | | |
Total Exchange-Traded Funds
(Cost $22,498,233) | | | | | | | 24,526,005 | |
| | | | | | | | |
|
| Preferred Stocks 1.6% | |
Chemicals 0.4% | |
Fuchs Petrolub SE 1.81% | | | 14,401 | | | | 1,407,405 | |
| | | | | | | | |
Commercial Banks 1.2% | | | | | | | | |
¨Bank of Ireland Trust-Preferred
Security 10.24% (c) | | | 2,880,000 | | | | 4,172,001 | |
| | | | | | | | |
Total Preferred Stocks
(Cost $5,322,281) | | | | | | | 5,579,406 | |
| | | | | | | | |
| | |
| | | | | | | | |
| | | Notional
Amount | | | | |
| Purchased Options 0.7% | |
Purchased Call Options 0.4% | |
CNY/USD | | | | | | | | |
Strike Price $6.321
Expires 6/9/14 | | | 13,500,000 | | | | 8,559 | |
Strike Price $6.722
Expires 12/9/14 | | | 13,500,000 | | | | 12,919 | |
| | | | | | | | |
| | | Number of
Contracts | | | | |
iShares Russell 2000 Index ETF | | | | | | | | |
Strike Price $111.00
Expires 1/18/14 | | | 1,218 | | | | 593,166 | |
Strike Price $112.00
Expires 1/18/14 | | | 1,566 | | | | 601,344 | |
Vanguard FTSE Emerging Markets
Strike Price $43.00
Expires 1/18/14 | | | 3,474 | | | | 34,740 | |
| | | | | | | | |
Total Purchased Call Options
(Cost $1,092,581) | | | | | | | 1,250,728 | |
| | | | | | | | |
| | | | | | |
The notes to the financial statements are an integral part of,
and should be read in conjunction with, the financial statements. | | mainstayinvestments.com | | | M-309 | |
Portfolio of Investments December 31, 2013 (continued)
| | | | | | | | |
| | | Notional
Amount | | | Value | |
| | | | | | | | |
| Purchased Options (continued) | |
Purchased Put Options 0.3% | |
EUR/USD
Strike Price $1.367
Expires 4/16/14 | | | 13,614,132 | | | $ | 258,535 | |
30 Year United States Treasury Bond
Futures Strike Price $129.00
Expires 1/24/14 | | | 497 | | | | 698,906 | |
iShares China Large Cap ETF
Strike Price $37.00
Expires 1/18/14 | | | 1.520 | | | | 33,440 | |
iShares MSCI Emerging Markets
Strike Price $41.00
Expires 1/18/14 | | | 3,873 | | | | 139,428 | |
| | | | | | | | |
Total Purchased Put Options
(Cost $1,839,878) | | | | | | | 1,130,309 | |
| | | | | | | | |
Total Purchased Options
(Cost $2,932,459) | | | | | | | 2,381,037 | |
| | | | | | | | |
| | |
| | | | | | | | |
| | |
Shares | | | | |
| Short-Term Investment 8.8% | |
Money Market Fund 8.8% | |
State Street Institutional Treasury Money Market Fund | | | 30,000,000 | | | | 30,000,000 | |
| | | | | | | | |
Total Short-Term Investment
(Cost $30,000,000) | | | | | | | 30,000,000 | |
| | | | | | | | |
Total Investments,
Before Investments Sold Short
(Cost $272,767,789) (h) | �� | | 87.9 | % | | | 300,201,964 | |
| | | | | | | | |
|
| Common Stocks Sold Short (16.6%) | |
Beverages (1.2%) | |
Coca-Cola Co. (The) | | | (97,035 | ) | | | (4,008,516 | ) |
| | | | | | | | |
|
Capital Markets (3.2%) | |
Aberdeen Asset Management PLC | | | (436,675 | ) | | | (3,615,560 | ) |
Franklin Resources, Inc. | | | (54,097 | ) | | | (3,123,020 | ) |
Invesco, Ltd. | | | (83,209 | ) | | | (3,028,807 | ) |
Legg Mason, Inc. | | | (30,264 | ) | | | (1,315,879 | ) |
| | | | | | | | |
| | | | | | | (11,083,266 | ) |
| | | | | | | | |
Diversified Financial Services (1.5%) | |
JPMorgan Chase & Co. | | | (88,052 | ) | | | (5,149,281 | ) |
| | | | | | | | |
|
Food Products (3.2%) | |
Danone | | | (55,997 | ) | | | (4,030,473 | ) |
Kellogg Co. | | | (60,841 | ) | | | (3,715,560 | ) |
Nestle S.A. | | | (45,457 | ) | | | (3,327,551 | ) |
| | | | | | | | |
| | | | | | | (11,073,584 | ) |
| | | | | | | | |
| | | | | | | | |
| | |
Shares | | | Value | |
| | | | | | | | |
Hotels, Restaurants & Leisure (1.2%) | |
McDonald’s Corp. | | | (40,365 | ) | | $ | (3,916,616 | ) |
| | | | | | | | |
|
Insurance (2.4%) | |
Allianz SE | | | (45,629 | ) | | | (8,182,302 | ) |
| | | | | | | | |
|
IT Services (1.0%) | |
International Business Machines Corp. | | | (17,242 | ) | | | (3,234,082 | ) |
| | | | | | | | |
|
Multiline Retail (1.1%) | |
Target Corp. | | | (61,142 | ) | | | (3,868,454 | ) |
| | | | | | | | |
|
Software (1.8%) | |
Microsoft Corp. | | | (56,992 | ) | | | (2,133,211 | ) |
Oracle Corp. | | | (38,750 | ) | | | (1,482,575 | ) |
SAP A.G., Sponsored ADR | | | (29,385 | ) | | | (2,560,609 | ) |
| | | | | | | | |
| | | | | | | (6,176,395 | ) |
| | | | | | | | |
Total Common Stocks Sold Short
(Proceeds $52,138,877) | | | | | | | (56,692,496 | ) |
| | | | | | | | |
|
| Exchange-Traded Funds Sold Short (11.9%)(d) | |
iShares iBoxx Investment Grade Corporate Bond | | | (13,140 | ) | | | (1,500,720 | ) |
iShares JP Morgan USD Emerging Markets Bond | | | (48,988 | ) | | | (5,298,542 | ) |
Market Vectors Emerging Markets Local Currency Bond | | | (13,014 | ) | | | (306,480 | ) |
Utilities Select Sector SPDR Fund | | | (246,182 | ) | | | (9,347,530 | ) |
Vanguard FTSE Emerging Markets | | | (583,585 | ) | | | (24,008,687 | ) |
| | | | | | | | |
Total Exchange-Traded Funds Sold Short
(Cost $40,919,021) | | | | | | | (40,461,959 | ) |
| | | | | | | | |
Total Investments Sold Short
(Proceeds $93,057,898) (e) | | | (28.5 | )% | | | (97,154,455 | ) |
| | | | | | | | |
Total Investments,
Net of Investments Sold Short
(Cost $179,709,891) | | | 59.4 | | | | 203,047,509 | |
Other Assets, Less Liabilities | | | 40.6 | | | | 138,531,594 | |
Net Assets | | | 100.0 | % | | $ | 341,579,103 | |
| | |
| | | | | | | | |
| | | Contracts
Long | | | Unrealized
Appreciation
(Depreciation) (g) | |
| Futures Contracts 0.1% | |
Topix Index March 2014 (f) | | | 50 | | | $ | 238,250 | |
| | | | | | | | |
Total Futures Contracts Long
(Notional Amount $651,250,000) | | | | | | | 238,250 | |
| | | | | | | | |
| | | | |
| M-310 | | MainStay VP Marketfield Portfolio | | The notes to the financial statements are an integral part of,
and should be read in conjunction with, the financial statements. |
| | | | | | | | |
| | | Contracts
Short | | | Unrealized
Appreciation
(Depreciation) (g) | |
| | | | | | | | |
| Futures Contracts (continued) | |
CAC 40 Index10 Euro
January 2014 (f) | | | (110 | ) | | $ | (287,460 | ) |
Euro-Bund
March 2014 (f) | | | (95 | ) | | | 280,977 | |
Euro-OAT
March 2014 (f) | | | (100 | ) | | | 117,561 | |
United States Treasury Bond March 2014 (f) | | | (34 | ) | | | 93,635 | |
| | | | | | | | |
Total Futures Contracts Short
(Notional Amount $35,456,125) | | | | | | | 204,713 | |
| | | | | | | | |
Total Futures Contracts
(Notional Amount $615,793,875) | | | | | | $ | 442,963 | |
| | | | | | | | |
| (a) | Security, or a portion thereof, is maintained in a segregated account at the Portfolio’s custodian as collateral for securities sold short (See Note 2(M)). |
| (b) | Non-income producing security. |
| (c) | May be sold to institutional investors only under Rule 144A or securities offered pursuant to Section 4(a)(2) of the Securities Act of 1933, as amended. |
| (d) | Exchange-Traded Fund—An investment vehicle that represents a basket of securities that is traded on an exchange. |
| (e) | As of December 31, 2013, cash in the amount of $129,939,019 is on deposit with broker for short sale transactions. |
| (f) | As of December 31, 2013, cash in the amount of $932,445 is on deposit with broker for futures transactions. |
| (g) | Represents the difference between the value of the contracts at the time they were opened and the value as of December 31, 2013. |
| (h) | As of December 31, 2013, cost is $273,262,402 for federal income tax purposes and net unrealized appreciation is as follows: |
| | | | |
Gross unrealized appreciation | | $ | 28,806,150 | |
Gross unrealized depreciation | | | (1,866,588 | ) |
| | | | |
Net unrealized appreciation | | $ | 26,939,562 | |
| | | | |
The following abbreviations are used in the above Portfolio:
ADR—American Depositary Receipt
CNY—Chinese Yuan
EUR—Euro
ETF—Exchange-Traded Fund
SPDR—Standard & Poor’s Depositary Receipt
USD—United States Dollar
Swap Contracts
OTC credit default swap contracts as of December 31, 2013 were as follows:
| | | | | | | | | | | | | | | | | | | | | | | | | | | | | | | | |
Reference Entity | | Counterparty | | | Termination
Date | | | Buy/Sell
Protection1 | | | Notional
Amount
(000)2 | | | (Pay)/Receive
Fixed Rate3 | | | Upfront Premiums
Received/(Paid) | | | Value | | | Unrealized
Appreciation/
Depreciation4 | |
Federal Republic of Brazil | | | | | | | | | | | | | | | | | | | | | | | | | | | | | | | | |
12.25%, due 3/6/30 | | | Citigroup | | | | 3/20/2019 | | | | Buy | | | $ | 16,253 | | | | 1.00 | % | | $ | (727,165 | ) | | $ | 722,529 | | | $ | (4,636 | ) |
| Republic of South Africa | | | | | | | | | | | | | | | | | | | | | | | | | | | | | | | | |
5.50%, due 3/9/20 | | | Citigroup | | | | 3/20/2019 | | | | Buy | | | $ | 4,063 | | | | 1.00 | % | | $ | (207,506 | ) | | $ | 201,632 | | | $ | (5,874 | ) |
| | | | | | | | | | | | | | | | | | | | | | | | | | | $ | 924,161 | | | $ | (10,510 | ) |
| 1. | Buy—Portfolio pays premium and buys credit protection. If a credit event occurs, as defined under the terms of that particular swap agreement, the Portfolio will either (i) receive from the seller of protection an amount equal to the notional amount of the swap and deliver the referenced obligation or underlying securities comprising the referenced index or (ii) receive a net settlement amount in the form of cash or securities equal to the notional amount of the swap less the recovery value of the referenced obligation or underlying securities comprising the referenced index. Sell—Portfolio receives premium and sells credit protection. If a credit event occurs, as defined under the terms of that particular swap agreement, the Portfolio will either (i) pay to the buyer of protection an amount equal to the notional amount of the swap and take delivery of the referenced obligation or underlying securities comprising the referenced index or (ii) pay a net settlement amount in the form of cash or securities equal to the notional amount of the swap less the recovery value of the referenced obligation or underlying securities comprising the referenced index. |
| 2. | The maximum potential amount the Portfolio could be required to pay as a seller of credit protection or receive as a buyer of credit protection if a credit event occurs as defined under the terms of that particular swap contract. |
| 3. | The annual fixed rate represents the interest received by the Portfolio (as a seller of protection) or paid by the Portfolio (as a buyer of protection) annually on the notional amount of the credit default swap contract. |
| 4. | Represents the difference between the value of the credit default swap contract at the time they were opened and the value at December 31, 2013. |
| | | | | | |
The notes to the financial statements are an integral part of,
and should be read in conjunction with, the financial statements. | | mainstayinvestments.com | | | M-311 | |
Portfolio of Investments December 31, 2013 (continued)
The following is a summary of the fair valuations according to the inputs used as of December 31, 2013, for valuing the Fund’s assets and liabilities.
Asset Valuation Inputs
| | | | | | | | | | | | | | | | |
Description | | Quoted Prices
in Active Markets
for Identical Assets
(Level 1) | | | Significant Other
Observable Inputs (Level 2) | | | Significant
Unobservable
Inputs
(Level 3) | | | Total | |
| Investments in Securities (a) | | | | | | | | | | | | | | | | |
| Common Stocks | | $ | 237,715,516 | | | $ | — | | | $ | — | | | $ | 237,715,516 | |
| Exchange-Traded Funds | | | 24,526,005 | | | | — | | | | — | | | | 24,526,005 | |
| Preferred Stocks | | | 1,407,405 | | | | 4,172,001 | | | | — | | | | 5,579,406 | |
| Short-Term Investment | | | | | | | | | | | | | | | | |
Money Market Fund | | | 30,000,000 | | | | — | | | | — | | | | 30,000,000 | |
| | | | | | | | | | | | | | | | |
| Total Investments in Securities | | | 293,648,926 | | | | 4,172,001 | | | | — | | | | 297,820,927 | |
| | | | | | | | | | | | | | | | |
| Other Financial Instruments | | | | | | | | | | | | | | | | |
Futures Contracts Long (b) | | | 238,250 | | | | — | | | | — | | | | 238,250 | |
Futures Contracts Short (b) | | | 492,173 | | | | — | | | | — | | | | 492,173 | |
Purchased Call Options | | | 1,250,728 | | | | — | | | | — | | | | 1,250,728 | |
Purchased Put Options | | | 1,130,309 | | | | — | | | | — | | | | 1,130,309 | |
| | | | | | | | | | | | | | | | |
| Total Other Financial Instruments | | | 3,111,460 | | | | — | | | | — | | | | 3,111,460 | |
| | | | | | | | | | | | | | | | |
| Total Investments in Securities and Other Financial Instruments | | $ | 296,760,386 | | | $ | 4,172,001 | | | $ | — | | | $ | 300,932,387 | |
| | | | | | | | | | | | | | | | |
Liability Valuation Inputs
| | | | | | | | | | | | | | | | |
Description | | Quoted Prices
in Active Markets
for Identical Assets
(Level 1) | | | Significant Other
Observable Inputs
(Level 2) | | | Significant
Unobservable
Inputs
(Level 3) | | | Total | |
| Investments in Securities Sold Short (a) | | | | | | | | | | | | | | | | |
| Common Stocks Sold Short | | $ | (56,692,496 | ) | | $ | — | | | $ | — | | | $ | (56,692,496 | ) |
| Exchange-Traded Funds Sold Short | | | (40,461,959 | ) | | | — | | | | — | | | | (40,461,959 | ) |
| | | | | | | | | | | | | | | | |
| Total Investments in Securities Sold Short | | | (97,154,455 | ) | | | — | | | | — | | | | (97,154,455 | ) |
| | | | | | | | | | | | | | | | |
| Other Financial Instruments | | | | | | | | | | | | | | | | |
Futures Contracts Short (b) | | | (287,460 | ) | | | — | | | | — | | | | (287,460 | ) |
Credit Default Swap Contracts (b) | | | — | | | | (10,510 | ) | | | — | | | | (10,510 | ) |
| | | | | | | | | | | | | | | | |
| Total Other Financial Instruments | | | (287,460 | ) | | | (10,510 | ) | | | — | | | | (297,970 | ) |
| | | | | | | | | | | | | | | | |
Total Investments in Securities Sold Short and Other Financial Instruments | | $ | (97,441,915 | ) | | $ | (10,510 | ) | | $ | — | | | $ | (97,452,425 | ) |
| | | | | | | | | | | | | | | | |
| (a) | For a complete listing of investments and their industries, see the Portfolio of Investments. |
| (b) | The value listed for these securities reflects unrealized appreciation (depreciation) as shown on the Portfolio of Investments. |
The Portfolio recognizes transfers between the levels as of the beginning of the period.
For the period ended December 31, 2013, the Portfolio did not have any transfers between Level 1 and Level 2 fair value measurements. (See Note 2)
As of December 31, 2013, the Portfolio did not hold any investments with significant unobservable inputs (Level 3). (See Note 2)
| | | | |
| M-312 | | MainStay VP Marketfield Portfolio | | The notes to the financial statements are an integral part of,
and should be read in conjunction with, the financial statements. |
Statement of Assets and Liabilities as of December 31, 2013
| | | | |
| Assets | |
Investment in securities, at value (identified cost $272,767,789) | | $ | 300,201,964 | |
Cash collateral on deposit at broker | | | 130,746,490 | |
Cash | | | 16,602,168 | |
Cash denominated in foreign currencies (identified cost $2,063,375) | | | 2,059,172 | |
Receivables: | | | | |
Investment securities sold | | | 1,013,757 | |
Fund shares sold | | | 679,151 | |
Dividends and interest | | | 623,381 | |
Premiums paid for swap contracts | | | 934,671 | |
| | | | |
Total assets | | | 452,860,754 | |
| | | | |
| |
| Liabilities | | | | |
Investments sold short (proceeds $93,057,898) | | | 97,154,455 | |
Payables: | | | | |
Investment securities purchased | | | 13,370,764 | |
Manager (See Note 3) | | | 379,671 | |
Dividends on investments sold short | | | 130,286 | |
Fund shares redeemed | | | 61,891 | |
Professional fees | | | 49,472 | |
NYLIFE Distributors (See Note 3) | | | 49,407 | |
Broker fees and charges on short sales | | | 29,269 | |
Custodian | | | 21,163 | |
Variation margin on futures contracts | | | 12,672 | |
Shareholder communication | | | 11,586 | |
Trustees | | | 48 | |
Accrued expenses | | | 457 | |
Unrealized depreciation on swap contracts | | | 10,510 | |
| | | | |
Total liabilities | | | 111,281,651 | |
| | | | |
Net assets | | $ | 341,579,103 | |
| | | | |
| |
| Composition of Net Assets | | | | |
Shares of beneficial interest outstanding (par value of $.001 per share) unlimited number of shares authorized | | $ | 30,660 | |
Additional paid-in capital | | | 321,835,129 | |
| | | | |
| | | 321,865,789 | |
Net investment loss | | | (278,160 | ) |
Accumulated net realized gain (loss) on investments, investments sold short, futures transactions, written options, swap transactions and foreign currency transactions | | | (3,776,365 | ) |
Net unrealized appreciation (depreciation) on investments, futures contracts and swap contracts | | | 27,866,628 | |
Net unrealized appreciation (depreciation) on investments sold short | | | (4,096,557 | ) |
Net unrealized appreciation (depreciation) on translation of other assets and liabilities in foreign currencies | | | (2,232 | ) |
| | | | |
Net assets | | $ | 341,579,103 | |
| | | | |
| | | | |
Initial Class | | | | |
Net assets applicable to outstanding shares | | $ | 88,556,748 | |
| | | | |
Shares of beneficial interest outstanding | | | 7,942,580 | |
| | | | |
Net asset value per share outstanding | | $ | 11.15 | |
| | | | |
Service Class | | | | |
Net assets applicable to outstanding shares | | $ | 253,022,355 | |
| | | | |
Shares of beneficial interest outstanding | | | 22,716,972 | |
| | | | |
Net asset value per share outstanding | | $ | 11.14 | |
| | | | |
| | | | | | |
The notes to the financial statements are an integral part of,
and should be read in conjunction with, the financial statements. | | mainstayinvestments.com | | | M-313 | |
Statement of Operations
for the period May 1, 2013 (inception date) through December 31, 2013
| | | | |
| Investment Income (Loss) | |
Income | | | | |
Dividends (a) | | $ | 1,510,313 | |
Interest | | | 22,369 | |
| | | | |
Total income | | | 1,532,682 | |
| | | | |
Expenses | | | | |
Manager (See Note 3) | | | 1,699,338 | |
Dividends on investments sold short | | | 978,562 | |
Broker fees and charges on short sales | | | 287,499 | |
Distribution/Service—Service Class (See Note 3) | | | 166,759 | |
Professional fees | | | 65,463 | |
Custodian | | | 53,707 | |
Shareholder communication | | | 23,373 | |
Offering (See Note 2) | | | 17,639 | |
Trustees | | | 1,579 | |
Miscellaneous | | | 11,690 | |
| | | | |
Total expenses | | | 3,305,609 | |
| | | | |
Net investment income (loss) | | | (1,772,927 | ) |
| | | | |
|
| Realized and Unrealized Gain (Loss) on Investments, Futures Contracts, Written Options, Swap Contracts and Foreign Currency Transactions | |
Net realized gain (loss) on: | | | | |
Security transactions | | | (2,270,912 | ) |
Investments sold short | | | (1,072,846 | ) |
Futures transactions | | | (265,328 | ) |
Written option transactions | | | (91,548 | ) |
Swap transactions | | | (219,340 | ) |
Foreign currency transactions | | | 17,851 | |
| | | | |
Net realized gain (loss) on investments, investments sold short, futures transactions, written option transactions, swap transactions and foreign currency transactions | | | (3,902,123 | ) |
| | | | |
Net change in unrealized appreciation (depreciation) on: | | | | |
Investments | | | 27,434,175 | |
Investments sold short | | | (4,096,557 | ) |
Futures contracts | | | 442,963 | |
Swap contracts | | | (10,510 | ) |
Translation of other assets and liabilities in foreign currencies | | | (2,232 | ) |
| | | | |
Net change in unrealized appreciation (depreciation) on investments, investments sold short, futures contracts, swap contracts and foreign currency transactions | | | 23,767,839 | |
| | | | |
Net realized and unrealized gain (loss) on investments, investments sold short, futures transactions, written options, swap transactions and foreign currency transactions | | | 19,865,716 | |
| | | | |
Net increase (decrease) in net assets resulting from operations | | $ | 18,092,789 | |
| | | | |
| (a) | Dividends recorded net of foreign withholding taxes in the amount of $43,955. |
| | | | |
| M-314 | | MainStay VP Marketfield Portfolio | | The notes to the financial statements are an integral part of,
and should be read in conjunction with, the financial statements. |
Statements of Changes in Net Assets
for the period May 1, 2013 (inception date) through December 31, 2013
| | | | |
| | | 2013 | |
| Increase (Decrease) in Net Assets | |
Operations: | | | | |
Net investment income (loss) | | $ | (1,772,927 | ) |
Net realized gain (loss) on investments, investments sold short, futures transactions, written option transactions, swap transactions and foreign currency transactions | | | (3,902,123 | ) |
Net change in unrealized appreciation (depreciation) on investments, investments sold short, futures contracts, swap contracts and foreign currency transactions | | | 23,767,839 | |
| | | | |
Net increase (decrease) in net assets resulting from operations | | | 18,092,789 | |
| | | | |
Capital share transactions: | | | | |
Net proceeds from sale of shares | | | 326,743,061 | |
Cost of shares redeemed | | | (3,256,747 | ) |
| | | | |
Increase (decrease) in net assets derived from capital share transactions | | | 323,486,314 | |
| | | | |
Net increase (decrease) in net assets | | | 341,579,103 | |
|
| Net Assets | |
Beginning of period | | | — | |
| | | | |
End of period | | $ | 341,579,103 | |
| | | | |
Net investment loss at end of period | | $ | (278,160 | ) |
| | | | |
| | | | | | |
The notes to the financial statements are an integral part of,
and should be read in conjunction with, the financial statements. | | mainstayinvestments.com | | | M-315 | |
Financial Highlights selected per share data and ratios
| | | | |
| | | Initial Class | |
| | | May 1, 2013**
through
December 31, | |
| | | 2013 | |
Net asset value at beginning of period | | $ | 10.00 | |
| | | | |
Net investment income (loss) | | | (0.10 | )(a) |
Net realized and unrealized gain (loss) on investments | | | 1.25 | |
| | | | |
Total from investment operations | | | 1.15 | |
| | | | |
Net asset value at end of period | | $ | 11.15 | |
| | | | |
Total investment return | | | 11.50 | %(b)(c) |
Ratios (to average net assets)/Supplemental Data: | | | | |
Net investment income (loss) | | | (1.35 | %)†† |
Net expenses (excluding short sale expenses) | | | 1.54 | % †† |
Expenses (including short sales expenses, before waiver/reimbursement) | | | 2.64 | % †† |
Short sale expenses | | | 1.10 | % †† |
Portfolio turnover rate | | | 18 | % |
Net assets at end of period (in 000’s) | | $ | 88,557 | |
| (a) | Per share data based on average shares outstanding during the period. |
| (b) | Total investment return is not annualized. |
| (c) | Total investment returns may reflect adjustments to conform to generally accepted accounting principles. |
| | | | |
| | | Service Class | |
| | | May 1, 2013**
through
December 31, | |
| | | 2013 | |
Net asset value at beginning of period | | $ | 10.00 | |
| | | | |
Net investment income (loss) | | | (0.11 | )(a) |
Net realized and unrealized gain (loss) on investments | | | 1.25 | |
| | | | |
Total from investment operations | | | 1.14 | |
| | | | |
Net asset value at end of period | | $ | 11.14 | |
| | | | |
Total investment return | | | 11.40 | %(b)(c) |
Ratios (to average net assets)/Supplemental Data: | | | | |
Net investment income (loss) | | | (1.55 | %)†† |
Net expenses (excluding short sale expenses) | | | 1.79 | % †† |
Expenses (including short sales expenses, before waiver/reimbursement) | | | 2.79 | % †† |
Short sale expenses | | | 1.00 | % †† |
Portfolio turnover rate | | | 18 | % |
Net assets at end of period (in 000’s) | | $ | 253,022 | |
| (a) | Per share data based on average shares outstanding during the period. |
| (b) | Total investment return is not annualized. |
| (c) | Total investment returns may reflect adjustments to conform to generally accepted accounting principles. |
| | | | |
| M-316 | | MainStay VP Marketfield Portfolio | | The notes to the financial statements are an integral part of,
and should be read in conjunction with, the financial statements. |
MainStay VP MFS® Utilities Portfolio
Investment and Performance Comparison (Unaudited)
Performance data quoted represents past performance. Past performance is no guarantee of future results. Because of market volatility, current performance may be lower or higher than the figures shown. Investment return and principal value will fluctuate, and as a result, when shares are redeemed, they may be worth more or less than their original cost. The performance table and graph do not reflect any deduction of sales charges, mortality and expense charges, contract charges or administrative charges. Please refer to the Performance Summary appropriate for your policy. For performance information current to the most recent month-end, please call 800-598-2019 or visit www.newyorklife.com.
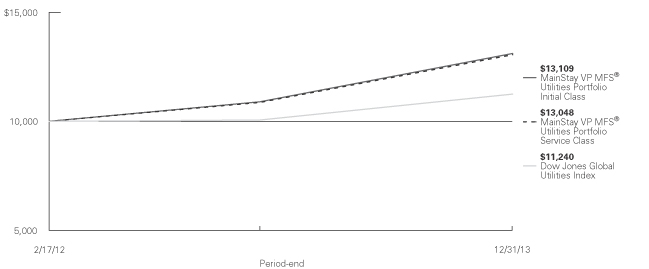
Average Annual Total Returns for the Period Ended December 31, 2013
| | | | | | | | | | | | |
| Class | | One Year | | | Since Inception (2/17/12) | | | Gross Expense Ratio1 | |
| Initial Class Shares | | | 20.33 | % | | | 15.57 | % | | | 0.80 | % |
| Service Class Shares | | | 20.03 | | | | 15.28 | | | | 1.05 | |
| | | | | | | | |
| Benchmark Performance | | One
Year | | | Since Inception
(2/17/12) | |
Dow Jones Global Utilities Index2 | | | 11.77 | % | | | 6.45 | % |
Average Lipper Variable Products Utility Portfolio3 | | | 18.40 | | | | 13.41 | |
| 1. | The gross expense ratios presented reflect the Portfolio’s “Total Annual Portfolio Operating Expenses” from the most recent Prospectus and may differ from other expense ratios disclosed in this report. |
| 2. | Please refer to pages M-2 and M-3 for additional explanations and disclosure regarding the Portfolios, their benchmark indices and other indices mentioned in the reports. |
| 3. | The Average Lipper Variable Products Utility Portfolio is representative of portfolios that invest primarily in the equity securities of domestic and foreign companies providing utilities. Lipper Inc. is an independent monitor of fund performance. Results are based on total returns with all dividend and capital gain distributions reinvested. |
| | | | |
| mainstayinvestments.com | | | M-317 | |
Cost in Dollars of a $1,000 Investment in MainStay VP MFS® Utilities Portfolio (Unaudited)
The example below is intended to describe the fees and expenses borne by shareholders during the period from July 1, 2013, to December 31, 2013, and the impact of those costs on your investment.
Example
As a shareholder of the Portfolio, you incur two types of costs: (1) transaction costs, including exchange fees and sales charges (loads) on purchases (as applicable), and (2) ongoing costs, including management fees, distribution and/or service (12b-1) fees, and other Portfolio expenses (as applicable). This example is intended to help you understand your ongoing costs (in dollars) of investing in the Portfolio and to compare these costs with the ongoing costs of investing in other Portfolios. The example is based on an investment of $1,000 made at the beginning of the six-month period and held for the entire period from July 1, 2013, to December 31, 2013. Shares are only sold in connection with variable life and annuity contracts and the example does not reflect any contract level or transactional fees or expenses. If these costs had been included, your costs would have been higher.
This example illustrates your Portfolio’s ongoing costs in two ways:
Actual Expenses
The second and third data columns in the table below provide information about actual account values and actual expenses. You may use the information in these columns, together with the amount you invested, to estimate the expenses that you paid during the six months ended
December 31, 2013. Simply divide your account value by $1,000 (for example, an $8,600 account value divided by $1,000 = 8.6), then multiply the result by the number under the heading entitled ‘‘Expenses Paid During Period’’ to estimate the expenses you paid on your account during this period.
Hypothetical Example for Comparison Purposes
The fourth and fifth data columns in the table below provide information about hypothetical account values and hypothetical expenses based on the Portfolio’s actual expense ratio and an assumed rate of return of 5% per year before expenses, which is not the Portfolio’s actual return. The hypothetical account values and expenses may not be used to estimate the actual ending account balances or expenses you paid for the six-month period shown. You may use this information to compare the ongoing costs of investing in the Portfolio with the ongoing costs of investing in other Portfolios. To do so, compare this 5% hypothetical example with the 5% hypothetical examples that appear in the shareholder reports of the other Portfolios.
Please note that the expenses shown in the table are meant to highlight your ongoing costs only and do not reflect any transactional costs, such as exchange fees or sales charges (loads). Therefore, the fourth and fifth data columns of the table are useful in comparing ongoing costs only and will not help you determine the relative total costs of owning different funds. In addition, if these transactional costs were included, your costs would have been higher.
| | | | | | | | | | | | | | | | | | | | |
| | | | | | | | | | | | | | | | |
| Share Class | | Beginning
Account
Value
7/1/13 | | | Ending Account
Value (Based
on Actual
Returns and
Expenses)
12/31/13 | | | Expenses
Paid
During
Period1 | | | Ending Account
Value (Based
on Hypothetical
5% Annualized
Return and
Actual Expenses)
12/31/13 | | | Expenses
Paid
During
Period1 | |
| | | | | |
| Initial Class Shares | | $ | 1,000.00 | | | $ | 1,096.70 | | | $ | 4.18 | | | $ | 1,021.20 | | | $ | 4.02 | |
| | | | | |
| Service Class Shares | | $ | 1,000.00 | | | $ | 1,095.40 | | | $ | 5.49 | | | $ | 1,020.00 | | | $ | 5.30 | |
| 1. | Expenses are equal to the Portfolio’s annualized expense ratio of each class (0.79% for Initial Class and 1.04% for Service Class) multiplied by the average account value over the period, divided by 365 and multiplied by 184 (to reflect the six-month period). The table above represents the actual expenses incurred during the six-month period. |
| | |
| M-318 | | MainStay VP MFS® Utilities Portfolio |
Portfolio Composition as of December 31, 2013 (Unaudited)
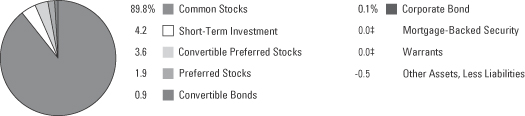
See Portfolio of Investments beginning on page M-321 for specific holdings within these categories.
| ‡ | Less than one-tenth of a percent. |
Top Ten Holdings as of December 31, 2013 (excluding short-term investment) (Unaudited)
| 3. | EDP—Energias de Portugal S.A. |
| 5. | Dominion Resources, Inc. |
| | | | |
| mainstayinvestments.com | | | M-319 | |
Portfolio Management Discussion and Analysis (Unaudited)
Answers to the questions reflect the views of Maura A. Shaughnessy, CFA, of Massachusetts Financial Services Company (“MFS”), the Portfolio’s Subadvisor.
How did MainStay VP MFS® Utilities Portfolio perform relative to its benchmark and peers during the 12 months ended December 31, 2013?
For the 12 months ended December 31, 2013, MainStay VP MFS® Utilities Portfolio returned 20.33% for Initial Class shares and 20.03% for Service Class shares. Both share classes outperformed the 11.77% return of the Dow Jones Global Utilities Index,1 which is the Portfolio’s broad-based securities-market index, and the 18.40% return of the average Lipper1 Variable Products Utility Portfolio during the 12 months ended December 31, 2013.
What factors affected the Portfolio’s relative performance during the reporting period?
Our industry allocations and stock selection helped the Portfolio’s performance relative to the Dow Jones Global World Utilities Index, with cable TV being particularly helpful.
Which sectors were the strongest positive contributors to the Portfolio’s relative performance, and which sectors were particularly weak?
The strongest positive-contributing industries to the Portfolio’s performance relative to the Dow Jones Global World Utilities Index were cable TV, electric power, and energy—independent. (Contributions take weightings and total returns into account.) Water utilities, pollution control and oil service were very minor detractors from the Portfolio’s relative performance.
During the reporting period, which individual stocks made the strongest positive contributions to the Portfolio’s absolute performance and which stocks detracted the most?
The stocks that made the strongest positive contributions to the Portfolio’s absolute performance were cable service provider Comcast, entertainment and communications services provider Virgin Media and media company Time Warner Cable. The stocks that made the weakest contributions to the Portfolio’s absolute performance were independent power producer Aksa Enerji Uretim, and Brazilian utilities Energias Do Brasil and Cemig Cia Energy.
Did the Portfolio make any significant purchases or sales during the reporting period?
Among the Portfolio’s largest purchases during the reporting period were Italian natural gas services company Snam SpA, energy transportation company Dominion Resources Pfd and energy holding company Pinnacle West Capital. We added Snam to the Portfolio after receiving a positive transmission review and positive distribution regulation parameters that were scheduled to cover the company for the next several years. We added convertible preferred securities from Dominion Resources to the Portfolio for the additional yield over the common stock. We added Pinnacle West Capital to the Portfolio because we believed that the stock had a good valuation, a good dividend yield and decent dividend growth potential.
Among the largest sales during the period were U.K. cable and media company Virgin Media, U.S. integrated electric power company FirstEnergy and utility services company Exelon. Virgin Media is no longer in the Portfolio because the company was acquired by Liberty Global. We sold the Portfolio’s position in FirstEnergy on news of the company’s upcoming capital expenditures, below consensus guidance for its retail division, need to raise additional equity and a possible dividend cut. We sold the Portfolio’s position in Exelon because the company has continued to struggle under the weight of lower prices and weak demand for power and gas.
How did the Portfolio’s sector weightings change during the reporting period?
During the reporting period, the Portfolio modestly increased its exposure to natural gas distribution and wireless communications and slightly increased its exposure to the natural gas pipeline industry. Additionally, the Portfolio modestly decreased its exposure to cable TV, telephone services and water utilities.
How was the Portfolio positioned at the end of the reporting period?
As of December 31, 2013, the Portfolio held significantly overweight positions in cable TV, wireless communications and natural gas pipeline. As of the same date, the Portfolio held a very significantly underweight position in electric power and modestly underweight positions in natural gas distribution and water utilities.
| 1. | Please refer to pages M-2 and M-3 for additional explanations and disclosure regarding the Portfolios, their benchmark indices and service providers mentioned in the reports. |
The opinions expressed are those of the portfolio manager as of the date of this report and are subject to change. There is no guarantee that any forecasts made will come to pass. This material does not constitute investment advice and is not intended as an endorsement of any specific investment.
Not all MainStay VP Portfolios and/or share classes are available under all policies.
| | |
| M-320 | | MainStay VP MFS® Utilities Portfolio |
Portfolio of Investments December 31, 2013
| | | | | | | | |
| | | Principal
Amount | | | Value | |
| | | | | | | | |
Long-Term Bonds 1.0%† Convertible Bonds 0.9% | |
Media 0.1% | |
XM Satellite Radio, Inc.
7.00%, due 12/1/14 (a)(b)(c) | | $ | 468,000 | | | $ | 911,430 | |
| | | | | | | | |
|
Telecommunications 0.8% | |
SBA Communications Corp.
4.00%, due 10/1/14 | | | 3,125,193 | | | | 9,266,197 | |
| | | | | | | | |
Total Convertible Bonds
(Cost $6,563,403) | | | | | | | 10,177,627 | |
| | | | | | | | |
|
| Corporate Bond 0.1% | |
Electric 0.1% | |
Viridian Group FundCo II
11.125%, due 4/1/17 (a)(c) | | | 1,045,000 | | | | 1,146,887 | |
| | | | | | | | |
Total Corporate Bond
(Cost $1,020,848) | | | | | | | 1,146,887 | |
| | | | | | | | |
|
| Mortgage-Backed Security 0.0%‡ | |
Commercial Mortgage Loans (Collateralized Mortgage Obligation) 0.0%‡ | |
Falcon Franchise Loan LLC
Series 2001-1, Class IO
8.604%, due 1/5/23 (a)(b)(c)(d) | | | 24,678 | | | | 2,715 | |
| | | | | | | | |
Total Mortgage-Backed Security
(Cost $1,447) | | | | | | | 2,715 | |
| | | | | | | | |
Total Long-Term Bonds
(Cost $7,585,698) | | | | | | | 11,327,229 | |
| | | | | | | | |
| | |
| | | | | | | | |
| | |
Shares | | | | |
| Common Stocks 89.8% | |
Commercial Services & Supplies 0.3% | | | | | |
Covanta Holding Corp. | | | 188,670 | | | | 3,348,892 | |
| | | | | | | | |
|
Diversified Telecommunication Services 7.3% | |
Bezeq-The Israeli Telecommunication Corp., Ltd. | | | 6,991,579 | | | | 11,850,646 | |
CenturyLink, Inc. | | | 252,239 | | | | 8,033,812 | |
Portugal Telecom SGPS S.A. Registered | | | 804,963 | | | | 3,499,343 | |
TDC A/S | | | 1,308,005 | | | | 12,687,486 | |
Telecom Italia S.p.A. | | | 6,886,031 | | | | 5,390,199 | |
Telefonica Brasil S.A., ADR | | | 263,781 | | | | 5,069,871 | |
Telekomunikasi Indonesia Persero Tbk PT | | | 6,722,000 | | | | 1,187,535 | |
TELUS Corp. | | | 16,520 | | | | 568,577 | |
| | | | | | | | |
| | |
Shares | | | Value | |
| | | | | | | | |
Diversified Telecommunication Services (continued) | |
Verizon Communications, Inc. | | | 248,010 | | | $ | 12,187,211 | |
Windstream Holdings, Inc. | | | 1,452,540 | | | | 11,591,269 | |
XL Axiata Tbk PT | | | 6,484,500 | | | | 2,770,698 | |
Ziggo N.V. | | | 215,494 | | | | 9,842,305 | |
| | | | | | | | |
| | | | | | | 84,678,952 | |
| | | | | | | | |
Electric Utilities 21.5% | |
American Electric Power Co., Inc. | | | 406,193 | | | | 18,985,461 | |
CEZ AS | | | 145,169 | | | | 3,779,196 | |
Cheung Kong Infrastructure Holdings, Ltd. | | | 1,079,000 | | | | 6,832,196 | |
Cia Paranaense de Energia Class B, Sponsored ADR | | | 270,403 | | | | 3,553,095 | |
Duke Energy Corp. | | | 203,660 | | | | 14,054,577 | |
Edison International | | | 458,752 | | | | 21,240,218 | |
¨EDP—Energias de Portugal S.A. | | | 9,277,427 | | | | 34,077,078 | |
EDP—Energias do Brasil S.A. | | | 1,959,700 | | | | 9,427,824 | |
Great Plains Energy, Inc. | | | 142,608 | | | | 3,456,818 | |
ITC Holdings Corp. | | | 67,799 | | | | 6,496,500 | |
Light S.A. | | | 439,130 | | | | 4,117,222 | |
¨NextEra Energy, Inc. | | | 369,848 | | | | 31,666,386 | |
¨Northeast Utilities | | | 652,180 | | | | 27,645,910 | |
OGE Energy Corp. | | | 461,530 | | | | 15,645,867 | |
Pinnacle West Capital Corp. | | | 179,420 | | | | 9,494,906 | |
Portland General Electric Co. | | | 447,740 | | | | 13,521,748 | |
PPL Corp. | | | 191,328 | | | | 5,757,059 | |
Red Electrica Corp. S.A. | | | 154,894 | | | | 10,334,748 | |
SSE PLC | | | 459,804 | | | | 10,431,350 | |
| | | | | | | | |
| | | | | | | 250,518,159 | |
| | | | | | | | |
Energy Equipment & Services 0.8% | |
Ensco PLC Class A | | | 103,520 | | | | 5,919,274 | |
Noble Corp. PLC | | | 106,360 | | | | 3,985,309 | |
| | | | | | | | |
| | | | | | | 9,904,583 | |
| | | | | | | | |
Gas Utilities 7.1% | |
AGL Resources, Inc. | | | 107,850 | | | | 5,093,755 | |
APA Group | | | 516,707 | | | | 2,768,207 | |
China Resources Gas Group, Ltd. | | | 2,200,000 | | | | 7,617,709 | |
Enagas S.A. | | | 639,182 | | | | 16,702,727 | |
Gas Natural SDG S.A. | | | 373,060 | | | | 9,594,618 | |
Infraestructura Energetica Nova S.A.B. de C.V. | | | 465,000 | | | | 1,861,567 | |
ONEOK, Inc. | | | 352,654 | | | | 21,928,026 | |
Questar Corp. | | | 115,440 | | | | 2,653,965 | |
Snam S.p.A. | | | 2,596,500 | | | | 14,523,766 | |
| | | | | | | | |
| | | | | | | 82,744,340 | |
| | | | | | | | |
Independent Power Producers & Energy Traders 9.8% | |
¨AES Corp. (The) | | | 1,584,376 | | | | 22,989,296 | |
Aksa Enerji Uretim AS (e) | | | 3,318,674 | | | | 3,984,262 | |
¨Calpine Corp. (e) | | | 1,532,668 | | | | 29,902,353 | |
| † | Percentages indicated are based on Portfolio net assets. |
| ¨ | | Among the Portfolio’s 10 largest holdings, as of December 31, 2013, excluding short-term investment. May be subject to change daily. |
| | | | | | |
The notes to the financial statements are an integral part of,
and should be read in conjunction with, the financial statements. | | mainstayinvestments.com | | | M-321 | |
Portfolio of Investments December 31, 2013 (continued)
| | | | | | | | |
| | |
Shares | | | Value | |
| | | | | | | | |
| Common Stocks (continued) | |
Independent Power Producers & Energy Traders (continued) | |
China Longyuan Power Group Corp. | | | 2,782,000 | | | $ | 3,580,511 | |
Dynegy, Inc. (e) | | | 63,680 | | | | 1,370,394 | |
E.ON Russia JSC (f) | | | 10,781,050 | | | | 774,866 | |
EDP Renovaveis S.A. | | | 3,633,462 | | | | 19,299,407 | |
Enel Green Power S.p.A. | | | 484,193 | | | | 1,219,636 | |
Infinis Energy PLC (e) | | | 805,350 | | | | 3,114,001 | |
¨NRG Energy, Inc. | | | 981,387 | | | | 28,185,435 | |
| | | | | | | | |
| | | | | | | 114,420,161 | |
| | | | | | | | |
Media 8.8% | |
Astro Malaysia Holdings Bhd | | | 6,567,000 | | | | 6,014,654 | |
¨Comcast Corp. Class A | | | 1,016,905 | | | | 50,723,221 | |
Liberty Global PLC (e) | | | 122,063 | | | | 10,292,352 | |
Liberty Global PLC Class A (e) | | | 146,079 | | | | 12,999,570 | |
Quebecor, Inc. Class B | | | 22,710 | | | | 565,265 | |
Sirius XM Holdings, Inc. (e) | | | 142,180 | | | | 496,208 | |
Time Warner Cable, Inc. | | | 143,827 | | | | 19,488,559 | |
Twenty-First Century Fox, Inc. Class A | | | 51,840 | | | | 1,823,731 | |
| | | | | | | | |
| | | | | | | 102,403,560 | |
| | | | | | | | |
Multi-Utilities 13.2% | |
AGL Energy, Ltd. | | | 238,630 | | | | 3,202,484 | |
Alliant Energy Corp. | | | 164,090 | | | | 8,467,044 | |
Ameren Corp. | | | 62,630 | | | | 2,264,701 | |
Canadian Utilities, Ltd. Class A | | | 15,680 | | | | 526,529 | |
CenterPoint Energy, Inc. | | | 550,504 | | | | 12,760,683 | |
Centrica PLC | | | 818,525 | | | | 4,712,852 | |
¨CMS Energy Corp. | | | 1,111,251 | | | | 29,748,189 | |
¨Dominion Resources, Inc. | | | 310,730 | | | | 20,101,124 | |
DTE Energy Co. | | | 131,170 | | | | 8,708,376 | |
GDF Suez | | | 562,575 | | | | 13,230,403 | |
National Grid PLC | | | 268,662 | | | | 3,505,740 | |
NiSource, Inc. | | | 190,564 | | | | 6,265,744 | |
Public Service Enterprise Group, Inc. | | | 654,539 | | | | 20,971,430 | |
Sempra Energy | | | 213,108 | | | | 19,128,574 | |
| | | | | | | | |
| | | | | | | 153,593,873 | |
| | | | | | | | |
Oil, Gas & Consumable Fuels 13.6% | |
Anadarko Petroleum Corp. | | | 102,660 | | | | 8,142,991 | |
Antero Resources Corp. (e) | | | 110,000 | | | | 6,978,400 | |
Cheniere Energy, Inc. (e) | | | 118,813 | | | | 5,123,217 | |
Enbridge, Inc. | | | 267,300 | | | | 11,678,412 | |
Energen Corp. | | | 153,584 | | | | 10,866,068 | |
Energy Transfer Equity, L.P. | | | 5,020 | | | | 410,335 | |
EQT Corp. | | | 228,981 | | | | 20,557,914 | |
¨Kinder Morgan, Inc. | | | 909,668 | | | | 32,748,048 | |
Noble Energy, Inc. | | | 57,593 | | | | 3,922,659 | |
ONEOK Partners, L.P. | | | 121,950 | | | | 6,420,667 | |
SemGroup Corp. Class A | | | 5,620 | | | | 366,593 | |
Spectra Energy Corp. | | | 352,233 | | | | 12,546,539 | |
TransCanada Corp. | | | 155,520 | | | | 7,106,558 | |
| | | | | | | | |
| | |
Shares | | | Value | |
| | | | | | | | |
Oil, Gas & Consumable Fuels (continued) | |
Western Gas Equity Partners, L.P. | | | 8,490 | | | $ | 335,440 | |
Williams Cos., Inc. (The) | | | 436,873 | | | | 16,850,192 | |
Williams Partners, L.P. | | | 285,341 | | | | 14,512,443 | |
| | | | | | | | |
| | | | | | | 158,566,476 | |
| | | | | | | | |
Real Estate Investment Trusts 1.7% | |
American Tower Corp. | | | 254,562 | | | | 20,319,139 | |
| | | | | | | | |
|
Water Utilities 0.1% | |
Aguas Andinas S.A. Class A | | | 920,760 | | | | 595,616 | |
| | | | | | | | |
|
Wireless Telecommunication Services 5.6% | |
Cellcom Israel, Ltd. | | | 382,363 | | | | 5,322,493 | |
KDDI Corp. | | | 10,200 | | | | 626,664 | |
Megafon OAO, GDR | | | 82,130 | | | | 2,751,355 | |
Mobile Telesystems OJSC (f) | | | 113,750 | | | | 1,134,889 | |
Mobile Telesystems OJSC, Sponsored ADR | | | 688,289 | | | | 14,887,691 | |
SBA Communications Corp.
Class A (e) | | | 77,082 | | | | 6,925,047 | |
Tele2 AB Class B | | | 341,875 | | | | 3,872,228 | |
Tim Participacoes S.A., ADR | | | 224,141 | | | | 5,881,460 | |
Turkcell Iletisim Hizmetleri AS (e) | | | 1,413,700 | | | | 7,466,494 | |
Vodafone Group PLC | | | 4,266,271 | | | | 16,743,413 | |
| | | | | | | | |
| | | | | | | 65,611,734 | |
| | | | | | | | |
Total Common Stocks
(Cost $911,374,641) | | | | | | | 1,046,705,485 | |
| | | | | | | | |
|
| Convertible Preferred Stocks 3.6% | |
Electric Utilities 2.3% | |
¨NextEra Energy, Inc.
5.889% | | | 165,200 | | | | 9,355,276 | |
PPL Corp.
8.75% | | | 317,531 | | | | 16,791,039 | |
| | | | | | | | |
| | | | | | | 26,146,315 | |
| | | | | | | | |
Multi-Utilities 1.1% | |
¨Dominion Resources, Inc. | | | | | | | | |
6.00% | | | 118,760 | | | | 6,437,979 | |
6.13% | | | 118,440 | | | | 6,409,973 | |
| | | | | | | | |
| | | | | | | 12,847,952 | |
| | | | | | | | |
Wireless Telecommunication Services 0.2% | |
Crown Castle International Corp. (e)
4.50% | | | 23,040 | | | | 2,304,922 | |
| | | | | | | | |
Total Convertible Preferred Stocks
(Cost $39,642,370) | | | | | | | 41,299,189 | |
| | | | | | | | |
| | | | |
| M-322 | | MainStay VP MFS® Utilities Portfolio | | The notes to the financial statements are an integral part of,
and should be read in conjunction with, the financial statements. |
| | | | | | | | |
| | |
Shares | | | Value | |
| | | | | | | | |
| Preferred Stocks 1.9% | |
Diversified Telecommunication Services 0.1% | |
Oi S.A.
7.72% | | | 794,400 | | | $ | 1,208,815 | |
| | | | | | | | |
|
Electric Utilities 1.8% | |
Cia Energetica de Minas Gerais
6.90% | | | 1,848,545 | | | | 10,977,266 | |
Cia Paranaense de Energia Class B
1.84% | | | 762,700 | | | | 9,869,760 | |
| | | | | | | | |
| | | | | | | 20,847,026 | |
| | | | | | | | |
Total Preferred Stocks
(Cost $30,479,356) | | | | | | | 22,055,841 | |
| | | | | | | | |
| | |
| | | | | | | | |
| | | Number of
Warrants | | | | |
| Warrants 0.0%‡ | |
Oil, Gas & Consumable Fuels 0.0%‡ | |
¨Kinder Morgan, Inc.
Expires 5/25/17 (e) | | | 57,580 | | | | 233,775 | |
| | | | | | | | |
Total Warrants
(Cost $290,484) | | | | | | | 233,775 | |
| | | | | | | | |
| | |
| | | | | | | | |
| | | Principal Amount | | | | |
| Short-Term Investment 4.2% | |
Repurchase Agreement 4.2% | |
State Street Bank and Trust Co.
0.00%, dated 12/31/13
due 1/2/14
Proceeds at Maturity $49,248,679 (Collateralized by a Federal National Mortgage Association security with a rate of 2.14% and a maturity date of 11/7/22, with a Principal Amount of $55,335,000 and a Market Value of $50,237,042) | | $ | 49,248,679 | | | | 49,248,679 | |
| | | | | | | | |
Total Short-Term Investment
(Cost $49,248,679) | | | | | | | 49,248,679 | |
| | | | | | | | |
Total Investments
(Cost $1,038,621,228) (g) | | | 100.5 | % | | | 1,170,870,198 | |
Other Assets, Less Liabilities | | | (0.5 | ) | | | (5,482,777 | ) |
Net Assets | | | 100.0 | % | | $ | 1,165,387,421 | |
| ‡ | Less than one-tenth of a percent. |
| (a) | May be sold to institutional investors only under Rule 144A or securities offered pursuant to Section 4(a)(2) of the Securities Act of 1933, as amended. |
| (b) | Illiquid security—The total market value of these securities as of December 31, 2013, is $914,145, which represents 0.1% of the Portfolio’s net assets. |
| (d) | Collateral strip rate—A bond whose interest is based on the weighted net interest rate of the collateral. The coupon rate adjusts periodically based on a predetermined schedule. Rate shown is the rate in effect as of December 31, 2013. |
| (e) | Non-income producing security. |
| (f) | Fair valued security—The total market value of these securities as of December 31, 2013, is $1,909,755, which represents 0.2% of the Portfolio’s net assets. |
| (g) | As of December 31, 2013, cost is $1,040,640,988 for federal income tax purposes and net unrealized appreciation is as follows: |
| | | | |
Gross unrealized appreciation | | $ | 160,002,702 | |
Gross unrealized depreciation | | | (29,773,492 | ) |
| | | | |
Net unrealized appreciation | | $ | 130,229,210 | |
| | | | |
The following abbreviations are used in the above portfolio:
ADR—American Depositary Receipt
GDR—Global Depositary Receipt
| | | | | | |
The notes to the financial statements are an integral part of,
and should be read in conjunction with, the financial statements. | | mainstayinvestments.com | | | M-323 | |
Portfolio of Investments December 31, 2013 (continued)
As of December 31, 2013, the Portfolio held the following foreign currency forward contracts:
| | | | | | | | | | | | | | | | | | | | | | | | | | | | | | |
Foreign Currency Buy Contracts | | Expiration
Date | | Counterparty | | | Contract
Amount
Purchased | | | Contract
Amount
Sold | | | Unrealized
Appreciation
(Depreciation) | |
Euro vs. U.S. Dollar | | 1/17/14 | | | Barclays Bank PLC | | | | EUR | | | | 500,642 | | | | USD | | | | 677,004 | | | | USD | | | | 11,724 | |
Euro vs. U.S. Dollar | | 3/18/14 | | | Barclays Bank PLC | | | | | | | | 656,000 | | | | | | | | 902,520 | | | | | | | | (81 | ) |
Euro vs. U.S. Dollar | | 1/17/14 | | | Deutsche Bank A.G. | | | | | | | | 65,614 | | | | | | | | 90,574 | | | | | | | | (309 | ) |
Euro vs. U.S. Dollar | | 1/17/14 | | | JPMorgan Chase Bank | | | | | | | | 296,716 | | | | | | | | 409,179 | | | | | | | | (989 | ) |
Euro vs. U.S. Dollar | | 1/14/14 | | | Merrill Lynch International Bank | | | | | | | | 1,300,152 | | | | | | | | 1,764,608 | | | | | | | | 24,001 | |
Euro vs. U.S. Dollar | | 1/17/14 | | | UBS A.G. | | | | | | | | 1,481,415 | | | | | | | | 2,027,180 | | | | | | | | 10,788 | |
Pound Sterling vs. U.S. Dollar | | 1/17/14 | | | Barclays Bank PLC | | | | GBP | | | | 1,100,000 | | | | | | | | 1,792,569 | | | | | | | | 28,807 | |
| | | | | | | | |
| | | | | | | | | | | | | | | | | | | | | | | | | | | | | | |
| | | | | |
Foreign Currency Sales Contracts | | | | | | | Contract
Amount
Sold | | | Contract
Amount
Purchased | | | | |
Euro vs. U.S. Dollar | | 1/14/14 | | | Barclays Bank PLC | | | | EUR | | | | 38,923 | | | | USD | | | | 52,633 | | | | USD | | | | (913 | ) |
Euro vs. U.S. Dollar | | 1/17/14 | | | Barclays Bank PLC | | | | | | | | 137,905 | | | | | | | | 190,351 | | | | | | | | 637 | |
Euro vs. U.S. Dollar | | 1/17/14 | | | Credit Suisse International | | | | | | | | 630,247 | | | | | | | | 852,399 | | | | | | | | (14,625 | ) |
Euro vs. U.S. Dollar | | 1/14/14 | | | Deutsche Bank A.G. | | | | | | | | 579,346 | | | | | | | | 783,786 | | | | | | | | (13,216 | ) |
Euro vs. U.S. Dollar | | 1/17/14 | | | Deutsche Bank A.G. | | | | | | | | 32,626,950 | | | | | | | | 44,055,540 | | | | | | | | (829,040 | ) |
Euro vs. U.S. Dollar | | 1/17/14 | | | JPMorgan Chase Bank | | | | | | | | 31,876,126 | | | | | | | | 43,034,065 | | | | | | | | (817,613 | ) |
Euro vs. U.S. Dollar | | 1/17/14 | | | UBS A.G. | | | | | | | | 955,693 | | | | | | | | 1,315,108 | | | | | | | | 371 | |
Pound Sterling vs. U.S. Dollar | | 1/17/14 | | | Barclays Bank PLC | | | | GBP | | | | 669,545 | | | | | | | | 1,096,945 | | | | | | | | (11,685 | ) |
Pound Sterling vs. U.S. Dollar | | 1/17/14 | | | Citibank N.A. | | | | | | | | 658,263 | | | | | | | | 1,068,524 | | | | | | | | (21,425 | ) |
Pound Sterling vs. U.S. Dollar | | 1/17/14 | | | Credit Suisse International | | | | | | | | 5,784,206 | | | | | | | | 9,260,265 | | | | | | | | (317,201 | ) |
Pound Sterling vs. U.S. Dollar | | 1/17/14 | | | Deutsche Bank A.G. | | | | | | | | 1,681,126 | | | | | | | | 2,714,608 | | | | | | | | (68,995 | ) |
Pound Sterling vs. U.S. Dollar | | 1/17/14 | | | JPMorgan Chase Bank | | | | | | | | 1,028,549 | | | | | | | | 1,663,075 | | | | | | | | (39,992 | ) |
Pound Sterling vs. U.S. Dollar | | 1/17/14 | | | Merrill Lynch International Bank | | | | | | | | 5,185,472 | | | | | | | | 8,285,658 | | | | | | | | (300,427 | ) |
Pound Sterling vs. U.S. Dollar | | 1/17/14 | | | UBS A.G. | | | | | | | | 133,663 | | | | | | | | 219,491 | | | | | | | | (1,828 | ) |
Net unrealized appreciation (depreciation) on foreign currency forward contracts | | | | USD | | | | (2,362,011 | ) |
| | | | |
| M-324 | | MainStay VP MFS® Utilities Portfolio | | The notes to the financial statements are an integral part of,
and should be read in conjunction with, the financial statements. |
The following is a summary of the fair valuations according to the inputs used as of December 31, 2013, for valuing the Portfolio’s assets and liabilities.
Asset Valuation Inputs
| | | | | | | | | | | | | | | | |
Description | | Quoted Prices
in Active Markets
for Identical Assets (Level 1) | | | Significant Other
Observable Inputs (Level 2) | | | Significant
Unobservable
Inputs (Level 3) | | | Total | |
| Investments in Securities (a) | | | | | | | | | | | | | | | | |
| Long-Term Bonds | | | | | | | | | | | | | | | | |
Convertible Bonds | | $ | — | | | $ | 10,177,627 | | | $ | — | | | $ | 10,177,627 | |
Corporate Bond | | | — | | | | 1,146,887 | | | | — | | | | 1,146,887 | |
Mortgage-Backed Security | | | — | | | | 2,715 | | | | — | | | | 2,715 | |
| | | | | | | | | | | | | | | | |
| Total Long-Term Bonds | | | — | | | | 11,327,229 | | | | — | | | | 11,327,229 | |
| | | | | | | | | | | | | | | | |
| Common Stocks | | | 1,044,795,730 | | | | 1,909,755 | | | | — | | | | 1,046,705,485 | |
| Convertible Preferred Stocks | | | 41,299,189 | | | | — | | | | — | | | | 41,299,189 | |
| Preferred Stocks | | | 22,055,841 | | | | — | | | | — | | | | 22,055,841 | |
| Warrants | | | 233,775 | | | | — | | | | — | | | | 233,775 | |
| Short-Term Investment | | | | | | | | | | | | | | | | |
Repurchase Agreement | | | — | | | | 49,248,679 | | | | — | | | | 49,248,679 | |
| | | | | | | | | | | | | | | | |
| Total Investments in Securities | | | 1,108,384,535 | | | | 62,485,663 | | | | — | | | | 1,170,870,198 | |
| | | | | | | | | | | | | | | | |
| Other Financial Instruments | | | | | | | | | | | | | | | | |
Foreign Currency Forward Contracts (b) | | | — | | | | 76,328 | | | | — | | | | 76,328 | |
| | | | | | | | | | | | | | | | |
| Total Investments in Securities and Other Financial Instruments | | $ | 1,108,384,535 | | | $ | 62,561,991 | | | $ | — | | | $ | 1,170,946,526 | |
| | | | | | | | | | | | | | | | |
Liability Valuation Inputs
| | | | | | | | | | | | | | | | |
Description | | Quoted Prices
in Active Markets
for Identical Assets (Level 1) | | | Significant Other
Observable Inputs (Level 2) | | | Significant
Unobservable
Inputs
(Level 3) | | | Total | |
| Other Financial Instruments | | | | | | | | | | | | | | | | |
Foreign Currency Forward Contracts (b) | | $ | — | | | $ | (2,438,339 | ) | | $ | — | | | $ | (2,438,339 | ) |
| | | | | | | | | | | | | | | | |
| Total Other Financial Instruments | | $ | — | | | $ | (2,438,339 | ) | | $ | — | | | $ | (2,438,339 | ) |
| | | | | | | | | | | | | | | | |
| (a) | For a complete listing of investments and their industries, see the Portfolio of Investments. |
| (b) | The value listed for these securities reflects unrealized appreciation (depreciation) as shown on the Portfolio of Investments. |
The Portfolio recognizes transfers between the levels as of the beginning of the period.
As of December 31, 2013, certain foreign securities with a market value of $176,197,703 were transferred from Level 2 to Level 1 as the prices of these securities were based on unadjusted quoted prices compared with the prior year prices which were adjusted for events after the market close. The December 31, 2012 prices were adjusted by applying factors provided by a third party vendor in accordance with the Portfolio’s policies and procedures. Fair values as of December 31, 2013, for these securities were based on quoted prices in active markets for identical investments.
As of December 31, 2013, an equity security with a market value of $1,010,444 was transferred from Level 3 to Level 2 as a result of the equity security using an observable input for valuation measurement at December 31, 2013.
| | | | | | |
The notes to the financial statements are an integral part of,
and should be read in conjunction with, the financial statements. | | mainstayinvestments.com | | | M-325 | |
Portfolio of Investments December 31, 2013 (continued)
The following is a reconciliation of investments in which significant unobservable inputs (Level 3) were used in determining value:
| | | | | | | | | | | | | | | | | | | | | | | | | | | | | | | | | | | | | | | | |
Investments in
Securities | | Balance
as of
December 31,
2012 | | | Accrued
Discounts
(Premiums) | | | Realized
Gain
(Loss) | | | Change in
Unrealized
Appreciation
(Deprecia
-tion) | | | Purchases | | | Sales | | | Trans
-fers
in to
Level 3 | | | Trans
-fers
out of
Level 3 | | | Balance
as of
December 31,
2013 | | | Change in
Unrealized
Appreciation
(Deprecia
-tion)
from
Investments
Still Held at
December 31,
2013 (a) | |
| Common Stocks | | | | | | | | | | | | | | | | | | | | | | | | | | | | | | | | | | | | | | | | |
Electric Utilities | | $ | 178,027 | | | $ | 60,911 | | | $ | (57,296 | ) | | $ | — | | | $ | — | | | $ | (181,642 | ) | | $ | — | | | $ | — | | | $ | — | | | $ | — | |
Independent Power Producers & Energy Traders | | | 1,010,444 | | | | 46,581 | | | | (43,024 | ) | | | (166,200 | ) | | | 164,374 | | | | (237,309 | ) | | | — | | | | (774,866 | ) | | | — | | | | — | |
| | | | | | | | | | | | | | | | | | | | | | | | | | | | | | | | | | | | | | | | |
| Total | | $ | 1,188,471 | | | $ | 107,492 | | | $ | (100,320 | ) | | $ | (166,200 | ) | | $ | 164,374 | | | $ | (418,951 | ) | | $ | — | | | $ | (774,866 | ) | | $ | — | | | $ | — | |
| | | | | | | | | | | | | | | | | | | | | | | | | | | | | | | | | | | | | | | | |
| (a) | Included in “Net change in unrealized appreciation (depreciation) on investments” in the Statement of Operations. |
| | | | |
| M-326 | | MainStay VP MFS® Utilities Portfolio | | The notes to the financial statements are an integral part of,
and should be read in conjunction with, the financial statements. |
Statement of Assets and Liabilities as of December 31, 2013
| | | | |
| Assets | | | | |
Investment in securities, at value
(identified cost $1,038,621,228) | | $ | 1,170,870,198 | |
Cash denominated in foreign currencies
(identified cost $85,663) | | | 83,776 | |
Receivables: | | | | |
Dividends and interest | | | 2,388,404 | |
Investment securities sold | | | 1,907,799 | |
Fund shares sold | | | 842,762 | |
Unrealized appreciation on foreign currency forward contracts | | | 76,328 | |
| | | | |
Total assets | | | 1,176,169,267 | |
| | | | |
| |
| Liabilities | | | | |
Payables: | | | | |
Investment securities purchased | | | 6,880,569 | |
Manager (See Note 3) | | | 703,827 | |
Fund shares redeemed | | | 388,091 | |
NYLIFE Distributors (See Note 3) | | | 227,639 | |
Shareholder communication | | | 58,773 | |
Custodian | | | 45,931 | |
Professional fees | | | 35,975 | |
Trustees | | | 1,189 | |
Accrued expenses | | | 1,513 | |
Unrealized depreciation on foreign currency forward contracts | | | 2,438,339 | |
| | | | |
Total liabilities | | | 10,781,846 | |
| | | | |
Net assets | | $ | 1,165,387,421 | |
| | | | |
| |
| Net Assets Consist of | | | | |
Shares of beneficial interest outstanding (par value of $.001 per share) unlimited number of shares authorized | | $ | 92,416 | |
Additional paid-in capital | | | 954,277,577 | |
| | | | |
| | | 954,369,993 | |
Undistributed net investment income | | | 23,866,640 | |
Accumulated net realized gain (loss) on investments and foreign currency transactions | | | 57,229,967 | |
Net unrealized appreciation (depreciation) on investments | | | 132,248,970 | |
Net unrealized appreciation (depreciation) on translation of other assets and liabilities in foreign currencies and foreign currency forward contracts | | | (2,328,149 | ) |
| | | | |
Net assets | | $ | 1,165,387,421 | |
| | | | |
| | | | |
Initial Class | | | | |
Net assets applicable to outstanding shares | | $ | 70,290,031 | |
| | | | |
Shares of beneficial interest outstanding | | | 5,557,376 | |
| | | | |
Net asset value per share outstanding | | $ | 12.65 | |
| | | | |
Service Class | | | | |
Net assets applicable to outstanding shares | | $ | 1,095,097,390 | |
| | | | |
Shares of beneficial interest outstanding | | | 86,858,897 | |
| | | | |
Net asset value per share outstanding | | $ | 12.61 | |
| | | | |
| | | | | | |
The notes to the financial statements are an integral part of,
and should be read in conjunction with, the financial statements. | | mainstayinvestments.com | | | M-327 | |
Statement of Operations for the year ended December 31, 2013
| | | | |
| Investment Income (Loss) | | | | |
Income | | | | |
Dividends (a) | | $ | 38,439,334 | |
Interest | | | 526,912 | |
| | | | |
Total income | | | 38,966,246 | |
| | | | |
Expenses | | | | |
Manager (See Note 3) | | | 7,452,250 | |
Distribution and service—Service Class (See Note 3) | | | 2,390,740 | |
Custodian | | | 291,855 | |
Shareholder communication | | | 162,186 | |
Professional fees | | | 87,065 | |
Trustees | | | 20,253 | |
Miscellaneous | | | 50,708 | |
| | | | |
Total expenses before waiver/reimbursement | | | 10,455,057 | |
Expense waiver/reimbursement from Manager
(See Note 3) | | | (14,064 | ) |
| | | | |
Net expenses | | | 10,440,993 | |
| | | | |
Net investment income (loss) | | | 28,525,253 | |
| | | | |
|
| Realized and Unrealized Gain (Loss) on Investments and Foreign Currency Transactions | |
Net realized gain (loss) on: | | | | |
Security transactions | | | 56,103,554 | |
Foreign currency transactions | | | (3,846,033 | ) |
| | | | |
Net realized gain (loss) on investments and foreign currency transactions | | | 52,257,521 | |
| | | | |
Net change in unrealized appreciation (depreciation) on: | | | | |
Investments | | | 99,279,397 | |
Translation of other assets and liabilities in foreign currencies and foreign currency forward contracts | | | 46,257 | |
| | | | |
Net change in unrealized appreciation (depreciation) on investments and foreign currency transactions | | | 99,325,654 | |
| | | | |
Net realized and unrealized gain (loss) on investments and foreign currency transactions | | | 151,583,175 | |
| | | | |
Net increase (decrease) in net assets resulting from operations | | $ | 180,108,428 | |
| | | | |
| (a) | Dividends recorded net of foreign withholding taxes in the amount of $2,265,849. |
| | | | |
| M-328 | | MainStay VP MFS® Utilities Portfolio | | The notes to the financial statements are an integral part of,
and should be read in conjunction with, the financial statements. |
Statements of Changes in Net Assets
for the year ended December 31, 2013 and the period February 17, 2012 (inception date) through December 31, 2012
| | | | | | | | |
| | | 2013 | | | 2012 | |
| Increase (Decrease) in Net Assets | |
Operations: | | | | | | | | |
Net investment income (loss) | | $ | 28,525,253 | | | $ | 22,880,598 | |
Net realized gain (loss) on investments and foreign currency transactions | | | 52,257,521 | | | | 14,217,995 | |
Net change in unrealized appreciation (depreciation) on investments and foreign currency transactions | | | 99,325,654 | | | | 30,595,167 | |
| | | | |
Net increase (decrease) in net assets resulting from operations | | | 180,108,428 | | | | 67,693,760 | |
| | | | |
Dividends and distributions to shareholders: | | | | | |
From net investment income: | | | | | | | | |
Initial Class | | | (1,515,367 | ) | | | — | |
Service Class | | | (21,599,728 | ) | | | — | |
| | | | |
| | | (23,115,095 | ) | | | — | |
| | | | |
From net realized gain on investments: | | | | | | | | |
Initial Class | | | (836,734 | ) | | | — | |
Service Class | | | (12,834,886 | ) | | | — | |
| | | | |
| | | (13,671,620 | ) | | | — | |
| | | | |
Total dividends and distributions to shareholders | | | (36,786,715 | ) | | | — | |
| | | | |
Capital share transactions: | | | | | | | | |
Net proceeds from sale of shares | | | 221,480,430 | | | | 874,557,510 | |
Net asset value of shares issued to shareholders in reinvestment of dividends and distributions | | | 36,786,715 | | | | — | |
Cost of shares redeemed | | | (86,668,372 | ) | | | (91,784,335 | ) |
| | | | |
Increase (decrease) in net assets derived from capital share transactions | | | 171,598,773 | | | | 782,773,175 | |
| | | | |
Net increase (decrease) in net assets | | | 314,920,486 | | | | 850,466,935 | |
| | |
| Net Assets | | | | | | | | |
Beginning of period | | | 850,466,935 | | | | — | |
| | | | |
End of period | | $ | 1,165,387,421 | | | $ | 850,466,935 | |
| | | | |
Undistributed net investment income at end of period | | $ | 23,866,640 | | | $ | 24,304,489 | |
| | | | |
| | | | | | |
The notes to the financial statements are an integral part of,
and should be read in conjunction with, the financial statements. | | mainstayinvestments.com | | | M-329 | |
Financial Highlights selected per share data and ratios
| | | | | | | | | | | | | | | | | | |
| | | Initial Class | | | | | Service Class | |
| | | Year ended
December 31, | | | February 17,
2012**
through
December 31, | | | | | Year ended
December 31, | | | February 17,
2012**
through
December 31, | |
| | | 2013 | | | 2012 | | | | | 2013 | | | 2012 | |
Net asset value at beginning of period | | $ | 10.89 | | | $ | 10.00 | | | | | $ | 10.87 | | | $ | 10.00 | |
| | | | | | | | | | | | | | | | | | |
Net investment income (loss) (a) | | | 0.37 | | | | 0.33 | | | | | | 0.34 | | | | 0.30 | |
Net realized and unrealized gain (loss) on investments | | | 1.88 | | | | 0.56 | | | | | | 1.87 | | | | 0.57 | |
Net realized and unrealized gain (loss) on foreign currency transactions | | | (0.05 | ) | | | (0.00 | )‡ | | | | | (0.05 | ) | | | (0.00 | )‡ |
| | | | | | | | | | | | | | | | | | |
Total from investment operations | | | 2.20 | | | | 0.89 | | | | | | 2.16 | | | | 0.87 | |
| | | | | | | | | | | | | | | | | | |
Less dividends and distributions: | | | | | | | | | | | | | | | | | | |
From net investment income | | | (0.28 | ) | | | — | | | | | | (0.26 | ) | | | — | |
From net realized gain on investments | | | (0.16 | ) | | | — | | | | | | (0.16 | ) | | | — | |
| | | | | | | | | | | | | | | | | | |
Total dividends and distributions | | | (0.44 | ) | | | — | | | | | | (0.42 | ) | | | — | |
| | | | | | | | | | | | | | | | | | |
Net asset value at end of period | | $ | 12.65 | | | $ | 10.89 | | | | | $ | 12.61 | | | $ | 10.87 | |
| | | | | | | | | | | | | | | | | | |
Total investment return | | | 20.33 | % | | | 8.90 | %(b)(c) | | | | | 20.03 | % | | | 8.70 | %(b)(c) |
Ratios (to average net assets)/Supplemental Data: | | | | | | | | | | | | | | | | | | |
Net investment income (loss) | | | 3.03 | % | | | 3.66 | %†† | | | | | 2.78 | % | | | 3.26 | %†† |
Net expenses | | | 0.79 | % | | | 0.80 | %†† | | | | | 1.04 | % | | | 1.05 | %†† |
Portfolio turnover rate | | | 45 | % | | | 43 | % | | | | | 45 | % | | | 43 | % |
Net assets at end of period (in 000’s) | | $ | 70,290 | | | $ | 56,565 | | | | | $ | 1,095,097 | | | $ | 793,902 | |
| ‡ | Less than one cent per share. |
| (a) | Per share data based on average shares outstanding during the period. |
| (b) | Total investment return is not annualized. |
| (c) | Total investment returns may reflect adjustments to conform to generally accepted accounting principles. |
| | | | |
| M-330 | | MainStay VP MFS® Utilities Portfolio | | The notes to the financial statements are an integral part of,
and should be read in conjunction with, the financial statements. |
MainStay VP Mid Cap Core Portfolio
Investment and Performance Comparison1 (Unaudited)
Performance data quoted represents past performance. Past performance is no guarantee of future results. Because of market volatility, current performance may be lower or higher than the figures shown. Investment return and principal value will fluctuate, and as a result, when shares are redeemed, they may be worth more or less than their original cost. The performance table and graph do not reflect any deduction of sales charges, mortality and expense charges, contract charges or administrative charges. Please refer to the Performance Summary appropriate for your policy. For performance information current to the most recent month-end, please call 800-598-2019 or visit www.newyorklife.com.
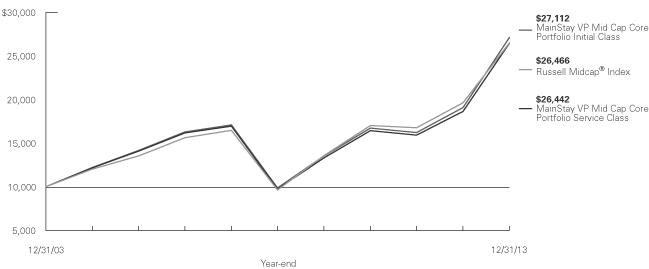
Average Annual Total Returns for the Year Ended December 31, 2013
| | | | | | | | | | | | | | | | |
| Class | | One Year | | | Five Years | | | Ten Years | | | Gross
Expense
Ratio2 | |
| Initial Class Shares | | | 42.18 | % | | | 22.37 | % | | | 10.49 | % | | | 0.85 | % |
| Service Class Shares | | | 41.82 | | | | 22.07 | | | | 10.21 | | | | 1.10 | |
| | | | | | | | | | | | |
| Benchmark Performance | | One
Year | | | Five
Years | | | Ten
Years | |
Russell Midcap® Index3 | | | 34.76 | % | | | 22.36 | % | | | 10.22 | % |
Average Lipper Variable Products Mid-Cap Core Portfolio4 | | | 34.74 | | | | 21.09 | | | | 9.34 | |
| 1. | Performance figures reflect certain fee waivers and/or expense limitations, without which total returns may have been different. For information on current fee waivers and/or expense limitations, please refer to the notes to the financial statements. |
| 2. | The gross expense ratios presented reflect the Portfolio’s “Total Annual Portfolio Operating Expenses” from the most recent Prospectus and may differ from other expense ratios disclosed in this report. |
| 3. | Please refer to pages M-2 and M-3 for additional explanations and disclosure regarding the Portfolios, their benchmark indices and other indices mentioned in the reports. |
| 4. | The Average Lipper Variable Products Mid-Cap Core Portfolio is representative of portfolios that, by portfolio practice, invest at least 75% of their equity assets in companies with market capitalizations (on a three-year weighted basis) below Lipper’s U.S. diversified equity large-cap floor. Mid-cap core portfolios have more latitude in the companies in which they invest. These portfolios typically have average characteristics compared to the S&P MidCap 400® Index. Lipper Inc. is an independent monitor of fund performance. Results are based on total returns with all dividend and capital gain distributions reinvested. |
| | | | |
| mainstayinvestments.com | | | M-331 | |
Cost in Dollars of a $1,000 Investment in MainStay VP Mid Cap Core Portfolio (Unaudited)
The example below is intended to describe the fees and expenses borne by shareholders during the six-month period from July 1, 2013, to December 31, 2013, and the impact of those costs on your investment.
Example
As a shareholder of the Portfolio, you incur two types of costs: (1) transaction costs, including exchange fees and sales charges (loads) on purchases (as applicable), and (2) ongoing costs, including management fees, distribution and/or service (12b-1) fees, and other Portfolio expenses (as applicable). This example is intended to help you understand your ongoing costs (in dollars) of investing in the Portfolio and to compare these costs with the ongoing costs of investing in other Portfolios. The example is based on an investment of $1,000 made at the beginning of the six-month period and held for the entire period from July 1, 2013, to December 31, 2013. Shares are only sold in connection with variable life and annuity contracts and the example does not reflect any contract level or transactional fees or expenses. If these costs had been included, your costs would have been higher.
This example illustrates your Portfolio’s ongoing costs in two ways:
Actual Expenses
The second and third data columns in the table below provide information about actual account values and actual expenses. You may use the information in these columns, together with the amount you invested, to estimate the expenses that you paid during the six months ended
December 31, 2013. Simply divide your account value by $1,000 (for example, an $8,600 account value divided by $1,000 = 8.6), then multiply the result by the number under the heading entitled ‘‘Expenses Paid During Period’’ to estimate the expenses you paid on your account during this period.
Hypothetical Example for Comparison Purposes
The fourth and fifth data columns in the table below provide information about hypothetical account values and hypothetical expenses based on the Portfolio’s actual expense ratio and an assumed rate of return of 5% per year before expenses, which is not the Portfolio’s actual return. The hypothetical account values and expenses may not be used to estimate the actual ending account balances or expenses you paid for the six-month period shown. You may use this information to compare the ongoing costs of investing in the Portfolio with the ongoing costs of investing in other Portfolios. To do so, compare this 5% hypothetical example with the 5% hypothetical examples that appear in the shareholder reports of the other Portfolios.
Please note that the expenses shown in the table are meant to highlight your ongoing costs only and do not reflect any transactional costs, such as exchange fees or sales charges (loads). Therefore, the fourth and fifth data columns of the table are useful in comparing ongoing costs only and will not help you determine the relative total costs of owning different funds. In addition, if these transactional costs were included, your costs would have been higher.
| | | | | | | | | | | | | | | | | | | | |
| | | | | | | | | | | | | | | | |
| Share Class | | Beginning
Account
Value
7/1/13 | | | Ending Account
Value (Based
on Actual
Returns and
Expenses)
12/31/13 | | | Expenses
Paid
During
Period1 | | | Ending Account
Value (Based
on Hypothetical
5% Annualized
Return and
Actual Expenses)
12/31/13 | | | Expenses
Paid
During
Period1 | |
| | | | | |
| Initial Class Shares | | $ | 1,000.00 | | | $ | 1,199.20 | | | $ | 4.66 | | | $ | 1,021.00 | | | $ | 4.28 | |
| | | | | |
| Service Class Shares | | $ | 1,000.00 | | | $ | 1,197.70 | | | $ | 6.04 | | | $ | 1,019.70 | | | $ | 5.55 | |
| 1. | Expenses are equal to the Portfolio’s annualized expense ratio of each class (0.84% for Initial Class and 1.09% for Service Class) multiplied by the average account value over the period, divided by 365 and multiplied by 184 (to reflect the six-month period). The table above represents the actual expenses incurred during the six-month period. |
| | |
| M-332 | | MainStay VP Mid Cap Core Portfolio |
Industry Composition as of December 31, 2013 (Unaudited)
| | | | |
| Specialty Retail | | | 5.7 | % |
| Insurance | | | 5.4 | |
| Health Care Providers & Services | | | 5.2 | |
| Real Estate Investment Trusts | | | 4.2 | |
| Hotels, Restaurants & Leisure | | | 4.0 | |
| Airlines | | | 3.5 | |
| IT Services | | | 3.4 | |
| Media | | | 3.4 | |
| Oil, Gas & Consumable Fuels | | | 3.4 | |
| Pharmaceuticals | | | 3.4 | |
| Diversified Financial Services | | | 3.1 | |
| Computers & Peripherals | | | 3.0 | |
| Energy Equipment & Services | | | 2.6 | |
| Capital Markets | | | 2.5 | |
| Software | | | 2.5 | |
| Textiles, Apparel & Luxury Goods | | | 2.3 | |
| Machinery | | | 2.2 | |
| Internet Software & Services | | | 2.1 | |
| Semiconductors & Semiconductor Equipment | | | 2.1 | |
| Professional Services | | | 1.9 | |
| Communications Equipment | | | 1.6 | |
| Auto Components | | | 1.5 | |
| Food & Staples Retailing | | | 1.5 | |
| Road & Rail | | | 1.5 | |
| Commercial Services & Supplies | | | 1.4 | |
| Exchange-Traded Funds | | | 1.4 | |
| Health Care Equipment & Supplies | | | 1.4 | |
| Personal Products | | | 1.4 | |
| Biotechnology | | | 1.3 | |
| Trading Companies & Distributors | | | 1.3 | |
| Containers & Packaging | | | 1.1 | |
| | | | |
| Diversified Consumer Services | | | 1.1 | % |
| Paper & Forest Products | | | 1.1 | |
| Wireless Telecommunication Services | | | 1.1 | |
| Electric Utilities | | | 1.0 | |
| Internet & Catalog Retail | | | 1.0 | |
| Multi-Utilities | | | 1.0 | |
| Beverages | | | 0.9 | |
| Chemicals | | | 0.9 | |
| Electronic Equipment & Instruments | | | 0.9 | |
| Aerospace & Defense | | | 0.8 | |
| Diversified Telecommunication Services | | | 0.8 | |
| Electrical Equipment | | | 0.8 | |
| Office Electronics | | | 0.8 | |
| Tobacco | | | 0.8 | |
| Commercial Banks | | | 0.7 | |
| Independent Power Producers & Energy Traders | | | 0.7 | |
| Metals & Mining | | | 0.7 | |
| Multiline Retail | | | 0.7 | |
| Life Sciences Tools & Services | | | 0.6 | |
| Thrifts & Mortgage Finance | | | 0.6 | |
| Construction & Engineering | | | 0.5 | |
| Food Products | | | 0.5 | |
| Household Products | | | 0.3 | |
| Gas Utilities | | | 0.1 | |
| Household Durables | | | 0.1 | |
| Automobiles | | | 0.0 | ‡ |
| Real Estate Management & Development | | | 0.0 | ‡ |
| Short-Term Investment | | | 0.2 | |
| Other Assets, Less Liabilities | | | –0.0 | ‡ |
| | | | |
| | | 100.0 | % |
| | | | |
See Portfolio of Investments beginning on page M-336 for specific holdings within these categories.
| ‡ | Less than one-tenth of a percent. |
Top Ten Holdings as of December 31, 2013 (excluding short-term investment) (Unaudited)
| 2. | McGraw Hill Financial, Inc. |
| 4. | Ameriprise Financial, Inc. |
| | | | |
| mainstayinvestments.com | | | M-333 | |
Portfolio Management Discussion and Analysis (Unaudited)
Answers to the questions reflect the views of Migene Kim, CFA, and Andrew Ver Planck, CFA, of Cornerstone Capital Management Holdings LLC (“Cornerstone Holdings”), the Portfolio’s Subadvisor.
How did MainStay VP Mid Cap Core Portfolio perform relative to its benchmark and peers for the 12 months ended December 31, 2013?
For the 12 months ended December 31, 2013, MainStay VP Mid Cap Core Portfolio returned 42.18% for Initial Class shares and 41.82% for Service Class shares. Over the same period, both share classes outperformed the 34.76% return of the Russell Midcap® Index,1 which is the Portfolio’s broad-based securities-market index. Both share classes also outperformed the 34.74% return of the average Lipper1 Variable Products Mid-Cap Core Portfolio for the 12 months ended December 31, 2013.
What factors affected the Portfolio’s relative performance during the reporting period?
Quantitative factors, such as valuation and momentum, generally worked well in 2013, which translated into solid relative returns for many domestic quantitative strategies. The Portfolio recorded its best annual relative performance since inception, helped by the strength of the underlying stock selection model. The model’s performance was robust in that our suites of valuation and momentum factors both worked well. The model was particularly effective in selecting top performers relative to the S&P 500® Index, which is important for long-only strategies. Share-issuance/repurchase, sales-multiple and credit-spread factors also worked well, while earnings momentum and sentiment factors were less effective.
Which sectors were the strongest positive contributors to the Portfolio’s relative performance, and which sectors were particularly weak?
The strongest positive sector contributions to the Portfolio’s performance relative to the Russell Midcap® Index came from industrials, health care and information technology. (Contributions take weightings and total returns into account.) Although stock selection was the main driver in each of these sectors, the Portfolio also benefited from an overweight position in health care. The sectors that detracted the most from the Portfolio’s relative performance were consumer discretionary and energy, largely because of unfavorable stock selection. Telecommunication services was another weak contributor to relative performance, even though the sector provided a
positive return. An overweight position in the sector detracted, but positive stock selection more than offset the allocation effect.
During the reporting period, which individual stocks made the strongest positive contributions to the Portfolio’s absolute performance and which stocks detracted the most?
Among the strongest positive contributors to the Portfolio’s absolute performance were semiconductor device maker Micron Technology, airline company Delta Air Lines and computers & peripherals company Western Digital. The Portfolio held a large position in Micron because the stock has a substantial weight in the benchmark. Additionally, our stock selection model suggested that the shares had high alpha2 potential. The stock returned an impressive 243% in 2013, making it the most substantial contributor to absolute performance. Delta Air Lines, also one of the largest stocks in the Russell Midcap® Index, returned 132.5% during the reporting period. The Portfolio held a large number of Delta Air Lines shares because of its weight in the benchmark and the return potential we perceived in the stock. Western Digital, a major player in the computer storage space, was also a strong contributor to absolute performance.
Among the Portfolio’s weakest contributors to absolute performance were specialty retailers Abercrombie & Fitch and American Eagle Outfitters and electronic manufacturing service provider Jabil Circuits. Abercrombie & Fitch and American Eagle Outfitters struggled to meet earnings expectations, as they tried to compete in the crowded—and often fickle—retailers-to-teens segment. Jabil Circuit saw its share price drop after the company missed earnings estimates amid concerns that demand for Apple products was slowing.
Did the Portfolio make any significant purchases or sales during the reporting period?
The Portfolio started building a position in capital markets company Ameriprise Financial in July 2013, shifting to an overweight position in September because, in our opinion, the valuation became attractive while sentiment and momentum scores held up. The Portfolio started purchasing shares of office electronics company Xerox in March 2013 and, and by the end of the reporting period, increased the position
| 1. | Please refer to pages M-2 and M-3 for additional explanations and disclosure regarding the Portfolios, their benchmark indices and service providers mentioned in the reports. |
| 2. | Alpha is a measure of risk-adjusted performance in relation to a benchmark. The risk-adjusted performance of a portfolio is compared with the performance of a benchmark, and any excess return (positive or negative) is the portfolio’s alpha. |
| | |
| M-334 | | MainStay VP Mid Cap Core Portfolio |
to as fully overweight as our model would allow. According to our model, the stock’s return potential increased on the basis of attractive valuation, sentiment and momentum readings.
The Portfolio sold shares of specialty chemicals company Sherwin-Williams through much of 2013, completely exiting the position in October. Our stock selection model deemed Sherwin-Williams expensive, and the company’s momentum and sentiment scores progressively deteriorated. Shares of health care REIT HCP were also liquidated during the reporting period. Our model gave HCP poor rankings for momentum and valuation.
How did the Portfolio’s sector weightings change during the reporting period?
Industrials saw the most substantial increase in relative sector weighting during the reporting period. The Portfolio moved from a significantly underweight position relative to the Russell Midcap® Index to a posi- tion that was modestly underweight. The increase resulted from purchases of stocks in electrical components, human resources & employment, and air-lines. The Portfolio added to an already overweight position in information technology through purchases
in computer hardware, semiconductors and office electronics companies.
Health care saw the most substantial decrease in relative sector weighting, as the Portfolio moved from a significantly overweight position relative to the Russell Midcap® Index to a neutral position. The decrease resulted from trimming biotechnology and health care equipment stocks. Materials exposure went from a neutral position relative to the benchmark to an underweight position, as the Portfolio disposed of some chemicals stocks.
How was the Portfolio positioned at the end of the reporting period?
As of December 31, 2013, the Portfolio was most significantly overweight relative to the Russell Midcap® Index in the information technology sector, followed by consumer discretionary. While exposure to information technology increased during the reporting period, the position in consumer discretionary remained relatively stable. As of the same date, the Portfolio was most significantly underweight in the utilities and financials sectors. The Portfolio’s stance on these sectors remained consistently negative throughout the reporting period.
The opinions expressed are those of the portfolio managers as of the date of this report and are subject to change. There is no guarantee that any forecasts made will come to pass. This material does not constitute investment advice and is not intended as an endorsement of any specific investment.
Not all MainStay VP Portfolios and/or share classes are available under all policies.
| | | | |
| mainstayinvestments.com | | | M-335 | |
Portfolio of Investments December 31, 2013
| | | | | | | | |
| | |
Shares | | | Value | |
| Common Stocks 98.4%† | |
Aerospace & Defense 0.8% | |
Exelis, Inc. | | | 8,536 | | | $ | 162,696 | |
Huntington Ingalls Industries, Inc. | | | 15,253 | | | | 1,372,923 | |
Spirit AeroSystems Holdings, Inc. Class A (a) | | | 150,444 | | | | 5,127,131 | |
| | | | | | | | |
| | | | | | | 6,662,750 | |
| | | | | | | | |
Airlines 3.5% | |
Alaska Air Group, Inc. | | | 67,906 | | | | 4,982,263 | |
Copa Holdings S.A. Class A | | | 32,534 | | | | 5,209,019 | |
¨Delta Air Lines, Inc. | | | 271,753 | | | | 7,465,055 | |
Southwest Airlines Co. | | | 333,248 | | | | 6,278,392 | |
United Continental Holdings, Inc. (a) | | | 118,899 | | | | 4,497,949 | |
| | | | | | | | |
| | | | | | | 28,432,678 | |
| | | | | | | | |
Auto Components 1.5% | |
Delphi Automotive PLC | | | 41,851 | | | | 2,516,501 | |
Goodyear Tire & Rubber Co. (The) | | | 228,739 | | | | 5,455,425 | |
Lear Corp. | | | 48,229 | | | | 3,905,102 | |
| | | | | | | | |
| | | | | | | 11,877,028 | |
| | | | | | | | |
Automobiles 0.0%‡ | |
Thor Industries, Inc. | | | 4,014 | | | | 221,693 | |
| | | | | | | | |
| | |
Beverages 0.9% | | | | | | | | |
Coca-Cola Enterprises, Inc. | | | 73,165 | | | | 3,228,772 | |
Dr. Pepper Snapple Group, Inc. | | | 77,228 | | | | 3,762,548 | |
| | | | | | | | |
| | | | | | | 6,991,320 | |
| | | | | | | | |
Biotechnology 1.3% | |
Cubist Pharmaceuticals, Inc. (a) | | | 58,122 | | | | 4,002,862 | |
United Therapeutics Corp. (a) | | | 53,625 | | | | 6,063,915 | |
Vertex Pharmaceuticals, Inc. (a) | | | 8,182 | | | | 607,923 | |
| | | | | | | | |
| | | | | | | 10,674,700 | |
| | | | | | | | |
Capital Markets 2.5% | |
¨Ameriprise Financial, Inc. | | | 65,261 | | | | 7,508,278 | |
Artisan Partners Asset Management, Inc. | | | 65,774 | | | | 4,287,807 | |
Lazard, Ltd. Class A | | | 119,636 | | | | 5,421,904 | |
LPL Financial Holdings, Inc. | | | 62,015 | | | | 2,916,565 | |
Raymond James Financial, Inc. | | | 6,507 | | | | 339,600 | |
| | | | | | | | |
| | | | | | | 20,474,154 | |
| | | | | | | | |
Chemicals 0.9% | |
CF Industries Holdings, Inc. | | | 18,496 | | | | 4,310,308 | |
Eastman Chemical Co. | | | 3,876 | | | | 312,793 | |
Scotts Miracle-Gro Co. (The) Class A | | | 37,167 | | | | 2,312,531 | |
| | | | | | | | |
| | | | | | | 6,935,632 | |
| | | | | | | | |
Commercial Banks 0.7% | |
CIT Group, Inc. | | | 42,651 | | | | 2,223,397 | |
Comerica, Inc. | | | 23,181 | | | | 1,102,025 | |
| | | | | | | | |
| | |
Shares | | | Value | |
Commercial Banks (continued) | |
Fifth Third Bancorp | | | 65,886 | | | $ | 1,385,582 | |
KeyCorp | | | 71,455 | | | | 958,926 | |
| | | | | | | | |
| | | | | | | 5,669,930 | |
| | | | | | | | |
Commercial Services & Supplies 1.4% | | | | | | | | |
ADT Corp. (The) | | | 15,707 | | | | 635,662 | |
Pitney Bowes, Inc. | | | 215,028 | | | | 5,010,153 | |
R.R. Donnelley & Sons Co. | | | 266,083 | | | | 5,396,163 | |
| | | | | | | | |
| | | | | | | 11,041,978 | |
| | | | | | | | |
Communications Equipment 1.6% | | | | | | | | |
Brocade Communications Systems, Inc. (a) | | | 566,855 | | | | 5,028,004 | |
EchoStar Corp. Class A (a) | | | 13,803 | | | | 686,285 | |
Harris Corp. | | | 80,737 | | | | 5,636,250 | |
Polycom, Inc. (a) | | | 179,728 | | | | 2,018,345 | |
| | | | | | | | |
| | | | | | | 13,368,884 | |
| | | | | | | | |
Computers & Peripherals 3.0% | | | | | | | | |
Lexmark International, Inc. Class A | | | 129,964 | | | | 4,616,321 | |
NetApp, Inc. | | | 152,160 | | | | 6,259,862 | |
SanDisk Corp. | | | 93,883 | | | | 6,622,507 | |
¨Western Digital Corp. | | | 84,586 | | | | 7,096,766 | |
| | | | | | | | |
| | | | | | | 24,595,456 | |
| | | | | | | | |
Construction & Engineering 0.5% | | | | | | | | |
AECOM Technology Corp. (a) | | | 145,159 | | | | 4,272,029 | |
| | | | | | | | |
| | |
Containers & Packaging 1.1% | | | | | | | | |
Packaging Corporation of America | | | 56,041 | | | | 3,546,274 | |
Rock-Tenn Co. Class A | | | 7,581 | | | | 796,081 | |
Sealed Air Corp. | | | 134,633 | | | | 4,584,254 | |
| | | | | | | | |
| | | | | | | 8,926,609 | |
| | | | | | | | |
Diversified Consumer Services 1.1% | | | | | | | | |
Apollo Education Group, Inc. (a) | | | 54,844 | | | | 1,498,338 | |
DeVry Education Group, Inc. | | | 75,374 | | | | 2,675,777 | |
Graham Holdings Co. Class B | | | 7,308 | | | | 4,847,543 | |
| | | | | | | | |
| | | | | | | 9,021,658 | |
| | | | | | | | |
Diversified Financial Services 3.1% | | | | | | | | |
Interactive Brokers Group, Inc. Class A | | | 166,295 | | | | 4,047,620 | |
IntercontinentalExchange Group, Inc. | | | 5,751 | | | | 1,293,515 | |
Leucadia National Corp. | | | 27,574 | | | | 781,447 | |
¨McGraw Hill Financial, Inc. | | | 96,603 | | | | 7,554,355 | |
Moody’s Corp. | | | 84,921 | | | | 6,663,751 | |
NASDAQ OMX Group, Inc. (The) | | | 122,258 | | | | 4,865,868 | |
| | | | | | | | |
| | | | | | | 25,206,556 | |
| | | | | | | | |
Diversified Telecommunication Services 0.8% | |
Frontier Communications Corp. | | | 1,042,690 | | | | 4,848,509 | |
tw telecom, Inc. (a) | | | 25,234 | | | | 768,880 | |
| † | Percentages indicated are based on Portfolio net assets. |
| ¨ | | Among the Portfolio’s 10 largest holdings, as of December 31, 2013, excluding short-term investment. May be subject to change daily. |
| | | | |
| M-336 | | MainStay VP Mid Cap Core Portfolio | | The notes to the financial statements are an integral part of,
and should be read in conjunction with, the financial statements. |
| | | | | | | | |
| | |
Shares | | | Value | |
| Common Stocks (continued) | |
Diversified Telecommunication Services (continued) | |
Windstream Holdings, Inc. | | | 109,884 | | | $ | 876,874 | |
| | | | | | | | |
| | | | | | | 6,494,263 | |
| | | | | | | | |
Electric Utilities 1.0% | | | | | | | | |
Edison International | | | 122,401 | | | | 5,667,166 | |
PPL Corp. | | | 10,350 | | | | 311,432 | |
Xcel Energy, Inc. | | | 81,110 | | | | 2,266,213 | |
| | | | | | | | |
| | | | | | | 8,244,811 | |
| | | | | | | | |
Electrical Equipment 0.8% | | | | | | | | |
Regal-Beloit Corp. | | | 208 | | | | 15,334 | |
Rockwell Automation, Inc. | | | 56,494 | | | | 6,675,331 | |
| | | | | | | | |
| | | | | | | 6,690,665 | |
| | | | | | | | |
Electronic Equipment, Instruments & Components 0.9% | |
CDW Corp. | | | 58,293 | | | | 1,361,725 | |
FLIR Systems, Inc. | | | 65,754 | | | | 1,979,195 | |
Jabil Circuit, Inc. | | | 184,913 | | | | 3,224,883 | |
Vishay Intertechnology, Inc. (a) | | | 31,908 | | | | 423,100 | |
| | | | | | | | |
| | | | | | | 6,988,903 | |
| | | | | | | | |
Energy Equipment & Services 2.6% | |
Helmerich & Payne, Inc. | | | 54,931 | | | | 4,618,599 | |
Nabors Industries, Ltd. | | | 157,767 | | | | 2,680,461 | |
Oil States International, Inc. (a) | | | 47,735 | | | | 4,855,604 | |
Patterson-UTI Energy, Inc. | | | 195,079 | | | | 4,939,400 | |
RPC, Inc. | | | 248,024 | | | | 4,427,229 | |
| | | | | | | | |
| | | | | | | 21,521,293 | |
| | | | | | | | |
Food & Staples Retailing 1.5% | |
¨Kroger Co. (The) | | | 176,558 | | | | 6,979,338 | |
Safeway, Inc. | | | 161,444 | | | | 5,258,231 | |
| | | | | | | | |
| | | | | | | 12,237,569 | |
| | | | | | | | |
Food Products 0.5% | |
Bunge, Ltd. | | | 44,828 | | | | 3,680,827 | |
Tyson Foods, Inc. Class A | | | 5,076 | | | | 169,843 | |
| | | | | | | | |
| | | | | | | 3,850,670 | |
| | | | | | | | |
Gas Utilities 0.1% | |
UGI Corp. | | | 21,102 | | | | 874,889 | |
| | | | | | | | |
|
Health Care Equipment & Supplies 1.4% | |
Alere, Inc. (a) | | | 317 | | | | 11,475 | |
Boston Scientific Corp. (a) | | | 550,824 | | | | 6,620,905 | |
C.R. Bard, Inc. | | | 693 | | | | 92,820 | |
Edwards Lifesciences Corp. (a) | | | 276 | | | | 18,150 | |
Hill-Rom Holdings, Inc. | | | 103,145 | | | | 4,264,014 | |
Zimmer Holdings, Inc. | | | 1,697 | | | | 158,144 | |
| | | | | | | | |
| | | | | | | 11,165,508 | |
| | | | | | | | |
Health Care Providers & Services 5.2% | |
AmerisourceBergen Corp. | | | 65,527 | | | | 4,607,203 | |
| | | | | | | | |
| | |
Shares | | | Value | |
Health Care Providers & Services (continued) | |
¨Cardinal Health, Inc. | | | 112,717 | | | $ | 7,530,623 | |
Community Health Systems, Inc. (a) | | | 3,686 | | | | 144,749 | |
DaVita HealthCare Partners, Inc. (a) | | | 50,133 | | | | 3,176,928 | |
HCA Holdings, Inc. (a) | | | 131,546 | | | | 6,276,060 | |
Health Net, Inc. (a) | | | 77,527 | | | | 2,300,226 | |
Henry Schein, Inc. (a) | | | 4,385 | | | | 501,030 | |
Humana, Inc. | | | 14,599 | | | | 1,506,909 | |
Laboratory Corporation of America Holdings (a) | | | 23,685 | | | | 2,164,098 | |
LifePoint Hospitals, Inc. (a) | | | 721 | | | | 38,098 | |
Omnicare, Inc. | | | 76,361 | | | | 4,609,150 | |
Tenet Healthcare Corp. (a) | | | 43,197 | | | | 1,819,458 | |
Universal Health Services, Inc. Class B | | | 37,622 | | | | 3,057,164 | |
VCA Antech, Inc. (a) | | | 154,831 | | | | 4,855,500 | |
| | | | | | | | |
| | | | | | | 42,587,196 | |
| | | | | | | | |
Hotels, Restaurants & Leisure 4.0% | |
Bally Technologies, Inc. (a) | | | 64,110 | | | | 5,029,429 | |
Brinker International, Inc. | | | 102,614 | | | | 4,755,133 | |
International Game Technology | | | 261,635 | | | | 4,751,292 | |
MGM Resorts International (a) | | | 231,526 | | | | 5,445,491 | |
Six Flags Entertainment Corp. | | | 8,752 | | | | 322,249 | |
Wendy’s Co. (The) | | | 247,790 | | | | 2,160,729 | |
Wyndham Worldwide Corp. | | | 55,283 | | | | 4,073,804 | |
Wynn Resorts, Ltd. | | | 33,095 | | | | 6,427,380 | |
| | | | | | | | |
| | | | | | | 32,965,507 | |
| | | | | | | | |
Household Durables 0.1% | |
PulteGroup, Inc. | | | 31,837 | | | | 648,520 | |
Whirlpool Corp. | | | 876 | | | | 137,409 | |
| | | | | | | | |
| | | | | | | 785,929 | |
| | | | | | | | |
Household Products 0.3% | |
Energizer Holdings, Inc. | | | 25,158 | | | | 2,723,102 | |
| | | | | | | | |
|
Independent Power Producers & Energy Traders 0.7% | |
AES Corp. (The) | | | 380,416 | | | | 5,519,836 | |
| | | | | | | | |
|
Insurance 5.4% | |
Alleghany Corp. (a) | | | 500 | | | | 199,980 | |
American National Insurance Co. | | | 2,424 | | | | 277,645 | |
Aon PLC | | | 1,390 | | | | 116,607 | |
Arch Capital Group, Ltd. (a) | | | 250 | | | | 14,923 | |
Assurant, Inc. | | | 25,193 | | | | 1,672,059 | |
Axis Capital Holdings, Ltd. | | | 105,806 | | | | 5,033,192 | |
Endurance Specialty Holdings, Ltd. | | | 5,512 | | | | 323,389 | |
Everest Re Group, Ltd. | | | 21,513 | | | | 3,353,231 | |
Fidelity National Financial, Inc. Class A | | | 67,954 | | | | 2,205,107 | |
Genworth Financial, Inc. Class A (a) | | | 298,943 | | | | 4,642,585 | |
Lincoln National Corp. | | | 119,245 | | | | 6,155,427 | |
PartnerRe, Ltd. | | | 37,840 | | | | 3,989,471 | |
Progressive Corp. (The) | | | 19,424 | | | | 529,693 | |
| | | | | | |
The notes to the financial statements are an integral part of,
and should be read in conjunction with, the financial statements. | | mainstayinvestments.com | | | M-337 | |
Portfolio of Investments December 31, 2013 (continued)
| | | | | | | | |
| | |
Shares | | | Value | |
| Common Stocks (continued) | |
Insurance (continued) | |
Protective Life Corp. | | | 76,873 | | | $ | 3,894,386 | |
StanCorp Financial Group, Inc. | | | 73,057 | | | | 4,840,026 | |
Unum Group | | | 127,984 | | | | 4,489,679 | |
Validus Holdings, Ltd. | | | 59,656 | | | | 2,403,540 | |
| | | | | | | | |
| | | | | | | 44,140,940 | |
| | | | | | | | |
Internet & Catalog Retail 1.0% | |
Expedia, Inc. | | | 82,700 | | | | 5,760,882 | |
Liberty Interactive Corp. Class A (a) | | | 84,925 | | | | 2,492,549 | |
| | | | | | | | |
| | | | | | | 8,253,431 | |
| | | | | | | | |
Internet Software & Services 2.1% | |
Akamai Technologies, Inc. (a) | | | 28,086 | | | | 1,325,097 | |
AOL, Inc. (a) | | | 91,925 | | | | 4,285,544 | |
IAC / InterActiveCorp | | | 82,035 | | | | 5,634,984 | |
VeriSign, Inc. (a) | | | 95,638 | | | | 5,717,240 | |
| | | | | | | | |
| | | | | | | 16,962,865 | |
| | | | | | | | |
IT Services 3.4% | |
Alliance Data Systems Corp. (a) | | | 1,332 | | | | 350,223 | |
Booz Allen Hamilton Holding Corp. | | | 90,964 | | | | 1,741,960 | |
Computer Sciences Corp. | | | 100,843 | | | | 5,635,107 | |
CoreLogic, Inc. (a) | | | 136,987 | | | | 4,867,148 | |
DST Systems, Inc. | | | 53,453 | | | | 4,850,325 | |
Genpact, Ltd. (a) | | | 158,764 | | | | 2,916,495 | |
Vantiv, Inc. Class A (a) | | | 41,585 | | | | 1,356,087 | |
Western Union Co. (The) | | | 334,134 | | | | 5,763,811 | |
| | | | | | | | |
| | | | | | | 27,481,156 | |
| | | | | | | | |
Life Sciences Tools & Services 0.6% | |
Agilent Technologies, Inc. | | | 51,759 | | | | 2,960,097 | |
Covance, Inc. (a) | | | 301 | | | | 26,506 | |
Quintiles Transnational Holdings, Inc. (a) | | | 32,631 | | | | 1,512,121 | |
| | | | | | | | |
| | | | | | | 4,498,724 | |
| | | | | | | | |
Machinery 2.2% | |
AGCO Corp. | | | 11,018 | | | | 652,155 | |
Colfax Corp. (a) | | | 104 | | | | 6,624 | |
Dover Corp. | | | 49,601 | | | | 4,788,481 | |
Ingersoll-Rand PLC | | | 19,884 | | | | 1,224,854 | |
Manitowoc Co., Inc. (The) | | | 53,249 | | | | 1,241,767 | |
Oshkosh Corp. | | | 99,474 | | | | 5,011,500 | |
PACCAR, Inc. | | | 1,514 | | | | 89,583 | |
Pentair, Ltd. | | | 14,667 | | | | 1,139,186 | |
Trinity Industries, Inc. | | | 76,911 | | | | 4,193,188 | |
| | | | | | | | |
| | | | | | | 18,347,338 | |
| | | | | | | | |
Media 3.4% | |
Cablevision Systems Corp. Class A | | | 136,089 | | | | 2,440,076 | |
Charter Communications, Inc. Class A (a) | | | 42,532 | | | | 5,816,676 | |
Cinemark Holdings, Inc. | | | 10,432 | | | | 347,699 | |
Clear Channel Outdoor Holdings, Inc. Class A | | | 13,942 | | | | 141,372 | |
| | | | | | | | |
| | |
Shares | | | Value | |
Media (continued) | |
DISH Network Corp. Class A (a) | | | 110,208 | | | $ | 6,383,247 | |
Gannett Co., Inc. | | | 191,612 | | | | 5,667,883 | |
John Wiley & Sons, Inc. Class A | | | 11,107 | | | | 613,106 | |
Liberty Media Corp. Class A (a) | | | 13,959 | | | | 2,044,296 | |
Regal Entertainment Group Class A | | | 233,136 | | | | 4,534,495 | |
| | | | | | | | |
| | | | | | | 27,988,850 | |
| | | | | | | | |
Metals & Mining 0.7% | |
Cliffs Natural Resources, Inc. | | | 5,379 | | | | 140,983 | |
Steel Dynamics, Inc. | | | 135,242 | | | | 2,642,629 | |
United States Steel Corp. | | | 105,356 | | | | 3,108,002 | |
| | | | | | | | |
| | | | | | | 5,891,614 | |
| | | | | | | | |
Multi-Utilities 1.0% | |
CenterPoint Energy, Inc. | | | 6,992 | | | | 162,075 | |
Consolidated Edison, Inc. | | | 26,782 | | | | 1,480,509 | |
DTE Energy Co. | | | 60,619 | | | | 4,024,495 | |
Public Service Enterprise Group, Inc. | | �� | 81,801 | | | | 2,620,904 | |
| | | | | | | | |
| | | | | | | 8,287,983 | |
| | | | | | | | |
Multiline Retail 0.7% | |
Big Lots, Inc. (a) | | | 63,155 | | | | 2,039,275 | |
Macy’s, Inc. | | | 64,297 | | | | 3,433,460 | |
| | | | | | | | |
| | | | | | | 5,472,735 | |
| | | | | | | | |
Office Electronics 0.8% | |
¨Xerox Corp. | | | 550,121 | | | | 6,694,972 | |
| | | | | | | | |
|
Oil, Gas & Consumable Fuels 3.4% | |
Chesapeake Energy Corp. | | | 199,402 | | | | 5,411,770 | |
CVR Energy, Inc. | | | 45,923 | | | | 1,994,436 | |
Energen Corp. | | | 3,304 | | | | 233,758 | |
HollyFrontier Corp. | | | 38,557 | | | | 1,915,897 | |
Kosmos Energy, Ltd. (a) | | | 261,126 | | | | 2,919,389 | |
Laredo Petroleum Holdings, Inc. (a) | | | 3,751 | | | | 103,865 | |
Murphy Oil Corp. | | | 26,386 | | | | 1,711,924 | |
Newfield Exploration Co. (a) | | | 8,432 | | | | 207,680 | |
Noble Energy, Inc. | | | 3,325 | | | | 226,466 | |
PBF Energy, Inc. Class A | | | 73,286 | | | | 2,305,578 | |
SandRidge Energy, Inc. (a) | | | 35,530 | | | | 215,667 | |
SM Energy Co. | | | 58,719 | | | | 4,880,136 | |
Southwestern Energy Co. (a) | | | 81,536 | | | | 3,206,811 | |
Tesoro Corp. | | | 23,406 | | | | 1,369,251 | |
Whiting Petroleum Corp. (a) | | | 2,917 | | | | 180,475 | |
WPX Energy, Inc. (a) | | | 44,083 | | | | 898,411 | |
| | | | | | | | |
| | | | | | | 27,781,514 | |
| | | | | | | | |
Paper & Forest Products 1.1% | |
Domtar Corp. | | | 52,981 | | | | 4,998,228 | |
International Paper Co. | | | 77,768 | | | | 3,812,965 | |
| | | | | | | | |
| | | | | | | 8,811,193 | |
| | | | | | | | |
Personal Products 1.4% | |
Herbalife, Ltd. | | | 71,525 | | | | 5,629,017 | |
| | | | |
| M-338 | | MainStay VP Mid Cap Core Portfolio | | The notes to the financial statements are an integral part of,
and should be read in conjunction with, the financial statements. |
| | | | | | | | |
| | |
Shares | | | Value | |
| Common Stocks (continued) | |
Personal Products (continued) | |
Nu Skin Enterprises, Inc. Class A | | | 42,913 | | | $ | 5,931,435 | |
| | | | | | | | |
| | | | | | | 11,560,452 | |
| | | | | | | | |
Pharmaceuticals 3.4% | |
¨Actavis PLC (a) | | | 50,214 | | | | 8,435,952 | |
Endo Health Solutions, Inc. (a) | | | 81,503 | | | | 5,498,192 | |
Jazz Pharmaceuticals PLC (a) | | | 44,923 | | | | 5,685,455 | |
¨Mylan, Inc. (a) | | | 154,090 | | | | 6,687,506 | |
Perrigo Co. PLC | | | 626 | | | | 96,066 | |
Zoetis, Inc. | | | 50,705 | | | | 1,657,547 | |
| | | | | | | | |
| | | | | | | 28,060,718 | |
| | | | | | | | |
Professional Services 1.9% | |
ManpowerGroup, Inc. | | | 63,466 | | | | 5,449,191 | |
Robert Half International, Inc. | | | 106,640 | | | | 4,477,813 | |
Towers Watson & Co. Class A | | | 45,626 | | | | 5,822,334 | |
| | | | | | | | |
| | | | | | | 15,749,338 | |
| | | | | | | | |
Real Estate Investment Trusts 4.2% | |
Apartment Investment & Management Co. Class A | | | 19,687 | | | | 510,090 | |
Boston Properties, Inc. | | | 13,445 | | | | 1,349,475 | |
CBL & Associates Properties, Inc. | | | 225,346 | | | | 4,047,214 | |
Equity Lifestyle Properties, Inc. | | | 32,241 | | | | 1,168,091 | |
Federal Realty Investment Trust | | | 409 | | | | 41,477 | |
Health Care REIT, Inc. | | | 6,161 | | | | 330,045 | |
Host Hotels & Resorts, Inc. | | | 217,606 | | | | 4,230,261 | |
Kimco Realty Corp. | | | 1,709 | | | | 33,753 | |
OMEGA Healthcare Investors, Inc. | | | 85,711 | | | | 2,554,188 | |
Plum Creek Timber Co., Inc. | | | 3,509 | | | | 163,204 | |
Regency Centers Corp. | | | 6,727 | | | | 311,460 | |
Senior Housing Properties Trust | | | 11,811 | | | | 262,558 | |
Tanger Factory Outlet Centers, Inc. | | | 5,119 | | | | 163,910 | |
Ventas, Inc. | | | 113,724 | | | | 6,514,111 | |
Vornado Realty Trust | | | 73,856 | | | | 6,557,674 | |
Weyerhaeuser Co. | | | 204,722 | | | | 6,463,073 | |
| | | | | | | | |
| | | | | | | 34,700,584 | |
| | | | | | | | |
Real Estate Management & Development 0.0%‡ | |
CBRE Group, Inc. Class A (a) | | | 8,625 | | | | 226,837 | |
| | | | | | | | |
| | |
Road & Rail 1.5% | | | | | | | | |
AMERCO (a) | | | 18,460 | | | | 4,390,527 | |
Avis Budget Group, Inc. (a) | | | 133,938 | | | | 5,413,774 | |
Con-way, Inc. | | | 67,399 | | | | 2,676,414 | |
| | | | | | | | |
| | | | | | | 12,480,715 | |
| | | | | | | | |
Semiconductors & Semiconductor Equipment 2.1% | |
First Solar, Inc. (a) | | | 81,419 | | | | 4,448,734 | |
Marvell Technology Group, Ltd. | | | 195,819 | | | | 2,815,877 | |
Maxim Integrated Products, Inc. | | | 661 | | | | 18,449 | |
Micron Technology, Inc. (a) | | | 82,978 | | | | 1,805,601 | |
| | | | | | | | |
| | |
Shares | | | Value | |
Semiconductors & Semiconductor Equipment (continued) | |
NVIDIA Corp. | | | 265,529 | | | $ | 4,253,775 | |
Skyworks Solutions, Inc. (a) | | | 138,057 | | | | 3,942,908 | |
| | | | | | | | |
| | | | | | | 17,285,344 | |
| | | | | | | | |
Software 2.5% | |
Activision Blizzard, Inc. | | | 282,684 | | | | 5,040,256 | |
Citrix Systems, Inc. (a) | | | 84,854 | | | | 5,367,015 | |
Intuit, Inc. | | | 45,721 | | | | 3,489,427 | |
Symantec Corp. | | | 282,268 | | | | 6,655,879 | |
| | | | | | | | |
| | | | | | | 20,552,577 | |
| | | | | | | | |
Specialty Retail 5.7% | |
Advance Auto Parts, Inc. | | | 51,513 | | | | 5,701,459 | |
Ascena Retail Group, Inc. (a) | | | 225,135 | | | | 4,763,857 | |
AutoZone, Inc. (a) | | | 316 | | | | 151,029 | |
Bed Bath & Beyond, Inc. (a) | | | 15,859 | | | | 1,273,478 | |
Best Buy Co., Inc. | | | 142,021 | | | | 5,663,797 | |
CST Brands, Inc. | | | 135,605 | | | | 4,979,416 | |
DSW, Inc. Class A | | | 33,265 | | | | 1,421,413 | |
GameStop Corp. Class A | | | 102,528 | | | | 5,050,529 | |
Gap, Inc. (The) | | | 104,742 | | | | 4,093,317 | |
Guess?, Inc. | | | 139,382 | | | | 4,330,599 | |
O’Reilly Automotive, Inc. (a) | | | 11,561 | | | | 1,488,016 | |
PetSmart, Inc. | | | 49,940 | | | | 3,633,135 | |
Staples, Inc. | | | 267,463 | | | | 4,249,987 | |
| | | | | | | | |
| | | | | | | 46,800,032 | |
| | | | | | | | |
Textiles, Apparel & Luxury Goods 2.3% | |
Coach, Inc. | | | 102,769 | | | | 5,768,424 | |
Deckers Outdoor Corp. (a) | | | 54,771 | | | | 4,625,959 | |
Fossil Group, Inc. (a) | | | 3,324 | | | | 398,681 | |
Hanesbrands, Inc. | | | 76,146 | | | | 5,350,779 | |
VF Corp. | | | 47,068 | | | | 2,934,219 | |
| | | | | | | | |
| | | | | | | 19,078,062 | |
| | | | | | | | |
Thrifts & Mortgage Finance 0.6% | |
Ocwen Financial Corp. (a) | | | 93,632 | | | | 5,191,894 | |
| | | | | | | | |
|
Tobacco 0.8% | |
¨Lorillard, Inc. | | | 136,157 | | | | 6,900,437 | |
| | | | | | | | |
|
Trading Companies & Distributors 1.3% | |
MRC Global, Inc. (a) | | | 149,040 | | | | 4,808,030 | |
United Rentals, Inc. (a) | | | 74,185 | | | | 5,782,721 | |
| | | | | | | | |
| | | | | | | 10,590,751 | |
| | | | | | | | |
Wireless Telecommunication Services 1.1% | |
Crown Castle International Corp. (a) | | | 33,824 | | | | 2,483,696 | |
Telephone & Data Systems, Inc. | | | 163,047 | | | | 4,203,352 | |
United States Cellular Corp. | | | 53,979 | | | | 2,257,402 | |
| | | | | | | | |
| | | | | | | 8,944,450 | |
| | | | | | | | |
Total Common Stocks
(Cost $641,780,909) | | | | | | | 805,758,702 | |
| | | | | | | | |
| | | | | | |
The notes to the financial statements are an integral part of,
and should be read in conjunction with, the financial statements. | | mainstayinvestments.com | | | M-339 | |
Portfolio of Investments December 31, 2013 (continued)
| | | | | | | | |
| | |
Shares | | | Value | |
| Exchange-Traded Funds 1.4% (b) | |
S&P 500 Index—SPDR Trust Series 1 | | | 31,043 | | | $ | 5,732,711 | |
S&P Midcap 400 Index—Midcap SPDR Trust Series 1 | | | 23,446 | | | | 5,725,513 | |
| | | | | | | | |
Total Exchange-Traded Funds
(Cost $10,580,928) | | | | | | | 11,458,224 | |
| | | | | | | | |
| | |
| | | | | | | | |
| | | Principal
Amount | | | | |
| Short-Term Investment 0.2% | |
Repurchase Agreement 0.2% | | | | | | | | |
State Street Bank and Trust Co.
0.00%, dated 12/31/13
due 1/2/14
Proceeds at Maturity $1,399,673 (Collateralized by a Federal National Mortgage Association security with a rate of 2.17% and a maturity date of 11/7/22, with a Principal Amount of $1,570,000 and a Market Value of $1,429,195) | | $ | 1,399,673 | | | | 1,399,673 | |
| | | | | | | | |
Total Short-Term Investment
(Cost $1,399,673) | | | | | | | 1,399,673 | |
| | | | | | | | |
Total Investments
(Cost $653,761,510) (c) | | | 100.0 | % | | | 818,616,599 | |
Other Assets, Less Liabilities | | | (0.0 | )‡ | | | (190,694 | ) |
Net Assets | | | 100.0 | % | | $ | 818,425,905 | |
| ‡ | Less than one-tenth of a percent. |
| (a) | Non-income producing security. |
| (b) | Exchange-Traded Fund—An investment vehicle that represents a basket of securities that is traded on an exchange. |
| (c) | As of December 31, 2013, cost is $656,452,343 for federal income tax purposes and net unrealized appreciation is as follows: |
| | | | |
Gross unrealized appreciation | | $ | 164,413,019 | |
Gross unrealized depreciation | | | (2,248,763 | ) |
| | | | |
Net unrealized appreciation | | $ | 162,164,256 | |
| | | | |
The following abbreviation is used in the above portfolio:
SPDR—Standard & Poor’s Depositary Receipt
The following is a summary of the fair valuations according to the inputs used as of December 31, 2013, for valuing the Portfolio’s assets.
Asset Valuation Inputs
| | | | | | | | | | | | | | | | |
Description | | Quoted Prices in
Active Markets
for Identical Assets (Level 1) | | | Significant Other
Observable Inputs (Level 2) | | | Significant
Unobservable
Inputs (Level 3) | | | Total | |
Investments in Securities (a) | | | | | | | | | | | | | | | | |
Common Stocks | | $ | 805,758,702 | | | $ | — | | | $ | — | | | $ | 805,758,702 | |
Exchange-Traded Funds | | | 11,458,224 | | | | — | | | | — | | | | 11,458,224 | |
Short-Term Investment | | | | | | | | | | | | | | | | |
Repurchase Agreement | | | — | | | | 1,399,673 | | | | — | | | | 1,399,673 | |
| | | | | | | | | | | | | | | | |
| Total Investments in Securities | | $ | 817,216,926 | | | $ | 1,399,673 | | | $ | — | | | $ | 818,616,599 | |
| | | | | | | | | | | | | | | | |
| (a) | For a complete listing of investments and their industries, see the Portfolio of Investments. |
The Portfolio recognizes transfers between the levels as of the beginning of the period.
For the year ended December 31, 2013, the Portfolio did not have any transfers between Level 1 and Level 2 fair value measurements. (See Note 2)
As of December 31, 2013, the Portfolio did not hold any investments with significant unobservable inputs (Level 3). (See Note 2)
| | | | |
| M-340 | | MainStay VP Mid Cap Core Portfolio | | The notes to the financial statements are an integral part of,
and should be read in conjunction with, the financial statements. |
Statement of Assets and Liabilities as of December 31, 2013
| | | | |
| Assets | | | | |
Investment in securities, at value
(identified cost $653,761,510) | | $ | 818,616,599 | |
Cash | | | 2,257 | |
Receivables: | | | | |
Investment securities sold | | | 2,029,888 | |
Fund shares sold | | | 1,339,561 | |
Dividends and interest | | | 826,430 | |
| | | | |
Total assets | | | 822,814,735 | |
| | | | |
| |
| Liabilities | | | | |
Payables: | | | | |
Investment securities purchased | | | 2,991,917 | |
Fund shares redeemed | | | 684,928 | |
Manager (See Note 3) | | | 545,748 | |
NYLIFE Distributors (See Note 3) | | | 86,727 | |
Shareholder communication | | | 40,362 | |
Professional fees | | | 31,591 | |
Custodian | | | 3,724 | |
Trustees | | | 750 | |
Accrued expenses | | | 3,083 | |
| | | | |
Total liabilities | | | 4,388,830 | |
| | | | |
Net assets | | $ | 818,425,905 | |
| | | | |
| |
| Net Assets Consist of | | | | |
Shares of beneficial interest outstanding (par value of $.001 per share) unlimited number of shares authorized | | $ | 50,826 | |
Additional paid-in capital | | | 525,934,048 | |
| | | | |
| | | 525,934,874 | |
Undistributed net investment income | | | 3,895,461 | |
Accumulated net realized gain (loss) on investments | | | 123,740,481 | |
Net unrealized appreciation (depreciation) on investments | | | 164,855,089 | |
| | | | |
Net assets | | $ | 818,425,905 | |
| | | | |
| | | | |
Initial Class | | | | |
Net assets applicable to outstanding shares | | $ | 397,963,987 | |
| | | | |
Shares of beneficial interest outstanding | | | 24,595,332 | |
| | | | |
Net asset value per share outstanding | | $ | 16.18 | |
| | | | |
Service Class | | | | |
Net assets applicable to outstanding shares | | $ | 420,461,918 | |
| | | | |
Shares of beneficial interest outstanding | | | 26,230,360 | |
| | | | |
Net asset value per share outstanding | | $ | 16.03 | |
| | | | |
| | | | | | |
The notes to the financial statements are an integral part of,
and should be read in conjunction with, the financial statements. | | mainstayinvestments.com | | | M-341 | |
Statement of Operations for the year ended December 31, 2013
| | | | |
| Investment Income (Loss) | | | | |
Income | | | | |
Dividends (a) | | $ | 10,424,156 | |
Interest | | | 72 | |
| | | | |
Total income | | | 10,928,703 | |
| | | | |
Expenses | | | | |
Manager (See Note 3) | | | 5,670,179 | |
Distribution and service—Service Class (See Note 3) | | | 876,701 | |
Shareholder communication | | | 108,777 | |
Professional fees | | | 64,917 | |
Custodian | | | 28,122 | |
Trustees | | | 12,862 | |
Miscellaneous | | | 19,560 | |
| | | | |
Total expenses before waiver/reimbursement | | | 6,781,118 | |
Expense waiver/reimbursement from Manager (See Note 3) | | | (213,462 | ) |
| | | | |
Net expenses | | | 6,567,656 | |
| | | | |
Net investment income (loss) | | | 3,856,572 | |
| | | | |
|
| Realized and Unrealized Gain (Loss) on Investments | |
Net realized gain (loss) on investments | | | 129,088,432 | |
Net change in unrealized appreciation (depreciation) on investments | | | 96,025,030 | |
| | | | |
Net realized and unrealized gain (loss) on investments | | | 225,113,462 | |
| | | | |
Net increase (decrease) in net assets resulting from operations | | $ | 228,970,034 | |
| | | | |
| (a) | Dividends recorded net of foreign withholding taxes in the amount of $722. |
| | | | |
| M-342 | | MainStay VP Mid Cap Core Portfolio | | The notes to the financial statements are an integral part of,
and should be read in conjunction with, the financial statements. |
Statements of Changes in Net Assets
for the years ended December 31, 2013 and December 31, 2012
| | | | | | | | |
| | | 2013 | | | 2012 | |
| Increase (Decrease) in Net Assets | |
Operations: | | | | | | | | |
Net investment income (loss) | | $ | 3,856,572 | | | $ | 6,966,529 | |
Net realized gain (loss) on investments | | | 129,088,432 | | | | 47,420,938 | |
Net change in unrealized appreciation (depreciation) on investments | | | 96,025,030 | | | | 34,681,767 | |
| | | | |
Net increase (decrease) in net assets resulting from operations | | | 228,970,034 | | | | 89,069,234 | |
| | | | |
Dividends and distributions to shareholders: | | | | | |
From net investment income: | | | | | | | | |
Initial Class | | | (3,655,512 | ) | | | (1,800,386 | ) |
Service Class | | | (3,087,497 | ) | | | (1,444,408 | ) |
| | | | |
| | | (6,743,009 | ) | | | (3,244,794 | ) |
| | | | |
From net realized gain on investments: | | | | | | | | |
Initial Class | | | (21,796,087 | ) | | | (18,994,762 | ) |
Service Class | | | (22,599,150 | ) | | | (22,948,043 | ) |
| | | | |
| | | (44,395,237 | ) | | | (41,942,805 | ) |
| | | | |
Total dividends and distributions to shareholders | | | (51,138,246 | ) | | | (45,187,599 | ) |
| | | | |
Capital share transactions: | | | | | | | | |
Net proceeds from sale of shares | | | 188,755,227 | | | | 50,029,189 | |
Net asset value of shares issued to shareholders in reinvestment of dividends and distributions | | | 51,138,246 | | | | 45,187,599 | |
Cost of shares redeemed | | | (114,030,160 | ) | | | (187,346,420 | ) |
| | | | |
Increase (decrease) in net assets derived from capital share transactions | | | 125,863,313 | | | | (92,129,632 | ) |
| | | | |
Net increase (decrease) in net assets | | | 303,695,101 | | | | (48,247,997 | ) |
| | |
| Net Assets | | | | | | | | |
Beginning of year | | | 514,730,804 | | | | 562,978,801 | |
| | | | |
End of year | | $ | 818,425,905 | | | $ | 514,730,804 | |
| | | | |
Undistributed net investment income at end of year | | $ | 3,895,461 | | | $ | 6,790,770 | |
| | | | |
| | | | | | |
The notes to the financial statements are an integral part of,
and should be read in conjunction with, the financial statements. | | mainstayinvestments.com | | | M-343 | |
Financial Highlights selected per share data and ratios
| | | | | | | �� | | | | | | | | | | | | | |
| | | Initial Class | |
| | | Year ended December 31, | |
| | | 2013 | | | 2012 | | | 2011 | | | 2010 | | | 2009 | |
Net asset value at beginning of year | | $ | 12.23 | | | $ | 11.40 | | | $ | 11.87 | | | $ | 9.63 | | | $ | 7.07 | |
| | | | | | | | | | | | | | | | | | | | |
Net investment income (loss) | | | 0.12 | (a) | | | 0.17 | (a) | | | 0.08 | (a) | | | 0.10 | | | | 0.07 | (a) |
Net realized and unrealized gain (loss) on investments | | | 4.93 | | | | 1.80 | | | | (0.44 | ) | | | 2.18 | | | | 2.54 | |
| | | | | | | | | | | | | | | | | | | | |
Total from investment operations | | | 5.05 | | | | 1.97 | | | | (0.36 | ) | | | 2.28 | | | | 2.61 | |
| | | | | | | | | | | | | | | | | | | | |
Less dividends and distributions: | | | | | | | | | | | | | | | | | | | | |
From net investment income | | | (0.16 | ) | | | (0.10 | ) | | | (0.11 | ) | | | (0.04 | ) | | | (0.05 | ) |
From net realized gain on investments | | | (0.94 | ) | | | (1.04 | ) | | | — | | | | — | | | | — | |
| | | | | | | | | | | | | | | | | | | | |
Total dividends and distributions | | | (1.10 | ) | | | (1.14 | ) | | | (0.11 | ) | | | (0.04 | ) | | | (0.05 | ) |
| | | | | | | | | | | | | | | | | | | | |
Net asset value at end of year | | $ | 16.18 | | | $ | 12.23 | | | $ | 11.40 | | | $ | 11.87 | | | $ | 9.63 | |
| | | | | | | | | | | | | | | | | | | | |
Total investment return | | | 42.18 | % | | | 17.52 | % | | | (2.99 | %) | | | 23.64 | % | | | 36.93 | % |
Ratios (to average net assets)/Supplemental Data: | | | | | | | | | | | | | | | | | | | | |
Net investment income (loss) | | | 0.79 | % | | | 1.38 | % | | | 0.63 | % | | | 0.86 | % | | | 0.84 | % |
Net expenses | | | 0.85 | % | | | 0.89 | % | | | 0.90 | % | | | 0.90 | % | | | 0.94 | % |
Expenses (before waiver/reimbursement) | | | 0.89 | % | | | — | | | | — | | | | — | | | | — | |
Portfolio turnover rate | | | 167 | % | | | 186 | % | | | 161 | % | | | 169 | % | | | 192 | % |
Net assets at end of year (in 000’s) | | $ | 397,964 | | | $ | 231,959 | | | $ | 295,511 | | | $ | 417,904 | | | $ | 348,595 | |
| (a) | Per share data based on average shares outstanding during the year. |
| | | | | | | | | | | | | | | | | | | | |
| | | Service Class | |
| | | Year ended December 31, | |
| | | 2013 | | | 2012 | | | 2011 | | | 2010 | | | 2009 | |
Net asset value at beginning of year | | $ | 12.13 | | | $ | 11.31 | | | $ | 11.78 | | | $ | 9.57 | | | $ | 7.02 | |
| | | | | | | | | | | | | | | | | | | | |
Net investment income (loss) | | | 0.08 | (a) | | | 0.15 | (a) | | | 0.05 | (a) | | | 0.07 | | | | 0.05 | (a) |
Net realized and unrealized gain (loss) on investments | | | 4.89 | | | | 1.78 | | | | (0.44 | ) | | | 2.17 | | | | 2.52 | |
| | | | | | | | | | | | | | | | | | | | |
Total from investment operations | | | 4.97 | | | | 1.93 | | | | (0.39 | ) | | | 2.24 | | | | 2.57 | |
| | | | | | | | | | | | | | | | | | | | |
Less dividends and distributions: | | | | | | | | | | | | | | | | | | | | |
From net investment income | | | (0.13 | ) | | | (0.07 | ) | | | (0.08 | ) | | | (0.03 | ) | | | (0.02 | ) |
From net realized gain on investments | | | (0.94 | ) | | | (1.04 | ) | | | — | | | | — | | | | — | |
| | | | | | | | | | | | | | | | | | | | |
Total dividends and distributions | | | (1.07 | ) | | | (1.11 | ) | | | (0.08 | ) | | | (0.03 | ) | | | (0.02 | ) |
| | | | | | | | | | | | | | | | | | | | |
Net asset value at end of year | | $ | 16.03 | | | $ | 12.13 | | | $ | 11.31 | | | $ | 11.78 | | | $ | 9.57 | |
| | | | | | | | | | | | | | | | | | | | |
Total investment return | | | 41.82 | % | | | 17.22 | % | | | (3.23 | %) | | | 23.33 | % | | | 36.58 | % |
Ratios (to average net assets)/Supplemental Data: | | | | | | | | | | | | | | | | | | | | |
Net investment income (loss) | | | 0.53 | % | | | 1.26 | % | | | 0.39 | % | | | 0.61 | % | | | 0.61 | % |
Net expenses | | | 1.10 | % | | | 1.14 | % | | | 1.15 | % | | | 1.15 | % | | | 1.19 | % |
Expenses (before waiver/reimbursement) | | | 1.14 | % | | | — | | | | — | | | | — | | | | — | |
Portfolio turnover rate | | | 167 | % | | | 186 | % | | | 161 | % | | | 169 | % | | | 192 | % |
Net assets at end of year (in 000’s) | | $ | 420,462 | | | $ | 282,772 | | | $ | 267,468 | | | $ | 299,601 | | | $ | 256,533 | |
| (a) | Per share data based on average shares outstanding during the year. |
| | | | |
| M-344 | | MainStay VP Mid Cap Core Portfolio | | The notes to the financial statements are an integral part of,
and should be read in conjunction with, the financial statements. |
MainStay VP Moderate Allocation Portfolio
Investment and Performance Comparison1 (Unaudited)
Performance data quoted represents past performance. Past performance is no guarantee of future results. Because of market volatility, current performance may be lower or higher than the figures shown. Investment return and principal value will fluctuate, and as a result, when shares are redeemed, they may be worth more or less than their original cost. The performance table and graph do not reflect any deduction of sales charges, mortality and expense charges, contract charges or administrative charges. Please refer to the Performance Summary appropriate for your policy. For performance information current to the most recent month-end, please call 800-598-2019 or visit www.newyorklife.com.
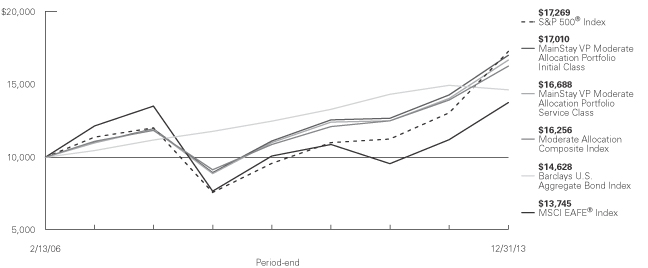
Average Annual Total Returns for the Period Ended December 31, 2013
| | | | | | | | | | | | | | | | |
| Class | | One Year | | | Five Years | | | Since
Inception
(2/13/06) | | | Gross
Expense
Ratio2 | |
| Initial Class Shares | | | 19.12 | % | | | 13.72 | % | | | 6.97 | % | | | 1.01 | % |
| Service Class Shares | | | 18.82 | | | | 13.45 | | | | 6.71 | | | | 1.26 | |
| | | | | | | | | | | | |
| Benchmark Performance | | One
Year | | | Five
Years | | | Since
Inception
(2/13/06) | |
S&P 500® Index3 | | | 32.39 | % | | | 17.94 | % | | | 7.17 | % |
MSCI EAFE® Index3 | | | 22.78 | | | | 12.44 | | | | 4.12 | |
Barclays U.S. Aggregate Bond Index3 | | | –2.02 | | | | 4.44 | | | | 4.94 | |
Moderate Allocation Composite Index3 | | | 16.70 | | | | 12.22 | | | | 6.36 | |
Average Lipper Variable Products Mixed-Asset Target Allocation Moderate Portfolio4 | | | 14.27 | | | | 12.12 | | | | 4.95 | |
| 1. | Performance figures reflect certain fee waivers and/or expense limitations, without which total returns may have been different. For information on current fee waivers and/or expense limitations, please refer to the notes to the financial statements. |
| 2. | The gross expense ratios presented reflect the Portfolio’s “Total Annual Portfolio Operating Expenses” from the most recent Prospectus and may differ from other expense ratios disclosed in this report. |
| 3. | Please refer to pages M-2 and M-3 for additional explanations and disclosure regarding the Portfolios, their benchmark indices and other indices mentioned in the reports. |
| 4. | The Average Lipper Variable Products Mixed-Asset Target Allocation Moderate Portfolio is representative of portfolios that, by portfolio practice, maintain a mix of between 40%-60% equity securities, with the remainder invested in bonds, cash, and cash equivalents. Lipper Inc. is an independent monitor of fund performance. Results are based on total returns with all dividend and capital gain distributions reinvested. |
| | | | |
| mainstayinvestments.com | | | M-345 | |
Cost in Dollars of a $1,000 Investment in MainStay VP Moderate Allocation Portfolio (Unaudited)
The example below is intended to describe the fees and expenses borne by shareholders during the six-month period from July 1, 2013, to December 31, 2013, and the impact of those costs on your investment.
Example
As a shareholder of the Portfolio, you incur two types of costs: (1) transaction costs, including exchange fees and sales charges (loads) on purchases (as applicable), and (2) ongoing costs, including management fees, distribution and/or service (12b-1) fees, and other Portfolio expenses (as applicable). This example is intended to help you understand your ongoing costs (in dollars) of investing in the Portfolio and to compare these costs with the ongoing costs of investing in other Portfolios. The example is based on an investment of $1,000 made at the beginning of the six-month period and held for the entire period from July 1, 2013, to December 31, 2013. Shares are only sold in connection with variable life and annuity contracts and the example does not reflect any contract level or transactional fees or expenses. If these costs had been included, your costs would have been higher.
This example illustrates your Portfolio’s ongoing costs in two ways:
Actual Expenses
The second and third data columns in the table below provide information about actual account values and actual expenses. You may use the information in these columns, together with the amount you invested, to estimate the expenses that you paid during the six months ended
December 31, 2013. Simply divide your account value by $1,000 (for example, an $8,600 account value divided by $1,000 = 8.6), then multiply the result by the number under the heading entitled ‘‘Expenses Paid During Period’’ to estimate the expenses you paid on your account during this period.
Hypothetical Example for Comparison Purposes
The fourth and fifth data columns in the table below provide information about hypothetical account values and hypothetical expenses based on the Portfolio’s actual expense ratio and an assumed rate of return of 5% per year before expenses, which is not the Portfolio’s actual return. The hypothetical account values and expenses may not be used to estimate the actual ending account balances or expenses you paid for the six-month period shown. You may use this information to compare the ongoing costs of investing in the Portfolio with the ongoing costs of investing in other Portfolios. To do so, compare this 5% hypothetical example with the 5% hypothetical examples that appear in the shareholder reports of the other Portfolios.
Please note that the expenses shown in the table are meant to highlight your ongoing costs only and do not reflect any transactional costs, such as exchange fees or sales charges (loads). Therefore, the fourth and fifth data columns of the table are useful in comparing ongoing costs only and will not help you determine the relative total costs of owning different funds. In addition, if these transactional costs were included, your costs would have been higher.
| | | | | | | | | | | | | | | | | | | | |
| | | | | | | | | | | | | | | | |
| Share Class | | Beginning
Account
Value
7/1/13 | | | Ending Account
Value (Based
on Actual
Returns and
Expenses)
12/31/13 | | | Expenses
Paid
During
Period1 | | | Ending Account
Value (Based on
Hypothetical 5%
Annualized
Return and
Actual Expenses)
12/31/13 | | | Expenses
Paid
During
Period1 | |
| | | | | |
| Initial Class Shares | | $ | 1,000.00 | | | $ | 1,115.10 | | | $ | 0.16 | | | $ | 1,025.10 | | | $ | 0.15 | |
| | | | | |
| Service Class Shares | | $ | 1,000.00 | | | $ | 1,113.70 | | | $ | 1.49 | | | $ | 1,023.80 | | | $ | 1.43 | |
| 1. | Expenses are equal to the Portfolio’s annualized expense ratio of each class (0.03% for Initial Class and 0.28% for Service Class) multiplied by the average account value over the period, divided by 365 and multiplied by 184 (to reflect the six-month period). The table above represents the actual expenses incurred during the six-month period. In addition to the fees and expenses which the Portfolio bears directly, the Portfolio indirectly bears a pro rata share of the fees and expenses of the Underlying Portfolios/Funds in which it invests. Such indirect expenses are not included in the above-reported expense figures. |
| | |
| M-346 | | MainStay VP Moderate Allocation Portfolio |
Investment Objectives of Underlying Portfolios/Funds as of December 31, 2013 (Unaudited)
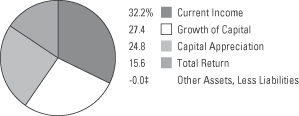
See Portfolio of Investments beginning on page M-351 for specific holdings within these categories.
| ‡ | Less than one-tenth of a percent. |
| | | | |
| mainstayinvestments.com | | | M-347 | |
Portfolio Management Discussion and Analysis (Unaudited)
Answers to the questions reflect the views of portfolio managers Jae S. Yoon, CFA, Jonathan Swaney and Poul Kristensen, CFA, of New York Life Investments,1 the Portfolio’s Manager.
How did MainStay VP Moderate Allocation Portfolio perform relative to its benchmark and peers during the 12 months ended December 31, 2013?
For the 12 months ended December 31, 2013, MainStay VP Moderate Allocation Portfolio returned 19.12% for Initial Class shares and 18.82% for Service Class shares. Over the same period, both share classes underperformed the 32.39% return of the S&P 500® Index,2 which is the Portfolio’s broad-based securities-market index, and the 22.78% return of the MSCI EAFE® Index,2 which is a secondary benchmark of the Portfolio. Over the same period, both share classes outperformed the –2.02% return of the Barclays U.S. Aggregate Bond Index2 and the 16.70% return of the Moderate Allocation Composite Index,2 which are additional benchmarks of the Portfolio. Both share classes also outperformed the 14.27% return of the average Lipper2 Variable Products Mixed-Asset Target Allocation Moderate Portfolio for the 12 months ended December 31, 2013.
What factors affected the Portfolio’s relative performance during the reporting period?
The Portfolio is a “fund of funds,” meaning that it seeks to achieve its investment objective by investing primarily in other MainStay VP Portfolios and other funds managed by New York Life Investments (the “Underlying Portfolios/Funds”). The Underlying Portfolios/Funds may invest in fixed-income securities or in domestic or international stocks at various capitalization levels. The Portfolio’s primary benchmark, on the other hand, consists entirely of U.S. large-cap stocks. These differences—particularly the Portfolio’s substantial allocation to Underlying Portfolios/Funds that invest in fixed-income securities—accounted for many of the challenges the Portfolio experienced in terms of relative performance. Fixed-income securities generally underperformed equities during the reporting period.
The Portfolio’s performance was strong compared to its peers and the Conservative Allocation Composite Index. Much of those excess returns were a product of our asset allocation decisions. We maintained a bias favoring stocks over bonds in varying measure over most of the reporting period. This bias contributed substantially to the Portfolio’s performance. Well-
timed preferences for small companies over large
companies and growth stocks over value stocks provided positive results. Much of the gain, however, was offset by overweight positions in emerging-market equities. Within the fixed-income portion of the Portfolio, exposure to speculative-grade credit instruments was rewarded, while defensive positioning against a potential rise in interest rates helped shield against losses in the high-grade part of the Portfolio.
Although asset-class positioning added substantially to returns, performance among the Underlying Portfolios/Funds in which the Portfolio invested was mixed. Among the larger holdings that enjoyed particularly strong performance were MainStay U.S. Equity Opportunities Fund, MainStay Epoch U.S. All Cap Fund and MainStay VP Unconstrained Bond Portfolio.
How did you allocate the Portfolio’s assets during the reporting period and why?
We considered a variety of information, including the portfolio-level characteristics of the Underlying Portfolios/Funds, such as capitalization, style biases, sector exposures, credit quality and duration.3 We also examined the attributes of the Underlying Portfolios’/Funds’ holdings, such as valuation metrics, earnings data and technical indicators. Finally, we evaluated the historical success of the managers responsible for the Underlying Portfolios/Funds. Generally speaking, we seek to invest in Underlying Portfolios/Funds that occupy attractively valued segments of the market, invest in fairly priced securities and are steered by individuals who have consistently demonstrated capable management in the past.
The Portfolio’s allocations to stocks and bonds varied over the course of the reporting period in response to the changing environment. Within equities, we placed a mild emphasis on two themes. First, our focus shifted from securities of large-cap companies toward securities of smaller companies, which we believed would perform especially well during an uptick in global economic growth. Second, we placed an increasing emphasis on growth over value because we anticipated that the quest for yield that has marked the past couple of years would morph into a quest for growth. Both strategies were modestly profitable during the reporting period.
| 1. | “New York Life Investments” is a service mark used by New York Life Investment Management Holdings LLC and its subsidiary New York Life Investment Management LLC. |
| 2. | Please refer to pages M-2 and M-3 for additional explanations and disclosure regarding the Portfolios, their benchmark indices and service providers mentioned in the reports. |
| 3. | Duration is a measure of the price sensitivity of a fixed-income investment to changes in interest rates. Duration is expressed as a number of years and is considered a more accurate sensitivity gauge than average maturity. |
| | |
| M-348 | | MainStay VP Moderate Allocation Portfolio |
In the fixed-income portion of the Portfolio, we continued to maintain a shorter duration than the Barclays U.S. Aggregate Bond Index because we believe that interest rates will rise as the economy gains strength and the Federal Reserve gradually disengages from its direct security purchases, widely known as quantitative easing. We also maintained the Portfolio’s tilt that favored corporate bonds over government-backed securities—a preference that has been in place for the last couple of years. This positioning reflects our enduring view that corporations have improved the quality of their balance sheets significantly by reducing leverage, accumulating cash and controlling operating costs. We anticipate that corporate default rates may remain quite low for some time, which could make the higher yields available on corporate bonds attractive.
How did the Portfolio’s allocations change over the course of the reporting period?
The most significant change was a shift from focusing on large-cap stocks to owning more stocks of small- and mid-cap companies. This strategy was visible in a large increase in allocations to MainStay VP Eagle Small Cap Growth Portfolio, MainStay VP U.S. Small Cap Portfolio and MainStay Epoch U.S. All Cap Fund. These increases were primarily funded from sales of MainStay MAP Fund, MainStay VP Large Cap Growth Portfolio and MainStay U.S. Equity Opportunities Fund. Our shift from value to growth was seen in a substantial new position in MainStay VP Cornerstone Growth Portfolio. A new position in a long/short portfolio, MainStay VP Marketfield Portfolio, was also noteworthy, as was our slight shift back into international stocks with a new position in MainStay Emerging Markets Opportunities Fund and increased exposure to MainStay ICAP International Fund.
In the fixed-income portion of the Portfolio, we shifted assets from MainStay VP Floating Rate Portfolio and MainStay VP Unconstrained Bond Portfolio into a new position in MainStay Short Duration High Yield Fund. We also established a new position in MainStay High Yield Municipal Bond Fund. We believed that prices in the high-yield municipal market might have overreacted to news of the Detroit bankruptcy filing and financial troubles in Puerto Rico.
Which Underlying Equity Portfolios/Funds had the highest total returns during the reporting period, and which Underlying Equity Portfolios/Funds had the lowest total returns?
Among the Underlying Portfolios/Funds in which the Portfolio invested, MainStay VP Mid Cap Core Portfolio had the highest total return in 2013, followed by MainStay U.S. Equity Opportunities Fund and MainStay VP U.S. Small Cap Portfolio. The only Underlying Equity Portfolio/Fund that generated a negative total return was MainStay VP DFA / DuPont Capital Emerging Markets Equity Portfolio. The next-lowest total returns came from MainStay VP International Equity Portfolio and MainStay VP Marketfield Portfolio.
Which Underlying Equity Portfolios/Funds made the strongest positive contributions to the Portfolio’s overall performance, and which Underlying Equity Portfolios/Funds were the greatest detractors?
Contributions reflect the performance of the Underlying Portfolios/Funds and the size of the positions held. Large positive contributions can therefore come from significant positions in Underlying Portfolios/Funds that do reasonably well or from smaller positions in Underlying Portfolios/Funds that do exceptionally well. During the reporting period, the Portfolio had many of its largest holdings in Underlying Portfolios/Funds that performed very well. On that list were MainStay U.S. Equity Opportunities Fund, MainStay MAP Fund and MainStay VP Large Cap Growth Portfolio. The only Underlying Portfolio/Fund with negative performance was MainStay VP DFA / DuPont Capital Emerging Markets Equity Portfolio. Other than that, weaker contributions tended to come from holdings with smaller allocations. Among these were MainStay VP ICAP Select Equity Portfolio and MainStay VP Marketfield Portfolio.
What factors and risks affected the Portfolio’s Underlying Fixed-Income Portfolio/Fund investments during the reporting period?
Yields on U.S. Treasury bonds rose significantly on signs of a strengthening economy and investors’ growing expectation that the Federal Reserve would gradually back away from stimulative monetary policy. At the same time, absolute yields on speculative-grade credit instruments fell, implying a significant
| | | | |
| mainstayinvestments.com | | | M-349 | |
compression of the spread4 to U.S. Treasury securities. This occurred against a backdrop of improving corporate financial health and significant net inflows to mutual funds and exchange-traded funds that invest in credit instruments.
During the reporting period, which fixed-income market segments were the strongest positive contributors to the Portfolio’s performance and which segments were particularly weak?
Domestic credit markets and short-duration securities were the strongest performers amid signs of economic improvement. For much the same reason, high-grade long-duration bonds provided poor performance.
Which Underlying Fixed-Income Portfolios/Funds made the strongest positive contributions to the Portfolio’s performance, and which Underlying Fixed-Income Portfolios/Funds were the greatest detractors?
In the fixed-income portion of the Portfolio, the largest positive contribution came from MainStay VP Floating Rate Bond Portfolio, which benefited from a short duration and a speculative profile. This was followed by smaller positions in MainStay VP Unconstrained Bond Portfolio and MainStay VP High Yield Corporate Bond Portfolio. Detracting from performance were positions in MainStay VP Bond Portfolio, MainStay Intermediate Term Bond Fund and MainStay High Yield Municipal Bond Fund.
| 4. | The terms “spread” and “yield spread” may refer to the difference in yield between a security or type of security and comparable U.S. Treasury issues. The terms may also refer to the difference in yield between two specific securities or types of securities at a given time. |
The opinions expressed are those of the portfolio managers as of the date of this report and are subject to change. There is no guarantee that any forecasts made will come to pass. This material does not constitute investment advice and is not intended as an endorsement of any specific investment.
Not all MainStay VP Portfolios and/or share classes are available under all policies.
| | |
| M-350 | | MainStay VP Moderate Allocation Portfolio |
Portfolio of Investments December 31, 2013
| | | | | | | | |
| | |
Shares | | | Value | |
| Affiliated Investment Companies 100.0%† | |
Equity Funds 60.4% | |
Mainstay Emerging Markets Opportunities Fund Class I (a) | | | 715,601 | | | $ | 6,927,014 | |
MainStay Epoch Global Choice Fund Class I (a) | | | 1,644,025 | | | | 33,883,353 | |
MainStay Epoch U.S. All Cap Fund Class I (a) | | | 2,668,073 | | | | 75,026,208 | |
MainStay ICAP Equity Fund Class I | | | 833,845 | | | | 43,243,178 | |
MainStay ICAP International Fund Class I | | | 1,042,136 | | | | 37,475,223 | |
MainStay International Opportunities Fund Class I (a) | | | 3,425,780 | | | | 30,934,791 | |
MainStay MAP Fund Class I (a) | | | 1,786,381 | | | | 80,065,609 | |
MainStay U.S. Equity Opportunities Fund Class I (a) | | | 6,870,715 | | | | 58,332,369 | |
MainStay VP Cornerstone Growth Portfolio Initial Class (a)(b) | | | 857,402 | | | | 29,316,177 | |
MainStay VP DFA / DuPont Capital Emerging Markets Equity Portfolio Initial Class (a) | | | 803,050 | | | | 7,627,442 | |
MainStay VP Eagle Small Cap Growth Portfolio Initial Class (a) | | | 2,438,578 | | | | 31,873,195 | |
MainStay VP International Equity Portfolio Initial Class (a) | | | 892,558 | | | | 12,328,051 | |
MainStay VP Large Cap Growth Portfolio Initial Class (a) | | | 4,039,930 | | | | 92,245,406 | |
MainStay VP Marketfield Portfolio Initial Class (a)(b) | | | 1,931,218 | | | | 21,537,627 | |
MainStay VP Mid Cap Core Portfolio Initial Class | | | 1,162,369 | | | | 18,807,670 | |
MainStay VP S&P 500 Index Portfolio Initial Class | | | 270,967 | | | | 10,184,093 | |
MainStay VP T. Rowe Price Equity Income Portfolio Initial Class (a) | | | 4,029,625 | | | | 55,500,491 | |
MainStay VP U.S. Small Cap Portfolio Initial Class (a) | | | 1,792,305 | | | | 24,697,360 | |
| | | | | | | | |
Total Equity Funds
(Cost $561,290,182) | | | | 670,005,257 | |
| | | | | | | | |
|
Fixed Income Funds 39.6% | |
MainStay High Yield Municipal Bond Fund Class I | | | 1,022,570 | | | | 10,972,177 | |
MainStay Intermediate Term Bond Fund Class I (a) | | | 4,170,729 | | | | 44,293,138 | |
MainStay Short Duration High Yield Fund Class I (a) | | | 2,214,664 | | | | 22,345,957 | |
MainStay VP Bond Portfolio Initial Class (a) | | | 12,999,180 | | | | 182,026,618 | |
MainStay VP Cash Management Portfolio Initial Class (a) | | | 49,036,299 | | | | 49,040,075 | |
MainStay VP Floating Rate Portfolio Initial Class (a) | | | 7,619,426 | | | | 71,098,751 | |
| | | | | | | | |
| | |
Shares | | | Value | |
Fixed Income Funds (continued) | |
MainStay VP High Yield Corporate Bond Portfolio Initial Class | | | 2,179,214 | | | $ | 22,358,678 | |
MainStay VP Unconstrained Bond Portfolio Initial Class (a) | | | 3,622,228 | | | | 37,372,663 | |
| | | | | | | | |
Total Fixed Income Funds
(Cost $447,585,822) | | | | 439,508,057 | |
| | | | | | | | |
Total Investments
(Cost $1,008,876,004) (c) | | | 100.0 | % | | | 1,109,513,314 | |
Other Assets, Less Liabilities | | | (0.0 | )‡ | | | (220,392 | ) |
Net Assets | | | 100.0 | % | | $ | 1,109,292,922 | |
| † | Percentages indicated are based on Portfolio net assets. |
| ‡ | Less than one-tenth of a percent. |
| (a) | The Portfolio’s ownership exceeds 5% of the outstanding shares of the Underlying Portfolio’s/Fund’s share class. (See Note 3) |
| (b) | Non-income producing Underlying Portfolio/Fund. |
| (c) | As of December 31, 2013, cost is $1,011,295,636 for federal income tax purposes and net unrealized appreciation is as follows: |
| | | | |
Gross unrealized appreciation | | $ | 108,932,551 | |
Gross unrealized depreciation | | | (10,714,873 | ) |
| | | | |
Net unrealized appreciation | | $ | 98,217,678 | |
| | | | |
| | | | | | |
The notes to the financial statements are an integral part of,
and should be read in conjunction with, the financial statements. | | mainstayinvestments.com | | | M-351 | |
Portfolio of Investments December 31, 2013 (continued)
The following is a summary of the fair valuations according to the inputs used as of December 31, 2013, for valuing the Portfolio’s assets.
Asset Valuation Inputs
| | | | | | | | | | | | | | | | |
Description | | Quoted Prices
in Active Markets
for Identical Assets (Level 1) | | | Significant Other
Observable Inputs (Level 2) | | | Significant
Unobservable
Inputs (Level 3) | | | Total | |
| Investments (a) | | | | | | | | | | | | | | | | |
| Affiliated Investment Companies | | | | | | | | | | | | | | | | |
Equity Funds | | $ | 670,005,257 | | | $ | — | | | $ | — | | | $ | 670,005,257 | |
Fixed Income Funds | | | 439,508,057 | | | | — | | | | — | | | | 439,508,057 | |
| | | | | | | | | | | | | | | | |
| Total Investments | | $ | 1,109,513,314 | | | $ | — | | | $ | — | | | $ | 1,109,513,314 | |
| | | | | | | | | | | | | | | | |
| (a) | For a complete listing of investments, see the Portfolio of Investments. |
The Portfolio recognizes transfers between the levels as of the beginning of the period.
For the year ended December 31, 2013, the Portfolio did not have any transfers between Level 1 and Level 2 fair value measurements. (See Note 2)
As of December 31, 2013, the Portfolio did not hold any investments with significant unobservable inputs (Level 3). (See Note 2)
| | | | |
| M-352 | | MainStay VP Moderate Allocation Portfolio | | The notes to the financial statements are an integral part of,
and should be read in conjunction with, the financial statements. |
Statement of Assets and Liabilities as of December 31, 2013
| | | | |
| Assets | |
Investment in affiliated investment companies, at value (identified cost $1,008,876,004) | | $ | 1,109,513,314 | |
Cash | | | 704,992 | |
Receivables: | | | | |
Investment securities sold | | | 1,209,132 | |
Fund shares sold | | | 792,646 | |
| | | | |
Total assets | | | 1,112,220,084 | |
| | | | |
| |
| Liabilities | | | | |
Payables: | | | | |
Investment securities purchased | | | 1,914,124 | |
Fund shares redeemed | | | 705,283 | |
NYLIFE Distributors (See Note 3) | | | 223,648 | |
Shareholder communication | | | 55,065 | |
Professional fees | | | 23,873 | |
Trustees | | | 1,252 | |
Custodian | | | 531 | |
Accrued expenses | | | 3,386 | |
| | | | |
Total liabilities | | | 2,927,162 | |
| | | | |
Net assets | | $ | 1,109,292,922 | |
| | | | |
| |
| Net Assets Consist of | | | | |
Shares of beneficial interest outstanding (par value of $.001 per share) unlimited number of shares authorized | | $ | 88,488 | |
Additional paid-in capital | | | 957,060,772 | |
| | | | |
| | | 957,149,260 | |
Undistributed net investment income | | | 23,449,947 | |
Accumulated net realized gain (loss) on investments | | | 28,056,405 | |
Net unrealized appreciation (depreciation) on investments | | | 100,637,310 | |
| | | | |
Net assets | | $ | 1,109,292,922 | |
| | | | |
| | | | |
Initial Class | | | | |
Net assets applicable to outstanding shares | | $ | 37,868,822 | |
| | | | |
Shares of beneficial interest outstanding | | | 3,003,720 | |
| | | | |
Net asset value per share outstanding | | $ | 12.61 | |
| | | | |
Service Class | | | | |
Net assets applicable to outstanding shares | | $ | 1,071,424,100 | |
| | | | |
Shares of beneficial interest outstanding | | | 85,484,722 | |
| | | | |
Net asset value per share outstanding | | $ | 12.53 | |
| | | | |
| | | | | | |
The notes to the financial statements are an integral part of,
and should be read in conjunction with, the financial statements. | | mainstayinvestments.com | | | M-353 | |
Statement of Operations for the year ended December 31, 2013
| | | | |
| Investment Income (Loss) | |
Income | | | | |
Dividend distributions from affiliated investment companies | | $ | 16,887,617 | |
| | | | |
Expenses | | | | |
Distribution and service—Service Class (See Note 3) | | | 2,387,786 | |
Shareholder communication | | | 155,346 | |
Professional fees | | | 65,886 | |
Trustees | | | 19,888 | |
Custodian | | | 8,547 | |
Miscellaneous | | | 24,693 | |
| | | | |
Total expenses | | | 2,662,146 | |
| | | | |
Net investment income (loss) | | | 14,225,471 | |
| | | | |
|
| Realized and Unrealized Gain (Loss) on Investments | |
Net realized gain (loss) on: | | | | |
Affiliated investment company transactions | | | 59,338,422 | |
Realized capital gain distributions from affiliated investment companies | | | 26,871,991 | |
| | | | |
Net realized gain (loss) on investments from affiliated investment companies | | | 86,210,413 | |
| | | | |
Net change in unrealized appreciation (depreciation) on investments | | | 69,220,765 | |
| | | | |
Net realized and unrealized gain (loss) on investments | | | 155,431,178 | |
| | | | |
Net increase (decrease) in net assets resulting from operations | | $ | 169,656,649 | |
| | | | |
| | | | |
| M-354 | | MainStay VP Moderate Allocation Portfolio | | The notes to the financial statements are an integral part of,
and should be read in conjunction with, the financial statements. |
Statements of Changes in Net Assets
for the years ended December 31, 2013 and December 31, 2012
| | | | | | | | |
| | | 2013 | | | 2012 | |
| Increase (Decrease) in Net Assets | |
Operations: | | | | | | | | |
Net investment income (loss) | | $ | 14,225,471 | | | $ | 12,954,370 | |
Net realized gain (loss) on investments from affiliated investment companies transactions | | | 86,210,413 | | | | 41,115,975 | |
Net change in unrealized appreciation (depreciation) on investments | | | 69,220,765 | | | | 33,840,572 | |
| | | | |
Net increase (decrease) in net assets resulting from operations | | | 169,656,649 | | | | 87,910,917 | |
| | | | |
Dividends and distributions to shareholders: | | | | | | | | |
From net investment income: | | | | | | | | |
Initial Class | | | (702,616 | ) | | | (490,591 | ) |
Service Class | | | (18,003,159 | ) | | | (11,865,785 | ) |
| | | | |
| | | (18,705,775 | ) | | | (12,356,376 | ) |
| | | | |
From net realized gain on investments: | | | | | | | | |
Initial Class | | | (1,137,301 | ) | | | (1,845,798 | ) |
Service Class | | | (32,196,452 | ) | | | (50,502,457 | ) |
| | | | |
| | | (33,333,753 | ) | | | (52,348,255 | ) |
| | | | |
Total dividends and distributions to shareholders | | | (52,039,528 | ) | | | (64,704,631 | ) |
| | | | |
Capital share transactions: | | | | | | | | |
Net proceeds from sale of shares | | | 171,356,179 | | | | 176,450,578 | |
Net asset value of shares issued to shareholders in reinvestment of dividends and distributions | | | 52,039,528 | | | | 64,704,631 | |
Cost of shares redeemed | | | (86,576,182 | ) | | | (81,394,039 | ) |
| | | | |
Increase (decrease) in net assets derived from capital share transactions | | | 136,819,525 | | | | 159,761,170 | |
| | | | |
Net increase (decrease) in net assets | | | 254,436,646 | | | | 182,967,456 | |
|
| Net Assets | |
Beginning of year | | | 854,856,276 | | | | 671,888,820 | |
| | | | |
End of year | | $ | 1,109,292,922 | | | $ | 854,856,276 | |
| | | | |
Undistributed net investment income at end of year | | $ | 23,449,947 | | | $ | 18,705,759 | |
| | | | |
| | | | | | |
The notes to the financial statements are an integral part of,
and should be read in conjunction with, the financial statements. | | mainstayinvestments.com | | | M-355 | |
Financial Highlights selected per share data and ratios
| | | | | | | | | | | | | | | | | | | | |
| | | Initial Class | |
| | | Year ended December 31, | |
| | | 2013 | | | 2012 | | | 2011 | | | 2010 | | | 2009 | |
Net asset value at beginning of year | | $ | 11.16 | | | $ | 10.76 | | | $ | 10.90 | | | $ | 9.85 | | | $ | 8.30 | |
| | | | | | | | | | | | | | | | | | | | |
Net investment income (loss) | | | 0.20 | (a) | | | 0.21 | (a) | | | 0.21 | (a) | | | 0.21 | (a) | | | 0.20 | |
Net realized and unrealized gain (loss) on investments | | | 1.90 | | | | 1.14 | | | | (0.12 | ) | | | 1.07 | | | | 1.80 | |
| | | | | | | | | | | | | | | | | | | | |
Total from investment operations | | | 2.10 | | | | 1.35 | | | | 0.09 | | | | 1.28 | | | | 2.00 | |
| | | | | | | | | | | | | | | | | | | | |
Less dividends and distributions: | | | | | | | | | | | | | | | | | | | | |
From net investment income | | | (0.25 | ) | | | (0.20 | ) | | | (0.20 | ) | | | (0.23 | ) | | | (0.26 | ) |
From net realized gain on investments | | | (0.40 | ) | | | (0.75 | ) | | | (0.03 | ) | | | — | | | | (0.19 | ) |
| | | | | | | | | | | | | | | | | | | | |
Total dividends and distributions | | | (0.65 | ) | | | (0.95 | ) | | | (0.23 | ) | | | (0.23 | ) | | | (0.45 | ) |
| | | | | | | | | | | | | | | | | | | | |
Net asset value at end of year | | $ | 12.61 | | | $ | 11.16 | | | $ | 10.76 | | | $ | 10.90 | | | $ | 9.85 | |
| | | | | | | | | | | | | | | | | | | | |
Total investment return | | | 19.12 | % | | | 12.61 | % | | | 0.94 | % | | | 13.09 | % | | | 24.22 | % |
Ratios (to average net assets)/Supplemental Data: | | | | | | | | | | | | | | | | | | | | |
Net investment income (loss) | | | 1.66 | % | | | 1.88 | % | | | 1.88 | % | | | 2.10 | % | | | 3.00 | % |
Net expenses (b) | | | 0.03 | % | | | 0.03 | % | | | 0.04 | % | | | 0.05 | % | | | 0.05 | % |
Portfolio turnover rate | | | 54 | % | | | 55 | % | | | 63 | % | | | 37 | % | | | 40 | % |
Net assets at end of year (in 000’s) | | $ | 37,869 | | | $ | 29,575 | | | $ | 23,369 | | | $ | 24,136 | | | $ | 19,224 | |
| (a) | Per share data based on average shares outstanding during the year. |
| (b) | In addition to the fees and expenses which the Portfolio bears directly, the Portfolio indirectly bears a pro-rata share of the fees and expenses of the Underlying Portfolios/Funds in which it invests. Such indirect expenses are not included in the above expense ratios. |
| | | | | | | | | | | | | | | | | | | | |
| | | Service Class | |
| | | Year ended December 31, | |
| | | 2013 | | | 2012 | | | 2011 | | | 2010 | | | 2009 | |
Net asset value at beginning of year | | $ | 11.11 | | | $ | 10.71 | | | $ | 10.86 | | | $ | 9.82 | | | $ | 8.28 | |
| | | | | | | | | | | | | | | | | | | | |
Net investment income (loss) | | | 0.17 | (a) | | | 0.19 | (a) | | | 0.18 | (a) | | | 0.19 | (a) | | | 0.19 | |
Net realized and unrealized gain (loss) on investments | | | 1.87 | | | | 1.14 | | | | (0.12 | ) | | | 1.06 | | | | 1.78 | |
| | | | | | | | | | | | | | | | | | | | |
Total from investment operations | | | 2.04 | | | | 1.33 | | | | 0.06 | | | | 1.25 | | | | 1.97 | |
| | | | | | | | | | | | | | | | | | | | |
Less dividends and distributions: | | | | | | | | | | | | | | | | | | | | |
From net investment income | | | (0.22 | ) | | | (0.18 | ) | | | (0.18 | ) | | | (0.21 | ) | | | (0.24 | ) |
From net realized gain on investments | | | (0.40 | ) | | | (0.75 | ) | | | (0.03 | ) | | | — | | | | (0.19 | ) |
| | | | | | | | | | | | | | | | | | | | |
Total dividends and distributions | | | (0.62 | ) | | | (0.93 | ) | | | (0.21 | ) | | | (0.21 | ) | | | (0.43 | ) |
| | | | | | | | | | | | | | | | | | | | |
Net asset value at end of year | | $ | 12.53 | | | $ | 11.11 | | | $ | 10.71 | | | $ | 10.86 | | | $ | 9.82 | |
| | | | | | | | | | | | | | | | | | | | |
Total investment return | | | 18.82 | % | | | 12.33 | % | | | 0.69 | % | | | 12.81 | % | | | 23.99 | % |
Ratios (to average net assets)/Supplemental Data: | | | | | | | | | | | | | | | | | | | | |
Net investment income (loss) | | | 1.43 | % | | | 1.65 | % | | | 1.68 | % | | | 1.89 | % | | | 2.76 | % |
Net expenses (b) | | | 0.28 | % | | | 0.28 | % | | | 0.29 | % | | | 0.30 | % | | | 0.30 | % |
Portfolio turnover rate | | | 54 | % | | | 55 | % | | | 63 | % | | | 37 | % | | | 40 | % |
Net assets at end of year (in 000’s) | | $ | 1,071,424 | | | $ | 825,281 | | | $ | 648,520 | | | $ | 572,578 | | | $ | 421,477 | |
| (a) | Per share data based on average shares outstanding during the year. |
| (b) | In addition to the fees and expenses which the Portfolio bears directly, the Portfolio indirectly bears a pro-rata share of the fees and expenses of the Underlying Portfolios/Funds in which it invests. Such indirect expenses are not included in the above expense ratios. |
| | | | |
| M-356 | | MainStay VP Moderate Allocation Portfolio | | The notes to the financial statements are an integral part of,
and should be read in conjunction with, the financial statements. |
MainStay VP Moderate Growth Allocation Portfolio
Investment and Performance Comparison1 (Unaudited)
Performance data quoted represents past performance. Past performance is no guarantee of future results. Because of market volatility, current performance may be lower or higher than the figures shown. Investment return and principal value will fluctuate, and as a result, when shares are redeemed, they may be worth more or less than their original cost. The performance table and graph do not reflect any deduction of sales charges mortality and expense charges, contract charges, or administrative charges. Please refer to the Performance Summary appropriate for your policy. For performance information current to the most recent month-end, please call 800-598-2019 or visit www.newyorklife.com.
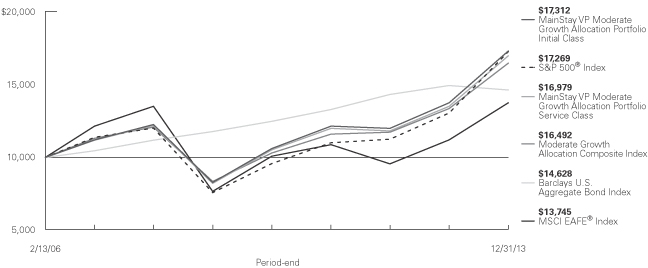
Average Annual Total Returns for the Period Ended December 31, 2013
| | | | | | | | | | | | | | | | |
| Class | | One Year | | | Five Years | | | Since
Inception
(2/13/06) | | | Gross
Expense
Ratio2 | |
| Initial Class Shares | | | 25.92 | % | | | 15.93 | % | | | 7.21 | % | | | 1.09 | % |
| Service Class Shares | | | 25.61 | | | | 15.64 | | | | 6.94 | | | | 1.34 | |
| | | | | | | | | | | | |
| Benchmark Performance | | One
Year | | | Five
Years | | | Since Inception
(2/13/06) | |
S&P 500® Index3 | | | 32.39 | % | | | 17.94 | % | | | 7.17 | % |
MSCI EAFE® Index3 | | | 22.78 | | | | 12.44 | | | | 4.12 | |
Barclays U.S. Aggregate Bond Index3 | | | –2.02 | | | | 4.44 | | | | 4.94 | |
Moderate Growth Allocation Composite Index3 | | | 23.43 | | | | 14.59 | | | | 6.55 | |
Average Lipper Variable Products Mixed-Asset Target Allocation Growth Portfolio4 | | | 19.36 | | | | 13.98 | | | | 5.10 | |
| 1. | Performance figures reflect certain fee waivers and/or expense limitations, without which total returns may have been different. For information on current fee waivers and/or expense limitations, please refer to the notes to the financial statements. |
| 2. | The gross expense ratios presented reflect the Portfolio’s “Total Annual Portfolio Operating Expenses” from the most recent Prospectus and may differ from other expense ratios disclosed in this report. |
| 3. | Please refer to pages M-2 and M-3 for additional explanations and disclosure regarding the Portfolios, their benchmark indices and other indices mentioned in the reports. |
| 4. | The Average Lipper Variable Products Mixed-Asset Target Allocation Growth Portfolio is representative of portfolios that, by portfolio practice, maintain a mix of between 60%-80% equity securities, with the remainder invested in bonds, cash, and cash equivalents. Lipper Inc. is an independent monitor of fund performance. Results are based on total returns with all dividend and capital gain distributions reinvested. |
| | | | |
| mainstayinvestments.com | | | M-357 | |
Cost in Dollars of a $1,000 Investment in MainStay VP Moderate Growth Allocation Portfolio (Unaudited)
The example below is intended to describe the fees and expenses borne by shareholders during the six-month period from July 1, 2013, to December 31, 2013, and the impact of those costs on your investment.
Example
As a shareholder of the Portfolio, you incur two types of costs: (1) transaction costs, including exchange fees and sales charges (loads) on purchases (as applicable), and (2) ongoing costs, including management fees, distribution and/or service (12b-1) fees, and other Portfolio expenses (as applicable). This example is intended to help you understand your ongoing costs (in dollars) of investing in the Portfolio and to compare these costs with the ongoing costs of investing in other Portfolios. The example is based on an investment of $1,000 made at the beginning of the six-month period and held for the entire period from July 1, 2013, to December 31, 2013. Shares are only sold in connection with variable life and annuity contracts and the example does not reflect any contract level or transactional fees or expenses. If these costs had been included, your costs would have been higher.
This example illustrates your Portfolio’s ongoing costs in two ways:
Actual Expenses
The second and third data columns in the table below provide information about actual account values and actual expenses. You may use the information in these columns, together with the amount you invested, to estimate the expenses that you paid during the six months ended
December 31, 2013. Simply divide your account value by $1,000 (for example, an $8,600 account value divided by $1,000 = 8.6), then multiply the result by the number under the heading entitled ‘‘Expenses Paid During Period’’ to estimate the expenses you paid on your account during this period.
Hypothetical Example for Comparison Purposes
The fourth and fifth data columns in the table below provide information about hypothetical account values and hypothetical expenses based on the Portfolio’s actual expense ratio and an assumed rate of return of 5% per year before expenses, which is not the Portfolio’s actual return. The hypothetical account values and expenses may not be used to estimate the actual ending account balances or expenses you paid for the six-month period shown. You may use this information to compare the ongoing costs of investing in the Portfolio with the ongoing costs of investing in other Portfolios. To do so, compare this 5% hypothetical example with the 5% hypothetical examples that appear in the shareholder reports of the other Portfolios.
Please note that the expenses shown in the table are meant to highlight your ongoing costs only and do not reflect any transactional costs, such as exchange fees or sales charges (loads). Therefore, the fourth and fifth data columns of the table are useful in comparing ongoing costs only and will not help you determine the relative total costs of owning different funds. In addition, if these transactional costs were included, your costs would have been higher.
| | | | | | | | | | | | | | | | | | | | |
| | | | | | | | | | | | | | | | |
| Share Class | | Beginning
Account
Value
7/1/13 | | | Ending Account
Value (Based
on Actual
Returns and
Expenses)
12/31/13 | | | Expenses
Paid
During
Period1 | | | Ending Account
Value (Based
on Hypothetical
5% Annualized
Return and
Actual Expenses)
12/31/13 | | | Expenses
Paid
During
Period1 | |
| | | | | |
| Initial Class Shares | | $ | 1,000.00 | | | $ | 1,147.20 | | | $ | 0.16 | | | $ | 1,025.10 | | | $ | 0.15 | |
| | | | | |
| Service Class Shares | | $ | 1,000.00 | | | $ | 1,145.80 | | | $ | 1.51 | | | $ | 1,023.80 | | | $ | 1.43 | |
| 1. | Expenses are equal to the Portfolio’s annualized expense ratio of each class (0.03% for Initial Class and 0.28% for Service Class) multiplied by the average account value over the period, divided by 365 and multiplied by 184 (to reflect the six-month period). The table above represents the actual expenses incurred during the six-month period. In addition to the fees and expenses which the Portfolio bears directly, the Portfolio indirectly bears a pro rata share of the fees and expenses of the Underlying Portfolios/Funds in which it invests. Such indirect expenses are not included in the above-reported expense figures. |
| | |
| M-358 | | MainStay VP Moderate Growth Allocation Portfolio |
Investment Objectives of Underlying Portfolios/Funds as of December 31, 2013 (Unaudited)
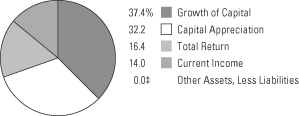
See Portfolio of Investments beginning on page M-363 for specific holdings within these categories.
| ‡ | Less than one-tenth of a percent. |
| | | | |
| mainstayinvestments.com | | | M-359 | |
Portfolio Management Discussion and Analysis (Unaudited)
Answers to the questions reflect the views of portfolio managers Jae S. Yoon, CFA, Jonathan Swaney and Poul Kristensen, CFA, of New York Life Investments,1 the Portfolio’s Manager.
How did MainStay VP Moderate Growth Allocation Portfolio perform relative to its benchmark and peers during the 12 months ended December 31, 2013?
For the 12 months ended December 31, 2013, MainStay VP Moderate Growth Allocation Portfolio returned 25.92% for Initial Class shares and 25.61% for Service Class shares. Over the same period, both share classes underperformed the 32.39% return of the S&P 500® Index,2 which is the Portfolio’s broad-based securities-market index. Over the same period, both share classes outperformed the 22.78% return of the MSCI EAFE® Index,2 which is a secondary benchmark of the Portfolio. Both share classes outperformed the –2.02% return of the Barclays U.S. Aggregate Bond Index2 and the 23.43% return of the Moderate Growth Allocation Composite Index2 during the reporting period. The Barclays U.S. Aggregate Bond Index and the Moderate Growth Allocation Composite Index are additional benchmarks of the Portfolio. Both share classes outperformed the 19.36% return of the average Lipper2 Variable Products Mixed-Asset Target Allocation Growth Portfolio for the 12 months ended December 31, 2013.
What factors affected the Portfolio’s relative performance during the reporting period?
The Portfolio is a “fund of funds,” meaning that it seeks to achieve its investment objective by investing primarily in other MainStay VP Portfolios and other funds managed by New York Life Investments (the “Underlying Portfolios/Funds”). The Underlying Portfolios/Funds may invest in fixed-income securities or in domestic or international stocks at various capitalization levels. The Portfolio’s primary benchmark, on the other hand, consists entirely of U.S. large-cap stocks. These differences—particularly the Portfolio’s substantial allocation to Underlying Portfolios/Funds that invest in fixed-income securities—accounted for many of the challenges the Portfolio experienced in terms of relative performance. Fixed-income securities generally underperformed equities during the reporting period.
The Portfolio’s performance was strong compared to its peers and the Conservative Allocation Composite Index. Much of those excess returns were a product of our asset allocation decisions. We maintained a bias
favoring stocks over bonds in varying measure over most of the reporting period. This bias contributed substantially to the Portfolio’s performance. Well-timed preferences for small companies over large companies and growth stocks over value stocks provided positive results. Much of the gain, however, was offset by overweight positions in emerging-market equities. Within the fixed-income part of the Portfolio, exposure to speculative-grade credit instruments was rewarded, while defensive positioning against a potential rise in interest rates helped shield against losses in the high-grade part of the Portfolio.
Although asset-class positioning added substantially to returns, performance among the Underlying Portfolios/Funds in which the Portfolio invested was mixed. Among the larger holdings that enjoyed particularly strong performance were MainStay U.S. Equity Opportunities Fund, MainStay Epoch U.S. All Cap Fund and MainStay VP Unconstrained Bond Portfolio.
How did you allocate the Portfolio’s assets during the reporting period and why?
We considered a variety of information, including the portfolio-level characteristics of the Underlying Portfolios/Funds, such as capitalization, style biases, sector exposures, credit quality and duration.3 We also examined the attributes of the Underlying Portfolios’/Funds’ holdings, such as valuation metrics, earnings data and technical indicators. Finally, we evaluated the historical success of the managers responsible for the Underlying Portfolios/Funds. Generally speaking, we seek to invest in Underlying Portfolios/Funds that occupy attractively valued segments of the market, invest in fairly priced securities and are steered by individuals who have consistently demonstrated capable management in the past.
The Portfolio’s allocations to stocks and bonds varied over the course of the reporting period in response to the changing environment. Within equities, we placed a mild emphasis on two themes. First, our focus shifted from securities of large-cap companies toward securities of smaller companies, which we believed would perform especially well during an uptick in global economic growth. Second, we placed an increasing
| 1. | “New York Life Investments” is a service mark used by New York Life Investment Management Holdings LLC and its subsidiary New York Life Investment Management LLC. |
| 2. | Please refer to pages M-2 and M-3 for additional explanations and disclosure regarding the Portfolios, their benchmark indices and service providers mentioned in the reports. |
| 3. | Duration is a measure of the price sensitivity of a fixed-income investment to changes in interest rates. Duration is expressed as a number of years and is considered a more accurate sensitivity gauge than average maturity. |
| | |
| M-360 | | MainStay VP Moderate Growth Allocation Portfolio |
emphasis on growth over value because we anticipated that the quest for yield that has marked the past couple of years would morph into a quest for growth. Both strategies were modestly profitable during the reporting period.
In the fixed-income portion of the Portfolio, we continued to maintain a shorter duration than the Barclays U.S. Aggregate Bond Index because we believe that interest rates will rise as the economy gains strength and the Federal Reserve gradually disengages from its direct security purchases, widely known as quantitative easing. We also maintained the Portfolio’s tilt that favored corporate bonds over government-backed securities—a preference that has been in place for the last couple of years. This positioning reflects our enduring view that corporations have improved the quality of their balance sheets significantly by reducing leverage, accumulating cash and controlling operating costs. We anticipate that corporate default rates may remain quite low for some time, which could make the higher yields available on corporate bonds attractive.
How did the Portfolio’s allocations change over the course of the reporting period?
The most significant change was a shift from focusing on large-cap stocks to owning more stocks of small- and mid-cap companies. This strategy was visible in a large increase in allocations to MainStay VP Eagle Small Cap Growth Portfolio, MainStay VP Mid Cap Core Portfolio and MainStay Epoch U.S. All Cap Fund. These increases were primarily funded from sales of MainStay MAP Fund, MainStay VP Large Cap Growth Portfolio, and MainStay U.S. Equity Opportunities Fund. Our shift from value to growth was seen in a substantial new position in MainStay VP Cornerstone Growth Portfolio. A new position in a long/short portfolio, MainStay VP Marketfield Portfolio, was also noteworthy, as was our slight shift back into international stocks with a new position in MainStay Emerging Markets Opportunities Fund and increased exposure to MainStay ICAP International Fund.
In the fixed-income portion of the Portfolio, we shifted assets from MainStay VP Floating Rate Portfolio and MainStay VP Unconstrained Bond Portfolio into a new position in MainStay Short Duration High Yield Fund. We also established a new position in MainStay High Yield Municipal Bond Fund. We believed that prices in the high-yield municipal market might have over-
reacted to news of the Detroit bankruptcy filing and financial troubles in Puerto Rico.
Which Underlying Equity Portfolios/Funds had the highest total returns during the reporting period, and which Underlying Equity Portfolios/Funds had the lowest total returns?
Among the Underlying Portfolios/Funds in which the Portfolio invested, MainStay VP Mid Cap Core Portfolio had the highest total return in 2013, followed by MainStay U.S. Equity Opportunities Fund and MainStay VP U.S. Small Cap Portfolio. The only Underlying Equity Portfolio/Fund that generated a negative total return was MainStay VP DFA / DuPont Capital Emerging Markets Equity Portfolio. The next-lowest total returns came from MainStay VP International Equity Portfolio and MainStay VP Marketfield Portfolio.
Which Underlying Equity Portfolios/Funds made the strongest positive contributions to the Portfolio’s overall performance, and which Underlying Equity Portfolios/Funds were the greatest detractors?
Contributions reflect the performance of the Underlying Portfolios/Funds and the size of the positions held. Large positive contributions can therefore come from significant positions in Underlying Portfolios/Funds that do reasonably well or from smaller positions in Underlying Portfolios/Funds that do exceptionally well. During the reporting period, the Portfolio had many of its largest holdings in Underlying Portfolios/Funds that performed very well. On that list were MainStay U.S. Equity Opportunities Fund, MainStay MAP Fund and MainStay VP Large Cap Growth Portfolio. The only Underlying Portfolio/Fund with negative performance was MainStay VP DFA / DuPont Capital Emerging Markets Equity Portfolio. Other than that, weaker contributions tended to come from holdings with smaller allocations. Among these were MainStay VP ICAP Select Equity Portfolio and MainStay VP Marketfield Portfolio.
What factors and risks affected the Portfolio’s Underlying Fixed-Income Portfolio/Fund investments during the reporting period?
Yields on U.S. Treasury bonds rose significantly on signs of a strengthening economy and investors’ growing expectation that the Federal Reserve would gradually back away from stimulative monetary policy. At the same time, absolute yields on speculative-grade credit instruments fell, implying a significant
| | | | |
| mainstayinvestments.com | | | M-361 | |
compression of the spread4 to U.S. Treasury securities. This occurred against a backdrop of improving corporate financial health and significant net inflows to mutual funds and exchange-traded funds that invest in credit instruments.
During the reporting period, which fixed-income market segments were the strongest positive contributors to the Portfolio’s performance and which segments were particularly weak?
Domestic credit markets and short-duration securities were the strongest performers amid signs of economic improvement. For much the same reason, high-grade long-duration bonds provided poor performance.
Which Underlying Fixed-Income Portfolios/Funds made the strongest positive contributions to the Portfolio’s performance, and which Underlying Fixed-Income Portfolios/Funds were the greatest detractors?
In the fixed-income portion of the Portfolio, the largest positive contribution came from MainStay VP Floating Rate Bond Portfolio, which benefited from a short duration and a speculative profile. This was followed by smaller positions in MainStay VP Unconstrained Bond Portfolio and MainStay VP High Yield Corporate Bond Portfolio. Detracting from performance were positions in MainStay Intermediate Term Bond Fund and MainStay High Yield Municipal Bond Fund.
| 4. | The terms “spread” and “yield spread” may refer to the difference in yield between a security or type of security and comparable U.S. Treasury issues. The terms may also refer to the difference in yield between two specific securities or types of securities at a given time. |
The opinions expressed are those of the portfolio managers as of the date of this report and are subject to change. There is no guarantee that any forecasts made will come to pass. This material does not constitute investment advice and is not intended as an endorsement of any specific investment.
Not all MainStay VP Portfolios and/or share classes are available under all policies.
| | |
| M-362 | | MainStay VP Moderate Growth Allocation Portfolio |
Portfolio of Investments December 31, 2013
| | | | | | | | |
| | |
Shares | | | Value | |
| Affiliated Investment Companies 100.0%† | |
Equity Funds 80.1% | |
MainStay Emerging Markets Opportunities Fund Class I (a) | | | 1,126,122 | | | $ | 10,900,863 | |
MainStay Epoch Global Choice Fund Class I (a) | | | 2,391,009 | | | | 49,278,693 | |
MainStay Epoch U.S. All Cap Fund Class I (a) | | | 4,186,371 | | | | 117,720,750 | |
MainStay ICAP Equity Fund Class I (a) | | | 1,402,136 | | | | 72,714,751 | |
MainStay ICAP International Fund Class I (a) | | | 2,492,832 | | | | 89,642,225 | |
MainStay International Opportunities Fund Class I (a) | | | 8,989,847 | | | | 81,178,322 | |
MainStay MAP Fund Class I (a) | | | 3,418,281 | | | | 153,207,343 | |
MainStay U.S. Equity Opportunities Fund Class I (a) | | | 14,488,705 | | | | 123,009,103 | |
MainStay VP Cornerstone Growth Portfolio Initial Class (a)(b) | | | 1,496,152 | | | | 51,156,242 | |
MainStay VP DFA / DuPont Capital Emerging Markets Equity Portfolio Initial Class (a) | | | 1,567,914 | | | | 14,892,199 | |
MainStay VP Eagle Small Cap Growth Portfolio Initial Class (a) | | | 6,984,495 | | | | 91,290,157 | |
MainStay VP International Equity Portfolio Initial Class (a) | | | 2,279,454 | | | | 31,483,934 | |
MainStay VP Large Cap Growth Portfolio Initial Class (a) | | | 6,594,026 | | | | 150,564,166 | |
MainStay VP Marketfield Portfolio Initial Class (a)(b) | | | 2,887,540 | | | | 32,202,895 | |
MainStay VP Mid Cap Core Portfolio Initial Class (a) | | | 3,821,362 | | | | 61,831,425 | |
MainStay VP S&P 500 Index Portfolio Initial Class | | | 380,850 | | | | 14,313,956 | |
MainStay VP T. Rowe Price Equity Income Portfolio Initial Class (a) | | | 8,553,441 | | | | 117,807,517 | |
MainStay VP U.S. Small Cap Portfolio Initial Class (a) | | | 6,017,587 | | | | 82,920,335 | |
MainStay VP Van Eck Global Hard Assets Portfolio Initial Class | | | 140,258 | | | | 1,397,981 | |
| | | | | | | | |
Total Equity Funds
(Cost $1,113,344,607) | | | | | | | 1,347,512,857 | |
| | | | | | | | |
|
Fixed Income Funds 19.9% | |
MainStay High Yield Municipal Bond Fund Class I | | | 1,268,747 | | | | 13,613,653 | |
MainStay Intermediate Term Bond Fund Class I (a) | | | 5,836,203 | | | | 61,980,480 | |
MainStay Short Duration High Yield Fund Class I (a) | | | 3,132,984 | | | | 31,611,808 | |
MainStay VP Bond Portfolio Initial Class | | | 194,648 | | | | 2,725,641 | |
| | | | | | | | |
| | |
Shares | | | Value | |
Fixed Income Funds (continued) | |
MainStay VP Cash Management Portfolio Initial Class (a) | | | 74,265,198 | | | $ | 74,270,916 | |
MainStay VP Floating Rate Portfolio Initial Class (a) | | | 9,361,079 | | | | 87,350,520 | |
MainStay VP High Yield Corporate Bond Portfolio Initial Class | | | 2,604,935 | | | | 26,726,570 | |
MainStay VP Unconstrained Bond Portfolio Initial Class (a) | | | 3,549,148 | | | | 36,618,661 | |
| | | | | | | | |
Total Fixed Income Funds
(Cost $337,270,877) | | | | | | | 334,898,249 | |
| | | | | | | | |
Total Investments
(Cost $1,450,615,484) (c) | | | 100.0 | % | | | 1,682,411,106 | |
Other Assets, Less Liabilities | | | 0.0 | ‡ | | | 784,990 | |
Net Assets | | | 100.0 | % | | $ | 1,683,196,096 | |
| † | Percentages indicated are based on Portfolio net assets. |
| ‡ | Less than one-tenth of a percent. |
| (a) | The Portfolio’s ownership exceeds 5% of the outstanding shares of the Underlying Portfolio’s/Fund’s share class. (See Note 3) |
| (b) | Non-income producing Underlying Portfolio/Fund. |
| (c) | As of December 31, 2013, cost is $1,461,207,223 for federal income tax purposes and net unrealized appreciation is as follows: |
| | | | |
Gross unrealized appreciation | | $ | 224,631,862 | |
Gross unrealized depreciation | | | (3,427,979 | ) |
| | | | |
Net unrealized appreciation | | $ | 221,203,883 | |
| | | | |
| | | | | | |
The notes to the financial statements are an integral part of,
and should be read in conjunction with, the financial statements. | | mainstayinvestments.com | | | M-363 | |
Portfolio of Investments December 31, 2013 (continued)
The following is a summary of the fair valuations according to the inputs used as of December 31, 2013, for valuing the Portfolio’s assets.
Asset Valuation Inputs
| | | | | | | | | | | | | | | | |
Description | | Quoted Prices
in Active Markets
for Identical Assets (Level 1) | | | Significant Other
Observable Inputs (Level 2) | | | Significant
Unobservable
Inputs (Level 3) | | | Total | |
| Investments (a) | | | | | | | | | | | | | | | | |
| Affiliated Investment Companies | | | | | | | | | | | | | | | | |
Equity Funds | | $ | 1,347,512,857 | | | $ | — | | | $ | — | | | $ | 1,347,512,857 | |
Fixed Income Funds | | | 334,898,249 | | | | — | | | | — | | | | 334,898,249 | |
| | | | | | | | | | | | | | | | |
| Total Investments | | $ | 1,682,411,106 | | | $ | — | | | $ | — | | | $ | 1,682,411,106 | |
| | | | | | | | | | | | | | | | |
| (a) | For a complete listing of investments, see the Portfolio of Investments. |
The Portfolio recognizes transfers between the levels as of the beginning of the period.
For the year ended December 31, 2013, the Portfolio did not have any transfers between Level 1 and Level 2 fair value measurements. (See Note 2)
As of December 31, 2013, the Portfolio did not hold any investments with significant unobservable inputs (Level 3). (See Note 2)
| | | | |
| M-364 | | MainStay VP Moderate Growth Allocation Portfolio | | The notes to the financial statements are an integral part of,
and should be read in conjunction with, the financial statements. |
Statement of Assets and Liabilities as of December 31, 2013
| | | | |
| Assets | |
Investment in affiliated investment companies, at value (identified cost $1,450,615,484) | | $ | 1,682,411,106 | |
Cash | | | 755,644 | |
Receivables: | | | | |
Fund shares sold | | | 1,348,185 | |
| | | | |
Total assets | | | 1,684,514,935 | |
| | | | |
| |
| Liabilities | | | | |
Payables: | | | | |
Investment securities purchased | | | 755,644 | |
NYLIFE Distributors (See Note 3) | | | 335,803 | |
Fund shares redeemed | | | 114,118 | |
Shareholder communication | | | 82,418 | |
Professional fees | | | 25,551 | |
Directors | | | 1,707 | |
Accrued expenses | | | 3,598 | |
| | | | |
Total liabilities | | | 1,318,839 | |
| | | | |
Net assets | | $ | 1,683,196,096 | |
| | | | |
| |
| Net Assets Consist of | | | | |
Shares of beneficial interest outstanding (par value of $.001 per share) unlimited number of shares authorized | | $ | 126,716 | |
Additional paid-in capital | | | 1,366,714,039 | |
| | | | |
| | | 1,366,840,755 | |
Undistributed net investment income | | | 31,050,494 | |
Accumulated net realized gain (loss) on investments | | | 53,509,225 | |
Net unrealized appreciation (depreciation) on investments | | | 231,795,622 | |
| | | | |
Net assets | | $ | 1,683,196,096 | |
| | | | |
| | | | |
Initial Class | | | | |
Net assets applicable to outstanding shares | | $ | 58,340,637 | |
| | | | |
Shares of beneficial interest outstanding | | | 4,365,922 | |
| | | | |
Net asset value per share outstanding | | $ | 13.36 | |
| | | | |
Service Class | | | | |
Net assets applicable to outstanding shares | | $ | 1,624,855,459 | |
| | | | |
Shares of beneficial interest outstanding | | | 122,350,233 | |
| | | | |
Net asset value per share outstanding | | $ | 13.28 | |
| | | | |
| | | | | | |
The notes to the financial statements are an integral part of,
and should be read in conjunction with, the financial statements. | | mainstayinvestments.com | | | M-365 | |
Statement of Operations for the year ended December 31, 2013
| | | | |
| Investment Income (Loss) | |
Income | | | | |
Dividend distributions from affiliated investment companies | | $ | 20,714,052 | |
| | | | |
Expenses | | | | |
Distribution and service—Service Class (See Note 3) | | | 3,420,370 | |
Shareholder communication | | | 228,098 | |
Professional fees | | | 82,532 | |
Directors | | | 28,072 | |
Custodian | | | 11,986 | |
Miscellaneous | | | 32,556 | |
| | | | |
Total expenses | | | 3,803,614 | |
| | | | |
Net investment income (loss) | | | 16,910,438 | |
| | | | |
|
| Realized and Unrealized Gain (Loss) on Investments | |
Net realized gain (loss) on: | | | | |
Affiliated investment company transactions | | | 94,009,044 | |
Realized capital gain distributions from affiliated investment companies | | | 46,647,680 | |
| | | | |
Net realized gain (loss) on investments from affiliated investment companies | | | 140,656,724 | |
| | | | |
Net change in unrealized appreciation (depreciation) on investments | | | 163,437,450 | |
| | | | |
Net realized and unrealized gain (loss) on investments | | | 304,094,174 | |
| | | | |
Net increase (decrease) in net assets resulting from operations | | $ | 321,004,612 | |
| | | | |
| | | | |
| M-366 | | MainStay VP Moderate Growth Allocation Portfolio | | The notes to the financial statements are an integral part of,
and should be read in conjunction with, the financial statements. |
Statements of Changes in Net Assets
for the years ended December 31, 2013 and December 31, 2012
| | | | | | | | |
| | | 2013 | | | 2012 | |
| Increase (Decrease) in Net Assets | |
Operations: | | | | | | | | |
Net investment income (loss) | | $ | 16,910,438 | | | $ | 13,065,871 | |
Net realized gain (loss) on investments from affiliated investment companies transactions | | | 140,656,724 | | | | 50,625,489 | |
Net change in unrealized appreciation (depreciation) on investments | | | 163,437,450 | | | | 68,751,763 | |
| | | | |
Net increase (decrease) in net assets resulting from operations | | | 321,004,612 | | | | 132,443,123 | |
| | | | |
Dividends and distributions to shareholders: | | | | | | | | |
From net investment income: | | | | | | | | |
Initial Class | | | (684,440 | ) | | | (501,251 | ) |
Service Class | | | (16,628,427 | ) | | | (10,462,919 | ) |
| | | | |
| | | (17,312,867 | ) | | | (10,964,170 | ) |
| | | | |
From net realized gain on investments: | | | | | | | | |
Initial Class | | | (1,527,428 | ) | | | (1,682,660 | ) |
Service Class | | | (42,552,837 | ) | | | (41,196,799 | ) |
| | | | |
| | | (44,080,265 | ) | | | (42,879,459 | ) |
| | | | |
Total dividends and distributions to shareholders | | | (61,393,132 | ) | | | (53,843,629 | ) |
| | | | |
Capital share transactions: | | | | | | | | |
Net proceeds from sale of shares | | | 274,089,306 | | | | 246,403,101 | |
Net asset value of shares issued to shareholders in reinvestment of dividends and distributions | | | 61,393,132 | | | | 53,843,629 | |
Cost of shares redeemed | | | (69,730,298 | ) | | | (72,905,965 | ) |
| | | | |
Increase (decrease) in net assets derived from capital share transactions | | | 265,752,140 | | | | 227,340,765 | |
| | | | |
Net increase (decrease) in net assets | | | 525,363,620 | | | | 305,940,259 | |
|
| Net Assets | |
Beginning of year | | | 1,157,832,476 | | | | 851,892,217 | |
| | | | |
End of year | | $ | 1,683,196,096 | | | $ | 1,157,832,476 | |
| | | | |
Undistributed net investment income at end of year | | $ | 31,050,494 | | | $ | 17,312,764 | |
| | | | |
| | | | | | |
The notes to the financial statements are an integral part of,
and should be read in conjunction with, the financial statements. | | mainstayinvestments.com | | | M-367 | |
Financial Highlights selected per share data and ratios
| | | | | | | | | | | | | | | | | | | | |
| | | Initial Class | |
| | | Year ended December 31, | |
| | | 2013 | | | 2012 | | | 2011 | | | 2010 | | | 2009 | |
Net asset value at beginning of year | | $ | 11.07 | | | $ | 10.16 | | | $ | 10.42 | | | $ | 9.25 | | | $ | 7.55 | |
| | | | | | | | | | | | | | | | | | | | |
Net investment income (loss) (a) | | | 0.17 | | | | 0.16 | | | | 0.16 | | | | 0.16 | | | | 0.19 | |
Net realized and unrealized gain (loss) on investments | | | 2.66 | | | | 1.32 | | | | (0.30 | ) | | | 1.16 | | | | 1.93 | |
| | | | | | | | | | | | | | | | | | | | |
Total from investment operations | | | 2.83 | | | | 1.48 | | | | (0.14 | ) | | | 1.32 | | | | 2.12 | |
| | | | | | | | | | | | | | | | | | | | |
Less dividends and distributions: | | | | | | | | | | | | | | | | | | | | |
From net investment income | | | (0.17 | ) | | | (0.13 | ) | | | (0.12 | ) | | | (0.15 | ) | | | (0.24 | ) |
From net realized gain on investments | | | (0.37 | ) | | | (0.44 | ) | | | — | | | | — | | | | (0.18 | ) |
| | | | | | | | | | | | | | | | | | | | |
Total dividends and distributions | | | (0.54 | ) | | | (0.57 | ) | | | (0.12 | ) | | | (0.15 | ) | | | (0.42 | ) |
| | | | | | | | | | | | | | | | | | | | |
Net asset value at end of year | | $ | 13.36 | | | $ | 11.07 | | | $ | 10.16 | | | $ | 10.42 | | | $ | 9.25 | |
| | | | | | | | | | | | | | | | | | | | |
Total investment return | | | 25.92 | % | | | 14.66 | % | | | (1.21 | %) | | | 14.33 | % | | | 28.42 | % |
Ratios (to average net assets)/Supplemental Data: | | | | | | | | | | | | | | | | | | | | |
Net investment income (loss) | | | 1.40 | % | | | 1.46 | % | | | 1.55 | % | | | 1.69 | % | | | 2.35 | % |
Net expenses (b) | | | 0.03 | % | | | 0.03 | % | | | 0.04 | % | | | 0.05 | % | | | 0.05 | % |
Portfolio turnover rate | | | 51 | % | | | 52 | % | | | 52 | % | | | 39 | % | | | 45 | % |
Net assets at end of year (in 000’s) | | $ | 58,341 | | | $ | 44,210 | | | $ | 37,848 | | | $ | 38,098 | | | $ | 30,850 | |
| (a) | Per share data based on average shares outstanding during the year. |
| (b) | In addition to the fees and expenses which the Portfolio bears directly, the Portfolio indirectly bears a pro-rata share of the fees and expenses of the Underlying Portfolios/Funds in which it invests. Such indirect expenses are not included in the above expense ratios. |
| | | | | | | | | | | | | | | | | | | | |
| | | Service Class | |
| | | Year ended December 31, | |
| | | 2013 | | | 2012 | | | 2011 | | | 2010 | | | 2009 | |
Net asset value at beginning of year | | $ | 11.02 | | | $ | 10.12 | | | $ | 10.39 | | | $ | 9.23 | | | $ | 7.53 | |
| | | | | | | | | | | | | | | | | | | | |
Net investment income (loss) (a) | | | 0.15 | | | | 0.14 | | | | 0.15 | | | | 0.14 | | | | 0.17 | |
Net realized and unrealized gain (loss) on investments | | | 2.63 | | | | 1.31 | | | | (0.32 | ) | | | 1.15 | | | | 1.93 | |
| | | | | | | | | | | | | | | | | | | | |
Total from investment operations | | | 2.78 | | | | 1.45 | | | | (0.17 | ) | | | 1.29 | | | | 2.10 | |
| | | | | | | | | | | | | | | | | | | | |
Less dividends and distributions: | | | | | | | | | | | | | | | | | | | | |
From net investment income | | | (0.15 | ) | | | (0.11 | ) | | | (0.10 | ) | | | (0.13 | ) | | | (0.22 | ) |
From net realized gain on investments | | | (0.37 | ) | | | (0.44 | ) | | | — | | | | — | | | | (0.18 | ) |
| | | | | | | | | | | | | | | | | | | | |
Total dividends and distributions | | | (0.52 | ) | | | (0.55 | ) | | | (0.10 | ) | | | (0.13 | ) | | | (0.40 | ) |
| | | | | | | | | | | | | | | | | | | | |
Net asset value at end of year | | $ | 13.28 | | | $ | 11.02 | | | $ | 10.12 | | | $ | 10.39 | | | $ | 9.23 | |
| | | | | | | | | | | | | | | | | | | | |
Total investment return | | | 25.61 | % | | | 14.37 | % | | | (1.46 | %) | | | 14.05 | % | | | 28.10 | % |
Ratios (to average net assets)/Supplemental Data: | | | | | | | | | | | | | | | | | | | | |
Net investment income (loss) | | | 1.18 | % | | | 1.28 | % | | | 1.41 | % | | | 1.52 | % | | | 2.08 | % |
Net expenses (b) | | | 0.28 | % | | | 0.28 | % | | | 0.29 | % | | | 0.30 | % | | | 0.30 | % |
Portfolio turnover rate | | | 51 | % | | | 52 | % | | | 52 | % | | | 39 | % | | | 45 | % |
Net assets at end of year (in 000’s) | | $ | 1,624,855 | | | $ | 1,113,622 | | | $ | 814,044 | | | $ | 603,988 | | | $ | 402,800 | |
| (a) | Per share data based on average shares outstanding during the year. |
| (b) | In addition to the fees and expenses which the Portfolio bears directly, the Portfolio indirectly bears a pro-rata share of the fees and expenses of the Underlying Portfolios/Funds in which it invests. Such indirect expenses are not included in the above expense ratios. |
| | | | |
| M-368 | | MainStay VP Moderate Growth Allocation Portfolio | | The notes to the financial statements are an integral part of,
and should be read in conjunction with, the financial statements. |
MainStay VP PIMCO Real Return Portfolio
Investment and Performance Comparison1 (Unaudited)
Performance data quoted represents past performance. Past performance is no guarantee of future results. Because of market volatility, current performance may be lower or higher than the figures shown. Investment return and principal value will fluctuate, and as a result, when shares are redeemed, they may be worth more or less than their original cost. The performance table and graph do not reflect any deduction of sales charges, mortality and expense charges, contract charges or administrative charges. Please refer to the Performance Summary appropriate for your policy. For performance information current to the most recent month-end, please call 800-598-2019 or visit www.newyorklife.com.
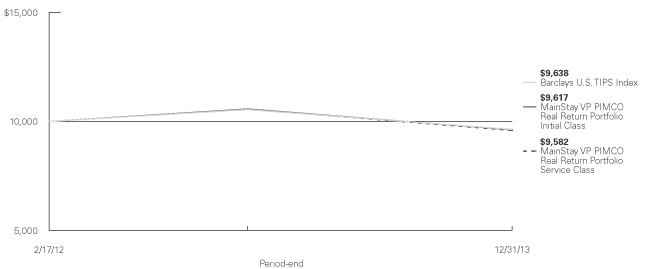
Total Returns for the Period Ended December 31, 2013
| | | | | | | | | | | | |
| Class | | One Year | | | Since Inception
(2/17/12) | | | Gross Expense Ratio2 | |
| Initial Class Shares | | | –9.08 | % | | | –2.07 | % | | | 0.62 | % |
| Service Class Shares | | | –9.26 | | | | –2.26 | | | | 0.87 | |
| | | | | | | | |
| Benchmark Performance | | One
Year | | | Since Inception
(2/17/12) | |
Barclays U.S. TIPS Index3 | | | –8.61 | % | | | –1.96 | % |
Average Lipper Variable Products Inflation-Protected Bond Portfolio4 | | | –8.21 | | | | –2.48 | |
| 1. | Performance figures reflect certain fee waivers and/or expense limitations, without which total returns may have been different. For information on current fee waivers and/or expense limitations, please refer to the notes to the financial statements. |
| 2. | The gross expense ratios presented reflect the Portfolio’s “Total Annual Portfolio Operating Expenses” from the most recent Prospectus and may differ from other expense ratios disclosed in this report. |
| 3. | Please refer to pages M-2 and M-3 for additional explanations and disclosure regarding the Portfolios, their benchmark indices and other indices mentioned in the reports. |
| 4. | The Average Lipper Variable Products Inflation-Protected Bond Portfolio is representative of portfolios that invest primarily in inflation-indexed fixed income securities. Inflation-linked bonds are fixed income securities structured to provide protection against inflation. Lipper Inc. is an independent monitor of fund performance. Results are based on total returns with all dividend and capital gain distributions reinvested. |
| | | | |
| mainstayinvestments.com | | | M-369 | |
Cost in Dollars of a $1,000 Investment in MainStay VP PIMCO Real Return Portfolio (Unaudited)
The example below is intended to describe the fees and expenses borne by shareholders during the period from July 1, 2013, to December 31, 2013, and the impact of those costs on your investment.
Example
As a shareholder of the Portfolio, you incur two types of costs: (1) transaction costs, including exchange fees and sales charges (loads) on purchases (as applicable), and (2) ongoing costs, including management fees, distribution and/or service (12b-1) fees, and other Portfolio expenses (as applicable). This example is intended to help you understand your ongoing costs (in dollars) of investing in the Portfolio and to compare these costs with the ongoing costs of investing in other Portfolios. The example is based on an investment of $1,000 made at the beginning of the six-month period and held for the entire period from July 1, 2013, to December 31, 2013. Shares are only sold in connection with variable life and annuity contracts and the example does not reflect any contract level or transactional fees or expenses. If these costs had been included, your costs would have been higher.
This example illustrates your Portfolio’s ongoing costs in two ways:
Actual Expenses
The second and third data columns in the table below provide information about actual account values and actual expenses. You may use the information in these columns, together with the amount you invested, to estimate the expenses that you paid during the six months ended
December 31, 2013. Simply divide your account value by $1,000 (for example, an $8,600 account value divided by $1,000 = 8.6), then multiply the result by the number under the heading entitled ‘‘Expenses Paid During Period’’ to estimate the expenses you paid on your account during this period.
Hypothetical Example for Comparison Purposes
The fourth and fifth data columns in the table below provide information about hypothetical account values and hypothetical expenses based on the Portfolio’s actual expense ratio and an assumed rate of return of 5% per year before expenses, which is not the Portfolio’s actual return. The hypothetical account values and expenses may not be used to estimate the actual ending account balances or expenses you paid for the six-month period shown. You may use this information to compare the ongoing costs of investing in the Portfolio with the ongoing costs of investing in other Portfolios. To do so, compare this 5% hypothetical example with the 5% hypothetical examples that appear in the shareholder reports of the other Portfolios.
Please note that the expenses shown in the table are meant to highlight your ongoing costs only and do not reflect any transactional costs, such as exchange fees or sales charges (loads). Therefore, the fourth and fifth data columns of the table are useful in comparing ongoing costs only and will not help you determine the relative total costs of owning different funds. In addition, if these transactional costs were included, your costs would have been higher.
| | | | | | | | | | | | | | | | | | | | |
| | | | | | | | | | | | | | | | |
| Share Class | | Beginning
Account
Value
7/1/13 | | | Ending Account
Value (Based
on Actual
Returns and
Expenses)
12/31/13 | | | Expenses
Paid
During
Period1 | | | Ending Account
Value (Based
on Hypothetical
5% Annualized
Return and
Actual Expenses)
12/31/13 | | | Expenses
Paid
During
Period1 | |
| | | | | |
| Initial Class Shares | | $ | 1,000.00 | | | $ | 986.90 | | | $ | 3.00 | | | $ | 1,022.20 | | | $ | 3.06 | |
| | | | | |
| Service Class Shares | | $ | 1,000.00 | | | $ | 985.90 | | | $ | 4.05 | | | $ | 1,021.10 | | | $ | 4.13 | |
| 1. | Expenses are equal to the Portfolio’s annualized expense ratio of each class (0.60% for Initial Class and 0.81% for Service Class) multiplied by the average account value over the period, divided by 365 and multiplied by 184 (to reflect the six-month period). The table above represents the actual expenses incurred during the six-month period. |
| | |
| M-370 | | MainStay VP PIMCO Real Return Portfolio |
Portfolio Composition as of December 31, 2013 (Unaudited)
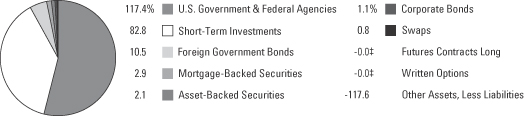
See Portfolio of Investments beginning on page M-374 for specific holdings within these categories.
| ‡ | Less than one-tenth of a percent. |
Top Ten Issuers Held as of December 31, 2013 (excluding short-term investments) (Unaudited)
| 1. | United States Treasury Inflation—Indexed Notes, 0.125%–2.625%, due 4/15/14–7/15/23 |
| 2. | United States Treasury Inflation—Indexed Bonds, 0.625%–3.625%, due 1/15/25–2/15/43 |
| 3. | Brazil Letras Do Tesouro Nacional, (zero coupon), due 1/1/17 |
| 4. | Bundesrepublik Deutschland Bundesobligation Inflation Linked Bond, 0.75%, due 4/15/18 |
| 5. | BCAP LLC Trust, 5.25%, due 8/26/37 |
| 6. | First Franklin Mortgage Loan Asset Backed Certificates, 0.505%–0.545%, due 9/25/35–11/25/35 |
| 7. | Italy Buoni Poliennali Del Tesoro, 1.70%–3.10%, due 9/15/16–9/15/26 |
| 8. | Mexican Bonos de Proteccion al Ahorro, 3.99%–4.01%, due 1/4/18–1/30/20 |
| 9. | Federal National Mortgage Association (Mortgage Pass-Through Securities), 1.339%–4.413%, due 11/1/34–6/1/43 |
| 10. | Australia Government Bond, 5.50%, due 4/21/23 |
| | | | |
| mainstayinvestments.com | | | M-371 | |
Portfolio Management Discussion and Analysis (Unaudited)
Answers to the questions reflect the views of portfolio manager Mihir Worah of Pacific Investment Management Company LLC (“PIMCO”), the Portfolio’s Subadvisor.
How did MainStay VP PIMCO Real Return Portfolio perform relative to its benchmark and peers during the 12 months ended December 31, 2013?
For the 12 months ended December 31, 2013, MainStay VP PIMCO Real Return Portfolio returned –9.08% for Initial Class shares and –9.26% for Service Class shares. Over the same period, both share classes underperformed the –8.61% return of the Barclays U.S. TIPS Index,1 which is the Portfolio’s broad-based securities-market index. Both share classes underperformed the –8.21% return of the average Lipper1 Variable Products Inflation-Protected Bond Portfolio for the 12 months ended December 31, 2013.
What factors affected the Portfolio’s relative performance during the reporting period?
Various strategies affected the Portfolio’s performance relative to the Barclays U.S. TIPS Index during the reporting period. On the positive side, we made tactical use of pay-fixed interest-rate swaps on the long end of the nominal U.S. Treasury yield curve2 as interest rates rose significantly across the nominal yield curve during the reporting period. We also used an allocation to non-agency mortgages, which benefited from the ongoing housing recovery.
Strategies that detracted from the Portfolio’s performance relative to the Barclays U.S. TIPS Index included increased exposure to U.S. real rates, as real yields rose during the year; exposure to Australian and Canadian inflation-linked bonds (ILBs), as real yields rose in both countries; and modest exposure to local emerging-market debt, particularly in Brazil, as Brazilian real and nominal rates rose as a result of multiple rate hikes by the central bank.
During the reporting period, how was the Portfolio’s performance materially affected by investments in derivatives?
The use of pay-fixed interest-rate swaps on the long end of the U.S. nominal yield curve had a positive impact on the Portfolio’s performance, as rates rose significantly across the nominal yield curve during 2013.
What was the Portfolio’s duration3 strategy during the reporting period?
The Portfolio had a shorter U.S. duration than the Barclays U.S. TIPS Index for the first half of the reporting period, but shifted to a longer-than-benchmark duration for the second half of the period. The Portfolio also reduced its real duration positioning in Europe, the U.K., Canada and Australia over the reporting period.
What specific factors, risks or market forces prompted significant decisions for the Portfolio during the reporting period?
Both real and nominal rates rose in the United States during the first half of the reporting period. Nevertheless, Treasury Inflation-Protected Securities (“TIPS”) underperformed nominal U.S. Treasury securities amid narrower breakeven inflation levels,4 as real yields rose more than nominal yields. In response, we moved the Portfolio’s exposure to TIPS to be overweight relative to the Barclays U.S. TIPS Index and maintained the overweight position through the end of the reporting period.
During the reporting period, which market segments were the strongest positive contributors to the Portfolio’s performance and which market segments were particularly weak?
U.S. TIPS holdings detracted from absolute returns as U.S. real yields rose during the reporting period, particularly following the Federal Reserve’s suggestion in the second quarter that it would begin tapering its direct bond purchases, widely known as quantitative easing. Exposure to Australian and Canadian inflation-linked bonds also detracted from the Portfolio’s returns as real yields rose in both countries. These strategies were marginally offset by an allocation to non-agency mortgages, which benefited from the ongoing housing recovery. The use of pay-fixed interest-rate swaps on the long end of the U.S. nominal yield curve also had a positive impact on absolute performance, as rates rose significantly across the nominal yield curve over the reporting period.
| 1. | Please refer to pages M-2 and M-3 for additional explanations and disclosure regarding the Portfolios, their benchmark indices and service providers mentioned in the reports. |
| 2. | The yield curve is a line that plots the yields of various securities of similar quality—typically U.S. Treasury issues—across a range of maturities. The U.S. Treasury yield curve serves as a benchmark for other debt and is used in economic forecasting. |
| 3. | Duration is a measure of the price sensitivity of a fixed-income investment to changes in interest rates. Duration is expressed as a number of years and is considered a more accurate sensitivity gauge than average maturity. |
| 4. | The breakeven inflation level represents the difference between the nominal yield on a fixed-rate obligation and the real yield on a comparable inflation-linked obligation. This difference typically represents the market’s inflation expectations. Over any given period, if actual inflation exceeds the breakeven level, the inflation-linked obligation will typically outperform the fixed-rate investment. If, however, inflation remains lower than the breakeven level, the fixed-rate obligation will typically outperform the inflation-linked obligation. |
| | |
| M-372 | | MainStay VP PIMCO Real Return Portfolio |
Did the Portfolio make any significant purchases or sales during the reporting period?
The Portfolio purchased additional TIPS during the reporting period. Since the Portfolio typically holds bonds until maturity, there were no significant sales during the reporting period.
How did the Portfolio’s sector weightings change during the reporting period?
During the reporting period, the Portfolio increased its exposure to U.S. TIPS.
How was the Portfolio positioned at the end of the reporting period?
As of December 31, 2013, the Portfolio was overweight U.S. TIPS relative to the Barclays U.S. TIPS Index. The Portfolio also continued to maintain out-of-benchmark exposure to non-agency mortgages, bonds of non-U.S. developed nations and emerging-market securities.
The opinions expressed are those of the portfolio manager as of the date of this report and are subject to change. There is no guarantee that any forecasts will come to pass. This material does not constitute investment advice and is not intended as an endorsement of any specific investment.
Not all MainStay VP Portfolios and/or share classes are available under all policies.
| | | | |
| mainstayinvestments.com | | | M-373 | |
Portfolio of Investments December 31, 2013
| | | | | | | | |
| | | Principal
Amount | | | Value | |
Long-Term Bonds 134.0%† Asset-Backed Securities 2.1% | |
Home Equity 0.4% | | | | | | | | |
HSBC Home Equity Loan Trust
Series 2006-2, Class A1
0.317%, due 3/20/36 (a)(b) | | $ | 1,503,789 | | | $ | 1,469,394 | |
| | | | | | | | |
|
Other ABS 1.7% | |
¨First Franklin Mortgage Loan Asset Backed Certificates | | | | | | | | |
Series 2005-FF11, Class A2D
0.505%, due 11/25/35 (a)(b) | | | 1,871,211 | | | | 1,806,827 | |
Series 2005-FF8, Class A2D
0.545%, due 9/25/35 (a)(b) | | | 4,487,150 | | | | 4,446,223 | |
| | | | | | | | |
| | | | | | | 6,253,050 | |
| | | | | | | | |
Total Asset-Backed Securities
(Cost $7,228,162) | | | | | | | 7,722,444 | |
| | | | | | | | |
|
| Corporate Bonds 1.1% | |
Banks 0.4% | |
Achmea Hypotheekbank N.V.
3.20%, due 11/3/14 (c) | | | 459,000 | | | | 469,750 | |
Eksportfinans ASA
2.375%, due 5/25/16 | | | 500,000 | | | | 491,875 | |
Intesa Sanpaolo S.p.A
3.125%, due 1/15/16 | | | 400,000 | | | | 407,625 | |
| | | | | | | | |
| | | | | | | 1,369,250 | |
| | | | | | | | |
Electric 0.7% | | | | | | | | |
Tokyo Electric Power Co., Inc.
4.50%, due 3/24/14 | | € | 1,900,000 | | | | 2,626,558 | |
| | | | | | | | |
Total Corporate Bonds
(Cost $3,799,737) | | | | | | | 3,995,808 | |
| | | | | | | | |
|
| Foreign Government Bonds 10.5% | |
Australia 0.8% | |
¨Australia Government Bond
5.50%, due 4/21/23 | | A$ | 3,100,000 | | | | 3,057,910 | |
| | | | | | | | |
|
Brazil 2.2% | |
¨Brazil Letras Do Tesouro Nacional
(zero coupon), due 1/1/17 | | B$ | 26,500,000 | | | | 7,910,024 | |
| | | | | | | | |
|
Germany 2.1% | |
¨Bundesrepublik Deutschland Bundesobligation Inflation Linked Bond
0.75%, due 4/15/18 | | € | 5,300,950 | | | | 7,579,773 | |
| | | | | | | | |
| | | | | | | | |
| | | Principal
Amount | | | Value | |
Italy 1.7% | | | | | | | | |
¨Italy Buoni Poliennali Del Tesoro | | | | | | | | |
1.70%, due 9/15/18 | | $ | 1,109,361 | | | $ | 1,530,782 | |
2.10%, due 9/15/16 | | | 1,495,088 | | | | 2,120,355 | |
Series Reg S
2.10%, due 9/15/17 | | | 1,623,174 | | | | 2,294,853 | |
Series Reg S
2.10%, due 9/15/21 | | | 108,079 | | | | 144,749 | |
Series Reg S
3.10%, due 9/15/26 | | | 105,793 | | | | 148,278 | |
| | | | | | | | |
| | | | | | | 6,239,017 | |
| | | | | | | | |
Mexico 1.8% | | | | | | | | |
Mexican Bonos
6.50%, due 6/9/22 | | M$ | 10,700,000 | | | | 828,460 | |
¨Mexican Bonos de Proteccion al Ahorro | | | | | | | | |
3.99%, due 1/4/18 (a) | | | 32,600,000 | | | | 2,535,004 | |
4.01%, due 1/30/20 (a) | | | 40,300,000 | | | | 3,121,144 | |
| | | | | | | | |
| | | | | | | 6,484,608 | |
| | | | | | | | |
New Zealand 0.5% | | | | | | | | |
New Zealand Government Bond
2.00%, due 9/20/25 | | N$ | 1,900,000 | | | | 1,462,369 | |
3.00%, due 9/20/30 (d) | | | 300,000 | | | | 246,977 | |
| | | | | | | | |
| | | | | | | 1,709,346 | |
| | | | | | | | |
Slovenia 0.3% | | | | | | | | |
Slovenia Government International Bond
4.70%, due 11/1/16 (c)(d) | | € | 700,000 | | | | 990,098 | |
| | | | | | | | |
|
Spain 0.7% | |
Instituto de Credito Oficial
Series Reg S
2.044%, due 3/25/14 (a) | | | 2,000,000 | | | | 2,747,822 | |
| | | | | | | | |
|
United Kingdom 0.4% | |
United Kingdom Gilt Inflation Linked Series Reg S
2.50%, due 7/26/16 | | £ | 300,000 | | | | 1,680,921 | |
| | | | | | | | |
Total Foreign Government Bonds
(Cost $38,808,714) | | | | | | | 38,399,519 | |
| | | | | | | | |
|
| Mortgage-Backed Securities 2.9% | |
Agency Collateral (Collateralized Mortgage Obligation) 0.3% | |
Federal Home Loan Mortgage Corporation Strips
Series 278, Class F1
0.617%, due 9/15/42 (a) | | $ | 1,317,259 | | | | 1,298,975 | |
| | | | | | | | |
| † | Percentages indicated are based on Portfolio net assets. |
| ¨ | | Among the Portfolio’s 10 largest issuers held, as of December 31, 2013, excluding short-term investments. May be subject to change daily. |
| | | | |
| M-374 | | MainStay VP PIMCO Real Return Portfolio | | The notes to the financial statements are an integral part of,
and should be read in conjunction with, the financial statements. |
| | | | | | | | |
| | | Principal
Amount | | | Value | |
| Mortgage-Backed Securities (continued) | |
Whole Loan Collateral (Collateralized Mortgage Obligations) 2.6% | |
¨BCAP LLC Trust
Series 2011-RR5, Class
5A1 5.25%, due 8/26/37 (c) | | $ | 6,694,012 | | | $ | 6,777,574 | |
Bear Stearns Adjustable Rate Mortgage Trust
Series 2004-10, Class 21A1
2.848%, due 1/25/35 (e) | | | 2,636,081 | | | | 2,613,039 | |
| | | | | | | | |
| | | | | | | 9,390,613 | |
| | | | | | | | |
Total Mortgage-Backed Securities
(Cost $10,351,640) | | | | | | | 10,689,588 | |
| | | | | | | | |
|
| U.S. Government & Federal Agencies 117.4% | |
Federal Home Loan Mortgage Corporation 0.6% | |
2.50%, due 10/2/19 | | | 2,100,000 | | | | 2,114,786 | |
| | | | | | | | |
|
¨Federal National Mortgage Association
(Mortgage Pass-Through Securities) 1.1% | |
1.339%, due 6/1/43 (a) | | | 826,261 | | | | 843,315 | |
2.485%, due 11/1/34 | | | 1,402,118 | | | | 1,498,114 | |
4.413%, due 12/1/36 (a) | | | 1,531,192 | | | | 1,623,179 | |
| | | | | | | | |
| | | | | | | 3,964,608 | |
| | | | | | | | |
¨United States Treasury Inflation—Indexed Bonds 26.0% | |
0.625%, due 2/15/43 (f) | | | 8,733,128 | | | | 6,714,955 | |
0.75%, due 2/15/42 (f) | | | 516,615 | | | | 415,310 | |
1.75%, due 1/15/28 (f) | | | 22,400,043 | | | | 23,982,046 | |
2.00%, due 1/15/26 (f) | | | 24,702,300 | | | | 27,346,212 | |
2.375%, due 1/15/25 (f) | | | 22,416,218 | | | | 25,766,389 | |
2.375%, due 1/15/27 (f) | | | 1,505,023 | | | | 1,733,598 | |
2.50%, due 1/15/29 (f) | | | 3,371,002 | | | | 3,961,453 | |
3.625%, due 4/15/28 (f) | | | 4,041,744 | | | | 5,346,467 | |
| | | | | | | | |
| | | | | | | 95,266,430 | |
| | | | | | | | |
¨United States Treasury Inflation—Indexed Notes 89.7% | |
0.125%, due 4/15/16 (f) | | | 28,763,617 | | | | 29,534,395 | |
0.125%, due 4/15/17 (f) | | | 14,491,557 | | | | 14,894,596 | |
0.125%, due 4/15/18 (f) | | | 37,882,227 | | | | 38,636,917 | |
0.125%, due 1/15/22 (f) | | | 19,700,695 | | | | 18,934,220 | |
0.125%, due 7/15/22 (f) | | | 43,551,222 | | | | 41,717,324 | |
0.125%, due 1/15/23 (f) | | | 35,297,860 | | | | 33,337,170 | |
0.375%, due 7/15/23 (f) | | | 14,044,240 | | | | 13,545,009 | |
0.50%, due 4/15/15 (f) | | | 25,956,664 | | | | 26,526,491 | |
0.625%, due 7/15/21 (f) | | | 6,525,603 | | | | 6,623,996 | |
1.125%, due 1/15/21 (f) | | | 50,371,840 | | | | 52,941,610 | |
1.25%, due 4/15/14 (f) | | | 1,875,296 | | | | 1,887,309 | |
1.375%, due 1/15/20 (f) | | | 26,017,637 | | | | 27,938,467 | |
1.625%, due 1/15/15 (f) | | | 4,890,815 | | | | 5,038,302 | |
1.875%, due 7/15/15 (f) | | | 1,200,220 | | | | 1,265,013 | |
1.875%, due 7/15/19 (f) | | | 10,605,154 | | | | 11,784,150 | |
| | | | | | | | |
| | | Principal
Amount | | | Value | |
United States Treasury Inflation—Indexed Notes (continued) | |
2.00%, due 1/15/16 (f) | | $ | 1,881,960 | | | $ | 2,005,610 | |
2.625%, due 7/15/17 (f) | | | 1,802,240 | | | | 2,027,239 | |
| | | | | | | | |
| | | | | | | 328,637,818 | |
| | | | | | | | |
Total U.S. Government & Federal Agencies
(Cost $457,883,046) | | | | | | | 429,983,642 | |
| | | | | | | | |
Total Long-Term Bonds
(Cost $518,071,299) | | | | | | | 490,791,001 | |
| | | | | | | | |
|
| Short-Term Investments 82.8% | |
Mexico Government 4.0% | |
Mexico Cetes
3.386%, due 1/16/14 (g) | | M$ | 90,000 | | | | 6,883 | |
3.386%, due 1/23/14 (g) | | | 530,000 | | | | 40,510 | |
3.447%, due 2/13/14 (g) | | | 32,260,000 | | | | 2,460,824 | |
3.478%, due 3/6/14 (g) | | | 120,000 | | | | 9,135 | |
3.508%, due 3/13/14 (g) | | | 161,300,000 | | | | 12,270,421 | |
| | | | | | | | |
Total Mexico Government
(Cost $15,010,174) | | | | | | | 14,787,773 | |
| | | | | | | | |
| | |
Other Commercial Paper 1.0% | | | | | | | | |
Banco Do Brasil S.A.
1.217%, due 1/24/14 (c)(g) | | $ | 3,700,000 | | | | 3,697,197 | |
| | | | | | | | |
Total Other Commercial Paper
(Cost $3,697,197) | | | | | | | 3,697,197 | |
| | | | | | | | |
| | |
Repurchase Agreements 71.3% | | | | | | | | |
Bank of America
0.01%, dated 12/31/13
due 1/2/14
Proceeds at Maturity $44,100,025 (Collateralized by a United States Treasury Bond with a rate of 4.50% and a maturity date of 5/15/38, with a Principal Amount of $40,309,000 and a Market Value of $44,935,676) | | | 44,100,000 | | | | 44,100,000 | |
Barclays Capital, Inc.
0.01%, dated 12/31/13
due 1/2/14
Proceeds at Maturity $44,100,025 (Collateralized by a United States Treasury Note with a rate of 0.25% and a maturity date of 12/31/15, with a Principal Amount of $45,099,000 and a Market Value of $44,980,976) | | | 44,100,000 | | | | 44,100,000 | |
| | | | | | |
The notes to the financial statements are an integral part of,
and should be read in conjunction with, the financial statements. | | mainstayinvestments.com | | | M-375 | |
Portfolio of Investments December 31, 2013 (continued)
| | | | | | | | |
| | | Principal
Amount | | | Value | |
| Short-Term Investments (continued) | |
BNP Paribas Securities Corp.
0.03%, dated 12/31/13
due 1/2/14
Proceeds at Maturity $44,100,074 (Collateralized by a Federal Home Loan Mortgage Corp. security with a rate of 3.00% and a maturity date of 1/1/43, with a Principal Amount of $47,888,167 and a Market Value of $45,628,331) | | $ | 44,100,000 | | | $ | 44,100,000 | |
Deutsche Bank Securities, Inc.
0.02%, dated 12/31/13
due 1/2/14
Proceeds at Maturity $39,600,044 (Collateralized by a United States Treasury Bond with a rate of 4.50% and a maturity date of 8/15/39, with a Principal Amount of $35,664,000 and a Market Value of $40,149,854) | | | 39,600,000 | | | | 39,600,000 | |
JPMorgan Chase Bank
0.03%, dated 12/31/13
due 1/2/14
Proceeds at Maturity $44,100,074 (Collateralized by a United States Treasury Note with a rate of 2.50% and a maturity date of 3/31/15, with a Principal Amount of $43,501,800 and a Market Value of $45,017,999) | | | 44,100,000 | | | | 44,100,000 | |
RBS Securities, Inc.
0.02%, dated 12/31/13
due 1/2/14
Proceeds at Maturity $44,100,049 (Collateralized by a United States Treasury Note with a rate of 0.63% and a maturity date of 11/30/17, with a Principal Amount of $46,095,000 and a Market Value of $44,972,554) | | | 44,100,000 | | | | 44,100,000 | |
State Street Bank and Trust Co.
0.00%, dated 12/31/13
due 1/2/14
Proceeds at Maturity $1,010,554 (Collateralized by a Federal National Mortgage Association security with a rate of 2.17% and a maturity date of 11/7/22, with a Principal Amount of $1,135,000 and a Market Value of $1,033,208) | | | 1,010,554 | | | | 1,010,554 | |
| | | | | | | | |
Total Repurchase Agreements
(Cost $261,110,554) | | | | | | | 261,110,554 | |
| | | | | | | | |
| | | | | | | | |
| | | Principal
Amount | | | Value | |
| U.S. Government & Federal Agency 6.5% | |
Federal Agency 6.1% | |
Federal Home Loan Bank Discount Notes 0.03%, due 1/3/14 (g) | | $ | 22,300,000 | | | $ | 22,299,963 | |
| | | | | | | | |
|
United States Treasury Bills 0.4% | |
0.124% -0.135%, due 12/11/14 (g) | | | 1,670,000 | | | | 1,668,163 | |
| | | | | | | | |
Total U.S. Government & Federal Agency
(Cost $23,967,886) | | | | | | | 23,968,126 | |
| | | | | | | | |
Total Short-Term Investments
(Cost $303,785,811) | | | | | | | 303,563,650 | |
| | | | | | | | |
Total Investments
(Cost $821,857,110) (j) | | | 216.8 | % | | | 794,354,651 | |
Other Assets, Less Liabilities | | | (116.8 | ) | | | (427,996,097 | ) |
Net Assets | | | 100.0 | % | | $ | 366,358,554 | |
| | |
| | | | | | | | |
| | | Contracts
Long | | | Unrealized
Appreciation
(Depreciation) (h) | |
| Futures Contracts (0.0%)‡ | | | | | | | | |
90—Day Eurodollar
September 2014 (i) | | | 90 | | | $ | 31,324 | |
90—Day Eurodollar
December 2015 (i) | | | 36 | | | | (10,092 | ) |
90—Day Eurodollar
March 2016 (i) | | | 145 | | | | (115,208 | ) |
90—Day Eurodollar
March 2017 (i) | | | 45 | | | | 36,485 | |
| | | | | | | | |
Total Futures Contracts
(Notional Amount $78,001,250) | | | | | | $ | (57,491 | ) |
| | | | | | | | |
| ‡ | Less than one-tenth of a percent. |
| (a) | Floating rate—Rate shown is the rate in effect as of December 31, 2013. |
| (b) | Subprime mortgage investment or other asset-backed security. The total market value of these securities as of December 31, 2013, is $7,722,444, which represents 2.1% of the Portfolio’s net assets. |
| (c) | May be sold to institutional investors only under Rule 144A or securities offered pursuant to Section 4(a)(2) of the Securities Act of 1933, as amended. |
| (d) | Illiquid security—The total market value of these securities as of December 31, 2013, is $1,237,075, which represents 0.3% of the Portfolio’s net assets. |
| (e) | Collateral strip rate—A bond whose interest is based on the weighted net interest rate of the collateral. The coupon rate adjusts periodically based on a predetermined schedule. Rate shown is the rate in effect as of December 31, 2013. |
| | | | |
| M-376 | | MainStay VP PIMCO Real Return Portfolio | | The notes to the financial statements are an integral part of,
and should be read in conjunction with, the financial statements. |
| (f) | Delayed delivery security. |
| (g) | Interest rate shown represents yield to maturity. |
| (h) | Represents the difference between the value of the contracts at the time they were opened and the value as of December 31, 2013. |
| (i) | As of December 31, 2013, cash in the amount of $1,616,353 is on deposit with broker for futures transactions. |
| (j) | As of December 31, 2013, cost is $862,123,701 for federal income tax purposes and net unrealized depreciation is as follows: |
| | | | |
Gross unrealized appreciation | | $ | 1,693,596 | |
Gross unrealized depreciation | | | (69,462,646 | ) |
| | | | |
Net unrealized depreciation | | $ | (67,769,050 | ) |
| | | | |
The following abbreviations are used in the above portfolio:
£–British Pound Sterling
A$—Australian Dollar
B$—Brazilian Real
M$—Mexican Peso
N$—New Zealand Dollar
€—Euro
As of December 31, 2013, the Portfolio held the following foreign currency forward contracts:
| | | | | | | | | | | | | | | | | | | | | | | | | | | | | | |
Foreign Currency Buy Contracts | | Expiration
Date | | Counterparty | | | Contract
Amount
Purchased | | | Contract
Amount
Sold | | | Unrealized
Appreciation
(Depreciation) | |
Brazilian Real vs. U.S. Dollar | | 1/3/14 | | | Credit Suisse | | | | BRL | | | | 17,602,951 | | | | USD | | | | 7,501,474 | | | | USD | | | | (40,224 | ) |
Brazilian Real vs. U.S. Dollar | | 1/3/14 | | | JPMorgan Chase Bank | | | | | | | | 14,599,373 | | | | | | | | 6,232,124 | | | | | | | | (43,982 | ) |
Canadian Dollar vs. U.S. Dollar | | 3/20/14 | | | Credit Suisse | | | | CAD | | | | 390,000 | | | | | | | | 366,484 | | | | | | | | (30 | ) |
New Zealand Dollar vs. U.S. Dollar | | 1/6/14 | | | Credit Suisse | | | | NZD | | | | 2,057,000 | | | | | | | | 1,681,096 | | | | | | | | 10,582 | |
| | | | | | | | | | | | | | | | | | | | | | | | | | | | | | |
Foreign Currency Sales Contracts | | | | | | | Contract
Amount
Sold | | | Contract
Amount
Purchased | | | | | | | |
Australian Dollar vs. U.S. Dollar | | 1/6/14 | | | Credit Suisse | | | | AUD | | | | 4,015,000 | | | | USD | | | | 3,648,671 | | | | USD | | | | 64,382 | |
Brazilian Real vs. U.S. Dollar | | 1/3/14 | | | Credit Suisse | | | | BRL | | | | 17,602,952 | | | | | | | | 7,564,383 | | | | | | | | 103,134 | |
Brazilian Real vs. U.S. Dollar | | 2/4/14 | | | Credit Suisse | | | | | | | | 16,568,794 | | | | | | | | 7,006,146 | | | | | | | | 39,663 | |
Brazilian Real vs. U.S. Dollar | | 1/3/14 | | | JPMorgan Chase Bank | | | | | | | | 14,599,372 | | | | | | | | 6,362,212 | | | | | | | | 174,071 | |
Canadian Dollar vs. U.S. Dollar | | 3/20/14 | | | Credit Suisse | | | | CAD | | | | 598,000 | | | | | | | | 560,456 | | | | | | | | (1,441 | ) |
Euro vs. U.S. Dollar | | 2/4/14 | | | Credit Suisse | | | | EUR | | | | 14,744,000 | | | | | | | | 20,270,105 | | | | | | | | (12,906 | ) |
Japanese Yen vs. U.S. Dollar | | 2/18/14 | | | Credit Suisse | | | | JPY | | | | 13,700,000 | | | | | | | | 137,950 | | | | | | | | 7,831 | |
Mexican Peso vs. U.S. Dollar | | 3/13/14 | | | Credit Suisse | | | | MXN | | | | 89,942,012 | | | | | | | | 6,956,072 | | | | | | | | 105,667 | |
Mexican Peso vs. U.S. Dollar | | 1/23/14 | | | JPMorgan Chase Bank | | | | | | | | 736,972 | | | | | | | | 56,767 | | | | | | | | 413 | |
Mexican Peso vs. U.S. Dollar | | 2/13/14 | | | JPMorgan Chase Bank | | | | | | | | 102,046,908 | | | | | | | | 7,905,404 | | | | | | | | 115,544 | |
Mexican Peso vs. U.S. Dollar | | 3/6/14 | | | Credit Suisse | | | | | | | | 10,089,000 | | | | | | | | 775,308 | | | | | | | | 6,466 | |
Mexican Peso vs. U.S. Dollar | | 3/6/14 | | | JPMorgan Chase Bank | | | | | | | | 60,311,814 | | | | | | | | 4,655,845 | | | | | | | | 59,729 | |
New Zealand Dollar vs. U.S. Dollar | | 1/6/14 | | | Credit Suisse | | | | NZD | | | | 2,057,000 | | | | | | | | 1,669,636 | | | | | | | | (22,041 | ) |
New Zealand Dollar vs. U.S. Dollar | | 2/4/14 | | | Credit Suisse | | | | | | | | 2,057,000 | | | | | | | | 1,677,582 | | | | | | | | (10,646 | ) |
Pound Sterling vs. U.S. Dollar | | 3/12/14 | | | JPMorgan Chase Bank | | | | GBP | | | | 1,017,000 | | | | | | | | 1,671,748 | | | | | | | | (11,547 | ) |
Net unrealized appreciation (depreciation) on foreign currency forward contracts | | | | USD | | | | 544,665 | |
| | | | | | |
The notes to the financial statements are an integral part of,
and should be read in conjunction with, the financial statements. | | mainstayinvestments.com | | | M-377 | |
Portfolio of Investments December 31, 2013 (continued)
Written Options
Options on Futures Contracts
| | | | | | | | | | | | | | | | | | | | | | | | |
Description | | Counterparty | | | Strike
Price | | | Expiration
Date | | | Number of
Contractst | | | Premium
Received | | | Market
Value | |
Put—Eurodollar Mid Curve 3 Year Future | | | Morgan Stanley | | | $ | 97.380 | | | | 3/14/2014 | | | | 24 | | | $ | 8,360 | | | $ | (12,000 | ) |
Swap Contracts
Open OTC interest rate swap agreements as of December 31, 2013 were as follows:
| | | | | | | | | | | | | | | | | | | | | | | | | | | | | | | | |
Notional
Amount | | Currency | | | Expiration Date | | | Counterparty | | | Payments
made by
Portfolio | | | Payments
Received
by Portfolio | | | Upfront
Premiums
Received/(Paid) | | | Unrealized
Appreciation/
(Depreciation) | | | Value | |
$200,000 | | | USD | | | | 10/31/2016 | | | | Credit Suisse | | | | Fixed 1.94 | % | | | 12-Month USD-CPI | | | $ | — | | | $ | (754 | ) | | $ | (754 | ) |
$8,000,000 | | | USD | | | | 11/16/2017 | | | | Credit Suisse | | | | Fixed 2.32 | % | | | 12-Month USD-CPI | | | | — | | | | (197,221 | ) | | | (197,221 | ) |
€4,900,000 | | | EUR | | | | 4/1/2021 | | | | Credit Suisse | | | | 12-Month EUR-CPI | | | | Fixed 2.15 | % | | | (9,388 | ) | | | 302,047 | | | | 292,659 | |
€1,800,000 | | | EUR | | | | 7/25/2021 | | | | Credit Suisse | | | | 12-Month EUR-CPI | | | | Fixed 1.95 | % | | | (1,410 | ) | | | 52,956 | | | | 51,546 | |
| | | | | | | | | | | | | | | | | | | | | | | $ | (10,798 | ) | | $ | 157,028 | | | $ | 146,230 | |
Open centrally cleared interest rate swap agreements as of December 31, 2013 were as follows:
| | | | | | | | | | | | | | | | | | | | | | | | | | | | | | | | |
Notional
Amount | | Currency | | | Expiration Date | | | Counterparty | | | Payments
made
by Portfolio | | | Payments
Received
by Portfolio | | | Upfront
Premiums
Received/(Paid) | | | Unrealized
Appreciation/
(Depreciation) | | | Value | |
$5,300,000 | | | USD | | | | 12/18/2043 | | | | Barclays Capital | | | | Fixed 3.50 | % | | | 3-Month USD-LIBOR | | | $ | 217,830 | | | $ | 214,231 | | | $ | 432,061 | |
$5,900,000 | | | USD | | | | 12/18/2043 | | | | Credit Suisse | | | | Fixed 3.50 | % | | | 3-Month USD-LIBOR | | | | 206,914 | | | | 274,060 | | | | 480,974 | |
¥670,000,000 | | | JPY | | | | 9/18/2023 | | | | Credit Suisse | | | | Fixed 1.00 | % | | | 6-Month JPY-LIBOR | | | | (45,242 | ) | | | (15,143 | ) | | | (60,385 | ) |
$8,700,000 | | | USD | | | | 6/19/2043 | | | | Credit Suisse | | | | Fixed 2.75 | % | | | 3-Month USD-LIBOR | | | | 597,664 | | | | 1,310,428 | | | | 1,908,092 | |
| | | | | | | | | | | | | | | | | | | | | | | $ | 977,166 | | | $ | 1,783,576 | | | $ | 2,760,742 | |
The following is a summary of the fair valuations according to the inputs used as of December 31, 2013, for valuing the Portfolio’s assets and liabilities.
Asset Valuation Inputs
| | | | | | | | | | | | | | | | |
Description | | Quoted Prices
in Active Markets
for Identical Assets
(Level 1) | | | Significant Other
Observable Inputs
(Level 2) | | | Significant
Unobservable
Inputs
(Level 3) | | | Total | |
| Investments in Securities (a) | | | | | | | | | | | | | | | | |
| Long-Term Bonds | | | | | | | | | | | | | | | | |
Asset-Backed Securities | | $ | — | | | $ | 7,722,444 | | | $ | — | | | $ | 7,722,444 | |
Corporate Bonds | | | — | | | | 3,995,808 | | | | — | | | | 3,995,808 | |
Foreign Government Bonds | | | — | | | | 38,399,519 | | | | — | | | | 38,399,519 | |
Mortgage-Backed Securities | | | — | | | | 10,689,588 | | | | — | | | | 10,689,588 | |
U.S. Government & Federal Agencies | | | — | | | | 429,983,642 | | | | — | | | | 429,983,642 | |
| | | | | | | | | | | | | | | | |
| Total Long-Term Bonds | | | — | | | | 490,791,001 | | | | — | | | | 490,791,001 | |
| | | | | | | | | | | | | | | | |
| Short-Term Investments | | | | | | | | | | | | | | | | |
Mexico Government | | | — | | | | 14,787,773 | | | | — | | | | 14,787,773 | |
Other Commercial Paper | | | — | | | | 3,697,197 | | | | — | | | | 3,697,197 | |
Repurchase Agreement | | | — | | | | 261,110,554 | | | | — | | | | 261,110,554 | |
U.S. Government & Federal Agency | | | — | | | | 23,968,126 | | | | — | | | | 23,968,126 | |
| | | | | | | | | | | | | | | | |
| Total Short-Term Investments | | | — | | | | 303,563,650 | | | | — | | | | 303,563,650 | |
| | | | | | | | | | | | | | | | |
| Total Investments in Securities | | | — | | | | 794,354,651 | | | | — | | | | 794,354,651 | |
| | | | | | | | | | | | | | | | |
| Other Financial Instruments | | | | | | | | | | | | | | | | |
Foreign Currency Forward Contracts (b) | | | — | | | | 687,482 | | | | — | | | | 687,482 | |
Swap Contracts | | | — | | | | 3,165,332 | | | | — | | | | 3,165,332 | |
| | | | | | | | | | | | | | | | |
| Total Other Financial Instruments | | | — | | | | 3,852,814 | | | | — | | | | 3,852,814 | |
| | | | | | | | | | | | | | | | |
| Total Investments in Securities and Other Financial Instruments | | $ | — | | | $ | 798,207,465 | | | $ | — | | | $ | 798,207,465 | |
| | | | | | | | | | | | | | | | |
| | | | |
| M-378 | | MainStay VP PIMCO Real Return Portfolio | | The notes to the financial statements are an integral part of,
and should be read in conjunction with, the financial statements. |
Liability Valuation Inputs
| | | | | | | | | | | | | | | | |
Description | | Quoted Prices
in Active Markets
for Identical Assets
(Level 1) | | | Significant Other
Observable Inputs
(Level 2) | | | Significant
Unobservable
Inputs
(Level 3) | | | Total | |
| Other Financial Instruments | | | | | | | | | | | | | | | | |
Foreign Currency Forward Contracts (b) | | $ | — | | | $ | (142,817 | ) | | $ | — | | | $ | (142,817 | ) |
Futures Contracts Long (b) | | | (57,491 | ) | | | — | | | | — | | | | (57,491 | ) |
Swap Contracts | | | — | | | | (258,360 | ) | | | — | | | | (258,360 | ) |
Written Options | | | — | | | | (12,000 | ) | | | — | | | | (12,000 | ) |
| | | | | | | | | | | | | | | | |
| Total Other Financial Instruments | | $ | (57,491 | ) | | $ | (413,177 | ) | | $ | — | | | $ | (470,668 | ) |
| | | | | | | | | | | | | | | | |
| (a) | For a complete listing of investments and their industries, see the Portfolio of Investments. |
| (b) | The value listed for these securities reflects unrealized appreciation (depreciation) as shown on the Portfolio of Investments. |
The Portfolio recognizes transfers between the levels as of the beginning of the period.
For the period ended December 31, 2013, the Portfolio did not have any transfers between Level 1 and Level 2 fair value measurements. (See Note 2)
As of December 31, 2013, the Portfolio did not hold any investments with significant unobservable inputs (Level 3). (See Note 2)
| | | | | | |
The notes to the financial statements are an integral part of,
and should be read in conjunction with, the financial statements. | | mainstayinvestments.com | | | M-379 | |
Statement of Assets and Liabilities as of December 31, 2013
| | | | |
| Assets | |
Investment in securities, at value (identified cost $560,746,556) | | $ | 533,244,097 | |
Repurchase agreements, at value (identified cost $261,110,554) | | | 261,110,554 | |
Cash collateral on deposit at broker | | | 1,616,353 | |
Cash denominated in foreign currencies (identified cost $188,794) | | | 178,191 | |
Receivables: | | | | |
Investment securities sold | | | 11,028,794 | |
Interest | | | 1,971,418 | |
Fund shares sold | | | 8,365 | |
Variation margin receivable on swap contracts | | | 286,854 | |
Open swap contracts, at value | | | 344,205 | |
Other assets | | | 201 | |
Unrealized appreciation on foreign currency forward contracts | | | 687,482 | |
| | | | |
Total assets | | | 810,476,514 | |
| | | | |
| |
| Liabilities | | | | |
Written options, at value (premiums received $8,360) | | | 12,000 | |
Payables: | | | | |
Dollar roll transactions | | | 441,467,474 | |
Investment securities purchased | | | 913,592 | |
Fund shares redeemed | | | 658,395 | |
Cash collateral due to broker | | | 390,000 | |
Open swap contracts, at value | | | 197,975 | |
Manager (See Note 3) | | | 142,577 | |
NYLIFE Distributors (See Note 3) | | | 76,763 | |
Professional fees | | | 72,230 | |
Shareholder communication | | | 18,874 | |
Variation margin on futures contracts | | | 14,113 | |
Custodian | | | 7,758 | |
Trustees | | | 657 | |
Accrued expenses | | | 2,735 | |
Unrealized depreciation on foreign currency forward contracts | | | 142,817 | |
| | | | |
Total liabilities | | | 444,117,960 | |
| | | | |
Net assets | | $ | 366,358,554 | |
| | | | |
| | | | |
| Net Assets Consist of | | | | |
Shares of beneficial interest outstanding (par value of $.001 per share) unlimited number of shares authorized | | $ | 38,887 | |
Additional paid-in capital | | | 397,582,333 | |
| | | | |
| | | 397,621,220 | |
Undistributed net investment income | | | 1,607,663 | |
Accumulated net realized gain (loss) on investments, futures transactions, written options, swap transactions and foreign currency transactions | | | (7,750,801 | ) |
Net unrealized appreciation (depreciation) on investments, swap contracts, futures contracts and written options | | | (25,658,324 | ) |
Net unrealized appreciation (depreciation) on translation of other assets and liabilities in foreign currencies and foreign currency forward contracts | | | 538,796 | |
| | | | |
Net assets | | $ | 366,358,554 | |
| | | | |
Initial Class | | | | |
Net assets applicable to outstanding shares | | $ | 9,678,047 | |
| | | | |
Shares of beneficial interest outstanding | | | 1,025,187 | |
| | | | |
Net asset value per share outstanding | | $ | 9.44 | |
| | | | |
Service Class | | | | |
Net assets applicable to outstanding shares | | $ | 356,680,507 | |
| | | | |
Shares of beneficial interest outstanding | | | 37,861,550 | |
| | | | |
Net asset value per share outstanding | | $ | 9.42 | |
| | | | |
| | | | |
| M-380 | | MainStay VP PIMCO Real Return Portfolio | | The notes to the financial statements are an integral part of,
and should be read in conjunction with, the financial statements. |
Statement of Operations for the year ended December 31, 2013
| | | | |
| Investment Income (Loss) | |
Income | | | | |
Interest | | $ | 6,666,822 | |
| | | | |
Expenses | | | | |
Manager (See Note 3) | | | 2,237,842 | |
Distribution and service—Service
Class (See Note 3) | | | 1,091,136 | |
Interest expense | | | 331,997 | |
Shareholder communication | | | 67,270 | |
Custodian | | | 52,824 | |
Professional fees | | | 30,130 | |
Trustees | | | 9,679 | |
Miscellaneous | | | 16,145 | |
| | | | |
Total expenses before waiver/reimbursement | | | 3,837,023 | |
| | | | |
Expense waiver/reimbursement from
Manager (See Note 3) | | | (188,960 | ) |
| | | | |
Net expenses | | | 3,648,063 | |
| | | | |
Net investment income (loss) | | | 3,018,759 | |
| | | | |
|
Realized and Unrealized Gain (Loss)
on Investments, Futures
Contracts, Swap Contracts,
Written Options and Foreign
Currency Transactions | |
Net realized gain (loss) on: | | | | |
Security transactions | | | (6,913,538 | ) |
Futures transactions | | | (544,514 | ) |
Written option transactions | | | 188,291 | |
Swap transactions | | | 615,038 | |
Foreign currency transactions | | | (1,095,576 | ) |
| | | | |
Net realized gain (loss) on investments, futures transactions, swap transactions, written option transactions and foreign currency transactions | | | (7,750,299 | ) |
| | | | |
Net change in unrealized appreciation (depreciation) on: | | | | |
Investments | | | (42,615,501 | ) |
Futures contracts | | | (93,577 | ) |
Swap contracts | | | 1,558,753 | |
Written option contracts | | | (50,919 | ) |
Translation of other assets and liabilities in foreign currencies and foreign currency forward contracts | | | 708,879 | |
| | | | |
Net change in unrealized appreciation (depreciation) on investments, futures contracts, swap contracts, written options and foreign currency transactions | | | (40,492,365 | ) |
| | | | |
Net realized and unrealized gain (loss) on investments, futures transactions, written options, swap transactions and foreign currency transactions | | | (48,242,664 | ) |
| | | | |
Net increase (decrease) in net assets resulting from operations | | $ | (45,223,905 | ) |
| | | | |
| | | | | | |
The notes to the financial statements are an integral part of,
and should be read in conjunction with, the financial statements. | | mainstayinvestments.com | | | M-381 | |
Statements of Changes in Net Assets
for the year ended December 31, 2013 and the period February 17, 2012 (inception date) through December 31, 2012
| | | | | | | | |
| | | 2013 | | | 2012 | |
| Increase (Decrease) in Net Assets | |
Operations: | | | | | | | | |
Net investment income (loss) | | $ | 3,018,759 | | | $ | 4,559,150 | |
Net realized gain (loss) on investments, futures transactions, written option transactions, swap transactions and foreign currency transactions | | | (7,750,299 | ) | | | 1,111,818 | |
Net change in unrealized appreciation (depreciation) on investments, futures contracts, written options, swap contracts and foreign currency transactions | | | (40,492,365 | ) | | | 15,372,837 | |
| | | | |
Net increase (decrease) in net assets resulting from operations | | | (45,223,905 | ) | | | 21,043,805 | |
| | | | |
Dividends and distributions to shareholders: | | | | | | | | |
From net investment income: | | | | | | | | |
Initial Class | | | (126,711 | ) | | | — | |
Service Class | | | (4,287,326 | ) | | | — | |
| | | | |
| | | (4,414,037 | ) | | | — | |
| | | | |
From net realized gain on investments: | | | | | | | | |
Initial Class | | | (67,235 | ) | | | — | |
Service Class | | | (2,601,367 | ) | | | — | |
| | | | |
| | | (2,668,602 | ) | | | — | |
| | | | |
Total dividends and distributions to shareholders | | | (7,082,639 | ) | | | — | |
| | | | |
Capital share transactions: | | | | | | | | |
Net proceeds from sale of shares | | | 74,947,360 | | | | 503,426,030 | |
Net asset value of shares issued to shareholders in reinvestment of dividends and distributions | | | 7,082,639 | | | | — | |
Cost of shares redeemed | | | (151,814,149 | ) | | | (36,020,587 | ) |
| | | | |
Increase (decrease) in net assets derived from capital share transactions | | | (69,784,150 | ) | | | 467,405,443 | |
| | | | |
Net increase (decrease) in net assets | | | (122,090,694 | ) | | | 488,449,248 | |
|
| Net Assets | |
Beginning of period | | | 488,449,248 | | | | — | |
| | | | |
End of period | | $ | 366,358,554 | | | $ | 488,449,248 | |
| | | | |
Undistributed net investment income at end of period | | $ | 1,607,663 | | | $ | 4,320,491 | |
| | | | |
| | | | |
| M-382 | | MainStay VP PIMCO Real Return Portfolio | | The notes to the financial statements are an integral part of,
and should be read in conjunction with, the financial statements. |
Statement of Cash Flows for the year ended December 31, 2013
| | | | |
| Cash flows used in operating activities: | |
Net decrease in net assets resulting from operations | | $ | (45,223,905 | ) |
Adjustments to reconcile net decrease in net assets resulting from operations to net cash used in operating activities: | | | | |
Investments purchased | | | (471,892,026 | ) |
Investments sold | | | 470,653,041 | |
Sale of short term investments, net | | | 90,540,554 | |
Amortization (accretion) of discount and premium, net | | | 4,277,418 | |
Increase in investment securities sold receivable | | | (8,221,472 | ) |
Increase in interest receivable | | | (1,090,276 | ) |
Increase in deposit at brokers | | | (1,616,353 | ) |
Decrease in other assets | | | 421 | |
Increase in receivable for open forward foreign currency contracts | | | (588,880 | ) |
Decrease in premiums from written options | | | (57,190 | ) |
Decrease in investment securities purchased payable | | | (49,086,408 | ) |
Increase in payable for dollar rolls | | | 38,220,614 | |
Increase in due to broker | | | 390,000 | |
Decrease in professional fees payable | | | (47,650 | ) |
Increase in custodian payable | | | 3,341 | |
Decrease in shareholder communication payable | | | (16,558 | ) |
Decrease in due to directors | | | (36 | ) |
Decrease in due to manager | | | (37,794 | ) |
Decrease in due to NYLIFE Distributors | | | (23,128 | ) |
Increase in receivable for open swap contracts | | | (314,067 | ) |
Decrease in payable for open swap contracts | | | (16,859 | ) |
Decrease in payable for open forward foreign currency contracts | | | (119,622 | ) |
Decrease in variation margin on derivative instruments | | | (146,902 | ) |
Increase in accrued expenses and other liabilities | | | 2,735 | |
Net change in unrealized (appreciation) depreciation on investments | | | 42,615,501 | |
Net realized gain from investments | | | 6,913,538 | |
| | | | |
Net cash provided by operating activities | | | 75,118,037 | |
| | | | |
|
| Cash flows from financing activities: | |
Proceeds from shares sold | | | 76,279,051 | |
Payment on shares redeemed | | | (151,305,760 | ) |
Due to custodian | | | (694 | ) |
| | | | |
Net cash used in financing activities | | | (75,027,403 | ) |
| | | | |
Net increase in cash: | | | 90,634 | |
Cash at beginning of year | | | 87,557 | |
| | | | |
Cash at end of year | | $ | 178,191 | |
| | | | |
| | | | | | |
The notes to the financial statements are an integral part of,
and should be read in conjunction with, the financial statements. | | mainstayinvestments.com | | | M-383 | |
Financial Highlights selected per share data and ratios
| | | | | | | | | | | | | | | | | | |
| | | Initial Class | | | | | Service Class | |
| | | Year ended
December 31, | | | February 17,
2012**
through
December 31, | | | | | Year ended
December 31, | | | February 17,
2012**
through
December 31, | |
| | | 2013 | | | 2012 | | | | | 2013 | | | 2012 | |
Net asset value at beginning of period | | $ | 10.59 | | | $ | 10.00 | | | | | $ | 10.58 | | | $ | 10.00 | |
| | | | | | | | | | | | | | | | | | |
Net investment income (loss) (a) | | | 0.09 | | | | 0.14 | | | | | | 0.07 | | | | 0.12 | |
Net realized and unrealized gain (loss) on investments | | | (1.05 | ) | | | 0.47 | | | | | | (1.05 | ) | | | 0.48 | |
Net realized and unrealized gain (loss) on foreign currency transactions | | | (0.01 | ) | | | (0.02 | ) | | | | | (0.01 | ) | | | (0.02 | ) |
| | | | | | | | | | | | | | | | | | |
Total from investment operations | | | (0.97 | ) | | | 0.59 | | | | | | (0.99 | ) | | | 0.58 | |
| | | | | | | | | | | | | | | | | | |
Less dividends and distributions: | | | | | | | | | | | | | | | | | | |
From net investment income | | | (0.12 | ) | | | — | | | | | | (0.11 | ) | | | — | |
From net realized gain on investments | | | (0.06 | ) | | | — | | | | | | (0.06 | ) | | | — | |
| | | | | | | | | | | | | | | | | | |
Total dividends and distributions | | | (0.18 | ) | | | — | | | | | | (0.17 | ) | | | — | |
| | | | | | | | | | | | | | | | | | |
Net asset value at end of period | | $ | 9.44 | | | $ | 10.59 | | | | | $ | 9.42 | | | $ | 10.58 | |
| | | | | | | | | | | | | | | | | | |
Total investment return | | | (9.08 | %) | | | 5.90 | %(b)(c) | | | | | (9.26 | %) | | | 5.80 | %(b)(c) |
Ratios (to average net assets)/Supplemental Data: | | | | | | | | | | | | | | | | | | |
Net investment income (loss) | | | 0.88 | % | | | 1.51 | %†† | | | | | 0.67 | % | | | 1.32 | %†† |
Net expenses (d) | | | 0.61 | % | | | 0.62 | %†† | | | | | 0.82 | % | | | 0.81 | %†† |
Expenses (before waiver/reimbursement) (d) | | | 0.61 | % | | | 0.62 | % | | | | | 0.86 | % | | | 0.87 | %†† |
Portfolio turnover rate | | | 88 | % (e) | | | 44 | %(e) | | | | | 88 | % (e) | | | 44 | %(e) |
Net assets at end of period (in 000’s) | | $ | 9,678 | | | $ | 12,642 | | | | | $ | 356,681 | | | $ | 475,807 | |
| (a) | Per share data based on average shares outstanding during the period. |
| (b) | Total investment return is not annualized. |
| (c) | Total investment return may reflect adjustments to conform to generally accepted accounting principles. |
| (d) | Includes interest expenses of 0.07% and 0.05% incurred as a result of entering into reverse repurchase agreements and dollar roll transactions for the year ended December 31, 2013 and the period ended December 31, 2012, respectively. |
| (e) | The portfolio turnover rate not including dollar rolls was 43% for the period ended December 31, 2012. |
| | | | |
| M-384 | | MainStay VP PIMCO Real Return Portfolio | | The notes to the financial statements are an integral part of,
and should be read in conjunction with, the financial statements. |
MainStay VP S&P 500 Index Portfolio
Investment and Performance Comparison1 (Unaudited)
Performance data quoted represents past performance. Past performance is no guarantee of future results. Because of market volatility, current performance may be lower or higher than the figures shown. Investment return and principal value will fluctuate, and as a result, when shares are redeemed, they may be worth more or less than their original cost. The performance table and graph do not reflect any deduction of sales charges, mortality and expense charges, contract charges or administrative charges. Please refer to the Performance Summary appropriate for your policy. For performance information current to the most recent month-end, please call 800-598-2019 or visit www.newyorklife.com.
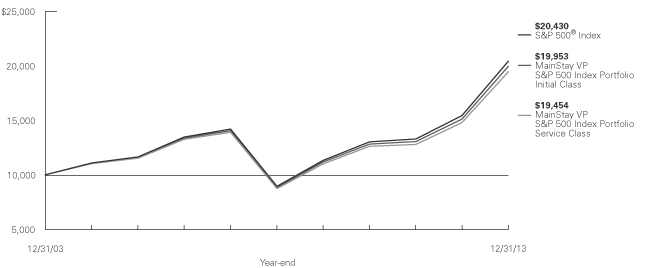
Average Annual Total Returns for the Year Ended December 31, 2013
| | | | | | | | | | | | | | | | |
| Class | | One Year | | | Five Years | | | Ten Years2 | | | Gross
Expense
Ratio3 | |
| Initial Class Shares | | | 32.01 | % | | | 17.63 | % | | | 7.15 | % | | | 0.29 | % |
| Service Class Shares | | | 31.68 | | | | 17.34 | | | | 6.88 | | | | 0.54 | |
| | | | | | | | | | | | |
| Benchmark Performance | | One
Year | | | Five
Years | | | Ten
Years | |
S&P 500® Index4 | | | 32.39 | % | | | 17.94 | % | | | 7.41 | % |
Average Lipper Variable Products S&P 500 Index Portfolio5 | | | 31.80 | | | | 17.50 | | | | 7.05 | |
| 1. | Performance figures reflect certain fee waivers and/or expense limitations, without which total returns may have been different. For information on current fee waivers and/or expense limitations, please refer to the notes to the financial statements. |
| 2. | Performance figures shown for the ten-year period ended December 31, 2013 reflect nonrecurring reimbursements from affiliates for printing and mailing costs. If these non-recurring reimbursements had not been made, the total returns would have been 7.14% for Initial Class shares and 6.87% for Service Class shares for the ten-year period. |
| 3. | The gross expense ratios presented reflect the Portfolio’s “Total Annual Portfolio Operating Expenses” from the most recent Prospectus and may differ from other expense ratios disclosed in this report. |
| 4. | Please refer to pages M-2 and M-3 for additional explanations and disclosure regarding the Portfolios, their benchmark indices and other indices mentioned in the reports. |
| 5. | The Average Lipper Variable Products S&P 500 Index Portfolio is representative of portfolios that are passively managed and commit by prospectus language to replicate the performance of the S&P 500® Index (including reinvested dividends). In addition, S&P 500 Index portfolios have limited expenses (advisor fee no higher than 0.50%). Lipper Inc. is an independent monitor of fund performance. Results are based on total returns with all dividend and capital gain distributions reinvested. |
| | | | |
| mainstayinvestments.com | | | M-385 | |
Cost in Dollars of a $1,000 Investment in MainStay VP S&P 500 Index Portfolio (Unaudited)
The example below is intended to describe the fees and expenses borne by shareholders during the six-month period from July 1, 2013, to December 31, 2013, and the impact of those costs on your investment.
Example
As a shareholder of the Portfolio, you incur two types of costs: (1) transaction costs, including exchange fees and sales charges (loads) on purchases (as applicable), and (2) ongoing costs, including management fees, distribution and/or service (12b-1) fees, and other Portfolio expenses (as applicable). This example is intended to help you understand your ongoing costs (in dollars) of investing in the Portfolio and to compare these costs with the ongoing costs of investing in other Portfolios. The example is based on an investment of $1,000 made at the beginning of the six-month period and held for the entire period from July 1, 2013, to December 31, 2013. Shares are only sold in connection with variable life and annuity contracts and the example does not reflect any contract level or transactional fees or expenses. If these costs had been included, your costs would have been higher.
This example illustrates your Portfolio’s ongoing costs in two ways:
Actual Expenses
The second and third data columns in the table below provide information about actual account values and actual expenses. You may use the information in these columns, together with the amount you invested, to estimate the expenses that you paid during the six months ended
December 31, 2013. Simply divide your account value by $1,000 (for example, an $8,600 account value divided by $1,000 = 8.6), then multiply the result by the number under the heading entitled ‘‘Expenses Paid During Period’’ to estimate the expenses you paid on your account during this period.
Hypothetical Example for Comparison Purposes
The fourth and fifth data columns in the table below provide information about hypothetical account values and hypothetical expenses based on the Portfolio’s actual expense ratio and an assumed rate of return of 5% per year before expenses, which is not the Portfolio’s actual return. The hypothetical account values and expenses may not be used to estimate the actual ending account balances or expenses you paid for the six-month period shown. You may use this information to compare the ongoing costs of investing in the Portfolio with the ongoing costs of investing in other Portfolios. To do so, compare this 5% hypothetical example with the 5% hypothetical examples that appear in the shareholder reports of the other Portfolios.
Please note that the expenses shown in the table are meant to highlight your ongoing costs only and do not reflect any transactional costs, such as exchange fees or sales charges (loads). Therefore, the fourth and fifth data columns of the table are useful in comparing ongoing costs only and will not help you determine the relative total costs of owning different funds. In addition, if these transactional costs were included, your costs would have been higher.
| | | | | | | | | | | | | | | | | | | | |
| | | | | | | | | | | | | | | | |
| Share Class | | Beginning
Account
Value
7/1/13 | | | Ending Account
Value (Based
on Actual
Returns and
Expenses)
12/31/13 | | | Expenses
Paid
During
Period1 | | | Ending Account
Value (Based
on Hypothetical
5% Annualized
Return and
Actual Expenses)
12/31/13 | | | Expenses
Paid
During
Period1 | |
| | | | | |
| Initial Class Shares | | $ | 1,000.00 | | | $ | 1,161.60 | | | $ | 1.53 | | | $ | 1,023.80 | | | $ | 1.43 | |
| | | | | |
| Service Class Shares | | $ | 1,000.00 | | | $ | 1,160.10 | | | $ | 2.89 | | | $ | 1,022.50 | | | $ | 2.70 | |
| 1. | Expenses are equal to the Portfolio’s annualized expense ratio of each class (0.28% for Initial Class and 0.53% for Service Class) multiplied by the average account value over the period, divided by 365 and multiplied by 184 (to reflect the six-month period). The table above represents the actual expenses incurred during the six-month period. |
| | |
| M-386 | | MainStay VP S&P 500 Index Portfolio |
Industry Composition as of December 31, 2013 (Unaudited)
| | | | |
| Oil, Gas & Consumable Fuels | | | 8.3 | % |
| Pharmaceuticals | | | 5.7 | |
| Diversified Financial Services | | | 5.1 | |
| Computers & Peripherals | | | 4.0 | |
| Media | | | 3.7 | |
| IT Services | | | 3.6 | |
| Software | | | 3.4 | |
| Internet Software & Services | | | 3.1 | |
| Insurance | | | 3.0 | |
| Commercial Banks | | | 2.8 | |
| Aerospace & Defense | | | 2.7 | |
| Chemicals | | | 2.5 | |
| Industrial Conglomerates | | | 2.5 | |
| Biotechnology | | | 2.4 | |
| Food & Staples Retailing | | | 2.3 | |
| Capital Markets | | | 2.2 | |
| Specialty Retail | | | 2.2 | |
| Beverages | | | 2.1 | |
| Diversified Telecommunication Services | | | 2.1 | |
| Health Care Equipment & Supplies | | | 2.0 | |
| Health Care Providers & Services | | | 2.0 | |
| Household Products | | | 2.0 | |
| Semiconductors & Semiconductor Equipment | | | 2.0 | |
| Energy Equipment & Services | | | 1.8 | |
| Real Estate Investment Trusts | | | 1.8 | |
| Communications Equipment | | | 1.7 | |
| Hotels, Restaurants & Leisure | | | 1.7 | |
| Machinery | | | 1.7 | |
| Electric Utilities | | | 1.6 | |
| Food Products | | | 1.5 | |
| Internet & Catalog Retail | | | 1.5 | |
| Tobacco | | | 1.5 | |
| Multi-Utilities | | | 1.1 | |
| Consumer Finance | | | 1.0 | |
| Road & Rail | | | 0.9 | |
| | | | |
| Air Freight & Logistics | | | 0.8 | % |
| Electrical Equipment | | | 0.8 | |
| Textiles, Apparel & Luxury Goods | | | 0.8 | |
| Automobiles | | | 0.7 | |
| Multiline Retail | | | 0.7 | |
| Commercial Services & Supplies | | | 0.5 | |
| Life Sciences Tools & Services | | | 0.5 | |
| Metals & Mining | | | 0.5 | |
| Auto Components | | | 0.4 | |
| Electronic Equipment, Instruments & Components | | | 0.4 | |
| Household Durables | | | 0.4 | |
| Airlines | | | 0.2 | |
| Construction & Engineering | | | 0.2 | |
| Containers & Packaging | | | 0.2 | |
| Personal Products | | | 0.2 | |
| Professional Services | | | 0.2 | |
| Trading Companies & Distributors | | | 0.2 | |
| Wireless Telecommunication Services | | | 0.2 | |
| Building Products | | | 0.1 | |
| Construction Materials | | | 0.1 | |
| Distributors | | | 0.1 | |
| Diversified Consumer Services | | | 0.1 | |
| Gas Utilities | | | 0.1 | |
| Health Care Technology | | | 0.1 | |
| Independent Power Producers & Energy Traders | | | 0.1 | |
| Leisure Equipment & Products | | | 0.1 | |
| Office Electronics | | | 0.1 | |
| Paper & Forest Products | | | 0.1 | |
| Thrifts & Mortgage Finance | | | 0.1 | |
| Real Estate Management & Development | | | 0.0 | ‡ |
| Short-Term Investments | | | 1.7 | |
| Other Assets, Less Liabilities | | | –0.2 | |
| | | | |
| | | 100.0 | % |
| | | | |
See Portfolio of Investments beginning on page M-389 for specific holdings within these categories.
| ‡ | Less than one-tenth of a percent. |
Top Ten Holdings as of December 31, 2013 (excluding short-term investments) (Unaudited)
| 8. | Procter & Gamble Co. (The) |
| | | | |
| mainstayinvestments.com | | | M-387 | |
Portfolio Management Discussion and Analysis (Unaudited)
Answers to the questions reflect the views of portfolio managers Francis J. Ok and Lee Baker of Cornerstone Capital Management Holdings LLC, the Portfolio’s Subadvisor.
How did MainStay VP S&P 500 Index Portfolio perform relative to its benchmark and peers during the 12 months ended December 31, 2013?
For the 12 months ended December 31, 2013, MainStay VP S&P 500 Index Portfolio returned 32.01% for Initial Class shares and 31.68% for Service Class shares. Over the same period, both share classes underperformed the 32.39% return of the S&P 500® Index,1 which is the Portfolio’s broad-based securities-market index. Initial Class shares outperformed and Service Class shares underperformed the 31.80% return of the average Lipper1 Variable Products S&P 500 Index Portfolio for the 12 months ended December 31, 2013.
During the reporting period, how was the Portfolio’s performance materially affected by investments in derivatives?
MainStay VP S&P 500 Index Portfolio invests in futures contracts to provide an efficient means of maintaining liquidity while remaining fully invested in the market. Since these futures contracts closely track the performance of the S&P 500® Index, they had a positive impact on the Portfolio’s relative performance.
During the reporting period, which S&P 500® industries had the highest total returns and which industries had the lowest total returns?
The S&P 500® industries that had the highest total returns during the reporting period were office electronics, biotechnology, and Internet & catalog retail. The industries that had the lowest total returns were real estate investment trusts, metals & mining, and electric utilities.
During the reporting period, which industries made the strongest positive contributions to the Portfolio’s performance and which industries made the weakest contributions?
The industries that made the greatest positive contributions to the Portfolio’s performance during the reporting period were oil, gas & consumable fuels; pharmaceuticals; and insurance. (Contributions take weightings and total returns into account.) The
industries that made the weakest contributions to the Portfolio’s performance were real estate investment trusts, metals & mining, and construction materials.
During the reporting period, which individual stocks in the S&P 500® Index had the highest total returns and which individual stocks had the lowest total returns?
During the reporting period, the S&P 500® stocks with the highest total returns were Internet catalog and retail company Netflix, semiconductor company Micron Technology and specialty retailer Best Buy. Over the same period, the S&P 500® stocks with the lowest total returns were multiline retailer J.C. Penney and metals & mining companies Newmont Mining and Cliff’s Natural Resources.
During the reporting period, which S&P 500® stocks made the strongest positive contributions to the Portfolio’s absolute performance and which S&P 500® stocks made the weakest contributions?
During the reporting period, the S&P 500® stocks that made the strongest contributions to the Portfolio’s absolute performance were Internet software & services company Google, software company Microsoft and industrial conglomerate General Electric.
Over the same period, the S&P 500® stocks that made the weakest contributions to the Portfolio’s absolute performance were metals & mining company Newmont Mining, diversified telecommunication services company CenturyLink and health care equipment & supplies company Intuitive Surgical.
Were there any changes in the S&P 500® Index during the reporting period?
During 2013, there were 18 additions to and 18 deletions from the S&P 500® Index. In terms of index weight, significant additions included Internet software & services company Facebook and automobile company General Motors. On the same basis, significant deletions included food products company H.J. Heinz and wireless telecommunication services company Sprint Nextel.
| 1. | Please refer to pages M-2 and M-3 for additional explanations and disclosure regarding the Portfolios, their benchmark indices and service providers mentioned in the reports. |
The opinions expressed are those of the portfolio managers as of the date of this report and are subject to change. There is no guarantee that any forecasts made will come to pass. This material does not constitute investment advice and is not intended as an endorsement of any specific investment.
Not all MainStay VP Portfolios and/or share classes are available under all policies.
| | |
| M-388 | | MainStay VP S&P 500 Index Portfolio |
Portfolio of Investments December 31, 2013
| | | | | | | | |
| | |
Shares | | | Value | |
| Common Stocks 98.5%† | | | | | | | | |
Aerospace & Defense 2.7% | | | | | | | | |
Boeing Co. (The) | | | 49,380 | | | $ | 6,739,876 | |
General Dynamics Corp. | | | 23,901 | | | | 2,283,741 | |
Honeywell International, Inc. | | | 56,052 | | | | 5,121,471 | |
L-3 Communications Holdings, Inc. | | | 6,329 | | | | 676,317 | |
Lockheed Martin Corp. | | | 19,222 | | | | 2,857,543 | |
Northrop Grumman Corp. | | | 15,858 | | | | 1,817,485 | |
Precision Castparts Corp. | | | 10,379 | | | | 2,795,065 | |
Raytheon Co. | | | 22,822 | | | | 2,069,955 | |
Rockwell Collins, Inc. | | | 9,650 | | | | 713,328 | |
Textron, Inc. | | | 20,079 | | | | 738,104 | |
United Technologies Corp. | | | 60,302 | | | | 6,862,368 | |
| | | | | | | | |
| | | | | | | 32,675,253 | |
| | | | | | | | |
Air Freight & Logistics 0.8% | |
C.H. Robinson Worldwide, Inc. | | | 10,829 | | | | 631,764 | |
Expeditors International of Washington, Inc. | | | 14,686 | | | | 649,855 | |
FedEx Corp. | | | 21,258 | | | | 3,056,263 | |
United Parcel Service, Inc. Class B | | | 51,059 | | | | 5,365,280 | |
| | | | | | | | |
| | | | | | | 9,703,162 | |
| | | | | | | | |
Airlines 0.2% | |
Delta Air Lines, Inc. | | | 61,109 | | | | 1,678,664 | |
Southwest Airlines Co. | | | 49,766 | | | | 937,592 | |
| | | | | | | | |
| | | | | | | 2,616,256 | |
| | | | | | | | |
Auto Components 0.4% | |
BorgWarner, Inc. | | | 16,258 | | | | 908,985 | |
Delphi Automotive PLC | | | 20,001 | | | | 1,202,660 | |
Goodyear Tire & Rubber Co. (The) | | | 17,636 | | | | 420,618 | |
Johnson Controls, Inc. | | | 48,930 | | | | 2,510,109 | |
| | | | | | | | |
| | | | | | | 5,042,372 | |
| | | | | | | | |
Automobiles 0.7% | |
Ford Motor Co. | | | 281,753 | | | | 4,347,449 | |
General Motors Co. (a) | | | 81,360 | | | | 3,325,183 | |
Harley-Davidson, Inc. | | | 15,793 | | | | 1,093,507 | |
| | | | | | | | |
| | | | | | | 8,766,139 | |
| | | | | | | | |
Beverages 2.1% | |
Beam, Inc. | | | 11,650 | | | | 792,899 | |
Brown-Forman Corp. Class B | | | 11,572 | | | | 874,496 | |
Coca-Cola Co. (The) | | | 271,274 | | | | 11,206,329 | |
Coca-Cola Enterprises, Inc. | | | 17,251 | | | | 761,287 | |
Constellation Brands, Inc. Class A (a) | | | 11,900 | | | | 837,522 | |
Dr. Pepper Snapple Group, Inc. | | | 14,329 | | | | 698,109 | |
Molson Coors Brewing Co. Class B | | | 11,293 | | | | 634,102 | |
| | | | | | | | |
| | |
Shares | | | Value | |
Beverages (continued) | |
Monster Beverage Corp. (a) | | | 9,700 | | | $ | 657,369 | |
PepsiCo., Inc. | | | 109,547 | | | | 9,085,828 | |
| | | | | | | | |
| | | | | | | 25,547,941 | |
| | | | | | | | |
Biotechnology 2.4% | |
Alexion Pharmaceuticals, Inc. (a) | | | 14,008 | | | | 1,863,904 | |
Amgen, Inc. | | | 53,866 | | | | 6,149,343 | |
Biogen Idec, Inc. (a) | | | 16,872 | | | | 4,719,942 | |
Celgene Corp. (a) | | | 29,437 | | | | 4,973,675 | |
Gilead Sciences, Inc. (a) | | | 109,525 | | | | 8,230,804 | |
Regeneron Pharmaceuticals, Inc. (a) | | | 5,607 | | | | 1,543,271 | |
Vertex Pharmaceuticals, Inc. (a) | | | 16,701 | | | | 1,240,884 | |
| | | | | | | | |
| | | | | | | 28,721,823 | |
| | | | | | | | |
Building Products 0.1% | |
Allegion PLC (a) | | | 6,379 | | | | 281,888 | |
Masco Corp. | | | 25,501 | | | | 580,658 | |
| | | | | | | | |
| | | | | | | 862,546 | |
| | | | | | | | |
Capital Markets 2.2% | |
Ameriprise Financial, Inc. | | | 13,893 | | | | 1,598,390 | |
Bank of New York Mellon Corp. | | | 82,039 | | | | 2,866,443 | |
BlackRock, Inc. | | | 9,079 | | | | 2,873,231 | |
Charles Schwab Corp. (The) | | | 82,882 | | | | 2,154,932 | |
E*TRADE Financial Corp. (a) | | | 20,515 | | | | 402,914 | |
Franklin Resources, Inc. | | | 28,837 | | | | 1,664,760 | |
Goldman Sachs Group, Inc. (The) | | | 30,108 | | | | 5,336,944 | |
Invesco, Ltd. | | | 31,665 | | | | 1,152,606 | |
Legg Mason, Inc. | | | 7,586 | | | | 329,839 | |
Morgan Stanley | | | 98,968 | | | | 3,103,636 | |
Northern Trust Corp. | | | 16,043 | | | | 992,901 | |
State Street Corp. | | | 31,358 | | | | 2,301,364 | |
T. Rowe Price Group, Inc. | | | 18,636 | | | | 1,561,138 | |
| | | | | | | | |
| | | | | | | 26,339,098 | |
| | | | | | | | |
Chemicals 2.5% | |
Air Products & Chemicals, Inc. | | | 15,093 | | | | 1,687,096 | |
Airgas, Inc. | | | 4,743 | | | | 530,505 | |
CF Industries Holdings, Inc. | | | 4,093 | | | | 953,833 | |
Dow Chemical Co. (The) | | | 86,639 | | | | 3,846,772 | |
E.I. du Pont de Nemours & Co. | | | 66,152 | | | | 4,297,895 | |
Eastman Chemical Co. | | | 10,993 | | | | 887,135 | |
Ecolab, Inc. | | | 19,372 | | | | 2,019,918 | |
FMC Corp. | | | 9,522 | | | | 718,530 | |
International Flavors & Fragrances, Inc. | | | 5,822 | | | | 500,576 | |
LyondellBasell Industries, N.V. Class A | | | 31,201 | | | | 2,504,816 | |
Monsanto Co. | | | 37,559 | | | | 4,377,501 | |
Mosaic Co. (The) | | | 24,344 | | | | 1,150,741 | |
PPG Industries, Inc. | | | 10,143 | | | | 1,923,721 | |
Praxair, Inc. | | | 21,029 | | | | 2,734,401 | |
| † | Percentages indicated are based on Portfolio net assets. |
| ¨ | | Among the Portfolio’s 10 largest holdings, as of December 31, 2013, excluding short-term investments. May be subject to change daily. |
| | | | | | |
The notes to the financial statements are an integral part of,
and should be read in conjunction with, the financial statements. | | mainstayinvestments.com | | | M-389 | |
Portfolio of Investments December 31, 2013 (continued)
| | | | | | | | |
| | |
Shares | | | Value | |
| Common Stocks (continued) | |
Chemicals (continued) | |
Sherwin-Williams Co. (The) | | | 6,150 | | | $ | 1,128,525 | |
Sigma-Aldrich Corp. | | | 8,550 | | | | 803,785 | |
| | | | | | | | |
| | | | | | | 30,065,750 | |
| | | | | | | | |
Commercial Banks 2.8% | |
BB&T Corp. | | | 50,352 | | | | 1,879,137 | |
Comerica, Inc. | | | 13,065 | | | | 621,110 | |
Fifth Third Bancorp | | | 63,059 | | | | 1,326,131 | |
Huntington Bancshares, Inc. | | | 59,324 | | | | 572,477 | |
KeyCorp | | | 64,052 | | | | 859,578 | |
M&T Bank Corp. | | | 9,300 | | | | 1,082,706 | |
PNC Financial Services Group, Inc. | | | 38,009 | | | | 2,948,738 | |
Regions Financial Corp. | | | 98,404 | | | | 973,215 | |
SunTrust Banks, Inc. | | | 38,237 | | | | 1,407,504 | |
U.S. Bancorp | | | 130,455 | | | | 5,270,382 | |
¨Wells Fargo & Co. | | | 342,406 | | | | 15,545,232 | |
Zions Bancorp. | | | 13,186 | | | | 395,053 | |
| | | | | | | | |
| | | | | | | 32,881,263 | |
| | | | | | | | |
Commercial Services & Supplies 0.5% | |
ADT Corp. (The) | | | 14,286 | | | | 578,154 | |
Cintas Corp. | | | 7,193 | | | | 428,631 | |
Iron Mountain, Inc. | | | 12,158 | | | | 368,995 | |
Pitney Bowes, Inc. | | | 14,429 | | | | 336,196 | |
Republic Services, Inc. | | | 19,294 | | | | 640,561 | |
Stericycle, Inc. (a) | | | 6,122 | | | | 711,193 | |
Tyco International, Ltd. | | | 33,237 | | | | 1,364,046 | |
Waste Management, Inc. | | | 31,165 | | | | 1,398,374 | |
| | | | | | | | |
| | | | | | | 5,826,150 | |
| | | | | | | | |
Communications Equipment 1.7% | |
Cisco Systems, Inc. | | | 381,914 | | | | 8,573,969 | |
F5 Networks, Inc. (a) | | | 5,543 | | | | 503,637 | |
Harris Corp. | | | 7,636 | | | | 533,069 | |
Juniper Networks, Inc. (a) | | | 36,073 | | | | 814,168 | |
Motorola Solutions, Inc. | | | 16,451 | | | | 1,110,443 | |
QUALCOMM, Inc. | | | 120,676 | | | | 8,960,193 | |
| | | | | | | | |
| | | | | | | 20,495,479 | |
| | | | | | | | |
Computers & Peripherals 4.0% | |
¨Apple, Inc. | | | 64,267 | | | | 36,060,856 | |
EMC Corp. | | | 146,991 | | | | 3,696,824 | |
Hewlett-Packard Co. | | | 137,277 | | | | 3,841,011 | |
NetApp, Inc. | | | 24,344 | | | | 1,001,512 | |
SanDisk Corp. | | | 16,136 | | | | 1,138,234 | |
Seagate Technology PLC | | | 23,294 | | | | 1,308,191 | |
Western Digital Corp. | | | 15,036 | | | | 1,261,520 | |
| | | | | | | | |
| | | | | | | 48,308,148 | |
| | | | | | | | |
| | | | | | | | |
| | |
Shares | | | Value | |
Construction & Engineering 0.2% | |
Fluor Corp. | | | 11,672 | | | $ | 937,145 | |
Jacobs Engineering Group, Inc. (a) | | | 9,407 | | | | 592,547 | |
Quanta Services, Inc. (a) | | | 15,422 | | | | 486,718 | |
| | | | | | | | |
| | | | | | | 2,016,410 | |
| | | | | | | | |
Construction Materials 0.1% | |
Vulcan Materials Co. | | | 9,286 | | | | 551,774 | |
| | | | | | | | |
| | |
Consumer Finance 1.0% | | | | | | | | |
American Express Co. | | | 65,810 | | | | 5,970,942 | |
Capital One Financial Corp. | | | 41,187 | | | | 3,155,336 | |
Discover Financial Services | | | 34,216 | | | | 1,914,385 | |
SLM Corp. | | | 31,165 | | | | 819,016 | |
| | | | | | | | |
| | | | | | | 11,859,679 | |
| | | | | | | | |
Containers & Packaging 0.2% | |
Avery Dennison Corp. | | | 6,900 | | | | 346,311 | |
Ball Corp. | | | 10,329 | | | | 533,596 | |
Bemis Co., Inc. | | | 7,350 | | | | 301,056 | |
MeadWestvaco Corp. | | | 12,708 | | | | 469,306 | |
Owens-Illinois, Inc. (a) | | | 11,786 | | | | 421,703 | |
Sealed Air Corp. | | | 14,015 | | | | 477,211 | |
| | | | | | | | |
| | | | | | | 2,549,183 | |
| | | | | | | | |
Distributors 0.1% | |
Genuine Parts Co. | | | 11,029 | | | | 917,502 | |
| | | | | | | | |
| | |
Diversified Consumer Services 0.1% | | | | | | | | |
Graham Holdings Co. Class B (a) | | | 314 | | | | 208,282 | |
H&R Block, Inc. | | | 19,522 | | | | 566,919 | |
| | | | | | | | |
| | | | | | | 775,201 | |
| | | | | | | | |
Diversified Financial Services 5.1% | |
Bank of America Corp. | | | 761,892 | | | | 11,862,658 | |
Berkshire Hathaway, Inc. Class B (a) | | | 128,576 | | | | 15,243,971 | |
Citigroup, Inc. | | | 216,651 | | | | 11,289,684 | |
CME Group, Inc. | | | 22,515 | | | | 1,766,527 | |
IntercontinentalExchange Group, Inc. | | | 8,215 | | | | 1,847,718 | |
¨JPMorgan Chase & Co. | | | 268,524 | | | | 15,703,283 | |
Leucadia National Corp. | | | 22,394 | | | | 634,646 | |
McGraw Hill Financial, Inc. | | | 19,344 | | | | 1,512,701 | |
Moody’s Corp. | | | 13,522 | | | | 1,061,071 | |
NASDAQ OMX Group, Inc. (The) | | | 8,257 | | | | 328,629 | |
| | | | | | | | |
| | | | | | | 61,250,888 | |
| | | | | | | | |
Diversified Telecommunication Services 2.1% | |
AT&T, Inc. | | | 376,300 | | | | 13,230,708 | |
CenturyLink, Inc. | | | 42,223 | | | | 1,344,803 | |
Frontier Communications Corp. | | | 71,395 | | | | 331,987 | |
Verizon Communications, Inc. | | | 204,422 | | | | 10,045,297 | |
Windstream Holdings, Inc. | | | 42,580 | | | | 339,788 | |
| | | | | | | | |
| | | | | | | 25,292,583 | |
| | | | | | | | |
| | | | |
| M-390 | | MainStay VP S&P 500 Index Portfolio | | The notes to the financial statements are an integral part of,
and should be read in conjunction with, the financial statements. |
| | | | | | | | |
| | |
Shares | | | Value | |
| Common Stocks (continued) | |
Electric Utilities 1.6% | |
American Electric Power Co., Inc. | | | 34,808 | | | $ | 1,626,926 | |
Duke Energy Corp. | | | 50,430 | | | | 3,480,174 | |
Edison International | | | 23,272 | | | | 1,077,494 | |
Entergy Corp. | | | 12,736 | | | | 805,807 | |
Exelon Corp. | | | 61,209 | | | | 1,676,515 | |
FirstEnergy Corp. | | | 29,873 | | | | 985,212 | |
NextEra Energy, Inc. | | | 30,765 | | | | 2,634,099 | |
Northeast Utilities | | | 22,508 | | | | 954,114 | |
Pepco Holdings, Inc. | | | 17,844 | | | | 341,356 | |
Pinnacle West Capital Corp. | | | 7,857 | | | | 415,792 | |
PPL Corp. | | | 45,016 | | | | 1,354,531 | |
Southern Co. (The) | | | 62,981 | | | | 2,589,149 | |
Xcel Energy, Inc. | | | 35,544 | | | | 993,099 | |
| | | | | | | | |
| | | | | | | 18,934,268 | |
| | | | | | | | |
Electrical Equipment 0.8% | |
AMETEK, Inc. | | | 17,486 | | | | 920,988 | |
Eaton Corp. PLC | | | 33,894 | | | | 2,580,011 | |
Emerson Electric Co. | | | 50,288 | | | | 3,529,212 | |
Rockwell Automation, Inc. | | | 9,908 | | | | 1,170,729 | |
Roper Industries, Inc. | | | 7,093 | | | | 983,657 | |
| | | | | | | | |
| | | | | | | 9,184,597 | |
| | | | | | | | |
Electronic Equipment, Instruments & Components 0.4% | |
Amphenol Corp. Class A | | | 11,308 | | | | 1,008,447 | |
Corning, Inc. | | | 103,375 | | | | 1,842,142 | |
FLIR Systems, Inc. | | | 10,122 | | | | 304,672 | |
Jabil Circuit, Inc. | | | 13,208 | | | | 230,348 | |
TE Connectivity, Ltd. | | | 29,315 | | | | 1,615,550 | |
| | | | | | | | |
| | | | | | | 5,001,159 | |
| | | | | | | | |
Energy Equipment & Services 1.8% | |
Baker Hughes, Inc. | | | 31,658 | | | | 1,749,421 | |
Cameron International Corp. (a) | | | 16,993 | | | | 1,011,593 | |
Diamond Offshore Drilling, Inc. | | | 4,964 | | | | 282,551 | |
Ensco PLC Class A | | | 16,686 | | | | 954,106 | |
FMC Technologies, Inc. (a) | | | 16,901 | | | | 882,401 | |
Halliburton Co. | | | 60,588 | | | | 3,074,841 | |
Helmerich & Payne, Inc. | | | 7,650 | | | | 643,212 | |
Nabors Industries, Ltd. | | | 18,551 | | | | 315,182 | |
National Oilwell Varco, Inc. | | | 30,580 | | | | 2,432,027 | |
Noble Corp. PLC | | | 18,101 | | | | 678,245 | |
Rowan Cos. PLC Class A (a) | | | 8,872 | | | | 313,714 | |
Schlumberger, Ltd. | | | 94,075 | | | | 8,477,098 | |
Transocean, Ltd. | | | 24,215 | | | | 1,196,705 | |
| | | | | | | | |
| | | | | | | 22,011,096 | |
| | | | | | | | |
Food & Staples Retailing 2.3% | |
Costco Wholesale Corp. | | | 31,208 | | | | 3,714,064 | |
CVS Caremark Corp. | | | 85,025 | | | | 6,085,239 | |
Kroger Co. (The) | | | 37,173 | | | | 1,469,449 | |
Safeway, Inc. | | | 17,629 | | | | 574,177 | |
| | | | | | | | |
| | |
Shares | | | Value | |
Food & Staples Retailing (continued) | |
Sysco Corp. | | | 41,544 | | | $ | 1,499,738 | |
Wal-Mart Stores, Inc. | | | 115,569 | | | | 9,094,125 | |
Walgreen Co. | | | 62,209 | | | | 3,573,285 | |
Whole Foods Market, Inc. | | | 26,580 | | | | 1,537,121 | |
| | | | | | | | |
| | | | | | | 27,547,198 | |
| | | | | | | | |
Food Products 1.5% | |
Archer-Daniels-Midland Co. | | | 47,002 | | | | 2,039,887 | |
Campbell Soup Co. | | | 12,829 | | | | 555,239 | |
ConAgra Foods, Inc. | | | 30,137 | | | | 1,015,617 | |
General Mills, Inc. | | | 45,309 | | | | 2,261,372 | |
Hershey Co. (The) | | | 10,700 | | | | 1,040,361 | |
Hormel Foods Corp. | | | 9,615 | | | | 434,310 | |
J.M. Smucker Co. (The) | | | 7,507 | | | | 777,875 | |
Kellogg Co. | | | 18,372 | | | | 1,121,978 | |
Kraft Foods Group, Inc. | | | 42,566 | | | | 2,295,159 | |
McCormick & Co., Inc. | | | 9,436 | | | | 650,329 | |
Mead Johnson Nutrition Co. | | | 14,429 | | | | 1,208,573 | |
Mondelez International, Inc. Class A | | | 125,276 | | | | 4,422,243 | |
Tyson Foods, Inc. Class A | | | 19,401 | | | | 649,157 | |
| | | | | | | | |
| | | | | | | 18,472,100 | |
| | | | | | | | |
Gas Utilities 0.1% | |
AGL Resources, Inc. | | | 8,486 | | | | 400,794 | |
ONEOK, Inc. | | | 14,736 | | | | 916,284 | |
| | | | | | | | |
| | | | | | | 1,317,078 | |
| | | | | | | | |
Health Care Equipment & Supplies 2.0% | |
Abbott Laboratories | | | 110,447 | | | | 4,233,434 | |
Baxter International, Inc. | | | 38,766 | | | | 2,696,175 | |
Becton, Dickinson & Co. | | | 13,865 | | | | 1,531,944 | |
Boston Scientific Corp. (a) | | | 95,375 | | | | 1,146,407 | |
C.R. Bard, Inc. | | | 5,564 | | | | 745,242 | |
CareFusion Corp. (a) | | | 15,093 | | | | 601,003 | |
Covidien PLC | | | 32,858 | | | | 2,237,630 | |
DENTSPLY International, Inc. | | | 10,193 | | | | 494,157 | |
Edwards Lifesciences Corp. (a) | | | 7,815 | | | | 513,914 | |
Intuitive Surgical, Inc. (a) | | | 2,722 | | | | 1,045,466 | |
Medtronic, Inc. | | | 71,317 | | | | 4,092,883 | |
St. Jude Medical, Inc. | | | 20,844 | | | | 1,291,286 | |
Stryker Corp. | | | 21,086 | | | | 1,584,402 | |
Varian Medical Systems, Inc. (a) | | | 7,550 | | | | 586,559 | |
Zimmer Holdings, Inc. | | | 12,215 | | | | 1,138,316 | |
| | | | | | | | |
| | | | | | | 23,938,818 | |
| | | | | | | | |
Health Care Providers & Services 2.0% | |
Aetna, Inc. | | | 26,251 | | | | 1,800,556 | |
AmerisourceBergen Corp. | | | 16,429 | | | | 1,155,123 | |
Cardinal Health, Inc. | | | 24,394 | | | | 1,629,763 | |
Cigna Corp. | | | 19,744 | | | | 1,727,205 | |
DaVita HealthCare Partners, Inc. (a) | | | 12,608 | | | | 798,969 | |
Express Scripts Holding Co. (a) | | | 57,559 | | | | 4,042,944 | |
Humana, Inc. | | | 11,136 | | | | 1,149,458 | |
| | | | | | |
The notes to the financial statements are an integral part of,
and should be read in conjunction with, the financial statements. | | mainstayinvestments.com | | | M-391 | |
Portfolio of Investments December 31, 2013 (continued)
| | | | | | | | |
| | |
Shares | | | Value | |
| Common Stocks (continued) | |
Health Care Providers & Services (continued) | |
Laboratory Corporation of America Holdings (a) | | | 6,243 | | | $ | 570,423 | |
McKesson Corp. | | | 16,408 | | | | 2,648,251 | |
Patterson Cos., Inc. | | | 5,957 | | | | 245,429 | |
Quest Diagnostics, Inc. | | | 10,386 | | | | 556,067 | |
Tenet Healthcare Corp. (a) | | | 7,086 | | | | 298,462 | |
UnitedHealth Group, Inc. | | | 71,917 | | | | 5,415,350 | |
WellPoint, Inc. | | | 21,101 | | | | 1,949,521 | |
| | | | | | | | |
| | | | | | | 23,987,521 | |
| | | | | | | | |
Health Care Technology 0.1% | |
Cerner Corp. (a) | | | 21,086 | | | | 1,175,334 | |
| | | | | | | | |
| | |
Hotels, Restaurants & Leisure 1.7% | | | | | | | | |
Carnival Corp. | | | 31,287 | | | | 1,256,799 | |
Chipotle Mexican Grill, Inc. (a) | | | 2,207 | | | | 1,175,845 | |
Darden Restaurants, Inc. | | | 9,329 | | | | 507,218 | |
International Game Technology | | | 17,779 | | | | 322,867 | |
Marriott International, Inc. Class A | | | 16,051 | | | | 792,277 | |
McDonald’s Corp. | | | 71,074 | | | | 6,896,310 | |
Starbucks Corp. | | | 53,831 | | | | 4,219,812 | |
Starwood Hotels & Resorts Worldwide, Inc. | | | 13,679 | | | | 1,086,797 | |
Wyndham Worldwide Corp. | | | 9,307 | | | | 685,833 | |
Wynn Resorts, Ltd. | | | 5,772 | | | | 1,120,980 | |
Yum! Brands, Inc. | | | 31,808 | | | | 2,405,003 | |
| | | | | | | | |
| | | | | | | 20,469,741 | |
| | | | | | | | |
Household Durables 0.4% | |
D.R. Horton, Inc. | | | 20,301 | | | | 453,118 | |
Garmin, Ltd. | | | 8,786 | | | | 406,089 | |
Harman International Industries, Inc. | | | 4,829 | | | | 395,254 | |
Leggett & Platt, Inc. | | | 10,086 | | | | 312,061 | |
Lennar Corp. Class A | | | 11,943 | | | | 472,465 | |
Mohawk Industries, Inc. (a) | | | 4,357 | | | | 648,757 | |
Newell Rubbermaid, Inc. | | | 20,515 | | | | 664,891 | |
PulteGroup, Inc. | | | 24,629 | | | | 501,693 | |
Whirlpool Corp. | | | 5,607 | | | | 879,514 | |
| | | | | | | | |
| | | | | | | 4,733,842 | |
| | | | | | | | |
Household Products 2.0% | |
Clorox Co. (The) | | | 9,215 | | | | 854,783 | |
Colgate-Palmolive Co. | | | 62,781 | | | | 4,093,949 | |
Kimberly-Clark Corp. | | | 27,258 | | | | 2,847,371 | |
¨Procter & Gamble Co. (The) | | | 194,164 | | | | 15,806,891 | |
| | | | | | | | |
| | | | | | | 23,602,994 | |
| | | | | | | | |
Independent Power Producers & Energy Traders 0.1% | |
AES Corp. (The) | | | 46,902 | | | | 680,548 | |
NRG Energy, Inc. | | | 23,101 | | | | 663,461 | |
| | | | | | | | |
| | | | | | | 1,344,009 | |
| | | | | | | | |
| | | | | | | | |
| | |
Shares | | | Value | |
Industrial Conglomerates 2.5% | |
3M Co. | | | 45,687 | | | $ | 6,407,602 | |
Danaher Corp. | | | 42,830 | | | | 3,306,476 | |
¨General Electric Co. | | | 722,698 | | | | 20,257,225 | |
| | | | | | | | |
| | | | | | | 29,971,303 | |
| | | | | | | | |
Insurance 3.0% | |
ACE, Ltd. | | | 24,294 | | | | 2,515,158 | |
Aflac, Inc. | | | 33,294 | | | | 2,224,039 | |
Allstate Corp. (The) | | | 32,487 | | | | 1,771,841 | |
American International Group, Inc. | | | 105,168 | | | | 5,368,826 | |
Aon PLC | | | 21,501 | | | | 1,803,719 | |
Assurant, Inc. | | | 5,193 | | | | 344,659 | |
Chubb Corp. (The) | | | 17,986 | | | | 1,737,987 | |
Cincinnati Financial Corp. | | | 10,529 | | | | 551,404 | |
Genworth Financial, Inc. Class A (a) | | | 35,308 | | | | 548,333 | |
Hartford Financial Services Group, Inc. (The) | | | 31,937 | | | | 1,157,078 | |
Lincoln National Corp. | | | 18,736 | | | | 967,152 | |
Loews Corp. | | | 21,851 | | | | 1,054,092 | |
Marsh & McLennan Cos., Inc. | | | 39,201 | | | | 1,895,760 | |
MetLife, Inc. | | | 80,082 | | | | 4,318,022 | |
Principal Financial Group, Inc. | | | 19,558 | | | | 964,405 | |
Progressive Corp. (The) | | | 39,430 | | | | 1,075,256 | |
Prudential Financial, Inc. | | | 33,073 | | | | 3,049,992 | |
Torchmark Corp. | | | 6,457 | | | | 504,615 | |
Travelers Companies, Inc. (The) | | | 26,008 | | | | 2,354,764 | |
Unum Group | | | 18,658 | | | | 654,523 | |
XL Group PLC | | | 20,201 | | | | 643,200 | |
| | | | | | | | |
| | | | | | | 35,504,825 | |
| | | | | | | | |
Internet & Catalog Retail 1.5% | |
Amazon.com, Inc. (a) | | | 26,487 | | | | 10,562,751 | |
Expedia, Inc. | | | 7,357 | | | | 512,489 | |
Netflix, Inc. (a) | | | 4,236 | | | | 1,559,568 | |
priceline.com, Inc. (a) | | | 3,672 | | | | 4,268,333 | |
TripAdvisor, Inc. (a) | | | 7,915 | | | | 655,599 | |
| | | | | | | | |
| | | | | | | 17,558,740 | |
| | | | | | | | |
Internet Software & Services 3.1% | |
Akamai Technologies, Inc. (a) | | | 12,786 | | | | 603,243 | |
eBay, Inc. (a) | | | 83,225 | | | | 4,568,220 | |
Facebook, Inc. Class A (a) | | | 117,483 | | | | 6,421,621 | |
¨Google, Inc. Class A (a) | | | 20,044 | | | | 22,463,511 | |
VeriSign, Inc. (a) | | | 9,200 | | | | 549,976 | |
Yahoo!, Inc. (a) | | | 67,388 | | | | 2,725,171 | |
| | | | | | | | |
| | | | | | | 37,331,742 | |
| | | | | | | | |
IT Services 3.6% | |
Accenture PLC Class A | | | 45,409 | | | | 3,733,528 | |
Alliance Data Systems Corp. (a) | | | 3,479 | | | | 914,733 | |
Automatic Data Processing, Inc. | | | 34,387 | | | | 2,778,813 | |
Cognizant Technology Solutions Corp. Class A (a) | | | 21,608 | | | | 2,181,976 | |
| | | | |
| M-392 | | MainStay VP S&P 500 Index Portfolio | | The notes to the financial statements are an integral part of,
and should be read in conjunction with, the financial statements. |
| | | | | | | | |
| | |
Shares | | | Value | |
| Common Stocks (continued) | |
IT Services (continued) | |
Computer Sciences Corp. | | | 10,515 | | | $ | 587,578 | |
Fidelity National Information Services, Inc. | | | 20,794 | | | | 1,116,222 | |
Fiserv, Inc. (a) | | | 18,422 | | | | 1,087,819 | |
International Business Machines Corp. | | | 72,910 | | | | 13,675,729 | |
MasterCard, Inc. Class A | | | 7,393 | | | | 6,176,556 | |
Paychex, Inc. | | | 23,215 | | | | 1,056,979 | |
Teradata Corp. (a) | | | 11,672 | | | | 530,959 | |
Total System Services, Inc. | | | 11,929 | | | | 396,997 | |
Visa, Inc. Class A | | | 36,373 | | | | 8,099,540 | |
Western Union Co. (The) | | | 39,451 | | | | 680,530 | |
| | | | | | | | |
| | | | | | | 43,017,959 | |
| | | | | | | | |
Leisure Equipment & Products 0.1% | |
Hasbro, Inc. | | | 8,250 | | | | 453,832 | |
Mattel, Inc. | | | 24,172 | | | | 1,150,104 | |
| | | | | | | | |
| | | | | | | 1,603,936 | |
| | | | | | | | |
Life Sciences Tools & Services 0.5% | |
Agilent Technologies, Inc. | | | 23,629 | | | | 1,351,342 | |
Life Technologies Corp. (a) | | | 12,336 | | | | 935,069 | |
PerkinElmer, Inc. | | | 8,029 | | | | 331,036 | |
Thermo Fisher Scientific, Inc. | | | 25,815 | | | | 2,874,500 | |
Waters Corp. (a) | | | 6,079 | | | | 607,900 | |
| | | | | | | | |
| | | | | | | 6,099,847 | |
| | | | | | | | |
Machinery 1.7% | |
Caterpillar, Inc. | | | 45,459 | | | | 4,128,132 | |
Cummins, Inc. | | | 12,443 | | | | 1,754,090 | |
Deere & Co. | | | 27,344 | | | | 2,497,327 | |
Dover Corp. | | | 12,172 | | | | 1,175,085 | |
Flowserve Corp. | | | 9,965 | | | | 785,541 | |
Illinois Tool Works, Inc. | | | 29,165 | | | | 2,452,193 | |
Ingersoll-Rand PLC | | | 19,136 | | | | 1,178,778 | |
Joy Global, Inc. | | | 7,593 | | | | 444,115 | |
PACCAR, Inc. | | | 25,294 | | | | 1,496,646 | |
Pall Corp. | | | 7,915 | | | | 675,545 | |
Parker Hannifin Corp. | | | 10,658 | | | | 1,371,045 | |
Pentair, Ltd. | | | 14,236 | | | | 1,105,710 | |
Snap-on, Inc. | | | 4,150 | | | | 454,508 | |
Stanley Black & Decker, Inc. | | | 11,086 | | | | 894,529 | |
Xylem, Inc. | | | 13,179 | | | | 455,993 | |
| | | | | | | | |
| | | | | | | 20,869,237 | |
| | | | | | | | |
Media 3.7% | |
Cablevision Systems Corp. Class A | | | 15,293 | | | | 274,203 | |
CBS Corp. Class B | | | 39,866 | | | | 2,541,059 | |
Comcast Corp. Class A | | | 186,150 | | | | 9,673,285 | |
DIRECTV (a) | | | 34,908 | | | | 2,411,794 | |
Discovery Communications, Inc. Class A (a) | | | 16,122 | | | | 1,457,751 | |
Gannett Co., Inc. | | | 16,279 | | | | 481,533 | |
| | | | | | | | |
| | |
Shares | | | Value | |
Media (continued) | |
Interpublic Group of Cos., Inc. (The) | | | 29,730 | | | $ | 526,221 | |
News Corp. Class A (a) | | | 35,558 | | | | 640,755 | |
Omnicom Group, Inc. | | | 18,386 | | | | 1,367,367 | |
Scripps Networks Interactive Class A | | | 7,829 | | | | 676,504 | |
Time Warner Cable, Inc. | | | 20,136 | | | | 2,728,428 | |
Time Warner, Inc. | | | 64,624 | | | | 4,505,585 | |
Twenty-First Century Fox, Inc. Class A | | | 140,177 | | | | 4,931,427 | |
Viacom, Inc. Class B | | | 28,987 | | | | 2,531,724 | |
Walt Disney Co. (The) | | | 116,740 | | | | 8,918,936 | |
| | | | | | | | |
| | | | | | | 43,666,572 | |
| | | | | | | | |
Metals & Mining 0.5% | |
Alcoa, Inc. | | | 76,403 | | | | 812,164 | |
Allegheny Technologies, Inc. | | | 7,715 | | | | 274,885 | |
Cliffs Natural Resources, Inc. | | | 10,936 | | | | 286,633 | |
Freeport-McMoRan Copper & Gold, Inc. | | | 74,160 | | | | 2,798,798 | |
Newmont Mining Corp. | | | 35,566 | | | | 819,085 | |
Nucor Corp. | | | 22,729 | | | | 1,213,274 | |
United States Steel Corp. | | | 10,336 | | | | 304,912 | |
| | | | | | | | |
| | | | | | | 6,509,751 | |
| | | | | | | | |
Multi-Utilities 1.1% | |
Ameren Corp. | | | 17,329 | | | | 626,617 | |
CenterPoint Energy, Inc. | | | 30,615 | | | | 709,656 | |
CMS Energy Corp. | | | 19,001 | | | | 508,657 | |
Consolidated Edison, Inc. | | | 20,922 | | | | 1,156,568 | |
Dominion Resources, Inc. | | | 41,459 | | | | 2,681,983 | |
DTE Energy Co. | | | 12,629 | | | | 838,439 | |
Integrys Energy Group, Inc. | | | 5,700 | | | | 310,137 | |
NiSource, Inc. | | | 22,379 | | | | 735,822 | |
PG&E Corp. | | | 32,094 | | | | 1,292,746 | |
Public Service Enterprise Group, Inc. | | | 36,137 | | | | 1,157,830 | |
SCANA Corp. | | | 10,036 | | | | 470,989 | |
Sempra Energy | | | 16,236 | | | | 1,457,343 | |
TECO Energy, Inc. | | | 14,593 | | | | 251,583 | |
Wisconsin Energy Corp. | | | 16,179 | | | | 668,840 | |
| | | | | | | | |
| | | | | | | 12,867,210 | |
| | | | | | | | |
Multiline Retail 0.7% | |
Dollar General Corp. (a) | | | 21,044 | | | | 1,269,374 | |
Dollar Tree, Inc. (a) | | | 14,865 | | | | 838,683 | |
Family Dollar Stores, Inc. | | | 6,907 | | | | 448,748 | |
Kohl’s Corp. | | | 14,379 | | | | 816,008 | |
Macy’s, Inc. | | | 26,322 | | | | 1,405,595 | |
Nordstrom, Inc. | | | 10,222 | | | | 631,720 | |
Target Corp. | | | 45,152 | | | | 2,856,767 | |
| | | | | | | | |
| | | | | | | 8,266,895 | |
| | | | | | | | |
Office Electronics 0.1% | |
Xerox Corp. | | | 82,660 | | | | 1,005,972 | |
| | | | | | | | |
| | | | | | |
The notes to the financial statements are an integral part of,
and should be read in conjunction with, the financial statements. | | mainstayinvestments.com | | | M-393 | |
Portfolio of Investments December 31, 2013 (continued)
| | | | | | | | |
| | |
Shares | | | Value | |
| Common Stocks (continued) | |
Oil, Gas & Consumable Fuels 8.3% | | | | | | | | |
Anadarko Petroleum Corp. | | | 35,951 | | | $ | 2,851,633 | |
Apache Corp. | | | 28,515 | | | | 2,450,579 | |
Cabot Oil & Gas Corp. | | | 30,087 | | | | 1,166,172 | |
Chesapeake Energy Corp. | | | 36,108 | | | | 979,971 | |
¨Chevron Corp. | | | 137,377 | | | | 17,159,761 | |
ConocoPhillips | | | 87,510 | | | | 6,182,582 | |
CONSOL Energy, Inc. | | | 16,351 | | | | 621,992 | |
Denbury Resources, Inc. (a) | | | 26,194 | | | | 430,367 | |
Devon Energy Corp. | | | 27,258 | | | | 1,686,453 | |
EOG Resources, Inc. | | | 19,501 | | | | 3,273,048 | |
EQT Corp. | | | 10,765 | | | | 966,482 | |
¨Exxon Mobil Corp. | | | 312,047 | | | | 31,579,156 | |
Hess Corp. | | | 20,315 | | | | 1,686,145 | |
Kinder Morgan, Inc. | | | 48,095 | | | | 1,731,420 | |
Marathon Oil Corp. | | | 49,759 | | | | 1,756,493 | |
Marathon Petroleum Corp. | | | 21,501 | | | | 1,972,287 | |
Murphy Oil Corp. | | | 12,558 | | | | 814,763 | |
Newfield Exploration Co. (a) | | | 9,722 | | | | 239,453 | |
Noble Energy, Inc. | | | 25,665 | | | | 1,748,043 | |
Occidental Petroleum Corp. | | | 57,581 | | | | 5,475,953 | |
Peabody Energy Corp. | | | 19,272 | | | | 376,382 | |
Phillips 66 | | | 42,823 | | | | 3,302,938 | |
Pioneer Natural Resources Co. | | | 10,186 | | | | 1,874,937 | |
QEP Resources, Inc. | | | 12,808 | | | | 392,565 | |
Range Resources Corp. | | | 11,672 | | | | 984,066 | |
Southwestern Energy Co. (a) | | | 25,051 | | | | 985,256 | |
Spectra Energy Corp. | | | 47,859 | | | | 1,704,738 | |
Tesoro Corp. | | | 9,486 | | | | 554,931 | |
Valero Energy Corp. | | | 38,544 | | | | 1,942,618 | |
Williams Cos., Inc. (The) | | | 48,816 | | | | 1,882,833 | |
WPX Energy, Inc. (a) | | | 14,343 | | | | 292,310 | |
| | | | | | | | |
| | | | | | | 99,066,327 | |
| | | | | | | | |
Paper & Forest Products 0.1% | |
International Paper Co. | | | 31,687 | | | | 1,553,614 | |
| | | | | | | | |
|
Personal Products 0.2% | |
Avon Products, Inc. | | | 30,987 | | | | 533,596 | |
Estee Lauder Cos., Inc. (The) Class A | | | 18,286 | | | | 1,377,302 | |
| | | | | | | | |
| | | | | | | 1,910,898 | |
| | | | | | | | |
Pharmaceuticals 5.7% | |
AbbVie, Inc. | | | 113,640 | | | | 6,001,329 | |
Actavis PLC (a) | | | 12,429 | | | | 2,088,072 | |
Allergan, Inc. | | | 21,229 | | | | 2,358,117 | |
Bristol-Myers Squibb Co. | | | 117,612 | | | | 6,251,078 | |
Eli Lilly & Co. | | | 70,824 | | | | 3,612,024 | |
Forest Laboratories, Inc. (a) | | | 16,936 | | | | 1,016,668 | |
Hospira, Inc. (a) | | | 11,850 | | | | 489,168 | |
¨Johnson & Johnson | | | 201,536 | | | | 18,458,682 | |
| | | | | | | | |
| | |
Shares | | | Value | |
Pharmaceuticals (continued) | |
Merck & Co., Inc. | | | 208,715 | | | $ | 10,446,186 | |
Mylan, Inc. (a) | | | 27,351 | | | | 1,187,034 | |
Perrigo Co. PLC | | | 9,507 | | | | 1,458,944 | |
Pfizer, Inc. | | | 462,953 | | | | 14,180,250 | |
Zoetis, Inc. | | | 35,716 | | | | 1,167,556 | |
| | | | | | | | |
| | | | | | | 68,715,108 | |
| | | | | | | | |
Professional Services 0.2% | |
Dun & Bradstreet Corp. | | | 2,729 | | | | 334,985 | |
Equifax, Inc. | | | 8,693 | | | | 600,599 | |
Nielsen Holdings N.V. | | | 18,072 | | | | 829,324 | |
Robert Half International, Inc. | | | 9,900 | | | | 415,701 | |
| | | | | | | | |
| | | | | | | 2,180,609 | |
| | | | | | | | |
Real Estate Investment Trusts 1.8% | |
American Tower Corp. | | | 28,187 | | | | 2,249,886 | |
Apartment Investment & Management Co. Class A | | | 10,422 | | | | 270,034 | |
AvalonBay Communities, Inc. | | | 8,686 | | | | 1,026,946 | |
Boston Properties, Inc. | | | 10,922 | | | | 1,096,241 | |
Equity Residential | | | 23,944 | | | | 1,241,975 | |
General Growth Properties, Inc. | | | 38,401 | | | | 770,708 | |
HCP, Inc. | | | 32,594 | | | | 1,183,814 | |
Health Care REIT, Inc. | | | 20,622 | | | | 1,104,721 | |
Host Hotels & Resorts, Inc. | | | 54,023 | | | | 1,050,207 | |
Kimco Realty Corp. | | | 29,265 | | | | 577,984 | |
Macerich Co. (The) | | | 10,036 | | | | 591,020 | |
Plum Creek Timber Co., Inc. | | | 12,636 | | | | 587,700 | |
ProLogis, Inc. | | | 35,623 | | | | 1,316,270 | |
Public Storage | | | 10,322 | | | | 1,553,668 | |
Simon Property Group, Inc. | | | 22,165 | | | | 3,372,626 | |
Ventas, Inc. | | | 21,008 | | | | 1,203,338 | |
Vornado Realty Trust | | | 12,429 | | | | 1,103,571 | |
Weyerhaeuser Co. | | | 41,630 | | | | 1,314,259 | |
| | | | | | | | |
| | | | | | | 21,614,968 | |
| | | | | | | | |
Real Estate Management & Development 0.0%‡ | |
CBRE Group, Inc., Class A (a) | | | 19,886 | | | | 523,002 | |
| | | | | | | | |
| | |
Road & Rail 0.9% | | | | | | | | |
CSX Corp. | | | 72,410 | | | | 2,083,236 | |
Kansas City Southern | | | 7,872 | | | | 974,790 | |
Norfolk Southern Corp. | | | 22,065 | | | | 2,048,294 | |
Ryder System, Inc. | | | 3,757 | | | | 277,191 | |
Union Pacific Corp. | | | 32,901 | | | | 5,527,368 | |
| | | | | | | | |
| | | | | | | 10,910,879 | |
| | | | | | | | |
Semiconductors & Semiconductor Equipment 2.0% | |
Altera Corp. | | | 22,937 | | | | 746,141 | |
Analog Devices, Inc. | | | 22,215 | | | | 1,131,410 | |
Applied Materials, Inc. | | | 86,017 | | | | 1,521,641 | |
Broadcom Corp. Class A | | | 38,544 | | | | 1,142,829 | |
First Solar, Inc. (a) | | | 5,043 | | | | 275,549 | |
| | | | |
| M-394 | | MainStay VP S&P 500 Index Portfolio | | The notes to the financial statements are an integral part of,
and should be read in conjunction with, the financial statements. |
| | | | | | | | |
| | |
Shares | | | Value | |
| Common Stocks (continued) | |
Semiconductors & Semiconductor Equipment (continued) | |
Intel Corp. | | | 355,085 | | | $ | 9,218,006 | |
KLA-Tencor Corp. | | | 11,900 | | | | 767,074 | |
Lam Research Corp. (a) | | | 11,600 | | | | 631,620 | |
Linear Technology Corp. | | | 16,729 | | | | 762,006 | |
LSI Corp. | | | 38,923 | | | | 428,931 | |
Microchip Technology, Inc. | | | 14,172 | | | | 634,197 | |
Micron Technology, Inc. (a) | | | 75,139 | | | | 1,635,025 | |
NVIDIA Corp. | | | 41,330 | | | | 662,107 | |
Texas Instruments, Inc. | | | 78,189 | | | | 3,433,279 | |
Xilinx, Inc. | | | 19,165 | | | | 880,057 | |
| | | | | | | | |
| | | | | | | 23,869,872 | |
| | | | | | | | |
Software 3.4% | |
Adobe Systems, Inc. (a) | | | 33,208 | | | | 1,988,495 | |
Autodesk, Inc. (a) | | | 16,115 | | | | 811,068 | |
CA, Inc. | | | 23,208 | | | | 780,949 | |
Citrix Systems, Inc. (a) | | | 13,315 | | | | 842,174 | |
Electronic Arts, Inc. (a) | | | 22,079 | | | | 506,492 | |
Intuit, Inc. | | | 20,351 | | | | 1,553,188 | |
¨Microsoft Corp. | | | 542,642 | | | | 20,311,090 | |
Oracle Corp. | | | 250,666 | | | | 9,590,481 | |
Red Hat, Inc. (a) | | | 13,536 | | | | 758,558 | |
Salesforce.com, Inc. (a) | | | 39,630 | | | | 2,187,180 | |
Symantec Corp. | | | 49,716 | | | | 1,172,303 | |
| | | | | | | | |
| | | | | | | 40,501,978 | |
| | | | | | | | |
Specialty Retail 2.2% | |
AutoNation, Inc. (a) | | | 4,614 | | | | 229,270 | |
AutoZone, Inc. (a) | | | 2,429 | | | | 1,160,916 | |
Bed Bath & Beyond, Inc. (a) | | | 15,336 | | | | 1,231,481 | |
Best Buy Co., Inc. | | | 19,522 | | | | 778,537 | |
Carmax, Inc. (a) | | | 15,951 | | | | 750,016 | |
GameStop Corp. Class A | | | 8,350 | | | | 411,321 | |
Gap, Inc. (The) | | | 18,922 | | | | 739,472 | |
Home Depot, Inc. (The) | | | 100,589 | | | | 8,282,498 | |
L Brands, Inc. | | | 17,415 | | | | 1,077,118 | |
Lowe’s Companies, Inc. | | | 74,703 | | | | 3,701,534 | |
O’Reilly Automotive, Inc. (a) | | | 7,665 | | | | 986,562 | |
PetSmart, Inc. | | | 7,407 | | | | 538,859 | |
Ross Stores, Inc. | | | 15,479 | | | | 1,159,842 | |
Staples, Inc. | | | 47,180 | | | | 749,690 | |
Tiffany & Co. | | | 7,865 | | | | 729,715 | |
TJX Cos., Inc. | | | 50,802 | | | | 3,237,611 | |
Urban Outfitters, Inc. (a) | | | 7,793 | | | | 289,120 | |
| | | | | | | | |
| | | | | | | 26,053,562 | |
| | | | | | | | |
Textiles, Apparel & Luxury Goods 0.8% | |
Coach, Inc. | | | 20,036 | | | | 1,124,621 | |
Fossil Group, Inc. (a) | | | 3,507 | | | | 420,630 | |
Michael Kors Holdings, Ltd. (a) | | | 12,815 | | | | 1,040,450 | |
NIKE, Inc. Class B | | | 53,373 | | | | 4,197,253 | |
| | | | | | | | |
| | |
Shares | | | Value | |
Textiles, Apparel & Luxury Goods (continued) | |
PVH Corp. | | | 5,829 | | | $ | 792,860 | |
Ralph Lauren Corp. | | | 4,257 | | | | 751,658 | |
VF Corp. | | | 25,158 | | | | 1,568,350 | |
| | | | | | | | |
| | | | | | | 9,895,822 | |
| | | | | | | | |
Thrifts & Mortgage Finance 0.1% | |
Hudson City Bancorp, Inc. | | | 33,973 | | | | 320,366 | |
People’s United Financial, Inc. | | | 22,701 | | | | 343,239 | |
| | | | | | | | |
| | | | | | | 663,605 | |
| | | | | | | | |
Tobacco 1.5% | |
Altria Group, Inc. | | | 142,862 | | | | 5,484,472 | |
Lorillard, Inc. | | | 26,315 | | | | 1,333,645 | |
Philip Morris International, Inc. | | | 114,447 | | | | 9,971,767 | |
Reynolds American, Inc. | | | 22,394 | | | | 1,119,476 | |
| | | | | | | | |
| | | | | | | 17,909,360 | |
| | | | | | | | |
Trading Companies & Distributors 0.2% | |
Fastenal Co. | | | 19,501 | | | | 926,492 | |
W.W. Grainger, Inc. | | | 4,414 | | | | 1,127,424 | |
| | | | | | | | |
| | | | | | | 2,053,916 | |
| | | | | | | | |
Wireless Telecommunication Services 0.2% | |
Crown Castle International Corp. (a) | | | 23,865 | | | | 1,752,407 | |
| | | | | | | | |
Total Common Stocks
(Cost $480,958,143) | | | | | | | 1,178,234,271 | (b) |
| | | | | | | | |
| | |
| | | | | | | | |
| | | Principal
Amount | | | | |
| Short-Term Investments 1.7% | | | | | | | | |
U.S. Government 1.7% | | | | | | | | |
United States Treasury Bills
0.003%–0.039%, due 1/9/14 (c) | | $ | 11,400,000 | | | | 11,399,993 | |
0.029%–0.054%, due 4/10/14 (c) | | | 6,200,000 | | | | 6,199,194 | |
0.033%, due 1/23/14 (c)(d) | | | 3,000,000 | | | | 2,999,940 | |
| | | | | | | | |
Total Short-Term Investments
(Cost $20,599,331) | | | | | | | 20,599,127 | |
| | | | | | | | |
Total Investments
(Cost $501,557,474) (f) | | | 100.2 | % | | | 1,198,833,398 | |
Other Assets, Less Liabilities | | | (0.2 | ) | | | (1,864,152 | ) |
Net Assets | | | 100.0 | % | | $ | 1,196,969,246 | |
| | |
| | | | | | | | |
| | | Contracts
Long | | | Unrealized
Appreciation
(Depreciation) (e) | |
| Futures Contracts 0.0%‡ | | | | | | | | |
Standard & Poor’s 500 Index
Mini March 2014 | | | 189 | | | $ | 266,276 | |
| | | | | | | | |
Total Futures Contracts
(Notional Amount $17,398,395) (b) | | | | | | $ | 266,276 | |
| | | | | | | | |
| | | | | | |
The notes to the financial statements are an integral part of,
and should be read in conjunction with, the financial statements. | | mainstayinvestments.com | | | M-395 | |
Portfolio of Investments December 31, 2013 (continued)
| ‡ | Less than one-tenth of a percent. |
| (a) | Non-income producing security. |
| (b) | The combined market value of common stocks and notional amount of S&P 500® Index futures contracts represents 99.9% of the Portfolio’s net assets. |
| (c) | Interest rate shown represents yield to maturity. |
| (d) | Represents a security, or a portion thereof, which is maintained at a broker as collateral for futures contracts. |
| (e) | Represents the difference between the value of the contracts at the time they were opened and the value as of December 31, 2013. |
| (f) | As of December 31, 2013, cost is $526,014,755 for federal income tax purposes and net unrealized appreciation is as follows: |
| | | | |
Gross unrealized appreciation | | $ | 678,738,320 | |
Gross unrealized depreciation | | | (5,919,677 | ) |
| | | | |
Net unrealized appreciation | | $ | 672,818,643 | |
| | | | |
The following is a summary of the fair valuations according to the inputs used as of December 31, 2013, for valuing the Portfolio’s assets.
Asset Valuation Inputs
| | | | | | | | | | | | | | | | |
Description | | Quoted Prices
in Active Markets
for Identical Assets (Level 1) | | | Significant Other
Observable Inputs (Level 2) | | | Significant
Unobservable
Inputs (Level 3) | | | Total | |
| Investments in Securities (a) | | | | | | | | | | | | | | | | |
| Common Stocks | | $ | 1,178,234,271 | | | $ | — | | | $ | — | | | $ | 1,178,234,271 | |
| Short-Term Investments | | | | | | | | | | | | | | | | |
U.S. Government | | | — | | | | 20,599,127 | | | | — | | | | 20,599,127 | |
| | | | | | | | | | | | | | | | |
| Total Investments in Securities | | | 1,178,234,271 | | | | 20,599,127 | | | | — | | | | 1,198,833,398 | |
| | | | | | | | | | | | | | | | |
| Other Financial Instruments | | | | | | | | | | | | | | | | |
Futures Contracts Long (b) | | | 266,276 | | | | — | | | | — | | | | 266,276 | |
| | | | | | | | | | | | | | | | |
| Total Investments in Securities and Other Financial Instruments | | $ | 1,178,500,547 | | | $ | 20,599,127 | | | $ | — | | | $ | 1,199,099,674 | |
| | | | | | | | | | | | | | | | |
| (a) | For a complete listing of investments and their industries, see the Portfolio of Investments. |
| (b) | The value listed for these securities reflects unrealized appreciation (depreciation) as shown on the Portfolio of Investments. |
The Portfolio recognizes transfers between the levels as of the beginning of the period.
For the year ended December 31, 2013, the Portfolio did not have any transfers between Level 1 and Level 2 fair value measurements. (See Note 2)
As of December 31, 2013, the Portfolio did not hold any investments with significant unobservable inputs (Level 3). (See Note 2)
| | | | |
| M-396 | | MainStay VP S&P 500 Index Portfolio | | The notes to the financial statements are an integral part of,
and should be read in conjunction with, the financial statements. |
Statement of Assets and Liabilities as of December 31, 2013
| | | | |
| Assets | | | | |
Investment in securities, at value (identified cost $501,557,474) | | $ | 1,198,833,398 | |
Cash | | | 15,551 | |
Receivables: | | | | |
Dividends and interest | | | 1,632,102 | |
Fund shares sold | | | 419,550 | |
Variation margin on futures contracts | | | 61,231 | |
| | | | |
Total assets | | | 1,200,961,832 | |
| | | | |
| |
| Liabilities | | | | |
Payables: | | | | |
Investment securities purchased | | | 3,047,550 | |
Fund shares redeemed | | | 501,809 | |
Manager (See Note 3) | | | 250,652 | |
NYLIFE Distributors (See Note 3) | | | 71,007 | |
Shareholder communication | | | 59,618 | |
Professional fees | | | 31,593 | |
Custodian | | | 6,433 | |
Trustees | | | 1,725 | |
Accrued expenses | | | 22,199 | |
| | | | |
Total liabilities | | | 3,992,586 | |
| | | | |
Net assets | | $ | 1,196,969,246 | |
| | | | |
| |
| Net Assets Consist of | | | | |
Shares of beneficial interest outstanding (par value of $.001 per share) unlimited number of shares authorized | | $ | 31,883 | |
Additional paid-in capital | | | 540,830,062 | |
| | | | |
| | | 540,861,945 | |
Undistributed net investment income | | | 18,960,390 | |
Accumulated net realized gain (loss) on investments and futures transactions | | | (60,395,289 | ) |
Net unrealized appreciation (depreciation) on investments and futures contracts | | | 697,542,200 | |
| | | | |
Net assets | | $ | 1,196,969,246 | |
| | | | |
| | | | |
Initial Class | | | | |
Net assets applicable to outstanding shares | | $ | 853,187,479 | |
| | | | |
Shares of beneficial interest outstanding | | | 22,700,677 | |
| | | | |
Net asset value per share outstanding | | $ | 37.58 | |
| | | | |
Service Class | | | | |
Net assets applicable to outstanding shares | | $ | 343,781,767 | |
| | | | |
Shares of beneficial interest outstanding | | | 9,182,717 | |
| | | | |
Net asset value per share outstanding | | $ | 37.44 | |
| | | | |
| | | | | | |
The notes to the financial statements are an integral part of,
and should be read in conjunction with, the financial statements. | | mainstayinvestments.com | | | M-397 | |
Statement of Operations for the year ended December 31, 2013
| | | | |
| Investment Income (Loss) | | | | |
Income | | | | |
Dividends (a) | | $ | 23,137,685 | |
Interest | | | 21,308 | |
| | | | |
Total income | | | 23,158,993 | |
| | | | |
Expenses | | | | |
Manager (See Note 3) | | | 2,972,900 | |
Distribution and service—Service Class (See Note 3) | | | 735,766 | |
Shareholder communication | | | 180,868 | |
Professional fees | | | 88,091 | |
Custodian | | | 38,303 | |
Trustees | | | 22,860 | |
Miscellaneous | | | 44,191 | |
| | | | |
Total expenses before waiver/reimbursement | | | 4,082,979 | |
Expense waiver/reimbursement from Manager (See Note 3) | | | (173,495 | ) |
| | | | |
Net expenses | | | 3,909,484 | |
| | | | |
Net investment income (loss) | | | 19,249,509 | |
| | | | |
|
| Realized and Unrealized Gain (Loss) on Investments and Futures Contracts | |
Net realized gain (loss) on: | | | | |
Security transactions | | | 16,440,907 | |
Futures transactions | | | 17,518,816 | |
| | | | |
Net realized gain (loss) on investments and futures transactions | | | 33,959,723 | |
| | | | |
Net change in unrealized appreciation (depreciation) on: | | | | |
Investments | | | 263,469,748 | |
Futures contracts | | | 944,925 | |
| | | | |
Net change in unrealized appreciation (depreciation) on investments and futures contracts | | | 264,414,673 | |
| | | | |
Net realized and unrealized gain (loss) on investments and futures transactions | | | 298,374,396 | |
| | | | |
Net increase (decrease) in net assets resulting from operations | | $ | 317,623,905 | |
| | | | |
| (a) | Dividends recorded net of foreign withholding taxes in the amount of $4,659. |
| | | | |
| M-398 | | MainStay VP S&P 500 Index Portfolio | | The notes to the financial statements are an integral part of,
and should be read in conjunction with, the financial statements. |
Statements of Changes in Net Assets
for the years ended December 31, 2013 and December 31, 2012
| | | | | | | | |
| | | 2013 | | | 2012 | |
| Increase (Decrease) in Net Assets | |
Operations: | | | | | | | | |
Net investment income (loss) | | $ | 19,249,509 | | | $ | 18,308,953 | |
Net realized gain (loss) on investments, futures transactions and foreign currency transactions | | | 33,959,723 | | | | 22,406,496 | |
Net change in unrealized appreciation (depreciation) on investments and futures contracts | | | 264,414,673 | | | | 98,764,021 | |
| | | | |
Net increase (decrease) in net assets resulting from operations | | | 317,623,905 | | | | 139,479,470 | |
| | | | |
Dividends to shareholders: | | | | | | | | |
From net investment income: | | | | | | | | |
Initial Class | | | (13,748,908 | ) | | | (11,913,117 | ) |
Service Class | | | (4,317,687 | ) | | | (3,494,658 | ) |
| | | | |
Total dividends to shareholders | | | (18,066,595 | ) | | | (15,407,775 | ) |
| | | | |
Capital share transactions: | | | | | | | | |
Net proceeds from sale of shares | | | 249,081,982 | | | | 265,116,333 | |
Net asset value of shares issued to shareholders in reinvestment of dividends | | | 18,066,595 | | | | 15,407,775 | |
Cost of shares redeemed | | | (391,053,473 | ) | | | (254,221,769 | ) |
| | | | |
Increase (decrease) in net assets derived from capital share transactions | | | (123,904,896 | ) | | | 26,302,339 | |
| | | | |
Net increase (decrease) in net assets | | | 175,652,414 | | | | 150,374,034 | |
| | |
| Net Assets | | | | | | | | |
Beginning of year | | | 1,021,316,832 | | | | 870,942,798 | |
| | | | |
End of year | | $ | 1,196,969,246 | | | $ | 1,021,316,832 | |
| | | | |
Undistributed net investment income at end of year | | $ | 18,960,390 | | | $ | 18,075,303 | |
| | | | |
| | | | | | |
The notes to the financial statements are an integral part of,
and should be read in conjunction with, the financial statements. | | mainstayinvestments.com | | | M-399 | |
Financial Highlights selected per share data and ratios
| | | | | | | | | | | | | | | | | | | | |
| | | Initial Class | |
| | | Year ended December 31, | |
| | | 2013 | | | 2012 | | | 2011 | | | 2010 | | | 2009 | |
Net asset value at beginning of year | | $ | 28.93 | | | $ | 25.42 | | | $ | 25.45 | | | $ | 22.58 | | | $ | 18.35 | |
| | | | | | | | | | | | | | | | | | | | |
Net investment income (loss) | | | 0.59 | (a) | | | 0.54 | | | | 0.45 | (a) | | | 0.40 | (a) | | | 0.39 | (a) |
Net realized and unrealized gain (loss) on investments | | | 8.61 | | | | 3.45 | | | | (0.03 | ) | | | 2.90 | | | | 4.40 | |
| | | | | | | | | | | | | | | | | | | | |
Total from investment operations | | | 9.20 | | | | 3.99 | | | | 0.42 | | | | 3.30 | | | | 4.79 | |
| | | | | | | | | | | | | | | | | | | | |
Less dividends: | | | | | | | | | | | | | | | | | | | | |
From net investment income | | | (0.55 | ) | | | (0.48 | ) | | | (0.45 | ) | | | (0.43 | ) | | | (0.56 | ) |
| | | | | | | | | | | | | | | | | | | | |
Net asset value at end of year | | $ | 37.58 | | | $ | 28.93 | | | $ | 25.42 | | | $ | 25.45 | | | $ | 22.58 | |
| | | | | | | | | | | | | | | | | | | | |
Total investment return | | | 32.01 | % | | | 15.66 | % | | | 1.85 | % | | | 14.73 | % | | | 26.26 | % |
Ratios (to average net assets)/Supplemental Data: | | | | | | | | | | | | | | | | | | | | |
Net investment income (loss) | | | 1.76 | % | | | 1.93 | % | | | 1.75 | % | | | 1.71 | % | | | 1.99 | % |
Net expenses | | | 0.28 | % | | | 0.29 | % | | | 0.29 | % | | | 0.30 | % | | | 0.30 | % |
Expenses (before waiver/reimbursement) | | | 0.30 | % | | | 0.34 | % | | | 0.34 | % | | | 0.35 | % | | | 0.35 | % |
Portfolio turnover rate | | | 8 | % | | | 10 | % | | | 4 | % | | | 4 | % | | | 15 | % |
Net assets at end of year (in 000’s) | | $ | 853,187 | | | $ | 773,233 | | | $ | 644,141 | | | $ | 719,103 | | | $ | 709,736 | |
| (a) | Per share data based on average shares outstanding during the year. |
| | | | | | | | | | | | | | | | | | | | |
| | | Service Class | |
| | | Year ended December 31, | |
| | | 2013 | | | 2012 | | | 2011 | | | 2010 | | | 2009 | |
Net asset value at beginning of year | | $ | 28.84 | | | $ | 25.34 | | | $ | 25.36 | | | $ | 22.52 | | | $ | 18.30 | |
| | | | | | | | | | | | | | | | | | | | |
Net investment income (loss) | | | 0.51 | (a) | | | 0.47 | | | | 0.39 | (a) | | | 0.34 | (a) | | | 0.34 | (a) |
Net realized and unrealized gain (loss) on investments | | | 8.57 | | | | 3.44 | | | | (0.03 | ) | | | 2.88 | | | | 4.38 | |
| | | | | | | | | | | | | | | | | | | | |
Total from investment operations | | | 9.08 | | | | 3.91 | | | | 0.36 | | | | 3.22 | | | | 4.72 | |
| | | | | | | | | | | | | | | | | | | | |
Less dividends: | | | | | | | | | | | | | | | | | | | | |
From net investment income | | | (0.48 | ) | | | (0.41 | ) | | | (0.38 | ) | | | (0.38 | ) | | | (0.50 | ) |
| | | | | | | | | | | | | | | | | | | | |
Net asset value at end of year | | $ | 37.44 | | | $ | 28.84 | | | $ | 25.34 | | | $ | 25.36 | | | $ | 22.52 | |
| | | | | | | | | | | | | | | | | | | | |
Total investment return | | | 31.68 | % | | | 15.37 | % | | | 1.59 | % | | | 14.44 | % | | | 25.95 | % |
Ratios (to average net assets)/Supplemental Data: | | | | | | | | | | | | | | | | | | | | |
Net investment income (loss) | | | 1.52 | % | | | 1.67 | % | | | 1.50 | % | | | 1.46 | % | | | 1.74 | % |
Net expenses | | | 0.53 | % | | | 0.54 | % | | | 0.54 | % | | | 0.55 | % | | | 0.55 | % |
Expenses (before waiver/reimbursement) | | | 0.55 | % | | | 0.59 | % | | | 0.59 | % | | | 0.60 | % | | | 0.60 | % |
Portfolio turnover rate | | | 8 | % | | | 10 | % | | | 4 | % | | | 4 | % | | | 15 | % |
Net assets at end of year (in 000’s) | | $ | 343,782 | | | $ | 248,084 | | | $ | 226,802 | | | $ | 243,111 | | | $ | 220,788 | |
| (a) | Per share data based on average shares outstanding during the year. |
| | | | |
| M-400 | | MainStay VP S&P 500 Index Portfolio | | The notes to the financial statements are an integral part of,
and should be read in conjunction with, the financial statements. |
MainStay VP T. Rowe Price Equity Income Portfolio
Investment and Performance Comparison1 (Unaudited)
Performance data quoted represents past performance. Past performance is no guarantee of future results. Because of market volatility, current performance may be lower or higher than the figures shown. Investment return and principal value will fluctuate, and as a result, when shares are redeemed, they may be worth more or less than their original cost. The performance table and graph do not reflect any deduction of sales charges, mortality and expense charges, contract charges or administrative charges. Please refer to the Performance Summary appropriate for your policy. For performance information current to the most recent month-end, please call 800-598-2019 or visit www.newyorklife.com.
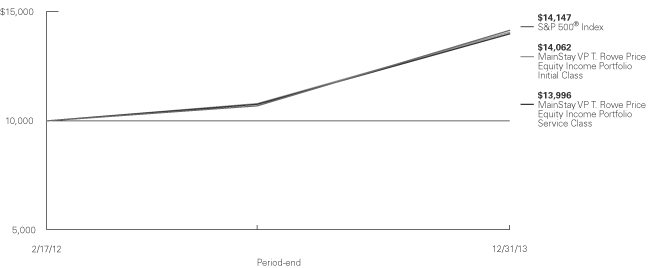
Average Annual Total Returns for the Period Ended December 31, 2013
| | | | | | | | | | | | |
| Class | | One Year | | | Since Inception (2/17/12) | | | Gross Expense Ratio2 | |
| Initial Class Shares | | | 30.36 | % | | | 19.98 | % | | | 0.84 | % |
| Service Class Shares | | | 30.04 | | | | 19.68 | | | | 1.09 | |
| | | | | | | | |
| Benchmark Performance | | One
Year | | | Since
Inception
(2/17/12) | |
S&P 500® Index3 | | | 32.39 | % | | | 20.41 | % |
Average Lipper Variable Products Equity Income Portfolio4 | | | 28.21 | | | | 18.70 | |
| 1. | Performance figures reflect certain fee waivers and/or expense limitations, without which total returns may have been different. For information on current fee waivers and/or expense limitations, please refer to the notes to the financial statements. |
| 2. | The gross expense ratios presented reflect the Portfolio’s “Total Annual Portfolio Operating Expenses” from the most recent Prospectus and may differ from other expense ratios disclosed in this report. |
| 3. | Please refer to pages M-2 and M-3 for additional explanations and disclosure regarding the Portfolios, their benchmark indices and other indices mentioned in the reports. |
| 4. | The Average Lipper Variable Products Equity Income Portfolio is representative of portfolios that, by portfolio practice, seek relatively high current income and growth of income through investing 65% or more of their portfolio in equities. Lipper Inc. is an independent monitor of fund performance. Results are based on total returns with all dividend and capital gain distributions reinvested. |
| | | | |
| mainstayinvestments.com | | | M-401 | |
Cost in Dollars of a $1,000 Investment in MainStay VP T. Rowe Price Equity Income Portfolio (Unaudited)
The example below is intended to describe the fees and expenses borne by shareholders during the period from July 1, 2013, to December 31, 2013, and the impact of those costs on your investment.
Example
As a shareholder of the Portfolio, you incur two types of costs: (1) transaction costs, including exchange fees and sales charges (loads) on purchases (as applicable), and (2) ongoing costs, including management fees, distribution and/or service (12b-1) fees, and other Portfolio expenses (as applicable). This example is intended to help you understand your ongoing costs (in dollars) of investing in the Portfolio and to compare these costs with the ongoing costs of investing in other Portfolios. The example is based on an investment of $1,000 made at the beginning of the six-month period and held for the entire period from July 1, 2013, to December 31, 2013. Shares are only sold in connection with variable life and annuity contracts and the example does not reflect any contract level or transactional fees or expenses. If these costs had been included, your costs would have been higher.
This example illustrates your Portfolio’s ongoing costs in two ways:
Actual Expenses
The second and third data columns in the table below provide information about actual account values and actual expenses. You may use the information in these columns, together with the amount you invested, to estimate the expenses that you paid during the six months ended
December 31, 2013. Simply divide your account value by $1,000 (for example, an $8,600 account value divided by $1,000 = 8.6), then multiply the result by the number under the heading entitled ‘‘Expenses Paid During Period’’ to estimate the expenses you paid on your account during this period.
Hypothetical Example for Comparison Purposes
The fourth and fifth data columns in the table below provide information about hypothetical account values and hypothetical expenses based on the Portfolio’s actual expense ratio and an assumed rate of return of 5% per year before expenses, which is not the Portfolio’s actual return. The hypothetical account values and expenses may not be used to estimate the actual ending account balances or expenses you paid for the six-month period shown. You may use this information to compare the ongoing costs of investing in the Portfolio with the ongoing costs of investing in other Portfolios. To do so, compare this 5% hypothetical example with the 5% hypothetical examples that appear in the shareholder reports of the other Portfolios.
Please note that the expenses shown in the table are meant to highlight your ongoing costs only and do not reflect any transactional costs, such as exchange fees or sales charges (loads). Therefore, the fourth and fifth data columns of the table are useful in comparing ongoing costs only and will not help you determine the relative total costs of owning different funds. In addition, if these transactional costs were included, your costs would have been higher.
| | | | | | | | | | | | | | | | | | | | |
| | | | | | | | | | | | | | | | |
| Share Class | | Beginning
Account
Value
7/1/13 | | | Ending Account
Value (Based
on Actual
Returns and
Expenses)
12/31/13 | | | Expenses
Paid
During
Period1 | | | Ending Account
Value (Based
on Hypothetical
5% Annualized
Return and
Actual Expenses)
12/31/13 | | | Expenses
Paid
During
Period1 | |
| | | | | |
| Initial Class Shares | | $ | 1,000.00 | | | $ | 1,141.30 | | | $ | 4.21 | | | $ | 1,021.30 | | | $ | 3.97 | |
| | | | | |
| Service Class Shares | | $ | 1,000.00 | | | $ | 1,139.90 | | | $ | 5.56 | | | $ | 1,020.00 | | | $ | 5.24 | |
| 1. | Expenses are equal to the Portfolio’s annualized expense ratio of each class (0.78% for Initial Class and 1.03% for Service Class) multiplied by the average account value over the period, divided by 365 and multiplied by 184 (to reflect the six-month period). The table above represents the actual expenses incurred during the six-month period. |
| | |
| M-402 | | MainStay VP T. Rowe Price Equity Income Portfolio |
Industry Composition as of December 31, 2013 (Unaudited)
| | | | |
| Oil, Gas & Consumable Fuels | | | 13.3 | % |
| Commercial Banks | | | 6.6 | |
| Pharmaceuticals | | | 5.9 | |
| Diversified Financial Services | | | 5.1 | |
| Insurance | | | 4.5 | |
| Machinery | | | 3.8 | |
| Electric Utilities | | | 3.7 | |
| Media | | | 3.6 | |
| Diversified Telecommunication Services | | | 3.1 | |
| Industrial Conglomerates | | | 3.1 | |
| Aerospace & Defense | | | 2.5 | |
| Food Products | | | 2.4 | |
| Semiconductors & Semiconductor Equipment | | | 2.3 | |
| Capital Markets | | | 2.1 | |
| Communications Equipment | | | 1.8 | |
| Electrical Equipment | | | 1.8 | |
| Multiline Retail | | | 1.8 | |
| Energy Equipment & Services | | | 1.7 | |
| Software | | | 1.5 | |
| Paper & Forest Products | | | 1.4 | |
| Computers & Peripherals | | | 1.3 | |
| Metals & Mining | | | 1.3 | |
| Air Freight & Logistics | | | 1.2 | |
| Automobiles | | | 1.2 | |
| Consumer Finance | | | 1.1 | |
| Household Products | | | 1.1 | |
| | | | |
| IT Services | | | 1.1 | % |
| Leisure Equipment & Products | | | 1.1 | |
| Multi-Utilities | | | 1.1 | |
| Road & Rail | | | 1.1 | |
| Airlines | | | 1.0 | |
| Beverages | | | 1.0 | |
| Building Products | | | 1.0 | |
| Chemicals | | | 1.0 | |
| Electronic Equipment, Instruments & Components | | | 0.9 | |
| Hotels, Restaurants & Leisure | | | 0.9 | |
| Real Estate Investment Trusts | | | 0.9 | |
| Specialty Retail | | | 0.8 | |
| Auto Components | | | 0.7 | |
| Construction Materials | | | 0.7 | |
| Distributors | | | 0.6 | |
| Personal Products | | | 0.6 | |
| Containers & Packaging | | | 0.5 | |
| Health Care Providers & Services | | | 0.5 | |
| Independent Power Producers & Energy Traders | | | 0.4 | |
| Wireless Telecommunication Services | | | 0.4 | |
| Life Sciences Tools & Services | | | 0.3 | |
| Household Durables | | | 0.1 | |
| Short-Term Investment | | | 4.1 | |
| Other Assets, Less Liabilities | | | 0.0 | ‡ |
| | | | |
| | | 100.0 | % |
| | | | |
See Portfolio of Investments beginning on page M-406 for specific holdings within these categories.
| ‡Less | than one-tenth of a percent. |
Top Ten Holdings as of December 31, 2013 (excluding short-term investment) (Unaudited)
| 10. | Illinois Tool Works, Inc. |
| | | | |
| mainstayinvestments.com | | | M-403 | |
Portfolio Management Discussion and Analysis (Unaudited)
Answers to the questions reflect the views of portfolio manager Brian C. Rogers of T. Rowe Price Associates, Inc. (“T. Rowe”), the Portfolio’s Subadvisor.
How did MainStay VP T. Rowe Price Equity Income Portfolio perform relative to its benchmark and peers during the 12 months ended December 31, 2013?
For the 12 months ended December 31, 2013, MainStay VP T. Rowe Price Equity Income Portfolio returned 30.36% for Initial Class shares and 30.04% for Service Class shares. Over the same period, both share classes underperformed the 32.39% return of the S&P 500® Index,1 which is the Portfolio’s broad-based securities-market index. Both share classes outperformed the 28.21% return of the average Lipper1 Variable Products Equity Income Portfolio for the 12 months ended December 31, 2013.
What factors affected the Portfolio’s relative performance during the reporting period?
Overall, the Portfolio’s equity sector weightings detracted from returns relative to the S&P 500® Index during the reporting period, while stock selection added relative value. The Portfolio’s cash position was a drag on relative performance in a rapidly advancing market.
Which sectors were the strongest positive contributors to the Portfolio’s relative performance, and which sectors were particularly weak?
During the reporting period, the sectors that made the strongest positive contributions to the Portfolio’s performance relative to the S&P 500® Index were information technology, industrials and financials. (Contributions take weightings and total returns into account.) Stock selection was a primary driver in each sector. An underweight position in the lagging information technology sector and an overweight position in industrials also helped.
The sectors that detracted the most from the Portfolio’s relative performance were energy, health care and materials. Stock selection was a factor in all three sectors. An overweight position in energy and an underweight position in health care also hurt relative results.
During the reporting period, which individual stocks made the strongest positive contributions to the Portfolio’s absolute performance and which stocks detracted the most?
The individual stocks that made the strongest positive contributions to the Portfolio’s absolute performance included industrial conglomerate General Electric,
diversified financial services company JPMorgan Chase and aircraft manufacturer Boeing. GE benefited from cyclical tailwinds, following a recent restructuring to simplify industrial holdings and shrink its financial business. The company has also cut costs, improved its margin structure and provided a sector-leading yield. Despite continued legal issues, JPMorgan Chase advanced on the news that the company would divest noncore businesses. We trimmed the Portfolio’s position on strength as the reporting period progressed. Shares of Boeing moved higher throughout the year, after early issues with the 787 Dreamliner’s lithium batteries were resolved. Focusing on order fulfillment, the company exceeded earnings and cash flow expectations in the third and fourth quarters of 2013, driven by increased orders and revenue growth. Boeing also announced a 50% dividend increase in December along with additional share repurchase plans. We trimmed our position slightly on strength.
Major detractors from absolute performance included gold and copper mining company Newmont Mining, state-owned Brazilian energy company Petrobras and iron ore producer Cliff’s Natural Resources. Newmont Mining suffered from declining gold and copper prices, which hurt company earnings, and from competitive pressures. Even so, we believe that Newmont Mining has quality assets and should be well positioned as commodity pressures ease. We added to this position on weakness. Results at Petrobras were weaker than expected, as government-controlled energy pricing led to increased debt and operating losses. Currency weakness remains a concern. Even so, the company plans to unlock value by divesting assets, which led us to add to the position on weakness. Cliff’s Natural Resources suffered from weak commodity prices and a capital allocation strategy that, in our opinion, was questionable. A dividend cut and expensive Canadian project weakened the company’s balance sheet, and we sold the Portfolio’s position to pursue companies with more compelling risk/return profiles.
Did the Portfolio make any significant purchases or sales during the reporting period?
We purchased shares of computers & peripherals company Apple when the shares dipped earlier in the reporting period, making the valuation compelling. We believe that the company has a vast addressable market with ample room for expansion and numerous
| 1. | Please refer to pages M-2 and M-3 for additional explanations and disclosure regarding the Portfolios, their benchmark indices and service providers mentioned in the reports. |
| | |
| M-404 | | MainStay VP T. Rowe Price Equity Income Portfolio |
avenues of growth, including China and enterprise sales. The company now pays a dividend, and management appears committed to returning capital to shareholders. We initiated a position in agricultural equipment manufacturer Deere to take advantage of the company’s pricing power and demonstrated ability to grow margins. The company maintains a strong balance sheet, generates significant free cash flow, and appears well positioned, even if farming fundamentals should weaken. We purchased shares of mining machinery company Joy Global, which primarily serves coal producers. Weak coal fundamentals, driven by slowing growth in China and exceptionally low natural gas prices, have pressured the stock, but the company appears well positioned for cyclical improvement, particularly in emerging markets.
During the reporting period, we eliminated the Portfolio’s positions in diversified conglomerate 3M, laboratory equipment maker Thermo Fisher Scientific and student loan provider SLM. Shares of 3M had advanced through solid organic sales growth. We sold the Portfolio’s position in Thermo Fisher Scientific in the third quarter of 2013, after an extended period of strong performance. SLM announced a new CEO in May and decided to split into separate businesses. When investors reacted favorably, we sold the Portfolio’s position on strength in the third quarter. All three stocks were sold to allow the Portfolio to pursue opportunities that we found more compelling.
How did the Portfolio’s sector weightings change during the reporting period?
At the beginning of 2013, the Portfolio’s most substantially overweight positions in relation to the S&P 500® Index were in financials, industrials and energy. At the end of the reporting period, the most substantially overweight sector relative to the Index was industrials, followed by energy and financials. The largest increase in relative weighting during the period was in energy, where we have pursued opportunities
among companies facing headwinds from commodities pressures.
By far, the Portfolio’s most substantially underweight position relative to the S&P 500® Index at the beginning of 2013 was information technology, followed by consumer staples and health care. At the end of the reporting period, information technology remained the most substantially underweight position, followed by health care and consumer staples. The addition of Apple substantially decreased the degree to which the Portfolio was underweight in the information technology sector.
The biggest change in relative sector weightings during the reporting period was in consumer discretionary, which went from a moderately overweight position to a moderately underweight position in relation to the S&P 500® Index.
How was the Portfolio positioned at the end of the reporting period?
The Portfolio is a diversified, bottom-up investment strategy with a long-term focus that has historically resulted in what we believe to be a relatively low turnover rate. Changes to the Portfolio’s sector positioning are a residual of our bottom-up stock selection process and fundamental analysis at the individual company level. They do not reflect a broad sector viewpoint.
As of December 31, 2013, the most significantly overweight sectors in the Portfolio were industrials and energy. In industrials, the Portfolio’s largest industry exposure was in aerospace & defense. As of the same date, the Portfolio’s most significantly underweight positions were in information technology and health care. Many information technology companies do not fit our investment criteria, either because of valuation or dividend concerns. In health care, our primary exposure is to the pharmaceuticals industry, which has been increasingly returning cash to shareholders through repurchases and dividends.
The opinions expressed are those of the portfolio manager as of the date of this report and are subject to change. There is no guarantee that any forecasts made will come to pass. This material does not constitute investment advice and is not intended as an endorsement of any specific investment.
Not all MainStay VP Portfolios and/or share classes are available under all policies.
| | | | |
| mainstayinvestments.com | | | M-405 | |
Portfolio of Investments December 31, 2013
| | | | | | | | |
| | |
Shares | | |
Value | |
| Common Stocks 95.8%† | |
Aerospace & Defense 2.5% | |
Boeing Co. (The) | | | 66,000 | | | $ | 9,008,340 | |
Honeywell International, Inc. | | | 110,100 | | | | 10,059,837 | |
| | | | | | | | |
| | | | | | | 19,068,177 | |
| | | | | | | | |
Air Freight & Logistics 1.2% | |
United Parcel Service, Inc. Class B | | | 83,600 | | | | 8,784,688 | |
| | | | | | | | |
|
Airlines 1.0% | |
United Continental Holdings, Inc. (a) | | | 198,300 | | | | 7,501,689 | |
| | | | | | | | |
|
Auto Components 0.7% | |
Johnson Controls, Inc. | | | 107,100 | | | | 5,494,230 | |
| | | | | | | | |
|
Automobiles 1.2% | |
Ford Motor Co. | | | 267,200 | | | | 4,122,896 | |
General Motors Co. (a) | | | 124,308 | | | | 5,080,468 | |
| | | | | | | | |
| | | | | | | 9,203,364 | |
| | | | | | | | |
Beverages 1.0% | |
Coca-Cola Co. (The) | | | 16,000 | | | | 660,960 | |
PepsiCo., Inc. | | | 79,900 | | | | 6,626,906 | |
| | | | | | | | |
| | | | | | | 7,287,866 | |
| | | | | | | | |
Building Products 1.0% | |
Masco Corp. | | | 192,900 | | | | 4,392,333 | |
USG Corp. (a) | | | 106,500 | | | | 3,022,470 | |
| | | | | | | | |
| | | | | | | 7,414,803 | |
| | | | | | | | |
Capital Markets 2.1% | |
Bank of New York Mellon Corp. | | | 5,000 | | | | 174,700 | |
Legg Mason, Inc. | | | 166,000 | | | | 7,217,680 | |
Northern Trust Corp. | | | 120,000 | | | | 7,426,800 | |
Och-Ziff Capital Management Group LLC Class A | | | 65,500 | | | | 969,400 | |
| | | | | | | | |
| | | | | | | 15,788,580 | |
| | | | | | | | |
Chemicals 1.0% | |
E.I. du Pont de Nemours & Co. | | | 69,600 | | | | 4,521,912 | |
Potash Corporation of Saskatchewan, Inc. | | | 100,500 | | | | 3,312,480 | |
| | | | | | | | |
| | | | | | | 7,834,392 | |
| | | | | | | | |
Commercial Banks 6.6% | |
PNC Financial Services Group, Inc. | | | 133,400 | | | | 10,349,172 | |
Regions Financial Corp. | | | 291,200 | | | | 2,879,968 | |
SunTrust Banks, Inc. | | | 203,200 | | | | 7,479,792 | |
¨U.S. Bancorp | | | 323,700 | | | | 13,077,480 | |
¨Wells Fargo & Co. | | | 355,300 | | | | 16,130,620 | |
| | | | | | | | |
| | | | | | | 49,917,032 | |
| | | | | | | | |
| | | | | | | | |
| | |
Shares | | |
Value | |
Communications Equipment 1.8% | |
Cisco Systems, Inc. | | | 281,700 | | | $ | 6,324,165 | |
Harris Corp. | | | 109,100 | | | | 7,616,271 | |
| | | | | | | | |
| | | | | | | 13,940,436 | |
| | | | | | | | |
Computers & Peripherals 1.3% | |
Apple, Inc. | | | 17,300 | | | | 9,707,203 | |
| | | | | | | | |
|
Construction Materials 0.7% | |
Vulcan Materials Co. | | | 94,400 | | | | 5,609,248 | |
| | | | | | | | |
|
Consumer Finance 1.1% | |
American Express Co. | | | 95,700 | | | | 8,682,861 | |
| | | | | | | | |
|
Containers & Packaging 0.5% | |
MeadWestvaco Corp. | | | 106,300 | | | | 3,925,659 | |
| | | | | | | | |
|
Distributors 0.6% | |
Genuine Parts Co. | | | 52,200 | | | | 4,342,518 | |
| | | | | | | | |
|
Diversified Financial Services 5.1% | |
¨Bank of America Corp. | | | 779,000 | | | | 12,129,030 | |
¨JPMorgan Chase & Co. | | | 360,900 | | | | 21,105,432 | |
McGraw Hill Financial, Inc. | | | 72,600 | | | | 5,677,320 | |
| | | | | | | | |
| | | | | | | 38,911,782 | |
| | | | | | | | |
Diversified Telecommunication Services 3.1% | |
AT&T, Inc. | | | 313,900 | | | | 11,036,724 | |
CenturyLink, Inc. | | | 110,500 | | | | 3,519,425 | |
Telefonica S.A. | | | 154,126 | | | | 2,509,387 | |
Verizon Communications, Inc. | | | 133,600 | | | | 6,565,104 | |
| | | | | | | | |
| | | | | | | 23,630,640 | |
| | | | | | | | |
Electric Utilities 3.7% | |
Duke Energy Corp. | | | 124,845 | | | | 8,615,554 | |
Entergy Corp. | | | 106,000 | | | | 6,706,620 | |
Exelon Corp. | | | 187,200 | | | | 5,127,408 | |
FirstEnergy Corp. | | | 109,500 | | | | 3,611,310 | |
Xcel Energy, Inc. | | | 156,400 | | | | 4,369,816 | |
| | | | | | | | |
| | | | | | | 28,430,708 | |
| | | | | | | | |
Electrical Equipment 1.8% | |
Eaton Corp. PLC | | | 58,684 | | | | 4,467,026 | |
Emerson Electric Co. | | | 135,700 | | | | 9,523,426 | |
| | | | | | | | |
| | | | | | | 13,990,452 | |
| | | | | | | | |
Electronic Equipment, Instruments & Components 0.9% | |
Corning, Inc. | | | 400,100 | | | | 7,129,782 | |
| | | | | | | | |
| † | Percentages indicated are based on Portfolio net assets. |
| ¨ | | Among the Portfolio’s 10 largest holdings, as of December 31, 2013, excluding short-term investment. May be subject to change daily. |
| | | | |
| M-406 | | MainStay VP T. Rowe Price Equity Income Portfolio | | The notes to the financial statements are an integral part of,
and should be read in conjunction with, the financial statements. |
| | | | | | | | |
| | |
Shares | | |
Value | |
| Common Stocks (continued) | |
Energy Equipment & Services 1.7% | |
Diamond Offshore Drilling, Inc. | | | 87,000 | | | $ | 4,952,040 | |
Schlumberger, Ltd. | | | 86,700 | | | | 7,812,537 | |
| | | | | | | | |
| | | | | | | 12,764,577 | |
| | | | | | | | |
Food Products 2.4% | |
Archer-Daniels-Midland Co. | | | 197,900 | | | | 8,588,860 | |
Campbell Soup Co. | | | 158,200 | | | | 6,846,896 | |
McCormick & Co., Inc. | | | 44,200 | | | | 3,046,264 | |
| | | | | | | | |
| | | | | | | 18,482,020 | |
| | | | | | | | |
Health Care Providers & Services 0.5% | |
Quest Diagnostics, Inc. | | | 73,300 | | | | 3,924,482 | |
| | | | | | | | |
|
Hotels, Restaurants & Leisure 0.9% | |
Carnival Corp. | | | 173,800 | | | | 6,981,546 | |
| | | | | | | | |
|
Household Durables 0.1% | |
Whirlpool Corp. | | | 5,400 | | | | 847,044 | |
| | | | | | | | |
|
Household Products 1.1% | |
Clorox Co. (The) | | | 86,400 | | | | 8,014,464 | |
| | | | | | | | |
|
Independent Power Producers & Energy Traders 0.4% | |
AES Corp. (The) | | | 204,900 | | | | 2,973,099 | |
| | | | | | | | |
|
Industrial Conglomerates 3.1% | |
¨General Electric Co. | | | 834,600 | | | | 23,393,838 | |
| | | | | | | | |
|
Insurance 4.5% | |
Allstate Corp. (The) | | | 160,000 | | | | 8,726,400 | |
Chubb Corp. (The) | | | 39,100 | | | | 3,778,233 | |
Lincoln National Corp. | | | 79,500 | | | | 4,103,790 | |
Loews Corp. | | | 53,300 | | | | 2,571,192 | |
Marsh & McLennan Cos., Inc. | | | 203,400 | | | | 9,836,424 | |
Sun Life Financial, Inc. | | | 89,500 | | | | 3,162,035 | |
Willis Group Holdings PLC | | | 52,900 | | | | 2,370,449 | |
| | | | | | | | |
| | | | | | | 34,548,523 | |
| | | | | | | | |
IT Services 1.1% | |
Computer Sciences Corp. | | | 98,300 | | | | 5,493,004 | |
Western Union Co. (The) | | | 158,700 | | | | 2,737,575 | |
| | | | | | | | |
| | | | | | | 8,230,579 | |
| | | | | | | | |
Leisure Equipment & Products 1.1% | |
Mattel, Inc. | | | 176,200 | | | | 8,383,596 | |
| | | | | | | | |
|
Life Sciences Tools & Services 0.3% | |
Agilent Technologies, Inc. | | | 39,900 | | | | 2,281,881 | |
| | | | | | | | |
| | | | | | | | |
| | |
Shares | | |
Value | |
Machinery 3.8% | | | | | | | | |
Deere & Co. | | | 53,500 | | | $ | 4,886,155 | |
¨Illinois Tool Works, Inc. | | | 131,900 | | | | 11,090,152 | |
Joy Global, Inc. | | | 72,700 | | | | 4,252,223 | |
Stanley Black & Decker, Inc. | | | 50,600 | | | | 4,082,914 | |
Xylem, Inc. | | | 138,400 | | | | 4,788,640 | |
| | | | | | | | |
| | | | | | | 29,100,084 | |
| | | | | | | | |
Media 3.6% | |
Cablevision Systems Corp. Class A | | | 199,100 | | | | 3,569,863 | |
Comcast Corp. Class A | | | 73,000 | | | | 3,793,445 | |
Madison Square Garden Co. Class A (a) | | | 56,200 | | | | 3,235,996 | |
New York Times Co. (The) Class A | | | 183,000 | | | | 2,904,210 | |
Time Warner, Inc. | | | 133,400 | | | | 9,300,648 | |
Walt Disney Co. (The) | | | 55,700 | | | | 4,255,480 | |
| | | | | | | | |
| | | | | | | 27,059,642 | |
| | | | | | | | |
Metals & Mining 1.3% | |
Newmont Mining Corp. | | | 113,900 | | | | 2,623,117 | |
Nucor Corp. | | | 134,000 | | | | 7,152,920 | |
| | | | | | | | |
| | | | | | | 9,776,037 | |
| | | | | | | | |
Multi-Utilities 1.1% | |
NiSource, Inc. | | | 260,400 | | | | 8,561,952 | |
| | | | | | | | |
|
Multiline Retail 1.8% | |
Kohl’s Corp. | | | 153,400 | | | | 8,705,450 | |
Macy’s, Inc. | | | 99,300 | | | | 5,302,620 | |
| | | | | | | | |
| | | | | | | 14,008,070 | |
| | | | | | | | |
Oil, Gas & Consumable Fuels 13.3% | |
Anadarko Petroleum Corp. | | | 84,900 | | | | 6,734,268 | |
¨Apache Corp. | | | 160,000 | | | | 13,750,400 | |
BP PLC, Sponsored ADR | | | 87,200 | | | | 4,238,792 | |
¨Chevron Corp. | | | 143,100 | | | | 17,874,621 | |
ConocoPhillips | | | 44,500 | | | | 3,143,925 | |
CONSOL Energy, Inc. | | | 145,500 | | | | 5,534,820 | |
ENI S.p.A. | | | 67,377 | | | | 1,621,157 | |
¨Exxon Mobil Corp. | | | 148,400 | | | | 15,018,080 | |
Hess Corp. | | | 105,700 | | | | 8,773,100 | |
Murphy Oil Corp. | | | 123,000 | | | | 7,980,240 | |
Petroleo Brasileiro S.A., ADR | | | 307,400 | | | | 4,235,972 | |
Royal Dutch Shell PLC, ADR | | | 155,200 | | | | 11,061,104 | |
Talisman Energy, Inc. | | | 148,900 | | | | 1,734,685 | |
| | | | | | | | |
| | | | | | | 101,701,164 | |
| | | | | | | | |
Paper & Forest Products 1.4% | |
International Paper Co. | | | 214,500 | | | | 10,516,935 | |
| | | | | | | | |
|
Personal Products 0.6% | |
Avon Products, Inc. | | | 270,300 | | | | 4,654,566 | |
| | | | | | | | |
| | | | | | |
The notes to the financial statements are an integral part of,
and should be read in conjunction with, the financial statements. | | mainstayinvestments.com | | | M-407 | |
Portfolio of Investments December 31, 2013 (continued)
| | | | | | | | |
| | |
Shares | | |
Value | |
| Common Stocks (continued) | |
Pharmaceuticals 5.9% | |
Bristol-Myers Squibb Co. | | | 156,900 | | | $ | 8,339,235 | |
GlaxoSmithKline PLC | | | 147,416 | | | | 3,933,889 | |
Hospira, Inc. (a) | | | 66,100 | | | | 2,728,608 | |
¨Johnson & Johnson | | | 123,600 | | | | 11,320,524 | |
Merck & Co., Inc. | | | 176,700 | | | | 8,843,835 | |
Pfizer, Inc. | | | 327,800 | | | | 10,040,514 | |
| | | | | | | | |
| | | | | | | 45,206,605 | |
| | | | | | | | |
Real Estate Investment Trusts 0.8% | |
Weyerhaeuser Co. | | | 181,800 | | | | 5,739,426 | |
| | | | | | | | |
|
Road & Rail 1.1% | |
Norfolk Southern Corp. | | | 90,700 | | | | 8,419,681 | |
| | | | | | | | |
|
Semiconductors & Semiconductor Equipment 2.3% | |
Analog Devices, Inc. | | | 110,300 | | | | 5,617,579 | |
Applied Materials, Inc. | | | 336,000 | | | | 5,943,840 | |
Texas Instruments, Inc. | | | 127,700 | | | | 5,607,307 | |
| | | | | | | | |
| | | | | | | 17,168,726 | |
| | | | | | | | |
Software 1.5% | |
CA, Inc. | | | 66,100 | | | | 2,224,265 | |
Microsoft Corp. | | | 248,400 | | | | 9,297,612 | |
| | | | | | | | |
| | | | | | | 11,521,877 | |
| | | | | | | | |
Specialty Retail 0.8% | |
Staples, Inc. | | | 353,400 | | | | 5,615,526 | |
Tiffany & Co. | | | 5,300 | | | | 491,734 | |
| | | | | | | | |
| | | | | | | 6,107,260 | |
| | | | | | | | |
Wireless Telecommunication Services 0.4% | |
Vodafone Group PLC | | | 846,966 | | | | 3,324,004 | |
| | | | | | | | |
Total Common Stocks
(Cost $569,637,606) | | | | | | | 730,287,788 | |
| | | | | | | | |
|
| Convertible Preferred Stock 0.1% | |
Real Estate Investment Trusts 0.1% | |
Weyerhaeuser Co.
6.375% | | | 6,900 | | | | 386,676 | |
| | | | | | | | |
Total Convertible Preferred Stock
(Cost $345,000) | | | | | | | 386,676 | |
| | | | | | | | |
| | | | | | | | |
| | | Principal
Amount | | | Value | |
| Short-Term Investment 4.1% | |
Repurchase Agreement 4.1% | |
State Street Bank and Trust Co. 0.00%, dated 12/31/13
due 1/2/14
Proceeds at Maturity $31,115,572 (Collateralized by a Federal National Mortgage Association security with a rate of 2.14% and a maturity date of 11/7/22, with a Principal Amount of $34,960,000 and a Market Value of $31,739,170) | | $ | 31,115,572 | | | $ | 31,115,572 | |
| | | | | | | | |
Total Short-Term Investment
(Cost $31,115,572) | | | | | | | 31,115,572 | |
| | | | | | | | |
Total Investments
(Cost $601,098,178) (b) | | | 100.0 | % | | | 761,790,036 | |
Other Assets, Less Liabilities | | | 0.0 | ‡ | | | 378,620 | |
Net Assets | | | 100.0 | % | | $ | 762,168,656 | |
| ‡ | Less than one-tenth of a percent. |
| (a) | Non-income producing security. |
| (b) | As of December 31, 2013, cost is $601,667,366 for federal income tax purposes and net unrealized appreciation is as follows: |
| | | | |
Gross unrealized appreciation | | $ | 168,692,710 | |
Gross unrealized depreciation | | | (8,570,040 | ) |
| | | | |
Net unrealized appreciation | | $ | 160,122,670 | |
| | | | |
The following abbreviation is used in the above portfolio:
| ADR—American | Depositary Receipt |
| | | | |
| M-408 | | MainStay VP T. Rowe Price Equity Income Portfolio | | The notes to the financial statements are an integral part of,
and should be read in conjunction with, the financial statements. |
The following is a summary of the fair valuations according to the inputs used as of December 31, 2013, for valuing the Portfolio’s assets.
Asset Valuation Inputs
| | | | | | | | | | | | | | | | |
Description | | Quoted Prices
in Active Markets
for Identical Assets (Level 1) | | | Significant Other
Observable Inputs (Level 2) | | | Significant
Unobservable
Inputs (Level 3) | | | Total | |
| Investments in Securities (a) | | | | | | | | | | | | | | | | |
Common Stocks | | $ | 730,287,788 | | | $ | — | | | $ | — | | | $ | 730,287,788 | |
Convertible Preferred Stock | | | 386,676 | | | | — | | | | — | | | | 386,676 | |
| Short-Term Investment | | | | | | | | | | | | | | | | |
Repurchase Agreement | | | — | | | | 31,115,572 | | | | — | | | | 31,115,572 | |
| | | | | | | | | | | | | | | | |
| Total Investments in Securities | | $ | 730,674,464 | | | $ | 31,115,572 | | | $ | — | | | $ | 761,790,036 | |
| | | | | | | | | | | | | | | | |
| (a) | For a complete listing of investments and their industries, see the Portfolio of Investments. |
The Portfolio recognizes transfers between the levels as of the beginning of the period.
As of December 31, 2013, certain foreign securities with a market value of $3,759,388 were transferred from Level 2 to Level 1 as the prices of these securities were based on unadjusted quoted prices compared to prior year prices which were adjusted for events after the market close. Fair values as of December 31, 2013, for these securities were based on quoted prices in active markets for identical investments. (See Note 2)
As of December 31, 2013, the Portfolio did not hold any investments with significant unobservable inputs (Level 3). (See Note 2)
| | | | | | |
The notes to the financial statements are an integral part of,
and should be read in conjunction with, the financial statements. | | mainstayinvestments.com | | | M-409 | |
Statement of Assets and Liabilities as of December 31, 2013
| | | | |
| Assets | |
Investment in securities, at value
(identified cost $601,098,178) | | $ | 761,790,036 | |
Cash denominated in foreign currencies (identified cost $96,400) | | | 97,948 | |
Cash | | | 25,759 | |
Receivables: | | | | |
Investment securities sold | | | 1,153,468 | |
Dividends and interest | | | 1,105,126 | |
Fund shares sold | | | 353,319 | |
| | | | |
Total assets | | | 764,525,656 | |
| | | | |
| |
| Liabilities | | | | |
Payables: | | | | |
Fund shares redeemed | | | 961,623 | |
Investment securities purchased | | | 776,539 | |
Manager (See Note 3) | | | 475,397 | |
NYLIFE Distributors (See Note 3) | | | 65,264 | |
Shareholder communication | | | 38,049 | |
Professional fees | | | 32,285 | |
Custodian | | | 3,962 | |
Trustees | | | 944 | |
Accrued expenses | | | 2,937 | |
| | | | |
Total liabilities | | | 2,357,000 | |
| | | | |
Net assets | | $ | 762,168,656 | |
| | | | |
| |
| Net Assets Consist of | | | | |
Shares of beneficial interest outstanding (par value of $.001 per share) unlimited number of shares authorized | | $ | 55,404 | |
Additional paid-in capital | | | 551,416,899 | |
| | | | |
| | | 551,472,303 | |
Undistributed net investment income | | | 11,456,521 | |
Accumulated net realized gain (loss) on investments and foreign currency transactions | | | 38,543,759 | |
Net unrealized appreciation (depreciation) on investments | | | 160,691,858 | |
Net unrealized appreciation (depreciation) on translation of other assets and liabilities in foreign currencies | | | 4,215 | |
| | | | |
Net assets | | $ | 762,168,656 | |
| | | | |
| | | | |
Initial Class | | | | |
Net assets applicable to outstanding shares | | $ | 448,470,869 | |
| | | | |
Shares of beneficial interest outstanding | | | 32,561,327 | |
| | | | |
Net asset value per share outstanding | | $ | 13.77 | |
| | | | |
Service Class | | | | |
Net assets applicable to outstanding shares | | $ | 313,697,787 | |
| | | | |
Shares of beneficial interest outstanding | | | 22,842,748 | |
| | | | |
Net asset value per share outstanding | | $ | 13.73 | |
| | | | |
| | | | |
| M-410 | | MainStay VP T. Rowe Price Equity Income Portfolio | | The notes to the financial statements are an integral part of,
and should be read in conjunction with, the financial statements. |
Statement of Operations for the year ended December 31, 2013
| | | | |
| Investment Income (Loss) | |
Income | | | | |
Dividends (a) | | $ | 17,919,430 | |
Interest | | | 1,855 | |
| | | | |
Total income | | | 17,921,285 | |
| | | | |
Expenses | | | | |
Manager (See Note 3) | | | 5,693,123 | |
Distribution and service—Service Class (See Note 3) | | | 697,500 | |
Shareholder communication | | | 112,933 | |
Professional fees | | | 64,895 | |
Custodian | | | 25,784 | |
Trustees | | | 14,517 | |
Miscellaneous | | | 22,367 | |
| | | | |
Total expenses before waiver/reimbursement | | | 6,631,119 | |
Expense waiver/reimbursement from Manager (See Note 3) | | | (359,229 | ) |
| | | | |
Net expenses | | | 6,271,890 | |
| | | | |
Net investment income (loss) | | | 11,649,395 | |
| | | | |
|
| Realized and Unrealized Gain (Loss) on Investments and Foreign Currency Transactions | |
Net realized gain (loss) on: | | | | |
Security transactions | | | 38,444,217 | |
Foreign currency transactions | | | (2,020 | ) |
| | | | |
Net realized gain (loss) on investments and foreign currency transactions | | | 38,442,197 | |
| | | | |
Net change in unrealized appreciation (depreciation) on: | | | | |
Investments | | | 136,364,898 | |
Translation of other assets and liabilities in foreign currencies | | | 3,371 | |
| | | | |
Net change in unrealized appreciation (depreciation) on investments and foreign currency transactions | | | 136,368,269 | |
| | | | |
Net realized and unrealized gain (loss) on investments and foreign currency transactions | | | 174,810,466 | |
| | | | |
Net increase (decrease) in net assets resulting from operations | | $ | 186,459,861 | |
| | | | |
| (a) | Dividends recorded net of foreign withholding taxes in the amount of $130,769. |
| | | | | | |
The notes to the financial statements are an integral part of,
and should be read in conjunction with, the financial statements. | | mainstayinvestments.com | | | M-411 | |
Statements of Changes in Net Assets
for the year ended December 31, 2013 and the period February 17, 2012 (inception date) through December 31, 2012
| | | | | | | | |
| | | 2013 | | | 2012 | |
| Increase (Decrease) in Net Assets | |
Operations: | | | | | | | | |
Net investment income (loss) | | $ | 11,649,395 | | | $ | 8,923,138 | |
Net realized gain (loss) on investments and foreign currency transactions | | | 38,442,197 | | | | 5,534,150 | |
Net change in unrealized appreciation (depreciation) on investments and foreign currency transactions | | | 136,368,269 | | | | 24,327,804 | |
| | | | |
Net increase (decrease) in net assets resulting from operations | | | 186,459,861 | | | | 38,785,092 | |
| | | | |
Dividends and distributions to shareholders: | | | | | | | | |
From net investment income: | | | | | | | | |
Initial Class | | | (5,636,878 | ) | | | — | |
Service Class | | | (3,128,289 | ) | | | — | |
| | | | |
| | | (8,765,167 | ) | | | — | |
| | | | |
From net realized gain on investments: | | | | | | | | |
Initial Class | | | (3,510,559 | ) | | | — | |
Service Class | | | (2,272,874 | ) | | | — | |
| | | | |
| | | (5,783,433 | ) | | | — | |
| | | | |
Total dividends and distributions to shareholders | | | (14,548,600 | ) | | | — | |
| | | | |
Capital share transactions: | | | | | | | | |
Net proceeds from sale of shares | | | 103,018,020 | | | | 655,547,131 | |
Net asset value of shares issued to shareholders in reinvestment of dividends and distributions | | | 14,548,600 | | | | — | |
Cost of shares redeemed | | | (143,712,031 | ) | | | (77,929,417 | ) |
| | | | |
Increase (decrease) in net assets derived from capital share transactions | | | (26,145,411 | ) | | | 577,617,714 | |
| | | | |
Net increase (decrease) in net assets | | | 145,765,850 | | | | 616,402,806 | |
|
| Net Assets | |
Beginning of period | | | 616,402,806 | | | | — | |
| | | | |
End of period | | $ | 762,168,656 | | | $ | 616,402,806 | |
| | | | |
Undistributed net investment income at end of period | | $ | 11,456,521 | | | $ | 8,775,690 | |
| | | | |
| | | | |
| M-412 | | MainStay VP T. Rowe Price Equity Income Portfolio | | The notes to the financial statements are an integral part of,
and should be read in conjunction with, the financial statements. |
Financial Highlights selected per share data and ratios
| | | | | | | | | | | | | | | | | | |
| | | Initial Class | | | | | Service Class | |
| | | Year ended
December 31, | | | February 17,
2012**
through
December 31, | | | | | Year ended
December 31, | | | February 17,
2012**
through
December 31, | |
| | | 2013 | | | 2012 | | | | | 2013 | | | 2012 | |
Net asset value at beginning of period | | $ | 10.79 | | | $ | 10.00 | | | | | $ | 10.76 | | | $ | 10.00 | |
| | | | | | | | | | | | | | | | | | |
Net investment income (loss) (a) | | | 0.21 | | | | 0.19 | | | | | | 0.18 | | | | 0.17 | |
Net realized and unrealized gain (loss) on investments | | | 3.03 | | | | 0.60 | | | | | | 3.03 | | | | 0.59 | |
| | | | | | | | | | | | | | | | | | |
Total from investment operations | | | 3.24 | | | | 0.79 | | | | | | 3.21 | | | | 0.76 | |
| | | | | | | | | | | | | | | | | | |
Less dividends and distributions | | | | | | | | | | | | | | | | | | |
From net investment income | | | (0.16 | ) | | | — | | | | | | (0.14 | ) | | | — | |
From net realized gain on investments | | | (0.10 | ) | | | — | | | | | | (0.10 | ) | | | — | |
| | | | | | | | | | | | | | | | | | |
Total dividends and distributions | | | (0.26 | ) | | | — | | | | | | (0.24 | ) | | | — | |
| | | | | | | | | | | | | | | | | | |
Net asset value at end of period | | $ | 13.77 | | | $ | 10.79 | | | | | $ | 13.73 | | | $ | 10.76 | |
| | | | | | | | | | | | | | | | | | |
Total investment return | | | 30.36 | % | | | 7.90 | %(b)(c) | | | | | 30.04 | % | | | 7.60 | %(b)(c) |
Ratios (to average net assets)/Supplemental Data: | | | | | | | | | | | | | | | | | | |
Net investment income (loss) | | | 1.72 | % | | | 2.15 | %†† | | | | | 1.47 | % | | | 1.85 | %†† |
Net expenses | | | 0.78 | % | | | 0.79 | %†† | | | | | 1.03 | % | | | 1.04 | %†† |
Expenses (before waiver/reimbursement) | | | 0.83 | % | | | 0.84 | %†† | | | | | 1.08 | % | | | 1.09 | %†† |
Portfolio turnover rate | | | 20 | % | | | 15 | % | | | | | 20 | % | | | 15 | % |
Net assets at end of period (in 000’s) | | $ | 448,471 | | | $ | 374,322 | | | | | $ | 313,698 | | | $ | 242,081 | |
| (a) | Per share data based on average shares outstanding during the period. |
| (b) | Total investment return is not annualized. |
| (c) | Total investment returns may reflect adjustments to conform to generally accepted accounting principles. |
| | | | | | |
The notes to the financial statements are an integral part of,
and should be read in conjunction with, the financial statements. | | mainstayinvestments.com | | | M-413 | |
MainStay VP Unconstrained Bond Portfolio
Investment and Performance Comparison (Unaudited)
Performance data quoted represents past performance. Past performance is no guarantee of future results. Because of market volatility, current performance may be lower or higher than the figures shown. Investment return and principal value will fluctuate, and as a result, when shares are redeemed, they may be worth more or less than their original cost. The performance table and graph do not reflect any deduction of sales charges, mortality and expense charges, contract charges or administrative charges. Please refer to the Performance Summary appropriate for your policy. For performance information current to the most recent month-end, please call 800-598-2019 or visit www.newyorklife.com.
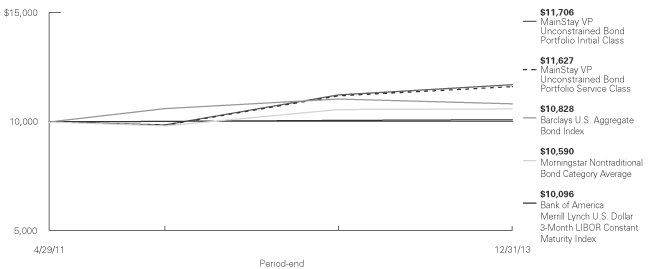
Average Annual Total Returns for the Period Ended December 31, 2013
| | | | | | | | | | | | |
| Class | | One Year | | | Since
Inception (4/29/11) | | | Gross Expense Ratio1 | |
| Initial Class Shares | | | 4.17 | % | | | 6.06 | % | | | 0.65 | % |
| Service Class Shares | | | 3.91 | | | | 5.80 | | | | 0.90 | |
| | | | | | | | |
| Benchmark Performance | | One Year | | | Since Inception
(4/29/11) | |
Barclays U.S. Aggregate Bond Index2 | | | –2.02 | % | | | 3.03 | % |
Bank of America Merrill Lynch U.S. Dollar 3-Month LIBOR Constant Maturity Index2 | | | 0.29 | | | | 0.36 | |
Morningstar Nontraditional Bond Category Average2 | | | 0.29 | | | | 2.17 | |
| 1. | The gross expense ratios presented reflect the Portfolio’s “Total Annual Portfolio Operating Expenses” from the most recent Prospectus and may differ from other expense ratios disclosed in this report. |
| 2. | Please refer to pages M-2 and M-3 for additional explanations and disclosure regarding the Portfolios, their benchmark indices and other indices mentioned in the reports. |
| | |
| M-414 | | MainStay VP Unconstrained Bond Portfolio |
Cost in Dollars of a $1,000 Investment in MainStay VP Unconstrained Bond Portfolio (Unaudited)
The example below is intended to describe the fees and expenses borne by shareholders during the six-month period from July 1, 2013, to December 31, 2013, and the impact of those costs on your investment.
Example
As a shareholder of the Portfolio, you incur two types of costs: (1) transaction costs, including exchange fees and sales charges (loads) on purchases (as applicable), and (2) ongoing costs, including management fees, distribution and/or service (12b-1) fees, and other Portfolio expenses (as applicable). This example is intended to help you understand your ongoing costs (in dollars) of investing in the Portfolio and to compare these costs with the ongoing costs of investing in other Portfolios. The example is based on an investment of $1,000 made at the beginning of the six-month period and held for the entire period from July 1, 2013, to December 31, 2013. Shares are only sold in connection with variable life and annuity contracts and the example does not reflect any contract level or transactional fees or expenses. If these costs had been included, your costs would have been higher.
This example illustrates your Portfolio’s ongoing costs in two ways:
Actual Expenses
The second and third data columns in the table below provide information about actual account values and actual expenses. You may use the information in these columns, together with the amount you invested, to estimate the expenses that you paid during the six months ended
December 31, 2013. Simply divide your account value by $1,000 (for example, an $8,600 account value divided by $1,000 = 8.6), then multiply the result by the number under the heading entitled ‘‘Expenses Paid During Period’’ to estimate the expenses you paid on your account during this period.
Hypothetical Example for Comparison Purposes
The fourth and fifth data columns in the table below provide information about hypothetical account values and hypothetical expenses based on the Portfolio’s actual expense ratio and an assumed rate of return of 5% per year before expenses, which is not the Portfolio’s actual return. The hypothetical account values and expenses may not be used to estimate the actual ending account balances or expenses you paid for the six-month period shown. You may use this information to compare the ongoing costs of investing in the Portfolio with the ongoing costs of investing in other Portfolios. To do so, compare this 5% hypothetical example with the 5% hypothetical examples that appear in the shareholder reports of the other Portfolios.
Please note that the expenses shown in the table are meant to highlight your ongoing costs only and do not reflect any transactional costs, such as exchange fees or sales charges (loads). Therefore, the fourth and fifth data columns of the table are useful in comparing ongoing costs only and will not help you determine the relative total costs of owning different funds. In addition, if these transactional costs were included, your costs would have been higher.
| | | | | | | | | | | | | | | | | | | | |
| | | | | | | | | | | | | | | | |
| Share Class | | Beginning
Account
Value
7/1/13 | | | Ending Account
Value (Based
on Actual
Returns and
Expenses)
12/31/13 | | | Expenses
Paid
During
Period1 | | | Ending Account
Value (Based
on Hypothetical
5% Annualized
Return and
Actual Expenses)
12/31/13 | | | Expenses
Paid
During
Period1 | |
| | | | | |
| Initial Class Shares | | $ | 1,000.00 | | | $ | 1,045.50 | | | $ | 3.40 | | | $ | 1,021.90 | | | $ | 3.36 | |
| | | | | |
| Service Class Shares | | $ | 1,000.00 | | | $ | 1,044.20 | | | $ | 4.69 | | | $ | 1,020.60 | | | $ | 4.63 | |
| 1. | Expenses are equal to the Portfolio’s annualized expense ratio of each class (0.66% for Initial Class and 0.91% for Service Class) multiplied by the average account value over the period, divided by 365 and multiplied by 184 (to reflect the six-month period). The table above represents the actual expenses incurred during the six-month period. |
| | | | |
| mainstayinvestments.com | | | M-415 | |
Portfolio Composition as of December 31, 2013 (Unaudited)
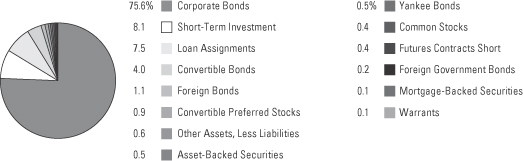
See Portfolio of Investments beginning on page M-420 for specific holdings within these categories.
Top Ten Holdings or Issuers Held as of December 31, 2013 (excluding short-term investment) (Unaudited)
| 2. | Dana Holding Corp., 5.375%, due 9/15/21 |
| 3. | First Data Corp., 7.375%–10.625%, due 6/15/19–6/15/21 |
| 4. | American International Group, Inc., 4.875%–5.75%, due 3/15/67 |
| 5. | Morgan Stanley, 4.875%–5.00%, due 11/1/22–11/24/25 |
| 6. | JPMorgan Chase & Co., (zero coupon)–7.90%, due 5/5/15–4/29/49 |
| 7. | Caesars Entertainment Operating Co., Inc., 4.488%–9.00%, due 1/26/18–2/15/20 |
| 8. | Hornbeck Offshore Services, Inc., 5.00%–5.875%, due 4/1/20–3/1/21 |
| 9. | Clear Channel Communications, Inc., 5.50%–9.00%, due 12/15/16–3/1/21 |
| 10. | Chrysler Group LLC / CG Co-Issuer, Inc., 8.25%, due 6/15/21 |
| | |
| M-416 | | MainStay VP Unconstrained Bond Portfolio |
Portfolio Management Discussion and Analysis (Unaudited)
Answers to the questions reflect the views of portfolio managers Dan Roberts, Michael Kimble, Louis N. Cohen and Taylor Wagenseil of MacKay Shields LLC, the Portfolio’s Subadvisor.
How did MainStay VP Unconstrained Bond Portfolio perform relative to its benchmark and peers during the 12 months ended December 31, 2013?
For the 12 months ended December 31, 2013, MainStay VP Unconstrained Bond Portfolio returned 4.17% for Initial Class shares and 3.91% for Service Class shares. Over the same period, both share classes outperformed the –2.02% return of the Barclays U.S. Aggregate Bond Index,1 which is the Portfolio’s broad-based securities-market index, and the 0.29% return of the Bank of America Merrill Lynch U.S. Dollar 3-Month LIBOR Constant Maturity Index,1 which is a secondary benchmark of the Portfolio. Over the same period, both share classes outperformed the 0.29% return of the Morningstar Nontraditional Bond Category Average, which is an additional benchmark of the Portfolio.
What factors affected the Portfolio’s relative performance during the reporting period?
The Portfolio’s outperformance of the Barclays U.S. Aggregate Bond Index was primarily driven by an overweight position in spread2 product, more specifically high-yield corporate bonds. High-yield corporate bonds were the best-performing fixed-income sector in 2013. From a total-return perspective all sectors within the high-yield index, as measured by the Bank of America Merrill Lynch U.S. High Yield Master II Constrained Index,1 delivered positive returns. Among high-yield bonds, the best-performing industries included food & drug, broadcasting and consumer durables, while the worst performers were wireless, utility and cable. For the year, $340 billion in new supply was just shy of 2012 levels. Most of the issuance (approximately 60%) was for refinancing activity, whereas in 2008 most high-yield issuers used deal proceeds for acquisitions and buyouts.
In the high-yield sector, the industries we favored during the year included gaming, airlines, autos and energy. Revenue and earnings trends improved over the course of the year as companies showed discipline in maintaining relatively modest leverage ratios. Short positions in two-year U.S. Treasury futures contracts remained our preferred means of reducing interest-rate risk. The hedge contributed to overall perform
ance as yields in the front end of the U.S. Treasury yield curve3 rose 10 basis points. (A basis point is one-hundredth of a percentage point.)
Corporate investment-grade bonds were the best-performing investment-grade sector within fixed-income markets during the reporting period. Despite this significant outperformance relative to U.S. Treasurys, U.S. corporate bonds delivered negative total returns in 2013 for the first time since 2008. Within the corporate universe, the return differences for financial and nonfinancial companies were significant. Financial companies returned 0.9%, but nonfinancial companies returned –2.7%. For this reason, the Portfolio’s overweight position in the financial sector helped relative performance during the reporting period.
During the reporting period, U.S. Treasury securities and agency mortgages underperformed spread product. Fortunately, the Portfolio’s underweight positions in these asset classes helped the Portfolio’s performance relative to the Barclays U.S. Aggregate Bond Index. We also used U.S. Treasury futures to lower the Portfolio’s duration, a move that was accretive to performance in relation to the Index.
What was the Portfolio’s duration strategy during the reporting period?
The Portfolio’s duration was shorter than that of the Barclays U.S. Aggregate Bond Index throughout the reporting period for two reasons. First, the Portfolio held an overweight position in high-yield corporate bonds. These bonds tend to have shorter durations than investment-grade corporate bonds. They also tend to have a lower correlation to U.S. Treasury securities, so they have a lower sensitivity to interest rates, although they are not immune. Second, we increased the Portfolio’s exposure to a short in U.S. Treasury securities through futures to lower the Portfolio’s overall duration and hedge against a rise in interest rates. The Portfolio’s exposure to lower-duration high-yield securities positively affected the Portfolio’s performance. The Portfolio’s exposure to U.S. Treasury futures also added to performance, but to a lesser extent.
| 1. | Please refer to pages M-2 and M-3 for additional explanations and disclosure regarding the Portfolios, their benchmark indices and service providers mentioned in the reports. |
| 2. | The terms “spread” and “yield spread” may refer to the difference in yield between a security or type of security and comparable U.S. Treasury issues. The terms may also refer to the difference in yield between two specific securities or types of securities at a given time. The term “spread product” is a generic term for individual securities or asset classes that typically trade at a spread to U.S. Treasury securities. |
| 3. | The yield curve is a line that plots the yields of various securities of similar quality—typically U.S. Treasury issues—across a range of maturities. The U.S. Treasury yield curve serves as a benchmark for other debt and is used in economic forecasting. |
| | | | |
| mainstayinvestments.com | | | M-417 | |
What specific factors, risks or market forces prompted significant decisions for the Portfolio during the reporting period?
During the reporting period, there were many macro factors to consider. Among these were the Federal Reserve’s comments at the end of the second quarter about possibly tapering bond purchases. As a result, the Portfolio experienced some periods of volatility. Nevertheless, we did not make any material changes to the Portfolio’s positioning.
Since the inception of the Portfolio we had judged the Federal Reserve’s accommodative monetary policy, along with improving economic data, to be a positive for spread product such as high-yield corporate bonds. In addition, improving profitability signaled that many corporations were doing more with less: less leverage, less short-term debt and smaller funding gaps. In our opinion, improving credit fundamentals would support narrower spreads—or less compensation for assuming credit risk—alongside a favorable balance of supply and demand for corporate debt. For these reasons, we have maintained a risk profile that was and is higher than that of the Barclays U.S. Aggregate Bond Index—specifically, an overweight in high-yield bonds.
During the reporting period, which market segments were the strongest positive contributors to the Portfolio’s performance and which market segments were particularly weak?
An overweight position in high-yield bonds, which outperformed the Barclays U.S. Aggregate Bond Index, was the driving force behind the Portfolio’s outperformance in 2013. (The Barclay’s U.S. Aggregate Bond Index consists entirely of investment-grade bonds.) The Portfolio’s positions in convertible bonds and bank loans were also positive contributors to the Portfolio’s relative performance, but to a lesser degree. Though our positions in investment-grade credit performed well relative to the Barclays U.S. Aggregate Bond Index, investment-grade bonds underperformed high-yield bonds during the reporting period.
With the Portfolio’s overweight position in high-yield corporate bonds came underweight positions in U.S. Treasury securities and agency mortgages. These underweight positions contributed to the Portfolio’s relative performance, as U.S. Treasury and agency securities had negative absolute returns for the reporting period. Overall, the Portfolio’s positioning did not change much during the reporting period. Our bias toward more cyclical segments of the market—
such as financials, gaming, homebuilders, building materials and steel companies—continued to perform well.
Did the Portfolio make any significant purchases or sales during the reporting period?
While there were no significant changes in the Portfolio’s overall positioning during the reporting period, we added some positions and eliminated others. The Portfolio purchased bonds of air carrier U.S. Airways Group, drug company Valeant Pharmaceuticals International and telecommunications company Sprint. We bought bonds of U.S. Airways Group because we believed that the fundamental landscape for airlines had improved. With consolidation and more revenue from ancillary services, airlines have been able to book relatively solid results. The Valeant Pharmaceuticals International bonds were issued to fund the company’s acquisition of Bausch and Lomb. The Sprint bonds were issued to fund a comprehensive capital-expenditure program, as the company was being acquired by Softbank, an investment-grade company. We believed that the bonds from Valeant Pharmaceuticals International and Sprint were issued at attractive levels.
During the reporting period, the Portfolio sold positions in oil & gas exploration & production company Plains Exploration & Production, electric utility Energy Future Holdings and telecommunications equipment company Lucent Technologies. We sold the Portfolio’s Plains Exploration & Production bonds after the company was upgraded to investment-grade following its acquisition by Freeport-McMoRan Copper & Gold. The Portfolio had owned the secured bonds of Energy Future Holdings, which performed well during the reporting period. In our view, however, the company had too much debt given its earnings power, and many investors expect the company to file for bankruptcy. In light of these factors, we did not think it prudent to maintain the position. The bonds of Lucent Technologies rebounded during the reporting period, as the company refinanced debt and produced better results. The bonds, however, rose to a level that, in our view, made them unattractive given their long duration and relatively tight spread.
How did the Portfolio’s sector weightings change during the reporting period?
Although there were no significant changes in the Portfolio’s positioning during the reporting period, we did add some new holdings to the Portfolio and eliminate others. Any changes in sector weightings were
| | |
| M-418 | | MainStay VP Unconstrained Bond Portfolio |
driven more by individual security selection than by sector rotation.
How was the Portfolio positioned at the end of the reporting period?
In spite of volatility in the markets, our baseline view on Federal Reserve policy, economic fundamentals and valuations within the credit markets has not changed. We firmly believe that economic growth will continue to be moderate and that the Federal Reserve will remain highly accommodative. Our central belief is that monetary policy plays a critical role in the crea-
tion of credit, and the Federal Reserve has the ability to control monetary policy through its influence on short-term interest rates.
As of December 31, 2013, the Portfolio maintained an overweight position in spread product, specifically high-yield bonds. As of the same date, the Portfolio maintained underweight positions in sectors that were more rate sensitive, such as U.S. Treasury and agency securities. As of December 31, the Portfolio’s duration was shorter than that of the Barclays U.S. Aggregate Bond Index.
The opinions expressed are those of the portfolio managers as of the date of this report and are subject to change. There is no guarantee that any forecasts will come to pass. This material does not constitute investment advice and is not intended as an endorsement of any specific investment.
Not all MainStay VP Portfolios and/or share classes are available under all policies.
| | | | |
| mainstayinvestments.com | | | M-419 | |
Portfolio of Investments December 31, 2013
| | | | | | | | |
| | | Principal
Amount | | | Value | |
Long-Term Bonds 89.5%† Asset-Backed Securities 0.5% | |
Airlines 0.1% | | | | | | | | |
Continental Airlines, Inc.
Series 2004-ERJ1, Class A
9.558%, due 3/1/21 | | $ | 20,101 | | | $ | 22,513 | |
Northwest Airlines, Inc.
Series 2007-1, Class A
7.027%, due 5/1/21 | | | 75,532 | | | | 83,840 | |
United Airlines, Inc.
Series 2009-2, Class A
9.75%, due 7/15/18 | | | 121,892 | | | | 140,176 | |
| | | | | | | | |
| | | | | | | 246,529 | |
| | | | | | | | |
Home Equity 0.3% | | | | | | | | |
Carrington Mortgage Loan Trust
Series 2006-NC4, Class A5
0.225%, due 10/25/36 (a)(b) | | | 111,789 | | | | 93,870 | |
Citigroup Mortgage Loan Trust
Series 2007-AHL2, Class A3A
0.235%, due 5/25/37 (a)(b) | | | 64,562 | | | | 47,371 | |
Equifirst Loan Securitization Trust
Series 2007-1, Class A2A
0.225%, due 4/25/37 (a)(b) | | | 19,241 | | | | 18,880 | |
First NLC Trust
Series 2007-1, Class A1
0.235%, due 8/25/37 (a)(b)(c) | | | 102,426 | | | | 51,727 | |
GSAA Home Equity Trust
Series 2006-14, Class A1
0.215%, due 9/25/36 (a)(b) | | | 215,785 | | | | 109,099 | |
Home Equity Loan Trust
Series 2007-FRE1, Class 2AV1
0.295%, due 4/25/37 (a)(b) | | | 51,811 | | | | 47,862 | |
HSI Asset Securitization Corp. Trust
Series 2007-NC1, Class A1
0.265%, due 4/25/37 (a)(b) | | | 76,551 | | | | 68,675 | |
JP Morgan Mortgage Acquisition Corp.
Series 2007-HE1, Class AF1
0.265%, due 3/25/47 (a)(b) | | | 61,249 | | | | 44,469 | |
Master Asset Backed Securities Trust
Series 2006-HE4, Class A1
0.215%, due 11/25/36 (a)(b) | | | 26,820 | | | | 11,230 | |
Merrill Lynch Mortgage Investors Trust
Series 2007-MLN1, Class A2A
0.275%, due 3/25/37 (a)(b) | | | 151,024 | | | | 100,259 | |
Morgan Stanley ABS Capital I Trust
Series 2006-HE6, Class A2B
0.265%, due 9/25/36 (a)(b) | | | 89,489 | | | | 47,444 | |
Series 2006-HE8, Class A2B
0.265%, due 10/25/36 (a)(b) | | | 48,132 | | | | 27,063 | |
| | | | | | | | |
| | | Principal
Amount | | | Value | |
Home Equity (continued) | | | | | | | | |
Morgan Stanley ABS Capital I Trust (continued) | | | | | |
Series 2007-HE4, Class A2A
0.275%, due 2/25/37 (a)(b) | | $ | 24,358 | | | $ | 10,715 | |
Series 2007-NC2, Class A2FP
0.315%, due 2/25/37 (a)(b) | | | 95,508 | | | | 51,574 | |
Renaissance Home Equity Loan Trust
Series 2007-2, Class AF1
5.893%, due 6/25/37 (b)(d) | | | 206,800 | | | | 113,499 | |
Securitized Asset Backed Receivables LLC Trust
Series 2007-BR4, Class A2A
0.255%, due 5/25/37 (a)(b) | | | 118,098 | | | | 67,690 | |
Soundview Home Equity Loan Trust
Series 2007-OPT1, Class 2A1
0.245%, due 6/25/37 (a)(b) | | | 99,186 | | | | 53,190 | |
Series 2006-EQ2, Class A2
0.275%, due 1/25/37 (a)(b) | | | 66,375 | | | | 39,892 | |
Specialty Underwriting & Residential Finance Trust
Series 2006-BC4, Class A2B
0.275%, due 9/25/37 (a)(b) | | | 710,952 | | | | 357,257 | |
| | | | | | | | |
| | | | | | | 1,361,766 | |
| | | | | | | | |
Student Loans 0.1% | | | | | | | | |
Keycorp Student Loan Trust
Series 2000-A, Class A2
0.558%, due 5/25/29 (a) | | | 427,997 | | | | 395,652 | |
| | | | | | | | |
Total Asset-Backed Securities
(Cost $2,382,070) | | | | | | | 2,003,947 | |
| | | | | | | | |
| | |
| Convertible Bonds 4.0% | | | | | | | | |
Airlines 0.2% | | | | | | | | |
Airtran Holdings, Inc.
5.25%, due 11/1/16 | | | 250,000 | | | | 424,062 | |
United Airlines, Inc.
4.50%, due 1/15/15 | | | 195,000 | | | | 399,263 | |
| | | | | | | | |
| | | | | | | 823,325 | |
| | | | | | | | |
Auto Manufacturers 0.1% | | | | | | | | |
Ford Motor Co.
4.25%, due 11/15/16 | | | 127,000 | | | | 234,950 | |
| | | | | | | | |
| | |
Biotechnology 0.2% | | | | | | | | |
Cubist Pharmaceuticals, Inc.
1.125%, due 9/1/18 (c) | | | 120,000 | | | | 138,375 | |
1.875%, due 9/1/20 (c) | | | 155,000 | | | | 177,572 | |
| † | Percentages indicated are based on Portfolio net assets. |
| ¨ | | Among the Portfolio’s 10 largest holdings or issuers held, as of December 31, 2013, excluding short-term investment. May be subject to change daily. |
| | | | |
| M-420 | | MainStay VP Unconstrained Bond Portfolio | | The notes to the financial statements are an integral part of,
and should be read in conjunction with, the financial statements. |
| | | | | | | | |
| | | Principal
Amount | | | Value | |
| Convertible Bonds (continued) | |
Biotechnology (continued) | | | | | | | | |
Gilead Sciences, Inc.
1.00%, due 5/1/14 | | $ | 171,000 | | | $ | 568,575 | |
| | | | | | | | |
| | | | | | | 884,522 | |
| | | | | | | | |
Chemicals 0.0%‡ | | | | | | | | |
RPM International, Inc.
2.25%, due 12/15/20 | | | 108,000 | | | | 120,083 | |
| | | | | | | | |
| | |
Coal 0.0%‡ | | | | | | | | |
Alpha Natural Resources, Inc.
2.375%, due 4/15/15 | | | 125,000 | | | | 124,922 | |
| | | | | | | | |
| | |
Commercial Services 0.1% | | | | | | | | |
ServiceSource International, Inc.
1.50%, due 8/1/18 (c) | | | 280,000 | | | | 264,950 | |
| | | | | | | | |
| | |
Computers 0.3% | | | | | | | | |
Cadence Design Systems, Inc.
2.625%, due 6/1/15 | | | 110,000 | | | | 206,731 | |
EMC Corp.
1.75%, due 12/1/13 (e) | | | 396,000 | | | | 619,451 | |
Sandisk Corp.
0.50%, due 10/15/20 (c) | | | 115,000 | | | | 114,425 | |
Spansion LLC
2.00%, due 9/1/20 (c) | | | 170,000 | | | | 199,006 | |
| | | | | | | | |
| | | | | | | 1,139,613 | |
| | | | | | | | |
Distribution & Wholesale 0.1% | | | | | | | | |
WESCO International, Inc.
6.00%, due 9/15/29 | | | 100,000 | | | | 324,375 | |
| | | | | | | | |
| | |
Electronics 0.1% | | | | | | | | |
InvenSense, Inc.
1.75%, due 11/1/18 (c) | | | 175,000 | | | | 204,641 | |
| | | | | | | | |
| | |
Entertainment 0.1% | | | | | | | | |
International Game Technology
3.25%, due 5/1/14 | | | 258,000 | | | | 273,802 | |
| | | | | | | | |
| | |
Environmental Controls 0.1% | | | | | | | | |
Covanta Holding Corp.
3.25%, due 6/1/14 | | | 340,000 | | | | 399,287 | |
| | | | | | | | |
| | |
Health Care—Products 0.1% | | | | | | | | |
Teleflex, Inc.
3.875%, due 8/1/17 | | | 322,000 | | | | 509,565 | |
| | | | | | | | |
| | | | | | | | |
| | | Principal
Amount | | | Value | |
Health Care—Services 0.1% | | | | | | | | |
Wellpoint, Inc.
2.75%, due 10/15/42 | | $ | 160,000 | | | $ | 217,400 | |
| | | | | | | | |
| | |
Home Builders 0.1% | | | | | | | | |
Ryland Group, Inc. (The)
0.25%, due 6/1/19 | | | 385,000 | | | | 361,178 | |
| | | | | | | | |
| | |
Household Products & Wares 0.1% | | | | | | | | |
Jarden Corp.
1.875%, due 9/15/18 | | | 310,000 | | | | 439,425 | |
| | | | | | | | |
| | |
Insurance 0.0%‡ | | | | | | | | |
Radian Group, Inc.
2.25%, due 3/1/19 | | | 76,000 | | | | 111,815 | |
| | | | | | | | |
| | |
Internet 0.2% | | | | | | | | |
priceline.com, Inc.
0.35%, due 6/15/20 (c) | | | 180,000 | | | | 205,987 | |
1.00%, due 3/15/18 | | | 305,000 | | | | 422,044 | |
Shutterfly, Inc.
0.25%, due 5/15/18 (c) | | | 125,000 | | | | 134,297 | |
Yahoo!, Inc.
(zero coupon), due 12/1/18 (c) | | | 200,000 | | | | 207,625 | |
| | | | | | | | |
| | | | | | | 969,953 | |
| | | | | | | | |
Iron & Steel 0.2% | | | | | | | | |
Allegheny Technologies, Inc.
4.25%, due 6/1/14 | | | 405,000 | | | | 420,187 | |
Steel Dynamics, Inc.
5.125%, due 6/15/14 | | | 222,000 | | | | 262,099 | |
United States Steel Corp.
4.00%, due 5/15/14 | | | 182,000 | | | | 195,195 | |
| | | | | | | | |
| | | | | | | 877,481 | |
| | | | | | | | |
Lodging 0.1% | | | | | | | | |
MGM Resorts International
4.25%, due 4/15/15 | | | 170,000 | | | | 234,175 | |
| | | | | | | | |
| | |
Media 0.0%‡ | | | | | | | | |
Liberty Interactive LLC
3.50%, due 1/15/31 | | | 130,000 | | | | 69,388 | |
Liberty Media Corp.
1.375%, due 10/15/23 (c) | | | 130,000 | | | | 130,081 | |
| | | | | | | | |
| | | | | | | 199,469 | |
| | | | | | | | |
Metal Fabricate & Hardware 0.1% | | | | | | | | |
RTI International Metals, Inc.
1.625%, due 10/15/19 | | | 249,000 | | | | 262,851 | |
| | | | | | | | |
| | | | | | |
The notes to the financial statements are an integral part of,
and should be read in conjunction with, the financial statements. | | mainstayinvestments.com | | | M-421 | |
Portfolio of Investments December 31, 2013 (continued)
| | | | | | | | |
| | | Principal
Amount | | | Value | |
| Convertible Bonds (continued) | |
Mining 0.0%‡ | | | | | | | | |
Alcoa, Inc.
5.25%, due 3/15/14 | | $ | 40,000 | | | $ | 66,325 | |
| | | | | | | | |
| | |
Miscellaneous—Manufacturing 0.1% | | | | | | | | |
Danaher Corp.
(zero coupon), due 1/22/21 | | | 266,000 | | | | 597,336 | |
| | | | | | | | |
| | |
Oil & Gas 0.1% | | | | | | | | |
Alon USA Energy, Inc.
3.00%, due 9/15/18 (c) | | | 110,000 | | | | 139,975 | |
Energy XXI Bermuda, Ltd.
3.00%, due 12/15/18 (c) | | | 180,000 | | | | 178,087 | |
| | | | | | | | |
| | | | | | | 318,062 | |
| | | | | | | | |
Oil & Gas Services 0.3% | | | | | | | | |
Helix Energy Solutions Group, Inc.
3.25%, due 3/15/32 | | | 381,000 | | | | 457,438 | |
¨JPMorgan Chase & Co. (Convertible into Schlumberger, Ltd.)
(zero coupon), due 5/5/15 (c)(f) | | | 400,000 | | | | 631,080 | |
SEACOR Holdings, Inc.
2.50%, due 12/15/27 | | | 60,000 | | | | 73,838 | |
Subsea 7 S.A.
3.50%, due 10/13/14 | | | 100,000 | | | | 126,300 | |
| | | | | | | | |
| | | | | | | 1,288,656 | |
| | | | | | | | |
Pharmaceuticals 0.2% | | | | | | | | |
BioMarin Pharmaceutical, Inc.
0.75%, due 10/15/18 | | | 175,000 | | | | 186,266 | |
Salix Pharmaceuticals, Ltd.
1.50%, due 3/15/19 | | | 275,000 | | | | 411,297 | |
Teva Pharmaceutical Finance Co. LLC
0.25%, due 2/1/26 | | | 295,000 | | | | 314,728 | |
| | | | | | | | |
| | | | | | | 912,291 | |
| | | | | | | | |
Real Estate Investment Trusts 0.1% | | | | | | | | |
SL Green Operating Partnership, L.P.
3.00%, due 10/15/17 (c) | | | 250,000 | | | | 312,344 | |
| | | | | | | | |
| | |
Semiconductors 0.3% | | | | | | | | |
Emulex Corp.
1.75%, due 11/15/18 (c) | | | 50,000 | | | | 49,156 | |
Intel Corp.
3.25%, due 8/1/39 | | | 220,000 | | | | 299,476 | |
Microchip Technology, Inc.
2.125%, due 12/15/37 | | | 56,000 | | | | 97,475 | |
Novellus Systems, Inc.
2.625%, due 5/15/41 | | | 255,000 | | | | 427,444 | |
NVIDIA Corp.
1.00%, due 12/1/18 (c) | | | 110,000 | | | | 113,163 | |
| | | | | | | | |
| | | Principal
Amount | | | Value | |
Semiconductors (continued) | | | | | | | | |
Rambus, Inc.
1.125%, due 8/15/18 (c) | | $ | 70,000 | | | $ | 73,631 | |
Xilinx, Inc.
2.625%, due 6/15/17 | | | 15,000 | | | | 24,000 | |
| | | | | | | | |
| | | | | | | 1,084,345 | |
| | | | | | | | |
Software 0.4% | | | | | | | | |
Bottomline Technologies, Inc.
1.50%, due 12/1/17 | | | 165,000 | | | | 221,925 | |
Cornerstone OnDemand, Inc.
1.50%, due 7/1/18 (c) | | | 325,000 | | | | 396,094 | |
Medidata Solutions, Inc.
1.00%, due 8/1/18 (c) | | | 180,000 | | | | 230,512 | |
Netsuite, Inc.
0.25%, due 6/1/18 (c) | | | 75,000 | | | | 83,063 | |
Nuance Communications, Inc.
2.75%, due 11/1/31 | | | 345,000 | | | | 338,747 | |
Proofpoint, Inc.
1.25%, due 12/15/18 (c) | | | 50,000 | | | | 54,156 | |
Salesforce.com, Inc.
0.25%, due 4/1/18 (c) | | | 175,000 | | | | 190,422 | |
ServiceNow, Inc.
(zero coupon), due 11/1/18 (c) | | | 65,000 | | | | 66,097 | |
| | | | | | | | |
| | | | | | | 1,581,016 | |
| | | | | | | | |
Telecommunications 0.2% | | | | | | | | |
Ciena Corp.
4.00%, due 12/15/20 | | | 140,000 | | | | 206,675 | |
Infinera Corp.
1.75%, due 6/1/18 (c) | | | 175,000 | | | | 188,453 | |
JDS Uniphase Corp.
0.625%, due 8/15/33 (c) | | | 260,000 | | | | 261,300 | |
| | | | | | | | |
| | | | | | | 656,428 | |
| | | | | | | | |
Transportation 0.0%‡ | | | | | | | | |
XPO Logistics, Inc.
4.50%, due 10/1/17 | | | 100,000 | | | | 167,812 | |
| | | | | | | | |
Total Convertible Bonds
(Cost $14,288,433) | | | | | | | 15,962,397 | |
| | | | | | | | |
| | |
| Corporate Bonds 75.6% | | | | | | | | |
Advertising 0.5% | | | | | | | | |
Lamar Media Corp.
5.00%, due 5/1/23 | | | 1,200,000 | | | | 1,140,000 | |
7.875%, due 4/15/18 | | | 750,000 | | | | 792,187 | |
| | | | | | | | |
| | | | | | | 1,932,187 | |
| | | | | | | | |
Aerospace & Defense 1.5% | | | | | | | | |
Alliant Techsystems, Inc.
6.875%, due 9/15/20 | | | 1,200,000 | | | | 1,294,500 | |
B/E Aerospace, Inc.
5.25%, due 4/1/22 | | | 1,650,000 | | | | 1,674,750 | |
| | | | |
| M-422 | | MainStay VP Unconstrained Bond Portfolio | | The notes to the financial statements are an integral part of,
and should be read in conjunction with, the financial statements. |
| | | | | | | | |
| | | Principal
Amount | | | Value | |
| Corporate Bonds (continued) | | | | | | | | |
Aerospace & Defense (continued) | | | | | | | | |
Ducommun, Inc.
9.75%, due 7/15/18 | | $ | 520,000 | | | $ | 578,500 | |
TransDigm, Inc.
7.50%, due 7/15/21 | | | 300,000 | | | | 322,500 | |
7.75%, due 12/15/18 | | | 1,075,000 | | | | 1,152,937 | |
Triumph Group, Inc.
8.625%, due 7/15/18 | | | 1,100,000 | | | | 1,188,000 | |
| | | | | | | | |
| | | | | | | 6,211,187 | |
| | | | | | | | |
Airlines 1.2% | | | | | | | | |
Continental Airlines, Inc.
7.875%, due 1/2/20 | | | 281,845 | | | | 303,688 | |
9.798%, due 10/1/22 | | | 653,210 | | | | 736,495 | |
Delta Air Lines, Inc.
Series 2011-1 Class A Pass Through Trust
5.30%, due 10/15/20 | | | 282,224 | | | | 307,624 | |
Series 2010-1 Class A Pass Through Trust
6.20%, due 1/2/20 | | | 76,592 | | | | 85,400 | |
Series 2010-2, Class B Pass Through Trust
6.75%, due 5/23/17 | | | 563,000 | | | | 601,003 | |
U.S. Airways Group, Inc.
Series A
6.25%, due 10/22/24 | | | 964,394 | | | | 1,053,601 | |
U.S. Airways, Inc.
Series 2012-1A, Pass Through Trust
5.90%, due 4/1/26 | | | 1,804,713 | | | | 1,967,137 | |
| | | | | | | | |
| | | | | | | 5,054,948 | |
| | | | | | | | |
Auto Manufacturers 1.5% | | | | | | | | |
¨Chrysler Group LLC / CG Co-Issuer, Inc.
8.25%, due 6/15/21 | | | 2,735,000 | | | | 3,111,062 | |
Ford Motor Co.
6.625%, due 10/1/28 | | | 51,000 | | | | 57,258 | |
7.45%, due 7/16/31 | | | 525,000 | | | | 642,951 | |
8.90%, due 1/15/32 | | | 135,000 | | | | 174,326 | |
9.98%, due 2/15/47 | | | 133,000 | | | | 181,689 | |
Navistar International Corp.
8.25%, due 11/1/21 | | | 1,715,000 | | | | 1,775,025 | |
| | | | | | | | |
| | | | | | | 5,942,311 | |
| | | | | | | | |
Auto Parts & Equipment 2.4% | | | | | | | | |
Continental Rubber of America Corp.
4.50%, due 9/15/19 (c) | | | 1,450,000 | | | | 1,536,710 | |
¨Dana Holding Corp.
5.375%, due 9/15/21 | | | 3,950,000 | | | | 3,964,812 | |
Goodyear Tire & Rubber Co. (The)
8.25%, due 8/15/20 | | | 1,650,000 | | | | 1,843,875 | |
Schaeffler Finance B.V.
4.75%, due 5/15/21 (c) | | | 2,000,000 | | | | 1,995,000 | |
| | | | | | | | |
| | | Principal
Amount | | | Value | |
Auto Parts & Equipment (continued) | | | | | | | | |
Tomkins LLC / Tomkins, Inc.
9.00%, due 10/1/18 | | $ | 187,000 | | | $ | 204,765 | |
| | | | | | | | |
| | | | | | | 9,545,162 | |
| | | | | | | | |
Banks 8.5% | | | | | | | | |
Banco de Bogota S.A.
5.375%, due 2/19/23 (c) | | | 1,600,000 | | | | 1,568,000 | |
Banco Do Brasil S.A.
5.875%, due 1/19/23 (c) | | | 1,500,000 | | | | 1,402,500 | |
Banco Santander Mexico S.A.
4.125%, due 11/9/22 (c) | | | 1,715,000 | | | | 1,616,387 | |
¨Bank of America Corp.
4.75%, due 5/6/19 (a) | | € | 1,000,000 | | | | 1,376,731 | |
5.625%, due 7/1/20 | | $ | 1,910,000 | | | | 2,182,582 | |
7.625%, due 6/1/19 | | | 95,000 | | | | 117,831 | |
Bank of America N.A.
6.00%, due 10/15/36 | | | 1,212,000 | | | | 1,390,962 | |
Barclays Bank PLC
5.14%, due 10/14/20 | | | 463,000 | | | | 493,036 | |
BBVA Bancomer S.A.
6.75%, due 9/30/22 (c) | | | 1,510,000 | | | | 1,608,150 | |
CIT Group, Inc.
4.25%, due 8/15/17 | | | 600,000 | | | | 624,750 | |
Citigroup, Inc.
3.375%, due 3/1/23 | | | 1,225,000 | | | | 1,164,381 | |
Discover Bank / Greenwood
7.00%, due 4/15/20 | | | 1,055,000 | | | | 1,226,951 | |
8.70%, due 11/18/19 | | | 420,000 | | | | 525,258 | |
Goldman Sachs Group, Inc. (The)
3.625%, due 1/22/23 | | | 2,813,000 | | | | 2,723,977 | |
¨JPMorgan Chase & Co.
7.90%, due 4/29/49 (a) | | | 2,500,000 | | | | 2,756,250 | |
LBG Capital No.1 PLC
8.00%, due 12/29/49 (a)(c) | | | 2,349,000 | | | | 2,508,135 | |
Mellon Capital III
6.369%, due 9/5/66 (a) | | £ | 1,400,000 | | | | 2,341,513 | |
Mizuho Capital Investment, Ltd.
14.95%, due 12/29/49 (a)(c) | | $ | 248,000 | | | | 263,250 | |
¨Morgan Stanley
4.875%, due 11/1/22 | | | 1,931,000 | | | | 1,976,689 | |
5.00%, due 11/24/25 | | | 1,450,000 | | | | 1,454,336 | |
RBS Citizens Financial Group, Inc.
4.15%, due 9/28/22 (c) | | | 1,450,000 | | | | 1,402,823 | |
Royal Bank of Scotland Group PLC
6.40%, due 10/21/19 | | | 1,194,000 | | | | 1,375,876 | |
UT2 Funding PLC
5.321%, due 6/30/16 (a) | | € | 1,600,000 | | | | 2,190,113 | |
| | | | | | | | |
| | | | | | | 34,290,481 | |
| | | | | | | | |
Beverages 0.2% | | | | | | | | |
Embotelladora Andina S.A.
5.00%, due 10/1/23 (c) | | $ | 950,000 | | | | 953,145 | |
| | | | | | | | |
| | | | | | |
The notes to the financial statements are an integral part of,
and should be read in conjunction with, the financial statements. | | mainstayinvestments.com | | | M-423 | |
Portfolio of Investments December 31, 2013 (continued)
| | | | | | | | |
| | | Principal
Amount | | | Value | |
| Corporate Bonds (continued) | | | | | | | | |
Building Materials 1.6% | | | | | | | | |
Associated Materials LLC / AMH New Finance, Inc.
9.125%, due 11/1/17 | | $ | 1,252,000 | | | $ | 1,336,510 | |
Cemex Espana Luxembourg
9.25%, due 5/12/20 (c) | | | 1,400,000 | | | | 1,536,500 | |
Masco Corp.
7.125%, due 3/15/20 | | | 1,100,000 | | | | 1,255,660 | |
Texas Industries, Inc.
9.25%, due 8/15/20 | | | 615,000 | | | | 684,956 | |
USG Corp.
6.30%, due 11/15/16 | | | 280,000 | | | | 300,300 | |
8.375%, due 10/15/18 (c) | | | 500,000 | | | | 543,750 | |
9.75%, due 1/15/18 | | | 582,000 | | | | 688,215 | |
| | | | | | | | |
| | | | | | | 6,345,891 | |
| | | | | | | | |
Chemicals 1.2% | | | | | | | | |
Ashland, Inc.
4.75%, due 8/15/22 | | | 950,000 | | | | 902,500 | |
Dow Chemical Co. (The)
8.55%, due 5/15/19 | | | 596,000 | | | | 769,551 | |
Hexion U.S. Finance Corp. / Hexion Nova Scotia Finance ULC
8.875%, due 2/1/18 | | | 877,000 | | | | 910,984 | |
Huntsman International LLC
8.625%, due 3/15/21 | | | 2,040,000 | | | | 2,305,200 | |
| | | | | | | | |
| | | | | | | 4,888,235 | |
| | | | | | | | |
Coal 0.4% | | | | | | | | |
Alpha Natural Resources, Inc.
6.00%, due 6/1/19 | | | 575,000 | | | | 495,938 | |
Cloud Peak Energy Resources LLC / Cloud Peak Energy Finance Corp.
8.25%, due 12/15/17 | | | 763,000 | | | | 796,381 | |
Peabody Energy Corp.
7.375%, due 11/1/16 | | | 475,000 | | | | 534,375 | |
| | | | | | | | |
| | | | | | | 1,826,694 | |
| | | | | | | | |
Commercial Services 2.4% | | | | | | | | |
Avis Budget Car Rental LLC / Avis Budget Finance, Inc.
5.50%, due 4/1/23 | | | 2,020,000 | | | | 1,956,875 | |
8.25%, due 1/15/19 | | | 677,000 | | | | 737,930 | |
Hertz Corp. (The)
6.25%, due 10/15/22 | | | 1,245,000 | | | | 1,285,462 | |
7.375%, due 1/15/21 | | | 1,570,000 | | | | 1,723,075 | |
Iron Mountain, Inc.
6.00%, due 8/15/23 | | | 600,000 | | | | 615,000 | |
7.75%, due 10/1/19 | | | 322,000 | | | | 359,030 | |
8.375%, due 8/15/21 | | | 1,077,000 | | | | 1,160,468 | |
| | | | | | | | |
| | | Principal
Amount | | | Value | |
Commercial Services (continued) | | | | | | | | |
United Rentals North America, Inc.
8.375%, due 9/15/20 | | $ | 1,548,000 | | | $ | 1,726,020 | |
| | | | | | | | |
| | | | | | | 9,563,860 | |
| | | | | | | | |
Computers 0.7% | | | | | | | | |
NCR Corp.
5.00%, due 7/15/22 | | | 2,075,000 | | | | 1,973,844 | |
SunGard Data Systems, Inc.
6.625%, due 11/1/19 | | | 550,000 | | | | 577,500 | |
7.625%, due 11/15/20 | | | 325,000 | | | | 354,250 | |
| | | | | | | | |
| | | | | | | 2,905,594 | |
| | | | | | | | |
Cosmetics & Personal Care 0.5% | | | | | | | | |
Albea Beauty Holdings S.A.
8.375%, due 11/1/19 (c) | | | 1,900,000 | | | | 1,976,000 | |
| | | | | | | | |
| | |
Diversified Financial Services 0.3% | | | | | | | | |
Ford Holdings LLC
9.30%, due 3/1/30 | | | 294,000 | | | | 399,252 | |
GE Capital Trust IV
Series Reg S
4.625%, due 9/15/66 (a) | | € | 277,000 | | | | 389,643 | |
General Electric Capital Corp.
Series Reg S
6.50%, due 9/15/67 (a) | | £ | 185,000 | | | | 329,756 | |
| | | | | | | | |
| | | | | | | 1,118,651 | |
| | | | | | | | |
Electric 2.3% | | | | | | | | |
Abu Dhabi National Energy Co.
3.625%, due 1/12/23 (c) | | $ | 1,600,000 | | | | 1,488,000 | |
Calpine Corp.
7.875%, due 7/31/20 (c) | | | 1,200,000 | | | | 1,314,000 | |
Duquesne Light Holdings, Inc.
5.90%, due 12/1/21 (c) | | | 1,494,000 | | | | 1,641,689 | |
Great Plains Energy, Inc.
4.85%, due 6/1/21 | | | 1,455,000 | | | | 1,533,046 | |
5.292%, due 6/15/22 (d) | | | 795,000 | | | | 852,940 | |
NRG Energy, Inc.
8.50%, due 6/15/19 | | | 1,405,000 | | | | 1,499,838 | |
Puget Energy, Inc.
5.625%, due 7/15/22 | | | 585,000 | | | | 636,190 | |
Wisconsin Energy Corp.
6.25%, due 5/15/67 (a) | | | 189,000 | | | | 194,906 | |
| | | | | | | | |
| | | | | | | 9,160,609 | |
| | | | | | | | |
Engineering & Construction 0.3% | | | | | | | | |
MasTec, Inc.
4.875%, due 3/15/23 | | | 1,190,000 | | | | 1,124,550 | |
| | | | | | | | |
| | |
Entertainment 0.9% | | | | | | | | |
Isle of Capri Casinos, Inc.
7.75%, due 3/15/19 | | | 1,031,000 | | | | 1,116,057 | |
| | | | |
| M-424 | | MainStay VP Unconstrained Bond Portfolio | | The notes to the financial statements are an integral part of,
and should be read in conjunction with, the financial statements. |
| | | | | | | | |
| | | Principal
Amount | | | Value | |
| Corporate Bonds (continued) | | | | | | | | |
Entertainment (continued) | | | | | | | | |
Mohegan Tribal Gaming Authority
9.75%, due 9/1/21 (c) | | $ | 1,321,000 | | | $ | 1,423,377 | |
Pinnacle Entertainment, Inc.
8.75%, due 5/15/20 | | | 975,000 | | | | 1,074,938 | |
| | | | | | | | |
| | | | | | | 3,614,372 | |
| | | | | | | | |
Finance—Auto Loans 0.8% | | | | | | | | |
Banque PSA Finance S.A.
5.75%, due 4/4/21 (c) | | | 1,225,000 | | | | 1,232,019 | |
Ford Motor Credit Co. LLC
8.125%, due 1/15/20 | | | 1,584,000 | | | | 1,980,713 | |
General Motors Financial Co., Inc.
3.25%, due 5/15/18 (c) | | | 216,000 | | | | 216,000 | |
| | | | | | | | |
| | | | | | | 3,428,732 | |
| | | | | | | | |
Finance—Consumer Loans 1.5% | | | | | | | | |
HSBC Finance Capital Trust IX
5.911%, due 11/30/35 (a) | | | 2,350,000 | | | | 2,420,500 | |
SLM Corp.
4.75%, due 3/17/14 | | € | 185,000 | | | | 255,827 | |
6.25%, due 1/25/16 | | $ | 92,000 | | | | 99,360 | |
7.25%, due 1/25/22 | | | 625,000 | | | | 660,938 | |
8.00%, due 3/25/20 | | | 492,000 | | | | 557,190 | |
8.45%, due 6/15/18 | | | 250,000 | | | | 291,250 | |
Springleaf Finance Corp.
6.00%, due 6/1/20 | | | 1,000,000 | | | | 1,000,000 | |
7.75%, due 10/1/21 | | | 765,000 | | | | 826,200 | |
| | | | | | | | |
| | | | | | | 6,111,265 | |
| | | | | | | | |
Finance—Credit Card 0.2% | | | | | | | | |
American Express Co.
6.80%, due 9/1/66 (a) | | | 486,000 | | | | 517,833 | |
Discover Financial Services
3.85%, due 11/21/22 | | | 300,000 | | | | 284,451 | |
| | | | | | | | |
| | | | | | | 802,284 | |
| | | | | | | | |
Finance—Investment Banker/Broker 0.3% | |
Jefferies Group LLC
5.125%, due 1/20/23 | | | 552,000 | | | | 558,329 | |
6.45%, due 6/8/27 | | | 750,000 | | | | 779,303 | |
| | | | | | | | |
| | | | | | | 1,337,632 | |
| | | | | | | | |
Finance—Other Services 0.4% | | | | | | | | |
Icahn Enterprises, L.P. / Icahn Enterprises Finance Corp.
7.75%, due 1/15/16 | | | 1,420,000 | | | | 1,448,400 | |
| | | | | | | | |
| | |
Food 2.9% | | | | | | | | |
ARAMARK Corp.
5.75%, due 3/15/20 (c) | | | 2,575,000 | | | | 2,690,875 | |
Grupo Bimbo S.A.B. de C.V.
4.50%, due 1/25/22 (c) | | | 1,387,000 | | | | 1,375,335 | |
| | | | | | | | |
| | | Principal
Amount | | | Value | |
Food (continued) | | | | | | | | |
JBS Finance II, Ltd.
8.25%, due 1/29/18 (c) | | $ | 350,000 | | | $ | 367,500 | |
JBS USA LLC / JBS USA Finance, Inc.
8.25%, due 2/1/20 (c) | | | 1,182,000 | | | | 1,282,470 | |
Kerry Group Financial Services
3.20%, due 4/9/23 (c) | | | 2,151,000 | | | | 1,947,664 | |
Minerva Luxembourg S.A.
7.75%, due 1/31/23 (c) | | | 1,600,000 | | | | 1,588,000 | |
Smithfield Foods, Inc.
6.625%, due 8/15/22 | | | 490,000 | | | | 519,400 | |
7.75%, due 7/1/17 | | | 794,000 | | | | 930,965 | |
Virgolino de Oliveira Finance, Ltd.
11.75%, due 2/9/22 (c) | | | 1,775,000 | | | | 1,207,000 | |
| | | | | | | | |
| | | | | | | 11,909,209 | |
| | | | | | | | |
Forest Products & Paper 1.3% | | | | | | | | |
Domtar Corp.
10.75%, due 6/1/17 | | | 887,000 | | | | 1,107,081 | |
Georgia-Pacific LLC
8.00%, due 1/15/24 | | | 2,180,000 | | | | 2,805,741 | |
International Paper Co.
7.30%, due 11/15/39 | | | 157,000 | | | | 193,851 | |
MeadWestvaco Corp.
7.375%, due 9/1/19 | | | 900,000 | | | | 1,068,178 | |
Norske Skogindustrier A.S.A.
7.125%, due 10/15/33 (c) | | | 185,000 | | | | 91,575 | |
| | | | | | | | |
| | | | | | | 5,266,426 | |
| | | | | | | | |
Health Care—Products 1.0% | | | | | | | | |
Alere, Inc.
7.25%, due 7/1/18 | | | 1,000,000 | | | | 1,098,750 | |
8.625%, due 10/1/18 | | | 277,000 | | | | 299,160 | |
Kinetic Concepts, Inc. / KCI U.S.A., Inc.
10.50%, due 11/1/18 | | | 2,300,000 | | | | 2,645,000 | |
| | | | | | | | |
| | | | | | | 4,042,910 | |
| | | | | | | | |
Health Care—Services 2.3% | | | | | | | | |
CHS / Community Health Systems, Inc.
5.125%, due 8/15/18 | | | 2,000,000 | | | | 2,065,000 | |
DaVita HealthCare Partners, Inc.
5.75%, due 8/15/22 | | | 2,525,000 | | | | 2,556,562 | |
HCA, Inc.
5.875%, due 3/15/22 | | | 1,000,000 | | | | 1,032,500 | |
7.50%, due 2/15/22 | | | 1,350,000 | | | | 1,481,625 | |
Tenet Healthcare Corp.
6.00%, due 10/1/20 (c) | | | 2,150,000 | | | | 2,244,063 | |
| | | | | | | | |
| | | | | | | 9,379,750 | |
| | | | | | | | |
Home Builders 2.4% | | | | | | | | |
Beazer Homes USA, Inc.
7.25%, due 2/1/23 | | | 1,300,000 | | | | 1,300,000 | |
8.125%, due 6/15/16 | | | 186,000 | | | | 207,390 | |
| | | | | | |
The notes to the financial statements are an integral part of,
and should be read in conjunction with, the financial statements. | | mainstayinvestments.com | | | M-425 | |
Portfolio of Investments December 31, 2013 (continued)
| | | | | | | | |
| | | Principal
Amount | | | Value | |
| Corporate Bonds (continued) | | | | | | | | |
Home Builders (continued) | | | | | | | | |
K Hovnanian Enterprises, Inc.
7.25%, due 10/15/20 (c) | | $ | 1,080,000 | | | $ | 1,159,650 | |
KB Home
8.00%, due 3/15/20 | | | 1,925,000 | | | | 2,127,125 | |
Lennar Corp.
6.95%, due 6/1/18 | | | 46,000 | | | | 51,750 | |
MDC Holdings, Inc.
5.625%, due 2/1/20 | | | 1,072,000 | | | | 1,122,920 | |
Shea Homes, L.P. / Shea Homes Funding Corp.
8.625%, due 5/15/19 | | | 1,320,000 | | | | 1,461,900 | |
Standard Pacific Corp.
8.375%, due 5/15/18 | | | 885,000 | | | | 1,039,875 | |
8.375%, due 1/15/21 | | | 1,100,000 | | | | 1,281,500 | |
| | | | | | | | |
| | | | | | | 9,752,110 | |
| | | | | | | | |
Household Products & Wares 0.8% | | | | | | | | |
Jarden Corp.
7.50%, due 1/15/20 | | | 977,000 | | | | 1,055,160 | |
Reynolds Group Issuer, Inc. / Reynolds Group Issuer LLC / Reynolds Group Issuer (Luxembourg) S.A. | | | | | | | | |
7.875%, due 8/15/19 | | | 475,000 | | | | 524,875 | |
8.50%, due 5/15/18 | | | 625,000 | | | | 659,375 | |
9.875%, due 8/15/19 | | | 826,000 | | | | 918,925 | |
| | | | | | | | |
| | | | | | | 3,158,335 | |
| | | | | | | | |
Insurance 5.0% | | | | | | | | |
Allstate Corp. (The)
6.50%, due 5/15/67 (a) | | | 162,000 | | | | 168,561 | |
¨American International Group, Inc. | | | | | | | | |
4.875%, due 3/15/67 (a) | | € | 2,000,000 | | | | 2,723,885 | |
Series A2
5.75%, due 3/15/67 (a) | | £ | 450,000 | | | | 734,894 | |
Chubb Corp. (The)
6.375%, due 3/29/67 (a) | | $ | 1,295,000 | | | | 1,401,837 | |
Genworth Holdings, Inc.
7.20%, due 2/15/21 | | | 450,000 | | | | 522,546 | |
7.625%, due 9/24/21 | | | 1,840,000 | | | | 2,189,589 | |
ING US, Inc.
2.90%, due 2/15/18 | | | 495,000 | | | | 506,279 | |
5.50%, due 7/15/22 | | | 1,670,000 | | | | 1,816,112 | |
Liberty Mutual Group, Inc.
7.00%, due 3/7/67 (a)(c) | | | 800,000 | | | | 824,000 | |
7.80%, due 3/7/87 (c) | | | 102,000 | | | | 109,650 | |
10.75%, due 6/15/88 (a)(c) | | | 987,000 | | | | 1,475,565 | |
Lincoln National Corp.
7.00%, due 5/17/66 (a) | | | 1,468,000 | | | | 1,495,525 | |
Oil Insurance, Ltd.
3.229%, due 12/29/49 (a)(c) | | | 1,648,000 | | | | 1,441,252 | |
| | | | | | | | |
| | | Principal
Amount | | | Value | |
Insurance (continued) | | | | | | | | |
Pacific Life Insurance Co.
9.25%, due 6/15/39 (c) | | $ | 1,046,000 | | | $ | 1,452,592 | |
Progressive Corp. (The)
6.70%, due 6/15/67 (a) | | | 138,000 | | | | 149,040 | |
Protective Life Corp.
8.45%, due 10/15/39 | | | 364,000 | | | | 463,350 | |
Prudential Financial, Inc.
5.625%, due 6/15/43 (a) | | | 1,245,000 | | | | 1,220,100 | |
Swiss Re Capital I, L.P.
6.854%, due 5/29/49 (a)(c) | | | 129,000 | | | | 136,353 | |
XL Group PLC
6.50%, due 12/29/49 (a) | | | 1,516,000 | | | | 1,491,365 | |
| | | | | | | | |
| | | | | | | 20,322,495 | |
| | | | | | | | |
Iron & Steel 1.9% | | | | | | | | |
AK Steel Corp.
7.625%, due 5/15/20 | | | 800,000 | | | | 798,000 | |
8.75%, due 12/1/18 | | | 1,000,000 | | | | 1,117,500 | |
Allegheny Ludlum Corp.
6.95%, due 12/15/25 | | | 157,000 | | | | 166,750 | |
APERAM
7.375%, due 4/1/16 (c) | | | 1,025,000 | | | | 1,053,188 | |
ArcelorMittal
6.75%, due 2/25/22 | | | 1,575,000 | | | | 1,712,812 | |
Cliffs Natural Resources, Inc.
3.95%, due 1/15/18 | | | 524,000 | | | | 529,133 | |
5.90%, due 3/15/20 | | | 760,000 | | | | 801,988 | |
Severstal Oao Via Steel Capital S.A.
5.90%, due 10/17/22 (c) | | | 1,600,000 | | | | 1,546,000 | |
| | | | | | | | |
| | | | | | | 7,725,371 | |
| | | | | | | | |
Leisure Time 0.2% | | | | | | | | |
Royal Caribbean Cruises, Ltd.
7.25%, due 3/15/18 | | | 600,000 | | | | 690,000 | |
| | | | | | | | |
| | |
Lodging 1.6% | | | | | | | | |
¨Caesars Entertainment Operating Co., Inc.
9.00%, due 2/15/20 | | | 1,987,000 | | | | 1,932,358 | |
MGM Resorts International
6.75%, due 10/1/20 | | | 1,194,000 | | | | 1,277,580 | |
8.625%, due 2/1/19 | | | 475,000 | | | | 556,938 | |
Starwood Hotels & Resorts Worldwide, Inc.
6.75%, due 5/15/18 | | | 185,000 | | | | 214,121 | |
7.15%, due 12/1/19 | | | 1,334,000 | | | | 1,593,000 | |
Wynn Las Vegas LLC / Wynn Las Vegas Capital Corp.
7.75%, due 8/15/20 | | | 900,000 | | | | 1,010,250 | |
| | | | | | | | |
| | | | | | | 6,584,247 | |
| | | | | | | | |
Machinery—Diversified 0.2% | | | | | | | | |
Briggs & Stratton Corp.
6.875%, due 12/15/20 | | | 800,000 | | | | 879,000 | |
| | | | | | | | |
| | | | |
| M-426 | | MainStay VP Unconstrained Bond Portfolio | | The notes to the financial statements are an integral part of,
and should be read in conjunction with, the financial statements. |
| | | | | | | | |
| | | Principal
Amount | | | Value | |
| Corporate Bonds (continued) | | | | | | | | |
Media 2.1% | | | | | | | | |
CCO Holdings LLC / CCO Holdings Capital Corp.
7.00%, due 1/15/19 | | $ | 222,000 | | | $ | 233,932 | |
7.25%, due 10/30/17 | | | 500,000 | | | | 529,375 | |
¨Clear Channel Communications, Inc. | | | | | | | | |
5.50%, due 12/15/16 | | | 1,095,000 | | | | 963,600 | |
9.00%, due 3/1/21 | | | 2,145,000 | | | | 2,166,450 | |
Clear Channel Worldwide Holdings, Inc.
7.625%, due 3/15/20 | | | 1,492,000 | | | | 1,568,465 | |
COX Communications, Inc.
6.95%, due 6/1/38 (c) | | | 509,000 | | | | 533,924 | |
DISH DBS Corp.
6.75%, due 6/1/21 | | | 1,400,000 | | | | 1,484,000 | |
7.125%, due 2/1/16 | | | 185,000 | | | | 204,888 | |
Time Warner Cable, Inc.
8.75%, due 2/14/19 | | | 740,000 | | | | 882,703 | |
| | | | | | | | |
| | | | | | | 8,567,337 | |
| | | | | | | | |
Metal Fabricate & Hardware 0.1% | | | | | | | | |
Mueller Water Products, Inc.
8.75%, due 9/1/20 | | | 406,000 | | | | 454,720 | |
| | | | | | | | |
| | |
Mining 2.1% | | | | | | | | |
Aleris International, Inc.
7.625%, due 2/15/18 | | | 545,000 | | | | 576,338 | |
7.875%, due 11/1/20 | | | 621,000 | | | | 659,812 | |
FMG Resources August 2006 Pty, Ltd.
6.875%, due 2/1/18 (c) | | | 400,000 | | | | 421,000 | |
8.25%, due 11/1/19 (c) | | | 1,665,000 | | | | 1,868,962 | |
Novelis, Inc.
8.375%, due 12/15/17 | | | 766,000 | | | | 817,705 | |
8.75%, due 12/15/20 | | | 1,302,000 | | | | 1,448,475 | |
Rio Tinto Finance USA, Ltd.
9.00%, due 5/1/19 | | | 1,000,000 | | | | 1,305,622 | |
Vedanta Resources PLC
8.25%, due 6/7/21 (c) | | | 1,420,000 | | | | 1,425,325 | |
| | | | | | | | |
| | | | | | | 8,523,239 | |
| | | | | | | | |
Miscellaneous—Manufacturing 0.2% | | | | | | | | |
GE Capital Trust I
6.375%, due 11/15/67 (a) | | | 475,000 | | | | 513,000 | |
Polypore International, Inc.
7.50%, due 11/15/17 | | | 118,000 | | | | 124,785 | |
| | | | | | | | |
| | | | | | | 637,785 | |
| | | | | | | | |
Office Furnishings 0.3% | | | | | | | | |
Interface, Inc.
7.625%, due 12/1/18 | | | 1,048,000 | | | | 1,126,600 | |
| | | | | | | | |
| | | | | | | | |
| | | Principal
Amount | | | Value | |
Oil & Gas 5.9% | | | | | | | | |
Berry Petroleum Co.
6.75%, due 11/1/20 | | $ | 752,000 | | | $ | 780,200 | |
Chesapeake Energy Corp.
5.375%, due 6/15/21 | | | 650,000 | | | | 672,750 | |
6.625%, due 8/15/20 | | | 1,055,000 | | | | 1,178,963 | |
Concho Resources, Inc.
5.50%, due 4/1/23 | | | 700,000 | | | | 721,000 | |
6.50%, due 1/15/22 | | | 500,000 | | | | 541,250 | |
7.00%, due 1/15/21 | | | 623,000 | | | | 685,300 | |
Denbury Resources, Inc.
6.375%, due 8/15/21 | | | 2,035,000 | | | | 2,167,275 | |
8.25%, due 2/15/20 | | | 525,000 | | | | 578,156 | |
ENI S.p.A.
4.15%, due 10/1/20 (c) | | | 1,280,000 | | | | 1,304,404 | |
EP Energy LLC / EP Energy Finance, Inc.
9.375%, due 5/1/20 | | | 1,325,000 | | | | 1,528,719 | |
Frontier Oil Corp.
6.875%, due 11/15/18 | | | 129,000 | | | | 139,159 | |
Hilcorp Energy I, L.P. / Hilcorp Finance Co.
7.625%, due 4/15/21 (c) | | | 277,000 | | | | 300,545 | |
8.00%, due 2/15/20 (c) | | | 700,000 | | | | 757,750 | |
Linn Energy LLC / Linn Energy Finance Corp.
6.50%, due 5/15/19 | | | 850,000 | | | | 867,000 | |
7.75%, due 2/1/21 | | | 185,000 | | | | 195,638 | |
8.625%, due 4/15/20 | | | 425,000 | | | | 459,000 | |
Murphy Oil USA, Inc.
6.00%, due 8/15/23 (c) | | | 1,898,000 | | | | 1,907,490 | |
Petrobras International Finance Co.
5.375%, due 1/27/21 | | | 1,165,000 | | | | 1,156,132 | |
Plains Exploration & Production Co.
6.75%, due 2/1/22 | | | 1,875,000 | | | | 2,065,357 | |
Precision Drilling Corp.
6.50%, due 12/15/21 | | | 487,000 | | | | 518,655 | |
6.625%, due 11/15/20 | | | 882,000 | | | | 941,535 | |
Samson Investment Co.
10.50%, due 2/15/20 (c) | | | 1,300,000 | | | | 1,417,000 | |
SM Energy Co.
5.00%, due 1/15/24 (c) | | | 1,300,000 | | | | 1,238,250 | |
Swift Energy Co.
7.125%, due 6/1/17 | | | 500,000 | | | | 510,000 | |
8.875%, due 1/15/20 | | | 1,042,000 | | | | 1,083,680 | |
| | | | | | | | |
| | | | | | | 23,715,208 | |
| | | | | | | | |
Oil & Gas Services 1.5% | | | | | | | | |
Basic Energy Services, Inc.
7.75%, due 2/15/19 | | | 2,070,000 | | | | 2,163,150 | |
CGG
6.50%, due 6/1/21 | | | 200,000 | | | | 205,000 | |
9.50%, due 5/15/16 | | | 385,000 | | | | 405,213 | |
| | | | | | |
The notes to the financial statements are an integral part of,
and should be read in conjunction with, the financial statements. | | mainstayinvestments.com | | | M-427 | |
Portfolio of Investments December 31, 2013 (continued)
| | | | | | | | |
| | | Principal
Amount | | | Value | |
| Corporate Bonds (continued) | | | | | | | | |
Oil & Gas Services (continued) | | | | | | | | |
Dresser-Rand Group, Inc.
6.50%, due 5/1/21 | | $ | 293,000 | | | $ | 312,045 | |
¨Hornbeck Offshore Services, Inc. | | | | | | | | |
5.00%, due 3/1/21 | | | 2,525,000 | | | | 2,474,500 | |
5.875%, due 4/1/20 | | | 659,000 | | | | 680,417 | |
| | | | | | | | |
| | | | | | | 6,240,325 | |
| | | | | | | | |
Packaging & Containers 0.4% | | | | | | | | |
Sealed Air Corp.
8.125%, due 9/15/19 (c) | | | 935,000 | | | | 1,049,538 | |
8.375%, due 9/15/21 (c) | | | 500,000 | | | | 567,500 | |
| | | | | | | | |
| | | | | | | 1,617,038 | |
| | | | | | | | |
Pharmaceuticals 0.4% | | | | | | | | |
VPII Escrow Corp.
7.50%, due 7/15/21 (c) | | | 1,500,000 | | | | 1,646,250 | |
| | | | | | | | |
| | |
Pipelines 3.7% | | | | | | | | |
Access Midstream Partners, L.P. / ACMP Finance Corp.
4.875%, due 5/15/23 | | | 490,000 | | | | 472,850 | |
5.875%, due 4/15/21 | | | 2,475,000 | | | | 2,635,875 | |
Atlas Pipeline Partners, L.P. / Atlas Pipeline Finance Corp.
4.75%, due 11/15/21 (c) | | | 850,000 | | | | 777,750 | |
6.625%, due 10/1/20 | | | 1,350,000 | | | | 1,410,750 | |
Energy Transfer Equity, L.P.
7.50%, due 10/15/20 | | | 1,100,000 | | | | 1,234,750 | |
Energy Transfer Partners, L.P.
4.65%, due 6/1/21 | | | 860,000 | | | | 884,632 | |
7.60%, due 2/1/24 | | | 383,000 | | | | 455,782 | |
MarkWest Energy Partners, L.P. / MarkWest Energy Finance Corp.
6.75%, due 11/1/20 | | | 752,000 | | | | 815,920 | |
Panhandle Eastern Pipe Line Co., L.P.
8.125%, due 6/1/19 | | | 463,000 | | | | 555,423 | |
Regency Energy Partners, L.P. / Regency Energy Finance Corp.
6.875%, due 12/1/18 | | | 1,050,000 | | | | 1,126,125 | |
Spectra Energy Partners, L.P.
4.75%, due 3/15/24 | | | 818,000 | | | | 833,872 | |
Targa Resources Partners, L.P. / Targa Resources Partners Finance Corp. | | | | | | | | |
5.25%, due 5/1/23 | | | 950,000 | | | | 920,312 | |
6.375%, due 8/1/22 | | | 861,000 | | | | 910,507 | |
7.875%, due 10/15/18 | | | 800,000 | | | | 860,000 | |
Williams Cos., Inc. (The)
3.70%, due 1/15/23 | | | 1,350,000 | | | | 1,178,291 | |
| | | | | | | | |
| | | | | | | 15,072,839 | |
| | | | | | | | |
| | | | | | | | |
| | | Principal
Amount | | | Value | |
Real Estate Investment Trusts 0.7% | | | | | | | | |
Geo Group, Inc. (The)
6.625%, due 2/15/21 | | $ | 277,000 | | | $ | 292,927 | |
Host Hotels & Resorts, L.P.
3.75%, due 10/15/23 | | | 329,000 | | | | 305,043 | |
5.875%, due 6/15/19 | | | 1,200,000 | | | | 1,302,304 | |
Ventas Realty, L.P. / Ventas Capital Corp.
2.70%, due 4/1/20 | | | 991,000 | | | | 947,595 | |
| | | | | | | | |
| | | | | | | 2,847,869 | |
| | | | | | | | |
Retail 1.7% | | | | | | | | |
AmeriGas Finance LLC / AmeriGas Finance Corp.
7.00%, due 5/20/22 | | | 950,000 | | | | 1,030,750 | |
AmeriGas Partners, L.P. / AmeriGas Finance Corp.
6.25%, due 8/20/19 | | | 1,360,000 | | | | 1,462,000 | |
6.50%, due 5/20/21 | | | 168,000 | | | | 179,340 | |
AutoNation, Inc.
6.75%, due 4/15/18 | | | 830,000 | | | | 960,725 | |
CVS Caremark Corp.
4.75%, due 5/18/20 | | | 1,305,000 | | | | 1,425,825 | |
Macy’s Retail Holdings, Inc.
3.875%, due 1/15/22 | | | 1,300,000 | | | | 1,281,381 | |
Suburban Propane Partners, L.P. / Suburban Energy Finance Corp.
7.50%, due 10/1/18 | | | 428,000 | | | | 459,030 | |
| | | | | | | | |
| | | | | | | 6,799,051 | |
| | | | | | | | |
Semiconductors 0.2% | | | | | | | | |
Freescale Semiconductor, Inc.
5.00%, due 5/15/21 (c) | | | 325,000 | | | | 316,063 | |
6.00%, due 1/15/22 (c) | | | 659,000 | | | | 667,237 | |
| | | | | | | | |
| | | | | | | 983,300 | |
| | | | | | | | |
Software 1.2% | | | | | | | | |
Fidelity National Information Services, Inc.
7.875%, due 7/15/20 | | | 1,014,000 | | | | 1,106,233 | |
¨First Data Corp. | | | | | | | | |
7.375%, due 6/15/19 (c) | | | 2,042,000 | | | | 2,179,835 | |
8.875%, due 8/15/20 (c) | | | 320,000 | | | | 354,000 | |
10.625%, due 6/15/21 (c) | | | 1,199,000 | | | | 1,299,416 | |
| | | | | | | | |
| | | | | | | 4,939,484 | |
| | | | | | | | |
Telecommunications 4.6% | | | | | | | | |
CC Holdings GS V LLC / Crown Castle GS III Corp.
2.381%, due 12/15/17 | | | 1,523,000 | | | | 1,508,504 | |
CommScope Holding Co., Inc.
6.625%, due 6/1/20 (c)(g) | | | 1,000,000 | | | | 1,040,000 | |
CommScope, Inc.
8.25%, due 1/15/19 (c) | | | 1,261,000 | | | | 1,382,371 | |
GTP Towers Issuer LLC
8.112%, due 2/15/15 (c) | | | 1,100,000 | | | | 1,129,993 | |
| | | | |
| M-428 | | MainStay VP Unconstrained Bond Portfolio | | The notes to the financial statements are an integral part of,
and should be read in conjunction with, the financial statements. |
| | | | | | | | |
| | | Principal
Amount | | | Value | |
| Corporate Bonds (continued) | | | | | | | | |
Telecommunications (continued) | | | | | | | | |
Hughes Satellite Systems Corp.
6.50%, due 6/15/19 | | $ | 250,000 | | | $ | 270,625 | |
7.625%, due 6/15/21 | | | 1,398,000 | | | | 1,558,770 | |
Intelsat Luxembourg S.A.
7.75%, due 6/1/21 (c) | | | 779,000 | | | | 835,477 | |
8.125%, due 6/1/23 (c) | | | 472,000 | | | | 506,220 | |
MetroPCS Wireless, Inc.
7.875%, due 9/1/18 | | | 314,000 | | | | 337,158 | |
SBA Tower Trust
4.254%, due 4/15/40 (c) | | | 1,420,000 | | | | 1,437,736 | |
Sprint Capital Corp.
6.90%, due 5/1/19 | | | 738,000 | | | | 806,265 | |
8.75%, due 3/15/32 | | | 1,330,000 | | | | 1,426,425 | |
T-Mobile USA, Inc.
6.125%, due 1/15/22 | | | 1,000,000 | | | | 1,017,500 | |
6.542%, due 4/28/20 | | | 1,235,000 | | | | 1,312,187 | |
Telefonica Emisiones SAU
4.57%, due 4/27/23 | | | 1,781,000 | | | | 1,756,221 | |
5.462%, due 2/16/21 | | | 279,000 | | | | 294,385 | |
Verizon Communications, Inc.
5.15%, due 9/15/23 | | | 1,722,000 | | | | 1,848,898 | |
| | | | | | | | |
| | | | | | | 18,468,735 | |
| | | | | | | | |
Transportation 1.3% | | | | | | | | |
CHC Helicopter S.A.
9.25%, due 10/15/20 | | | 2,508,000 | | | | 2,702,370 | |
PHI, Inc.
8.625%, due 10/15/18 | | | 1,451,000 | | | | 1,559,825 | |
Ukraine Railways Via Shortline PLC
9.50%, due 5/21/18 (c) | | | 1,175,000 | | | | 1,054,562 | |
| | | | | | | | |
| | | | | | | 5,316,757 | |
| | | | | | | | |
Total Corporate Bonds
(Cost $299,816,167) | | | | | | | 306,248,580 | |
| | | | | | | | |
| | |
| Foreign Bonds 1.1% | | | | | | | | |
Luxembourg 0.4% | | | | | | | | |
Ageas Hybrid Financing S.A.
5.125%, due 6/29/49 (a) | | € | 1,225,000 | | | | 1,703,348 | |
| | | | | | | | |
| | |
United Kingdom 0.7% | | | | | | | | |
Barclays Bank PLC
Series Reg S
10.00%, due 5/21/21 | | £ | 401,000 | | | | 857,363 | |
Rexam PLC
6.75%, due 6/29/67 (a) | | € | 222,000 | | | | 328,311 | |
| | | | | | | | |
| | | Principal
Amount | | | Value | |
United Kingdom (continued) | | | | | | | | |
Santander UK PLC
4.814%, due 9/28/49 (a) | | £ | 1,150,000 | | | $ | 1,695,661 | |
| | | | | | | | |
| | | | | | | 2,881,335 | |
| | | | | | | | |
Total Foreign Bonds
(Cost $3,961,812) | | | | | | | 4,584,683 | |
| | | | | | | | |
|
| Foreign Government Bonds 0.2% | |
El Salvador 0.0%‡ | | | | | | | | |
Republic of El Salvador
7.65%, due 6/15/35 | | $ | 37,000 | | | | 36,038 | |
8.25%, due 4/10/32 (c) | | | 37,000 | | | | 39,451 | |
| | | | | | | | |
| | | | | | | 75,489 | |
| | | | | | | | |
Portugal 0.2% | | | | | | | | |
Portugal Obrigacoes do Tesouro OT
Series Reg S
4.95%, due 10/25/23 | | € | 700,000 | | | | 887,411 | |
| | | | | | | | |
Total Foreign Government Bonds
(Cost $886,651) | | | | | | | 962,900 | |
| | | | | | | | |
|
| Loan Assignments 7.5% (h) | |
Advertising 0.4% | | | | | | | | |
Acosta, Inc.
New Term Loan B
4.25%, due 3/2/18 | | $ | 1,496,250 | | | | 1,503,731 | |
| | | | | | | | |
| | |
Aerospace & Defense 0.1% | | | | | | | | |
Transdigm, Inc.
Term Loan C
3.75%, due 2/28/20 | | | 498,741 | | | | 499,572 | |
| | | | | | | | |
| | |
Airlines 0.1% | | | | | | | | |
United Airlines, Inc.
New Term Loan B
4.00%, due 4/1/19 | | | 421,813 | | | | 424,976 | |
| | | | | | | | |
| | |
Building Materials 0.5% | | | | | | | | |
Quikrete Holdings, Inc. | | | | | | | | |
1st Lien Term Loan
4.00%, due 9/28/20 | | | 1,296,750 | | | | 1,302,142 | |
2nd Lien Term Loan
7.00%, due 3/26/21 | | | 650,000 | | | | 663,812 | |
| | | | | | | | |
| | | | | | | 1,965,954 | |
| | | | | | | | |
Chemicals 0.8% | | | | | | | | |
Ascend Performance Materials LLC
Term Loan B
6.75%, due 4/10/18 | | | 1,621,125 | | | | 1,560,333 | |
| | | | | | |
The notes to the financial statements are an integral part of,
and should be read in conjunction with, the financial statements. | | mainstayinvestments.com | | | M-429 | |
Portfolio of Investments December 31, 2013 (continued)
| | | | | | | | |
| | | Principal
Amount | | | Value | |
| Loan Assignments (continued) | |
Chemicals (continued) | | | | | | | | |
Axalta Coating Systems US Holdings, Inc.
Term Loan
4.75%, due 2/1/20 | | $ | 496,250 | | | $ | 499,283 | |
PQ Corp.
Term Loan
4.50%, due 8/7/17 | | | 990,000 | | | | 997,270 | |
| | | | | | | | |
| | | | | | | 3,056,886 | |
| | | | | | | | |
Commercial Services 0.2% | | | | | | | | |
KAR Auction Services, Inc.
Term Loan B
3.75%, due 5/19/17 | | | 956,555 | | | | 960,142 | |
| | | | | | | | |
| | |
Diversified Financial Services 0.2% | | | | | | | | |
Springleaf Financial Funding Co.
Term Loan B2
4.75%, due 9/25/19 | | | 1,000,000 | | | | 1,011,667 | |
| | | | | | | | |
| | |
Electric 0.2% | | | | | | | | |
NRG Energy, Inc.
Refi Term Loan B
2.75%, due 7/2/18 | | | 694,750 | | | | 692,723 | |
| | | | | | | | |
|
Electrical Components & Equipment 0.4% | |
Generac Power Systems, Inc.
Term Loan B
3.50%, due 5/31/20 | | | 1,750,000 | | | | 1,749,454 | |
| | | | | | | | |
| | |
Entertainment 1.0% | | | | | | | | |
Mohegan Tribal Gaming Authority
New Term Loan B
5.50%, due 11/19/19 | | | 1,000,000 | | | | 1,014,750 | |
Scientific Games International, Inc.
New Term Loan B
4.25%, due 10/18/20 | | | 1,850,000 | | | | 1,849,615 | |
SeaWorld Parks & Entertainment, Inc.
Term Loan B2
3.00%, due 5/14/20 | | | 1,246,867 | | | | 1,232,395 | |
| | | | | | | | |
| | | | | | | 4,096,760 | |
| | | | | | | | |
Food 0.4% | | | | | | | | |
H.J. Heinz Co.
Term Loan B2
3.50%, due 6/5/20 | | | 1,492,500 | | | | 1,502,670 | |
| | | | | | | | |
| | |
Lodging 1.0% | | | | | | | | |
Boyd Gaming Corp.
Term Loan B
4.00%, due 8/14/20 | | | 1,750,000 | | | | 1,757,292 | |
| | | | | | | | |
| | | Principal
Amount | | | Value | |
Lodging (continued) | | | | | | | | |
¨Caesars Entertainment Operating Co., Inc.
Extended Term Loan B5
4.488%, due 1/26/18 | | $ | 1,500,000 | | | $ | 1,411,563 | |
MGM Resorts International
Term Loan B
3.50%, due 12/20/19 | | | 745,000 | | | | 744,380 | |
| | | | | | | | |
| | | | | | | 3,913,235 | |
| | | | | | | | |
Media 0.6% | | | | | | | | |
Charter Communications Operating LLC
Term Loan F
3.00%, due 1/4/21 | | | 997,494 | | | | 987,519 | |
Virgin Media Investment Holdings, Ltd.
USD Term Loan B
3.50%, due 6/8/20 | | | 1,500,000 | | | | 1,501,875 | |
| | | | | | | | |
| | | | | | | 2,489,394 | |
| | | | | | | | |
Mining 0.5% | | | | | | | | |
FMG Resources August 2006 Pty, Ltd
New Term Loan B
4.25%, due 6/28/19 | | | 493,763 | | | | 500,346 | |
Noranda Aluminum Acquisition Corp.
New Term Loan B
5.75%, due 2/28/19 | | | 1,587,879 | | | | 1,485,989 | |
| | | | | | | | |
| | | | | | | 1,986,335 | |
| | | | | | | | |
Oil & Gas 0.5% | | | | | | | | |
Quicksilver Resources, Inc.
New 2nd Lien Term Loan
7.00%, due 6/21/19 (l) | | | 1,900,000 | | | | 1,876,250 | |
| | | | | | | | |
| | |
Pharmaceuticals 0.3% | | | | | | | | |
Valeant Pharmaceuticals International, Inc.
Term Loan E
4.50%, due 8/5/20 | | | 1,290,250 | | | | 1,296,701 | |
| | | | | | | | |
| | |
Pipelines 0.3% | | | | | | | | |
Energy Transfer Equity, L.P.
Term Loan
3.25%, due 12/2/19 | | | 1,250,000 | | | | 1,245,118 | |
| | | | | | | | |
Total Loan Assignments
(Cost $30,255,932) | | | | | | | 30,271,568 | |
| | | | | | | | |
|
| Mortgage-Backed Securities 0.1% | |
Commercial Mortgage Loans (Collateralized Mortgage Obligations) 0.1% | |
Banc of America Commercial Mortgage, Inc.
Series 2005-J, Class 1A1
2.606%, due 11/25/35 (i) | | | 82,698 | | | | 71,337 | |
| | | | |
| M-430 | | MainStay VP Unconstrained Bond Portfolio | | The notes to the financial statements are an integral part of,
and should be read in conjunction with, the financial statements. |
| | | | | | | | |
| | | Principal
Amount | | | Value | |
| Mortgage-Backed Securities (continued) | |
Commercial Mortgage Loans
(Collateralized Mortgage Obligations) (continued) | |
Deutsche ALT-A Securities, Inc. Alternate Loan Trust
Series 2005-5, Class 1A3
5.50%, due 11/25/35 (a) | | $ | 31,680 | | | $ | 28,759 | |
WaMu Mortgage Pass-Through Certificates
Series 2006-AR14, Class 1A1
2.065%, due 11/25/36 (i) | | | 43,447 | | | | 36,527 | |
Wells Fargo Mortgage Backed Securities Trust
Series 2006-AR10, Class 5A2
2.612%, due 7/25/36 (i) | | | 52,096 | | | | 49,688 | |
| | | | | | | | |
Total Mortgage-Backed Securities
(Cost $181,277) | | | | | | | 186,311 | |
| | | | | | | | |
| | |
| Yankee Bonds 0.5% (j) | | | | | | | | |
Banks 0.3% | | | | | | | | |
Royal Bank of Scotland Group PLC
6.125%, due 12/15/22 | | | 970,000 | | | | 991,341 | |
| | | | | | | | |
| | |
Insurance 0.2% | | | | | | | | |
Validus Holdings, Ltd.
8.875%, due 1/26/40 | | | 680,000 | | | | 897,875 | |
| | | | | | | | |
Total Yankee Bonds
(Cost $1,880,205) | | | | | | | 1,889,216 | |
| | | | | | | | |
Total Long-Term Bonds
(Cost $353,652,547) | | | | | | | 362,109,602 | |
| | | | | | | | |
| | |
| | | | | | | | |
| | |
Shares | | | | |
| Common Stocks 0.4% | | | | | | | | |
Auto Manufacturers 0.2% | | | | | | | | |
General Motors Co. (k) | | | 18,239 | | | | 745,428 | |
| | | | | | | | |
| | |
Banks 0.2% | | | | | | | | |
Citigroup, Inc. | | | 16,000 | | | | 833,760 | |
| | | | | | | | |
| | |
Building Materials 0.0%‡ | | | | | | | | |
U.S. Concrete, Inc. (k)(l) | | | 3,115 | | | | 70,492 | |
| | | | | | | | |
Total Common Stocks
(Cost $1,247,886) | | | | | | | 1,649,680 | |
| | | | | | | | |
|
| Convertible Preferred Stocks 0.9% | |
Aerospace & Defense 0.1% | | | | | | | | |
United Technologies Corp.
7.50% | | | 6,400 | | | | 419,008 | |
| | | | | | | | |
| | | | | | | | |
| | |
Shares | | | Value | |
Auto Parts & Equipment 0.1% | | | | | | | | |
Goodyear Tire & Rubber Co. (The)
5.88% | | | 5,100 | | | $ | 340,935 | |
| | | | | | | | |
| | |
Banks 0.2% | | | | | | | | |
¨Bank of America Corp.
7.25% Series L | | | 400 | | | | 424,400 | |
Wells Fargo & Co.
7.50% Series L | | | 400 | | | | 442,000 | |
| | | | | | | | |
| | | | | | | 866,400 | |
| | | | | | | | |
Food 0.1% | | | | | | | | |
Post Holdings, Inc. | | | | | | | | |
2.50% (c) | | | 600 | | | | 60,038 | |
3.75% (c) | | | 1,000 | | | | 119,011 | |
| | | | | | | | |
| | | | | | | 179,049 | |
| | | | | | | | |
Hand & Machine Tools 0.1% | | | | | | | | |
Stanley Black & Decker, Inc.
4.75% | | | 2,800 | | | | 347,564 | |
| | | | | | | | |
| | |
Insurance 0.1% | | | | | | | | |
Maiden Holdings, Ltd.
7.25% | | | 1,300 | | | | 59,241 | |
MetLife, Inc.
5.00% | | | 13,626 | | | | 429,733 | |
| | | | | | | | |
| | | | | | | 488,974 | |
| | | | | | | | |
Iron & Steel 0.2% | | | | | | | | |
ArcelorMittal
6.00% | | | 36,000 | | | | 936,000 | |
| | | | | | | | |
| | |
Oil & Gas 0.0%‡ | | | | | | | | |
Sanchez Energy Corp.
4.88% | | | 1,500 | | | | 93,750 | |
| | | | | | | | |
Total Convertible Preferred Stocks
(Cost $3,328,061) | | | | | | | 3,671,680 | |
| | | | | | | | |
| | |
| | | | | | | | |
| | | Number of
Warrants | | | | |
| Warrants 0.1% | | | | | | | | |
Auto Manufacturers 0.1% | | | | | | | | |
General Motors Co. | | | | | | | | |
Strike Price $10.00
Expires 7/10/16 (k) | | | 7,425 | | | | 231,363 | |
Strike Price $18.33
Expires 7/10/19 (k) | | | 3,655 | | | | 84,540 | |
| | | | | | | | |
Total Warrants
(Cost $233,707) | | | | | | | 315,903 | |
| | | | | | | | |
| | | | | | |
The notes to the financial statements are an integral part of,
and should be read in conjunction with, the financial statements. | | mainstayinvestments.com | | | M-431 | |
Portfolio of Investments December 31, 2013 (continued)
| | | | | | | | |
| | | Principal
Amount | | | Value | |
| Short-Term Investment 8.1% | |
Repurchase Agreement 8.1% | | | | | | | | |
State Street Bank and Trust Co.
0.00%, dated 12/31/13
due 1/2/14
Proceeds at Maturity $32,888,703 (Collateralized by a Federal National Mortgage Association security with a rate of 2.14% and a maturity date of 11/7/22, with a Principal Amount of $36,955,000 and a Market Value of $33,550,373) | | $ | 32,888,703 | | | $ | 32,888,703 | |
| | | | | | | | |
Total Short-Term Investment
(Cost $32,888,703) | | | | | | | 32,888,703 | |
| | | | | | | | |
Total Investments
(Cost $391,350,904) (o) | | | 99.0 | % | | | 400,635,568 | |
Other Assets, Less Liabilities | | | 1.0 | | | | 4,227,135 | |
Net Assets | | | 100.0 | % | | $ | 404,862,703 | |
| | |
| | | | | | | | |
| | | Contracts
Short | | | Unrealized
Appreciation
(Depreciation) (m) | |
| Futures Contracts 0.4% | | | | | | | | |
United States Treasury Note
March 2014 (10 Year) (n) | | | (150 | ) | | $ | 351,240 | |
United States Treasury Note
March 2014 (2 Year) (n) | | | (600 | ) | | | 213,084 | |
United States Treasury Note
March 2014 (5 Year) (n) | | | (880 | ) | | | 1,215,647 | |
| | | | | | | | |
Total Futures Contracts
(Notional Amount $255,339,53) | | | | | | $ | 1,779,971 | |
| | | | | | | | |
| ‡ | Less than one-tenth of a percent. |
| (a) | Floating rate—Rate shown is the rate in effect as of December 31, 2013. |
| (b) | Subprime mortgage investment or other asset-backed security. The total market value of these securities as of December 31, 2013, is $1,361,766, which represents 0.3% of the Portfolio’s net assets. |
| (c) | May be sold to institutional investors only under Rule 144A or securities offered pursuant to Section 4(a)(2) of the Securities Act of 1933, as amended. |
| (d) | Step coupon—Rate shown is the rate in effect as of December 31, 2013. |
| (e) | Fair valued security—The total market value of this security as of December 31, 2013, is $619,451, which represents 0.2% of the Portfolio’s net assets. |
| (f) | Synthetic Convertible Bond—Security structured by an investment bank that provides exposure to a specific company’s stock, represents 0.2% of the Portfolio’s net assets. |
| (g) | PIK (“Payment in Kind”)—interest or dividend payment is made with additional securities. |
| (h) | Floating Rate Loan—generally pays interest at rates which are periodically re-determined at a margin above the London InterBank Offered Rate or other short-term rates. The rate shown is the weighted average interest rate of all contracts within the floating rate loan facility as of December 31, 2013. |
| (i) | Collateral strip rate—A bond whose interest is based on the weighted net interest rate of the collateral. The coupon rate adjusts periodically based on a predetermined schedule. Rate shown is the rate in effect as of December 31, 2013. |
| (j) | Yankee Bond—Dollar-denominated bond issued in the United States by a foreign bank or corporation. |
| (k) | Non-income producing security. |
| (l) | Illiquid security—The total market value of this security as of December 31, 2013, is $1,946,742, which represents 0.5% of the Portfolio’s net assets. |
| (m) | Represents the difference between the value of the contracts at the time they were opened and the value as of December 31, 2013. |
| (n) | At December 31, 2013, cash in the amount of $1,163,250 is on deposit with broker for futures transactions. |
| (o) | As of December 31, 2013, cost is $391,362,805 for federal income tax purposes and net unrealized appreciation is as follows: |
| | | | |
Gross unrealized appreciation | | $ | 13,855,748 | |
Gross unrealized depreciation | | | (4,582,985 | ) |
| | | | |
Net unrealized appreciation | | $ | 9,272,763 | |
| | | | |
The following abbreviations are used in the above portfolio:
£—British Pound Sterling
€—Euro
| | | | |
| M-432 | | MainStay VP Unconstrained Bond Portfolio | | The notes to the financial statements are an integral part of,
and should be read in conjunction with, the financial statements. |
As of December 31, 2013, the Portfolio held the following foreign currency forward contracts:
| | | | | | | | | | | | | | | | | | | | | | | | | | | | | | | | |
Foreign Currency Sale Contracts | | Expiration
Date | | | Counterparty | | | Contract
Amount Sold | | | Contract Amount
Purchased | | | Unrealized
Appreciation
(Depreciation) | |
| | | | | | | | |
| Euro vs. U.S. Dollar | | | 2/20/14 | | | | JPMorgan Chase Bank | | | | EUR | | | | 7,330,000 | | | | USD | | | | 10,059,965 | | | | USD | | | | (23,720 | ) |
| | | | | | | | |
| Pound Sterling vs. U.S. Dollar | | | 2/20/14 | | | | JPMorgan Chase Bank | | | | GBP | | | | 4,907,000 | | | | USD | | | | 7,989,087 | | | | | | | | (133,978 | ) |
| | | | | |
| Net unrealized appreciation (depreciation) on foreign currency forward contracts | | | | | | | | | | | | | | | | USD | | | | (157,698 | ) |
The following is a summary of the fair valuations according to the inputs used as of December 31, 2013, for valuing the Portfolio’s assets and liabilities.
Asset Valuation Inputs
| | | | | | | | | | | | | | | | |
Description | | Quoted Prices
in Active Markets
for Identical Assets (Level 1) | | | Significant Other
Observable Inputs (Level 2) | | | Significant
Unobservable
Inputs (Level 3) | | | Total | |
| Investments in Securities (a) | | | | | | | | | | | | | | | | |
| Long-Term Bonds | | | | | | | | | | | | | | | | |
Asset-Backed Securities | | $ | — | | | $ | 2,003,947 | | | $ | — | | | $ | 2,003,947 | |
Convertible Bonds | | | — | | | | 15,962,397 | | | | — | | | | 15,962,397 | |
Corporate Bonds | | | — | | | | 306,248,580 | | | | — | | | | 306,248,580 | |
Foreign Bonds | | | — | | | | 4,584,683 | | | | — | | | | 4,584,683 | |
Foreign Government Bonds | | | — | | | | 962,900 | | | | — | | | | 962,900 | |
Loan Assignments (b) | | | — | | | | 28,395,318 | | | | 1,876,250 | | | | 30,271,568 | |
Mortgage-Backed Securities | | | — | | | | 186,311 | | | | — | | | | 186,311 | |
Yankee Bonds | | | — | | | | 1,889,216 | | | | — | | | | 1,889,216 | |
| | | | | | | | | | | | | | | | |
| Total Long-Term Bonds | | | — | | | | 360,233,352 | | | | 1,876,250 | | | | 362,109,602 | |
| | | | | | | | | | | | | | | | |
| Common Stocks | | | 1,649,680 | | | | — | | | | — | | | | 1,649,680 | |
| Convertible Preferred Stocks | | | 3,552,669 | | | | 119,011 | | | | — | | | | 3,671,680 | |
| Warrants | | | 315,903 | | | | — | | | | — | | | | 315,903 | |
| Short-Term Investment | | | | | | | | | | | | | | | | |
Repurchase Agreement | | | — | | | | 32,888,703 | | | | — | | | | 32,888,703 | |
| | | | | | | | | | | | | | | | |
| Total Investments in Securities | | | 5,518,252 | | | | 393,241,066 | | | | 1,876,250 | | | | 400,635,568 | |
| | | | | | | | | | | | | | | | |
| Other Financial Instruments | | | | | | | | | | | | | | | | |
Futures Contracts Short (c) | | | 1,779,971 | | | | — | | | | — | | | | 1,779,971 | |
| | | | | | | | | | | | | | | | |
Total Investments in Securities and Other Financial Instruments | | $ | 7,298,223 | | | $ | 393,241,066 | | | $ | 1,876,250 | | | $ | 402,415,539 | |
| | | | | | | | | | | | | | | | |
Liability Valuation Inputs
| | | | | | | | | | | | | | | | |
Description | | Quoted Prices
in Active Markets
for Identical Assets (Level 1) | | | Significant Other
Observable Inputs (Level 2) | | | Significant
Unobservable
Inputs (Level 3) | | | Total | |
| Other Financial Instruments | | | | | | | | | | | | | | | | |
Foreign Currency Forward Contracts (c) | | $ | — | | | $ | (157,698 | ) | | $ | — | | | $ | (157,698 | ) |
| | | | | | | | | | | | | | | | |
| Total Other Financial Instruments | | $ | — | | | $ | (157,698 | ) | | $ | — | | | $ | (157,698 | ) |
| | | | | | | | | | | | | | | | |
| (a) | For a complete listing of investments and their industries, see the Portfolio of Investments. |
| (b) | The Level 3 security valued at $1,876,250 represents Loan Assignments whose value was obtained from an independent pricing service which used a single broker quote to measure such value as referenced in the Portfolio of Investments. |
| (c) | The value listed for these securities reflects unrealized appreciation (depreciation) as shown on the Portfolio of Investments. |
| | | | | | |
The notes to the financial statements are an integral part of,
and should be read in conjunction with, the financial statements. | | mainstayinvestments.com | | | M-433 | |
Portfolio of Investments December 31, 2013 (continued)
The Portfolio recognizes transfers between the levels as of the beginning of the period.
For the year ended December 31, 2013, the Portfolio did not have any transfers between Level 1 and Level 2 fair value measurements. (See Note 2)
The following is a reconciliation of investments in which significant unobservable inputs (Level 3) were used in determining value:
| | | | | | | | | | | | | | | | | | | | | | | | | | | | | | | | | | | | | | | | |
Investments in
Securities | | Balance
as of
December 31,
2012 | | | Accrued
Discounts
(Premiums) | | | Realized
Gain
(Loss) | | | Change in
Unrealized
Appreciation
(Depreciation) | | | Purchases | | | Sales | | | Transfers
into
Level 3 | | | Transfers
out of
Level 3 | | | Balance
as of
December 31,
2013 | | | Change in
Unrealized
Appreciation
(Depreciation)
from Investments
Still Held at
December 31,
2013 (a) | |
Long-Term Bonds | | | | | | | | | | | | | | | | | | | | | | | | | | | | | | | | | | | | | | | | |
Loan Assignments Oil & Gas | | $ | — | | | $ | 3,442 | | | $ | — | | | $ | 23,531 | | | $ | 1,849,277 | | | $ | — | | | $ | — | | | $ | — | | | $ | 1,876,250 | | | $ | 23,531 | |
| | | | | | | | | | | | | | | | | | | | | | | | | | | | | | | | | | | | | | | | |
Total | | $ | — | | | $ | 3,442 | | | $ | — | | | $ | 23,531 | | | $ | 1,849,277 | | | $ | — | | | $ | — | | | $ | — | | | $ | 1,876,250 | | | $ | 23,531 | |
| | | | | | | | | | | | | | | | | | | | | | | | | | | | | | | | | | | | | | | | |
| (a) | Included in “Net change in unrealized appreciation (depreciation) on investments” in the Statement of Operations. |
| | | | |
| M-434 | | MainStay VP Unconstrained Bond Portfolio | | The notes to the financial statements are an integral part of,
and should be read in conjunction with, the financial statements. |
Statement of Assets and Liabilities as of December 31, 2013
| | | | |
| Assets | |
Investment in securities, at value (identified cost $391,350,904) | | $ | 400,635,568 | |
Cash denominated in foreign currencies (identified cost $2,050,609) | | | 2,084,292 | |
Cash collateral on deposit at broker | | | 1,163,250 | |
Receivables: | | | | |
Dividends and interest | | | 5,489,417 | |
Fund shares sold | | | 902,329 | |
Variation margin on futures contracts | | | 108,281 | |
Investment securities sold | | | 35,999 | |
| | | | |
Total assets | | | 410,419,136 | |
| | | | |
| |
| Liabilities | | | | |
Payables: | | | | |
Investment securities purchased | | | 5,056,555 | |
Manager (See Note 3) | | | 193,269 | |
NYLIFE Distributors (See Note 3) | | | 60,944 | |
Professional fees | | | 32,639 | |
Fund shares redeemed | | | 31,026 | |
Shareholder communication | | | 16,776 | |
Custodian | | | 4,374 | |
Trustees | | | 450 | |
Accrued expenses | | | 2,702 | |
Unrealized depreciation on foreign currency forward contracts | | | 157,698 | |
| | | | |
Total liabilities | | | 5,556,433 | |
| | | | |
Net assets | | $ | 404,862,703 | |
| | | | |
| |
| Net Assets Consist of | | | | |
Shares of beneficial interest outstanding (par value of $.001 per share) unlimited number of shares authorized | | $ | 39,307 | |
Additional paid-in capital | | | 397,108,284 | |
| | | | |
| | | 397,147,591 | |
Distributions in excess of net investment income | | | (205,112 | ) |
Accumulated net realized gain (loss) on investments, futures transactions and foreign currency transactions | | | (3,029,905 | ) |
Net unrealized appreciation (depreciation) on investments and futures contracts | | | 11,064,635 | |
Net unrealized appreciation (depreciation) on translation of other assets and liabilities in foreign currencies and foreign currency forward contracts | | | (114,506 | ) |
| | | | |
Net assets | | $ | 404,862,703 | |
| | | | |
| | | | |
Initial Class | | | | |
Net assets applicable to outstanding shares | | $ | 105,971,993 | |
| | | | |
Shares of beneficial interest outstanding | | | 10,271,001 | |
| | | | |
Net asset value per share outstanding | | $ | 10.32 | |
| | | | |
Service Class | | | | |
Net assets applicable to outstanding shares | | $ | 298,890,710 | |
| | | | |
Shares of beneficial interest outstanding | | | 29,036,132 | |
| | | | |
Net asset value per share outstanding | | $ | 10.29 | |
| | | | |
| | | | | | |
The notes to the financial statements are an integral part of,
and should be read in conjunction with, the financial statements. | | mainstayinvestments.com | | | M-435 | |
Statement of Operations for the year ended December 31, 2013
| | | | |
| Investment Income (Loss) | |
Income | | | | |
Interest | | $ | 16,707,719 | |
Dividends | | | 224,883 | |
| | | | |
Total income | | | 16,932,602 | |
| | | | |
Expenses | | | | |
Manager (See Note 3) | | | 1,894,144 | |
Distribution and service—Service Class (See Note 3) | | | 530,278 | |
Professional fees | | | 63,840 | |
Shareholder communication | | | 50,505 | |
Custodian | | | 28,874 | |
Trustees | | | 6,412 | |
Miscellaneous | | | 18,993 | |
| | | | |
Total expenses | | | 2,593,046 | |
| | | | |
Net investment income (loss) | | | 14,339,556 | |
| | | | |
|
| Realized and Unrealized Gain (Loss) on Investments, Futures Contracts and Foreign Currency Transactions | |
Net realized gain (loss) on: | | | | |
Security transactions | | | (951,632 | ) |
Futures transactions | | | (979,097 | ) |
Foreign currency transactions | | | (505,228 | ) |
| | | | |
Net realized gain (loss) on investments, futures transactions and foreign currency transactions | | | (2,435,957 | ) |
| | | | |
Net change in unrealized appreciation (depreciation) on: | | | | |
Investments | | | (983,607 | ) |
Futures contracts | | | 1,982,351 | |
Translation of other assets and liabilities in foreign currencies and foreign currency forward contracts | | | (58,142 | ) |
| | | | |
Net change in unrealized appreciation (depreciation) on investments, futures contracts and foreign currency transactions | | | 940,602 | |
| | | | |
Net realized and unrealized gain (loss) on investments, futures transactions and foreign currency transactions | | | (1,495,355 | ) |
| | | | |
Net increase (decrease) in net assets resulting from operations | | $ | 12,844,201 | |
| | | | |
| | | | |
| M-436 | | MainStay VP Unconstrained Bond Portfolio | | The notes to the financial statements are an integral part of,
and should be read in conjunction with, the financial statements. |
Statement of Changes in Net Assets
for the years ended December 31, 2013 and December 31, 2012
| | | | | | | | |
| | | 2013 | | | 2012 | |
| Increase (Decrease) in Net Assets | |
Operations: | | | | | | | | |
Net investment income (loss) | | $ | 14,339,556 | | | $ | 12,957,155 | |
Net realized gain (loss) on investments, futures transactions and foreign currency transactions | | | (2,435,957 | ) | | | 650,606 | |
Net change in unrealized appreciation (depreciation) on investments, futures contracts and foreign currency transactions | | | 940,602 | | | | 17,837,272 | |
| | | | |
Net increase (decrease) in net assets resulting from operations | | | 12,844,201 | | | | 31,445,033 | |
| | | | |
Dividends and distributions to shareholders: | | | | | | | | |
From net investment income: | | | | | | | | |
Initial Class | | | (3,368,062 | ) | | | (6,496,910 | ) |
Service Class | | | (10,795,149 | ) | | | (6,484,699 | ) |
| | | | |
| | | (14,163,211 | ) | | | (12,981,609 | ) |
| | | | |
From net realized gain on investments: | | | | | | | | |
Initial Class | | | (1,744 | ) | | | (1,107,043 | ) |
Service Class | | | (4,921 | ) | | | (1,060,445 | ) |
| | | | |
| | | (6,665 | ) | | | (2,167,488 | ) |
| | | | |
Total dividends and distributions to shareholders | | | (14,169,876 | ) | | | (15,149,097 | ) |
| | | | |
Capital share transactions: | | | | | | | | |
Net proceeds from sale of shares | | | 218,463,879 | | | | 147,761,010 | |
Net asset value of shares issued to shareholders in reinvestment of dividends and distributions | | | 14,169,876 | | | | 15,149,097 | |
Cost of shares redeemed | | | (109,251,452 | ) | | | (124,556,990 | ) |
| | | | |
Increase (decrease) in net assets derived from capital share transactions | | | 123,382,303 | | | | 38,353,117 | |
| | | | |
Net increase (decrease) in net assets | | | 122,056,628 | | | | 54,649,053 | |
|
| Net Assets | |
Beginning of year | | | 282,806,075 | | | | 228,157,022 | |
| | | | |
End of year | | $ | 404,862,703 | | | $ | 282,806,075 | |
| | | | |
Distributions in excess of net investment income at end of year | | $ | (205,112 | ) | | $ | (64,636 | ) |
| | | | |
| | | | | | |
The notes to the financial statements are an integral part of,
and should be read in conjunction with, the financial statements. | | mainstayinvestments.com | | | M-437 | |
Financial Highlights selected per share data and ratios
| | | | | | | | | | | | |
| | | Initial Class | |
| | | Year ended December 31, | | | April 29,
2011**
through
December 31, | |
| | | 2013 | | | 2012 | | | 2011 | |
Net asset value at beginning of period | | $ | 10.32 | | | $ | 9.60 | | | $ | 10.00 | |
| | | | | | | | | | | | |
Net investment income (loss) (a) | | | 0.49 | | | | 0.54 | | | | 0.31 | |
Net realized and unrealized gain (loss) on investments | | | (0.04 | ) | | | 0.81 | | | | (0.47 | ) |
Net realized and unrealized gain (loss) on foreign currency transactions | | | (0.02 | ) | | | (0.01 | ) | | | 0.02 | |
| | | | | | | | | | | | |
Total from investment operations | | | 0.43 | | | | 1.34 | | | | (0.14 | ) |
| | | | | | | | | | | | |
Less dividends and distributions: | | | | | | | | | | | | |
From net investment income | | | (0.43 | ) | | | (0.53 | ) | | | (0.26 | ) |
From net realized gain on investments | | | (0.00 | )‡ | | | (0.09 | ) | | | — | |
| | | | | | | | | | | | |
Total dividends and distributions | | | (0.43 | ) | | | (0.62 | ) | | | (0.26 | ) |
| | | | | | | | | | | | |
Net asset value at end of period | | $ | 10.32 | | | $ | 10.32 | | | $ | 9.60 | |
| | | | | | | | | | | | |
Total investment return | | | 4.17 | % | | | 13.88 | % | | | (1.32 | %)(b) |
Ratios (to average net assets)/Supplemental Data: | | | | | | | | | | | | |
Net investment income (loss) | | | 4.69 | % | | | 5.30 | % | | | 4.74 | % †† |
Net expenses (excluding short sale expenses) | | | 0.65 | % | | | 0.65 | % | | | 0.71 | % †† |
Expenses (including short sales expenses) | | | 0.65 | % | | | 0.65 | % | | | 0.78 | % †† |
Short sale expenses | | | — | | | | 0.00 | %(c) | | | 0.07 | % †† |
Portfolio turnover rate | | | 23 | % | | | 39 | % | | | 7 | % |
Net assets at end of period (in 000’s) | | $ | 105,972 | | | $ | 133,840 | | | $ | 188,333 | |
| ‡ | Less than one cent per share. |
| (a) | Per share data based on average shares outstanding during the period. |
| (b) | Total investment return is not annualized. |
| (c) | Less than one-hundredth of a percent. |
| | | | |
| M-438 | | MainStay VP Unconstrained Bond Portfolio | | The notes to the financial statements are an integral part of,
and should be read in conjunction with, the financial statements. |
Financial Highlights selected per share data and ratios
| | | | | | | | | | | | |
| | | Service Class | |
| | | Year ended December 31, | | | April 29,
2011**
through
December 31, | |
| | | 2013 | | | 2012 | | | 2011 | |
Net asset value at beginning of period | | $ | 10.30 | | | $ | 9.60 | | | $ | 10.00 | |
| | | | | | | | | | | | |
Net investment income (loss) (a) | | | 0.47 | | | | 0.52 | | | | 0.31 | |
Net realized and unrealized gain (loss) on investments | | | (0.04 | ) | | | 0.79 | | | | (0.49 | ) |
Net realized and unrealized gain (loss) on foreign currency transactions | | | (0.03 | ) | | | (0.01 | ) | | | 0.03 | |
| | | | | | | | | | | | |
Total from investment operations | | | 0.40 | | | | 1.30 | | | | (0.15 | ) |
| | | | | | | | | | | | |
Less dividends and distributions: | | | | | | | | | | | | |
From net investment income | | | (0.41 | ) | | | (0.51 | ) | | | (0.25 | ) |
From net realized gain on investments | | | (0.00 | )‡ | | | (0.09 | ) | | | — | |
| | | | | | | | | | | | |
Total dividends and distributions | | | (0.41 | ) | | | (0.60 | ) | | | (0.25 | ) |
| | | | | | | | | | | | |
Net asset value at end of period | | $ | 10.29 | | | $ | 10.30 | | | $ | 9.60 | |
| | | | | | | | | | | | |
Total investment return | | | 3.91 | % | | | 13.58 | % | | | (1.48 | %)(b) |
Ratios (to average net assets)/Supplemental Data: | | | | | | | | | | | | |
Net investment income (loss) | | | 4.47 | % | | | 5.03 | % | | | 4.81 | % †† |
Net expenses (excluding short sales expenses) | | | 0.90 | % | | | 0.90 | % | | | 0.95 | % †† |
Expenses (including short sales expenses) | | | 0.90 | % | | | 0.90 | % | | | 1.03 | % †† |
Short sale expenses | | | — | | | | 0.00 | %(c) | | | 0.08 | % †† |
Portfolio turnover rate | | | 23 | % | | | 39 | % | | | 7 | % |
Net assets at end of period (in 000’s) | | $ | 298,891 | | | $ | 148,966 | | | $ | 39,824 | |
| ‡ | Less than one cent per share. |
| (a) | Per share data based on average shares outstanding during the period. |
| (b) | Total investment return is not annualized. |
| (c) | Less than one-hundredth of a percent. |
| | | | | | |
The notes to the financial statements are an integral part of,
and should be read in conjunction with, the financial statements. | | mainstayinvestments.com | | | M-439 | |
MainStay VP U.S. Small Cap Portfolio
Investment and Performance Comparison (Unaudited)
Performance data quoted represents past performance. Past performance is no guarantee of future results. Because of market volatility, current performance may be lower or higher than the figures shown. Investment return and principal value will fluctuate, and as a result, when shares are redeemed, they may be worth more or less than their original cost. The performance table and graph do not reflect any deduction of sales charges, mortality and expense charges, contract charges or administrative charges. Please refer to the Performance Summary appropriate for your policy. For performance information current to the most recent month-end, please call 800-598-2019 or visit www.newyorklife.com.

Average Annual Total Returns for the Year Ended December 31, 2013
| | | | | | | | | | | | | | |
| Class | | One Year | | Five Years | | | Ten Years1 | | | Gross Expense Ratio2 | |
| Initial Class Shares | | 37.90% | | | 21.68% | | | | 9.86 | % | | | 0.83 | % |
| Service Class Shares | | 37.56 | | | 21.38 | | | | 9.58 | | | | 1.08 | |
| | | | | | | | | | | | |
| Benchmark Performance | | One
Year | | | Five
Years | | | Ten
Years | |
Russell 2500™ Index3 | | | 36.80 | % | | | 21.77 | % | | | 9.81 | % |
Average Lipper Variable Products Small-Cap Core Portfolio4 | | | 38.55 | | | | 20.38 | | | | 8.81 | |
| 1. | Performance figures shown for the ten-year period ended December 31, 2013 reflect nonrecurring reimbursements from affiliates for printing and mailing costs. If these nonrecurring reimbursements had not been made, the total returns would have been 9.85% for Initial Class shares and 9.57% for Service Class shares for the ten-year period. |
| 2. | The gross expense ratios presented reflect the Portfolio’s “Total Annual Portfolio Operating Expenses” from the most recent Prospectus and may differ from other expense ratios disclosed in this report. |
| 3. | Please refer to pages M-2 and M-3 for additional explanations and disclosure regarding the Portfolios, their benchmark indices and other indices mentioned in the reports. |
| 4. | The Average Lipper Variable Products Small-Cap Core Portfolio is representative of portfolios that, by portfolio practice, invest at least 75% of their equity assets in companies with market capitalizations (on a three-year weighted basis) below Lipper’s U.S. Diversified Equity small-cap ceiling. Small-cap core portfolios have more latitude in the companies in which they invest. These portfolios typically have average characteristics compared to the S&P SmallCap 600® Index. Lipper Inc. is an independent monitor of fund performance. Results are based on total returns with all dividend and capital gain distributions reinvested. |
| | |
| M-440 | | MainStay VP U.S. Small Cap Portfolio |
Cost in Dollars of a $1,000 Investment in MainStay VP U.S. Small Cap Portfolio (Unaudited)
The example below is intended to describe the fees and expenses borne by shareholders during the six-month period from July 1, 2013, to December 31, 2013, and the impact of those costs on your investment.
Example
As a shareholder of the Portfolio, you incur two types of costs: (1) transaction costs, including exchange fees and sales charges (loads) on purchases (as applicable), and (2) ongoing costs, including management fees, distribution and/or service (12b-1) fees, and other Portfolio expenses (as applicable). This example is intended to help you understand your ongoing costs (in dollars) of investing in the Portfolio and to compare these costs with the ongoing costs of investing in other Portfolios. The example is based on an investment of $1,000 made at the beginning of the six-month period and held for the entire period from July 1, 2013, to December 31, 2013. Shares are only sold in connection with variable life and annuity contracts and the example does not reflect any contract level or transactional fees or expenses. If these costs had been included, your costs would have been higher.
This example illustrates your Portfolio’s ongoing costs in two ways:
Actual Expenses
The second and third data columns in the table below provide information about actual account values and actual expenses. You may use the information in these columns, together with the amount you invested, to estimate the expenses that you paid during the six months ended
December 31, 2013. Simply divide your account value by $1,000 (for example, an $8,600 account value divided by $1,000 = 8.6), then multiply the result by the number under the heading entitled ‘‘Expenses Paid During Period’’ to estimate the expenses you paid on your account during this period.
Hypothetical Example for Comparison Purposes
The fourth and fifth data columns in the table below provide information about hypothetical account values and hypothetical expenses based on the Portfolio’s actual expense ratio and an assumed rate of return of 5% per year before expenses, which is not the Portfolio’s actual return. The hypothetical account values and expenses may not be used to estimate the actual ending account balances or expenses you paid for the six-month period shown. You may use this information to compare the ongoing costs of investing in the Portfolio with the ongoing costs of investing in other Portfolios. To do so, compare this 5% hypothetical example with the 5% hypothetical examples that appear in the shareholder reports of the other Portfolios.
Please note that the expenses shown in the table are meant to highlight your ongoing costs only and do not reflect any transactional costs, such as exchange fees or sales charges (loads). Therefore, the fourth and fifth data columns of the table are useful in comparing ongoing costs only and will not help you determine the relative total costs of owning different funds. In addition, if these transactional costs were included, your costs would have been higher.
| | | | | | | | | | | | | | | | | | | | |
| Share Class | | Beginning
Account
Value
7/1/13 | | | Ending Account
Value (Based
on Actual
Returns and
Expenses)
12/31/13 | | | Expenses
Paid
During
Period1 | | | Ending Account
Value (Based
on Hypothetical
5% Annualized
Return and
Actual Expenses)
12/31/13 | | | Expenses
Paid
During
Period1 | |
| | | | | |
| Initial Class Shares | | $ | 1,000.00 | | | $ | 1,172.80 | | | $ | 4.49 | | | $ | 1,021.10 | | | $ | 4.18 | |
| | | | | |
| Service Class Shares | | $ | 1,000.00 | | | $ | 1,171.30 | | | $ | 5.86 | | | $ | 1,019.80 | | | $ | 5.45 | |
| 1. | Expenses are equal to the Portfolio’s annualized expense ratio of each class (0.82% for Initial Class and 1.07% for Service Class) multiplied by the average account value over the period, divided by 365 and multiplied by 184 (to reflect the six-month period). The table above represents the actual expenses incurred during the six-month period. |
| | | | |
| mainstayinvestments.com | | | M-441 | |
Industry Composition as of December 31, 2013 (Unaudited)
| | | | |
| Commercial Banks | | | 10.5 | % |
| Health Care Equipment & Supplies | | | 8.4 | |
| Machinery | | | 8.2 | |
| Specialty Retail | | | 6.4 | |
| Health Care Providers & Services | | | 4.6 | |
| Hotels, Restaurants & Leisure | | | 4.6 | |
| Thrifts & Mortgage Finance | | | 4.3 | |
| Electric Utilities | | | 3.9 | |
| Semiconductors & Semiconductor Equipment | | | 3.7 | |
| Chemicals | | | 3.6 | |
| Building Products | | | 3.4 | |
| Aerospace & Defense | | | 3.0 | |
| Textiles, Apparel & Luxury Goods | | | 2.7 | |
| Exchange-Traded Fund | | | 2.5 | |
| Capital Markets | | | 2.3 | |
| Electronic Equipment, Instruments & Components | | | 2.1 | |
| Road & Rail | | | 2.1 | |
| Multi-Utilities | | | 1.7 | |
| Paper & Forest Products | | | 1.6 | |
| Software | | | 1.6 | |
| Communications Equipment | | | 1.5 | |
| | | | |
| Auto Components | | | 1.4 | % |
| Commercial Services & Supplies | | | 1.4 | |
| Containers & Packaging | | | 1.4 | |
| Food & Staples Retailing | | | 1.4 | |
| IT Services | | | 1.2 | |
| Energy Equipment & Services | | | 1.1 | |
| Household Durables | | | 1.1 | |
| Diversified Consumer Services | | | 1.0 | |
| Food Products | | | 1.0 | |
| Diversified Telecommunication Services | | | 0.9 | |
| Biotechnology | | | 0.7 | |
| Diversified Financial Services | | | 0.7 | |
| Real Estate Investment Trusts | | | 0.7 | |
| Professional Services | | | 0.6 | |
| Construction Materials | | | 0.5 | |
| Internet Software & Services | | | 0.4 | |
| Metals & Mining | | | 0.1 | |
| Short-Term Investment | | | 3.0 | |
| Other Assets, Less Liabilities | | | –1.3 | |
| | | | |
| | | 100.0 | % |
| | | | |
See Portfolio of Investments beginning on page M-445 for specific holdings within these categories.
Top Ten Holdings as of December 31, 2013 (excluding short-term investment) (Unaudited)
| 1. | iShares Russell 2000 Value Index Fund |
| 2. | Armstrong World Industries, Inc. |
| 3. | Iconix Brand Group, Inc. |
| 4. | Mueller Industries, Inc. |
| 5. | Integra LifeSciences Holdings Corp. |
| 6. | WellCare Health Plans, Inc. |
| 7. | Brinker International, Inc. |
| 8. | ViewPoint Financial Group, Inc. |
| | |
| M-442 | | MainStay VP U.S. Small Cap Portfolio |
Portfolio Management Discussion and Analysis (Unaudited)
Answers to the questions reflect the views of portfolio managers David Pearl, Michael Welhoelter, CFA, and Janet K. Navon of Epoch Investment Partners, Inc., the Portfolio’s Subadvisor.
How did MainStay VP U.S. Small Cap Portfolio perform relative to its benchmark and peers for the 12 months ended December 31, 2013?
For the 12 months ended December 31, 2013, MainStay VP U.S. Small Cap Portfolio returned 37.90% for Initial Class shares and 37.56% for Service Class shares. Over the same period, both share classes outperformed the 36.80% return of the Russell 2500™ Index,1 which is the Portfolio’s broad-based securities-market index. Both share classes underperformed the 38.55% return of the average Lipper Variable Products Small-Cap Core Portfolio for the 12 months ended December 31, 2013.
What factors affected the Portfolio’s relative performance during the reporting period?
The Portfolio outperformed the Russell 2500™ Index primarily because of stock selection in the financials and materials sectors. Stock selection in the industrials and information technology sectors detracted from relative returns.
Which sectors were the strongest positive contributors to the Portfolio’s relative performance, and which sectors were particularly weak?
The Portfolio’s returns are primarily the result of finding companies that can increase their free cash flow and are committed to allocating it intelligently to benefit shareholders. We believe understanding this “slow and steady” approach is more helpful to understanding returns than parsing returns in terms of sector weights and relative returns within those sectors. That said, sector commentary may provide additional insight if it is viewed in this context for this strategy.
The financials sector provided the most significant positive contribution relative to the Russell 2500™ Index, with the Portfolio’s sector positioning and security selection both contributing to relative results. Security selection in the materials and telecommunication services sectors also provided positive contributions. Stock selection detracted from relative returns in the industrials and information technology sectors, as did the Portfolio’s cash position in a rapidly rising market.
During the reporting period, which individual stocks made the strongest positive contributions to the Portfolio’s absolute performance and which stocks detracted the most?
Biotechnology company Alkermes was the strongest individual contributor to the Portfolio’s absolute performance. The company continued to generate strong financial results driven by continued growth in its five key drug products, higher cash-flow generation and a robust clinical pipeline. Revenue from Alkermes’ key drugs grew substantially during the reporting period. Pharmaceuticals company Endo Health Solutions was also a strong contributor, benefiting from strategic initiatives by the company’s new CEO. The company appeared to be on track to achieve its cost-reduction target of $325 million in annual savings by mid-2014. Brand management company Iconix Brand Group, another strong performer, posted solid earnings and revenue in 2013 and raised its full-year guidance. The company has successfully employed a dual strategy of acquisition and share buybacks to boost earnings per share.
Detractors from the Portfolio’s absolute performance included clothing maker Perry Ellis, which possesses some of the historically strongest retail brands in the industry. The company experienced softer-than-expected sales trends in its own stores, as well as those of its partners, which include Kohl’s and Macy’s. As a result, we exited the Portfolio’s position in favor of other opportunities with a more favorable risk/reward profile. Agricultural and construction equipment company Titan Machinery also detracted from performance. We sold the Portfolio’s position in the stock because we felt that the company faced near-term headwinds in its core agricultural machinery business as the outlook for new equipment orders in 2014 diminished. We sold the Portfolio’s position in semiconductor company Volterra Semiconductor early in the reporting period. The semiconductor sector had been under pressure in the latter part of 2012 and early 2013; and after a few successive periods of industrywide price declines, we chose to reduce the Portfolio’s exposure. All three of these detractors had negative returns for the reporting period.
Did the Portfolio make any significant purchases or sales during the reporting period?
The Portfolio made several significant purchases during the reporting period, including Ohio-based
| 1. | Please refer to pages M-2 and M-3 for additional explanations and disclosure regarding the Portfolios, their benchmark indices and service providers mentioned in the reports. |
| | | | |
| mainstayinvestments.com | | | M-443 | |
bank holding company First Financial Bancorp and global online employment solutions company Monster Worldwide. First Bancorp operates 110 branches in Cincinnati, Dayton and Indianapolis. The company has been well capitalized, which has enabled it to distribute 60% to 80% of its earnings to shareholders. We believe that the company will earn favorable returns on capital through organic growth and small acquisitions. We added Monster Worldwide to the Portfolio because the company has generated strong cash flow and repurchased 11% of its shares outstanding year-to-date. Even so, the company still had $139 million remaining on its current authorization, which represents 25% of its current market capitalization. We believe that the company should continue to benefit from improvements in the U.S. economy.
In addition to the sales previously mentioned, the Portfolio sold computers & peripherals company Diebold, which faces increasing competitive pressure in its core ATM business. While the company has had a dominant franchise and a strong management team, we elected to exit the Portfolio’s position in favor of other opportunities with a more favorable risk/reward profile. We sold several other positions as they reached our target price, including positions in machinery companies Navistar International and Colfax.
How did the Portfolio’s sector weightings change during the reporting period?
Sector weights are generally a function of our bottom-up stock selection process. During the reporting period, the Portfolio reduced exposure to consumer discretionary, information technology, industrials and consumer staples. Over the same period, sectors in which the Portfolio increased its weightings included financials, materials and utilities.
How was the Portfolio positioned at the end of the reporting period?
The Portfolio continues to seek attractive returns through a diversified group of companies focused on generating significant free cash flow and returning it to shareholders. Our stock-by-stock selection process often results in the Portfolio having a different composition than the Russell 2500™ Index.
As of December 31, 2013, the Portfolio’s most significantly underweight sector positions relative to the Russell 2500™ Index were in information technology, energy and financials. As of the same date, the Portfolio’s most significantly overweight sector positions were in health care, industrials and consumer discretionary.
The opinions expressed are those of the portfolio managers as of the date of this report and are subject to change. There is no guarantee that any forecasts will come to pass. This material does not constitute investment advice and is not intended as an endorsement of any specific investment.
Not all MainStay VP Portfolios and/or share classes are available under all policies.
| | |
| M-444 | | MainStay VP U.S. Small Cap Portfolio |
Portfolio of Investments December 31, 2013
| | | | | | | | |
| | |
Shares | | | Value | |
| Common Stocks 95.8%† | |
Aerospace & Defense 3.0% | |
¨Curtiss-Wright Corp. | | | 117,150 | | | $ | 7,290,244 | |
Hexcel Corp. (a) | | | 125,810 | | | | 5,622,449 | |
| | | | | | | | |
| | | | | | | 12,912,693 | |
| | | | | | | | |
Auto Components 1.4% | |
Dana Holding Corp. | | | 91,400 | | | | 1,793,268 | |
Visteon Corp. (a) | | | 50,650 | | | | 4,147,729 | |
| | | | | | | | |
| | | | | | | 5,940,997 | |
| | | | | | | | |
Biotechnology 0.7% | |
Alkermes PLC (a) | | | 76,939 | | | | 3,128,340 | |
| | | | | | | | |
|
Building Products 3.4% | |
¨Armstrong World Industries, Inc. (a) | | | 157,260 | | | | 9,059,748 | |
Simpson Manufacturing Co., Inc. | | | 149,860 | | | | 5,504,358 | |
| | | | | | | | |
| | | | | | | 14,564,106 | |
| | | | | | | | |
Capital Markets 2.3% | |
Diamond Hill Investment Group, Inc. | | | 37,350 | | | | 4,419,999 | |
Waddell & Reed Financial, Inc. Class A | | | 80,850 | | | | 5,264,952 | |
| | | | | | | | |
| | | | | | | 9,684,951 | |
| | | | | | | | |
Chemicals 3.6% | |
Chemtura Corp. (a) | | | 210,650 | | | | 5,881,348 | |
Flotek Industries, Inc. (a) | | | 223,970 | | | | 4,495,078 | |
Innophos Holdings, Inc. | | | 97,290 | | | | 4,728,294 | |
| | | | | | | | |
| | | | | | | 15,104,720 | |
| | | | | | | | |
Commercial Banks 10.5% | |
Bank of Hawaii Corp. | | | 99,400 | | | | 5,878,516 | |
BankUnited, Inc. | | | 221,000 | | | | 7,275,320 | |
CVB Financial Corp. | | | 289,647 | | | | 4,944,274 | |
First Financial Bancorp | | | 204,770 | | | | 3,569,141 | |
Investors Bancorp, Inc. | | | 280,750 | | | | 7,181,585 | |
Sterling Financial Corp. | | | 135,950 | | | | 4,633,176 | |
Texas Capital Bancshares, Inc. (a) | | | 56,350 | | | | 3,504,970 | |
¨ViewPoint Financial Group, Inc. | | | 278,200 | | | | 7,636,590 | |
| | | | | | | | |
| | | | | | | 44,623,572 | |
| | | | | | | | |
Commercial Services & Supplies 1.4% | |
Herman Miller, Inc. | | | 199,860 | | | | 5,899,867 | |
| | | | | | | | |
|
Communications Equipment 1.5% | |
Harmonic, Inc. (a) | | | 889,273 | | | | 6,562,835 | |
| | | | | | | | |
|
Construction Materials 0.5% | |
United States Lime & Minerals, Inc. (a) | | | 34,200 | | | | 2,092,014 | |
| | | | | | | | |
|
Containers & Packaging 1.4% | |
Silgan Holdings, Inc. | | | 121,810 | | | | 5,849,316 | |
| | | | | | | | |
| | | | | | | | |
| | |
Shares | | | Value | |
Diversified Consumer Services 1.0% | |
Service Corp. International | | | 242,100 | | | $ | 4,389,273 | |
| | | | | | | | |
|
Diversified Financial Services 0.7% | |
CBOE Holdings, Inc. | | | 58,680 | | | | 3,049,013 | |
| | | | | | | | |
|
Diversified Telecommunication Services 0.9% | |
Lumos Networks Corp. | | | 175,650 | | | | 3,688,650 | |
| | | | | | | | |
|
Electric Utilities 3.9% | |
Cleco Corp. | | | 156,002 | | | | 7,272,813 | |
Great Plains Energy, Inc. | | | 211,700 | | | | 5,131,608 | |
Westar Energy, Inc. | | | 123,700 | | | | 3,979,429 | |
| | | | | | | | |
| | | | | | | 16,383,850 | |
| | | | | | | | |
Electronic Equipment, Instruments & Components 2.1% | |
National Instruments Corp. | | | 151,544 | | | | 4,852,439 | |
OSI Systems, Inc. (a) | | | 79,575 | | | | 4,226,228 | |
| | | | | | | | |
| | | | | | | 9,078,667 | |
| | | | | | | | |
Energy Equipment & Services 1.1% | |
Dril-Quip, Inc. (a) | | | 41,181 | | | | 4,527,027 | |
| | | | | | | | |
|
Food & Staples Retailing 1.4% | |
Spartan Stores, Inc. | | | 248,657 | | | | 6,037,392 | |
| | | | | | | | |
|
Food Products 1.0% | |
TreeHouse Foods, Inc. (a) | | | 62,050 | | | | 4,276,486 | |
| | | | | | | | |
|
Health Care Equipment & Supplies 8.4% | |
Alere, Inc. (a) | | | 71,150 | | | | 2,575,630 | |
Greatbatch, Inc. (a) | | | 61,450 | | | | 2,718,548 | |
Haemonetics Corp. (a) | | | 116,100 | | | | 4,891,293 | |
¨Integra LifeSciences Holdings Corp. (a) | | | 171,806 | | | | 8,196,864 | |
Sirona Dental Systems, Inc. (a) | | | 66,484 | | | | 4,667,177 | |
Teleflex, Inc. | | | 65,250 | | | | 6,124,365 | |
Wright Medical Group, Inc. (a) | | | 214,885 | | | | 6,599,119 | |
| | | | | | | | |
| | | | | | | 35,772,996 | |
| | | | | | | | |
Health Care Providers & Services 4.6% | |
Bio-Reference Laboratories, Inc. (a) | | | 261,980 | | | | 6,690,969 | |
U.S. Physical Therapy, Inc. | | | 132,341 | | | | 4,666,344 | |
¨WellCare Health Plans, Inc. (a) | | | 113,790 | | | | 8,013,092 | |
| | | | | | | | |
| | | | | | | 19,370,405 | |
| | | | | | | | |
Hotels, Restaurants & Leisure 4.6% | |
¨Brinker International, Inc. | | | 172,865 | | | | 8,010,564 | |
Life Time Fitness, Inc. (a) | | | 138,075 | | | | 6,489,525 | |
Monarch Casino & Resort, Inc. (a) | | | 262,984 | | | | 5,280,719 | |
| | | | | | | | |
| | | | | | | 19,780,808 | |
| | | | | | | | |
| † | Percentages indicated are based on Portfolio net assets. |
| ¨ | | Among the Portfolio’s 10 largest holdings, as of December 31, 2013, excluding short-term investment. May be subject to change daily. |
| | | | | | |
The notes to the financial statements are an integral part of,
and should be read in conjunction with, the financial statements. | | mainstayinvestments.com | | | M-445 | |
Portfolio of Investments December 31, 2013 (continued)
| | | | | | | | |
| | |
Shares | | | Value | |
| Common Stocks (continued) | |
Household Durables 1.1% | |
M/I Homes, Inc. (a) | | | 178,950 | | | $ | 4,554,278 | |
| | | | | | | | |
|
Internet Software & Services 0.4% | |
Monster Worldwide, Inc. (a) | | | 250,724 | | | | 1,787,662 | |
| | | | | | | | |
|
IT Services 1.2% | |
Forrester Research, Inc. | | | 134,035 | | | | 5,128,179 | |
| | | | | | | | |
|
Machinery 8.2% | |
Actuant Corp. Class A | | | 46,600 | | | | 1,707,424 | |
Harsco Corp. | | | 199,050 | | | | 5,579,371 | |
Kennametal, Inc. | | | 61,831 | | | | 3,219,540 | |
¨Mueller Industries, Inc. | | | 132,759 | | | | 8,365,145 | |
Mueller Water Products, Inc. Class A | | | 544,800 | | | | 5,104,776 | |
Wabtec Corp. | | | 47,054 | | | | 3,494,701 | |
¨Woodward, Inc. | | | 159,550 | | | | 7,277,075 | |
| | | | | | | | |
| | | | | | | 34,748,032 | |
| | | | | | | | |
Metals & Mining 0.1% | |
Haynes International, Inc. | | | 5,692 | | | | 314,426 | |
| | | | | | | | |
|
Multi-Utilities 1.7% | |
Vectren Corp. | | | 202,010 | | | | 7,171,355 | |
| | | | | | | | |
|
Paper & Forest Products 1.6% | |
KapStone Paper and Packaging Corp. (a) | | | 123,470 | | | | 6,897,034 | |
| | | | | | | | |
|
Professional Services 0.6% | |
Resources Connection, Inc. | | | 176,700 | | | | 2,532,111 | |
| | | | | | | | |
|
Real Estate Investment Trusts 0.7% | |
Tanger Factory Outlet Centers, Inc. | | | 99,200 | | | | 3,176,384 | |
| | | | | | | | |
|
Road & Rail 2.1% | |
Con-way, Inc. | | | 96,050 | | | | 3,814,146 | |
Genesee & Wyoming, Inc. Class A (a) | | | 54,266 | | | | 5,212,249 | |
| | | | | | | | |
| | | | | | | 9,026,395 | |
| | | | | | | | |
Semiconductors & Semiconductor Equipment 3.7% | |
Cypress Semiconductor Corp. (a) | | | 558,090 | | | | 5,859,945 | |
Teradyne, Inc. (a) | | | 231,550 | | | | 4,079,911 | |
Veeco Instruments, Inc. (a) | | | 175,415 | | | | 5,772,908 | |
| | | | | | | | |
| | | | | | | 15,712,764 | |
| | | | | | | | |
Software 1.6% | |
Rovi Corp. (a) | | | 354,600 | | | | 6,982,074 | |
| | | | | | | | |
| | | | | | | | |
| | |
Shares | | | Value | |
Specialty Retail 6.4% | |
American Eagle Outfitters, Inc. | | | 310,960 | | | $ | 4,477,824 | |
Big 5 Sporting Goods Corp. | | | 299,100 | | | | 5,928,162 | |
CST Brands, Inc. | | | 148,350 | | | | 5,447,412 | |
Express, Inc. (a) | | | 244,200 | | | | 4,559,214 | |
JoS. A. Bank Clothiers, Inc. (a) | | | 124,784 | | | | 6,829,428 | |
| | | | | | | | |
| | | | | | | 27,242,040 | |
| | | | | | | | |
Textiles, Apparel & Luxury Goods 2.7% | |
G-III Apparel Group, Ltd. (a) | | | 35,080 | | | | 2,588,553 | |
¨Iconix Brand Group, Inc. (a) | | | 225,850 | | | | 8,966,245 | |
| | | | | | | | |
| | | | | | | 11,554,798 | |
| | | | | | | | |
Thrifts & Mortgage Finance 4.3% | |
Brookline Bancorp, Inc. | | | 529,620 | | | | 5,068,463 | |
Capitol Federal Financial, Inc. | | | 394,060 | | | | 4,772,067 | |
Northwest Bancshares, Inc. | | | 287,100 | | | | 4,243,338 | |
Trustco Bank Corp. | | | 605,760 | | | | 4,349,357 | |
| | | | | | | | |
| | | | | | | 18,433,225 | |
| | | | | | | | |
Total Common Stocks
(Cost $321,802,111) | | | | | | | 407,978,735 | |
| | | | | | | | |
| | |
| | | | | | | | |
| Exchange-Traded Fund 2.5% (b) | |
¨iShares Russell 2000 Value Index Fund | | | 105,370 | | | | 10,484,315 | |
| | | | | | | | |
Total Exchange-Traded Fund
(Cost $8,815,469) | | | | | | | 10,484,315 | |
| | | | | | | | |
| | |
| | | | | | | | |
| | | Principal
Amount | | | | |
| Short-Term Investment 3.0% | |
Repurchase Agreement 3.0% | |
State Street Bank and Trust Co.
0.00%, dated 12/31/13
due 1/2/14
Proceeds at Maturity $12,712,855 (Collateralized by a Federal National Mortgage Association security with a rate of 2.17% and a maturity date of 11/7/22, with a Principal Amount of $14,245,000 and a Market Value of $12,967,437) | | | $12,712,855 | | | | 12,712,855 | |
| | | | | | | | |
Total Short-Term Investment
(Cost $12,712,855) | | | | | | | 12,712,855 | |
| | | | | | | | |
Total Investments
(Cost $343,330,435) (c) | | | 101.3 | % | | | 431,175,905 | |
Other Assets, Less Liabilities | | | (1.3 | ) | | | (5,393,502 | ) |
Net Assets | | | 100.0 | % | | $ | 425,782,403 | |
| | | | |
| M-446 | | MainStay VP U.S. Small Cap Portfolio | | The notes to the financial statements are an integral part of,
and should be read in conjunction with, the financial statements. |
| (a) | Non-income producing security. |
| (b) | Exchange-Traded Fund—An investment vehicle that represents a basket of securities that is traded on an exchange. |
| (c) | As of December 31, 2013, cost is $343,612,392 for federal income tax purposes and net unrealized appreciation is as follows: |
| | | | |
Gross unrealized appreciation | | $ | 88,986,497 | |
Gross unrealized depreciation | | | (1,422,984 | ) |
| | | | |
Net unrealized appreciation | | $ | 87,563,513 | |
| | | | |
The following is a summary of the fair valuations according to the inputs used as of December 31, 2013, for valuing the Portfolio’s assets.
Asset Valuation Inputs
| | | | | | | | | | | | | | | | |
Description | | Quoted Prices
in Active Markets
for Identical Assets (Level 1) | | | Significant Other
Observable Inputs (Level 2) | | | Significant
Unobservable
Inputs
(Level 3) | | | Total | |
| Investments in Securities (a) | | | | | | | | | | | | |
| Common Stocks | | $ | 407,978,735 | | | $ | — | | | $ | — | | | $ | 407,978,735 | |
| Exchange-Traded Fund | | | 10,484,315 | | | | — | | | | — | | | | 10,484,315 | |
| Short-Term Investment | | | | | | | | | | | | | | | | |
Repurchase Agreement | | | — | | | | 12,712,855 | | | | — | | | | 12,712,855 | |
| | | | | | | | | | | | | | | | |
| Total Investments in Securities | | $ | 418,463,050 | | | $ | 12,712,855 | | | $ | — | | | $ | 431,175,905 | |
| | | | | | | | | | | | | | | | |
| (a) | For a complete listing of investments and their industries, see the Portfolio of Investments. |
The Portfolio recognizes transfers between the levels as of the beginning of the period.
For the year ended December 31, 2013, the Portfolio did not have any transfers between Level 1 and Level 2 fair value measurements. (See Note 2)
As of December 31, 2013, the Portfolio did not hold any investments with significant unobservable inputs (Level 3). (See Note 2)
| | | | | | |
The notes to the financial statements are an integral part of,
and should be read in conjunction with, the financial statements. | | mainstayinvestments.com | | | M-447 | |
Statement of Assets and Liabilities as of December 31, 2013
| | | | |
| Assets | |
Investment in securities, at value
(identified cost $343,330,435) | | $ | 431,175,905 | |
Receivables: | | | | |
Dividends and interest | | | 276,725 | |
Fund shares sold | | | 263,811 | |
| | | | |
Total assets | | | 431,716,441 | |
| | | | |
| |
| Liabilities | | | | |
Payables: | | | | |
Investment securities purchased | | | 5,209,735 | |
Fund shares redeemed | | | 355,996 | |
Manager (See Note 3) | | | 270,988 | |
NYLIFE Distributors (See Note 3) | | | 39,749 | |
Professional fees | | | 31,471 | |
Shareholder communication | | | 20,447 | |
Custodian | | | 1,875 | |
Trustees | | | 325 | |
Accrued expenses | | | 3,452 | |
| | | | |
Total liabilities | | | 5,934,038 | |
| | | | |
Net assets | | $ | 425,782,403 | |
| | | | |
| |
| Net Assets Consist of | | | | |
Shares of beneficial interest outstanding (par value of $.001 per share) unlimited number of shares authorized | | $ | 31,286 | |
Additional paid-in capital | | | 309,773,844 | |
| | | | |
| | | 309,805,130 | |
Undistributed net investment income | | | 848,357 | |
Accumulated net realized gain (loss) on investments | | | 27,283,446 | |
Net unrealized appreciation (depreciation) on investments | | | 87,845,470 | |
| | | | |
Net assets | | $ | 425,782,403 | |
| | | | |
| | | | |
Initial Class | | | | |
Net assets applicable to outstanding shares | | $ | 232,795,144 | |
| | | | |
Shares of beneficial interest outstanding | | | 16,894,105 | |
| | | | |
Net asset value per share outstanding | | $ | 13.78 | |
| | | | |
Service Class | | | | |
Net assets applicable to outstanding shares | | $ | 192,987,259 | |
| | | | |
Shares of beneficial interest outstanding | | | 14,391,614 | |
| | | | |
Net asset value per share outstanding | | $ | 13.41 | |
| | | | |
| | | | |
| M-448 | | MainStay VP U.S. Small Cap Portfolio | | The notes to the financial statements are an integral part of,
and should be read in conjunction with, the financial statements. |
Statement of Operations for the year ended December 31, 2013
| | | | |
| Investment Income (Loss) | |
Income | | | | |
Dividends (a) | | $ | 3,900,603 | |
Interest | | | 393 | |
| | | | |
Total income | | | 3,900,996 | |
| | | | |
Expenses | | | | |
Manager (See Note 3) | | | 2,523,895 | |
Distribution and service—Service Class (See Note 3) | | | 392,969 | |
Professional fees | | | 52,897 | |
Shareholder communication | | | 52,019 | |
Custodian | | | 10,251 | |
Trustees | | | 6,224 | |
Miscellaneous | | | 14,311 | |
| | | | |
Total expenses | | | 3,052,566 | |
| | | | |
Net investment income (loss) | | | 848,430 | |
| | | | |
|
| Realized and Unrealized Gain (Loss) on Investments | |
Net realized gain (loss) on investments | | | 41,414,764 | |
Net change in unrealized appreciation (depreciation) on investments | | | 59,326,736 | |
| | | | |
Net realized and unrealized gain (loss) on investments | | | 100,741,500 | |
| | | | |
Net increase (decrease) in net assets resulting
from operations | | $ | 101,589,930 | |
| | | | |
| (a) | Dividends recorded net of foreign withholding taxes in the amount of $3,367. |
| | | | | | |
The notes to the financial statements are an integral part of,
and should be read in conjunction with, the financial statements. | | mainstayinvestments.com | | | M-449 | |
Statements of Changes in Net Assets
for the years ended December 31, 2013 and December 31, 2012
| | | | | | | | |
| | | 2013 | | | 2012 | |
| Increase (Decrease) in Net Assets | |
Operations: | | | | | | | | |
Net investment income (loss) | | $ | 848,430 | | | $ | 2,224,006 | |
Net realized gain (loss) on investments | | | 41,414,764 | | | | 10,201,224 | |
Net change in unrealized appreciation (depreciation) on investments | | | 59,326,736 | | | | 18,501,297 | |
| | | | |
Net increase (decrease) in net assets resulting from operations | | | 101,589,930 | | | | 30,926,527 | |
| | | | |
Dividends to shareholders: | | | | | | | | |
From net investment income: | | | | | | | | |
Initial Class | | | (1,307,542 | ) | | | (618,731 | ) |
Service Class | | | (916,377 | ) | | | (261,257 | ) |
| | | | |
Total dividends to shareholders | | | (2,223,919 | ) | | | (879,988 | ) |
| | | | |
Capital share transactions: | | | | | | | | |
Net proceeds from sale of shares | | | 123,702,079 | | | | 46,215,355 | |
Net asset value of shares issued to shareholders in reinvestment of dividends | | | 2,223,919 | | | | 879,988 | |
Cost of shares redeemed | | | (52,728,871 | ) | | | (80,685,957 | ) |
| | | | |
Increase (decrease) in net assets derived from capital share transactions | | | 73,197,127 | | | | (33,590,614 | ) |
| | | | |
Net increase (decrease) in net assets | | | 172,563,138 | | | | (3,544,075 | ) |
|
| Net Assets | |
Beginning of year | | | 253,219,265 | | | | 256,763,340 | |
| | | | |
End of year | | $ | 425,782,403 | | | $ | 253,219,265 | |
| | | | |
Undistributed net investment income
at end of year | | $ | 848,357 | | | $ | 2,223,915 | |
| | | | |
| | | | |
| M-450 | | MainStay VP U.S. Small Cap Portfolio | | The notes to the financial statements are an integral part of,
and should be read in conjunction with, the financial statements. |
Financial Highlights selected per share data and ratios
| | | | | | | | | | | | | | | | | | | | |
| | | Initial Class | |
| | | Year ended December 31, | |
| | | 2013 | | | 2012 | | | 2011 | | | 2010 | | | 2009 | |
Net asset value at beginning of year | | $ | 10.06 | | | $ | 8.96 | | | $ | 9.31 | | | $ | 7.45 | | | $ | 5.28 | |
| | | | | | | | | | | | | | | | | | | | |
Net investment income (loss) (a) | | | 0.05 | | | | 0.09 | | | | 0.04 | | | | 0.08 | | | | (0.00 | )‡ |
Net realized and unrealized gain (loss) on investments | | | 3.76 | | | | 1.05 | | | | (0.33 | ) | | | 1.78 | | | | 2.17 | |
| | | | | | | | | | | | | | | | | | | | |
Total from investment operations | | | 3.81 | | | | 1.14 | | | | (0.29 | ) | | | 1.86 | | | | 2.17 | |
| | | | | | | | | | | | | | | | | | | | |
Less dividends: | | | | | | | | | | | | | | | | | | | | |
From net investment income | | | (0.09 | ) | | | (0.04 | ) | | | (0.06 | ) | | | (0.00 | )‡ | | | — | |
| | | | | | | | | | | | | | | | | | | | |
Net asset value at end of year | | $ | 13.78 | | | $ | 10.06 | | | $ | 8.96 | | | $ | 9.31 | | | $ | 7.45 | |
| | | | | | | | | | | | | | | | | | | | |
Total investment return | | | 37.90 | % | | | 12.80 | % | | | (2.75 | %) | | | 25.03 | % | | | 41.10 | % (b) |
Ratios (to average net assets)/Supplemental Data: | | | | | | | | | | | | | | | | | | | | |
Net investment income (loss) | | | 0.39 | % | | | 0.98 | % | | | 0.46 | % | | | 0.98 | % | | | (0.02 | %) |
Net expenses | | | 0.82 | % | | | 0.83 | % | | | 0.84 | % | | | 0.85 | % | | | 1.08 | % |
Portfolio turnover rate | | | 40 | % | | | 32 | % | | | 46 | % | | | 70 | % | | | 186 | % |
Net assets at end of year (in 000’s) | | $ | 232,795 | | | $ | 128,576 | | | $ | 141,113 | | | $ | 107,627 | | | $ | 76,143 | |
| ‡ | Less than one cent per share. |
| (a) | Per share data based on average shares outstanding during the year. |
| (b) | Total investment return may reflect adjustments to conform to generally accepted accounting principles. |
| | | | | | | | | | | | | | | | | | | | |
| | | Service Class | |
| | | Year ended December 31, | |
| | | 2013 | | | 2012 | | | 2011 | | | 2010 | | | 2009 | |
Net asset value at beginning of year | | $ | 9.80 | | | $ | 8.73 | | | $ | 9.07 | | | $ | 7.27 | | | $ | 5.17 | |
| | | | | | | | | | | | | | | | | | | | |
Net investment income (loss) (a) | | | 0.01 | | | | 0.06 | | | | 0.02 | | | | 0.07 | | | | (0.02 | ) |
Net realized and unrealized gain (loss) on investments | | | 3.67 | | | | 1.03 | | | | (0.30 | ) | | | 1.73 | | | | 2.12 | |
| | | | | | | | | | | | | | | | | | | | |
Total from investment operations | | | 3.68 | | | | 1.09 | | | | (0.28 | ) | | | 1.80 | | | | 2.10 | |
| | | | | | | | | | | | | | | | | | | | |
Less dividends: | | | | | | | | | | | | | | | | | | | | |
From net investment income | | | (0.07 | ) | | | (0.02 | ) | | | (0.06 | ) | | | — | | | | — | |
| | | | | | | | | | | | | | | | | | | | |
Net asset value at end of year | | $ | 13.41 | | | $ | 9.80 | | | $ | 8.73 | | | $ | 9.07 | | | $ | 7.27 | |
| | | | | | | | | | | | | | | | | | | | |
Total investment return | | | 37.56 | % | | | 12.52 | % | | | (2.99 | %) | | | 24.76 | %(b) | | | 40.62 | % (b) |
Ratios (to average net assets)/Supplemental Data: | | | | | | | | | | | | | | | | | | | | |
Net investment income (loss) | | | 0.13 | % | | | 0.69 | % | | | 0.19 | % | | | 0.84 | % | | | (0.39 | %) |
Net expenses | | | 1.07 | % | | | 1.08 | % | | | 1.09 | % | | | 1.10 | % | | | 1.33 | % |
Portfolio turnover rate | | | 40 | % | | | 32 | % | | | 46 | % | | | 70 | % | | | 186 | % |
Net assets at end of year (in 000’s) | | $ | 192,987 | | | $ | 124,643 | | | $ | 115,651 | | | $ | 132,906 | | | $ | 109,781 | |
| (a) | Per share data based on average shares outstanding during the year. |
| (b) | Total investment returns may reflect adjustments to conform to generally accepted accounting principles. |
| | | | | | |
The notes to the financial statements are an integral part of,
and should be read in conjunction with, the financial statements. | | mainstayinvestments.com | | | M-451 | |
MainStay VP Van Eck Global Hard Assets Portfolio
Investment and Performance Comparison (Unaudited)
Performance data quoted represents past performance. Past performance is no guarantee of future results. Because of market volatility, current performance may be lower or higher than the figures shown. Investment return and principal value will fluctuate, and as a result, when shares are redeemed, they may be worth more or less than their original cost. The performance table and graph do not reflect any deduction of sales charges, mortality and expense charges, contract charges or administrative charges. Please refer to the Performance Summary appropriate for your policy. For performance information current to the most recent month-end, please call 800-598-2019 or visit www.newyorklife.com.
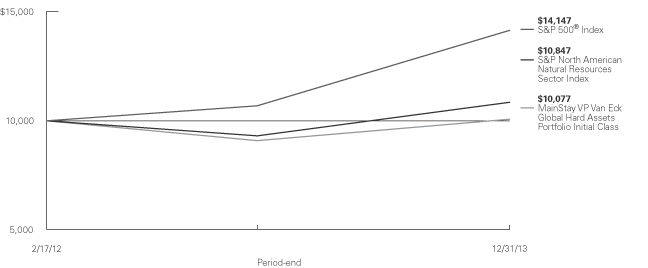
Total Returns for the Period Ended December 31, 2013
| | | | | | | | | | | | |
| Class | | One Year | | | Since Inception (2/17/12) | | | Gross Expense Ratio1 | |
| Initial Class Shares | | | 10.96 | % | | | 0.41 | % | | | 0.94 | % |
| | | | | | | | |
| Benchmark Performance | | One
Year | | | Since
Inception
(2/17/12) | |
S&P North American Natural Resources Sector Index2 | | | 16.49 | % | | | 4.45 | % |
S&P 500® Index2 | | | 32.39 | | | | 20.41 | |
Average Lipper Variable Products Natural Resources Portfolio3 | | | 10.40 | | | | –0.09 | |
| 1. | The gross expense ratios presented reflect the Portfolio’s “Total Annual Portfolio Operating Expenses” from the most recent Prospectus and may differ from other expense ratios disclosed in this report. |
| 2. | Please refer to pages M-2 and M-3 for additional explanations and disclosure regarding the Portfolios, their benchmark indices and other indices mentioned in the reports. |
| 3. | The Average Lipper Variable Products Natural Resources Portfolio is representative of portfolios that, by portfolio |
| | practice, invest primarily in the equity securities of domestic companies engaged in the exploration, development, production, or distribution of natural resources. Lipper Inc. is an independent monitor of fund performance. Results are based on total returns with all dividend and capital gain distributions reinvested. |
| | |
| M-452 | | MainStay VP Van Eck Global Hard Assets Portfolio |
Cost in Dollars of a $1,000 Investment in MainStay VP Van Eck Global Hard Assets Portfolio (Unaudited)
The example below is intended to describe the fees and expenses borne by shareholders during the period from July 1, 2013, to December 31, 2013, and the impact of those costs on your investment.
Example
As a shareholder of the Portfolio, you incur two types of costs: (1) transaction costs, including exchange fees and sales charges (loads) on purchases (as applicable), and (2) ongoing costs, including management fees, distribution and/or service (12b-1) fees, and other Portfolio expenses (as applicable). This example is intended to help you understand your ongoing costs (in dollars) of investing in the Portfolio and to compare these costs with the ongoing costs of investing in other Portfolios. The example is based on an investment of $1,000 made at the beginning of the six-month period and held for the entire period from July 1, 2013, to December 31, 2013. Shares are only sold in connection with variable life and annuity contracts and the example does not reflect any contract level or transactional fees or expenses. If these costs had been included, your costs would have been higher.
This example illustrates your Portfolio’s ongoing costs in two ways:
Actual Expenses
The second and third data columns in the table below provide information about actual account values and actual expenses. You may use the information in these columns, together with the amount you invested, to estimate the expenses that you paid during the six months ended
December 31, 2013. Simply divide your account value by $1,000 (for example, an $8,600 account value divided by $1,000 = 8.6), then multiply the result by the number under the heading entitled ‘‘Expenses Paid During Period’’ to estimate the expenses you paid on your account during this period.
Hypothetical Example for Comparison Purposes
The fourth and fifth data columns in the table below provide information about hypothetical account values and hypothetical expenses based on the Portfolio’s actual expense ratio and an assumed rate of return of 5% per year before expenses, which is not the Portfolio’s actual return. The hypothetical account values and expenses may not be used to estimate the actual ending account balances or expenses you paid for the six-month period shown. You may use this information to compare the ongoing costs of investing in the Portfolio with the ongoing costs of investing in other Portfolios. To do so, compare this 5% hypothetical example with the 5% hypothetical examples that appear in the shareholder reports of the other Portfolios.
Please note that the expenses shown in the table are meant to highlight your ongoing costs only and do not reflect any transactional costs, such as exchange fees or sales charges (loads). Therefore, the fourth and fifth data columns of the table are useful in comparing ongoing costs only and will not help you determine the relative total costs of owning different funds. In addition, if these transactional costs were included, your costs would have been higher.
| | | | | | | | | | | | | | | | | | | | |
| | | | | | | | | | | | | | | | |
| Share Class | | Beginning
Account
Value
7/1/13 | | | Ending Account
Value (Based
on Actual
Returns and
Expenses)
12/31/13 | | | Expenses
Paid
During
Period1 | | | Ending Account
Value (Based
on Hypothetical
5% Annualized
Return and
Actual Expenses)
12/31/13 | | | Expenses
Paid
During
Period1 | |
| | | | | |
| Initial Class Shares | | $ | 1,000.00 | | | $ | 1,165.00 | | | $ | 5.07 | | | $ | 1,020.50 | | | $ | 4.74 | |
| 1. | Expenses are equal to the Portfolio’s annualized expense ratio of 0.93% multiplied by the average account value over the period, divided by 365 and multiplied by 184 (to reflect the six-month period). The table above represents the actual expenses incurred during the six-month period. |
| | | | |
| mainstayinvestments.com | | | M-453 | |
Portfolio Composition as of December 31, 2013 (Unaudited)
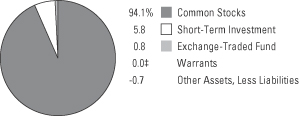
See Portfolio of Investments beginning on page M-457 for specific holdings within these categories.
| ‡ | Less than one-tenth of a percent. |
Top Ten Holdings as of December 31, 2013 (excluding short-term investment) (Unaudited)
| 7. | Pioneer Natural Resources Co. |
| 9. | First Quantum Minerals, Ltd. |
| 10. | Anadarko Petroleum Corp. |
| | |
| M-454 | | MainStay VP Van Eck Global Hard Assets Portfolio |
Portfolio Management Discussion and Analysis (Unaudited)
Answers to the questions reflect the views of portfolio managers Charles T. Cameron and Shawn Reynolds of Van Eck Associates Corporation (“Van Eck”), the Portfolio’s Subadvisor.
How did MainStay VP Van Eck Global Hard Assets Portfolio perform relative to its benchmark and peers during the 12 months ended December 31, 2013?
For the 12 months ended December 31, 2013, MainStay VP Van Eck Global Hard Assets Portfolio returned 10.96% for Initial Class shares. Over the same period, the Portfolio underperformed the 16.49% return of the S&P North American Natural Resources Sector Index,1 which is the Portfolio’s broad-based securities-market index. Over the same period, both share classes underperformed the 32.39% return of the S&P 500® Index,1 which is the Portfolio’s secondary benchmark.The Portfolio outperformed the 10.40% return of the average Lipper1 Variable Products Natural Resources Portfolio for the 12 months ended December 31, 2013.
What factors affected the Portfolio’s relative performance during the reporting period?
Overweight positions in gold and in diversified metals & mining detracted from the Portfolio’s performance in relation to the S&P North American Natural Resources Sector Index. As growth slowed in the emerging markets, metals & mining shares and commodities underperformed energy shares and commodities.
Which subindustries were the strongest positive contributors to the Portfolio’s relative performance, and which subindustries were particularly weak?
The subindustries that made the strongest positive contributions to the Portfolio’s performance relative to the S&P North American Natural Resources Sector Index were oil & gas exploration & production, precious metals & minerals, and agricultural products. (Contributions take weightings and total returns into account.) In the oil & gas exploration & production subindustry, an overweight allocation and, to a greater extent, stock selection contributed to relative performance. The precious metals & minerals subindustry consists mostly of silver mining stocks that had significantly negative performance during the reporting period. Fortunately, the Portfolio had no exposure to this subindustry, which explains the positive contribution to relative performance. On the other hand, the Portfolio had exposure to the agricultural products subindustry through its position in Archer-Daniels-Midland. This out-of-benchmark stock showed positive performance during the
reporting period, which accounts for the positive subindustry contribution.
The subindustries that detracted the most from the Portfolio’s performance relative to the S&P North American Natural Resources Sector Index were gold, diversified metals & mining, and steel.
During the reporting period, which individual stocks made the strongest positive contributions to the Portfolio’s absolute performance and which stocks detracted the most?
The Portfolio’s strongest individual contributions came mainly from energy-related companies. Oil & gas exploration & production companies Pioneer Natural Resources and Cimarex Energy were the two strongest contributors. Both stocks advanced on strong drilling results and resource additions in the Permian Basin of West Texas. Shares of oilfield services giant Halliburton rose on strong revenue growth from North American unconventional drilling activities and continued expansion in international exploration and development operations.
The Portfolio’s greatest detractors were all gold companies. Shares of Newmont Mining, New Gold and Eldorado Gold all dropped amid broad weakness in the gold mining sector, driven by falling gold prices.
Did the Portfolio make any significant purchases or sales during the reporting period?
The Portfolio made significant purchases in the oil & gas refining & marketing subindustry, adding shares of Phillips 66, Marathon Petroleum and Delek. The Portfolio’s largest sales during the reporting period were diversified metals & mining companies Rio Tinto, BHP Billiton and Freeport-McMoRan Copper & Gold. All three stocks were eliminated from the Portfolio before December 31, 2013. The Portfolio’s overall exposure to diversified metals & mining was reduced because of slowing growth in emerging markets and weakness in base-metal and bulk-commodity prices.
How did the Portfolio’s sector weightings change during the reporting period?
During the reporting period, the Portfolio reduced its positions in the diversified metals & mining and gold subindustries. The Portfolio also reduced its cash position. The Portfolio’s allocation to the energy sector trended higher during the reporting period.
| 1. | Please refer to pages M-2 and M-3 for additional explanations and disclosure regarding the Portfolios, their benchmark indices and service providers mentioned in the reports. |
| | | | |
| mainstayinvestments.com | | | M-455 | |
Within the energy sector, the oil & gas refining & marketing subindustry saw the most significant allocation increase. Allocations also increased in the oil & gas exploration & production and oil & gas equipment & services subindustries.
How was the Portfolio positioned at the end of the reporting period?
As of December 31, 2013, the Portfolio remained underweight relative to the S&P North American
Natural Resources Sector Index in the energy sector overall, but held one of its highest historical energy allocations. Within energy, the Portfolio held overweight positions in the oil & gas equipment & services, oil & gas drilling, and oil & gas exploration & production subindustries as of December 31, 2013. On the same date, the Portfolio was also overweight relative to the S&P North American Natural Resources Sector Index in the diversified metals & mining and agricultural products subindustries.
The opinions expressed are those of the portfolio managers as of the date of this report and are subject to change. There is no guarantee that any forecasts made will come to pass. This material does not constitute investment advice and is not intended as an endorsement of any specific investment.
Not all MainStay VP Portfolios and/or share classes are available under all policies.
| | |
| M-456 | | MainStay VP Van Eck Global Hard Assets Portfolio |
Portfolio of Investments December 31, 2013
| | | | | | | | |
| | |
Shares | | |
Value | |
| Common Stocks 94.1%† | |
Canada 7.8% | |
Agrium, Inc. (Chemicals) | | | 89,400 | | | $ | 8,178,312 | |
Eldorado Gold Corp. (Metals & Mining) | | | 891,000 | | | | 5,069,790 | |
¨First Quantum Minerals, Ltd. (Metals & Mining) | | | 1,038,100 | | | | 18,704,857 | |
Goldcorp, Inc. (Metals & Mining) | | | 289,100 | | | | 6,264,797 | |
Kinross Gold Corp. (Metals & Mining) | | | 612,800 | | | | 2,684,064 | |
New Gold, Inc. (Metals & Mining) (a) | | | 978,300 | | | | 5,126,292 | |
| | | | | | | | |
| | | | | | | 46,028,112 | |
| | | | | | | | |
Norway 0.9% | |
Seadrill, Ltd. (Energy Equipment & Services) | | | 132,800 | | | | 5,455,424 | |
| | | | | | | | |
|
Switzerland 5.1% | |
¨Glencore Xstrata PLC (Oil, Gas & Consumable Fuels) (a) | | | 5,830,030 | | | | 30,188,801 | |
| | | | | | | | |
|
United Kingdom 5.1% | |
Afren PLC (Oil, Gas & Consumable Fuels) (a) | | | 4,204,500 | | | | 11,780,451 | |
African Minerals, Ltd. (Metals & Mining) (a) | | | 404,000 | | | | 1,326,300 | |
Genel Energy PLC (Oil, Gas & Consumable Fuels) (a) | | | 189,900 | | | | 3,380,498 | |
Ophir Energy PLC (Oil, Gas & Consumable Fuels) (a) | | | 1,150,000 | | | | 6,242,434 | |
Randgold Resources, Ltd., ADR(Metals & Mining) | | | 121,000 | | | | 7,600,010 | |
| | | | | | | | |
| | | | | | | 30,329,693 | |
| | | | | | | | |
United States 75.2% | |
Alpha Natural Resources, Inc. (Oil, Gas & Consumable Fuels) (a) | | | 136,400 | | | | 973,896 | |
¨Anadarko Petroleum Corp. (Oil, Gas & Consumable Fuels) | | | 226,600 | | | | 17,973,912 | |
Archer-Daniels-Midland Co. (Food Products) | | | 94,500 | | | | 4,101,300 | |
Atwood Oceanics, Inc. (Energy Equipment & Services) (a) | | | 205,100 | | | | 10,950,289 | |
Cameron International Corp. (Energy Equipment & Services) (a) | | | 293,400 | | | | 17,466,102 | |
¨Cimarex Energy Co. (Oil, Gas & Consumable Fuels) | | | 210,400 | | | | 22,073,064 | |
Cloud Peak Energy, Inc. (Oil, Gas & Consumable Fuels) (a) | | | 162,500 | | | | 2,925,000 | |
¨Concho Resources, Inc. (Oil, Gas & Consumable Fuels) (a) | | | 195,600 | | | | 21,124,800 | |
¨CONSOL Energy, Inc. (Oil, Gas & Consumable Fuels) | | | 581,300 | | | | 22,112,652 | |
Cummins, Inc. (Machinery) | | | 67,700 | | | | 9,543,669 | |
Delek US Holdings, Inc. (Oil, Gas & Consumable Fuels) | | | 194,400 | | | | 6,689,304 | |
| | | | | | | | |
| | |
Shares | | |
Value | |
United States (continued) | |
Diamond Offshore Drilling, Inc. (Energy Equipment & Services) | | | 88,200 | | | $ | 5,020,344 | |
Diamondback Energy, Inc. (Oil, Gas & Consumable Fuels) (a) | | | 129,149 | | | | 6,826,816 | |
Dril-Quip, Inc. (Energy Equipment & Services) (a) | | | 109,000 | | | | 11,982,370 | |
EOG Resources, Inc. (Oil, Gas & Consumable Fuels) | | | 94,600 | | | | 15,877,664 | |
Green Plains Renewable Energy, Inc. (Oil, Gas & Consumable Fuels) | | | 34,900 | | | | 676,711 | |
Gulfport Energy Corp. (Oil, Gas & Consumable Fuels) (a) | | | 53,000 | | | | 3,346,950 | |
Halcon Resources Corp. (Oil, Gas & Consumable Fuels) (a) | | | 745,100 | | | | 2,876,086 | |
¨Halliburton Co. (Energy Equipment & Services) | | | 441,500 | | | | 22,406,125 | |
HollyFrontier Corp. (Oil, Gas & Consumable Fuels) | | | 301,400 | | | | 14,976,566 | |
Jacobs Engineering Group, Inc. (Construction & Engineering) (a) | | | 72,300 | | | | 4,554,177 | |
Louisiana-Pacific Corp. (Paper & Forest Products) (a) | | | 555,200 | | | | 10,276,752 | |
¨Marathon Oil Corp. (Oil, Gas & Consumable Fuels) | | | 551,200 | | | | 19,457,360 | �� |
Marathon Petroleum Corp. (Oil, Gas & Consumable Fuels) | | | 157,900 | | | | 14,484,167 | |
Nabors Industries, Ltd. (Energy Equipment & Services) | | | 107,000 | | | | 1,817,930 | |
National Oilwell Varco, Inc. (Energy Equipment & Services) | | | 218,800 | | | | 17,401,164 | |
Newfield Exploration Co. (Oil, Gas & Consumable Fuels) (a) | | | 282,100 | | | | 6,948,123 | |
Newmont Mining Corp. (Metals & Mining) | | | 291,100 | | | | 6,704,033 | |
Noble Corp. PLC (Energy Equipment & Services) | | | 203,100 | | | | 7,610,157 | |
Occidental Petroleum Corp. (Oil, Gas & Consumable Fuels) | | | 169,700 | | | | 16,138,470 | |
Phillips 66 (Oil, Gas & Consumable Fuels) | | | 201,900 | | | | 15,572,547 | |
¨Pioneer Natural Resources Co. (Oil, Gas & Consumable Fuels) | | | 112,000 | | | | 20,615,840 | |
¨Schlumberger, Ltd. (Energy Equipment & Services) | | | 258,000 | | | | 23,248,380 | |
Scorpio Tankers, Inc. (Oil, Gas & Consumable Fuels) | | | 227,500 | | | | 2,682,225 | |
SM Energy Co. (Oil, Gas & Consumable Fuels) | | | 207,900 | | | | 17,278,569 | |
Steel Dynamics, Inc. (Metals & Mining) | | | 262,800 | | | | 5,135,112 | |
Superior Energy Services, Inc. (Energy Equipment & Services) (a) | | | 345,400 | | | | 9,191,094 | |
| † | Percentages indicated are based on Portfolio net assets. |
| ¨ | | Among the Portfolio’s 10 largest holdings, as of December 31, 2013, excluding short-term investment. May be subject to change daily. |
| | | | | | |
The notes to the financial statements are an integral part of,
and should be read in conjunction with, the financial statements. | | mainstayinvestments.com | | | M-457 | |
Portfolio of Investments December 31, 2013 (continued)
| | | | | | | | |
| | |
Shares | | |
Value | |
| Common Stocks (continued) | |
United States (continued) | |
Tesoro Corp. (Oil, Gas & Consumable Fuels) | | | 257,300 | | | $ | 15,052,050 | |
United States Steel Corp. (Metals & Mining) | | | 212,100 | | | | 6,256,950 | |
Whiting Petroleum Corp. (Oil, Gas & Consumable Fuels) (a) | | | 77,508 | | | | 4,795,420 | |
| | | | | | | | |
| | | | | | | 445,144,140 | |
| | | | | | | | |
Total Common Stocks
(Cost $536,536,657) | | | | | | | 557,146,170 | |
| | | | | | | | |
|
| Exchange-Traded Fund 0.8% (b) | |
United States 0.8% | |
SPDR Gold Shares (Capital Markets) (a) | | | 42,800 | | | | 4,972,076 | |
| | | | | | | | |
Total Exchange-Traded Fund
(Cost $7,147,852) | | | | | | | 4,972,076 | |
| | | | | | | | |
| | |
| | | | | | | | |
| | | Number of
Warrants | | | | |
| Warrants 0.0%‡ | |
Canada 0.0%‡ | |
Kinross Gold Corp.
Strike Price $21.30
Expires 9/17/14 (Metals & Mining) (a) | | | 34,300 | | | | 484 | |
| | | | | | | | |
Total Warrants
(Cost $36,859) | | | | | | | 484 | |
| | | | | | | | |
| | |
| | | | | | | | |
| | | Principal
Amount | | | | |
| Short-Term Investment 5.8% | |
Repurchase Agreement 5.8% | |
United States 5.8% | |
State Street Bank and Trust Co.
0.00%, dated 12/31/13
due 1/2/14
Proceeds at Maturity $34,094,397 (Collateralized by a Federal National Mortgage Association security with a rate of 2.17% and a maturity date of 11/7/22, with a Principal Amount of $38,205,000 and a Market Value of $34,778,585) (Capital Markets) | | $ | 34,094,397 | | | | 34,094,397 | |
| | | | | | | | |
Total Short-Term Investment
(Cost $34,094,397) | | | | | | | 34,094,397 | |
| | | | | | | | |
Total Investments
(Cost $577,815,765) (c) | | | 100.7 | % | | | 596,213,127 | |
Other Assets, Less Liabilities | | | (0.7 | ) | | | (4,323,539 | ) |
Net Assets | | | 100.0 | % | | $ | 591,889,588 | |
| ‡ | Less than one-tenth of a percent. |
| (a) | Non-income producing security. |
| (b) | Exchange-Traded Fund—An investment vehicle that represents a basket of securities that is traded on an exchange. |
| (c) | As of December 31, 2013, cost is $578,554,213 for federal income tax purposes and net unrealized appreciation is as follows: |
| | | | |
Gross unrealized appreciation | | $ | 77,898,457 | |
Gross unrealized depreciation | | | (60,239,543 | ) |
| | | | |
Net unrealized appreciation | | $ | 17,658,914 | |
| | | | |
The following abbreviations are used in the above portfolio:
| ADR—American | Depositary Receipt |
| SPDR—Standard | & Poor’s Depositary Receipt |
| | | | |
| M-458 | | MainStay VP Van Eck Global Hard Assets Portfolio | | The notes to the financial statements are an integral part of,
and should be read in conjunction with, the financial statements. |
The following is a summary of the fair valuations according to the inputs used as of December 31, 2013, for valuing the Portfolio’s assets.
Asset Valuation Inputs
| | | | | | | | | | | | | | | | |
Description | | Quoted Prices
in Active Markets
for Identical Assets (Level 1) | | | Significant Other
Observable Inputs (Level 2) | | | Significant
Unobservable
Inputs (Level 3) | | | Total | |
| Investments in Securities (a) | | | | | | | | | | | | | | | | |
| Common Stocks | | $ | 557,146,170 | | | $ | — | | | $ | — | | | $ | 557,146,170 | |
| Exchange-Traded Fund | | | 4,972,076 | | | | — | | | | — | | | | 4,972,076 | |
| Warrants | | | 484 | | | | — | | | | — | | | | 484 | |
| Short-Term Investment | | | | | | | | | | | | | | | | |
Repurchase Agreement | | | — | | | | 34,094,397 | | | | — | | | | 34,094,397 | |
| | | | | | | | | | | | | | | | |
| Total Investments in Securities | | $ | 562,118,730 | | | $ | 34,094,397 | | | $ | — | | | $ | 596,213,127 | |
| | | | | | | | | | | | | | | | |
| (a) | For a complete listing of investments and their industries, see the Portfolio of Investments. |
The Portfolio recognizes transfers between the levels as of the beginning of the period.
As of the year ended December 31, 2013, certain foreign securities with a market value of $16,325,652 were transferred from Level 2 to Level 1 as the prices of these securities were based on unadjusted quoted prices compared with the prior year prices which were adjusted for events after the market close. The December 31, 2012 prices were adjusted by applying factors provided by a third party vendor in accordance with the Portfolio’s policies and procedures. Fair values as of December 31, 2013 for these securities were based on quoted prices in active markets for identical investments. (See Note 2)
As of December 31, 2013, the Portfolio did not hold any investments with significant unobservable inputs (Level 3). (See Note 2)
The table below sets forth the diversification of MainStay VP Van Eck Global Hard Assets Portfolio investments by industry.
Industry Diversification (Unaudited)
| | | | | | | | |
| | | Value | | | Percent† | |
Capital Markets | | $ | 39,066,473 | | | | 6.6 | % |
Chemicals | | | 8,178,312 | | | | 1.4 | |
Construction & Engineering | | | 4,554,177 | | | | 0.8 | |
Energy Equipment & Services | | | 132,549,379 | | | | 22.4 | |
Food Products | | | 4,101,300 | | | | 0.7 | |
Machinery | | | 9,543,669 | | | | 1.6 | |
Metals & Mining | | | 64,872,689 | | | | 10.9 | |
Oil, Gas & Consumable Fuels | | | 323,070,376 | | | | 54.6 | |
Paper & Forest Products | | | 10,276,752 | | | | 1.7 | |
| | | | | | | | |
| | | 596,213,127 | | | | 100.7 | |
Other Assets, Less Liabilities | | | (4,323,539 | ) | | | (0.7 | ) |
| | | | | | | | |
Net Assets | | $ | 591,889,588 | | | | 100.0 | % |
| | | | | | | | |
| † | Percentages indicated are based on Portfolio net assets. |
| | | | | | |
The notes to the financial statements are an integral part of,
and should be read in conjunction with, the financial statements. | | mainstayinvestments.com | | | M-459 | |
Statement of Assets and Liabilities as of December 31, 2013
| | | | |
| Assets | |
Investment in securities, at value (identified cost $577,815,765) | | $ | 596,213,127 | |
Cash denominated in foreign currencies (identified cost $212) | | | 215 | |
Receivables: | | | | |
Dividends and interest | | | 275,134 | |
Fund shares sold | | | 255,980 | |
| | | | |
Total assets | | | 596,744,456 | |
| | | | |
| |
| Liabilities | | | | |
Payables: | | | | |
Investment securities purchased | | | 3,727,221 | |
Fund shares redeemed | | | 619,044 | |
Manager (See Note 3) | | | 438,612 | |
Professional fees | | | 34,314 | |
Shareholder communication | | | 31,069 | |
Custodian | | | 3,249 | |
Trustees | | | 735 | |
Accrued expenses | | | 624 | |
| | | | |
Total liabilities | | | 4,854,868 | |
| | | | |
Net assets | | $ | 591,889,588 | |
| | | | |
| |
| Net Assets Consist of | | | | |
Shares of beneficial interest outstanding (par value of $.001 per share) unlimited number of shares authorized | | $ | 59,384 | |
Additional paid-in capital | | | 603,878,671 | |
| | | | |
| | | 603,938,055 | |
Undistributed net investment income | | | 2,148,794 | |
Accumulated net realized gain (loss) on investments and foreign currency transactions | | | (32,594,626 | ) |
Net unrealized appreciation (depreciation) on investments | | | 18,397,362 | |
Net unrealized appreciation (depreciation) on translation of other assets and liabilities in foreign currencies | | | 3 | |
| | | | |
Net assets applicable to outstanding shares | | $ | 591,889,588 | |
| | | | |
Shares of beneficial interest outstanding | | | 59,383,806 | |
| | | | |
Net asset value per share outstanding | | $ | 9.97 | |
| | | | |
| | | | |
| M-460 | | MainStay VP Van Eck Global Hard Assets Portfolio | | The notes to the financial statements are an integral part of,
and should be read in conjunction with, the financial statements. |
Statement of Operations for the year ended December 31, 2013
| | | | |
| Investment Income (Loss) | |
Income | | | | |
Dividends (a) | | $ | 8,202,506 | |
Interest | | | 2,046 | |
| | | | |
Total income | | | 8,204,552 | |
| | | | |
Expenses | | | | |
Manager (See Note 3) | | | 5,257,390 | |
Shareholder communication | | | 87,444 | |
Professional fees | | | 62,447 | |
Custodian | | | 21,333 | |
Trustees | | | 12,288 | |
Miscellaneous | | | 27,575 | |
| | | | |
Total expenses | | | 5,468,477 | |
| | | | |
Net investment income (loss) | | | 2,736,075 | |
| | | | |
|
| Realized and Unrealized Gain (Loss) on Investments and Foreign Currency Transactions | |
Net realized gain (loss) on: | | | | |
Security transactions | | | (18,891,078 | ) |
Foreign currency transactions | | | (16,190 | ) |
| | | | |
Net realized gain (loss) on investments and foreign currency transactions | | | (18,907,268 | ) |
| | | | |
Net change in unrealized appreciation (depreciation) on: | | | | |
Investments | | | 77,204,234 | |
Translation of other assets and liabilities in foreign currencies | | | 451 | |
| | | | |
Net change in unrealized appreciation (depreciation) on investments and foreign currency transactions | | | 77,204,685 | |
| | | | |
Net realized and unrealized gain (loss) on investments and foreign currency transactions | | | 58,297,417 | |
| | | | |
Net increase (decrease) in net assets resulting from operations | | $ | 61,033,492 | |
| | | | |
| (a) | Dividends recorded net of foreign withholding taxes in the amount of $90,270. |
| | | | | | |
The notes to the financial statements are an integral part of,
and should be read in conjunction with, the financial statements. | | mainstayinvestments.com | | | M-461 | |
Statements of Changes in Net Assets
for the year ended December 31, 2013 and the period February 17, 2012 (inception date) through December 31, 2012
| | | | | | | | |
| | | 2013 | | | 2012 | |
| Increase (Decrease) in Net Assets | |
Operations: | | | | | | | | |
Net investment income (loss) | | $ | 2,736,075 | | | $ | 5,406,264 | |
Net realized gain (loss) on investments and foreign currency transactions | | | (18,907,268 | ) | | | (13,252,921 | ) |
Net change in unrealized appreciation (depreciation) on investments and foreign currency transactions | | | 77,204,685 | | | | (58,807,320 | ) |
| | | | |
Net increase (decrease) in net assets resulting from operations | | | 61,033,492 | | | | (66,653,977 | ) |
| | | | |
Dividends to shareholders: | | | | | | | | |
From net investment income: | | | | | | | | |
Initial Class | | | (6,427,982 | ) | | | — | |
| | | | |
Capital share transactions: | | | | | | | | |
Net proceeds from sale of shares | | | 44,462,988 | | | | 784,047,718 | |
Net asset value of shares issued to shareholders in reinvestment of dividends | | | 6,427,982 | | | | — | |
Cost of shares redeemed | | | (122,585,197 | ) | | | (108,415,436 | ) |
| | | | |
Increase (decrease) in net assets derived from capital share transactions | | | (71,694,227 | ) | | | 675,632,282 | |
| | | | |
Net increase (decrease) in net assets | | | (17,088,717 | ) | | | 608,978,305 | |
|
| Net Assets | |
Beginning of period | | | 608,978,305 | | | | — | |
| | | | |
End of period | | $ | 591,889,588 | | | $ | 608,978,305 | |
| | | | |
Undistributed net investment income at end of period | | $ | 2,148,794 | | | $ | 5,855,465 | |
| | | | |
| | | | |
| M-462 | | MainStay VP Van Eck Global Hard Assets Portfolio | | The notes to the financial statements are an integral part of,
and should be read in conjunction with, the financial statements. |
Financial Highlights selected per share data and ratios
| | | | | | | | |
| | | Initial Class | |
| | | Year
ended
December 31, | | | February 17,
2012**
through
December 31, | |
| | | 2013 | | | 2012 | |
Net asset value at beginning of period | | $ | 9.08 | | | $ | 10.00 | |
| | | | | | | | |
Net investment income (loss) | | | 0.05 | | | | 0.08 | |
Net realized and unrealized gain (loss) on investments | | | 0.95 | | | | (1.00 | ) |
Net realized and unrealized gain (loss) on foreign currency transactions | | | (0.00 | )‡ | | | (0.00 | )‡ |
| | | | | | | | |
Total from investment operations | | | 1.00 | | | | (0.92 | ) |
| | | | | | | | |
Less dividends: | | | | | | | | |
From net investment income | | | (0.11 | ) | | | — | |
| | | | | | | | |
Net asset value at end of period | | $ | 9.97 | | | $ | 9.08 | |
| | | | | | | | |
Total investment return | | | 10.96 | % | | | (9.20 | %)(a)(b) |
Ratios (to average net assets)/Supplemental Data: | | | | | | | | |
Net investment income (loss) | | | 0.46 | % | | | 0.98 | % †† |
Net expenses | | | 0.93 | % | | | 0.94 | % †† |
Portfolio turnover rate | | | 31 | % | | | 24 | % |
Net assets at end of period (in 000’s) | | $ | 591,890 | | | $ | 608,978 | |
| ‡ | Less than one cent per share. |
| (a) | Total investment return is not annualized. |
| (b) | Total investment return may reflect adjustments to conform to generally accepted accounting principles. |
| | | | | | |
The notes to the financial statements are an integral part of,
and should be read in conjunction with, the financial statements. | | mainstayinvestments.com | | | M-463 | |
Notes to Financial Statements
Note 1–Organization and Business
MainStay VP Funds Trust (the “Fund”) was organized as a Delaware statutory trust on February 1, 2011. The Fund is registered under the Investment Company Act of 1940, as amended (the “1940 Act”), as an open-end management investment company and is comprised of twenty-nine separate series (each a “Portfolio” and collectively, the “Portfolios”). Effective April 29, 2011, each Portfolio that was a series of MainStay VP Series Fund, Inc., a Maryland corporation, merged into a corresponding “shell” series of the Fund. Each shell series succeeded to the accounting and performance histories of its corresponding predecessor portfolio. Therefore, for periods prior to April 29, 2011, any historical information provided for each such Portfolio is that of the corresponding predecessor portfolio. On April 29, 2011, the Fund assumed MainStay VP Series Fund, Inc.‘s registration statement pursuant to Rule 414 under the Securities Act of 1933, as amended, and the 1940 Act.
The Portfolios commenced operations on the dates indicated below:
| | |
Commencement
of Operations | | Portfolios |
January 23, 1984 | | Bond and Common Stock |
January 29, 1993 | | Cash Management, Cornerstone Growth(a), Government, Income Builder and S&P 500 Index |
May 1, 1995 | | High Yield Corporate Bond and International Equity |
October 1, 1996 | | Convertible |
May 1, 1998 | | ICAP Select Equity, Large Cap Growth and U.S. Small Cap |
July 2, 2001 | | Mid Cap Core |
May 2, 2005 | | Balanced and Floating Rate |
February 13, 2006 | | Conservative Allocation, Growth Allocation, Moderate Allocation and Moderate Growth Allocation |
April 29, 2011 | | Unconstrained Bond(b) |
February 17, 2012 | | DFA / DuPont Capital Emerging Markets Equity, Eagle Small Cap Growth, Janus Balanced, MFS® Utilities, PIMCO Real Return, T. Rowe Price Equity Income and Van Eck Global Hard Assets |
May 1, 2013 | | Marketfield |
| (a) | Effective May 1, 2013, the name of MainStay VP Growth Equity Portfolio changed to MainStay VP Cornerstone Growth Portfolio. |
| (b) | Effective May 1, 2013, the name of MainStay VP Flexible Bond Opportunities Portfolio changed to MainStay VP Unconstrained Bond Portfolio. |
Shares of the Portfolios are currently offered to New York Life Insurance and Annuity Corporation (“NYLIAC”), a wholly-owned subsidiary of New York Life Insurance Company (“New York Life”). NYLIAC allocates shares of the Portfolios to, among others, NYLIAC Variable Annuity Separate Accounts-I, II, III and IX, VUL Separate Account-I and CSVUL Separate Account-I (collectively, the “Separate Accounts”). The Separate Accounts are used to fund flexible
premium deferred variable annuity contracts and variable life insurance policies. Shares of the Portfolios are also offered to the Conservative Allocation, Growth Allocation, Moderate Allocation and Moderate Growth Allocation Portfolios (collectively, the “Asset Allocation Portfolios”) which operate as “funds-of-funds.” The Asset Allocation Portfolios may invest in other Portfolios of the Fund as well as funds of The MainStay Funds, a Massachusetts business trust, and MainStay Funds Trust, a Delaware statutory trust, for which New York Life Investment Management LLC (“New York Life Investments” or the “Manager”) also serves as manager (the “Underlying Portfolios/Funds”).
On May 13, 2003, the Board of Directors of MainStay VP Series Fund Inc. adopted a Multiple Class Plan under which the existing shares of each of the predecessor portfolios, except the Cash Management Portfolio, were re-classified as Initial Class shares, and a second class of shares, the Service Class, was established. On April 5, 2011, the Board of Trustees (the “Board”) of the Fund adopted a Multiple Class Plan that is the same in all material respects as the May 13, 2003 Multiple Class Plan. Under the terms of the Multiple Class Plan, the classes differ in that, pursuant to a plan adopted in accordance with Rule 12b-1 under the 1940 Act, Service Class shares pay a combined distribution and service fee of 0.25% of average daily net assets to the Distributor (as defined below) of their shares. Contract owners of variable annuity contracts purchased after June 2, 2003 are permitted to invest only in the Service Class shares.
The Service Class of each Portfolio commenced operations on the dates indicated below:
| | |
Commencement
of Operations | | Portfolios |
June 4, 2003 | | Bond, Government, High Yield Corporate Bond and Income Builder |
June 5, 2003 | | Common Stock, Convertible, Cornerstone Growth, ICAP Select Equity, International Equity, Mid Cap Core, S&P 500 Index and U.S. Small Cap |
June 6, 2003 | | Large Cap Growth |
May 2, 2005 | | Balanced and Floating Rate |
February 13, 2006 | | Conservative Allocation, Growth Allocation, Moderate Allocation and Moderate Growth Allocation |
April 29, 2011 | | Unconstrained Bond |
February 17, 2012 | | DFA / DuPont Capital Emerging Markets Equity, Eagle Small Cap Growth, Janus Balanced, MFS® Utilities, PIMCO Real Return and T. Rowe Price Equity Income |
May 1, 2013 | | Marketfield |
The investment objective for each Portfolio is as follows:
Balanced: seeks total return.
Bond: seeks total return.
Cash Management: seeks a high level of current income while preserving capital and maintaining liquidity.
| | |
| M-464 | | MainStay VP Funds Trust |
Common Stock: seeks long-term growth of capital.
Conservative Allocation: seeks current income and, secondarily, long-term growth of capital.
Convertible: seeks capital appreciation together with current income.
Cornerstone Growth: seeks long-term growth of capital.
DFA / DuPont Capital Emerging Markets Equity: seeks long-term capital appreciation.
Eagle Small Cap Growth: seeks long-term capital appreciation.
Floating Rate: seeks high current income.
Government: seeks current income.
Growth Allocation: seeks long-term growth of capital.
High Yield Corporate Bond: seeks maximum current income through investment in a diversified portfolio of high-yield debt securities. Capital appreciation is a secondary objective.
ICAP Select Equity: seeks total return.
Income Builder: seeks current income consistent with reasonable opportunity for future growth of capital and income.
International Equity: seeks long-term growth of capital.
Janus Balanced: seeks long-term capital growth, consistent with preservation of capital and balanced current income.
Large Cap Growth: seeks long-term growth of capital.
Marketfield: seeks capital appreciation.
MFS® Utilities: seeks total return.
Mid Cap Core: seeks long-term growth of capital.
Moderate Allocation: seeks long-term growth of capital and, secondarily, current income.
Moderate Growth Allocation: seeks long-term growth of capital and, secondarily, current income.
PIMCO Real Return: seeks maximum real return, consistent with preservation of real capital and prudent investment management.
S&P 500 Index: seeks investment results that correspond to the total return performance (reflecting reinvestment of dividends) of common stocks in the aggregate as represented by the S&P 500® Index.
T. Rowe Price Equity Income: seeks substantial dividend income as well as long-term growth of capital through investments in the common stocks of established companies.
U.S. Small Cap: seeks long-term capital appreciation by investing primarily in securities of small-cap companies.
Unconstrained Bond: seeks total return by investing primarily in domestic and foreign debt securities.
Van Eck Global Hard Assets: seeks long-term capital appreciation by investing primarily in hard asset securities. Income is a consideration.
Prior to May 1, 2013, the investment objective of Unconstrained Bond was as follows: seek current income and total return by investing primarily in domestic and foreign debt securities.
Note 2–Significant Accounting Policies
Each Portfolio prepares its financial statements in accordance with generally accepted accounting principles (“GAAP”) in the United States of America and follows the significant accounting policies described below.
(A) Valuation of Shares. The Cash Management Portfolio seeks to maintain a net asset value (“NAV”) of $1.00 per share, although there is no assurance that it will be able to do so on a continuous basis. The Portfolio has adopted certain investment, portfolio and dividend and distribution policies designed to enable it to do so as such. An investment in the Cash Management Portfolio and the other Portfolios, is not insured or guaranteed by the Federal Deposit Insurance Corporation or any other government agency.
(B) Securities Valuation. Investments are valued as of the close of regular trading on the New York Stock Exchange (“Exchange”) (generally 4:00 p.m. Eastern time) on each day the Portfolios are open for business (“valuation date”).
The Board adopted procedures for the valuation of each Portfolio’s securities and delegated the responsibility for valuation measurements under those procedures to the Valuation Committee of the Portfolios (the “Valuation Committee”). The Board authorized the Valuation Committee to appoint a Valuation Sub-Committee (the “Sub-Committee”) to deal in the first instance with questions that arise or cannot be resolved under these procedures. The Sub-Committee meets (in person, via electronic mail or via teleconference) on an as-needed basis. The Valuation Committee meets at a later time, as necessary, to ensure that actions taken by the Sub-Committee were appropriate. The procedures recognize that, subject to the oversight of the Board and unless otherwise noted, the responsibility for day-to-day valuation of portfolio assets (including securities for which market prices are not readily available) rests with New York Life Investments, aided to whatever extent necessary by the Subadvisor(s) (as defined in Note 3(A)) to each Portfolio.
To assess the appropriateness of security valuations, the Manager or the Portfolio’s third party service provider, who is subject to oversight by the Manager, regularly compares
| | | | |
| mainstayinvestments.com | | | M-465 | |
Notes to Financial Statements (continued)
prior day prices, prices on comparable securities, and the sale prices to the prior and current day prices and challenges prices with changes exceeding certain tolerance levels with third party pricing services or broker sources. For those securities valued through either a standardized fair valuation methodology or a fair valuation measurement, the Sub-Committee deals in the first instance with such valuation and the Valuation Committee reviews and affirms the reasonableness of the valuation based on such methodologies and measurements on a regular basis after considering all relevant information that is reasonably available. Any action taken by the Sub-Committee with respect to the pricing of a portfolio security is submitted by the Valuation Committee to the full Board for its review at its next regularly scheduled meeting immediately after such action.
“Fair value” is defined as the price that a Portfolio would receive upon selling an investment in an orderly transaction to an independent buyer in the principal or most advantageous market for the investment. Fair value measurements are estimated within a framework that has established a three-tier hierarchy which maximizes the use of observable market data and minimizes the use of unobservable inputs to establish a classification of fair value measurements for disclosure purposes. “Inputs” refers broadly to the assumptions that market participants would use in pricing the asset or liability, including assumptions about risk, such as the risk inherent in a particular valuation technique used to measure fair value using a pricing model and/or the risk inherent in the inputs for the valuation technique. Inputs may be observable or unobservable. Observable inputs reflect the assumptions market participants would use in pricing the asset or liability based on market data obtained from sources independent of each Portfolio. Unobservable inputs reflect each Portfolio’s own assumptions about the assumptions market participants would use in pricing the asset or liability developed based on the information available. The inputs or methodology used for valuing securities may not be an indication of the risks associated with investing in those securities. The three-tier hierarchy of inputs is summarized in the three broad Levels listed below.
| • | | Level 1—quoted prices in active markets for identical assets or liabilities |
| • | | Level 2—other significant observable inputs (including quoted prices for similar assets or liabilities in active markets, interest rates and yield curves, prepayment speeds, credit risk etc.) |
| • | | Level 3—significant unobservable inputs (including each Portfolio’s own assumptions about the assumptions that market participants would use in measuring the fair value of assets or liabilities ) |
The aggregate value by input level, as of December 31, 2013, for each Portfolio’s assets or liabilities included at the end of each Portfolio’s respective Portfolio of Investments.
The Portfolios may use third party vendor evaluations, whose prices may be derived from one or more of the following standard inputs among others:
| | |
• Benchmark Yields | | • Reported Trades |
• Broker Dealer Quotes | | • Issuer Spreads |
• Two-sided markets | | • Benchmark securities |
• Bids / Offers | | • Reference Data (corporate actions or material event notices) |
• Industry and economic events | | • Comparable bonds |
• Equity and credit default swap curves | | • Monthly payment information |
Securities for which market values cannot be measured using the methodologies described above are valued by methods deemed reasonable and in good faith by the Valuation Committee, following the procedures established by the Board, to represent fair value. Under these procedures, the Portfolios generally use a market-based approach which may use related or comparable assets or liabilities, recent transactions, market multiples, book values, and other relevant information. The Portfolios may also use an income-based valuation approach in which the anticipated future cash flows of the investment are discounted to calculate fair value. Discounts may also be applied due to the nature or duration of any restrictions on the disposition of the investments. Due to the inherent uncertainty of valuations of such investments, fair values may differ significantly from values that would have been used had an active market existed. For the year ended December 31, 2013 there have been no material changes to the fair value methodologies.
Equity and non-equity securities which may be valued in this manner include, but are not limited to: (i) a security for which trading has been halted or suspended; (ii) a debt security that has recently gone into default and for which there is not a current market quotation; (iii) a security of an issuer that has entered into a restructuring; (iv) a security that has been de-listed from a national exchange; (v) a security for which the market price is not readily available from a third party pricing source or, if so provided, does not, in the opinion of the Manager or Subadvisor(s) reflect the security’s market value; (vi) a security subject to trading collars for which no or limited trading takes place; and (vii) a security whose principal market has been temporarily closed at a time when, under normal conditions, it would be open. Securities for which market quotations or observable inputs are not readily available are generally categorized as Level 3 in the hierarchy. As of December 31, 2013, the Balanced, Bond, Convertible, DFA / DuPont Capital Emerging Markets Equity, Government, High Yield Corporate Bond, Income Builder and MFS® Utilities Portfolios held securities with values of $2,860,564, $32,694,542, $234, $75,857, $917,677, $16,538,762, $346,330 and $1,909,755, respectively, that were valued in such a manner.
| | |
| M-466 | | MainStay VP Funds Trust |
Securities held by certain Portfolios principally trade in foreign markets. Certain events may occur between the time the foreign markets close and the time at which the Portfolios’ NAVs are calculated. These events may include, but are not limited to, situations relating to a single issuer in a market sector, significant fluctuations in U.S. or foreign markets, natural disasters, armed conflicts, governmental actions or other developments not tied directly to the securities markets. Should the Manager or Subadvisor(s) conclude that such events may have affected the accuracy of the last price of such securities reported on the local foreign market, the Sub-Committee may, pursuant to procedures adopted by the Board, adjust the value of the local price to reflect the estimated impact on the price of such securities as a result of such events. In this instance, securities are generally categorized as Level 3 in the hierarchy. Additionally, certain foreign equity securities are also fair valued whenever the movement of a particular index exceeds certain thresholds. In such cases, the securities are fair valued by applying factors provided by a third party vendor in accordance with a Portfolio’s policies and procedures and are generally categorized as Level 2 in the hierarchy. As of December 31, 2013, no foreign equity securities held by the Portfolios were fair valued in such a manner.
Investments in the Underlying Portfolios/Funds are valued at their NAV at the close of business each day. Securities held by the Underlying Portfolios/Funds are valued using policies consistent with those used by the Underlying Portfolios/Funds, as described in the paragraphs below. These securities are generally categorized as Level 1 in the hierarchy.
Equity securities and Exchange-Traded Funds are valued at the last quoted sales prices as of the close of regular trading on the Exchange on each valuation date. Securities that are not traded on the valuation date are valued at the mean of the last quoted bid and ask prices. Prices are normally taken from the principal market in which each security trades. Futures contracts are valued at the last posted settlement price on the market where such futures are primarily traded. Options contracts are valued at the last posted settlement price on the market where such options are principally traded. Investments in other mutual funds, including money market funds, are valued at their respective NAVs as of the close of the Exchange on the valuation date. These securities are generally categorized as Level 1 in the hierarchy.
Debt securities (other than convertible and municipal bonds) are valued at the evaluated bid prices (evaluated mean prices in the case of convertible and municipal bonds) supplied by a pricing agent or brokers selected by the Portfolios’ Manager, in consultation with the Portfolios’ Subadvisor(s), if any. Those prices reflect broker/dealer supplied valuations and electronic data processing techniques, if such prices are deemed by the Portfolios’ Manager, in consultation with the Portfolios’ Subadvisor, if any, to be representative of market values, at the regular close of trading of the Exchange on each valuation date.
Debt securities purchased on a delayed delivery basis are marked to market daily until settlement at the forward settlement date. Debt securities, including corporate bonds, U.S. government & federal agency bonds, municipal bonds, foreign bonds, Yankee bonds, convertible bonds, asset-backed securities and mortgage-backed securities, are generally categorized as Level 2 in the hierarchy.
Securities held by the Cash Management Portfolio are valued at their amortized cost in accordance with the requirements of Rule 2a-7 under the 1940 Act. The amortized cost method involves valuing a security at its cost on the date of purchase and thereafter assuming a constant amortization to maturity of the difference between such cost and the value on maturity date. Amortized cost approximates the current fair value of a security. Securities valued at amortized cost are not valued using quoted prices in an active market.
Temporary cash investments acquired in excess of 60 days to maturity are valued using the latest bid prices or using valuations based on a matrix system (which considers such factors as security prices, yields, maturities, and ratings), both as furnished by independent pricing services. Other temporary cash investments which mature in 60 days or less at the time of purchase (“Short-Term Investments”) are valued at amortized cost. The amortized cost method involves valuing a security at its cost on the date of purchase and thereafter assuming a constant amortization to maturity of the difference between such cost and the value on maturity date. Amortized cost approximates the current fair value of a security. These securities are generally categorized as Level 2 in the hierarchy.
Foreign currency forward contracts are valued at their fair market values measured on the basis of the mean between the last current bid and ask prices based on dealer or exchange quotations and are generally categorized as Level 2 in the hierarchy.
Loan assignments, participations and commitments are valued at the average of bid quotations obtained from the engaged independent pricing agent and are generally categorized as Level 2 in the hierarchy. Certain loan assignments, participations and commitments may be valued by single broker quotes obtained from the pricing agent with significant unobservable inputs and are generally categorized as Level 3 in the hierarchy. For these loan assignments, participations and commitments, the Manager may consider additional factors such as the liquidity of the Portfolios’ investments. As of December 31, 2013, the Floating Rate, High Yield Corporate Bond, Income Builder and Unconstrained Bond Portfolios held Level 3 securities with a value of $22,659,026, $5,112,750, $198,422 and $1,876,250, respectively, that were valued by single broker quotes and/or deemed to be illiquid.
| | | | |
| mainstayinvestments.com | | | M-467 | |
Notes to Financial Statements (continued)
The valuation techniques and significant amounts of unobservable inputs used in the fair valuation measurement of each Portfolio’s Level 3 securities are outlined in the
tables below. A significant increase or decrease in any of those inputs in isolation would result in a significantly higher or lower fair value measurement.
| | | | | | | | | | |
| Balanced |
Asset Class | | Fair Value
at 12/31/13 | | | Valuation Technique | | Unobservable Inputs | | Range/
(Weighted Average) |
| Asset-Backed Securities (7 positions) | | $ | 2,860,564 | | | Market Approach | | Offered Quotes | | $98.20 - $99.25/($98.63) |
| | | | | | | | | | |
|
| Bond |
Asset Class | | Fair Value
at 12/31/13 | | | Valuation Technique | | Unobservable Inputs | | Range/
(Weighted Average) |
| Asset-Backed Securities (7 positions) | | $ | 32,694,542 | | | Market Approach | | Offered Quotes | | $98.20 - $99.25/($98.63) |
| | | | | | | | | | |
|
| Floating Rate |
Asset Class | | Fair Value
at 12/31/13 | | | Valuation Technique | | Unobservable Inputs | | Range/
(Weighted Average) |
| Floating Rate Loans (12 positions) | | $ | 20,209,087 | | | Market Approach | | Offered Quotes | | $93.00 - $102.125/($100.21) |
| Foreign Floating Rate Loan (1 position) | | | 2,449,939 | | | Market Approach | | Offered Quote | | $100.50/($100.50) |
| | | | | | | | | | |
| | $ | 22,659,026 | | | | | | | |
| | | | | | | | | | |
Generally, a security is considered illiquid if it cannot be sold or disposed of in the ordinary course of business at approximately the price at which it is valued within seven days. Its illiquidity might prevent the sale of such security at a time when the Portfolio’s Manager or Subadvisor(s) might wish to sell, and these securities could have the effect of decreasing the overall level of a Portfolio’s liquidity. Further, the lack of an established secondary market may make it more difficult to value illiquid securities, requiring a Portfolio to rely on judgments that may be somewhat subjective in measuring value, which could vary from the amount that a Portfolio could realize upon disposition. Difficulty in selling illiquid securities may result in a loss or may be costly to a Portfolio. Under the supervision of the Board, the Manager or Subadvisor(s) measure the liquidity of a Portfolio’s investments; in doing so, the Manager or Subadvisor(s) may consider various factors, including (i) the frequency of trades and quotations, (ii) the number of dealers and prospective purchasers, (iii) dealer undertakings to make a market, and (iv) the nature of the security and the market in which it trades (e.g., the time needed to dispose of the security, the method of soliciting offers and the mechanics of transfer). Illiquid securities generally will be valued in good faith in such a manner as the Board deems appropriate to reflect their fair value.
(C) Income Taxes. Each Portfolio is treated as a separate entity for federal income tax purposes. Each Portfolio’s policy is to comply with the requirements of the Internal Revenue Code of 1986, as amended (the “Internal Revenue Code”), applicable to regulated investment companies and to distribute all of the taxable income to the shareholders of each Portfolio within the allowable time limits. Therefore, no federal, state and local income tax provisions are required.
Management evaluates the Portfolios’ tax positions to determine if the tax positions taken meet the minimum recognition threshold in connection with accounting for uncertainties in income tax positions taken or expected to be taken for the purposes of measuring and recognizing tax liabilities in the financial statements. Recognition of tax benefits of an uncertain tax position is required only when the position is “more likely than not” to be sustained assuming examination by taxing authorities. Management has analyzed the Portfolios’ tax positions taken on federal, state and local income tax returns for all open tax years (for up to three tax years), and has concluded that no provisions for federal, state and local income tax are required in the Portfolios’ financial statements. The Portfolios’ federal, state or local income and federal excise tax returns for tax years for which the applicable statutes of limitations have not expired are subject to examination by the Internal Revenue Service and state and local departments of revenue.
(D) Foreign Taxes. The Portfolios may be subject to foreign taxes on income and other transaction-based taxes imposed by certain countries in which they invest. A portion of the taxes on gains on investments or currency purchases/repatriation may be recoverable. The Portfolios will accrue such taxes and recoveries as applicable, based upon their current interpretation of tax rules and regulations that exist in the markets in which they invest.
The Portfolios may be subject to taxation on realized capital gains, repatriation proceeds and other transaction-based taxes imposed by certain countries in which they invest. The Portfolios will accrue such taxes as applicable based upon their current interpretation of tax rules and regulations that
| | |
| M-468 | | MainStay VP Funds Trust |
exist in the market in which they invest. Capital gains taxes relating to positions still held are reflected as a liability on the Statement of Assets and Liabilities, as well as an adjustment to the Portfolio’s net unrealized appreciation (depreciation). Taxes related to capital gains realized during the year ended December 31, 2013, if any, are reflected as part of net realized gain (loss) in the Statement of Operations. Changes in tax liabilities related to capital gains taxes on unrealized investment gains, if any, are reflected as part of the change in net unrealized appreciation (depreciation) on investments in the Statement of Operations. Transaction-based charges are generally assessed as a percentage of the transaction amount.
(E) Dividends and Distributions to Shareholders. Dividends and distributions are recorded on the ex-dividend date. For the Cash Management and Floating Rate Portfolios, dividends, if any, are declared daily and paid monthly and distributions of net realized capital and currency gains, if any, are declared and paid at least annually. Each of the other Portfolios intend to declare and pay dividends of net investment income and distributions of net realized capital and currency gains, if any, at least annually. All dividends and distributions are reinvested in the same class of shares of the applicable Portfolio. Dividends and distributions to shareholders are determined in accordance with federal income tax regulations and may differ from GAAP.
(F) Security Transactions and Investment Income. Each Portfolio records security transactions on the trade date. Realized gains and losses on security transactions are determined using the identified cost method and include gains and losses from repayments of principal on mortgage-backed securities. Dividend income is recognized on the ex-dividend date, net of any foreign tax withheld at the source, and interest income is accrued as earned using the effective interest rate method. Dividends and distributions received by the Asset Allocation Portfolios from the Underlying Portfolios/Funds are recorded on the ex-dividend date. Discounts and premiums on securities purchased, other than Short-Term Investments, for all Portfolios are accreted and amortized, respectively, on the effective interest rate method over the life of the respective securities or, in the case of a callable security, over the period to the first date of call. Discounts and premiums on Short-Term Investments, Floating Rate Loans and Loan Assignments are accreted and amortized, respectively, on the straight-line method. The straight-line method approximates the effective interest method for short-term investments. Income from payment-in-kind securities is recorded daily based on the effective interest method of accrual.
Investment income and realized and unrealized gains and losses on investments of each Portfolio are allocated to the separate classes of shares pro rata based upon their relative net assets on the date the income is earned or realized and unrealized gains and losses are incurred.
A Portfolio may place a debt obligation on non-accrual status and reduce related interest income by ceasing current accruals and writing off interest receivables when the collection of all or a portion of interest has become doubtful based on consistently applied procedures. A debt obligation is removed from non-accrual status when the issuer resumes interest payments or when collectability of interest is reasonably assured.
(G) Expenses. Expenses of the Fund are allocated to the individual Portfolios in proportion to the net assets of the respective Portfolios when the expenses are incurred, except where direct allocations of expenses can be made. Expenses (other than fees incurred under the distribution and service plans, further discussed in Note 3(B)), which are charged directly to the Service Class shares, are allocated to separate classes of shares pro rata based upon their relative net assets on the date the expenses are incurred. The expenses borne by each Portfolio, including those incurred with related parties of each Portfolio, are shown on each Portfolio’s Statement of Operations.
In addition, each Asset Allocation Portfolio bears a pro rata share of the fees and expenses of the Underlying Portfolios/Funds in which it invests. Because the Underlying Portfolios/Funds have varied expense and fee levels and the Asset Allocation Portfolios may own different proportions of the Underlying Portfolios/Funds at different times, the amount of fees and expenses incurred indirectly by each Asset Allocation Portfolio may vary. These indirect expenses of the Underlying Portfolios/Funds are not included in the amounts shown as expenses on each Portfolio’s Statement of Operations or in the expense ratios included in the financial highlights.
(H) Use of Estimates. In preparing financial statements in conformity with GAAP, management makes estimates and assumptions that affect the reported amounts and disclosures in the financial statements. Actual results could differ from those estimates.
(I) Repurchase Agreements. Each Portfolio may enter into repurchase agreements to earn income. The Portfolios may enter into repurchase agreements only with financial institutions that are deemed by the Manager or Subadvisor(s), if any, to be creditworthy, pursuant to guidelines established by the Board. During the term of any repurchase agreement, the Manager or Subadvisor(s) will continue to monitor the creditworthiness of the seller. Under the 1940 Act, repurchase agreements are considered to be collateralized loans by a Portfolio to the seller secured by the securities transferred to the Portfolio.
When a Portfolio invests in repurchase agreements, a custodian takes possession of the collateral pledged for investments in the repurchase agreement. The underlying collateral is valued daily on a mark-to-market basis to determine if the value, including accrued interest, exceeds the repurchase price. In the event of the seller’s default on
| | | | |
| mainstayinvestments.com | | | M-469 | |
Notes to Financial Statements (continued)
the obligation to repurchase, a Portfolio has the right to liquidate the collateral and apply the proceeds in satisfaction of the obligation. Under certain circumstances, such as in the event of default or bankruptcy by the counterparty to the agreement, realization and/or retention of the collateral may be subject to legal proceedings and possible realized loss to the Portfolios.
(J) Reverse Repurchase Agreements. A Portfolio may enter into reverse repurchase agreements with banks or broker/dealers, which involve the sale of a security by a Portfolio and its agreement to repurchase the instrument at a specified time and price. Under a reverse repurchase agreement, the Portfolio continues to receive any principal and interest payments on the underlying security during the term of the agreement. These agreements involve the sale of debt securities, or obligations, held by a Portfolio, with an agreement to repurchase the obligations at an agreed upon price, date and interest payment. The proceeds will be used to purchase other debt securities either maturing, or under an agreement to resell, at a date simultaneous with or prior to the expiration of the reverse repurchase agreement. Reverse repurchase agreements will be utilized, only when the interest income to be earned from the investment of the proceeds from the transaction is greater than the interest expense of the reverse repurchase transaction.
The use of reverse repurchase agreements by a Portfolio creates leverage that increases a Portfolio’s investment risk. If the income and gains on securities purchased with the proceeds of reverse repurchase agreements exceed the cost of the agreements, the Portfolio’s earnings or NAV will increase faster than otherwise would be the case; conversely, if the income and gains fail to exceed the costs, earnings or NAV would decline faster than otherwise would be the case. If the buyer of the obligation subject to the reverse repurchase agreement becomes bankrupt, realization upon the underlying securities may be delayed and there is a risk of loss due to any decline in their value. During the period ended December 31, 2013, PIMCO Real Return Portfolio’s average amount of borrowings under reverse repurchase agreements, while outstanding, was $56,644,518 at a weighted average interest rate of 0.16%. As of December 31, 2013, the Portfolios did not hold any reverse repurchase agreements.
(K) Loan Assignments, Participations and Commitments. The Floating Rate Portfolio may principally invest in loan assignments and participations (“loans”). The High Yield Corporate Bond, Income Builder, Janus Balanced and Unconstrained Bond Portfolios may invest in loans. Loans are agreements to make money available (a “commitment”) to a borrower in a specified amount, at a specified rate and within a specified time. Such loans are typically senior, secured and collateralized in nature. The Portfolios record an investment when the borrower withdraws money and record interest as earned. These loans pay interest at rates that are periodically reset by reference to a base lending rate plus a spread. These
base lending rates are generally the prime rate offered by a designated U.S. bank or the London InterBank Offered Rate.
The loans in which the Portfolios may invest are generally readily marketable, but may be subject to some restrictions on resale. For example, a Portfolio may be contractually obligated to receive approval from the agent bank and/or borrower prior to the sale of these investments. A Portfolio assumes the credit risk of the borrower, the selling participant and any other persons interpositioned between the Portfolio and the borrower (“intermediate participants”). In the event that the borrower, selling participant or intermediate participants become insolvent or enter into bankruptcy, a Portfolio may incur certain costs and delays in realizing payment, or may suffer a loss of principal and/or interest.
Unfunded commitments represent the remaining obligation of a Portfolio to the borrower. At any point in time, up to the maturity date of the issue, the borrower may demand the unfunded portion. The unfunded amounts, if any, are mark-to-market and any unrealized gains or losses are recorded in the Portfolio’s Statement of Asset and Liabilities. (See Note 6)
(L) Futures Contracts. A futures contract is an agreement to purchase or sell a specified quantity of an underlying instrument at a specified future date and price, or to make or receive a cash payment based on the value of a financial instrument (i.e., foreign currency, interest rate, security, or securities index). The Portfolios are subject to market price risk and/or interest rate risk in the normal course of investing in these transactions. During the period the futures contract is open, changes in the value of the contract are recognized as unrealized appreciation or depreciation by marking-to-market such contract on a daily basis to reflect the market value of the contract at the end of each day’s trading. A Portfolio agrees to receive from or pay to the broker an amount of cash equal to the daily fluctuation in the value of the contract. Such receipts or payments are known as “variation margin.” When the futures contract is closed, the Portfolio records a realized gain or loss equal to the difference between the proceeds from (or cost of) the closing transaction and the Portfolio’s basis in the contract.
The use of futures contracts involves, to varying degrees, elements of market risk in excess of the amount recognized in a Portfolio’s Statement of Assets and Liabilities. The contract or notional amounts and variation margin reflect the extent of a Portfolio’s involvement in open futures positions. Risks arise from the possible imperfect correlation in movements in the price of futures contracts, interest rates and the underlying hedged assets, and the possible inability of counterparties to meet the terms of their contracts. However, each Portfolio’s activities in futures contracts have minimal counterparty risk as they are conducted through regulated exchanges that guarantee the futures against default by the counterparty. In the event of a bankruptcy or insolvency of a futures commission merchant that
| | |
| M-470 | | MainStay VP Funds Trust |
holds margin on behalf of the Portfolios, the Portfolios may not be entitled to the return of all of the margin owed to the Portfolios, potentially resulting in a loss.
The Balanced, Cornerstone Growth, Marketfield, and PIMCO Real Return Portfolios may invest in futures contracts to try to enhance returns or reduce the risk of loss by hedging certain of their holdings. The Bond, Government, Income Builder, and Unconstrained Bond Portfolios may invest in futures contracts in order to hedge against anticipated changes in interest rates that might otherwise have an adverse effect upon the value of a Portfolio’s securities. The Income Builder Portfolio may also use equity index futures contracts to add exposure to the equity markets. The S&P 500 Index Portfolio may invest in futures contracts to maintain cash reserves, while fully invested, to facilitate trading or to reduce transaction cost. A Portfolio’s investment in futures contracts and other derivatives may increase the volatility of the Portfolio’s NAV and may result in a loss to the Portfolio.
(M) Securities Sold Short. Certain Portfolios may engage in the sale of securities they do not own (“short sales”) as part of their investment strategies. When a Portfolio enters into a short sale, it must segregate the cash proceeds from the security sold short or other securities as collateral for its obligation to deliver the security upon conclusion of the sale. A gain, limited to the price at which the Portfolio sold the security short, or a loss, unlimited as to dollar amount, will be recognized upon termination of a short sale if the market price on the date the short position is closed out is less or greater, respectively, than the proceeds originally received. Any such gain or loss may be offset, completely or in part, by the change in the value of the hedged investments. Interest on short positions held is accrued daily while dividends declared on short positions existing on the record date are recorded on the ex-dividend date. Both the interest and dividends paid on short sales are recorded as expenses on the Statement of Operations. Short sales involve risk of loss in excess of the related amounts reflected on the Statement of Assets and Liabilities.
(N) Delayed Delivery Transactions. Certain Portfolios may purchase or sell securities on a delayed delivery basis. These transactions involve a commitment by a Portfolio to purchase or sell securities for a predetermined price or yield, with payment and delivery taking place beyond the customary settlement period. When delayed delivery purchases are outstanding, a Portfolio will designate liquid assets in an amount sufficient to meet the purchase price. When purchasing a security on a delayed delivery basis, a Portfolio assumes the rights and risks of ownership of the security, including the risk of price and yield fluctuations, and takes such fluctuations into account when determining its NAV. A Portfolio may dispose of or renegotiate a delayed delivery transaction after it is entered into, and may sell delayed delivery securities before they are delivered, which may result in a capital gain or loss. When a Portfolio has sold a security on a delayed delivery basis, the Portfolio does not
participate in future gains and losses with respect to the security.
(O) Foreign Currency Forward Contracts. Certain Portfolios may enter into foreign currency forward contracts, which are agreements to buy or sell currencies of different countries on a specified future date at a specified rate. These Portfolios are subject to foreign currency exchange rate risk in the normal course of investing in these transactions. During the period the forward contract is open, changes in the value of the contract are recognized as unrealized appreciation or depreciation by marking-to-market such contract on a daily basis to reflect the market value of the contract at the end of each day’s trading. Cash movement occurs on settlement date. When the forward contract is closed, a Portfolio records a realized gain or loss equal to the difference between the proceeds from (or cost of) the closing transaction and the Portfolio’s basis in the contract. The Income Builder, International Equity, Marketfield, MFS® Utilities, PIMCO Real Return, and Unconstrained Bond Portfolios may purchase and sell foreign currency forward contracts for purposes of seeking to enhance portfolio returns and manage portfolio risk more efficiently. Foreign currency forward contracts may also be used to gain exposure to a particular currency or to hedge against the risk of loss due to changing currency exchange rates. Foreign currency forward contracts to purchase or sell a foreign currency may also be used in anticipation of future purchases or sales of securities denominated in foreign currency, even if the specific investments have not yet been selected.
The use of foreign currency forward contracts involves, to varying degrees, elements of market risk in excess of the amount recognized in a Portfolio’s Statement of Assets and Liabilities. The contract amount reflects the extent of a Portfolio’s involvement in these financial instruments. Risks arise from the possible movements in the foreign exchange rates underlying these instruments. While a Portfolio may enter into forward contracts to reduce currency exchange risks, changes in currency exchange rates may result in poorer overall performance for the Portfolio than if it had not engaged in such transactions. Exchange rate movements can be large, depending on the currency, and can last for extended periods of time, affecting the value of a Portfolio’s assets. Moreover, there may be an imperfect correlation between a Portfolio’s holdings of securities denominated in a particular currency and forward contracts entered into by the Portfolio. Such imperfect correlation may prevent a Portfolio from achieving the intended hedge or expose the Portfolio to the risk of currency exchange loss. The unrealized appreciation (depreciation) on forward contracts reflects a Portfolio’s exposure at the valuation date to credit loss in the event of a counterparty’s failure to perform its obligations.
(P) Foreign Currency Transactions. The books and records of the Portfolios are kept in U.S. dollars. Prices of securities denominated in foreign currency amounts are translated into U.S. dollars at the mean between the buying
| | | | |
| mainstayinvestments.com | | | M-471 | |
Notes to Financial Statements (continued)
and selling rates last quoted by any major U.S. bank at the following dates:
| (i) | market value of investment securities, other assets and liabilities—at the valuation date; and |
| (ii) | purchases and sales of investment securities, income and expenses—at the date of such transactions. |
The assets and liabilities that are denominated in foreign currency amounts are presented at the exchange rates and market values at the close of the period. The realized and unrealized changes in net assets arising from fluctuations in exchange rates and market prices of securities are not separately presented.
Net realized gain (loss) on foreign currency transactions represents net gains and losses on foreign currency forward contracts, net currency gains or losses realized as a result of differences between the amounts of securities sale proceeds or purchase cost, dividends, interest and withholding taxes as recorded on a Portfolio’s books and the U.S. dollar equivalent amount actually received or paid. Net currency gains or losses from valuing such foreign currency denominated assets and liabilities, other than investments at valuation date exchange rates, are reflected in unrealized foreign exchange gains or losses.
(Q) Swap Contracts. Certain Portfolios may enter into credit default, interest rate, index and currency exchange rate contracts (“swaps”) for the purpose of attempting to obtain a desired return at a lower cost to the Portfolio, rather than directly investing in an instrument yielding that desired return or to hedge against credit and interest rate risk. In a typical swap transaction, two parties agree to exchange the returns (or differentials in rates of returns) earned or realized on a particular investment or instruments. The gross returns to be exchanged or “swapped” between the parties are calculated with respect to a notional amount. The payments may be adjusted for transaction costs, interest payments, the amount of interest paid on the investment or instrument or other factors. Collateral, in the form of cash or securities, may be required to be held in segregated accounts with the custodian bank or broker in accordance with the swap. Swaps agreements are privately negotiated in the over the counter market (“OTC swaps”) and may be executed in a multilateral or other trade facilities platform, such as a registered commodities exchange (“centrally cleared swaps”).
Credit default swaps, in particular, are contracts whereby one party makes periodic payments to a counterparty in exchange for the right to receive a specified return in the event of a default by a third party on its obligation. Such periodic payments are accrued daily and recorded as a realized gain or loss. Credit default swaps may be used to provide a measure of protection against defaults of sovereign or corporate issuers.
Certain standardized swaps, including certain credit default and interest rate swaps, are subject to mandatory clearing,
and more are expected to be in the future. The counterparty risk for cleared derivatives is expected to be generally lower than for uncleared derivatives, but cleared contracts are not risk-free. In a cleared derivative transaction, a Portfolio typically enters into the transaction with a financial institution counterparty, and performance of the transaction is effectively guaranteed by a central clearinghouse, thereby reducing or eliminating the Portfolio’s exposure to the credit risk of its original counterparty. The Portfolio will be required to post specified levels of margin with the clearinghouse or at the instruction of the clearinghouse; the margin required by a clearinghouse may be greater than the margin the Portfolio would be required to post in an uncleared transaction.
Swaps are mark-to-market daily based upon quotations from pricing agents, brokers, or market makers and the change in value, if any, is recorded as unrealized appreciation or depreciation. Any payments made or received upon entering a swap would be amortized or accreted over the life of the swap and recorded as a realized gain or loss. Early termination of a swap is recorded as a realized gain or loss. Daily changes in valuation of centrally cleared swaps, if any, are recorded as a receivable or payable for the change in value as appropriate (“variation margin”) on the Statements of Assets and Liabilities.
A Portfolio bears the risk of loss of the amount expected to be received under a swap in the event of the default or bankruptcy of the swap counterparty. A Portfolio may be able to eliminate its exposure under a swap either by assignment or other disposition, or by entering into an offsetting swap with the same party or a similar creditworthy party. Swaps are not actively traded on financial markets. Entering into swaps involves elements of credit, market, and documentation risk in excess of the amounts recognized on the Statement of Assets and Liabilities. Such risks involve the possibilities that there will be no liquid market for these swaps, that the counterparty to the swaps may default on its obligation to perform or disagree as to the meaning of the contractual terms in the swaps and that there may be unfavorable changes in interest rates, the price of the index or the security underlying these transactions. As of December 31, 2013, Marketfield and PIMCO Real Return Portfolios held swap contracts.
(R) Options Contracts. A Portfolio may write call and put options on securities and financial derivative instruments it owns or in which it may invest. Writing put options tends to increase a Portfolio’s exposure to the underlying instrument. Writing call options tends to decrease the Portfolio’s exposure to the underlying instrument. When a Portfolio writes a call or put, an amount equal to the premium received is recorded as a liability and subsequently marked to market to reflect the current value of the option written. These liabilities are reflected as written options outstanding on the Statement of Assets and Liabilities. Premiums received from writing options which expire are treated as realized gains. Premiums received from writing options which are exercised
| | |
| M-472 | | MainStay VP Funds Trust |
or closed are added to the proceeds or offset against amounts paid on the underlying futures, swaps, security or currency transaction to determine the realized gain or loss. Certain options may be written with premiums to be determined on a future date. A Portfolio, as a writer of an option has no control over whether the underlying instrument may be sold (call) or purchased (put) and as a result bears the market risk of an unfavorable change in the price of the instrument underlying the written option. There is the risk the Portfolio may not be able to enter into a closing transaction because of an illiquid market.
A Portfolio may also purchase put and call options. Purchasing call options tends to increase a Portfolio’s exposure to the underlying instrument. Purchasing put options tends to decrease the Portfolio’s exposure to the underlying instrument. A Portfolio pays a premium which is included on the Portfolio’s Statement of Assets and Liabilities as an investment and subsequently marked to market to reflect the current value of the option. Premiums paid for purchasing options which expire are treated as realized losses. Certain options may be purchased with premiums to be determined on a future date. The premiums for these options are based upon implied volatility parameters at specified terms. The risk associated with purchasing put and call options is limited to the premium paid. Premiums paid for purchasing options which are exercised or closed are added to the amounts paid or offset against the proceeds on the underlying investment transaction to determine the realized gain or loss when the underlying transaction is sold.
During the period ended December 31, 2013, Marketfield Portfolio had the following transactions in written options:
| | | | | | | | |
| | | Number of
Contracts | | | Premium | |
Options Outstanding at May 1, 2013 | | | — | | | $ | — | |
Options—Written | | | 2,432 | | | | 566,357 | |
Options—Expired | | | (768 | ) | | | (146,219 | ) |
Options—Canceled in closing transactions | | | (1,664 | ) | | | (420,138 | ) |
Options Outstanding at December 31, 2013 | | | — | | | | — | |
(S) Interest Rate Swaptions. A Portfolio may enter into interest rate swaption agreements. A swaption is an option to enter into a pre-defined swap agreement by some specified date in the future. The writer of the swaption becomes the counterparty to the swap if the buyer exercises. The interest rate swaption agreement will specify whether the buyer of the swaption will be a fixed-rate receiver or a fixed rate buyer. As of December 31, 2013, PIMCO Real Return Portfolio held Interest Rate Swaptions.
During the year ended December 31, 2013, PIMCO Real Return Portfolio had the following transactions in interest rate swaptions:
| | | | | | | | |
| | | Notional
Amount/
Number of
Contracts | | | Premium | |
Options Outstanding at December 31, 2012 | | | 27,600,000 | | | $ | 65,550 | |
Options—Written | | | 208,000,282 | | | | 148,983 | |
Options—Exercised | | | (31 | ) | | | (15,172 | ) |
Options—Expired | | | (28,200,007 | ) | | | (76,728 | ) |
Options—Canceled in closing transactions | | | (207,400,220 | ) | | | (114,273 | ) |
Options Outstanding at December 31, 2013 | | | 24 | | | | 8,360 | |
(T) Dollar Rolls. Certain Portfolios may enter into dollar roll transactions in which they sell securities from their portfolios to a counterparty from whom they simultaneously agree to buy a similar security on a delayed delivery basis. The dollar roll transactions of the Portfolios are generally classified as purchase and sale transactions other than in the PIMCO Real Return Portfolio. If certain criteria are met, these dollar roll transactions may be considered financing transactions, whereby the difference in the sales price and the future purchase price is recorded as an adjustment to interest income. The PIMCO Real Return Portfolio generally enters into dollar roll transactions that are considered financing transactions.
When accounted for as purchase and sales, the securities sold in connection with the dollar rolls are removed from a portfolio and a realized gain or loss is recognized. The securities the Portfolios have agreed to acquire are included at market value in the Portfolio of Investments and liabilities for such purchase commitments are included as payables for investments purchased. During the roll period, a Portfolio foregoes principal and interest paid on the securities. A Portfolio is compensated by the difference between the current sales price and the forward price for the future as well as by the earnings on the cash proceeds of the initial sale. Dollar rolls may be renewed without physical delivery of the securities subject to the contract. The Portfolios maintain liquid assets from their respective portfolios having a value not less than the repurchase price, including accrued interest. Dollar roll transactions involve certain risks, including the risk that the securities returned to the Portfolios at the end of the roll period, while substantially similar, could be inferior to what was initially sold to the counterparty.
A Portfolio accounts for a dollar roll transaction as a purchase and sale whereby the difference in the sales price and purchase price of the security sold is recorded as a realized gain (loss). During the period ended December 31, 2013, PIMCO Real Return Portfolio’s average amount of borrowings was $136,061,889 at a weighted average interest rate of 0.19%.
(U) Treasury Inflation-Protected Securities. The PIMCO Real Return Portfolio invests in Treasury Inflation-Protected Securities (“TIPS”) which are specially structured bonds in which the principal amount is adjusted to keep pace with inflation. The inflation (deflation) adjustment is applied to the principal of each bond on a monthly basis and is
| | | | |
| mainstayinvestments.com | | | M-473 | |
Notes to Financial Statements (continued)
accounted for as interest income on the Statements of Operations. TIPS are subject to interest rate risk.
(V) Securities Lending. In order to realize additional income, each Portfolio, other than the Asset Allocation and Cash Management Portfolios, may engage in securities lending, subject to the limitations set forth in the 1940 Act and relevant guidance by the staff of the Securities and Exchange Commission. In the event the Portfolios do engage in securities lending, the Portfolios will lend through their custodian, State Street Bank and Trust Company (“State Street”). State Street will manage the Portfolios’ cash collateral in accordance with a lending agreement between the Portfolios and State Street, and indemnify the Portfolios against counterparty risk. The loans will be collateralized by cash or securities at least equal at all times to the market value of the securities loaned. Collateral will consist of U.S. government securities, cash equivalents or irrevocable letters of credit. The Portfolios may bear the risk of delay in recovery of, or loss of rights in, the securities loaned should the borrower of the securities experience financial difficulty. The Portfolios may also record a realized gain or loss on securities deemed sold due to the borrower’s inability to return securities on loan. The Portfolios will receive compensation for lending their securities in the form of fees or they will retain a portion of interest on the investment of any cash received as collateral. The Portfolios will also continue to receive interest and dividends on the securities loaned and any gain or loss in the market price of the securities loaned that may occur during the term of the loan will be for the account of the Portfolios.
Although the Portfolios and New York Life Investments have temporarily suspended securities lending, the Portfolios and New York Life Investments reserve the right to reinstitute lending when deemed appropriate. The Portfolios did not have any portfolio securities on loan as of December 31, 2013.
(W) Rights and Warrants. Rights are certificates that permit the holder to purchase a certain number of shares, or a fractional share, of a new stock from the issuer at a specific price. Warrants are instruments that entitle the holder to buy an equity security at a specific price for a specific period of time. The Portfolios may enter into rights and warrants when securities are acquired through a corporate action. These investments can provide a greater potential for profit or loss than an equivalent investment in the underlying security. Prices of these investments do not necessarily move in tandem with the prices of the underlying securities.
There is risk involved in the purchase of rights and warrants in that these investments are speculative investments. A Portfolio could also lose the entire value of its investment in warrants if such warrants are not exercised by the date of its expiration. The Portfolios are exposed to risk until the sale or exercise of each right or warrant is completed.
(X) Offering Costs. Costs incurred by the Marketfield Portfolio in connection with the commencement of the Marketfield Portfolio’s operations are being amortized on a straight line basis over twelve months.
(Y) Restricted Securities. A restricted security is a security which has been purchased through a private offering and cannot be resold to the general public without prior registration under the Securities Act of 1933, as amended. Disposal of these securities may involve time-consuming negotiations and expenses, and it may be difficult to obtain a prompt sale at an acceptable price. (See Note 5).
(Z) Concentration of Risk. The High Yield Corporate Bond and Unconstrained Bond Portfolios’ principal investments may include high-yield securities (sometimes called “junk bonds”), which are generally considered speculative because they present a greater risk of loss, including default, than higher quality debt securities. These securities pay investors a premium—higher interest rate or yield—because of the increased risk of loss. These securities can also be subject to greater price volatility.
The Floating Rate, High Yield Corporate Bond, Income Builder, Janus Balanced and Unconstrained Bond Portfolios’ principal investments may include loans which are usually rated below investment grade and are generally considered speculative because they present a greater risk of loss, including default, than higher quality debt securities. These securities pay investors a higher interest rate because of the increased risk of loss. Although certain loans are collateralized, there is no guarantee that the value of the collateral will be sufficient to repay the loan. In a recession or serious credit event, the value of these securities could decline significantly.
There are certain risks involved in investing in foreign securities that are in addition to the usual risks inherent in domestic instruments. These risks include those resulting from currency fluctuations, future adverse political or economic developments and possible imposition of currency exchange blockages or other foreign governmental laws or restrictions. These risks are likely to be greater in emerging markets than in developed markets. The ability of issuers of debt securities held by the Portfolios to meet their obligations may be affected by economic or political developments in a specific country, industry or region.
The Portfolios may enter into investment transactions which may represent off-balance sheet risk. Off-balance sheet risk exists when the maximum potential loss on a particular investment is greater than the value of such investment, as reflected in the Statement of Assets and Liabilities. Off-balance sheet risk generally arises from the use of derivative financial instruments or short sales.
(AA) Indemnifications. Under the Fund’s organizational documents, its officers and directors are indemnified against certain liabilities that may arise out of performance of their duties to the Fund. Additionally, in the normal course of business, the Portfolios enter into contracts with third-party service providers that contain a variety of representations and warranties and which may provide general indemnifications. The Portfolios’ maximum exposure under these arrangements is unknown, as this would involve future
| | |
| M-474 | | MainStay VP Funds Trust |
claims that may be made against the Portfolios that have not yet occurred. Based on experience, management is of the view that the risk of loss in connection with these potential indemnification obligations is remote. However, there can be no assurance that material liabilities related to such obligations will not arise in the future, which could adversely impact the Portfolios.
(AB) Quantitative Disclosure of Derivative Holdings. The following tables show additional disclosures
about the Balanced, Bond, Cornerstone Growth,
Government, Income Builder, Marketfield, MFS® Utilities, PIMCO Real Return, S&P 500 Index and Unconstrained Bond Portfolios’ derivative and hedging activities, including how such activities are accounted for and their effect on the Portfolios’ financial positions, performance and cash flows. These derivatives are not accounted for as hedging instruments. The amounts disclosed in each of the following tables represent the monthly average held during the year ended December 31, 2013.
Balanced
Fair value of derivatives instruments as of December 31, 2013:
Asset Derivatives
| | | | | | | | | | |
| | | Statement of Assets and Liabilities Location | | Interest
Rate Contracts
Risk | | | Total | |
Futures Contracts | | Net Assets—Net unrealized appreciation (depreciation) on investments and futures contracts (a) | | $ | 20,079 | | | $ | 20,079 | |
| | | | | | |
Total Fair Value | | | | $ | 20,079 | | | $ | 20,079 | |
| | | | | | |
| (a) | Includes cumulative appreciation (depreciation) of futures contracts as reported in the Portfolio of Investments. Only current day’s variation margin is reported within the Statement of Assets and Liabilities. |
The effect of derivative instruments on the Statement of Operations for the year ended December 31, 2013:
Realized Gain (Loss)
| | | | | | | | | | |
| | | Statement of Operations Location | | Interest
Rate
Contracts
Risk | | | Total | |
Futures Contracts | | Net realized gain (loss) on futures transactions | | $ | 9,983 | | | $ | 9,983 | |
| | | | | | |
Total Realized Gain (Loss) | | | | $ | 9,983 | | | $ | 9,983 | |
| | | | | | |
Change in Unrealized Appreciation (Depreciation)
| | | | | | | | | | |
| | | Statement of Operations Location | | Interest
Rate
Contracts
Risk | | | Total | |
Futures Contracts | | Net change in unrealized appreciation (depreciation) on futures contracts | | $ | 20,079 | | | $ | 20,079 | |
| | | | | | |
Total Change in Unrealized Appreciation (Depreciation) | | | | $ | 20,079 | | | $ | 20,079 | |
| | | | | | |
Number of Contracts, Notional Amounts or Shares/Units
| | | | | | | | |
| | | Interest
Rate
Contracts
Risk | | | Total | |
Futures Contracts Short (Average number of contracts) | | | (14 | ) | | | (14 | ) |
| | | | |
| | | | |
| mainstayinvestments.com | | | M-475 | |
Notes to Financial Statements (continued)
Bond
Fair value of derivatives instruments as of December 31, 2013:
Asset Derivatives
| | | | | | | | | | |
| | | Statement of Assets and Liabilities Location | | Interest
Rate
Contracts
Risk | | | Total | |
Futures Contracts | | Net Assets—Net unrealized appreciation (depreciation) on investments and futures contracts (a) | | $ | 183,583 | | | $ | 183,583 | |
| | | | | | |
Total Fair Value | | | | $ | 183,583 | | | $ | 183,583 | |
| | | | | | |
| (a) | Includes cumulative appreciation (depreciation) of futures contracts as reported in the Portfolio of Investments. Only current day’s variation margin is reported within the Statement of Assets and Liabilities. |
The effect of derivative instruments on the Statement of Operations for the year ended December 31, 2013:
Realized Gain (Loss)
| | | | | | | | | | |
| | | Statement of Operations Location | | Interest
Rate
Contracts
Risk | | | Total | |
Futures Contracts | | Net realized gain (loss) on futures transactions | | $ | (187,843 | ) | | $ | (187,843 | ) |
| | | | | | |
Total Realized Gain (Loss) | | | | $ | (187,843 | ) | | $ | (187,843 | ) |
| | | | | | |
Change in Unrealized Appreciation (Depreciation)
| | | | | | | | | | |
| | | Statement of Operations Location | | Interest
Rate
Contracts
Risk | | | Total | |
Futures Contracts | | Net change in unrealized appreciation (depreciation) on futures contracts | | $ | 183,583 | | | $ | 183,583 | |
| | | | | | |
Total Change in Unrealized Appreciation (Depreciation) | | | | $ | 183,583 | | | $ | 183,583 | |
| | | | | | |
Number of Contracts, Notional Amounts or Shares/Units
| | | | | | | | |
| | | Interest
Rate
Contracts
Risk | | | Total | |
Futures Contracts Long (Average number of contracts) | | | 110 | | | | 110 | |
Futures Contracts Short (Average number of contracts) | | | (95 | ) | | | (95 | ) |
| | | | |
Cornerstone Growth
The effect of derivative instruments on the Statement of Operations for the year ended December 31, 2013:
Realized Gain (Loss)
| | | | | | | | | | |
| | | Statement of Operations Location | | Equity Contracts
Risk | | | Total | |
Futures Contracts | | Net realized gain (loss) on futures transactions | | $ | 130,859 | | | $ | 130,859 | |
| | | | | | |
Total Realized Gain (Loss) | | | | $ | 130,859 | | | $ | 130,859 | |
| | | | | | |
| | |
| M-476 | | MainStay VP Funds Trust |
Change in Unrealized Appreciation (Depreciation)
| | | | | | | | | | |
| | | Statement of Operations Location | | Equity Contracts
Risk | | | Total | |
Futures Contracts | | Net change in unrealized appreciation (depreciation) on futures contracts | | $ | (56,918 | ) | | $ | (56,918 | ) |
| | | | | | |
Total Change in Unrealized Appreciation (Depreciation) | | | | $ | (56,918 | ) | | $ | (56,918 | ) |
| | | | | | |
Government
Fair value of derivatives instruments as of December 31, 2013:
Asset Derivatives
| | | | | | | | | | |
| | | Statement of Assets and Liabilities Location | | Interest
Rate
Contracts
Risk | | | Total | |
Futures Contracts | | Net Assets—Net unrealized appreciation (depreciation) on investments and futures contracts (a) | | $ | 763,147 | | | $ | 763,147 | |
| | | | | | |
Total Fair Value | | | | $ | 763,147 | | | $ | 763,147 | |
| | | | | | |
| (a) | Includes cumulative appreciation (depreciation) of futures contracts as reported in the Portfolio of Investments. Only current day’s variation margin is reported within the Statement of Assets and Liabilities. |
The effect of derivative instruments on the Statement of Operations for the year ended December 31, 2013:
Realized Gain (Loss)
| | | | | | | | | | |
| | | Statement of Operations Location | | Interest
Rate
Contracts
Risk | | | Total | |
Futures Contracts | | Net realized gain (loss) on futures transactions | | $ | (590,525 | ) | | $ | (590,525 | ) |
| | | | | | |
Total Realized Gain (Loss) | | | | $ | (590,525 | ) | | $ | (590,525 | ) |
| | | | | | |
Change in Unrealized Appreciation (Depreciation)
| | | | | | | | | | |
| | | Statement of Operations Location | | Interest
Rate
Contracts
Risk | | | Total | |
Futures Contracts | | Net change in unrealized appreciation (depreciation) on futures contracts | | $ | 763,147 | | | $ | 763,147 | |
| | | | | | |
Total Change in Unrealized Appreciation (Depreciation) | | | | $ | 763,147 | | | $ | 763,147 | |
| | | | | | |
Number of Contracts, Notional Amounts or Shares/Units
| | | | | | | | |
| | | Interest
Rate
Contracts
Risk | | | Total | |
Futures Contracts Short (Average number of contracts) | | | (409 | ) | | | (409 | ) |
| | | | |
| | | | |
| mainstayinvestments.com | | | M-477 | |
Notes to Financial Statements (continued)
Income Builder
Fair value of derivatives instruments as of December 31, 2013:
Asset Derivatives
| | | | | | | | | | | | | | | | | | |
| | | Statement of Assets and Liabilities Location | | Foreign
Exchange
Contracts
Risk | | | Equity
Contracts
Risk | | | Interest
Rate
Contracts
Risk | | | Total | |
Futures Contracts | | Net Assets—Net unrealized appreciation (depreciation) on investments and futures contracts (a) | | $ | — | | | $ | 1,993,926 | | | $ | 664,516 | | | $ | 2,658,442 | |
| | | | | | |
Total Fair Value | | | | $ | — | | | $ | 1,993,926 | | | $ | 664,516 | | | $ | 2,658,442 | |
| | | | | | |
Liability Derivatives
| | | | | | | | | | | | | | | | | | |
| | | Statement of Assets and Liabilities Location | | Foreign
Exchange
Contracts
Risk | | | Equity
Contracts
Risk | | | Interest
Rate
Contracts
Risk | | | Total | |
Forward Contracts | | Unrealized depreciation on foreign currency forward contracts | | $ | (391,544 | ) | | $ | — | | | $ | — | | | $ | (391,544 | ) |
| | | | | | |
Total Fair Value | | | | $ | (391,544 | ) | | $ | — | | | $ | — | | | $ | (391,544 | ) |
| | | | | | |
| (a) | Includes cumulative appreciation (depreciation) of futures contracts as reported in the Portfolio of Investments. Only current day’s variation margin is reported within the Statement of Assets and Liabilities. |
The effect of derivative instruments on the Statement of Operations for the year ended December, 2013:
Realized Gain (Loss)
| | | | | | | | | | | | | | | | | | |
| | | Statement of Operations Location | | Foreign
Exchange
Contracts
Risk | | | Equity
Contracts
Risk | | | Interest
Rate
Contracts
Risk | | | Total | |
Futures Contracts | | Net realized gain (loss) on futures transactions | | $ | — | | | $ | 16,471,398 | | | $ | 158,998 | | | $ | 16,630,396 | |
Forward Contracts | | Net realized gain (loss) on foreign currency transactions | | | (1,570,234 | ) | | | — | | | | — | | | | (1,570,234 | ) |
| | | | | | |
Total Realized Gain (Loss) | | | | $ | (1,570,234 | ) | | $ | 16,471,398 | | | $ | 158,998 | | | $ | 15,060,162 | |
| | | | | | |
Change in Unrealized Appreciation (Depreciation)
| | | | | | | | | | | | | | | | | | |
| | | Statement of Operations Location | | Foreign
Exchange
Contracts
Risk | | | Equity
Contracts
Risk | | | Interest
Rate
Contracts
Risk | | | Total | |
Futures Contracts | | Net change in unrealized appreciation (depreciation) on futures contracts | | $ | — | | | $ | 1,741,247 | | | $ | 648,987 | | | $ | 2,390,234 | |
Forward Contracts | | Net change in unrealized appreciation (depreciation) on translation of other assets and liabilities in foreign currencies and foreign currency forward contracts | | | (138,562 | ) | | | — | | | | — | | | | (138,562 | ) |
| | | | | | |
Total Change in Unrealized Appreciation (Depreciation) | | $ | (138,562 | ) | | $ | 1,741,247 | | | $ | 648,987 | | | $ | 2,251,672 | |
| | | | | | |
Number of Contracts, Notional Amounts or Shares/Units
| | | | | | | | | | | | | | | | |
| | | Foreign
Exchange
Contracts
Risk | | | Equity
Contracts
Risk | | | Interest
Rate
Contracts
Risk | | | Total | |
Futures Contracts Long (Average number of contracts) | | | — | | | | 843 | | | | — | | | | 843 | |
Futures Contracts Short (Average number of contracts) | | | — | | | | — | | | | (304 | ) | | | (304 | ) |
Forward Contracts Long (Average notional amount) | | $ | 36,303,817 | | | $ | — | | | $ | — | | | $ | 36,303,817 | |
Forward Contracts Short (Average notional amount) | | $ | (41,376,588 | ) | | $ | — | | | $ | — | | | $ | (41,376,588 | ) |
| | | | |
| | |
| M-478 | | MainStay VP Funds Trust |
The following table presents the Portfolio’s derivative liabilities by counterparty net of amounts available for offset under a master netting agreement, or similar agreement, and net of the related collateral pledged by the Portfolio as of December 31, 2013.
| | | | | | | | | | | | | | | | |
Counterparty | | Gross Liabilities in
Statement of Assets
and Liabilities | | | Derivative
assets/(liabilities)
available for offset | | | Collateral Pledged | | | Net Amount
of Derivative
Liabilities† | |
JPMorgan Chase Bank | | $ | 391,544 | | | $ | — | | | $ | — | | | $ | 391,544 | |
| | | | | | | | | | | | | | | | |
| † | Represents the net amount payable to the counterparty in the event of default. |
Marketfield
Fair value of derivatives instruments as of December 31, 2013:
Asset Derivatives
| | | | | | | | | | | | | | | | | | | | | | |
| | | Statement of Assets and Liabilities Location | | Credit
Contracts
Risk | | | Foreign
Exchange
Contracts
Risk | | | Equity
Contracts
Risk | | | Interest
Rate
Contracts
Risk | | | Total | |
Purchased Currency Options | | Investments in securities, at value | | $ | — | | | $ | 280,013 | | | $ | — | | | $ | — | | | $ | 280,013 | |
Purchased Options | | Investments in securities, at value | | | — | | | | — | | | | 1,402,118 | | | | 698,906 | | | | 2,101,024 | |
Futures Contracts | | Net Assets—Net unrealized appreciation (depreciation) on investments and futures contracts (a) | | | — | | | | — | | | | 636,788 | | | | 93,635 | | | | 730,423 | |
Swap Contracts | | Premiums paid for swap contracts | | | 934,671 | | | | — | | | | — | | | | — | | | | 934,671 | |
| | | | | | |
Total Fair Value | | | | $ | 934,671 | | | $ | 280,013 | | | $ | 2,737,812 | | | $ | 93,635 | | | $ | 4,046,131 | |
| | | | | | |
Liability Derivatives
| | | | | | | | | | | | | | | | | | | | | | |
| | | Statement of Assets and Liabilities Location | | Credit
Contracts
Risk | | | Foreign
Exchange
Contracts
Risk | | | Equity
Contracts
Risk | | | Interest
Rate
Contracts
Risk | | | Total | |
Futures Contracts | | Net Assets—Net unrealized appreciation (depreciation) on investments and futures contracts (a) | | $ | — | | | $ | — | | | $ | 287,460 | | | $ | — | | | $ | 287,460 | |
Swap Contracts | | Unrealized depreciation on swap contracts | | | 10,510 | | | | — | | | | — | | | | — | | | | 10,510 | |
| | | | | | | | | | |
Total Fair Value | | | | $ | 10,510 | | | $ | — | | | $ | 287,460 | | | $ | — | | | $ | 297,970 | |
| | | | | | | | | | |
| (a) | Includes cumulative appreciation (depreciation) of futures contracts as reported in the Portfolio of Investments. Only current day’s variation margin is reported within the Statement of Assets and Liabilities. |
The effect of derivative instruments on the Statement of Operations for the period ended December 31, 2013:
Realized Gain (Loss)
| | | | | | | | | | | | | | | | | | | | | | |
| | | Statement of Operations Location | | Credit
Contracts
Risk | | | Foreign
Exchange
Contracts
Risk | | | Equity
Contracts
Risk | | | Interest
Rate
Contracts
Risk | | | Total | |
Written Options | | Net realized gain (loss) on written option transactions | | $ | — | | | $ | — | | | $ | (102,521 | ) | | $ | 10,973 | | | $ | (91,548 | ) |
Futures Contracts | | Net realized gain (loss) on futures transactions | | | — | | | | — | | | | (241,160 | ) | | | (24,168 | ) | | | (265,328 | ) |
Forward Contracts | | Net realized gain (loss) on foreign currency transactions | | | — | | | | (14,783 | ) | | | — | | | | — | | | | (14,783 | ) |
Swap Contracts | | Net realized gain (loss) on swap transactions | | | (219,340 | ) | | | — | | | | — | | | | — | | | | (219,340 | ) |
| | | | | | | | | | |
Total Realized Gain (Loss) | | | | $ | (219,340 | ) | | $ | (14,783 | ) | | $ | (343,681 | ) | | $ | (13,195 | ) | | $ | (590,999 | ) |
| | | | | | | | | | |
| | | | |
| mainstayinvestments.com | | | M-479 | |
Notes to Financial Statements (continued)
Change in Unrealized Appreciation (Depreciation)
| | | | | | | | | | | | | | | | | | | | | | |
| | | Statement of Operations Location | | Credit
Contracts
Risk | | | Foreign
Exchange
Contracts
Risk | | | Equity
Contracts
Risk | | | Interest
Rate
Contracts
Risk | | | Total | |
Futures Contracts | | Net change in unrealized appreciation (depreciation) on futures contracts | | $ | — | | | $ | — | | | $ | 349,328 | | | $ | 93,635 | | | $ | 442,963 | |
Purchased Currency Options | | Net change in unrealized appreciation (depreciation) on investments | | | — | | | | (494,048 | ) | | | — | | | | — | | | | (494,048 | ) |
Swap Contracts | | Net change in unrealized appreciation (depreciation) on swap contracts | | | (10,510 | ) | | | — | | | | — | | | | — | | | | (10,510 | ) |
| | | | | | | | | | |
Total Change in Unrealized Appreciation (Depreciation) | | $ | (10,510 | ) | | $ | (494,048 | ) | | $ | 349,328 | | | $ | 93,635 | | | $ | (61,595 | ) |
| | | | | | | | | | |
Number of Contracts, Notional Amounts or Shares/Units
| | | | | | | | | | | | | | | | | | | | |
| | | Credit
Contracts
Risk | | | Foreign
Exchange
Contracts
Risk | | | Equity
Contracts
Risk | | | Interest
Rate
Contracts
Risk | | | Total | |
Purchased Currency Options (Average notional amount) | | $ | — | | | $ | 32,834,628 | | | $ | — | | | $ | — | | | $ | 32,834,628 | |
Purchased Options (Average notional amount) | | $ | | | | $ | — | | | $ | 7,688 | | | $ | 1,294 | | | $ | 8,982 | |
Swap Contracts (Average notional amount) | | $ | 18,037 | | | $ | — | | | $ | — | | | $ | — | | | $ | 18,037 | |
Written Options (Average notional amount) | | $ | — | | | $ | — | | | $ | (555 | ) | | $ | (399 | ) | | $ | (954 | ) |
Futures Contracts Long (Average number of contracts) | | | — | | | | — | | | | 65 | | | | — | | | | 65 | |
Futures Contracts Short (Average number of contracts) | | | — | | | | — | | | | (110 | ) | | | (140 | ) | | | (250 | ) |
| | | | |
The following table presents the Portfolio’s derivative assets by counterparty net of amounts available for offset under a master netting agreement, or similar agreement, and net of the related collateral received by the Portfolio as of December 31, 2013.
| | | | | | | | | | | | | | | | |
Counterparty | | Gross Assets in
Statement of Assets
and Liabilities | | | Derivative
assets/(liabilities)
available for offset | | | Collateral Received | | | Net Amount
of Derivative
Assets* | |
Barclays Bank PLC | | $ | 33,440 | | | $ | — | | | $ | — | | | $ | 33,440 | |
Citibank N.A. | | | 1,013,659 | | | | — | | | | — | | | | 1,013,659 | |
| | | | |
| | $ | 1,047,099 | | | $ | — | | | $ | — | | | $ | 1,047,099 | |
| | | | |
| * | Represents the net amount receivable from the counterparty in the event of default. |
MFS® Utilities
Fair value of derivatives instruments as of December 31, 2013:
Asset Derivatives
| | | | | | | | | | |
| | | Statement of Assets and Liabilities Location | | Foreign
Exchange
Contracts
Risk | | | Total | |
Forward Contracts | | Unrealized appreciation on foreign currency forward contracts | | $ | 76,328 | | | $ | 76,328 | |
| | | | | | |
Total Fair Value | | | | $ | 76,328 | | | $ | 76,328 | |
| | | | | | |
Liability Derivatives
| | | | | | | | | | |
| | | Statement of Assets and Liabilities Location | | Foreign
Exchange
Contracts
Risk | | | Total | |
Forward Contracts | | Unrealized depreciation on foreign currency forward contracts | | $ | (2,438,339 | ) | | $ | (2,438,339 | ) |
| | | | | | |
Total Fair Value | | | | $ | (2,438,339 | ) | | $ | (2,438,339 | ) |
| | | | | | |
| | |
| M-480 | | MainStay VP Funds Trust |
The effect of derivative instruments on the Statement of Operations for the year ended December 31, 2013:
Realized Gain (Loss)
| | | | | | | | | | |
| | | Statement of Operations Location | | Foreign
Exchange
Contracts
Risk | | | Total | |
Forward Contracts | | Net realized gain (loss) on foreign currency transactions | | $ | 450 | | | $ | 450 | |
| | | | | | |
Total Realized Gain (Loss) | | $ | 450 | | | $ | 450 | |
| | | | | | |
Change in Unrealized Appreciation (Depreciation)
| | | | | | | | | | |
| | | Statement of Operations Location | | Foreign
Exchange
Contracts
Risk | | | Total | |
Forward Contracts | | Net change in unrealized appreciation (depreciation) on translation of other assets and liabilities in foreign currencies and foreign currency forward contracts | | $ | 26,036 | | | $ | 26,036 | |
| | | | | | |
Total Change in Unrealized Appreciation (Depreciation) | | $ | 26,036 | | | $ | 26,036 | |
| | | | | | |
Number of Contracts, Notional Amounts or Shares/Units
| | | | | | | | |
| | | Foreign
Exchange
Contracts
Risk | | | Total | |
Forward Contracts Long (Average notional amount) | | $ | 12,181,504 | | | $ | 12,181,504 | |
Forward Contracts Short (Average notional amount) | | $ | (113,321,091 | ) | | $ | (113,321,091 | ) |
| | | | |
The following table presents the Portfolio’s derivative assets by counterparty net of amounts available for offset under a master netting agreement, or similar agreement, and net of the related collateral received by the Portfolio as of December 31, 2013.
| | | | | | | | | | | | | | | | |
Counterparty | | Gross Assets in
Statement of Assets
and Liabilities | | | Derivative
assets/(liabilities)
available for offset | | | Collateral Received | | | Net Amount
of Derivative
Assets* | |
Barclays Bank PLC | | $ | 41,168 | | | $ | (12,679 | ) | | $ | — | | | $ | 28,489 | |
| Merrill Lynch International Bank | | | 24,001 | | | | (24,001 | ) | | | — | | | | — | |
| UBS A.G. | | | 11,159 | | | | (1,828 | ) | | | — | | | | 9,331 | |
| | | | |
| | $ | 76,328 | | | $ | (38,508 | ) | | $ | — | | | $ | 37,820 | |
| | | | |
The following table presents the Portfolio’s derivative liabilities by counterparty net of amounts available for offset under a master netting agreement, or similar agreement, and net of the related collateral pledged by the Portfolio as of December 31, 2013.
| | | | | | | | | | | | | | | | |
Counterparty | | Gross Liabilities in
Statement of Assets
and Liabilities | | | Derivative
assets/(liabilities)
available for offset | | | Collateral Pledged | | | Net Amount
of Derivative
Liabilities† | |
Barclays Bank PLC | | $ | 12,679 | | | $ | (12,679 | ) | | $ | — | | | $ | — | |
| Citibank N.A. | | | 21,425 | | | | — | | | | — | | | | 21,425 | |
| Credit Suisse International | | | 331,826 | | | | — | | | | — | | | | 331,826 | |
| Deutsche Bank A.G. | | | 911,560 | | | | — | | | | — | | | | 911,560 | |
| JPMorgan Chase Bank | | | 858,594 | | | | — | | | | — | | | | 858,594 | |
| Merrill Lynch International Bank | | | 300,427 | | | | (24,001 | ) | | | — | | | | 276,426 | |
| UBS A.G. | | | 1,828 | | | | (1,828 | ) | | | — | | | | — | |
| | | | |
| | $ | 2,438,339 | | | $ | (38,508 | ) | | $ | — | | | $ | 2,399,831 | |
| | | | |
| * | Represents the net amount receivable from the counterparty in the event of default. |
| † | Represents the net amount payable to the counterparty in the event of default. |
| | | | |
| mainstayinvestments.com | | | M-481 | |
Notes to Financial Statements (continued)
PIMCO Real Return
Fair value of derivatives instruments as of December 31, 2013:
Asset Derivatives
| | | | | | | | | | | | | | |
| | | Statement of Assets and Liabilities Location | | Foreign
Exchange
Contracts
Risk | | | Interest
Rate
Contracts
Risk | | | Total | |
Swap Contracts | | Open swap agreements, at value (a) | | $ | — | | | $ | 3,165,332 | | | $ | 3,165,332 | |
Forward Contracts | | Unrealized appreciation on foreign currency forward contracts | | | 687,482 | | | | — | | | | 687,482 | |
| | | | | | |
Total Fair Value | | | | $ | 687,482 | | | $ | 3,165,332 | | | $ | 3,852,814 | |
| | | | | | |
Liability Derivatives
| | | | | | | | | | | | | | |
| | | Statement of Assets and Liabilities Location | | Foreign
Exchange
Contracts
Risk | | | Interest
Rate
Contracts
Risk | | | Total | |
Written Options | | Investments in written options, at value | | $ | — | | | $ | (12,000 | ) | | $ | (12,000 | ) |
Futures Contracts | | Net Assets—Net unrealized appreciation (depreciation) on investments and futures contracts (b) | | | — | | | | (57,491 | ) | | | (57,491 | ) |
Swap Contracts | | Open swap agreements, at value (a) | | | — | | | | (258,360 | ) | | | (258,360 | ) |
Forward Contracts | | Unrealized depreciation on foreign currency forward contracts | | | (142,817 | ) | | | — | | | | (142,817 | ) |
| | | | | | | | | | | | | | |
Total Fair Value | | | | $ | (142,817 | ) | | $ | (327,851 | ) | | $ | (470,668 | ) |
| | | | | | | | | | | | |
| (a) | Includes open swap agreements at value as reported in the Portfolio of Investments. Only current day’s variation margin of centrally cleared swaps is reported within the Statement of Assets and Liabilities. |
| (b) | Includes cumulative appreciation (depreciation) of futures contracts as reported in the Portfolio of Investments. Only the current day’s variation margin is reported within the Statement of Assets and Liabilities. |
The effect of derivative instruments on the Statement of Operations for the year ended December 31, 2013:
Realized Gain (Loss)
| | | | | | | | | | | | | | |
| | | Statement of Operations Location | | Foreign
Exchange
Contracts
Risk | | | Interest
Rate
Contracts
Risk | | | Total | |
Written Options | | Net realized gain (loss) on written option transactions | | $ | — | | | $ | 188,291 | | | $ | 188,291 | |
Futures Contracts | | Net realized gain (loss) on futures transactions | | | — | | | | (544,514 | ) | | | (544,514 | ) |
Swap Contracts | | Net realized gain (loss) on swap transactions | | | — | | | | 615,308 | | | | 615,038 | |
Forward Contracts | | Net realized gain (loss) on foreign currency transactions | | | (31,557 | ) | | | — | | | | (31,557 | ) |
| | | | | | | | | | | | | | |
Total Realized Gain (Loss) | | | | $ | (31,557 | ) | | $ | 259,085 | | | $ | 227,528 | |
| | | | | | | | | | | | |
Change in Unrealized Appreciation (Depreciation)
| | | | | | | | | | | | | | |
| | | Statement of Operations Location | | Foreign
Exchange
Contracts
Risk | | | Interest
Rate
Contracts
Risk | | | Total | |
Written Options | | Net change in unrealized appreciation (depreciation) on written option | | $ | — | | | $ | (50,919 | ) | | $ | (50,919 | ) |
Futures Contracts | | Net change in unrealized appreciation (depreciation) on futures contracts | | | — | | | | (93,577 | ) | | | (93,577 | ) |
Swap Contracts | | Net change in unrealized appreciation (depreciation) on swap contracts | | | — | | | | 1,558,753 | | | | 1,558,753 | |
Forward Contracts | | Net change in unrealized appreciation (depreciation) on translation of other assets and liabilities in foreign currencies and foreign currency forward contracts | | | 708,502 | | | | — | | | | 708,502 | |
| | | | | | | | | | | | | | |
Total Change in Unrealized Appreciation (Depreciation) | | $ | 708,502 | | | $ | 1,414,257 | | | $ | 2,122,759 | |
| | | | | | | | | | | | |
| | |
| M-482 | | MainStay VP Funds Trust |
Number of Contracts, Notional Amounts or Shares/Units
| | | | | | | | | | | | |
| | | Foreign
Exchange
Contracts
Risk | | | Interest Rate
Contracts
Risk | | | Total | |
Interest Rate Swaption Contracts (Average notional amount) | | $ | — | | | $ | (29,601,443 | ) | | $ | (29,601,443 | ) |
Futures Contracts Long (Average number of contracts) | | | — | | | | 277 | | | | 277 | |
Futures Contracts Short (Average number of contracts) | | | — | | | | (64 | ) | | | (64 | ) |
Swap Contracts (Average notional amount) | | $ | — | | | $ | 253,800,000 | | | $ | 253,800,000 | |
Forward Contracts Long (Average notional amount) | | $ | 16,680,354 | | | $ | — | | | $ | 16,680,354 | |
Forward Contracts Short (Average notional amount) | | $ | (51,548,910 | ) | | $ | — | | | $ | (51,548,910 | ) |
| | | | |
The following table presents the Portfolio’s derivative assets by counterparty net of amounts available for offset under a master netting agreement, or similar agreement, and net of the related collateral received by the Portfolio as of December 31, 2013.
| | | | | | | | | | | | | | | | |
Counterparty | | Gross Assets in
Statement of Assets
and Liabilities | | | Derivative
assets/(liabilities)
available for offset | | | Collateral Received | | | Net Amount
of Derivative
Assets* | |
Credit Suisse | | $ | 681,930 | | | $ | (285,263 | ) | | $ | — | | | $ | 396,667 | |
| JPMorgan Chase Bank | | | 349,757 | | | | (55,529 | ) | | | — | | | | 294,228 | |
| | | | |
| | $ | 1,031,687 | | | $ | (340,792 | ) | | $ | — | | | $ | 693,895 | |
| | | | |
The following table presents the Portfolio’s derivative liabilities by counterparty net of amounts available for offset under a master netting agreement, or similar agreement, and net of the related collateral pledged by the Portfolio as of December 31, 2013.
| | | | | | | | | | | | | | | | |
Counterparty | | Gross Liabilities in
Statement of Assets
and Liabilities | | | Derivative
assets/(liabilities)
available for offset | | | Collateral Pledged | | | Net Amount
of Derivative
Liabilities† | |
Credit Suisse | | $ | 285,263 | | | $ | (285,263 | ) | | $ | — | | | $ | — | |
| Morgan Stanley | | | 12,000 | | | | — | | | | (12,000 | ) | | | — | |
| JPMorgan Chase Bank | | | 55,529 | | | | (55,529 | ) | | | — | | | | — | |
| | | | |
| | $ | 352,792 | | | $ | (340,792 | ) | | $ | (12,000 | ) | | $ | — | |
| | | | |
| * | Represents the net amount receivable from the counterparty in the event of default. |
| † | Represents the net amount payable to the counterparty in the event of default. |
S&P 500 Index
Fair value of derivatives instruments as of December 31, 2013:
Asset Derivatives
| | | | | | | | | | |
| | | Statement of Assets and Liabilities Location | | Equity
Contracts
Risk | | | Total | |
Futures Contracts | | Net Assets—Net unrealized appreciation (depreciation) on investments and futures contracts (a) | | $ | 266,276 | | | $ | 266,276 | |
| | | | | | | | | | |
Total Fair Value | | | | $ | 266,276 | | | $ | 266,276 | |
| | | | | | | | | | |
| (a) | Includes cumulative appreciation (depreciation) of futures contracts as reported in the Portfolio of Investments. Only current day’s variation margin is reported within the Statement of Assets and Liabilities. |
| | | | |
| mainstayinvestments.com | | | M-483 | |
Notes to Financial Statements (continued)
The effect of derivative instruments on the Statement of Operations for the year ended December 31, 2013:
Realized Gain (Loss)
| | | | | | | | | | |
| | | Statement of Operations Location | | Equity
Contracts
Risk | | | Total | |
Futures Contracts | | Net realized gain (loss) on futures transactions | | $ | 17,518,816 | | | $ | 17,518,816 | |
| | | | | | |
Total Realized Gain (Loss) | | | | $ | 17,518,816 | | | $ | 17,518,816 | |
| | | | | | |
Change in Unrealized Appreciation (Depreciation)
| | | | | | | | | | |
| | | Statement of Operations Location | | Equity
Contracts
Risk | | | Total | |
Futures Contracts | | Net change in unrealized appreciation (depreciation) on futures contracts | | $ | 944,925 | | | $ | 944,925 | |
| | | | | | | | | | |
Total Change in Unrealized Appreciation (Depreciation) | | $ | 944,925 | | | $ | 944,925 | |
| | | | | | | | | | |
Number of Contracts, Notional Amounts or Shares/Units
| | | | | | | | |
| | | Equity
Contracts
Risk | | | Total | |
Futures Contracts Long (Average number of contracts) | | | 603 | | | | 603 | |
| | | | |
Unconstrained Bond
Fair value of derivatives instruments as of December 31, 2013:
Asset Derivatives
| | | | | | | | | | | | | | |
| | | Statement of Assets and Liabilities Location | | Foreign
Exchange
Contracts
Risk | | | Interest
Rate
Contracts
Risk | | | Total | |
Futures Contracts | | Net Assets—Net unrealized appreciation (depreciation) on investments and futures contracts (a) | | $ | — | | | $ | 1,779,971 | | | $ | 1,779,971 | |
| | | | | | |
Total Fair Value | | | | $ | — | | | $ | 1,779,971 | | | $ | 1,779,971 | |
| | | | | | |
Liability Derivatives
| | | | | | | | | | | | | | |
| | | Statement of Assets and Liabilities Location | | Foreign
Exchange
Contracts
Risk | | | Interest
Rate
Contracts
Risk | | | Total | |
Forward Contracts | | Unrealized depreciation on foreign currency forward contracts | | $ | (157,698 | ) | | $ | — | | | $ | (157,698 | ) |
| | | | | | |
Total Fair Value | | | | $ | (157,698 | ) | | $ | — | | | $ | (157,698 | ) |
| | | | | | |
| (a) | Includes cumulative appreciation (depreciation) of futures contracts as reported in the Portfolio of Investments. Only current day’s variation margin is reported within the Statement of Assets and Liabilities. |
The effect of derivative instruments on the Statement of Operations for the year ended December 31, 2013:
Realized Gain (Loss)
| | | | | | | | | | | | | | |
| | | Statement of Operations Location | | Foreign
Exchange
Contracts
Risk | | | Interest
Rate
Contracts
Risk | | | Total | |
Futures Contracts | | Net realized gain (loss) on futures transactions | | $ | — | | | $ | (979,097 | ) | | $ | (979,097 | ) |
Forward Contracts | | Net realized gain (loss) on foreign currency transactions | | | (443,601 | ) | | | — | | | | (443,601 | ) |
| | | | | | |
Total Realized Gain (Loss) | | | | $ | (443,601 | ) | | $ | (979,097 | ) | | $ | (1,422,698 | ) |
| | | | | | |
| | |
| M-484 | | MainStay VP Funds Trust |
Change in Unrealized Appreciation (Depreciation)
| | | | | | | | | | | | | | |
| | | Statement of Operations Location | | Foreign
Exchange
Contracts
Risk | | | Interest
Rate
Contracts
Risk | | | Total | |
Futures Contracts | | Net change in unrealized appreciation (depreciation) on futures contracts | | $ | — | | | $ | 1,982,351 | | | $ | 1,982,351 | |
Forward Contracts | | Net change in unrealized appreciation (depreciation) on translation of other assets and liabilities in foreign currencies and foreign currency forward contracts | | | (95,732 | ) | | | — | | | | (95,732 | ) |
| | | | | | |
Total Change in Unrealized Appreciation (Depreciation) | | $ | (95,732 | ) | | $ | 1,982,351 | | | $ | 1,886,619 | |
| | | | | | |
Number of Contracts, Notional Amounts or Shares/Units
| | | | | | | | | | | | |
| | | Foreign
Exchange
Contracts
Risk | | | Interest
Rate
Contracts
Risk | | | Total | |
Futures Contracts Long (Average number of contracts) | | | | | | | 115 | | | | 115 | |
Futures Contracts Short (Average number of contracts) | | | — | | | | (1,055 | ) | | | (1,055 | ) |
Forward Contracts Long (Average notional amount) | | $ | 10,627,598 | | | $ | — | | | $ | 10,627,598 | |
Forward Contracts Short (Average notional amount) | | $ | (13,439,019 | ) | | $ | — | | | $ | (13,439,019 | ) |
| | | | |
The following table presents the Portfolio’s derivative liabilities by counterparty net of amounts available for offset under a master netting agreement, or similar agreement, and net of the related collateral pledged by the Portfolio as of December 31, 2013.
| | | | | | | | | | | | | | | | |
Counterparty | | Gross Liabilities in
Statement of Assets
and Liabilities | | | Derivative
assets/(liabilities)
available for offset | | | Collateral Pledged | | | Net Amount
of Derivative
Liabilities† | |
JPMorgan Chase Bank | | $ | 157,698 | | | $ | — | | | $ | — | | | $ | 157,698 | |
| | | | |
| † | Represents the net amount payable to the counterparty in the event of default. |
Note 3–Fees and Related Party Transactions
(A) Manager and Subadvisors. New York Life Investments, a registered investment adviser and an indirect, wholly-owned subsidiary of New York Life, serves as the Portfolios’ investment manager pursuant to an Amended and Restated Management Agreement (“Management Agreement”). New York Life Investments manages the Bond, Cash Management, Conservative Allocation, Floating Rate, Growth Allocation, Moderate Allocation and Moderate Growth Allocation Portfolios and the fixed-income portion of the Balanced Portfolio directly without the use of a subadvisor.
Cornerstone Capital Management LLC (“Cornerstone Capital”), a registered investment adviser, serves as the Subadvisor to the Cornerstone Growth Portfolio (formerly known as Growth Equity Portfolio) pursuant to the terms of a Subadvisory Agreement with New York Life Investments. Cornerstone Capital is an affiliate of New York Life Investments.
Cornerstone Capital Management Holdings LLC (“Cornerstone Holdings”) (formerly Madison Square Investors LLC), a registered investment adviser and an indirect, wholly-owned subsidiary of New York Life, serves as Subadvisor to the following Portfolios: Common Stock,
International Equity, Mid Cap Core, S&P 500 Index, and the equity portion of Balanced Portfolio, pursuant to the terms of a Subadvisory Agreement with New York Life Investments.
Dimensional Fund Advisors LP (“DFA”) and DuPont Capital Management Corporation (“DuPont Capital”), each a registered investment adviser, serve as Subadvisors to the DFA / DuPont Capital Emerging Markets Equity Portfolio and manage a portion of the Portfolio’s assets, as designated by New York Life Investments from time to time, subject to the oversight of New York Life Investments. Each Subadvisor is responsible for the day-to-day portfolio management of the Portfolio with respect to its allocated portion of the Portfolio’s assets.
Eagle Asset Management, Inc. (“Eagle”), a registered investment adviser, serves as Subadvisor to the Eagle Small Cap Growth Portfolio pursuant to the terms of a Subadvisory Agreement with New York Life Investments.
Epoch Investment Partners, Inc. (“Epoch”), a registered investment adviser, serves as Subadvisor to the U.S. Small Cap Portfolio and the equity portion of the Income Builder Portfolio pursuant to the terms of a Subadvisory Agreement with New York Life Investments.
| | | | |
| mainstayinvestments.com | | | M-485 | |
Notes to Financial Statements (continued)
Institutional Capital LLC (“ICAP”), a registered investment adviser and an indirect, wholly-owned subsidiary of New York Life, serves as Subadvisor to the ICAP Select Equity Portfolio pursuant to the terms of a Subadvisory Agreement with New York Life Investments.
Janus Capital Management LLC (“Janus”), a registered investment adviser and wholly owned subsidiary of Janus Capital Group, Inc. (“JCGI”), serves as Subadvisor to the Janus Balanced Portfolio pursuant to the terms of a Subadvisory Agreement with New York Life Investments.
MacKay Shields LLC (“MacKay Shields”), a registered investment adviser and an indirect, wholly-owned subsidiary of New York Life, serves as Subadvisor to the following Portfolios: Convertible, Government, High Yield Corporate Bond, Unconstrained Bond (formerly known as Flexible Bond Opportunities) and the overall asset allocation and fixed-income portion of Income Builder Portfolio pursuant to the terms of a Subadvisory Agreement with New York Life Investments.
Marketfield Asset Management LLC (“Marketfield”), a registered investment adviser, serves as Subadvisor to the Marketfield Portfolio pursuant to the terms of a Subadvisory Agreement with New York Life Investments.
Massachusetts Financial Services Company (“MFS®”), a registered investment adviser and an indirect majority-owned subsidiary of Sun Life Financial Inc. (a diversified financial services company), serves as Subadvisor to the MFS® Utilities Portfolio pursuant to the terms of a Subadvisory Agreement with New York Life Investments.
Pacific Investment Management Company LLC (“PIMCO”), a registered investment adviser, serves as Subadvisor to the PIMCO Real Return Portfolio pursuant to the terms of a Subadvisory Agreement with New York Life Investments.
T. Rowe Price Associates, Inc. (“T. Rowe Price”), a registered investment adviser, serves as Subadvisor to the T. Rowe Price Equity Portfolio pursuant to the terms of a Subadvisory Agreement with New York Life Investments.
Van Eck Associates Corporation (“Van Eck”), a registered investment adviser, serves as Subadvisor to the Van Eck Global Hard Assets Portfolio pursuant to the terms of a Subadvisory Agreement with New York Life Investments.
Winslow Capital Management, Inc. (“Winslow”), a registered investment adviser, serves as Subadvisor to the Large Cap Growth Portfolio pursuant to the terms of a Subadvisory Agreement with New York Life Investments.
Pursuant to the terms of Subadvisory Agreements between New York Life Investments and the Subadvisors, New York Life Investments pays for the services of each Subadvisor.
Pursuant to the Management Agreement referenced above, New York Life Investments also serves as administrator for the Portfolios. New York Life Investments provides offices, conducts clerical, recordkeeping and bookkeeping services,
and keeps most of the financial and accounting records required to be maintained by the Portfolios. Except for the portion of salaries and expenses that are the responsibility of the Portfolios, the Manager pays the salaries and expenses of all personnel affiliated with the Portfolios and the operational expenses of the Portfolios. The Portfolios reimburse New York Life Investments in an amount equal to a portion of the compensation of the Chief Compliance Officer of the Portfolios. For allocation methodology, see Note 2(G).
State Street, 1 Lincoln Street, Boston, Massachusetts, 02111, provides sub-administration and sub-accounting services to the Portfolios pursuant to an agreement with New York Life Investments. These services include calculating the daily NAVs of the Portfolios, maintaining the general ledger and sub-ledger accounts for the calculation of the Portfolios’ respective NAVs, and assisting New York Life Investments in conducting various aspects of the Portfolios’ administrative operations. For providing these services to the Portfolios, State Street is compensated by New York Life Investments.
The Fund, on behalf of each Portfolio, pays New York Life Investments in its capacity as the Portfolios’ investment manager and administrator, a monthly fee for the services performed and the facilities furnished at an approximate annual percentage of the average daily net assets of each Portfolio set forth in the table below. Where indicated, New York Life Investments has voluntarily agreed to waive fees and/or reimburse expenses with respect to certain Portfolios. From time to time, the Manager may voluntarily limit the Cash Management Portfolio’s expenses to the extent it deems appropriate to enhance the Portfolio’s yield during periods when expenses may have a significant impact on yield because of low interest rates. This limitation may be revised or terminated by the Manager at any time without notice.
| | | | | | | | |
Portfolio | | Annual Rate
on Average
Daily Net
Assets | | | Effective
Management
Fee Rate* | |
Balanced | | | 0.70% | (a) | | | 0.71% | |
Bond | | | 0.50% | (b) | | | 0.49% | |
Cash Management | | | 0.45% | (c) | | | 0.44% | |
Common Stock | | | 0.55% | (d) | | | 0.55% | |
Conservative Allocation | | | 0.00% | | | | 0.00% | |
Convertible | | | 0.60% | (e) | | | 0.60% | |
Cornerstone Growth | | | 0.70% | (f) | | | 0.67% | |
DFA / DuPont Capital Emerging Markets Equity | | | 1.20% | (g) | | | 1.20% | |
Eagle Small Cap Growth | | | 0.81% | (h) | | | 0.81% | |
Floating Rate | | | 0.60% | (i) | | | 0.60% | |
Government | | | 0.50% | (b) | | | 0.50% | |
Growth Allocation | | | 0.00% | | | | 0.00% | |
High Yield Corporate Bond | | | 0.57% | (j) | | | 0.56% | |
ICAP Select Equity | | | 0.80% | (k) | | | 0.76% | |
| | |
| M-486 | | MainStay VP Funds Trust |
| | | | | | | | |
Portfolio | | Annual Rate
on Average
Daily Net
Assets | | | Effective
Management
Fee Rate* | |
Income Builder | | | 0.57% | (l) | | | 0.57% | |
International Equity | | | 0.89% | (m) | | | 0.89% | |
Janus Balanced | | | 0.55% | (n) | | | 0.55% | |
Large Cap Growth | | | 0.75% | (o) | | | 0.74% | |
Marketfield | | | 1.40% | (p) | | | 1.40% | |
MFS® Utilities | | | 0.73% | (q) | | | 0.73% | |
Mid Cap Core | | | 0.85% | (r) | | | 0.85% | |
Moderate Allocation | | | 0.00% | | | | 0.00% | |
Moderate Growth Allocation | | | 0.00% | | | | 0.00% | |
PIMCO Real Return | | | 0.50% | (s) | | | 0.50% | |
S&P 500 Index | | | 0.25% | (t) | | | 0.26% | |
T. Rowe Price Equity Income | | | 0.80% | (u) | | | 0.79% | |
Unconstrained Bond | | | 0.60% | (v) | | | 0.60% | |
U.S. Small Cap | | | 0.80% | (w) | | | 0.78% | |
Van Eck Global Hard Assets | | | 0.89% | (x) | | | 0.89% | |
| * | The effective management fee rate is exclusive of any applicable waivers/reimbursements. |
| (a) | Up to $1 billion and 0.65% in excess of $1 billion. Prior to May 1, 2013 the management fee rate was 0.75% up to $1 billion and 0.70% in excess of $1 billion. New York Life Investments had voluntarily agreed to waive a portion of its management fees to 0.70% on assets up to $1 billion and 0.65% on assets in excess of $1 billion. The agreement expired on May 1, 2013. For the year ended December 31, 2013, the Manager waived its fees in the amount of $35,901. |
| (b) | Up to $500 million; 0.475% from $500 million to $1 billion and 0.45% in excess of $1 billion. |
| (c) | Up to $500 million; 0.40% from $500 million to $1 billion and 0.35% in excess of $1 billion. From time to time, the Manager may limit expenses of the Portfolio to the extent it deems appropriate to enhance the yield of the Portfolio during periods when expenses have a significant impact on the yield of the Portfolio because of low interest rates. This expense limitation policy is voluntary and may be revised or terminated by the Manager at any time without notice. For the year ended December 31, 2013, the Manager waived its fees in the amount of $2,318,351. |
| (d) | Up to $500 million; 0.525% from $500 million to $1 billion and 0.50% in excess of $1 billion. |
| (e) | Up to $500 million; 0.55% from $500 million to $1 billion and 0.50% in excess of $1 billion. |
| (f) | Up to $500 million; 0.675% from $500 million to $1 billion and 0.65% in excess of $1 billion. At a special meeting held on January 7, 2013, the shareholders of the Portfolio approved an amendment to the Amended and Restated Management Agreement dated May 1, 2013 between New York Life |
| | Investments and MainStay VP Funds Trust with respect to the Portfolio, which imposed an increase in the management fees paid to New York Life Investments, which in turn increased the Portfolio’s overall fees. Proir to May 1, 2013, the management fees were 0.61% up to $1 billion and 0.50% in excess of $1 billion. |
| (g) | New York Life Investments has contractually agreed to waive fees and/or reimburse expenses so that total annual operating expenses do not exceed 1.60% for Initial Class and 1.65% for Service Class. This agreement expires on May 1, 2014 and may not be amended or terminated prior to that date. Additionally, New York Life Investments has contractually agreed to waive 0.01% of its management fee on assets in excess of $1 billion. This agreement expires on May 1, 2014 and may only be amended or terminated prior to that date by action of the Board. |
| (h) | New York Life Investments has contractually agreed to waive fees and/or reimburse expenses so that total annual operating expenses do not exceed 0.95% for Initial Class and 1.22% for Service Class. This agreement expires on May 1, 2014 and may not be amended or terminated prior to that date. Additionally, New York Life Investments has contractually agreed to waive 0.025% of its management fee on assets in excess of $1 billion. This agreement expires on May 1, 2014 and may only be amended or terminated prior to that date by action of the Board. |
| (i) | Up to $1 billion and 0.575% in excess of $1 billion. |
| (j) | Up to $1 billion; 0.55% from $1 billion to $5 billion and 0.525% in excess of $5 billion. |
| (k) | Up to $250 million; 0.75% from $250 million to $1 billion and 0.74% in excess of $1 billion. |
| (l) | Up to $1 billion and 0.55% in excess of $1 billion. |
| (m) | Up to $500 million and 0.85% in excess of $500 million. |
| (n) | New York Life Investments has contractually agreed to waive fees and/or reimburse expenses so that total annual operating expenses do not exceed 0.58% for Initial Class and 0.83% for Service Class. This agreement expires on May 1, 2014 and may not be amended or terminated prior to that date. Additionally, New York Life Investments has contractually agreed to waive 0.025% of its management fee on assets in excess of $1 billion. This agreement expires on May 1, 2014 and may only be amended or terminated prior to that date by action of the Board. For the year ended December 31, 2013, the Manager waived its fees in the amount of $75,419. |
| (o) | Up to $500 million; 0.725% from $500 million to $750 million, 0.71% from $750 million to $1 billion, 0.70% from $1 billion to $2 billion, 0.66% from $2 billion to $3 billion, 0.61% from $3 billion to $7 billion, 0.585% from $7 billion to $9 billion and 0.575% in excess of $9 billion. New York Life Investments has voluntarily agreed to waive a portion of its management fee when the subadvisory fee is reduced as a result of achieving breakpoints in the subadvisory fee schedule. The savings that result from the reduced subadvisory fee will be shared equally with the MainStay VP Large Cap Growth Portfolio provided that the amount of the management fee retained by New York Life Investments, after payment of the subadvisory fee, exceeds 0.35% of the average daily net assets of the Portfolio. This waiver may be discontinued at any time. For the year ended December 31, 2013, the Manager waived its fees in the amount of $25,102. |
| (p) | New York Life Investments has contractually agreed to waive fees and/or reimburse expenses so that total annual operating expenses do not exceed 1.60% for Initial Class shares. New York Life Investments has agreed to apply an equivalent waiver or reimbursement in an equal to the number of basis points waived for the Initial Class shares to the Service Class shares. This agreement expires on May 1, 2014 and may not be amended or terminated prior to that date. |
| | | | |
| mainstayinvestments.com | | | M-487 | |
Notes to Financial Statements (continued)
| (q) | New York Life Investments has contractually agreed to waive fees and/or reimburse expenses so that total annual operating expenses do not exceed 0.81% for Initial Class and 1.06% for Service Class. This agreement expires on May 1, 2014 and may not be amended or terminated prior to that date. Additionally, New York Life Investments has contractually agreed to waive 0.03% of its management fee on assets in excess of $1 billion. This agreement expires on May 1, 2014 and may only be amended or terminated prior to that date by action of the Board. For the year ended December 31, 2013, the Manager waived its fees in the amount of $14,064. |
| (r) | Up to $1 billion and 0.80% in excess of $1 billion. New York Life Investments has contractually agreed to waive fees and/or reimburse expenses so that the total annual operating expenses (excluding taxes, interest, litigation, extraordinary expenses, brokerage and other transaction expenses relating to the purchase or sale of portfolio investments, and acquired (underlying) fund fees and expenses) do not exceed 0.84% for the Initial Class and 1.09% for the Service Class. This agreement expires on May 1, 2014 and may only be amended or terminated prior to that date by action of the Board. For the year ended December 31, 2013, the Manager waived its fees in the amount of $213,462. |
| (s) | New York Life Investments has contractually agreed to waive fees and/or reimburse expenses so that total annual operating expenses do not exceed 0.66% for Initial Class and 0.76% for Service Class. This agreement expires on May 1, 2014 and may not be amended or terminated prior to that date. For the year ended December 31, 2013, the Manager waived its fees in the amount of $188,960. |
| | Subsequent to the implementation of this expense limitation agreement, amended accounting guidance required certain dollar roll transactions to be treated as secured borrowings and the components of the net income from such transactions are now presented in the financial statements as interest income and interest expense. These accounting changes did not affect the Portfolio’s overall results of operations, net asset value, total return or the amount of expenses paid directly from investments in the Portfolio. As a result of these new reporting requirements, the Portfolio may present in its financial statements net expenses which are greater than this agreed upon expense limit. |
| (t) | Up to $1 billion; 0.225% from $1 billion to $2 billion; 0.215% from $2 billion to $3 billion and 0.20% in excess of $3 billion. Prior to May 1, 2013, the management fee rate was 0.30% up to $1 billion; 0.275% from $1 billion to $2 billion; 0.265% from $2 billion to $3 billion and 0.25% in excess of $3 billion. New York Life Investments had voluntarily agreed to waive a portion of its management fees to 0.25% on asset up to $1 billion; 0.225% on assets from $1 billion to $2 billion; 0.215% on assets from $2 billion and 0.20% on asset in excess of $3 billion. This agreement expired on May 1, 2013. For the year ended December 31, 2013, the Manager waived its fees in the amount of $173,495. |
| (u) | Up to $500 million and 0.775% on assets in excess of $500 million. New York Life Investments has contractually agreed to waive its management fee to 0.75% on assets up to $500 million and 0.725% on assets in excess of $500 million. This agreement expires on May 1, 2014 and may not be amended or terminated prior to that date. Additionally, New York Life Investments has contractually agreed to waive fees and/or reimburse expenses so that total annual operating expenses do |
| | not exceed 0.85% for Initial Class and 1.10% for Service Class. This agreement expires on May 1, 2014 and may not be amended or terminated prior to that date. For the year ended December 31, 2013, the Manager waived its fees in the amount of $359,229. |
| (v) | Up to $500 million; 0.55% from $500 million to $1 billion and 0.50% in excess of $1 billion. |
| (w) | Up to $200 million; 0.75% from $200 million to $500 million; 0.725% from $500 million to $1 billion and 0.70% in excess of $1 billion. |
| (x) | New York Life Investments has contractually agreed to waive fees and/or reimburse expenses so that total annual operating expenses do not exceed 0.97% for Initial Class. This agreement expires on May 1, 2014 and may not be amended or terminated prior to that date. Additionally, New York Life Investments has contractually agreed to waive 0.01% of its management fees on assets in excess of $1 billion. This agreement expires on May 1, 2014 and may only be amended or terminated prior to that date by action of the Board. |
(B) Distribution and Service Fees. NYLIFE Distributors LLC (the “Distributor”), an indirect, wholly-owned subsidiary of New York Life, serves as distributor to the Service Class shares of all Portfolios offering such shares, pursuant to a Distribution and Service Agreement. With respect to the Service Class shares of all Portfolios offering such shares, the Fund has adopted a Distribution and Service Plan in accordance with the provisions of Rule 12b-1 under the 1940 Act. Under the Distribution and Service Plan, the Distributor has agreed to provide, through its affiliates or independent third parties, various distribution-related, shareholder and administrative support services to Service Class shareholders. For its services, the Distributor is entitled to a combined distribution and service fee accrued daily and paid monthly at an annual rate of 0.25% of the average daily net assets attributable to the Service Class shares of each applicable Portfolio.
(C) Capital. As of December 31, 2013, the Asset Allocation Portfolios held the following percentages of outstanding shares of affiliated investment companies:
| | | | |
Conservative Allocation Portfolio | | | | |
MainStay Emerging Markets Opportunities Fund Class I | | | 7.22 | % |
MainStay Epoch Global Choice Fund Class I | | | 13.25 | |
MainStay Epoch U.S. All Cap Fund Class I | | | 5.61 | |
MainStay High Yield Municipal Bond Fund Class I | | | 2.22 | |
MainStay High Yield Opportunities Fund Class I | | | 0.30 | |
MainStay ICAP Equity Fund Class I | | | 1.87 | |
MainStay ICAP International Fund Class I | | | 0.69 | |
MainStay Intermediate Term Bond Fund Class I | | | 4.67 | |
MainStay International Opportunities Fund Class I | | | 3.61 | |
MainStay MAP Fund Class I | | | 2.44 | |
MainStay Short Duration High Yield Fund Class I | | | 15.24 | |
MainStay U.S. Equity Opportunities Fund Class I | | | 6.79 | |
MainStay VP Bond Portfolio Initial Class | | | 39.58 | |
| | |
| M-488 | | MainStay VP Funds Trust |
| | | | |
MainStay VP Cash Management Portfolio Initial Class | | | 4.83 | % |
MainStay VP Cornerstone Growth Portfolio Initial Class | | | 2.78 | |
MainStay VP DFA / DuPont Capital Emerging Markets Equity Portfolio Initial Class | | | 3.33 | |
MainStay VP Eagle Small Cap Growth Portfolio Initial Class | | | 5.67 | |
MainStay VP Floating Rate Portfolio Initial Class | | | 26.83 | |
MainStay VP High Yield Corporate Bond Portfolio Initial Class | | | 3.93 | |
MainStay VP International Equity Portfolio Initial Class | | | 1.53 | |
MainStay VP Large Cap Growth Portfolio Initial Class | | | 9.23 | |
MainStay VP Marketfield Portfolio Initial Class | | | 19.17 | |
MainStay VP Mid Cap Core Portfolio Initial Class | | | 4.16 | |
MainStay VP S&P 500 Index Portfolio Initial Class | | | 0.17 | |
MainStay VP T. Rowe Price Equity Income Portfolio Initial Class | | | 6.82 | |
MainStay VP Unconstrained Bond Portfolio Initial Class | | | 27.12 | |
MainStay VP U.S. Small Cap Portfolio Initial Class | | | 9.68 | |
| |
| | | | |
Growth Allocation Portfolio | | | | |
MainStay Emerging Markets Opportunities Fund Class I | | | 4.41 | % |
MainStay Epoch Global Choice Fund Class I | | | 5.88 | |
MainStay Epoch U.S. All Cap Fund Class I | | | 5.61 | |
MainStay ICAP Equity Fund Class I | | | 2.24 | |
MainStay ICAP International Fund Class I | | | 1.97 | |
MainStay International Opportunities Fund Class I | | | 11.09 | |
MainStay MAP Fund Class I | | | 2.78 | |
MainStay U.S. Equity Opportunities Fund Class I | | | 7.74 | |
MainStay VP Cornerstone Growth Portfolio Initial Class | | | 2.89 | |
MainStay VP DFA / DuPont Capital Emerging Markets Equity Portfolio Initial Class | | | 3.46 | |
MainStay VP Eagle Small Cap Growth Portfolio Initial Class | | | 6.21 | |
MainStay VP International Equity Portfolio Initial Class | | | 4.71 | |
MainStay VP Large Cap Growth Portfolio Initial Class | | | 9.52 | |
MainStay VP Marketfield Portfolio Initial Class | | | 8.83 | |
MainStay VP Mid Cap Core Portfolio Initial Class | | | 4.62 | |
MainStay VP S&P 500 Index Portfolio Initial Class | | | 0.97 | |
MainStay VP T. Rowe Price Equity Income Portfolio Initial Class | | | 7.53 | |
MainStay VP U.S. Small Cap Portfolio Initial Class | | | 11.13 | |
MainStay VP Van Eck Global Hard Assets Portfolio Initial Class | | | 0.02 | |
| |
| | | | |
Moderate Allocation Portfolio | | | | |
MainStay Emerging Markets Opportunities Fund Class I | | | 11.35 | % |
MainStay Epoch Global Choice Fund Class I | | | 17.13 | |
MainStay Epoch U.S. All Cap Fund Class I | | | 11.76 | |
MainStay High Yield Municipal Bond Fund Class I | | | 2.88 | |
MainStay ICAP Equity Fund Class I | | | 4.20 | |
MainStay ICAP International Fund Class I | | | 2.51 | |
MainStay Intermediate Term Bond Fund Class I | | | 6.07 | |
MainStay International Opportunities Fund Class I | | | 13.83 | |
MainStay MAP Fund Class I | | | 5.24 | |
MainStay Short Duration High Yield Fund Class I | | | 12.58 | |
MainStay U.S. Equity Opportunities Fund Class I | | | 13.49 | |
| | | | |
MainStay VP Bond Portfolio Initial Class | | | 26.91 | % |
MainStay VP Cash Management Portfolio Initial Class | | | 6.25 | |
MainStay VP Cornerstone Growth Portfolio Initial Class | | | 5.61 | |
MainStay VP DFA / DuPont Capital Emerging Markets Equity Portfolio Initial Class | | | 5.75 | |
MainStay VP Eagle Small Cap Growth Portfolio Initial Class | | | 7.41 | |
MainStay VP Floating Rate Portfolio Initial Class | | | 25.22 | |
MainStay VP High Yield Corporate Bond Portfolio Initial Class | | | 3.18 | |
MainStay VP International Equity Portfolio Initial Class | | | 5.90 | |
MainStay VP Large Cap Growth Portfolio Initial Class | | | 21.53 | |
MainStay VP Marketfield Portfolio Initial Class | | | 24.31 | |
MainStay VP Mid Cap Core Portfolio Initial Class | | | 4.73 | |
MainStay VP S&P 500 Index Portfolio Initial Class | | | 1.19 | |
MainStay VP T. Rowe Price Equity Income Portfolio Initial Class | | | 12.38 | |
MainStay VP Unconstrained Bond Portfolio Initial Class | | | 35.27 | |
MainStay VP U.S. Small Cap Portfolio Initial Class | | | 10.61 | |
| |
| | | | |
Moderate Growth Allocation Portfolio | | | | |
MainStay Emerging Markets Opportunities Fund Class I | | | 17.86 | % |
MainStay Epoch Global Choice Fund Class I | | | 24.92 | |
MainStay Epoch U.S. All Cap Fund Class | | | 18.46 | |
MainStay High Yield Municipal Bond Fund Class I | | | 3.57 | |
MainStay ICAP Equity Fund Class I | | | 7.06 | |
MainStay ICAP International Fund Class I | | | 6.00 | |
MainStay Intermediate Term Bond Fund Class I | | | 8.50 | |
MainStay International Opportunities Fund Class I | | | 36.29 | |
MainStay MAP Fund Class I | | | 10.03 | |
MainStay Short Duration High Yield Fund Class I | | | 17.80 | |
MainStay U.S. Equity Opportunities Fund Class I | | | 28.46 | |
MainStay VP Bond Portfolio Initial Class | | | 0.40 | |
MainStay VP Cash Management Portfolio Initial Class | | | 9.46 | |
MainStay VP Cornerstone Growth Portfolio Initial Class | | | 9.79 | |
MainStay VP DFA / DuPont Capital Emerging Markets Equity Portfolio Initial Class | | | 11.23 | |
MainStay VP Eagle Small Cap Growth Portfolio Initial Class | | | 21.22 | |
MainStay VP Floating Rate Portfolio Initial Class | | | 30.98 | |
MainStay VP High Yield Corporate Bond Portfolio Initial Class | | | 3.80 | |
MainStay VP International Equity Portfolio Initial Class | | | 15.08 | |
MainStay VP Large Cap Growth Portfolio Initial Class | | | 35.15 | |
MainStay VP Marketfield Portfolio Initial Class | | | 36.36 | |
MainStay VP Mid Cap Core Portfolio Initial Class | | | 15.54 | |
MainStay VP S&P 500 Index Portfolio Initial Class | | | 1.68 | |
MainStay VP T. Rowe Price Equity Income Portfolio Initial Class | | | 26.27 | |
MainStay VP Unconstrained Bond Portfolio Initial Class | | | 34.56 | |
MainStay VP U.S. Small Cap Portfolio Initial Class | | | 35.62 | |
MainStay VP Van Eck Global Hard Assets Portfolio Initial Class | | | 0.24 | |
As of December 31, 2013, the Floating Rate Portfolio held the following percentage of outstanding shares of an affiliated investment company:
| | | | |
MainStay High Yield Corporate Bond Fund Class I | | | 0.14 | % |
| | | | |
| mainstayinvestments.com | | | M-489 | |
Notes to Financial Statements (continued)
Note 4–Federal Income Tax
As of December 31, 2013, the components of accumulated gain (loss) on a tax basis were as follows:
| | | | | | | | | | | | | | | | | | | | | | | | |
Portfolio | | Ordinary
Income | | | Late Year
Ordinary and
Post October
Loss Deferrals | | | Accumulated
Capital
and Other
Gain (Loss) | | | Other
Temporary
Differences | | | Unrealized
Appreciation
(Depreciation) | | | Total
Accumulated
Gain (Loss) | |
Balanced | | $ | 14,300,002 | | | $ | — | | | $ | 11,456,037 | | | $ | 76 | | | $ | 35,773,171 | | | $ | 61,529,286 | |
Bond | | | 20,760,367 | | | | — | | | | (10,592,098 | ) | | | — | | | | (1,097,031 | ) | | | 9,071,238 | |
Cash Management | | | 136 | | | | — | | | | — | | | | — | | | | — | | | | 136 | |
Common Stock | | | 8,614,285 | | | | — | | | | (37,479,217 | ) | | | — | | | | 131,849,433 | | | | 102,984,501 | |
Conservative Allocation | | | 30,243,786 | | | | — | | | | 49,315,080 | | | | (24,783,492 | ) | | | 32,123,397 | | | | 86,898,771 | |
Convertible | | | 23,976,114 | | | | — | | | | 5,818,564 | | | | (2,505,776 | ) | | | 96,180,148 | | | | 123,469,050 | |
Cornerstone Growth | | | 12,817,341 | | | | — | | | | 82,967,806 | | | | — | | | | 66,262,034 | | | | 162,047,181 | |
DFA / Dupont Capital Emerging Markets Equity | | | 3,963,635 | | | | — | | | | (8,800,740 | ) | | | — | | | | (16,107,807 | ) | | | (20,944,912 | ) |
Eagle Small Cap Growth | | | — | | | | — | | | | 1,865,957 | | | | — | | | | 102,167,436 | | | | 104,033,393 | |
Floating Rate | | | 236,490 | | | | — | | | | (5,622,939 | ) | | | (100,860 | ) | | | 2,941,402 | | | | (2,545,907 | ) |
Government | | | 7,797,189 | | | | — | | | | 882,083 | | | | — | | | | 3,108,613 | | | | 11,787,885 | |
Growth Allocation | | | 6,768,466 | | | | — | | | | 32,090,252 | | | | (38,211,652 | ) | | | 60,065,419 | | | | 60,712,485 | |
High Yield Corporate Bond | | | 162,519,085 | | | | — | | | | (67,848,809 | ) | | | (466,063 | ) | | | 98,592,937 | | | | 192,797,150 | |
ICAP Select Equity | | | 17,227,683 | | | | — | | | | (67,008,839 | ) | | | — | | | | 327,513,089 | | | | 277,731,933 | |
Income Builder | | | 7,701,238 | | | | — | | | | 20,577,974 | | | | — | | | | 49,402,602 | | | | 77,681,814 | |
International Equity | | | 3,049,487 | | | | — | | | | (111,983,364 | ) | | | — | | | | 100,315,511 | | | | (8,618,366 | ) |
Janus Balanced | | | 18,095,813 | | | | — | | | | 14,703,850 | | | | (4,652 | ) | | | 164,880,981 | | | | 197,675,992 | |
Large Cap Growth | | | 18,697,322 | | | | — | | | | 70,821,788 | | | | — | | | | 209,009,959 | | | | 298,529,069 | |
Marketfield | | | — | | | | — | | | | (3,055,766 | ) | | | — | | | | 22,769,080 | | | | 19,713,314 | |
MFS® Utilities | | | 42,287,907 | | | | — | | | | 38,703,255 | | | | (251,174 | ) | | | 130,277,440 | | | | 211,017,428 | |
Mid Cap Core | | | 69,945,931 | | | | — | | | | 60,375,319 | | | | — | | | | 162,169,781 | | | | 292,491,031 | |
Moderate Allocation | | | 33,722,188 | | | | — | | | | 66,479,550 | | | | (46,275,754 | ) | | | 98,217,678 | | | | 152,143,662 | |
Moderate Growth Allocation | | | 44,680,308 | | | | — | | | | 111,237,926 | | | | (60,766,776 | ) | | | 221,203,883 | | | | 316,355,341 | |
PIMCO Real Return | | | 34,671,407 | | | | — | | | | — | | | | — | | | | (65,934,073 | ) | | | (31,262,666 | ) |
S&P 500 Index | | | 18,960,390 | | | | — | | | | (35,671,732 | ) | | | — | | | | 672,818,643 | | | | 656,107,301 | |
T. Rowe Price Equity Income | | | 21,477,988 | | | | — | | | | 29,091,480 | | | | — | | | | 160,126,885 | | | | 210,696,353 | |
Unconstrained Bond | | | — | | | | (192,793 | ) | | | (1,238,033 | ) | | | (170,017 | ) | | | 9,315,955 | | | | 7,715,112 | |
U.S. Small Cap | | | 848,357 | | | | — | | | | 27,565,403 | | | | — | | | | 87,563,513 | | | | 115,977,273 | |
Van Eck Global Hard Assets | | | 2,543,350 | | | | — | | | | (32,250,734 | ) | | | — | | | | 17,658,917 | | | | (12,048,467 | ) |
The difference between book-basis and tax-basis unrealized appreciation (depreciation) is primarily due to wash sale adjustments, return of capital distributions received, Passive Foreign Investment Companies (PFICs), partnerships, straddle deferrals, short sale adjustments, modified debt instruments, grantor trusts, swaps, and Real Estate Investment Trusts (REITs).
The other temporary differences are primarily due to loss deferrals from related party transactions, equity to debt tax adjustments, Contingent Payment Debt Instruments (CPDI) and defaulted bond income accruals.
Certain Portfolios intend to elect, to the extent provided by the regulations, to treat certain qualifying capital and/or ordinary losses that arose after October 31, 2013, as if they arose on January 1, 2014.
| | |
| M-490 | | MainStay VP Funds Trust |
The following table discloses the current year reclassifications between accumulated undistributed net investment income (loss), accumulated net realized gain (loss) on investments and additional paid-in capital, arising from permanent differences; net assets as of December 31, 2013 are not affected.
| | | | | | | | | | | | |
Portfolio | | Undistributed Net
Investment
Income (Loss) | | | Accumulated
Net Realized
Gain (Loss)
on Investments | | | Additional
Paid-in Capital | |
Balanced | | $ | (148,786 | ) | | $ | 148,786 | | | $ | — | |
Bond | | | 2,737,265 | | | | (2,737,265 | ) | | | — | |
Cash Management | | | 112 | | | | (112 | ) | | | — | |
Common Stock | | | (39,302 | ) | | | 39,304 | | | | (2 | ) |
Conservative Allocation | | | 7,253,732 | | | | (7,253,732 | ) | | | — | |
Convertible | | | 4,641,700 | | | | (4,641,700 | ) | | | — | |
Cornerstone Growth | | | (143,730 | ) | | | 143,730 | | | | — | |
DFA / Dupont Capital Emerging Markets Equity | | | (338,803 | ) | | | 338,803 | | | | — | |
Eagle Small Cap Growth | | | 971,043 | | | | (100,563 | ) | | | (870,480 | ) |
Floating Rate | | | 41,240 | | | | (41,240 | ) | | | — | |
Government | | | (32,932 | ) | | | 32,932 | | | | — | |
Growth Allocation | | | 3,707,988 | | | | (3,707,988 | ) | | | — | |
High Yield Corporate Bond | | | (775,223 | ) | | | 775,223 | | | | — | |
ICAP Select Equity | | | 1,120 | | | | (1,120 | ) | | | — | |
Income Builder | | | (1,726,553 | ) | | | 1,726,919 | | | | (366 | ) |
International Equity | | | (36,636 | ) | | | 36,636 | | | | — | |
Janus Balanced | | | (913,218 | ) | | | 913,711 | | | | (493 | ) |
Large Cap Growth | | | 182,037 | | | | (182,037 | ) | | | — | |
Marketfield | | | 1,494,767 | | | | 125,758 | | | | (1,620,525 | ) |
MFS® Utilities | | | (5,848,007 | ) | | | 5,849,962 | | | | (1,955 | ) |
Mid Cap Core | | | (8,872 | ) | | | 8,876 | | | | (4 | ) |
Moderate Allocation | | | 9,224,492 | | | | (9,224,492 | ) | | | — | |
Moderate Growth Allocation | | | 14,140,159 | | | | (14,140,159 | ) | | | — | |
PIMCO Real Return | | | (1,317,550 | ) | | | 1,317,623 | | | | (73 | ) |
S&P 500 Index | | | (297,827 | ) | | | 297,852 | | | | (25 | ) |
T. Rowe Price Equity Income | | | (203,397 | ) | | | 203,397 | | | | — | |
Unconstrained Bond | | | (316,821 | ) | | | 281,786 | | | | 35,035 | |
U.S. Small Cap | | | (69 | ) | | | 69 | | | | — | |
Van Eck Global Hard Assets | | | (14,764 | ) | | | 14,764 | | | | — | |
The reclassifications for the Portfolios are primarily due to return of capital distributions received, dollar rolls, REITs, short term capital gain distributions received from underlying investment companies, defaulted bond income accruals, CPDI, foreign currency gain (loss), foreign capital gains, nondeductible expenses, net operating losses, security litigations, PFICs, partnerships, short sales, equity to debt tax adjustments, consent fees and treasury inflation protection securities.
Under the Regulated Investment Company Modernization Act of 2010, the Portfolios are permitted to carry forward capital losses incurred in taxable years beginning after December 22, 2010, for an unlimited period. However, any
losses incurred during those future years will be required to be utilized prior to the losses incurred in pre-enactment tax years. As a result of this ordering rule, pre-enactment capital loss carryforwards may be more likely to expire unused. Additionally, post-enactment capital losses that are carried forward will retain their character as either short-term or long-term capital losses rather than being considered all short-term as under previous law.
As of December 31, 2013, for federal income tax purposes, capital loss carryforwards, as shown in the table below, were available to the extent provided by the regulations to offset future realized gains of each respective Portfolio through the years indicated. Accordingly, no capital gains
| | | | |
| mainstayinvestments.com | | | M-491 | |
Notes to Financial Statements (continued)
distributions are expected to be paid to shareholders until net gains have been realized in excess of such amounts.
| | | | | | | | | | | | |
Portfolio | | Capital Loss
Available
Through | | | Short-Term
Amounts
(000’s) | | | Long-Term
Amounts
(000’s) | |
Bond | | | Unlimited | | | $ | 10,592 | | | $ | — | |
Common Stock | | | 2017 | | | $ | 37,479 | | | $ | — | |
DFA / Dupont Capital Emerging Markets Equity | | | Unlimited | | | $ | — | | | $ | 8,801 | |
Floating Rate | | | 2016 | | | $ | 3,161 | | | $ | — | |
| | | | 2017 | | | | 2,462 | | | | | |
Total | | | | | | $ | 5,623 | | | $ | — | |
High Yield Corporate Bond | | | 2017 | | | $ | 67,849 | | | $ | — | |
ICAP Select Equity | | | 2017 | | | $ | 67,009 | | | $ | — | |
International Equity | | | 2016 | | | $ | 47,174 | | | $ | — | |
| | | 2017 | | | | 39,290 | | | | — | |
| | | | Unlimited | | | | 13,463 | | | | 12,056 | |
Total | | | | | | $ | 99,927 | | | $ | 12,056 | |
Marketfield | | | Unlimited | | | $ | 2,894 | | | $ | 162 | |
S&P 500 Index | | | 2016 | | | $ | 11,893 | | | $ | — | |
| | | | 2017 | | | | 23,779 | | | | — | |
Total | | | | | | $ | 35,672 | | | $ | — | |
Unconstrained Bond | | | Unlimited | | | $ | — | | | $ | 1,238 | |
Van Eck Global Hard Assets | | | Unlimited | | | $ | 6,403 | | | $ | 25,848 | |
The following Portfolios utilized capital loss carryforwards during the year ended December 31, 2013:
| | | | |
Portfolio | | Capital Loss
Carryforward
Utilized | |
Balanced | | $ | 1,089,719 | |
Common Stock | | | 105,644,785 | |
Cornerstone Growth | | | 31,444,736 | |
DFA / Dupont Capital Emerging Markets Equity | | | 3,466,613 | |
Eagle Small Cap Growth | | | 7,159,438 | |
Floating Rate | | | 5,006,838 | |
High Yield Corporate Bond | | | 52,284,656 | |
ICAP Select Equity | | | 127,443,916 | |
Income Builder | | | 11,224,912 | |
International Equity | | | 23,351,989 | |
S&P 500 Index | | | 34,114,704 | |
U.S. Small Cap | | | 13,838,633 | |
Van Eck Global Hard Assets | | | 7,035,407 | |
The tax character of distributions paid during the years ended December 31, 2013 and December 31, 2012 shown in the Statements of Changes in Net Assets was as follows:
| | | | | | | | | | | | | | | | |
| | | 2013 | | | 2012 | |
Portfolio | | Tax-Based
Distributions from
Ordinary Income | | | Tax-Based
Distributions from
Long-Term Gains | | | Tax-Based
Distributions from
Ordinary Income | | | Tax-Based
Distributions from
Long-Term Gains | |
Balanced | | $ | 2,514,733 | | | $ | — | | | $ | 2,232,826 | | | $ | — | |
Bond | | | 33,456,861 | | | | 2,105,788 | | | | 43,905,456 | | | | 14,610,565 | |
Cash Management | | | 70,226 | | | | — | | | | 74,363 | | | | — | |
Common Stock | | | 9,226,181 | | | | — | | | | 8,428,942 | | | | — | |
Conservative Allocation | | | 22,562,470 | | | | 17,254,924 | | | | 14,827,547 | | | | 34,144,384 | |
Convertible | | | 18,017,161 | | | | 29,750,231 | | | | 13,508,301 | | | | 1,815,023 | |
Cornerstone Growth | | | 4,350,412 | | | | — | | | | 1,643,158 | | | | — | |
DFA / Dupont Capital Emerging Markets Equity | | | 2,559,174 | | | | — | | | | — | | | | — | |
Eagle Small Cap Growth | | | 367,468 | | | | 30 | | | | — | | | | — | |
Floating Rate | | | 31,912,772 | | | | — | | | | 27,052,712 | | | | — | |
Government | | | 9,732,170 | | | | 562,630 | | | | 10,547,054 | | | | — | |
Growth Allocation | | | 4,274,982 | | | | 13,603,547 | | | | 2,060,343 | | | | 17,092,173 | |
High Yield Corporate Bond | | | 148,003,963 | | | | — | | | | 133,183,824 | | | | — | |
ICAP Select Equity | | | 18,024,012 | | | | — | | | | 21,988,842 | | | | — | |
Income Builder | | | 17,313,007 | | | | — | | | | 12,654,013 | | | | — | |
International Equity | | | 5,029,983 | | | | — | | | | 7,471,178 | | | | — | |
Janus Balanced | | | 14,288,737 | | | | 95,172 | | | | — | | | | — | |
Large Cap Growth | | | 1,643,573 | | | | 3,840,100 | | | | — | | | | — | |
MFS® Utilities | | | 36,785,495 | | | | 1,220 | | | | — | | | | — | |
Mid Cap Core | | | 21,466,459 | | | | 29,671,787 | | | | 3,244,794 | | | | 41,942,805 | |
| | |
| M-492 | | MainStay VP Funds Trust |
| | | | | | | | | | | | | | | | |
| | | 2013 | | | 2012 | |
Portfolio | | Tax-Based
Distributions from
Ordinary Income | | | Tax-Based
Distributions from
Long-Term Gains | | | Tax-Based
Distributions from
Ordinary Income | | | Tax-Based
Distributions from
Long-Term Gains | |
Moderate Allocation | | $ | 21,645,121 | | | $ | 30,394,407 | | | $ | 15,069,587 | | | $ | 49,635,044 | |
Moderate Growth Allocation | | | 20,603,546 | | | | 40,789,586 | | | | 10,964,170 | | | | 42,879,459 | |
PIMCO Real Return | | | 7,021,862 | | | | 60,777 | | | | — | | | | — | |
S&P 500 Index | | | 18,066,595 | | | | — | | | | 15,407,775 | | | | — | |
T. Rowe Price Equity Income | | | 14,460,606 | | | | 87,994 | | | | — | | | | — | |
Unconstrained Bond | | | 14,169,876 | | | | — | | | | 14,703,960 | | | | 445,137 | |
U.S. Small Cap | | | 2,223,919 | | | | — | | | | 879,988 | | | | — | |
Van Eck Global Hard Assets | | | 6,427,982 | | | | — | | | | — | | | | — | |
Note 5–Restricted Securities
As of December 31, 2013, the following Portfolios held restricted securities:
Convertible
| | | | | | | | | | | | | | | | | | | | |
Security | | Date(s) of
Acquisition | | | Principal
Amount | | | Cost | | | 12/31/13
Value | | | Percent of
Net Assets | |
At Home Corp.
Convertible Bond
4.75%, due 12/31/49 | | | 8/31/01 | | | $ | 2,335,418 | | | $ | 0 | (a) | | $ | 234 | | | | 0.0% | ‡ |
| ‡ | Less than one-tenth of a percent. |
High Yield Corporate Bond
| | | | | | | | | | | | | | | | | | | | |
Security | | Date(s) of Acquisition | | | Principal
Amount/
Number of
Warrants/
Shares | | | Cost | | | 12/31/13 Value | | | Percent of Net Assets | |
Affinity Gaming LLC | | | | | | | | | | | | | | | | | | | | |
Common Stock | | | 10/24/12 | | | | 75,000 | | | $ | 843,750 | | | $ | 825,000 | | | | 0.0 | %‡ |
ASG Corp. | | | | | | | | | | | | | | | | | | | | |
Warrant Expires 5/15/18 | | | 4/30/10 | | | | 3,370 | | | | — | | | | 421,250 | | | | 0.0 | ‡ |
At Home Corp. | | | | | | | | | | | | | | | | | | | | |
Convertible Bond 0.525% due 12/28/18 | | | 8/31/01 | | | $ | 1,869,975 | | | | 0 | (a) | | | 187 | | | | 0.0 | ‡ |
Convertible Bond 4.75%, due 12/15/49 | | | 8/27/01 | | | $ | 9,032,054 | | | | 58,488 | | | | 903 | | | | 0.0 | ‡ |
ION Media Networks, Inc. | | | | | | | | | | | | | | | | | | | | |
Warrant, Second Lien, Expires 12/18/16 | | | 12/20/10 | | | | 365 | | | | — | | | | 4 | | | | 0.0 | ‡ |
Warrant, Unsecured Debt, Expires 12/18/16 | | | 3/12/10 | | | | 360 | | | | 1,099 | | | | 3 | | | | 0.0 | ‡ |
Neenah Enterprises, Inc. | | | | | | | | | | | | | | | | | | | | |
Common Stock | | | 7/29/10 | | | | 230,859 | | | | 1,955,376 | | | | 2,957,304 | | | | 0.1 | |
Quebecor World, Inc. (Litigation Recovery Trust—Escrow Shares) | | | | | | | | | | | | | | | | | | | | |
Corporate Bond 6.50% | | | 1/23/08 | | | $ | 150,000 | | | | — | | | | 2,205 | | | | 0.0 | ‡ |
Corporate Bond 9.75% | | | 1/23/08 | | | $ | 8,530,000 | | | | — | | | | 125,391 | | | | 0.0 | ‡ |
Somerset Cayuga Holding Co., Inc. (PIK) | | | | | | | | | | | | | | | | | | | | |
Convertible Bond 20.00%, due 6/15/17 | | | 6/29/2012-12/15/13 | | | $ | 1,720,708 | | | | 1,730,835 | | | | 2,529,441 | | | | 0.1 | |
Sterling Entertainment Enterprise LLC | | | | | | | | | | | | | | | | | | | | |
Corporate Bond 9.75%, due 12/31/19 | | | 12/21/12 | | | $ | 10,000,000 | | | | 10,000,000 | | | | 10,375,000 | | | | 0.4 | |
Upstate NY Power Producers | | | | | | | | | | | | | | | | | | | | |
Common Stock | | | 6/29/12 | | | | 19,474 | | | | 331,050 | | | | 370,006 | | | | 0.0 | ‡ |
Total | | | | | | | | | | $ | 14,920,598 | | | $ | 17,606,694 | | | | 0.6 | % |
| ‡ | Less than one-tenth of a percent. |
| | | | |
| mainstayinvestments.com | | | M-493 | |
Notes to Financial Statements (continued)
Income Builder
| | | | | | | | | | | | | | | | | | | | |
Security | | Date(s) of
Acquisition | | | Number of
Warrants/
Shares | | | Cost | | | 12/31/13
Value | | | Percent
of Net
Assets | |
ION Media Networks, Inc. | | | | | | | | | | | | | | | | | | | | |
Warrant, Second Lien, Expires 12/18/16 | | | 12/20/10 | | | | 4 | | | $ | — | | | $ | 0 | (a) | | | 0.0 | %‡ |
Warrant, Unsecured Debt, Expires 12/18/16 | | | 3/12/10 | | | | 4 | | | | 13 | | | | 0 | (a) | | | 0.0 | ‡ |
Quebecor World, Inc. (Litigation Recovery Trust—Escrow Shares) | | | | | | | | | | | | | | | | | | | | |
Corporate Bond 9.75% | | | 9/3/09 | | | | 70,000 | | | | — | | | | 1,029 | | | | 0.0 | ‡ |
Total | | | | | | | | | | $ | 13 | | | $ | 1,029 | | | | 0.0 | %‡ |
| ‡ | Less than one-tenth of a percent. |
MFS® Utilities
| | | | | | | | | | | | | | | | | | | | |
Security | | Date(s) of
Acquisition | | | Principal
Amount | | | Cost | | | 12/31/13
Value | | | Percent
of Net
Assets | |
Falcon Franchise Loan LLC | | | 2/17/12 | | | $ | 24,678 | | | $ | 1,447 | | | $ | 2,715 | | | | 0.0 | %‡ |
Viridian Group FundCo II | | | 3/1/12 | | | $ | 1,045,000 | | | | 1,020,848 | | | | 1,146,887 | | | | 0.1 | |
XM Satellite Radio, Inc. | | | 10/21/13 | | | $ | 468,000 | | | | 911,934 | | | | 911,430 | | | | 0.1 | |
Total | | | | | | | | | | $ | 1,934,229 | | | $ | 2,061,032 | | | | 0.2 | % |
| ‡ | Less than one-tenth of a percent. |
Note 6–Commitments and Contingencies
As of December 31, 2013, the following Portfolio had unfunded commitments pursuant to the following loan agreements:
Floating Rate
| | | | | | | | |
Borrower | | Unfunded
Commitments | | | Unrealized
Appreciation | |
Alinta Energy U.S. Finance LLC | | | | | | | | |
Delayed Draw Term Loan due 8/13/18 | | $ | 165,789 | | | $ | 8,494 | |
Genesys Telecom Holdings, U.S., Inc. | | | | | | | | |
Delayed Draw Term Loan due 11/13/20 | | | 666,667 | | | | 4,575 | |
Total | | $ | 832,456 | | | $ | 13,069 | |
Commitments are available until maturity date.
Note 7–Custodian
State Street is the custodian of the cash and the securities of the Portfolios. Custodial fees are charged to the Portfolios based on the Portfolios’ net assets and/or the market value of the securities in the Portfolios and the number of certain cash transactions incurred by the Portfolios.
Note 8–Line of Credit
The Portfolios, except for Cash Management Portfolio, and certain affiliated funds, maintain a line of credit with a syndi-
cate of banks in order to secure a source of funds for temporary purposes to meet unanticipated or excessive redemption requests.
Effective August 28, 2013, under a second amended and restated credit agreement (the “Credit Agreement”), the aggregate commitment amount is $300,000,000 with an optional maximum amount of $400,000,000. The commitment fee is an annual rate of 0.08% of the average commitment amount payable quarterly, regardless of usage, to Bank of New York Mellon and State Street, who serve as the agents to the syndicate. The commitment fee is allocated among certain Portfolios and affiliated funds based upon net assets and other factors. Interest on any revolving credit loan is charged based upon the Federal Funds Advances rate or the one month London InterBank Offered Rate, whichever is higher. The Credit Agreement expires on August 27, 2014, although the Portfolios, certain affiliated funds and the syndicate of banks may renew the Credit Agreement for an additional year on the same or different terms. Prior to August 28, 2013, the aggregate commitment amount was $200,000,000 with an optional maximum amount of $250,000,000. There were no borrowings made or outstanding with respect to the Portfolios under the Credit Agreement during the year ended December 31, 2013.
| | |
| M-494 | | MainStay VP Funds Trust |
Note 9–Purchases and Sales of Securities (in 000’s)
During the year ended December 31, 2013, purchases and sales of securities, other than short-term securities and securities subject to repurchase transactions, were as follows:
| | | | | | | | | | | | | | | | |
| | | U.S. Government Securities | | | Other | |
Portfolio | | Purchases | | | Sales | | | Purchases | | | Sales | |
Balanced | | $ | 129,890 | | | $ | 106,397 | | | $ | 316,302 | | | $ | 291,061 | |
Bond | | | 2,796,404 | | | | 2,873,498 | | | | 634,418 | | | | 536,807 | |
Common Stock | | | — | | | | — | | | | 645,034 | | | | 687,487 | |
Conservative Allocation | | | — | | | | — | | | | 537,513 | | | | 437,504 | |
Convertible | | | — | | | | — | | | | 398,734 | | | | 381,842 | |
Cornerstone Growth | | | — | | | | — | | | | 868,109 | | | | 806,181 | |
DFA / DuPont Capital Emerging Markets Equity | | | — | | | | — | | | | 277,604 | | | | 328,336 | |
Eagle Small Cap Growth | | | — | | | | — | | | | 236,948 | | | | 163,162 | |
Floating Rate | | | — | | | | — | | | | 480,039 | | | | 370,373 | |
Government | | | 75,698 | | | | 140,206 | | | | 3,527 | | | | 16,083 | |
Growth Allocation | | | — | | | | — | | | | 193,370 | | | | 127,670 | |
High Yield Corporate Bond | | | — | | | | — | | | | 1,211,594 | | | | 1,032,016 | |
ICAP Select Equity | | | — | | | | — | | | | 585,004 | | | | 655,469 | |
Income Builder | | | 5,962 | | | | 5,680 | | | | 150,116 | | | | 69,882 | |
International Equity | | | — | | | | — | | | | 164,059 | | | | 162,375 | |
Janus Balanced | | | 406,827 | | | | 339,595 | | | | 271,627 | | | | 332,540 | |
Large Cap Growth | | | — | | | | — | | | | 493,800 | | | | 621,259 | |
Marketfield | | | — | | | | — | | | | 266,422 | | | | 27,032 | |
MFS® Utilities | | | — | | | | — | | | | 584,996 | | | | 438,438 | |
Mid Cap Core | | | — | | | | — | | | | 1,190,460 | | | | 1,111,311 | |
Moderate Allocation | | | — | | | | — | | | | 656,396 | | | | 529,083 | |
Moderate Growth Allocation | | | — | | | | — | | | | 988,617 | | | | 721,689 | |
PIMCO Real Return | | | 464,105 | | | | 457,327 | | | | 2,897 | | | | 14,387 | |
S&P 500 Index | | | — | | | | — | | | | 83,165 | | | | 121,585 | |
T. Rowe Price Equity Income | | | — | | | | — | | | | 138,061 | | | | 163,533 | |
Unconstrained Bond | | | 1,274 | | | | 5,902 | | | | 189,586 | | | | 61,557 | |
U.S. Small Cap | | | — | | | | — | | | | 203,431 | | | | 127,424 | |
Van Eck Global Hard Assets | | | — | | | | — | | | | 173,017 | | | | 234,228 | |
Note 10–In-Kind Transfer of Securities
On February 17, 2012, an affiliate of the Manager made an in-kind contribution of securities into the following Portfolios:
| | | | | | | | |
Receiving Portfolio | | Shares | | | Purchase Value | |
Eagle Small Cap Growth | | | 13,054,133 | | | $ | 130,541,325 | |
Janus Balanced | | | 80,451,627 | | | | 804,516,267 | |
MFS® Utilities | | | 68,355,812 | | | | 683,558,115 | |
T. Rowe Price Equity Income | | | 38,659,173 | | | | 386,591,726 | |
Van Eck Global Hard Assets | | | 63,810,482 | | | $ | 638,104,820 | |
On May 1, 2012, an affiliate of the Manager made an in-kind contribution of securities into the following Portfolio:
| | | | | | | | |
Receiving Portfolio | | Shares | | | Purchase Value | |
MFS® Utilities | | | 3,128,970 | | | $ | 31,915,497 | |
| | | | |
| mainstayinvestments.com | | | M-495 | |
Notes to Financial Statements (continued)
Note 11–Capital Share Transactions
Transactions in capital shares for the year ended December 31, 2013, and the year ended December 31, 2012, were as follows:
Balanced
| | | | | | | | |
Initial Class | | Shares | | | Amount | |
Year ended December 31, 2013: | | | | | | | | |
Shares sold | | | 130,341 | | | $ | 1,780,601 | |
Shares issued to shareholders in reinvestment of dividends and distributions | | | 9,844 | | | | 136,174 | |
Shares redeemed | | | (80,855 | ) | | | (1,104,136 | ) |
| | | | | | | | |
Net increase (decrease) | | | 59,330 | | | $ | 812,639 | |
| | | | | | | | |
Year ended December 31, 2012: | | | | | | | | |
Shares sold | | | 81,036 | | | $ | 950,885 | |
Shares issued to shareholders in reinvestment of dividends and distributions | | | 11,127 | | | | 133,941 | |
Shares redeemed | | | (128,536 | ) | | | (1,505,171 | ) |
| | | | | | | | |
Net increase (decrease) | | | (36,373 | ) | | $ | (420,345 | ) |
| | | | | | | | |
|
| |
Service Class | | Shares | | | Amount | |
Year ended December 31, 2013: | | | | | | | | |
Shares sold | | | 4,787,120 | | | $ | 65,131,377 | |
Shares issued to shareholders in reinvestment of dividends and distributions | | | 172,958 | | | | 2,378,559 | |
Shares redeemed | | | (1,545,310 | ) | | | (20,977,401 | ) |
| | | | | | | | |
Net increase (decrease) | | | 3,414,768 | | | $ | 46,532,535 | |
| | | | | | | | |
Year ended December 31, 2012: | | | | | | | | |
Shares sold | | | 2,820,726 | | | $ | 32,985,550 | |
Shares issued to shareholders in reinvestment of dividends and distributions | | | 175,239 | | | | 2,098,885 | |
Shares redeemed | | | (1,855,548 | ) | | | (21,676,387 | ) |
| | | | | | | | |
Net increase (decrease) | | | 1,140,417 | | | $ | 13,408,048 | |
| | | | | | | | |
Bond
| | | | | | | | |
Initial Class | | Shares | | | Amount | |
Year ended December 31, 2013: | | | | | | | | |
Shares sold | | | 11,418,438 | | | $ | 164,511,738 | |
Shares issued to shareholders in reinvestment of dividends and distributions | | | 1,638,963 | | | | 22,909,894 | |
Shares redeemed | | | (5,925,761 | ) | | | (85,100,301 | ) |
| | | | | | | | |
Net increase (decrease) | | | 7,131,640 | | | $ | 102,321,331 | |
| | | | | | | | |
Year ended December 31, 2012: | | | | | | | | |
Shares sold | | | 10,034,381 | | | $ | 152,758,736 | |
Shares issued to shareholders in reinvestment of dividends and distributions | | | 2,369,613 | | | | 35,040,150 | |
Shares redeemed | | | (6,631,775 | ) | | | (100,138,004 | ) |
| | | | | | | | |
Net increase (decrease) | | | 5,772,219 | | | $ | 87,660,882 | |
| | | | | | | | |
|
| |
| | | | | | | | |
Service Class | | Shares | | | Amount | |
Year ended December 31, 2013: | | | | | | | | |
Shares sold | | | 3,369,384 | | | $ | 48,598,958 | |
Shares issued to shareholders in reinvestment of dividends and distributions | | | 913,143 | | | | 12,652,755 | |
Shares redeemed | | | (8,230,908 | ) | | | (117,419,260 | ) |
| | | | | | | | |
Net increase (decrease) | | | (3,948,381 | ) | | $ | (56,167,547 | ) |
| | | | | | | | |
Year ended December 31, 2012: | | | | | | | | |
Shares sold | | | 6,993,901 | | | $ | 104,959,452 | |
Shares issued to shareholders in reinvestment of dividends and distributions | | | 1,601,268 | | | | 23,475,871 | |
Shares redeemed | | | (3,556,739 | ) | | | (53,425,684 | ) |
| | | | | | | | |
Net increase (decrease) | | | 5,038,430 | | | $ | 75,009,639 | |
| | | | | | | | |
Cash Management
| | | | | | |
Initial Class (at $1 per share) | | Shares | | | |
Year ended December 31, 2013: | | | | | | |
Shares sold | | | 706,554,558 | | | |
Shares issued to shareholders in reinvestment of dividends and distributions | | | 70,595 | | | |
Shares redeemed | | | (650,499,005 | ) | | |
| | | | | | |
Net increase (decrease) | | | 56,126,148 | | | |
| | | | | | |
Year ended December 31, 2012: | | | | | | |
Shares sold | | | 608,165,429 | | | |
Shares issued to shareholders in reinvestment of dividends and distributions | | | 73,901 | | | |
Shares redeemed | | | (768,859,618 | ) | | |
| | | | | | |
Net increase (decrease) | | | (160,620,288 | ) | | |
| | | | | | |
Common Stock
| | | | | | | | |
Initial Class | | Shares | | | Amount | |
Year ended December 31, 2013: | | | | | | | | |
Shares sold | | | 309,153 | | | $ | 6,636,161 | |
Shares issued to shareholders in reinvestment of dividends and distributions | | | 369,846 | | | | 8,145,224 | |
Shares redeemed | | | (3,114,915 | ) | | | (66,807,454 | ) |
| | | | | | | | |
Net increase (decrease) | | | (2,435,916 | ) | | $ | (52,026,069 | ) |
| | | | | | | | |
Year ended December 31, 2012: | | | | | | | | |
Shares sold | | | 857,164 | | | $ | 15,594,548 | |
Shares issued to shareholders in reinvestment of dividends and distributions | | | 409,353 | | | | 7,607,005 | |
Shares redeemed | | | (3,873,199 | ) | | | (67,942,684 | ) |
| | | | | | | | |
Net increase (decrease) | | | (2,606,682 | ) | | $ | (44,741,131 | ) |
| | | | | | | | |
|
| |
| | |
| M-496 | | MainStay VP Funds Trust |
| | | | | | | | |
Service Class | | Shares | | | Amount | |
Year ended December 31, 2013: | | | | | | | | |
Shares sold | | | 1,106,700 | | | $ | 23,980,162 | |
Shares issued to shareholders in reinvestment of dividends and distributions | | | 49,328 | | | | 1,080,957 | |
Shares redeemed | | | (680,331 | ) | | | (14,574,465 | ) |
| | | | | | | | |
Net increase (decrease) | | | 475,697 | | | $ | 10,486,654 | |
| | | | | | | | |
Year ended December 31, 2012: | | | | | | | | |
Shares sold | | | 327,485 | | | $ | 5,790,825 | |
Shares issued to shareholders in reinvestment of dividends and distributions | | | 44,421 | | | | 821,937 | |
Shares redeemed | | | (703,634 | ) | | | (12,415,732 | ) |
| | | | | | | | |
Net increase (decrease) | | | (331,728 | ) | | $ | (5,802,970 | ) |
| | | | | | | | |
Conservative Allocation
| | | | | | | | |
Initial Class | | Shares | | | Amount | |
Year ended December 31, 2013: | | | | | | | | |
Shares sold | | | 195,091 | | | $ | 2,385,983 | |
Shares issued to shareholders in reinvestment of dividends and distributions | | | 61,059 | | | | 730,237 | |
Shares redeemed | | | (162,946 | ) | | | (1,989,760 | ) |
| | | | | | | | |
Net increase (decrease) | | | 93,204 | | | $ | 1,126,460 | |
| | | | | | | | |
Year ended December 31, 2012: | | | | | | | | |
Shares sold | | | 386,241 | | | $ | 4,553,836 | |
Shares issued to shareholders in reinvestment of dividends and distributions | | | 78,339 | | | | 904,671 | |
Shares redeemed | | | (192,243 | ) | | | (2,287,155 | ) |
| | | | | | | | |
Net increase (decrease) | | | 272,337 | | | $ | 3,171,352 | |
| | | | | | | | |
|
| |
Service Class | | Shares | | | Amount | |
Year ended December 31, 2013: | | | | | | | | |
Shares sold | | | 12,901,174 | | | $ | 156,239,254 | |
Shares issued to shareholders in reinvestment of dividends and distributions | | | 3,293,641 | | | | 39,087,157 | |
Shares redeemed | | | (7,320,007 | ) | | | (88,928,479 | ) |
| | | | | | | | |
Net increase (decrease) | | | 8,874,808 | | | $ | 106,397,932 | |
| | | | | | | | |
Year ended December 31, 2012: | | | | | | | | |
Shares sold | | | 14,291,367 | | | $ | 168,209,406 | |
Shares issued to shareholders in reinvestment of dividends and distributions | | | 4,190,446 | | | | 48,067,260 | |
Shares redeemed | | | (5,526,999 | ) | | | (64,871,982 | ) |
| | | | | | | | |
Net increase (decrease) | | | 12,954,814 | | | $ | 151,404,684 | |
| | | | | | | | |
Convertible
| | | | | | | | |
Initial Class | | Shares | | | Amount | |
Year ended December 31, 2013: | | | | | | | | |
Shares sold | | | 545,390 | | | $ | 7,113,374 | |
Shares issued to shareholders in reinvestment of dividends and distributions | | | 1,076,806 | | | | 13,798,939 | |
Shares redeemed | | | (2,388,186 | ) | | | (30,354,032 | ) |
| | | | | | | | |
Net increase (decrease) | | | (765,990 | ) | | $ | (9,441,719 | ) |
| | | | | | | | |
Year ended December 31, 2012: | | | | | | | | |
Shares sold | | | 564,931 | | | $ | 6,596,597 | |
Shares issued to shareholders in reinvestment of dividends and distributions | | | 460,210 | | | | 5,338,562 | |
Shares redeemed | | | (3,906,141 | ) | | | (45,820,131 | ) |
| | | | | | | | |
Net increase (decrease) | | | (2,881,000 | ) | | $ | (33,884,972 | ) |
| | | | | | | | |
|
| |
Service Class | | Shares | | | Amount | |
Year ended December 31, 2013: | | | | | | | | |
Shares sold | | | 4,729,299 | | | $ | 61,103,043 | |
Shares issued to shareholders in reinvestment of dividends and distributions | | | 2,670,701 | | | | 33,968,453 | |
Shares redeemed | | | (3,044,501 | ) | | | (39,046,932 | ) |
| | | | | | | | |
Net increase (decrease) | | | 4,355,499 | | | $ | 56,024,564 | |
| | | | | | | | |
Year ended December 31, 2012: | | | | | | | | |
Shares sold | | | 2,303,354 | | | $ | 26,721,363 | |
Shares issued to shareholders in reinvestment of dividends and distributions | | | 866,235 | | | | 9,984,762 | |
Shares redeemed | | | (4,557,028 | ) | | | (52,597,258 | ) |
| | | | | | | | |
Net increase (decrease) | | | (1,387,439 | ) | | $ | (15,891,133 | ) |
| | | | | | | | |
Cornerstone Growth
| | | | | | | | |
Initial Class | | Shares | | | Amount | |
Year ended December 31, 2013: | | | | | | | | |
Shares sold | | | 3,618,597 | | | $ | 108,574,219 | |
Shares issued to shareholders in reinvestment of dividends and distributions | | | 126,608 | | | | 3,996,351 | |
Shares redeemed | | | (1,785,579 | ) | | | (54,872,855 | ) |
| | | | | | | | |
Net increase (decrease) | | | 1,959,626 | | | $ | 57,697,715 | |
| | | | | | | | |
Year ended December 31, 2012: | | | | | | | | |
Shares sold | | | 102,891 | | | $ | 2,782,873 | |
Shares issued to shareholders in reinvestment of dividends and distributions | | | 54,594 | | | | 1,542,898 | |
Shares redeemed | | | (1,783,236 | ) | | | (48,088,962 | ) |
| | | | | | | | |
Net increase (decrease) | | | (1,625,751 | ) | | $ | (43,763,191 | ) |
| | | | | | | | |
|
| |
| | | | |
| mainstayinvestments.com | | | M-497 | |
Notes to Financial Statements (continued)
| | | | | | | | |
Service Class | | Shares | | | Amount | |
Year ended December 31, 2013: | | | | | | | | |
Shares sold | | | 357,407 | | | $ | 10,757,970 | |
Shares issued to shareholders in reinvestment of dividends and distributions | | | 11,264 | | | | 354,061 | |
Shares redeemed | | | (430,349 | ) | | | (12,927,148 | ) |
| | | | | | | | |
Net increase (decrease) | | | (61,678 | ) | | $ | (1,815,117 | ) |
| | | | | | | | |
Year ended December 31, 2012: | | | | | | | | |
Shares sold | | | 494,071 | | | $ | 13,225,580 | |
Shares issued to shareholders in reinvestment of dividends and distributions | | | 3,561 | | | | 100,260 | |
Shares redeemed | | | (415,067 | ) | | | (11,175,610 | ) |
| | | | | | | | |
Net increase (decrease) | | | 82,565 | | | $ | 2,150,230 | |
| | | | | | | | |
DFA / DuPont Capital Emerging Markets Equity
| | | | | | | | |
Initial Class | | Shares | | | Amount | |
Year ended December 31, 2013: | | | | | | | | |
Shares sold | | | 5,972,329 | | | $ | 56,699,958 | |
Shares issued to shareholders in reinvestment of dividends and distributions | | | 142,566 | | | | 1,360,886 | |
Shares redeemed | | | (10,994,009 | ) | | | (103,833,283 | ) |
| | | | | | | | |
Net increase (decrease) | | | (4,879,114 | ) | | $ | (45,772,439 | ) |
| | | | | | | | |
Period ended December 31, 2012 (a): | | | | | | | | |
Shares sold | | | 21,275,466 | | | $ | 207,915,142 | |
Shares redeemed | | | (2,429,245 | ) | | | (22,614,665 | ) |
| | | | | | | | |
Net increase (decrease) | | | 18,846,221 | | | $ | 185,300,477 | |
| | | | | | | | |
|
| |
Service Class | | Shares | | | Amount | |
Year ended December 31, 2013: | | | | | | | | |
Shares sold | | | 3,153,022 | | | $ | 29,614,476 | |
Shares issued to shareholders in reinvestment of dividends and distributions | | | 125,764 | | | | 1,198,288 | |
Shares redeemed | | | (4,225,517 | ) | | | (40,256,266 | ) |
| | | | | | | | |
Net increase (decrease) | | | (946,731 | ) | | $ | (9,443,502 | ) |
| | | | | | | | |
Period ended December 31, 2012 (a): | | | | | | | | |
Shares sold | | | 29,047,349 | | | $ | 289,065,033 | |
Shares redeemed | | | (3,726,412 | ) | | | (34,601,198 | ) |
| | | | | | | | |
Net increase (decrease) | | | 25,320,937 | | | $ | 254,463,835 | |
| | | | | | | | |
|
(a) The inception date of the Portfolio was February 17, 2012. | |
Eagle Small Cap Growth
| | | | | | | | |
Initial Class | | Shares | | | Amount | |
Year ended December 31, 2013: | | | | | | | | |
Shares sold | | | 10,710,387 | | | $ | 126,430,076 | |
Shares issued to shareholders in reinvestment of dividends and distributions | | | 29,592 | | | | 367,498 | |
Shares redeemed | | | (5,137,055 | ) | | | (59,542,870 | ) |
| | | | | | | | |
Net increase (decrease) | | | 5,602,924 | | | $ | 67,254,704 | |
| | | | | | | | |
Period ended December 31, 2012 (a): | | | | | | | | |
Shares sold | | | 32,186,774 | | | $ | 319,740,447 | |
Shares redeemed | | | (4,882,245 | ) | | | (46,758,126 | ) |
| | | | | | | | |
Net increase (decrease) | | | 27,304,529 | | | $ | 272,982,321 | |
| | | | | | | | |
|
| |
Service Class | | Shares | | | Amount | |
Year ended December 31, 2013: | | | | | | | | |
Shares sold | | | 1,052,080 | | | $ | 12,302,239 | |
Shares redeemed | | | (1,087,088 | ) | | | (12,602,634 | ) |
| | | | | | | | |
Net increase (decrease) | | | (35,008 | ) | | $ | (300,395 | ) |
| | | | | | | | |
Period ended December 31, 2012 (a): | | | | | | | | |
Shares sold | | | 5,514,765 | | | $ | 55,080,104 | |
Shares redeemed | | | (970,798 | ) | | | (9,350,292 | ) |
| | | | | | | | |
Net increase (decrease) | | | 4,543,967 | | | $ | 45,729,812 | |
| | | | | | | | |
|
(a) The inception date of the Portfolio was February 17, 2012. | |
Floating Rate
| | | | | | | | |
Initial Class | | Shares | | | Amount | |
Year ended December 31, 2013: | | | | | | | | |
Shares sold | | | 9,143,107 | | | $ | 85,394,380 | |
Shares issued to shareholders in reinvestment of dividends and distributions | | | 1,289,695 | | | | 12,037,630 | |
Shares redeemed | | | (10,559,605 | ) | | | (98,291,961 | ) |
| | | | | | | | |
Net increase (decrease) | | | (126,803 | ) | | $ | (859,951 | ) |
| | | | | | | | |
Year ended December 31, 2012: | | | | | | | | |
Shares sold | | | 16,485,847 | | | $ | 152,042,252 | |
Shares issued to shareholders in reinvestment of dividends and distributions | | | 1,118,171 | | | | 10,330,192 | |
Shares redeemed | | | (5,069,999 | ) | | | (46,867,874 | ) |
| | | | | | | | |
Net increase (decrease) | | | 12,534,019 | | | $ | 115,504,570 | |
| | | | | | | | |
|
| |
Service Class | | Shares | | | Amount | |
Year ended December 31, 2013: | | | | | | | | |
Shares sold | | | 18,109,825 | | | $ | 169,052,070 | |
Shares issued to shareholders in reinvestment of dividends and distributions | | | 2,128,092 | | | | 19,875,142 | |
Shares redeemed | | | (8,723,835 | ) | | | (81,503,015 | ) |
| | | | | | | | |
Net increase (decrease) | | | 11,514,082 | | | $ | 107,424,197 | |
| | | | | | | | |
Year ended December 31, 2012: | | | | | | | | |
Shares sold | | | 10,824,188 | | | $ | 100,051,970 | |
Shares issued to shareholders in reinvestment of dividends and distributions | | | 1,809,637 | | | | 16,722,520 | |
Shares redeemed | | | (7,203,492 | ) | | | (66,471,859 | ) |
| | | | | | | | |
Net increase (decrease) | | | 5,430,333 | | | $ | 50,302,631 | |
| | | | | | | | |
| | |
| M-498 | | MainStay VP Funds Trust |
Government
| | | | | | | | |
Initial Class | | Shares | | | Amount | |
Year ended December 31, 2013: | | | | | | | | |
Shares sold | | | 431,005 | | | $ | 4,999,258 | |
Shares issued to shareholders in reinvestment of dividends and distributions | | | 302,914 | | | | 3,386,294 | |
Shares redeemed | | | (2,617,512 | ) | | | (30,272,037 | ) |
| | | | | | | | |
Net increase (decrease) | | | (1,883,593 | ) | | $ | (21,886,485 | ) |
| | | | | | | | |
Year ended December 31, 2012: | | | | | | | | |
Shares sold | | | 573,360 | | | $ | 6,842,120 | |
Shares issued to shareholders in reinvestment of dividends and distributions | | | 304,571 | | | | 3,610,388 | |
Shares redeemed | | | (2,349,665 | ) | | | (28,023,167 | ) |
| | | | | | | | |
Net increase (decrease) | | | (1,471,734 | ) | | $ | (17,570,659 | ) |
| | | | | | | | |
|
| |
Service Class | | Shares | | | Amount | |
Year ended December 31, 2013: | | | | | | | | |
Shares sold | | | 1,973,661 | | | $ | 22,827,371 | |
Shares issued to shareholders in reinvestment of dividends and distributions | | | 622,642 | | | | 6,908,506 | |
Shares redeemed | | | (6,758,652 | ) | | | (77,483,958 | ) |
| | | | | | | | |
Net increase (decrease) | | | (4,162,349 | ) | | $ | (47,748,081 | ) |
| | | | | | | | |
Year ended December 31, 2012: | | | | | | | | |
Shares sold | | | 5,388,782 | | | $ | 63,678,452 | |
Shares issued to shareholders in reinvestment of dividends and distributions | | | 589,676 | | | | 6,936,666 | |
Shares redeemed | | | (4,300,303 | ) | | | (50,797,170 | ) |
| | | | | | | | |
Net increase (decrease) | | | 1,678,155 | | | $ | 19,817,948 | |
| | | | | | | | |
Growth Allocation
| | | | | | | | |
Initial Class | | Shares | | | Amount | |
Year ended December 31, 2013: | | | | | | | | |
Shares sold | | | 374,540 | | | $ | 4,292,669 | |
Shares issued to shareholders in reinvestment of dividends and distributions | | | 188,482 | | | | 2,165,082 | |
Shares redeemed | | | (221,611 | ) | | | (2,555,445 | ) |
| | | | | | | | |
Net increase (decrease) | | | 341,411 | | | $ | 3,902,306 | |
| | | | | | | | |
Year ended December 31, 2012: | | | | | | | | |
Shares sold | | | 300,054 | | | $ | 3,026,131 | |
Shares issued to shareholders in reinvestment of dividends and distributions | | | 227,892 | | | | 2,278,393 | |
Shares redeemed | | | (270,535 | ) | | | (2,745,504 | ) |
| | | | | | | | |
Net increase (decrease) | | | 257,411 | | | $ | 2,559,020 | |
| | | | | | | | |
|
| |
| | | | | | | | |
Service Class | | Shares | | | Amount | |
Year ended December 31, 2013: | | | | | | | | |
Shares sold | | | 6,566,478 | | | $ | 76,895,189 | |
Shares issued to shareholders in reinvestment of dividends and distributions | | | 1,373,251 | | | | 15,713,447 | |
Shares redeemed | | | (2,376,426 | ) | | | (27,062,559 | ) |
| | | | | | | | |
Net increase (decrease) | | | 5,563,303 | | | $ | 65,546,077 | |
| | | | | | | | |
Year ended December 31, 2012: | | | | | | | | |
Shares sold | | | 1,761,882 | | | $ | 17,745,268 | |
Shares issued to shareholders in reinvestment of dividends and distributions | | | 1,692,987 | | | | 16,874,123 | |
Shares redeemed | | | (3,147,573 | ) | | | (31,829,362 | ) |
| | | | | | | | |
Net increase (decrease) | | | 307,296 | | | $ | 2,790,029 | |
| | | | | | | | |
High Yield Corporate Bond
| | | | | | | | |
Initial Class | | Shares | | | Amount | |
Year ended December 31, 2013: | | | | | | | | |
Shares sold | | | 8,448,167 | | | $ | 87,662,636 | |
Shares issued to shareholders in reinvestment of dividends and distributions | | | 3,750,771 | | | | 37,478,544 | |
Shares redeemed | | | (14,111,679 | ) | | | (146,506,810 | ) |
| | | | | | | | |
Net increase (decrease) | | | (1,912,741 | ) | | $ | (21,365,630 | ) |
| | | | | | | | |
Year ended December 31, 2012: | | | | | | | | |
Shares sold | | | 8,348,865 | | | $ | 83,984,771 | |
Shares issued to shareholders in reinvestment of dividends and distributions | | | 4,050,548 | | | | 40,276,749 | |
Shares redeemed | | | (11,466,667 | ) | | | (114,968,282 | ) |
| | | | | | | | |
Net increase (decrease) | | | 932,746 | | | $ | 9,293,238 | |
| | | | | | | | |
|
| |
Service Class | | Shares | | | Amount | |
Year ended December 31, 2013: | | | | | | | | |
Shares sold | | | 34,800,833 | | | $ | 358,472,006 | |
Shares issued to shareholders in reinvestment of dividends and distributions | | | 11,166,659 | | | | 110,525,419 | |
Shares redeemed | | | (25,843,154 | ) | | | (264,698,617 | ) |
| | | | | | | | |
Net increase (decrease) | | | 20,124,338 | | | $ | 204,298,808 | |
| | | | | | | | |
Year ended December 31, 2012: | | | | | | | | |
Shares sold | | | 45,027,384 | | | $ | 449,296,200 | |
Shares issued to shareholders in reinvestment of dividends and distributions | | | 9,422,058 | | | | 92,907,075 | |
Shares redeemed | | | (10,563,747 | ) | | | (105,150,032 | ) |
| | | | | | | | |
Net increase (decrease) | | | 43,885,695 | | | $ | 437,053,243 | |
| | | | | | | | |
| | | | |
| mainstayinvestments.com | | | M-499 | |
Notes to Financial Statements (continued)
ICAP Select Equity
| | | | | | | | |
Initial Class | | Shares | | | Amount | |
Year ended December 31, 2013: | | | | | | | | |
Shares sold | | | 574,277 | | | $ | 9,197,530 | |
Shares issued to shareholders in reinvestment of dividends and distributions | | | 644,287 | | | | 10,361,894 | |
Shares redeemed | | | (4,987,865 | ) | | | (78,767,507 | ) |
| | | | | | | | |
Net increase (decrease) | | | (3,769,301 | ) | | $ | (59,208,083 | ) |
| | | | | | | | |
Year ended December 31, 2012: | | | | | | | | |
Shares sold | | | 2,003,777 | | | $ | 25,929,207 | |
Shares issued to shareholders in reinvestment of dividends and distributions | | | 948,919 | | | | 12,939,217 | |
Shares redeemed | | | (9,058,657 | ) | | | (120,397,386 | ) |
| | | | | | | | |
Net increase (decrease) | | | (6,105,961 | ) | | $ | (81,528,962 | ) |
| | | | | | | | |
|
| |
Service Class | | Shares | | | Amount | |
Year ended December 31, 2013: | | | | | | | | |
Shares sold | | | 4,145,007 | | | $ | 65,720,902 | |
Shares issued to shareholders in reinvestment of dividends and distributions | | | 480,683 | | | | 7,662,118 | |
Shares redeemed | | | (4,341,400 | ) | | | (68,215,810 | ) |
| | | | | | | | |
Net increase (decrease) | | | 284,290 | | | $ | 5,167,210 | |
| | | | | | | | |
Year ended December 31, 2012: | | | | | | | | |
Shares sold | | | 2,195,604 | | | $ | 28,663,734 | |
Shares issued to shareholders in reinvestment of dividends and distributions | | | 669,261 | | | | 9,049,625 | |
Shares redeemed | | | (5,466,721 | ) | | | (71,524,124 | ) |
| | | | | | | | |
Net increase (decrease) | | | (2,601,856 | ) | | $ | (33,810,765 | ) |
| | | | | | | | |
Income Builder
| | | | | | | | |
Initial Class | | Shares | | | Amount | |
Year ended December 31, 2013: | | | | | | | | |
Shares sold | | | 667,648 | | | $ | 11,238,875 | |
Shares issued to shareholders in reinvestment of dividends and distributions | | | 591,733 | | | | 9,853,978 | |
Shares redeemed | | | (1,689,137 | ) | | | (28,571,519 | ) |
| | | | | | | | |
Net increase (decrease) | | | (429,756 | ) | | $ | (7,478,666 | ) |
| | | | | | | | |
Year ended December 31, 2012: | | | | | | | | |
Shares sold | | | 316,962 | | | $ | 4,887,632 | |
Shares issued to shareholders in reinvestment of dividends and distributions | | | 584,285 | | | | 9,029,798 | |
Shares redeemed | | | (1,947,243 | ) | | | (29,619,891 | ) |
| | | | | | | | |
Net increase (decrease) | | | (1,045,996 | ) | | $ | (15,702,461 | ) |
| | | | | | | | |
|
| |
| | | | | | | | |
Service Class | | Shares | | | Amount | |
Year ended December 31, 2013: | | | | | | | | |
Shares sold | | | 5,102,744 | | | $ | 85,986,746 | |
Shares issued to shareholders in reinvestment of dividends and distributions | | | 450,826 | | | | 7,459,029 | |
Shares redeemed | | | (977,560 | ) | | | (16,503,249 | ) |
| | | | | | | | |
Net increase (decrease) | | | 4,576,010 | | | $ | 76,942,526 | |
| | | | | | | | |
Year ended December 31, 2012: | | | | | | | | |
Shares sold | | | 2,426,522 | | | $ | 37,183,058 | |
Shares issued to shareholders in reinvestment of dividends and distributions | | | 235,652 | | | | 3,624,215 | |
Shares redeemed | | | (766,344 | ) | | | (11,586,093 | ) |
| | | | | | | | |
Net increase (decrease) | | | 1,895,830 | | | $ | 29,221,180 | |
| | | | | | | | |
International Equity
| | | | | | | | |
Initial Class | | Shares | | | Amount | |
Year ended December 31, 2013: | | | | | | | | |
Shares sold | | | 2,434,350 | | | $ | 31,742,031 | |
Shares issued to shareholders in reinvestment of dividends and distributions | | | 166,615 | | | | 2,225,969 | |
Shares redeemed | | | (2,324,072 | ) | | | (29,991,577 | ) |
| | | | | | | | |
Net increase (decrease) | | | 276,893 | | | $ | 3,976,423 | |
| | | | | | | | |
Year ended December 31, 2012: | | | | | | | | |
Shares sold | | | 3,281,368 | | | $ | 36,011,439 | |
Shares issued to shareholders in reinvestment of dividends and distributions | | | 264,690 | | | | 3,187,864 | |
Shares redeemed | | | (2,994,160 | ) | | | (34,563,020 | ) |
| | | | | | | | |
Net increase (decrease) | | | 551,898 | | | $ | 4,636,283 | |
| | | | | | | | |
|
| |
Service Class | | Shares | | | Amount | |
Year ended December 31, 2013: | | | | | | | | |
Shares sold | | | 2,732,352 | | | $ | 35,167,231 | |
Shares issued to shareholders in reinvestment of dividends and distributions | | | 211,519 | | | | 2,804,014 | |
Shares redeemed | | | (2,769,127 | ) | | | (35,510,773 | ) |
| | | | | | | | |
Net increase (decrease) | | | 174,744 | | | $ | 2,460,472 | |
| | | | | | | | |
Year ended December 31, 2012: | | | | | | | | |
Shares sold | | | 1,426,902 | | | $ | 16,221,731 | |
Shares issued to shareholders in reinvestment of dividends and distributions | | | 358,298 | | | | 4,283,314 | |
Shares redeemed | | | (3,824,386 | ) | | | (44,004,338 | ) |
| | | | | | | | |
Net increase (decrease) | | | (2,039,186 | ) | | $ | (23,499,293 | ) |
| | | | | | | | |
| | |
| M-500 | | MainStay VP Funds Trust |
Janus Balanced
| | | | | | | | |
Initial Class | | Shares | | | Amount | |
Year ended December 31, 2013: | | | | | | | | |
Shares sold | | | 872,334 | | | $ | 9,975,302 | |
Shares issued to shareholders in reinvestment of dividends and distributions | | | 647,292 | | | | 7,560,875 | |
Shares redeemed | | | (5,661,383 | ) | | | (65,182,422 | ) |
| | | | | | | | |
Net increase (decrease) | | | (4,141,757 | ) | | $ | (47,646,245 | ) |
| | | | | | | | |
Period ended December 31, 2012 (a): | | | | | | | | |
Shares sold | | | 50,651,008 | | | $ | 506,919,366 | |
Shares redeemed | | | (6,918,700 | ) | | | (70,517,337 | ) |
| | | | | | | | |
Net increase (decrease) | | | 43,732,308 | | | $ | 436,402,029 | |
| | | | | | | | |
|
| |
Service Class | | Shares | | | Amount | |
Year ended December 31, 2013: | | | | | | | | |
Shares sold | | | 7,360,194 | | | $ | 83,972,361 | |
Shares issued to shareholders in reinvestment of dividends and distributions | | | 585,584 | | | | 6,823,034 | |
Shares redeemed | | | (2,710,877 | ) | | | (31,256,057 | ) |
| | | | | | | | |
Net increase (decrease) | | | 5,234,901 | | | $ | 59,539,338 | |
| | | | | | | | |
Period ended December 31, 2012 (a): | | | | | | | | |
Shares sold | | | 38,844,099 | | | $ | 389,606,978 | |
Shares redeemed | | | (2,867,931 | ) | | | (29,210,129 | ) |
| | | | | | | | |
Net increase (decrease) | | | 35,976,168 | | | $ | 360,396,849 | |
| | | | | | | | |
|
(a) The inception date of the Portfolio was February 17, 2012. | |
Large Cap Growth
| | | | | | | | |
Initial Class | | Shares | | | Amount | |
Year ended December 31, 2013: | | | | | | | | |
Shares sold | | | 1,843,678 | | | $ | 35,595,600 | |
Shares issued to shareholders in reinvestment of dividends and distributions | | | 169,248 | | | | 3,487,579 | |
Shares redeemed | | | (9,397,170 | ) | | | (177,997,067 | ) |
| | | | | | | | |
Net increase (decrease) | | | (7,384,244 | ) | | $ | (138,913,888 | ) |
| | | | | | | | |
Year ended December 31, 2012: | | | | | | | | |
Shares sold | | | 8,997,069 | | | $ | 148,021,277 | |
Shares redeemed | | | (3,899,688 | ) | | | (62,761,644 | ) |
| | | | | | | | |
Net increase (decrease) | | | 5,097,381 | | | $ | 85,259,633 | |
| | | | | | | | |
|
| |
Service Class | | Shares | | | Amount | |
Year ended December 31, 2013: | | | | | | | | |
Shares sold | | | 2,529,524 | | | $ | 48,284,187 | |
Shares issued to shareholders in reinvestment of dividends and distributions | | | 98,726 | | | | 1,996,094 | |
Shares redeemed | | | (1,719,243 | ) | | | (32,977,330 | ) |
| | | | | | | | |
Net increase (decrease) | | | 909,007 | | | $ | 17,302,951 | |
| | | | | | | | |
Year ended December 31, 2012: | | | | | | | | |
Shares sold | | | 3,142,054 | | | $ | 51,070,035 | |
Shares redeemed | | | (1,903,099 | ) | | | (31,011,940 | ) |
| | | | | | | | |
Net increase (decrease) | | | 1,238,955 | | | $ | 20,058,095 | |
| | | | | | | | |
Marketfield
| | | | | | | | |
Initial Class (a) | | Shares | | | Amount | |
Period ended December 31, 2013: | | | | | | | | |
Shares sold | | | 8,012,709 | | | $ | 80,464,524 | |
Shares redeemed | | | (70,129 | ) | | | (755,116 | ) |
| | | | | | | | |
Net increase (decrease) | | | 7,942,580 | | | $ | 79,709,408 | |
| | | | | | | | |
|
| |
Service Class (a) | | Shares | | | Amount | |
Period ended December 31, 2013: | | | | | | | | |
Shares sold | | | 22,948,462 | | | $ | 246,278,537 | |
Shares redeemed | | | (231,490 | ) | | | (2,501,631 | ) |
| | | | | | | | |
Net increase (decrease) | | | 22,716,972 | | | $ | 243,776,906 | |
| | | | | | | | |
|
(a) The inception date of the Portfolio was May 1, 2013. | |
MFS® Utilities
| | | | | | | | |
Initial Class | | Shares | | | Amount | |
Year ended December 31, 2013: | | | | | | | | |
Shares sold | | | 604,079 | | | $ | 7,284,324 | |
Shares issued to shareholders in reinvestment of dividends and distributions | | | 194,412 | | | | 2,352,101 | |
Shares redeemed | | | (433,070 | ) | | | (5,254,615 | ) |
| | | | | | | | |
Net increase (decrease) | | | 365,421 | | | $ | 4,381,810 | |
| | | | | | | | |
Period ended December 31, 2012 (a): | | | | | | | | |
Shares sold | | | 5,712,020 | | | $ | 57,945,272 | |
Shares redeemed | | | (520,065 | ) | | | (5,346,936 | ) |
| | | | | | | | |
Net increase (decrease) | | | 5,191,955 | | | $ | 52,598,336 | |
| | | | | | | | |
|
| |
Service Class | | Shares | | | Amount | |
Year ended December 31, 2013: | | | | | | | | |
Shares sold | | | 17,737,343 | | | $ | 214,196,106 | |
Shares issued to shareholders in reinvestment of dividends and distributions | | | 2,853,533 | | | | 34,434,614 | |
Shares redeemed | | | (6,763,111 | ) | | | (81,413,757 | ) |
| | | | | | | | |
Net increase (decrease) | | | 13,827,765 | | | $ | 167,216,963 | |
| | | | | | | | |
Period ended December 31, 2012 (a): | | | | | | | | |
Shares sold | | | 81,436,887 | | | $ | 816,612,238 | |
Shares redeemed | | | (8,405,755 | ) | | | (86,437,399 | ) |
| | | | | | | | |
Net increase (decrease) | | | 73,031,132 | | | $ | 730,174,839 | |
| | | | | | | | |
|
(a) The inception date of the Portfolio was February 17, 2012. | |
| | | | |
| mainstayinvestments.com | | | M-501 | |
Notes to Financial Statements (continued)
Mid Cap Core
| | | | | | | | |
Initial Class | | Shares | | | Amount | |
Year ended December 31, 2013: | | | | | | | | |
Shares sold | | | 8,110,168 | | | $ | 120,002,121 | |
Shares issued to shareholders in reinvestment of dividends and distributions | | | 1,739,286 | | | | 25,451,599 | |
Shares redeemed | | | (4,215,714 | ) | | | (62,517,626 | ) |
| | | | | | | | |
Net increase (decrease) | | | 5,633,740 | | | $ | 82,936,094 | |
| | | | | | | | |
Year ended December 31, 2012: | | | | | | | | |
Shares sold | | | 2,522,673 | | | $ | 30,411,407 | |
Shares issued to shareholders in reinvestment of dividends and distributions | | | 1,728,497 | | | | 20,795,148 | |
Shares redeemed | | | (11,221,288 | ) | | | (138,791,573 | ) |
| | | | | | | | |
Net increase (decrease) | | | (6,970,118 | ) | | $ | (87,585,018 | ) |
| | | | | | | | |
|
| |
Service Class | | Shares | | | Amount | |
Year ended December 31, 2013: | | | | | | | | |
Shares sold | | | 4,712,940 | | | $ | 68,753,106 | |
Shares issued to shareholders in reinvestment of dividends and distributions | | | 1,770,791 | | | | 25,686,647 | |
Shares redeemed | | | (3,557,208 | ) | | | (51,512,534 | ) |
| | | | | | | | |
Net increase (decrease) | | | 2,926,523 | | | $ | 42,927,219 | |
| | | | | | | | |
Year ended December 31, 2012: | | | | | | | | |
Shares sold | | | 1,608,665 | | | $ | 19,617,782 | |
Shares issued to shareholders in reinvestment of dividends and distributions | | | 2,042,802 | | | | 24,392,451 | |
Shares redeemed | | | (3,995,369 | ) | | | (48,554,847 | ) |
| | | | | | | | |
Net increase (decrease) | | | (343,902 | ) | | $ | (4,544,614 | ) |
| | | | | | | | |
Moderate Allocation
| | | | | | | | |
Initial Class | | Shares | | | Amount | |
Year ended December 31, 2013: | | | | | | | | |
Shares sold | | | 562,020 | | | $ | 6,677,333 | |
Shares issued to shareholders in reinvestment of dividends and distributions | | | 154,727 | | | | 1,839,917 | |
Shares redeemed | | | (362,495 | ) | | | (4,359,211 | ) |
| | | | | | | | |
Net increase (decrease) | | | 354,252 | | | $ | 4,158,039 | |
| | | | | | | | |
Year ended December 31, 2012: | | | | | | | | |
Shares sold | | | 601,321 | | | $ | 6,828,325 | |
Shares issued to shareholders in reinvestment of dividends and distributions | | | 211,055 | | | | 2,336,389 | |
Shares redeemed | | | (335,175 | ) | | | (3,786,945 | ) |
| | | | | | | | |
Net increase (decrease) | | | 477,201 | | | $ | 5,377,769 | |
| | | | | | | | |
|
| |
| | | | | | | | |
Service Class | | Shares | | | Amount | |
Year ended December 31, 2013: | | | | | | | | |
Shares sold | | | 13,766,570 | | | $ | 164,678,846 | |
Shares issued to shareholders in reinvestment of dividends and distributions | | | 4,243,788 | | | | 50,199,611 | |
Shares redeemed | | | (6,827,960 | ) | | | (82,216,971 | ) |
| | | | | | | | |
Net increase (decrease) | | | 11,182,398 | | | $ | 132,661,486 | |
| | | | | | | | |
Year ended December 31, 2012: | | | | | | | | |
Shares sold | | | 15,021,722 | | | $ | 169,622,253 | |
Shares issued to shareholders in reinvestment of dividends and distributions | | | 5,658,691 | | | | 62,368,242 | |
Shares redeemed | | | (6,907,248 | ) | | | (77,607,094 | ) |
| | | | | | | | |
Net increase (decrease) | | | 13,773,165 | | | $ | 154,383,401 | |
| | | | | | | | |
Moderate Growth Allocation
| | | | | | | | |
Initial Class | | Shares | | | Amount | |
Year ended December 31, 2013: | | | | | | | | |
Shares sold | | | 473,249 | | | $ | 5,876,885 | |
Shares issued to shareholders in reinvestment of dividends and distributions | | | 178,222 | | | | 2,211,868 | |
Shares redeemed | | | (278,300 | ) | | | (3,436,341 | ) |
| | | | | | | | |
Net increase (decrease) | | | 373,171 | | | $ | 4,652,412 | |
| | | | | | | | |
Year ended December 31, 2012: | | | | | | | | |
Shares sold | | | 401,400 | | | $ | 4,376,439 | |
Shares issued to shareholders in reinvestment of dividends and distributions | | | 199,712 | | | | 2,183,911 | |
Shares redeemed | | | (332,068 | ) | | | (3,616,659 | ) |
| | | | | | | | |
Net increase (decrease) | | | 269,044 | | | $ | 2,943,691 | |
| | | | | | | | |
|
| |
Service Class | | Shares | | | Amount | |
Year ended December 31, 2013: | | | | | | | | |
Shares sold | | | 21,840,734 | | | $ | 268,212,421 | |
Shares issued to shareholders in reinvestment of dividends and distributions | | | 4,795,192 | | | | 59,181,264 | |
Shares redeemed | | | (5,375,793 | ) | | | (66,293,957 | ) |
| | | | | | | | |
Net increase (decrease) | | | 21,260,133 | | | $ | 261,099,728 | |
| | | | | | | | |
Year ended December 31, 2012: | | | | | | | | |
Shares sold | | | 22,305,684 | | | $ | 242,026,662 | |
Shares issued to shareholders in reinvestment of dividends and distributions | | | 4,745,460 | | | | 51,659,718 | |
Shares redeemed | | | (6,378,345 | ) | | | (69,289,306 | ) |
| | | | | | | | |
Net increase (decrease) | | | 20,672,799 | | | $ | 224,397,074 | |
| | | | | | | | |
| | |
| M-502 | | MainStay VP Funds Trust |
PIMCO Real Return
| | | | | | | | |
Initial Class | | Shares | | | Amount | |
Year ended December 31, 2013: | | | | | | | | |
Shares sold | | | 268,156 | | | $ | 2,757,154 | |
Shares issued to shareholders in reinvestment of dividends and distributions | | | 20,046 | | | | 193,946 | |
Shares redeemed | | | (456,345 | ) | | | (4,605,298 | ) |
| | | | | | | | |
Net increase (decrease) | | | (168,143 | ) | | $ | (1,654,198 | ) |
| | | | | | | | |
Period ended December 31, 2012 (a): | | | | | | | | |
Shares sold | | | 1,314,010 | | | $ | 13,363,847 | |
Shares redeemed | | | (120,680 | ) | | | (1,251,607 | ) |
| | | | | | | | |
Net increase (decrease) | | | 1,193,330 | | | $ | 12,112,240 | |
| | | | | | | | |
|
| |
Service Class | | Shares | | | Amount | |
Year ended December 31, 2013: | | | | | | | | |
Shares sold | | | 7,022,332 | | | $ | 72,190,206 | |
Shares issued to shareholders in reinvestment of dividends and distributions | | | 713,165 | | | | 6,888,693 | |
Shares redeemed | | | (14,858,216 | ) | | | (147,208,851 | ) |
| | | | | | | | |
Net increase (decrease) | | | (7,122,719 | ) | | $ | (68,129,952 | ) |
| | | | | | | | |
Period ended December 31, 2012 (a): | | | | | | | | |
Shares sold | | | 48,359,131 | | | $ | 490,062,183 | |
Shares redeemed | | | (3,374,862 | ) | | | (34,768,980 | ) |
| | | | | | | | |
Net increase (decrease) | | | 44,984,269 | | | $ | 455,293,203 | |
| | | | | | | | |
|
(a) The inception date of the Portfolio was February 17, 2012. | |
S&P 500 Index
| | | | | | | | |
Initial Class | | Shares | | | Amount | |
Year ended December 31, 2013: | | | | | | | | |
Shares sold | | | 5,540,201 | | | $ | 183,568,311 | |
Shares issued to shareholders in reinvestment of dividends and distributions | | | 404,648 | | | | 13,748,908 | |
Shares redeemed | | | (9,970,067 | ) | | | (340,999,291 | ) |
| | | | | | | | |
Net increase (decrease) | | | (4,025,218 | ) | | $ | (143,682,072 | ) |
| | | | | | | | |
Year ended December 31, 2012: | | | | | | | | |
Shares sold | | | 8,548,262 | | | $ | 234,122,666 | |
Shares issued to shareholders in reinvestment of dividends and distributions | | | 406,816 | | | | 11,913,117 | |
Shares redeemed | | | (7,567,329 | ) | | | (210,337,284 | ) |
| | | | | | | | |
Net increase (decrease) | | | 1,387,749 | | | $ | 35,698,499 | |
| | | | | | | | |
|
| |
| | | | | | | | |
Service Class | | Shares | | | Amount | |
Year ended December 31, 2013: | | | | | | | | |
Shares sold | | | 1,951,754 | | | $ | 65,513,671 | |
Shares issued to shareholders in reinvestment of dividends and distributions | | | 127,493 | | | | 4,317,687 | |
Shares redeemed | | | (1,499,799 | ) | | | (50,054,182 | ) |
| | | | | | | | |
Net increase (decrease) | | | 579,448 | | | $ | 19,777,176 | |
| | | | | | | | |
Year ended December 31, 2012: | | | | | | | | |
Shares sold | | | 1,105,130 | | | $ | 30,993,667 | |
Shares issued to shareholders in reinvestment of dividends and distributions | | | 119,662 | | | | 3,494,658 | |
Shares redeemed | | | (1,570,955 | ) | | | (43,884,485 | ) |
| | | | | | | | |
Net increase (decrease) | | | (346,163 | ) | | $ | (9,396,160 | ) |
| | | | | | | | |
T. Rowe Price Equity Income
| | | | | | | | |
Initial Class | | Shares | | | Amount | |
Year ended December 31, 2013: | | | | | | | | |
Shares sold | | | 5,042,037 | | | $ | 61,029,544 | |
Shares issued to shareholders in reinvestment of dividends and distributions | | | 724,811 | | | | 9,147,436 | |
Shares redeemed | | | (7,905,660 | ) | | | (101,183,764 | ) |
| | | | | | | | |
Net increase (decrease) | | | (2,138,812 | ) | | $ | (31,006,784 | ) |
| | | | | | | | |
Period ended December 31, 2012 (a): | | | | | | | | |
Shares sold | | | 38,773,915 | | | $ | 394,465,320 | |
Shares redeemed | | | (4,073,776 | ) | | | (41,278,761 | ) |
| | | | | | | | |
Net increase (decrease) | | | 34,700,139 | | | $ | 353,186,559 | |
| | | | | | | | |
|
| |
Service Class | | Shares | | | Amount | |
Year ended December 31, 2013: | | | | | | | | |
Shares sold | | | 3,349,045 | | | $ | 41,988,476 | |
Shares issued to shareholders in reinvestment of dividends and distributions | | | 428,962 | | | | 5,401,164 | |
Shares redeemed | | | (3,425,776 | ) | | | (42,528,267 | ) |
| | | | | | | | |
Net increase (decrease) | | | 352,231 | | | $ | 4,861,373 | |
| | | | | | | | |
Period ended December 31, 2012 (a): | | | | | | | | |
Shares sold | | | 26,078,184 | | | $ | 261,081,811 | |
Shares redeemed | | | (3,587,667 | ) | | | (36,650,656 | ) |
| | | | | | | | |
Net increase (decrease) | | | 22,490,517 | | | $ | 224,431,155 | |
| | | | | | | | |
|
(a) The inception date of the Portfolio was February 17, 2012. | |
| | | | |
| mainstayinvestments.com | | | M-503 | |
Notes to Financial Statements (continued)
Unconstrained Bond
| | | | | | | | |
Initial Class | | Shares | | | Amount | |
Year ended December 31, 2013: | | | | | | | | |
Shares sold | | | 4,062,835 | | | $ | 42,182,040 | |
Shares issued to shareholders in reinvestment of dividends and distributions | | | 329,361 | | | | 3,369,806 | |
Shares redeemed | | | (7,094,821 | ) | | | (73,998,311 | ) |
| | | | | | | | |
Net increase (decrease) | | | (2,702,625 | ) | | $ | (28,446,465 | ) |
| | | | | | | | |
Year ended December 31, 2012: | | | | | | | | |
Shares sold | | | 4,003,771 | | | $ | 40,371,349 | |
Shares issued to shareholders in reinvestment of dividends and distributions | | | 738,080 | | | | 7,603,953 | |
Shares redeemed | | | (11,379,328 | ) | | | (116,375,153 | ) |
| | | | | | | | |
Net increase (decrease) | | | (6,637,477 | ) | | $ | (68,399,851 | ) |
| | | | | | | | |
|
| |
Service Class | | Shares | | | Amount | |
Year ended December 31, 2013: | | | | | | | | |
Shares sold | | | 16,898,857 | | | $ | 176,281,839 | |
Shares issued to shareholders in reinvestment of dividends and distributions | | | 1,057,893 | | | | 10,800,070 | |
Shares redeemed | | | (3,384,096 | ) | | | (35,253,141 | ) |
| | | | | | | | |
Net increase (decrease) | | | 14,572,654 | | | $ | 151,828,768 | |
| | | | | | | | |
Year ended December 31, 2012: | | | | | | | | |
Shares sold | | | 10,379,513 | | | $ | 107,389,661 | |
Shares issued to shareholders in reinvestment of dividends and distributions | | | 734,540 | | | | 7,545,144 | |
Shares redeemed | | | (800,513 | ) | | | (8,181,837 | ) |
| | | | | | | | |
Net increase (decrease) | | | 10,313,540 | | | $ | 106,752,968 | |
| | | | | | | | |
U.S. Small Cap
| | | | | | | | |
Initial Class | | Shares | | | Amount | |
Year ended December 31, 2013: | | | | | | | | |
Shares sold | | | 6,599,516 | | | $ | 81,849,555 | |
Shares issued to shareholders in reinvestment of dividends and distributions | | | 103,698 | | | | 1,307,542 | |
Shares redeemed | | | (2,586,996 | ) | | | (30,057,145 | ) |
| | | | | | | | |
Net increase (decrease) | | | 4,116,218 | | | $ | 53,099,952 | |
| | | | | | | | |
Year ended December 31, 2012: | | | | | | | | |
Shares sold | | | 3,221,540 | | | $ | 30,811,492 | |
Shares issued to shareholders in reinvestment of dividends and distributions | | | 63,323 | | | | 618,731 | |
Shares redeemed | | | (6,253,080 | ) | | | (60,116,042 | ) |
| | | | | | | | |
Net increase (decrease) | | | (2,968,217 | ) | | $ | (28,685,819 | ) |
| | | | | | | | |
|
| |
| | | | | | | | |
Service Class | | Shares | | | Amount | |
Year ended December 31, 2013: | | | | | | | | |
Shares sold | | | 3,537,531 | | | $ | 41,852,524 | |
Shares issued to shareholders in reinvestment of dividends and distributions | | | 74,635 | | | | 916,377 | |
Shares redeemed | | | (1,937,887 | ) | | | (22,671,726 | ) |
| | | | | | | | |
Net increase (decrease) | | | 1,674,279 | | | $ | 20,097,175 | |
| | | | | | | | |
Year ended December 31, 2012: | | | | | | | | |
Shares sold | | | 1,647,002 | | | $ | 15,403,863 | |
Shares issued to shareholders in reinvestment of dividends and distributions | | | 27,434 | | | | 261,257 | |
Shares redeemed | | | (2,205,100 | ) | | | (20,569,915 | ) |
| | | | | | | | |
Net increase (decrease) | | | (530,664 | ) | | $ | (4,904,795 | ) |
| | | | | | | | |
Van Eck Global Hard Assets
| | | | | | | | |
Initial Class | | Shares | | | Amount | |
Year ended December 31, 2013: | | | | | | | | |
Shares sold | | | 4,769,353 | | | $ | 44,462,988 | |
Shares issued to shareholders in reinvestment of dividends and distributions | | | 663,659 | | | | 6,427,982 | |
Shares redeemed | | | (13,112,348 | ) | | | (122,585,197 | ) |
| | | | | | | | |
Net increase (decrease) | | | (7,679,336 | ) | | $ | (71,694,227 | ) |
| | | | | | | | |
Period ended December 31, 2012 (a): | | | | | | | | |
Shares sold | | | 79,206,473 | | | $ | 784,047,718 | |
Shares redeemed | | | (12,143,331 | ) | | | (108,415,436 | ) |
| | | | | | | | |
Net increase (decrease) | | | 67,063,142 | | | $ | 675,632,282 | |
| | | | | | | | |
|
(a) The inception date of the Portfolio was February 17, 2012. | |
Note 12–Litigation
The Common Stock, Mid Cap Core, and S&P 500 Index Portfolios have been named as defendants in the case entitled Kirschner v. FitzSimons, No. 12-2652 (S.D.N.Y.) (the “FitzSimons action”) as a result of their ownership of shares in the Tribune Company (“Tribune”) in 2007 when Tribune effected a leveraged buyout transaction (“LBO”) by which Tribune converted to a privately-held company. In its complaint, which was served on the Portfolios in October 2012, the plaintiff asserts claims against certain insiders, major shareholders, professional advisers, and others involved in the LBO. Separately, the complaint also seeks to obtain from former Tribune shareholders, including the Portfolios, any proceeds they received in connection with the LBO. The sole claim and cause of action brought against the Portfolios is for fraudulent conveyance pursuant to United States Bankruptcy Code Section 548(a)(1)(A).
In June 2011, certain Tribune creditors filed numerous additional actions asserting state law constructive fraudulent conveyance claims (the “SLCFC actions”) against specifically-named former Tribune shareholders and, in some cases, putative defendant classes comprised of former Tribune shareholders. One of the SLCFC actions,
| | |
| M-504 | | MainStay VP Funds Trust |
entitled Deutsche Bank Trust Co. Americas v. Blackrock Institutional Trust Co., No. 11-9319 (S.D.N.Y.) (the “Deutsche Bank action”), named the MainStay VP Funds Trust as a defendant.
The FitzSimons action and the Deutsche Bank action have been consolidated with the majority of the other Tribune LBO related lawsuits in a multidistrict litigation proceeding entitled In re Tribune Co. Fraudulent Conveyance Litig., No. 11-md-2296 (S.D.N.Y.) (the “MDL Proceeding”).
On August 2, 2013, the plaintiff in the FitzSimons action filed a Fifth Amended Complaint.
On September 23, 2013, the District Court granted the defendants’ motion to dismiss the SLCFC actions, including the Deutsche Bank action, on the basis that the plaintiffs did not have standing to pursue their claims. On September 30, 2013, the plaintiffs in the SLCFC actions filed a notice of appeal to the United States Court of Appeals for the Second Circuit. On October 28, 2013, the defendants filed a joint notice of cross-appeal of that same order.
On November 20, 2013, the District Court issued Master Case Order No. 4 governing the next steps in the FitzSimons action, including the protocol for filing of any motions to dismiss the lawsuit. On January 24, 2014, the Court extended the time for service of summonses and complaints to February 28, 2014.
The value of the proceeds received by the Portfolios in connection with the LBO and the Portfolio’s cost basis in shares of Tribune was as follows:
| | | | | | | | |
Portfolio | | Proceeds | | | Cost Basis | |
Common Stock | | $ | 1,300,602 | | | $ | 1,174,184 | |
Mid Cap Core | | $ | 808,180 | | | $ | 790,269 | |
S&P 500 Index | | $ | 682,856 | | | $ | 527,309 | |
At this stage of the proceedings it would be difficult to assess with any reasonable certainty the probable outcome of the pending litigation or the effect, if any, on the Portfolios’ net asset values.
Note 13–Subsequent Events
In connection with the preparation of the financial statements of the Portfolios as of and for the year ended December 31, 2013, events and transactions subsequent to December 31, 2013, through the date the financial statements were issued have been evaluated by the Portfolios’ management for possible adjustment and/or disclosure. No subsequent events requiring financial statement adjustment or disclosure have been identified, other than the following:
Effective January 1, 2014, for the Convertible, Income Builder and Unconstrained Bond Portfolios, dividends of net investment income, if any, are declared and distributed quarterly and distributions of net realized capital and currency gains, if any, are declared and paid at least annually.
| | | | |
| mainstayinvestments.com | | | M-505 | |
Report of Independent Registered Public Accounting Firm
To the Board of Trustees and Shareholders of
MainStay VP Funds Trust
In our opinion, the accompanying statements of assets and liabilities, including the portfolios of investments, and the related statements of operations, of changes in net assets and of cash flows, and the financial highlights present fairly, in all material respects, the financial position of each of the portfolios constituting MainStay VP Funds Trust (as listed in Note 1 to the financial statements and hereafter referred to collectively as the “Funds”) at December 31, 2013, and the results of each of their operations, the changes in each of their net assets, the cash flows of MainStay VP PIMCO Real Return Portfolio and the financial highlights for each of the periods presented, in conformity with accounting principles generally accepted in the United States of America. These financial statements and financial highlights (hereafter referred to as “financial statements”) are the responsibility of the Funds’ management. Our responsibility is to express an opinion on these financial statements based on our audits. We conducted our audits of these financial statements in accordance with the standards of the Public Company Accounting Oversight Board (United States). Those standards require that we plan and perform the audit to obtain reasonable assurance about whether the financial statements are free of material misstatement. An audit includes examining, on a test basis, evidence supporting the amounts and disclosures in the financial statements, assessing the accounting principles used and significant estimates made by management, and evaluating the overall financial statement presentation. We believe that our audits, which included confirmation of securities at December 31, 2013 by correspondence with the custodian, agent banks, brokers and transfer agents, and the application of alternative auditing procedures where securities purchased confirmations had not been received, provide a reasonable basis for our opinion.
PricewaterhouseCoopers LLP
New York, New York
February 21, 2014
| | |
| M-506 | | MainStay VP Funds Trust |
I. Board Consideration and Approval of Management Agreements
and Subadvisory Agreements (Unaudited)
Section 15(c) of the Investment Company Act of 1940, as amended (the “1940 Act”) requires that each mutual fund’s board of trustees, including a majority of the independent trustees, annually review and approve the fund’s investment advisory agreements. At its December 10-11, 2013 meeting, the Board of Trustees (the “Board”) of MainStay VP Funds Trust (the “Trust”) unanimously approved the Management Agreements between New York Life Investment Management LLC (“New York Life Investments”) and the Trust, on behalf of each of the Trust’s Portfolios, and the Subadvisory Agreements between New York Life Investments and each of Cornerstone Capital Management LLC (“Cornerstone Capital Management”), Cornerstone Capital Management Holdings LLC (“Cornerstone Capital Management Holdings”), Dimensional Fund Advisors LP (“DFA”), DuPont Capital Management Corporation (“DuPont Capital”), Eagle Asset Management, Inc. (“Eagle”), Epoch Investment Partners, Inc. (“Epoch”), Institutional Capital LLC (“ICAP”), Janus Capital Management LLC (“Janus Capital”), MacKay Shields LLC (“MacKay”), Massachusetts Financial Services Company (“MFS”), Pacific Investment Management Company LLC (“PIMCO”), T. Rowe Price Associates, Inc. (“T. Rowe”), Van Eck Associates Corporation (“Van Eck”) and Winslow Capital Management, Inc. (“Winslow”) (collectively, the “Subadvisers”), which serve as subadvisers to certain Portfolios (the “Subadvised Portfolios”).
In reaching its decision to approve the Agreements, the Board considered information furnished by New York Life Investments and the Subadvisers in connection with a contract review process that took place at various meetings of the Board and its Contracts Committee between September 2013 and December 2013, as well as other relevant information furnished to the Board throughout the year by New York Life Investments and the Subadvisers. Information requested by and furnished to the Board in connection with the contract review process included, among other items, reports on each Portfolio prepared by Strategic Insight Mutual Fund Research and Consulting LLC (“Strategic Insight”), an independent third-party service provider engaged by the Board to report objectively on each Portfolio’s investment performance, management and subadvisory fees and ordinary operating expenses. The Board also considered information provided by New York Life Investments and the Subadvisers on the fees charged to other investment advisory clients (including institutional separate accounts) that follow investment strategies similar to the Portfolios, and the rationale for any differences in a Portfolio’s management and subadvisory fees and the fees charged to those other investment advisory clients. In addition, the Board requested and received information on the profitability of the Portfolios to New York Life Investments and its affiliates and certain Subadvisers, and responses from New York Life Investments and the Subadvisers to a series of questions encompassing a variety of topics prepared on behalf of the Board by independent legal counsel to
the Board and its independent trustees (the “Independent Trustees”). Information provided to the Board at its meetings throughout the year included, among other items, detailed investment performance reports on each Portfolio prepared by the Investment Consulting Group at New York Life Investments. The structure and format for this regular reporting were developed in consultation with the Board. The Board also received from New York Life Investments throughout the year, among other items, periodic reports on legal and compliance matters, portfolio turnover, and sales and marketing activity.
In determining to approve the Agreements, the members of the Board reviewed and evaluated all of the information and factors they believed to be relevant and appropriate in light of legal advice furnished to them by independent legal counsel and through the exercise of their own business judgment. The broad factors considered by the Board are discussed in greater detail below, and included, among other items: (i) the nature, scope and quality of the services provided to the Portfolios by New York Life Investments and the Subadvisers; (ii) the investment performance of each Portfolio, New York Life Investments and the Subadvisers; (iii) the costs of the services provided, and profits realized, by New York Life Investments and each Subadviser from their relationships with the Portfolios; (iv) the extent to which economies of scale may be realized as the Portfolios grow, and the extent to which economies of scale may benefit Portfolio investors; and (v) the reasonableness of each Portfolio’s management and subadvisory fees and overall total ordinary operating expenses, particularly as compared to similar funds and accounts managed by New York Life Investments and the Subadvisers and third-party “peer funds” identified by Strategic Insight.
While individual members of the Board may have weighed certain factors differently, the Board’s decisions to approve the Agreements were based on a consideration of all the information provided to the Board, including information provided to the Board throughout the year and specifically in connection with the contract review process. The Board’s conclusions with respect to the Agreements also were based, in part, on the Board’s consideration of the Agreements in prior years. In addition to considering the above-referenced factors, the Board observed that in the marketplace there are a range of investment options available to variable life insurance policyholders and variable annuity contract owners that invest in the Portfolios, and that these policyholders and contract owners, having had the opportunity to consider other investment options, have chosen to invest in the Portfolios. A more detailed discussion of the factors that figured prominently in the Board’s decisions to approve the Agreements is provided below.
| | | | |
| mainstayinvestments.com | | | M-507 | |
I. Board Consideration and Approval of Management Agreement
and Subsidiary Agreement (Unaudited) (continued)
Nature, Scope and Quality of Services to Be Provided by New York Life Investments and the Subadvisers
The Board examined the nature, scope and quality of the services that New York Life Investments provides to the Portfolios. The Board evaluated New York Life Investments’ experience in serving as manager of the Portfolios, noting that New York Life Investments manages other mutual funds, serves a variety of other investment advisory clients, including other pooled investment vehicles, and has experience with overseeing mutual fund service providers, including subadvisers. The Board considered the experience of senior personnel at New York Life Investments providing management and administrative services to the Portfolios, as well as New York Life Investments’ reputation and financial condition. The Board also considered the full range of non-advisory services that New York Life Investments supplies to the Portfolios under the terms of the Management Agreement, including: (i) fund accounting and oversight services provided by New York Life Investments’ Fund Accounting and Administration Group; (ii) investment oversight and analytical services provided by New York Life Investments’ Investment Consulting Group; (iii) compliance services provided by the Portfolios’ Chief Compliance Officer as well as New York Life Investments’ compliance department, including oversight and implementation of each Portfolio’s compliance program; and (iv) legal services provided by New York Life Investments’ Office of the General Counsel. Additional information about the non-advisory services provided by New York Life Investments is set forth in each Portfolio’s Management Agreement. The Board also considered New York Life Investments’ willingness to invest in personnel that benefit the Portfolios, and noted that New York Life Investments is responsible for compensating each Portfolio’s officers.
The Board also examined the nature, scope and quality of the advisory services that New York Life Investments provides to the non-Subadvised Portfolios and the Subadvisers provide to the Subadvised Portfolios. The Board evaluated New York Life Investments’ and the Subadvisers’ experience in serving as investment adviser and subadviser, respectively, to the Portfolios and managing other portfolios. It examined New York Life Investments’ and the Subadvisers’ track record and experience in providing investment advisory services, the experience of investment advisory, senior management and administrative personnel at New York Life Investments and the Subadvisers, and New York Life Investments’ and the Subadvisers’ overall legal and compliance environment. The Board also reviewed New York Life Investments’ and the Subadvisers’ willingness to invest in personnel and infrastructure that benefit the Portfolios. In this regard, the Board considered the experience of each Portfolio’s portfolio managers, the number of accounts managed by the portfolio managers and the method for compensating portfolio managers.
Based on these considerations, the Board concluded, within the context of its overall determinations regarding the Agreements, that the Portfolios should continue to benefit from the nature, scope and quality of these services as a result of New York Life Investments’ and the Subadvisers’ experience, personnel, operations and resources.
Investment Performance
In evaluating each Portfolio’s investment performance, the Board considered investment performance results in light of a Portfolio’s investment objective, strategies and risks, as disclosed in the Portfolio’s prospectus. The Board particularly considered detailed investment reports on the Portfolios’ performance provided to the Board throughout the year by the Investment Consulting Group of New York Life Investments. These reports include, among other items, information on each Portfolio’s gross and net returns, each Portfolio’s investment performance relative to relevant investment categories and Portfolio benchmarks, each Portfolio’s risk-adjusted investment performance, and each Portfolio’s investment performance as compared to similar competitor funds, as appropriate. The Board also considered information provided by Strategic Insight showing the investment performance of each Portfolio as compared to peer funds.
The Board focused principally on each Portfolio’s long-term performance track record (to the extent available). The Board also gave weight to its ongoing discussions with senior management at New York Life Investments concerning each Portfolio’s investment performance, as well as discussions between each Portfolio’s portfolio managers and the Board that occur typically on an annual basis. In addition, the Board considered any specific actions that New York Life Investments or the Subadvisers had taken, or had agreed with the Board to take, to enhance Portfolio investment performance, and the results of those actions. The Board particularly considered the recent underperformance of the MainStay VP Cornerstone Growth Portfolio relative to its peer funds and noted discussions with New York Life Investments and Cornerstone Capital Management regarding initiatives to improve performance.
Because the MainStay VP Conservative Allocation Portfolio, MainStay VP Moderate Allocation Portfolio, Main-Stay VP Moderate Growth Allocation Portfolio and MainStay VP Growth Allocation Portfolio (the “Asset Allocation Portfolios”) invest substantially all of their assets in other funds advised by New York Life Investments (including the Portfolios), the Board considered the rationale for the allocation among and selection of the underlying funds in which the Asset Allocation Portfolios invest, including the investment performance of the underlying funds.
Based on these considerations, the Board concluded, within the context of its overall determinations regarding the Agreements, that the long-term investment performance of
| | |
| M-508 | | MainStay VP Funds Trust |
the Portfolios, along with ongoing efforts by New York Life Investments and the Subadvisers to enhance investment returns, supported a determination to approve the Agreements. The Portfolios disclose more information about investment performance in the Portfolio Management Discussion and Analysis, Investment and Performance Comparison and Financial Highlights sections of this Annual Report and in the Portfolios’ prospectus.
Costs of the Services Provided, and Profits Realized, by New York Life Investments and the Subadvisers
The Board considered the costs of the services provided by New York Life Investments and the Subadvisers under the Agreements, and the profits realized by New York Life Investments and its affiliates and the Subadvisers due to their relationships with the Portfolios. Because Cornerstone Capital Management, Cornerstone Capital Management Holdings, ICAP and MacKay are affiliates of New York Life Investments whose subadvisory fees are paid directly by New York Life Investments, the Board considered cost and profitability information for New York Life Investments and these Subadvisers in the aggregate. Because the subadvisory fees of DFA, DuPont Capital, Eagle, Epoch, Janus, MFS, PIMCO, T. Rowe, Van Eck and Winslow are negotiated at arm’s-length by New York Life Investments and are paid by New York Life Investments, not the Portfolios, the Board principally considered the profits realized by New York Life Investments and its affiliates with respect to the Portfolios.
The Board noted that the Asset Allocation Portfolios do not pay a management fee, but that shareholders of the Asset Allocation Portfolios indirectly pay their pro rata share of the fees and expenses of the underlying funds in which the Asset Allocation Portfolios invest. The Board considered that the Asset Allocation Portfolios’ investments in underlying funds managed by New York Life Investments indirectly benefit New York Life Investments.
In evaluating the costs and profits of New York Life Investments and its affiliates and the Subadvisers, the Board considered, among other factors, each party’s investments in personnel, systems, equipment and other resources necessary to manage the Portfolios, and that New York Life Investments is responsible for paying the subadvisory fees for the Subadvised Portfolios. The Board acknowledged that New York Life Investments and the Subadvisers must be in a position to pay and retain experienced professional personnel to provide services to the Portfolios, and that the ability to maintain a strong financial position is important in order for New York Life Investments and the Subadvisers to continue to provide high-quality services to the Portfolios. The Board also noted that the Portfolios benefit from the allocation of certain fixed costs across the MainStay Group of Funds. In addition, the Board requested and received information regarding the profitability to New York Life Investments of managing the Portfolios as compared with managing retail MainStay Funds (“Retail Funds”).
The Board noted the difficulty in obtaining reliable comparative data about mutual fund managers’ profitability, since such information generally is not publicly available and may be impacted by numerous factors, including the structure of a fund manager’s organization, the types of funds it manages, the methodology used to allocate certain fixed costs to specific funds, and the manager’s capital structure and costs of capital. While recognizing the difficulty in evaluating a manager’s profitability with respect to the Portfolios, and noting that other profitability methodologies may also be reasonable, the Board concluded that the profitability methodology presented by New York Life Investments to the Board, which was developed by New York Life Investments in consultation with an independent consultant, was reasonable in all material respects.
In considering the costs and profitability of the Portfolios, the Board also considered certain fall-out benefits that may be realized by New York Life Investments and its affiliates due to their relationships with the Portfolios. The Board recognized, for example, the benefits to the Subadvisers from legally permitted “soft-dollar” arrangements by which brokers provide research and other services to the Subadvisers in exchange for commissions paid by a Subadvised Portfolio with respect to trades on the Subadvised Portfolio’s portfolio securities. The Board also requested and received information from New York Life Investments, DFA, DuPont Capital, Eagle, Epoch, Janus, MFS, PIMCO, T. Rowe, Van Eck and Winslow concerning other business relationships between DFA, DuPont Capital, Eagle, Epoch, Janus, MFS, PIMCO, T. Rowe, Van Eck and Winslow and their affiliates and New York Life Investments and its affiliates.
The Board further considered that, in addition to fees earned by New York Life Investments for managing the Portfolios, New York Life Investments’ affiliates also earn revenues from serving the Portfolios in various other capacities, including as the Portfolios’ distributor. The Board observed that information about these other revenues, and their impact on the profitability of the Portfolios to New York Life Investments and its affiliates, was furnished to the Board as part of the 15(c) process. The Board noted that, although it assessed the overall profitability of the Portfolios to New York Life Investments and its affiliates as part of the contract review process, when considering the reasonableness of the fees to be paid to New York Life Investments and its affiliates under the Agreements, the Board considered the profitability of New York Life Investments’ relationship with the Portfolios on a pre-tax basis, and without regard to distribution expenses.
After evaluating the information presented to the Board, the Board concluded, within the context of its overall determinations regarding the Agreements, that any profits realized by New York Life Investments and its affiliates and the Subadvisers due to their relationships with the Portfolios supported the Board’s decision to approve the Agreements. With respect to DFA, DuPont Capital, Eagle, Epoch, Janus,
| | | | |
| mainstayinvestments.com | | | M-509 | |
I. Board Consideration and Approval of Management Agreement
and Subsidiary Agreement (Unaudited) (continued)
MFS, PIMCO, T. Rowe, Van Eck and Winslow, the Board concluded that any profits realized by DFA, DuPont Capital, Eagle, Epoch, Janus, MFS, PIMCO, T. Rowe, Van Eck and Winslow due to their relationships with the Portfolios are the result of arm’s-length negotiations between New York Life Investments and DFA, DuPont Capital, Eagle, Epoch, Janus, MFS, PIMCO, T. Rowe, Van Eck and Winslow, and are based on fees paid to DFA, DuPont Capital, Eagle, Epoch, Janus, MFS, PIMCO, T. Rowe, Van Eck and Winslow by New York Life Investments, not the Portfolios.
Extent to Which Economies of Scale May Be Realized as the Portfolios Grow
The Board considered whether each Portfolio’s expense structure permitted economies of scale to be shared with Portfolio investors. The Board also considered a report from New York Life Investments, prepared at the request of the Board, that addressed economies of scale in the mutual fund business generally, the changing economics of the mutual fund business and the various ways in which the benefits of economies of scale may be shared with the MainStay Funds. The Board also reviewed information from New York Life Investments showing how each Portfolio’s management fee schedule compared to fee schedules of other funds and accounts managed by New York Life Investments. In addition, the Board reviewed information from Strategic Insight showing how each Portfolio’s management fee schedule hypothetically would compare with fees paid for similar services by peer funds at varying asset levels. While recognizing the difficulty of determining economies of scale with precision, the Board acknowledged that economies of scale may be shared with the Portfolios in a number of ways, including, for example, through the imposition of management fee breakpoints and by initially setting relatively low management fees. The Board considered that New York Life Investments had agreed to new breakpoints or fee waivers for certain of the Portfolios following negotiations with the Board in connection with the annual contract review process. With respect to the Asset Allocation Portfolios, the Board noted that the Portfolios do not pay a management fee, and that the Board separately considers economies of scale as part of its review of the management agreements of underlying funds in which the Portfolios invest.
Based on this information, the Board concluded, within the context of its overall determinations regarding the Agreements, that each Portfolio’s expense structure appropriately reflects economies of scale for the benefit of Portfolio investors. The Board noted, however, that it would continue to evaluate the reasonableness of each Portfolio’s expense structure as the Portfolio grows over time.
Management and Subadvisory Fees and Total Ordinary Operating Expenses
The Board evaluated the reasonableness of the fees to be paid under the Agreements and each Portfolio’s expected
total ordinary operating expenses. With respect to the Subadvised Portfolios, the Board primarily considered the reasonableness of the management fees paid by the Portfolios to New York Life Investments, since the fees paid to the Subadvisers are paid by New York Life Investments, not the Subadvised Portfolios.
In assessing the reasonableness of each Portfolio’s fees and expenses, the Board primarily considered comparative data provided by Strategic Insight on the fees and expenses charged by similar mutual funds managed by other investment advisers. Because the Asset Allocation Portfolios do not pay a management fee to New York Life Investments, the Board considered the reasonableness of fees and expenses the Asset Allocation Portfolios indirectly pay by investing in underlying funds that charge management fees. The Board considered New York Life Investments’ process for monitoring and disclosing potential conflicts in the selection of underlying funds. In addition, the Board considered information provided by New York Life Investments and the Subadvisers on fees charged to other investment advisory clients, including institutional separate accounts and other funds with similar investment objectives as the Portfolios. In this regard, the Board took into account the explanation provided by New York Life Investments about the different scope of services provided to mutual funds as compared with other investment advisory clients. The Board also took into account the impact of any contractual breakpoints, voluntary waivers and expense limitation arrangements on each Portfolio’s net management fee and expenses. The Board particularly considered the expenses borne by Portfolios whose contractual expense limitation agreements were set to expire, and negotiated an extension of the expense limitation agreement for the MainStay VP T. Rowe Price Equity Income Portfolio. The Board also evaluated differences in the contractual management fee schedules of the Portfolios and Retail Funds with similar investment objectives, investment strategies and portfolio management processes, taking into account New York Life Investments’ rationale for any differences in fee schedules.
After considering all of the factors outlined above, the Board concluded that each Portfolio’s management and subadvisory fees and total ordinary operating expenses were within a range that is competitive and, within the context of the Board’s overall conclusions regarding the Agreements, support a conclusion that these fees and expenses are reasonable.
Conclusion
On the basis of the information provided to it and its evaluation thereof, the Board, including the Independent Trustees, unanimously voted to approve the Agreements.
| | |
| M-510 | | MainStay VP Funds Trust |
II. Board Consideration and Approval of Subadvisory Agreement
for VP Cornerstone Growth Portfolio (Unaudited)
At a meeting held on September 24-25, 2012, the Board of MainStay VP Cornerstone Growth Portfolio (previously, the MainStay VP Growth Equity Portfolio) (the “Portfolio”) unanimously approved New York Life Investments’ recommendation to replace New York Life Investment Management LLC’s affiliate, Madison Square Investors LLC (“Madison Square Investors”, the Portfolio’s then-current Subadviser), with Cornerstone Capital Management, a newly formed Delaware limited liability company, as the Portfolio’s proposed new subadviser. Cornerstone Capital Management was a wholly owned subsidiary of Cornerstone Capital Management, Inc., a Minnesota corporation (“Cornerstone Inc.”), an investment adviser that had been providing investment advisory services to institutional and high net worth clients since 1993. Prior to the closing of a Transaction Agreement between Madison Square Investors, New York Life Investments, Cornerstone Capital Management, Cornerstone Inc. and its individual owners (“Transaction Agreement”), Cornerstone Capital Management was expected to be the successor in interest to all of the assets and liabilities of Cornerstone Inc., and subject to the terms and conditions of the Transaction Agreement, Madison Square Investors would initially acquire ownership of approximately 31.55% of the equity interests in, and 50.20% of the voting rights with respect to, Cornerstone Capital Management. Thus, upon completion of the transaction between Madison Square Investors and Cornerstone Capital Management, Cornerstone Capital Management would become a subsidiary of Madison Square Investors, and an affiliate of New York Life Investments. The closing of the transaction was expected to occur in January 2013, and was subject to certain customary approvals and other conditions, including policy holder approval of the Subadvisory Agreement. On future dates, and subject to the terms and conditions of the Transaction Agreement, Madison Square Investors would purchase additional equity interests and voting rights of Cornerstone Capital Management.
In connection with its consideration of New York Life Investments’ recommendation to approve Cornerstone Capital Management as the Portfolio’s subadviser, the members of the Board, including members of its Contracts Committee and Investment Committee, undertook a review of Cornerstone Capital Management’s qualifications to serve as the Portfolio’s subadviser.
In reaching its decision to approve the Subadvisory Agreement, the Board considered information furnished by New York Life Investments and Cornerstone Capital Management. The Board also considered information provided by New York Life Investments and Cornerstone Capital Management on the fees charged to other investment advisory clients (including institutional separate accounts) that follow investment strategies similar to that proposed for the Portfolio, and the rationale for any differences in the Portfolio’s subadvisory fees and the fees charged to those other investment advisory clients. The Board also requested and received responses from Cornerstone Capital
Management to a comprehensive list of questions encompassing a variety of topics prepared on behalf of the Board by independent legal counsel to the Board and its Independent Trustees.
In determining to approve the Subadvisory Agreement, the members of the Board reviewed and evaluated all of this information and factors they believed to be relevant and appropriate in light of legal advice furnished to them by independent legal counsel and through the exercise of their own business judgment. The broad factors considered by the Board are discussed in greater detail below, and included, among other things: (i) the nature, scope, and quality of the services to be provided to the Portfolio by Cornerstone Capital Management; (ii) the investment performance of the Portfolio and the historical investment performance of similar portfolios managed by Cornerstone Inc., the predecessor to Cornerstone Capital Management; (iii) the costs of the services to be provided, and profits to be realized, by Cornerstone Capital Management from its relationship with the Portfolio; (iv) the extent to which economies of scale may be realized as the Portfolio grows, and the extent to which economies of scale may benefit Portfolio investors; and (v) the reasonableness of the Portfolio’s subadvisory fee, particularly as compared to similar funds and accounts managed by Cornerstone Inc. and third-party “peer funds” identified by New York Life Investments based on data from an independent third-party service provider.
While individual members of the Board may have weighed certain factors differently, the Board’s decision to approve the Subadvisory Agreement was based on a consideration of all the information provided to the Board in connection with its review of Cornerstone Capital Management. The Board took note of New York Life Investments’ belief that Cornerstone Capital Management, with its resources and strong historical investment performance track record (through its predecessor, Cornerstone Inc.), was well qualified to serve as the Portfolio’s subadviser. A more detailed discussion of the factors that figured prominently in the Board’s decision to approve the Subadvisory Agreement is provided below.
Nature, Scope and Quality of Services to be Provided by Cornerstone Capital Management
In considering the approval of the Subadvisory Agreement, the Board examined the nature, scope and quality of the services that Cornerstone Capital Management proposed to provide to the Portfolio. The Board evaluated Cornerstone Inc.’s experience in serving as manager of other similar portfolios. It examined Cornerstone Inc.’s experience in providing investment advisory services, the experience of investment advisory, senior management and administrative personnel at Cornerstone Inc., and Cornerstone Inc.’s overall legal and compliance environment, taking into consideration the fact that Cornerstone Capital Management essentially would be the continuation of Cornerstone
| | | | |
| mainstayinvestments.com | | | M-511 | |
II. Board Consideration and Approval of Subadvisory Agreement
for VP Cornerstone Growth Portfolio (Unaudited) (continued)
Inc. in a different corporate form. The Board also reviewed Cornerstone Capital Management’s willingness to invest in personnel that was expected to benefit the Portfolio. In this regard, the Board took note of the experience of the Portfolio’s proposed portfolio manager, the number of accounts managed by the portfolio manager and Cornerstone Inc.’s method for compensating portfolio managers. The Board also considered the experience of senior personnel at Cornerstone Inc., who would also be senior personnel of Cornerstone Capital Management, as well as Cornerstone Inc.’s reputation and financial condition. The Board further observed that Cornerstone Inc. had approximately $2.7 billion in equity assets under management as of August 31, 2012.
Additionally, the Board considered that Madison Square Investors would provide legal, compliance, marketing and other administrative services to Cornerstone Capital Management. Cornerstone Capital Management would pay Madison Square Investors, from its own resources and not from the assets of the Portfolio, an annual administrative fee based on the combined assets of the Portfolio and MainStay Cornerstone Growth Fund.
Based on these considerations, the Board concluded that, within the context of its overall determinations regarding the Subadvisory Agreement, that the Portfolio was likely to benefit from the nature, scope and quality of these services as a result of Cornerstone Capital Management’s experience, personnel, operations and resources.
Investment Performance
In evaluating the Portfolio’s investment performance, the Board considered the Portfolio’s historical investment performance results in light of the Portfolio’s investment objective, strategies and risks, as disclosed in the Portfolio’s prospectus. The Board particularly considered detailed investment reports on the Portfolio’s performance provided to the Board throughout the year by the Investment Consulting Group of New York Life Investments. The Board also considered information provided by New York Life Investments showing the investment performance of the Portfolio as compared to similar mutual funds managed by other investment advisers. The Board compared the Portfolio’s historical investment performance to the investment performance of similar portfolios managed by Cornerstone Inc., as well as the anticipated strength of Cornerstone Capital Management’s resources (including research capabilities) that may result in stronger long-term investment performance for the Portfolio over time.
Based on these considerations, the Board concluded, within the context of its overall determinations regarding the Subadvisory Agreement, that the selection of Cornerstone Capital Management as the subadviser to the Portfolio was likely to benefit the Portfolio’s long-term investment performance.
Costs of the Services to be Provided, and Profits to be Realized, by Cornerstone Capital Management
The Board considered the estimated costs of the services to be provided by Cornerstone Capital Management under the Subadvisory Agreement and the profitability of New York Life Investments and its affiliates, which would include Cornerstone Capital Management at the time of the execution of the Subadvisory Agreement, due to their relationships with the Portfolio. Because Cornerstone Capital Management would be an affiliate of New York Life Investments whose subadvisory fees would be paid directly by New York Life Investments, the Board considered cost and profitability information for New York Life Investments and Cornerstone Capital Management in the aggregate.
In evaluating the costs and profits of New York Life Investments and its affiliates, including Cornerstone Capital Management, the Board considered, among other factors, Cornerstone Capital Management’s investments in personnel, systems, equipment and other resources necessary to manage the Portfolio, and that New York Life Investments would be responsible for paying the subadvisory fees for the Portfolio. The Board acknowledged that Cornerstone Capital Management must be in a position to pay and retain experienced professional personnel to provide services to the Portfolio, and that Cornerstone Capital Management’s ability to maintain a strong financial position was important in order for Cornerstone Capital Management to provide high-quality services to the Portfolio.
In considering the costs and profitability of the Portfolio, the Board also considered certain fall-out benefits that may be realized by Cornerstone Capital Management due to its relationship with the Portfolio. The Board recognized, for example, the benefits to Cornerstone Capital Management from legally permitted “soft-dollar” arrangements by which brokers provide research and other services to Cornerstone Capital Management in exchange for commissions paid by the Portfolio with respect to trades in the Portfolio’s portfolio securities.
The Board took into account the fact that the Portfolio would undergo substantial changes to its principal investment strategies in connection with the appointment of Cornerstone Capital Management as subadviser. The Board noted estimates from New York Life Investments and Cornerstone Capital Management that up to 80% of the holdings of the Portfolio would be sold to align the Portfolio’s holdings with Cornerstone Capital Management’s strategy. The Board considered the fact that the brokerage and other expenses of this transition would be borne by the Portfolio.
After evaluating the information presented to the Board, the Board concluded, within the context of its overall determinations regarding the Subadvisory Agreement, that any profits to be realized by New York Life Investments and its
| | |
| M-512 | | MainStay VP Funds Trust |
affiliates, to include Cornerstone Capital Management, due to their relationships with the Portfolio supported the Board’s decision to approve the Subadvisory Agreement.
Extent to Which Economies of Scale May be Realized as the Portfolio Grows
The Board also considered whether the Portfolio’s expense structure permitted economies of scale to be shared with Portfolio investors. The Board considered the Portfolio’s contractual management and subadvisory fee schedules, and noted that each fee schedule provided for breakpoints at the $500 million and $1 billion assets levels.
Based on this information, the Board concluded, within the context of its overall determinations regarding the Subadvisory Agreement, that the Portfolio’s expense structure appropriately reflected economies of scale for the benefit of Portfolio investors. The Board noted, however, that it would continue to evaluate the reasonableness of the Portfolio’s fee and expense structure as the Portfolio grows over time.
Reasonableness of Subadvisory Fees
The Board evaluated the reasonableness of the fees to be paid under the Subadvisory Agreement. The Board also acknowledged that Cornerstone Capital Management, like Madison Square Investors, would be affiliated with New York
Life Investments. The Board noted that it had separately considered an amendment to the Management Agreement between New York Life Investments and the Portfolio, which would, upon the approval of the shareholders of the Portfolio, increase the management fee of the Portfolio and the revenue received by New York Life Investments and its affiliates, and that it had found the amendment to the Management Agreement, including the increased management fee, to be reasonable. In reaching its conclusion, the Board also considered information provided by Cornerstone Capital Management concerning the fees it charged to other investment advisory clients, including institutional separate accounts and other funds with similar investment objectives as the Portfolio.
After considering all of the factors outlined above, the Board concluded that the Portfolio’s subadvisory fees were within a range that was competitive and that, within the context of the Board’s overall conclusions regarding the Subadvisory Agreement, supported the conclusion that these fees were reasonable.
Conclusion
On the basis of the information provided to it and its evaluation thereof, the Board unanimously voted to approve the Subadvisory Agreement.
| | | | |
| mainstayinvestments.com | | | M-513 | |
Proxy Voting Policies and Procedures
A description of the policies and procedures that New York Life Investments uses to vote proxies related to the Portfolios’ securities is available without charge, upon request, (i) by calling 800-598-2019 and (ii) on the Securities and Exchange Commission’s (“SEC”) website at www.sec.gov.
The Fund is required to file with the SEC the proxy voting records for each Portfolio for the 12-month period ending June 30 on Form N-PX. The most recent Form N-PX or relevant Portfolio proxy voting record is available free of charge upon request by calling 800-598-2019 or on the SEC’s website at www.sec.gov.
Portfolio Holdings Disclosure
Each Portfolio is required to file its complete schedule of portfolio holdings with the SEC for its first and third fiscal quarters on Form N-Q. In addition, the Cash Management Portfolio is required to file its complete schedule of portfolio holdings every month on Form N-MFP and also makes available its complete schedule of portfolio holdings on its website at www.nylim.com, five days after each month-end. The Portfolios’ Form N-Q is available without charge on the SEC’s website at www.sec.gov or by calling New York Life Investments at 800-598-2019. Form N-MFP is made available to the public by the SEC 60 days after the month to which the information pertains, and a link to each of the most recent 12 months of filings on Form N-MFP is provided on the Portfolios’ website. You can also obtain and review copies of Forms N-Q and N-MFP by visiting the SEC’s Public Reference Room in Washington, DC (information on the operation of the Public Reference Room may be obtained by calling 1-800-SEC-0330).
| | |
| M-514 | | MainStay VP Funds Trust |
Board Members and Officers (Unaudited)
The Board Members oversee the MainStay Group of Funds (which is comprised of Funds that are series of The MainStay Funds, MainStay Funds Trust and MainStay VP Funds Trust, and Private Advisors Alternative Strategies Master Fund, Private Advisors Alternative Strategies Fund, and MainStay Defined Term Municipal Opportunities Fund) (collectively, the “Fund Complex”), the Manager and, when applicable, the Subadvisor(s) and other service providers to the Fund Complex. Each Board Member of MainStay VP Funds Trust serves until his or her successor is elected and qualified or until his or her resignation, death or removal. The Retirement Policy provides that a Board Member shall tender his
or her resignation by the end of the calendar year during which he or she reaches the age of 75.
Officers serve a term of one year and are elected annually by the Board Members. The business address of each Board Member and officer listed below is 51 Madison Avenue, New York, New York 10010.
The Statement of Additional Information applicable to the Fund includes additional information about the Board Members and is available without charge, upon request, by calling 800-MAINSTAY (624-6782) or by going online to mainstayinvestments.com.
| | | | | | | | | | | | |
| | | | | Name and Date of Birth | | Term of office,
Position(s) Held and
Length of Service | | Principal Occupation(s) During Past Five Years | | Number of
Portfolios in
Fund Complex
Overseen by
Board Member | | Other Directorships Held by Board Member |
Interested Board Members | | | | John Y. Kim* 9/24/60 | | Indefinite; MainStay VP Funds Trust: Trustee since 2008** | | Vice Chairman (since January 2014), Chief Investment Officer (since 2011), New York Life Insurance Company; President, Investments Group—New York Life Insurance Company (since 2012); Chairman of the Board of Managers and Chief Executive Officer, New York Life Investment Management Holdings LLC (since 2008); Chairman of the Board of Managers (since 2008) and Chief Executive Officer (2008 to 2013), New York Life Investment Management LLC; Member of the Board, MCF Capital Management (since 2012), Private Advisors, L.L.C. (since 2012); MacKay Shields LLC and Madison Capital Funding LLC (since 2008); and Member of the Board of Managers, McMorgan and Company LLC and GoldPoint Partners (fka NYLCAP Manager LLC) (2008-2012) | | 79 | | MainStay Funds: Trustee since 2008 (12 Funds); MainStay Funds Trust: Trustee since 2008 (35 Funds)***; Private Advisors Alternative Strategies Master Fund: Trustee since 2011; Private Advisors Alternative Strategies Fund: Trustee since 2011; and MainStay DefinedTerm Municipal Opportunities Fund: Trustee since 2011. |
| | | | |
| mainstayinvestments.com | | | M-515 | |
| | | | | | | | | | | | |
| | | | | Name and Date of Birth | | Term of office,
Position(s) Held and
Length of Service | | Principal Occupation(s) During Past Five Years | | Number of
Portfolios in
Fund Complex
Overseen by
Board Member | | Other Directorships Held by Board Member |
Non-Interested Board Members | | | | Susan B. Kerley 8/12/51 | | Indefinite; MainStay VP Funds Trust: Trustee since 2007** | | President, Strategic Management Advisors LLC (since 1990) | | 79 | | MainStay Funds: Trustee since 2007 (12 Funds); MainStay Funds Trust: Trustee since 1990 (35 Funds)***; Private Advisors Alternative Strategies Master Fund: Trustee since 2011; Private Advisors Alternative Strategies Fund: Trustee since 2011; MainStay DefinedTerm Municipal Opportunities Fund: Trustee since 2011; and Legg Mason Partners Funds: Trustee since 1991 (53 portfolios). |
| | | | Alan R. Latshaw 3/27/51 | | Indefinite; MainStay VP Funds Trust: Trustee and Audit Committee Financial Expert since 2007** | | Retired; Partner, Ernst & Young LLP (2002 to 2003); Partner, Arthur Andersen LLP (1989 to 2002); Consultant to the MainStay Funds Audit and Compliance Committee (2004 to 2006) | | 79 | | MainStay Funds: Trustee and Audit Committee Financial Expert since 2006 (12 Funds); MainStay Funds Trust: Trustee and Audit Committee Financial Expert since 2007 (35 Funds)***; Private Advisors Alternative Strategies Master Fund: Trustee and Audit Committee Financial Expert since 2011; Private Advisors Alternative Strategies Fund: Trustee and Audit Committee Financial Expert since 2011; MainStay DefinedTerm Municipal Opportunities Fund: Trustee and Audit Committee Financial Expert since 2011; State Farm Associates Funds Trusts: Trustee since 2005 (4 portfolios); State Farm Mutual Fund Trust: Trustee since 2005 (15 portfolios); and State Farm Variable Product Trust: Trustee since 2005 (9 portfolios). |
| | |
| M-516 | | MainStay VP Funds Trust |
| | | | | | | | | | | | |
| | | | | Name and Date of Birth | | Term of office,
Position(s) Held and
Length of Service | | Principal Occupation(s) During Past Five Years | | Number of
Portfolios in
Fund Complex
Overseen by
Board Member | | Other Directorships Held by Board Member |
| Non-Interested Board Members | | | | Peter Meenan 12/5/41 | | Indefinite; MainStay VP Funds Trust: Chairman since 2013 and Trustee since 2007** | | Retired; Independent Consultant (2004 to 2013); President and Chief Executive Officer, Babson—United, Inc. (financial services firm) (2000 to 2004); Independent Consultant (1999 to 2000); Head of Global Funds, Citicorp (1995 to 1999) | | 79 | | MainStay Funds: Chairman since 2013 and Trustee since 2007 (12 Funds); MainStay Funds Trust: Chairman since 2013 and Trustee since 2002 (35 Funds)***; Private Advisors Alternative Strategies Master Fund: Chairman since 2013 and Trustee since 2011; Private Advisors Alternative Strategies Fund: Chairman since 2013 and Trustee since 2011; and MainStay DefinedTerm Municipal Opportunities Fund: Chairman since 2013 and Trustee since 2011. |
| | | | Richard H. Nolan, Jr. 11/16/46 | | Indefinite; MainStay VP Funds Trust: Trustee since 2006** | | Managing Director, ICC Capital Management; President—Shields/Alliance, Alliance Capital Management (1994 to 2004) | | 79 | | MainStay Funds: Trustee since 2007 (12 Funds); MainStay Funds Trust: Trustee since 2007 (35 Funds)***; Private Advisors Alternative Strategies Master Fund: Trustee since 2011; Private Advisors Alternative Strategies Fund: Trustee since 2011; and MainStay DefinedTerm Municipal Opportunities Fund: Trustee since 2011. |
| | | | Richard S. Trutanic 2/13/52 | | Indefinite; MainStay VP Funds Trust: Trustee since 2007** | | Chairman and Chief Executive Officer, Somerset & Company (financial advisory firm) (since 2004); Managing Director, The Carlyle Group (private investment firm) (2002 to 2004); Senior Managing Director, Partner and Board Member, Groupe Arnault S.A. (private investment firm) (1999 to 2002) | | 79 | | MainStay Funds: Trustee since 1994 (12 Funds); MainStay Funds Trust: Trustee since 2007 (35 Funds)***; Private Advisors Alternative Strategies Master Fund: Trustee since 2011; Private Advisors Alternative Strategies Fund: Trustee since 2011; and MainStay DefinedTerm Municipal Opportunities Fund: Trustee since 2011. |
| | | | |
| mainstayinvestments.com | | | M-517 | |
| | | | | | | | | | | | |
| | | | | Name and Date of Birth | | Term of office,
Position(s) Held and
Length of Service | | Principal Occupation(s) During Past Five Years | | Number of
Portfolios in
Fund Complex
Overseen by
Board Member | | Other Directorships Held by Board Member |
Non-Interested Board Members | | | | Roman L. Weil 5/22/40 | | Indefinite; MainStay VP Funds Trust: Trustee and Audit Committee Financial Expert since 1994** | | Visiting Professor, University of California—San Diego (since 2012); President, Roman L. Weil Associates, Inc. (consulting firm) (since 1981); Visiting Professor, Johns Hopkins University (2013); Visiting Professor, Southern Methodist University (2011); Visiting Professor, NYU Stern School of Business, New York University (2011); V. Duane Rath Professor Emeritus of Accounting, Chicago Booth School Business, University of Chicago (since 2008) | | 79 | | MainStay Funds: Trustee and Audit Committee Financial Expert since 2007 (12 Funds); MainStay Funds Trust: Trustee and Audit Committee Financial Expert since 2007 (35 Funds)***; Private Advisors Alternative Strategies Master Fund: Trustee and Audit Committee Financial Expert since 2011; Private Advisors Alternative Strategies Fund: Trustee and Audit Committee Financial Expert since 2011; and MainStay DefinedTerm Municipal Opportunities Fund: Trustee and Audit Committee Financial Expert since 2011. |
| | | | John A. Weisser 10/22/41 | | Indefinite; MainStay VP Funds Trust: Trustee since 1997** | | Retired; Managing Director of Salomon Brothers, Inc. (1971 to 1995) | | 79 | | MainStay Funds: Trustee since 2007 (12 Funds); MainStay Funds Trust: Trustee since 2007 (35 Funds)***; Private Advisors Alternative Strategies Master Fund: Trustee since 2011; Private Advisors Alternative Strategies Fund: Trustee since 2011; MainStay DefinedTerm Municipal Opportunities Fund: Trustee since 2011; Direxion Insurance Trust: Trustee since 2007 (1 portfolio); Direxion Funds: Trustee since 2007 (18 portfolios); and Direxion Shares ETF Trust: Trustee since 2008 (52 portfolios). |
| | * | This Board Member is considered to be an “interested person” of the MainStay Group of Funds within the meaning of the 1940 Act because of his affiliation with New York Life Insurance Company, New York Life Investment Management LLC, Cornerstone Capital Management Holdings LLC, Cornerstone Capital Management LLC, MacKay Shields LLC, Institutional Capital LLC, NYLIFE Securities LLC and/or NYLIFE Distributors LLC, as described in detail above in the column entitled “Principal Occupation(s) During the Past Five Years.” |
| | ** | Includes prior service as a Director of MainStay VP Series Fund, Inc., the predecessor to MainStay VP Funds Trust. |
| | *** | Includes prior service as a Director/Trustee of certain predecessor entities to MainStay Funds Trust. |
| | |
| M-518 | | MainStay VP Funds Trust |
The following individuals have been appointed by the Board Members to serve as Officers of the MainStay Group of Funds.*
| | | | | | | | |
| | | | | Name and
Date of Birth | | Position(s) Held and
Length of Service | | Principal Occupation(s) During Past Five Years |
Officers | | | | Stephen P. Fisher 2/22/59 | | President, MainStay VP Funds Trust (since 2007)** | | Chairman and Chief Executive Officer (since January 2014), President and Chief Operating Officer (2008 to 2013), NYLIFE Distributors LLC, Senior Managing Director (since 2012) and Chairman of the Board (since 2008), NYLIM Service Company LLC; Senior Managing Director (since 2005) and Co-President (since 2014), New York Life Investment Management LLC; President, MainStay Funds (since 2007), MainStay Funds Trust (since 2009), Private Advisors Alternative Strategies Master Fund, Private Advisors Alternative Strategies Fund and MainStay DefinedTerm Municipal Opportunities Fund (since 2011) |
| | | | Jack R. Benintende 5/12/64 | | Treasurer and Principal Financial and Accounting Officer, MainStay VP Funds Trust (since 2007)** | | Managing Director, New York Life Investment Management LLC, (since 2007); Treasurer and Principal Financial and Accounting Officer, MainStay Funds (since 2007), MainStay Funds Trust (since 2009), Private Advisors Alternative Strategies Master Fund, Private Advisors Alternative Strategies Fund and MainStay DefinedTerm Municipal Opportunities Fund (since 2011) and Assistant Treasurer, New York Life Investment Management Holdings LLC (since 2008) |
| | | | Jeffrey A. Engelsman 9/28/67 | | Vice President and Chief Compliance Officer, MainStay VP Funds Trust (since 2009)** | | Managing Director, Compliance, New York Life Investment Management LLC (since 2009); Vice President and Chief Compliance Officer, MainStay Funds and MainStay Funds Trust (since 2009), Private Advisors Alternative Strategies Master Fund, Private Advisors Alternative Strategies Fund and MainStay DefinedTerm Municipal Opportunities Fund (since 2011) |
| | | | J. Kevin Gao 10/13/67 | | Secretary and Chief Legal Officer, MainStay VP Funds Trust (since 2010)** | | Managing Director and Associate General Counsel, New York Life Investment Management LLC (since 2010); Secretary and Chief Legal Officer, MainStay Funds and MainStay Funds Trust (since 2010), Private Advisors Alternative Strategies Master Fund, Private Advisors Alternative Strategies Fund and MainStay DefinedTerm Municipal Opportunities Fund (since 2011); Director and Counsel, Credit Suisse; Chief Legal Officer and Secretary, Credit Suisse Asset Management LLC and Credit Suisse Funds (2003 to 2010) |
| | | | Scott T. Harrington 2/8/59 | | Vice President — Administration, MainStay VP Funds Trust (since 2005)** | | Director, New York Life Investment Management LLC (including predecessor advisory organizations) (since 2000); Member of the Board of Directors, New York Life Trust Company (since 2009); Vice President—Administration, MainStay Funds (since 2005), MainStay Funds Trust (since 2009), Private Advisors Alternative Strategies Master Fund, Private Advisors Alternative Strategies Fund and MainStay DefinedTerm Municipal Opportunities Fund (since 2011) |
| | * | The Officers listed above are considered to be “interested persons” of the MainStay Group of Funds within the meaning of the 1940 Act because of their affiliation with the MainStay Group of Funds, New York Life Insurance Company, New York Life Investment Management LLC, New York Life Insurance Company, New York Life Investment Management LLC, NYLIFE Securities LLC and/or NYLIFE Distributors LLC, as described in detail in the column captioned “Principal Occupation(s) During Past Five Years.” Officers are elected annually by the Board to serve a one year term. |
| | ** | Includes prior service as an Officer of MainStay VP Series Fund, Inc., the predecessor to MainStay VP Funds Trust. |
| | | | |
| mainstayinvestments.com | | | M-519 | |
This page intentionally left blank
This page intentionally left blank
This page intentionally left blank
MainStay VP Portfolios
MainStay VP offers a wide range of Portfolios. The full array of MainStay VP offerings is listed here, with information about the manager, subadvisors, legal counsel, and independent registered public accounting firm.
Equity Portfolios
MainStay VP Common Stock Portfolio
MainStay VP Cornerstone Growth Portfolio
MainStay VP DFA / DuPont Capital Emerging Markets Equity Portfolio
MainStay VP Eagle Small Cap Growth Portfolio
MainStay VP ICAP Select Equity Portfolio
MainStay VP International Equity Portfolio
MainStay VP Large Cap Growth Portfolio
MainStay VP Mid Cap Core Portfolio
MainStay VP S&P 500 Index Portfolio
MainStay VP U.S. Small Cap Portfolio
MainStay VP Van Eck Global Hard Assets Portfolio
Mixed Asset Portfolios
MainStay VP Balanced Portfolio
MainStay VP Convertible Portfolio
MainStay VP Income Builder Portfolio
MainStay VP Janus Balanced Portfolio
MainStay VP Marketfield Portfolio
MainStay VP MFS® Utilities Portfolio
MainStay VP T. Rowe Price Equity Income Portfolio
Income Portfolios
MainStay VP Bond Portfolio
MainStay VP Floating Rate Portfolio
MainStay VP Government Portfolio
MainStay VP High Yield Corporate Bond Portfolio
MainStay VP PIMCO Real Return Portfolio
MainStay VP Unconstrained Bond Portfolio
Money Market
MainStay VP Cash Management Portfolio
Asset Allocation Portfolios
MainStay VP Conservative Allocation Portfolio
MainStay VP Growth Allocation Portfolio
MainStay VP Moderate Allocation Portfolio
MainStay VP Moderate Growth Allocation Portfolio
Manager
New York Life Investment Management LLC
New York, New York
Subadvisors
Cornerstone Capital Management Holdings LLC*
New York, New York
Cornerstone Capital Management LLC*
Bloomington, Minnesota
Dimensional Fund Advisors LP
Austin, Texas
DuPont Capital Management Corporation
Wilmington, Delaware
Eagle Asset Management, Inc.
St Petersburg, Florida
Epoch Investment Partners, Inc.
New York, New York
Institutional Capital LLC*
Chicago, Illinois
Janus Capital Management LLC
Denver, Colorado
MacKay Shields LLC*
New York, New York
Marketfield Asset Management LLC
New York, New York
Massachusetts Financial Services Company
Boston, Massachusetts
Pacific Investment Management Company LLC
Newport Beach, California
T. Rowe Price Associates, Inc
Baltimore, Maryland
Van Eck Associates Corporation
New York, New York
Winslow Capital Management, Inc.
Minneapolis, Minnesota
Distributor
NYLIFE Distributors LLC*
Parsippany, New Jersey
Custodian
State Street Bank and Trust Company
Boston, Massachusetts
Independent Registered Public Accounting Firm
PricewaterhouseCoopers LLP
Legal Counsel
Dechert LLP
Some Portfolios may not be available in all products.
* An affiliate of New York Life Investment Management LLC
Not part of the Annual Report
mainstayinvestments.com
NYLIFE Distributors LLC, 169 Lackawanna Avenue, Parsippany, New Jersey 07054
This report may be distributed only when preceded or accompanied by a current Fund prospectus.
New York Life Investment Management LLC is the investment manager to the MainStay VP Funds Trust
© 2013 by NYLIFE Distributors LLC. All rights reserved.
You may obtain copies of the Prospectus and the Statement of Additional Information free of charge, upon request, by calling toll-free 800-598-2019 or writing to New York Life Insurance and Annuity Corporation, 51 Madison Avenue, New York, NY 10010.
| | | | |
| Not FDIC Insured. | | No Bank Guarantee. | | May Lose Value. |
| | | | | | |
 NYLIM-32933 NYLIM-32933 | | | | | MSVP11-02/14 | |
As of the end of the period covered by this report, the Registrant has adopted a code of ethics (the “Code”) that applies to the Registrant’s principal executive officer (“PEO”) and principal financial officer (“PFO”). A copy of the Code is filed herewith. The Registrant did not grant any waivers, including implicit waivers, from any provisions of the Code to the PEO or PFO during the period covered by this report.
| Item 3. | Audit Committee Financial Expert. |
The Board of Trustees has determined that the Registrant has two audit committee financial experts serving on its Audit Committee. The Audit Committee financial experts are Alan R. Latshaw and Roman L. Weil. Messrs. Latshaw and Weil are “independent” within the meaning of that term under the Investment Company Act of 1940.
| Item 4. | Principal Accountant Fees and Services. |
(a) Audit Fees
The aggregate fees billed for the fiscal year ended December 31, 2013 for professional services rendered by PricewaterhouseCoopers LLP (“PwC”) for the audit of the Registrant’s annual financial statements or services that are normally provided by PwC in connection with statutory and regulatory filings or engagements for that fiscal year were $1,213,800.
The aggregate fees billed for the fiscal year ended December 31, 2012 for professional services rendered by PwC for the audit of the Registrant’s annual financial statements or services that are normally provided by PwC in connection with statutory and regulatory filings or engagements for that fiscal year were $1,131,765.
The aggregate fees billed for assurance and related services by PwC that are reasonably related to the performance of the audit of the Registrant’s financial statements and are not reported under paragraph (a) of this Item were: (i) $0 for the fiscal year ended December 31, 2013, and (ii) $0 for the fiscal year ended December 31, 2012. These audit-related services include review of financial highlights for Registrant’s registration statements and issuance of consents to use the auditor’s reports.
The aggregate fees billed for professional services rendered by PwC for tax compliance, tax advice, and tax planning were: (i) $191,440 during the fiscal year ended December 31, 2013, and (ii) $127,700 during the fiscal year ended December 31, 2012. These services primarily included preparation of federal, state and local income tax returns and excise tax returns, as well as services relating to excise tax distribution requirements.
(d) All Other Fees
The aggregate fees billed for products and services provided by PwC, other than the services reported in paragraphs (a) through (c) of this Item were: (i) $0 during the fiscal year ended December 31, 2013, and (ii) $0 during the fiscal year ended December 31, 2012.
(e) Pre-Approval Policies and Procedures
| | (1) | The Registrant’s Audit Committee has adopted pre-approval policies and procedures (the “Procedures”) to govern the Committee’s pre-approval of (i) all audit services and permissible non-audit services to be provided to the Registrant by its independent accountant, and (ii) all permissible non-audit services to be provided by such independent accountant to the Registrant’s investment adviser and to any entity controlling, controlled by or under common control with the investment adviser that provides ongoing services to the Registrant (collectively, the “Service Affiliates”) if the services directly relate to the Registrant’s operations and financial reporting. In accordance with the Procedures, the Audit Committee is responsible for the engagement of the independent accountant to certify the Registrant’s financial statements for each fiscal year. With respect to the pre-approval of non-audit services provided to the Registrant and its Service Affiliates, the Procedures provide that the Audit Committee may annually pre-approve a list of the types of services that may be provided to the Registrant or its Service Affiliates, or the Audit Committee may pre-approve such services on a project-by-project basis as they arise. Unless a type of service has received general pre-approval, it will require specific pre-approval by the Audit Committee if it is to be provided by the independent accountant. The Procedures also permit the Audit Committee to delegate authority to one or more of its members to pre-approve any proposed non-audit services that have not been previously pre-approved by the Audit Committee, subject to the ratification by the full Audit Committee no later than its next scheduled meeting. To date, the Audit Committee has not delegated such authority. |
| | (2) | With respect to the services described in paragraphs (b) through (d) of this Item 4, no amount was approved by the Audit Committee pursuant to paragraph (c)(7)(i)(C) of Rule 2-01 of Regulation S-X. |
(f) Less than fifty percent of PwC’s engagement to audit the Registrant’s financial statements for the most recent fiscal year was attributable to work performed by persons other than PwC’s full-time, permanent employees.
(g) All non-audit fees billed by PwC for services rendered to the Registrant for the fiscal years ended December 31, 2013 and December 31, 2012 are disclosed in 4(b)-(d) above.
The aggregate non-audit fees billed by PwC for services rendered to the Registrant’s investment adviser (not including any sub-adviser whose role is primarily portfolio management and is subcontracted with or overseen by another investment adviser), and any entity controlling, controlled by, or under common control with the adviser that provides ongoing services to the Registrant were approximately: (i) $2,700,000 for the fiscal year ended December 31, 2013, and (ii) $2,608,827 for the fiscal year ended December 31, 2012.
(h) [The Registrant’s Audit Committee has determined that the non-audit services rendered by PwC for the fiscal year ended December 31, 2013 to the Registrant’s investment adviser and any entity controlling,
controlled by, or under common control with the Registrant’s investment adviser that provides ongoing services to the Registrant that were not required to be pre-approved by the Audit Committee because they did not relate directly to the operations and financial reporting of the registrant were compatible with maintaining the respective independence of PwC during the relevant time period.]
| Item 5. | Audit Committee of Listed Registrants |
Not applicable.
| Item 6. | Schedule of Investments |
The Schedule of Investments is included as part of Item 1 of this report.
| Item 7. | Disclosure of Proxy Voting Policies and Procedures for Closed-End Management Investment Companies. |
Not applicable.
| Item 8. | Portfolio Managers of Closed-End Management Investment Companies. |
Not applicable.
| Item 9. | Purchases of Equity Securities by Closed-End Management Investment Company and Affiliated Purchasers. |
Not Applicable.
| Item 10. | Submission of Matters to a Vote of Security Holders. |
Since the Registrant’s last response to this Item, there have been no material changes to the procedures by which shareholders may recommend nominees to the Registrant’s Board of Directors.
| Item 11. | Controls and Procedures. |
(a) Based on an evaluation of the Registrant’s Disclosure Controls and Procedures (as defined in Rule 30a-3(c) under the Investment Company Act of 1940) (the “Disclosure Controls”), as of a date within 90 days prior to the filing date (the “Filing Date”) of this Form N-CSR (the “Report”), the Registrant’s principal executive officer and principal financial officer have concluded that the Disclosure Controls are reasonably designed to ensure that information required to be disclosed by the Registrant in the Report is recorded, processed, summarized and reported by the Filing Date, including ensuring that information required to be disclosed in the Report is accumulated and communicated to the Registrant’s management, including the Registrant’s principal executive officer and principal financial officer, as appropriate to allow timely decisions regarding required disclosure.
(b) There were no changes in the Registrant’s internal control over financial reporting (as defined in Rule 30a-3(d)) under the Investment Company Act of 1940 that occurred during the second fiscal quarter of the period covered by this report that has materially affected, or is reasonably likely to materially affect, the Registrant’s internal control over financial reporting.
| | |
| |
| (a)(1) | | Code of Ethics |
|
(a)(2) Certifications of principal executive officer and principal financial officer as required by Rule 30a-2 under the Investment Company Act of 1940. |
| |
| (b) | | Certifications of principal executive officer and principal financial officer as required by Section 906 of the Sarbanes-Oxley Act of 2002. |
SIGNATURES
Pursuant to the requirements of the Securities Exchange Act of 1934 and the Investment Company Act of 1940, the Registrant has duly caused this Report to be signed on its behalf by the undersigned, thereunto duly authorized.
MAINSTAY VP FUNDS TRUST
| | |
| By: | | /s/ Stephen P. Fisher |
| | Stephen P. Fisher |
| | President and Principal Executive Officer |
| |
| Date: | | March 10, 2014 |
Pursuant to the requirements of the Securities Exchange Act of 1934 and the Investment Company Act of 1940, this Report has been signed below by the following persons on behalf of the Registrant and in the capacities and on the dates indicated.
| | |
| |
| By: | | /s/ Stephen P. Fisher |
| | Stephen P. Fisher |
| | President and Principal Executive Officer |
| |
| Date: | | March 10, 2014 |
| |
| By: | | /s/ Jack R. Benintende |
| | Jack R. Benintende |
| | Treasurer and Principal Financial and Accounting Officer |
| |
| Date: | | March 10, 2014 |
EXHIBIT INDEX
| | |
| |
| (a)(1) | | Code of Ethics |
| |
| (a)(2) | | Certifications of principal executive officer and principal financial officer as required by Rule 30a-2 under the Investment Company Act of 1940. |
| |
| (b) | | Certification of principal executive officer and principal financial officer as required by Section 906 of the Sarbanes-Oxley Act of 2002. |