UNITED STATES
SECURITIES AND EXCHANGE COMMISSION
Washington, D.C. 20549
Form N-CSR
CERTIFIED SHAREHOLDER REPORT OF REGISTERED MANAGEMENT
INVESTMENT COMPANIES
Investment Company Act File Number 811-03833
MAINSTAY VP FUNDS TRUST
(Exact name of Registrant as specified in charter)
51 Madison Avenue, New York, NY 10010
(Address of principal executive offices) (Zip code)
J. Kevin Gao, Esq.
30 Hudson Street
Jersey City, New Jersey 07302
(Name and address of agent for service)
Registrant’s telephone number, including area code: (212) 576-7000
Date of fiscal year end: December 31
Date of reporting period: December 31, 2022
FORM N-CSR
Item 1. Reports to Stockholders.
MainStay VP Wellington U.S. Equity Portfolio
Message from the President and Annual Report
December 31, 2022
Sign up for e-delivery of your shareholder reports. For full details on e-delivery, including who can participate and what you can receive via e-delivery,
please log in to newyorklifeinvestments.com/accounts.
| Not FDIC/NCUA Insured | Not a Deposit | May Lose Value | No Bank Guarantee | Not Insured by Any Government Agency |
This page intentionally left blank
Message from the President
The 12-month reporting period ended December 31, 2022, proved exceptionally challenging for investors as both stock and bond markets suffered steep declines. A variety of economic and geopolitical forces drove the market’s losses, all centered around rising inflation and monetary efforts to rein it in.
Inflationary alarms began to sound well before the reporting period began. In late 2021, after nearly two years of accommodative policies designed to encourage economic growth in the face of the COVID-19 pandemic, the U.S. Federal Reserve (the “Fed”) warned of the increasing need to tighten monetary policy. Nevertheless, the pace and persistence of inflation in early 2022 caught most market participants—the Fed included—off guard. Russia’s invasion of Ukraine in February exacerbated global inflationary pressures while increasing investor uncertainty. Domestic supply shortages, international trade imbalances and rising inflation caused U.S. GDP (gross domestic product) to contract in the first and second quarters of the year, although employment and consumer spending proved resilient. Prices for petroleum surged to multi-year highs, while many key agricultural chemicals and industrial metals soared as well. Accelerating inflationary forces prompted the Fed to implement its most aggressive series of interest rate hikes since the 1980s, with a 0.25% increase in March followed by six further rate increases totaling 4.25%. International central banks generally followed suit and raised rates by varying degrees in efforts to curb local inflation, although most increases remained significantly more modest than those in the United States. Relatively high U.S. interest rates and an international risk averse sentiment pushed U.S. dollar values higher compared to most other currencies, with negative impacts on global prices for food, fuel and other key U.S.-dollar-denominated products.
The effects of these interrelated challenges were felt throughout U.S. and international financial markets. The S&P 500® Index, a widely regarded benchmark of market performance, declined by more than 18% during the reporting period. Although the energy sector generated strong gains, bolstered by elevated oil and gas prices, most other industry segments recorded losses. The more cyclical and growth-oriented sectors of consumer discretionary, information technology and real estate delivered the weakest returns, while the traditionally defensive and value-oriented
consumer staples, utilities and health care sectors outperformed. On average, international developed-country equity markets mildly outperformed their U.S. counterparts, while emerging markets lagged slightly. Fixed-income markets proved unusually volatile, with bond prices trending sharply lower as yields rose along with interest rates. Short-term yields rose faster than long-term yields, producing a yield curve inversion from July through the end of the reporting period as long-term rates remained below short-term rates. While floating-rate instruments, which feature variable interest rates that allow investors to benefit from a rising rate environment, provided a degree of insulation from inflation-driven trends, they were not immune to the market’s widespread declines.
Although, according to the most recent estimates, the annualized inflation rate in the United States has declined from a peak of 9.1% in July 2022 to 6.5% in December, the Fed remains focused on achieving more substantial and lasting reductions, aiming for a target rate of 2%. As a result, further rate hikes and additional market volatility are potential headwinds in the coming months. The question remains as to whether the Fed and other central banks will manage a so-called “soft landing,” curbing inflation while avoiding a persistent economic slowdown. If they prove successful, we believe that the increasingly attractive valuations we have observed in both equity and bond markets should eventually translate into sustainable improvements in the investment environment.
Whatever actions the Fed takes and however financial markets react, as a MainStay VP investor you can depend on us to continue managing our portfolios with the insight, expertise and level of service that have long defined New York Life Investments. Thank you for trusting us to help you meet your investment needs.
Sincerely,
Kirk C. Lehneis
President
The opinions expressed are as of the date of this report and are subject to change. There is no guarantee that any forecast made will come to pass. This material does not constitute investment advice and is not intended as an endorsement of any specific investment. Past performance is no guarantee of future results.
Not part of the Annual Report
Investors should refer to the Portfolio’s Summary Prospectus and/or Prospectus and consider the Portfolio’s investment objectives, strategies, risks, charges and expenses carefully before investing. The Summary Prospectus and/or Prospectus contain this and other information about the Portfolio. You may obtain copies of the Portfolio’s Summary Prospectus, Prospectus and Statement of Additional Information, which includes information about the MainStay VP Funds Trust's Trustees, free of charge, upon request, by calling toll-free 800-598-2019, by writing to New York Life Insurance and Annuity Corporation, 51 Madison Avenue, Room 251, New York, New York 10010 or by sending an email to MainStayShareholdersServices@nylim.com. These documents are also available at newyorklifeinvestments.com/investment-products/vp. Please read the Portfolio's Summary Prospectus and/or Prospectus carefully before investing. MainStay VP Funds Trust portfolios are separate account options which are purchased through a variable insurance or variable annuity contract.
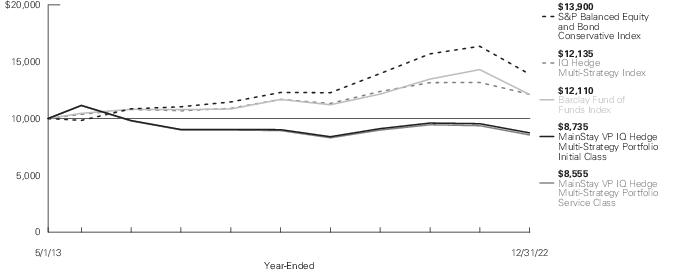
Investment and Performance Comparison (Unaudited)
Performance data quoted represents past performance. Past performance is no guarantee of future results. Because of market volatility and other factors, current performance may be lower or higher than the figures shown. Investment return and principal value will fluctuate, and as a result, when shares are redeemed, they may be worth more or less than their original cost. The performance table and graph do not reflect any deduction of sales charges, mortality and expense charges, contract charges or administrative charges. Please refer to the Performance Summary appropriate for your policy. For performance information current to the most recent month-end, please call 800-598-2019 or visit www.newyorklife.com.
Performance figures may reflect certain fee waivers and/or expense limitations, without which total returns may have been different. For information on current fee waivers and/or expense limitations (if any), please refer to the Notes to Financial Statements.
| Average Annual Total Returns for the Year-Ended December 31, 2022 |
| Class | Inception
Date1, 2 | One
Year | Five
Years | Ten
Years | Gross
Expense
Ratio3 |
| Initial Class Shares | 1/23/1984 | -20.68% | 7.00% | 11.41% | 0.58% |
| Service Class Shares | 6/5/2003 | -20.87 | 6.73 | 11.13 | 0.83 |
| 1. | Effective January 1, 2018, due to an organizational restructuring, all investment personnel of Cornerstone Capital Management Holdings LLC, a former subadvisor, transitioned to MacKay Shields LLC, a former subadvisor. |
| 2. | Effective May 1, 2021, the Portfolio replaced its subadvisor and modified its principal investment strategies. The past performance in the graph and table prior to that date reflects the Portfolio's prior subadvisors and principal investment strategies. |
| 3. | The gross expense ratios presented reflect the Portfolio’s “Total Annual Portfolio Operating Expenses” from the most recent Prospectus and may differ from other expense ratios disclosed in this report. |
| Benchmark Performance* | One
Year | Five
Years | Ten
Years |
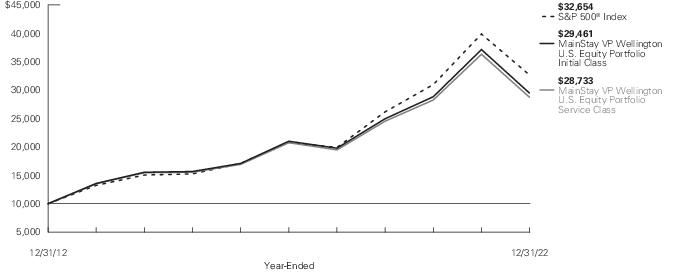
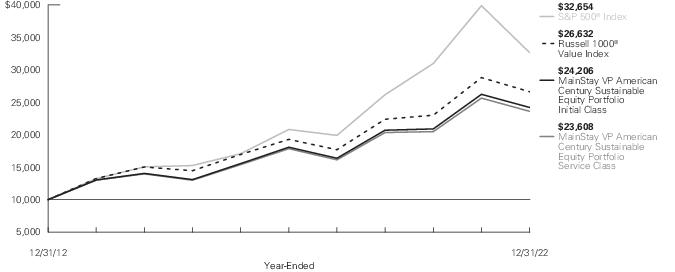
| S&P 500® Index1 | -18.11% | 9.42% | 12.56% |
| Morningstar Large Blend Category Average2 | -16.92 | 7.65 | 10.63 |
| * | Returns for indices reflect no deductions for fees, expenses or taxes, except for foreign withholding taxes where applicable. Results assume reinvestment of all dividends and capital gains. An investment cannot be made directly in an index. |
| 1. | The S&P 500® Index is the Portfolio's primary benchmark. S&P 500® is a trademark of The McGraw-Hill Companies, Inc. The S&P 500® Index is widely regarded as the standard index for measuring large-cap U.S. stock market performance. |
| 2. | The Morningstar Large Blend Category Average is representative of funds that represent the overall U.S. stock market in size, growth rates and price. Stocks in the top 70% of the capitalization of the U.S. equity market are defined as large cap. The blend style is assigned to portfolios where neither growth nor value characteristics predominate. These portfolios tend to invest across the spectrum of U.S. industries, and owing to their broad exposure, the portfolios' returns are often similar to those of the S&P 500® Index. Results are based on average total returns of similar funds with all dividends and capital gain distributions reinvested. |
Cost in Dollars of a $1,000 Investment in MainStay VP Wellington U.S. Equity Portfolio (Unaudited)
The example below is intended to describe the fees and expenses borne by shareholders during the six-month period from July 1, 2022 to December 31, 2022, and the impact of those costs on your investment.
Example
As a shareholder of the Portfolio you incur two types of costs: (1) transaction costs, including exchange fees and sales charges (loads) on purchases (as applicable), and (2) ongoing costs, including management fees, distribution and/or service (12b-1) fees and other Portfolio expenses (as applicable). This example is intended to help you understand your ongoing costs (in dollars) of investing in the Portfolio and to compare these costs with the ongoing costs of investing in other mutual funds. The example is based on an investment of $1,000 made at the beginning of the six-month period and held for the entire period from July 1, 2022 to December 31, 2022. Shares are only sold in connection with variable life and annuity contracts and the example does not reflect any contract level or transactional fees or expenses. If these costs had been included, your costs would have been higher.
This example illustrates your Portfolio’s ongoing costs in two ways:
Actual Expenses
The second and third data columns in the table below provide information about actual account values and actual expenses. You may use the information in these columns, together with the amount you invested, to estimate the expenses that you paid during the six months ended
December 31, 2022. Simply divide your account value by $1,000 (for example, an $8,600 account value divided by $1,000 = 8.6), then multiply the result by the number under the heading entitled “Expenses Paid During Period” to estimate the expenses you paid on your account during this period.
Hypothetical Example for Comparison Purposes
The fourth and fifth data columns in the table below provide information about hypothetical account values and hypothetical expenses based on the Portfolio’s actual expense ratio and an assumed rate of return of 5% per year before expenses, which is not the Portfolio’s actual return. The hypothetical account values and expenses may not be used to estimate the actual ending account balances or expenses you paid for the six-month period shown. You may use this information to compare the ongoing costs of investing in the Portfolio with the ongoing costs of investing in other mutual funds. To do so, compare this 5% hypothetical example with the 5% hypothetical examples that appear in the shareholder reports of the other mutual funds.
Please note that the expenses shown in the table are meant to highlight your ongoing costs only and do not reflect any transactional costs, such as exchange fees or sales charges (loads). Therefore, the fourth and fifth data columns of the table are useful in comparing ongoing costs only and will not help you determine the relative total costs of owning different funds. In addition, if these transactional costs were included, your costs would have been higher.
| Share Class | Beginning
Account
Value
7/1/22 | Ending Account
Value (Based
on Actual
Returns and
Expenses)
12/31/22 | Expenses
Paid
During
Period1 | Ending Account
Value (Based
on Hypothetical
5% Annualized
Return and
Actual Expenses)
12/31/22 | Expenses
Paid
During
Period1 | Net Expense
Ratio
During
Period2 |
| Initial Class Shares | $1,000.00 | $1,010.70 | $2.94 | $1,022.28 | $2.96 | 0.58% |
| Service Class Shares | $1,000.00 | $1,009.50 | $4.20 | $1,021.02 | $4.23 | 0.83% |
| 1. | Expenses are equal to the Portfolio’s annualized expense ratio of each class multiplied by the average account value over the period, divided by 365 and multiplied by 184 (to reflect the six-month period). The table above represents the actual expenses incurred during the six-month period. In addition to the fees and expenses which the Portfolio bears directly, it also indirectly bears a pro rata share of the fees and expenses of the underlying funds in which it invests. Such indirect expenses are not included in the above-reported expense figures. |
| 2. | Expenses are equal to the Portfolio's annualized expense ratio to reflect the six-month period. |
| 6 | MainStay VP Wellington U.S. Equity Portfolio |
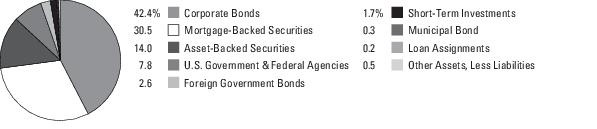
Industry Composition as of December 31, 2022 (Unaudited)
| Software | 8.5% |
| Semiconductors & Semiconductor Equipment | 5.2 |
| Technology Hardware, Storage & Peripherals | 5.2 |
| Interactive Media & Services | 4.7 |
| Pharmaceuticals | 4.2 |
| Banks | 4.1 |
| Oil, Gas & Consumable Fuels | 4.1 |
| Machinery | 3.9 |
| Household Products | 3.7 |
| Biotechnology | 3.5 |
| Health Care Equipment & Supplies | 3.4 |
| IT Services | 3.3 |
| Health Care Providers & Services | 3.2 |
| Internet & Direct Marketing Retail | 3.1 |
| Electric Utilities | 3.1 |
| Beverages | 3.0 |
| Life Sciences Tools & Services | 2.9 |
| Hotels, Restaurants & Leisure | 2.9 |
| Capital Markets | 2.9 |
| Insurance | 2.8% |
| Chemicals | 2.5 |
| Building Products | 2.3 |
| Specialty Retail | 2.0 |
| Equity Real Estate Investment Trusts | 1.9 |
| Electronic Equipment, Instruments & Components | 1.8 |
| Aerospace & Defense | 1.7 |
| Consumer Finance | 1.7 |
| Textiles, Apparel & Luxury Goods | 1.6 |
| Electrical Equipment | 1.4 |
| Entertainment | 1.2 |
| Automobiles | 1.0 |
| Professional Services | 0.9 |
| Communications Equipment | 0.8 |
| Short–Term Investment | 2.6 |
| Other Assets, Less Liabilities | –1.1 |
| | 100.0% |
See Portfolio of Investments beginning on page 10 for specific holdings within these categories. The Portfolio's holdings are subject to change.
Top Ten Holdings and/or Issuers Held as of December 31, 2022 (excluding short-term investments) (Unaudited)
| 1. | Microsoft Corp. |
| 2. | Alphabet, Inc. |
| 3. | Apple, Inc. |
| 4. | UnitedHealth Group, Inc. |
| 5. | Amazon.com, Inc. |
| 6. | JPMorgan Chase & Co. |
| 7. | Procter & Gamble Co. (The) |
| 8. | Eli Lilly and Co. |
| 9. | Pfizer, Inc. |
| 10. | TJX Cos., Inc. (The) |
Portfolio Management Discussion and Analysis (Unaudited)
Answers to the questions reflect the views of portfolio managers Mammen Chally, CFA, Douglas W. McLane, CFA, and David A. Siegle, CFA, of Wellington Management Company LLP (“Wellington”), the Portfolio’s Subadvisor.
How did MainStay VP Wellington U.S. Equity Portfolio perform relative to its benchmark and peers during the 12 months ended December 31, 2022?
For the 12 months ended December 31, 2022, MainStay VP Wellington U.S. Equity Portfolio returned −20.68% for Initial Class shares and −20.87% for Service Class shares. Over the same period, both share classes underperformed the −18.11% return of the S&P 500® Index (“the Index”), which is the Portfolio’s benchmark, and the −16.92% return of the Morningstar Large Blend Category Average.1
What factors affected the Portfolio’s relative performance during the reporting period?
The Portfolio underperformed the Index primarily due to security selection. Sector allocation, a result of Wellington's bottom-up stock selection process, also weighed on results.
Which sectors were the strongest positive contributors to the Portfolio’s relative performance, and which sectors were particularly weak?
Security selection in the consumer discretionary, financials and health care sectors made the strongest positive contributions to the Portfolio’s performance relative to the Index, while selection in communication services, information technology and energy detracted. (Contributions take weightings and total returns into account.) From a sector allocation perspective, an underweight allocation to energy weighed on relative performance although this was marginally offset by the Portfolio’s overweight exposure to health care.
During the reporting period, which individual stocks made the strongest positive contributions to the Portfolio’s absolute performance and which stocks detracted the most?
The strongest contributors to absolute performance were holdings in pharmaceutical company Eli Lilly, oil & gas exploration & production company EOG Resources and biotechnology developer Vertex Pharmaceuticals. Shares of Eli Lilly rose after Eisai and Biogen reported breakthrough trial results for their Alzheimer’s drug. The news bodes well for Eli Lilly’s drug donanemab, which also targets removing the amyloid beta protein to slow Alzheimer’s progression. Eli Lilly is expected to report donanemab’s phase 3 clinical trial results in the second quarter of 2023. Shares also benefited from approval by the U.S. Food and Drug Administration (FDA) for the company's oral lung cancer drug, Retevmo, used for certain adult patients with solid tumors and a specific genetic makeup. EOG shares rose after the company reported strong second-quarter earnings, bolstered by industry-leading operational efficiencies. In addition, EOG maintained fiscal 2022 guidance and declared a special dividend of $1.50 per share.
Shares of Vertex rose following the FDA’s grant of breakthrough therapy designation to the company’s pipeline drug, inaxaplin, for the treatment of APOL1-mediated chronic kidney disease, and the European Medicines Agency designation of the drug as a priority medicine. Vertex also shared strong efficacy data on exagamglogene autotemcel, in development with CRISPR Therapeutics, for transfusion-dependent beta thalassemia, or sickle cell disease.
The most significant detractors from the Portfolio’s absolute performance were holdings in Internet advertising leader and technology conglomerate Alphabet, online retailer Amazon.com, and software and cloud services company Microsoft. Alphabet shares sank after the Google parent company announced that third-quarter 2022 revenue missed consensus estimates. The company's results also showed slowing growth, compared to the prior annual reporting period. Income across all business segments declined, with the exception of unallocated corporate costs. Amazon.com shares ended the reporting period lower after the company reported third-quarter results below consensus estimates in the face of soaring inflation and rising interest rates, in addition to a slowdown in core retail business as customers returned to stores. Management also issued a disappointing fourth-quarter revenue forecast, stating plans to continue implementing cost-cutting measures. Microsoft shares declined after the company reported weaker-than-expected cloud revenue in the fiscal first quarter, despite beating earnings and revenue estimates. Additionally, the company issued second-quarter revenue guidance that fell short of expectations.
Did the Portfolio make any significant purchases or sales during the reporting period?
The Portfolio’s largest purchases were new positions in pharmaceutical company Pfizer and multinational conglomerate Johnson Controls International. The purchase of Pfizer shares reflected our positive view of the company’s many revenue drivers, with a broad portfolio of medicines across therapeutic areas including oncology, cardiovascular/diabetes, neurology and autoimmune. Pfizer has strategically shifted towards science and technology and away from generics, after the sale of its Upjohn business to Mylan, a development we believe should unlock value long-term. The Portfolio initiated its position in Johnson Controls, an HVAC, fire, and security equipment provider for buildings, based on the company's improving organic growth as more buildings are retrofitted for clean air/green certifications. Additionally, the company is expanding margins through self-help initiatives, and trades at an attractive valuation relative to peers.
The largest sales were positions in pharmaceutical company Merck and social networking platform operator Meta Platforms. We swapped the Portfolio’s position in Merck for Pfizer, as Merck revenue growth appeared increasingly dependent on one
| 1. | See page 5 for more information on benchmark and peer group returns. |
| 8 | MainStay VP Wellington U.S. Equity Portfolio |
product–Keytruda–with lackluster development opportunities across other products. We eliminated the position in Meta as founder, Chairman and CEO Mark Zuckerberg’s continued aggressive spending led us to believe he was not committed to increasing shareholder value. The company’s governance challenges, coupled with its unknown spending plans for the Metaverse, led to our decision to eliminate the holding.
How did the Portfolio’s sector weightings change during the reporting period?
The only significant change to the Portfolio’s sector weights during the reporting period was a decrease in communication services exposure.
How was the Portfolio positioned at the end of the reporting period?
As of December 31, 2022, the Portfolio’s largest overweight positions relative to the Index were in the health care and industrials sectors. As of the same date, the Portfolio held its most significantly underweight positions in communication services and energy.
The opinions expressed are those of the portfolio managers as of the date of this report and are subject to change. There is no guarantee that any forecasts will come to pass. This material does not constitute investment advice and is not intended as an endorsement of any specific investment.
Not all MainStay VP Portfolios and/or share classes are available under all policies.
Portfolio of Investments December 31, 2022†
| | Shares | Value |
| Common Stocks 98.5% |
| Aerospace & Defense 1.7% |
| Raytheon Technologies Corp. | 140,278 | $ 14,156,856 |
| Automobiles 1.0% |
| Ford Motor Co. | 565,603 | 6,577,963 |
| Tesla, Inc. (a) | 12,981 | 1,598,999 |
| | | 8,176,962 |
| Banks 4.1% |
| Bank of America Corp. | 430,035 | 14,242,759 |
| JPMorgan Chase & Co. | 149,122 | 19,997,260 |
| | | 34,240,019 |
| Beverages 3.0% |
| Constellation Brands, Inc., Class A | 50,980 | 11,814,615 |
| Monster Beverage Corp. (a) | 133,095 | 13,513,135 |
| | | 25,327,750 |
| Biotechnology 3.5% |
| Regeneron Pharmaceuticals, Inc. (a) | 16,610 | 11,983,949 |
| Seagen, Inc. (a) | 45,782 | 5,883,445 |
| Vertex Pharmaceuticals, Inc. (a) | 39,601 | 11,435,977 |
| | | 29,303,371 |
| Building Products 2.3% |
| Fortune Brands Innovations, Inc. | 115,568 | 6,600,088 |
| Johnson Controls International plc | 197,257 | 12,624,448 |
| | | 19,224,536 |
| Capital Markets 2.9% |
| Charles Schwab Corp. (The) | 118,914 | 9,900,780 |
| Morgan Stanley | 167,523 | 14,242,805 |
| | | 24,143,585 |
| Chemicals 2.5% |
| PPG Industries, Inc. | 78,871 | 9,917,240 |
| Sherwin-Williams Co. (The) | 45,256 | 10,740,606 |
| | | 20,657,846 |
| Communications Equipment 0.8% |
| F5, Inc. (a) | 44,589 | 6,398,967 |
| Consumer Finance 1.7% |
| American Express Co. | 95,480 | 14,107,170 |
| Electric Utilities 3.1% |
| American Electric Power Co., Inc. | 80,040 | 7,599,798 |
| Duke Energy Corp. | 108,932 | 11,218,907 |
| | Shares | Value |
| |
| Electric Utilities (continued) |
| Eversource Energy | 83,892 | $ 7,033,505 |
| | | 25,852,210 |
| Electrical Equipment 1.4% |
| AMETEK, Inc. | 82,465 | 11,522,010 |
| Electronic Equipment, Instruments & Components 1.8% |
| CDW Corp. | 52,629 | 9,398,487 |
| Corning, Inc. | 186,960 | 5,971,502 |
| | | 15,369,989 |
| Entertainment 1.2% |
| Walt Disney Co. (The) (a) | 113,237 | 9,838,031 |
| Equity Real Estate Investment Trusts 1.9% |
| AvalonBay Communities, Inc. | 36,903 | 5,960,573 |
| Prologis, Inc. | 89,743 | 10,116,728 |
| | | 16,077,301 |
| Health Care Equipment & Supplies 3.4% |
| Abbott Laboratories | 93,103 | 10,221,779 |
| Becton Dickinson and Co. | 39,880 | 10,141,484 |
| Hologic, Inc. (a) | 109,783 | 8,212,866 |
| | | 28,576,129 |
| Health Care Providers & Services 3.2% |
| UnitedHealth Group, Inc. | 50,578 | 26,815,444 |
| Hotels, Restaurants & Leisure 2.9% |
| Airbnb, Inc., Class A (a) | 57,819 | 4,943,524 |
| Booking Holdings, Inc. (a) | 3,431 | 6,914,426 |
| McDonald's Corp. | 46,685 | 12,302,898 |
| | | 24,160,848 |
| Household Products 3.7% |
| Colgate-Palmolive Co. | 145,260 | 11,445,036 |
| Procter & Gamble Co. (The) | 128,752 | 19,513,653 |
| | | 30,958,689 |
| Insurance 2.8% |
| Chubb Ltd. | 53,898 | 11,889,899 |
| Progressive Corp. (The) | 88,166 | 11,436,012 |
| | | 23,325,911 |
| Interactive Media & Services 4.7% |
| Alphabet, Inc. (a) | | |
| Class A | 336,748 | 29,711,276 |
| Class C | 101,506 | 9,006,627 |
| | | 38,717,903 |
The notes to the financial statements are an integral part of, and should be read in conjunction with, the financial statements.
| 10 | MainStay VP Wellington U.S. Equity Portfolio |
| | Shares | Value |
| Common Stocks (continued) |
| Internet & Direct Marketing Retail 3.1% |
| Amazon.com, Inc. (a) | 308,284 | $ 25,895,856 |
| IT Services 3.3% |
| Global Payments, Inc. | 53,136 | 5,277,468 |
| GoDaddy, Inc., Class A (a) | 103,528 | 7,745,965 |
| Mastercard, Inc., Class A | 42,550 | 14,795,911 |
| | | 27,819,344 |
| Life Sciences Tools & Services 2.9% |
| Danaher Corp. | 42,341 | 11,238,148 |
| Thermo Fisher Scientific, Inc. | 24,076 | 13,258,413 |
| | | 24,496,561 |
| Machinery 3.9% |
| Deere & Co. | 31,699 | 13,591,263 |
| Illinois Tool Works, Inc. | 45,047 | 9,923,854 |
| Nordson Corp. | 36,337 | 8,638,032 |
| | | 32,153,149 |
| Oil, Gas & Consumable Fuels 4.1% |
| ConocoPhillips | 61,823 | 7,295,114 |
| EOG Resources, Inc. | 104,742 | 13,566,184 |
| Pioneer Natural Resources Co. | 56,433 | 12,888,733 |
| | | 33,750,031 |
| Pharmaceuticals 4.2% |
| Eli Lilly and Co. | 48,249 | 17,651,414 |
| Pfizer, Inc. | 335,604 | 17,196,349 |
| | | 34,847,763 |
| Professional Services 0.9% |
| Leidos Holdings, Inc. | 68,948 | 7,252,640 |
| Semiconductors & Semiconductor Equipment 5.2% |
| Advanced Micro Devices, Inc. (a) | 103,371 | 6,695,340 |
| KLA Corp. | 19,119 | 7,208,437 |
| Marvell Technology, Inc. | 141,407 | 5,237,715 |
| NVIDIA Corp. | 19,446 | 2,841,838 |
| QUALCOMM, Inc. | 76,235 | 8,381,276 |
| | Shares | | Value |
| |
| Semiconductors & Semiconductor Equipment (continued) |
| Texas Instruments, Inc. | 79,897 | | $ 13,200,582 |
| | | | 43,565,188 |
| Software 8.5% |
| Microsoft Corp. | 213,384 | | 51,173,751 |
| Palo Alto Networks, Inc. (a) | 45,657 | | 6,370,978 |
| Salesforce, Inc. (a) | 56,026 | | 7,428,487 |
| Workday, Inc., Class A (a) | 36,213 | | 6,059,521 |
| | | | 71,032,737 |
| Specialty Retail 2.0% |
| TJX Cos., Inc. (The) | 205,576 | | 16,363,850 |
| Technology Hardware, Storage & Peripherals 5.2% |
| Apple, Inc. | 285,337 | | 37,073,836 |
| NetApp, Inc. | 106,675 | | 6,406,901 |
| | | | 43,480,737 |
| Textiles, Apparel & Luxury Goods 1.6% |
| NIKE, Inc., Class B | 116,663 | | 13,650,738 |
Total Common Stocks
(Cost $800,579,186) | | | 821,260,121 |
| Short-Term Investment 2.6% |
| Affiliated Investment Company 2.6% |
| MainStay U.S. Government Liquidity Fund, 3.602% (b) | 21,509,049 | | 21,509,049 |
Total Short-Term Investment
(Cost $21,509,049) | | | 21,509,049 |
Total Investments
(Cost $822,088,235) | 101.1% | | 842,769,170 |
| Other Assets, Less Liabilities | (1.1) | | (9,041,395) |
| Net Assets | 100.0% | | $ 833,727,775 |
| † | Percentages indicated are based on Portfolio net assets. |
| (a) | Non-income producing security. |
| (b) | Current yield as of December 31, 2022. |
The notes to the financial statements are an integral part of, and should be read in conjunction with, the financial statements.
11
Portfolio of Investments December 31, 2022† (continued)
Investments in Affiliates (in 000's)
Investments in issuers considered to be affiliate(s) of the Portfolio during the year ended December 31, 2022 for purposes of Section 2(a)(3) of the Investment Company Act of 1940, as amended, were as follows:
| Affiliated Investment Companies | Value,
Beginning
of Year | Purchases
at Cost | Proceeds
from
Sales | Net
Realized
Gain/(Loss)
on Sales | Change in
Unrealized
Appreciation/
(Depreciation) | Value,
End of
Year | Dividend
Income | Other
Distributions | Shares
End of
Year |
| MainStay U.S. Government Liquidity Fund | $ 8,211 | $ 165,228 | $ (151,930) | $ — | $ — | $ 21,509 | $ 208 | $ — | 21,509 |
The following is a summary of the fair valuations according to the inputs used as of December 31, 2022, for valuing the Portfolio’s assets:
| Description | Quoted
Prices in
Active
Markets for
Identical
Assets
(Level 1) | | Significant
Other
Observable
Inputs
(Level 2) | | Significant
Unobservable
Inputs
(Level 3) | | Total |
| Asset Valuation Inputs | | | | | | | |
| Investments in Securities (a) | | | | | | | |
| Common Stocks | $ 821,260,121 | | $ — | | $ — | | $ 821,260,121 |
| Short-Term Investment | | | | | | | |
| Affiliated Investment Company | 21,509,049 | | — | | — | | 21,509,049 |
| Total Investments in Securities | $ 842,769,170 | | $ — | | $ — | | $ 842,769,170 |
| (a) | For a complete listing of investments and their industries, see the Portfolio of Investments. |
The notes to the financial statements are an integral part of, and should be read in conjunction with, the financial statements.
| 12 | MainStay VP Wellington U.S. Equity Portfolio |
Statement of Assets and Liabilities as of December 31, 2022
| Assets |
Investment in unaffiliated securities, at value
(identified cost $800,579,186) | $821,260,121 |
Investment in affiliated investment companies, at value
(identified cost $21,509,049) | 21,509,049 |
| Receivables: | |
| Dividends | 426,876 |
| Portfolio shares sold | 175,776 |
| Other assets | 4,258 |
| Total assets | 843,376,080 |
| Liabilities |
| Payables: | |
| Investment securities purchased | 8,838,178 |
| Manager (See Note 3) | 389,265 |
| Portfolio shares redeemed | 250,316 |
| Shareholder communication | 84,351 |
| NYLIFE Distributors (See Note 3) | 49,050 |
| Professional fees | 30,530 |
| Custodian | 3,756 |
| Accrued expenses | 2,859 |
| Total liabilities | 9,648,305 |
| Net assets | $833,727,775 |
| Composition of Net Assets |
| Shares of beneficial interest outstanding (par value of $.001 per share) unlimited number of shares authorized | $ 39,315 |
| Additional paid-in-capital | 830,188,187 |
| | 830,227,502 |
| Total distributable earnings (loss) | 3,500,273 |
| Net assets | $833,727,775 |
| Initial Class | |
| Net assets applicable to outstanding shares | $607,322,970 |
| Shares of beneficial interest outstanding | 28,487,674 |
| Net asset value per share outstanding | $ 21.32 |
| Service Class | |
| Net assets applicable to outstanding shares | $226,404,805 |
| Shares of beneficial interest outstanding | 10,827,770 |
| Net asset value per share outstanding | $ 20.91 |
The notes to the financial statements are an integral part of, and should be read in conjunction with, the financial statements.
13
Statement of Operations for the year ended December 31, 2022
| Investment Income (Loss) |
| Income | |
| Dividends-unaffiliated | $ 13,037,700 |
| Dividends-affiliated | 208,076 |
| Securities lending, net | 82 |
| Total income | 13,245,858 |
| Expenses | |
| Manager (See Note 3) | 4,849,373 |
| Distribution/Service—Service Class (See Note 3) | 631,078 |
| Shareholder communication | 119,650 |
| Professional fees | 99,742 |
| Custodian | 22,626 |
| Trustees | 19,702 |
| Miscellaneous | 23,493 |
| Total expenses | 5,765,664 |
| Net investment income (loss) | 7,480,194 |
| Realized and Unrealized Gain (Loss) |
| Net realized gain (loss) on unaffiliated investments | (24,077,250) |
| Net change in unrealized appreciation (depreciation) on unaffiliated investments | (202,149,971) |
| Net realized and unrealized gain (loss) | (226,227,221) |
| Net increase (decrease) in net assets resulting from operations | $(218,747,027) |
The notes to the financial statements are an integral part of, and should be read in conjunction with, the financial statements.
| 14 | MainStay VP Wellington U.S. Equity Portfolio |
Statements of Changes in Net Assets
for the years ended December 31, 2022 and December 31, 2021
| | 2022 | 2021 |
| Increase (Decrease) in Net Assets |
| Operations: | | |
| Net investment income (loss) | $ 7,480,194 | $ 5,115,122 |
| Net realized gain (loss) | (24,077,250) | 172,354,933 |
| Net change in unrealized appreciation (depreciation) | (202,149,971) | 46,742,537 |
| Net increase (decrease) in net assets resulting from operations | (218,747,027) | 224,212,592 |
| Distributions to shareholders: | | |
| Initial Class | (127,232,665) | (35,636,214) |
| Service Class | (48,423,993) | (15,848,167) |
| Total distributions to shareholders | (175,656,658) | (51,484,381) |
| Capital share transactions: | | |
| Net proceeds from sales of shares | 139,698,289 | 193,654,667 |
| Net asset value of shares issued to shareholders in reinvestment of distributions | 175,656,658 | 51,484,381 |
| Cost of shares redeemed | (125,658,917) | (147,245,808) |
| Increase (decrease) in net assets derived from capital share transactions | 189,696,030 | 97,893,240 |
| Net increase (decrease) in net assets | (204,707,655) | 270,621,451 |
| Net Assets |
| Beginning of year | 1,038,435,430 | 767,813,979 |
| End of year | $ 833,727,775 | $1,038,435,430 |
The notes to the financial statements are an integral part of, and should be read in conjunction with, the financial statements.
15
Financial Highlights selected per share data and ratios
| | Year Ended December 31, |
| Initial Class | 2022 | | 2021 | | 2020 | | 2019 | | 2018 |
| Net asset value at beginning of year | $ 34.39 | | $ 28.28 | | $ 26.83 | | $ 25.23 | | $ 29.75 |
| Net investment income (loss) (a) | 0.25 | | 0.21 | | 0.28 | | 0.38 | | 0.42 |
| Net realized and unrealized gain (loss) | (7.58) | | 7.77 | | 3.68 | | 5.74 | | (1.69) |
| Total from investment operations | (7.33) | | 7.98 | | 3.96 | | 6.12 | | (1.27) |
| Less distributions: | | | | | | | | | |
| From net investment income | (0.19) | | (0.29) | | (0.43) | | (0.43) | | (0.49) |
| From net realized gain on investments | (5.55) | | (1.58) | | (2.08) | | (4.09) | | (2.76) |
| Total distributions | (5.74) | | (1.87) | | (2.51) | | (4.52) | | (3.25) |
| Net asset value at end of year | $ 21.32 | | $ 34.39 | | $ 28.28 | | $ 26.83 | | $ 25.23 |
| Total investment return (b) | (20.68)% | | 28.78% | | 15.55% | | 26.21% | | (5.84)% |
| Ratios (to average net assets)/Supplemental Data: | | | | | | | | | |
| Net investment income (loss) | 0.90% | | 0.65% | | 1.09% | | 1.37% | | 1.40% |
| Net expenses (c) | 0.57% | | 0.58% | | 0.58% | | 0.58% | | 0.57% |
| Portfolio turnover rate | 21% | | 26% | | 143% | | 119% | | 125% |
| Net assets at end of year (in 000's) | $ 607,323 | | $ 732,245 | | $ 497,644 | | $ 543,355 | | $ 454,804 |
| (a) | Per share data based on average shares outstanding during the year. |
| (b) | Total return does not reflect any deduction of sales charges, mortality and expense charges, contract charges or administrative charges. For periods of less than one year, total return is not annualized. |
| (c) | In addition to the fees and expenses which the Portfolio bears directly, it also indirectly bears a pro-rata share of the fees and expenses of the underlying funds in which it invests. Such indirect expenses are not included in the above expense ratios. |
| | Year Ended December 31, |
| Service Class | 2022 | | 2021 | | 2020 | | 2019 | | 2018 |
| Net asset value at beginning of year | $ 33.85 | | $ 27.87 | | $ 26.47 | | $ 24.94 | | $ 29.45 |
| Net investment income (loss) (a) | 0.18 | | 0.13 | | 0.21 | | 0.31 | | 0.35 |
| Net realized and unrealized gain (loss) | (7.46) | | 7.65 | | 3.62 | | 5.67 | | (1.68) |
| Total from investment operations | (7.28) | | 7.78 | | 3.83 | | 5.98 | | (1.33) |
| Less distributions: | | | | | | | | | |
| From net investment income | (0.11) | | (0.22) | | (0.35) | | (0.36) | | (0.42) |
| From net realized gain on investments | (5.55) | | (1.58) | | (2.08) | | (4.09) | | (2.76) |
| Total distributions | (5.66) | | (1.80) | | (2.43) | | (4.45) | | (3.18) |
| Net asset value at end of year | $ 20.91 | | $ 33.85 | | $ 27.87 | | $ 26.47 | | $ 24.94 |
| Total investment return (b) | (20.87)% | | 28.46% | | 15.26% | | 25.89% | | (6.08)% |
| Ratios (to average net assets)/Supplemental Data: | | | | | | | | | |
| Net investment income (loss) | 0.65% | | 0.40% | | 0.83% | | 1.12% | | 1.17% |
| Net expenses (c) | 0.82% | | 0.83% | | 0.83% | | 0.83% | | 0.82% |
| Portfolio turnover rate | 21% | | 26% | | 143% | | 119% | | 125% |
| Net assets at end of year (in 000's) | $ 226,405 | | $ 306,191 | | $ 270,170 | | $ 268,992 | | $ 237,094 |
| (a) | Per share data based on average shares outstanding during the year. |
| (b) | Total return does not reflect any deduction of sales charges, mortality and expense charges, contract charges or administrative charges. For periods of less than one year, total return is not annualized. |
| (c) | In addition to the fees and expenses which the Portfolio bears directly, it also indirectly bears a pro-rata share of the fees and expenses of the underlying funds in which it invests. Such indirect expenses are not included in the above expense ratios. |
The notes to the financial statements are an integral part of, and should be read in conjunction with, the financial statements.
| 16 | MainStay VP Wellington U.S. Equity Portfolio |
Notes to Financial Statements
Note 1–Organization and Business
MainStay VP Funds Trust (the “Fund”) was organized as a Delaware statutory trust on February 1, 2011. The Fund is registered under the Investment Company Act of 1940, as amended (the “1940 Act”), as an open-end management investment company. The Fund is comprised of thirty-one separate series (collectively referred to as the “Portfolios”). These financial statements and notes relate to the MainStay VP Wellington U.S. Equity Portfolio (the "Portfolio"), a "diversified” portfolio, as that term is defined in the 1940 Act, as interpreted or modified by regulatory authorities having jurisdiction, from time to time.
Shares of the Portfolio are currently offered to certain separate accounts to fund variable annuity policies and variable universal life insurance policies issued by New York Life Insurance and Annuity Corporation (“NYLIAC”), a wholly-owned subsidiary of New York Life Insurance Company (“New York Life”) and may also be offered to fund variable annuity policies and variable universal life insurance policies issued by other insurance companies. NYLIAC allocates shares of the Portfolio to, among others, certain NYLIAC separate accounts. Shares of the Portfolio are also offered to the MainStay VP Conservative Allocation Portfolio, MainStay VP Moderate Allocation Portfolio, MainStay VP Growth Allocation Portfolio and MainStay VP Equity Allocation Portfolio, which operate as “funds-of-funds," and other variable insurance funds.
The following table lists the Portfolio's share classes that have been registered and commenced operations:
| Class | Commenced Operations |
| Initial Class | January 23, 1984 |
| Service Class | June 5, 2003 |
Shares of the Portfolio are offered and are redeemed at a price equal to their respective net asset value (“NAV”) per share. No sales or redemption charge is applicable to the purchase or redemption of the Portfolio's shares. Under the terms of the Fund’s multiple class plan, adopted pursuant to Rule 18f-3 under the 1940 Act, the classes differ in that, among other things, Service Class shares of the Portfolio pay a combined distribution and service fee of 0.25% of average daily net assets attributable to Service Class shares of the Portfolio to the Distributor (as defined in Note 3(B)) pursuant to a plan adopted in accordance with Rule 12b-1 under the 1940 Act. Contract owners of variable annuity contracts purchased after June 2, 2003, are permitted to invest only in the Service Class shares.
The Portfolio's investment objective is to seek long-term growth of capital.
Note 2–Significant Accounting Policies
The Portfolio is an investment company and accordingly follows the investment company accounting and reporting guidance of the Financial Accounting Standards Board (“FASB”) Accounting Standards Codification Topic 946 Financial Services—Investment Companies. The Portfolio prepares its financial statements in accordance with generally accepted
accounting principles (“GAAP”) in the United States of America and follows the significant accounting policies described below.
(A) Securities Valuation. Investments are usually valued as of the close of regular trading on the New York Stock Exchange (the "Exchange") (usually 4:00 p.m. Eastern time) on each day the Portfolio is open for business ("valuation date").
Effective September 8, 2022, and pursuant to Rule 2a-5 under the 1940 Act, the Board of Trustees of the Fund (the "Board") designated New York Life Investment Management LLC (“New York Life Investments” or the "Manager") as its Valuation Designee (the "Valuation Designee"). The Valuation Designee is responsible for performing fair valuations relating to all investments in the Portfolio’s portfolio for which market quotations are not readily available; periodically assessing and managing material valuation risks; establishing and applying fair value methodologies; testing fair valuation methodologies; evaluating and overseeing pricing services; ensuring appropriate segregation of valuation and portfolio management functions; providing quarterly, annual and prompt reporting to the Board, as appropriate; identifying potential conflicts of interest; and maintaining appropriate records. The Valuation Designee has established a valuation committee ("Valuation Committee") to assist in carrying out the Valuation Designee’s responsibilities and establish prices of securities for which market quotations are not readily available. The Portfolio’s and the Valuation Designee's policies and procedures ("Valuation Procedures") govern the Valuation Designee’s selection and application of methodologies for determining and calculating the fair value of Portfolio investments. The Valuation Designee may value the Portfolio's portfolio securities for which market quotations are not readily available and other Portfolio assets utilizing inputs from pricing services and other third-party sources (together, “Pricing Sources”). The Valuation Committee meets (in person, via electronic mail or via teleconference) on an ad-hoc basis to determine fair valuations and on a quarterly basis to review fair value events with respect to certain securities for which market quotations are not readily available, including valuation risks and back-testing results, and preview reports to the Board.
The Valuation Committee establishes prices of securities for which market quotations are not readily available based on such methodologies and measurements on a regular basis after considering information that is reasonably available and deemed relevant by the Valuation Committee. The Board shall oversee the Valuation Designee and review fair valuation materials on a prompt, quarterly and annual basis and approve proposed revisions to the Valuation Procedures.
Investments for which market quotations are not readily available are valued at fair value as determined in good faith pursuant to the Valuation Procedures. A market quotation is readily available only when that quotation is a quoted price (unadjusted) in active markets for identical investments that the Portfolio can access at the measurement date, provided that a quotation will not be readily available if it is not reliable. "Fair value" is defined as the price the Portfolio would reasonably expect to receive upon selling an asset or liability in an orderly transaction to an independent buyer in the principal or most advantageous market for the
Notes to Financial Statements (continued)
asset or liability. Fair value measurements are determined within a framework that establishes a three-tier hierarchy that maximizes the use of observable market data and minimizes the use of unobservable inputs to establish a classification of fair value measurements for disclosure purposes. "Inputs" refer broadly to the assumptions that market participants would use in pricing the asset or liability, including assumptions about risk, such as the risk inherent in a particular valuation technique used to measure fair value using a pricing model and/or the risk inherent in the inputs for the valuation technique. Inputs may be observable or unobservable. Observable inputs reflect the assumptions market participants would use in pricing the asset or liability based on market data obtained from sources independent of the Portfolio. Unobservable inputs reflect the Portfolio’s own assumptions about the assumptions market participants would use in pricing the asset or liability based on the information available. The inputs or methodology used for valuing assets or liabilities may not be an indication of the risks associated with investing in those assets or liabilities. The three-tier hierarchy of inputs is summarized below.
| • | Level 1—quoted prices (unadjusted) in active markets for an identical asset or liability |
| • | Level 2—other significant observable inputs (including quoted prices for a similar asset or liability in active markets, interest rates and yield curves, prepayment speeds, credit risk, etc.) |
| • | Level 3—significant unobservable inputs (including the Portfolio's own assumptions about the assumptions that market participants would use in measuring fair value of an asset or liability) |
The level of an asset or liability within the fair value hierarchy is based on the lowest level of an input, both individually and in the aggregate, that is significant to the fair value measurement. The aggregate value by input level of the Portfolio’s assets and liabilities as of December 31, 2022, is included at the end of the Portfolio of Investments.
The Portfolio may use third-party vendor evaluations, whose prices may be derived from one or more of the following standard inputs, among others:
| • Broker/dealer quotes | • Benchmark securities |
| • Two-sided markets | • Reference data (corporate actions or material event notices) |
| • Bids/offers | • Monthly payment information |
| • Industry and economic events | • Reported trades |
An asset or liability for which a market quotation is not readily available is valued by methods deemed reasonable in good faith by the Valuation Committee, following the Valuation Procedures to represent fair value. Under these procedures, the Valuation Designee generally uses a market-based approach which may use related or comparable assets or liabilities, recent transactions, market multiples, book values and other relevant information. The Valuation Designee may also use an income-based valuation approach in which the anticipated future cash flows of the asset or liability are discounted to calculate fair value.
Discounts may also be applied due to the nature and/or duration of any restrictions on the disposition of the asset or liability. Fair value represents a good faith approximation of the value of a security. Fair value determinations involve the consideration of a number of subjective factors, an analysis of applicable facts and circumstances and the exercise of judgment. As a result, it is possible that the fair value for a security determined in good faith in accordance with the Valuation Procedures may differ from valuations for the same security determined for other funds using their own valuation procedures. Although the Valuation Procedures are designed to value a security at the price the Portfolio may reasonably expect to receive upon the security's sale in an orderly transaction, there can be no assurance that any fair value determination thereunder would, in fact, approximate the amount that the Portfolio would actually realize upon the sale of the security or the price at which the security would trade if a reliable market price were readily available. During the year ended December 31, 2022, there were no material changes to the fair value methodologies.
Securities which may be valued in this manner include, but are not limited to: (i) a security for which trading has been halted or suspended or otherwise does not have a readily available market quotation on a given day; (ii) a debt security that has recently gone into default and for which there is not a current market quotation; (iii) a security of an issuer that has entered into a restructuring; (iv) a security that has been delisted from a national exchange; (v) a security subject to trading collars for which no or limited trading takes place; and (vi) a security whose principal market has been temporarily closed at a time when, under normal conditions, it would be open. Securities valued in this manner are generally categorized as Level 2 or 3 in the hierarchy.
Equity securities are valued at the last quoted sales prices as of the close of regular trading on the relevant exchange on each valuation date. Securities that are not traded on the valuation date are valued at the mean of the last quoted bid and ask prices. Prices are normally taken from the principal market in which each security trades. These securities are generally categorized as Level 1 in the hierarchy.
Investments in mutual funds, including money market funds, are valued at their respective NAVs at the close of business each day on the valuation date. These securities are generally categorized as Level 1 in the hierarchy.
Temporary cash investments acquired in excess of 60 days to maturity at the time of purchase are valued using the latest bid prices or using valuations based on a matrix system (which considers such factors as security prices, yields, maturities and ratings), both as furnished by independent pricing services. Temporary cash investments that mature in 60 days or less at the time of purchase ("Short-Term Investments") are valued using the amortized cost method of valuation, unless the use of such method would be inappropriate. The amortized cost method involves valuing a security at its cost on the date of purchase and thereafter assuming a constant amortization to maturity of the difference between such cost and the value on maturity date. Amortized cost approximates the current fair value of a security. Securities valued using the amortized
| 18 | MainStay VP Wellington U.S. Equity Portfolio |
cost method are not valued using quoted prices in an active market and are generally categorized as Level 2 in the hierarchy.
The information above is not intended to reflect an exhaustive list of the methodologies that may be used to value portfolio investments. The Valuation Procedures permit the use of a variety of valuation methodologies in connection with valuing portfolio investments. The methodology used for a specific type of investment may vary based on the market data available or other considerations. The methodologies summarized above may not represent the specific means by which portfolio investments are valued on any particular business day.
(B) Income Taxes. The Portfolio's policy is to comply with the requirements of the Internal Revenue Code of 1986, as amended (the “Internal Revenue Code”), applicable to regulated investment companies and to distribute all of its taxable income to the shareholders of the Portfolio within the allowable time limits.
The Manager evaluates the Portfolio’s tax positions to determine if the tax positions taken meet the minimum recognition threshold in connection with accounting for uncertainties in income tax positions taken or expected to be taken for the purposes of measuring and recognizing tax liabilities in the financial statements. Recognition of tax benefits of an uncertain tax position is permitted only to the extent the position is “more likely than not” to be sustained assuming examination by taxing authorities. The Manager analyzed the Portfolio's tax positions taken on federal, state and local income tax returns for all open tax years (for up to three tax years) and has concluded that no provisions for federal, state and local income tax are required in the Portfolio's financial statements. The Portfolio's federal, state and local income tax and federal excise tax returns for tax years for which the applicable statutes of limitations have not expired are subject to examination by the Internal Revenue Service and state and local departments of revenue.
(C) Dividends and Distributions to Shareholders. Dividends and distributions are recorded on the ex-dividend date. The Portfolio intends to declare and pay dividends from net investment income and distributions from net realized capital and currency gains, if any, at least annually. All dividends and distributions are reinvested at NAV in the same class of shares of the Portfolio. Dividends and distributions to shareholders are determined in accordance with federal income tax regulations and may differ from determinations using GAAP.
(D) Security Transactions and Investment Income. The Portfolio records security transactions on the trade date. Realized gains and losses on security transactions are determined using the identified cost method. Dividend income is recognized on the ex-dividend date, net of any foreign tax withheld at the source, and interest income is accrued as earned using the effective interest rate method. Distributions received from real estate investment trusts may be classified as dividends, capital gains and/or return of capital.
Investment income and realized and unrealized gains and losses on investments of the Portfolio are allocated pro rata to the separate classes
of shares based upon their relative net assets on the date the income is earned or realized and unrealized gains and losses are incurred.
(E) Expenses. Expenses of the Fund are allocated to the individual Portfolios in proportion to the net assets of the respective Portfolios when the expenses are incurred, except where direct allocations of expenses can be made. Expenses (other than fees incurred under the distribution and service plans, further discussed in Note 3(B), which are charged directly to the Service Class shares) are allocated to separate classes of shares pro rata based upon their relative net assets on the date the expenses are incurred. The expenses borne by the Portfolio, including those of related parties to the Portfolio, are shown in the Statement of Operations.
Additionally, the Portfolio may invest in exchange-traded funds ("ETFs") and mutual funds, which are subject to management fees and other fees that may cause the costs of investing in ETFs and mutual funds to be greater than the costs of owning the underlying securities directly. These indirect expenses of ETFs and mutual funds are not included in the amounts shown as expenses in the Statement of Operations or in the expense ratios included in the Financial Highlights.
(F) Use of Estimates. In preparing financial statements in conformity with GAAP, the Manager makes estimates and assumptions that affect the reported amounts and disclosures in the financial statements. Actual results could differ from those estimates and assumptions.
(G) Securities Lending. In order to realize additional income, the Portfolio may engage in securities lending, subject to the limitations set forth in the 1940 Act and relevant guidance by the staff of the Securities and Exchange Commission (“SEC”). If the Portfolio engages in securities lending, the Portfolio will lend through its custodian, JPMorgan Chase Bank, N.A., ("JPMorgan"), acting as securities lending agent on behalf of the Portfolio. Under the current arrangement, JPMorgan will manage the Portfolio's collateral in accordance with the securities lending agency agreement between the Portfolio and JPMorgan, and indemnify the Portfolio against counterparty risk. The loans will be collateralized by cash (which may be invested in a money market fund) and/or non-cash collateral (which may include U.S. Treasury securities and/or U.S. government agency securities issued or guaranteed by the United States government or its agencies or instrumentalities) at least equal at all times to the market value of the securities loaned. Non-cash collateral held at year end is segregated and cannot be transferred by the Portfolio. The Portfolio bears the risk of delay in recovery of, or loss of rights in, the securities loaned. The Portfolio may also record a realized gain or loss on securities deemed sold due to a borrower’s inability to return securities on loan. The Portfolio bears the risk of any loss on investment of cash collateral. The Portfolio will receive compensation for lending its securities in the form of fees or it will retain a portion of interest earned on the investment of any cash collateral. The Portfolio will also continue to receive interest and dividends on the securities loaned and any gain or loss in the market price of the securities loaned that may occur during the term of the loan will be for the account of the Portfolio. Income earned from securities lending activities, if any, is reflected in the Statement of
Notes to Financial Statements (continued)
Operations. As of December 31, 2022, the Portfolio did not have any portfolio securities on loan.
(H) Indemnifications. Under the Fund’s organizational documents, its officers and trustees are indemnified against certain liabilities that may arise out of performance of their duties to the Fund. Additionally, in the normal course of business, the Portfolio enters into contracts with third-party service providers that contain a variety of representations and warranties and that may provide general indemnifications. The Portfolio's maximum exposure under these arrangements is unknown, as this would involve future claims that may be made against the Portfolio that have not yet occurred. The Manager believes that the risk of loss in connection with these potential indemnification obligations is remote. However, there can be no assurance that material liabilities related to such obligations will not arise in the future, which could adversely impact the Portfolio.
Note 3–Fees and Related Party Transactions
(A) Manager and Subadvisor. New York Life Investments, a registered investment adviser and an indirect, wholly-owned subsidiary of New York Life, serves as the Portfolio's Manager, pursuant to an Amended and Restated Management Agreement ("Management Agreement"). The Manager provides offices, conducts clerical, recordkeeping and bookkeeping services and keeps most of the financial and accounting records required to be maintained by the Portfolio. Except for the portion of salaries and expenses that are the responsibility of the Portfolio, the Manager pays the salaries and expenses of all personnel affiliated with the Portfolio and certain operational expenses of the Portfolio. During a portion of the year ended December 31, 2022, the Portfolio reimbursed New York Life Investments in an amount equal to the portion of the compensation of the Chief Compliance Officer attributable to the Portfolio. Wellington Management Company LLP ("Wellington" or the "Subadvisor"), a registered investment adviser, serves as the Subadvisor to the Portfolio and is responsible for the day-to-day portfolio management of the Portfolio. Pursuant to the terms of a Subadvisory Agreement between New York Life Investments and Wellington, New York Life Investments pays for the services of the Subadvisor.
Pursuant to the Management Agreement, the Fund pays the Manager, on behalf of the Portfolio, a monthly fee for the services performed and the facilities furnished at an annual rate of the Portfolio's average daily net assets as follows: 0.55% up to $500 million; 0.525% from $500 million to $1 billion; and 0.50% in excess of $1 billion. During the year ended December 31, 2022, the effective management fee rate was 0.54%.
During the year ended December 31, 2022, New York Life Investments earned fees from the Portfolio in the amount of $4,849,373 and paid the Subadvisor fees of $2,109,717.
JPMorgan provides sub-administration and sub-accounting services to the Portfolio pursuant to an agreement with New York Life Investments. These services include calculating the daily NAVs of the Portfolio, maintaining the general ledger and sub-ledger accounts for the calculation of the Portfolio's NAVs, and assisting New York Life
Investments in conducting various aspects of the Portfolio's administrative operations. For providing these services to the Portfolio, JPMorgan is compensated by New York Life Investments.
Pursuant to an agreement between the Fund and New York Life Investments, New York Life Investments is responsible for providing or procuring certain regulatory reporting services for the Portfolio. The Portfolio will reimburse New York Life Investments for the actual costs incurred by New York Life Investments in connection with providing or procuring these services for the Portfolio.
(B) Distribution and Service Fees. The Fund, on behalf of the Portfolio, has entered into a distribution agreement with NYLIFE Distributors LLC (the “Distributor”), an affiliate of New York Life Investments. The Portfolio has adopted a distribution plan (the “Plan”) in accordance with the provisions of Rule 12b-1 under the 1940 Act. Under the Plan, the Distributor has agreed to provide, through its affiliates or independent third parties, various distribution-related, shareholder and administrative support services to the Service Class shareholders. For its services, the Distributor is entitled to a combined distribution and service fee accrued daily and paid monthly at an annual rate of 0.25% of the average daily net assets attributable to the Service Class shares of the Portfolio.
Note 4-Federal Income Tax
As of December 31, 2022, the cost and unrealized appreciation (depreciation) of the Portfolio’s investment portfolio, including applicable derivative contracts and other financial instruments, as determined on a federal income tax basis, were as follows:
| | Federal Tax
Cost | Gross
Unrealized
Appreciation | Gross
Unrealized
(Depreciation) | Net
Unrealized
Appreciation/
(Depreciation) |
| Investments in Securities | $823,845,093 | $95,846,533 | $(76,922,456) | $18,924,077 |
As of December 31, 2022, the components of accumulated gain (loss) on a tax basis were as follows:
Ordinary
Income | Accumulated
Capital
and Other
Gain (Loss) | Other
Temporary
Differences | Unrealized
Appreciation
(Depreciation) | Total
Accumulated
Gain (Loss) |
| $7,701,555 | $(23,125,359) | $— | $18,924,077 | $3,500,273 |
The difference between book-basis and tax-basis unrealized appreciation (depreciation) is primarily due to wash sale adjustments.
As of December 31, 2022, for federal income tax purposes, capital loss carryforwards of $23,125,359, as shown in the table below, were available to the extent provided by the regulations to offset future realized gains of the Portfolio. Accordingly, no capital gains distributions are
| 20 | MainStay VP Wellington U.S. Equity Portfolio |
expected to be paid to shareholders until net gains have been realized in excess of such amounts.
Capital Loss
Available Through | Short-Term
Capital Loss
Amounts (000’s) | Long-Term
Capital Loss
Amounts (000’s) |
| Unlimited | $15,284 | $7,841 |
During the years ended December 31, 2022 and December 31, 2021, the tax character of distributions paid as reflected in the Statements of Changes in Net Assets was as follows:
| | 2022 | 2021 |
| Distributions paid from: | | |
| Ordinary Income | $100,243,996 | $ 7,424,661 |
| Long-Term Capital Gains | 75,412,662 | 44,059,720 |
| Total | $175,656,658 | $51,484,381 |
Note 5–Custodian
JPMorgan is the custodian of cash and securities held by the Portfolio. Custodial fees are charged to the Portfolio based on the Portfolio's net assets and/or the market value of securities held by the Portfolio and the number of certain transactions incurred by the Portfolio.
Note 6–Line of Credit
The Portfolio and certain other funds managed by New York Life Investments maintain a line of credit with a syndicate of banks in order to secure a source of funds for temporary purposes to meet unanticipated or excessive redemption requests.
Effective July 26, 2022, under the credit agreement (the “Credit Agreement”), the aggregate commitment amount is $600,000,000 with an additional uncommitted amount of $100,000,000. The commitment fee is an annual rate of 0.15% of the average commitment amount payable quarterly, regardless of usage, to JPMorgan, who serves as the agent to the syndicate. The commitment fee is allocated among the Portfolio and certain other funds managed by New York Life Investments based upon their respective net assets and other factors. Interest on any revolving credit loan is charged based upon the Federal Funds Rate, Daily Simple Secured Overnight Financing Rate ("SOFR") + 0.10%, or the Overnight Bank Funding Rate, whichever is higher. The Credit Agreement expires on July 25, 2023, although the Portfolio, certain other funds managed by New York Life Investments and the syndicate of banks may renew the Credit Agreement for an additional year on the same or different terms or enter into a credit agreement with a different syndicate of banks. Prior to July 26, 2022, the aggregate commitment amount and the commitment fee were the same as those under the current Credit Agreement. During the year ended December 31, 2022, there were no borrowings made or outstanding with respect to the Portfolio under the Credit Agreement.
Note 7–Interfund Lending Program
Pursuant to an exemptive order issued by the SEC, the Portfolio, along with certain other funds managed by New York Life Investments, may participate in an interfund lending program. The interfund lending program provides an alternative credit facility that permits the Portfolio and certain other funds managed by New York Life Investments to lend or borrow money for temporary purposes directly to or from one another, subject to the conditions of the exemptive order. During the year ended December 31, 2022, there were no interfund loans made or outstanding with respect to the Portfolio.
Note 8–Purchases and Sales of Securities (in 000’s)
During the year ended December 31, 2022, purchases and sales of securities, other than short-term securities, were $200,117 and $182,700, respectively.
Note 9–Capital Share Transactions
Transactions in capital shares for the years ended December 31, 2022 and December 31, 2021, were as follows:
| Initial Class | Shares | Amount |
| Year ended December 31, 2022: | | |
| Shares sold | 4,126,421 | $120,131,397 |
| Shares issued to shareholders in reinvestment of distributions | 6,200,906 | 127,232,665 |
| Shares redeemed | (3,129,082) | (89,333,654) |
| Net increase (decrease) | 7,198,245 | $158,030,408 |
| Year ended December 31, 2021: | | |
| Shares sold | 5,417,196 | $173,672,097 |
| Shares issued to shareholders in reinvestment of distributions | 1,118,933 | 35,636,214 |
| Shares redeemed | (2,843,866) | (90,895,781) |
| Net increase (decrease) | 3,692,263 | $118,412,530 |
| |
| Service Class | Shares | Amount |
| Year ended December 31, 2022: | | |
| Shares sold | 709,385 | $ 19,566,892 |
| Shares issued to shareholders in reinvestment of distributions | 2,404,906 | 48,423,993 |
| Shares redeemed | (1,332,405) | (36,325,263) |
| Net increase (decrease) | 1,781,886 | $ 31,665,622 |
| Year ended December 31, 2021: | | |
| Shares sold | 633,617 | $ 19,982,570 |
| Shares issued to shareholders in reinvestment of distributions | 505,346 | 15,848,167 |
| Shares redeemed | (1,788,728) | (56,350,027) |
| Net increase (decrease) | (649,765) | $ (20,519,290) |
Notes to Financial Statements (continued)
Note 10–Other Matters
As of the date of this report, interest rates in the United States and many parts of the world, including certain European countries, are ascending from historically low levels. Thus, the Portfolio currently faces a heightened level of risk associated with rising interest rates. This could be driven by a variety of factors, including but not limited to central bank monetary policies, changing inflation or real growth rates, general economic conditions, increasing bond issuances or reduced market demand for low yielding investments.
An outbreak of COVID-19, first detected in December 2019, has developed into a global pandemic and has resulted in travel restrictions, closure of international borders, certain businesses and securities markets, restrictions on securities trading activities, prolonged quarantines, supply chain disruptions, and lower consumer demand, as well as general concern and uncertainty. In 2022, many countries lifted some or all restrictions related to COVID-19. However, the continued impact of COVID-19 and related variants is uncertain and could further adversely affect the global economy, national economies, individual issuers and capital markets in unforeseeable ways and result in a substantial and extended economic downturn. Developments that disrupt global economies and financial markets, such as COVID-19, may magnify factors that affect the Portfolio's performance.
Note 11–Subsequent Events
In connection with the preparation of the financial statements of the Portfolio as of and for the year ended December 31, 2022, events and transactions subsequent to December 31, 2022, through the date the financial statements were issued have been evaluated by the Manager for possible adjustment and/or disclosure. No subsequent events requiring financial statement adjustment or disclosure have been identified.
| 22 | MainStay VP Wellington U.S. Equity Portfolio |
Report of Independent Registered Public Accounting Firm
To the Board of Trustees of MainStay VP Funds Trust and Shareholders of
MainStay VP Wellington U.S. Equity Portfolio
Opinion on the Financial Statements
We have audited the accompanying statement of assets and liabilities, including the portfolio of investments, of MainStay VP Wellington U.S. Equity Portfolio (one of the portfolios constituting MainStay VP Funds Trust, referred to hereafter as the “Portfolio”) as of December 31, 2022, the related statement of operations for the year ended December 31, 2022, the statements of changes in net assets for each of the two years in the period ended December 31, 2022, including the related notes, and the financial highlights for each of the five years in the period ended December 31, 2022 (collectively referred to as the “financial statements”). In our opinion, the financial statements present fairly, in all material respects, the financial position of the Portfolio as of December 31, 2022, the results of its operations for the year then ended, the changes in its net assets for each of the two years in the period ended December 31, 2022 and the financial highlights for each of the five years in the period ended December 31, 2022 in conformity with accounting principles generally accepted in the United States of America.
Basis for Opinion
These financial statements are the responsibility of the Portfolio’s management. Our responsibility is to express an opinion on the Portfolio’s financial statements based on our audits. We are a public accounting firm registered with the Public Company Accounting Oversight Board (United States) (PCAOB) and are required to be independent with respect to the Portfolio in accordance with the U.S. federal securities laws and the applicable rules and regulations of the Securities and Exchange Commission and the PCAOB.
We conducted our audits of these financial statements in accordance with the standards of the PCAOB. Those standards require that we plan and perform the audit to obtain reasonable assurance about whether the financial statements are free of material misstatement, whether due to error or fraud.
Our audits included performing procedures to assess the risks of material misstatement of the financial statements, whether due to error or fraud, and performing procedures that respond to those risks. Such procedures included examining, on a test basis, evidence regarding the amounts and disclosures in the financial statements. Our audits also included evaluating the accounting principles used and significant estimates made by management, as well as evaluating the overall presentation of the financial statements. Our procedures included confirmation of securities owned as of December 31, 2022 by correspondence with the custodian, transfer agent and brokers; when replies were not received from brokers, we performed other auditing procedures. We believe that our audits provide a reasonable basis for our opinion.
/s/PricewaterhouseCoopers LLP
New York, New York
February 24, 2023
We have served as the auditor of one or more investment companies in the MainStay group of funds since 1984.
Board Consideration and Approval of Management Agreement and Subadvisory Agreement (Unaudited)
The continuation of the Management Agreement with respect to the MainStay VP Wellington U.S. Equity Portfolio (“Portfolio”) and New York Life Investment Management LLC (“New York Life Investments”) and the Subadvisory Agreement between New York Life Investments and Wellington Management Company LLP (“WMC”) with respect to the Portfolio (together, “Advisory Agreements”) is subject to annual review and approval by the Board of Trustees of MainStay VP Funds Trust (“Board” of the “Trust”) in accordance with Section 15 of the Investment Company Act of 1940, as amended (“1940 Act”). At its December 6–7, 2022 meeting, the Board, which is comprised solely of Trustees who are not an “interested person” (as such term is defined in the 1940 Act) of the Trust (“Independent Trustees”), unanimously approved the continuation of each of the Advisory Agreements for a one-year period.
In reaching the decision to approve the continuation of each of the Advisory Agreements, the Board considered information and materials furnished by New York Life Investments and WMC in connection with an annual contract review process undertaken by the Board that took place at meetings of the Board and its Contracts Committee during October 2022 through December 2022, including information and materials furnished by New York Life Investments and WMC in response to requests prepared on behalf of the Board, and in consultation with the Board, by independent legal counsel to the Independent Trustees, which encompassed a variety of topics, including those summarized below. Information and materials requested by and furnished to the Board for consideration in connection with the contract review process included, among other items, reports on the Portfolio and “peer funds” prepared by Institutional Shareholder Services Inc. (“ISS”), an independent third-party service provider engaged by the Board to report objectively on the Portfolio’s investment performance, management fee and total expenses. The Board also considered information on the fees charged to other investment advisory clients of New York Life Investments and/or WMC that follow investment strategies similar to those of the Portfolio, if any, and, when applicable, the rationale for any differences in the Portfolio’s management and subadvisory fees and the fees charged to those other investment advisory clients. In addition, the Board considered information regarding the legal standards and fiduciary obligations applicable to its consideration of the continuation of each of the Advisory Agreements. The contract review process, including the structure and format for information and materials provided to the Board, has been developed in consultation with the Board. The Independent Trustees also met in executive sessions with their independent legal counsel and, for portions thereof, with senior management of New York Life Investments.
The Board’s deliberations with respect to the continuation of each of the Advisory Agreements reflect a year-long process, and the Board also took into account information furnished to the Board and its Committees throughout the year, as deemed relevant and appropriate by the Trustees, including, among other items, reports on investment performance of the Portfolio and investment-related matters for the Portfolio as well as presentations from New York Life Investments and, generally annually, WMC personnel. In addition, the Board took into account other information received from New York Life Investments throughout the year,
including, among other items, periodic reports on legal and compliance matters, risk management, portfolio turnover, brokerage commissions and non-advisory services provided to the Portfolio by New York Life Investments, as deemed relevant and appropriate by the Trustees.
In addition to information provided to the Board throughout the year, the Board received information in connection with its June 2022 meeting provided specifically in response to requests prepared on behalf of the Board, and in consultation with the Board, by independent legal counsel to the Independent Trustees regarding the Portfolio’s distribution arrangements. In addition, the Board received information regarding the Portfolio’s asset levels, share purchase and redemption activity and the payment of Rule 12b-1 and/or other fees by the applicable share classes of the Portfolio, among other information.
In considering the continuation of each of the Advisory Agreements, the Trustees reviewed and evaluated the information and factors they believed to reasonably be necessary and appropriate in light of legal advice furnished to them by independent legal counsel to the Independent Trustees and through the exercise of their own business judgment. Although individual Trustees may have weighed certain factors or information differently and the Board did not consider any single factor or information controlling in reaching its decision, the factors considered by the Board are summarized in more detail below and include, among other factors: (i) the nature, extent and quality of the services provided to the Portfolio by New York Life Investments and WMC; (ii) the qualifications of the portfolio managers of the Portfolio and the historical investment performance of the Portfolio, New York Life Investments and WMC; (iii) the costs of the services provided, and profits realized, by New York Life Investments and WMC with respect to their relationships with the Portfolio; (iv) the extent to which economies of scale have been realized or may be realized if the Portfolio grows and the extent to which any economies of scale have been shared, have benefited or may benefit the Portfolio’s shareholders; and (v) the reasonableness of the Portfolio’s management and subadvisory fees and total ordinary operating expenses. Although the Board recognized that comparisons between the Portfolio’s fees and expenses and those of other funds are imprecise given different terms of agreements, variations in fund strategies and other factors, the Board considered the reasonableness of the Portfolio’s management fee and total ordinary operating expenses as compared to the peer funds identified by ISS. Throughout their considerations, the Trustees acknowledged the commitment of New York Life Investments and its affiliates to serve the MainStay Group of Funds, as well as their capacity, experience, resources, financial stability and reputations. The Trustees also acknowledged the entrepreneurial and other risks assumed by New York Life Investments in sponsoring and managing the Portfolio. With respect to the Subadvisory Agreement, the Board took into account New York Life Investments’ recommendation to approve the continuation of the Subadvisory Agreement.
The Trustees noted that, throughout the year, the Trustees are afforded an opportunity to ask questions of, and request additional information or materials from, New York Life Investments and WMC. The Board’s decision with respect to each of the Advisory Agreements may have also
| 24 | MainStay VP Wellington U.S. Equity Portfolio |
been based, in part, on the Board’s knowledge of New York Life Investments and WMC resulting from, among other things, the Board’s consideration of each of the Advisory Agreements in prior years, the advisory agreements for other funds in the MainStay Group of Funds, the Board’s review throughout the year of the performance and operations of other funds in the MainStay Group of Funds and each Trustee’s business judgment and industry experience. In addition to considering the above-referenced factors, the Board observed that in the marketplace, notably under variable life insurance policies and variable annuity contracts for which the Portfolio serves as an investment option, there are a range of investment options available to investors and that the Portfolio’s shareholders, having had the opportunity to consider other investment options, have chosen to invest in the Portfolio.
The factors that figured prominently in the Board’s decision to approve the continuation of each of the Advisory Agreements during its December 6–7, 2022 meeting are summarized in more detail below.
Nature, Extent and Quality of Services Provided by New York Life Investments and WMC
The Board examined the nature, extent and quality of the services that New York Life Investments provides to the Portfolio. The Board evaluated New York Life Investments’ experience and capabilities in serving as manager of the Portfolio and considered that the Portfolio operates in a “manager-of-managers” structure. The Board also considered New York Life Investments’ responsibilities and services provided pursuant to this structure, including overseeing the services provided by WMC, evaluating the performance of WMC, making recommendations to the Board as to whether the Subadvisory Agreement should be renewed, modified or terminated and periodically reporting to the Board regarding the results of New York Life Investments’ evaluation and monitoring functions. The Board noted that New York Life Investments manages other mutual funds, serves a variety of other investment advisory clients, including other pooled investment vehicles, and has experience overseeing mutual fund service providers, including subadvisors. The Board considered the experience of senior personnel at New York Life Investments providing management and administrative and other non-advisory services to the Portfolio. The Board observed that New York Life Investments devotes significant resources and time to providing management and administrative and other non-advisory services to the Portfolio, including New York Life Investments’ oversight and due diligence reviews of WMC and ongoing analysis of, and interactions with, WMC with respect to, among other things, the Portfolio’s investment performance and risks as well as WMC’s investment capabilities and subadvisory services with respect to the Portfolio.
The Board also considered the range of services that New York Life Investments provides to the Portfolio under the terms of the Management Agreement, including: (i) fund accounting and ongoing supervisory services provided by New York Life Investments’ Fund Administration and Accounting Group; (ii) investment supervisory and analytical services provided by New York Life Investments’ Investment Consulting Group; (iii) compliance services provided by the Trust’s Chief Compliance Officer as
well as New York Life Investments’ compliance department, including supervision and implementation of the Portfolio’s compliance program; (iv) legal services provided by New York Life Investments’ Office of the General Counsel; and (v) risk management monitoring and analysis by compliance and investment personnel. In addition, the Board considered New York Life Investments’ willingness to invest in personnel and other resources, such as cyber security, information security and business continuity planning, designed to benefit the Portfolio and noted that New York Life Investments is responsible for compensating the Trust’s officers, except for a portion of the salary of the Trust’s Chief Compliance Officer. The Board recognized that New York Life Investments provides certain other non-advisory services to the Portfolio and has provided an increasingly broad array of non-advisory services to the MainStay Group of Funds as a result of regulatory and other developments, including in connection with the implementation of the MainStay Group of Funds’ derivatives risk management program and policies and procedures adopted pursuant to Rule 18f-4 under the 1940 Act.
The Board also examined the range, and the nature, extent and quality, of the investment advisory services that WMC provides to the Portfolio and considered the terms of each of the Advisory Agreements. The Board evaluated WMC’s experience and performance in serving as subadvisor to the Portfolio and advising other portfolios and WMC’s track record and experience in providing investment advisory services, the experience of investment advisory, senior management and administrative personnel at WMC. The Board considered New York Life Investments’ and WMC’s overall resources, legal and compliance environment, capabilities, reputation, financial condition and history. In addition to information provided in connection with quarterly meetings with the Trust’s Chief Compliance Officer, the Board considered information regarding the compliance policies and procedures of New York Life Investments and WMC and acknowledged their commitment to further developing and strengthening compliance programs relating to the Portfolio. The Board also considered WMC’s ability to recruit and retain qualified investment professionals and willingness to invest in personnel and other resources to service and support the Portfolio. In this regard, the Board considered the qualifications and experience of the Portfolio’s portfolio managers, the number of accounts managed by the portfolio managers and the method for compensating the portfolio managers.
In addition, the Board considered information provided by New York Life Investments and WMC regarding the operations of their respective business continuity plans in response to the COVID-19 pandemic and the continued remote work environment.
Based on these considerations, among others, the Board concluded that the Portfolio would likely continue to benefit from the nature, extent and quality of these services.
Investment Performance
In evaluating the Portfolio’s investment performance, the Board considered investment performance results over various periods in light of the Portfolio’s investment objective, strategies and risks. The Board
Board Consideration and Approval of Management Agreement and Subadvisory Agreement (Unaudited) (continued)
considered investment reports on, and analysis of, the Portfolio’s performance provided to the Board throughout the year. These reports include, among other items, information on the Portfolio’s gross and net returns, the Portfolio’s investment performance compared to a relevant investment category and the Portfolio’s benchmark, the Portfolio’s risk-adjusted investment performance and the Portfolio’s investment performance as compared to peer funds, as appropriate, as well as portfolio attribution information and commentary on the effect of market conditions. The Board also considered information provided by ISS showing the investment performance of the Portfolio as compared to peer funds. In addition, the Board reviewed the methodology used by ISS to construct the group of peer funds for comparative purposes.
The Board also took into account its discussions with senior management at New York Life Investments concerning the Portfolio’s investment performance over various periods as well as discussions between the Portfolio’s portfolio management team and the members of the Board’s Investment Committee, which generally occur on an annual basis. In addition, the Board considered any specific actions that New York Life Investments or WMC had taken, or had agreed to take, to seek to enhance Portfolio investment performance and the results of those actions.
Based on these considerations, among others, the Board concluded that its review of the Portfolio’s investment performance and related information supported a determination to approve the continuation of each of the Advisory Agreements.
Costs of the Services Provided, and Profits and Other Benefits Realized, by New York Life Investments and WMC
The Board considered the costs of the services provided under each of the Advisory Agreements. The Board also considered the profits realized by New York Life Investments and its affiliates and WMC due to their relationships with the Portfolio as well as by New York Life Investments and its affiliates due to their relationships with the MainStay Group of Funds. The Board considered information from New York Life Investments that WMC’s subadvisory fee reflected an arm’s-length negotiation and that this fee is paid by New York Life Investments, not the Portfolio, and the relevance of WMC’s profitability was considered by the Trustees in that context. On this basis, the Board primarily considered the costs and profitability for New York Life Investments and its affiliates with respect to the Portfolio.
In addition, the Board acknowledged the difficulty in obtaining reliable comparative data about mutual fund managers’ profitability because such information generally is not publicly available and may be impacted by numerous factors, including the structure of a fund manager’s organization, the types of funds it manages, the methodology used to allocate certain fixed costs to specific funds and the manager’s capital structure and costs of capital.
In evaluating the costs of the services provided by New York Life Investments and WMC and profits realized by New York Life Investments and its affiliates and WMC, the Board considered, among other factors,
New York Life Investments’ and its affiliates’ and WMC’s continuing investments in, or willingness to invest in, personnel and other resources to support and further enhance the management of the Portfolio, and that New York Life Investments is responsible for paying the subadvisory fee for the Portfolio. The Board also considered the financial resources of New York Life Investments and WMC and acknowledged that New York Life Investments and WMC must be in a position to recruit and retain experienced professional personnel and to maintain a strong financial position for New York Life Investments and WMC to continue to provide high-quality services to the Portfolio. The Board recognized that the Portfolio benefits from the allocation of certain fixed costs among the funds in the MainStay Group of Funds, among other expected benefits resulting from its relationship with New York Life Investments.
The Board considered information regarding New York Life Investments’ methodology for calculating profitability and allocating costs provided by New York Life Investments in connection with the fund profitability analysis presented to the Board. The Board noted it had previously engaged an independent consultant to review the methods used to allocate costs among the funds in the MainStay Group of Funds. The Board also noted that the independent consultant had concluded that New York Life Investments’ methods for allocating costs and procedures for estimating overall profitability of the relationship with the funds in the MainStay Group of Funds are reasonable and that New York Life Investments continued to use the same method of calculating profit and allocating costs since the independent consultant’s review. The Board recognized the difficulty in calculating and evaluating a manager’s profitability with respect to the Portfolio and considered that other profitability methodologies may also be reasonable.
The Board also considered certain fall-out benefits that may be realized by New York Life Investments and its affiliates due to their relationships with the Portfolio, including reputational and other indirect benefits. The Board recognized, for example, the benefits to WMC from legally permitted “soft-dollar” arrangements by which brokers provide research and other services to WMC in exchange for commissions paid by the Portfolio with respect to trades in the Portfolio’s portfolio securities. In this regard, the Board also requested and considered information from New York Life Investments concerning other material business relationships between WMC and its affiliates and New York Life Investments and its affiliates and considered the existence of a strategic partnership between New York Life Investments and WMC that relates to certain current and future products and represents a potential conflict of interest associated with New York Life Investments’ recommendation to approve the Subadvisory Agreement. In addition, the Board considered its review of the management agreement for a money market fund advised by New York Life Investments and an affiliated subadvisor that serves as an investment option for the Portfolio, including the potential rationale for and costs associated with investments in this money market fund by the Portfolio, if any, and considered information from New York Life Investments that the nature and type of specific investment advisory services provided to this money market fund are distinct from, or in addition to, the investment advisory services provided to the Portfolio. In
| 26 | MainStay VP Wellington U.S. Equity Portfolio |
addition, the Board considered the potential dividend received tax deduction for insurance company affiliates of New York Life Investments from the Portfolio’s securities lending activity.
The Board noted that the Portfolio serves as an investment option primarily under variable contracts issued by affiliates of New York Life Investments that would receive fees under those contracts. The Board observed that, in addition to fees earned by New York Life Investments under the Management Agreement for managing the Portfolio, New York Life Investments’ affiliates also earn revenues from serving the Portfolio in various other capacities, including as the Portfolio’s distributor. The Board considered information about these other revenues and their impact on the profitability of the relationship with the Portfolio to New York Life Investments and its affiliates. The Board noted that, although it assessed the overall profitability of the relationship with the Portfolio to New York Life Investments and its affiliates as part of the contract review process, when considering the reasonableness of the fee paid to New York Life Investments under the Management Agreement, the Board considered the profitability of New York Life Investments’ relationship with the Portfolio on a pre-tax basis and without regard to distribution expenses incurred by New York Life Investments from its own resources.
After evaluating the information deemed relevant by the Trustees, the Board concluded that any profits realized by New York Life Investments and its affiliates due to their relationships with the Portfolio were not excessive, other benefits that may accrue to New York Life Investments and its affiliates are reasonable and benefits that may accrue to WMC and its affiliates are consistent with those expected for a subadvisor to a mutual fund. With respect to WMC, the Board considered that any profits realized by WMC due to its relationship with the Portfolio are the result of arm’s-length negotiations between New York Life Investments and WMC, acknowledging that any such profits are based on the subadvisory fee paid to WMC by New York Life Investments, not the Portfolio.
Management and Subadvisory Fees and Total Ordinary Operating Expenses
The Board evaluated the reasonableness of the fee paid under each of the Advisory Agreements and the Portfolio’s total ordinary operating expenses. The Board primarily considered the reasonableness of the management fee paid by the Portfolio to New York Life Investments because the subadvisory fee paid to WMC is paid by New York Life Investments, not the Portfolio. The Board also considered the reasonableness of the subadvisory fee paid by New York Life Investments and the amount of the management fee retained by New York Life Investments.
In assessing the reasonableness of the Portfolio’s fees and expenses, the Board primarily considered comparative data provided by ISS on the fees and expenses charged by similar mutual funds managed by other investment advisers. The Board reviewed the methodology used by ISS to construct the group of peer funds for comparative purposes. In addition, the Board considered information provided by New York Life Investments and WMC on fees charged to other investment advisory clients, including
institutional separate accounts and/or other funds that follow investment strategies similar to those of the Portfolio, if any. The Board considered the contractual management fee schedules of the Portfolio as compared to those of such other investment advisory clients, taking into account the rationale for any differences in fee schedules. The Board also took into account information provided by New York Life Investments about the more extensive scope of services provided to registered investment companies, such as the Portfolio, as compared with other investment advisory clients. Additionally, the Board considered the impact of contractual breakpoints on the Portfolio’s net management fee and expenses. The Board also considered that in proposing fees for the Portfolio, New York Life Investments considers the competitive marketplace for mutual funds. The Board noted that New York Life Investments proposed an additional management fee and subadvisory fee breakpoint for the Portfolio, effective May 1, 2023.
Based on the factors outlined above, among other considerations, the Board concluded that the Portfolio’s management fee and total ordinary operating expenses are within a range that is competitive and support a conclusion that these fees and expenses are reasonable.
Economies of Scale
The Board considered information regarding economies of scale, including whether economies of scale may exist for the Portfolio and whether the Portfolio’s expense structure permits any economies of scale to be appropriately shared with the Portfolio’s beneficial shareholders. The Board also considered a report from New York Life Investments, previously prepared at the request of the Board, that addressed economies of scale, including with respect to the mutual fund business generally, and the various ways in which the benefits of economies of scale may be shared with the funds in the MainStay Group of Funds. Although the Board recognized the difficulty of determining economies of scale with precision, the Board acknowledged that economies of scale may be shared with the Portfolio in a number of ways, including, for example, through the imposition of fee breakpoints, initially setting management fee rates at scale or making additional investments to enhance the services provided to the Portfolio. The Board reviewed information from New York Life Investments showing how the Portfolio’s management fee schedule compared to fee schedules of other funds and accounts managed by New York Life Investments. The Board also reviewed information from ISS showing how the Portfolio’s management fee schedule compared with fees paid for similar services by peer funds at varying asset levels.
Based on this information, the Board concluded that economies of scale are appropriately reflected for the benefit of the Portfolio’s beneficial shareholders through the Portfolio’s expense structure and other methods to share benefits from economies of scale.
Board Consideration and Approval of Management Agreement and Subadvisory Agreement (Unaudited) (continued)
Conclusion
On the basis of the information and factors summarized above, among other information and factors deemed relevant by the Trustees, and the evaluation thereof, the Board unanimously voted to approve the continuation of each of the Advisory Agreements.
| 28 | MainStay VP Wellington U.S. Equity Portfolio |
Proxy Voting Policies and Procedures and Proxy Voting Record
The Portfolio is required to file with the SEC its proxy voting record for the 12-month period ending June 30 on Form N-PX. A description of the policies and procedures that are used to vote proxies relating to portfolio securities of the Portfolio is available free of charge upon request by calling 800-598-2019 or visiting the SEC's website at www.sec.gov. The most recent Form N-PX or proxy voting record is available free of charge upon request by calling 800-598-2019; visiting https://www.newyorklifeinvestments.com/investment-products/vp; or visiting the SEC’s website at www.sec.gov.
Shareholder Reports and Quarterly Portfolio Disclosure
The Portfolio is required to file its complete schedule of portfolio holdings with the SEC 60 days after its first and third fiscal quarter on Form N-PORT. The Portfolio's holdings report is available free of charge upon request by calling 800-598-2019 or by visiting the SEC’s website at www.sec.gov.
Board of Trustees and Officers (Unaudited)
The Trustees and officers of the Portfolio are listed below. The Board oversees the MainStay Group of Funds (which consists of MainStay Funds and MainStay Funds Trust), MainStay VP Funds Trust, MainStay MacKay DefinedTerm Municipal Opportunities Fund, MainStay CBRE Global Infrastructure Megatrends Fund, the Manager and the Subadvisors, and elects the officers of the Portfolios who are responsible for the day-to-day operations of the Portfolio. Information pertaining to the Trustees and officers is set forth below. Each Trustee serves until his or her successor
is elected and qualified or until his or her resignation, death or removal. Under the Board’s retirement policy, unless an exception is made, a Trustee must tender his or her resignation by the end of the calendar year during which he or she reaches the age of 75. The business address of each Trustee and officer listed below is 51 Madison Avenue, New York, New York 10010. None of the Trustees are “interested persons” (as defined by the 1940 Act and rules adopted by the SEC thereunder) of the Portfolio (“Independent Trustees”).
| | Name and
Year of Birth | Term of Office,
Position(s) Held and
Length of Service | Principal Occupation(s)
During Past Five Years | Number of
Portfolios in
Fund Complex
Overseen by
Trustee | Other Directorships
Held by Trustee |
| | | | | | |
| | David H. Chow
1957 | MainStay VP Funds Trust: Trustee since January 2016, Advisory Board Member (June 2015 to December 2015) | Founder and CEO, DanCourt Management, LLC since 1999 | 78 | MainStay Funds: Trustee since January 2016, Advisory Board Member (June 2015 to December 2015) (12 Funds);
MainStay Funds Trust: Trustee since January 2016, Advisory Board Member (June 2015 to December 2015) (33 Funds);
MainStay MacKay DefinedTerm Municipal Opportunities Fund: Trustee since January 2016, Advisory Board Member (June 2015 to December 2015);
MainStay CBRE Global Infrastructure Megatrends Fund: Trustee since June 2021;VanEck Vectors Group of Exchange-Traded Funds: Independent Chairman of the Board of Trustees since 2008 and Trustee since 2006 (57 portfolios); and Berea College of Kentucky: Trustee since 2009, Chair of the Committee since 2018 |
| | Susan B. Kerley
1951 | MainStay VP Funds Trust: Chairman since 2017 and Trustee since 2007* | President, Strategic Management Advisors LLC since 1990 | 78 | MainStay Funds: Chairman since 2017 and Trustee since 2007 (12 Funds); MainStay Funds Trust: Chairman since 2017 and Trustee since 1990 (33 Funds)**;
MainStay MacKay DefinedTerm Municipal Opportunities Fund: Chairman since 2017 and Trustee since 2011; MainStay CBRE Global Infrastructure Megatrends Fund: Trustee since June 2021; and Legg Mason Partners Funds: Trustee since 1991 (45 portfolios) |
| | Alan R. Latshaw
1951 | MainStay VP Funds Trust: Trustee since 2007* | Retired; Partner, Ernst & Young LLP (2002 to 2003); Partner, Arthur Andersen LLP (1989 to 2002); Consultant to the MainStay Funds Audit and Compliance Committee (2004 to 2006) | 78 | MainStay Funds: Trustee since 2006 (12 Funds);
MainStay Funds Trust: Trustee since 2007 (33 Funds)**;
MainStay MacKay DefinedTerm Municipal Opportunities Fund: Trustee since 2011; and
MainStay CBRE Global Infrastructure Megatrends Fund: Trustee since June 2021 |
| 30 | MainStay VP Wellington U.S. Equity Portfolio |
| | Name and
Year of Birth | Term of Office,
Position(s) Held and
Length of Service | Principal Occupation(s)
During Past Five Years | Number of
Portfolios in
Fund Complex
Overseen by
Trustee | Other Directorships
Held by Trustee |
| | | | | | |
| | Karen Hammond
1956 | MainStay VP Funds Trust: Trustee since December 2021, Advisory Board Member (June 2021 to December 2021)
| Retired, Managing Director, Devonshire Investors (2007 to 2013); Senior Vice President, Fidelity Management & Research Co. (2005 to 2007); Senior Vice President and Corporate Treasurer, FMR Corp. (2003 to 2005); Chief Operating Officer, Fidelity Investments Japan (2001 to 2003) | 78 | MainStay Funds: Trustee since December 2021, Advisory Board Member (June 2021 to December 2021) (12 Funds);
MainStay Funds Trust: Trustee since December 2021, Advisory Board Member (June 2021 to December 2021) (33 Funds);
MainStay MacKay DefinedTerm Municipal Opportunities Fund: Trustee since December 2021, Advisory Board Member (June 2021 to December 2021);
MainStay CBRE Global Infrastructure Megatrends Fund: Trustee since December 2021, Advisory Board Member (June 2021 to December 2021);
Two Harbors Investment Corp.: Director since 2018; Rhode Island State Investment Commission: Member since 2017; and Blue Cross Blue Shield of Rhode Island: Director since 2019
|
| | Jacques P. Perold
1958 | MainStay VP Funds Trust: Trustee since January 2016, Advisory Board Member (June 2015 to December 2015) | Founder and Chief Executive Officer, CapShift Advisors LLC (since 2018); President, Fidelity Management & Research Company (2009 to 2014); President and Chief Investment Officer, Geode Capital Management, LLC (2001 to 2009) | 78 | MainStay Funds: Trustee since January 2016, Advisory Board Member (June 2015 to December 2015) (12 Funds);
MainStay Funds Trust: Trustee since January 2016, Advisory Board Member (June 2015 to December 2015) (33 Funds); MainStay MacKay DefinedTerm Municipal Opportunities Fund: Trustee since January 2016, Advisory Board Member (June 2015 to December 2015);
MainStay CBRE Global Infrastructure Megatrends Fund: Trustee since June 2021; Allstate Corporation: Director since 2015;
Partners in Health: Trustee since 2019; and
MSCI Inc.: Director since 2017 |
| | Richard S. Trutanic
1952 | MainStay VP Funds Trust: Trustee since 2007* | Chairman and Chief Executive Officer, Somerset & Company (financial advisory firm) since 2004; Managing Director, The Carlyle Group (private investment firm) (2002 to 2004); Senior Managing Director, Partner and Board Member, Groupe Arnault S.A. (private investment firm) (1999 to 2002)
| 78 | MainStay Funds: Trustee since 1994 (12 Funds);
MainStay Funds Trust: Trustee since 2007 (33 Funds)**;
MainStay MacKay DefinedTerm Municipal Opportunities Fund: Trustee since 2011; and
MainStay CBRE Global Infrastructure Megatrends Fund: Trustee since June 2021 |
| * | Includes prior service as a Director of MainStay VP Series Fund, Inc., the predecessor to MainStay VP Funds Trust. |
| ** | Includes prior service as a Director/Trustee of certain predecessor entities to MainStay Funds Trust. |
Board of Trustees and Officers (Unaudited) (continued)
| | Name and
Year of Birth | Position(s) Held and
Length of Service | Principal Occupation(s)
During Past Five Years | |
| | | | | |
| | Kirk C. Lehneis
1974 | President, MainStay VP Funds Trust (since 2017) | Chief Operating Officer and Senior Managing Director (since 2016), New York Life Investment Management LLC and New York Life Investment Management Holdings LLC; Member of the Board of Managers (since 2017) and Senior Managing Director (since 2018), NYLIFE Distributors LLC; Chairman of the Board and Senior Managing Director, NYLIM Service Company LLC (since 2017); Trustee, President and Principal Executive Officer of IndexIQ Trust, IndexIQ ETF Trust and IndexIQ Active ETF Trust (since January 2018); President, MainStay CBRE Global Infrastructure Megatrends Fund (since 2021), MainStay MacKay DefinedTerm Municipal Opportunities Fund, MainStay Funds and MainStay Funds Trust (since 2017); Senior Managing Director, Global Product Development (from 2015-2016); Managing Director, Product Development (from 2010-2015), New York Life Investment Management LLC | |
| | Jack R. Benintende
1964 | Treasurer and Principal Financial and Accounting Officer, MainStay VP Funds Trust (since 2007)** | Managing Director, New York Life Investment Management LLC (since 2007); Treasurer and Principal Financial and Accounting Officer, MainStay CBRE Global Infrastructure Megatrends Fund (since 2021), MainStay MacKay DefinedTerm Municipal Opportunities Fund (since 2011), MainStay Funds Trust (since 2009) and MainStay Funds (since 2007); and Assistant Treasurer, New York Life Investment Management Holdings LLC (2008 to 2012) | |
| | J. Kevin Gao
1967 | Secretary and Chief Legal Officer, MainStay VP Funds Trust (since 2010)** | Managing Director and Associate General Counsel, New York Life Investment Management LLC (since 2010); Secretary and Chief Legal Officer, MainStay CBRE Global Infrastructure Megatrends Fund (since 2021), MainStay MacKay DefinedTerm Municipal Opportunities Fund (since 2011), MainStay Funds and MainStay Funds Trust (since 2010) | |
| | Scott T. Harrington
1959 | Vice President— Administration, MainStay VP Funds Trust (since 2005)** | Managing Director, New York Life Investment Management LLC (including predecessor advisory organizations) (since 2000); Member of the Board of Directors, New York Life Trust Company (since 2009); Vice President—Administration, MainStay CBRE Global Infrastructure Megatrends Fund (since 2021), MainStay MacKay DefinedTerm Municipal Opportunities Fund (since 2011), MainStay Funds Trust and MainStay Funds (since 2009) | |
| | Kevin M. Gleason
1967 | Vice President and Chief Compliance Officer, MainStay VP Funds Trust (since June 2022) | Vice President and Chief Compliance Officer, IndexIQ, IndexIQ ETF Trust and Index IQ Active ETF Trust (since June 2022); Vice President and Chief Compliance Officer, MainStay CBRE Global Infrastructure Megatrends Fund, MainStay MacKay DefinedTerm Municipal Opportunities Fund (since June 2022); MainStay Funds Trust and MainStay Funds (since June 2022); Senior Vice President, Voya Investment Management and Chief Compliance Officer, Voya Family of Funds (2012-2022) | |
| * | The officers listed above are considered to be “interested persons” of the MainStay Group of Funds, MainStay VP Funds Trust, MainStay CBRE Global Infrastructure Megatrends Fund and MainStay MacKay DefinedTerm Municipal Opportunities Fund within the meaning of the 1940 Act because of their affiliation with the MainStay Group of Funds, New York Life Insurance Company and/or its affiliates, including New York Life Investment Management LLC, NYLIM Service Company LLC, NYLIFE Securities LLC and/or NYLIFE Distributors LLC, as described in detail in the column captioned “Principal Occupation(s) During Past Five Years.” Officers are elected annually by the Board. |
| ** | Includes prior service as an Officer of MainStay VP Series Fund, Inc., the predecessor to MainStay VP Funds Trust. |
Officers of the Trust (Who are not Trustees)*
| 32 | MainStay VP Wellington U.S. Equity Portfolio |
This page intentionally left blank.
This page intentionally left blank.
MainStay VP Portfolios
MainStay VP offers a wide range of Portfolios. The full array of MainStay VP offerings is listed here, with information about the manager, subadvisors, legal counsel, and independent registered public accounting firm.
Equity
MainStay VP American Century Sustainable Equity Portfolio1
MainStay VP Candriam Emerging Markets Equity Portfolio
MainStay VP Epoch U.S. Equity Yield Portfolio
MainStay VP Fidelity Institutional AM® Utilities Portfolio†
MainStay VP MacKay International Equity Portfolio
MainStay VP Natural Resources Portfolio
MainStay VP S&P 500 Index Portfolio2
MainStay VP Small Cap Growth Portfolio
MainStay VP Wellington Growth Portfolio
MainStay VP Wellington Mid Cap Portfolio
MainStay VP Wellington Small Cap Portfolio
MainStay VP Wellington U.S. Equity Portfolio
MainStay VP Winslow Large Cap Growth Portfolio
Mixed Asset
MainStay VP Balanced Portfolio
MainStay VP Income Builder Portfolio
MainStay VP Janus Henderson Balanced Portfolio
MainStay VP MacKay Convertible Portfolio
Income
MainStay VP Bond Portfolio
MainStay VP Floating Rate Portfolio
MainStay VP Indexed Bond Portfolio
MainStay VP MacKay Government Portfolio
MainStay VP MacKay High Yield Corporate Bond Portfolio
MainStay VP MacKay Strategic Bond Portfolio
MainStay VP PIMCO Real Return Portfolio
Money Market
MainStay VP U.S. Government Money Market Portfolio
Alternative
MainStay VP CBRE Global Infrastructure Portfolio
MainStay VP IQ Hedge Multi-Strategy Portfolio
Asset Allocation
MainStay VP Conservative Allocation Portfolio
MainStay VP Equity Allocation Portfolio
MainStay VP Growth Allocation Portfolio
MainStay VP Moderate Allocation Portfolio
Manager
New York Life Investment Management LLC
New York, New York
Subadvisors
American Century Investment Management, Inc.
Kansas City, Missouri
Brown Advisory LLC
Baltimore, Maryland
Candriam*
Strassen, Luxembourg
CBRE Investment Management Listed Real Assets LLC
Radnor, Pennsylvania
Epoch Investment Partners, Inc.
New York, New York
FIAM LLC
Smithfield, Rhode Island
IndexIQ Advisors LLC*
New York, New York
Janus Henderson Investors US LLC
Denver, Colorado
MacKay Shields LLC*
New York, New York
Newton Investment Management North America, LLC
Boston, Massachusetts
NYL Investors LLC*
New York, New York
Pacific Investment Management Company LLC
Newport Beach, California
Segall Bryant & Hamill, LLC
Chicago, Illinois
Wellington Management Company LLP
Boston, Massachusetts
Winslow Capital Management, LLC
Minneapolis, Minnesota
Legal Counsel
Dechert LLP
Washington, District of Columbia
Independent Registered Public Accounting Firm
PricewaterhouseCoopers LLP
New York, New York
Distributor
NYLIFE Distributors LLC*
Jersey City, New Jersey
Custodian
JPMorgan Chase Bank, N.A.
New York, New York
Some Portfolios may not be available in all products.
† Fidelity Institutional AM is a registered trade mark of FMR LLC. Used with permission.
* An affiliate of New York Life Investment Management LLC.
| 1. | Prior to May 1, 2022, the Portfolio's name was MainStay VP T. Rowe Price Equity Income Portfolio. |
| 2. | Prior to May 1, 2022, the Portfolio's name was MainStay VP MacKay S&P 500 Index Portfolio. |
Not part of the Annual Report
2022 Annual Report
This report is for the general information of New York Life Variable Annuities and NYLIAC Variable Universal Life Insurance Products policyowners. It must be preceded or accompanied by the appropriate product(s) and funds prospectuses if it is given to anyone who is not an owner of a New York Life variable annuity policy or a NYLIAC Variable Universal Life Insurance Product. This report does not offer for sale or solicit orders to purchase securities.
The performance data quoted in this report represents past performance. Past performance is no guarantee of future results. Due to market volatility and other factors, current performance may be lower or higher than the figures shown. The most recent month-end performance summary for your variable annuity or variable life policy is available by calling 800-598-2019 and is updated periodically on newyorklife.com.
The New York Life Variable Annuities and NYLIAC Variable Universal Life Insurance Products are issued by New York Life Insurance and Annuity Corporation (a Delaware Corporation) and distributed by NYLIFE Distributors LLC (Member FINRA/SIPC).
New York Life Insurance Company
New York Life Insurance and Annuity
Corporation (NYLIAC) (A Delaware Corporation)
51 Madison Avenue, Room 551
New York, NY 10010
newyorklife.com
newyorklifeinvestments.com
NYLIFE Distributors LLC, 30 Hudson Street, Jersey City, NJ 07302
New York Life Investment Management LLC is the investment manager to the MainStay VP Funds Trust
©2023 by NYLIFE Distributors LLC. All rights reserved.
You may obtain copies of the Prospectus and the Statement of Additional Information free of charge, upon request, by calling toll-free 800-598-2019 or writing to New York Life Insurance and Annuity Corporation, 51 Madison Avenue, New York, NY 10010.
| Not FDIC Insured | No Bank Guarantee | May Lose Value |
(NYLIAC) NI511
MainStay VP Small Cap Growth Portfolio
Message from the President and Annual Report
December 31, 2022
Sign up for e-delivery of your shareholder reports. For full details on e-delivery, including who can participate and what you can receive via e-delivery,
please log in to newyorklifeinvestments.com/accounts.
| Not FDIC/NCUA Insured | Not a Deposit | May Lose Value | No Bank Guarantee | Not Insured by Any Government Agency |
This page intentionally left blank
Message from the President
The 12-month reporting period ended December 31, 2022, proved exceptionally challenging for investors as both stock and bond markets suffered steep declines. A variety of economic and geopolitical forces drove the market’s losses, all centered around rising inflation and monetary efforts to rein it in.
Inflationary alarms began to sound well before the reporting period began. In late 2021, after nearly two years of accommodative policies designed to encourage economic growth in the face of the COVID-19 pandemic, the U.S. Federal Reserve (the “Fed”) warned of the increasing need to tighten monetary policy. Nevertheless, the pace and persistence of inflation in early 2022 caught most market participants—the Fed included—off guard. Russia’s invasion of Ukraine in February exacerbated global inflationary pressures while increasing investor uncertainty. Domestic supply shortages, international trade imbalances and rising inflation caused U.S. GDP (gross domestic product) to contract in the first and second quarters of the year, although employment and consumer spending proved resilient. Prices for petroleum surged to multi-year highs, while many key agricultural chemicals and industrial metals soared as well. Accelerating inflationary forces prompted the Fed to implement its most aggressive series of interest rate hikes since the 1980s, with a 0.25% increase in March followed by six further rate increases totaling 4.25%. International central banks generally followed suit and raised rates by varying degrees in efforts to curb local inflation, although most increases remained significantly more modest than those in the United States. Relatively high U.S. interest rates and an international risk averse sentiment pushed U.S. dollar values higher compared to most other currencies, with negative impacts on global prices for food, fuel and other key U.S.-dollar-denominated products.
The effects of these interrelated challenges were felt throughout U.S. and international financial markets. The S&P 500® Index, a widely regarded benchmark of market performance, declined by more than 18% during the reporting period. Although the energy sector generated strong gains, bolstered by elevated oil and gas prices, most other industry segments recorded losses. The more cyclical and growth-oriented sectors of consumer discretionary, information technology and real estate delivered the weakest returns, while the traditionally defensive and value-oriented
consumer staples, utilities and health care sectors outperformed. On average, international developed-country equity markets mildly outperformed their U.S. counterparts, while emerging markets lagged slightly. Fixed-income markets proved unusually volatile, with bond prices trending sharply lower as yields rose along with interest rates. Short-term yields rose faster than long-term yields, producing a yield curve inversion from July through the end of the reporting period as long-term rates remained below short-term rates. While floating-rate instruments, which feature variable interest rates that allow investors to benefit from a rising rate environment, provided a degree of insulation from inflation-driven trends, they were not immune to the market’s widespread declines.
Although, according to the most recent estimates, the annualized inflation rate in the United States has declined from a peak of 9.1% in July 2022 to 6.5% in December, the Fed remains focused on achieving more substantial and lasting reductions, aiming for a target rate of 2%. As a result, further rate hikes and additional market volatility are potential headwinds in the coming months. The question remains as to whether the Fed and other central banks will manage a so-called “soft landing,” curbing inflation while avoiding a persistent economic slowdown. If they prove successful, we believe that the increasingly attractive valuations we have observed in both equity and bond markets should eventually translate into sustainable improvements in the investment environment.
Whatever actions the Fed takes and however financial markets react, as a MainStay VP investor you can depend on us to continue managing our portfolios with the insight, expertise and level of service that have long defined New York Life Investments. Thank you for trusting us to help you meet your investment needs.
Sincerely,
Kirk C. Lehneis
President
The opinions expressed are as of the date of this report and are subject to change. There is no guarantee that any forecast made will come to pass. This material does not constitute investment advice and is not intended as an endorsement of any specific investment. Past performance is no guarantee of future results.
Not part of the Annual Report
Investors should refer to the Portfolio’s Summary Prospectus and/or Prospectus and consider the Portfolio’s investment objectives, strategies, risks, charges and expenses carefully before investing. The Summary Prospectus and/or Prospectus contain this and other information about the Portfolio. You may obtain copies of the Portfolio’s Summary Prospectus, Prospectus and Statement of Additional Information, which includes information about the MainStay VP Funds Trust's Trustees, free of charge, upon request, by calling toll-free 800-598-2019, by writing to New York Life Insurance and Annuity Corporation, 51 Madison Avenue, Room 251, New York, New York 10010 or by sending an email to MainStayShareholdersServices@nylim.com. These documents are also available at newyorklifeinvestments.com/investment-products/vp. Please read the Portfolio's Summary Prospectus and/or Prospectus carefully before investing. MainStay VP Funds Trust portfolios are separate account options which are purchased through a variable insurance or variable annuity contract.
Investment and Performance Comparison (Unaudited)
Performance data quoted represents past performance. Past performance is no guarantee of future results. Because of market volatility and other factors, current performance may be lower or higher than the figures shown. Investment return and principal value will fluctuate, and as a result, when shares are redeemed, they may be worth more or less than their original cost. The performance table and graph do not reflect any deduction of sales charges, mortality and expense charges, contract charges or administrative charges. Please refer to the Performance Summary appropriate for your policy. For performance information current to the most recent month-end, please call 800-598-2019 or visit www.newyorklife.com.
Performance figures may reflect certain fee waivers and/or expense limitations, without which total returns may have been different. For information on current fee waivers and/or expense limitations (if any), please refer to the Notes to Financial Statements.
| Average Annual Total Returns for the Year-Ended December 31, 2022 |
| Class | Inception
Date1 | One
Year | Five
Years | Ten
Years | Gross
Expense
Ratio2 |
| Initial Class Shares | 2/17/2012 | -26.49% | 5.45% | 8.88% | 0.84% |
| Service Class Shares | 2/17/2012 | -26.67 | 5.18 | 8.61 | 1.09 |
| 1. | The Portfolio replaced its subadvisor and modified its principal investment strategies as of May 1, 2020. Therefore, the performance information shown in this report prior to May 1, 2020 reflects the Portfolio’s prior subadvisor and its principal investment strategies. |
| 2. | The gross expense ratios presented reflect the Portfolio’s “Total Annual Portfolio Operating Expenses” from the most recent Prospectus and may differ from other expense ratios disclosed in this report. |
| Benchmark Performance* | One
Year | Five
Years | Ten
Years |
| Russell 2000® Growth Index1 | -26.36% | 3.51% | 9.20% |
| Morningstar Small Growth Category Average2 | -28.14 | 5.59 | 9.59 |
| * | Returns for indices reflect no deductions for fees, expenses or taxes, except for foreign withholding taxes where applicable. Results assume reinvestment of all dividends and capital gains. An investment cannot be made directly in an index. |
| 1. | The Russell 2000® Growth Index is the Portfolio’s primary benchmark. The Russell 2000® Growth Index is a broad-based benchmark that measures the performance of the small-cap growth segment of the U.S. equity universe. It includes those Russell 2000® Index companies with higher price-to-book ratios and higher forecasted growth values. |
| 2. | The Morningstar Small Growth Category Average is representative of funds that focus on faster-growing companies whose shares are at the lower end of the market-capitalization range. These funds tend to favor companies in up-and-coming industries or young firms in their early growth stages. Results are based on average total returns of similar funds with all dividends and capital gain distributions reinvested. |
Cost in Dollars of a $1,000 Investment in MainStay VP Small Cap Growth Portfolio (Unaudited)
The example below is intended to describe the fees and expenses borne by shareholders during the six-month period from July 1, 2022 to December 31, 2022, and the impact of those costs on your investment.
Example
As a shareholder of the Portfolio you incur two types of costs: (1) transaction costs, including exchange fees and sales charges (loads) on purchases (as applicable), and (2) ongoing costs, including management fees, distribution and/or service (12b-1) fees and other Portfolio expenses (as applicable). This example is intended to help you understand your ongoing costs (in dollars) of investing in the Portfolio and to compare these costs with the ongoing costs of investing in other mutual funds. The example is based on an investment of $1,000 made at the beginning of the six-month period and held for the entire period from July 1, 2022 to December 31, 2022. Shares are only sold in connection with variable life and annuity contracts and the example does not reflect any contract level or transactional fees or expenses. If these costs had been included, your costs would have been higher.
This example illustrates your Portfolio’s ongoing costs in two ways:
Actual Expenses
The second and third data columns in the table below provide information about actual account values and actual expenses. You may use the information in these columns, together with the amount you invested, to estimate the expenses that you paid during the six months ended
December 31, 2022. Simply divide your account value by $1,000 (for example, an $8,600 account value divided by $1,000 = 8.6), then multiply the result by the number under the heading entitled “Expenses Paid During Period” to estimate the expenses you paid on your account during this period.
Hypothetical Example for Comparison Purposes
The fourth and fifth data columns in the table below provide information about hypothetical account values and hypothetical expenses based on the Portfolio’s actual expense ratio and an assumed rate of return of 5% per year before expenses, which is not the Portfolio’s actual return. The hypothetical account values and expenses may not be used to estimate the actual ending account balances or expenses you paid for the six-month period shown. You may use this information to compare the ongoing costs of investing in the Portfolio with the ongoing costs of investing in other mutual funds. To do so, compare this 5% hypothetical example with the 5% hypothetical examples that appear in the shareholder reports of the other mutual funds.
Please note that the expenses shown in the table are meant to highlight your ongoing costs only and do not reflect any transactional costs, such as exchange fees or sales charges (loads). Therefore, the fourth and fifth data columns of the table are useful in comparing ongoing costs only and will not help you determine the relative total costs of owning different funds. In addition, if these transactional costs were included, your costs would have been higher.
| Share Class | Beginning
Account
Value
7/1/22 | Ending Account
Value (Based
on Actual
Returns and
Expenses)
12/31/22 | Expenses
Paid
During
Period1 | Ending Account
Value (Based
on Hypothetical
5% Annualized
Return and
Actual Expenses)
12/31/22 | Expenses
Paid
During
Period1 | Net Expense
Ratio
During
Period2 |
| Initial Class Shares | $1,000.00 | $1,018.20 | $4.27 | $1,020.97 | $4.28 | 0.84% |
| Service Class Shares | $1,000.00 | $1,016.90 | $5.54 | $1,019.71 | $5.55 | 1.09% |
| 1. | Expenses are equal to the Portfolio’s annualized expense ratio of each class multiplied by the average account value over the period, divided by 365 and multiplied by 184 (to reflect the six-month period). The table above represents the actual expenses incurred during the six-month period. In addition to the fees and expenses which the Portfolio bears directly, it also indirectly bears a pro rata share of the fees and expenses of the underlying funds in which it invests. Such indirect expenses are not included in the above-reported expense figures. |
| 2. | Expenses are equal to the Portfolio's annualized expense ratio to reflect the six-month period. |
| 6 | MainStay VP Small Cap Growth Portfolio |
Industry Composition as of December 31, 2022 (Unaudited)
| Software | 8.6% |
| Health Care Equipment & Supplies | 7.1 |
| IT Services | 7.1 |
| Health Care Providers & Services | 6.6 |
| Commercial Services & Supplies | 6.2 |
| Semiconductors & Semiconductor Equipment | 5.1 |
| Biotechnology | 4.5 |
| Hotels, Restaurants & Leisure | 3.9 |
| Chemicals | 3.7 |
| Life Sciences Tools & Services | 3.5 |
| Aerospace & Defense | 2.3 |
| Equity Real Estate Investment Trusts | 2.3 |
| Capital Markets | 2.2 |
| Energy Equipment & Services | 2.2 |
| Diversified Consumer Services | 2.1 |
| Oil, Gas & Consumable Fuels | 1.9 |
| Construction & Engineering | 1.9 |
| Building Products | 1.8 |
| Professional Services | 1.6 |
| Electronic Equipment, Instruments & Components | 1.6 |
| Insurance | 1.6 |
| Banks | 1.4 |
| Food Products | 1.4 |
| Machinery | 1.4% |
| Exchange–Traded Fund | 1.4 |
| Food & Staples Retailing | 1.2 |
| Specialty Retail | 1.2 |
| Road & Rail | 1.0 |
| Interactive Media & Services | 1.0 |
| Leisure Products | 0.8 |
| Health Care Technology | 0.8 |
| Auto Components | 0.7 |
| Trading Companies & Distributors | 0.7 |
| Media | 0.6 |
| Communications Equipment | 0.6 |
| Diversified Telecommunication Services | 0.6 |
| Household Durables | 0.5 |
| Pharmaceuticals | 0.4 |
| Internet & Direct Marketing Retail | 0.3 |
| Entertainment | 0.3 |
| Real Estate Management & Development | 0.2 |
| Short–Term Investments | 7.6 |
| Other Assets, Less Liabilities | –1.9 |
| | 100.0% |
See Portfolio of Investments beginning on page 11 for specific holdings within these categories. The Portfolio's holdings are subject to change.
Top Ten Holdings and/or Issuers Held as of December 31, 2022 (excluding short-term investments) (Unaudited)
| 1. | Workiva, Inc. |
| 2. | Envestnet, Inc. |
| 3. | Genpact Ltd. |
| 4. | Waste Connections, Inc. |
| 5. | Churchill Downs, Inc. |
| 6. | Blackline, Inc. |
| 7. | Bright Horizons Family Solutions, Inc. |
| 8. | Power Integrations, Inc. |
| 9. | Prosperity Bancshares, Inc. |
| 10. | SPDR S&P Biotech ETF |
Portfolio Management Discussion and Analysis (Unaudited)
Answers to the questions reflect the views of Brian C. Fitzsimons, CFA, and Mitch S. Begun, CFA, of Segall Bryant & Hamill, LLC (“SBH”), one of the Portfolio’s Subadvisors, and Christopher A. Berrier and George Sakellaris, CFA, of Brown Advisory LLC (“Brown Advisory”), the Portfolio’s other Subadvisor.
How did MainStay VP Small Cap Growth Portfolio perform relative to its benchmark and peers during the 12 months ended December 31, 2022?
For the 12 months ended December 31, 2022, MainStay VP Small Cap Growth Portfolio returned −26.49% for Initial Class shares and −26.67% for Service Class shares. Over the same period, both share classes underperformed the −26.36% return of the Russell 2000® Growth Index (“the Index”), which is the Portfolio’s benchmark, and outperformed the −28.14% return of the Morningstar Small Growth Category Average.1
What factors affected the Portfolio’s relative performance during the reporting period?
SBH
The portion of the Portfolio subadvised by SBH underperformed the Index during the reporting period, primarily due to security selection. Although less impactful, sector allocation also had a negative impact on performance. Cash allocation positively impacted performance, providing an offset to relative returns.
Brown Advisory
During the reporting period, the portion of the Portfolio subadvised by Brown Advisory demonstrated solid downside capture2, primarily through positive stock selection, driving outperformance compared to the Index. For some time, we have held a skeptical view regarding valuations of the small-cap growth complex and the validity of certain businesses contained within the segment. Given this perspective, and our investment philosophy focused on finding high-quality businesses at appropriate valuations, the Portfolio entered the reporting period tilted away from companies that we believed had extended valuations. Indeed, the reporting period saw a cleansing of a good deal of the excess valuations embedded in the small-cap growth space. The strong rebound of the quality factor bolstered the Portfolio’s relative performance.
Which sectors were the strongest positive contributors to the Portfolio’s relative performance, and which sectors were particularly weak?
SBH
Relative to the Index, the sectors that made the strongest positive contributions to the performance of the portion of the Portfolio subadvised by SBH were real estate and information technology. (Contributions take weightings and total returns into account.) The sectors that detracted most from relative performance during the reporting period were energy, financials and industrials. Energy was the only sector in the Index that generated positive returns
during the reporting period; all other sectors produced negative returns.
Brown Advisory
The three sectors making the strongest contributions to the relative performance of the portion of the Portfolio subadvised by Brown Advisory were information technology, industrials and financials. Financial holdings posted modestly positive absolute returns for the reporting period, while information technology and industrials holdings posted negative absolute returns. In all three sectors, the majority of the Portfolio’s strong performance relative to the Index was the result of stock selection; however underweight exposure to information technology and overweight exposure to industrials also enhanced returns.
The three weakest contributors were energy, materials and telecommunications. While energy was the only sector in the Index to post positive absolute returns during the reporting period, the portion of the Portfolio subadvised by Brown Advisory held a much smaller allocation to energy than the Index, making energy the most significant detractor from relative performance.
During the reporting period, which individual stocks made the strongest positive contributions to the Portfolio’s absolute performance and which stocks detracted the most?
SBH
The three strongest performing holdings in the portion of the Portfolio subadvised by SBH included biotechnology company Turning Point Therapeutics, enterprise planning software provider Anaplan and outsourced clinical development services provider Medpace Holdings. Turning Point Therapeutics and Anaplan outperformed upon announcing they would be acquired—Turning Point Therapeutics by pharmaceutical company Bristol Myers Squibb and Anaplan by private equity firm Thoma Bravo—at premiums to their pre-acquisition stock prices. Despite fears regarding a slowing funding environment for early-stage biotechnology companies, Medpace continued to see strong demand for its services. The company expects growth to remain strong into 2023, fueled by its large and growing backlog of contracted business. While we believe the long-term outlook remains strong, we trimmed the Portfolio’s holdings to better align the position size with our risk/reward expectations. Both Turning Point Therapeutics and Anaplan were sold during the reporting period, while Medpace remained in the Portfolio as of the end of 2022.
The stocks that detracted most from absolute performance were pharmacy automation tools and services provider Omnicell,
| 1. | See page 5 for more information on benchmark and peer group returns. |
| 2. | The downside capture ratio is a statistical measure of an investment manager's overall performance in down-markets. The ratio is used to evaluate how well an investment manager performed relative to an index during periods when that index has dropped. |
| 8 | MainStay VP Small Cap Growth Portfolio |
independent insurance agency Goosehead and information technology services provider Endava. Omnicell reported an abrupt and unexpected slowdown in customer demand. The company’s customer base of large health systems came under considerable financial strain, slowing implementation of Omnicell’s products and services. We sold the Portfolio’s position because of what we perceived as the highly uncertain outlook for the company over the next 12–18 months. Goosehead shares lagged as continued growth investments in the business created margin pressure, along with concerns that a slowdown in housing could reduce demand for new policies. In addition, turnover in management was met with great skepticism. We increased the Portfolio’s position earlier in the year, prior to the management turnover, as we believed the business pressures would prove temporary. Despite strong growth and profitability, Endava shares underperformed, largely due to a compression in valuations for growth companies as interest rates rose. We added to the Portfolio’s Endava position in the first half of the year, as we believed the long-term growth prospects for digital transformation services remain attractive. Other noteworthy detractors from performance included composite decking solutions provider AZEK and enterprise security software company Rapid7. AZEK shares underperformed as housing end markets slowed materially with the rise in interest rates. The Portfolio continued to hold a position in AZEK as of the end of the reporting period. Rapid7 shares struggled due to the company’s sales execution missteps and increasing competitive pressures. We exited the Portfolio’s position in the fourth quarter of 2022.
Brown Advisory
The three strongest performing holdings in the portion of the Portfolio subadvised by Brown Advisory included global payment facilitator and processor EVO Payments, pharmaceutical company Neurocrine Biosciences, and oil & gas drilling chemicals and equipment producer ChampionX. EVO Payments shares rose after the company entered into an agreement to be acquired by Global Payments in an all-cash transaction at a premium to EVO’s pre-acquisition share price. We expect the transaction to close in early 2023. Shares in Neurocrine Biosciences benefited from a return to growth of the company’s lead commercial asset, tardive dyskinesia treatment Ingrezza, which had seen sales hampered by the COVID-19 pandemic. ChampionX shares were bolstered by the positive energy cycle, with high commodity prices, strong demand and constrained supply breathing life into a new capital deployment strategy that included both dividends and share repurchases.
The stocks that detracted most from absolute performance were child care and educational services provider Bright Horizons Family Solutions, genetic and molecular testing services company NeoGenomics and semiconductor supplies manufacturer Entegris. Bright Horizons Family Solutions shares gave back all of a post-COVID-19 bounce due to a longer-than-anticipated recovery
in return-to-office rates, along with a labor shortage that both constrained enrollment and pressured profitability. NeoGenomics shares struggled throughout 2022 with external, pandemic-driven headwinds, as well as internal operating challenges and inefficiencies. With improving clinical testing volumes, a new and experienced management team, and a business optimization plan, we believe the company’s long-term fundamental performance is likely to greatly improve. Entegris shares gave back previous gains as the semiconductor cycle rolled over. We remain intrigued by the company’s acquisition of CMC Materials, consolidating an already consolidated industry even further.
Did the Portfolio make any significant purchases or sales during the reporting period?
SBH
Significant new purchases during the reporting period included positions in information technology services provider Globant, Medpace (described above), skilled nursing facility operator The Ensign Group and insurance provider Kinsale Capital Group. Globant was a previous holding that we believed offered a long-tailed growth opportunity through its digital transformation services, however, we sold the Portfolio’s position near the end of 2021 as it rose out of the investable market-cap range. The significant selloff in the markets during the reporting period provided an opportunity to reestablish a position in the first half of 2022. Medpace focuses its efforts on smaller biopharmaceutical companies, which are increasingly outsourcing clinical activities to category leaders like Medpace. Ensign appears positioned to benefit from attractive organic and inorganic growth opportunities in the high-quality, skilled nursing facilities market. Kinsale is a leader in the niche excess & surplus insurance market for businesses. We like the company’s long growth runway in a large underpenetrated market and believe Kinsale’s strong technology/systems are a true underwriting differentiator versus its peers.
Significant sales included positions in Anaplan (described above), health care communications technology provider Vocera Communications, and Turning Point Therapeutics (also described above) following announcements that each of the companies would be acquired. Other significant sales included pet insurance provider Trupanion and golf company Topgolf Callaway Brands. We exited the Portfolio’s Trupanion position due to concerns about the sustainability of strong policy growth during the pandemic resulting from greater pet ownership. We sold the Portfolio’s Topgolf position over concerns regarding the company’s debt leverage amid a rapidly deteriorating consumer spending environment.
Brown Advisory
Significant purchases included shares in ChampionX (described above), visual discovery engine company Pinterest and
independent energy oil & gas producer Denbury. ChampionX was created when Apergy and ChampionX (a former division of Ecolab) combined in June of 2020. While both Apergy and ChampionX were strong performers in their respective market prior to the merger, we believe the newly formed entity should exhibit increased global scale and structurally higher EBITDA (earnings before interest, taxes, depreciation and amortization) margins, given the sizable operating synergies expected to be realized over time. Pinterest offers content that we believe is highly aligned with advertising. The company has a new CEO, who we believe will unlock value by innovating faster than his predecessor and focusing on what users and advertisers need. Denbury leverages enhanced oil recovery (EOR) capabilities, using downhole carbon dioxide injection techniques to produce oil from depleted fields. We believe this expertise has primed the company to take advantage of growing demand for carbon sequestration.
Significant sales included positions in drug delivery and technology company Catalent, semiconductor equipment company CMC Materials and online gaming company Zynga. We exited the Portfolio’s investment in Catalent as our thesis had largely played out. CMC Materials was acquired by Entegris, and Zynga was acquired by Take-Two Interactive Software.
How did the Portfolio’s sector weightings change during the reporting period?
SBH
The portion of the Portfolio subadvised by SBH saw its largest sector increases relative to the Index in information technology and real estate. In our view, the underperformance of the information technology sector provided attractive opportunities for new purchases and additions to existing positions during the reporting period. The relative increase in real estate was due to the sector’s strong performance, as well as additions made to current holdings.
The most significant sector decreases relative to the Index occurred in financials and energy. Among financials, relative weighting declined due to sector underperformance, along with the sale of certain holdings based on fundamental concerns. Although the Portfolio made three purchases in the energy sector, the relative weighting decreased as the sector’s representation in the Index rose significantly.
Brown Advisory
Relative to the Index, the portion of the Portfolio subadvised by Brown Advisory trimmed its overweight exposure to the industrials sector. Conversely, we increased information technology exposure,
reducing the magnitude of the Portfolio’s underweight position in the sector.
How was the Portfolio positioned at the end of the reporting period?
SBH
As of December 31, 2022, the portion of the Portfolio subadvised by SBH held overweight exposure, relative to the Index, in the information technology and financials sectors, and underweight exposure primarily in energy and consumer staples.
Brown Advisory
As of December 31, 2022, the portion of the Portfolio subadvised by Brown Advisory held overweight exposure to the industrials and health care sectors. As of the same date, the Portfolio held underweight exposure to information technology, energy and materials.
The opinions expressed are those of the portfolio managers as of the date of this report and are subject to change. There is no guarantee that any forecasts will come to pass. This material does not constitute investment advice and is not intended as an endorsement of any specific investment.
Not all MainStay VP Portfolios and/or share classes are available under all policies.
| 10 | MainStay VP Small Cap Growth Portfolio |
Portfolio of Investments December 31, 2022†
| | Shares | Value |
| Common Stocks 92.9% |
| Aerospace & Defense 2.3% |
| Hexcel Corp. | 64,720 | $ 3,808,772 |
| Kratos Defense & Security Solutions, Inc. (a) | 192,655 | 1,988,199 |
| Mercury Systems, Inc. (a) | 34,631 | 1,549,391 |
| Woodward, Inc. | 28,442 | 2,747,782 |
| | | 10,094,144 |
| Auto Components 0.7% |
| Fox Factory Holding Corp. (a) | 30,102 | 2,746,206 |
| XPEL, Inc. (a) | 6,906 | 414,774 |
| | | 3,160,980 |
| Banks 1.4% |
| Prosperity Bancshares, Inc. (b) | 86,273 | 6,270,322 |
| Biotechnology 4.5% |
| Abcam plc, Sponsored ADR (a) | 199,288 | 3,100,921 |
| Ascendis Pharma A/S, ADR (a) | 14,341 | 1,751,466 |
| Avid Bioservices, Inc. (a) | 143,575 | 1,977,028 |
| Biohaven Ltd. (a)(b) | 12,277 | 170,405 |
| Blueprint Medicines Corp. (a) | 54,892 | 2,404,819 |
| Fate Therapeutics, Inc. (a) | 60,844 | 613,916 |
| Karuna Therapeutics, Inc. (a) | 8,736 | 1,716,624 |
| Natera, Inc. (a) | 52,102 | 2,092,937 |
| Neurocrine Biosciences, Inc. (a) | 35,493 | 4,239,284 |
| Xencor, Inc. (a) | 57,006 | 1,484,436 |
| | | 19,551,836 |
| Building Products 1.8% |
| AZEK Co., Inc. (The) (a) | 171,673 | 3,488,395 |
| Simpson Manufacturing Co., Inc. | 24,528 | 2,174,653 |
| Zurn Elkay Water Solutions Corp. | 108,233 | 2,289,128 |
| | | 7,952,176 |
| Capital Markets 2.2% |
| Hamilton Lane, Inc., Class A | 50,987 | 3,257,049 |
| Houlihan Lokey, Inc. | 44,723 | 3,898,057 |
| StepStone Group, Inc., Class A | 102,615 | 2,583,846 |
| | | 9,738,952 |
| Chemicals 3.7% |
| Avient Corp. | 65,406 | 2,208,107 |
| HB Fuller Co. | 61,739 | 4,421,747 |
| Innospec, Inc. | 31,573 | 3,247,599 |
| Livent Corp. (a) | 130,330 | 2,589,657 |
| Quaker Chemical Corp. | 21,537 | 3,594,525 |
| | | 16,061,635 |
| | Shares | Value |
| |
| Commercial Services & Supplies 6.2% |
| Casella Waste Systems, Inc., Class A (a) | 13,439 | $ 1,065,847 |
| IAA, Inc. (a) | 42,329 | 1,693,160 |
| Montrose Environmental Group, Inc. (a) | 48,415 | 2,149,142 |
| MSA Safety, Inc. | 23,531 | 3,392,935 |
| Rentokil Initial plc, Sponsored ADR | 75,147 | 2,315,279 |
| Ritchie Bros Auctioneers, Inc. | 56,657 | 3,276,474 |
| Tetra Tech, Inc. | 38,521 | 5,592,864 |
| Waste Connections, Inc. | 56,066 | 7,432,109 |
| | | 26,917,810 |
| Communications Equipment 0.6% |
| Infinera Corp. (a)(b) | 398,000 | 2,682,520 |
| Construction & Engineering 1.9% |
| Ameresco, Inc., Class A (a) | 33,790 | 1,930,760 |
| Comfort Systems USA, Inc. | 27,986 | 3,220,629 |
| Valmont Industries, Inc. | 9,549 | 3,157,568 |
| | | 8,308,957 |
| Diversified Consumer Services 2.1% |
| Bright Horizons Family Solutions, Inc. (a) | 105,277 | 6,642,979 |
| Mister Car Wash, Inc. (a)(b) | 290,405 | 2,680,438 |
| | | 9,323,417 |
| Diversified Telecommunication Services 0.6% |
| Cogent Communications Holdings, Inc. | 42,328 | 2,416,082 |
| Electronic Equipment, Instruments & Components 1.6% |
| Littelfuse, Inc. | 10,262 | 2,259,693 |
| Novanta, Inc. (a) | 35,891 | 4,876,510 |
| | | 7,136,203 |
| Energy Equipment & Services 2.2% |
| Cactus, Inc., Class A | 95,235 | 4,786,511 |
| ChampionX Corp. | 158,227 | 4,587,001 |
| | | 9,373,512 |
| Entertainment 0.3% |
| Take-Two Interactive Software, Inc. (a) | 14,357 | 1,494,994 |
| Equity Real Estate Investment Trusts 2.3% |
| Americold Realty Trust, Inc. | 99,534 | 2,817,808 |
| EastGroup Properties, Inc. | 22,183 | 3,284,415 |
| Terreno Realty Corp. | 70,137 | 3,988,691 |
| | | 10,090,914 |
| Food & Staples Retailing 1.2% |
| Casey's General Stores, Inc. | 23,548 | 5,282,994 |
The notes to the financial statements are an integral part of, and should be read in conjunction with, the financial statements.
11
Portfolio of Investments December 31, 2022† (continued)
| | Shares | Value |
| Common Stocks (continued) |
| Food Products 1.4% |
| Simply Good Foods Co. (The) (a) | 162,053 | $ 6,162,876 |
| Health Care Equipment & Supplies 7.1% |
| CONMED Corp. | 46,943 | 4,161,028 |
| Establishment Labs Holdings, Inc. (a)(b) | 51,455 | 3,378,021 |
| Globus Medical, Inc., Class A (a) | 40,182 | 2,984,317 |
| Inari Medical, Inc. (a) | 82,828 | 5,264,548 |
| Inspire Medical Systems, Inc. (a) | 14,055 | 3,540,173 |
| Integra LifeSciences Holdings Corp. (a) | 74,816 | 4,194,933 |
| Nevro Corp. (a) | 15,803 | 625,799 |
| OrthoPediatrics Corp. (a) | 52,493 | 2,085,547 |
| SI-BONE, Inc. (a) | 131,917 | 1,794,071 |
| Silk Road Medical, Inc. (a) | 43,460 | 2,296,861 |
| Teleflex, Inc. | 3,167 | 790,578 |
| | | 31,115,876 |
| Health Care Providers & Services 6.6% |
| Accolade, Inc. (a) | 173,647 | 1,352,710 |
| Addus HomeCare Corp. (a) | 38,146 | 3,795,145 |
| agilon health, Inc. (a) | 134,770 | 2,175,188 |
| Alignment Healthcare, Inc. (a) | 116,860 | 1,374,274 |
| Amedisys, Inc. (a) | 24,688 | 2,062,435 |
| Encompass Health Corp. | 53,918 | 3,224,835 |
| Ensign Group, Inc. (The) | 47,787 | 4,521,128 |
| HealthEquity, Inc. (a) | 64,087 | 3,950,323 |
| Option Care Health, Inc. (a) | 152,741 | 4,595,977 |
| Surgery Partners, Inc. (a) | 71,294 | 1,986,251 |
| | | 29,038,266 |
| Health Care Technology 0.8% |
| Phreesia, Inc. (a) | 104,125 | 3,369,485 |
| Hotels, Restaurants & Leisure 3.9% |
| Choice Hotels International, Inc. | 21,368 | 2,406,891 |
| Churchill Downs, Inc. | 34,167 | 7,223,929 |
| First Watch Restaurant Group, Inc. (a) | 38,169 | 516,427 |
| MakeMyTrip Ltd. (a) | 107,086 | 2,952,361 |
| Shake Shack, Inc., Class A (a) | 47,351 | 1,966,487 |
| Wingstop, Inc. | 13,377 | 1,840,943 |
| | | 16,907,038 |
| Household Durables 0.5% |
| TopBuild Corp. (a) | 8,090 | 1,266,004 |
| Vizio Holding Corp., Class A (a)(b) | 130,650 | 968,117 |
| | | 2,234,121 |
| | Shares | Value |
| |
| Insurance 1.6% |
| Goosehead Insurance, Inc., Class A (a) | 61,987 | $ 2,128,634 |
| Kinsale Capital Group, Inc. | 11,640 | 3,044,093 |
| Palomar Holdings, Inc. (a) | 36,058 | 1,628,379 |
| | | 6,801,106 |
| Interactive Media & Services 1.0% |
| Angi, Inc. (a) | 330,225 | 776,029 |
| Pinterest, Inc., Class A (a) | 140,074 | 3,400,996 |
| | | 4,177,025 |
| Internet & Direct Marketing Retail 0.3% |
| Revolve Group, Inc. (a)(b) | 67,354 | 1,499,300 |
| IT Services 7.1% |
| Endava plc, Sponsored ADR (a) | 53,922 | 4,125,033 |
| Evo Payments, Inc., Class A (a) | 147,428 | 4,988,964 |
| Genpact Ltd. | 162,991 | 7,549,743 |
| Globant SA (a) | 20,369 | 3,425,251 |
| Maximus, Inc. | 65,016 | 4,767,623 |
| WEX, Inc. (a) | 19,492 | 3,189,866 |
| WNS Holdings Ltd., ADR (a) | 35,062 | 2,804,609 |
| | | 30,851,089 |
| Leisure Products 0.8% |
| Clarus Corp. (b) | 151,928 | 1,191,115 |
| YETI Holdings, Inc. (a) | 56,200 | 2,321,622 |
| | | 3,512,737 |
| Life Sciences Tools & Services 3.5% |
| Azenta, Inc. (a) | 97,763 | 5,691,762 |
| Bruker Corp. | 52,583 | 3,594,048 |
| Charles River Laboratories International, Inc. (a) | 4,710 | 1,026,309 |
| Medpace Holdings, Inc. (a) | 14,174 | 3,010,699 |
| NeoGenomics, Inc. (a) | 210,330 | 1,943,449 |
| | | 15,266,267 |
| Machinery 1.4% |
| IDEX Corp. | 5,828 | 1,330,707 |
| John Bean Technologies Corp. | 51,454 | 4,699,294 |
| | | 6,030,001 |
| Media 0.6% |
| New York Times Co. (The), Class A | 84,546 | 2,744,363 |
| Oil, Gas & Consumable Fuels 1.9% |
| Denbury, Inc. (a) | 69,277 | 6,028,485 |
| Matador Resources Co. | 39,926 | 2,285,364 |
| | | 8,313,849 |
The notes to the financial statements are an integral part of, and should be read in conjunction with, the financial statements.
| 12 | MainStay VP Small Cap Growth Portfolio |
| | Shares | Value |
| Common Stocks (continued) |
| Pharmaceuticals 0.4% |
| Arvinas, Inc. (a) | 14,274 | $ 488,313 |
| Pacira BioSciences, Inc. (a) | 34,631 | 1,337,103 |
| | | 1,825,416 |
| Professional Services 1.6% |
| ASGN, Inc. (a) | 31,460 | 2,563,361 |
| CBIZ, Inc. (a) | 46,351 | 2,171,544 |
| FTI Consulting, Inc. (a) | 15,172 | 2,409,314 |
| | | 7,144,219 |
| Real Estate Management & Development 0.2% |
| DigitalBridge Group, Inc. | 76,031 | 831,779 |
| Road & Rail 1.0% |
| Knight-Swift Transportation Holdings, Inc. | 22,140 | 1,160,357 |
| Saia, Inc. (a) | 16,036 | 3,362,429 |
| | | 4,522,786 |
| Semiconductors & Semiconductor Equipment 5.1% |
| Allegro MicroSystems, Inc. (a) | 55,005 | 1,651,250 |
| Credo Technology Group Holding Ltd. (a) | 104,865 | 1,395,753 |
| Entegris, Inc. | 40,697 | 2,669,316 |
| Lattice Semiconductor Corp. (a) | 22,356 | 1,450,457 |
| Onto Innovation, Inc. (a) | 54,968 | 3,742,771 |
| Power Integrations, Inc. | 90,199 | 6,469,072 |
| Silicon Laboratories, Inc. (a) | 25,562 | 3,467,997 |
| SiTime Corp. (a) | 12,378 | 1,257,853 |
| | | 22,104,469 |
| Software 8.6% |
| Bentley Systems, Inc., Class B | 47,716 | 1,763,583 |
| Blackline, Inc. (a) | 99,847 | 6,716,708 |
| Box, Inc., Class A (a) | 80,440 | 2,504,097 |
| Dynatrace, Inc. (a) | 87,505 | 3,351,442 |
| Envestnet, Inc. (a) | 124,619 | 7,688,992 |
| Everbridge, Inc. (a) | 72,280 | 2,138,042 |
| PROS Holdings, Inc. (a) | 74,948 | 1,818,239 |
| Sprout Social, Inc., Class A (a) | 26,303 | 1,485,067 |
| Sumo Logic, Inc. (a) | 58,514 | 473,963 |
| Workiva, Inc. (a) | 106,682 | 8,958,088 |
| Zuora, Inc., Class A (a) | 81,541 | 518,601 |
| | | 37,416,822 |
| Specialty Retail 1.2% |
| Boot Barn Holdings, Inc. (a) | 41,102 | 2,569,697 |
| | Shares | | Value |
| |
| Specialty Retail (continued) |
| Leslie's, Inc. (a) | 85,079 | | $ 1,038,815 |
| Warby Parker, Inc., Class A (a)(b) | 113,846 | | 1,535,782 |
| | | | 5,144,294 |
| Trading Companies & Distributors 0.7% |
| SiteOne Landscape Supply, Inc. (a) | 25,112 | | 2,946,140 |
Total Common Stocks
(Cost $415,260,498) | | | 405,816,772 |
| Exchange-Traded Fund 1.4% |
| SPDR S&P Biotech ETF (a)(b) | 74,965 | | 6,222,095 |
Total Exchange-Traded Fund
(Cost $6,054,004) | | | 6,222,095 |
| Short-Term Investments 7.6% |
| Affiliated Investment Company 5.4% |
| MainStay U.S. Government Liquidity Fund, 3.602% (c) | 23,455,506 | | 23,455,506 |
| Unaffiliated Investment Company 2.2% |
| Invesco Government and Agency Portfolio, 4.301% (c)(d) | 9,878,293 | | 9,878,293 |
Total Short-Term Investments
(Cost $33,333,799) | | | 33,333,799 |
Total Investments
(Cost $454,648,301) | 101.9% | | 445,372,666 |
| Other Assets, Less Liabilities | (1.9) | | (8,206,640) |
| Net Assets | 100.0% | | $ 437,166,026 |
| † | Percentages indicated are based on Portfolio net assets. |
| (a) | Non-income producing security. |
| (b) | All or a portion of this security was held on loan. As of December 31, 2022, the aggregate market value of securities on loan was $12,739,374; the total market value of collateral held by the Portfolio was $12,996,840. The market value of the collateral held included non-cash collateral in the form of U.S. Treasury securities with a value of $3,118,547. The Portfolio received cash collateral with a value of $9,878,293. (See Note 2(G)) |
| (c) | Current yield as of December 31, 2022. |
| (d) | Represents a security purchased with cash collateral received for securities on loan. |
The notes to the financial statements are an integral part of, and should be read in conjunction with, the financial statements.
13
Portfolio of Investments December 31, 2022† (continued)
Investments in Affiliates (in 000's)
Investments in issuers considered to be affiliate(s) of the Portfolio during the year ended December 31, 2022 for purposes of Section 2(a)(3) of the Investment Company Act of 1940, as amended, were as follows:
| Affiliated Investment Companies | Value,
Beginning
of Year | Purchases
at Cost | Proceeds
from
Sales | Net
Realized
Gain/(Loss)
on Sales | Change in
Unrealized
Appreciation/
(Depreciation) | Value,
End of
Year | Dividend
Income | Other
Distributions | Shares
End of
Year |
| MainStay U.S. Government Liquidity Fund | $ 22,772 | $ 148,777 | $ (148,093) | $ — | $ — | $ 23,456 | $ 412 | $ — | 23,456 |
| Abbreviation(s): |
| ADR—American Depositary Receipt |
| ETF—Exchange-Traded Fund |
| SPDR—Standard & Poor’s Depositary Receipt |
The following is a summary of the fair valuations according to the inputs used as of December 31, 2022, for valuing the Portfolio’s assets:
| Description | Quoted
Prices in
Active
Markets for
Identical
Assets
(Level 1) | | Significant
Other
Observable
Inputs
(Level 2) | | Significant
Unobservable
Inputs
(Level 3) | | Total |
| Asset Valuation Inputs | | | | | | | |
| Investments in Securities (a) | | | | | | | |
| Common Stocks | $ 405,816,772 | | $ — | | $ — | | $ 405,816,772 |
| Exchange-Traded Fund | 6,222,095 | | — | | — | | 6,222,095 |
| Short-Term Investments | | | | | | | |
| Affiliated Investment Company | 23,455,506 | | — | | — | | 23,455,506 |
| Unaffiliated Investment Company | 9,878,293 | | — | | — | | 9,878,293 |
| Total Short-Term Investments | 33,333,799 | | — | | — | | 33,333,799 |
| Total Investments in Securities | $ 445,372,666 | | $ — | | $ — | | $ 445,372,666 |
| (a) | For a complete listing of investments and their industries, see the Portfolio of Investments. |
The notes to the financial statements are an integral part of, and should be read in conjunction with, the financial statements.
| 14 | MainStay VP Small Cap Growth Portfolio |
Statement of Assets and Liabilities as of December 31, 2022
| Assets |
Investment in unaffiliated securities, at value
(identified cost $431,192,795) including securities on loan of $12,739,374 | $421,917,160 |
Investment in affiliated investment companies, at value
(identified cost $23,455,506) | 23,455,506 |
| Receivables: | |
| Investment securities sold | 1,886,849 |
| Dividends | 313,868 |
| Portfolio shares sold | 13,111 |
| Securities lending | 5,652 |
| Other assets | 2,551 |
| Total assets | 447,594,697 |
| Liabilities |
| Cash collateral received for securities on loan | 9,878,293 |
| Due to custodian | 63 |
| Payables: | |
| Manager (See Note 3) | 308,489 |
| Portfolio shares redeemed | 118,605 |
| Investment securities purchased | 32,123 |
| Professional fees | 29,482 |
| NYLIFE Distributors (See Note 3) | 25,529 |
| Shareholder communication | 22,548 |
| Custodian | 4,250 |
| Accrued expenses | 9,289 |
| Total liabilities | 10,428,671 |
| Net assets | $437,166,026 |
| Composition of Net Assets |
| Shares of beneficial interest outstanding (par value of $.001 per share) unlimited number of shares authorized | $ 47,349 |
| Additional paid-in-capital | 446,120,116 |
| | 446,167,465 |
| Total distributable earnings (loss) | (9,001,439) |
| Net assets | $437,166,026 |
| Initial Class | |
| Net assets applicable to outstanding shares | $320,090,561 |
| Shares of beneficial interest outstanding | 34,170,102 |
| Net asset value per share outstanding | $ 9.37 |
| Service Class | |
| Net assets applicable to outstanding shares | $117,075,465 |
| Shares of beneficial interest outstanding | 13,178,537 |
| Net asset value per share outstanding | $ 8.88 |
The notes to the financial statements are an integral part of, and should be read in conjunction with, the financial statements.
15
Statement of Operations for the year ended December 31, 2022
| Investment Income (Loss) |
| Income | |
| Dividends-unaffiliated (net of foreign tax withholding of $24,978) | $ 1,717,221 |
| Dividends-affiliated | 412,102 |
| Securities lending, net | 76,233 |
| Total income | 2,205,556 |
| Expenses | |
| Manager (See Note 3) | 3,754,107 |
| Distribution/Service—Service Class (See Note 3) | 329,848 |
| Professional fees | 83,705 |
| Custodian | 27,259 |
| Shareholder communication | 26,587 |
| Trustees | 9,953 |
| Miscellaneous | 16,219 |
| Total expenses | 4,247,678 |
| Net investment income (loss) | (2,042,122) |
| Realized and Unrealized Gain (Loss) |
| Net realized gain (loss) on unaffiliated investments | 964,390 |
| Net change in unrealized appreciation (depreciation) on unaffiliated investments | (151,607,563) |
| Net realized and unrealized gain (loss) | (150,643,173) |
| Net increase (decrease) in net assets resulting from operations | $(152,685,295) |
The notes to the financial statements are an integral part of, and should be read in conjunction with, the financial statements.
| 16 | MainStay VP Small Cap Growth Portfolio |
Statements of Changes in Net Assets
for the years ended December 31, 2022 and December 31, 2021
| | 2022 | 2021 |
| Increase (Decrease) in Net Assets |
| Operations: | | |
| Net investment income (loss) | $ (2,042,122) | $ (3,692,220) |
| Net realized gain (loss) | 964,390 | 118,790,132 |
| Net change in unrealized appreciation (depreciation) | (151,607,563) | (56,483,974) |
| Net increase (decrease) in net assets resulting from operations | (152,685,295) | 58,613,938 |
| Distributions to shareholders: | | |
| Initial Class | (82,864,939) | (51,525,334) |
| Service Class | (32,444,804) | (22,332,907) |
| Total distributions to shareholders | (115,309,743) | (73,858,241) |
| Capital share transactions: | | |
| Net proceeds from sales of shares | 85,439,744 | 105,037,004 |
| Net asset value of shares issued to shareholders in reinvestment of distributions | 115,309,743 | 73,858,241 |
| Cost of shares redeemed | (64,467,524) | (171,515,217) |
| Increase (decrease) in net assets derived from capital share transactions | 136,281,963 | 7,380,028 |
| Net increase (decrease) in net assets | (131,713,075) | (7,864,275) |
| Net Assets |
| Beginning of year | 568,879,101 | 576,743,376 |
| End of year | $ 437,166,026 | $ 568,879,101 |
The notes to the financial statements are an integral part of, and should be read in conjunction with, the financial statements.
17
Financial Highlights selected per share data and ratios
| | Year Ended December 31, |
| Initial Class | 2022 | | 2021 | | 2020 | | 2019 | | 2018 |
| Net asset value at beginning of year | $ 17.53 | | $ 18.16 | | $ 13.31 | | $ 12.20 | | $ 14.09 |
| Net investment income (loss) (a) | (0.05) | | (0.11) | | (0.06) | | (0.06) | | (0.06) |
| Net realized and unrealized gain (loss) | (4.74) | | 1.98 | | 5.36 | | 2.96 | | (1.04) |
| Total from investment operations | (4.79) | | 1.87 | | 5.30 | | 2.90 | | (1.10) |
| Less distributions: | | | | | | | | | |
| From net realized gain on investments | (3.37) | | (2.50) | | (0.45) | | (1.79) | | (0.79) |
| Net asset value at end of year | $ 9.37 | | $ 17.53 | | $ 18.16 | | $ 13.31 | | $ 12.20 |
| Total investment return (b) | (26.49)% | | 10.31% | | 40.48% | | 25.59% | | (8.88)% |
| Ratios (to average net assets)/Supplemental Data: | | | | | | | | | |
| Net investment income (loss) | (0.37)% | | (0.56)% | | (0.41)% | | (0.41)% | | (0.40)% |
| Net expenses (c) | 0.85% | | 0.84%(d) | | 0.85%(d) | | 0.85% | | 0.85% |
| Portfolio turnover rate | 39% | | 32% | | 101% | | 46% | | 41% |
| Net assets at end of year (in 000's) | $ 320,091 | | $ 395,321 | | $ 422,200 | | $ 332,474 | | $ 251,547 |
| (a) | Per share data based on average shares outstanding during the year. |
| (b) | Total return does not reflect any deduction of sales charges, mortality and expense charges, contract charges or administrative charges. For periods of less than one year, total return is not annualized. |
| (c) | In addition to the fees and expenses which the Portfolio bears directly, it also indirectly bears a pro-rata share of the fees and expenses of the underlying funds in which it invests. Such indirect expenses are not included in the above expense ratios. |
| (d) | Expense waiver/reimbursement less than 0.01%. |
| | Year Ended December 31, |
| Service Class | 2022 | | 2021 | | 2020 | | 2019 | | 2018 |
| Net asset value at beginning of year | $ 16.91 | | $ 17.64 | | $ 12.97 | | $ 11.96 | | $ 13.87 |
| Net investment income (loss) (a) | (0.08) | | (0.15) | | (0.09) | | (0.09) | | (0.09) |
| Net realized and unrealized gain (loss) | (4.58) | | 1.92 | | 5.21 | | 2.89 | | (1.03) |
| Total from investment operations | (4.66) | | 1.77 | | 5.12 | | 2.80 | | (1.12) |
| Less distributions: | | | | | | | | | |
| From net realized gain on investments | (3.37) | | (2.50) | | (0.45) | | (1.79) | | (0.79) |
| Net asset value at end of year | $ 8.88 | | $ 16.91 | | $ 17.64 | | $ 12.97 | | $ 11.96 |
| Total investment return (b) | (26.67)% | | 10.03% | | 40.13% | | 25.28% | | (9.11)% |
| Ratios (to average net assets)/Supplemental Data: | | | | | | | | | |
| Net investment income (loss) | (0.63)% | | (0.81)% | | (0.66)% | | (0.65)% | | (0.64)% |
| Net expenses (c) | 1.10% | | 1.09%(d) | | 1.10%(d) | | 1.10% | | 1.10% |
| Portfolio turnover rate | 39% | | 32% | | 101% | | 46% | | 41% |
| Net assets at end of year (in 000's) | $ 117,075 | | $ 173,558 | | $ 154,543 | | $ 125,306 | | $ 96,497 |
| (a) | Per share data based on average shares outstanding during the year. |
| (b) | Total return does not reflect any deduction of sales charges, mortality and expense charges, contract charges or administrative charges. For periods of less than one year, total return is not annualized. |
| (c) | In addition to the fees and expenses which the Portfolio bears directly, it also indirectly bears a pro-rata share of the fees and expenses of the underlying funds in which it invests. Such indirect expenses are not included in the above expense ratios. |
| (d) | Expense waiver/reimbursement less than 0.01%. |
The notes to the financial statements are an integral part of, and should be read in conjunction with, the financial statements.
| 18 | MainStay VP Small Cap Growth Portfolio |
Notes to Financial Statements
Note 1–Organization and Business
MainStay VP Funds Trust (the “Fund”) was organized as a Delaware statutory trust on February 1, 2011. The Fund is registered under the Investment Company Act of 1940, as amended (the “1940 Act”), as an open-end management investment company. The Fund is comprised of thirty-one separate series (collectively referred to as the “Portfolios”). These financial statements and notes relate to the MainStay VP Small Cap Growth Portfolio (the "Portfolio"), a "diversified” portfolio, as that term is defined in the 1940 Act, as interpreted or modified by regulatory authorities having jurisdiction, from time to time.
Shares of the Portfolio are currently offered to certain separate accounts to fund variable annuity policies and variable universal life insurance policies issued by New York Life Insurance and Annuity Corporation (“NYLIAC”), a wholly-owned subsidiary of New York Life Insurance Company (“New York Life”) and may also be offered to fund variable annuity policies and variable universal life insurance policies issued by other insurance companies. NYLIAC allocates shares of the Portfolio to, among others, certain NYLIAC separate accounts. Shares of the Portfolio are also offered to the MainStay VP Conservative Allocation Portfolio, MainStay VP Moderate Allocation Portfolio, MainStay VP Growth Allocation Portfolio and MainStay VP Equity Allocation Portfolio, which operate as “funds-of-funds," and other variable insurance funds.
The following table lists the Portfolio's share classes that have been registered and commenced operations:
| Class | Commenced Operations |
| Initial Class | February 17, 2012 |
| Service Class | February 17, 2012 |
Shares of the Portfolio are offered and are redeemed at a price equal to their respective net asset value (“NAV”) per share. No sales or redemption charge is applicable to the purchase or redemption of the Portfolio's shares. Under the terms of the Fund’s multiple class plan, adopted pursuant to Rule 18f-3 under the 1940 Act, the classes differ in that, among other things, Service Class shares of the Portfolio pay a combined distribution and service fee of 0.25% of average daily net assets attributable to Service Class shares of the Portfolio to the Distributor (as defined in Note 3(B)) pursuant to a plan adopted in accordance with Rule 12b-1 under the 1940 Act. Contract owners of variable annuity contracts purchased after June 2, 2003, are permitted to invest only in the Service Class shares.
The Portfolio's investment objective is to seek long-term capital appreciation.
Note 2–Significant Accounting Policies
The Portfolio is an investment company and accordingly follows the investment company accounting and reporting guidance of the Financial Accounting Standards Board (“FASB”) Accounting Standards Codification Topic 946 Financial Services—Investment Companies. The Portfolio prepares its financial statements in accordance with generally accepted
accounting principles (“GAAP”) in the United States of America and follows the significant accounting policies described below.
(A) Securities Valuation. Investments are usually valued as of the close of regular trading on the New York Stock Exchange (the "Exchange") (usually 4:00 p.m. Eastern time) on each day the Portfolio is open for business ("valuation date").
Effective September 8, 2022, and pursuant to Rule 2a-5 under the 1940 Act, the Board of Trustees of the Fund (the "Board") designated New York Life Investment Management LLC (“New York Life Investments” or the "Manager") as its Valuation Designee (the "Valuation Designee"). The Valuation Designee is responsible for performing fair valuations relating to all investments in the Portfolio’s portfolio for which market quotations are not readily available; periodically assessing and managing material valuation risks; establishing and applying fair value methodologies; testing fair valuation methodologies; evaluating and overseeing pricing services; ensuring appropriate segregation of valuation and portfolio management functions; providing quarterly, annual and prompt reporting to the Board, as appropriate; identifying potential conflicts of interest; and maintaining appropriate records. The Valuation Designee has established a valuation committee ("Valuation Committee") to assist in carrying out the Valuation Designee’s responsibilities and establish prices of securities for which market quotations are not readily available. The Portfolio’s and the Valuation Designee's policies and procedures ("Valuation Procedures") govern the Valuation Designee’s selection and application of methodologies for determining and calculating the fair value of Portfolio investments. The Valuation Designee may value the Portfolio's portfolio securities for which market quotations are not readily available and other Portfolio assets utilizing inputs from pricing services and other third-party sources (together, “Pricing Sources”). The Valuation Committee meets (in person, via electronic mail or via teleconference) on an ad-hoc basis to determine fair valuations and on a quarterly basis to review fair value events with respect to certain securities for which market quotations are not readily available, including valuation risks and back-testing results, and preview reports to the Board.
The Valuation Committee establishes prices of securities for which market quotations are not readily available based on such methodologies and measurements on a regular basis after considering information that is reasonably available and deemed relevant by the Valuation Committee. The Board shall oversee the Valuation Designee and review fair valuation materials on a prompt, quarterly and annual basis and approve proposed revisions to the Valuation Procedures.
Investments for which market quotations are not readily available are valued at fair value as determined in good faith pursuant to the Valuation Procedures. A market quotation is readily available only when that quotation is a quoted price (unadjusted) in active markets for identical investments that the Portfolio can access at the measurement date, provided that a quotation will not be readily available if it is not reliable. "Fair value" is defined as the price the Portfolio would reasonably expect to receive upon selling an asset or liability in an orderly transaction to an independent buyer in the principal or most advantageous market for the
Notes to Financial Statements (continued)
asset or liability. Fair value measurements are determined within a framework that establishes a three-tier hierarchy that maximizes the use of observable market data and minimizes the use of unobservable inputs to establish a classification of fair value measurements for disclosure purposes. "Inputs" refer broadly to the assumptions that market participants would use in pricing the asset or liability, including assumptions about risk, such as the risk inherent in a particular valuation technique used to measure fair value using a pricing model and/or the risk inherent in the inputs for the valuation technique. Inputs may be observable or unobservable. Observable inputs reflect the assumptions market participants would use in pricing the asset or liability based on market data obtained from sources independent of the Portfolio. Unobservable inputs reflect the Portfolio’s own assumptions about the assumptions market participants would use in pricing the asset or liability based on the information available. The inputs or methodology used for valuing assets or liabilities may not be an indication of the risks associated with investing in those assets or liabilities. The three-tier hierarchy of inputs is summarized below.
| • | Level 1—quoted prices (unadjusted) in active markets for an identical asset or liability |
| • | Level 2—other significant observable inputs (including quoted prices for a similar asset or liability in active markets, interest rates and yield curves, prepayment speeds, credit risk, etc.) |
| • | Level 3—significant unobservable inputs (including the Portfolio's own assumptions about the assumptions that market participants would use in measuring fair value of an asset or liability) |
The level of an asset or liability within the fair value hierarchy is based on the lowest level of an input, both individually and in the aggregate, that is significant to the fair value measurement. The aggregate value by input level of the Portfolio’s assets and liabilities as of December 31, 2022, is included at the end of the Portfolio of Investments.
The Portfolio may use third-party vendor evaluations, whose prices may be derived from one or more of the following standard inputs, among others:
| • Broker/dealer quotes | • Benchmark securities |
| • Two-sided markets | • Reference data (corporate actions or material event notices) |
| • Bids/offers | • Monthly payment information |
| • Industry and economic events | • Reported trades |
An asset or liability for which a market quotation is not readily available is valued by methods deemed reasonable in good faith by the Valuation Committee, following the Valuation Procedures to represent fair value. Under these procedures, the Valuation Designee generally uses a market-based approach which may use related or comparable assets or liabilities, recent transactions, market multiples, book values and other relevant information. The Valuation Designee may also use an income-based valuation approach in which the anticipated future cash flows of the asset or liability are discounted to calculate fair value.
Discounts may also be applied due to the nature and/or duration of any restrictions on the disposition of the asset or liability. Fair value represents a good faith approximation of the value of a security. Fair value determinations involve the consideration of a number of subjective factors, an analysis of applicable facts and circumstances and the exercise of judgment. As a result, it is possible that the fair value for a security determined in good faith in accordance with the Valuation Procedures may differ from valuations for the same security determined for other funds using their own valuation procedures. Although the Valuation Procedures are designed to value a security at the price the Portfolio may reasonably expect to receive upon the security's sale in an orderly transaction, there can be no assurance that any fair value determination thereunder would, in fact, approximate the amount that the Portfolio would actually realize upon the sale of the security or the price at which the security would trade if a reliable market price were readily available. During the year ended December 31, 2022, there were no material changes to the fair value methodologies.
Securities which may be valued in this manner include, but are not limited to: (i) a security for which trading has been halted or suspended or otherwise does not have a readily available market quotation on a given day; (ii) a debt security that has recently gone into default and for which there is not a current market quotation; (iii) a security of an issuer that has entered into a restructuring; (iv) a security that has been delisted from a national exchange; (v) a security subject to trading collars for which no or limited trading takes place; and (vi) a security whose principal market has been temporarily closed at a time when, under normal conditions, it would be open. Securities valued in this manner are generally categorized as Level 2 or 3 in the hierarchy.
Equity securities are valued at the last quoted sales prices as of the close of regular trading on the relevant exchange on each valuation date. Securities that are not traded on the valuation date are valued at the mean of the last quoted bid and ask prices. Prices are normally taken from the principal market in which each security trades. These securities are generally categorized as Level 1 in the hierarchy.
Exchange-traded funds (“ETFs”) are valued at the last quoted sales prices as of the close of regular trading on the relevant exchange on each valuation date. Securities that are not traded on the valuation date are valued at the mean of the last quoted bid and ask prices. Prices are normally taken from the principal market in which each security trades. These securities are generally categorized as Level 1 in the hierarchy.
Investments in mutual funds, including money market funds, are valued at their respective NAVs at the close of business each day on the valuation date. These securities are generally categorized as Level 1 in the hierarchy.
Temporary cash investments acquired in excess of 60 days to maturity at the time of purchase are valued using the latest bid prices or using valuations based on a matrix system (which considers such factors as security prices, yields, maturities and ratings), both as furnished by independent pricing services. Temporary cash investments that mature in 60 days or less at the time of purchase ("Short-Term Investments") are
| 20 | MainStay VP Small Cap Growth Portfolio |
valued using the amortized cost method of valuation, unless the use of such method would be inappropriate. The amortized cost method involves valuing a security at its cost on the date of purchase and thereafter assuming a constant amortization to maturity of the difference between such cost and the value on maturity date. Amortized cost approximates the current fair value of a security. Securities valued using the amortized cost method are not valued using quoted prices in an active market and are generally categorized as Level 2 in the hierarchy.
The information above is not intended to reflect an exhaustive list of the methodologies that may be used to value portfolio investments. The Valuation Procedures permit the use of a variety of valuation methodologies in connection with valuing portfolio investments. The methodology used for a specific type of investment may vary based on the market data available or other considerations. The methodologies summarized above may not represent the specific means by which portfolio investments are valued on any particular business day.
(B) Income Taxes. The Portfolio's policy is to comply with the requirements of the Internal Revenue Code of 1986, as amended (the “Internal Revenue Code”), applicable to regulated investment companies and to distribute all of its taxable income to the shareholders of the Portfolio within the allowable time limits.
The Manager evaluates the Portfolio’s tax positions to determine if the tax positions taken meet the minimum recognition threshold in connection with accounting for uncertainties in income tax positions taken or expected to be taken for the purposes of measuring and recognizing tax liabilities in the financial statements. Recognition of tax benefits of an uncertain tax position is permitted only to the extent the position is “more likely than not” to be sustained assuming examination by taxing authorities. The Manager analyzed the Portfolio's tax positions taken on federal, state and local income tax returns for all open tax years (for up to three tax years) and has concluded that no provisions for federal, state and local income tax are required in the Portfolio's financial statements. The Portfolio's federal, state and local income tax and federal excise tax returns for tax years for which the applicable statutes of limitations have not expired are subject to examination by the Internal Revenue Service and state and local departments of revenue.
(C) Dividends and Distributions to Shareholders. Dividends and distributions are recorded on the ex-dividend date. The Portfolio intends to declare and pay dividends from net investment income and distributions from net realized capital and currency gains, if any, at least annually. All dividends and distributions are reinvested at NAV in the same class of shares of the Portfolio. Dividends and distributions to shareholders are determined in accordance with federal income tax regulations and may differ from determinations using GAAP.
(D) Security Transactions and Investment Income. The Portfolio records security transactions on the trade date. Realized gains and losses on security transactions are determined using the identified cost method. Dividend income is recognized on the ex-dividend date, net of any foreign tax withheld at the source, and interest income is accrued as earned
using the effective interest rate method. Distributions received from real estate investment trusts may be classified as dividends, capital gains and/or return of capital.
Investment income and realized and unrealized gains and losses on investments of the Portfolio are allocated pro rata to the separate classes of shares based upon their relative net assets on the date the income is earned or realized and unrealized gains and losses are incurred.
(E) Expenses. Expenses of the Fund are allocated to the individual Portfolios in proportion to the net assets of the respective Portfolios when the expenses are incurred, except where direct allocations of expenses can be made. Expenses (other than fees incurred under the distribution and service plans, further discussed in Note 3(B), which are charged directly to the Service Class shares) are allocated to separate classes of shares pro rata based upon their relative net assets on the date the expenses are incurred. The expenses borne by the Portfolio, including those of related parties to the Portfolio, are shown in the Statement of Operations.
Additionally, the Portfolio may invest in mutual funds, which are subject to management fees and other fees that may cause the costs of investing in mutual funds to be greater than the costs of owning the underlying securities directly. These indirect expenses of mutual funds are not included in the amounts shown as expenses in the Statement of Operations or in the expense ratios included in the Financial Highlights.
(F) Use of Estimates. In preparing financial statements in conformity with GAAP, the Manager makes estimates and assumptions that affect the reported amounts and disclosures in the financial statements. Actual results could differ from those estimates and assumptions.
(G) Securities Lending. In order to realize additional income, the Portfolio may engage in securities lending, subject to the limitations set forth in the 1940 Act and relevant guidance by the staff of the Securities and Exchange Commission (“SEC”). If the Portfolio engages in securities lending, the Portfolio will lend through its custodian, JPMorgan Chase Bank, N.A., ("JPMorgan"), acting as securities lending agent on behalf of the Portfolio. Under the current arrangement, JPMorgan will manage the Portfolio's collateral in accordance with the securities lending agency agreement between the Portfolio and JPMorgan, and indemnify the Portfolio against counterparty risk. The loans will be collateralized by cash (which may be invested in a money market fund) and/or non-cash collateral (which may include U.S. Treasury securities and/or U.S. government agency securities issued or guaranteed by the United States government or its agencies or instrumentalities) at least equal at all times to the market value of the securities loaned. Non-cash collateral held at year end is segregated and cannot be transferred by the Portfolio. The Portfolio bears the risk of delay in recovery of, or loss of rights in, the securities loaned. The Portfolio may also record a realized gain or loss on securities deemed sold due to a borrower’s inability to return securities on loan. The Portfolio bears the risk of any loss on investment of cash collateral. The Portfolio will receive compensation for lending its securities in the form of fees or it will retain a portion of interest earned on the
Notes to Financial Statements (continued)
investment of any cash collateral. The Portfolio will also continue to receive interest and dividends on the securities loaned and any gain or loss in the market price of the securities loaned that may occur during the term of the loan will be for the account of the Portfolio. Income earned from securities lending activities, if any, is reflected in the Statement of Operations. Securities on loan as of December 31, 2022, are shown in the Portfolio of Investments.
(H) Indemnifications. Under the Fund’s organizational documents, its officers and trustees are indemnified against certain liabilities that may arise out of performance of their duties to the Fund. Additionally, in the normal course of business, the Portfolio enters into contracts with third-party service providers that contain a variety of representations and warranties and that may provide general indemnifications. The Portfolio's maximum exposure under these arrangements is unknown, as this would involve future claims that may be made against the Portfolio that have not yet occurred. The Manager believes that the risk of loss in connection with these potential indemnification obligations is remote. However, there can be no assurance that material liabilities related to such obligations will not arise in the future, which could adversely impact the Portfolio.
Note 3–Fees and Related Party Transactions
(A) Manager and Subadvisors. New York Life Investments, a registered investment adviser and an indirect, wholly-owned subsidiary of New York Life, serves as the Portfolio’s Manager pursuant to an Amended and Restated Management Agreement (“Management Agreement”). The Manager provides offices, conducts clerical, recordkeeping and bookkeeping services, and keeps most of the financial and accounting records required to be maintained by the Portfolio. Except for the portion of salaries and expenses that are the responsibility of the Portfolio, the Manager pays the salaries and expenses of all personnel affiliated with the Portfolio and certain operational expenses of the Portfolio. During a portion of the year ended December 31, 2022, the Portfolio reimbursed New York Life Investments in an amount equal to the portion of the compensation of the Chief Compliance Officer attributable to the Portfolio. The Portfolio's subadvisors are Segall Bryant & Hamill, LLC ("SBH" or a "Subadvisor") and Brown Advisory LLC ("Brown Advisory" or a 'Subadvisor", and together, with SBH, the "subadvisors'), the Portfolio's subadvisors. SBH, a registered investment adviser, serves as a Subadvisor to the Portfolio, pursuant to the terms of a Subadvisory Agreement between New York Life Investments and SBH. Brown Advisory, a registered investment adviser, serves as a Subadvisor to the Portfolio, pursuant to the terms of a Subadvisory Agreement between New York Life Investments and Brown Advisory. Each Subadvisor is responsible for managing a portion of the Portfolio’s assets, as designated by the Manager from time to time. New York Life Investments pays for the services of the Subadvisors.
Pursuant to the Management Agreement, the Fund pays the Manager, on behalf of the Portfolio, a monthly fee for the services performed and the facilities furnished at an annual rate of the Portfolio's average daily net assets as follows: 0.81% up to $1 billion; and 0.785% in excess of
$1 billion. During the year ended December 31, 2022, the effective management fee rate was 0.81%.
During the year ended December 31, 2022, New York Life Investments earned fees from the Portfolio in the amount of $3,754,107 and paid SBH and Brown Advisory fees of $934,808 and $949,814, respectively.
JPMorgan provides sub-administration and sub-accounting services to the Portfolio pursuant to an agreement with New York Life Investments. These services include calculating the daily NAVs of the Portfolio, maintaining the general ledger and sub-ledger accounts for the calculation of the Portfolio's NAVs, and assisting New York Life Investments in conducting various aspects of the Portfolio's administrative operations. For providing these services to the Portfolio, JPMorgan is compensated by New York Life Investments.
Pursuant to an agreement between the Fund and New York Life Investments, New York Life Investments is responsible for providing or procuring certain regulatory reporting services for the Portfolio. The Portfolio will reimburse New York Life Investments for the actual costs incurred by New York Life Investments in connection with providing or procuring these services for the Portfolio.
(B) Distribution and Service Fees. The Fund, on behalf of the Portfolio, has entered into a distribution agreement with NYLIFE Distributors LLC (the “Distributor”), an affiliate of New York Life Investments. The Portfolio has adopted a distribution plan (the “Plan”) in accordance with the provisions of Rule 12b-1 under the 1940 Act. Under the Plan, the Distributor has agreed to provide, through its affiliates or independent third parties, various distribution-related, shareholder and administrative support services to the Service Class shareholders. For its services, the Distributor is entitled to a combined distribution and service fee accrued daily and paid monthly at an annual rate of 0.25% of the average daily net assets attributable to the Service Class shares of the Portfolio.
Note 4-Federal Income Tax
As of December 31, 2022, the cost and unrealized appreciation (depreciation) of the Portfolio’s investment portfolio, including applicable derivative contracts and other financial instruments, as determined on a federal income tax basis, were as follows:
| | Federal Tax
Cost | Gross
Unrealized
Appreciation | Gross
Unrealized
(Depreciation) | Net
Unrealized
Appreciation/
(Depreciation) |
| Investments in Securities | $455,812,830 | $51,224,797 | $(61,664,961) | $(10,440,164) |
| 22 | MainStay VP Small Cap Growth Portfolio |
As of December 31, 2022, the components of accumulated gain (loss) on a tax basis were as follows:
Ordinary
Income | Accumulated
Capital
and Other
Gain (Loss) | Other
Temporary
Differences | Unrealized
Appreciation
(Depreciation) | Total
Accumulated
Gain (Loss) |
| $— | $1,388,343 | $50,382 | $(10,440,164) | $(9,001,439) |
The difference between book-basis and tax-basis unrealized appreciation (depreciation) is primarily due to wash sale adjustments. The other temporary differences are primarily due to deferred dividends from real estate investment trusts (“REITs”).
The following table discloses the current year reclassifications between total distributable earnings (loss) and additional paid-in capital arising from permanent differences; net assets as of December 31, 2022 were not affected.
| | Total
Distributable
Earnings (Loss) | Additional
Paid-In
Capital |
| | $1,642,656 | $(1,642,656) |
The reclassifications for the Portfolio are primarily due to different book and tax treatment of reclassification of net operating losses.
During the years ended December 31, 2022 and December 31, 2021, the tax character of distributions paid as reflected in the Statements of Changes in Net Assets was as follows:
| | 2022 | 2021 |
| Distributions paid from: | | |
| Ordinary Income | $ 42,583,224 | $34,188,405 |
| Long-Term Capital Gains | 72,726,519 | 39,669,836 |
| Total | $115,309,743 | $73,858,241 |
Note 5–Custodian
JPMorgan is the custodian of cash and securities held by the Portfolio. Custodial fees are charged to the Portfolio based on the Portfolio's net assets and/or the market value of securities held by the Portfolio and the number of certain transactions incurred by the Portfolio.
Note 6–Line of Credit
The Portfolio and certain other funds managed by New York Life Investments maintain a line of credit with a syndicate of banks in order to secure a source of funds for temporary purposes to meet unanticipated or excessive redemption requests.
Effective July 26, 2022, under the credit agreement (the “Credit Agreement”), the aggregate commitment amount is $600,000,000 with an additional uncommitted amount of $100,000,000. The commitment fee is an annual rate of 0.15% of the average commitment amount payable quarterly, regardless of usage, to JPMorgan, who serves as the agent to the syndicate. The commitment fee is allocated among the Portfolio and certain other funds managed by New York Life Investments
based upon their respective net assets and other factors. Interest on any revolving credit loan is charged based upon the Federal Funds Rate, Daily Simple Secured Overnight Financing Rate ("SOFR") + 0.10%, or the Overnight Bank Funding Rate, whichever is higher. The Credit Agreement expires on July 25, 2023, although the Portfolio, certain other funds managed by New York Life Investments and the syndicate of banks may renew the Credit Agreement for an additional year on the same or different terms or enter into a credit agreement with a different syndicate of banks. Prior to July 26, 2022, the aggregate commitment amount and the commitment fee were the same as those under the current Credit Agreement. During the year ended December 31, 2022, there were no borrowings made or outstanding with respect to the Portfolio under the Credit Agreement.
Note 7–Interfund Lending Program
Pursuant to an exemptive order issued by the SEC, the Portfolio, along with certain other funds managed by New York Life Investments, may participate in an interfund lending program. The interfund lending program provides an alternative credit facility that permits the Portfolio and certain other funds managed by New York Life Investments to lend or borrow money for temporary purposes directly to or from one another, subject to the conditions of the exemptive order. During the year ended December 31, 2022, there were no interfund loans made or outstanding with respect to the Portfolio.
Note 8–Purchases and Sales of Securities (in 000’s)
During the year ended December 31, 2022, purchases and sales of securities, other than short-term securities, were $187,370 and $171,100, respectively.
Note 9–Capital Share Transactions
Transactions in capital shares for the years ended December 31, 2022 and December 31, 2021, were as follows:
| Initial Class | Shares | Amount |
| Year ended December 31, 2022: | | |
| Shares sold | 5,141,939 | $ 68,272,969 |
| Shares issued to shareholders in reinvestment of distributions | 9,244,708 | 82,864,939 |
| Shares redeemed | (2,767,030) | (36,485,974) |
| Net increase (decrease) | 11,619,617 | $ 114,651,934 |
| Year ended December 31, 2021: | | |
| Shares sold | 3,788,555 | $ 71,083,995 |
| Shares issued to shareholders in reinvestment of distributions | 2,935,314 | 51,525,334 |
| Shares redeemed | (7,426,075) | (140,856,224) |
| Net increase (decrease) | (702,206) | $ (18,246,895) |
| |
Notes to Financial Statements (continued)
| Service Class | Shares | Amount |
| Year ended December 31, 2022: | | |
| Shares sold | 1,328,818 | $ 17,166,775 |
| Shares issued to shareholders in reinvestment of distributions | 3,814,702 | 32,444,804 |
| Shares redeemed | (2,227,095) | (27,981,550) |
| Net increase (decrease) | 2,916,425 | $ 21,630,029 |
| Year ended December 31, 2021: | | |
| Shares sold | 1,843,221 | $ 33,953,009 |
| Shares issued to shareholders in reinvestment of distributions | 1,317,996 | 22,332,907 |
| Shares redeemed | (1,660,340) | (30,658,993) |
| Net increase (decrease) | 1,500,877 | $ 25,626,923 |
Note 10–Other Matters
As of the date of this report, interest rates in the United States and many parts of the world, including certain European countries, are ascending from historically low levels. Thus, the Portfolio currently faces a heightened level of risk associated with rising interest rates. This could be driven by a variety of factors, including but not limited to central bank monetary policies, changing inflation or real growth rates, general economic conditions, increasing bond issuances or reduced market demand for low yielding investments.
An outbreak of COVID-19, first detected in December 2019, has developed into a global pandemic and has resulted in travel restrictions, closure of international borders, certain businesses and securities markets, restrictions on securities trading activities, prolonged quarantines, supply chain disruptions, and lower consumer demand, as well as general concern and uncertainty. In 2022, many countries lifted some or all restrictions related to COVID-19. However, the continued impact of COVID-19 and related variants is uncertain and could further adversely affect the global economy, national economies, individual issuers and capital markets in unforeseeable ways and result in a substantial and extended economic downturn. Developments that disrupt global economies and financial markets, such as COVID-19, may magnify factors that affect the Portfolio's performance.
Note 11–Subsequent Events
In connection with the preparation of the financial statements of the Portfolio as of and for the year ended December 31, 2022, events and transactions subsequent to December 31, 2022, through the date the financial statements were issued have been evaluated by the Manager for possible adjustment and/or disclosure. No subsequent events requiring financial statement adjustment or disclosure have been identified.
| 24 | MainStay VP Small Cap Growth Portfolio |
Report of Independent Registered Public Accounting Firm
To the Board of Trustees of MainStay VP Funds Trust and Shareholders of
MainStay VP Small Cap Growth Portfolio
Opinion on the Financial Statements
We have audited the accompanying statement of assets and liabilities, including the portfolio of investments, of MainStay VP Small Cap Growth Portfolio (one of the portfolios constituting MainStay VP Funds Trust, referred to hereafter as the “Portfolio”) as of December 31, 2022, the related statement of operations for the year ended December 31, 2022, the statements of changes in net assets for each of the two years in the period ended December 31, 2022, including the related notes, and the financial highlights for each of the five years in the period ended December 31, 2022 (collectively referred to as the “financial statements”). In our opinion, the financial statements present fairly, in all material respects, the financial position of the Portfolio as of December 31, 2022, the results of its operations for the year then ended, the changes in its net assets for each of the two years in the period ended December 31, 2022 and the financial highlights for each of the five years in the period ended December 31, 2022 in conformity with accounting principles generally accepted in the United States of America.
Basis for Opinion
These financial statements are the responsibility of the Portfolio’s management. Our responsibility is to express an opinion on the Portfolio’s financial statements based on our audits. We are a public accounting firm registered with the Public Company Accounting Oversight Board (United States) (PCAOB) and are required to be independent with respect to the Portfolio in accordance with the U.S. federal securities laws and the applicable rules and regulations of the Securities and Exchange Commission and the PCAOB.
We conducted our audits of these financial statements in accordance with the standards of the PCAOB. Those standards require that we plan and perform the audit to obtain reasonable assurance about whether the financial statements are free of material misstatement, whether due to error or fraud.
Our audits included performing procedures to assess the risks of material misstatement of the financial statements, whether due to error or fraud, and performing procedures that respond to those risks. Such procedures included examining, on a test basis, evidence regarding the amounts and disclosures in the financial statements. Our audits also included evaluating the accounting principles used and significant estimates made by management, as well as evaluating the overall presentation of the financial statements. Our procedures included confirmation of securities owned as of December 31, 2022 by correspondence with the custodian, transfer agents and brokers; when replies were not received from brokers, we performed other auditing procedures. We believe that our audits provide a reasonable basis for our opinion.
/s/PricewaterhouseCoopers LLP
New York, New York
February 24, 2023
We have served as the auditor of one or more investment companies in the MainStay group of funds since 1984.
Board Consideration and Approval of Management Agreement and Subadvisory Agreements (Unaudited)
The continuation of the Management Agreement with respect to the MainStay VP Small Cap Growth Portfolio (“Portfolio”) and New York Life Investment Management LLC (“New York Life Investments”) and the Subadvisory Agreements between New York Life Investments and each of Segall Bryant & Hamill, LLC (“Segall”) and Brown Advisory LLC (“Brown Advisory”) with respect to the Portfolio (together, “Advisory Agreements”) is subject to annual review and approval by the Board of Trustees of MainStay VP Funds Trust (“Board” of the “Trust”) in accordance with Section 15 of the Investment Company Act of 1940, as amended (“1940 Act”). At its December 6–7, 2022 meeting, the Board, which is comprised solely of Trustees who are not an “interested person” (as such term is defined in the 1940 Act) of the Trust (“Independent Trustees”), unanimously approved the continuation of each of the Advisory Agreements for a one-year period.
In reaching the decision to approve the continuation of each of the Advisory Agreements, the Board considered information and materials furnished by New York Life Investments, Segall and Brown Advisory in connection with an annual contract review process undertaken by the Board that took place at meetings of the Board and its Contracts Committee during October 2022 through December 2022, including information and materials furnished by New York Life Investments, Segall and Brown Advisory in response to requests prepared on behalf of the Board, and in consultation with the Board, by independent legal counsel to the Independent Trustees, which encompassed a variety of topics, including those summarized below. Information and materials requested by and furnished to the Board for consideration in connection with the contract review process included, among other items, reports on the Portfolio and “peer funds” prepared by Institutional Shareholder Services Inc. (“ISS”), an independent third-party service provider engaged by the Board to report objectively on the Portfolio’s investment performance, management fee and total expenses. The Board also considered information on the fees charged to other investment advisory clients of New York Life Investments, Segall and/or Brown Advisory that follow investment strategies similar to those of the Portfolio, if any, and, when applicable, the rationale for any differences in the Portfolio’s management and subadvisory fees and the fees charged to those other investment advisory clients. In addition, the Board considered information regarding the legal standards and fiduciary obligations applicable to its consideration of the continuation of each of the Advisory Agreements. The contract review process, including the structure and format for information and materials provided to the Board, has been developed in consultation with the Board. The Independent Trustees also met in executive sessions with their independent legal counsel and, for portions thereof, with senior management of New York Life Investments.
The Board’s deliberations with respect to the continuation of each of the Advisory Agreements reflect a year-long process, and the Board also took into account information furnished to the Board and its Committees throughout the year, as deemed relevant and appropriate by the Trustees, including, among other items, reports on investment performance of the Portfolio and investment-related matters for the Portfolio as well as presentations from New York Life Investments and, generally annually,
Segall and Brown Advisory personnel. In addition, the Board took into account other information received from New York Life Investments throughout the year, including, among other items, periodic reports on legal and compliance matters, risk management, portfolio turnover, brokerage commissions and non-advisory services provided to the Portfolio by New York Life Investments, as deemed relevant and appropriate by the Trustees.
In addition to information provided to the Board throughout the year, the Board received information in connection with its June 2022 meeting provided specifically in response to requests prepared on behalf of the Board, and in consultation with the Board, by independent legal counsel to the Independent Trustees regarding the Portfolio’s distribution arrangements. In addition, the Board received information regarding the Portfolio’s asset levels, share purchase and redemption activity and the payment of Rule 12b-1 and/or other fees by applicable share classes of the Portfolio, among other information.
In considering the continuation of each of the Advisory Agreements, the Trustees reviewed and evaluated the information and factors they believed to reasonably be necessary and appropriate in light of legal advice furnished to them by independent legal counsel to the Independent Trustees and through the exercise of their own business judgment. Although individual Trustees may have weighed certain factors or information differently and the Board did not consider any single factor or information controlling in reaching its decision, the factors considered by the Board are summarized in more detail below and include, among other factors: (i) the nature, extent and quality of the services provided to the Portfolio by New York Life Investments, Segall and Brown Advisory; (ii) the qualifications of the portfolio managers of the Portfolio and the historical investment performance of the Portfolio, New York Life Investments, Segall and Brown Advisory; (iii) the costs of the services provided, and profits realized, by New York Life Investments, Segall and Brown Advisory with respect to their relationships with the Portfolio; (iv) the extent to which economies of scale have been realized or may be realized if the Portfolio grows and the extent to which any economies of scale have been shared, have benefited or may benefit the Portfolio’s shareholders; and (v) the reasonableness of the Portfolio’s management and subadvisory fees and total ordinary operating expenses. Although the Board recognized that comparisons between the Portfolio’s fees and expenses and those of other funds are imprecise given different terms of agreements, variations in fund strategies and other factors, the Board considered the reasonableness of the Portfolio’s management fee and total ordinary operating expenses as compared to the peer funds identified by ISS. Throughout their considerations, the Trustees acknowledged the commitment of New York Life Investments and its affiliates to serve the MainStay Group of Funds, as well as their capacity, experience, resources, financial stability and reputations. The Trustees also acknowledged the entrepreneurial and other risks assumed by New York Life Investments in sponsoring and managing the Portfolio. With respect to the Subadvisory Agreements, the Board took into account New York Life Investments’ recommendation to approve the continuation of the Subadvisory Agreements.
| 26 | MainStay VP Small Cap Growth Portfolio |
The Trustees noted that, throughout the year, the Trustees are afforded an opportunity to ask questions of, and request additional information or materials from, New York Life Investments, Segall and Brown Advisory. The Board’s decision with respect to each of the Advisory Agreements may have also been based, in part, on the Board’s knowledge of New York Life Investments, Segall and Brown Advisory resulting from, among other things, the Board’s consideration of each of the Advisory Agreements in prior years, the advisory agreements for other funds in the MainStay Group of Funds, the Board’s review throughout the year of the performance and operations of other funds in the MainStay Group of Funds and each Trustee’s business judgment and industry experience. In addition to considering the above-referenced factors, the Board observed that in the marketplace, notably under variable life insurance policies and variable annuity contracts for which the Portfolio serves as an investment option, there are a range of investment options available to investors and that the Portfolio’s shareholders, having had the opportunity to consider other investment options, have chosen to invest in the Portfolio.
The factors that figured prominently in the Board’s decision to approve the continuation of each of the Advisory Agreements during its December 6–7, 2022 meeting are summarized in more detail below.
Nature, Extent and Quality of Services Provided by New York Life Investments, Segall and Brown Advisory
The Board examined the nature, extent and quality of the services that New York Life Investments provides to the Portfolio. The Board evaluated New York Life Investments’ experience and capabilities in serving as manager of the Portfolio and considered that the Portfolio operates in a “manager-of-managers” structure. The Board also considered New York Life Investments’ responsibilities and services provided pursuant to this structure, including overseeing the services provided by Segall and Brown Advisory, evaluating the performance of Segall and Brown Advisory, making recommendations to the Board as to whether the Subadvisory Agreements should be renewed, modified or terminated and periodically reporting to the Board regarding the results of New York Life Investments’ evaluation and monitoring functions. The Board noted that New York Life Investments manages other mutual funds, serves a variety of other investment advisory clients, including other pooled investment vehicles, and has experience overseeing mutual fund service providers, including subadvisors. The Board considered the experience of senior personnel at New York Life Investments providing management and administrative and other non-advisory services to the Portfolio. The Board observed that New York Life Investments devotes significant resources and time to providing management and administrative and other non-advisory services to the Portfolio, including New York Life Investments’ oversight and due diligence reviews of Segall and Brown Advisory and ongoing analysis of, and interactions with, Segall and Brown Advisory with respect to, among other things, the Portfolio’s investment performance and risks as well as Segall’s and Brown Advisory’s investment capabilities and subadvisory services with respect to the Portfolio.
The Board also considered the range of services that New York Life Investments provides to the Portfolio under the terms of the Management Agreement, including: (i) fund accounting and ongoing supervisory services provided by New York Life Investments’ Fund Administration and Accounting Group; (ii) investment supervisory and analytical services provided by New York Life Investments’ Investment Consulting Group; (iii) compliance services provided by the Trust’s Chief Compliance Officer as well as New York Life Investments’ compliance department, including supervision and implementation of the Portfolio’s compliance program; (iv) legal services provided by New York Life Investments’ Office of the General Counsel; and (v) risk management monitoring and analysis by compliance and investment personnel. In addition, the Board considered New York Life Investments’ willingness to invest in personnel and other resources, such as cyber security, information security and business continuity planning, designed to benefit the Portfolio and noted that New York Life Investments is responsible for compensating the Trust’s officers, except for a portion of the salary of the Trust’s Chief Compliance Officer. The Board recognized that New York Life Investments provides certain other non-advisory services to the Portfolio and has provided an increasingly broad array of non-advisory services to the MainStay Group of Funds as a result of regulatory and other developments, including in connection with the implementation of the MainStay Group of Funds’ derivatives risk management program and policies and procedures adopted pursuant to Rule 18f-4 under the 1940 Act.
The Board also examined the range, and the nature, extent and quality, of the investment advisory services that Segall and Brown Advisory provide to the Portfolio and considered the terms of each of the Advisory Agreements. The Board evaluated Segall’s and Brown Advisory’s experience and performance in serving as subadvisors to the Portfolio and advising other portfolios and Segall’s and Brown Advisory’s track record and experience in providing investment advisory services, the experience of investment advisory, senior management and administrative personnel at Segall and Brown Advisory. The Board considered New York Life Investments’, Segall’s and Brown Advisory’s overall resources, legal and compliance environment, capabilities, reputation, financial condition and history. In addition to information provided in connection with quarterly meetings with the Trust’s Chief Compliance Officer, the Board considered information regarding the compliance policies and procedures of New York Life Investments, Segall and Brown Advisory and acknowledged their commitment to further developing and strengthening compliance programs relating to the Portfolio. The Board also considered Segall’s and Brown Advisory’s ability to recruit and retain qualified investment professionals and willingness to invest in personnel and other resources to service and support the Portfolio. In this regard, the Board considered the qualifications and experience of the Portfolio’s portfolio managers, the number of accounts managed by the portfolio managers and the method for compensating the portfolio managers.
In addition, the Board considered information provided by New York Life Investments, Segall and Brown Advisory regarding the operations of their respective business continuity plans in response to the COVID-19 pandemic and the continued remote work environment.
Board Consideration and Approval of Management Agreement and Subadvisory Agreements (Unaudited) (continued)
Based on these considerations, among others, the Board concluded that the Portfolio would likely continue to benefit from the nature, extent and quality of these services.
Investment Performance
In evaluating the Portfolio’s investment performance, the Board considered investment performance results over various periods in light of the Portfolio’s investment objective, strategies and risks. The Board considered investment reports on, and analysis of, the Portfolio’s performance provided to the Board throughout the year. These reports include, among other items, information on the Portfolio’s gross and net returns, the Portfolio’s investment performance compared to a relevant investment category and the Portfolio’s benchmark, the Portfolio’s risk-adjusted investment performance and the Portfolio’s investment performance as compared to peer funds, as appropriate, as well as portfolio attribution information and commentary on the effect of market conditions. The Board also considered information provided by ISS showing the investment performance of the Portfolio as compared to peer funds. In addition, the Board reviewed the methodology used by ISS to construct the group of peer funds for comparative purposes.
The Board also took into account its discussions with senior management at New York Life Investments concerning the Portfolio’s investment performance over various periods as well as discussions between the Portfolio’s portfolio management team and the members of the Board’s Investment Committee, which generally occur on an annual basis. In addition, the Board considered any specific actions that New York Life Investments, Segall or Brown Advisory had taken, or had agreed to take, to seek to enhance Portfolio investment performance and the results of those actions.
Based on these considerations, among others, the Board concluded that its review of the Portfolio’s investment performance and related information supported a determination to approve the continuation of each of the Advisory Agreements.
Costs of the Services Provided, and Profits and Other Benefits Realized, by New York Life Investments, Segall and Brown Advisory
The Board considered the costs of the services provided under each of the Advisory Agreements. The Board also considered the profits realized by New York Life Investments and its affiliates and Segall and Brown Advisory due to their relationships with the Portfolio as well as by New York Life Investments and its affiliates due to their relationships with the MainStay Group of Funds. The Board considered information from New York Life Investments that Segall’s and Brown Advisory’s subadvisory fees reflected an arm’s-length negotiation and that these fees are paid by New York Life Investments, not the Portfolio, and the relevance of Segall’s and Brown Advisory’s profitability was considered by the Trustees in that context. On this basis, the Board primarily considered the costs and profitability for New York Life Investments and its affiliates with respect to the Portfolio.
In addition, the Board acknowledged the difficulty in obtaining reliable comparative data about mutual fund managers’ profitability because such information generally is not publicly available and may be impacted by numerous factors, including the structure of a fund manager’s organization, the types of funds it manages, the methodology used to allocate certain fixed costs to specific funds and the manager’s capital structure and costs of capital.
In evaluating the costs of the services provided by New York Life Investments, Segall and Brown Advisory and profits realized by New York Life Investments and its affiliates, Segall and Brown Advisory, the Board considered, among other factors, New York Life Investments’ and its affiliates’, Segall’s and Brown Advisory’s continuing investments in, or willingness to invest in, personnel and other resources to support and further enhance the management of the Portfolio, and that New York Life Investments is responsible for paying the subadvisory fees for the Portfolio. The Board also considered the financial resources of New York Life Investments, Segall and Brown Advisory and acknowledged that New York Life Investments, Segall and Brown Advisory must be in a position to recruit and retain experienced professional personnel and to maintain a strong financial position for New York Life Investments, Segall and Brown Advisory to continue to provide high-quality services to the Portfolio. The Board recognized that the Portfolio benefits from the allocation of certain fixed costs among the funds in the MainStay Group of Funds, among other expected benefits resulting from its relationship with New York Life Investments.
The Board considered information regarding New York Life Investments’ methodology for calculating profitability and allocating costs provided by New York Life Investments in connection with the fund profitability analysis presented to the Board. The Board noted it had previously engaged an independent consultant to review the methods used to allocate costs among the funds in the MainStay Group of Funds. The Board also noted that the independent consultant had concluded that New York Life Investments’ methods for allocating costs and procedures for estimating overall profitability of the relationship with the funds in the MainStay Group of Funds are reasonable and that New York Life Investments continued to use the same method of calculating profit and allocating costs since the independent consultant’s review. The Board recognized the difficulty in calculating and evaluating a manager’s profitability with respect to the Portfolio and considered that other profitability methodologies may also be reasonable.
The Board also considered certain fall-out benefits that may be realized by New York Life Investments and its affiliates due to their relationships with the Portfolio, including reputational and other indirect benefits. The Board recognized, for example, the benefits to Segall and Brown Advisory from legally permitted “soft-dollar” arrangements by which brokers provide research and other services to Segall and Brown Advisory in exchange for commissions paid by the Portfolio with respect to trades in the Portfolio’s portfolio securities. In this regard, the Board also requested and considered information from New York Life Investments concerning other material business relationships between Segall and Brown Advisory and its affiliates and New York Life Investments and its affiliates. In
| 28 | MainStay VP Small Cap Growth Portfolio |
addition, the Board considered its review of the management agreement for a money market fund advised by New York Life Investments and an affiliated subadvisor that serves as an investment option for the Portfolio, including the potential rationale for and costs associated with investments in this money market fund by the Portfolio, if any, and considered information from New York Life Investments that the nature and type of specific investment advisory services provided to this money market fund are distinct from, or in addition to, the investment advisory services provided to the Portfolio. In addition, the Board considered the potential dividend received tax deduction for insurance company affiliates of New York Life Investments from the Portfolio’s securities lending activity.
The Board noted that the Portfolio serves as an investment option primarily under variable contracts issued by affiliates of New York Life Investments that would receive fees under those contracts. The Board observed that, in addition to fees earned by New York Life Investments under the Management Agreement for managing the Portfolio, New York Life Investments’ affiliates also earn revenues from serving the Portfolio in various other capacities, including as the Portfolio’s distributor. The Board considered information about these other revenues and their impact on the profitability of the relationship with the Portfolio to New York Life Investments and its affiliates. The Board noted that, although it assessed the overall profitability of the relationship with the Portfolio to New York Life Investments and its affiliates as part of the contract review process, when considering the reasonableness of the fee paid to New York Life Investments under the Management Agreement, the Board considered the profitability of New York Life Investments’ relationship with the Portfolio on a pre-tax basis and without regard to distribution expenses incurred by New York Life Investments from its own resources.
After evaluating the information deemed relevant by the Trustees, the Board concluded that any profits realized by New York Life Investments and its affiliates due to their relationships with the Portfolio were not excessive, other benefits that may accrue to New York Life Investments and its affiliates are reasonable and benefits that may accrue to Segall and Brown Advisory and its affiliates are consistent with those expected for a subadvisor to a mutual fund. With respect to Segall and Brown Advisory, the Board considered that any profits realized by Segall and Brown Advisory due to their relationships with the Portfolio are the result of arm’s-length negotiations between New York Life Investments and each of Segall and Brown Advisory, acknowledging that any such profits are based on the subadvisory fees paid to Segall and Brown Advisory by New York Life Investments, not the Portfolio.
Management and Subadvisory Fees and Total Ordinary Operating Expenses
The Board evaluated the reasonableness of the fee paid under each of the Advisory Agreements and the Portfolio’s total ordinary operating expenses. The Board primarily considered the reasonableness of the management fee paid by the Portfolio to New York Life Investments because the subadvisory fees paid to Segall and Brown Advisory are paid by New York Life Investments, not the Portfolio. The Board also
considered the reasonableness of the subadvisory fees paid by New York Life Investments and the amount of the management fee retained by New York Life Investments.
In assessing the reasonableness of the Portfolio’s fees and expenses, the Board primarily considered comparative data provided by ISS on the fees and expenses charged by similar mutual funds managed by other investment advisers. The Board reviewed the methodology used by ISS to construct the group of peer funds for comparative purposes. In addition, the Board considered information provided by New York Life Investments, Segall and Brown Advisory on fees charged to other investment advisory clients, including institutional separate accounts and/or other funds that follow investment strategies similar to those of the Portfolio, if any. The Board considered the contractual management fee schedules of the Portfolio as compared to those of such other investment advisory clients, taking into account the rationale for any differences in fee schedules. The Board also took into account information provided by New York Life Investments about the more extensive scope of services provided to registered investment companies, such as the Portfolio, as compared with other investment advisory clients. Additionally, the Board considered the impact of contractual breakpoints on the Portfolio’s net management fee and expenses. The Board also considered that in proposing fees for the Portfolio, New York Life Investments considers the competitive marketplace for mutual funds.
Based on the factors outlined above, among other considerations, the Board concluded that the Portfolio’s management fee and total ordinary operating expenses are within a range that is competitive and support a conclusion that these fees and expenses are reasonable.
Economies of Scale
The Board considered information regarding economies of scale, including whether economies of scale may exist for the Portfolio and whether the Portfolio’s expense structure permits any economies of scale to be appropriately shared with the Portfolio’s beneficial shareholders. The Board also considered a report from New York Life Investments, previously prepared at the request of the Board, that addressed economies of scale, including with respect to the mutual fund business generally, and the various ways in which the benefits of economies of scale may be shared with the funds in the MainStay Group of Funds. Although the Board recognized the difficulty of determining economies of scale with precision, the Board acknowledged that economies of scale may be shared with the Portfolio in a number of ways, including, for example, through the imposition of fee breakpoints, initially setting management fee rates at scale or making additional investments to enhance the services provided to the Portfolio. The Board reviewed information from New York Life Investments showing how the Portfolio’s management fee schedule compared to fee schedules of other funds and accounts managed by New York Life Investments. The Board also reviewed information from ISS showing how the Portfolio’s management fee schedule compared with fees paid for similar services by peer funds at varying asset levels.
Board Consideration and Approval of Management Agreement and Subadvisory Agreements (Unaudited) (continued)
Based on this information, the Board concluded that economies of scale are appropriately reflected for the benefit of the Portfolio’s beneficial shareholders through the Portfolio’s expense structure and other methods to share benefits from economies of scale.
Conclusion
On the basis of the information and factors summarized above, among other information and factors deemed relevant by the Trustees, and the evaluation thereof, the Board unanimously voted to approve the continuation of each of the Advisory Agreements.
| 30 | MainStay VP Small Cap Growth Portfolio |
Proxy Voting Policies and Procedures and Proxy Voting Record
The Portfolio is required to file with the SEC its proxy voting record for the 12-month period ending June 30 on Form N-PX. A description of the policies and procedures that are used to vote proxies relating to portfolio securities of the Portfolio is available free of charge upon request by calling 800-598-2019 or visiting the SEC's website at www.sec.gov. The most recent Form N-PX or proxy voting record is available free of charge upon request by calling 800-598-2019; visiting https://www.newyorklifeinvestments.com/investment-products/vp; or visiting the SEC’s website at www.sec.gov.
Shareholder Reports and Quarterly Portfolio Disclosure
The Portfolio is required to file its complete schedule of portfolio holdings with the SEC 60 days after its first and third fiscal quarter on Form N-PORT. The Portfolio's holdings report is available free of charge upon request by calling 800-598-2019 or by visiting the SEC’s website at www.sec.gov.
Board of Trustees and Officers (Unaudited)
The Trustees and officers of the Portfolio are listed below. The Board oversees the MainStay Group of Funds (which consists of MainStay Funds and MainStay Funds Trust), MainStay VP Funds Trust, MainStay MacKay DefinedTerm Municipal Opportunities Fund, MainStay CBRE Global Infrastructure Megatrends Fund, the Manager and the Subadvisors, and elects the officers of the Portfolios who are responsible for the day-to-day operations of the Portfolio. Information pertaining to the Trustees and officers is set forth below. Each Trustee serves until his or her successor
is elected and qualified or until his or her resignation, death or removal. Under the Board’s retirement policy, unless an exception is made, a Trustee must tender his or her resignation by the end of the calendar year during which he or she reaches the age of 75. The business address of each Trustee and officer listed below is 51 Madison Avenue, New York, New York 10010. None of the Trustees are “interested persons” (as defined by the 1940 Act and rules adopted by the SEC thereunder) of the Portfolio (“Independent Trustees”).
| | Name and
Year of Birth | Term of Office,
Position(s) Held and
Length of Service | Principal Occupation(s)
During Past Five Years | Number of
Portfolios in
Fund Complex
Overseen by
Trustee | Other Directorships
Held by Trustee |
| | | | | | |
| | David H. Chow
1957 | MainStay VP Funds Trust: Trustee since January 2016, Advisory Board Member (June 2015 to December 2015) | Founder and CEO, DanCourt Management, LLC since 1999 | 78 | MainStay Funds: Trustee since January 2016, Advisory Board Member (June 2015 to December 2015) (12 Funds);
MainStay Funds Trust: Trustee since January 2016, Advisory Board Member (June 2015 to December 2015) (33 Funds);
MainStay MacKay DefinedTerm Municipal Opportunities Fund: Trustee since January 2016, Advisory Board Member (June 2015 to December 2015);
MainStay CBRE Global Infrastructure Megatrends Fund: Trustee since June 2021;VanEck Vectors Group of Exchange-Traded Funds: Independent Chairman of the Board of Trustees since 2008 and Trustee since 2006 (57 portfolios); and Berea College of Kentucky: Trustee since 2009, Chair of the Committee since 2018 |
| | Susan B. Kerley
1951 | MainStay VP Funds Trust: Chairman since 2017 and Trustee since 2007* | President, Strategic Management Advisors LLC since 1990 | 78 | MainStay Funds: Chairman since 2017 and Trustee since 2007 (12 Funds); MainStay Funds Trust: Chairman since 2017 and Trustee since 1990 (33 Funds)**;
MainStay MacKay DefinedTerm Municipal Opportunities Fund: Chairman since 2017 and Trustee since 2011; MainStay CBRE Global Infrastructure Megatrends Fund: Trustee since June 2021; and Legg Mason Partners Funds: Trustee since 1991 (45 portfolios) |
| | Alan R. Latshaw
1951 | MainStay VP Funds Trust: Trustee since 2007* | Retired; Partner, Ernst & Young LLP (2002 to 2003); Partner, Arthur Andersen LLP (1989 to 2002); Consultant to the MainStay Funds Audit and Compliance Committee (2004 to 2006) | 78 | MainStay Funds: Trustee since 2006 (12 Funds);
MainStay Funds Trust: Trustee since 2007 (33 Funds)**;
MainStay MacKay DefinedTerm Municipal Opportunities Fund: Trustee since 2011; and
MainStay CBRE Global Infrastructure Megatrends Fund: Trustee since June 2021 |
| 32 | MainStay VP Small Cap Growth Portfolio |
| | Name and
Year of Birth | Term of Office,
Position(s) Held and
Length of Service | Principal Occupation(s)
During Past Five Years | Number of
Portfolios in
Fund Complex
Overseen by
Trustee | Other Directorships
Held by Trustee |
| | | | | | |
| | Karen Hammond
1956 | MainStay VP Funds Trust: Trustee since December 2021, Advisory Board Member (June 2021 to December 2021)
| Retired, Managing Director, Devonshire Investors (2007 to 2013); Senior Vice President, Fidelity Management & Research Co. (2005 to 2007); Senior Vice President and Corporate Treasurer, FMR Corp. (2003 to 2005); Chief Operating Officer, Fidelity Investments Japan (2001 to 2003) | 78 | MainStay Funds: Trustee since December 2021, Advisory Board Member (June 2021 to December 2021) (12 Funds);
MainStay Funds Trust: Trustee since December 2021, Advisory Board Member (June 2021 to December 2021) (33 Funds);
MainStay MacKay DefinedTerm Municipal Opportunities Fund: Trustee since December 2021, Advisory Board Member (June 2021 to December 2021);
MainStay CBRE Global Infrastructure Megatrends Fund: Trustee since December 2021, Advisory Board Member (June 2021 to December 2021);
Two Harbors Investment Corp.: Director since 2018; Rhode Island State Investment Commission: Member since 2017; and Blue Cross Blue Shield of Rhode Island: Director since 2019
|
| | Jacques P. Perold
1958 | MainStay VP Funds Trust: Trustee since January 2016, Advisory Board Member (June 2015 to December 2015) | Founder and Chief Executive Officer, CapShift Advisors LLC (since 2018); President, Fidelity Management & Research Company (2009 to 2014); President and Chief Investment Officer, Geode Capital Management, LLC (2001 to 2009) | 78 | MainStay Funds: Trustee since January 2016, Advisory Board Member (June 2015 to December 2015) (12 Funds);
MainStay Funds Trust: Trustee since January 2016, Advisory Board Member (June 2015 to December 2015) (33 Funds); MainStay MacKay DefinedTerm Municipal Opportunities Fund: Trustee since January 2016, Advisory Board Member (June 2015 to December 2015);
MainStay CBRE Global Infrastructure Megatrends Fund: Trustee since June 2021; Allstate Corporation: Director since 2015;
Partners in Health: Trustee since 2019; and
MSCI Inc.: Director since 2017 |
| | Richard S. Trutanic
1952 | MainStay VP Funds Trust: Trustee since 2007* | Chairman and Chief Executive Officer, Somerset & Company (financial advisory firm) since 2004; Managing Director, The Carlyle Group (private investment firm) (2002 to 2004); Senior Managing Director, Partner and Board Member, Groupe Arnault S.A. (private investment firm) (1999 to 2002)
| 78 | MainStay Funds: Trustee since 1994 (12 Funds);
MainStay Funds Trust: Trustee since 2007 (33 Funds)**;
MainStay MacKay DefinedTerm Municipal Opportunities Fund: Trustee since 2011; and
MainStay CBRE Global Infrastructure Megatrends Fund: Trustee since June 2021 |
| * | Includes prior service as a Director of MainStay VP Series Fund, Inc., the predecessor to MainStay VP Funds Trust. |
| ** | Includes prior service as a Director/Trustee of certain predecessor entities to MainStay Funds Trust. |
Board of Trustees and Officers (Unaudited) (continued)
| | Name and
Year of Birth | Position(s) Held and
Length of Service | Principal Occupation(s)
During Past Five Years | |
| | | | | |
| | Kirk C. Lehneis
1974 | President, MainStay VP Funds Trust (since 2017) | Chief Operating Officer and Senior Managing Director (since 2016), New York Life Investment Management LLC and New York Life Investment Management Holdings LLC; Member of the Board of Managers (since 2017) and Senior Managing Director (since 2018), NYLIFE Distributors LLC; Chairman of the Board and Senior Managing Director, NYLIM Service Company LLC (since 2017); Trustee, President and Principal Executive Officer of IndexIQ Trust, IndexIQ ETF Trust and IndexIQ Active ETF Trust (since January 2018); President, MainStay CBRE Global Infrastructure Megatrends Fund (since 2021), MainStay MacKay DefinedTerm Municipal Opportunities Fund, MainStay Funds and MainStay Funds Trust (since 2017); Senior Managing Director, Global Product Development (from 2015-2016); Managing Director, Product Development (from 2010-2015), New York Life Investment Management LLC | |
| | Jack R. Benintende
1964 | Treasurer and Principal Financial and Accounting Officer, MainStay VP Funds Trust (since 2007)** | Managing Director, New York Life Investment Management LLC (since 2007); Treasurer and Principal Financial and Accounting Officer, MainStay CBRE Global Infrastructure Megatrends Fund (since 2021), MainStay MacKay DefinedTerm Municipal Opportunities Fund (since 2011), MainStay Funds Trust (since 2009) and MainStay Funds (since 2007); and Assistant Treasurer, New York Life Investment Management Holdings LLC (2008 to 2012) | |
| | J. Kevin Gao
1967 | Secretary and Chief Legal Officer, MainStay VP Funds Trust (since 2010)** | Managing Director and Associate General Counsel, New York Life Investment Management LLC (since 2010); Secretary and Chief Legal Officer, MainStay CBRE Global Infrastructure Megatrends Fund (since 2021), MainStay MacKay DefinedTerm Municipal Opportunities Fund (since 2011), MainStay Funds and MainStay Funds Trust (since 2010) | |
| | Scott T. Harrington
1959 | Vice President— Administration, MainStay VP Funds Trust (since 2005)** | Managing Director, New York Life Investment Management LLC (including predecessor advisory organizations) (since 2000); Member of the Board of Directors, New York Life Trust Company (since 2009); Vice President—Administration, MainStay CBRE Global Infrastructure Megatrends Fund (since 2021), MainStay MacKay DefinedTerm Municipal Opportunities Fund (since 2011), MainStay Funds Trust and MainStay Funds (since 2009) | |
| | Kevin M. Gleason
1967 | Vice President and Chief Compliance Officer, MainStay VP Funds Trust (since June 2022) | Vice President and Chief Compliance Officer, IndexIQ, IndexIQ ETF Trust and Index IQ Active ETF Trust (since June 2022); Vice President and Chief Compliance Officer, MainStay CBRE Global Infrastructure Megatrends Fund, MainStay MacKay DefinedTerm Municipal Opportunities Fund (since June 2022); MainStay Funds Trust and MainStay Funds (since June 2022); Senior Vice President, Voya Investment Management and Chief Compliance Officer, Voya Family of Funds (2012-2022) | |
| * | The officers listed above are considered to be “interested persons” of the MainStay Group of Funds, MainStay VP Funds Trust, MainStay CBRE Global Infrastructure Megatrends Fund and MainStay MacKay DefinedTerm Municipal Opportunities Fund within the meaning of the 1940 Act because of their affiliation with the MainStay Group of Funds, New York Life Insurance Company and/or its affiliates, including New York Life Investment Management LLC, NYLIM Service Company LLC, NYLIFE Securities LLC and/or NYLIFE Distributors LLC, as described in detail in the column captioned “Principal Occupation(s) During Past Five Years.” Officers are elected annually by the Board. |
| ** | Includes prior service as an Officer of MainStay VP Series Fund, Inc., the predecessor to MainStay VP Funds Trust. |
Officers of the Trust (Who are not Trustees)*
| 34 | MainStay VP Small Cap Growth Portfolio |
MainStay VP Portfolios
MainStay VP offers a wide range of Portfolios. The full array of MainStay VP offerings is listed here, with information about the manager, subadvisors, legal counsel, and independent registered public accounting firm.
Equity
MainStay VP American Century Sustainable Equity Portfolio1
MainStay VP Candriam Emerging Markets Equity Portfolio
MainStay VP Epoch U.S. Equity Yield Portfolio
MainStay VP Fidelity Institutional AM® Utilities Portfolio†
MainStay VP MacKay International Equity Portfolio
MainStay VP Natural Resources Portfolio
MainStay VP S&P 500 Index Portfolio2
MainStay VP Small Cap Growth Portfolio
MainStay VP Wellington Growth Portfolio
MainStay VP Wellington Mid Cap Portfolio
MainStay VP Wellington Small Cap Portfolio
MainStay VP Wellington U.S. Equity Portfolio
MainStay VP Winslow Large Cap Growth Portfolio
Mixed Asset
MainStay VP Balanced Portfolio
MainStay VP Income Builder Portfolio
MainStay VP Janus Henderson Balanced Portfolio
MainStay VP MacKay Convertible Portfolio
Income
MainStay VP Bond Portfolio
MainStay VP Floating Rate Portfolio
MainStay VP Indexed Bond Portfolio
MainStay VP MacKay Government Portfolio
MainStay VP MacKay High Yield Corporate Bond Portfolio
MainStay VP MacKay Strategic Bond Portfolio
MainStay VP PIMCO Real Return Portfolio
Money Market
MainStay VP U.S. Government Money Market Portfolio
Alternative
MainStay VP CBRE Global Infrastructure Portfolio
MainStay VP IQ Hedge Multi-Strategy Portfolio
Asset Allocation
MainStay VP Conservative Allocation Portfolio
MainStay VP Equity Allocation Portfolio
MainStay VP Growth Allocation Portfolio
MainStay VP Moderate Allocation Portfolio
Manager
New York Life Investment Management LLC
New York, New York
Subadvisors
American Century Investment Management, Inc.
Kansas City, Missouri
Brown Advisory LLC
Baltimore, Maryland
Candriam*
Strassen, Luxembourg
CBRE Investment Management Listed Real Assets LLC
Radnor, Pennsylvania
Epoch Investment Partners, Inc.
New York, New York
FIAM LLC
Smithfield, Rhode Island
IndexIQ Advisors LLC*
New York, New York
Janus Henderson Investors US LLC
Denver, Colorado
MacKay Shields LLC*
New York, New York
Newton Investment Management North America, LLC
Boston, Massachusetts
NYL Investors LLC*
New York, New York
Pacific Investment Management Company LLC
Newport Beach, California
Segall Bryant & Hamill, LLC
Chicago, Illinois
Wellington Management Company LLP
Boston, Massachusetts
Winslow Capital Management, LLC
Minneapolis, Minnesota
Legal Counsel
Dechert LLP
Washington, District of Columbia
Independent Registered Public Accounting Firm
PricewaterhouseCoopers LLP
New York, New York
Distributor
NYLIFE Distributors LLC*
Jersey City, New Jersey
Custodian
JPMorgan Chase Bank, N.A.
New York, New York
Some Portfolios may not be available in all products.
† Fidelity Institutional AM is a registered trade mark of FMR LLC. Used with permission.
* An affiliate of New York Life Investment Management LLC.
| 1. | Prior to May 1, 2022, the Portfolio's name was MainStay VP T. Rowe Price Equity Income Portfolio. |
| 2. | Prior to May 1, 2022, the Portfolio's name was MainStay VP MacKay S&P 500 Index Portfolio. |
Not part of the Annual Report
2022 Annual Report
This report is for the general information of New York Life Variable Annuities and NYLIAC Variable Universal Life Insurance Products policyowners. It must be preceded or accompanied by the appropriate product(s) and funds prospectuses if it is given to anyone who is not an owner of a New York Life variable annuity policy or a NYLIAC Variable Universal Life Insurance Product. This report does not offer for sale or solicit orders to purchase securities.
The performance data quoted in this report represents past performance. Past performance is no guarantee of future results. Due to market volatility and other factors, current performance may be lower or higher than the figures shown. The most recent month-end performance summary for your variable annuity or variable life policy is available by calling 800-598-2019 and is updated periodically on newyorklife.com.
The New York Life Variable Annuities and NYLIAC Variable Universal Life Insurance Products are issued by New York Life Insurance and Annuity Corporation (a Delaware Corporation) and distributed by NYLIFE Distributors LLC (Member FINRA/SIPC).
New York Life Insurance Company
New York Life Insurance and Annuity
Corporation (NYLIAC) (A Delaware Corporation)
51 Madison Avenue, Room 551
New York, NY 10010
newyorklife.com
newyorklifeinvestments.com
NYLIFE Distributors LLC, 30 Hudson Street, Jersey City, NJ 07302
New York Life Investment Management LLC is the investment manager to the MainStay VP Funds Trust
©2023 by NYLIFE Distributors LLC. All rights reserved.
You may obtain copies of the Prospectus and the Statement of Additional Information free of charge, upon request, by calling toll-free 800-598-2019 or writing to New York Life Insurance and Annuity Corporation, 51 Madison Avenue, New York, NY 10010.
| Not FDIC Insured | No Bank Guarantee | May Lose Value |
(NYLIAC) NI515
MainStay VP MacKay International Equity Portfolio
Message from the President and Annual Report
December 31, 2022
Sign up for e-delivery of your shareholder reports. For full details on e-delivery, including who can participate and what you can receive via e-delivery,
please log in to newyorklifeinvestments.com/accounts.
| Not FDIC/NCUA Insured | Not a Deposit | May Lose Value | No Bank Guarantee | Not Insured by Any Government Agency |
This page intentionally left blank
Message from the President
The 12-month reporting period ended December 31, 2022, proved exceptionally challenging for investors as both stock and bond markets suffered steep declines. A variety of economic and geopolitical forces drove the market’s losses, all centered around rising inflation and monetary efforts to rein it in.
Inflationary alarms began to sound well before the reporting period began. In late 2021, after nearly two years of accommodative policies designed to encourage economic growth in the face of the COVID-19 pandemic, the U.S. Federal Reserve (the “Fed”) warned of the increasing need to tighten monetary policy. Nevertheless, the pace and persistence of inflation in early 2022 caught most market participants—the Fed included—off guard. Russia’s invasion of Ukraine in February exacerbated global inflationary pressures while increasing investor uncertainty. Domestic supply shortages, international trade imbalances and rising inflation caused U.S. GDP (gross domestic product) to contract in the first and second quarters of the year, although employment and consumer spending proved resilient. Prices for petroleum surged to multi-year highs, while many key agricultural chemicals and industrial metals soared as well. Accelerating inflationary forces prompted the Fed to implement its most aggressive series of interest rate hikes since the 1980s, with a 0.25% increase in March followed by six further rate increases totaling 4.25%. International central banks generally followed suit and raised rates by varying degrees in efforts to curb local inflation, although most increases remained significantly more modest than those in the United States. Relatively high U.S. interest rates and an international risk averse sentiment pushed U.S. dollar values higher compared to most other currencies, with negative impacts on global prices for food, fuel and other key U.S.-dollar-denominated products.
The effects of these interrelated challenges were felt throughout U.S. and international financial markets. The S&P 500® Index, a widely regarded benchmark of market performance, declined by more than 18% during the reporting period. Although the energy sector generated strong gains, bolstered by elevated oil and gas prices, most other industry segments recorded losses. The more cyclical and growth-oriented sectors of consumer discretionary, information technology and real estate delivered the weakest returns, while the traditionally defensive and value-oriented
consumer staples, utilities and health care sectors outperformed. On average, international developed-country equity markets mildly outperformed their U.S. counterparts, while emerging markets lagged slightly. Fixed-income markets proved unusually volatile, with bond prices trending sharply lower as yields rose along with interest rates. Short-term yields rose faster than long-term yields, producing a yield curve inversion from July through the end of the reporting period as long-term rates remained below short-term rates. While floating-rate instruments, which feature variable interest rates that allow investors to benefit from a rising rate environment, provided a degree of insulation from inflation-driven trends, they were not immune to the market’s widespread declines.
Although, according to the most recent estimates, the annualized inflation rate in the United States has declined from a peak of 9.1% in July 2022 to 6.5% in December, the Fed remains focused on achieving more substantial and lasting reductions, aiming for a target rate of 2%. As a result, further rate hikes and additional market volatility are potential headwinds in the coming months. The question remains as to whether the Fed and other central banks will manage a so-called “soft landing,” curbing inflation while avoiding a persistent economic slowdown. If they prove successful, we believe that the increasingly attractive valuations we have observed in both equity and bond markets should eventually translate into sustainable improvements in the investment environment.
Whatever actions the Fed takes and however financial markets react, as a MainStay VP investor you can depend on us to continue managing our portfolios with the insight, expertise and level of service that have long defined New York Life Investments. Thank you for trusting us to help you meet your investment needs.
Sincerely,
Kirk C. Lehneis
President
The opinions expressed are as of the date of this report and are subject to change. There is no guarantee that any forecast made will come to pass. This material does not constitute investment advice and is not intended as an endorsement of any specific investment. Past performance is no guarantee of future results.
Not part of the Annual Report
Investors should refer to the Portfolio’s Summary Prospectus and/or Prospectus and consider the Portfolio’s investment objectives, strategies, risks, charges and expenses carefully before investing. The Summary Prospectus and/or Prospectus contain this and other information about the Portfolio. You may obtain copies of the Portfolio’s Summary Prospectus, Prospectus and Statement of Additional Information, which includes information about the MainStay VP Funds Trust's Trustees, free of charge, upon request, by calling toll-free 800-598-2019, by writing to New York Life Insurance and Annuity Corporation, 51 Madison Avenue, Room 251, New York, New York 10010 or by sending an email to MainStayShareholdersServices@nylim.com. These documents are also available at newyorklifeinvestments.com/investment-products/vp. Please read the Portfolio's Summary Prospectus and/or Prospectus carefully before investing. MainStay VP Funds Trust portfolios are separate account options which are purchased through a variable insurance or variable annuity contract.
Investment and Performance Comparison (Unaudited)
Performance data quoted represents past performance. Past performance is no guarantee of future results. Because of market volatility and other factors, current performance may be lower or higher than the figures shown. Investment return and principal value will fluctuate, and as a result, when shares are redeemed, they may be worth more or less than their original cost. The performance table and graph do not reflect any deduction of sales charges, mortality and expense charges, contract charges or administrative charges. Please refer to the Performance Summary appropriate for your policy. For performance information current to the most recent month-end, please call 800-598-2019 or visit www.newyorklife.com.
Performance figures may reflect certain fee waivers and/or expense limitations, without which total returns may have been different. For information on current fee waivers and/or expense limitations (if any), please refer to the Notes to Financial Statements.
| Average Annual Total Returns for the Year-Ended December 31, 2022 |
| Class | Inception
Date | One
Year | Five
Years | Ten
Years | Gross
Expense
Ratio1 |
| Initial Class Shares | 5/1/1995 | -26.45% | 1.95% | 5.15% | 0.93% |
| Service Class Shares | 6/5/2003 | -26.63 | 1.69 | 4.89 | 1.18 |
| 1. | The gross expense ratios presented reflect the Portfolio’s “Total Annual Portfolio Operating Expenses” from the most recent Prospectus and may differ from other expense ratios disclosed in this report. |
| Benchmark Performance* | One
Year | Five
Years | Ten
Years |
| MSCI ACWI® ex USA Index (Net)1 | -16.00% | 0.88% | 3.80% |
| MSCI EAFE® Index (Net)2 | -14.45 | 1.54 | 4.67 |
| Morningstar Foreign Large Growth Category Average3 | -25.61 | 1.63 | 4.73 |
| * | Returns for indices reflect no deductions for fees, expenses or taxes, except for foreign withholding taxes where applicable. Results assume reinvestment of all dividends and capital gains. An investment cannot be made directly in an index. |
| 1. | The Portfolio has selected the MSCI ACWI® (All Country World Index) ex USA Index (Net) as its primary benchmark. The MSCI ACWI® ex USA Index (Net) is a free float-adjusted market capitalization weighted index that is designed to measure the equity market performance of developed and emerging markets, excluding the U.S. |
| 2. | The MSCI EAFE® Index (Net) is the Portfolio's secondary benchmark. The MSCI EAFE® Index (Net) consists of international stocks representing the developed world outside of North America. |
| 3. | The Morningstar Foreign Large Growth Category Average is representative of funds that focus on high-priced growth stocks, mainly outside of the United States. Most of these funds divide their assets among a dozen or more developed markets, including Japan, Britain, France, and Germany. These funds primarily invest in stocks that have market caps in the top 70% of each economically integrated market and will have less than 20% of assets invested in U.S. stocks. Results are based on average total returns of similar funds with all dividends and capital gain distributions reinvested. |
Cost in Dollars of a $1,000 Investment in MainStay VP MacKay International Equity Portfolio (Unaudited)
The example below is intended to describe the fees and expenses borne by shareholders during the six-month period from July 1, 2022 to December 31, 2022, and the impact of those costs on your investment.
Example
As a shareholder of the Portfolio you incur two types of costs: (1) transaction costs, including exchange fees and sales charges (loads) on purchases (as applicable), and (2) ongoing costs, including management fees, distribution and/or service (12b-1) fees and other Portfolio expenses (as applicable). This example is intended to help you understand your ongoing costs (in dollars) of investing in the Portfolio and to compare these costs with the ongoing costs of investing in other mutual funds. The example is based on an investment of $1,000 made at the beginning of the six-month period and held for the entire period from July 1, 2022 to December 31, 2022. Shares are only sold in connection with variable life and annuity contracts and the example does not reflect any contract level or transactional fees or expenses. If these costs had been included, your costs would have been higher.
This example illustrates your Portfolio’s ongoing costs in two ways:
Actual Expenses
The second and third data columns in the table below provide information about actual account values and actual expenses. You may use the information in these columns, together with the amount you invested, to estimate the expenses that you paid during the six months ended
December 31, 2022. Simply divide your account value by $1,000 (for example, an $8,600 account value divided by $1,000 = 8.6), then multiply the result by the number under the heading entitled “Expenses Paid During Period” to estimate the expenses you paid on your account during this period.
Hypothetical Example for Comparison Purposes
The fourth and fifth data columns in the table below provide information about hypothetical account values and hypothetical expenses based on the Portfolio’s actual expense ratio and an assumed rate of return of 5% per year before expenses, which is not the Portfolio’s actual return. The hypothetical account values and expenses may not be used to estimate the actual ending account balances or expenses you paid for the six-month period shown. You may use this information to compare the ongoing costs of investing in the Portfolio with the ongoing costs of investing in other mutual funds. To do so, compare this 5% hypothetical example with the 5% hypothetical examples that appear in the shareholder reports of the other mutual funds.
Please note that the expenses shown in the table are meant to highlight your ongoing costs only and do not reflect any transactional costs, such as exchange fees or sales charges (loads). Therefore, the fourth and fifth data columns of the table are useful in comparing ongoing costs only and will not help you determine the relative total costs of owning different funds. In addition, if these transactional costs were included, your costs would have been higher.
| Share Class | Beginning
Account
Value
7/1/22 | Ending Account
Value (Based
on Actual
Returns and
Expenses)
12/31/22 | Expenses
Paid
During
Period1 | Ending Account
Value (Based
on Hypothetical
5% Annualized
Return and
Actual Expenses)
12/31/22 | Expenses
Paid
During
Period1 | Net Expense
Ratio
During
Period2 |
| Initial Class Shares | $1,000.00 | $1,013.30 | $4.77 | $1,020.47 | $4.79 | 0.94% |
| Service Class Shares | $1,000.00 | $1,012.00 | $6.03 | $1,019.21 | $6.06 | 1.19% |
| 1. | Expenses are equal to the Portfolio’s annualized expense ratio of each class multiplied by the average account value over the period, divided by 365 and multiplied by 184 (to reflect the six-month period). The table above represents the actual expenses incurred during the six-month period. In addition to the fees and expenses which the Portfolio bears directly, it also indirectly bears a pro rata share of the fees and expenses of the underlying funds in which it invests. Such indirect expenses are not included in the above-reported expense figures. |
| 2. | Expenses are equal to the Portfolio's annualized expense ratio to reflect the six-month period. |
| 6 | MainStay VP MacKay International Equity Portfolio |
Country Composition as of December 31, 2022 (Unaudited)
| United States | 14.6% |
| United Kingdom | 11.5 |
| Germany | 10.4 |
| France | 9.8 |
| Switzerland | 9.6 |
| Netherlands | 8.6 |
| Japan | 7.8 |
| India | 6.1 |
| China | 5.3 |
| Israel | 4.2% |
| Hong Kong | 3.9 |
| Denmark | 2.5 |
| Sweden | 1.6 |
| Italy | 1.1 |
| Other Assets, Less Liabilities | 3.0 |
| | 100.0% |
See Portfolio of Investments beginning on page 10 for specific holdings within these categories. The Portfolio's holdings are subject to change.
Top Ten Holdings and/or Issuers Held as of December 31, 2022 (excluding short-term investments) (Unaudited)
| 1. | Tencent Holdings Ltd. |
| 2. | Lonza Group AG (Registered) |
| 3. | ICON plc |
| 4. | NICE Ltd., Sponsored ADR |
| 5. | Teleperformance |
| 6. | AIA Group Ltd. |
| 7. | Diageo plc |
| 8. | HDFC Bank Ltd. |
| 9. | Symrise AG |
| 10. | Adyen NV |
Portfolio Management Discussion and Analysis (Unaudited)
Answers to the questions reflect the views of Carlos Garcia-Tunon, CFA, Ian Murdoch, CFA, and Lawrence Rosenberg, CFA, of MacKay Shields LLC, the Portfolio’s Subadvisor.
How did MainStay VP MacKay International Equity Portfolio perform relative to its benchmarks and peers during the 12 months ended December 31, 2022?
For the 12 months ended December 31, 2022, MainStay VP MacKay International Equity Portfolio returned −26.45% for Initial Class shares and −26.63% for Service Class shares. Over the same period, both share classes underperformed the −16.00% return of the MSCI ACWI® ex USA Index (Net), which is the Portfolio’s primary benchmark, and the −14.45% return of the MSCI EAFE® Index (Net), which is a secondary benchmark of the Portfolio. For the 12 months ended December 31, 2022, both share classes underperformed the −25.61% return of the Morningstar Foreign Large Growth Category Average.1
During the reporting period, were there any market events that materially impacted the Portfolio’s performance or liquidity?
Risk assets declined at the beginning of the reporting period in response to Russia’s invasion of Ukraine. This exacerbated inflationary forces by exerting upward pressure on food and energy prices, leading to growing expectations for accelerated global monetary policy tightening. The decline in international equities accelerated in the second and third quarters of 2022 as the Ukraine conflict, China COVID-19 lockdowns and the continued prospect of higher interest rates weighed on investor sentiment. The fourth quarter saw most risk assets rebound strongly, although the full year remained disappointing for international equities generally and international growth stocks in particular.
What factors affected the Portfolio’s relative performance during the reporting period?
The Portfolio’s underperformance relative to the MSCI ACWI® ex USA Index (Net) was driven primarily by style factors, with the marked outperformance of lower-quality value stocks over higher-quality growth stocks during the reporting period. Based on the Portfolio’s active allocations, relative returns suffered primarily from negative contributions from stock selection on both a country and sector basis, as well as negative contributions from sector allocation. (Contributions take weightings and total returns into account.) These negative selection and allocation effects were partially offset by a positive contribution from country allocation.
Which sectors were the strongest positive contributors to the Portfolio’s relative performance, and which sectors were particularly weak?
During the reporting period, the strongest positive contributions to the Portfolio's performance relative to the MSCI ACWI® ex USA Index (Net) came from the real estate sector. The Portfolio’s real estate positioning benefited from an underweight position relative
to the Index, and was further boosted by a positive contribution from stock selection. During the same period, the health care, consumer discretionary and energy sectors provided the weakest contributions to relative performance. The Portfolio’s health care and consumer discretionary positions suffered from negative stock selection, although returns in health care benefited from overweight exposure relative to the Index, while returns in consumer discretionary benefited from underweight exposure. In the outperforming energy sector, relative returns were hurt by the Portfolio’s zero exposure.
During the reporting period, which individual stocks made the strongest positive contributions to the Portfolio’s absolute performance and which stocks detracted the most?
The top contributors to the Portfolio's absolute performance during the reporting period included positions in Hong Kong-based, pan-Asian life insurer AIA Group, French prepaid corporate services provider Edenred, and Swiss dental product and solutions provider Straumann Holding. The most significant detractors from absolute performance during the same period were French customer relationship management services firm Teleperformance, Brazilian vertically integrated health care provider Hapvida, and UK-domiciled, Asia-focused life insurer Prudential.
Did the Portfolio make any significant purchases or sales during the reporting period?
During the reporting period, the Fund’s largest initial purchase was in Hong Kong-based, pan-Asian life insurer AIA Group, while the largest increased position was in Israeli fraud detection and contact center software provider NICE. The Fund’s largest full sale was in UK-domiciled, Asia-focused life insurer Prudential, while the largest decreased position size was in French pharmaceutical and laboratory equipment supplier Sartorius Stedim Biotech.
How did the Portfolio’s sector weightings change during the reporting period?
The Portfolio's largest increases in sector exposures relative to the MSCI ACWI® ex USA Index (Net) were in the industrials and materials sectors. Conversely, the most significant decreases in sector exposure were in consumer discretionary and communication services.
How was the Portfolio positioned at the end of the reporting period?
As of December 31, 2022, the Portfolio held its most overweight positions relative to the MSCI ACWI® ex USA Index (Net) in the information technology and health care sectors. As of the same
| 1. | See page 5 for more information on benchmark and peer group returns. |
| 8 | MainStay VP MacKay International Equity Portfolio |
date, the Portfolio held its most significantly underweight exposures to the consumer discretionary and energy sectors.
The opinions expressed are those of the portfolio managers as of the date of this report and are subject to change. There is no guarantee that any forecasts will come to pass. This material does not constitute investment advice and is not intended as an endorsement of any specific investment.
Not all MainStay VP Portfolios and/or share classes are available under all policies.
Portfolio of Investments December 31, 2022†
| | Shares | Value |
| Common Stocks 96.8% |
| China 5.3% |
| Tencent Holdings Ltd. (Interactive Media & Services) | 544,955 | $ 23,161,790 |
| Denmark 2.5% |
| Chr Hansen Holding A/S (Chemicals) | 150,509 | 10,850,606 |
| France 9.8% |
| BioMerieux (Health Care Equipment & Supplies) | 39,069 | 4,108,544 |
| Dassault Systemes SE (Software) | 106,747 | 3,850,054 |
| Edenred (IT Services) | 239,978 | 13,058,204 |
| Sartorius Stedim Biotech (Life Sciences Tools & Services) | 13,513 | 4,402,460 |
| Teleperformance (Professional Services) | 75,253 | 17,957,246 |
| | | 43,376,508 |
| Germany 10.4% |
| Carl Zeiss Meditec AG (Health Care Equipment & Supplies) | 41,644 | 5,256,061 |
| Deutsche Boerse AG (Capital Markets) | 68,260 | 11,777,638 |
| Nemetschek SE (Software) | 115,844 | 5,916,854 |
| Scout24 SE (Interactive Media & Services) (a) | 166,532 | 8,367,051 |
| Symrise AG (Chemicals) | 135,680 | 14,760,970 |
| | | 46,078,574 |
| Hong Kong 3.9% |
| AIA Group Ltd. (Insurance) | 1,576,600 | 17,369,408 |
| India 6.1% |
| HDFC Bank Ltd. (Banks) | 794,639 | 15,642,726 |
| Housing Development Finance Corp. Ltd. (Diversified Financial Services) | 345,970 | 11,015,984 |
| | | 26,658,710 |
| Israel 4.2% |
| NICE Ltd., Sponsored ADR (Software) (b) | 97,218 | 18,695,021 |
| Italy 1.1% |
| Reply SpA (IT Services) | 40,432 | 4,650,012 |
| Japan 7.8% |
| Benefit One, Inc. (Professional Services) | 243,700 | 3,573,953 |
| Menicon Co. Ltd. (Health Care Equipment & Supplies) | 327,700 | 6,932,669 |
| | Shares | Value |
| |
| Japan (continued) |
| MonotaRO Co. Ltd. (Trading Companies & Distributors) | 366,500 | $ 5,182,678 |
| Relo Group, Inc. (Real Estate Management & Development) | 473,000 | 7,651,645 |
| SMS Co. Ltd. (Professional Services) | 168,500 | 4,304,666 |
| TechnoPro Holdings, Inc. (Professional Services) | 251,100 | 6,638,524 |
| | | 34,284,135 |
| Netherlands 8.6% |
| Adyen NV (IT Services) (a)(b) | 10,517 | 14,553,603 |
| IMCD NV (Trading Companies & Distributors) | 87,278 | 12,466,416 |
| Koninklijke DSM NV (Chemicals) | 88,840 | 10,891,388 |
| | | 37,911,407 |
| Sweden 1.6% |
| Hexagon AB, Class B (Electronic Equipment, Instruments & Components) | 363,208 | 3,817,956 |
| MIPS AB (Leisure Products) | 82,508 | 3,416,422 |
| | | 7,234,378 |
| Switzerland 9.6% |
| Belimo Holding AG (Registered) (Building Products) | 8,499 | 4,060,629 |
| Lonza Group AG (Registered) (Life Sciences Tools & Services) | 43,688 | 21,502,267 |
| Straumann Holding AG (Registered) (Health Care Equipment & Supplies) | 35,135 | 3,978,800 |
| TE Connectivity Ltd. (Electronic Equipment, Instruments & Components) | 112,279 | 12,889,629 |
| | | 42,431,325 |
| United Kingdom 11.5% |
| Diageo plc (Beverages) | 385,478 | 17,022,433 |
| Experian plc (Professional Services) | 337,177 | 11,478,710 |
| Linde plc (Chemicals) | 35,700 | 11,644,626 |
| St James's Place plc (Capital Markets) | 813,159 | 10,767,927 |
| | | 50,913,696 |
| United States 14.4% |
| Accenture plc, Class A (IT Services) | 15,299 | 4,082,385 |
| Aon plc, Class A (Insurance) | 34,621 | 10,391,147 |
| Globant SA (IT Services) (b) | 81,255 | 13,663,841 |
| ICON plc (Life Sciences Tools & Services) (b) | 110,620 | 21,487,935 |
The notes to the financial statements are an integral part of, and should be read in conjunction with, the financial statements.
| 10 | MainStay VP MacKay International Equity Portfolio |
| | Shares | | Value |
| Common Stocks (continued) |
| United States (continued) |
| STERIS plc (Health Care Equipment & Supplies) | 75,708 | | $ 13,982,511 |
| | | | 63,607,819 |
Total Common Stocks
(Cost $454,641,168) | | | 427,223,389 |
| Short-Term Investment 0.2% |
| Affiliated Investment Company 0.2% |
| United States 0.2% |
| MainStay U.S. Government Liquidity Fund, 3.602% (c) | 871,894 | | 871,894 |
Total Short-Term Investment
(Cost $871,894) | | | 871,894 |
Total Investments
(Cost $455,513,062) | 97.0% | | 428,095,283 |
| Other Assets, Less Liabilities | 3.0 | | 13,315,853 |
| Net Assets | 100.0% | | $ 441,411,136 |
| † | Percentages indicated are based on Portfolio net assets. |
| (a) | May be sold to institutional investors only under Rule 144A or securities offered pursuant to Section 4(a)(2) of the Securities Act of 1933, as amended. |
| (b) | Non-income producing security. |
| (c) | Current yield as of December 31, 2022. |
Investments in Affiliates (in 000's)
Investments in issuers considered to be affiliate(s) of the Portfolio during the year ended December 31, 2022 for purposes of Section 2(a)(3) of the Investment Company Act of 1940, as amended, were as follows:
| Affiliated Investment Companies | Value,
Beginning
of Year | Purchases
at Cost | Proceeds
from
Sales | Net
Realized
Gain/(Loss)
on Sales | Change in
Unrealized
Appreciation/
(Depreciation) | Value,
End of
Year | Dividend
Income | Other
Distributions | Shares
End of
Year |
| MainStay U.S. Government Liquidity Fund | $ 145 | $ 73,659 | $ (72,932) | $ — | $ — | $ 872 | $ 13 | $ — | 872 |
| Abbreviation(s): |
| ADR—American Depositary Receipt |
The notes to the financial statements are an integral part of, and should be read in conjunction with, the financial statements.
11
Portfolio of Investments December 31, 2022† (continued)
The following is a summary of the fair valuations according to the inputs used as of December 31, 2022, for valuing the Portfolio’s assets:
| Description | Quoted
Prices in
Active
Markets for
Identical
Assets
(Level 1) | | Significant
Other
Observable
Inputs
(Level 2) | | Significant
Unobservable
Inputs
(Level 3) | | Total |
| Asset Valuation Inputs | | | | | | | |
| Investments in Securities (a) | | | | | | | |
| Common Stocks | | | | | | | |
| China | $ — | | $ 23,161,790 | | $ — | | $ 23,161,790 |
| Denmark | — | | 10,850,606 | | — | | 10,850,606 |
| France | — | | 43,376,508 | | — | | 43,376,508 |
| Germany | — | | 46,078,574 | | — | | 46,078,574 |
| Hong Kong | — | | 17,369,408 | | — | | 17,369,408 |
| India | — | | 26,658,710 | | — | | 26,658,710 |
| Italy | — | | 4,650,012 | | — | | 4,650,012 |
| Japan | — | | 34,284,135 | | — | | 34,284,135 |
| Netherlands | — | | 37,911,407 | | — | | 37,911,407 |
| Sweden | — | | 7,234,378 | | — | | 7,234,378 |
| Switzerland | 12,889,629 | | 29,541,696 | | — | | 42,431,325 |
| United Kingdom | 11,644,626 | | 39,269,070 | | — | | 50,913,696 |
| All Other Countries | 82,302,840 | | — | | — | | 82,302,840 |
| Total Common Stocks | 106,837,095 | | 320,386,294 | | — | | 427,223,389 |
| Short-Term Investment | | | | | | | |
| Affiliated Investment Company | 871,894 | | — | | — | | 871,894 |
| Total Investments in Securities | $ 107,708,989 | | $ 320,386,294 | | $ — | | $ 428,095,283 |
| (a) | For a complete listing of investments and their industries, see the Portfolio of Investments. |
The notes to the financial statements are an integral part of, and should be read in conjunction with, the financial statements.
| 12 | MainStay VP MacKay International Equity Portfolio |
Industry Diversification
| | Value | | Percent † |
| Banks | $ 15,642,726 | | 3.5% |
| Beverages | 17,022,433 | | 3.9 |
| Building Products | 4,060,629 | | 0.9 |
| Capital Markets | 22,545,565 | | 5.1 |
| Chemicals | 48,147,590 | | 10.9 |
| Diversified Financial Services | 11,015,984 | | 2.5 |
| Electronic Equipment, Instruments & Components | 16,707,585 | | 3.8 |
| Health Care Equipment & Supplies | 34,258,585 | | 7.8 |
| Insurance | 27,760,555 | | 6.3 |
| Interactive Media & Services | 31,528,841 | | 7.1 |
| IT Services | 50,008,045 | | 11.3 |
| Leisure Products | 3,416,422 | | 0.8 |
| Life Sciences Tools & Services | 47,392,662 | | 10.7 |
| Professional Services | 43,953,099 | | 10.0 |
| Real Estate Management & Development | 7,651,645 | | 1.7 |
| Software | 28,461,929 | | 6.5 |
| Trading Companies & Distributors | 17,649,094 | | 4.0 |
| | 427,223,389 | | 96.8 |
| Short-Term Investment | 871,894 | | 0.2 |
| Other Assets, Less Liabilities | 13,315,853 | | 3.0 |
| Net Assets | $441,411,136 | | 100.0% |
| † | Percentages indicated are based on Portfolio net assets. |
The notes to the financial statements are an integral part of, and should be read in conjunction with, the financial statements.
13
Statement of Assets and Liabilities as of December 31, 2022
| Assets |
Investment in unaffiliated securities, at value
(identified cost $454,641,168) | $ 427,223,389 |
Investment in affiliated investment companies, at value
(identified cost $871,894) | 871,894 |
Cash denominated in foreign currencies
(identified cost $14,662,589) | 14,720,918 |
| Receivables: | |
| Investment securities sold | 1,288,255 |
| Dividends | 732,932 |
| Portfolio shares sold | 5,722 |
| Other assets | 2,633 |
| Total assets | 444,845,743 |
| Liabilities |
| Payables: | |
| Investment securities purchased | 2,593,166 |
| Manager (See Note 3) | 340,984 |
| Foreign capital gains tax (See Note 2) | 301,599 |
| Portfolio shares redeemed | 59,011 |
| NYLIFE Distributors (See Note 3) | 51,192 |
| Professional fees | 34,173 |
| Shareholder communication | 23,783 |
| Custodian | 13,758 |
| Accrued expenses | 16,941 |
| Total liabilities | 3,434,607 |
| Net assets | $ 441,411,136 |
| Composition of Net Assets |
| Shares of beneficial interest outstanding (par value of $.001 per share) unlimited number of shares authorized | $ 43,274 |
| Additional paid-in-capital | 543,182,164 |
| | 543,225,438 |
| Total distributable earnings (loss) | (101,814,302) |
| Net assets | $ 441,411,136 |
| Initial Class | |
| Net assets applicable to outstanding shares | $205,665,664 |
| Shares of beneficial interest outstanding | 19,989,187 |
| Net asset value per share outstanding | $ 10.29 |
| Service Class | |
| Net assets applicable to outstanding shares | $235,745,472 |
| Shares of beneficial interest outstanding | 23,284,982 |
| Net asset value per share outstanding | $ 10.12 |
The notes to the financial statements are an integral part of, and should be read in conjunction with, the financial statements.
| 14 | MainStay VP MacKay International Equity Portfolio |
Statement of Operations for the year ended December 31, 2022
| Investment Income (Loss) |
| Income | |
| Dividends-unaffiliated (net of foreign tax withholding of $478,405) | $ 5,069,633 |
| Dividends-affiliated | 13,265 |
| Securities lending, net | 10,663 |
| Total income | 5,093,561 |
| Expenses | |
| Manager (See Note 3) | 4,219,774 |
| Distribution/Service—Service Class (See Note 3) | 639,617 |
| Professional fees | 104,663 |
| Custodian | 81,845 |
| Shareholder communication | 27,260 |
| Trustees | 10,198 |
| Miscellaneous | 42,109 |
| Total expenses | 5,125,466 |
| Net investment income (loss) | (31,905) |
| Realized and Unrealized Gain (Loss) |
| Net realized gain (loss) on: | |
| Unaffiliated investment transactions(a) | (70,552,638) |
| Foreign currency transactions | (1,191,502) |
| Net realized gain (loss) | (71,744,140) |
| Net change in unrealized appreciation (depreciation) on: | |
| Unaffiliated investments(b) | (85,077,148) |
| Translation of other assets and liabilities in foreign currencies | (350,998) |
| Net change in unrealized appreciation (depreciation) | (85,428,146) |
| Net realized and unrealized gain (loss) | (157,172,286) |
| Net increase (decrease) in net assets resulting from operations | $(157,204,191) |
| (a) | Realized gain (loss) on security transactions recorded net of foreign capital gains tax in the amount of $62,960. |
| (b) | Net change in unrealized appreciation (depreciation) on investments recorded net of foreign capital gains tax in the amount of $(238,205). |
The notes to the financial statements are an integral part of, and should be read in conjunction with, the financial statements.
15
Statements of Changes in Net Assets
for the years ended December 31, 2022 and December 31, 2021
| | 2022 | 2021 |
| Increase (Decrease) in Net Assets |
| Operations: | | |
| Net investment income (loss) | $ (31,905) | $ 1,332,779 |
| Net realized gain (loss) | (71,744,140) | 95,139,312 |
| Net change in unrealized appreciation (depreciation) | (85,428,146) | (30,744,702) |
| Net increase (decrease) in net assets resulting from operations | (157,204,191) | 65,727,389 |
| Distributions to shareholders: | | |
| Initial Class | (42,204,462) | (33,734,818) |
| Service Class | (47,989,156) | (41,322,755) |
| Total distributions to shareholders | (90,193,618) | (75,057,573) |
| Capital share transactions: | | |
| Net proceeds from sales of shares | 56,783,387 | 34,068,196 |
| Net asset value of shares issued to shareholders in reinvestment of distributions | 90,193,618 | 75,057,573 |
| Cost of shares redeemed | (46,049,495) | (72,259,312) |
| Increase (decrease) in net assets derived from capital share transactions | 100,927,510 | 36,866,457 |
| Net increase (decrease) in net assets | (146,470,299) | 27,536,273 |
| Net Assets |
| Beginning of year | 587,881,435 | 560,345,162 |
| End of year | $ 441,411,136 | $587,881,435 |
The notes to the financial statements are an integral part of, and should be read in conjunction with, the financial statements.
| 16 | MainStay VP MacKay International Equity Portfolio |
Financial Highlights selected per share data and ratios
| | Year Ended December 31, |
| Initial Class | 2022 | | 2021 | | 2020 | | 2019 | | 2018 |
| Net asset value at beginning of year | $ 17.98 | | $ 18.43 | | $ 16.21 | | $ 14.99 | | $ 17.46 |
| Net investment income (loss) (a) | 0.02 | | 0.07 | | 0.03 | | 0.12 | | 0.10 |
| Net realized and unrealized gain (loss) | (5.06) | | 2.12 | | 3.24 | | 3.31 | | (2.04) |
| Total from investment operations | (5.04) | | 2.19 | | 3.27 | | 3.43 | | (1.94) |
| Less distributions: | | | | | | | | | |
| From net investment income | (0.04) | | (0.02) | | (0.12) | | (0.08) | | (0.21) |
| From net realized gain on investments | (2.61) | | (2.62) | | (0.93) | | (2.13) | | (0.32) |
| Total distributions | (2.65) | | (2.64) | | (1.05) | | (2.21) | | (0.53) |
| Net asset value at end of year | $ 10.29 | | $ 17.98 | | $ 18.43 | | $ 16.21 | | $ 14.99 |
| Total investment return (b) | (26.45)% | | 12.24% | | 20.85% | | 24.80% | | (11.56)% |
| Ratios (to average net assets)/Supplemental Data: | | | | | | | | | |
| Net investment income (loss) | 0.12% | | 0.37% | | 0.16% | | 0.74% | | 0.55% |
| Net expenses (c) | 0.95% | | 0.93% | | 0.96% | | 0.96% | �� | 0.96% |
| Portfolio turnover rate | 102% | | 86% | | 135% | | 66% | | 46% |
| Net assets at end of year (in 000's) | $ 205,666 | | $ 266,747 | | $ 245,101 | | $ 209,278 | | $ 158,215 |
| (a) | Per share data based on average shares outstanding during the year. |
| (b) | Total return does not reflect any deduction of sales charges, mortality and expense charges, contract charges or administrative charges. For periods of less than one year, total return is not annualized. |
| (c) | In addition to the fees and expenses which the Portfolio bears directly, it also indirectly bears a pro-rata share of the fees and expenses of the underlying funds in which it invests. Such indirect expenses are not included in the above expense ratios. |
| | Year Ended December 31, |
| Service Class | 2022 | | 2021 | | 2020 | | 2019 | | 2018 |
| Net asset value at beginning of year | $ 17.75 | | $ 18.24 | | $ 16.06 | | $ 14.86 | | $ 17.32 |
| Net investment income (loss) (a) | (0.02) | | 0.02 | | (0.01) | | 0.08 | | 0.05 |
| Net realized and unrealized gain (loss) | (5.00) | | 2.11 | | 3.20 | | 3.28 | | (2.03) |
| Total from investment operations | (5.02) | | 2.13 | | 3.19 | | 3.36 | | (1.98) |
| Less distributions: | | | | | | | | | |
| From net investment income | — | | — | | (0.08) | | (0.03) | | (0.16) |
| From net realized gain on investments | (2.61) | | (2.62) | | (0.93) | | (2.13) | | (0.32) |
| Total distributions | (2.61) | | (2.62) | | (1.01) | | (2.16) | | (0.48) |
| Net asset value at end of year | $ 10.12 | | $ 17.75 | | $ 18.24 | | $ 16.06 | | $ 14.86 |
| Total investment return (b) | (26.63)% | | 11.96% | | 20.54% | | 24.49% | | (11.78)% |
| Ratios (to average net assets)/Supplemental Data: | | | | | | | | | |
| Net investment income (loss) | (0.12)% | | 0.12% | | (0.08)% | | 0.52% | | 0.32% |
| Net expenses (c) | 1.20% | | 1.18% | | 1.21% | | 1.21% | | 1.21% |
| Portfolio turnover rate | 102% | | 86% | | 135% | | 66% | | 46% |
| Net assets at end of year (in 000's) | $ 235,745 | | $ 321,135 | | $ 315,244 | | $ 303,135 | | $ 258,307 |
| (a) | Per share data based on average shares outstanding during the year. |
| (b) | Total return does not reflect any deduction of sales charges, mortality and expense charges, contract charges or administrative charges. For periods of less than one year, total return is not annualized. |
| (c) | In addition to the fees and expenses which the Portfolio bears directly, it also indirectly bears a pro-rata share of the fees and expenses of the underlying funds in which it invests. Such indirect expenses are not included in the above expense ratios. |
The notes to the financial statements are an integral part of, and should be read in conjunction with, the financial statements.
17
Notes to Financial Statements
Note 1–Organization and Business
MainStay VP Funds Trust (the “Fund”) was organized as a Delaware statutory trust on February 1, 2011. The Fund is registered under the Investment Company Act of 1940, as amended (the “1940 Act”), as an open-end management investment company. The Fund is comprised of thirty-one separate series (collectively referred to as the “Portfolios”). These financial statements and notes relate to the MainStay VP MacKay International Equity Portfolio (the "Portfolio"), a "diversified” portfolio, as that term is defined in the 1940 Act, as interpreted or modified by regulatory authorities having jurisdiction, from time to time.
Shares of the Portfolio are currently offered to certain separate accounts to fund variable annuity policies and variable universal life insurance policies issued by New York Life Insurance and Annuity Corporation (“NYLIAC”), a wholly-owned subsidiary of New York Life Insurance Company (“New York Life”) and may also be offered to fund variable annuity policies and variable universal life insurance policies issued by other insurance companies. NYLIAC allocates shares of the Portfolio to, among others, certain NYLIAC separate accounts. Shares of the Portfolio are also offered to the MainStay VP Conservative Allocation Portfolio, MainStay VP Moderate Allocation Portfolio, MainStay VP Growth Allocation Portfolio and MainStay VP Equity Allocation Portfolio, which operate as “funds-of-funds," and other variable insurance funds.
The following table lists the Portfolio's share classes that have been registered and commenced operations:
| Class | Commenced Operations |
| Initial Class | May 1, 1995 |
| Service Class | June 5, 2003 |
Shares of the Portfolio are offered and are redeemed at a price equal to their respective net asset value (“NAV”) per share. No sales or redemption charge is applicable to the purchase or redemption of the Portfolio's shares. Under the terms of the Fund’s multiple class plan, adopted pursuant to Rule 18f-3 under the 1940 Act, the classes differ in that, among other things, Service Class shares of the Portfolio pay a combined distribution and service fee of 0.25% of average daily net assets attributable to Service Class shares of the Portfolio to the Distributor (as defined in Note 3(B)) pursuant to a plan adopted in accordance with Rule 12b-1 under the 1940 Act. Contract owners of variable annuity contracts purchased after June 2, 2003, are permitted to invest only in the Service Class shares.
The Portfolio's investment objective is to seek long-term growth of capital.
Note 2–Significant Accounting Policies
The Portfolio is an investment company and accordingly follows the investment company accounting and reporting guidance of the Financial Accounting Standards Board (“FASB”) Accounting Standards Codification Topic 946 Financial Services—Investment Companies. The Portfolio prepares its financial statements in accordance with generally accepted
accounting principles (“GAAP”) in the United States of America and follows the significant accounting policies described below.
(A) Securities Valuation. Investments are usually valued as of the close of regular trading on the New York Stock Exchange (the "Exchange") (usually 4:00 p.m. Eastern time) on each day the Portfolio is open for business ("valuation date").
Effective September 8, 2022, and pursuant to Rule 2a-5 under the 1940 Act, the Board of Trustees of the Fund (the "Board") designated New York Life Investment Management LLC (“New York Life Investments” or the "Manager") as its Valuation Designee (the "Valuation Designee"). The Valuation Designee is responsible for performing fair valuations relating to all investments in the Portfolio’s portfolio for which market quotations are not readily available; periodically assessing and managing material valuation risks; establishing and applying fair value methodologies; testing fair valuation methodologies; evaluating and overseeing pricing services; ensuring appropriate segregation of valuation and portfolio management functions; providing quarterly, annual and prompt reporting to the Board, as appropriate; identifying potential conflicts of interest; and maintaining appropriate records. The Valuation Designee has established a valuation committee ("Valuation Committee") to assist in carrying out the Valuation Designee’s responsibilities and establish prices of securities for which market quotations are not readily available. The Portfolio’s and the Valuation Designee's policies and procedures ("Valuation Procedures") govern the Valuation Designee’s selection and application of methodologies for determining and calculating the fair value of Portfolio investments. The Valuation Designee may value the Portfolio's portfolio securities for which market quotations are not readily available and other Portfolio assets utilizing inputs from pricing services and other third-party sources (together, “Pricing Sources”). The Valuation Committee meets (in person, via electronic mail or via teleconference) on an ad-hoc basis to determine fair valuations and on a quarterly basis to review fair value events with respect to certain securities for which market quotations are not readily available, including valuation risks and back-testing results, and preview reports to the Board.
The Valuation Committee establishes prices of securities for which market quotations are not readily available based on such methodologies and measurements on a regular basis after considering information that is reasonably available and deemed relevant by the Valuation Committee. The Board shall oversee the Valuation Designee and review fair valuation materials on a prompt, quarterly and annual basis and approve proposed revisions to the Valuation Procedures.
Investments for which market quotations are not readily available are valued at fair value as determined in good faith pursuant to the Valuation Procedures. A market quotation is readily available only when that quotation is a quoted price (unadjusted) in active markets for identical investments that the Portfolio can access at the measurement date, provided that a quotation will not be readily available if it is not reliable. "Fair value" is defined as the price the Portfolio would reasonably expect to receive upon selling an asset or liability in an orderly transaction to an independent buyer in the principal or most advantageous market for the
| 18 | MainStay VP MacKay International Equity Portfolio |
asset or liability. Fair value measurements are determined within a framework that establishes a three-tier hierarchy that maximizes the use of observable market data and minimizes the use of unobservable inputs to establish a classification of fair value measurements for disclosure purposes. "Inputs" refer broadly to the assumptions that market participants would use in pricing the asset or liability, including assumptions about risk, such as the risk inherent in a particular valuation technique used to measure fair value using a pricing model and/or the risk inherent in the inputs for the valuation technique. Inputs may be observable or unobservable. Observable inputs reflect the assumptions market participants would use in pricing the asset or liability based on market data obtained from sources independent of the Portfolio. Unobservable inputs reflect the Portfolio’s own assumptions about the assumptions market participants would use in pricing the asset or liability based on the information available. The inputs or methodology used for valuing assets or liabilities may not be an indication of the risks associated with investing in those assets or liabilities. The three-tier hierarchy of inputs is summarized below.
| • | Level 1—quoted prices (unadjusted) in active markets for an identical asset or liability |
| • | Level 2—other significant observable inputs (including quoted prices for a similar asset or liability in active markets, interest rates and yield curves, prepayment speeds, credit risk, etc.) |
| • | Level 3—significant unobservable inputs (including the Portfolio's own assumptions about the assumptions that market participants would use in measuring fair value of an asset or liability) |
The level of an asset or liability within the fair value hierarchy is based on the lowest level of an input, both individually and in the aggregate, that is significant to the fair value measurement. The aggregate value by input level of the Portfolio’s assets and liabilities as of December 31, 2022, is included at the end of the Portfolio of Investments.
The Portfolio may use third-party vendor evaluations, whose prices may be derived from one or more of the following standard inputs, among others:
| • Broker/dealer quotes | • Benchmark securities |
| • Two-sided markets | • Reference data (corporate actions or material event notices) |
| • Bids/offers | • Monthly payment information |
| • Industry and economic events | • Reported trades |
An asset or liability for which a market quotation is not readily available is valued by methods deemed reasonable in good faith by the Valuation Committee, following the Valuation Procedures to represent fair value. Under these procedures, the Valuation Designee generally uses a market-based approach which may use related or comparable assets or liabilities, recent transactions, market multiples, book values and other relevant information. The Valuation Designee may also use an income-based valuation approach in which the anticipated future cash flows of the asset or liability are discounted to calculate fair value.
Discounts may also be applied due to the nature and/or duration of any restrictions on the disposition of the asset or liability. Fair value represents a good faith approximation of the value of a security. Fair value determinations involve the consideration of a number of subjective factors, an analysis of applicable facts and circumstances and the exercise of judgment. As a result, it is possible that the fair value for a security determined in good faith in accordance with the Valuation Procedures may differ from valuations for the same security determined for other funds using their own valuation procedures. Although the Valuation Procedures are designed to value a security at the price the Portfolio may reasonably expect to receive upon the security's sale in an orderly transaction, there can be no assurance that any fair value determination thereunder would, in fact, approximate the amount that the Portfolio would actually realize upon the sale of the security or the price at which the security would trade if a reliable market price were readily available. During the year ended December 31, 2022, there were no material changes to the fair value methodologies.
Securities which may be valued in this manner include, but are not limited to: (i) a security for which trading has been halted or suspended or otherwise does not have a readily available market quotation on a given day; (ii) a debt security that has recently gone into default and for which there is not a current market quotation; (iii) a security of an issuer that has entered into a restructuring; (iv) a security that has been delisted from a national exchange; (v) a security subject to trading collars for which no or limited trading takes place; and (vi) a security whose principal market has been temporarily closed at a time when, under normal conditions, it would be open. Securities valued in this manner are generally categorized as Level 2 or 3 in the hierarchy.
Certain securities held by the Portfolio may principally trade in foreign markets. Events may occur between the time the foreign markets close and the time at which the Portfolio's NAVs are calculated. These events may include, but are not limited to, situations relating to a single issuer in a market sector, significant fluctuations in U.S. or foreign markets, natural disasters, armed conflicts, governmental actions or other developments not tied directly to the securities markets. Should the Valuation Designee conclude that such events may have affected the accuracy of the last price of such securities reported on the local foreign market, the Valuation Designee may, pursuant to the Valuation Procedures, adjust the value of the local price to reflect the estimated impact on the price of such securities as a result of such events. In this instance, securities are generally categorized as Level 3 in the hierarchy. Additionally, certain foreign equity securities are also fair valued whenever the movement of a particular index exceeds certain thresholds. In such cases, the securities are fair valued by applying factors provided by a third-party vendor in accordance with the Valuation Procedures and are generally categorized as Level 2 in the hierarchy. Securities that were fair valued in such a manner as of December 31, 2022, are shown in the Portfolio of Investments.
If the principal market of certain foreign equity securities is closed in observance of a local foreign holiday, these securities are valued using the last closing price of regular trading on the relevant exchange and fair
Notes to Financial Statements (continued)
valued by applying factors provided by a third-party vendor in accordance with the Valuation Procedures. These securities are generally categorized as Level 2 in the hierarchy. No securities held by the Portfolio as of December 31, 2022, were fair valued in such a manner.
Equity securities are valued at the last quoted sales prices as of the close of regular trading on the relevant exchange on each valuation date. Securities that are not traded on the valuation date are valued at the mean of the last quoted bid and ask prices. Prices are normally taken from the principal market in which each security trades. These securities are generally categorized as Level 1 in the hierarchy.
Investments in mutual funds, including money market funds, are valued at their respective NAVs at the close of business each day on the valuation date. These securities are generally categorized as Level 1 in the hierarchy.
Temporary cash investments acquired in excess of 60 days to maturity at the time of purchase are valued using the latest bid prices or using valuations based on a matrix system (which considers such factors as security prices, yields, maturities and ratings), both as furnished by independent pricing services. Temporary cash investments that mature in 60 days or less at the time of purchase ("Short-Term Investments") are valued using the amortized cost method of valuation, unless the use of such method would be inappropriate. The amortized cost method involves valuing a security at its cost on the date of purchase and thereafter assuming a constant amortization to maturity of the difference between such cost and the value on maturity date. Amortized cost approximates the current fair value of a security. Securities valued using the amortized cost method are not valued using quoted prices in an active market and are generally categorized as Level 2 in the hierarchy.
The information above is not intended to reflect an exhaustive list of the methodologies that may be used to value portfolio investments. The Valuation Procedures permit the use of a variety of valuation methodologies in connection with valuing portfolio investments. The methodology used for a specific type of investment may vary based on the market data available or other considerations. The methodologies summarized above may not represent the specific means by which portfolio investments are valued on any particular business day.
(B) Income Taxes. The Portfolio's policy is to comply with the requirements of the Internal Revenue Code of 1986, as amended (the “Internal Revenue Code”), applicable to regulated investment companies and to distribute all of its taxable income to the shareholders of the Portfolio within the allowable time limits.
The Manager evaluates the Portfolio’s tax positions to determine if the tax positions taken meet the minimum recognition threshold in connection with accounting for uncertainties in income tax positions taken or expected to be taken for the purposes of measuring and recognizing tax liabilities in the financial statements. Recognition of tax benefits of an uncertain tax position is permitted only to the extent the position is “more likely than not” to be sustained assuming examination by taxing authorities. The Manager analyzed the Portfolio's tax positions taken on
federal, state and local income tax returns for all open tax years (for up to three tax years) and has concluded that no provisions for federal, state and local income tax are required in the Portfolio's financial statements. The Portfolio's federal, state and local income tax and federal excise tax returns for tax years for which the applicable statutes of limitations have not expired are subject to examination by the Internal Revenue Service and state and local departments of revenue.
(C) Foreign Taxes. The Portfolio may be subject to foreign taxes on income and other transaction-based taxes imposed by certain countries in which it invests. A portion of the taxes on gains on investments or currency purchases/repatriation may be reclaimable. The Portfolio will accrue such taxes and reclaims as applicable, based upon its current interpretation of tax rules and regulations that exist in the markets in which it invests.
The Portfolio may be subject to taxation on realized capital gains, repatriation proceeds and other transaction-based taxes imposed by certain countries in which it invests. The Portfolio will accrue such taxes as applicable based upon its current interpretation of tax rules and regulations that exist in the market in which it invests. Capital gains taxes relating to positions still held are reflected as a liability in the Statement of Assets and Liabilities, as well as an adjustment to the Portfolio's net unrealized appreciation (depreciation). Taxes related to capital gains realized, if any, are reflected as part of net realized gain (loss) in the Statement of Operations. Changes in tax liabilities related to capital gains taxes on unrealized investment gains, if any, are reflected as part of the change in net unrealized appreciation (depreciation) on investments in the Statement of Operations. Transaction-based charges are generally assessed as a percentage of the transaction amount.
(D) Dividends and Distributions to Shareholders. Dividends and distributions are recorded on the ex-dividend date. The Portfolio intends to declare and pay dividends from net investment income and distributions from net realized capital and currency gains, if any, at least annually. All dividends and distributions are reinvested at NAV in the same class of shares of the Portfolio. Dividends and distributions to shareholders are determined in accordance with federal income tax regulations and may differ from determinations using GAAP.
(E) Security Transactions and Investment Income. The Portfolio records security transactions on the trade date. Realized gains and losses on security transactions are determined using the identified cost method. Dividend income is recognized on the ex-dividend date, net of any foreign tax withheld at the source, and interest income is accrued as earned using the effective interest rate method. Distributions received from real estate investment trusts may be classified as dividends, capital gains and/or return of capital.
Investment income and realized and unrealized gains and losses on investments of the Portfolio are allocated pro rata to the separate classes of shares based upon their relative net assets on the date the income is earned or realized and unrealized gains and losses are incurred.
| 20 | MainStay VP MacKay International Equity Portfolio |
(F) Expenses. Expenses of the Fund are allocated to the individual Portfolios in proportion to the net assets of the respective Portfolios when the expenses are incurred, except where direct allocations of expenses can be made. Expenses (other than fees incurred under the distribution and service plans, further discussed in Note 3(B), which are charged directly to the Service Class shares) are allocated to separate classes of shares pro rata based upon their relative net assets on the date the expenses are incurred. The expenses borne by the Portfolio, including those of related parties to the Portfolio, are shown in the Statement of Operations.
Additionally, the Portfolio may invest in mutual funds, which are subject to management fees and other fees that may cause the costs of investing in mutual funds to be greater than the costs of owning the underlying securities directly. These indirect expenses of mutual funds are not included in the amounts shown as expenses in the Statement of Operations or in the expense ratios included in the Financial Highlights.
(G) Use of Estimates. In preparing financial statements in conformity with GAAP, the Manager makes estimates and assumptions that affect the reported amounts and disclosures in the financial statements. Actual results could differ from those estimates and assumptions.
(H) Foreign Currency Transactions. The Portfolio's books and records are maintained in U.S. dollars. Prices of securities denominated in foreign currency amounts are translated into U.S. dollars at the mean between the buying and selling rates last quoted by any major U.S. bank at the following dates:
(i) market value of investment securities, other assets and liabilities— at the valuation date; and
(ii) purchases and sales of investment securities, income and expenses—at the date of such transactions.
The assets and liabilities that are denominated in foreign currency amounts are presented at the exchange rates and market values at the close of the period. The realized and unrealized changes in net assets arising from fluctuations in exchange rates and market prices of securities are not separately presented.
Net realized gain (loss) on foreign currency transactions represents net currency gains or losses realized as a result of differences between the amounts of securities sale proceeds or purchase cost, dividends, interest and withholding taxes as recorded on the Portfolio's books, and the U.S. dollar equivalent amount actually received or paid. Net currency gains or losses from valuing such foreign currency denominated assets and liabilities, other than investments at valuation date exchange rates, are reflected in unrealized foreign exchange gains or losses.
(I) Securities Lending. In order to realize additional income, the Portfolio may engage in securities lending, subject to the limitations set forth in the 1940 Act and relevant guidance by the staff of the Securities and Exchange Commission (“SEC”). If the Portfolio engages in securities lending, the Portfolio will lend through its custodian, JPMorgan Chase Bank, N.A., ("JPMorgan"), acting as securities lending agent on behalf of
the Portfolio. Under the current arrangement, JPMorgan will manage the Portfolio's collateral in accordance with the securities lending agency agreement between the Portfolio and JPMorgan, and indemnify the Portfolio against counterparty risk. The loans will be collateralized by cash (which may be invested in a money market fund) and/or non-cash collateral (which may include U.S. Treasury securities and/or U.S. government agency securities issued or guaranteed by the United States government or its agencies or instrumentalities) at least equal at all times to the market value of the securities loaned. Non-cash collateral held at year end is segregated and cannot be transferred by the Portfolio. The Portfolio bears the risk of delay in recovery of, or loss of rights in, the securities loaned. The Portfolio may also record a realized gain or loss on securities deemed sold due to a borrower’s inability to return securities on loan. The Portfolio bears the risk of any loss on investment of cash collateral. The Portfolio will receive compensation for lending its securities in the form of fees or it will retain a portion of interest earned on the investment of any cash collateral. The Portfolio will also continue to receive interest and dividends on the securities loaned and any gain or loss in the market price of the securities loaned that may occur during the term of the loan will be for the account of the Portfolio. Income earned from securities lending activities, if any, is reflected in the Statement of Operations. As of December 31, 2022, the Portfolio did not have any portfolio securities on loan.
(J) Foreign Securities Risk. The Portfolio invests in foreign securities, which carry certain risks that are in addition to the usual risks inherent in domestic securities. These risks include those resulting from currency fluctuations, future adverse political or economic developments and possible imposition of currency exchange blockages or other foreign governmental laws or restrictions. These risks are likely to be greater in emerging markets than in developed markets. The ability of issuers of debt securities held by the Portfolio to meet their obligations may be affected by, among other things, economic or political developments in a specific country, industry or region.
(K) Indemnifications. Under the Fund’s organizational documents, its officers and trustees are indemnified against certain liabilities that may arise out of performance of their duties to the Fund. Additionally, in the normal course of business, the Portfolio enters into contracts with third-party service providers that contain a variety of representations and warranties and that may provide general indemnifications. The Portfolio's maximum exposure under these arrangements is unknown, as this would involve future claims that may be made against the Portfolio that have not yet occurred. The Manager believes that the risk of loss in connection with these potential indemnification obligations is remote. However, there can be no assurance that material liabilities related to such obligations will not arise in the future, which could adversely impact the Portfolio.
Note 3–Fees and Related Party Transactions
(A) Manager and Subadvisor. New York Life Investments, a registered investment adviser and an indirect, wholly-owned subsidiary of New York Life, serves as the Portfolio's Manager, pursuant to an Amended
Notes to Financial Statements (continued)
and Restated Management Agreement ("Management Agreement"). The Manager provides offices, conducts clerical, recordkeeping and bookkeeping services and keeps most of the financial and accounting records required to be maintained by the Portfolio. Except for the portion of salaries and expenses that are the responsibility of the Portfolio, the Manager pays the salaries and expenses of all personnel affiliated with the Portfolio and certain operational expenses of the Portfolio. During a portion of the year ended December 31, 2022, the Portfolio reimbursed New York Life Investments in an amount equal to the portion of the compensation of the Chief Compliance Officer attributable to the Portfolio. MacKay Shields LLC ("MacKay Shields" or the "Subadvisor"), a registered investment adviser and an indirect, wholly-owned subsidiary of New York Life, serves as the Subadvisor to the Portfolio and is responsible for the day-to-day portfolio management of the Portfolio. Pursuant to the terms of an Amended and Restated Subadvisory Agreement between New York Life Investments and MacKay Shields, New York Life Investments pays for the services of the Subadvisor.
Pursuant to the Management Agreement, the Fund pays the Manager, on behalf of the Portfolio, a monthly fee for the services performed and the facilities furnished at an annual rate of the Portfolio's average daily net assets as follows: 0.89% up to $500 million; and 0.85% in excess of $500 million. During the year ended December 31, 2022, the effective management fee rate was 0.89%.
During the year ended December 31, 2022, New York Life Investments earned fees from the Portfolio in the amount of $4,219,774 and paid the Subadvisor fees of $2,109,887.
JPMorgan provides sub-administration and sub-accounting services to the Portfolio pursuant to an agreement with New York Life Investments. These services include calculating the daily NAVs of the Portfolio, maintaining the general ledger and sub-ledger accounts for the calculation of the Portfolio's NAVs, and assisting New York Life Investments in conducting various aspects of the Portfolio's administrative operations. For providing these services to the Portfolio, JPMorgan is compensated by New York Life Investments.
Pursuant to an agreement between the Fund and New York Life Investments, New York Life Investments is responsible for providing or procuring certain regulatory reporting services for the Portfolio. The Portfolio will reimburse New York Life Investments for the actual costs incurred by New York Life Investments in connection with providing or procuring these services for the Portfolio.
(B) Distribution and Service Fees. The Fund, on behalf of the Portfolio, has entered into a distribution agreement with NYLIFE Distributors LLC (the “Distributor”), an affiliate of New York Life Investments. The Portfolio has adopted a distribution plan (the “Plan”) in accordance with the provisions of Rule 12b-1 under the 1940 Act. Under the Plan, the Distributor has agreed to provide, through its affiliates or independent third parties, various distribution-related, shareholder and administrative support services to the Service Class shareholders. For its services, the Distributor is entitled to a combined distribution and service
fee accrued daily and paid monthly at an annual rate of 0.25% of the average daily net assets attributable to the Service Class shares of the Portfolio.
Note 4-Federal Income Tax
As of December 31, 2022, the cost and unrealized appreciation (depreciation) of the Portfolio’s investment portfolio, including applicable derivative contracts and other financial instruments, as determined on a federal income tax basis, were as follows:
| | Federal Tax
Cost | Gross
Unrealized
Appreciation | Gross
Unrealized
(Depreciation) | Net
Unrealized
Appreciation/
(Depreciation) |
| Investments in Securities | $467,944,628 | $14,676,667 | $(54,526,012) | $(39,849,345) |
As of December 31, 2022, the components of accumulated gain (loss) on a tax basis were as follows:
Ordinary
Income | Accumulated
Capital
and Other
Gain (Loss) | Other
Temporary
Differences | Unrealized
Appreciation
(Depreciation) | Total
Accumulated
Gain (Loss) |
| $— | $(61,578,793) | $— | $(40,235,509) | $(101,814,302) |
The difference between book-basis and tax-basis unrealized appreciation (depreciation) is primarily due to wash sale adjustments and Passive Foreign Investment Company ("PFIC") adjustments.
The following table discloses the current year reclassifications between total distributable earnings (loss) and additional paid-in capital arising from permanent differences; net assets as of December 31, 2022 were not affected.
| | Total
Distributable
Earnings (Loss) | Additional
Paid-In
Capital |
| | $920,495 | $(920,495) |
The reclassifications for the Portfolio are primarily due to different book and tax treatment of reclassification of net operating losses.
As of December 31, 2022, for federal income tax purposes, capital loss carryforwards of $61,578,793, as shown in the table below, were available to the extent provided by the regulations to offset future realized gains of the Portfolio. Accordingly, no capital gains distributions are expected to be paid to shareholders until net gains have been realized in excess of such amounts.
Capital Loss
Available Through | Short-Term
Capital Loss
Amounts (000’s) | Long-Term
Capital Loss
Amounts (000’s) |
| Unlimited | $53,031 | $8,548 |
| 22 | MainStay VP MacKay International Equity Portfolio |
During the years ended December 31, 2022 and December 31, 2021, the tax character of distributions paid as reflected in the Statements of Changes in Net Assets was as follows:
| | 2022 | 2021 |
| Distributions paid from: | | |
| Ordinary Income | $46,066,083 | $50,111,243 |
| Long-Term Capital Gains | 44,127,535 | 24,946,330 |
| Total | $90,193,618 | $75,057,573 |
Note 5–Custodian
JPMorgan is the custodian of cash and securities held by the Portfolio. Custodial fees are charged to the Portfolio based on the Portfolio's net assets and/or the market value of securities held by the Portfolio and the number of certain transactions incurred by the Portfolio.
Note 6–Line of Credit
The Portfolio and certain other funds managed by New York Life Investments maintain a line of credit with a syndicate of banks in order to secure a source of funds for temporary purposes to meet unanticipated or excessive redemption requests.
Effective July 26, 2022, under the credit agreement (the “Credit Agreement”), the aggregate commitment amount is $600,000,000 with an additional uncommitted amount of $100,000,000. The commitment fee is an annual rate of 0.15% of the average commitment amount payable quarterly, regardless of usage, to JPMorgan, who serves as the agent to the syndicate. The commitment fee is allocated among the Portfolio and certain other funds managed by New York Life Investments based upon their respective net assets and other factors. Interest on any revolving credit loan is charged based upon the Federal Funds Rate, Daily Simple Secured Overnight Financing Rate ("SOFR") + 0.10%, or the Overnight Bank Funding Rate, whichever is higher. The Credit Agreement expires on July 25, 2023, although the Portfolio, certain other funds managed by New York Life Investments and the syndicate of banks may renew the Credit Agreement for an additional year on the same or different terms or enter into a credit agreement with a different syndicate of banks. Prior to July 26, 2022, the aggregate commitment amount and the commitment fee were the same as those under the current Credit Agreement. During the year ended December 31, 2022, there were no borrowings made or outstanding with respect to the Portfolio under the Credit Agreement.
Note 7–Interfund Lending Program
Pursuant to an exemptive order issued by the SEC, the Portfolio, along with certain other funds managed by New York Life Investments, may participate in an interfund lending program. The interfund lending program provides an alternative credit facility that permits the Portfolio and certain other funds managed by New York Life Investments to lend or borrow money for temporary purposes directly to or from one another, subject to the conditions of the exemptive order. During the year ended
December 31, 2022, there were no interfund loans made or outstanding with respect to the Portfolio.
Note 8–Purchases and Sales of Securities (in 000’s)
During the year ended December 31, 2022, purchases and sales of securities, other than short-term securities, were $477,634 and $468,483, respectively.
Note 9–Capital Share Transactions
Transactions in capital shares for the years ended December 31, 2022 and December 31, 2021, were as follows:
| Initial Class | Shares | Amount |
| Year ended December 31, 2022: | | |
| Shares sold | 1,923,130 | $ 26,627,915 |
| Shares issued to shareholders in reinvestment of distributions | 4,555,503 | 42,204,462 |
| Shares redeemed | (1,322,741) | (16,804,815) |
| Net increase (decrease) | 5,155,892 | $ 52,027,562 |
| Year ended December 31, 2021: | | |
| Shares sold | 838,988 | $ 16,153,016 |
| Shares issued to shareholders in reinvestment of distributions | 1,922,628 | 33,734,818 |
| Shares redeemed | (1,225,104) | (23,742,345) |
| Net increase (decrease) | 1,536,512 | $ 26,145,489 |
| |
| Service Class | Shares | Amount |
| Year ended December 31, 2022: | | |
| Shares sold | 2,224,777 | $ 30,155,472 |
| Shares issued to shareholders in reinvestment of distributions | 5,261,219 | 47,989,156 |
| Shares redeemed | (2,297,584) | (29,244,680) |
| Net increase (decrease) | 5,188,412 | $ 48,899,948 |
| Year ended December 31, 2021: | | |
| Shares sold | 962,140 | $ 17,915,180 |
| Shares issued to shareholders in reinvestment of distributions | 2,385,193 | 41,322,755 |
| Shares redeemed | (2,530,506) | (48,516,967) |
| Net increase (decrease) | 816,827 | $ 10,720,968 |
Note 10–Other Matters
As of the date of this report, interest rates in the United States and many parts of the world, including certain European countries, are ascending from historically low levels. Thus, the Portfolio currently faces a heightened level of risk associated with rising interest rates. This could be driven by a variety of factors, including but not limited to central bank monetary policies, changing inflation or real growth rates, general economic conditions, increasing bond issuances or reduced market demand for low yielding investments.
An outbreak of COVID-19, first detected in December 2019, has developed into a global pandemic and has resulted in travel restrictions,
Notes to Financial Statements (continued)
closure of international borders, certain businesses and securities markets, restrictions on securities trading activities, prolonged quarantines, supply chain disruptions, and lower consumer demand, as well as general concern and uncertainty. In 2022, many countries lifted some or all restrictions related to COVID-19. However, the continued impact of COVID-19 and related variants is uncertain and could further adversely affect the global economy, national economies, individual issuers and capital markets in unforeseeable ways and result in a substantial and extended economic downturn. Developments that disrupt global economies and financial markets, such as COVID-19, may magnify factors that affect the Portfolio's performance.
Note 11–Subsequent Events
In connection with the preparation of the financial statements of the Portfolio as of and for the year ended December 31, 2022, events and transactions subsequent to December 31, 2022, through the date the financial statements were issued have been evaluated by the Manager for possible adjustment and/or disclosure. No subsequent events requiring financial statement adjustment or disclosure have been identified.
| 24 | MainStay VP MacKay International Equity Portfolio |
Report of Independent Registered Public Accounting Firm
To the Board of Trustees of MainStay VP Funds Trust and Shareholders of
MainStay VP MacKay International Equity Portfolio
Opinion on the Financial Statements
We have audited the accompanying statement of assets and liabilities, including the portfolio of investments, of MainStay VP MacKay International Equity Portfolio (one of the portfolios constituting MainStay VP Funds Trust, referred to hereafter as the “Portfolio”) as of December 31, 2022, the related statement of operations for the year ended December 31, 2022, the statements of changes in net assets for each of the two years in the period ended December 31, 2022, including the related notes, and the financial highlights for each of the five years in the period ended December 31, 2022 (collectively referred to as the “financial statements”). In our opinion, the financial statements present fairly, in all material respects, the financial position of the Portfolio as of December 31, 2022, the results of its operations for the year then ended, the changes in its net assets for each of the two years in the period ended December 31, 2022 and the financial highlights for each of the five years in the period ended December 31, 2022 in conformity with accounting principles generally accepted in the United States of America.
Basis for Opinion
These financial statements are the responsibility of the Portfolio’s management. Our responsibility is to express an opinion on the Portfolio’s financial statements based on our audits. We are a public accounting firm registered with the Public Company Accounting Oversight Board (United States) (PCAOB) and are required to be independent with respect to the Portfolio in accordance with the U.S. federal securities laws and the applicable rules and regulations of the Securities and Exchange Commission and the PCAOB.
We conducted our audits of these financial statements in accordance with the standards of the PCAOB. Those standards require that we plan and perform the audit to obtain reasonable assurance about whether the financial statements are free of material misstatement, whether due to error or fraud.
Our audits included performing procedures to assess the risks of material misstatement of the financial statements, whether due to error or fraud, and performing procedures that respond to those risks. Such procedures included examining, on a test basis, evidence regarding the amounts and disclosures in the financial statements. Our audits also included evaluating the accounting principles used and significant estimates made by management, as well as evaluating the overall presentation of the financial statements. Our procedures included confirmation of securities owned as of December 31, 2022 by correspondence with the custodian, transfer agent and brokers; when replies were not received from brokers, we performed other auditing procedures. We believe that our audits provide a reasonable basis for our opinion.
/s/PricewaterhouseCoopers LLP
New York, New York
February 24, 2023
We have served as the auditor of one or more investment companies in the MainStay group of funds since 1984.
Board Consideration and Approval of Management Agreement and Subadvisory Agreement (Unaudited)
The continuation of the Management Agreement with respect to the MainStay VP MacKay International Equity Portfolio (“Portfolio”) and New York Life Investment Management LLC (“New York Life Investments”) and the Subadvisory Agreement between New York Life Investments and MacKay Shields LLC (“MacKay”) with respect to the Portfolio (together, “Advisory Agreements”) is subject to annual review and approval by the Board of Trustees of MainStay VP Funds Trust (“Board” of the “Trust”) in accordance with Section 15 of the Investment Company Act of 1940, as amended (“1940 Act”). At its December 6–7, 2022 meeting, the Board, which is comprised solely of Trustees who are not an “interested person” (as such term is defined in the 1940 Act) of the Trust (“Independent Trustees”), unanimously approved the continuation of each of the Advisory Agreements for a one-year period.
In reaching the decision to approve the continuation of each of the Advisory Agreements, the Board considered information and materials furnished by New York Life Investments and MacKay in connection with an annual contract review process undertaken by the Board that took place at meetings of the Board and its Contracts Committee during October 2022 through December 2022, including information and materials furnished by New York Life Investments and MacKay in response to requests prepared on behalf of the Board, and in consultation with the Board, by independent legal counsel to the Independent Trustees, which encompassed a variety of topics, including those summarized below. Information and materials requested by and furnished to the Board for consideration in connection with the contract review process included, among other items, reports on the Portfolio and “peer funds” prepared by Institutional Shareholder Services Inc. (“ISS”), an independent third-party service provider engaged by the Board to report objectively on the Portfolio’s investment performance, management fee and total expenses. The Board also considered information on the fees charged to other investment advisory clients of New York Life Investments and/or MacKay that follow investment strategies similar to those of the Portfolio, if any, and, when applicable, the rationale for any differences in the Portfolio’s management and subadvisory fees and the fees charged to those other investment advisory clients. In addition, the Board considered information regarding the legal standards and fiduciary obligations applicable to its consideration of the continuation of each of the Advisory Agreements. The contract review process, including the structure and format for information and materials provided to the Board, has been developed in consultation with the Board. The Independent Trustees also met in executive sessions with their independent legal counsel and, for portions thereof, with senior management of New York Life Investments.
The Board’s deliberations with respect to the continuation of each of the Advisory Agreements reflect a year-long process, and the Board also took into account information furnished to the Board and its Committees throughout the year, as deemed relevant and appropriate by the Trustees, including, among other items, reports on investment performance of the Portfolio and investment-related matters for the Portfolio as well as presentations from New York Life Investments and, generally annually, MacKay personnel. In addition, the Board took into account other information received from New York Life Investments throughout the year,
including, among other items, periodic reports on legal and compliance matters, risk management, portfolio turnover, brokerage commissions and non-advisory services provided to the Portfolio by New York Life Investments, as deemed relevant and appropriate by the Trustees.
In addition to information provided to the Board throughout the year, the Board received information in connection with its June 2022 meeting provided specifically in response to requests prepared on behalf of the Board, and in consultation with the Board, by independent legal counsel to the Independent Trustees regarding the Portfolio’s distribution arrangements. In addition, the Board received information regarding the Portfolio’s asset levels, share purchase and redemption activity and the payment of Rule 12b-1 and/or other fees by the applicable share classes of the Portfolio, among other information.
In considering the continuation of each of the Advisory Agreements, the Trustees reviewed and evaluated the information and factors they believed to reasonably be necessary and appropriate in light of legal advice furnished to them by independent legal counsel to the Independent Trustees and through the exercise of their own business judgment. Although individual Trustees may have weighed certain factors or information differently and the Board did not consider any single factor or information controlling in reaching its decision, the factors considered by the Board are summarized in more detail below and include, among other factors: (i) the nature, extent and quality of the services provided to the Portfolio by New York Life Investments and MacKay; (ii) the qualifications of the portfolio managers of the Portfolio and the historical investment performance of the Portfolio, New York Life Investments and MacKay; (iii) the costs of the services provided, and profits realized, by New York Life Investments and MacKay with respect to their relationships with the Portfolio; (iv) the extent to which economies of scale have been realized or may be realized if the Portfolio grows and the extent to which any economies of scale have been shared, have benefited or may benefit the Portfolio’s shareholders; and (v) the reasonableness of the Portfolio’s management and subadvisory fees and total ordinary operating expenses. Although the Board recognized that comparisons between the Portfolio’s fees and expenses and those of other funds are imprecise given different terms of agreements, variations in fund strategies and other factors, the Board considered the reasonableness of the Portfolio’s management fee and total ordinary operating expenses as compared to the peer funds identified by ISS. Throughout their considerations, the Trustees acknowledged the commitment of New York Life Investments and its affiliates to serve the MainStay Group of Funds, as well as their capacity, experience, resources, financial stability and reputations. The Trustees also acknowledged the entrepreneurial and other risks assumed by New York Life Investments in sponsoring and managing the Portfolio. With respect to the Subadvisory Agreement, the Board took into account New York Life Investments’ recommendation to approve the continuation of the Subadvisory Agreement.
The Trustees noted that, throughout the year, the Trustees are afforded an opportunity to ask questions of, and request additional information or materials from, New York Life Investments and MacKay. The Board’s decision with respect to each of the Advisory Agreements may have also
| 26 | MainStay VP MacKay International Equity Portfolio |
been based, in part, on the Board’s knowledge of New York Life Investments and MacKay resulting from, among other things, the Board’s consideration of each of the Advisory Agreements in prior years, the advisory agreements for other funds in the MainStay Group of Funds, the Board’s review throughout the year of the performance and operations of other funds in the MainStay Group of Funds and each Trustee’s business judgment and industry experience. In addition to considering the above-referenced factors, the Board observed that in the marketplace, notably under variable life insurance policies and variable annuity contracts for which the Portfolio serves as an investment option, there are a range of investment options available to investors and that the Portfolio’s shareholders, having had the opportunity to consider other investment options, have chosen to invest in the Portfolio.
The factors that figured prominently in the Board’s decision to approve the continuation of each of the Advisory Agreements during its December 6–7, 2022 meeting are summarized in more detail below.
Nature, Extent and Quality of Services Provided by New York Life Investments and MacKay
The Board examined the nature, extent and quality of the services that New York Life Investments provides to the Portfolio. The Board evaluated New York Life Investments’ experience and capabilities in serving as manager of the Portfolio and considered that the Portfolio operates in a “manager-of-managers” structure. The Board also considered New York Life Investments’ responsibilities and services provided pursuant to this structure, including overseeing the services provided by MacKay, evaluating the performance of MacKay, making recommendations to the Board as to whether the Subadvisory Agreement should be renewed, modified or terminated and periodically reporting to the Board regarding the results of New York Life Investments’ evaluation and monitoring functions. The Board noted that New York Life Investments manages other mutual funds, serves a variety of other investment advisory clients, including other pooled investment vehicles, and has experience overseeing mutual fund service providers, including subadvisors. The Board considered the experience of senior personnel at New York Life Investments providing management and administrative and other non-advisory services to the Portfolio. The Board observed that New York Life Investments devotes significant resources and time to providing management and administrative and other non-advisory services to the Portfolio, including New York Life Investments’ oversight and due diligence reviews of MacKay and ongoing analysis of, and interactions with, MacKay with respect to, among other things, the Portfolio’s investment performance and risks as well as MacKay’s investment capabilities and subadvisory services with respect to the Portfolio.
The Board also considered the range of services that New York Life Investments provides to the Portfolio under the terms of the Management Agreement, including: (i) fund accounting and ongoing supervisory services provided by New York Life Investments’ Fund Administration and Accounting Group; (ii) investment supervisory and analytical services provided by New York Life Investments’ Investment Consulting Group; (iii) compliance services provided by the Trust’s Chief Compliance Officer as
well as New York Life Investments’ compliance department, including supervision and implementation of the Portfolio’s compliance program; (iv) legal services provided by New York Life Investments’ Office of the General Counsel; and (v) risk management monitoring and analysis by compliance and investment personnel. In addition, the Board considered New York Life Investments’ willingness to invest in personnel and other resources, such as cyber security, information security and business continuity planning, designed to benefit the Portfolio and noted that New York Life Investments is responsible for compensating the Trust’s officers, except for a portion of the salary of the Trust’s Chief Compliance Officer. The Board recognized that New York Life Investments provides certain other non-advisory services to the Portfolio and has provided an increasingly broad array of non-advisory services to the MainStay Group of Funds as a result of regulatory and other developments, including in connection with the implementation of the MainStay Group of Funds’ derivatives risk management program and policies and procedures adopted pursuant to Rule 18f-4 under the 1940 Act.
The Board also examined the range, and the nature, extent and quality, of the investment advisory services that MacKay provides to the Portfolio and considered the terms of each of the Advisory Agreements. The Board evaluated MacKay’s experience and performance in serving as subadvisor to the Portfolio and advising other portfolios and MacKay’s track record and experience in providing investment advisory services, the experience of investment advisory, senior management and administrative personnel at MacKay. The Board considered New York Life Investments’ and MacKay’s overall resources, legal and compliance environment, capabilities, reputation, financial condition and history. In addition to information provided in connection with quarterly meetings with the Trust’s Chief Compliance Officer, the Board considered information regarding the compliance policies and procedures of New York Life Investments and MacKay and acknowledged their commitment to further developing and strengthening compliance programs relating to the Portfolio. The Board also considered MacKay’s ability to recruit and retain qualified investment professionals and willingness to invest in personnel and other resources to service and support the Portfolio. In this regard, the Board considered the qualifications and experience of the Portfolio’s portfolio managers, the number of accounts managed by the portfolio managers and the method for compensating the portfolio managers.
In addition, the Board considered information provided by New York Life Investments and MacKay regarding the operations of their respective business continuity plans in response to the COVID-19 pandemic and the continued remote work environment.
Based on these considerations, among others, the Board concluded that the Portfolio would likely continue to benefit from the nature, extent and quality of these services.
Investment Performance
In evaluating the Portfolio’s investment performance, the Board considered investment performance results over various periods in light of the Portfolio’s investment objective, strategies and risks. The Board
Board Consideration and Approval of Management Agreement and Subadvisory Agreement (Unaudited) (continued)
considered investment reports on, and analysis of, the Portfolio’s performance provided to the Board throughout the year. These reports include, among other items, information on the Portfolio’s gross and net returns, the Portfolio’s investment performance compared to a relevant investment category and the Portfolio’s benchmarks, the Portfolio’s risk-adjusted investment performance and the Portfolio’s investment performance as compared to peer funds, as appropriate, as well as portfolio attribution information and commentary on the effect of market conditions. The Board also considered information provided by ISS showing the investment performance of the Portfolio as compared to peer funds. In addition, the Board reviewed the methodology used by ISS to construct the group of peer funds for comparative purposes.
The Board also took into account its discussions with senior management at New York Life Investments concerning the Portfolio’s investment performance over various periods as well as discussions between the Portfolio’s portfolio management team and the members of the Board’s Investment Committee, which generally occur on an annual basis. In addition, the Board considered any specific actions that New York Life Investments or MacKay had taken, or had agreed to take, to seek to enhance Portfolio investment performance and the results of those actions.
Based on these considerations, among others, the Board concluded that its review of the Portfolio’s investment performance and related information supported a determination to approve the continuation of each of the Advisory Agreements.
Costs of the Services Provided, and Profits and Other Benefits Realized, by New York Life Investments and MacKay
The Board considered the costs of the services provided under each of the Advisory Agreements. The Board also considered the profits realized by New York Life Investments and its affiliates, including MacKay, due to their relationships with the Portfolio as well as the MainStay Group of Funds. Because MacKay is an affiliate of New York Life Investments whose subadvisory fee is paid by New York Life Investments, not the Portfolio, the Board considered cost and profitability information for New York Life Investments and MacKay in the aggregate.
In addition, the Board acknowledged the difficulty in obtaining reliable comparative data about mutual fund managers’ profitability because such information generally is not publicly available and may be impacted by numerous factors, including the structure of a fund manager’s organization, the types of funds it manages, the methodology used to allocate certain fixed costs to specific funds and the manager’s capital structure and costs of capital.
In evaluating the costs of the services provided by New York Life Investments and MacKay and profits realized by New York Life Investments and its affiliates, including MacKay, the Board considered, among other factors, New York Life Investments’ and its affiliates’, including MacKay’s, continuing investments in, or willingness to invest in, personnel and other resources to support and further enhance the management of the Portfolio, and that New York Life Investments is
responsible for paying the subadvisory fee for the Portfolio. The Board also considered the financial resources of New York Life Investments and MacKay and acknowledged that New York Life Investments and MacKay must be in a position to recruit and retain experienced professional personnel and to maintain a strong financial position for New York Life Investments and MacKay to continue to provide high-quality services to the Portfolio. The Board recognized that the Portfolio benefits from the allocation of certain fixed costs among the funds in the MainStay Group of Funds, among other expected benefits resulting from its relationship with New York Life Investments.
The Board considered information regarding New York Life Investments’ methodology for calculating profitability and allocating costs provided by New York Life Investments in connection with the fund profitability analysis presented to the Board. The Board noted it had previously engaged an independent consultant to review the methods used to allocate costs among the funds in the MainStay Group of Funds. The Board also noted that the independent consultant had concluded that New York Life Investments’ methods for allocating costs and procedures for estimating overall profitability of the relationship with the funds in the MainStay Group of Funds are reasonable and that New York Life Investments continued to use the same method of calculating profit and allocating costs since the independent consultant’s review. The Board recognized the difficulty in calculating and evaluating a manager’s profitability with respect to the Portfolio and considered that other profitability methodologies may also be reasonable.
The Board also considered certain fall-out benefits that may be realized by New York Life Investments and its affiliates due to their relationships with the Portfolio, including reputational and other indirect benefits. The Board recognized, for example, the benefits to MacKay from legally permitted “soft-dollar” arrangements by which brokers provide research and other services to MacKay in exchange for commissions paid by the Portfolio with respect to trades in the Portfolio’s portfolio securities. In addition, the Board considered its review of the management agreement for a money market fund advised by New York Life Investments and an affiliated subadvisor that serves as an investment option for the Portfolio, including the potential rationale for and costs associated with investments in this money market fund by the Portfolio, if any, and considered information from New York Life Investments that the nature and type of specific investment advisory services provided to this money market fund are distinct from, or in addition to, the investment advisory services provided to the Portfolio. In addition, the Board considered the potential dividend received tax deduction for insurance company affiliates of New York Life Investments from the Portfolio’s securities lending activity.
The Board noted that the Portfolio serves as an investment option primarily under variable contracts issued by affiliates of New York Life Investments that would receive fees under those contracts. The Board observed that, in addition to fees earned by New York Life Investments under the Management Agreement for managing the Portfolio, New York Life Investments’ affiliates also earn revenues from serving the Portfolio in various other capacities, including as the Portfolio’s distributor. The Board considered information about these other revenues and their impact on
| 28 | MainStay VP MacKay International Equity Portfolio |
the profitability of the relationship with the Portfolio to New York Life Investments and its affiliates. The Board noted that, although it assessed the overall profitability of the relationship with the Portfolio to New York Life Investments and its affiliates as part of the contract review process, when considering the reasonableness of the fee paid to New York Life Investments under the Management Agreement, the Board considered the profitability of New York Life Investments’ relationship with the Portfolio on a pre-tax basis and without regard to distribution expenses incurred by New York Life Investments from its own resources.
After evaluating the information deemed relevant by the Trustees, the Board concluded that any profits realized by New York Life Investments and its affiliates, including MacKay, due to their relationships with the Portfolio were not excessive and other benefits that may accrue to New York Life Investments and its affiliates, including MacKay, are reasonable.
Management and Subadvisory Fees and Total Ordinary Operating Expenses
The Board evaluated the reasonableness of the fee paid under each of the Advisory Agreements and the Portfolio’s total ordinary operating expenses. The Board primarily considered the reasonableness of the management fee paid by the Portfolio to New York Life Investments because the subadvisory fee paid to MacKay is paid by New York Life Investments, not the Portfolio. The Board also considered the reasonableness of the subadvisory fee paid by New York Life Investments and the amount of the management fee retained by New York Life Investments.
In assessing the reasonableness of the Portfolio’s fees and expenses, the Board primarily considered comparative data provided by ISS on the fees and expenses charged by similar mutual funds managed by other investment advisers. The Board reviewed the methodology used by ISS to construct the group of peer funds for comparative purposes. In addition, the Board considered information provided by New York Life Investments and MacKay on fees charged to other investment advisory clients, including institutional separate accounts and/or other funds that follow investment strategies similar to those of the Portfolio, if any. The Board considered the contractual management fee schedules of the Portfolio as compared to those of such other investment advisory clients, taking into account the rationale for any differences in fee schedules. The Board also took into account information provided by New York Life Investments about the more extensive scope of services provided to registered investment companies, such as the Portfolio, as compared with other investment advisory clients. Additionally, the Board considered the impact of contractual breakpoints on the Portfolio’s net management fee and expenses. The Board also considered that in proposing fees for the Portfolio, New York Life Investments considers the competitive marketplace for mutual funds. The Board considered its discussions with representatives from New York Life Investments regarding the management fee paid by the Portfolio.
Based on the factors outlined above, among other considerations, the Board concluded that the Portfolio’s management fee and total ordinary operating expenses are within a range that is competitive and support a conclusion that these fees and expenses are reasonable.
Economies of Scale
The Board considered information regarding economies of scale, including whether economies of scale may exist for the Portfolio and whether the Portfolio’s expense structure permits any economies of scale to be appropriately shared with the Portfolio’s beneficial shareholders. The Board also considered a report from New York Life Investments, previously prepared at the request of the Board, that addressed economies of scale, including with respect to the mutual fund business generally, and the various ways in which the benefits of economies of scale may be shared with the funds in the MainStay Group of Funds. Although the Board recognized the difficulty of determining economies of scale with precision, the Board acknowledged that economies of scale may be shared with the Portfolio in a number of ways, including, for example, through the imposition of fee breakpoints, initially setting management fee rates at scale or making additional investments to enhance the services provided to the Portfolio. The Board reviewed information from New York Life Investments showing how the Portfolio’s management fee schedule compared to fee schedules of other funds and accounts managed by New York Life Investments. The Board also reviewed information from ISS showing how the Portfolio’s management fee schedule compared with fees paid for similar services by peer funds at varying asset levels.
Based on this information, the Board concluded that economies of scale are appropriately reflected for the benefit of the Portfolio’s beneficial shareholders through the Portfolio’s expense structure and other methods to share benefits from economies of scale.
Conclusion
On the basis of the information and factors summarized above, among other information and factors deemed relevant by the Trustees, and the evaluation thereof, the Board unanimously voted to approve the continuation of each of the Advisory Agreements.
Proxy Voting Policies and Procedures and Proxy Voting Record
The Portfolio is required to file with the SEC its proxy voting record for the 12-month period ending June 30 on Form N-PX. A description of the policies and procedures that are used to vote proxies relating to portfolio securities of the Portfolio is available free of charge upon request by calling 800-598-2019 or visiting the SEC's website at www.sec.gov. The most recent Form N-PX or proxy voting record is available free of charge upon request by calling 800-598-2019; visiting https://www.newyorklifeinvestments.com/investment-products/vp; or visiting the SEC’s website at www.sec.gov.
Shareholder Reports and Quarterly Portfolio Disclosure
The Portfolio is required to file its complete schedule of portfolio holdings with the SEC 60 days after its first and third fiscal quarter on Form N-PORT. The Portfolio's holdings report is available free of charge upon request by calling 800-598-2019 or by visiting the SEC’s website at www.sec.gov.
| 30 | MainStay VP MacKay International Equity Portfolio |
Board of Trustees and Officers (Unaudited)
The Trustees and officers of the Portfolio are listed below. The Board oversees the MainStay Group of Funds (which consists of MainStay Funds and MainStay Funds Trust), MainStay VP Funds Trust, MainStay MacKay DefinedTerm Municipal Opportunities Fund, MainStay CBRE Global Infrastructure Megatrends Fund, the Manager and the Subadvisors, and elects the officers of the Portfolios who are responsible for the day-to-day operations of the Portfolio. Information pertaining to the Trustees and officers is set forth below. Each Trustee serves until his or her successor
is elected and qualified or until his or her resignation, death or removal. Under the Board’s retirement policy, unless an exception is made, a Trustee must tender his or her resignation by the end of the calendar year during which he or she reaches the age of 75. The business address of each Trustee and officer listed below is 51 Madison Avenue, New York, New York 10010. None of the Trustees are “interested persons” (as defined by the 1940 Act and rules adopted by the SEC thereunder) of the Portfolio (“Independent Trustees”).
| | Name and
Year of Birth | Term of Office,
Position(s) Held and
Length of Service | Principal Occupation(s)
During Past Five Years | Number of
Portfolios in
Fund Complex
Overseen by
Trustee | Other Directorships
Held by Trustee |
| | | | | | |
| | David H. Chow
1957 | MainStay VP Funds Trust: Trustee since January 2016, Advisory Board Member (June 2015 to December 2015) | Founder and CEO, DanCourt Management, LLC since 1999 | 78 | MainStay Funds: Trustee since January 2016, Advisory Board Member (June 2015 to December 2015) (12 Funds);
MainStay Funds Trust: Trustee since January 2016, Advisory Board Member (June 2015 to December 2015) (33 Funds);
MainStay MacKay DefinedTerm Municipal Opportunities Fund: Trustee since January 2016, Advisory Board Member (June 2015 to December 2015);
MainStay CBRE Global Infrastructure Megatrends Fund: Trustee since June 2021;VanEck Vectors Group of Exchange-Traded Funds: Independent Chairman of the Board of Trustees since 2008 and Trustee since 2006 (57 portfolios); and Berea College of Kentucky: Trustee since 2009, Chair of the Committee since 2018 |
| | Susan B. Kerley
1951 | MainStay VP Funds Trust: Chairman since 2017 and Trustee since 2007* | President, Strategic Management Advisors LLC since 1990 | 78 | MainStay Funds: Chairman since 2017 and Trustee since 2007 (12 Funds); MainStay Funds Trust: Chairman since 2017 and Trustee since 1990 (33 Funds)**;
MainStay MacKay DefinedTerm Municipal Opportunities Fund: Chairman since 2017 and Trustee since 2011; MainStay CBRE Global Infrastructure Megatrends Fund: Trustee since June 2021; and Legg Mason Partners Funds: Trustee since 1991 (45 portfolios) |
| | Alan R. Latshaw
1951 | MainStay VP Funds Trust: Trustee since 2007* | Retired; Partner, Ernst & Young LLP (2002 to 2003); Partner, Arthur Andersen LLP (1989 to 2002); Consultant to the MainStay Funds Audit and Compliance Committee (2004 to 2006) | 78 | MainStay Funds: Trustee since 2006 (12 Funds);
MainStay Funds Trust: Trustee since 2007 (33 Funds)**;
MainStay MacKay DefinedTerm Municipal Opportunities Fund: Trustee since 2011; and
MainStay CBRE Global Infrastructure Megatrends Fund: Trustee since June 2021 |
Board of Trustees and Officers (Unaudited) (continued)
| | Name and
Year of Birth | Term of Office,
Position(s) Held and
Length of Service | Principal Occupation(s)
During Past Five Years | Number of
Portfolios in
Fund Complex
Overseen by
Trustee | Other Directorships
Held by Trustee |
| | | | | | |
| | Karen Hammond
1956 | MainStay VP Funds Trust: Trustee since December 2021, Advisory Board Member (June 2021 to December 2021)
| Retired, Managing Director, Devonshire Investors (2007 to 2013); Senior Vice President, Fidelity Management & Research Co. (2005 to 2007); Senior Vice President and Corporate Treasurer, FMR Corp. (2003 to 2005); Chief Operating Officer, Fidelity Investments Japan (2001 to 2003) | 78 | MainStay Funds: Trustee since December 2021, Advisory Board Member (June 2021 to December 2021) (12 Funds);
MainStay Funds Trust: Trustee since December 2021, Advisory Board Member (June 2021 to December 2021) (33 Funds);
MainStay MacKay DefinedTerm Municipal Opportunities Fund: Trustee since December 2021, Advisory Board Member (June 2021 to December 2021);
MainStay CBRE Global Infrastructure Megatrends Fund: Trustee since December 2021, Advisory Board Member (June 2021 to December 2021);
Two Harbors Investment Corp.: Director since 2018; Rhode Island State Investment Commission: Member since 2017; and Blue Cross Blue Shield of Rhode Island: Director since 2019
|
| | Jacques P. Perold
1958 | MainStay VP Funds Trust: Trustee since January 2016, Advisory Board Member (June 2015 to December 2015) | Founder and Chief Executive Officer, CapShift Advisors LLC (since 2018); President, Fidelity Management & Research Company (2009 to 2014); President and Chief Investment Officer, Geode Capital Management, LLC (2001 to 2009) | 78 | MainStay Funds: Trustee since January 2016, Advisory Board Member (June 2015 to December 2015) (12 Funds);
MainStay Funds Trust: Trustee since January 2016, Advisory Board Member (June 2015 to December 2015) (33 Funds); MainStay MacKay DefinedTerm Municipal Opportunities Fund: Trustee since January 2016, Advisory Board Member (June 2015 to December 2015);
MainStay CBRE Global Infrastructure Megatrends Fund: Trustee since June 2021; Allstate Corporation: Director since 2015;
Partners in Health: Trustee since 2019; and
MSCI Inc.: Director since 2017 |
| | Richard S. Trutanic
1952 | MainStay VP Funds Trust: Trustee since 2007* | Chairman and Chief Executive Officer, Somerset & Company (financial advisory firm) since 2004; Managing Director, The Carlyle Group (private investment firm) (2002 to 2004); Senior Managing Director, Partner and Board Member, Groupe Arnault S.A. (private investment firm) (1999 to 2002)
| 78 | MainStay Funds: Trustee since 1994 (12 Funds);
MainStay Funds Trust: Trustee since 2007 (33 Funds)**;
MainStay MacKay DefinedTerm Municipal Opportunities Fund: Trustee since 2011; and
MainStay CBRE Global Infrastructure Megatrends Fund: Trustee since June 2021 |
| * | Includes prior service as a Director of MainStay VP Series Fund, Inc., the predecessor to MainStay VP Funds Trust. |
| ** | Includes prior service as a Director/Trustee of certain predecessor entities to MainStay Funds Trust. |
| 32 | MainStay VP MacKay International Equity Portfolio |
| | Name and
Year of Birth | Position(s) Held and
Length of Service | Principal Occupation(s)
During Past Five Years | |
| | | | | |
| | Kirk C. Lehneis
1974 | President, MainStay VP Funds Trust (since 2017) | Chief Operating Officer and Senior Managing Director (since 2016), New York Life Investment Management LLC and New York Life Investment Management Holdings LLC; Member of the Board of Managers (since 2017) and Senior Managing Director (since 2018), NYLIFE Distributors LLC; Chairman of the Board and Senior Managing Director, NYLIM Service Company LLC (since 2017); Trustee, President and Principal Executive Officer of IndexIQ Trust, IndexIQ ETF Trust and IndexIQ Active ETF Trust (since January 2018); President, MainStay CBRE Global Infrastructure Megatrends Fund (since 2021), MainStay MacKay DefinedTerm Municipal Opportunities Fund, MainStay Funds and MainStay Funds Trust (since 2017); Senior Managing Director, Global Product Development (from 2015-2016); Managing Director, Product Development (from 2010-2015), New York Life Investment Management LLC | |
| | Jack R. Benintende
1964 | Treasurer and Principal Financial and Accounting Officer, MainStay VP Funds Trust (since 2007)** | Managing Director, New York Life Investment Management LLC (since 2007); Treasurer and Principal Financial and Accounting Officer, MainStay CBRE Global Infrastructure Megatrends Fund (since 2021), MainStay MacKay DefinedTerm Municipal Opportunities Fund (since 2011), MainStay Funds Trust (since 2009) and MainStay Funds (since 2007); and Assistant Treasurer, New York Life Investment Management Holdings LLC (2008 to 2012) | |
| | J. Kevin Gao
1967 | Secretary and Chief Legal Officer, MainStay VP Funds Trust (since 2010)** | Managing Director and Associate General Counsel, New York Life Investment Management LLC (since 2010); Secretary and Chief Legal Officer, MainStay CBRE Global Infrastructure Megatrends Fund (since 2021), MainStay MacKay DefinedTerm Municipal Opportunities Fund (since 2011), MainStay Funds and MainStay Funds Trust (since 2010) | |
| | Scott T. Harrington
1959 | Vice President— Administration, MainStay VP Funds Trust (since 2005)** | Managing Director, New York Life Investment Management LLC (including predecessor advisory organizations) (since 2000); Member of the Board of Directors, New York Life Trust Company (since 2009); Vice President—Administration, MainStay CBRE Global Infrastructure Megatrends Fund (since 2021), MainStay MacKay DefinedTerm Municipal Opportunities Fund (since 2011), MainStay Funds Trust and MainStay Funds (since 2009) | |
| | Kevin M. Gleason
1967 | Vice President and Chief Compliance Officer, MainStay VP Funds Trust (since June 2022) | Vice President and Chief Compliance Officer, IndexIQ, IndexIQ ETF Trust and Index IQ Active ETF Trust (since June 2022); Vice President and Chief Compliance Officer, MainStay CBRE Global Infrastructure Megatrends Fund, MainStay MacKay DefinedTerm Municipal Opportunities Fund (since June 2022); MainStay Funds Trust and MainStay Funds (since June 2022); Senior Vice President, Voya Investment Management and Chief Compliance Officer, Voya Family of Funds (2012-2022) | |
| * | The officers listed above are considered to be “interested persons” of the MainStay Group of Funds, MainStay VP Funds Trust, MainStay CBRE Global Infrastructure Megatrends Fund and MainStay MacKay DefinedTerm Municipal Opportunities Fund within the meaning of the 1940 Act because of their affiliation with the MainStay Group of Funds, New York Life Insurance Company and/or its affiliates, including New York Life Investment Management LLC, NYLIM Service Company LLC, NYLIFE Securities LLC and/or NYLIFE Distributors LLC, as described in detail in the column captioned “Principal Occupation(s) During Past Five Years.” Officers are elected annually by the Board. |
| ** | Includes prior service as an Officer of MainStay VP Series Fund, Inc., the predecessor to MainStay VP Funds Trust. |
Officers of the Trust (Who are not Trustees)*
This page intentionally left blank.
MainStay VP Portfolios
MainStay VP offers a wide range of Portfolios. The full array of MainStay VP offerings is listed here, with information about the manager, subadvisors, legal counsel, and independent registered public accounting firm.
Equity
MainStay VP American Century Sustainable Equity Portfolio1
MainStay VP Candriam Emerging Markets Equity Portfolio
MainStay VP Epoch U.S. Equity Yield Portfolio
MainStay VP Fidelity Institutional AM® Utilities Portfolio†
MainStay VP MacKay International Equity Portfolio
MainStay VP Natural Resources Portfolio
MainStay VP S&P 500 Index Portfolio2
MainStay VP Small Cap Growth Portfolio
MainStay VP Wellington Growth Portfolio
MainStay VP Wellington Mid Cap Portfolio
MainStay VP Wellington Small Cap Portfolio
MainStay VP Wellington U.S. Equity Portfolio
MainStay VP Winslow Large Cap Growth Portfolio
Mixed Asset
MainStay VP Balanced Portfolio
MainStay VP Income Builder Portfolio
MainStay VP Janus Henderson Balanced Portfolio
MainStay VP MacKay Convertible Portfolio
Income
MainStay VP Bond Portfolio
MainStay VP Floating Rate Portfolio
MainStay VP Indexed Bond Portfolio
MainStay VP MacKay Government Portfolio
MainStay VP MacKay High Yield Corporate Bond Portfolio
MainStay VP MacKay Strategic Bond Portfolio
MainStay VP PIMCO Real Return Portfolio
Money Market
MainStay VP U.S. Government Money Market Portfolio
Alternative
MainStay VP CBRE Global Infrastructure Portfolio
MainStay VP IQ Hedge Multi-Strategy Portfolio
Asset Allocation
MainStay VP Conservative Allocation Portfolio
MainStay VP Equity Allocation Portfolio
MainStay VP Growth Allocation Portfolio
MainStay VP Moderate Allocation Portfolio
Manager
New York Life Investment Management LLC
New York, New York
Subadvisors
American Century Investment Management, Inc.
Kansas City, Missouri
Brown Advisory LLC
Baltimore, Maryland
Candriam*
Strassen, Luxembourg
CBRE Investment Management Listed Real Assets LLC
Radnor, Pennsylvania
Epoch Investment Partners, Inc.
New York, New York
FIAM LLC
Smithfield, Rhode Island
IndexIQ Advisors LLC*
New York, New York
Janus Henderson Investors US LLC
Denver, Colorado
MacKay Shields LLC*
New York, New York
Newton Investment Management North America, LLC
Boston, Massachusetts
NYL Investors LLC*
New York, New York
Pacific Investment Management Company LLC
Newport Beach, California
Segall Bryant & Hamill, LLC
Chicago, Illinois
Wellington Management Company LLP
Boston, Massachusetts
Winslow Capital Management, LLC
Minneapolis, Minnesota
Legal Counsel
Dechert LLP
Washington, District of Columbia
Independent Registered Public Accounting Firm
PricewaterhouseCoopers LLP
New York, New York
Distributor
NYLIFE Distributors LLC*
Jersey City, New Jersey
Custodian
JPMorgan Chase Bank, N.A.
New York, New York
Some Portfolios may not be available in all products.
† Fidelity Institutional AM is a registered trade mark of FMR LLC. Used with permission.
* An affiliate of New York Life Investment Management LLC.
| 1. | Prior to May 1, 2022, the Portfolio's name was MainStay VP T. Rowe Price Equity Income Portfolio. |
| 2. | Prior to May 1, 2022, the Portfolio's name was MainStay VP MacKay S&P 500 Index Portfolio. |
Not part of the Annual Report
2022 Annual Report
This report is for the general information of New York Life Variable Annuities and NYLIAC Variable Universal Life Insurance Products policyowners. It must be preceded or accompanied by the appropriate product(s) and funds prospectuses if it is given to anyone who is not an owner of a New York Life variable annuity policy or a NYLIAC Variable Universal Life Insurance Product. This report does not offer for sale or solicit orders to purchase securities.
The performance data quoted in this report represents past performance. Past performance is no guarantee of future results. Due to market volatility and other factors, current performance may be lower or higher than the figures shown. The most recent month-end performance summary for your variable annuity or variable life policy is available by calling 800-598-2019 and is updated periodically on newyorklife.com.
The New York Life Variable Annuities and NYLIAC Variable Universal Life Insurance Products are issued by New York Life Insurance and Annuity Corporation (a Delaware Corporation) and distributed by NYLIFE Distributors LLC (Member FINRA/SIPC).
New York Life Insurance Company
New York Life Insurance and Annuity
Corporation (NYLIAC) (A Delaware Corporation)
51 Madison Avenue, Room 551
New York, NY 10010
newyorklife.com
newyorklifeinvestments.com
NYLIFE Distributors LLC, 30 Hudson Street, Jersey City, NJ 07302
New York Life Investment Management LLC is the investment manager to the MainStay VP Funds Trust
©2023 by NYLIFE Distributors LLC. All rights reserved.
You may obtain copies of the Prospectus and the Statement of Additional Information free of charge, upon request, by calling toll-free 800-598-2019 or writing to New York Life Insurance and Annuity Corporation, 51 Madison Avenue, New York, NY 10010.
| Not FDIC Insured | No Bank Guarantee | May Lose Value |
(NYLIAC) NI523
MainStay VP Winslow Large Cap Growth Portfolio
Message from the President and Annual Report
December 31, 2022
Sign up for e-delivery of your shareholder reports. For full details on e-delivery, including who can participate and what you can receive via e-delivery,
please log in to newyorklifeinvestments.com/accounts.
| Not FDIC/NCUA Insured | Not a Deposit | May Lose Value | No Bank Guarantee | Not Insured by Any Government Agency |
This page intentionally left blank
Message from the President
The 12-month reporting period ended December 31, 2022, proved exceptionally challenging for investors as both stock and bond markets suffered steep declines. A variety of economic and geopolitical forces drove the market’s losses, all centered around rising inflation and monetary efforts to rein it in.
Inflationary alarms began to sound well before the reporting period began. In late 2021, after nearly two years of accommodative policies designed to encourage economic growth in the face of the COVID-19 pandemic, the U.S. Federal Reserve (the “Fed”) warned of the increasing need to tighten monetary policy. Nevertheless, the pace and persistence of inflation in early 2022 caught most market participants—the Fed included—off guard. Russia’s invasion of Ukraine in February exacerbated global inflationary pressures while increasing investor uncertainty. Domestic supply shortages, international trade imbalances and rising inflation caused U.S. GDP (gross domestic product) to contract in the first and second quarters of the year, although employment and consumer spending proved resilient. Prices for petroleum surged to multi-year highs, while many key agricultural chemicals and industrial metals soared as well. Accelerating inflationary forces prompted the Fed to implement its most aggressive series of interest rate hikes since the 1980s, with a 0.25% increase in March followed by six further rate increases totaling 4.25%. International central banks generally followed suit and raised rates by varying degrees in efforts to curb local inflation, although most increases remained significantly more modest than those in the United States. Relatively high U.S. interest rates and an international risk averse sentiment pushed U.S. dollar values higher compared to most other currencies, with negative impacts on global prices for food, fuel and other key U.S.-dollar-denominated products.
The effects of these interrelated challenges were felt throughout U.S. and international financial markets. The S&P 500® Index, a widely regarded benchmark of market performance, declined by more than 18% during the reporting period. Although the energy sector generated strong gains, bolstered by elevated oil and gas prices, most other industry segments recorded losses. The more cyclical and growth-oriented sectors of consumer discretionary, information technology and real estate delivered the weakest returns, while the traditionally defensive and value-oriented
consumer staples, utilities and health care sectors outperformed. On average, international developed-country equity markets mildly outperformed their U.S. counterparts, while emerging markets lagged slightly. Fixed-income markets proved unusually volatile, with bond prices trending sharply lower as yields rose along with interest rates. Short-term yields rose faster than long-term yields, producing a yield curve inversion from July through the end of the reporting period as long-term rates remained below short-term rates. While floating-rate instruments, which feature variable interest rates that allow investors to benefit from a rising rate environment, provided a degree of insulation from inflation-driven trends, they were not immune to the market’s widespread declines.
Although, according to the most recent estimates, the annualized inflation rate in the United States has declined from a peak of 9.1% in July 2022 to 6.5% in December, the Fed remains focused on achieving more substantial and lasting reductions, aiming for a target rate of 2%. As a result, further rate hikes and additional market volatility are potential headwinds in the coming months. The question remains as to whether the Fed and other central banks will manage a so-called “soft landing,” curbing inflation while avoiding a persistent economic slowdown. If they prove successful, we believe that the increasingly attractive valuations we have observed in both equity and bond markets should eventually translate into sustainable improvements in the investment environment.
Whatever actions the Fed takes and however financial markets react, as a MainStay VP investor you can depend on us to continue managing our portfolios with the insight, expertise and level of service that have long defined New York Life Investments. Thank you for trusting us to help you meet your investment needs.
Sincerely,
Kirk C. Lehneis
President
The opinions expressed are as of the date of this report and are subject to change. There is no guarantee that any forecast made will come to pass. This material does not constitute investment advice and is not intended as an endorsement of any specific investment. Past performance is no guarantee of future results.
Not part of the Annual Report
Investors should refer to the Portfolio’s Summary Prospectus and/or Prospectus and consider the Portfolio’s investment objectives, strategies, risks, charges and expenses carefully before investing. The Summary Prospectus and/or Prospectus contain this and other information about the Portfolio. You may obtain copies of the Portfolio’s Summary Prospectus, Prospectus and Statement of Additional Information, which includes information about the MainStay VP Funds Trust's Trustees, free of charge, upon request, by calling toll-free 800-598-2019, by writing to New York Life Insurance and Annuity Corporation, 51 Madison Avenue, Room 251, New York, New York 10010 or by sending an email to MainStayShareholdersServices@nylim.com. These documents are also available at newyorklifeinvestments.com/investment-products/vp. Please read the Portfolio's Summary Prospectus and/or Prospectus carefully before investing. MainStay VP Funds Trust portfolios are separate account options which are purchased through a variable insurance or variable annuity contract.
Investment and Performance Comparison (Unaudited)
Performance data quoted represents past performance. Past performance is no guarantee of future results. Because of market volatility and other factors, current performance may be lower or higher than the figures shown. Investment return and principal value will fluctuate, and as a result, when shares are redeemed, they may be worth more or less than their original cost. The performance table and graph do not reflect any deduction of sales charges, mortality and expense charges, contract charges or administrative charges. Please refer to the Performance Summary appropriate for your policy. For performance information current to the most recent month-end, please call 800-598-2019 or visit www.newyorklife.com.
Performance figures may reflect certain fee waivers and/or expense limitations, without which total returns may have been different. For information on current fee waivers and/or expense limitations (if any), please refer to the Notes to Financial Statements.
| Average Annual Total Returns for the Year-Ended December 31, 2022 |
| Class | Inception
Date | One
Year | Five
Years | Ten
Years | Gross
Expense
Ratio1 |
| Initial Class Shares | 5/1/1998 | -31.16% | 10.23% | 12.93% | 0.74% |
| Service Class Shares | 6/6/2003 | -31.34 | 9.95 | 12.65 | 0.99 |
| 1. | The gross expense ratios presented reflect the Portfolio’s “Total Annual Portfolio Operating Expenses” from the most recent Prospectus and may differ from other expense ratios disclosed in this report. |
| Benchmark Performance* | One
Year | Five
Years | Ten
Years |
| Russell 1000® Growth Index1 | -29.14% | 10.96% | 14.10% |
| S&P 500® Index2 | -18.11 | 9.42 | 12.56 |
| Morningstar Large Growth Category Average3 | -30.20 | 7.88 | 11.39 |
| * | Returns for indices reflect no deductions for fees, expenses or taxes, except for foreign withholding taxes where applicable. Results assume reinvestment of all dividends and capital gains. An investment cannot be made directly in an index. |
| 1. | The Russell 1000® Growth Index is the Portfolio's primary benchmark. The Russell 1000® Growth Index is a broad-based benchmark that measures the performance of the large-cap growth segment of the U.S. equity universe. It includes those Russell 1000® Index companies with higher price-to-book ratios and higher forecasted growth values. |
| 2. | The S&P 500® Index is the Portfolio's secondary benchmark. “S&P 500®" is a trademark of The McGraw-Hill Companies, Inc. The S&P 500® Index is widely regarded as the standard index for measuring large-cap U.S. stock market performance. |
| 3. | The Morningstar Large Growth Category Average is representative of funds that invest primarily in big U.S. companies that are projected to grow faster than other large-cap stocks. Stocks in the top 70% of the capitalization of the U.S. equity market are defined as large cap. Growth is defined based on fast growth and high valuations. Most of these funds focus on companies in rapidly expanding industries. Results are based on average total returns of similar funds with all dividends and capital gain distributions reinvested. |
Cost in Dollars of a $1,000 Investment in MainStay VP Winslow Large Cap Growth Portfolio (Unaudited)
The example below is intended to describe the fees and expenses borne by shareholders during the six-month period from July 1, 2022 to December 31, 2022, and the impact of those costs on your investment.
Example
As a shareholder of the Portfolio you incur two types of costs: (1) transaction costs, including exchange fees and sales charges (loads) on purchases (as applicable), and (2) ongoing costs, including management fees, distribution and/or service (12b-1) fees and other Portfolio expenses (as applicable). This example is intended to help you understand your ongoing costs (in dollars) of investing in the Portfolio and to compare these costs with the ongoing costs of investing in other mutual funds. The example is based on an investment of $1,000 made at the beginning of the six-month period and held for the entire period from July 1, 2022 to December 31, 2022. Shares are only sold in connection with variable life and annuity contracts and the example does not reflect any contract level or transactional fees or expenses. If these costs had been included, your costs would have been higher.
This example illustrates your Portfolio’s ongoing costs in two ways:
Actual Expenses
The second and third data columns in the table below provide information about actual account values and actual expenses. You may use the information in these columns, together with the amount you invested, to estimate the expenses that you paid during the six months ended
December 31, 2022. Simply divide your account value by $1,000 (for example, an $8,600 account value divided by $1,000 = 8.6), then multiply the result by the number under the heading entitled “Expenses Paid During Period” to estimate the expenses you paid on your account during this period.
Hypothetical Example for Comparison Purposes
The fourth and fifth data columns in the table below provide information about hypothetical account values and hypothetical expenses based on the Portfolio’s actual expense ratio and an assumed rate of return of 5% per year before expenses, which is not the Portfolio’s actual return. The hypothetical account values and expenses may not be used to estimate the actual ending account balances or expenses you paid for the six-month period shown. You may use this information to compare the ongoing costs of investing in the Portfolio with the ongoing costs of investing in other mutual funds. To do so, compare this 5% hypothetical example with the 5% hypothetical examples that appear in the shareholder reports of the other mutual funds.
Please note that the expenses shown in the table are meant to highlight your ongoing costs only and do not reflect any transactional costs, such as exchange fees or sales charges (loads). Therefore, the fourth and fifth data columns of the table are useful in comparing ongoing costs only and will not help you determine the relative total costs of owning different funds. In addition, if these transactional costs were included, your costs would have been higher.
| Share Class | Beginning
Account
Value
7/1/22 | Ending Account
Value (Based
on Actual
Returns and
Expenses)
12/31/22 | Expenses
Paid
During
Period1 | Ending Account
Value (Based
on Hypothetical
5% Annualized
Return and
Actual Expenses)
12/31/22 | Expenses
Paid
During
Period1 | Net Expense
Ratio
During
Period2 |
| Initial Class Shares | $1,000.00 | $1,014.70 | $3.81 | $1,021.42 | $3.82 | 0.75% |
| Service Class Shares | $1,000.00 | $1,013.40 | $5.07 | $1,020.16 | $5.09 | 1.00% |
| 1. | Expenses are equal to the Portfolio’s annualized expense ratio of each class multiplied by the average account value over the period, divided by 365 and multiplied by 184 (to reflect the six-month period). The table above represents the actual expenses incurred during the six-month period. In addition to the fees and expenses which the Portfolio bears directly, it also indirectly bears a pro rata share of the fees and expenses of the underlying funds in which it invests. Such indirect expenses are not included in the above-reported expense figures. |
| 2. | Expenses are equal to the Portfolio's annualized expense ratio to reflect the six-month period. |
| 6 | MainStay VP Winslow Large Cap Growth Portfolio |
Industry Composition as of December 31, 2022 (Unaudited)
| Software | 14.1% |
| IT Services | 12.9 |
| Semiconductors & Semiconductor Equipment | 9.1 |
| Life Sciences Tools & Services | 7.1 |
| Hotels, Restaurants & Leisure | 7.0 |
| Technology Hardware, Storage & Peripherals | 5.5 |
| Road & Rail | 4.8 |
| Health Care Equipment & Supplies | 4.7 |
| Health Care Providers & Services | 3.8 |
| Chemicals | 3.5 |
| Pharmaceuticals | 3.4 |
| Interactive Media & Services | 3.3 |
| Capital Markets | 2.8 |
| Machinery | 2.7% |
| Food & Staples Retailing | 2.6 |
| Textiles, Apparel & Luxury Goods | 2.4 |
| Energy Equipment & Services | 2.4 |
| Multiline Retail | 2.2 |
| Health Care Technology | 2.1 |
| Personal Products | 1.3 |
| Internet & Direct Marketing Retail | 0.9 |
| Professional Services | 0.8 |
| Short–Term Investment | 0.7 |
| Other Assets, Less Liabilities | –0.1 |
| | 100.0% |
See Portfolio of Investments beginning on page 10 for specific holdings within these categories. The Portfolio's holdings are subject to change.
Top Ten Holdings and/or Issuers Held as of December 31, 2022 (excluding short-term investments) (Unaudited)
| 1. | Microsoft Corp. |
| 2. | Apple, Inc. |
| 3. | Visa, Inc., Class A |
| 4. | Mastercard, Inc., Class A |
| 5. | UnitedHealth Group, Inc. |
| 6. | Alphabet, Inc. |
| 7. | Union Pacific Corp. |
| 8. | Chipotle Mexican Grill, Inc. |
| 9. | Analog Devices, Inc. |
| 10. | ServiceNow, Inc. |
Portfolio Management Discussion and Analysis (Unaudited)
Answers to the questions reflect the views of portfolio managers Justin H. Kelly, CFA, Patrick M. Burton, CFA, and Peter A. Dlugosch of Winslow Capital Management, LLC, the Portfolio’s Subadvisor.
How did MainStay VP Winslow Large Cap Growth Portfolio perform relative to its benchmarks and peers during the 12 months ended December 31, 2022?
For the 12 months ended December 31, 2022, MainStay VP Winslow Large Cap Growth Portfolio returned −31.16% for Initial Class shares and −31.34% for Service Class shares. Over the same period, both share classes underperformed the −29.14% return of the Russell 1000® Growth Index, which is the Portfolio’s primary benchmark, and the −18.11% return of the S&P 500® Index, which is a secondary benchmark of the Portfolio. For the 12 months ended December 31, 2022, both share classes also underperformed the −30.20% return of the Morningstar Large Growth Category Average.1
During the reporting period, were there any market events that materially impacted the Portfolio’s performance or liquidity?
The calendar year will be remembered as one of the worst for equity and fixed income investors in recent history. The massive shift toward tighter monetary policy (from a zero Fed Funds rate in March 2022) led to massive declines in financial asset values. We believe the abrupt change ushered in a new equity regime era; zero and near-zero interest rates are unlikely in the next decade, and the 2017-2021 growth at any price stocks, will also prove aberrant.
What factors affected the Portfolio’s relative performance during the reporting period?
During the reporting period, the Portfolio’s performance relative to the Russell 1000® Growth Index was undermined primarily by individual security selection. Security selection in the information technology and health care sectors detracted most significantly from the Portfolio’s relative returns, although offset to a degree by relatively strong selection in the consumer discretionary and materials sectors. Sector allocation made a positive contribution to relative performance, predominantly driven by the Portfolio’s overweight exposure to the health care sector and its underweight exposure to the lagging communication services sector. (Contributions take weightings and total returns into account.)
Which sectors were the strongest positive contributors to the Portfolio’s relative performance, and which sectors were particularly weak?
The sectors making the strongest positive contributions to the Portfolio’s performance relative to the Russell 1000® Growth Index included consumer discretionary, materials and communications services. In consumer discretionary and materials, strong security selection largely drove outperformance. The outperformance of the Portfolio in the communication
services sector was largely the result of relatively underweight exposure to this weak-performing sector.
Information technology, consumer staples and health care provided the weakest contributions to the Portfolio’s relative performance. Security selection primarily drove relative underperformance in information technology and health care, while the relative underperformance in consumer staples resulted from both underweight sector exposure and security selection.
During the reporting period, which individual stocks made the strongest positive contributions to the Portfolio’s absolute performance and which stocks detracted the most?
The leading positive contributors to the Portfolio’s absolute performance during the reporting period included positions in oilfield services provider Schlumberger, medical device company Abiomed and global specialty coffee company Starbucks. Schlumberger benefited from strong results in the energy sector due to high oil and gas prices. The company works across the exploration & production value chain of its customers to streamline workflows, provide geophysical services, maximize drilling efficiency and enhance production and extraction from reservoirs. Its customers include the largest independent oil and national oil companies. Abiomed, the innovative developer of the first and only catheter-based heart pump, saw growth driven by its newest Impella heart pumps, which are easier to use and appropriate for a much wider range of underlying heart conditions. During the reporting period, it was announced that the company will be acquired by Johnson & Johnson at a sizeable premium to its pre-acquisition stock price. Starbucks shares rose as the company significantly increased its long-term earnings growth guidance. The Portfolio initiated a position in Starbucks earlier in the reporting period following the return of the company’s former long-time leader Howard Schultz as chief executive officer and member of the Board of Directors.
Notable detractors from the Portfolio’s absolute performance during the same period included online retailer Amazon.com, software and cloud services provider Microsoft, and electric vehicle maker Tesla. Over the past 2 years, Amazon has dramatically increased its capital expenditures and staffing to meet and exceed very strong e-commerce sales during the pandemic. However, Amazon overestimated its post-pandemic sales growth trajectory, leading the company to cancel leases on warehouses and shrink their staff via layoffs. The Portfolio materially reduced its holdings in Amazon during the reporting period. Microsoft, the Portfolio’s largest holding, remained the largest software company in the world while also making progress in transitioning its business to be one of the largest public cloud companies through its fast-growing Azure business. Shares lost ground as investor sentiment shifted away from richly valued,
| 1. | See page 5 for more information on benchmark and peer group returns. |
| 8 | MainStay VP Winslow Large Cap Growth Portfolio |
growth-oriented technology companies. The Portfolio materially reduced its holdings in Microsoft during the reporting period. Tesla shares declined due to production issues in the company's Shanghai facility and the market's re-rating of higher multiple stocks. The Portfolio sold its holdings in Tesla during the reporting period due to concerns over slowing demand in China and our belief that the Twitter saga would continue to be a headwind on the shares of Tesla, potentially hurting the brand.
Did the Portfolio make any significant purchases or sales during the reporting period?
The Portfolio’s largest purchases included shares in U.S.-based multinational consumer electronics and technology company Apple and Schlumberger, described above. Very early in the reporting period, we sold the Portfolio’s Apple position in anticipation that pandemic-related demand pull-forward for iPhones, Macs, iPads and Services would result in declining hardware revenues and slowing services revenue growth as 2022 progressed. We reintroduced Apple into the Portfolio later in the reporting period following a negative earnings revision cycle. We view Apple as a high-quality company with a high return on invested capital, strong operational execution and a significant moat in the smartphone business, which represents more than 50% of the company’s total revenue.
Significant sales included reductions in the Portfolio’s positions in Amazon.com and Microsoft, both described above.
How did the Portfolio’s sector weightings change during the reporting period?
During the reporting period, the Portfolio’s sector weightings relative to the Russell 1000® Growth Index underwent shifts due to both structural changes within the Portfolio as well as the reconstitution of the Index. In absolute terms, the Portfolio’s exposure to the communication services sector decreased, shifting from an overweight position to an underweight position. The Portfolio’s absolute exposure to the consumer discretionary sector declined meaningfully as well, also shifting from an overweight position to an underweight position, partially due to changes in the Russell 1000® Growth Index weight during the reporting period.
During the same period, the Portfolio’s largest increases in absolute exposure came from the health care and industrials sectors. The increased absolute position in health care resulted in the Portfolio’s largest increase in sector exposure relative to the Russell 1000® Growth Index, shifting from a slightly overweight position to a more significantly overweight position.
How was the Portfolio positioned at the end of the reporting period?
During the first half of the reporting period, we took steps to better position the Portfolio for an environment of slowing global growth resulting from a pronounced shift toward significantly tighter monetary policy. Specifically, we leveraged our ‘No Preferred Habitat’ investment process and opportunistically moved toward companies exhibiting resilient growth. As of December 31, 2022, we view the Portfolio’s positioning as optimal for the prevailing economic and market environment.
As of the same date, health care represented the Portfolio’s largest overweight position relative to the Russell 1000® Growth Index, based on our expectation that revenue and earnings power in the sector should prove relatively durable in a weak macroeconomic environment, and that innovation should continue to catalyze strong secular growth. The Portfolio’s next-largest overweight sector positions included industrials and materials, where we believe several railroad and select heavy equipment companies are likely to exhibit more resilient earnings growth than their more cyclical peers, while also benefiting from strong secular trends. Conversely, the Portfolio held relatively underweight exposure to the communication services sector, which we view as increasingly sensitive to potentially lower advertising spending in the coming months. Consumer staples represented the Portfolio’s next-largest underweight exposure, reflecting our view that the sector’s perceived defensive characteristics are largely overvalued. The information technology sector, previously a more significantly underweight exposure for the Portfolio, shifted to a slightly underweight position with the purchase of shares in companies with compelling business models after the stocks had contracted. The Portfolio’s remaining sector weights remained close to benchmark weight. In all cases, the Portfolio’s sector weights were driven by microeconomic analysis rather than sector decisions.
The opinions expressed are those of the portfolio managers as of the date of this report and are subject to change. There is no guarantee that any forecasts will come to pass. This material does not constitute investment advice and is not intended as an endorsement of any specific investment.
Not all MainStay VP Portfolios and/or share classes are available under all policies.
Portfolio of Investments December 31, 2022†
| | Shares | Value |
| Common Stocks 99.4% |
| Capital Markets 2.8% |
| Moody's Corp. | 65,640 | $ 18,288,617 |
| MSCI, Inc. | 35,800 | 16,653,086 |
| | | 34,941,703 |
| Chemicals 3.5% |
| Air Products and Chemicals, Inc. | 42,900 | 13,224,354 |
| Linde plc | 93,600 | 30,530,448 |
| | | 43,754,802 |
| Energy Equipment & Services 2.4% |
| Schlumberger Ltd. | 562,300 | 30,060,558 |
| Food & Staples Retailing 2.6% |
| Costco Wholesale Corp. | 73,400 | 33,507,100 |
| Health Care Equipment & Supplies 4.7% |
| IDEXX Laboratories, Inc. (a) | 61,590 | 25,126,256 |
| Intuitive Surgical, Inc. (a) | 128,480 | 34,092,168 |
| | | 59,218,424 |
| Health Care Providers & Services 3.8% |
| UnitedHealth Group, Inc. | 91,680 | 48,606,902 |
| Health Care Technology 2.1% |
| Veeva Systems, Inc., Class A (a) | 166,190 | 26,819,742 |
| Hotels, Restaurants & Leisure 7.0% |
| Chipotle Mexican Grill, Inc. (a) | 27,590 | 38,280,849 |
| Hilton Worldwide Holdings, Inc. | 209,920 | 26,525,491 |
| Starbucks Corp. | 242,300 | 24,036,160 |
| | | 88,842,500 |
| Interactive Media & Services 3.3% |
| Alphabet, Inc. (a) | | |
| Class A | 252,500 | 22,278,075 |
| Class C | 224,760 | 19,942,955 |
| | | 42,221,030 |
| Internet & Direct Marketing Retail 0.9% |
| Amazon.com, Inc. (a) | 135,300 | 11,365,200 |
| IT Services 12.9% |
| Accenture plc, Class A | 92,100 | 24,575,964 |
| Gartner, Inc. (a) | 84,800 | 28,504,672 |
| Mastercard, Inc., Class A | 156,940 | 54,572,746 |
| | Shares | Value |
| |
| IT Services (continued) |
| Visa, Inc., Class A | 267,500 | $ 55,575,800 |
| | | 163,229,182 |
| Life Sciences Tools & Services 7.1% |
| Agilent Technologies, Inc. | 170,990 | 25,588,653 |
| Bio-Techne Corp. | 228,160 | 18,909,901 |
| Danaher Corp. | 103,500 | 27,470,970 |
| IQVIA Holdings, Inc. (a) | 85,100 | 17,436,139 |
| | | 89,405,663 |
| Machinery 2.7% |
| Deere & Co. | 80,700 | 34,600,932 |
| Multiline Retail 2.2% |
| Dollar Tree, Inc. (a) | 194,300 | 27,481,792 |
| Personal Products 1.3% |
| Estee Lauder Cos., Inc. (The), Class A | 65,500 | 16,251,205 |
| Pharmaceuticals 3.4% |
| AstraZeneca plc, Sponsored ADR | 299,200 | 20,285,760 |
| Zoetis, Inc. | 157,450 | 23,074,298 |
| | | 43,360,058 |
| Professional Services 0.8% |
| CoStar Group, Inc. (a) | 139,350 | 10,768,968 |
| Road & Rail 4.8% |
| CSX Corp. | 710,450 | 22,009,741 |
| Union Pacific Corp. | 190,284 | 39,402,108 |
| | | 61,411,849 |
| Semiconductors & Semiconductor Equipment 9.1% |
| Analog Devices, Inc. | 216,550 | 35,520,696 |
| ASML Holding NV (Registered) | 60,860 | 33,253,904 |
| Lam Research Corp. | 54,000 | 22,696,200 |
| NVIDIA Corp. | 167,640 | 24,498,910 |
| | | 115,969,710 |
| Software 14.1% |
| Adobe, Inc. (a) | 31,350 | 10,550,215 |
| Intuit, Inc. | 75,050 | 29,210,961 |
| Microsoft Corp. | 335,830 | 80,538,751 |
| Palo Alto Networks, Inc. (a) | 168,210 | 23,472,023 |
| ServiceNow, Inc. (a) | 90,580 | 35,169,497 |
| | | 178,941,447 |
The notes to the financial statements are an integral part of, and should be read in conjunction with, the financial statements.
| 10 | MainStay VP Winslow Large Cap Growth Portfolio |
| | Shares | | Value |
| Common Stocks (continued) |
| Technology Hardware, Storage & Peripherals 5.5% |
| Apple, Inc. | 532,050 | | $ 69,129,257 |
| Textiles, Apparel & Luxury Goods 2.4% |
| Lululemon Athletica, Inc. (a) | 95,000 | | 30,436,100 |
Total Common Stocks
(Cost $1,220,092,767) | | | 1,260,324,124 |
| Short-Term Investment 0.7% |
| Affiliated Investment Company 0.7% |
| MainStay U.S. Government Liquidity Fund, 3.602% (b) | 8,116,681 | | 8,116,681 |
Total Short-Term Investment
(Cost $8,116,681) | | | 8,116,681 |
Total Investments
(Cost $1,228,209,448) | 100.1% | | 1,268,440,805 |
| Other Assets, Less Liabilities | (0.1) | | (1,000,080) |
| Net Assets | 100.0% | | $ 1,267,440,725 |
| † | Percentages indicated are based on Portfolio net assets. |
| (a) | Non-income producing security. |
| (b) | Current yield as of December 31, 2022. |
Investments in Affiliates (in 000's)
Investments in issuers considered to be affiliate(s) of the Portfolio during the year ended December 31, 2022 for purposes of Section 2(a)(3) of the Investment Company Act of 1940, as amended, were as follows:
| Affiliated Investment Companies | Value,
Beginning
of Year | Purchases
at Cost | Proceeds
from
Sales | Net
Realized
Gain/(Loss)
on Sales | Change in
Unrealized
Appreciation/
(Depreciation) | Value,
End of
Year | Dividend
Income | Other
Distributions | Shares
End of
Year |
| MainStay U.S. Government Liquidity Fund | $ 15,463 | $ 332,200 | $ (339,546) | $ — | $ — | $ 8,117 | $ 129 | $ — | 8,117 |
| Abbreviation(s): |
| ADR—American Depositary Receipt |
The notes to the financial statements are an integral part of, and should be read in conjunction with, the financial statements.
11
Portfolio of Investments December 31, 2022† (continued)
The following is a summary of the fair valuations according to the inputs used as of December 31, 2022, for valuing the Portfolio’s assets:
| Description | Quoted
Prices in
Active
Markets for
Identical
Assets
(Level 1) | | Significant
Other
Observable
Inputs
(Level 2) | | Significant
Unobservable
Inputs
(Level 3) | | Total |
| Asset Valuation Inputs | | | | | | | |
| Investments in Securities (a) | | | | | | | |
| Common Stocks | $ 1,260,324,124 | | $ — | | $ — | | $ 1,260,324,124 |
| Short-Term Investment | | | | | | | |
| Affiliated Investment Company | 8,116,681 | | — | | — | | 8,116,681 |
| Total Investments in Securities | $ 1,268,440,805 | | $ — | | $ — | | $ 1,268,440,805 |
| (a) | For a complete listing of investments and their industries, see the Portfolio of Investments. |
The notes to the financial statements are an integral part of, and should be read in conjunction with, the financial statements.
| 12 | MainStay VP Winslow Large Cap Growth Portfolio |
Statement of Assets and Liabilities as of December 31, 2022
| Assets |
Investment in unaffiliated securities, at value
(identified cost $1,220,092,767) | $1,260,324,124 |
Investment in affiliated investment companies, at value
(identified cost $8,116,681) | 8,116,681 |
| Receivables: | |
| Dividends | 447,320 |
| Portfolio shares sold | 248,370 |
| Other assets | 7,995 |
| Total assets | 1,269,144,490 |
| Liabilities |
| Payables: | |
| Manager (See Note 3) | 810,015 |
| Portfolio shares redeemed | 570,707 |
| NYLIFE Distributors (See Note 3) | 205,107 |
| Shareholder communication | 62,970 |
| Professional fees | 40,903 |
| Custodian | 4,726 |
| Accrued expenses | 9,337 |
| Total liabilities | 1,703,765 |
| Net assets | $1,267,440,725 |
| Composition of Net Assets |
| Shares of beneficial interest outstanding (par value of $.001 per share) unlimited number of shares authorized | $ 72,378 |
| Additional paid-in-capital | 1,175,709,974 |
| | 1,175,782,352 |
| Total distributable earnings (loss) | 91,658,373 |
| Net assets | $1,267,440,725 |
| Initial Class | |
| Net assets applicable to outstanding shares | $335,309,342 |
| Shares of beneficial interest outstanding | 17,690,955 |
| Net asset value per share outstanding | $ 18.95 |
| Service Class | |
| Net assets applicable to outstanding shares | $932,131,383 |
| Shares of beneficial interest outstanding | 54,687,259 |
| Net asset value per share outstanding | $ 17.04 |
The notes to the financial statements are an integral part of, and should be read in conjunction with, the financial statements.
13
Statement of Operations for the year ended December 31, 2022
| Investment Income (Loss) |
| Income | |
| Dividends-unaffiliated (net of foreign tax withholding of $60,006) | $ 9,536,942 |
| Dividends-affiliated | 128,784 |
| Securities lending, net | 1,051 |
| Total income | 9,666,777 |
| Expenses | |
| Manager (See Note 3) | 10,527,820 |
| Distribution/Service—Service Class (See Note 3) | 2,569,706 |
| Professional fees | 133,836 |
| Shareholder communication | 106,861 |
| Trustees | 32,975 |
| Custodian | 30,313 |
| Miscellaneous | 43,686 |
| Total expenses before waiver/reimbursement | 13,445,197 |
| Expense waiver/reimbursement from Manager (See Note 3) | (28,848) |
| Net expenses | 13,416,349 |
| Net investment income (loss) | (3,749,572) |
| Realized and Unrealized Gain (Loss) |
| Net realized gain (loss) on unaffiliated investments | 55,370,337 |
| Net change in unrealized appreciation (depreciation) on unaffiliated investments | (658,798,432) |
| Net realized and unrealized gain (loss) | (603,428,095) |
| Net increase (decrease) in net assets resulting from operations | $(607,177,667) |
The notes to the financial statements are an integral part of, and should be read in conjunction with, the financial statements.
| 14 | MainStay VP Winslow Large Cap Growth Portfolio |
Statements of Changes in Net Assets
for the years ended December 31, 2022 and December 31, 2021
| | 2022 | 2021 |
| Increase (Decrease) in Net Assets |
| Operations: | | |
| Net investment income (loss) | $ (3,749,572) | $ (9,158,082) |
| Net realized gain (loss) | 55,370,337 | 361,319,257 |
| Net change in unrealized appreciation (depreciation) | (658,798,432) | 42,537,169 |
| Net increase (decrease) in net assets resulting from operations | (607,177,667) | 394,698,344 |
| Distributions to shareholders: | | |
| Initial Class | (88,754,424) | (43,495,671) |
| Service Class | (263,426,186) | (95,317,024) |
| Total distributions to shareholders | (352,180,610) | (138,812,695) |
| Capital share transactions: | | |
| Net proceeds from sales of shares | 214,496,273 | 225,933,895 |
| Net asset value of shares issued to shareholders in reinvestment of distributions | 352,180,610 | 138,812,695 |
| Cost of shares redeemed | (282,463,949) | (306,858,723) |
| Increase (decrease) in net assets derived from capital share transactions | 284,212,934 | 57,887,867 |
| Net increase (decrease) in net assets | (675,145,343) | 313,773,516 |
| Net Assets |
| Beginning of year | 1,942,586,068 | 1,628,812,552 |
| End of year | $1,267,440,725 | $1,942,586,068 |
The notes to the financial statements are an integral part of, and should be read in conjunction with, the financial statements.
15
Financial Highlights selected per share data and ratios
| | Year Ended December 31, |
| Initial Class | 2022 | | 2021 | | 2020 | | 2019 | | 2018 |
| Net asset value at beginning of year | $ 37.92 | | $ 32.76 | | $ 25.51 | | $ 21.64 | | $ 23.92 |
| Net investment income (loss) (a) | (0.02) | | (0.12) | | (0.04) | | 0.00‡ | | 0.00‡ |
| Net realized and unrealized gain (loss) | (12.18) | | 8.01 | | 9.36 | | 6.95 | | 1.36 |
| Total from investment operations | (12.20) | | 7.89 | | 9.32 | | 6.95 | | 1.36 |
| Less distributions: | | | | | | | | | |
| From net realized gain on investments | (6.77) | | (2.73) | | (2.07) | | (3.08) | | (3.64) |
| Net asset value at end of year | $ 18.95 | | $ 37.92 | | $ 32.76 | | $ 25.51 | | $ 21.64 |
| Total investment return (b) | (31.16)% | | 24.52% | | 37.16% | | 33.64% | | 3.57% |
| Ratios (to average net assets)/Supplemental Data: | | | | | | | | | |
| Net investment income (loss) | (0.09)% | | (0.34)% | | (0.16)% | | 0.01% | | 0.01% |
| Net expenses (c)(d) | 0.75% | | 0.74% | | 0.75% | | 0.76% | | 0.76% |
| Portfolio turnover rate | 75% | | 62% | | 54% | | 56% | | 58% |
| Net assets at end of year (in 000's) | $ 335,309 | | $ 632,666 | | $ 534,965 | | $ 438,089 | | $ 238,174 |
| ‡ | Less than one cent per share. |
| (a) | Per share data based on average shares outstanding during the year. |
| (b) | Total return does not reflect any deduction of sales charges, mortality and expense charges, contract charges or administrative charges. For periods of less than one year, total return is not annualized. |
| (c) | In addition to the fees and expenses which the Portfolio bears directly, it also indirectly bears a pro-rata share of the fees and expenses of the underlying funds in which it invests. Such indirect expenses are not included in the above expense ratios. |
| (d) | Expense waiver/reimbursement less than 0.01%. |
| | Year Ended December 31, |
| Service Class | 2022 | | 2021 | | 2020 | | 2019 | | 2018 |
| Net asset value at beginning of year | $ 35.23 | | $ 30.68 | | $ 24.05 | | $ 20.60 | | $ 22.96 |
| Net investment income (loss) (a) | (0.08) | | (0.20) | | (0.11) | | (0.06) | | (0.06) |
| Net realized and unrealized gain (loss) | (11.34) | | 7.48 | | 8.81 | | 6.59 | | 1.34 |
| Total from investment operations | (11.42) | | 7.28 | | 8.70 | | 6.53 | | 1.28 |
| Less distributions: | | | | | | | | | |
| From net realized gain on investments | (6.77) | | (2.73) | | (2.07) | | (3.08) | | (3.64) |
| Net asset value at end of year | $ 17.04 | | $ 35.23 | | $ 30.68 | | $ 24.05 | | $ 20.60 |
| Total investment return (b) | (31.34)% | | 24.20% | | 36.81% | | 33.30% | | 3.31% |
| Ratios (to average net assets)/Supplemental Data: | | | | | | | | | |
| Net investment income (loss) | (0.33)% | | (0.59)% | | (0.41)% | | (0.25)% | | (0.23)% |
| Net expenses (c)(d) | 1.00% | | 0.99% | | 1.00% | | 1.01% | | 1.01% |
| Portfolio turnover rate | 75% | | 62% | | 54% | | 56% | | 58% |
| Net assets at end of year (in 000's) | $ 932,131 | | $ 1,309,920 | | $ 1,093,847 | | $ 825,075 | | $ 623,836 |
| (a) | Per share data based on average shares outstanding during the year. |
| (b) | Total return does not reflect any deduction of sales charges, mortality and expense charges, contract charges or administrative charges. For periods of less than one year, total return is not annualized. |
| (c) | In addition to the fees and expenses which the Portfolio bears directly, it also indirectly bears a pro-rata share of the fees and expenses of the underlying funds in which it invests. Such indirect expenses are not included in the above expense ratios. |
| (d) | Expense waiver/reimbursement less than 0.01%. |
The notes to the financial statements are an integral part of, and should be read in conjunction with, the financial statements.
| 16 | MainStay VP Winslow Large Cap Growth Portfolio |
Notes to Financial Statements
Note 1–Organization and Business
MainStay VP Funds Trust (the “Fund”) was organized as a Delaware statutory trust on February 1, 2011. The Fund is registered under the Investment Company Act of 1940, as amended (the “1940 Act”), as an open-end management investment company. The Fund is comprised of thirty-one separate series (collectively referred to as the “Portfolios”). These financial statements and notes relate to the MainStay VP Winslow Large Cap Growth Portfolio (the "Portfolio"), a "diversified” portfolio, as that term is defined in the 1940 Act, as interpreted or modified by regulatory authorities having jurisdiction, from time to time.
Shares of the Portfolio are currently offered to certain separate accounts to fund variable annuity policies and variable universal life insurance policies issued by New York Life Insurance and Annuity Corporation (“NYLIAC”), a wholly-owned subsidiary of New York Life Insurance Company (“New York Life”) and may also be offered to fund variable annuity policies and variable universal life insurance policies issued by other insurance companies. NYLIAC allocates shares of the Portfolio to, among others, certain NYLIAC separate accounts. Shares of the Portfolio are also offered to the MainStay VP Conservative Allocation Portfolio, MainStay VP Moderate Allocation Portfolio, MainStay VP Growth Allocation Portfolio and MainStay VP Equity Allocation Portfolio, which operate as “funds-of-funds," and other variable insurance funds.
The following table lists the Portfolio's share classes that have been registered and commenced operations:
| Class | Commenced Operations |
| Initial Class | May 1, 1998 |
| Service Class | June 6, 2003 |
Shares of the Portfolio are offered and are redeemed at a price equal to their respective net asset value (“NAV”) per share. No sales or redemption charge is applicable to the purchase or redemption of the Portfolio's shares. Under the terms of the Fund’s multiple class plan, adopted pursuant to Rule 18f-3 under the 1940 Act, the classes differ in that, among other things, Service Class shares of the Portfolio pay a combined distribution and service fee of 0.25% of average daily net assets attributable to Service Class shares of the Portfolio to the Distributor (as defined in Note 3(B)) pursuant to a plan adopted in accordance with Rule 12b-1 under the 1940 Act. Contract owners of variable annuity contracts purchased after June 2, 2003, are permitted to invest only in the Service Class shares.
The Portfolio's investment objective is to seek long-term growth of capital.
Note 2–Significant Accounting Policies
The Portfolio is an investment company and accordingly follows the investment company accounting and reporting guidance of the Financial Accounting Standards Board (“FASB”) Accounting Standards Codification Topic 946 Financial Services—Investment Companies. The Portfolio prepares its financial statements in accordance with generally accepted
accounting principles (“GAAP”) in the United States of America and follows the significant accounting policies described below.
(A) Securities Valuation. Investments are usually valued as of the close of regular trading on the New York Stock Exchange (the "Exchange") (usually 4:00 p.m. Eastern time) on each day the Portfolio is open for business ("valuation date").
Effective September 8, 2022, and pursuant to Rule 2a-5 under the 1940 Act, the Board of Trustees of the Fund (the "Board") designated New York Life Investment Management LLC (“New York Life Investments” or the "Manager") as its Valuation Designee (the "Valuation Designee"). The Valuation Designee is responsible for performing fair valuations relating to all investments in the Portfolio’s portfolio for which market quotations are not readily available; periodically assessing and managing material valuation risks; establishing and applying fair value methodologies; testing fair valuation methodologies; evaluating and overseeing pricing services; ensuring appropriate segregation of valuation and portfolio management functions; providing quarterly, annual and prompt reporting to the Board, as appropriate; identifying potential conflicts of interest; and maintaining appropriate records. The Valuation Designee has established a valuation committee ("Valuation Committee") to assist in carrying out the Valuation Designee’s responsibilities and establish prices of securities for which market quotations are not readily available. The Portfolio’s and the Valuation Designee's policies and procedures ("Valuation Procedures") govern the Valuation Designee’s selection and application of methodologies for determining and calculating the fair value of Portfolio investments. The Valuation Designee may value the Portfolio's portfolio securities for which market quotations are not readily available and other Portfolio assets utilizing inputs from pricing services and other third-party sources (together, “Pricing Sources”). The Valuation Committee meets (in person, via electronic mail or via teleconference) on an ad-hoc basis to determine fair valuations and on a quarterly basis to review fair value events with respect to certain securities for which market quotations are not readily available, including valuation risks and back-testing results, and preview reports to the Board.
The Valuation Committee establishes prices of securities for which market quotations are not readily available based on such methodologies and measurements on a regular basis after considering information that is reasonably available and deemed relevant by the Valuation Committee. The Board shall oversee the Valuation Designee and review fair valuation materials on a prompt, quarterly and annual basis and approve proposed revisions to the Valuation Procedures.
Investments for which market quotations are not readily available are valued at fair value as determined in good faith pursuant to the Valuation Procedures. A market quotation is readily available only when that quotation is a quoted price (unadjusted) in active markets for identical investments that the Portfolio can access at the measurement date, provided that a quotation will not be readily available if it is not reliable. "Fair value" is defined as the price the Portfolio would reasonably expect to receive upon selling an asset or liability in an orderly transaction to an independent buyer in the principal or most advantageous market for the
Notes to Financial Statements (continued)
asset or liability. Fair value measurements are determined within a framework that establishes a three-tier hierarchy that maximizes the use of observable market data and minimizes the use of unobservable inputs to establish a classification of fair value measurements for disclosure purposes. "Inputs" refer broadly to the assumptions that market participants would use in pricing the asset or liability, including assumptions about risk, such as the risk inherent in a particular valuation technique used to measure fair value using a pricing model and/or the risk inherent in the inputs for the valuation technique. Inputs may be observable or unobservable. Observable inputs reflect the assumptions market participants would use in pricing the asset or liability based on market data obtained from sources independent of the Portfolio. Unobservable inputs reflect the Portfolio’s own assumptions about the assumptions market participants would use in pricing the asset or liability based on the information available. The inputs or methodology used for valuing assets or liabilities may not be an indication of the risks associated with investing in those assets or liabilities. The three-tier hierarchy of inputs is summarized below.
| • | Level 1—quoted prices (unadjusted) in active markets for an identical asset or liability |
| • | Level 2—other significant observable inputs (including quoted prices for a similar asset or liability in active markets, interest rates and yield curves, prepayment speeds, credit risk, etc.) |
| • | Level 3—significant unobservable inputs (including the Portfolio's own assumptions about the assumptions that market participants would use in measuring fair value of an asset or liability) |
The level of an asset or liability within the fair value hierarchy is based on the lowest level of an input, both individually and in the aggregate, that is significant to the fair value measurement. The aggregate value by input level of the Portfolio’s assets and liabilities as of December 31, 2022, is included at the end of the Portfolio of Investments.
The Portfolio may use third-party vendor evaluations, whose prices may be derived from one or more of the following standard inputs, among others:
| • Broker/dealer quotes | • Benchmark securities |
| • Two-sided markets | • Reference data (corporate actions or material event notices) |
| • Bids/offers | • Monthly payment information |
| • Industry and economic events | • Reported trades |
An asset or liability for which a market quotation is not readily available is valued by methods deemed reasonable in good faith by the Valuation Committee, following the Valuation Procedures to represent fair value. Under these procedures, the Valuation Designee generally uses a market-based approach which may use related or comparable assets or liabilities, recent transactions, market multiples, book values and other relevant information. The Valuation Designee may also use an income-based valuation approach in which the anticipated future cash flows of the asset or liability are discounted to calculate fair value.
Discounts may also be applied due to the nature and/or duration of any restrictions on the disposition of the asset or liability. Fair value represents a good faith approximation of the value of a security. Fair value determinations involve the consideration of a number of subjective factors, an analysis of applicable facts and circumstances and the exercise of judgment. As a result, it is possible that the fair value for a security determined in good faith in accordance with the Valuation Procedures may differ from valuations for the same security determined for other funds using their own valuation procedures. Although the Valuation Procedures are designed to value a security at the price the Portfolio may reasonably expect to receive upon the security's sale in an orderly transaction, there can be no assurance that any fair value determination thereunder would, in fact, approximate the amount that the Portfolio would actually realize upon the sale of the security or the price at which the security would trade if a reliable market price were readily available. During the year ended December 31, 2022, there were no material changes to the fair value methodologies.
Securities which may be valued in this manner include, but are not limited to: (i) a security for which trading has been halted or suspended or otherwise does not have a readily available market quotation on a given day; (ii) a debt security that has recently gone into default and for which there is not a current market quotation; (iii) a security of an issuer that has entered into a restructuring; (iv) a security that has been delisted from a national exchange; (v) a security subject to trading collars for which no or limited trading takes place; and (vi) a security whose principal market has been temporarily closed at a time when, under normal conditions, it would be open. Securities valued in this manner are generally categorized as Level 2 or 3 in the hierarchy.
Equity securities are valued at the last quoted sales prices as of the close of regular trading on the relevant exchange on each valuation date. Securities that are not traded on the valuation date are valued at the mean of the last quoted bid and ask prices. Prices are normally taken from the principal market in which each security trades. These securities are generally categorized as Level 1 in the hierarchy.
Investments in mutual funds, including money market funds, are valued at their respective NAVs at the close of business each day on the valuation date. These securities are generally categorized as Level 1 in the hierarchy.
Temporary cash investments acquired in excess of 60 days to maturity at the time of purchase are valued using the latest bid prices or using valuations based on a matrix system (which considers such factors as security prices, yields, maturities and ratings), both as furnished by independent pricing services. Temporary cash investments that mature in 60 days or less at the time of purchase ("Short-Term Investments") are valued using the amortized cost method of valuation, unless the use of such method would be inappropriate. The amortized cost method involves valuing a security at its cost on the date of purchase and thereafter assuming a constant amortization to maturity of the difference between such cost and the value on maturity date. Amortized cost approximates the current fair value of a security. Securities valued using the amortized
| 18 | MainStay VP Winslow Large Cap Growth Portfolio |
cost method are not valued using quoted prices in an active market and are generally categorized as Level 2 in the hierarchy.
The information above is not intended to reflect an exhaustive list of the methodologies that may be used to value portfolio investments. The Valuation Procedures permit the use of a variety of valuation methodologies in connection with valuing portfolio investments. The methodology used for a specific type of investment may vary based on the market data available or other considerations. The methodologies summarized above may not represent the specific means by which portfolio investments are valued on any particular business day.
(B) Income Taxes. The Portfolio's policy is to comply with the requirements of the Internal Revenue Code of 1986, as amended (the “Internal Revenue Code”), applicable to regulated investment companies and to distribute all of its taxable income to the shareholders of the Portfolio within the allowable time limits.
The Manager evaluates the Portfolio’s tax positions to determine if the tax positions taken meet the minimum recognition threshold in connection with accounting for uncertainties in income tax positions taken or expected to be taken for the purposes of measuring and recognizing tax liabilities in the financial statements. Recognition of tax benefits of an uncertain tax position is permitted only to the extent the position is “more likely than not” to be sustained assuming examination by taxing authorities. The Manager analyzed the Portfolio's tax positions taken on federal, state and local income tax returns for all open tax years (for up to three tax years) and has concluded that no provisions for federal, state and local income tax are required in the Portfolio's financial statements. The Portfolio's federal, state and local income tax and federal excise tax returns for tax years for which the applicable statutes of limitations have not expired are subject to examination by the Internal Revenue Service and state and local departments of revenue.
(C) Dividends and Distributions to Shareholders. Dividends and distributions are recorded on the ex-dividend date. The Portfolio intends to declare and pay dividends from net investment income and distributions from net realized capital and currency gains, if any, at least annually. All dividends and distributions are reinvested at NAV in the same class of shares of the Portfolio. Dividends and distributions to shareholders are determined in accordance with federal income tax regulations and may differ from determinations using GAAP.
(D) Security Transactions and Investment Income. The Portfolio records security transactions on the trade date. Realized gains and losses on security transactions are determined using the identified cost method. Dividend income is recognized on the ex-dividend date, net of any foreign tax withheld at the source, and interest income is accrued as earned using the effective interest rate method. Distributions received from real estate investment trusts may be classified as dividends, capital gains and/or return of capital.
Investment income and realized and unrealized gains and losses on investments of the Portfolio are allocated pro rata to the separate classes
of shares based upon their relative net assets on the date the income is earned or realized and unrealized gains and losses are incurred.
(E) Expenses. Expenses of the Fund are allocated to the individual Portfolios in proportion to the net assets of the respective Portfolios when the expenses are incurred, except where direct allocations of expenses can be made. Expenses (other than fees incurred under the distribution and service plans, further discussed in Note 3(B), which are charged directly to the Service Class shares) are allocated to separate classes of shares pro rata based upon their relative net assets on the date the expenses are incurred. The expenses borne by the Portfolio, including those of related parties to the Portfolio, are shown in the Statement of Operations.
Additionally, the Portfolio may invest in mutual funds, which are subject to management fees and other fees that may cause the costs of investing in mutual funds to be greater than the costs of owning the underlying securities directly. These indirect expenses of mutual funds are not included in the amounts shown as expenses in the Statement of Operations or in the expense ratios included in the Financial Highlights.
(F) Use of Estimates. In preparing financial statements in conformity with GAAP, the Manager makes estimates and assumptions that affect the reported amounts and disclosures in the financial statements. Actual results could differ from those estimates and assumptions.
(G) Securities Lending. In order to realize additional income, the Portfolio may engage in securities lending, subject to the limitations set forth in the 1940 Act and relevant guidance by the staff of the Securities and Exchange Commission (“SEC”). If the Portfolio engages in securities lending, the Portfolio will lend through its custodian, JPMorgan Chase Bank, N.A., ("JPMorgan"), acting as securities lending agent on behalf of the Portfolio. Under the current arrangement, JPMorgan will manage the Portfolio's collateral in accordance with the securities lending agency agreement between the Portfolio and JPMorgan, and indemnify the Portfolio against counterparty risk. The loans will be collateralized by cash (which may be invested in a money market fund) and/or non-cash collateral (which may include U.S. Treasury securities and/or U.S. government agency securities issued or guaranteed by the United States government or its agencies or instrumentalities) at least equal at all times to the market value of the securities loaned. Non-cash collateral held at year end is segregated and cannot be transferred by the Portfolio. The Portfolio bears the risk of delay in recovery of, or loss of rights in, the securities loaned. The Portfolio may also record a realized gain or loss on securities deemed sold due to a borrower’s inability to return securities on loan. The Portfolio bears the risk of any loss on investment of cash collateral. The Portfolio will receive compensation for lending its securities in the form of fees or it will retain a portion of interest earned on the investment of any cash collateral. The Portfolio will also continue to receive interest and dividends on the securities loaned and any gain or loss in the market price of the securities loaned that may occur during the term of the loan will be for the account of the Portfolio. Income earned from securities lending activities, if any, is reflected in the Statement of
Notes to Financial Statements (continued)
Operations. As of December 31, 2022, the Portfolio did not have any portfolio securities on loan.
(H) Indemnifications. Under the Fund’s organizational documents, its officers and trustees are indemnified against certain liabilities that may arise out of performance of their duties to the Fund. Additionally, in the normal course of business, the Portfolio enters into contracts with third-party service providers that contain a variety of representations and warranties and that may provide general indemnifications. The Portfolio's maximum exposure under these arrangements is unknown, as this would involve future claims that may be made against the Portfolio that have not yet occurred. The Manager believes that the risk of loss in connection with these potential indemnification obligations is remote. However, there can be no assurance that material liabilities related to such obligations will not arise in the future, which could adversely impact the Portfolio.
Note 3–Fees and Related Party Transactions
(A) Manager and Subadvisor. New York Life Investments, a registered investment adviser and an indirect, wholly-owned subsidiary of New York Life, serves as the Portfolio’s Manager, pursuant to an Amended and Restated Management Agreement (“Management Agreement”). The Manager provides offices, conducts clerical, recordkeeping and bookkeeping services and keeps most of the financial and accounting records required to be maintained by the Portfolio. Except for the portion of salaries and expenses that are the responsibility of the Portfolio, the Manager pays the salaries and expenses of all personnel affiliated with the Portfolio and certain operational expenses of the Portfolio. During a portion of the year ended December 31, 2022, the Portfolio reimbursed New York Life Investments in an amount equal to the portion of the compensation of the Chief Compliance Officer attributable to the Portfolio. Winslow Capital Management, LLC. (“Winslow” or the “Subadvisor”), a registered investment adviser, serves as the Subadvisor to the Portfolio and is responsible for the day-to-day portfolio management of the Portfolio. Pursuant to the terms of a Subadvisory Agreement between New York Life Investments and Winslow, New York Life Investments pays for the services of the Subadvisor.
Pursuant to the Management Agreement, the Fund pays the Manager, on behalf of the Portfolio, a monthly fee for the services performed and the facilities furnished at an annual rate of the Portfolio's average daily net assets as follows: 0.75% up to $500 million; 0.725% from $500 million to $750 million; 0.71% from $750 million to $1 billion; 0.70% from $1 billion to $2 billion; 0.66% from $2 billion to $3 billion; 0.61% from $3 billion to $7 billion; 0.585% from $7 billion to $9 billion; and 0.575% in excess of $9 billion.
New York Life Investments has voluntarily agreed to waive a portion of its management fee when the subadvisory fee is reduced as a result of achieving breakpoints in the subadvisory fee schedule. The savings that result from the reduced subadvisory fee will be shared equally with the Portfolio provided that the amount of the management fee retained by New York Life Investments, after payment of the subadvisory fee, exceeds
0.35% of the average daily net assets of the Portfolio. This waiver may be discontinued at any time.
New York Life Investments has contractually agreed to waive a portion of its management fee so that the management fee does not exceed 0.55% of the Portfolio’s average daily net assets from $11 billion to $13 billion; and 0.525% of the Portfolio’s average daily net assets over $13 billion. This agreement expires May 1, 2023, and may only be amended or terminated prior to that date by action of the Board. During the year ended December 31, 2022, the effective management fee rate was 0.72% (exclusive of any applicable waivers/reimbursements).
During the year ended December 31, 2022, New York Life Investments earned fees from the Portfolio in the amount of $10,527,820 and waived fees and/or reimbursed expenses in the amount of $28,848 and paid the Subadvisor fees of $3,877,958.
JPMorgan provides sub-administration and sub-accounting services to the Portfolio pursuant to an agreement with New York Life Investments. These services include calculating the daily NAVs of the Portfolio, maintaining the general ledger and sub-ledger accounts for the calculation of the Portfolio's NAVs, and assisting New York Life Investments in conducting various aspects of the Portfolio's administrative operations. For providing these services to the Portfolio, JPMorgan is compensated by New York Life Investments.
Pursuant to an agreement between the Fund and New York Life Investments, New York Life Investments is responsible for providing or procuring certain regulatory reporting services for the Portfolio. The Portfolio will reimburse New York Life Investments for the actual costs incurred by New York Life Investments in connection with providing or procuring these services for the Portfolio.
(B) Distribution and Service Fees. The Fund, on behalf of the Portfolio, has entered into a distribution agreement with NYLIFE Distributors LLC (the “Distributor”), an affiliate of New York Life Investments. The Portfolio has adopted a distribution plan (the “Plan”) in accordance with the provisions of Rule 12b-1 under the 1940 Act. Under the Plan, the Distributor has agreed to provide, through its affiliates or independent third parties, various distribution-related, shareholder and administrative support services to the Service Class shareholders. For its services, the Distributor is entitled to a combined distribution and service fee accrued daily and paid monthly at an annual rate of 0.25% of the average daily net assets attributable to the Service Class shares of the Portfolio.
| 20 | MainStay VP Winslow Large Cap Growth Portfolio |
Note 4-Federal Income Tax
As of December 31, 2022, the cost and unrealized appreciation (depreciation) of the Portfolio’s investment portfolio, including applicable derivative contracts and other financial instruments, as determined on a federal income tax basis, were as follows:
| | Federal Tax
Cost | Gross
Unrealized
Appreciation | Gross
Unrealized
(Depreciation) | Net
Unrealized
Appreciation/
(Depreciation) |
| Investments in Securities | $1,231,830,296 | $112,082,464 | $(75,471,955) | $36,610,509 |
As of December 31, 2022, the components of accumulated gain (loss) on a tax basis were as follows:
Ordinary
Income | Accumulated
Capital
and Other
Gain (Loss) | Other
Temporary
Differences | Unrealized
Appreciation
(Depreciation) | Total
Accumulated
Gain (Loss) |
| $— | $55,047,864 | $— | $36,610,509 | $91,658,373 |
The difference between book-basis and tax-basis unrealized appreciation (depreciation) is primarily due to wash sale adjustments.
The following table discloses the current year reclassifications between total distributable earnings (loss) and additional paid-in capital arising from permanent differences; net assets as of December 31, 2022 were not affected.
| | Total
Distributable
Earnings (Loss) | Additional
Paid-In
Capital |
| | $146,679 | $(146,679) |
The reclassifications for the Portfolio are primarily due to different book and tax treatment of reclassification of net operating losses.
During the years ended December 31, 2022 and December 31, 2021, the tax character of distributions paid as reflected in the Statements of Changes in Net Assets was as follows:
| | 2022 | 2021 |
| Distributions paid from: | | |
| Ordinary Income | $ 51,907,115 | $ — |
| Long-Term Capital Gains | 300,273,495 | 138,812,695 |
| Total | $352,180,610 | $138,812,695 |
Note 5–Custodian
JPMorgan is the custodian of cash and securities held by the Portfolio. Custodial fees are charged to the Portfolio based on the Portfolio's net assets and/or the market value of securities held by the Portfolio and the number of certain transactions incurred by the Portfolio.
Note 6–Line of Credit
The Portfolio and certain other funds managed by New York Life Investments maintain a line of credit with a syndicate of banks in order to secure a source of funds for temporary purposes to meet unanticipated or excessive redemption requests.
Effective July 26, 2022, under the credit agreement (the “Credit Agreement”), the aggregate commitment amount is $600,000,000 with an additional uncommitted amount of $100,000,000. The commitment fee is an annual rate of 0.15% of the average commitment amount payable quarterly, regardless of usage, to JPMorgan, who serves as the agent to the syndicate. The commitment fee is allocated among the Portfolio and certain other funds managed by New York Life Investments based upon their respective net assets and other factors. Interest on any revolving credit loan is charged based upon the Federal Funds Rate, Daily Simple Secured Overnight Financing Rate ("SOFR") + 0.10%, or the Overnight Bank Funding Rate, whichever is higher. The Credit Agreement expires on July 25, 2023, although the Portfolio, certain other funds managed by New York Life Investments and the syndicate of banks may renew the Credit Agreement for an additional year on the same or different terms or enter into a credit agreement with a different syndicate of banks. Prior to July 26, 2022, the aggregate commitment amount and the commitment fee were the same as those under the current Credit Agreement. During the year ended December 31, 2022, there were no borrowings made or outstanding with respect to the Portfolio under the Credit Agreement.
Note 7–Interfund Lending Program
Pursuant to an exemptive order issued by the SEC, the Portfolio, along with certain other funds managed by New York Life Investments, may participate in an interfund lending program. The interfund lending program provides an alternative credit facility that permits the Portfolio and certain other funds managed by New York Life Investments to lend or borrow money for temporary purposes directly to or from one another, subject to the conditions of the exemptive order. During the year ended December 31, 2022, there were no interfund loans made or outstanding with respect to the Portfolio.
Note 8–Purchases and Sales of Securities (in 000’s)
During the year ended December 31, 2022, purchases and sales of securities, other than short-term securities, were $1,098,112 and $1,159,239, respectively.
Notes to Financial Statements (continued)
Note 9–Capital Share Transactions
Transactions in capital shares for the years ended December 31, 2022 and December 31, 2021, were as follows:
| Initial Class | Shares | Amount |
| Year ended December 31, 2022: | | |
| Shares sold | 2,106,607 | $ 63,629,404 |
| Shares issued to shareholders in reinvestment of distributions | 4,944,646 | 88,754,424 |
| Shares redeemed | (6,044,937) | (171,066,781) |
| Net increase (decrease) | 1,006,316 | $ (18,682,953) |
| Year ended December 31, 2021: | | |
| Shares sold | 2,316,264 | $ 82,342,909 |
| Shares issued to shareholders in reinvestment of distributions | 1,208,858 | 43,495,671 |
| Shares redeemed | (3,168,728) | (114,442,169) |
| Net increase (decrease) | 356,394 | $ 11,396,411 |
| |
| Service Class | Shares | Amount |
| Year ended December 31, 2022: | | |
| Shares sold | 5,856,023 | $ 150,866,869 |
| Shares issued to shareholders in reinvestment of distributions | 16,310,714 | 263,426,186 |
| Shares redeemed | (4,663,155) | (111,397,168) |
| Net increase (decrease) | 17,503,582 | $ 302,895,887 |
| Year ended December 31, 2021: | | |
| Shares sold | 4,318,772 | $ 143,590,986 |
| Shares issued to shareholders in reinvestment of distributions | 2,849,784 | 95,317,024 |
| Shares redeemed | (5,641,331) | (192,416,554) |
| Net increase (decrease) | 1,527,225 | $ 46,491,456 |
Note 10–Other Matters
As of the date of this report, interest rates in the United States and many parts of the world, including certain European countries, are ascending from historically low levels. Thus, the Portfolio currently faces a heightened level of risk associated with rising interest rates. This could be driven by a variety of factors, including but not limited to central bank monetary policies, changing inflation or real growth rates, general economic conditions, increasing bond issuances or reduced market demand for low yielding investments.
An outbreak of COVID-19, first detected in December 2019, has developed into a global pandemic and has resulted in travel restrictions, closure of international borders, certain businesses and securities markets, restrictions on securities trading activities, prolonged quarantines, supply chain disruptions, and lower consumer demand, as well as general concern and uncertainty. In 2022, many countries lifted some or all restrictions related to COVID-19. However, the continued impact of COVID-19 and related variants is uncertain and could further adversely affect the global economy, national economies, individual issuers and capital markets in unforeseeable ways and result in a
substantial and extended economic downturn. Developments that disrupt global economies and financial markets, such as COVID-19, may magnify factors that affect the Portfolio's performance.
Note 11–Subsequent Events
In connection with the preparation of the financial statements of the Portfolio as of and for the year ended December 31, 2022, events and transactions subsequent to December 31, 2022, through the date the financial statements were issued have been evaluated by the Manager for possible adjustment and/or disclosure. No subsequent events requiring financial statement adjustment or disclosure have been identified.
| 22 | MainStay VP Winslow Large Cap Growth Portfolio |
Report of Independent Registered Public Accounting Firm
To the Board of Trustees of MainStay VP Funds Trust and Shareholders of
MainStay VP Winslow Large Cap Growth Portfolio
Opinion on the Financial Statements
We have audited the accompanying statement of assets and liabilities, including the portfolio of investments, of MainStay VP Winslow Large Cap Growth Portfolio (one of the portfolios constituting MainStay VP Funds Trust, referred to hereafter as the “Portfolio”) as of December 31, 2022, the related statement of operations for the year ended December 31, 2022, the statements of changes in net assets for each of the two years in the period ended December 31, 2022, including the related notes, and the financial highlights for each of the five years in the period ended December 31, 2022 (collectively referred to as the “financial statements”). In our opinion, the financial statements present fairly, in all material respects, the financial position of the Portfolio as of December 31, 2022, the results of its operations for the year then ended, the changes in its net assets for each of the two years in the period ended December 31, 2022 and the financial highlights for each of the five years in the period ended December 31, 2022 in conformity with accounting principles generally accepted in the United States of America.
Basis for Opinion
These financial statements are the responsibility of the Portfolio’s management. Our responsibility is to express an opinion on the Portfolio’s financial statements based on our audits. We are a public accounting firm registered with the Public Company Accounting Oversight Board (United States) (PCAOB) and are required to be independent with respect to the Portfolio in accordance with the U.S. federal securities laws and the applicable rules and regulations of the Securities and Exchange Commission and the PCAOB.
We conducted our audits of these financial statements in accordance with the standards of the PCAOB. Those standards require that we plan and perform the audit to obtain reasonable assurance about whether the financial statements are free of material misstatement, whether due to error or fraud.
Our audits included performing procedures to assess the risks of material misstatement of the financial statements, whether due to error or fraud, and performing procedures that respond to those risks. Such procedures included examining, on a test basis, evidence regarding the amounts and disclosures in the financial statements. Our audits also included evaluating the accounting principles used and significant estimates made by management, as well as evaluating the overall presentation of the financial statements. Our procedures included confirmation of securities owned as of December 31, 2022 by correspondence with the custodian and transfer agent. We believe that our audits provide a reasonable basis for our opinion.
/s/PricewaterhouseCoopers LLP
New York, New York
February 24, 2023
We have served as the auditor of one or more investment companies in the MainStay group of funds since 1984.
Board Consideration and Approval of Management Agreement and Subadvisory Agreement (Unaudited)
The continuation of the Management Agreement with respect to the MainStay VP Winslow Large Cap Growth Portfolio (“Portfolio”) and New York Life Investment Management LLC (“New York Life Investments”) and the Subadvisory Agreement between New York Life Investments and Winslow Capital Management, LLC (“Winslow Capital”) with respect to the Portfolio (together, “Advisory Agreements”) is subject to annual review and approval by the Board of Trustees of MainStay VP Funds Trust (“Board” of the “Trust”) in accordance with Section 15 of the Investment Company Act of 1940, as amended (“1940 Act”). At its December 6–7, 2022 meeting, the Board, which is comprised solely of Trustees who are not an “interested person” (as such term is defined in the 1940 Act) of the Trust (“Independent Trustees”), unanimously approved the continuation of each of the Advisory Agreements for a one-year period.
In reaching the decision to approve the continuation of each of the Advisory Agreements, the Board considered information and materials furnished by New York Life Investments and Winslow Capital in connection with an annual contract review process undertaken by the Board that took place at meetings of the Board and its Contracts Committee during October 2022 through December 2022, including information and materials furnished by New York Life Investments and Winslow Capital in response to requests prepared on behalf of the Board, and in consultation with the Board, by independent legal counsel to the Independent Trustees, which encompassed a variety of topics, including those summarized below. Information and materials requested by and furnished to the Board for consideration in connection with the contract review process included, among other items, reports on the Portfolio and “peer funds” prepared by Institutional Shareholder Services Inc. (“ISS”), an independent third-party service provider engaged by the Board to report objectively on the Portfolio’s investment performance, management fee and total expenses. The Board also considered information on the fees charged to other investment advisory clients of New York Life Investments and/or Winslow Capital that follow investment strategies similar to those of the Portfolio, if any, and, when applicable, the rationale for any differences in the Portfolio’s management and subadvisory fees and the fees charged to those other investment advisory clients. In addition, the Board considered information regarding the legal standards and fiduciary obligations applicable to its consideration of the continuation of each of the Advisory Agreements. The contract review process, including the structure and format for information and materials provided to the Board, has been developed in consultation with the Board. The Independent Trustees also met in executive sessions with their independent legal counsel and, for portions thereof, with senior management of New York Life Investments.
The Board’s deliberations with respect to the continuation of each of the Advisory Agreements reflect a year-long process, and the Board also took into account information furnished to the Board and its Committees throughout the year, as deemed relevant and appropriate by the Trustees, including, among other items, reports on investment performance of the Portfolio and investment-related matters for the Portfolio as well as presentations from New York Life Investments and, generally annually, Winslow Capital personnel. In addition, the Board took into account other
information received from New York Life Investments throughout the year, including, among other items, periodic reports on legal and compliance matters, risk management, portfolio turnover, brokerage commissions and non-advisory services provided to the Portfolio by New York Life Investments, as deemed relevant and appropriate by the Trustees.
In addition to information provided to the Board throughout the year, the Board received information in connection with its June 2022 meeting provided specifically in response to requests prepared on behalf of the Board, and in consultation with the Board, by independent legal counsel to the Independent Trustees regarding the Portfolio’s distribution arrangements. In addition, the Board received information regarding the Portfolio’s asset levels, share purchase and redemption activity and the payment of Rule 12b-1 and/or other fees by the applicable share classes of the Portfolio, among other information.
In considering the continuation of each of the Advisory Agreements, the Trustees reviewed and evaluated the information and factors they believed to reasonably be necessary and appropriate in light of legal advice furnished to them by independent legal counsel to the Independent Trustees and through the exercise of their own business judgment. Although individual Trustees may have weighed certain factors or information differently and the Board did not consider any single factor or information controlling in reaching its decision, the factors considered by the Board are summarized in more detail below and include, among other factors: (i) the nature, extent and quality of the services provided to the Portfolio by New York Life Investments and Winslow Capital; (ii) the qualifications of the portfolio managers of the Portfolio and the historical investment performance of the Portfolio, New York Life Investments and Winslow Capital; (iii) the costs of the services provided, and profits realized, by New York Life Investments and Winslow Capital with respect to their relationships with the Portfolio; (iv) the extent to which economies of scale have been realized or may be realized if the Portfolio grows and the extent to which any economies of scale have been shared, have benefited or may benefit the Portfolio’s shareholders; and (v) the reasonableness of the Portfolio’s management and subadvisory fees and total ordinary operating expenses. Although the Board recognized that comparisons between the Portfolio’s fees and expenses and those of other funds are imprecise given different terms of agreements, variations in fund strategies and other factors, the Board considered the reasonableness of the Portfolio’s management fee and total ordinary operating expenses as compared to the peer funds identified by ISS. Throughout their considerations, the Trustees acknowledged the commitment of New York Life Investments and its affiliates to serve the MainStay Group of Funds, as well as their capacity, experience, resources, financial stability and reputations. The Trustees also acknowledged the entrepreneurial and other risks assumed by New York Life Investments in sponsoring and managing the Portfolio. With respect to the Subadvisory Agreement, the Board took into account New York Life Investments’ recommendation to approve the continuation of the Subadvisory Agreement.
| 24 | MainStay VP Winslow Large Cap Growth Portfolio |
The Trustees noted that, throughout the year, the Trustees are afforded an opportunity to ask questions of, and request additional information or materials from, New York Life Investments and Winslow Capital. The Board’s decision with respect to each of the Advisory Agreements may have also been based, in part, on the Board’s knowledge of New York Life Investments and Winslow Capital resulting from, among other things, the Board’s consideration of each of the Advisory Agreements in prior years, the advisory agreements for other funds in the MainStay Group of Funds, the Board’s review throughout the year of the performance and operations of other funds in the MainStay Group of Funds and each Trustee’s business judgment and industry experience. In addition to considering the above-referenced factors, the Board observed that in the marketplace, notably under variable life insurance policies and variable annuity contracts for which the Portfolio serves as an investment option, there are a range of investment options available to investors and that the Portfolio’s shareholders, having had the opportunity to consider other investment options, have chosen to invest in the Portfolio.
The factors that figured prominently in the Board’s decision to approve the continuation of each of the Advisory Agreements during its December 6–7, 2022 meeting are summarized in more detail below.
Nature, Extent and Quality of Services Provided by New York Life Investments and Winslow Capital
The Board examined the nature, extent and quality of the services that New York Life Investments provides to the Portfolio. The Board evaluated New York Life Investments’ experience and capabilities in serving as manager of the Portfolio and considered that the Portfolio operates in a “manager-of-managers” structure. The Board also considered New York Life Investments’ responsibilities and services provided pursuant to this structure, including overseeing the services provided by Winslow Capital, evaluating the performance of Winslow Capital, making recommendations to the Board as to whether the Subadvisory Agreement should be renewed, modified or terminated and periodically reporting to the Board regarding the results of New York Life Investments’ evaluation and monitoring functions. The Board noted that New York Life Investments manages other mutual funds, serves a variety of other investment advisory clients, including other pooled investment vehicles, and has experience overseeing mutual fund service providers, including subadvisors. The Board considered the experience of senior personnel at New York Life Investments providing management and administrative and other non-advisory services to the Portfolio. The Board observed that New York Life Investments devotes significant resources and time to providing management and administrative and other non-advisory services to the Portfolio, including New York Life Investments’ oversight and due diligence reviews of Winslow Capital and ongoing analysis of, and interactions with, Winslow Capital with respect to, among other things, the Portfolio’s investment performance and risks as well as Winslow Capital’s investment capabilities and subadvisory services with respect to the Portfolio.
The Board also considered the range of services that New York Life Investments provides to the Portfolio under the terms of the Management Agreement, including: (i) fund accounting and ongoing supervisory services provided by New York Life Investments’ Fund Administration and Accounting Group; (ii) investment supervisory and analytical services provided by New York Life Investments’ Investment Consulting Group; (iii) compliance services provided by the Trust’s Chief Compliance Officer as well as New York Life Investments’ compliance department, including supervision and implementation of the Portfolio’s compliance program; (iv) legal services provided by New York Life Investments’ Office of the General Counsel; and (v) risk management monitoring and analysis by compliance and investment personnel. In addition, the Board considered New York Life Investments’ willingness to invest in personnel and other resources, such as cyber security, information security and business continuity planning, designed to benefit the Portfolio and noted that New York Life Investments is responsible for compensating the Trust’s officers, except for a portion of the salary of the Trust’s Chief Compliance Officer. The Board recognized that New York Life Investments provides certain other non-advisory services to the Portfolio and has provided an increasingly broad array of non-advisory services to the MainStay Group of Funds as a result of regulatory and other developments, including in connection with the implementation of the MainStay Group of Funds’ derivatives risk management program and policies and procedures adopted pursuant to Rule 18f-4 under the 1940 Act.
The Board also examined the range, and the nature, extent and quality, of the investment advisory services that Winslow Capital provides to the Portfolio and considered the terms of each of the Advisory Agreements. The Board evaluated Winslow Capital’s experience and performance in serving as subadvisor to the Portfolio and advising other portfolios and Winslow Capital’s track record and experience in providing investment advisory services, the experience of investment advisory, senior management and administrative personnel at Winslow Capital. The Board considered New York Life Investments’ and Winslow Capital’s overall resources, legal and compliance environment, capabilities, reputation, financial condition and history. In addition to information provided in connection with quarterly meetings with the Trust’s Chief Compliance Officer, the Board considered information regarding the compliance policies and procedures of New York Life Investments and Winslow Capital and acknowledged their commitment to further developing and strengthening compliance programs relating to the Portfolio. The Board also considered Winslow Capital’s ability to recruit and retain qualified investment professionals and willingness to invest in personnel and other resources to service and support the Portfolio. In this regard, the Board considered the qualifications and experience of the Portfolio’s portfolio managers, the number of accounts managed by the portfolio managers and the method for compensating the portfolio managers.
In addition, the Board considered information provided by New York Life Investments and Winslow Capital regarding the operations of their respective business continuity plans in response to the COVID-19 pandemic and the continued remote work environment.
Board Consideration and Approval of Management Agreement and Subadvisory Agreement (Unaudited) (continued)
Based on these considerations, among others, the Board concluded that the Portfolio would likely continue to benefit from the nature, extent and quality of these services.
Investment Performance
In evaluating the Portfolio’s investment performance, the Board considered investment performance results over various periods in light of the Portfolio’s investment objective, strategies and risks. The Board considered investment reports on, and analysis of, the Portfolio’s performance provided to the Board throughout the year. These reports include, among other items, information on the Portfolio’s gross and net returns, the Portfolio’s investment performance compared to a relevant investment category and the Portfolio’s benchmarks, the Portfolio’s risk-adjusted investment performance and the Portfolio’s investment performance as compared to peer funds, as appropriate, as well as portfolio attribution information and commentary on the effect of market conditions. The Board also considered information provided by ISS showing the investment performance of the Portfolio as compared to peer funds. In addition, the Board reviewed the methodology used by ISS to construct the group of peer funds for comparative purposes.
The Board also took into account its discussions with senior management at New York Life Investments concerning the Portfolio’s investment performance over various periods as well as discussions between the Portfolio’s portfolio management team and the members of the Board’s Investment Committee, which generally occur on an annual basis. In addition, the Board considered any specific actions that New York Life Investments or Winslow Capital had taken, or had agreed to take, to seek to enhance Portfolio investment performance and the results of those actions.
Based on these considerations, among others, the Board concluded that its review of the Portfolio’s investment performance and related information supported a determination to approve the continuation of each of the Advisory Agreements.
Costs of the Services Provided, and Profits and Other Benefits Realized, by New York Life Investments and Winslow Capital
The Board considered the costs of the services provided under each of the Advisory Agreements. The Board also considered the profits realized by New York Life Investments and its affiliates and Winslow Capital due to their relationships with the Portfolio as well as by New York Life Investments and its affiliates due to their relationships with the MainStay Group of Funds. The Board considered information from New York Life Investments that Winslow Capital’s subadvisory fee reflected an arm’s-length negotiation and that this fee is paid by New York Life Investments, not the Portfolio, and the relevance of Winslow Capital’s profitability was considered by the Trustees in that context. On this basis, the Board primarily considered the costs and profitability for New York Life Investments and its affiliates with respect to the Portfolio.
In addition, the Board acknowledged the difficulty in obtaining reliable comparative data about mutual fund managers’ profitability because such information generally is not publicly available and may be impacted by numerous factors, including the structure of a fund manager’s organization, the types of funds it manages, the methodology used to allocate certain fixed costs to specific funds and the manager’s capital structure and costs of capital.
In evaluating the costs of the services provided by New York Life Investments and Winslow Capital and profits realized by New York Life Investments and its affiliates and Winslow Capital, the Board considered, among other factors, New York Life Investments’ and its affiliates’ and Winslow Capital’s continuing investments in, or willingness to invest in, personnel and other resources to support and further enhance the management of the Portfolio, and that New York Life Investments is responsible for paying the subadvisory fee for the Portfolio. The Board also considered the financial resources of New York Life Investments and Winslow Capital and acknowledged that New York Life Investments and Winslow Capital must be in a position to recruit and retain experienced professional personnel and to maintain a strong financial position for New York Life Investments and Winslow Capital to continue to provide high-quality services to the Portfolio. The Board recognized that the Portfolio benefits from the allocation of certain fixed costs among the funds in the MainStay Group of Funds, among other expected benefits resulting from its relationship with New York Life Investments.
The Board considered information regarding New York Life Investments’ methodology for calculating profitability and allocating costs provided by New York Life Investments in connection with the fund profitability analysis presented to the Board. The Board noted it had previously engaged an independent consultant to review the methods used to allocate costs among the funds in the MainStay Group of Funds. The Board also noted that the independent consultant had concluded that New York Life Investments’ methods for allocating costs and procedures for estimating overall profitability of the relationship with the funds in the MainStay Group of Funds are reasonable and that New York Life Investments continued to use the same method of calculating profit and allocating costs since the independent consultant’s review. The Board recognized the difficulty in calculating and evaluating a manager’s profitability with respect to the Portfolio and considered that other profitability methodologies may also be reasonable.
The Board also considered certain fall-out benefits that may be realized by New York Life Investments and its affiliates due to their relationships with the Portfolio, including reputational and other indirect benefits. The Board recognized, for example, the benefits to Winslow Capital from legally permitted “soft-dollar” arrangements by which brokers provide research and other services to Winslow Capital in exchange for commissions paid by the Portfolio with respect to trades in the Portfolio’s portfolio securities. In this regard, the Board also requested and considered information from New York Life Investments concerning other material business relationships between Winslow Capital and its affiliates and New York Life Investments and its affiliates. In addition, the Board considered its review of the management agreement for a money market
| 26 | MainStay VP Winslow Large Cap Growth Portfolio |
fund advised by New York Life Investments and an affiliated subadvisor that serves as an investment option for the Portfolio, including the potential rationale for and costs associated with investments in this money market fund by the Portfolio, if any, and considered information from New York Life Investments that the nature and type of specific investment advisory services provided to this money market fund are distinct from, or in addition to, the investment advisory services provided to the Portfolio. In addition, the Board considered the potential dividend received tax deduction for insurance company affiliates of New York Life Investments from the Portfolio’s securities lending activity.
The Board noted that the Portfolio serves as an investment option primarily under variable contracts issued by affiliates of New York Life Investments that would receive fees under those contracts. The Board observed that, in addition to fees earned by New York Life Investments under the Management Agreement for managing the Portfolio, New York Life Investments’ affiliates also earn revenues from serving the Portfolio in various other capacities, including as the Portfolio’s distributor. The Board considered information about these other revenues and their impact on the profitability of the relationship with the Portfolio to New York Life Investments and its affiliates. The Board noted that, although it assessed the overall profitability of the relationship with the Portfolio to New York Life Investments and its affiliates as part of the contract review process, when considering the reasonableness of the fee paid to New York Life Investments under the Management Agreement, the Board considered the profitability of New York Life Investments’ relationship with the Portfolio on a pre-tax basis and without regard to distribution expenses incurred by New York Life Investments from its own resources.
After evaluating the information deemed relevant by the Trustees, the Board concluded that any profits realized by New York Life Investments and its affiliates due to their relationships with the Portfolio were not excessive, other benefits that may accrue to New York Life Investments and its affiliates are reasonable and benefits that may accrue to Winslow Capital and its affiliates are consistent with those expected for a subadvisor to a mutual fund. With respect to Winslow Capital, the Board considered that any profits realized by Winslow Capital due to its relationship with the Portfolio are the result of arm’s-length negotiations between New York Life Investments and Winslow Capital, acknowledging that any such profits are based on the subadvisory fee paid to Winslow Capital by New York Life Investments, not the Portfolio.
Management and Subadvisory Fees and Total Ordinary Operating Expenses
The Board evaluated the reasonableness of the fee paid under each of the Advisory Agreements and the Portfolio’s total ordinary operating expenses. The Board primarily considered the reasonableness of the management fee paid by the Portfolio to New York Life Investments because the subadvisory fee paid to Winslow Capital is paid by New York Life Investments, not the Portfolio. The Board also considered the reasonableness of the subadvisory fee paid by New York Life Investments and the amount of the management fee retained by New York Life Investments.
In assessing the reasonableness of the Portfolio’s fees and expenses, the Board primarily considered comparative data provided by ISS on the fees and expenses charged by similar mutual funds managed by other investment advisers. The Board reviewed the methodology used by ISS to construct the group of peer funds for comparative purposes. In addition, the Board considered information provided by New York Life Investments and Winslow Capital on fees charged to other investment advisory clients, including institutional separate accounts and/or other funds that follow investment strategies similar to those of the Portfolio, if any. The Board considered the contractual management fee schedules of the Portfolio as compared to those of such other investment advisory clients, taking into account the rationale for any differences in fee schedules. The Board also took into account information provided by New York Life Investments about the more extensive scope of services provided to registered investment companies, such as the Portfolio, as compared with other investment advisory clients. Additionally, the Board considered the impact of contractual breakpoints and voluntary waivers on the Portfolio’s net management fee and expenses. The Board also considered that in proposing fees for the Portfolio, New York Life Investments considers the competitive marketplace for mutual funds. The Board considered its discussions with representatives from New York Life Investments regarding the management fee paid by the Portfolio.
Based on the factors outlined above, among other considerations, the Board concluded that the Portfolio’s management fee and total ordinary operating expenses are within a range that is competitive and support a conclusion that these fees and expenses are reasonable.
Economies of Scale
The Board considered information regarding economies of scale, including whether economies of scale may exist for the Portfolio and whether the Portfolio’s expense structure permits any economies of scale to be appropriately shared with the Portfolio’s beneficial shareholders. The Board also considered a report from New York Life Investments, previously prepared at the request of the Board, that addressed economies of scale, including with respect to the mutual fund business generally, and the various ways in which the benefits of economies of scale may be shared with the funds in the MainStay Group of Funds. Although the Board recognized the difficulty of determining economies of scale with precision, the Board acknowledged that economies of scale may be shared with the Portfolio in a number of ways, including, for example, through the imposition of fee breakpoints, initially setting management fee rates at scale or making additional investments to enhance the services provided to the Portfolio. The Board reviewed information from New York Life Investments showing how the Portfolio’s management fee schedule compared to fee schedules of other funds and accounts managed by New York Life Investments. The Board also reviewed information from ISS showing how the Portfolio’s management fee schedule compared with fees paid for similar services by peer funds at varying asset levels.
Board Consideration and Approval of Management Agreement and Subadvisory Agreement (Unaudited) (continued)
Based on this information, the Board concluded that economies of scale are appropriately reflected for the benefit of the Portfolio’s beneficial shareholders through the Portfolio’s expense structure and other methods to share benefits from economies of scale.
Conclusion
On the basis of the information and factors summarized above, among other information and factors deemed relevant by the Trustees, and the evaluation thereof, the Board unanimously voted to approve the continuation of each of the Advisory Agreements.
| 28 | MainStay VP Winslow Large Cap Growth Portfolio |
Proxy Voting Policies and Procedures and Proxy Voting Record
The Portfolio is required to file with the SEC its proxy voting record for the 12-month period ending June 30 on Form N-PX. A description of the policies and procedures that are used to vote proxies relating to portfolio securities of the Portfolio is available free of charge upon request by calling 800-598-2019 or visiting the SEC's website at www.sec.gov. The most recent Form N-PX or proxy voting record is available free of charge upon request by calling 800-598-2019; visiting https://www.newyorklifeinvestments.com/investment-products/vp; or visiting the SEC’s website at www.sec.gov.
Shareholder Reports and Quarterly Portfolio Disclosure
The Portfolio is required to file its complete schedule of portfolio holdings with the SEC 60 days after its first and third fiscal quarter on Form N-PORT. The Portfolio's holdings report is available free of charge upon request by calling 800-598-2019 or by visiting the SEC’s website at www.sec.gov.
Board of Trustees and Officers (Unaudited)
The Trustees and officers of the Portfolio are listed below. The Board oversees the MainStay Group of Funds (which consists of MainStay Funds and MainStay Funds Trust), MainStay VP Funds Trust, MainStay MacKay DefinedTerm Municipal Opportunities Fund, MainStay CBRE Global Infrastructure Megatrends Fund, the Manager and the Subadvisors, and elects the officers of the Portfolios who are responsible for the day-to-day operations of the Portfolio. Information pertaining to the Trustees and officers is set forth below. Each Trustee serves until his or her successor
is elected and qualified or until his or her resignation, death or removal. Under the Board’s retirement policy, unless an exception is made, a Trustee must tender his or her resignation by the end of the calendar year during which he or she reaches the age of 75. The business address of each Trustee and officer listed below is 51 Madison Avenue, New York, New York 10010. None of the Trustees are “interested persons” (as defined by the 1940 Act and rules adopted by the SEC thereunder) of the Portfolio (“Independent Trustees”).
| | Name and
Year of Birth | Term of Office,
Position(s) Held and
Length of Service | Principal Occupation(s)
During Past Five Years | Number of
Portfolios in
Fund Complex
Overseen by
Trustee | Other Directorships
Held by Trustee |
| | | | | | |
| | David H. Chow
1957 | MainStay VP Funds Trust: Trustee since January 2016, Advisory Board Member (June 2015 to December 2015) | Founder and CEO, DanCourt Management, LLC since 1999 | 78 | MainStay Funds: Trustee since January 2016, Advisory Board Member (June 2015 to December 2015) (12 Funds);
MainStay Funds Trust: Trustee since January 2016, Advisory Board Member (June 2015 to December 2015) (33 Funds);
MainStay MacKay DefinedTerm Municipal Opportunities Fund: Trustee since January 2016, Advisory Board Member (June 2015 to December 2015);
MainStay CBRE Global Infrastructure Megatrends Fund: Trustee since June 2021;VanEck Vectors Group of Exchange-Traded Funds: Independent Chairman of the Board of Trustees since 2008 and Trustee since 2006 (57 portfolios); and Berea College of Kentucky: Trustee since 2009, Chair of the Committee since 2018 |
| | Susan B. Kerley
1951 | MainStay VP Funds Trust: Chairman since 2017 and Trustee since 2007* | President, Strategic Management Advisors LLC since 1990 | 78 | MainStay Funds: Chairman since 2017 and Trustee since 2007 (12 Funds); MainStay Funds Trust: Chairman since 2017 and Trustee since 1990 (33 Funds)**;
MainStay MacKay DefinedTerm Municipal Opportunities Fund: Chairman since 2017 and Trustee since 2011; MainStay CBRE Global Infrastructure Megatrends Fund: Trustee since June 2021; and Legg Mason Partners Funds: Trustee since 1991 (45 portfolios) |
| | Alan R. Latshaw
1951 | MainStay VP Funds Trust: Trustee since 2007* | Retired; Partner, Ernst & Young LLP (2002 to 2003); Partner, Arthur Andersen LLP (1989 to 2002); Consultant to the MainStay Funds Audit and Compliance Committee (2004 to 2006) | 78 | MainStay Funds: Trustee since 2006 (12 Funds);
MainStay Funds Trust: Trustee since 2007 (33 Funds)**;
MainStay MacKay DefinedTerm Municipal Opportunities Fund: Trustee since 2011; and
MainStay CBRE Global Infrastructure Megatrends Fund: Trustee since June 2021 |
| 30 | MainStay VP Winslow Large Cap Growth Portfolio |
| | Name and
Year of Birth | Term of Office,
Position(s) Held and
Length of Service | Principal Occupation(s)
During Past Five Years | Number of
Portfolios in
Fund Complex
Overseen by
Trustee | Other Directorships
Held by Trustee |
| | | | | | |
| | Karen Hammond
1956 | MainStay VP Funds Trust: Trustee since December 2021, Advisory Board Member (June 2021 to December 2021)
| Retired, Managing Director, Devonshire Investors (2007 to 2013); Senior Vice President, Fidelity Management & Research Co. (2005 to 2007); Senior Vice President and Corporate Treasurer, FMR Corp. (2003 to 2005); Chief Operating Officer, Fidelity Investments Japan (2001 to 2003) | 78 | MainStay Funds: Trustee since December 2021, Advisory Board Member (June 2021 to December 2021) (12 Funds);
MainStay Funds Trust: Trustee since December 2021, Advisory Board Member (June 2021 to December 2021) (33 Funds);
MainStay MacKay DefinedTerm Municipal Opportunities Fund: Trustee since December 2021, Advisory Board Member (June 2021 to December 2021);
MainStay CBRE Global Infrastructure Megatrends Fund: Trustee since December 2021, Advisory Board Member (June 2021 to December 2021);
Two Harbors Investment Corp.: Director since 2018; Rhode Island State Investment Commission: Member since 2017; and Blue Cross Blue Shield of Rhode Island: Director since 2019
|
| | Jacques P. Perold
1958 | MainStay VP Funds Trust: Trustee since January 2016, Advisory Board Member (June 2015 to December 2015) | Founder and Chief Executive Officer, CapShift Advisors LLC (since 2018); President, Fidelity Management & Research Company (2009 to 2014); President and Chief Investment Officer, Geode Capital Management, LLC (2001 to 2009) | 78 | MainStay Funds: Trustee since January 2016, Advisory Board Member (June 2015 to December 2015) (12 Funds);
MainStay Funds Trust: Trustee since January 2016, Advisory Board Member (June 2015 to December 2015) (33 Funds); MainStay MacKay DefinedTerm Municipal Opportunities Fund: Trustee since January 2016, Advisory Board Member (June 2015 to December 2015);
MainStay CBRE Global Infrastructure Megatrends Fund: Trustee since June 2021; Allstate Corporation: Director since 2015;
Partners in Health: Trustee since 2019; and
MSCI Inc.: Director since 2017 |
| | Richard S. Trutanic
1952 | MainStay VP Funds Trust: Trustee since 2007* | Chairman and Chief Executive Officer, Somerset & Company (financial advisory firm) since 2004; Managing Director, The Carlyle Group (private investment firm) (2002 to 2004); Senior Managing Director, Partner and Board Member, Groupe Arnault S.A. (private investment firm) (1999 to 2002)
| 78 | MainStay Funds: Trustee since 1994 (12 Funds);
MainStay Funds Trust: Trustee since 2007 (33 Funds)**;
MainStay MacKay DefinedTerm Municipal Opportunities Fund: Trustee since 2011; and
MainStay CBRE Global Infrastructure Megatrends Fund: Trustee since June 2021 |
| * | Includes prior service as a Director of MainStay VP Series Fund, Inc., the predecessor to MainStay VP Funds Trust. |
| ** | Includes prior service as a Director/Trustee of certain predecessor entities to MainStay Funds Trust. |
Board of Trustees and Officers (Unaudited) (continued)
| | Name and
Year of Birth | Position(s) Held and
Length of Service | Principal Occupation(s)
During Past Five Years | |
| | | | | |
| | Kirk C. Lehneis
1974 | President, MainStay VP Funds Trust (since 2017) | Chief Operating Officer and Senior Managing Director (since 2016), New York Life Investment Management LLC and New York Life Investment Management Holdings LLC; Member of the Board of Managers (since 2017) and Senior Managing Director (since 2018), NYLIFE Distributors LLC; Chairman of the Board and Senior Managing Director, NYLIM Service Company LLC (since 2017); Trustee, President and Principal Executive Officer of IndexIQ Trust, IndexIQ ETF Trust and IndexIQ Active ETF Trust (since January 2018); President, MainStay CBRE Global Infrastructure Megatrends Fund (since 2021), MainStay MacKay DefinedTerm Municipal Opportunities Fund, MainStay Funds and MainStay Funds Trust (since 2017); Senior Managing Director, Global Product Development (from 2015-2016); Managing Director, Product Development (from 2010-2015), New York Life Investment Management LLC | |
| | Jack R. Benintende
1964 | Treasurer and Principal Financial and Accounting Officer, MainStay VP Funds Trust (since 2007)** | Managing Director, New York Life Investment Management LLC (since 2007); Treasurer and Principal Financial and Accounting Officer, MainStay CBRE Global Infrastructure Megatrends Fund (since 2021), MainStay MacKay DefinedTerm Municipal Opportunities Fund (since 2011), MainStay Funds Trust (since 2009) and MainStay Funds (since 2007); and Assistant Treasurer, New York Life Investment Management Holdings LLC (2008 to 2012) | |
| | J. Kevin Gao
1967 | Secretary and Chief Legal Officer, MainStay VP Funds Trust (since 2010)** | Managing Director and Associate General Counsel, New York Life Investment Management LLC (since 2010); Secretary and Chief Legal Officer, MainStay CBRE Global Infrastructure Megatrends Fund (since 2021), MainStay MacKay DefinedTerm Municipal Opportunities Fund (since 2011), MainStay Funds and MainStay Funds Trust (since 2010) | |
| | Scott T. Harrington
1959 | Vice President— Administration, MainStay VP Funds Trust (since 2005)** | Managing Director, New York Life Investment Management LLC (including predecessor advisory organizations) (since 2000); Member of the Board of Directors, New York Life Trust Company (since 2009); Vice President—Administration, MainStay CBRE Global Infrastructure Megatrends Fund (since 2021), MainStay MacKay DefinedTerm Municipal Opportunities Fund (since 2011), MainStay Funds Trust and MainStay Funds (since 2009) | |
| | Kevin M. Gleason
1967 | Vice President and Chief Compliance Officer, MainStay VP Funds Trust (since June 2022) | Vice President and Chief Compliance Officer, IndexIQ, IndexIQ ETF Trust and Index IQ Active ETF Trust (since June 2022); Vice President and Chief Compliance Officer, MainStay CBRE Global Infrastructure Megatrends Fund, MainStay MacKay DefinedTerm Municipal Opportunities Fund (since June 2022); MainStay Funds Trust and MainStay Funds (since June 2022); Senior Vice President, Voya Investment Management and Chief Compliance Officer, Voya Family of Funds (2012-2022) | |
| * | The officers listed above are considered to be “interested persons” of the MainStay Group of Funds, MainStay VP Funds Trust, MainStay CBRE Global Infrastructure Megatrends Fund and MainStay MacKay DefinedTerm Municipal Opportunities Fund within the meaning of the 1940 Act because of their affiliation with the MainStay Group of Funds, New York Life Insurance Company and/or its affiliates, including New York Life Investment Management LLC, NYLIM Service Company LLC, NYLIFE Securities LLC and/or NYLIFE Distributors LLC, as described in detail in the column captioned “Principal Occupation(s) During Past Five Years.” Officers are elected annually by the Board. |
| ** | Includes prior service as an Officer of MainStay VP Series Fund, Inc., the predecessor to MainStay VP Funds Trust. |
Officers of the Trust (Who are not Trustees)*
| 32 | MainStay VP Winslow Large Cap Growth Portfolio |
This page intentionally left blank
This page intentionally left blank.
MainStay VP Portfolios
MainStay VP offers a wide range of Portfolios. The full array of MainStay VP offerings is listed here, with information about the manager, subadvisors, legal counsel, and independent registered public accounting firm.
Equity
MainStay VP American Century Sustainable Equity Portfolio1
MainStay VP Candriam Emerging Markets Equity Portfolio
MainStay VP Epoch U.S. Equity Yield Portfolio
MainStay VP Fidelity Institutional AM® Utilities Portfolio†
MainStay VP MacKay International Equity Portfolio
MainStay VP Natural Resources Portfolio
MainStay VP S&P 500 Index Portfolio2
MainStay VP Small Cap Growth Portfolio
MainStay VP Wellington Growth Portfolio
MainStay VP Wellington Mid Cap Portfolio
MainStay VP Wellington Small Cap Portfolio
MainStay VP Wellington U.S. Equity Portfolio
MainStay VP Winslow Large Cap Growth Portfolio
Mixed Asset
MainStay VP Balanced Portfolio
MainStay VP Income Builder Portfolio
MainStay VP Janus Henderson Balanced Portfolio
MainStay VP MacKay Convertible Portfolio
Income
MainStay VP Bond Portfolio
MainStay VP Floating Rate Portfolio
MainStay VP Indexed Bond Portfolio
MainStay VP MacKay Government Portfolio
MainStay VP MacKay High Yield Corporate Bond Portfolio
MainStay VP MacKay Strategic Bond Portfolio
MainStay VP PIMCO Real Return Portfolio
Money Market
MainStay VP U.S. Government Money Market Portfolio
Alternative
MainStay VP CBRE Global Infrastructure Portfolio
MainStay VP IQ Hedge Multi-Strategy Portfolio
Asset Allocation
MainStay VP Conservative Allocation Portfolio
MainStay VP Equity Allocation Portfolio
MainStay VP Growth Allocation Portfolio
MainStay VP Moderate Allocation Portfolio
Manager
New York Life Investment Management LLC
New York, New York
Subadvisors
American Century Investment Management, Inc.
Kansas City, Missouri
Brown Advisory LLC
Baltimore, Maryland
Candriam*
Strassen, Luxembourg
CBRE Investment Management Listed Real Assets LLC
Radnor, Pennsylvania
Epoch Investment Partners, Inc.
New York, New York
FIAM LLC
Smithfield, Rhode Island
IndexIQ Advisors LLC*
New York, New York
Janus Henderson Investors US LLC
Denver, Colorado
MacKay Shields LLC*
New York, New York
Newton Investment Management North America, LLC
Boston, Massachusetts
NYL Investors LLC*
New York, New York
Pacific Investment Management Company LLC
Newport Beach, California
Segall Bryant & Hamill, LLC
Chicago, Illinois
Wellington Management Company LLP
Boston, Massachusetts
Winslow Capital Management, LLC
Minneapolis, Minnesota
Legal Counsel
Dechert LLP
Washington, District of Columbia
Independent Registered Public Accounting Firm
PricewaterhouseCoopers LLP
New York, New York
Distributor
NYLIFE Distributors LLC*
Jersey City, New Jersey
Custodian
JPMorgan Chase Bank, N.A.
New York, New York
Some Portfolios may not be available in all products.
† Fidelity Institutional AM is a registered trade mark of FMR LLC. Used with permission.
* An affiliate of New York Life Investment Management LLC.
| 1. | Prior to May 1, 2022, the Portfolio's name was MainStay VP T. Rowe Price Equity Income Portfolio. |
| 2. | Prior to May 1, 2022, the Portfolio's name was MainStay VP MacKay S&P 500 Index Portfolio. |
Not part of the Annual Report
2022 Annual Report
This report is for the general information of New York Life Variable Annuities and NYLIAC Variable Universal Life Insurance Products policyowners. It must be preceded or accompanied by the appropriate product(s) and funds prospectuses if it is given to anyone who is not an owner of a New York Life variable annuity policy or a NYLIAC Variable Universal Life Insurance Product. This report does not offer for sale or solicit orders to purchase securities.
The performance data quoted in this report represents past performance. Past performance is no guarantee of future results. Due to market volatility and other factors, current performance may be lower or higher than the figures shown. The most recent month-end performance summary for your variable annuity or variable life policy is available by calling 800-598-2019 and is updated periodically on newyorklife.com.
The New York Life Variable Annuities and NYLIAC Variable Universal Life Insurance Products are issued by New York Life Insurance and Annuity Corporation (a Delaware Corporation) and distributed by NYLIFE Distributors LLC (Member FINRA/SIPC).
New York Life Insurance Company
New York Life Insurance and Annuity
Corporation (NYLIAC) (A Delaware Corporation)
51 Madison Avenue, Room 551
New York, NY 10010
newyorklife.com
newyorklifeinvestments.com
NYLIFE Distributors LLC, 30 Hudson Street, Jersey City, NJ 07302
New York Life Investment Management LLC is the investment manager to the MainStay VP Funds Trust
©2023 by NYLIFE Distributors LLC. All rights reserved.
You may obtain copies of the Prospectus and the Statement of Additional Information free of charge, upon request, by calling toll-free 800-598-2019 or writing to New York Life Insurance and Annuity Corporation, 51 Madison Avenue, New York, NY 10010.
| Not FDIC Insured | No Bank Guarantee | May Lose Value |
(NYLIAC) NI525
MainStay VP Wellington Mid Cap Portfolio
Message from the President and Annual Report
December 31, 2022
Sign up for e-delivery of your shareholder reports. For full details on e-delivery, including who can participate and what you can receive via e-delivery,
please log in to newyorklifeinvestments.com/accounts.
| Not FDIC/NCUA Insured | Not a Deposit | May Lose Value | No Bank Guarantee | Not Insured by Any Government Agency |
This page intentionally left blank
Message from the President
The 12-month reporting period ended December 31, 2022, proved exceptionally challenging for investors as both stock and bond markets suffered steep declines. A variety of economic and geopolitical forces drove the market’s losses, all centered around rising inflation and monetary efforts to rein it in.
Inflationary alarms began to sound well before the reporting period began. In late 2021, after nearly two years of accommodative policies designed to encourage economic growth in the face of the COVID-19 pandemic, the U.S. Federal Reserve (the “Fed”) warned of the increasing need to tighten monetary policy. Nevertheless, the pace and persistence of inflation in early 2022 caught most market participants—the Fed included—off guard. Russia’s invasion of Ukraine in February exacerbated global inflationary pressures while increasing investor uncertainty. Domestic supply shortages, international trade imbalances and rising inflation caused U.S. GDP (gross domestic product) to contract in the first and second quarters of the year, although employment and consumer spending proved resilient. Prices for petroleum surged to multi-year highs, while many key agricultural chemicals and industrial metals soared as well. Accelerating inflationary forces prompted the Fed to implement its most aggressive series of interest rate hikes since the 1980s, with a 0.25% increase in March followed by six further rate increases totaling 4.25%. International central banks generally followed suit and raised rates by varying degrees in efforts to curb local inflation, although most increases remained significantly more modest than those in the United States. Relatively high U.S. interest rates and an international risk averse sentiment pushed U.S. dollar values higher compared to most other currencies, with negative impacts on global prices for food, fuel and other key U.S.-dollar-denominated products.
The effects of these interrelated challenges were felt throughout U.S. and international financial markets. The S&P 500® Index, a widely regarded benchmark of market performance, declined by more than 18% during the reporting period. Although the energy sector generated strong gains, bolstered by elevated oil and gas prices, most other industry segments recorded losses. The more cyclical and growth-oriented sectors of consumer discretionary, information technology and real estate delivered the weakest returns, while the traditionally defensive and value-oriented
consumer staples, utilities and health care sectors outperformed. On average, international developed-country equity markets mildly outperformed their U.S. counterparts, while emerging markets lagged slightly. Fixed-income markets proved unusually volatile, with bond prices trending sharply lower as yields rose along with interest rates. Short-term yields rose faster than long-term yields, producing a yield curve inversion from July through the end of the reporting period as long-term rates remained below short-term rates. While floating-rate instruments, which feature variable interest rates that allow investors to benefit from a rising rate environment, provided a degree of insulation from inflation-driven trends, they were not immune to the market’s widespread declines.
Although, according to the most recent estimates, the annualized inflation rate in the United States has declined from a peak of 9.1% in July 2022 to 6.5% in December, the Fed remains focused on achieving more substantial and lasting reductions, aiming for a target rate of 2%. As a result, further rate hikes and additional market volatility are potential headwinds in the coming months. The question remains as to whether the Fed and other central banks will manage a so-called “soft landing,” curbing inflation while avoiding a persistent economic slowdown. If they prove successful, we believe that the increasingly attractive valuations we have observed in both equity and bond markets should eventually translate into sustainable improvements in the investment environment.
Whatever actions the Fed takes and however financial markets react, as a MainStay VP investor you can depend on us to continue managing our portfolios with the insight, expertise and level of service that have long defined New York Life Investments. Thank you for trusting us to help you meet your investment needs.
Sincerely,
Kirk C. Lehneis
President
The opinions expressed are as of the date of this report and are subject to change. There is no guarantee that any forecast made will come to pass. This material does not constitute investment advice and is not intended as an endorsement of any specific investment. Past performance is no guarantee of future results.
Not part of the Annual Report
Investors should refer to the Portfolio’s Summary Prospectus and/or Prospectus and consider the Portfolio’s investment objectives, strategies, risks, charges and expenses carefully before investing. The Summary Prospectus and/or Prospectus contain this and other information about the Portfolio. You may obtain copies of the Portfolio’s Summary Prospectus, Prospectus and Statement of Additional Information, which includes information about the MainStay VP Funds Trust's Trustees, free of charge, upon request, by calling toll-free 800-598-2019, by writing to New York Life Insurance and Annuity Corporation, 51 Madison Avenue, Room 251, New York, New York 10010 or by sending an email to MainStayShareholdersServices@nylim.com. These documents are also available at newyorklifeinvestments.com/investment-products/vp. Please read the Portfolio's Summary Prospectus and/or Prospectus carefully before investing. MainStay VP Funds Trust portfolios are separate account options which are purchased through a variable insurance or variable annuity contract.
Investment and Performance Comparison (Unaudited)
Performance data quoted represents past performance. Past performance is no guarantee of future results. Because of market volatility and other factors, current performance may be lower or higher than the figures shown. Investment return and principal value will fluctuate, and as a result, when shares are redeemed, they may be worth more or less than their original cost. The performance table and graph do not reflect any deduction of sales charges, mortality and expense charges, contract charges or administrative charges. Please refer to the Performance Summary appropriate for your policy. For performance information current to the most recent month-end, please call 800-598-2019 or visit www.newyorklife.com.
Performance figures may reflect certain fee waivers and/or expense limitations, without which total returns may have been different. For information on current fee waivers and/or expense limitations (if any), please refer to the Notes to Financial Statements.
| Average Annual Total Returns for the Year-Ended December 31, 2022 |
| Class | Inception
Date1, 2 | One
Year | Five
Years | Ten
Years | Gross
Expense
Ratio3 |
| Initial Class Shares | 7/2/2001 | -20.52% | 2.80% | 9.07% | 0.89% |
| Service Class Shares | 6/5/2003 | -20.71 | 2.54 | 8.79 | 1.14 |
| 1. | Effective January 1, 2018, due to an organizational restructuring whereby all investment personnel of Cornerstone Capital Management Holdings LLC, the former subadvisor, transitioned to MacKay Shields LLC. |
| 2. | Effective May 1, 2021, the Portfolio replaced its subadvisor and modified its principal investment strategies. The past performance in the chart and table prior to that date reflects the Portfolio’s prior subadvisors and principal investment strategies. |
| 3. | The gross expense ratios presented reflect the Portfolio’s “Total Annual Portfolio Operating Expenses” from the most recent Prospectus, as supplemented, and may differ from other expense ratios disclosed in this report. |
| Benchmark Performance* | One
Year | Five
Years | Ten
Years |
| Russell Midcap® Index1 | -17.32% | 7.10% | 10.96% |
| S&P MidCap 400® Index2 | -13.06 | 6.71 | 10.78 |
| Morningstar Mid-Cap Blend Category Average3 | -14.14 | 5.84 | 9.24 |
| * | Returns for indices reflect no deductions for fees, expenses or taxes, except for foreign withholding taxes where applicable. Results assume reinvestment of all dividends and capital gains. An investment cannot be made directly in an index. |
| 1. | The Russell Midcap® Index is the Portfolio's primary benchmark. The Russell Midcap® Index measures the performance of the mid-cap segment of the U.S. equity universe. The Russell Midcap® Index is a subset of the Russell 1000® Index and it includes approximately 800 of the smallest companies based on a combination of their market cap and current index membership. The Russell Midcap® Index represents approximately 31% of the total market capitalization of the Russell 1000® Index companies. |
| 2. | The Portfolio has selected the S&P MidCap 400® Index as its secondary benchmark. The S&P MidCap 400® Index is a market capitalization-weighted index of common stocks representing the mid-cap U.S. equity market. |
| 3. | The Morningstar Mid-Cap Blend Category Average is representative of funds that invest primarily in U.S. stocks of various sizes and styles, giving it a middle-of-the-road profile. The U.S. mid-cap range for market capitalization typically falls between $1 billion and $8 billion and represents 20% of the total capitalization of the U.S. equity market. The blend style is assigned to funds where neither growth nor value characteristics predominate. Results are based on average total returns of similar funds with all dividends and capital gain distributions reinvested. |
Cost in Dollars of a $1,000 Investment in MainStay VP Wellington Mid Cap Portfolio (Unaudited)
The example below is intended to describe the fees and expenses borne by shareholders during the six-month period from July 1, 2022 to December 31, 2022, and the impact of those costs on your investment.
Example
As a shareholder of the Portfolio you incur two types of costs: (1) transaction costs, including exchange fees and sales charges (loads) on purchases (as applicable), and (2) ongoing costs, including management fees, distribution and/or service (12b-1) fees and other Portfolio expenses (as applicable). This example is intended to help you understand your ongoing costs (in dollars) of investing in the Portfolio and to compare these costs with the ongoing costs of investing in other mutual funds. The example is based on an investment of $1,000 made at the beginning of the six-month period and held for the entire period from July 1, 2022 to December 31, 2022. Shares are only sold in connection with variable life and annuity contracts and the example does not reflect any contract level or transactional fees or expenses. If these costs had been included, your costs would have been higher.
This example illustrates your Portfolio’s ongoing costs in two ways:
Actual Expenses
The second and third data columns in the table below provide information about actual account values and actual expenses. You may use the information in these columns, together with the amount you invested, to estimate the expenses that you paid during the six months ended
December 31, 2022. Simply divide your account value by $1,000 (for example, an $8,600 account value divided by $1,000 = 8.6), then multiply the result by the number under the heading entitled “Expenses Paid During Period” to estimate the expenses you paid on your account during this period.
Hypothetical Example for Comparison Purposes
The fourth and fifth data columns in the table below provide information about hypothetical account values and hypothetical expenses based on the Portfolio’s actual expense ratio and an assumed rate of return of 5% per year before expenses, which is not the Portfolio’s actual return. The hypothetical account values and expenses may not be used to estimate the actual ending account balances or expenses you paid for the six-month period shown. You may use this information to compare the ongoing costs of investing in the Portfolio with the ongoing costs of investing in other mutual funds. To do so, compare this 5% hypothetical example with the 5% hypothetical examples that appear in the shareholder reports of the other mutual funds.
Please note that the expenses shown in the table are meant to highlight your ongoing costs only and do not reflect any transactional costs, such as exchange fees or sales charges (loads). Therefore, the fourth and fifth data columns of the table are useful in comparing ongoing costs only and will not help you determine the relative total costs of owning different funds. In addition, if these transactional costs were included, your costs would have been higher.
| Share Class | Beginning
Account
Value
7/1/22 | Ending Account
Value (Based
on Actual
Returns and
Expenses)
12/31/22 | Expenses
Paid
During
Period1 | Ending Account
Value (Based
on Hypothetical
5% Annualized
Return and
Actual Expenses)
12/31/22 | Expenses
Paid
During
Period1 | Net Expense
Ratio
During
Period2 |
| Initial Class Shares | $1,000.00 | $1,046.90 | $4.44 | $1,020.87 | $4.38 | 0.86% |
| Service Class Shares | $1,000.00 | $1,045.60 | $5.72 | $1,019.61 | $5.65 | 1.11% |
| 1. | Expenses are equal to the Portfolio’s annualized expense ratio of each class multiplied by the average account value over the period, divided by 365 and multiplied by 184 (to reflect the six-month period). The table above represents the actual expenses incurred during the six-month period. In addition to the fees and expenses which the Portfolio bears directly, it also indirectly bears a pro rata share of the fees and expenses of the underlying funds in which it invests. Such indirect expenses are not included in the above-reported expense figures. |
| 2. | Expenses are equal to the Portfolio's annualized expense ratio to reflect the six-month period. |
| 6 | MainStay VP Wellington Mid Cap Portfolio |
Industry Composition as of December 31, 2022 (Unaudited)
| Machinery | 8.6% |
| Insurance | 6.6 |
| Banks | 6.1 |
| Oil, Gas & Consumable Fuels | 6.0 |
| IT Services | 5.0 |
| Biotechnology | 4.9 |
| Chemicals | 4.4 |
| Health Care Equipment & Supplies | 4.3 |
| Software | 3.0 |
| Communications Equipment | 3.0 |
| Equity Real Estate Investment Trusts | 3.0 |
| Building Products | 2.8 |
| Electronic Equipment, Instruments & Components | 2.7 |
| Road & Rail | 2.6 |
| Professional Services | 2.4 |
| Household Durables | 2.4 |
| Aerospace & Defense | 2.1 |
| Life Sciences Tools & Services | 2.1 |
| Semiconductors & Semiconductor Equipment | 2.1 |
| Hotels, Restaurants & Leisure | 2.0 |
| Containers & Packaging | 2.0 |
| Health Care Providers & Services | 1.8 |
| Internet & Direct Marketing Retail | 1.7 |
| Trading Companies & Distributors | 1.5% |
| Textiles, Apparel & Luxury Goods | 1.5 |
| Pharmaceuticals | 1.5 |
| Air Freight & Logistics | 1.4 |
| Specialty Retail | 1.3 |
| Consumer Finance | 1.3 |
| Auto Components | 1.3 |
| Food & Staples Retailing | 1.2 |
| Commercial Services & Supplies | 1.1 |
| Metals & Mining | 1.1 |
| Diversified Financial Services | 1.0 |
| Multi–Utilities | 1.0 |
| Leisure Products | 0.9 |
| Media | 0.6 |
| Interactive Media & Services | 0.6 |
| Gas Utilities | 0.5 |
| Capital Markets | 0.3 |
| Entertainment | 0.2 |
| Short–Term Investments | 0.9 |
| Other Assets, Less Liabilities | –0.8 |
| | 100.0% |
See Portfolio of Investments beginning on page 11 for specific holdings within these categories. The Portfolio's holdings are subject to change.
Top Ten Holdings and/or Issuers Held as of December 31, 2022 (excluding short-term investments) (Unaudited)
| 1. | Marathon Oil Corp. |
| 2. | Westinghouse Air Brake Technologies Corp. |
| 3. | FMC Corp. |
| 4. | Integra LifeSciences Holdings Corp. |
| 5. | F5, Inc. |
| 6. | United Therapeutics Corp. |
| 7. | Genpact Ltd. |
| 8. | NVR, Inc. |
| 9. | Jazz Pharmaceuticals plc |
| 10. | WEX, Inc. |
Portfolio Management Discussion and Analysis (Unaudited)
Answers to the questions reflect the views of portfolio managers Gregory J. Garabedian, Mark A. Whitaker, CFA, and Philip W. Ruedi, CFA, of Wellington Management Company LLP (“Wellington”), the Portfolio’s Subadvisor.
How did MainStay VP Wellington Mid Cap Portfolio perform relative to its benchmarks and peers during the 12 months ended December 31, 2022?
For the 12 months ended December 31, 2022, MainStay VP Wellington Mid Cap Portfolio returned −20.52% for Initial Class shares and −20.71% for Service Class shares. Over the same period, both share classes underperformed the −17.32% return of the Russell Midcap® Index, which is the Portfolio’s primary benchmark, and the −13.06% return of the S&P MidCap 400® Index, which is the Portfolio’s secondary benchmark. For the 12 months ended December 31, 2022, both share classes also underperformed the −14.14% return of the Morningstar Mid-Cap Blend Category Average.1
What factors affected the Portfolio’s relative performance during the reporting period?
The Portfolio underperformed the Russell Midcap® Index primarily due to sector allocation, a result of our bottom-up stock selection process. Specifically, underweight exposure to energy and utilities drove most of the Portfolio’s underperformance, while underweight exposure to real estate made a positive contribution to relative returns. (Contributions take weightings and total returns into account.)
Which sectors were the strongest positive contributors to the Portfolio’s relative performance, and which sectors were particularly weak?
During the reporting period, security selection in the consumer discretionary and information technology sectors weighed on results relative to the Russell Midcap® Index. This was partially offset by relatively strong returns from the financials and materials sectors.
The Portfolio employs two investment strategies with different investment styles: mid-cap opportunities and select mid-cap value. Each investment strategy has a distinct investment philosophy and analytical process to identify securities for purchase or sale. In the mid-cap opportunities portion of the Portfolio, security selection in information technology, consumer discretionary, and communication services detracted most from performance relative to the S&P MidCap 400® Index, the yardstick by which Wellington measures this strategy. Conversely, security selection in the materials and consumer staples sectors contributed positively to relative returns. Sector allocation, a result of our bottom-up stock selection process, also detracted from results. Allocation effect was driven by overweight exposure to information technology and health care, and underweight exposure to energy. The negative impact of these positions was
partially offset by the positive impact of underweight exposures to real estate and consumer discretionary.
The select mid-cap value portion of the Portfolio outperformed the Russell 2500™ Value Index2, the yardstick by which Wellington measures this strategy, primarily due to security selection. Strong selection in real estate, financials and health care was partially offset by relatively weak selection in information technology and communication services. Sector allocation detracted from relative performance, primarily due to underweight exposure to energy, lack of exposure to utilities and overweight exposure to information technology. These detractors were partially offset by the positive effects of underweight exposure to real estate and communication services.
During the reporting period, which individual stocks made the strongest positive contributions to the Portfolio’s absolute performance and which stocks detracted the most?
Mid-Cap Opportunities
For the mid-cap opportunities portion of the Portfolio, the strongest positive contributors to absolute performance during the reporting period included holdings in biotechnology developer United Therapeutics, steel producer Steel Dynamics and security technology company Axon Enterprise. Shares of United Therapeutics rose after the company received U.S. Food and Drug Administration approval for Tyvaso DPI, the first dry powder inhaler for the treatment of pulmonary arterial hypertension and pulmonary hypertension associated with interstitial lung disease. Shares of Steel Dynamics gained ground after the company reported third-quarter 2022 revenue and earnings above expectations, driven by better-than-expected sales in the steel fabrication segment. The company also announced a further $1.5 billion share repurchase program, additive to its previously announced $1.25 billion program, which had $245 million remaining as of September 30, 2022. Shares of Axon climbed after the company reported third-quarter 2022 earnings above expectations and raised its full-year outlook, citing robust demand for its mission-critical products.
The most significant detractors from the absolute performance of the mid-cap opportunities portion of the Portfolio were holdings in human interface semiconductor maker Synaptics, broadband communication provider Cable One and semiconductor manufacturer Coherent. Shares of Synaptics fell despite the company’s in-line fiscal fourth-quarter 2022 results. Management lowered revenue guidance below expectations as consumer-facing headwinds across mobile, PC and internet-of-things segments weighed on demand. Shares of Cable One declined after the company reported second-quarter 2022
| 1. | See page 5 for more information on benchmark and peer group returns. |
| 2. | The Russell 2500™ Value Index measures the performance of the small to mid-cap value segment of the U.S. equity universe. It includes those Russell 2500 companies with relatively lower price-to-book ratios, lower I/B/E/S forecast medium term (2 years) growth and lower sales per share historical growth (5 years). |
| 8 | MainStay VP Wellington Mid Cap Portfolio |
results that fell short of Wall Street expectations. Total revenue of $429.1 million was below consensus estimates of $435.3 million, and $227.5 million adjusted EBITDA (earnings before interest, taxes, depreciation and amortization) was below consensus estimates of $233.9 million. Coherent was acquired by semiconductor manufacturer II-VI in mid-2022, with the combined company adopting the Coherent name. Although the combined company reported solid fourth-quarter 2022 results, shares traded lower as the acquisition left the company with net debt of $4.2 billion. In addition, free cash flow was negatively impacted by inventory buildup and supply-chain shortages.
Select Mid-Cap Value
For the select mid-cap value portion of the Portfolio, the leading contributors to absolute performance included property & casualty reinsurer Alleghany, home construction company Lennar and life insurer Globe Life. Alleghany shares rose following the announcement that Berkshire Hathaway had offered to acquire all outstanding Alleghany shares at a price of $848.02 per share in cash, a 29% premium to the trailing 30-day average stock price at the time. The transaction was unanimously approved by both Boards of Directors. Lennar shares rebounded off 2022 lows, as near-term housing demand headwinds abated following a decline in the 10-year Treasury yield in July. Globe Life shares reached all-time highs as the company reported strong operating results, benefiting from higher interest rates and revenue growth from higher underwriting premiums.
The most significant detractors from the absolute performance of the select mid-cap value portion of the Portfolio included telecommunications equipment company Lumentum Holdings, regional bank Western Alliance Bancorporation, and manufacturing instrument and control systems maker MKS Instruments. Lumentum shares lost ground when the company reported disappointing fiscal first-quarter 2023 results and reduced its full-year guidance due to expectations that the ongoing semiconductor chip shortage would continue. Western Alliance Bancorp shares declined when the company reported lower-than-expected third-quarter 2022 earnings. Mortgage banking-related income declined $35 million as rising interest rates reduced refinancing activities and restrained affordability in the purchase market. MKS Instruments shares declined amid broad-based weakness in technology stocks due, in part, to widespread supply chain disruptions and demand weakness. Growing investor concern regarding the MKS acquisition of chemicals and equipment company Atotech also weighed on the share price.
Did the Portfolio make any significant purchases or sales during the reporting period?
Mid-Cap Opportunities
During the reporting period, the mid-cap opportunities portion of the Portfolio initiated a position in midstream energy company Targa Resources. We believe Targa trades at an attractive valuation that should benefit from the rising commodity price environment. The mid-cap opportunities portion of the Portfolio also added a position in oil & gas exploration & production company Marathon Oil. We believe that Marathon stands to benefit from an improved industry structure amid constrained oil & gas supply. The mid-cap opportunities portion of the Portfolio eliminated its position in Molina Healthcare, a managed care company that works with Medicaid and Medicare. While we think highly of the management team, we judged the company’s business quality as just average. The mid-cap opportunities portion of the Portfolio also eliminated its position in packaged foods company Lamb Weston due to volatile fundamentals.
Select Mid-Cap Value
The largest purchases within the select mid-cap value portion of the Portfolio were positions in Dutch multinational life insurer Aegon and contract research company Syneos Health. We believe Aegon offers idiosyncratic opportunities likely to drive increasing returns, including a defensive business model and balance sheet, as well as low exposure to interest rates and equity markets. Syneos shares appeared attractive, after declining in what we believed to be a market overreaction to the company’s reported second-quarter 2022 bookings—which came in below expectations—and slower decision-making from both biotech companies and large pharmaceutical companies. We held a differentiated view that Syneos’ pipeline was pushed instead of canceled, and we believe that steady win rates across both biotech and pharmaceutical companies have the potential to drive earnings upside. Significant sales within the select mid-cap value portion of the Portfolio tended to stem from strong performance, enabling the Portfolio to reallocate proceeds to more attractive investment opportunities. Examples include Alleghany and Tower Semiconductor, which both saw their shares rally during the reporting period.
How did the Portfolio’s sector weightings change during the reporting period?
During the reporting period, the most notable increases in relative sector exposures for the mid-cap opportunities portion of the Portfolio were to materials and energy, while the most notable reductions were to information technology and health care. The most notable increases in relative sector exposure for the select
mid-cap value portion of the Portfolio were to consumer discretionary and energy, while the most significant reductions were to financials and information technology.
How was the Portfolio positioned at the end of the reporting period?
As of December 31, 2022, the mid-cap opportunities portion of the Portfolio held its most overweight exposures relative to the Russell Midcap® Index to the health care and information technology sectors, while its most underweight exposures were to real estate and consumer staples. As of the same date, the select mid-cap value portion of the Portfolio held its most overweight exposures relative to the Russell 2500™ Value Index to industrials and information technology, while its most underweight exposures were to real estate and utilities.
The opinions expressed are those of the portfolio managers as of the date of this report and are subject to change. There is no guarantee that any forecasts will come to pass. This material does not constitute investment advice and is not intended as an endorsement of any specific investment.
Not all MainStay VP Portfolios and/or share classes are available under all policies.
| 10 | MainStay VP Wellington Mid Cap Portfolio |
Portfolio of Investments December 31, 2022†
| | Shares | Value |
| Common Stocks 99.9% |
| Aerospace & Defense 2.1% |
| Axon Enterprise, Inc. (a) | 60,473 | $ 10,034,285 |
| Spirit AeroSystems Holdings, Inc., Class A | 179,480 | 5,312,608 |
| | | 15,346,893 |
| Air Freight & Logistics 1.4% |
| CH Robinson Worldwide, Inc. | 52,677 | 4,823,106 |
| Expeditors International of Washington, Inc. | 49,826 | 5,177,918 |
| | | 10,001,024 |
| Auto Components 1.3% |
| Visteon Corp. (a) | 68,713 | 8,989,722 |
| Banks 6.1% |
| Cadence Bank | 248,544 | 6,129,095 |
| Cullen | 44,898 | 6,002,863 |
| First Citizens BancShares, Inc., Class A | 9,585 | 7,268,881 |
| First Republic Bank | 52,016 | 6,340,230 |
| M&T Bank Corp. | 45,619 | 6,617,492 |
| Prosperity Bancshares, Inc. | 73,072 | 5,310,873 |
| Western Alliance Bancorp | 100,079 | 5,960,705 |
| | | 43,630,139 |
| Biotechnology 4.9% |
| Alnylam Pharmaceuticals, Inc. (a) | 12,802 | 3,042,395 |
| Apellis Pharmaceuticals, Inc. (a) | 86,165 | 4,455,592 |
| Exact Sciences Corp. (a) | 60,739 | 3,007,188 |
| Neurocrine Biosciences, Inc. (a) | 34,356 | 4,103,481 |
| PTC Therapeutics, Inc. (a) | 101,229 | 3,863,911 |
| Sage Therapeutics, Inc. (a) | 58,998 | 2,250,184 |
| Ultragenyx Pharmaceutical, Inc. (a) | 73,316 | 3,396,730 |
| United Therapeutics Corp. (a) | 38,954 | 10,832,718 |
| | | 34,952,199 |
| Building Products 2.8% |
| Builders FirstSource, Inc. (a) | 145,459 | 9,437,380 |
| Fortune Brands Innovations, Inc. | 69,555 | 3,972,286 |
| Lennox International, Inc. | 28,923 | 6,919,249 |
| | | 20,328,915 |
| Capital Markets 0.3% |
| Hamilton Lane, Inc., Class A | 37,369 | 2,387,132 |
| Chemicals 4.4% |
| Celanese Corp. | 68,550 | 7,008,552 |
| Element Solutions, Inc. | 422,558 | 7,686,330 |
| FMC Corp. | 93,871 | 11,715,101 |
| | Shares | Value |
| |
| Chemicals (continued) |
| Valvoline, Inc. | 141,611 | $ 4,623,599 |
| | | 31,033,582 |
| Commercial Services & Supplies 1.1% |
| Clean Harbors, Inc. (a) | 49,270 | 5,622,693 |
| GFL Environmental, Inc. | 87,214 | 2,549,265 |
| | | 8,171,958 |
| Communications Equipment 3.0% |
| CommScope Holding Co., Inc. (a) | 132,420 | 973,287 |
| F5, Inc. (a) | 79,948 | 11,473,338 |
| Lumentum Holdings, Inc. (a) | 174,507 | 9,104,030 |
| | | 21,550,655 |
| Consumer Finance 1.3% |
| Credit Acceptance Corp. (a)(b) | 19,145 | 9,082,388 |
| Containers & Packaging 2.0% |
| Ball Corp. | 66,111 | 3,380,917 |
| Graphic Packaging Holding Co. | 133,966 | 2,980,743 |
| Silgan Holdings, Inc. | 147,169 | 7,629,241 |
| | | 13,990,901 |
| Diversified Financial Services 1.0% |
| Voya Financial, Inc. | 116,454 | 7,160,756 |
| Electronic Equipment, Instruments & Components 2.7% |
| CDW Corp. | 27,136 | 4,845,947 |
| Coherent Corp. (a) | 119,077 | 4,179,603 |
| Flex Ltd. (a) | 200,842 | 4,310,069 |
| National Instruments Corp. | 153,094 | 5,649,168 |
| | | 18,984,787 |
| Entertainment 0.2% |
| Roku, Inc. (a) | 33,498 | 1,363,368 |
| Equity Real Estate Investment Trusts 3.0% |
| Gaming and Leisure Properties, Inc. | 125,303 | 6,527,033 |
| Host Hotels & Resorts, Inc. | 132,054 | 2,119,467 |
| KRC Interim Corp. | 132,019 | 2,796,163 |
| Life Storage, Inc. | 30,178 | 2,972,533 |
| Rexford Industrial Realty, Inc. | 45,925 | 2,509,342 |
| Ryman Hospitality Properties, Inc. | 54,449 | 4,452,839 |
| | | 21,377,377 |
| Food & Staples Retailing 1.2% |
| BJ's Wholesale Club Holdings, Inc. (a) | 7,423 | 491,106 |
The notes to the financial statements are an integral part of, and should be read in conjunction with, the financial statements.
11
Portfolio of Investments December 31, 2022† (continued)
| | Shares | Value |
| Common Stocks (continued) |
| Food & Staples Retailing (continued) |
| U.S. Foods Holding Corp. (a) | 228,176 | $ 7,762,547 |
| | | 8,253,653 |
| Gas Utilities 0.5% |
| UGI Corp. | 95,060 | 3,523,874 |
| Health Care Equipment & Supplies 4.3% |
| Inari Medical, Inc. (a) | 82,285 | 5,230,035 |
| Insulet Corp. (a) | 27,062 | 7,966,782 |
| Integra LifeSciences Holdings Corp. (a) | 206,013 | 11,551,149 |
| Teleflex, Inc. | 24,165 | 6,032,309 |
| | | 30,780,275 |
| Health Care Providers & Services 1.8% |
| Encompass Health Corp. | 104,092 | 6,225,743 |
| Molina Healthcare, Inc. (a) | 19,515 | 6,444,243 |
| | | 12,669,986 |
| Hotels, Restaurants & Leisure 2.0% |
| Choice Hotels International, Inc. | 61,307 | 6,905,621 |
| Denny's Corp. (a) | 400,833 | 3,691,672 |
| Hyatt Hotels Corp., Class A (a) | 39,363 | 3,560,383 |
| | | 14,157,676 |
| Household Durables 2.4% |
| Lennar Corp., Class A | 51,997 | 4,705,729 |
| NVR, Inc. (a) | 2,267 | 10,456,719 |
| Vizio Holding Corp., Class A (a)(b) | 219,486 | 1,626,391 |
| | | 16,788,839 |
| Insurance 6.6% |
| Aegon NV (Registered) | 1,570,189 | 7,913,753 |
| Fidelity National Financial, Inc. | 102,468 | 3,854,846 |
| Globe Life, Inc. | 42,207 | 5,088,054 |
| Hanover Insurance Group, Inc. (The) | 32,475 | 4,388,347 |
| Kemper Corp. | 170,156 | 8,371,675 |
| Markel Corp. (a) | 7,074 | 9,319,924 |
| W R Berkley Corp. | 56,718 | 4,116,025 |
| White Mountains Insurance Group Ltd. | 2,958 | 4,183,588 |
| | | 47,236,212 |
| Interactive Media & Services 0.6% |
| Cargurus, Inc. (a) | 289,940 | 4,062,059 |
| Internet & Direct Marketing Retail 1.7% |
| Chewy, Inc., Class A (a)(b) | 131,191 | 4,864,562 |
| | Shares | Value |
| |
| Internet & Direct Marketing Retail (continued) |
| Etsy, Inc. (a) | 60,320 | $ 7,225,130 |
| | | 12,089,692 |
| IT Services 5.0% |
| Genpact Ltd. | 226,094 | 10,472,674 |
| Nuvei Corp. (a)(b) | 85,414 | 2,170,370 |
| Shift4 Payments, Inc., Class A (a) | 124,130 | 6,942,591 |
| VeriSign, Inc. (a) | 26,869 | 5,519,967 |
| WEX, Inc. (a) | 63,832 | 10,446,107 |
| | | 35,551,709 |
| Leisure Products 0.9% |
| YETI Holdings, Inc. (a) | 151,204 | 6,246,237 |
| Life Sciences Tools & Services 2.1% |
| Bio-Techne Corp. | 60,527 | 5,016,478 |
| ICON plc (a) | 23,920 | 4,646,460 |
| Syneos Health, Inc. (a) | 149,201 | 5,472,692 |
| | | 15,135,630 |
| Machinery 8.6% |
| Esab Corp. | 88,086 | 4,132,995 |
| Graco, Inc. | 62,722 | 4,218,682 |
| IDEX Corp. | 45,364 | 10,357,962 |
| Ingersoll Rand, Inc. | 136,214 | 7,117,182 |
| John Bean Technologies Corp. | 49,483 | 4,519,282 |
| Lincoln Electric Holdings, Inc. | 38,253 | 5,527,176 |
| Middleby Corp. (The) (a) | 69,389 | 9,291,187 |
| Nordson Corp. | 17,120 | 4,069,766 |
| Westinghouse Air Brake Technologies Corp. | 123,199 | 12,296,492 |
| | | 61,530,724 |
| Media 0.6% |
| Cable One, Inc. | 6,458 | 4,597,192 |
| Metals & Mining 1.1% |
| Steel Dynamics, Inc. | 79,851 | 7,801,443 |
| Multi-Utilities 1.0% |
| Black Hills Corp. | 60,707 | 4,270,130 |
| NiSource, Inc. | 97,206 | 2,665,389 |
| | | 6,935,519 |
| Oil, Gas & Consumable Fuels 6.0% |
| Coterra Energy, Inc. | 208,565 | 5,124,442 |
| Diamondback Energy, Inc. | 35,585 | 4,867,316 |
| Marathon Oil Corp. | 471,095 | 12,752,542 |
The notes to the financial statements are an integral part of, and should be read in conjunction with, the financial statements.
| 12 | MainStay VP Wellington Mid Cap Portfolio |
| | Shares | Value |
| Common Stocks (continued) |
| Oil, Gas & Consumable Fuels (continued) |
| Ovintiv, Inc. | 121,611 | $ 6,166,894 |
| PDC Energy, Inc. | 86,502 | 5,491,147 |
| Targa Resources Corp. | 114,930 | 8,447,355 |
| | | 42,849,696 |
| Pharmaceuticals 1.5% |
| Jazz Pharmaceuticals plc (a) | 65,605 | 10,451,532 |
| Professional Services 2.4% |
| Dun & Bradstreet Holdings, Inc. | 191,009 | 2,341,770 |
| Leidos Holdings, Inc. | 54,068 | 5,687,413 |
| Robert Half International, Inc. | 35,190 | 2,598,078 |
| Science Applications International Corp. | 40,258 | 4,465,820 |
| TransUnion | 42,023 | 2,384,805 |
| | | 17,477,886 |
| Road & Rail 2.6% |
| JB Hunt Transport Services, Inc. | 34,852 | 6,076,795 |
| Knight-Swift Transportation Holdings, Inc. | 109,281 | 5,727,417 |
| U-Haul Holding Co. | 117,214 | 6,444,426 |
| | | 18,248,638 |
| Semiconductors & Semiconductor Equipment 2.1% |
| First Solar, Inc. (a) | 25,775 | 3,860,837 |
| MKS Instruments, Inc. | 83,579 | 7,081,649 |
| Synaptics, Inc. (a) | 41,631 | 3,961,606 |
| | | 14,904,092 |
| Software 3.0% |
| Dynatrace, Inc. (a) | 149,370 | 5,720,871 |
| Fair Isaac Corp. (a) | 7,032 | 4,209,214 |
| Guidewire Software, Inc. (a) | 48,342 | 3,024,275 |
| Informatica, Inc., Class A (a)(b) | 129,137 | 2,103,642 |
| LiveRamp Holdings, Inc. (a) | 67,895 | 1,591,459 |
| Olo, Inc., Class A (a) | 153,407 | 958,794 |
| Q2 Holdings, Inc. (a) | 71,408 | 1,918,733 |
| Teradata Corp. (a) | 61,064 | 2,055,414 |
| | | 21,582,402 |
| Specialty Retail 1.3% |
| CarMax, Inc. (a) | 87,083 | 5,302,484 |
| Monro, Inc. | 84,134 | 3,802,857 |
| | | 9,105,341 |
| | Shares | | Value |
| |
| Textiles, Apparel & Luxury Goods 1.5% |
| Carter's, Inc. | 67,044 | | $ 5,002,153 |
| Steven Madden Ltd. | 177,647 | | 5,677,598 |
| | | | 10,679,751 |
| Trading Companies & Distributors 1.5% |
| AerCap Holdings NV (a) | 115,206 | | 6,718,814 |
| Watsco, Inc. | 16,293 | | 4,063,474 |
| | | | 10,782,288 |
Total Common Stocks
(Cost $772,878,156) | | | 711,794,142 |
| Short-Term Investments 0.9% |
| Affiliated Investment Company 0.2% |
| MainStay U.S. Government Liquidity Fund, 3.602% (c) | 994,575 | | 994,575 |
| Unaffiliated Investment Company 0.7% |
| Invesco Government and Agency Portfolio, 4.301% (c)(d) | 5,108,161 | | 5,108,161 |
Total Short-Term Investments
(Cost $6,102,736) | | | 6,102,736 |
Total Investments
(Cost $778,980,892) | 100.8% | | 717,896,878 |
| Other Assets, Less Liabilities | (0.8) | | (5,400,237) |
| Net Assets | 100.0% | | $ 712,496,641 |
| † | Percentages indicated are based on Portfolio net assets. |
| (a) | Non-income producing security. |
| (b) | All or a portion of this security was held on loan. As of December 31, 2022, the aggregate market value of securities on loan was $13,742,962; the total market value of collateral held by the Portfolio was $14,187,694. The market value of the collateral held included non-cash collateral in the form of U.S. Treasury securities with a value of $9,079,533. The Portfolio received cash collateral with a value of $5,108,161. (See Note 2(H)) |
| (c) | Current yield as of December 31, 2022. |
| (d) | Represents a security purchased with cash collateral received for securities on loan. |
The notes to the financial statements are an integral part of, and should be read in conjunction with, the financial statements.
13
Portfolio of Investments December 31, 2022† (continued)
Investments in Affiliates (in 000's)
Investments in issuers considered to be affiliate(s) of the Portfolio during the year ended December 31, 2022 for purposes of Section 2(a)(3) of the Investment Company Act of 1940, as amended, were as follows:
| Affiliated Investment Companies | Value,
Beginning
of Year | Purchases
at Cost | Proceeds
from
Sales | Net
Realized
Gain/(Loss)
on Sales | Change in
Unrealized
Appreciation/
(Depreciation) | Value,
End of
Year | Dividend
Income | Other
Distributions | Shares
End of
Year |
| MainStay U.S. Government Liquidity Fund | $ 4,362 | $ 103,220 | $ (106,587) | $ — | $ — | $ 995 | $ 32 | $ — | 995 |
The following is a summary of the fair valuations according to the inputs used as of December 31, 2022, for valuing the Portfolio’s assets:
| Description | Quoted
Prices in
Active
Markets for
Identical
Assets
(Level 1) | | Significant
Other
Observable
Inputs
(Level 2) | | Significant
Unobservable
Inputs
(Level 3) | | Total |
| Asset Valuation Inputs | | | | | | | |
| Investments in Securities (a) | | | | | | | |
| Common Stocks | $ 711,794,142 | | $ — | | $ — | | $ 711,794,142 |
| Short-Term Investments | | | | | | | |
| Affiliated Investment Company | 994,575 | | — | | — | | 994,575 |
| Unaffiliated Investment Company | 5,108,161 | | — | | — | | 5,108,161 |
| Total Short-Term Investments | 6,102,736 | | — | | — | | 6,102,736 |
| Total Investments in Securities | $ 717,896,878 | | $ — | | $ — | | $ 717,896,878 |
| (a) | For a complete listing of investments and their industries, see the Portfolio of Investments. |
The notes to the financial statements are an integral part of, and should be read in conjunction with, the financial statements.
| 14 | MainStay VP Wellington Mid Cap Portfolio |
Statement of Assets and Liabilities as of December 31, 2022
| Assets |
Investment in unaffiliated securities, at value
(identified cost $777,986,317) including securities on loan of $13,742,962 | $ 716,902,303 |
Investment in affiliated investment companies, at value
(identified cost $994,575) | 994,575 |
| Receivables: | |
| Investment securities sold | 664,604 |
| Dividends | 444,277 |
| Portfolio shares sold | 207,204 |
| Securities lending | 3,557 |
| Other assets | 4,209 |
| Total assets | 719,220,729 |
| Liabilities |
| Cash collateral received for securities on loan | 5,108,161 |
| Due to custodian | 1,553 |
| Payables: | |
| Investment securities purchased | 612,261 |
| Manager (See Note 3) | 521,016 |
| Portfolio shares redeemed | 239,488 |
| Shareholder communication | 97,553 |
| NYLIFE Distributors (See Note 3) | 92,432 |
| Professional fees | 32,573 |
| Custodian | 6,160 |
| Accrued expenses | 12,891 |
| Total liabilities | 6,724,088 |
| Net assets | $ 712,496,641 |
| Composition of Net Assets |
| Shares of beneficial interest outstanding (par value of $.001 per share) unlimited number of shares authorized | $ 98,382 |
| Additional paid-in-capital | 860,397,575 |
| | 860,495,957 |
| Total distributable earnings (loss) | (147,999,316) |
| Net assets | $ 712,496,641 |
| Initial Class | |
| Net assets applicable to outstanding shares | $286,377,538 |
| Shares of beneficial interest outstanding | 38,590,774 |
| Net asset value per share outstanding | $ 7.42 |
| Service Class | |
| Net assets applicable to outstanding shares | $426,119,103 |
| Shares of beneficial interest outstanding | 59,791,617 |
| Net asset value per share outstanding | $ 7.13 |
The notes to the financial statements are an integral part of, and should be read in conjunction with, the financial statements.
15
Statement of Operations for the year ended December 31, 2022
| Investment Income (Loss) |
| Income | |
| Dividends-unaffiliated (net of foreign tax withholding of $44,709) | $ 7,467,830 |
| Securities lending, net | 76,433 |
| Dividends-affiliated | 31,556 |
| Total income | 7,575,819 |
| Expenses | |
| Manager (See Note 3) | 6,541,342 |
| Distribution/Service—Service Class (See Note 3) | 1,170,537 |
| Shareholder communication | 114,434 |
| Professional fees | 92,194 |
| Custodian | 40,334 |
| Trustees | 16,057 |
| Miscellaneous | 24,897 |
| Total expenses before waiver/reimbursement | 7,999,795 |
| Expense waiver/reimbursement from Manager (See Note 3) | (210,952) |
| Net expenses | 7,788,843 |
| Net investment income (loss) | (213,024) |
| Realized and Unrealized Gain (Loss) |
| Net realized gain (loss) on: | |
| Unaffiliated investment transactions | (85,034,581) |
| Foreign currency transactions | 6 |
| Net realized gain (loss) | (85,034,575) |
| Net change in unrealized appreciation (depreciation) on: | |
| Unaffiliated investments | (105,118,253) |
| Translation of other assets and liabilities in foreign currencies | 15 |
| Net change in unrealized appreciation (depreciation) | (105,118,238) |
| Net realized and unrealized gain (loss) | (190,152,813) |
| Net increase (decrease) in net assets resulting from operations | $(190,365,837) |
The notes to the financial statements are an integral part of, and should be read in conjunction with, the financial statements.
| 16 | MainStay VP Wellington Mid Cap Portfolio |
Statements of Changes in Net Assets
for the years ended December 31, 2022 and December 31, 2021
| | 2022 | 2021 |
| Increase (Decrease) in Net Assets |
| Operations: | | |
| Net investment income (loss) | $ (213,024) | $ (1,891,112) |
| Net realized gain (loss) | (85,034,575) | 309,141,181 |
| Net change in unrealized appreciation (depreciation) | (105,118,238) | (139,533,923) |
| Net increase (decrease) in net assets resulting from operations | (190,365,837) | 167,716,146 |
| Distributions to shareholders: | | |
| Initial Class | (116,195,297) | (8,656,336) |
| Service Class | (181,440,133) | (13,020,163) |
| Total distributions to shareholders | (297,635,430) | (21,676,499) |
| Capital share transactions: | | |
| Net proceeds from sales of shares | 49,449,693 | 35,391,084 |
| Net asset value of shares issued to shareholders in reinvestment of distributions | 297,635,430 | 21,676,499 |
| Cost of shares redeemed | (78,282,585) | (169,646,736) |
| Increase (decrease) in net assets derived from capital share transactions | 268,802,538 | (112,579,153) |
| Net increase (decrease) in net assets | (219,198,729) | 33,460,494 |
| Net Assets |
| Beginning of year | 931,695,370 | 898,234,876 |
| End of year | $ 712,496,641 | $ 931,695,370 |
The notes to the financial statements are an integral part of, and should be read in conjunction with, the financial statements.
17
Financial Highlights selected per share data and ratios
| | Year Ended December 31, |
| Initial Class | 2022 | | 2021 | | 2020 | | 2019 | | 2018 |
| Net asset value at beginning of year | $ 16.34 | | $ 13.96 | | $ 13.56 | | $ 11.94 | | $ 15.57 |
| Net investment income (loss) (a) | 0.02 | | (0.02) | | 0.08 | | 0.11 | | 0.16 |
| Net realized and unrealized gain (loss) | (3.69) | | 2.80 | | 1.32 | | 2.54 | | (1.68) |
| Total from investment operations | (3.67) | | 2.78 | | 1.40 | | 2.65 | | (1.52) |
| Less distributions: | | | | | | | | | |
| From net investment income | — | | (0.10) | | (0.12) | | (0.16) | | (0.15) |
| From net realized gain on investments | (5.25) | | (0.30) | | (0.88) | | (0.87) | | (1.96) |
| Total distributions | (5.25) | | (0.40) | | (1.00) | | (1.03) | | (2.11) |
| Net asset value at end of year | $ 7.42 | | $ 16.34 | | $ 13.96 | | $ 13.56 | | $ 11.94 |
| Total investment return (b) | (20.52)% | | 20.00% | | 11.28% | | 22.88% | | (11.98)% |
| Ratios (to average net assets)/Supplemental Data: | | | | | | | | | |
| Net investment income (loss) | 0.13% | | (0.12)% | | 0.65% | | 0.84% | | 1.08% |
| Net expenses (c) | 0.86% | | 0.86% | | 0.86% | | 0.86% | | 0.86% |
| Expenses (before waiver/reimbursement) (c) | 0.89% | | 0.89% | | 0.89% | | 0.88% | | 0.88% |
| Portfolio turnover rate | 49% | | 54% | | 178% | | 174% | �� | 181% |
| Net assets at end of year (in 000's) | $ 286,378 | | $ 360,437 | | $ 346,379 | | $ 398,240 | | $ 453,343 |
| (a) | Per share data based on average shares outstanding during the year. |
| (b) | Total return does not reflect any deduction of sales charges, mortality and expense charges, contract charges or administrative charges. For periods of less than one year, total return is not annualized. |
| (c) | In addition to the fees and expenses which the Portfolio bears directly, it also indirectly bears a pro-rata share of the fees and expenses of the underlying funds in which it invests. Such indirect expenses are not included in the above expense ratios. |
| | Year Ended December 31, |
| Service Class | 2022 | | 2021 | | 2020 | | 2019 | | 2018 |
| Net asset value at beginning of year | $ 16.00 | | $ 13.68 | | $ 13.32 | | $ 11.74 | | $ 15.35 |
| Net investment income (loss) (a) | (0.01) | | (0.04) | | 0.05 | | 0.08 | | 0.12 |
| Net realized and unrealized gain (loss) | (3.61) | | 2.72 | | 1.28 | | 2.49 | | (1.66) |
| Total from investment operations | (3.62) | | 2.68 | | 1.33 | | 2.57 | | (1.54) |
| Less distributions: | | | | | | | | | |
| From net investment income | — | | (0.06) | | (0.09) | | (0.12) | | (0.11) |
| From net realized gain on investments | (5.25) | | (0.30) | | (0.88) | | (0.87) | | (1.96) |
| Total distributions | (5.25) | | (0.36) | | (0.97) | | (0.99) | | (2.07) |
| Net asset value at end of year | $ 7.13 | | $ 16.00 | | $ 13.68 | | $ 13.32 | | $ 11.74 |
| Total investment return (b) | (20.71)% | | 19.70% | | 11.00% | | 22.57% | | (12.20)% |
| Ratios (to average net assets)/Supplemental Data: | | | | | | | | | |
| Net investment income (loss) | (0.13)% | | (0.25)% | | 0.42% | | 0.58% | | 0.83% |
| Net expenses (c) | 1.11% | | 1.11% | | 1.11% | | 1.11% | | 1.11% |
| Expenses (before waiver/reimbursement) (c) | 1.14% | | 1.14% | | 1.14% | | 1.13% | | 1.13% |
| Portfolio turnover rate | 49% | | 54% | | 178% | | 174% | | 181% |
| Net assets at end of year (in 000's) | $ 426,119 | | $ 571,259 | | $ 551,856 | | $ 516,445 | | $ 395,800 |
| (a) | Per share data based on average shares outstanding during the year. |
| (b) | Total return does not reflect any deduction of sales charges, mortality and expense charges, contract charges or administrative charges. For periods of less than one year, total return is not annualized. |
| (c) | In addition to the fees and expenses which the Portfolio bears directly, it also indirectly bears a pro-rata share of the fees and expenses of the underlying funds in which it invests. Such indirect expenses are not included in the above expense ratios. |
The notes to the financial statements are an integral part of, and should be read in conjunction with, the financial statements.
| 18 | MainStay VP Wellington Mid Cap Portfolio |
Notes to Financial Statements
Note 1–Organization and Business
MainStay VP Funds Trust (the “Fund”) was organized as a Delaware statutory trust on February 1, 2011. The Fund is registered under the Investment Company Act of 1940, as amended (the “1940 Act”), as an open-end management investment company. The Fund is comprised of thirty-one separate series (collectively referred to as the “Portfolios”). These financial statements and notes relate to the MainStay VP Wellington Mid Cap Portfolio (the "Portfolio"), a "diversified” portfolio, as that term is defined in the 1940 Act, as interpreted or modified by regulatory authorities having jurisdiction, from time to time.
Shares of the Portfolio are currently offered to certain separate accounts to fund variable annuity policies and variable universal life insurance policies issued by New York Life Insurance and Annuity Corporation (“NYLIAC”), a wholly-owned subsidiary of New York Life Insurance Company (“New York Life”) and may also be offered to fund variable annuity policies and variable universal life insurance policies issued by other insurance companies. NYLIAC allocates shares of the Portfolio to, among others, certain NYLIAC separate accounts. Shares of the Portfolio are also offered to the MainStay VP Conservative Allocation Portfolio, MainStay VP Moderate Allocation Portfolio, MainStay VP Growth Allocation Portfolio and MainStay VP Equity Allocation Portfolio, which operate as “funds-of-funds," and other variable insurance funds.
The following table lists the Portfolio's share classes that have been registered and commenced operations:
| Class | Commenced Operations |
| Initial Class | July 2, 2001 |
| Service Class | June 5, 2003 |
Shares of the Portfolio are offered and are redeemed at a price equal to their respective net asset value (“NAV”) per share. No sales or redemption charge is applicable to the purchase or redemption of the Portfolio's shares. Under the terms of the Fund’s multiple class plan, adopted pursuant to Rule 18f-3 under the 1940 Act, the classes differ in that, among other things, Service Class shares of the Portfolio pay a combined distribution and service fee of 0.25% of average daily net assets attributable to Service Class shares of the Portfolio to the Distributor (as defined in Note 3(B)) pursuant to a plan adopted in accordance with Rule 12b-1 under the 1940 Act. Contract owners of variable annuity contracts purchased after June 2, 2003, are permitted to invest only in the Service Class shares.
The Portfolio's investment objective is to seek long-term growth of capital.
Note 2–Significant Accounting Policies
The Portfolio is an investment company and accordingly follows the investment company accounting and reporting guidance of the Financial Accounting Standards Board (“FASB”) Accounting Standards Codification Topic 946 Financial Services—Investment Companies. The Portfolio prepares its financial statements in accordance with generally accepted
accounting principles (“GAAP”) in the United States of America and follows the significant accounting policies described below.
(A) Securities Valuation. Investments are usually valued as of the close of regular trading on the New York Stock Exchange (the "Exchange") (usually 4:00 p.m. Eastern time) on each day the Portfolio is open for business ("valuation date").
Effective September 8, 2022, and pursuant to Rule 2a-5 under the 1940 Act, the Board of Trustees of the Fund (the "Board") designated New York Life Investment Management LLC (“New York Life Investments” or the "Manager") as its Valuation Designee (the "Valuation Designee"). The Valuation Designee is responsible for performing fair valuations relating to all investments in the Portfolio’s portfolio for which market quotations are not readily available; periodically assessing and managing material valuation risks; establishing and applying fair value methodologies; testing fair valuation methodologies; evaluating and overseeing pricing services; ensuring appropriate segregation of valuation and portfolio management functions; providing quarterly, annual and prompt reporting to the Board, as appropriate; identifying potential conflicts of interest; and maintaining appropriate records. The Valuation Designee has established a valuation committee ("Valuation Committee") to assist in carrying out the Valuation Designee’s responsibilities and establish prices of securities for which market quotations are not readily available. The Portfolio’s and the Valuation Designee's policies and procedures ("Valuation Procedures") govern the Valuation Designee’s selection and application of methodologies for determining and calculating the fair value of Portfolio investments. The Valuation Designee may value the Portfolio's portfolio securities for which market quotations are not readily available and other Portfolio assets utilizing inputs from pricing services and other third-party sources (together, “Pricing Sources”). The Valuation Committee meets (in person, via electronic mail or via teleconference) on an ad-hoc basis to determine fair valuations and on a quarterly basis to review fair value events with respect to certain securities for which market quotations are not readily available, including valuation risks and back-testing results, and preview reports to the Board.
The Valuation Committee establishes prices of securities for which market quotations are not readily available based on such methodologies and measurements on a regular basis after considering information that is reasonably available and deemed relevant by the Valuation Committee. The Board shall oversee the Valuation Designee and review fair valuation materials on a prompt, quarterly and annual basis and approve proposed revisions to the Valuation Procedures.
Investments for which market quotations are not readily available are valued at fair value as determined in good faith pursuant to the Valuation Procedures. A market quotation is readily available only when that quotation is a quoted price (unadjusted) in active markets for identical investments that the Portfolio can access at the measurement date, provided that a quotation will not be readily available if it is not reliable. "Fair value" is defined as the price the Portfolio would reasonably expect to receive upon selling an asset or liability in an orderly transaction to an independent buyer in the principal or most advantageous market for the
Notes to Financial Statements (continued)
asset or liability. Fair value measurements are determined within a framework that establishes a three-tier hierarchy that maximizes the use of observable market data and minimizes the use of unobservable inputs to establish a classification of fair value measurements for disclosure purposes. "Inputs" refer broadly to the assumptions that market participants would use in pricing the asset or liability, including assumptions about risk, such as the risk inherent in a particular valuation technique used to measure fair value using a pricing model and/or the risk inherent in the inputs for the valuation technique. Inputs may be observable or unobservable. Observable inputs reflect the assumptions market participants would use in pricing the asset or liability based on market data obtained from sources independent of the Portfolio. Unobservable inputs reflect the Portfolio’s own assumptions about the assumptions market participants would use in pricing the asset or liability based on the information available. The inputs or methodology used for valuing assets or liabilities may not be an indication of the risks associated with investing in those assets or liabilities. The three-tier hierarchy of inputs is summarized below.
| • | Level 1—quoted prices (unadjusted) in active markets for an identical asset or liability |
| • | Level 2—other significant observable inputs (including quoted prices for a similar asset or liability in active markets, interest rates and yield curves, prepayment speeds, credit risk, etc.) |
| • | Level 3—significant unobservable inputs (including the Portfolio's own assumptions about the assumptions that market participants would use in measuring fair value of an asset or liability) |
The level of an asset or liability within the fair value hierarchy is based on the lowest level of an input, both individually and in the aggregate, that is significant to the fair value measurement. The aggregate value by input level of the Portfolio’s assets and liabilities as of December 31, 2022, is included at the end of the Portfolio of Investments.
The Portfolio may use third-party vendor evaluations, whose prices may be derived from one or more of the following standard inputs, among others:
| • Broker/dealer quotes | • Benchmark securities |
| • Two-sided markets | • Reference data (corporate actions or material event notices) |
| • Bids/offers | • Monthly payment information |
| • Industry and economic events | • Reported trades |
An asset or liability for which a market quotation is not readily available is valued by methods deemed reasonable in good faith by the Valuation Committee, following the Valuation Procedures to represent fair value. Under these procedures, the Valuation Designee generally uses a market-based approach which may use related or comparable assets or liabilities, recent transactions, market multiples, book values and other relevant information. The Valuation Designee may also use an income-based valuation approach in which the anticipated future cash flows of the asset or liability are discounted to calculate fair value.
Discounts may also be applied due to the nature and/or duration of any restrictions on the disposition of the asset or liability. Fair value represents a good faith approximation of the value of a security. Fair value determinations involve the consideration of a number of subjective factors, an analysis of applicable facts and circumstances and the exercise of judgment. As a result, it is possible that the fair value for a security determined in good faith in accordance with the Valuation Procedures may differ from valuations for the same security determined for other funds using their own valuation procedures. Although the Valuation Procedures are designed to value a security at the price the Portfolio may reasonably expect to receive upon the security's sale in an orderly transaction, there can be no assurance that any fair value determination thereunder would, in fact, approximate the amount that the Portfolio would actually realize upon the sale of the security or the price at which the security would trade if a reliable market price were readily available. During the year ended December 31, 2022, there were no material changes to the fair value methodologies.
Securities which may be valued in this manner include, but are not limited to: (i) a security for which trading has been halted or suspended or otherwise does not have a readily available market quotation on a given day; (ii) a debt security that has recently gone into default and for which there is not a current market quotation; (iii) a security of an issuer that has entered into a restructuring; (iv) a security that has been delisted from a national exchange; (v) a security subject to trading collars for which no or limited trading takes place; and (vi) a security whose principal market has been temporarily closed at a time when, under normal conditions, it would be open. Securities valued in this manner are generally categorized as Level 2 or 3 in the hierarchy.
Equity securities are valued at the last quoted sales prices as of the close of regular trading on the relevant exchange on each valuation date. Securities that are not traded on the valuation date are valued at the mean of the last quoted bid and ask prices. Prices are normally taken from the principal market in which each security trades. These securities are generally categorized as Level 1 in the hierarchy.
Investments in mutual funds, including money market funds, are valued at their respective NAVs at the close of business each day on the valuation date. These securities are generally categorized as Level 1 in the hierarchy.
Temporary cash investments acquired in excess of 60 days to maturity at the time of purchase are valued using the latest bid prices or using valuations based on a matrix system (which considers such factors as security prices, yields, maturities and ratings), both as furnished by independent pricing services. Temporary cash investments that mature in 60 days or less at the time of purchase ("Short-Term Investments") are valued using the amortized cost method of valuation, unless the use of such method would be inappropriate. The amortized cost method involves valuing a security at its cost on the date of purchase and thereafter assuming a constant amortization to maturity of the difference between such cost and the value on maturity date. Amortized cost approximates the current fair value of a security. Securities valued using the amortized
| 20 | MainStay VP Wellington Mid Cap Portfolio |
cost method are not valued using quoted prices in an active market and are generally categorized as Level 2 in the hierarchy.
The information above is not intended to reflect an exhaustive list of the methodologies that may be used to value portfolio investments. The Valuation Procedures permit the use of a variety of valuation methodologies in connection with valuing portfolio investments. The methodology used for a specific type of investment may vary based on the market data available or other considerations. The methodologies summarized above may not represent the specific means by which portfolio investments are valued on any particular business day.
(B) Income Taxes. The Portfolio's policy is to comply with the requirements of the Internal Revenue Code of 1986, as amended (the “Internal Revenue Code”), applicable to regulated investment companies and to distribute all of its taxable income to the shareholders of the Portfolio within the allowable time limits.
The Manager evaluates the Portfolio’s tax positions to determine if the tax positions taken meet the minimum recognition threshold in connection with accounting for uncertainties in income tax positions taken or expected to be taken for the purposes of measuring and recognizing tax liabilities in the financial statements. Recognition of tax benefits of an uncertain tax position is permitted only to the extent the position is “more likely than not” to be sustained assuming examination by taxing authorities. The Manager analyzed the Portfolio's tax positions taken on federal, state and local income tax returns for all open tax years (for up to three tax years) and has concluded that no provisions for federal, state and local income tax are required in the Portfolio's financial statements. The Portfolio's federal, state and local income tax and federal excise tax returns for tax years for which the applicable statutes of limitations have not expired are subject to examination by the Internal Revenue Service and state and local departments of revenue.
(C) Dividends and Distributions to Shareholders. Dividends and distributions are recorded on the ex-dividend date. The Portfolio intends to declare and pay dividends from net investment income and distributions from net realized capital and currency gains, if any, at least annually. All dividends and distributions are reinvested at NAV in the same class of shares of the Portfolio. Dividends and distributions to shareholders are determined in accordance with federal income tax regulations and may differ from determinations using GAAP.
(D) Security Transactions and Investment Income. The Portfolio records security transactions on the trade date. Realized gains and losses on security transactions are determined using the identified cost method. Dividend income is recognized on the ex-dividend date, net of any foreign tax withheld at the source, and interest income is accrued as earned using the effective interest rate method. Distributions received from real estate investment trusts may be classified as dividends, capital gains and/or return of capital.
Investment income and realized and unrealized gains and losses on investments of the Portfolio are allocated pro rata to the separate classes
of shares based upon their relative net assets on the date the income is earned or realized and unrealized gains and losses are incurred.
(E) Expenses. Expenses of the Fund are allocated to the individual Portfolios in proportion to the net assets of the respective Portfolios when the expenses are incurred, except where direct allocations of expenses can be made. Expenses (other than fees incurred under the distribution and service plans, further discussed in Note 3(B), which are charged directly to the Service Class shares) are allocated to separate classes of shares pro rata based upon their relative net assets on the date the expenses are incurred. The expenses borne by the Portfolio, including those of related parties to the Portfolio, are shown in the Statement of Operations.
Additionally, the Portfolio may invest in mutual funds, which are subject to management fees and other fees that may cause the costs of investing in mutual funds to be greater than the costs of owning the underlying securities directly. These indirect expenses of mutual funds are not included in the amounts shown as expenses in the Statement of Operations or in the expense ratios included in the Financial Highlights.
(F) Use of Estimates. In preparing financial statements in conformity with GAAP, the Manager makes estimates and assumptions that affect the reported amounts and disclosures in the financial statements. Actual results could differ from those estimates and assumptions.
(G) Foreign Currency Transactions. The Portfolio's books and records are maintained in U.S. dollars. Prices of securities denominated in foreign currency amounts are translated into U.S. dollars at the mean between the buying and selling rates last quoted by any major U.S. bank at the following dates:
(i) market value of investment securities, other assets and liabilities— at the valuation date; and
(ii) purchases and sales of investment securities, income and expenses—at the date of such transactions.
The assets and liabilities that are denominated in foreign currency amounts are presented at the exchange rates and market values at the close of the period. The realized and unrealized changes in net assets arising from fluctuations in exchange rates and market prices of securities are not separately presented.
Net realized gain (loss) on foreign currency transactions represents net currency gains or losses realized as a result of differences between the amounts of securities sale proceeds or purchase cost, dividends, interest and withholding taxes as recorded on the Portfolio's books, and the U.S. dollar equivalent amount actually received or paid. Net currency gains or losses from valuing such foreign currency denominated assets and liabilities, other than investments at valuation date exchange rates, are reflected in unrealized foreign exchange gains or losses.
(H) Securities Lending. In order to realize additional income, the Portfolio may engage in securities lending, subject to the limitations set forth in the 1940 Act and relevant guidance by the staff of the Securities
Notes to Financial Statements (continued)
and Exchange Commission (“SEC”). If the Portfolio engages in securities lending, the Portfolio will lend through its custodian, JPMorgan Chase Bank, N.A., ("JPMorgan"), acting as securities lending agent on behalf of the Portfolio. Under the current arrangement, JPMorgan will manage the Portfolio's collateral in accordance with the securities lending agency agreement between the Portfolio and JPMorgan, and indemnify the Portfolio against counterparty risk. The loans will be collateralized by cash (which may be invested in a money market fund) and/or non-cash collateral (which may include U.S. Treasury securities and/or U.S. government agency securities issued or guaranteed by the United States government or its agencies or instrumentalities) at least equal at all times to the market value of the securities loaned. Non-cash collateral held at year end is segregated and cannot be transferred by the Portfolio. The Portfolio bears the risk of delay in recovery of, or loss of rights in, the securities loaned. The Portfolio may also record a realized gain or loss on securities deemed sold due to a borrower’s inability to return securities on loan. The Portfolio bears the risk of any loss on investment of cash collateral. The Portfolio will receive compensation for lending its securities in the form of fees or it will retain a portion of interest earned on the investment of any cash collateral. The Portfolio will also continue to receive interest and dividends on the securities loaned and any gain or loss in the market price of the securities loaned that may occur during the term of the loan will be for the account of the Portfolio. Income earned from securities lending activities, if any, is reflected in the Statement of Operations. Securities on loan as of December 31, 2022, are shown in the Portfolio of Investments.
(I) Indemnifications. Under the Fund’s organizational documents, its officers and trustees are indemnified against certain liabilities that may arise out of performance of their duties to the Fund. Additionally, in the normal course of business, the Portfolio enters into contracts with third-party service providers that contain a variety of representations and warranties and that may provide general indemnifications. The Portfolio's maximum exposure under these arrangements is unknown, as this would involve future claims that may be made against the Portfolio that have not yet occurred. The Manager believes that the risk of loss in connection with these potential indemnification obligations is remote. However, there can be no assurance that material liabilities related to such obligations will not arise in the future, which could adversely impact the Portfolio.
Note 3–Fees and Related Party Transactions
(A) Manager and Subadvisor. New York Life Investments, a registered investment adviser and an indirect, wholly-owned subsidiary of New York Life, serves as the Portfolio's Manager, pursuant to an Amended and Restated Management Agreement ("Management Agreement"). The Manager provides offices, conducts clerical, recordkeeping and bookkeeping services and keeps most of the financial and accounting records required to be maintained by the Portfolio. Except for the portion of salaries and expenses that are the responsibility of the Portfolio, the Manager pays the salaries and expenses of all personnel affiliated with the Portfolio and certain operational expenses of the Portfolio. During a portion of the year ended December 31, 2022, the Portfolio reimbursed
New York Life Investments in an amount equal to the portion of the compensation of the Chief Compliance Officer attributable to the Portfolio. Wellington Management Company LLP ("Wellington" or the "Subadvisor"), a registered investment adviser, serves as the Subadvisor to the Portfolio and is responsible for the day-to-day portfolio management of the Portfolio. Pursuant to the terms of a Subadvisory Agreement between New York Life Investments and Wellington, New York Life Investments pays for the services of the Subadvisor.
Pursuant to the Management Agreement, the Fund pays the Manager, on behalf of the Portfolio, a monthly fee for the services performed and the facilities furnished at an annual rate of the Portfolio's average daily net assets as follows: 0.85% up to $1 billion; 0.80% from $1 billion to $2 billion; and 0.775% in excess of $2 billion. During the year ended December 31, 2022, the effective management fee rate was 0.85% (exclusive of any applicable waivers/reimbursements).
New York Life Investments has contractually agreed to waive fees and/or reimburse expenses so that the Total Annual Portfolio Operating Expenses (excluding taxes, interest, litigation, extraordinary expenses, brokerage and other transaction expenses relating to the purchase or sale of portfolio investments, and acquired (underlying) portfolio/fund fees and expenses) of Initial Class shares and Service Class shares do not exceed 0.86% and 1.11%, respectively, of the Portfolio's average daily net assets. This agreement will remain in effect until May 1, 2023, and shall renew automatically for one-year terms unless New York Life Investments provides written notice of termination prior to the start of the next term or upon approval of the Board.
During the year ended December 31, 2022, New York Life Investments earned fees from the Portfolio in the amount of $6,541,342 and waived fees and/or reimbursed certain class specific expenses in the amount of $210,952 and paid the Subadvisor fees in the amount of $2,829,436.
JPMorgan provides sub-administration and sub-accounting services to the Portfolio pursuant to an agreement with New York Life Investments. These services include calculating the daily NAVs of the Portfolio, maintaining the general ledger and sub-ledger accounts for the calculation of the Portfolio's NAVs, and assisting New York Life Investments in conducting various aspects of the Portfolio's administrative operations. For providing these services to the Portfolio, JPMorgan is compensated by New York Life Investments.
Pursuant to an agreement between the Fund and New York Life Investments, New York Life Investments is responsible for providing or procuring certain regulatory reporting services for the Portfolio. The Portfolio will reimburse New York Life Investments for the actual costs incurred by New York Life Investments in connection with providing or procuring these services for the Portfolio.
(B) Distribution and Service Fees. The Fund, on behalf of the Portfolio, has entered into a distribution agreement with NYLIFE Distributors LLC (the “Distributor”), an affiliate of New York Life Investments. The Portfolio has adopted a distribution plan (the “Plan”) in accordance with the provisions of Rule 12b-1 under the 1940 Act. Under
| 22 | MainStay VP Wellington Mid Cap Portfolio |
the Plan, the Distributor has agreed to provide, through its affiliates or independent third parties, various distribution-related, shareholder and administrative support services to the Service Class shareholders. For its services, the Distributor is entitled to a combined distribution and service fee accrued daily and paid monthly at an annual rate of 0.25% of the average daily net assets attributable to the Service Class shares of the Portfolio.
Note 4-Federal Income Tax
As of December 31, 2022, the cost and unrealized appreciation (depreciation) of the Portfolio’s investment portfolio, including applicable derivative contracts and other financial instruments, as determined on a federal income tax basis, were as follows:
| | Federal Tax
Cost | Gross
Unrealized
Appreciation | Gross
Unrealized
(Depreciation) | Net
Unrealized
Appreciation/
(Depreciation) |
| Investments in Securities | $799,654,194 | $50,507,202 | $(132,264,518) | $(81,757,316) |
As of December 31, 2022, the components of accumulated gain (loss) on a tax basis were as follows:
Ordinary
Income | Accumulated
Capital
and Other
Gain (Loss) | Other
Temporary
Differences | Unrealized
Appreciation
(Depreciation) | Total
Accumulated
Gain (Loss) |
| $311,456 | $(66,556,681) | $3,210 | $(81,757,301) | $(147,999,316) |
The difference between book-basis and tax-basis unrealized appreciation (depreciation) is primarily due to wash sale adjustments. The other temporary differences are primarily due to deferred dividends from real estate investment trusts ("REITs").
As of December 31, 2022, for federal income tax purposes, capital loss carryforwards of $66,556,681, as shown in the table below, were available to the extent provided by the regulations to offset future realized gains of the Portfolio. Accordingly, no capital gains distributions are expected to be paid to shareholders until net gains have been realized in excess of such amounts.
Capital Loss
Available Through | Short-Term
Capital Loss
Amounts (000’s) | Long-Term
Capital Loss
Amounts (000’s) |
| Unlimited | $21,985 | $44,572 |
During the years ended December 31, 2022 and December 31, 2021, the tax character of distributions paid as reflected in the Statements of Changes in Net Assets was as follows:
| | 2022 | 2021 |
| Distributions paid from: | | |
| Ordinary Income | $163,719,831 | $ 4,299,927 |
| Long-Term Capital Gains | 133,915,599 | 17,376,572 |
| Total | $297,635,430 | $21,676,499 |
Note 5–Custodian
JPMorgan is the custodian of cash and securities held by the Portfolio. Custodial fees are charged to the Portfolio based on the Portfolio's net assets and/or the market value of securities held by the Portfolio and the number of certain transactions incurred by the Portfolio.
Note 6–Line of Credit
The Portfolio and certain other funds managed by New York Life Investments maintain a line of credit with a syndicate of banks in order to secure a source of funds for temporary purposes to meet unanticipated or excessive redemption requests.
Effective July 26, 2022, under the credit agreement (the “Credit Agreement”), the aggregate commitment amount is $600,000,000 with an additional uncommitted amount of $100,000,000. The commitment fee is an annual rate of 0.15% of the average commitment amount payable quarterly, regardless of usage, to JPMorgan, who serves as the agent to the syndicate. The commitment fee is allocated among the Portfolio and certain other funds managed by New York Life Investments based upon their respective net assets and other factors. Interest on any revolving credit loan is charged based upon the Federal Funds Rate, Daily Simple Secured Overnight Financing Rate ("SOFR") + 0.10%, or the Overnight Bank Funding Rate, whichever is higher. The Credit Agreement expires on July 25, 2023, although the Portfolio, certain other funds managed by New York Life Investments and the syndicate of banks may renew the Credit Agreement for an additional year on the same or different terms or enter into a credit agreement with a different syndicate of banks. Prior to July 26, 2022, the aggregate commitment amount and the commitment fee were the same as those under the current Credit Agreement. During the year ended December 31, 2022, there were no borrowings made or outstanding with respect to the Portfolio under the Credit Agreement.
Note 7–Interfund Lending Program
Pursuant to an exemptive order issued by the SEC, the Portfolio, along with certain other funds managed by New York Life Investments, may participate in an interfund lending program. The interfund lending program provides an alternative credit facility that permits the Portfolio and certain other funds managed by New York Life Investments to lend or borrow money for temporary purposes directly to or from one another, subject to the conditions of the exemptive order. During the year ended December 31, 2022, there were no interfund loans made or outstanding with respect to the Portfolio.
Note 8–Purchases and Sales of Securities (in 000’s)
During the year ended December 31, 2022, purchases and sales of securities, other than short-term securities, were $376,044 and $401,165, respectively.
The Portfolio may purchase securities from or sell securities to other portfolios managed by the Subadvisor. These interportfolio transactions
Notes to Financial Statements (continued)
are primarily used for cash management purposes and are made pursuant to Rule 17a-7 under the 1940 Act. The Rule 17a-7 transactions during the year ended December 31, 2022, were as follows:
Purchases
(000's) | Sales
(000's) | Realized
Gain / (Loss)
(000's) |
| $54 | $53 | $(40) |
Note 9–Capital Share Transactions
Transactions in capital shares for the years ended December 31, 2022 and December 31, 2021, were as follows:
| Initial Class | Shares | Amount |
| Year ended December 31, 2022: | | |
| Shares sold | 1,878,622 | $ 23,300,580 |
| Shares issued to shareholders in reinvestment of distributions | 16,591,980 | 116,195,297 |
| Shares redeemed | (1,943,510) | (23,906,575) |
| Net increase (decrease) | 16,527,092 | $ 115,589,302 |
| Year ended December 31, 2021: | | |
| Shares sold | 670,483 | $ 10,666,624 |
| Shares issued to shareholders in reinvestment of distributions | 549,295 | 8,656,336 |
| Shares redeemed | (3,970,175) | (61,601,891) |
| Net increase (decrease) | (2,750,397) | $ (42,278,931) |
| |
| Service Class | Shares | Amount |
| Year ended December 31, 2022: | | |
| Shares sold | 2,130,972 | $ 26,149,113 |
| Shares issued to shareholders in reinvestment of distributions | 26,963,106 | 181,440,133 |
| Shares redeemed | (5,000,775) | (54,376,010) |
| Net increase (decrease) | 24,093,303 | $ 153,213,236 |
| Year ended December 31, 2021: | | |
| Shares sold | 1,575,723 | $ 24,724,460 |
| Shares issued to shareholders in reinvestment of distributions | 842,947 | 13,020,163 |
| Shares redeemed | (7,046,320) | (108,044,845) |
| Net increase (decrease) | (4,627,650) | $ (70,300,222) |
Note 10–Other Matters
As of the date of this report, interest rates in the United States and many parts of the world, including certain European countries, are ascending from historically low levels. Thus, the Portfolio currently faces a heightened level of risk associated with rising interest rates. This could be driven by a variety of factors, including but not limited to central bank monetary policies, changing inflation or real growth rates, general economic conditions, increasing bond issuances or reduced market demand for low yielding investments.
An outbreak of COVID-19, first detected in December 2019, has developed into a global pandemic and has resulted in travel restrictions,
closure of international borders, certain businesses and securities markets, restrictions on securities trading activities, prolonged quarantines, supply chain disruptions, and lower consumer demand, as well as general concern and uncertainty. In 2022, many countries lifted some or all restrictions related to COVID-19. However, the continued impact of COVID-19 and related variants is uncertain and could further adversely affect the global economy, national economies, individual issuers and capital markets in unforeseeable ways and result in a substantial and extended economic downturn. Developments that disrupt global economies and financial markets, such as COVID-19, may magnify factors that affect the Portfolio's performance.
Note 11–Subsequent Events
In connection with the preparation of the financial statements of the Portfolio as of and for the year ended December 31, 2022, events and transactions subsequent to December 31, 2022, through the date the financial statements were issued have been evaluated by the Manager for possible adjustment and/or disclosure. No subsequent events requiring financial statement adjustment or disclosure have been identified.
| 24 | MainStay VP Wellington Mid Cap Portfolio |
Report of Independent Registered Public Accounting Firm
To the Board of Trustees of MainStay VP Funds Trust and Shareholders of
MainStay VP Wellington Mid Cap Portfolio
Opinion on the Financial Statements
We have audited the accompanying statement of assets and liabilities, including the portfolio of investments, of MainStay VP Wellington Mid Cap Portfolio (one of the portfolios constituting MainStay VP Funds Trust, referred to hereafter as the “Portfolio”) as of December 31, 2022, the related statement of operations for the year ended December 31, 2022, the statements of changes in net assets for each of the two years in the period ended December 31, 2022, including the related notes, and the financial highlights for each of the five years in the period ended December 31, 2022 (collectively referred to as the “financial statements”). In our opinion, the financial statements present fairly, in all material respects, the financial position of the Portfolio as of December 31, 2022, the results of its operations for the year then ended, the changes in its net assets for each of the two years in the period ended December 31, 2022 and the financial highlights for each of the five years in the period ended December 31, 2022 in conformity with accounting principles generally accepted in the United States of America.
Basis for Opinion
These financial statements are the responsibility of the Portfolio’s management. Our responsibility is to express an opinion on the Portfolio’s financial statements based on our audits. We are a public accounting firm registered with the Public Company Accounting Oversight Board (United States) (PCAOB) and are required to be independent with respect to the Portfolio in accordance with the U.S. federal securities laws and the applicable rules and regulations of the Securities and Exchange Commission and the PCAOB.
We conducted our audits of these financial statements in accordance with the standards of the PCAOB. Those standards require that we plan and perform the audit to obtain reasonable assurance about whether the financial statements are free of material misstatement, whether due to error or fraud.
Our audits included performing procedures to assess the risks of material misstatement of the financial statements, whether due to error or fraud, and performing procedures that respond to those risks. Such procedures included examining, on a test basis, evidence regarding the amounts and disclosures in the financial statements. Our audits also included evaluating the accounting principles used and significant estimates made by management, as well as evaluating the overall presentation of the financial statements. Our procedures included confirmation of securities owned as of December 31, 2022 by correspondence with the custodian, transfer agents and brokers; when replies were not received from brokers, we performed other auditing procedures. We believe that our audits provide a reasonable basis for our opinion.
/s/PricewaterhouseCoopers LLP
New York, New York
February 24, 2023
We have served as the auditor of one or more investment companies in the MainStay group of funds since 1984.
Board Consideration and Approval of Management Agreement and Subadvisory Agreement (Unaudited)
The continuation of the Management Agreement with respect to the MainStay VP Wellington Mid Cap Portfolio (“Portfolio”) and New York Life Investment Management LLC (“New York Life Investments”) and the Subadvisory Agreement between New York Life Investments and Wellington Management Company LLP (“WMC”) with respect to the Portfolio (together, “Advisory Agreements”) is subject to annual review and approval by the Board of Trustees of MainStay VP Funds Trust (“Board” of the “Trust”) in accordance with Section 15 of the Investment Company Act of 1940, as amended (“1940 Act”). At its December 6–7, 2022 meeting, the Board, which is comprised solely of Trustees who are not an “interested person” (as such term is defined in the 1940 Act) of the Trust (“Independent Trustees”), unanimously approved the continuation of each of the Advisory Agreements for a one-year period.
In reaching the decision to approve the continuation of each of the Advisory Agreements, the Board considered information and materials furnished by New York Life Investments and WMC in connection with an annual contract review process undertaken by the Board that took place at meetings of the Board and its Contracts Committee during October 2022 through December 2022, including information and materials furnished by New York Life Investments and WMC in response to requests prepared on behalf of the Board, and in consultation with the Board, by independent legal counsel to the Independent Trustees, which encompassed a variety of topics, including those summarized below. Information and materials requested by and furnished to the Board for consideration in connection with the contract review process included, among other items, reports on the Portfolio and “peer funds” prepared by Institutional Shareholder Services Inc. (“ISS”), an independent third-party service provider engaged by the Board to report objectively on the Portfolio’s investment performance, management fee and total expenses. The Board also considered information on the fees charged to other investment advisory clients of New York Life Investments and/or WMC that follow investment strategies similar to those of the Portfolio, if any, and, when applicable, the rationale for any differences in the Portfolio’s management and subadvisory fees and the fees charged to those other investment advisory clients. In addition, the Board considered information regarding the legal standards and fiduciary obligations applicable to its consideration of the continuation of each of the Advisory Agreements. The contract review process, including the structure and format for information and materials provided to the Board, has been developed in consultation with the Board. The Independent Trustees also met in executive sessions with their independent legal counsel and, for portions thereof, with senior management of New York Life Investments.
The Board’s deliberations with respect to the continuation of each of the Advisory Agreements reflect a year-long process, and the Board also took into account information furnished to the Board and its Committees throughout the year, as deemed relevant and appropriate by the Trustees, including, among other items, reports on investment performance of the Portfolio and investment-related matters for the Portfolio as well as presentations from New York Life Investments and, generally annually, WMC personnel. In addition, the Board took into account other information received from New York Life Investments throughout the year,
including, among other items, periodic reports on legal and compliance matters, risk management, portfolio turnover, brokerage commissions and non-advisory services provided to the Portfolio by New York Life Investments, as deemed relevant and appropriate by the Trustees.
In addition to information provided to the Board throughout the year, the Board received information in connection with its June 2022 meeting provided specifically in response to requests prepared on behalf of the Board, and in consultation with the Board, by independent legal counsel to the Independent Trustees regarding the Portfolio’s distribution arrangements. In addition, the Board received information regarding the Portfolio’s asset levels, share purchase and redemption activity and the payment of Rule 12b-1 and/or other fees by the applicable share classes of the Portfolio, among other information.
In considering the continuation of each of the Advisory Agreements, the Trustees reviewed and evaluated the information and factors they believed to reasonably be necessary and appropriate in light of legal advice furnished to them by independent legal counsel to the Independent Trustees and through the exercise of their own business judgment. Although individual Trustees may have weighed certain factors or information differently and the Board did not consider any single factor or information controlling in reaching its decision, the factors considered by the Board are summarized in more detail below and include, among other factors: (i) the nature, extent and quality of the services provided to the Portfolio by New York Life Investments and WMC; (ii) the qualifications of the portfolio managers of the Portfolio and the historical investment performance of the Portfolio, New York Life Investments and WMC; (iii) the costs of the services provided, and profits realized, by New York Life Investments and WMC with respect to their relationships with the Portfolio; (iv) the extent to which economies of scale have been realized or may be realized if the Portfolio grows and the extent to which any economies of scale have been shared, have benefited or may benefit the Portfolio’s shareholders; and (v) the reasonableness of the Portfolio’s management and subadvisory fees and total ordinary operating expenses. Although the Board recognized that comparisons between the Portfolio’s fees and expenses and those of other funds are imprecise given different terms of agreements, variations in fund strategies and other factors, the Board considered the reasonableness of the Portfolio’s management fee and total ordinary operating expenses as compared to the peer funds identified by ISS. Throughout their considerations, the Trustees acknowledged the commitment of New York Life Investments and its affiliates to serve the MainStay Group of Funds, as well as their capacity, experience, resources, financial stability and reputations. The Trustees also acknowledged the entrepreneurial and other risks assumed by New York Life Investments in sponsoring and managing the Portfolio. With respect to the Subadvisory Agreement, the Board took into account New York Life Investments’ recommendation to approve the continuation of the Subadvisory Agreement.
The Trustees noted that, throughout the year, the Trustees are afforded an opportunity to ask questions of, and request additional information or materials from, New York Life Investments and WMC. The Board’s decision with respect to each of the Advisory Agreements may have also
| 26 | MainStay VP Wellington Mid Cap Portfolio |
been based, in part, on the Board’s knowledge of New York Life Investments and WMC resulting from, among other things, the Board’s consideration of each of the Advisory Agreements in prior years, the advisory agreements for other funds in the MainStay Group of Funds, the Board’s review throughout the year of the performance and operations of other funds in the MainStay Group of Funds and each Trustee’s business judgment and industry experience. In addition to considering the above-referenced factors, the Board observed that in the marketplace, notably under variable life insurance policies and variable annuity contracts for which the Portfolio serves as an investment option, there are a range of investment options available to investors and that the Portfolio’s shareholders, having had the opportunity to consider other investment options, have chosen to invest in the Portfolio.
The factors that figured prominently in the Board’s decision to approve the continuation of each of the Advisory Agreements during its December 6–7, 2022 meeting are summarized in more detail below.
Nature, Extent and Quality of Services Provided by New York Life Investments and WMC
The Board examined the nature, extent and quality of the services that New York Life Investments provides to the Portfolio. The Board evaluated New York Life Investments’ experience and capabilities in serving as manager of the Portfolio and considered that the Portfolio operates in a “manager-of-managers” structure. The Board also considered New York Life Investments’ responsibilities and services provided pursuant to this structure, including overseeing the services provided by WMC, evaluating the performance of WMC, making recommendations to the Board as to whether the Subadvisory Agreement should be renewed, modified or terminated and periodically reporting to the Board regarding the results of New York Life Investments’ evaluation and monitoring functions. The Board noted that New York Life Investments manages other mutual funds, serves a variety of other investment advisory clients, including other pooled investment vehicles, and has experience overseeing mutual fund service providers, including subadvisors. The Board considered the experience of senior personnel at New York Life Investments providing management and administrative and other non-advisory services to the Portfolio. The Board observed that New York Life Investments devotes significant resources and time to providing management and administrative and other non-advisory services to the Portfolio, including New York Life Investments’ oversight and due diligence reviews of WMC and ongoing analysis of, and interactions with, WMC with respect to, among other things, the Portfolio’s investment performance and risks as well as WMC’s investment capabilities and subadvisory services with respect to the Portfolio.
The Board also considered the range of services that New York Life Investments provides to the Portfolio under the terms of the Management Agreement, including: (i) fund accounting and ongoing supervisory services provided by New York Life Investments’ Fund Administration and Accounting Group; (ii) investment supervisory and analytical services provided by New York Life Investments’ Investment Consulting Group; (iii) compliance services provided by the Trust’s Chief Compliance Officer as
well as New York Life Investments’ compliance department, including supervision and implementation of the Portfolio’s compliance program; (iv) legal services provided by New York Life Investments’ Office of the General Counsel; and (v) risk management monitoring and analysis by compliance and investment personnel. In addition, the Board considered New York Life Investments’ willingness to invest in personnel and other resources, such as cyber security, information security and business continuity planning, designed to benefit the Portfolio and noted that New York Life Investments is responsible for compensating the Trust’s officers, except for a portion of the salary of the Trust’s Chief Compliance Officer. The Board recognized that New York Life Investments provides certain other non-advisory services to the Portfolio and has provided an increasingly broad array of non-advisory services to the MainStay Group of Funds as a result of regulatory and other developments, including in connection with the implementation of the MainStay Group of Funds’ derivatives risk management program and policies and procedures adopted pursuant to Rule 18f-4 under the 1940 Act.
The Board also examined the range, and the nature, extent and quality, of the investment advisory services that WMC provides to the Portfolio and considered the terms of each of the Advisory Agreements. The Board evaluated WMC’s experience and performance in serving as subadvisor to the Portfolio and advising other portfolios and WMC’s track record and experience in providing investment advisory services, the experience of investment advisory, senior management and administrative personnel at WMC. The Board considered New York Life Investments’ and WMC’s overall resources, legal and compliance environment, capabilities, reputation, financial condition and history. In addition to information provided in connection with quarterly meetings with the Trust’s Chief Compliance Officer, the Board considered information regarding the compliance policies and procedures of New York Life Investments and WMC and acknowledged their commitment to further developing and strengthening compliance programs relating to the Portfolio. The Board also considered WMC’s ability to recruit and retain qualified investment professionals and willingness to invest in personnel and other resources to service and support the Portfolio. In this regard, the Board considered the qualifications and experience of the Portfolio’s portfolio managers, the number of accounts managed by the portfolio managers and the method for compensating the portfolio managers.
In addition, the Board considered information provided by New York Life Investments and WMC regarding the operations of their respective business continuity plans in response to the COVID-19 pandemic and the continued remote work environment.
Based on these considerations, among others, the Board concluded that the Portfolio would likely continue to benefit from the nature, extent and quality of these services.
Investment Performance
In evaluating the Portfolio’s investment performance, the Board considered investment performance results over various periods in light of the Portfolio’s investment objective, strategies and risks. The Board
Board Consideration and Approval of Management Agreement and Subadvisory Agreement (Unaudited) (continued)
considered investment reports on, and analysis of, the Portfolio’s performance provided to the Board throughout the year. These reports include, among other items, information on the Portfolio’s gross and net returns, the Portfolio’s investment performance compared to a relevant investment category and the Portfolio’s benchmarks, the Portfolio’s risk-adjusted investment performance and the Portfolio’s investment performance as compared to peer funds, as appropriate, as well as portfolio attribution information and commentary on the effect of market conditions. The Board also considered information provided by ISS showing the investment performance of the Portfolio as compared to peer funds. In addition, the Board reviewed the methodology used by ISS to construct the group of peer funds for comparative purposes.
The Board also took into account its discussions with senior management at New York Life Investments concerning the Portfolio’s investment performance over various periods as well as discussions between the Portfolio’s portfolio management team and the members of the Board’s Investment Committee, which generally occur on an annual basis. In addition, the Board considered any specific actions that New York Life Investments or WMC had taken, or had agreed to take, to seek to enhance Portfolio investment performance and the results of those actions. In considering the investment performance of the Portfolio, the Board noted that the Portfolio underperformed its peer funds for the one-, three-, five- and ten-year periods ended July 31, 2022. The Board considered its discussions with representatives from New York Life Investments and WMC regarding the Portfolio’s investment performance.
Based on these considerations, among others, the Board concluded that its review of the Portfolio’s investment performance and related information supported a determination to approve the continuation of each of the Advisory Agreements.
Costs of the Services Provided, and Profits and Other Benefits Realized, by New York Life Investments and WMC
The Board considered the costs of the services provided under each of the Advisory Agreements. The Board also considered the profits realized by New York Life Investments and its affiliates and WMC due to their relationships with the Portfolio as well as by New York Life Investments and its affiliates due to their relationships with the MainStay Group of Funds. The Board considered information from New York Life Investments that WMC’s subadvisory fee reflected an arm’s-length negotiation and that this fee is paid by New York Life Investments, not the Portfolio, and the relevance of WMC’s profitability was considered by the Trustees in that context. On this basis, the Board primarily considered the costs and profitability for New York Life Investments and its affiliates with respect to the Portfolio.
In addition, the Board acknowledged the difficulty in obtaining reliable comparative data about mutual fund managers’ profitability because such information generally is not publicly available and may be impacted by numerous factors, including the structure of a fund manager’s
organization, the types of funds it manages, the methodology used to allocate certain fixed costs to specific funds and the manager’s capital structure and costs of capital.
In evaluating the costs of the services provided by New York Life Investments and WMC and profits realized by New York Life Investments and its affiliates and WMC, the Board considered, among other factors, New York Life Investments’ and its affiliates’ and WMC’s continuing investments in, or willingness to invest in, personnel and other resources to support and further enhance the management of the Portfolio, and that New York Life Investments is responsible for paying the subadvisory fee for the Portfolio. The Board also considered the financial resources of New York Life Investments and WMC and acknowledged that New York Life Investments and WMC must be in a position to recruit and retain experienced professional personnel and to maintain a strong financial position for New York Life Investments and WMC to continue to provide high-quality services to the Portfolio. The Board recognized that the Portfolio benefits from the allocation of certain fixed costs among the funds in the MainStay Group of Funds, among other expected benefits resulting from its relationship with New York Life Investments.
The Board considered information regarding New York Life Investments’ methodology for calculating profitability and allocating costs provided by New York Life Investments in connection with the fund profitability analysis presented to the Board. The Board noted it had previously engaged an independent consultant to review the methods used to allocate costs among the funds in the MainStay Group of Funds. The Board also noted that the independent consultant had concluded that New York Life Investments’ methods for allocating costs and procedures for estimating overall profitability of the relationship with the funds in the MainStay Group of Funds are reasonable and that New York Life Investments continued to use the same method of calculating profit and allocating costs since the independent consultant’s review. The Board recognized the difficulty in calculating and evaluating a manager’s profitability with respect to the Portfolio and considered that other profitability methodologies may also be reasonable.
The Board also considered certain fall-out benefits that may be realized by New York Life Investments and its affiliates due to their relationships with the Portfolio, including reputational and other indirect benefits. The Board recognized, for example, the benefits to WMC from legally permitted “soft-dollar” arrangements by which brokers provide research and other services to WMC in exchange for commissions paid by the Portfolio with respect to trades in the Portfolio’s portfolio securities. In this regard, the Board also requested and considered information from New York Life Investments concerning other material business relationships between WMC and its affiliates and New York Life Investments and its affiliates and considered the existence of a strategic partnership between New York Life Investments and WMC that relates to certain current and future products and represents a potential conflict of interest associated with New York Life Investments’ recommendation to approve the Subadvisory Agreement. In addition, the Board considered its review of the management agreement for a money market fund advised by New York Life Investments and an affiliated subadvisor that serves as an
| 28 | MainStay VP Wellington Mid Cap Portfolio |
investment option for the Portfolio, including the potential rationale for and costs associated with investments in this money market fund by the Portfolio, if any, and considered information from New York Life Investments that the nature and type of specific investment advisory services provided to this money market fund are distinct from, or in addition to, the investment advisory services provided to the Portfolio. In addition, the Board considered the potential dividend received tax deduction for insurance company affiliates of New York Life Investments from the Portfolio’s securities lending activity.
The Board noted that the Portfolio serves as an investment option primarily under variable contracts issued by affiliates of New York Life Investments that would receive fees under those contracts. The Board observed that, in addition to fees earned by New York Life Investments under the Management Agreement for managing the Portfolio, New York Life Investments’ affiliates also earn revenues from serving the Portfolio in various other capacities, including as the Portfolio’s distributor. The Board considered information about these other revenues and their impact on the profitability of the relationship with the Portfolio to New York Life Investments and its affiliates. The Board noted that, although it assessed the overall profitability of the relationship with the Portfolio to New York Life Investments and its affiliates as part of the contract review process, when considering the reasonableness of the fee paid to New York Life Investments under the Management Agreement, the Board considered the profitability of New York Life Investments’ relationship with the Portfolio on a pre-tax basis and without regard to distribution expenses incurred by New York Life Investments from its own resources.
After evaluating the information deemed relevant by the Trustees, the Board concluded that any profits realized by New York Life Investments and its affiliates due to their relationships with the Portfolio were not excessive, other benefits that may accrue to New York Life Investments and its affiliates are reasonable and benefits that may accrue to WMC and its affiliates are consistent with those expected for a subadvisor to a mutual fund. With respect to WMC, the Board considered that any profits realized by WMC due to its relationship with the Portfolio are the result of arm’s-length negotiations between New York Life Investments and WMC, acknowledging that any such profits are based on the subadvisory fee paid to WMC by New York Life Investments, not the Portfolio.
Management and Subadvisory Fees and Total Ordinary Operating Expenses
The Board evaluated the reasonableness of the fee paid under each of the Advisory Agreements and the Portfolio’s total ordinary operating expenses. The Board primarily considered the reasonableness of the management fee paid by the Portfolio to New York Life Investments because the subadvisory fee paid to WMC is paid by New York Life Investments, not the Portfolio. The Board also considered the reasonableness of the subadvisory fee paid by New York Life Investments and the amount of the management fee retained by New York Life Investments.
In assessing the reasonableness of the Portfolio’s fees and expenses, the Board primarily considered comparative data provided by ISS on the fees and expenses charged by similar mutual funds managed by other investment advisers. The Board reviewed the methodology used by ISS to construct the group of peer funds for comparative purposes. In addition, the Board considered information provided by New York Life Investments and WMC on fees charged to other investment advisory clients, including institutional separate accounts and/or other funds that follow investment strategies similar to those of the Portfolio, if any. The Board considered the contractual management fee schedules of the Portfolio as compared to those of such other investment advisory clients, taking into account the rationale for any differences in fee schedules. The Board also took into account information provided by New York Life Investments about the more extensive scope of services provided to registered investment companies, such as the Portfolio, as compared with other investment advisory clients. Additionally, the Board considered the impact of contractual breakpoints and expense limitation arrangements on the Portfolio’s net management fee and expenses. The Board also considered that in proposing fees for the Portfolio, New York Life Investments considers the competitive marketplace for mutual funds.
Based on the factors outlined above, among other considerations, the Board concluded that the Portfolio’s management fee and total ordinary operating expenses are within a range that is competitive and support a conclusion that these fees and expenses are reasonable.
Economies of Scale
The Board considered information regarding economies of scale, including whether economies of scale may exist for the Portfolio and whether the Portfolio’s expense structure permits any economies of scale to be appropriately shared with the Portfolio’s beneficial shareholders. The Board also considered a report from New York Life Investments, previously prepared at the request of the Board, that addressed economies of scale, including with respect to the mutual fund business generally, and the various ways in which the benefits of economies of scale may be shared with the funds in the MainStay Group of Funds. Although the Board recognized the difficulty of determining economies of scale with precision, the Board acknowledged that economies of scale may be shared with the Portfolio in a number of ways, including, for example, through the imposition of fee breakpoints, initially setting management fee rates at scale or making additional investments to enhance the services provided to the Portfolio. The Board reviewed information from New York Life Investments showing how the Portfolio’s management fee schedule compared to fee schedules of other funds and accounts managed by New York Life Investments. The Board also reviewed information from ISS showing how the Portfolio’s management fee schedule compared with fees paid for similar services by peer funds at varying asset levels.
Based on this information, the Board concluded that economies of scale are appropriately reflected for the benefit of the Portfolio’s beneficial shareholders through the Portfolio’s expense structure and other methods to share benefits from economies of scale.
Board Consideration and Approval of Management Agreement and Subadvisory Agreement (Unaudited) (continued)
Conclusion
On the basis of the information and factors summarized above, among other information and factors deemed relevant by the Trustees, and the evaluation thereof, the Board unanimously voted to approve the continuation of each of the Advisory Agreements.
| 30 | MainStay VP Wellington Mid Cap Portfolio |
Proxy Voting Policies and Procedures and Proxy Voting Record
The Portfolio is required to file with the SEC its proxy voting record for the 12-month period ending June 30 on Form N-PX. A description of the policies and procedures that are used to vote proxies relating to portfolio securities of the Portfolio is available free of charge upon request by calling 800-598-2019 or visiting the SEC's website at www.sec.gov. The most recent Form N-PX or proxy voting record is available free of charge upon request by calling 800-598-2019; visiting https://www.newyorklifeinvestments.com/investment-products/vp; or visiting the SEC’s website at www.sec.gov.
Shareholder Reports and Quarterly Portfolio Disclosure
The Portfolio is required to file its complete schedule of portfolio holdings with the SEC 60 days after its first and third fiscal quarter on Form N-PORT. The Portfolio's holdings report is available free of charge upon request by calling 800-598-2019 or by visiting the SEC’s website at www.sec.gov.
Board of Trustees and Officers (Unaudited)
The Trustees and officers of the Portfolio are listed below. The Board oversees the MainStay Group of Funds (which consists of MainStay Funds and MainStay Funds Trust), MainStay VP Funds Trust, MainStay MacKay DefinedTerm Municipal Opportunities Fund, MainStay CBRE Global Infrastructure Megatrends Fund, the Manager and the Subadvisors, and elects the officers of the Portfolios who are responsible for the day-to-day operations of the Portfolio. Information pertaining to the Trustees and officers is set forth below. Each Trustee serves until his or her successor
is elected and qualified or until his or her resignation, death or removal. Under the Board’s retirement policy, unless an exception is made, a Trustee must tender his or her resignation by the end of the calendar year during which he or she reaches the age of 75. The business address of each Trustee and officer listed below is 51 Madison Avenue, New York, New York 10010. None of the Trustees are “interested persons” (as defined by the 1940 Act and rules adopted by the SEC thereunder) of the Portfolio (“Independent Trustees”).
| | Name and
Year of Birth | Term of Office,
Position(s) Held and
Length of Service | Principal Occupation(s)
During Past Five Years | Number of
Portfolios in
Fund Complex
Overseen by
Trustee | Other Directorships
Held by Trustee |
| | | | | | |
| | David H. Chow
1957 | MainStay VP Funds Trust: Trustee since January 2016, Advisory Board Member (June 2015 to December 2015) | Founder and CEO, DanCourt Management, LLC since 1999 | 78 | MainStay Funds: Trustee since January 2016, Advisory Board Member (June 2015 to December 2015) (12 Funds);
MainStay Funds Trust: Trustee since January 2016, Advisory Board Member (June 2015 to December 2015) (33 Funds);
MainStay MacKay DefinedTerm Municipal Opportunities Fund: Trustee since January 2016, Advisory Board Member (June 2015 to December 2015);
MainStay CBRE Global Infrastructure Megatrends Fund: Trustee since June 2021;VanEck Vectors Group of Exchange-Traded Funds: Independent Chairman of the Board of Trustees since 2008 and Trustee since 2006 (57 portfolios); and Berea College of Kentucky: Trustee since 2009, Chair of the Committee since 2018 |
| | Susan B. Kerley
1951 | MainStay VP Funds Trust: Chairman since 2017 and Trustee since 2007* | President, Strategic Management Advisors LLC since 1990 | 78 | MainStay Funds: Chairman since 2017 and Trustee since 2007 (12 Funds); MainStay Funds Trust: Chairman since 2017 and Trustee since 1990 (33 Funds)**;
MainStay MacKay DefinedTerm Municipal Opportunities Fund: Chairman since 2017 and Trustee since 2011; MainStay CBRE Global Infrastructure Megatrends Fund: Trustee since June 2021; and Legg Mason Partners Funds: Trustee since 1991 (45 portfolios) |
| | Alan R. Latshaw
1951 | MainStay VP Funds Trust: Trustee since 2007* | Retired; Partner, Ernst & Young LLP (2002 to 2003); Partner, Arthur Andersen LLP (1989 to 2002); Consultant to the MainStay Funds Audit and Compliance Committee (2004 to 2006) | 78 | MainStay Funds: Trustee since 2006 (12 Funds);
MainStay Funds Trust: Trustee since 2007 (33 Funds)**;
MainStay MacKay DefinedTerm Municipal Opportunities Fund: Trustee since 2011; and
MainStay CBRE Global Infrastructure Megatrends Fund: Trustee since June 2021 |
| 32 | MainStay VP Wellington Mid Cap Portfolio |
| | Name and
Year of Birth | Term of Office,
Position(s) Held and
Length of Service | Principal Occupation(s)
During Past Five Years | Number of
Portfolios in
Fund Complex
Overseen by
Trustee | Other Directorships
Held by Trustee |
| | | | | | |
| | Karen Hammond
1956 | MainStay VP Funds Trust: Trustee since December 2021, Advisory Board Member (June 2021 to December 2021)
| Retired, Managing Director, Devonshire Investors (2007 to 2013); Senior Vice President, Fidelity Management & Research Co. (2005 to 2007); Senior Vice President and Corporate Treasurer, FMR Corp. (2003 to 2005); Chief Operating Officer, Fidelity Investments Japan (2001 to 2003) | 78 | MainStay Funds: Trustee since December 2021, Advisory Board Member (June 2021 to December 2021) (12 Funds);
MainStay Funds Trust: Trustee since December 2021, Advisory Board Member (June 2021 to December 2021) (33 Funds);
MainStay MacKay DefinedTerm Municipal Opportunities Fund: Trustee since December 2021, Advisory Board Member (June 2021 to December 2021);
MainStay CBRE Global Infrastructure Megatrends Fund: Trustee since December 2021, Advisory Board Member (June 2021 to December 2021);
Two Harbors Investment Corp.: Director since 2018; Rhode Island State Investment Commission: Member since 2017; and Blue Cross Blue Shield of Rhode Island: Director since 2019
|
| | Jacques P. Perold
1958 | MainStay VP Funds Trust: Trustee since January 2016, Advisory Board Member (June 2015 to December 2015) | Founder and Chief Executive Officer, CapShift Advisors LLC (since 2018); President, Fidelity Management & Research Company (2009 to 2014); President and Chief Investment Officer, Geode Capital Management, LLC (2001 to 2009) | 78 | MainStay Funds: Trustee since January 2016, Advisory Board Member (June 2015 to December 2015) (12 Funds);
MainStay Funds Trust: Trustee since January 2016, Advisory Board Member (June 2015 to December 2015) (33 Funds); MainStay MacKay DefinedTerm Municipal Opportunities Fund: Trustee since January 2016, Advisory Board Member (June 2015 to December 2015);
MainStay CBRE Global Infrastructure Megatrends Fund: Trustee since June 2021; Allstate Corporation: Director since 2015;
Partners in Health: Trustee since 2019; and
MSCI Inc.: Director since 2017 |
| | Richard S. Trutanic
1952 | MainStay VP Funds Trust: Trustee since 2007* | Chairman and Chief Executive Officer, Somerset & Company (financial advisory firm) since 2004; Managing Director, The Carlyle Group (private investment firm) (2002 to 2004); Senior Managing Director, Partner and Board Member, Groupe Arnault S.A. (private investment firm) (1999 to 2002)
| 78 | MainStay Funds: Trustee since 1994 (12 Funds);
MainStay Funds Trust: Trustee since 2007 (33 Funds)**;
MainStay MacKay DefinedTerm Municipal Opportunities Fund: Trustee since 2011; and
MainStay CBRE Global Infrastructure Megatrends Fund: Trustee since June 2021 |
| * | Includes prior service as a Director of MainStay VP Series Fund, Inc., the predecessor to MainStay VP Funds Trust. |
| ** | Includes prior service as a Director/Trustee of certain predecessor entities to MainStay Funds Trust. |
Board of Trustees and Officers (Unaudited) (continued)
| | Name and
Year of Birth | Position(s) Held and
Length of Service | Principal Occupation(s)
During Past Five Years | |
| | | | | |
| | Kirk C. Lehneis
1974 | President, MainStay VP Funds Trust (since 2017) | Chief Operating Officer and Senior Managing Director (since 2016), New York Life Investment Management LLC and New York Life Investment Management Holdings LLC; Member of the Board of Managers (since 2017) and Senior Managing Director (since 2018), NYLIFE Distributors LLC; Chairman of the Board and Senior Managing Director, NYLIM Service Company LLC (since 2017); Trustee, President and Principal Executive Officer of IndexIQ Trust, IndexIQ ETF Trust and IndexIQ Active ETF Trust (since January 2018); President, MainStay CBRE Global Infrastructure Megatrends Fund (since 2021), MainStay MacKay DefinedTerm Municipal Opportunities Fund, MainStay Funds and MainStay Funds Trust (since 2017); Senior Managing Director, Global Product Development (from 2015-2016); Managing Director, Product Development (from 2010-2015), New York Life Investment Management LLC | |
| | Jack R. Benintende
1964 | Treasurer and Principal Financial and Accounting Officer, MainStay VP Funds Trust (since 2007)** | Managing Director, New York Life Investment Management LLC (since 2007); Treasurer and Principal Financial and Accounting Officer, MainStay CBRE Global Infrastructure Megatrends Fund (since 2021), MainStay MacKay DefinedTerm Municipal Opportunities Fund (since 2011), MainStay Funds Trust (since 2009) and MainStay Funds (since 2007); and Assistant Treasurer, New York Life Investment Management Holdings LLC (2008 to 2012) | |
| | J. Kevin Gao
1967 | Secretary and Chief Legal Officer, MainStay VP Funds Trust (since 2010)** | Managing Director and Associate General Counsel, New York Life Investment Management LLC (since 2010); Secretary and Chief Legal Officer, MainStay CBRE Global Infrastructure Megatrends Fund (since 2021), MainStay MacKay DefinedTerm Municipal Opportunities Fund (since 2011), MainStay Funds and MainStay Funds Trust (since 2010) | |
| | Scott T. Harrington
1959 | Vice President— Administration, MainStay VP Funds Trust (since 2005)** | Managing Director, New York Life Investment Management LLC (including predecessor advisory organizations) (since 2000); Member of the Board of Directors, New York Life Trust Company (since 2009); Vice President—Administration, MainStay CBRE Global Infrastructure Megatrends Fund (since 2021), MainStay MacKay DefinedTerm Municipal Opportunities Fund (since 2011), MainStay Funds Trust and MainStay Funds (since 2009) | |
| | Kevin M. Gleason
1967 | Vice President and Chief Compliance Officer, MainStay VP Funds Trust (since June 2022) | Vice President and Chief Compliance Officer, IndexIQ, IndexIQ ETF Trust and Index IQ Active ETF Trust (since June 2022); Vice President and Chief Compliance Officer, MainStay CBRE Global Infrastructure Megatrends Fund, MainStay MacKay DefinedTerm Municipal Opportunities Fund (since June 2022); MainStay Funds Trust and MainStay Funds (since June 2022); Senior Vice President, Voya Investment Management and Chief Compliance Officer, Voya Family of Funds (2012-2022) | |
| * | The officers listed above are considered to be “interested persons” of the MainStay Group of Funds, MainStay VP Funds Trust, MainStay CBRE Global Infrastructure Megatrends Fund and MainStay MacKay DefinedTerm Municipal Opportunities Fund within the meaning of the 1940 Act because of their affiliation with the MainStay Group of Funds, New York Life Insurance Company and/or its affiliates, including New York Life Investment Management LLC, NYLIM Service Company LLC, NYLIFE Securities LLC and/or NYLIFE Distributors LLC, as described in detail in the column captioned “Principal Occupation(s) During Past Five Years.” Officers are elected annually by the Board. |
| ** | Includes prior service as an Officer of MainStay VP Series Fund, Inc., the predecessor to MainStay VP Funds Trust. |
Officers of the Trust (Who are not Trustees)*
| 34 | MainStay VP Wellington Mid Cap Portfolio |
MainStay VP Portfolios
MainStay VP offers a wide range of Portfolios. The full array of MainStay VP offerings is listed here, with information about the manager, subadvisors, legal counsel, and independent registered public accounting firm.
Equity
MainStay VP American Century Sustainable Equity Portfolio1
MainStay VP Candriam Emerging Markets Equity Portfolio
MainStay VP Epoch U.S. Equity Yield Portfolio
MainStay VP Fidelity Institutional AM® Utilities Portfolio†
MainStay VP MacKay International Equity Portfolio
MainStay VP Natural Resources Portfolio
MainStay VP S&P 500 Index Portfolio2
MainStay VP Small Cap Growth Portfolio
MainStay VP Wellington Growth Portfolio
MainStay VP Wellington Mid Cap Portfolio
MainStay VP Wellington Small Cap Portfolio
MainStay VP Wellington U.S. Equity Portfolio
MainStay VP Winslow Large Cap Growth Portfolio
Mixed Asset
MainStay VP Balanced Portfolio
MainStay VP Income Builder Portfolio
MainStay VP Janus Henderson Balanced Portfolio
MainStay VP MacKay Convertible Portfolio
Income
MainStay VP Bond Portfolio
MainStay VP Floating Rate Portfolio
MainStay VP Indexed Bond Portfolio
MainStay VP MacKay Government Portfolio
MainStay VP MacKay High Yield Corporate Bond Portfolio
MainStay VP MacKay Strategic Bond Portfolio
MainStay VP PIMCO Real Return Portfolio
Money Market
MainStay VP U.S. Government Money Market Portfolio
Alternative
MainStay VP CBRE Global Infrastructure Portfolio
MainStay VP IQ Hedge Multi-Strategy Portfolio
Asset Allocation
MainStay VP Conservative Allocation Portfolio
MainStay VP Equity Allocation Portfolio
MainStay VP Growth Allocation Portfolio
MainStay VP Moderate Allocation Portfolio
Manager
New York Life Investment Management LLC
New York, New York
Subadvisors
American Century Investment Management, Inc.
Kansas City, Missouri
Brown Advisory LLC
Baltimore, Maryland
Candriam*
Strassen, Luxembourg
CBRE Investment Management Listed Real Assets LLC
Radnor, Pennsylvania
Epoch Investment Partners, Inc.
New York, New York
FIAM LLC
Smithfield, Rhode Island
IndexIQ Advisors LLC*
New York, New York
Janus Henderson Investors US LLC
Denver, Colorado
MacKay Shields LLC*
New York, New York
Newton Investment Management North America, LLC
Boston, Massachusetts
NYL Investors LLC*
New York, New York
Pacific Investment Management Company LLC
Newport Beach, California
Segall Bryant & Hamill, LLC
Chicago, Illinois
Wellington Management Company LLP
Boston, Massachusetts
Winslow Capital Management, LLC
Minneapolis, Minnesota
Legal Counsel
Dechert LLP
Washington, District of Columbia
Independent Registered Public Accounting Firm
PricewaterhouseCoopers LLP
New York, New York
Distributor
NYLIFE Distributors LLC*
Jersey City, New Jersey
Custodian
JPMorgan Chase Bank, N.A.
New York, New York
Some Portfolios may not be available in all products.
† Fidelity Institutional AM is a registered trade mark of FMR LLC. Used with permission.
* An affiliate of New York Life Investment Management LLC.
| 1. | Prior to May 1, 2022, the Portfolio's name was MainStay VP T. Rowe Price Equity Income Portfolio. |
| 2. | Prior to May 1, 2022, the Portfolio's name was MainStay VP MacKay S&P 500 Index Portfolio. |
Not part of the Annual Report
2022 Annual Report
This report is for the general information of New York Life Variable Annuities and NYLIAC Variable Universal Life Insurance Products policyowners. It must be preceded or accompanied by the appropriate product(s) and funds prospectuses if it is given to anyone who is not an owner of a New York Life variable annuity policy or a NYLIAC Variable Universal Life Insurance Product. This report does not offer for sale or solicit orders to purchase securities.
The performance data quoted in this report represents past performance. Past performance is no guarantee of future results. Due to market volatility and other factors, current performance may be lower or higher than the figures shown. The most recent month-end performance summary for your variable annuity or variable life policy is available by calling 800-598-2019 and is updated periodically on newyorklife.com.
The New York Life Variable Annuities and NYLIAC Variable Universal Life Insurance Products are issued by New York Life Insurance and Annuity Corporation (a Delaware Corporation) and distributed by NYLIFE Distributors LLC (Member FINRA/SIPC).
New York Life Insurance Company
New York Life Insurance and Annuity
Corporation (NYLIAC) (A Delaware Corporation)
51 Madison Avenue, Room 551
New York, NY 10010
newyorklife.com
newyorklifeinvestments.com
NYLIFE Distributors LLC, 30 Hudson Street, Jersey City, NJ 07302
New York Life Investment Management LLC is the investment manager to the MainStay VP Funds Trust
©2023 by NYLIFE Distributors LLC. All rights reserved.
You may obtain copies of the Prospectus and the Statement of Additional Information free of charge, upon request, by calling toll-free 800-598-2019 or writing to New York Life Insurance and Annuity Corporation, 51 Madison Avenue, New York, NY 10010.
| Not FDIC Insured | No Bank Guarantee | May Lose Value |
(NYLIAC) NI527
MainStay VP U.S. Government Money Market Portfolio
Message from the President and Annual Report
December 31, 2022
Sign up for e-delivery of your shareholder reports. For full details on e-delivery, including who can participate and what you can receive via e-delivery,
please log in to newyorklifeinvestments.com/accounts.
| Not FDIC/NCUA Insured | Not a Deposit | May Lose Value | No Bank Guarantee | Not Insured by Any Government Agency |
This page intentionally left blank
Message from the President
The 12-month reporting period ended December 31, 2022, proved exceptionally challenging for investors as both stock and bond markets suffered steep declines. A variety of economic and geopolitical forces drove the market’s losses, all centered around rising inflation and monetary efforts to rein it in.
Inflationary alarms began to sound well before the reporting period began. In late 2021, after nearly two years of accommodative policies designed to encourage economic growth in the face of the COVID-19 pandemic, the U.S. Federal Reserve (the “Fed”) warned of the increasing need to tighten monetary policy. Nevertheless, the pace and persistence of inflation in early 2022 caught most market participants—the Fed included—off guard. Russia’s invasion of Ukraine in February exacerbated global inflationary pressures while increasing investor uncertainty. Domestic supply shortages, international trade imbalances and rising inflation caused U.S. GDP (gross domestic product) to contract in the first and second quarters of the year, although employment and consumer spending proved resilient. Prices for petroleum surged to multi-year highs, while many key agricultural chemicals and industrial metals soared as well. Accelerating inflationary forces prompted the Fed to implement its most aggressive series of interest rate hikes since the 1980s, with a 0.25% increase in March followed by six further rate increases totaling 4.25%. International central banks generally followed suit and raised rates by varying degrees in efforts to curb local inflation, although most increases remained significantly more modest than those in the United States. Relatively high U.S. interest rates and an international risk averse sentiment pushed U.S. dollar values higher compared to most other currencies, with negative impacts on global prices for food, fuel and other key U.S.-dollar-denominated products.
The effects of these interrelated challenges were felt throughout U.S. and international financial markets. The S&P 500® Index, a widely regarded benchmark of market performance, declined by more than 18% during the reporting period. Although the energy sector generated strong gains, bolstered by elevated oil and gas prices, most other industry segments recorded losses. The more cyclical and growth-oriented sectors of consumer discretionary, information technology and real estate delivered the weakest returns, while the traditionally defensive and value-oriented
consumer staples, utilities and health care sectors outperformed. On average, international developed-country equity markets mildly outperformed their U.S. counterparts, while emerging markets lagged slightly. Fixed-income markets proved unusually volatile, with bond prices trending sharply lower as yields rose along with interest rates. Short-term yields rose faster than long-term yields, producing a yield curve inversion from July through the end of the reporting period as long-term rates remained below short-term rates. While floating-rate instruments, which feature variable interest rates that allow investors to benefit from a rising rate environment, provided a degree of insulation from inflation-driven trends, they were not immune to the market’s widespread declines.
Although, according to the most recent estimates, the annualized inflation rate in the United States has declined from a peak of 9.1% in July 2022 to 6.5% in December, the Fed remains focused on achieving more substantial and lasting reductions, aiming for a target rate of 2%. As a result, further rate hikes and additional market volatility are potential headwinds in the coming months. The question remains as to whether the Fed and other central banks will manage a so-called “soft landing,” curbing inflation while avoiding a persistent economic slowdown. If they prove successful, we believe that the increasingly attractive valuations we have observed in both equity and bond markets should eventually translate into sustainable improvements in the investment environment.
Whatever actions the Fed takes and however financial markets react, as a MainStay VP investor you can depend on us to continue managing our portfolios with the insight, expertise and level of service that have long defined New York Life Investments. Thank you for trusting us to help you meet your investment needs.
Sincerely,
Kirk C. Lehneis
President
The opinions expressed are as of the date of this report and are subject to change. There is no guarantee that any forecast made will come to pass. This material does not constitute investment advice and is not intended as an endorsement of any specific investment. Past performance is no guarantee of future results.
Not part of the Annual Report
Investors should refer to the Portfolio’s Summary Prospectus and/or Prospectus and consider the Portfolio’s investment objectives, strategies, risks, charges and expenses carefully before investing. The Summary Prospectus and/or Prospectus contain this and other information about the Portfolio. You may obtain copies of the Portfolio’s Summary Prospectus, Prospectus and Statement of Additional Information, which includes information about the MainStay VP Funds Trust's Trustees, free of charge, upon request, by calling toll-free 800-598-2019, by writing to New York Life Insurance and Annuity Corporation, 51 Madison Avenue, Room 251, New York, New York 10010 or by sending an email to MainStayShareholdersServices@nylim.com. These documents are also available at newyorklifeinvestments.com/investment-products/vp. Please read the Portfolio's Summary Prospectus and/or Prospectus carefully before investing. MainStay VP Funds Trust portfolios are separate account options which are purchased through a variable insurance or variable annuity contract.
Investment and Performance Comparison (Unaudited)
Performance data quoted represents past performance. Past performance is no guarantee of future results. Because of market volatility and other factors, current performance may be lower or higher than the figures shown. Investment return and principal value will fluctuate, and as a result, when shares are redeemed, they may be worth more or less than their original cost. The performance table and graph do not reflect any deduction of sales charges, mortality and expense charges, contract charges or administrative charges. Please refer to the Performance Summary appropriate for your policy. For performance information current to the most recent month-end, please call 800-598-2019 or visit www.newyorklife.com.
An investment in the Portfolio is not insured or guaranteed by the Federal Deposit Insurance Corporation or any other government agency. Although the Portfolio seeks to preserve the value of your investment at $1.00 per share, it is possible to lose money by investing in the Portfolio.
Performance figures may reflect certain fee waivers and/or expense limitations, without which total returns may have been different. For information on current fee waivers and/or expense limitations (if any), please refer to the Notes to Financial Statements.
| Average Annual Total Returns for the Year-Ended December 31, 2022 |
| Class | Inception
Date1 | One
Year | Five
Years | Ten
Years | Gross
Expense
Ratio2 |
| Initial Class Shares | 1/29/1993 | 1.29% | 0.94% | 0.52% | 0.41% |
| | | | | | |
| 7-Day Current Yield = 3.68%; 7-Day Effective Yield = 3.75%.3 | | | | | |
| 1. | Effective August 26, 2016 and October 14, 2016, the Portfolio modified its principal investment strategies in connection with commencing operations as a "government money market fund." Consequently the performance information may have been different if the current investment strategies had been in effect during the period prior to the Portfolio commencing operations as a "government money market fund." |
| 2. | The gross expense ratios presented reflect the Portfolio’s “Total Annual Portfolio Operating Expenses” from the most recent Prospectus and may differ from other expense ratios disclosed in this report. |
3. As of December 31, 2022, MainStay VP U.S. Government Money Market Portfolio had an effective 7-day current yield = 3.68%; 7-day effective yield = 3.75%. The current yield is more reflective of the Portfolio’s earnings than the total return.
| Benchmark Performance* | One
Year | Five
Years | Ten
Years |
| Average Lipper Variable Products U.S. Government Money Market Portfolio1 | 1.19% | 0.88% | 0.48% |
| Morningstar Prime Money Market Category Average2 | 1.34 | 1.07 | 0.63 |
| * | Returns for indices reflect no deductions for fees, expenses or taxes, except for foreign withholding taxes where applicable. |
| 1. | The Average Lipper VP U.S. Government Money Market Portfolio is an equally weighted performance average consisting of funds that invest 99.5% of their assets in cash, government securities and/or repurchase agreements that are collateralized solely by government securities or cash, and have a weighted average maturity of 60 days or less. These funds intend to keep a constant net asset value. |
| 2. | The Morningstar Prime Money Market Category Average is representative of funds that invest in short-term money market securities in order to provide a level of current income that is consistent with the preservation of capital. Results are based on average total returns of similar funds with all dividends and capital gain distributions reinvested. |
Cost in Dollars of a $1,000 Investment in MainStay VP U.S. Government Money Market Portfolio (Unaudited)
The example below is intended to describe the fees and expenses borne by shareholders during the six-month period from July 1, 2022 to December 31, 2022, and the impact of those costs on your investment.
Example
As a shareholder of the Portfolio you incur two types of costs: (1) transaction costs, including exchange fees and sales charges (loads) on purchases (as applicable), and (2) ongoing costs, including management fees and other Portfolio expenses (as applicable). This example is intended to help you understand your ongoing costs (in dollars) of investing in the Portfolio and to compare these costs with the ongoing costs of investing in other mutual funds. The example is based on an investment of $1,000 made at the beginning of the six-month period and held for the entire period from July 1, 2022 to December 31, 2022. Shares are only sold in connection with variable life and annuity contracts and the example does not reflect any contract level or transactional fees or expenses. If these costs had been included, your costs would have been higher.
This example illustrates your Portfolio’s ongoing costs in two ways:
Actual Expenses
The second and third data columns in the table below provide information about actual account values and actual expenses. You may use the information in these columns, together with the amount you invested, to estimate the expenses that you paid during the six months ended
December 31, 2022. Simply divide your account value by $1,000 (for example, an $8,600 account value divided by $1,000 = 8.6), then multiply the result by the number under the heading entitled “Expenses Paid During Period” to estimate the expenses you paid on your account during this period.
Hypothetical Example for Comparison Purposes
The fourth and fifth data columns in the table below provide information about hypothetical account values and hypothetical expenses based on the Portfolio’s actual expense ratio and an assumed rate of return of 5% per year before expenses, which is not the Portfolio’s actual return. The hypothetical account values and expenses may not be used to estimate the actual ending account balances or expenses you paid for the six-month period shown. You may use this information to compare the ongoing costs of investing in the Portfolio with the ongoing costs of investing in other mutual funds. To do so, compare this 5% hypothetical example with the 5% hypothetical examples that appear in the shareholder reports of the other mutual funds.
Please note that the expenses shown in the table are meant to highlight your ongoing costs only and do not reflect any transactional costs, such as exchange fees or sales charges (loads). Therefore, the fourth and fifth data columns of the table are useful in comparing ongoing costs only and will not help you determine the relative total costs of owning different funds. In addition, if these transactional costs were included, your costs would have been higher.
| Share Class | Beginning
Account
Value
7/1/22 | Ending Account
Value (Based
on Actual
Returns and
Expenses)
12/31/22 | Expenses
Paid
During
Period1 | Ending Account
Value (Based
on Hypothetical
5% Annualized
Return and
Actual Expenses)
12/31/22 | Expenses
Paid
During
Period1 | Net Expense
Ratio
During
Period2 |
| Initial Class Shares | $1,000.00 | $1,012.00 | $1.42 | $1,023.79 | $1.43 | 0.28% |
| 1. | Expenses are equal to the Portfolio’s annualized expense ratio of each class multiplied by the average account value over the period, divided by 365 and multiplied by 184 (to reflect the six-month period). The table above represents the actual expenses incurred during the six-month period. |
| 2. | Expenses are equal to the Portfolio's annualized expense ratio to reflect the six-month period. |
| 6 | MainStay VP U.S. Government Money Market Portfolio |
Portfolio Composition as of December 31, 2022 (Unaudited)
See Portfolio of Investments beginning on page 9 for specific holdings within these categories. The Portfolio's holdings are subject to change.
Portfolio Management Discussion and Analysis (Unaudited)
Questions answered by NYL Investors LLC, the Portfolio’s Subadvisor.
How did MainStay VP U.S. Government Money Market Portfolio perform relative to its peers during the 12 months ended December 31, 2022?
For the 12 months ended December 31, 2022, Initial Class shares of MainStay VP U.S. Government Money Market Portfolio provided a 7-day current yield of 3.68% and a 7-day effective yield of 3.75%. For the 12 months ended December 31, 2022, Initial Class shares of MainStay VP U.S. Government Money Market Portfolio returned 1.29%. For the same period, the Portfolio outperformed the 1.19% return of the Average Lipper Variable Products U.S. Government Money Market Portfolio and underperformed the 1.34% return of the Morningstar Prime Money Market Category.1
What was the Portfolio’s duration2strategy during the reporting period?
During the reporting period, the Portfolio generally maintained a duration shorter than that of the Bloomberg 1 Month T-Bill Index. Our strategy throughout the reporting period was to keep the duration of the Portfolio as short as possible in order to stay in front of each U.S. Federal Reserve (the “Fed”) monetary policy meeting. Our expectation was that the Fed would tighten monetary policy by raising interest rates at each meeting. The shorter duration profile of the Portfolio allowed us to reinvest maturing securities at higher interest rates after each subsequent meeting. As of December 31, 2022, the Portfolio’s duration was 0.02 years compared to a duration of 0.09 years for the Bloomberg 1 Month T-Bill Index.
During the reporting period, which market segments were the strongest contributors to the Portfolio’s performance and which market segments were particularly weak?
With the Fed announcing a change in monetary policy to an extended period of tightening, short-term interest rates rose precipitously. During the reporting period, the 1-month part of Treasury yield curve3 moved 396 basis points higher. (A basis point is one one-hundredth of a percentage point.) In our view, this shift created a more attractive investment environment. In addition, the Fed’s restrictive policy stance resulted in a large influx of cash in the front end of the curve.
U.S. Agency discount notes made the strongest contributions to Portfolio performance, due to the lack of supply in U.S. Treasury bills (“T-bills”) and the inability of certain types of investors to buy
agencies. (Contributions take weightings and total returns into account.) Within the U.S. agency sub-component, FNMA (The Federal National Mortgage Association, commonly known as Fannie Mae) and FHLMC (The Federal Home Loan Mortgage Corporation, commonly known as Freddie Mac) were the best performers. Increased yield differentials between Treasury securities and agencies also made agency debt more attractive.
Did the Portfolio make any significant purchases or sales during the reporting period?
The top issuers purchased by the Portfolio, outside of U.S. Treasury bills, included Federal Home Loan Banks, Federal Agricultural Mortgage Corporation (also known as Farmer Mac), Tennessee Valley Authority, Federal Farm Credit Banks Funding Corporation, FNMA and FHLMC. Throughout the reporting period, the fund sold T-Bills to cover redemptions and/or any cash shortfalls.
How did the Portfolio’s sector weightings change during the reporting period?
We reduced the Portfolio’s allocation to T-bills during the reporting period while increasing the Portfolio’s allocation to agency discount notes. We made these allocation changes to take advantage of the yield premium being offered on agency discount notes over matched duration Treasuries. In addition to the sector weighting changes, we shortened the Portfolio’s duration from 0.13 years to 0.02 years.
| 1. | See page 5 for more information on benchmark and peer group returns. |
| 2. | Duration is a measure of the price sensitivity of a fixed-income investment to changes in interest rates. Duration is expressed as a number of years and is considered a more accurate sensitivity gauge than average maturity. |
| 3. | The yield curve is a line that plots the yields of various securities of similar quality—typically U.S. Treasury issues—across a range of maturities. The U.S. Treasury yield curve serves as a benchmark for other debt and is used in economic forecasting. |
The opinions expressed are those of the Subadvisor as of the date of this report and are subject to change. There is no guarantee that any forecasts will come to pass. This material does not constitute investment advice and is not intended as an endorsement of any specific investment.
Not all MainStay VP Portfolios and/or share classes are available under all policies.
| 8 | MainStay VP U.S. Government Money Market Portfolio |
Portfolio of Investments December 31, 2022†
| | Principal
Amount | Value |
| Short-Term Investments 100.0% |
| Government Agency Debt 58.5% |
| Federal Agricultural Mortgage Corp. | | |
| 3.829%, due 1/5/23 | $ 50,000,000 | $ 49,978,778 |
| 4.122%, due 1/18/23 | 25,000,000 | 24,951,597 |
| 4.157%, due 2/1/23 | 20,000,000 | 19,928,872 |
| Federal Farm Credit Banks | | |
| 3.975%, due 1/4/23 | 50,000,000 | 49,983,500 |
| 4.066%, due 2/1/23 | 25,000,000 | 24,912,812 |
| Federal Home Loan Banks | | |
| 4.005%, due 1/3/23 | 30,000,000 | 29,993,347 |
| 4.047%, due 1/4/23 | 17,000,000 | 16,994,277 |
| 4.065%, due 1/25/23 | 30,000,000 | 29,919,000 |
| 4.078%, due 1/9/23 | 20,000,000 | 19,981,956 |
| 4.106%, due 1/30/23 | 22,000,000 | 21,927,516 |
| Federal National Mortgage Association | | |
| 3.862%, due 1/3/23 | 56,000,000 | 55,988,022 |
| 3.862%, due 1/5/23 | 50,000,000 | 49,978,611 |
| Tennessee Valley Authority | | |
| 3.828%, due 1/4/23 | 25,000,000 | 24,992,044 |
| 3.965%, due 1/11/23 | 67,000,000 | 66,926,333 |
| 4.059%, due 1/18/23 | 15,000,000 | 14,971,313 |
Total Government Agency Debt
(Cost $501,427,978) | | 501,427,978 |
| Treasury Debt 31.6% |
| U.S. Treasury Bills (a) | | |
| 3.69%, due 1/3/23 | 231,000,000 | 230,952,784 |
| 3.704%, due 1/10/23 | 30,000,000 | 29,972,303 |
| 3.728%, due 1/17/23 | 10,000,000 | 9,983,480 |
| U.S. Treasury Notes | | |
| 0.125%, due 1/31/23 | 10,000 | 9,984 |
Total Treasury Debt
(Cost $270,918,551) | | 270,918,551 |
| | Principal
Amount | | Value |
| |
| Treasury Repurchase Agreements 9.9% |
RBC Capital Markets LLC
4.25%, dated 12/30/22
due 1/3/23
Proceeds at Maturity $45,215,342
(Collateralized by United States Treasury securities with rates between 2.375% and 2.875% and maturity dates between 06/15/25 and 03/31/29, with a Principal Amount of $48,768,700 and a Market Value of $46,119,670) | 45,194,000 | | $ 45,194,000 |
TD Securities, Inc.
4.27%, dated 12/30/22
due 1/3/23
Proceeds at Maturity $40,018,978
(Collateralized by United States Treasury securities with rates between 0.125% and 2.875% and maturity dates between 02/28/23 and 07/31/26, with a Principal Amount of $41,958,700 and a Market Value of $40,800,087) | 40,000,000 | | 40,000,000 |
Total Treasury Repurchase Agreements
(Cost $85,194,000) | | | 85,194,000 |
Total Short-Term Investments
(Cost $857,540,529) | 100.0% | | 857,540,529 |
| Other Assets, Less Liabilities | (0.0)‡ | | (217,322) |
| Net Assets | 100.0% | | $ 857,323,207 |
| † | Percentages indicated are based on Portfolio net assets. |
| ‡ | Less than one-tenth of a percent. |
| (a) | Interest rate shown represents yield to maturity. |
The notes to the financial statements are an integral part of, and should be read in conjunction with, the financial statements.
9
Portfolio of Investments December 31, 2022† (continued)
The following is a summary of the fair valuations according to the inputs used as of December 31, 2022, for valuing the Portfolio’s assets:
| Description | Quoted
Prices in
Active
Markets for
Identical
Assets
(Level 1) | | Significant
Other
Observable
Inputs
(Level 2) | | Significant
Unobservable
Inputs
(Level 3) | | Total |
| Asset Valuation Inputs | | | | | | | |
| Investments in Securities (a) | | | | | | | |
| Short-Term Investments | | | | | | | |
| Government Agency Debt | $ — | | $ 501,427,978 | | $ — | | $ 501,427,978 |
| Treasury Debt | — | | 270,918,551 | | — | | 270,918,551 |
| Treasury Repurchase Agreements | — | | 85,194,000 | | — | | 85,194,000 |
| Total Investments in Securities | $ — | | $ 857,540,529 | | $ — | | $ 857,540,529 |
| (a) | For a complete listing of investments and their industries, see the Portfolio of Investments. |
The notes to the financial statements are an integral part of, and should be read in conjunction with, the financial statements.
| 10 | MainStay VP U.S. Government Money Market Portfolio |
Statement of Assets and Liabilities as of December 31, 2022
| Assets |
Investment in securities, at value
(amortized cost $772,346,529) | $772,346,529 |
Repurchase agreements, at value
(amortized cost $85,194,000) | 85,194,000 |
| Cash | 786 |
| Receivables: | |
| Interest | 20,165 |
| Other assets | 3,664 |
| Total assets | 857,565,144 |
| Liabilities |
| Payables: | |
| Manager (See Note 3) | 195,697 |
| Professional fees | 25,498 |
| Shareholder communication | 17,030 |
| Custodian | 3,573 |
| Accrued expenses | 139 |
| Total liabilities | 241,937 |
| Net assets | $857,323,207 |
| Composition of Net Assets |
| Shares of beneficial interest outstanding (par value of $.001 per share) unlimited number of shares authorized | $ 857,249 |
| Additional paid-in-capital | 856,465,664 |
| | 857,322,913 |
| Total distributable earnings (loss) | 294 |
| Net assets | $857,323,207 |
| Initial Class | |
| Net assets applicable to outstanding shares | $857,323,207 |
| Shares of beneficial interest outstanding | 857,249,373 |
| Net asset value per share outstanding | $ 1.00 |
The notes to the financial statements are an integral part of, and should be read in conjunction with, the financial statements.
11
Statement of Operations for the year ended December 31, 2022
| Investment Income (Loss) |
| Income | |
| Interest | $13,020,981 |
| Expenses | |
| Manager (See Note 3) | 3,028,429 |
| Professional fees | 82,288 |
| Shareholder communication | 32,684 |
| Custodian | 18,650 |
| Trustees | 15,564 |
| Miscellaneous | 14,547 |
| Total expenses before waiver/reimbursement | 3,192,162 |
| Expense waiver/reimbursement from Manager (See Note 3) | (1,321,749) |
| Net expenses | 1,870,413 |
| Net investment income (loss) | 11,150,568 |
| Realized Gain (Loss) |
| Net realized gain (loss) on investments | (14,591) |
| Net increase (decrease) in net assets resulting from operations | $11,135,977 |
The notes to the financial statements are an integral part of, and should be read in conjunction with, the financial statements.
| 12 | MainStay VP U.S. Government Money Market Portfolio |
Statements of Changes in Net Assets
for the years ended December 31, 2022 and December 31, 2021
| | 2022 | 2021 |
| Increase (Decrease) in Net Assets |
| Operations: | | |
| Net investment income (loss) | $ 11,150,568 | $ 70,668 |
| Net realized gain (loss) | (14,591) | 2,617 |
| Net increase (decrease) in net assets resulting from operations | 11,135,977 | 73,285 |
| Distributions to shareholders: | | |
| Initial Class | (11,150,567) | (70,685) |
| Capital share transactions: | | |
| Net proceeds from sales of shares | 767,061,320 | 565,120,376 |
| Net asset value of shares issued to shareholders in reinvestment of distributions | 11,150,567 | 65,395 |
| Cost of shares redeemed | (550,908,451) | (762,204,170) |
| Increase (decrease) in net assets derived from capital share transactions | 227,303,436 | (197,018,399) |
| Net increase (decrease) in net assets | 227,288,846 | (197,015,799) |
| Net Assets |
| Beginning of year | 630,034,361 | 827,050,160 |
| End of year | $ 857,323,207 | $ 630,034,361 |
The notes to the financial statements are an integral part of, and should be read in conjunction with, the financial statements.
13
Financial Highlights selected per share data and ratios
| | Year Ended December 31, |
| Initial Class | 2022 | | 2021 | | 2020 | | 2019 | | 2018 |
| Net asset value at beginning of year | $ 1.00 | | $ 1.00 | | $ 1.00 | | $ 1.00 | | $ 1.00 |
| Net investment income (loss) | 0.01 | | 0.00‡ | | 0.00‡ | | 0.02 | | 0.01 |
| Net realized and unrealized gain (loss) on investments | 0.00‡ | | 0.00 | | 0.00 | | 0.00 | | 0.00 |
| Total from investment operations | 0.01 | | 0.00‡ | | 0.00‡ | | 0.02 | | 0.01 |
| Less distributions: | | | | | | | | | |
| From net investment income | (0.01) | | (0.00)‡ | | 0.00‡ | | (0.02) | | (0.01) |
| Net asset value at end of year | $ 1.00 | | $ 1.00 | | $ 1.00 | | $ 1.00 | | $ 1.00 |
| Total investment return (a) | 1.29% | | 0.01% | | 0.24% | | 1.78% | | 1.38% |
| Ratios (to average net assets)/Supplemental Data: | | | | | | | | | |
| Net investment income (loss) | 1.40% | | 0.01% | | 0.15% | | 1.78% | | 1.37% |
| Net expenses | 0.24% | | 0.04% | | 0.16% | | 0.44% | | 0.44% |
| Expenses (before waiver/reimbursement) | 0.40% | | 0.41% | | 0.42% | | 0.44% | | 0.44% |
| Net assets at end of year (in 000's) | $ 857,323 | | $ 630,034 | | $ 827,050 | | $ 396,254 | | $ 512,490 |
| ‡ | Less than one cent per share. |
| (a) | Total return does not reflect any deduction of sales charges, mortality and expense charges, contract charges or administrative charges. For periods of less than one year, total return is not annualized. |
The notes to the financial statements are an integral part of, and should be read in conjunction with, the financial statements.
| 14 | MainStay VP U.S. Government Money Market Portfolio |
Notes to Financial Statements
Note 1–Organization and Business
MainStay VP Funds Trust (the “Fund”) was organized as a Delaware statutory trust on February 1, 2011. The Fund is registered under the Investment Company Act of 1940, as amended (the “1940 Act”), as an open-end management investment company. The Fund is comprised of thirty-one separate series (collectively referred to as the “Portfolios”). These financial statements and notes relate to the MainStay VP U.S. Government Money Market Portfolio (the "Portfolio"), a "diversified” portfolio, as that term is defined in the 1940 Act, as interpreted or modified by regulatory authorities having jurisdiction, from time to time.
Shares of the Portfolio are currently offered to certain separate accounts to fund variable annuity policies and variable universal life insurance policies issued by New York Life Insurance and Annuity Corporation (“NYLIAC”), a wholly-owned subsidiary of New York Life Insurance Company (“New York Life”) and may also be offered to fund variable annuity policies and variable universal life insurance policies issued by other insurance companies. NYLIAC allocates shares of the Portfolio to, among others, certain NYLIAC separate accounts. Shares of the Portfolio are also offered to the MainStay VP Conservative Allocation Portfolio, MainStay VP Moderate Allocation Portfolio, MainStay VP Growth Allocation Portfolio and MainStay VP Equity Allocation Portfolio, which operate as “funds-of-funds," and other variable insurance funds.
The following table lists the Portfolio's share class that has been registered and commenced operations:
| Class | Commenced Operations |
| Initial Class | January 29, 1993 |
Shares of the Portfolio are offered and are redeemed at a price equal to their respective net asset value (“NAV”) per share. No sales or redemption charge is applicable to the purchase or redemption of the Portfolio's shares.
The Portfolio's investment objective is to seek a high level of current income while preserving capital and maintaining liquidity.
Note 2–Significant Accounting Policies
The Portfolio is an investment company and accordingly follows the investment company accounting and reporting guidance of the Financial Accounting Standards Board (“FASB”) Accounting Standards Codification Topic 946 Financial Services—Investment Companies. The Portfolio prepares its financial statements in accordance with generally accepted accounting principles (“GAAP”) in the United States of America and follows the significant accounting policies described below.
(A) Valuation of Shares. The Portfolio seeks to maintain a NAV of $1.00 per share, although there is no assurance that it will be able to do so. An investment in the Portfolio, is not insured or guaranteed by the Federal Deposit Insurance Corporation or any other government agency. The Portfolio’s sponsor has no legal obligation to provide financial support to the Portfolio, and you should not expect that the sponsor will provide financial support to the Portfolio at any time.
(B) Securities Valuation. Investments are usually valued as of the close of regular trading on the New York Stock Exchange (the “Exchange”) (generally 4:00 p.m. Eastern time) on each day the Portfolio is open for business (“valuation date”). Securities are valued using the amortized cost method of valuation, unless the use of such method would be inappropriate per the requirements of Rule 2a-7 under the 1940 Act. The amortized cost method involves valuing a security at its cost on the date of purchase and thereafter assuming a constant amortization to maturity of the difference between such cost and the value on maturity date. Amortized cost approximates the current fair value of a security.
Effective September 8, 2022, and pursuant to Rule 2a-5 under the 1940 Act, the Board of Trustees of the Fund (the "Board") designated New York Life Investment Management LLC (“New York Life Investments” or the "Manager") as its Valuation Designee (the "Valuation Designee"). The Valuation Designee is responsible for performing fair valuations relating to all investments in the Portfolio’s portfolio for which market quotations are not readily available; periodically assessing and managing material valuation risks; establishing and applying fair value methodologies; testing fair valuation methodologies; evaluating and overseeing pricing services; ensuring appropriate segregation of valuation and portfolio management functions; providing quarterly, annual and prompt reporting to the Board, as appropriate; identifying potential conflicts of interest; and maintaining appropriate records. The Valuation Designee has established a valuation committee ("Valuation Committee") to assist in carrying out the Valuation Designee’s responsibilities and establish prices of securities for which market quotations are not readily available. The Portfolio’s and the Valuation Designee's policies and procedures ("Valuation Procedures") govern the Valuation Designee’s selection and application of methodologies for determining and calculating the fair value of Portfolio investments. The Valuation Designee may value the Portfolio's portfolio securities for which market quotations are not readily available and other Portfolio assets utilizing inputs from pricing services and other third-party sources (together, “Pricing Sources”). The Valuation Committee meets (in person, via electronic mail or via teleconference) on an ad-hoc basis to determine fair valuations and on a quarterly basis to review fair value events with respect to certain securities for which market quotations are not readily available, including valuation risks and back-testing results, and preview reports to the Board.
The Valuation Committee establishes prices of securities for which market quotations are not readily available based on such methodologies and measurements on a regular basis after considering information that is reasonably available and deemed relevant by the Valuation Committee. The Board shall oversee the Valuation Designee and review fair valuation materials on a prompt, quarterly and annual basis and approve proposed revisions to the Valuation Procedures.
Investments for which market quotations are not readily available are valued at fair value as determined in good faith pursuant to the Valuation Procedures. A market quotation is readily available only when that quotation is a quoted price (unadjusted) in active markets for identical investments that the Portfolio can access at the measurement date,
Notes to Financial Statements (continued)
provided that a quotation will not be readily available if it is not reliable. "Fair value" is defined as the price the Portfolio would reasonably expect to receive upon selling an asset or liability in an orderly transaction to an independent buyer in the principal or most advantageous market for the asset or liability. Fair value measurements are determined within a framework that establishes a three-tier hierarchy that maximizes the use of observable market data and minimizes the use of unobservable inputs to establish a classification of fair value measurements for disclosure purposes. "Inputs" refer broadly to the assumptions that market participants would use in pricing the asset or liability, including assumptions about risk, such as the risk inherent in a particular valuation technique used to measure fair value using a pricing model and/or the risk inherent in the inputs for the valuation technique. Inputs may be observable or unobservable. Observable inputs reflect the assumptions market participants would use in pricing the asset or liability based on market data obtained from sources independent of the Portfolio. Unobservable inputs reflect the Portfolio’s own assumptions about the assumptions market participants would use in pricing the asset or liability based on the information available. The inputs or methodology used for valuing assets or liabilities may not be an indication of the risks associated with investing in those assets or liabilities. The three-tier hierarchy of inputs is summarized below.
| • | Level 1—quoted prices (unadjusted) in active markets for an identical asset or liability |
| • | Level 2—other significant observable inputs (including quoted prices for a similar asset or liability in active markets, interest rates and yield curves, prepayment speeds, credit risk, etc.) |
| • | Level 3—significant unobservable inputs (including the Portfolio's own assumptions about the assumptions that market participants would use in measuring fair value of an asset or liability) |
Securities valued at amortized cost are not obtained from a quoted price in an active market and are generally categorized as Level 2 in the hierarchy. The level of an asset or liability within the fair value hierarchy is based on the lowest level of an input, both individually and in the aggregate, that is significant to the fair value measurement. As of December 31, 2022, the aggregate value by input level of the Portfolio’s assets and liabilities is included at the end of the Portfolio of Investments.
The Portfolio may use third-party vendor evaluations, whose prices may be derived from one or more of the following standard inputs, among others:
| • Benchmark yields | • Reported trades |
| • Broker/dealer quotes | • Issuer spreads |
| • Two-sided markets | • Benchmark securities |
| • Bids/offers | • Reference data (corporate actions or material event notices) |
| • Industry and economic events | • Comparable bonds |
| • Monthly payment information | |
An asset or liability for which market values cannot be measured using the methodologies described above is valued by methods deemed reasonable in good faith by the Valuation Committee, following the procedures established by the Board, to represent fair value. Under these procedures, the Portfolio may utilize some of the following fair value techniques: multi-dimensional relational pricing models and option adjusted spread pricing. During the year ended December 31, 2022, there were no material changes to the fair value methodologies. Securities valued in this manner are generally categorized as Level 3 in the hierarchy. No securities held by the Portfolio as of December 31, 2022, were fair valued in such a manner.
Temporary cash investments acquired in excess of 60 days to maturity at the time of purchase are valued using the latest bid prices or using valuations based on a matrix system (which considers such factors as security prices, yields, maturities and ratings), both as furnished by independent pricing services. Temporary cash investments that mature in 60 days or less at the time of purchase ("Short-Term Investments") are valued using the amortized cost method of valuation, unless the use of such method would be inappropriate. The amortized cost method involves valuing a security at its cost on the date of purchase and thereafter assuming a constant amortization to maturity of the difference between such cost and the value on maturity date. Amortized cost approximates the current fair value of a security. Securities valued using the amortized cost method are not valued using quoted prices in an active market and are generally categorized as Level 2 in the hierarchy.
The information above is not intended to reflect an exhaustive list of the methodologies that may be used to value portfolio investments. The Valuation Procedures permit the use of a variety of valuation methodologies in connection with valuing portfolio investments. The methodology used for a specific type of investment may vary based on the market data available or other considerations. The methodologies summarized above may not represent the specific means by which portfolio investments are valued on any particular business day.
(C) Income Taxes. The Portfolio's policy is to comply with the requirements of the Internal Revenue Code of 1986, as amended (the “Internal Revenue Code”), applicable to regulated investment companies and to distribute all of its taxable income to the shareholders of the Portfolio within the allowable time limits.
The Manager evaluates the Portfolio’s tax positions to determine if the tax positions taken meet the minimum recognition threshold in connection with accounting for uncertainties in income tax positions taken or expected to be taken for the purposes of measuring and recognizing tax liabilities in the financial statements. Recognition of tax benefits of an uncertain tax position is permitted only to the extent the position is “more likely than not” to be sustained assuming examination by taxing authorities. The Manager analyzed the Portfolio's tax positions taken on federal, state and local income tax returns for all open tax years (for up to three tax years) and has concluded that no provisions for federal, state and local income tax are required in the Portfolio's financial statements. The Portfolio's federal, state and local income tax and federal excise tax
| 16 | MainStay VP U.S. Government Money Market Portfolio |
returns for tax years for which the applicable statutes of limitations have not expired are subject to examination by the Internal Revenue Service and state and local departments of revenue.
(D) Dividends and Distributions to Shareholders. Dividends and distributions are recorded on the ex-dividend date. The Portfolio intends to declare dividends from net investment income, if any, daily and intends to pay them at least monthly and declares and pays distributions from net realized capital and currency gains, if any, at least annually. All dividends and distributions are reinvested at NAV in the same class of shares of the Portfolio. Dividends and distributions to shareholders are determined in accordance with federal income tax regulations and may differ from determinations using GAAP.
(E) Security Transactions and Investment Income. The Portfolio records security transactions on the trade date. Realized gains and losses on security transactions are determined using the identified cost method. Dividend income is recognized on the ex-dividend date, net of any foreign tax withheld at the source, and interest income is accrued as earned using the effective interest rate method. Distributions received from real estate investment trusts may be classified as dividends, capital gains and/or return of capital.
(F) Expenses. Expenses of the Fund are allocated to the individual Funds in proportion to the net assets of the respective Portfolios when the expenses are incurred, except where direct allocations of expenses can be made. The expenses borne by the Portfolio, including those of related parties to the Portfolio, are shown in the Statement of Operations.
(G) Use of Estimates. In preparing financial statements in conformity with GAAP, the Manager makes estimates and assumptions that affect the reported amounts and disclosures in the financial statements. Actual results could differ from those estimates and assumptions.
(H) Repurchase Agreements. The Portfolio may enter into repurchase agreements (i.e., buy a security from another party with the agreement that it will be sold back in the future) to earn income. The Portfolio may enter into repurchase agreements only with counterparties, usually financial institutions, that are deemed by the Manager or the Subadvisor to be creditworthy, pursuant to guidelines established by the Board. During the term of any repurchase agreement, the Manager or the Subadvisor will continue to monitor the creditworthiness of the counterparty. Under the 1940 Act, repurchase agreements are considered to be collateralized loans by the Portfolio to the counterparty secured by the securities transferred to the Portfolio.
Repurchase agreements are subject to counterparty risk, meaning the Portfolio could lose money by the counterparty’s failure to perform under the terms of the agreement. The Portfolio mitigates this risk by ensuring the repurchase agreement is collateralized by cash, U.S. government securities, fixed income securities and/or other securities. The collateral is held by the Portfolio's custodian and valued daily on a mark to market basis to determine if the value, including accrued interest, exceeds the repurchase price. In the event of the counterparty’s default on the obligation to repurchase, the Portfolio has the right to liquidate the
collateral and apply the proceeds in satisfaction of the obligation. Under certain circumstances, such as in the event of default or bankruptcy by the counterparty, realization and/or retention of the collateral may be limited or subject to delay, to legal proceedings and possible realized loss to the Portfolio. Repurchase agreements as of December 31, 2022, are shown in the Portfolio of Investments.
(I) Debt Securities Risk. The ability of issuers of debt securities held by the Portfolio to meet their obligations may be affected by, among other things, economic or political developments in a specific country, industry or region. Debt securities are also subject to the risks associated with changes in interest rates.
Investments in the Portfolio are not guaranteed, even though some of the Portfolio’s underlying investments are guaranteed by the U.S. government or its agencies or instrumentalities. The principal risk of mortgage-related and asset-backed securities is that the underlying debt may be prepaid ahead of schedule, if interest rates fall, thereby reducing the value of the Portfolio’s investment. If interest rates rise, less of the debt may be prepaid and the Portfolio may lose money because the Portfolio may be unable to invest in higher yielding assets. The Portfolio is subject to interest-rate risk and can lose principal value when interest rates rise. Bonds are also subject to credit risk, in which the bond issuer may fail to pay interest and principal in a timely manner.
(J) LIBOR Replacement Risk. The Portfolio may invest in certain debt securities, derivatives or other financial instruments that utilize the London Interbank Offered Rate ("LIBOR"), as a “benchmark” or “reference rate” for various interest rate calculations. As of January 1, 2022, the United Kingdom Financial Conduct Authority, which regulates LIBOR, ceased its active encouragement of banks to provide the quotations needed to sustain most LIBOR rates due to the absence of an active market for interbank unsecured lending and other reasons. However, the United Kingdom Financial Conduct Authority, the LIBOR administrator and other regulators announced that the most widely used tenors of U.S. dollar LIBOR will continue until mid-2023. As a result, it is anticipated that the remaining LIBOR settings will be discontinued or will no longer be sufficiently robust to be representative of its underlying market around that time. Various financial industry groups will plan for that transition and certain regulators and industry groups have taken actions to establish alternative reference rates (e.g., the Secured Overnight Financing Rate, which measures the cost of overnight borrowings through repurchase agreement transactions collateralized with U.S. Treasury securities and is intended to replace U.S. dollar LIBOR with certain adjustments). However, there are challenges to converting certain contracts and transactions to a new benchmark and neither the full effects of the transition process nor its ultimate outcome is known.
The elimination of LIBOR or changes to other reference rates or any other changes or reforms to the determination or supervision of reference rates could have an adverse impact on the market for, or value of, any securities or payments linked to those reference rates, which may adversely affect the Portfolio's performance and/or net asset value. Uncertainty and risk also remain regarding the willingness and ability of
Notes to Financial Statements (continued)
issuers and lenders to include enhanced provisions in new and existing contracts or instruments. Consequently, the transition away from LIBOR to other reference rates may lead to increased volatility and illiquidity in markets that are tied to LIBOR, fluctuations in values of LIBOR-related investments or investments in issuers that utilize LIBOR, increased difficulty in borrowing or refinancing and diminished effectiveness of hedging strategies, adversely affecting the Portfolio's performance. Furthermore, the risks associated with the expected discontinuation of LIBOR and transition may be exacerbated if the work necessary to effect an orderly transition to an alternative reference rate is not completed in a timely manner. While the transition away from LIBOR has already begun with no material adverse effect to the Portfolio's performance, the transition is expected to last through mid-2023 for some LIBOR tenors. The usefulness of LIBOR as a benchmark could deteriorate anytime during this transition period.
(K) Indemnifications. Under the Fund’s organizational documents, its officers and trustees are indemnified against certain liabilities that may arise out of performance of their duties to the Fund. Additionally, in the normal course of business, the Portfolio enters into contracts with third-party service providers that contain a variety of representations and warranties and that may provide general indemnifications. The Portfolio's maximum exposure under these arrangements is unknown, as this would involve future claims that may be made against the Portfolio that have not yet occurred. The Manager believes that the risk of loss in connection with these potential indemnification obligations is remote. However, there can be no assurance that material liabilities related to such obligations will not arise in the future, which could adversely impact the Portfolio.
Note 3–Fees and Related Party Transactions
(A) Manager and Subadvisor. New York Life Investments, a registered investment adviser and an indirect, wholly-owned subsidiary of New York Life, serves as the Portfolio's Manager pursuant to an Amended and Restated Management Agreement ("Management Agreement"). The Manager provides offices, conducts clerical, recordkeeping and bookkeeping services and keeps most of the financial and accounting records required to be maintained by the Portfolio. Except for the portion of salaries and expenses that are the responsibility of the Portfolio, the Manager pays the salaries and expenses of all personnel affiliated with the Portfolio and certain operational expenses of the Portfolio. During a portion of the year ended December 31, 2022, the Portfolio reimbursed New York Life Investments in an amount equal to the portion of the compensation of the Chief Compliance Officer attributable to the Portfolio. NYL Investors LLC ("NYL Investors" or ''Subadvisor''), a registered investment adviser and a direct, wholly-owned subsidiary of New York Life, serves as the Subadvisor to the Portfolio and is responsible for the day-to-day portfolio management of the Portfolio. Pursuant to the terms of a Subadvisory Agreement between New York Life Investments and NYL Investors, New York Life Investments pays for the services of the Subadvisor.
The Fund, on behalf of the Portfolio, pays New York Life Investments in its capacity as the Portfolio’s investment manager and administrator, pursuant to the Management Agreement, a monthly fee for the services performed and the facilities furnished at an annual rate of 0.40% up to $500 million; 0.35% from $500 million to $1 billion; and 0.30% in excess of $1 billion.
New York Life Investments has contractually agreed to waive fees and/or reimburse expenses so that total annual operating expenses (excluding taxes, interest, litigation, extraordinary expenses, brokerage and other transaction expenses relating to the purchase or sale of portfolio investments and acquired (underlying) fund fees and expenses) of Initial Class shares do not exceed 0.28% of average daily net assets. This agreement will remain in effect until May 1, 2023 and shall renew automatically for one-year terms unless New York Life Investments provides written notice of termination prior to the start of the next term or upon approval of the Board. During the year ended December 31, 2022, the effective management fee rate was 0.38%.
New York Life Investments may voluntarily waive fees or reimburse expenses of the Fund to the extent it deems appropriate to enhance the yield of the Fund’s during periods when expenses have a significant impact on the yield of the Fund, as applicable, because of low interest rates. This expense limitation policy is voluntary and in addition to any contractual arrangements that may be in place with respect to the Fund and described in the Fund’s prospectus.
During the year ended December 31, 2022, New York Life Investments earned fees from the Portfolio in the amount of $3,028,429 and paid the Subadvisor in the amount of $1,029,505. Additionally, New York Life Investments reimbursed expenses in the amount of $1,321,749, without which the Portfolio's total returns would have been lower.
JPMorgan provides sub-administration and sub-accounting services to the Portfolio pursuant to an agreement with New York Life Investments. These services include calculating the daily NAVs of the Portfolio, maintaining the general ledger and sub-ledger accounts for the calculation of the Portfolio's NAVs, and assisting New York Life Investments in conducting various aspects of the Portfolio's administrative operations. For providing these services to the Portfolio, JPMorgan is compensated by New York Life Investments.
Pursuant to an agreement between the Fund and New York Life Investments, New York Life Investments is responsible for providing or procuring certain regulatory reporting services for the Portfolio. The Portfolio will reimburse New York Life Investments for the actual costs incurred by New York Life Investments in connection with providing or procuring these services for the Portfolio.
| 18 | MainStay VP U.S. Government Money Market Portfolio |
Note 4-Federal Income Tax
The amortized cost also represents the aggregate cost for federal income tax purposes.
As of December 31, 2022, the components of accumulated gain (loss) on a tax basis were as follows:
Ordinary
Income | Accumulated
Capital
and Other
Gain (Loss) | Other
Temporary
Differences | Unrealized
Appreciation
(Depreciation) | Total
Accumulated
Gain (Loss) |
| $14,885 | $(14,591) | $— | $— | $294 |
As of December 31, 2022, for federal income tax purposes, capital loss carryforwards of $14,591, as shown in the table below, were available to the extent provided by the regulations to offset future realized gains of the Portfolio. Accordingly, no capital gains distributions are expected to be paid to shareholders until net gains have been realized in excess of such amounts.
Capital Loss
Available Through | Short-Term
Capital Loss
Amounts (000’s) | Long-Term
Capital Loss
Amounts (000’s) |
| Unlimited | $15 | $— |
During the years ended December 31, 2022 and December 31, 2021, the tax character of distributions paid as reflected in the Statements of Changes in Net Assets was as follows:
| | 2022 | 2021 |
| Distributions paid from: | | |
| Ordinary Income | $11,150,567 | $70,685 |
Note 5–Custodian
JPMorgan is the custodian of cash and securities held by the Portfolio. Custodial fees are charged to the Portfolio based on the Portfolio's net assets and/or the market value of securities held by the Portfolio and the number of certain transactions incurred by the Portfolio.
Note 6–Capital Share Transactions
Transactions in capital shares for the years ended December 31, 2022 and December 31, 2021, were as follows:
| Initial Class (at $1 per share) | Shares |
| Year ended December 31, 2022: | |
| Shares sold | 766,984,622 |
| Shares issued to shareholders in reinvestment of distributions | 11,149,452 |
| Shares redeemed | (550,853,367) |
| Net increase (decrease) | 227,280,707 |
| Year ended December 31, 2021: | |
| Shares sold | 565,063,871 |
| Shares issued to shareholders in reinvestment of distributions | 65,388 |
| Shares redeemed | (762,127,958) |
| Net increase (decrease) | (196,998,699) |
Note 7–Other Matters
As of the date of this report, interest rates in the United States and many parts of the world, including certain European countries, are ascending from historically low levels. Thus, the Portfolio currently faces a heightened level of risk associated with rising interest rates. This could be driven by a variety of factors, including but not limited to central bank monetary policies, changing inflation or real growth rates, general economic conditions, increasing bond issuances or reduced market demand for low yielding investments.
An outbreak of COVID-19, first detected in December 2019, has developed into a global pandemic and has resulted in travel restrictions, closure of international borders, certain businesses and securities markets, restrictions on securities trading activities, prolonged quarantines, supply chain disruptions, and lower consumer demand, as well as general concern and uncertainty. In 2022, many countries lifted some or all restrictions related to COVID-19. However, the continued impact of COVID-19 and related variants is uncertain and could further adversely affect the global economy, national economies, individual issuers and capital markets in unforeseeable ways and result in a substantial and extended economic downturn. Developments that disrupt global economies and financial markets, such as COVID-19, may magnify factors that affect the Portfolio's performance.
Note 8–Subsequent Events
In connection with the preparation of the financial statements of the Portfolio as of and for the year ended December 31, 2022, events and transactions subsequent to December 31, 2022, through the date the financial statements were issued have been evaluated by the Manager for possible adjustment and/or disclosure. No subsequent events requiring financial statement adjustment or disclosure have been identified.
Report of Independent Registered Public Accounting Firm
To the Board of Trustees of MainStay VP Funds Trust and Shareholders of
MainStay VP U.S. Government Money Market Portfolio
Opinion on the Financial Statements
We have audited the accompanying statement of assets and liabilities, including the portfolio of investments, of MainStay VP U.S. Government Money Market Portfolio (one of the portfolios constituting MainStay VP Funds Trust, referred to hereafter as the “Portfolio”) as of December 31, 2022, the related statement of operations for the year ended December 31, 2022, the statements of changes in net assets for each of the two years in the period ended December 31, 2022, including the related notes, and the financial highlights for each of the five years in the period ended December 31, 2022 (collectively referred to as the “financial statements”). In our opinion, the financial statements present fairly, in all material respects, the financial position of the Portfolio as of December 31, 2022, the results of its operations for the year then ended, the changes in its net assets for each of the two years in the period ended December 31, 2022 and the financial highlights for each of the five years in the period ended December 31, 2022 in conformity with accounting principles generally accepted in the United States of America.
Basis for Opinion
These financial statements are the responsibility of the Portfolio’s management. Our responsibility is to express an opinion on the Portfolio’s financial statements based on our audits. We are a public accounting firm registered with the Public Company Accounting Oversight Board (United States) (PCAOB) and are required to be independent with respect to the Portfolio in accordance with the U.S. federal securities laws and the applicable rules and regulations of the Securities and Exchange Commission and the PCAOB.
We conducted our audits of these financial statements in accordance with the standards of the PCAOB. Those standards require that we plan and perform the audit to obtain reasonable assurance about whether the financial statements are free of material misstatement, whether due to error or fraud.
Our audits included performing procedures to assess the risks of material misstatement of the financial statements, whether due to error or fraud, and performing procedures that respond to those risks. Such procedures included examining, on a test basis, evidence regarding the amounts and disclosures in the financial statements. Our audits also included evaluating the accounting principles used and significant estimates made by management, as well as evaluating the overall presentation of the financial statements. Our procedures included confirmation of securities owned as of December 31, 2022 by correspondence with the custodian and brokers. We believe that our audits provide a reasonable basis for our opinion.
/s/PricewaterhouseCoopers LLP
New York, New York
February 24, 2023
We have served as the auditor of one or more investment companies in the MainStay group of funds since 1984.
| 20 | MainStay VP U.S. Government Money Market Portfolio |
Board Consideration and Approval of Management Agreement and Subadvisory Agreement (Unaudited)
The continuation of the Management Agreement with respect to the MainStay VP U.S. Government Money Market Portfolio (“Portfolio”) and New York Life Investment Management LLC (“New York Life Investments”) and the Subadvisory Agreement between New York Life Investments and NYL Investors LLC (“NYL Investors”) with respect to the Portfolio (together, “Advisory Agreements”) is subject to annual review and approval by the Board of Trustees of MainStay VP Funds Trust (“Board” of the “Trust”) in accordance with Section 15 of the Investment Company Act of 1940, as amended (“1940 Act”). At its December 6–7, 2022 meeting, the Board, which is comprised solely of Trustees who are not an “interested person” (as such term is defined in the 1940 Act) of the Trust (“Independent Trustees”), unanimously approved the continuation of each of the Advisory Agreements for a one-year period.
In reaching the decision to approve the continuation of each of the Advisory Agreements, the Board considered information and materials furnished by New York Life Investments and NYL Investors in connection with an annual contract review process undertaken by the Board that took place at meetings of the Board and its Contracts Committee during October 2022 through December 2022, including information and materials furnished by New York Life Investments and NYL Investors in response to requests prepared on behalf of the Board, and in consultation with the Board, by independent legal counsel to the Independent Trustees, which encompassed a variety of topics, including those summarized below. Information and materials requested by and furnished to the Board for consideration in connection with the contract review process included, among other items, reports on the Portfolio and “peer funds” prepared by Institutional Shareholder Services Inc. (“ISS”), an independent third-party service provider engaged by the Board to report objectively on the Portfolio’s investment performance, management fee and total expenses. The Board also considered information on the fees charged to other investment advisory clients of New York Life Investments and/or NYL Investors that follow investment strategies similar to those of the Portfolio, if any, and, when applicable, the rationale for any differences in the Portfolio’s management and subadvisory fees and the fees charged to those other investment advisory clients. In addition, the Board considered information regarding the legal standards and fiduciary obligations applicable to its consideration of the continuation of each of the Advisory Agreements. The contract review process, including the structure and format for information and materials provided to the Board, has been developed in consultation with the Board. The Independent Trustees also met in executive sessions with their independent legal counsel and, for portions thereof, with senior management of New York Life Investments.
The Board’s deliberations with respect to the continuation of each of the Advisory Agreements reflect a year-long process, and the Board also took into account information furnished to the Board and its Committees throughout the year, as deemed relevant and appropriate by the Trustees, including, among other items, reports on investment performance of the Portfolio and investment-related matters for the Portfolio as well as presentations from New York Life Investments and, generally annually, NYL Investors personnel. In addition, the Board took into account other
information received from New York Life Investments throughout the year, including, among other items, periodic reports on legal and compliance matters, risk management, portfolio turnover, brokerage commissions and non-advisory services provided to the Portfolio by New York Life Investments, as deemed relevant and appropriate by the Trustees.
In addition to information provided to the Board throughout the year, the Board received information in connection with its June 2022 meeting provided specifically in response to requests prepared on behalf of the Board, and in consultation with the Board, by independent legal counsel to the Independent Trustees regarding the Portfolio’s distribution arrangements. In addition, the Board received information regarding the Portfolio’s asset levels, share purchase and redemption activity and the payment of Rule 12b-1 and/or other fees by the share class of the Portfolio, among other information.
In considering the continuation of each of the Advisory Agreements, the Trustees reviewed and evaluated the information and factors they believed to reasonably be necessary and appropriate in light of legal advice furnished to them by independent legal counsel to the Independent Trustees and through the exercise of their own business judgment. Although individual Trustees may have weighed certain factors or information differently and the Board did not consider any single factor or information controlling in reaching its decision, the factors considered by the Board are summarized in more detail below and include, among other factors: (i) the nature, extent and quality of the services provided to the Portfolio by New York Life Investments and NYL Investors; (ii) the qualifications of the portfolio managers of the Portfolio and the historical investment performance of the Portfolio, New York Life Investments and NYL Investors; (iii) the costs of the services provided, and profits realized, by New York Life Investments and NYL Investors with respect to their relationships with the Portfolio; (iv) the extent to which economies of scale have been realized or may be realized if the Portfolio grows and the extent to which any economies of scale have been shared, have benefited or may benefit the Portfolio’s shareholders; and (v) the reasonableness of the Portfolio’s management and subadvisory fees and total ordinary operating expenses. Although the Board recognized that comparisons between the Portfolio’s fees and expenses and those of other funds are imprecise given different terms of agreements, variations in fund strategies and other factors, the Board considered the reasonableness of the Portfolio’s management fee and total ordinary operating expenses as compared to the peer funds identified by ISS. Throughout their considerations, the Trustees acknowledged the commitment of New York Life Investments and its affiliates to serve the MainStay Group of Funds, as well as their capacity, experience, resources, financial stability and reputations. The Trustees also acknowledged the entrepreneurial and other risks assumed by New York Life Investments in sponsoring and managing the Portfolio. With respect to the Subadvisory Agreement, the Board took into account New York Life Investments’ recommendation to approve the continuation of the Subadvisory Agreement.
The Trustees noted that, throughout the year, the Trustees are afforded an opportunity to ask questions of, and request additional information or materials from, New York Life Investments and NYL Investors. The Board’s
Board Consideration and Approval of Management Agreement and Subadvisory Agreement (Unaudited) (continued)
decision with respect to each of the Advisory Agreements may have also been based, in part, on the Board’s knowledge of New York Life Investments and NYL Investors resulting from, among other things, the Board’s consideration of each of the Advisory Agreements in prior years, the advisory agreements for other funds in the MainStay Group of Funds, the Board’s review throughout the year of the performance and operations of other funds in the MainStay Group of Funds and each Trustee’s business judgment and industry experience. In addition to considering the above-referenced factors, the Board observed that in the marketplace, notably under variable life insurance policies and variable annuity contracts for which the Portfolio serves as an investment option, there are a range of investment options available to investors and that the Portfolio’s shareholders, having had the opportunity to consider other investment options, have chosen to invest in the Portfolio.
The factors that figured prominently in the Board’s decision to approve the continuation of each of the Advisory Agreements during its December 6–7, 2022 meeting are summarized in more detail below.
Nature, Extent and Quality of Services Provided by New York Life Investments and NYL Investors
The Board examined the nature, extent and quality of the services that New York Life Investments provides to the Portfolio. The Board evaluated New York Life Investments’ experience and capabilities in serving as manager of the Portfolio and considered that the Portfolio operates in a “manager-of-managers” structure. The Board also considered New York Life Investments’ responsibilities and services provided pursuant to this structure, including overseeing the services provided by NYL Investors, evaluating the performance of NYL Investors, making recommendations to the Board as to whether the Subadvisory Agreement should be renewed, modified or terminated and periodically reporting to the Board regarding the results of New York Life Investments’ evaluation and monitoring functions. The Board noted that New York Life Investments manages other mutual funds, serves a variety of other investment advisory clients, including other pooled investment vehicles, and has experience overseeing mutual fund service providers, including subadvisors. The Board considered the experience of senior personnel at New York Life Investments providing management and administrative and other non-advisory services to the Portfolio. The Board observed that New York Life Investments devotes significant resources and time to providing management and administrative and other non-advisory services to the Portfolio, including New York Life Investments’ oversight and due diligence reviews of NYL Investors and ongoing analysis of, and interactions with, NYL Investors with respect to, among other things, the Portfolio’s investment performance and risks as well as NYL Investors’ investment capabilities and subadvisory services with respect to the Portfolio.
The Board also considered the range of services that New York Life Investments provides to the Portfolio under the terms of the Management Agreement, including: (i) fund accounting and ongoing supervisory services provided by New York Life Investments’ Fund Administration and Accounting Group; (ii) investment supervisory and analytical services
provided by New York Life Investments’ Investment Consulting Group; (iii) compliance services provided by the Trust’s Chief Compliance Officer as well as New York Life Investments’ compliance department, including supervision and implementation of the Portfolio’s compliance program; (iv) legal services provided by New York Life Investments’ Office of the General Counsel; and (v) risk management monitoring and analysis by compliance and investment personnel. In addition, the Board considered New York Life Investments’ willingness to invest in personnel and other resources, such as cyber security, information security and business continuity planning, designed to benefit the Portfolio and noted that New York Life Investments is responsible for compensating the Trust’s officers, except for a portion of the salary of the Trust’s Chief Compliance Officer. The Board recognized that New York Life Investments provides certain other non-advisory services to the Portfolio and has provided an increasingly broad array of non-advisory services to the MainStay Group of Funds as a result of regulatory and other developments, including in connection with the implementation of the MainStay Group of Funds’ derivatives risk management program and policies and procedures adopted pursuant to Rule 18f-4 under the 1940 Act.
The Board also examined the range, and the nature, extent and quality, of the investment advisory services that NYL Investors provides to the Portfolio and considered the terms of each of the Advisory Agreements. The Board evaluated NYL Investors’ experience and performance in serving as subadvisor to the Portfolio and advising other portfolios and NYL Investors’ track record and experience in providing investment advisory services, the experience of investment advisory, senior management and administrative personnel at NYL Investors. The Board considered New York Life Investments’ and NYL Investors’ overall resources, legal and compliance environment, capabilities, reputation, financial condition and history. In addition to information provided in connection with quarterly meetings with the Trust’s Chief Compliance Officer, the Board considered information regarding the compliance policies and procedures of New York Life Investments and NYL Investors and acknowledged their commitment to further developing and strengthening compliance programs relating to the Portfolio. The Board also considered NYL Investors’ ability to recruit and retain qualified investment professionals and willingness to invest in personnel and other resources to service and support the Portfolio. In this regard, the Board considered the qualifications and experience of the Portfolio’s portfolio managers, the number of accounts managed by the portfolio managers and the method for compensating the portfolio managers.
In addition, the Board considered information provided by New York Life Investments and NYL Investors regarding the operations of their respective business continuity plans in response to the COVID-19 pandemic and the continued remote work environment.
Based on these considerations, among others, the Board concluded that the Portfolio would likely continue to benefit from the nature, extent and quality of these services.
| 22 | MainStay VP U.S. Government Money Market Portfolio |
Investment Performance
In evaluating the Portfolio’s investment performance, the Board considered investment performance results over various periods in light of the Portfolio’s investment objective, strategies and risks. The Board considered investment reports on, and analysis of, the Portfolio’s performance provided to the Board throughout the year. These reports include, among other items, information on the Portfolio’s gross and net returns, the Portfolio’s investment performance compared to a relevant investment category and the Portfolio’s benchmark, the Portfolio’s risk-adjusted investment performance and the Portfolio’s investment performance as compared to peer funds, as appropriate, as well as portfolio attribution information and commentary on the effect of market conditions. The Board also considered information provided by ISS showing the investment performance of the Portfolio as compared to peer funds. In addition, the Board reviewed the methodology used by ISS to construct the group of peer funds for comparative purposes.
The Board also took into account its discussions with senior management at New York Life Investments concerning the Portfolio’s investment performance over various periods as well as discussions between the Portfolio’s portfolio management team and the members of the Board’s Investment Committee, which generally occur on an annual basis. In addition, the Board considered any specific actions that New York Life Investments or NYL Investors had taken, or had agreed to take, to seek to enhance Portfolio investment performance and the results of those actions.
Based on these considerations, among others, the Board concluded that its review of the Portfolio’s investment performance and related information supported a determination to approve the continuation of each of the Advisory Agreements.
Costs of the Services Provided, and Profits and Other Benefits Realized, by New York Life Investments and NYL Investors
The Board considered the costs of the services provided under each of the Advisory Agreements. The Board also considered the profits realized by New York Life Investments and its affiliates, including NYL Investors, due to their relationships with the Portfolio as well as the MainStay Group of Funds. Because NYL Investors is an affiliate of New York Life Investments whose subadvisory fee is paid by New York Life Investments, not the Portfolio, the Board considered cost and profitability information for New York Life Investments and NYL Investors in the aggregate.
In addition, the Board acknowledged the difficulty in obtaining reliable comparative data about mutual fund managers’ profitability because such information generally is not publicly available and may be impacted by numerous factors, including the structure of a fund manager’s organization, the types of funds it manages, the methodology used to allocate certain fixed costs to specific funds and the manager’s capital structure and costs of capital.
In evaluating the costs of the services provided by New York Life Investments and NYL Investors and profits realized by New York Life Investments and its affiliates, including NYL Investors, the Board considered, among other factors, New York Life Investments’ and its affiliates’, including NYL Investors’, continuing investments in, or willingness to invest in, personnel and other resources to support and further enhance the management of the Portfolio, and that New York Life Investments is responsible for paying the subadvisory fee for the Portfolio. The Board also considered the financial resources of New York Life Investments and NYL Investors and acknowledged that New York Life Investments and NYL Investors must be in a position to recruit and retain experienced professional personnel and to maintain a strong financial position for New York Life Investments and NYL Investors to continue to provide high-quality services to the Portfolio. The Board recognized that the Portfolio benefits from the allocation of certain fixed costs among the funds in the MainStay Group of Funds, among other expected benefits resulting from its relationship with New York Life Investments.
The Board considered information regarding New York Life Investments’ methodology for calculating profitability and allocating costs provided by New York Life Investments in connection with the fund profitability analysis presented to the Board. The Board noted it had previously engaged an independent consultant to review the methods used to allocate costs among the funds in the MainStay Group of Funds. The Board also noted that the independent consultant had concluded that New York Life Investments’ methods for allocating costs and procedures for estimating overall profitability of the relationship with the funds in the MainStay Group of Funds are reasonable and that New York Life Investments continued to use the same method of calculating profit and allocating costs since the independent consultant’s review. The Board recognized the difficulty in calculating and evaluating a manager’s profitability with respect to the Portfolio and considered that other profitability methodologies may also be reasonable.
The Board also considered certain fall-out benefits that may be realized by New York Life Investments and its affiliates due to their relationships with the Portfolio, including reputational and other indirect benefits. In addition, the Board considered the potential dividend received tax deduction for insurance company affiliates of New York Life Investments from the Portfolio’s securities lending activity.
The Board noted that the Portfolio serves as an investment option primarily under variable contracts issued by affiliates of New York Life Investments that would receive fees under those contracts. The Board observed that, in addition to fees earned by New York Life Investments under the Management Agreement for managing the Portfolio, New York Life Investments’ affiliates also earn revenues from serving the Portfolio in various other capacities, including as the Portfolio’s distributor. The Board considered information about these other revenues and their impact on the profitability of the relationship with the Portfolio to New York Life Investments and its affiliates. The Board noted that, although it assessed the overall profitability of the relationship with the Portfolio to New York Life Investments and its affiliates as part of the contract review process, when considering the reasonableness of the fee paid to New York Life
Board Consideration and Approval of Management Agreement and Subadvisory Agreement (Unaudited) (continued)
Investments under the Management Agreement, the Board considered the profitability of New York Life Investments’ relationship with the Portfolio on a pre-tax basis and without regard to distribution expenses incurred by New York Life Investments from its own resources.
After evaluating the information deemed relevant by the Trustees, the Board concluded that any profits realized by New York Life Investments and its affiliates, including NYL Investors, due to their relationships with the Portfolio were not excessive and other benefits that may accrue to New York Life Investments and its affiliates, including NYL Investors, are reasonable.
Management and Subadvisory Fees and Total Ordinary Operating Expenses
The Board evaluated the reasonableness of the fee paid under each of the Advisory Agreements and the Portfolio’s total ordinary operating expenses. The Board primarily considered the reasonableness of the management fee paid by the Portfolio to New York Life Investments because the subadvisory fee paid to NYL Investors is paid by New York Life Investments, not the Portfolio. The Board also considered the reasonableness of the subadvisory fee paid by New York Life Investments and the amount of the management fee retained by New York Life Investments.
In assessing the reasonableness of the Portfolio’s fees and expenses, the Board primarily considered comparative data provided by ISS on the fees and expenses charged by similar mutual funds managed by other investment advisers. The Board reviewed the methodology used by ISS to construct the group of peer funds for comparative purposes. In addition, the Board considered information provided by New York Life Investments and NYL Investors on fees charged to other investment advisory clients, including institutional separate accounts and/or other funds that follow investment strategies similar to those of the Portfolio, if any. The Board considered the contractual management fee schedules of the Portfolio as compared to those of such other investment advisory clients, taking into account the rationale for any differences in fee schedules. The Board also took into account information provided by New York Life Investments about the more extensive scope of services provided to registered investment companies, such as the Portfolio, as compared with other investment advisory clients. Additionally, the Board considered the impact of contractual breakpoints, voluntary waivers and expense limitation arrangements on the Portfolio’s net management fee and expenses. The Board noted that New York Life Investments had provided support to the Portfolio in the form of voluntary waivers and/or reimbursements of fees and expenses in order to maintain a positive yield. The Board also considered that in proposing fees for the Portfolio, New York Life Investments considers the competitive marketplace for mutual funds.
Based on the factors outlined above, among other considerations, the Board concluded that the Portfolio’s management fee and total ordinary operating expenses are within a range that is competitive and support a conclusion that these fees and expenses are reasonable.
Economies of Scale
The Board considered information regarding economies of scale, including whether economies of scale may exist for the Portfolio and whether the Portfolio’s expense structure permits any economies of scale to be appropriately shared with the Portfolio’s beneficial shareholders. The Board also considered a report from New York Life Investments, previously prepared at the request of the Board, that addressed economies of scale, including with respect to the mutual fund business generally, and the various ways in which the benefits of economies of scale may be shared with the funds in the MainStay Group of Funds. Although the Board recognized the difficulty of determining economies of scale with precision, the Board acknowledged that economies of scale may be shared with the Portfolio in a number of ways, including, for example, through the imposition of fee breakpoints, initially setting management fee rates at scale or making additional investments to enhance the services provided to the Portfolio. The Board reviewed information from New York Life Investments showing how the Portfolio’s management fee schedule compared to fee schedules of other funds and accounts managed by New York Life Investments. The Board also reviewed information from ISS showing how the Portfolio’s management fee schedule compared with fees paid for similar services by peer funds at varying asset levels.
Based on this information, the Board concluded that economies of scale are appropriately reflected for the benefit of the Portfolio’s beneficial shareholders through the Portfolio’s expense structure and other methods to share benefits from economies of scale.
Conclusion
On the basis of the information and factors summarized above, among other information and factors deemed relevant by the Trustees, and the evaluation thereof, the Board unanimously voted to approve the continuation of each of the Advisory Agreements.
| 24 | MainStay VP U.S. Government Money Market Portfolio |
Proxy Voting Policies and Procedures and Proxy Voting Record
The Portfolio is required to file with the SEC its proxy voting record for the 12-month period ending June 30 on Form N-PX. A description of the policies and procedures that are used to vote proxies relating to portfolio securities of the Portfolio is available free of charge upon request by calling 800-598-2019 or visiting the SEC's website at www.sec.gov. The most recent Form N-PX or proxy voting record is available free of charge upon request by calling 800-598-2019; visiting https://www.newyorklifeinvestments.com/investment-products/vp; or visiting the SEC’s website at www.sec.gov.
Shareholder Reports and Quarterly Portfolio Disclosure
The Portfolio is required to file a Form N-MFP every month disclosing its portfolio holdings. The Portfolio's Form N-MFP is available free of charge upon request by calling 800-598-2019 or by visiting the SEC’s website at www.sec.gov.
Board of Trustees and Officers (Unaudited)
The Trustees and officers of the Portfolio are listed below. The Board oversees the MainStay Group of Funds (which consists of MainStay Funds and MainStay Funds Trust), MainStay VP Funds Trust, MainStay MacKay DefinedTerm Municipal Opportunities Fund, MainStay CBRE Global Infrastructure Megatrends Fund, the Manager and the Subadvisors, and elects the officers of the Portfolios who are responsible for the day-to-day operations of the Portfolio. Information pertaining to the Trustees and officers is set forth below. Each Trustee serves until his or her successor
is elected and qualified or until his or her resignation, death or removal. Under the Board’s retirement policy, unless an exception is made, a Trustee must tender his or her resignation by the end of the calendar year during which he or she reaches the age of 75. The business address of each Trustee and officer listed below is 51 Madison Avenue, New York, New York 10010. None of the Trustees are “interested persons” (as defined by the 1940 Act and rules adopted by the SEC thereunder) of the Portfolio (“Independent Trustees”).
| | Name and
Year of Birth | Term of Office,
Position(s) Held and
Length of Service | Principal Occupation(s)
During Past Five Years | Number of
Portfolios in
Fund Complex
Overseen by
Trustee | Other Directorships
Held by Trustee |
| | | | | | |
| | David H. Chow
1957 | MainStay VP Funds Trust: Trustee since January 2016, Advisory Board Member (June 2015 to December 2015) | Founder and CEO, DanCourt Management, LLC since 1999 | 78 | MainStay Funds: Trustee since January 2016, Advisory Board Member (June 2015 to December 2015) (12 Funds);
MainStay Funds Trust: Trustee since January 2016, Advisory Board Member (June 2015 to December 2015) (33 Funds);
MainStay MacKay DefinedTerm Municipal Opportunities Fund: Trustee since January 2016, Advisory Board Member (June 2015 to December 2015);
MainStay CBRE Global Infrastructure Megatrends Fund: Trustee since June 2021;VanEck Vectors Group of Exchange-Traded Funds: Independent Chairman of the Board of Trustees since 2008 and Trustee since 2006 (57 portfolios); and Berea College of Kentucky: Trustee since 2009, Chair of the Committee since 2018 |
| | Susan B. Kerley
1951 | MainStay VP Funds Trust: Chairman since 2017 and Trustee since 2007* | President, Strategic Management Advisors LLC since 1990 | 78 | MainStay Funds: Chairman since 2017 and Trustee since 2007 (12 Funds); MainStay Funds Trust: Chairman since 2017 and Trustee since 1990 (33 Funds)**;
MainStay MacKay DefinedTerm Municipal Opportunities Fund: Chairman since 2017 and Trustee since 2011; MainStay CBRE Global Infrastructure Megatrends Fund: Trustee since June 2021; and Legg Mason Partners Funds: Trustee since 1991 (45 portfolios) |
| | Alan R. Latshaw
1951 | MainStay VP Funds Trust: Trustee since 2007* | Retired; Partner, Ernst & Young LLP (2002 to 2003); Partner, Arthur Andersen LLP (1989 to 2002); Consultant to the MainStay Funds Audit and Compliance Committee (2004 to 2006) | 78 | MainStay Funds: Trustee since 2006 (12 Funds);
MainStay Funds Trust: Trustee since 2007 (33 Funds)**;
MainStay MacKay DefinedTerm Municipal Opportunities Fund: Trustee since 2011; and
MainStay CBRE Global Infrastructure Megatrends Fund: Trustee since June 2021 |
| 26 | MainStay VP U.S. Government Money Market Portfolio |
| | Name and
Year of Birth | Term of Office,
Position(s) Held and
Length of Service | Principal Occupation(s)
During Past Five Years | Number of
Portfolios in
Fund Complex
Overseen by
Trustee | Other Directorships
Held by Trustee |
| | | | | | |
| | Karen Hammond
1956 | MainStay VP Funds Trust: Trustee since December 2021, Advisory Board Member (June 2021 to December 2021)
| Retired, Managing Director, Devonshire Investors (2007 to 2013); Senior Vice President, Fidelity Management & Research Co. (2005 to 2007); Senior Vice President and Corporate Treasurer, FMR Corp. (2003 to 2005); Chief Operating Officer, Fidelity Investments Japan (2001 to 2003) | 78 | MainStay Funds: Trustee since December 2021, Advisory Board Member (June 2021 to December 2021) (12 Funds);
MainStay Funds Trust: Trustee since December 2021, Advisory Board Member (June 2021 to December 2021) (33 Funds);
MainStay MacKay DefinedTerm Municipal Opportunities Fund: Trustee since December 2021, Advisory Board Member (June 2021 to December 2021);
MainStay CBRE Global Infrastructure Megatrends Fund: Trustee since December 2021, Advisory Board Member (June 2021 to December 2021);
Two Harbors Investment Corp.: Director since 2018; Rhode Island State Investment Commission: Member since 2017; and Blue Cross Blue Shield of Rhode Island: Director since 2019
|
| | Jacques P. Perold
1958 | MainStay VP Funds Trust: Trustee since January 2016, Advisory Board Member (June 2015 to December 2015) | Founder and Chief Executive Officer, CapShift Advisors LLC (since 2018); President, Fidelity Management & Research Company (2009 to 2014); President and Chief Investment Officer, Geode Capital Management, LLC (2001 to 2009) | 78 | MainStay Funds: Trustee since January 2016, Advisory Board Member (June 2015 to December 2015) (12 Funds);
MainStay Funds Trust: Trustee since January 2016, Advisory Board Member (June 2015 to December 2015) (33 Funds); MainStay MacKay DefinedTerm Municipal Opportunities Fund: Trustee since January 2016, Advisory Board Member (June 2015 to December 2015);
MainStay CBRE Global Infrastructure Megatrends Fund: Trustee since June 2021; Allstate Corporation: Director since 2015;
Partners in Health: Trustee since 2019; and
MSCI Inc.: Director since 2017 |
| | Richard S. Trutanic
1952 | MainStay VP Funds Trust: Trustee since 2007* | Chairman and Chief Executive Officer, Somerset & Company (financial advisory firm) since 2004; Managing Director, The Carlyle Group (private investment firm) (2002 to 2004); Senior Managing Director, Partner and Board Member, Groupe Arnault S.A. (private investment firm) (1999 to 2002)
| 78 | MainStay Funds: Trustee since 1994 (12 Funds);
MainStay Funds Trust: Trustee since 2007 (33 Funds)**;
MainStay MacKay DefinedTerm Municipal Opportunities Fund: Trustee since 2011; and
MainStay CBRE Global Infrastructure Megatrends Fund: Trustee since June 2021 |
| * | Includes prior service as a Director of MainStay VP Series Fund, Inc., the predecessor to MainStay VP Funds Trust. |
| ** | Includes prior service as a Director/Trustee of certain predecessor entities to MainStay Funds Trust. |
Board of Trustees and Officers (Unaudited) (continued)
| | Name and
Year of Birth | Position(s) Held and
Length of Service | Principal Occupation(s)
During Past Five Years | |
| | | | | |
| | Kirk C. Lehneis
1974 | President, MainStay VP Funds Trust (since 2017) | Chief Operating Officer and Senior Managing Director (since 2016), New York Life Investment Management LLC and New York Life Investment Management Holdings LLC; Member of the Board of Managers (since 2017) and Senior Managing Director (since 2018), NYLIFE Distributors LLC; Chairman of the Board and Senior Managing Director, NYLIM Service Company LLC (since 2017); Trustee, President and Principal Executive Officer of IndexIQ Trust, IndexIQ ETF Trust and IndexIQ Active ETF Trust (since January 2018); President, MainStay CBRE Global Infrastructure Megatrends Fund (since 2021), MainStay MacKay DefinedTerm Municipal Opportunities Fund, MainStay Funds and MainStay Funds Trust (since 2017); Senior Managing Director, Global Product Development (from 2015-2016); Managing Director, Product Development (from 2010-2015), New York Life Investment Management LLC | |
| | Jack R. Benintende
1964 | Treasurer and Principal Financial and Accounting Officer, MainStay VP Funds Trust (since 2007)** | Managing Director, New York Life Investment Management LLC (since 2007); Treasurer and Principal Financial and Accounting Officer, MainStay CBRE Global Infrastructure Megatrends Fund (since 2021), MainStay MacKay DefinedTerm Municipal Opportunities Fund (since 2011), MainStay Funds Trust (since 2009) and MainStay Funds (since 2007); and Assistant Treasurer, New York Life Investment Management Holdings LLC (2008 to 2012) | |
| | J. Kevin Gao
1967 | Secretary and Chief Legal Officer, MainStay VP Funds Trust (since 2010)** | Managing Director and Associate General Counsel, New York Life Investment Management LLC (since 2010); Secretary and Chief Legal Officer, MainStay CBRE Global Infrastructure Megatrends Fund (since 2021), MainStay MacKay DefinedTerm Municipal Opportunities Fund (since 2011), MainStay Funds and MainStay Funds Trust (since 2010) | |
| | Scott T. Harrington
1959 | Vice President— Administration, MainStay VP Funds Trust (since 2005)** | Managing Director, New York Life Investment Management LLC (including predecessor advisory organizations) (since 2000); Member of the Board of Directors, New York Life Trust Company (since 2009); Vice President—Administration, MainStay CBRE Global Infrastructure Megatrends Fund (since 2021), MainStay MacKay DefinedTerm Municipal Opportunities Fund (since 2011), MainStay Funds Trust and MainStay Funds (since 2009) | |
| | Kevin M. Gleason
1967 | Vice President and Chief Compliance Officer, MainStay VP Funds Trust (since June 2022) | Vice President and Chief Compliance Officer, IndexIQ, IndexIQ ETF Trust and Index IQ Active ETF Trust (since June 2022); Vice President and Chief Compliance Officer, MainStay CBRE Global Infrastructure Megatrends Fund, MainStay MacKay DefinedTerm Municipal Opportunities Fund (since June 2022); MainStay Funds Trust and MainStay Funds (since June 2022); Senior Vice President, Voya Investment Management and Chief Compliance Officer, Voya Family of Funds (2012-2022) | |
| * | The officers listed above are considered to be “interested persons” of the MainStay Group of Funds, MainStay VP Funds Trust, MainStay CBRE Global Infrastructure Megatrends Fund and MainStay MacKay DefinedTerm Municipal Opportunities Fund within the meaning of the 1940 Act because of their affiliation with the MainStay Group of Funds, New York Life Insurance Company and/or its affiliates, including New York Life Investment Management LLC, NYLIM Service Company LLC, NYLIFE Securities LLC and/or NYLIFE Distributors LLC, as described in detail in the column captioned “Principal Occupation(s) During Past Five Years.” Officers are elected annually by the Board. |
| ** | Includes prior service as an Officer of MainStay VP Series Fund, Inc., the predecessor to MainStay VP Funds Trust. |
Officers of the Trust (Who are not Trustees)*
| 28 | MainStay VP U.S. Government Money Market Portfolio |
This page intentionally left blank
This page intentionally left blank.
MainStay VP Portfolios
MainStay VP offers a wide range of Portfolios. The full array of MainStay VP offerings is listed here, with information about the manager, subadvisors, legal counsel, and independent registered public accounting firm.
Equity
MainStay VP American Century Sustainable Equity Portfolio1
MainStay VP Candriam Emerging Markets Equity Portfolio
MainStay VP Epoch U.S. Equity Yield Portfolio
MainStay VP Fidelity Institutional AM® Utilities Portfolio†
MainStay VP MacKay International Equity Portfolio
MainStay VP Natural Resources Portfolio
MainStay VP S&P 500 Index Portfolio2
MainStay VP Small Cap Growth Portfolio
MainStay VP Wellington Growth Portfolio
MainStay VP Wellington Mid Cap Portfolio
MainStay VP Wellington Small Cap Portfolio
MainStay VP Wellington U.S. Equity Portfolio
MainStay VP Winslow Large Cap Growth Portfolio
Mixed Asset
MainStay VP Balanced Portfolio
MainStay VP Income Builder Portfolio
MainStay VP Janus Henderson Balanced Portfolio
MainStay VP MacKay Convertible Portfolio
Income
MainStay VP Bond Portfolio
MainStay VP Floating Rate Portfolio
MainStay VP Indexed Bond Portfolio
MainStay VP MacKay Government Portfolio
MainStay VP MacKay High Yield Corporate Bond Portfolio
MainStay VP MacKay Strategic Bond Portfolio
MainStay VP PIMCO Real Return Portfolio
Money Market
MainStay VP U.S. Government Money Market Portfolio
Alternative
MainStay VP CBRE Global Infrastructure Portfolio
MainStay VP IQ Hedge Multi-Strategy Portfolio
Asset Allocation
MainStay VP Conservative Allocation Portfolio
MainStay VP Equity Allocation Portfolio
MainStay VP Growth Allocation Portfolio
MainStay VP Moderate Allocation Portfolio
Manager
New York Life Investment Management LLC
New York, New York
Subadvisors
American Century Investment Management, Inc.
Kansas City, Missouri
Brown Advisory LLC
Baltimore, Maryland
Candriam*
Strassen, Luxembourg
CBRE Investment Management Listed Real Assets LLC
Radnor, Pennsylvania
Epoch Investment Partners, Inc.
New York, New York
FIAM LLC
Smithfield, Rhode Island
IndexIQ Advisors LLC*
New York, New York
Janus Henderson Investors US LLC
Denver, Colorado
MacKay Shields LLC*
New York, New York
Newton Investment Management North America, LLC
Boston, Massachusetts
NYL Investors LLC*
New York, New York
Pacific Investment Management Company LLC
Newport Beach, California
Segall Bryant & Hamill, LLC
Chicago, Illinois
Wellington Management Company LLP
Boston, Massachusetts
Winslow Capital Management, LLC
Minneapolis, Minnesota
Legal Counsel
Dechert LLP
Washington, District of Columbia
Independent Registered Public Accounting Firm
PricewaterhouseCoopers LLP
New York, New York
Distributor
NYLIFE Distributors LLC*
Jersey City, New Jersey
Custodian
JPMorgan Chase Bank, N.A.
New York, New York
Some Portfolios may not be available in all products.
† Fidelity Institutional AM is a registered trade mark of FMR LLC. Used with permission.
* An affiliate of New York Life Investment Management LLC.
| 1. | Prior to May 1, 2022, the Portfolio's name was MainStay VP T. Rowe Price Equity Income Portfolio. |
| 2. | Prior to May 1, 2022, the Portfolio's name was MainStay VP MacKay S&P 500 Index Portfolio. |
Not part of the Annual Report
2022 Annual Report
This report is for the general information of New York Life Variable Annuities and NYLIAC Variable Universal Life Insurance Products policyowners. It must be preceded or accompanied by the appropriate product(s) and funds prospectuses if it is given to anyone who is not an owner of a New York Life variable annuity policy or a NYLIAC Variable Universal Life Insurance Product. This report does not offer for sale or solicit orders to purchase securities.
The performance data quoted in this report represents past performance. Past performance is no guarantee of future results. Due to market volatility and other factors, current performance may be lower or higher than the figures shown. The most recent month-end performance summary for your variable annuity or variable life policy is available by calling 800-598-2019 and is updated periodically on newyorklife.com.
The New York Life Variable Annuities and NYLIAC Variable Universal Life Insurance Products are issued by New York Life Insurance and Annuity Corporation (a Delaware Corporation) and distributed by NYLIFE Distributors LLC (Member FINRA/SIPC).
New York Life Insurance Company
New York Life Insurance and Annuity
Corporation (NYLIAC) (A Delaware Corporation)
51 Madison Avenue, Room 551
New York, NY 10010
newyorklife.com
newyorklifeinvestments.com
NYLIFE Distributors LLC, 30 Hudson Street, Jersey City, NJ 07302
New York Life Investment Management LLC is the investment manager to the MainStay VP Funds Trust
©2023 by NYLIFE Distributors LLC. All rights reserved.
You may obtain copies of the Prospectus and the Statement of Additional Information free of charge, upon request, by calling toll-free 800-598-2019 or writing to New York Life Insurance and Annuity Corporation, 51 Madison Avenue, New York, NY 10010.
| Not FDIC Insured | No Bank Guarantee | May Lose Value |
| 5015536 | MSVPUSGMM11-02/23 |
(NYLIAC) NI510
MainStay VP MacKay Convertible Portfolio
Message from the President and Annual Report
December 31, 2022
Sign up for e-delivery of your shareholder reports. For full details on e-delivery, including who can participate and what you can receive via e-delivery,
please log in to newyorklifeinvestments.com/accounts.
| Not FDIC/NCUA Insured | Not a Deposit | May Lose Value | No Bank Guarantee | Not Insured by Any Government Agency |
This page intentionally left blank
Message from the President
The 12-month reporting period ended December 31, 2022, proved exceptionally challenging for investors as both stock and bond markets suffered steep declines. A variety of economic and geopolitical forces drove the market’s losses, all centered around rising inflation and monetary efforts to rein it in.
Inflationary alarms began to sound well before the reporting period began. In late 2021, after nearly two years of accommodative policies designed to encourage economic growth in the face of the COVID-19 pandemic, the U.S. Federal Reserve (the “Fed”) warned of the increasing need to tighten monetary policy. Nevertheless, the pace and persistence of inflation in early 2022 caught most market participants—the Fed included—off guard. Russia’s invasion of Ukraine in February exacerbated global inflationary pressures while increasing investor uncertainty. Domestic supply shortages, international trade imbalances and rising inflation caused U.S. GDP (gross domestic product) to contract in the first and second quarters of the year, although employment and consumer spending proved resilient. Prices for petroleum surged to multi-year highs, while many key agricultural chemicals and industrial metals soared as well. Accelerating inflationary forces prompted the Fed to implement its most aggressive series of interest rate hikes since the 1980s, with a 0.25% increase in March followed by six further rate increases totaling 4.25%. International central banks generally followed suit and raised rates by varying degrees in efforts to curb local inflation, although most increases remained significantly more modest than those in the United States. Relatively high U.S. interest rates and an international risk averse sentiment pushed U.S. dollar values higher compared to most other currencies, with negative impacts on global prices for food, fuel and other key U.S.-dollar-denominated products.
The effects of these interrelated challenges were felt throughout U.S. and international financial markets. The S&P 500® Index, a widely regarded benchmark of market performance, declined by more than 18% during the reporting period. Although the energy sector generated strong gains, bolstered by elevated oil and gas prices, most other industry segments recorded losses. The more cyclical and growth-oriented sectors of consumer discretionary, information technology and real estate delivered the weakest returns, while the traditionally defensive and value-oriented
consumer staples, utilities and health care sectors outperformed. On average, international developed-country equity markets mildly outperformed their U.S. counterparts, while emerging markets lagged slightly. Fixed-income markets proved unusually volatile, with bond prices trending sharply lower as yields rose along with interest rates. Short-term yields rose faster than long-term yields, producing a yield curve inversion from July through the end of the reporting period as long-term rates remained below short-term rates. While floating-rate instruments, which feature variable interest rates that allow investors to benefit from a rising rate environment, provided a degree of insulation from inflation-driven trends, they were not immune to the market’s widespread declines.
Although, according to the most recent estimates, the annualized inflation rate in the United States has declined from a peak of 9.1% in July 2022 to 6.5% in December, the Fed remains focused on achieving more substantial and lasting reductions, aiming for a target rate of 2%. As a result, further rate hikes and additional market volatility are potential headwinds in the coming months. The question remains as to whether the Fed and other central banks will manage a so-called “soft landing,” curbing inflation while avoiding a persistent economic slowdown. If they prove successful, we believe that the increasingly attractive valuations we have observed in both equity and bond markets should eventually translate into sustainable improvements in the investment environment.
Whatever actions the Fed takes and however financial markets react, as a MainStay VP investor you can depend on us to continue managing our portfolios with the insight, expertise and level of service that have long defined New York Life Investments. Thank you for trusting us to help you meet your investment needs.
Sincerely,
Kirk C. Lehneis
President
The opinions expressed are as of the date of this report and are subject to change. There is no guarantee that any forecast made will come to pass. This material does not constitute investment advice and is not intended as an endorsement of any specific investment. Past performance is no guarantee of future results.
Not part of the Annual Report
Investors should refer to the Portfolio’s Summary Prospectus and/or Prospectus and consider the Portfolio’s investment objectives, strategies, risks, charges and expenses carefully before investing. The Summary Prospectus and/or Prospectus contain this and other information about the Portfolio. You may obtain copies of the Portfolio’s Summary Prospectus, Prospectus and Statement of Additional Information, which includes information about the MainStay VP Funds Trust's Trustees, free of charge, upon request, by calling toll-free 800-598-2019, by writing to New York Life Insurance and Annuity Corporation, 51 Madison Avenue, Room 251, New York, New York 10010 or by sending an email to MainStayShareholdersServices@nylim.com. These documents are also available at newyorklifeinvestments.com/investment-products/vp. Please read the Portfolio's Summary Prospectus and/or Prospectus carefully before investing. MainStay VP Funds Trust portfolios are separate account options which are purchased through a variable insurance or variable annuity contract.
MainStay VP MacKay Convertible Portfolio
Investment and Performance Comparison (Unaudited)
Performance data quoted represents past performance. Past performance is no guarantee of future results. Because of market volatility and other factors, current performance may be lower or higher than the figures shown. Investment return and principal value will fluctuate, and as a result, when shares are redeemed, they may be worth more or less than their original cost. The performance table and graph do not reflect any deduction of sales charges, mortality and expense charges, contract charges or administrative charges. Please refer to the Performance Summary appropriate for your policy. For performance information current to the most recent month-end, please call 800-598-2019 or visit www.newyorklife.com.
Performance figures may reflect certain fee waivers and/or expense limitations, without which total returns may have been different. For information on current fee waivers and/or expense limitations (if any), please refer to the Notes to Financial Statements.
| Average Annual Total Returns for the Year-Ended December 31, 2022 |
| Class | Inception
Date | One
Year | Five
Years | Ten Years
or Since
Inception | Gross
Expense
Ratio1 |
| Initial Class Shares | 10/1/1996 | -12.67% | 9.21% | 10.04% | 0.56% |
| Service Class Shares | 6/5/2003 | -12.89 | 8.93 | 9.77 | 0.81 |
| Service 2 Class Shares | 4/26/2016 | -12.97 | 8.83 | 9.85 | 0.91 |
| 1. | The gross expense ratios presented reflect the Portfolio’s “Total Annual Portfolio Operating Expenses” from the most recent Prospectus and may differ from other expense ratios disclosed in this report. |
| Benchmark Performance* | One
Year | Five
Years | Ten
Years |
| ICE BofA U.S. Convertible Index1 | -18.71% | 9.29% | 10.01% |
| Morningstar Convertibles Category Average2 | -17.45 | 7.05 | 7.78 |
| * | Returns for indices reflect no deductions for fees, expenses or taxes, except for foreign withholding taxes where applicable. Results assume reinvestment of all dividends and capital gains. An investment cannot be made directly in an index. |
| 1. | The ICE BofA U.S. Convertible Index is the Portfolio’s primary broad–based securities market index for comparison purposes. The ICE BofA U.S. Convertible Index is a market-capitalization weighted index of domestic corporate convertible securities. In order to be included in this Index, bonds and preferred stocks must be convertible only to common stock. |
| 2. | The Morningstar Convertibles Category Average is representative of funds that are designed to offer some of the capital-appreciation potential of stock portfolios while also supplying some of the safety and yield of bond portfolios. Results are based on average total returns of similar funds with all dividends and capital gain distributions reinvested. |
| 6 | MainStay VP MacKay Convertible Portfolio |
Cost in Dollars of a $1,000 Investment in MainStay VP MacKay Convertible Portfolio (Unaudited)
The example below is intended to describe the fees and expenses borne by shareholders during the six-month period from July 1, 2022 to December 31, 2022, and the impact of those costs on your investment.
Example
As a shareholder of the Portfolio you incur two types of costs: (1) transaction costs, including exchange fees and sales charges (loads) on purchases (as applicable), and (2) ongoing costs, including management fees, distribution and/or service (12b-1) fees and other Portfolio expenses (as applicable). This example is intended to help you understand your ongoing costs (in dollars) of investing in the Portfolio and to compare these costs with the ongoing costs of investing in other mutual funds. The example is based on an investment of $1,000 made at the beginning of the six-month period and held for the entire period from July 1, 2022 to December 31, 2022. Shares are only sold in connection with variable life and annuity contracts and the example does not reflect any contract level or transactional fees or expenses. If these costs had been included, your costs would have been higher.
This example illustrates your Portfolio’s ongoing costs in two ways:
Actual Expenses
The second and third data columns in the table below provide information about actual account values and actual expenses. You may use the information in these columns, together with the amount you invested, to estimate the expenses that you paid during the six months ended
December 31, 2022. Simply divide your account value by $1,000 (for example, an $8,600 account value divided by $1,000 = 8.6), then multiply the result by the number under the heading entitled “Expenses Paid During Period” to estimate the expenses you paid on your account during this period.
Hypothetical Example for Comparison Purposes
The fourth and fifth data columns in the table below provide information about hypothetical account values and hypothetical expenses based on the Portfolio’s actual expense ratio and an assumed rate of return of 5% per year before expenses, which is not the Portfolio’s actual return. The hypothetical account values and expenses may not be used to estimate the actual ending account balances or expenses you paid for the six-month period shown. You may use this information to compare the ongoing costs of investing in the Portfolio with the ongoing costs of investing in other mutual funds. To do so, compare this 5% hypothetical example with the 5% hypothetical examples that appear in the shareholder reports of the other mutual funds.
Please note that the expenses shown in the table are meant to highlight your ongoing costs only and do not reflect any transactional costs, such as exchange fees or sales charges (loads). Therefore, the fourth and fifth data columns of the table are useful in comparing ongoing costs only and will not help you determine the relative total costs of owning different funds. In addition, if these transactional costs were included, your costs would have been higher.
| Share Class | Beginning
Account
Value
7/1/22 | Ending Account
Value (Based
on Actual
Returns and
Expenses)
12/31/22 | Expenses
Paid
During
Period1 | Ending Account
Value (Based
on Hypothetical
5% Annualized
Return and
Actual Expenses)
12/31/22 | Expenses
Paid
During
Period1 | Net Expense
Ratio
During
Period2 |
| Initial Class Shares | $1,000.00 | $1,038.10 | $2.98 | $1,022.28 | $2.96 | 0.58% |
| Service Class Shares | $1,000.00 | $1,036.80 | $4.26 | $1,021.02 | $4.23 | 0.83% |
| Service 2 Class Shares | $1,000.00 | $1,036.20 | $4.77 | $1,020.52 | $4.74 | 0.93% |
| 1. | Expenses are equal to the Portfolio’s annualized expense ratio of each class multiplied by the average account value over the period, divided by 365 and multiplied by 184 (to reflect the six-month period). The table above represents the actual expenses incurred during the six-month period. In addition to the fees and expenses which the Portfolio bears directly, it also indirectly bears a pro rata share of the fees and expenses of the underlying funds in which it invests. Such indirect expenses are not included in the above-reported expense figures. |
| 2. | Expenses are equal to the Portfolio's annualized expense ratio to reflect the six-month period. |
Portfolio Composition as of December 31, 2022 (Unaudited)
See Portfolio of Investments beginning on page 11 for specific holdings within these categories. The Portfolio's holdings are subject to change.
Top Ten Holdings and/or Issuers Held as of December 31, 2022 (excluding short-term investments) (Unaudited)
| 1. | Pioneer Natural Resources Co., 0.25%, due 5/15/25 |
| 2. | EQT Corp., 1.75%, due 5/1/26 |
| 3. | Elevance Health, Inc., 2.75%, due 10/15/42 |
| 4. | Danaher Corp., 5.00%, Series B |
| 5. | NICE Ltd., (zero coupon), due 9/15/25 |
| 6. | BioMarin Pharmaceutical, Inc., 1.25%, due 5/15/27 |
| 7. | Palo Alto Networks, Inc., 0.375%-0.75%, due 7/1/23–6/1/25 |
| 8. | Microchip Technology, Inc., 0.125%, due 11/15/24 |
| 9. | Southwest Airlines Co., 1.25%, due 5/1/25 |
| 10. | Ford Motor Co., (zero coupon), due 3/15/26 |
| 8 | MainStay VP MacKay Convertible Portfolio |
Portfolio Management Discussion and Analysis (Unaudited)
Answers to the questions reflect the views of portfolio manager Edward Silverstein, CFA, of MacKay Shields LLC, the Portfolio’s Subadvisor.
How did MainStay VP MacKay Convertible Portfolio perform relative to its benchmark and peers during the 12 months ended December 31, 2022?
For the 12 months ended December 31, 2022, MainStay VP MacKay Convertible Portfolio returned −12.67% for Initial Class shares, −12.89% for Service Class shares and −12.97% for Service 2 Class shares. Over the same period, all share classes outperformed the −18.71% return of the ICE BofA U.S. Convertible Index (“the Index”), which is the Portfolio’s benchmark, and the −17.45% return of the Morningstar Convertibles Category Average.1
During the reporting period, were there any market events that materially impacted the Portfolio’s performance or liquidity?
A sell-off in risk assets, coupled with a sharp move higher in interest rates and yields, had a negative impact on the Portfolio’s absolute performance during the reporting period. The Portfolio outperformed the Index primarily due to overweight exposure to the energy sector and underweight exposure to numerous richly valued securities in the information technology, consumer discretionary and alternative energy sectors. Our investment process, which generally favors more valued-oriented companies based on their free cash flow profile, helped the Portfolio avoid many of the most richly valued sectors in the Index while identifying winners in energy.
What factors affected the Portfolio’s relative performance during the reporting period?
Performance relative to the Index benefited from the strong absolute performance of the energy sector, to which the Portfolio held significantly overweight exposure. Relative returns also benefited from the Portfolio’s underweight exposure to richly-valued information technology companies, which have a large presence in the Index and were vulnerable to sharp declines as interest rates rose. However, the widening of credit spreads2and the general rise in interest rates hurt Portfolio performance.
What specific factors, risks or market forces prompted significant decisions for the Portfolio during the reporting period?
Although markets were negatively impacted by a large move in interest rates coupled with recessionary fears, there were no material changes to the sector weightings in the Portfolio. Our investment process, which generally favors more valued-oriented companies based on their free cash flow profile, helped us avoid
many of the richly valued sectors and identify winners in the energy sector.
During the reporting period, which sectors were the strongest positive contributors to the Portfolio’s relative performance, and which sectors were particularly weak?
During the reporting period, the energy sector made the strongest contribution to the Portfolio’s performance relative to the Index due to overweight allocation and positive security selection. (Contributions take weightings and total returns into account.) In addition, security selection in the consumer discretionary and information technology sectors enhanced relative returns. Conversely, an underweight allocation to the utilities sector, as well as security selection in communication services and financials, weakened relative performance.
Did the Portfolio make any significant purchases or sales during the reporting period?
During the reporting period, the Portfolio initiated positions in the convertible bonds of Dropbox and added to its position in MGP Ingredients. The Portfolio initiated the position in software developer Dropbox due to the company’s attractive valuation based on its free cash flow profile. The Portfolio had purchased the convertible bonds of distillers MGP Ingredients when the company offered convertible bonds in an initial public offering and added to the position in the months following the offering.
During the reporting period, the Portfolio parted with holdings that matured, the largest of which were Workday and Broadcom. In addition, we sold the Portfolio’s holding of Atlas Air Worldwide after it was announced that the company would be acquired by an investment firm.
How did the Portfolio’s sector weightings change during the reporting period?
There were no material changes to positioning during the reporting period. The Portfolio increased its exposure to the consumer staples, energy and real estate sectors. Conversely, the Portfolio decreased its exposure to the industrials and financials sectors.
How was the Portfolio positioned at the end of the reporting period?
As of December 31, 2022, the Portfolio held overweight exposure relative to the Index in the energy, consumer staples and health care sectors. As of the same date, the Portfolio held underweight exposure to financials, communication services consumer
| 1. | See page 5 for more information on benchmark and peer group returns. |
| 2. | The terms “spread” and “yield spread” may refer to the difference in yield between a security or type of security and comparable U.S. Treasury issues. The terms may also refer to the difference in yield between two specific securities or types of securities at a given time. The term “credit spread” typically refers to the difference in yield between corporate or municipal bonds (or a specific category of these bonds) and comparable U.S. Treasury issues. |
discretionary, information technology, utilities, materials and industrials.
The opinions expressed are those of the portfolio manager as of the date of this report and are subject to change. There is no guarantee that any forecasts will come to pass. This material does not constitute investment advice and is not intended as an endorsement of any specific investment.
Not all MainStay VP Portfolios and/or share classes are available under all policies.
| 10 | MainStay VP MacKay Convertible Portfolio |
Portfolio of Investments December 31, 2022†
| | Principal
Amount | Value |
| Long-Term Bonds 2.7% |
| Corporate Bonds 2.7% |
| Biotechnology 0.2% |
| Bridgebio Pharma, Inc. | | |
| 2.50%, due 3/15/27 | $ 6,895,000 | $ 3,102,750 |
| Commercial Services 0.6% |
| Block, Inc. | | |
| 0.25%, due 11/1/27 | 13,105,000 | 9,877,894 |
| Leisure Time 0.2% |
| NCL Corp. Ltd. | | |
| 5.375%, due 8/1/25 | 2,860,000 | 2,884,310 |
| Oil & Gas 0.0% ‡ |
| Valaris Ltd. | | |
| Series 1145 | | |
| 8.25% (8.25% Cash or 12.00% PIK), due 4/30/28 (a) | 801,000 | 804,381 |
| Oil & Gas Services 0.0% ‡ |
| Weatherford International Ltd. | | |
| 11.00%, due 12/1/24 (b) | 56,000 | 57,122 |
| Semiconductors 1.4% |
| Silicon Laboratories, Inc. | | |
| 0.625%, due 6/15/25 | 18,986,000 | 23,816,038 |
| Software 0.3% |
| Five9, Inc. | | |
| 0.50%, due 6/1/25 | 4,933,000 | 4,530,961 |
Total Corporate Bonds
(Cost $55,236,787) | | 45,073,456 |
Total Long-Term Bonds
(Cost $55,236,787) | | 45,073,456 |
| Convertible Securities 90.2% |
| Convertible Bonds 81.8% |
| Airlines 2.7% |
| American Airlines Group, Inc. | | |
| 6.50%, due 7/1/25 | 6,895,000 | 7,301,805 |
| JetBlue Airways Corp. | | |
| 0.50%, due 4/1/26 | 4,623,000 | 3,393,638 |
| Southwest Airlines Co. | | |
| 1.25%, due 5/1/25 (c) | 29,005,000 | 34,943,774 |
| | | 45,639,217 |
| | Principal
Amount | Value |
| |
| Auto Manufacturers 1.9% |
| Ford Motor Co. | | |
| (zero coupon), due 3/15/26 | $ 32,843,000 | $ 31,151,585 |
| Beverages 1.1% |
| MGP Ingredients, Inc. | | |
| 1.875%, due 11/15/41 (c) | 14,482,000 | 18,302,352 |
| Biotechnology 5.4% |
| Alnylam Pharmaceuticals, Inc. | | |
| 1.00%, due 9/15/27 (b) | 5,744,000 | 6,246,600 |
| BioMarin Pharmaceutical, Inc. | | |
| 1.25%, due 5/15/27 (c) | 37,741,000 | 40,743,705 |
| Guardant Health, Inc. | | |
| (zero coupon), due 11/15/27 | 7,494,000 | 4,697,989 |
| Halozyme Therapeutics, Inc. | | |
| 1.00%, due 8/15/28 (b) | 9,000,000 | 10,648,125 |
| Illumina, Inc. | | |
| (zero coupon), due 8/15/23 (c) | 19,199,000 | 18,641,764 |
| Ionis Pharmaceuticals, Inc. | | |
| (zero coupon), due 4/1/26 | 9,307,000 | 8,638,059 |
| | | 89,616,242 |
| Commercial Services 2.4% |
| Alarm.com Holdings, Inc. | | |
| (zero coupon), due 1/15/26 | 3,250,000 | 2,654,925 |
| Block, Inc. | | |
| (zero coupon), due 5/1/26 | 14,812,000 | 12,064,374 |
| Chegg, Inc. | | |
| (zero coupon), due 9/1/26 | 10,000,000 | 7,944,000 |
| Euronet Worldwide, Inc. | | |
| 0.75%, due 3/15/49 | 11,685,000 | 11,166,478 |
| Repay Holdings Corp. | | |
| (zero coupon), due 2/1/26 (b) | 2,180,000 | 1,602,972 |
| Sabre GLBL, Inc. | | |
| 4.00%, due 4/15/25 | 1,185,000 | 1,276,127 |
| Shift4 Payments, Inc. | | |
| (zero coupon), due 12/15/25 | 2,300,000 | 2,289,937 |
| 0.50%, due 8/1/27 | 1,180,000 | 998,870 |
| | | 39,997,683 |
| Computers 2.4% |
| Lumentum Holdings, Inc. | | |
| 0.50%, due 12/15/26 | 26,640,000 | 22,977,000 |
| Parsons Corp. | | |
| 0.25%, due 8/15/25 | 2,878,000 | 3,285,237 |
| Western Digital Corp. | | |
| 1.50%, due 2/1/24 (d) | 4,634,000 | 4,437,055 |
The notes to the financial statements are an integral part of, and should be read in conjunction with, the financial statements.
11
Portfolio of Investments December 31, 2022† (continued)
| | Principal
Amount | Value |
| Convertible Bonds (continued) |
| Computers (continued) |
| Zscaler, Inc. | | |
| 0.125%, due 7/1/25 | $ 9,088,000 | $ 9,587,840 |
| | | 40,287,132 |
| Cosmetics & Personal Care 0.5% |
| Beauty Health Co. (The) | | |
| 1.25%, due 10/1/26 (b) | 11,004,000 | 8,374,044 |
| Electric 1.8% |
| NRG Energy, Inc. | | |
| 2.75%, due 6/1/48 | 29,752,000 | 29,558,612 |
| Energy-Alternate Sources 1.9% |
| Enphase Energy, Inc. | | |
| (zero coupon), due 3/1/26 | 9,315,000 | 10,539,922 |
| NextEra Energy Partners LP | | |
| (zero coupon), due 11/15/25 (b) | 10,860,000 | 10,849,140 |
| SolarEdge Technologies, Inc. | | |
| (zero coupon), due 9/15/25 | 8,449,000 | 10,531,679 |
| | | 31,920,741 |
| Entertainment 2.5% |
| Live Nation Entertainment, Inc. | | |
| 2.50%, due 3/15/23 | 9,704,000 | 10,364,390 |
| Marriott Vacations Worldwide Corp. | | |
| (zero coupon), due 1/15/26 | 3,060,000 | 2,998,800 |
| Vail Resorts, Inc. | | |
| (zero coupon), due 1/1/26 (c) | 30,094,000 | 28,062,655 |
| | | 41,425,845 |
| Food 1.0% |
| Chefs' Warehouse, Inc. (The) | | |
| 2.375%, due 12/15/28 (b) | 11,991,000 | 12,043,760 |
| Post Holdings, Inc. | | |
| 2.50%, due 8/15/27 (b) | 4,844,000 | 5,111,389 |
| | | 17,155,149 |
| Healthcare-Products 4.8% |
| CONMED Corp. | | |
| 2.25%, due 6/15/27 (b) | 24,108,000 | 22,082,928 |
| Exact Sciences Corp. | | |
| 0.375%, due 3/1/28 | 21,770,000 | 17,172,176 |
| Haemonetics Corp. | | |
| (zero coupon), due 3/1/26 | 9,354,000 | 7,775,980 |
| Integra LifeSciences Holdings Corp. | | |
| 0.50%, due 8/15/25 | 8,831,000 | 8,605,810 |
| | Principal
Amount | Value |
| |
| Healthcare-Products (continued) |
| Lantheus Holdings, Inc. | | |
| 2.625%, due 12/15/27 (b) | $ 11,991,000 | $ 12,133,693 |
| NuVasive, Inc. | | |
| 0.375%, due 3/15/25 | 12,958,000 | 11,383,603 |
| Omnicell, Inc. | | |
| 0.25%, due 9/15/25 | 1,735,000 | 1,521,595 |
| | | 80,675,785 |
| Healthcare-Services 4.5% |
| Elevance Health, Inc. | | |
| 2.75%, due 10/15/42 | 7,264,000 | 53,155,773 |
| Teladoc Health, Inc. | | |
| 1.25%, due 6/1/27 | 28,389,000 | 21,950,227 |
| | | 75,106,000 |
| Internet 9.4% |
| Booking Holdings, Inc. | | |
| 0.75%, due 5/1/25 (c) | 11,000,000 | 14,705,944 |
| Etsy, Inc. | | |
| 0.25%, due 6/15/28 | 26,578,000 | 22,891,631 |
| Expedia Group, Inc. | | |
| (zero coupon), due 2/15/26 (c) | 2,758,000 | 2,415,811 |
| Match Group Financeco 2, Inc. | | |
| 0.875%, due 6/15/26 (b) | 13,160,000 | 11,720,625 |
| Okta, Inc. | | |
| 0.125%, due 9/1/25 | 7,194,000 | 6,355,899 |
| Palo Alto Networks, Inc. | | |
| 0.375%, due 6/1/25 | 11,770,000 | 17,437,255 |
| 0.75%, due 7/1/23 | 13,152,000 | 20,813,040 |
| Q2 Holdings, Inc. | | |
| 0.75%, due 6/1/26 | 2,800,000 | 2,318,400 |
| Snap, Inc. | | |
| (zero coupon), due 5/1/27 | 10,555,000 | 7,425,443 |
| 0.125%, due 3/1/28 (b) | 12,850,000 | 8,641,625 |
| Uber Technologies, Inc. | | |
| (zero coupon), due 12/15/25 (c) | 14,485,000 | 12,272,509 |
| Zendesk, Inc. | | |
| 0.625%, due 6/15/25 | 9,259,000 | 9,242,334 |
| Ziff Davis, Inc. | | |
| 1.75%, due 11/1/26 (b) | 3,285,000 | 3,291,570 |
| Zillow Group, Inc. | | |
| 2.75%, due 5/15/25 | 17,202,000 | 16,445,112 |
| | | 155,977,198 |
| Leisure Time 0.4% |
| NCL Corp. Ltd. | | |
| 6.00%, due 5/15/24 | 1,756,000 | 2,058,532 |
The notes to the financial statements are an integral part of, and should be read in conjunction with, the financial statements.
| 12 | MainStay VP MacKay Convertible Portfolio |
| | Principal
Amount | Value |
| Convertible Bonds (continued) |
| Leisure Time (continued) |
| Royal Caribbean Cruises Ltd. | | |
| 6.00%, due 8/15/25 (b) | $ 3,850,000 | $ 4,854,850 |
| | | 6,913,382 |
| Machinery-Diversified 0.9% |
| Chart Industries, Inc. | | |
| 1.00%, due 11/15/24 (b) | 7,813,000 | 15,555,683 |
| Media 3.4% |
| Cable One, Inc. | | |
| 1.125%, due 3/15/28 (c) | 18,790,000 | 14,054,920 |
| DISH Network Corp. | | |
| (zero coupon), due 12/15/25 | 20,445,000 | 13,146,135 |
| Liberty Media Corp. | | |
| 1.375%, due 10/15/23 | 11,955,000 | 14,782,357 |
| Liberty Media Corp.-Liberty Formula One | | |
| 2.25%, due 8/15/27 (b) | 14,461,000 | 13,889,791 |
| | | 55,873,203 |
| Oil & Gas 8.8% |
| EQT Corp. | | |
| 1.75%, due 5/1/26 | 24,479,000 | 56,962,633 |
| Permian Resources Operating LLC | | |
| 3.25%, due 4/1/28 | 14,611,000 | 24,816,783 |
| Pioneer Natural Resources Co. | | |
| 0.25%, due 5/15/25 | 27,292,000 | 63,781,403 |
| | | 145,560,819 |
| Oil & Gas Services 3.6% |
| Helix Energy Solutions Group, Inc. | | |
| 6.75%, due 2/15/26 | 22,085,000 | 30,623,455 |
| Oil States International, Inc. | | |
| 4.75%, due 4/1/26 | 26,829,000 | 28,991,417 |
| | | 59,614,872 |
| Pharmaceuticals 1.7% |
| Dexcom, Inc. | | |
| 0.25%, due 11/15/25 (c) | 16,942,000 | 18,509,135 |
| Pacira BioSciences, Inc. | | |
| 0.75%, due 8/1/25 | 11,671,000 | 10,569,549 |
| | | 29,078,684 |
| Real Estate Investment Trusts 1.0% |
| Pebblebrook Hotel Trust | | |
| 1.75%, due 12/15/26 | 5,863,000 | 4,851,633 |
| | Principal
Amount | Value |
| |
| Real Estate Investment Trusts (continued) |
| Summit Hotel Properties, Inc. | | |
| 1.50%, due 2/15/26 | $ 13,238,000 | $ 11,371,442 |
| | | 16,223,075 |
| Retail 2.8% |
| Burlington Stores, Inc. | | |
| 2.25%, due 4/15/25 | 20,948,000 | 24,194,940 |
| Cheesecake Factory, Inc. (The) | | |
| 0.375%, due 6/15/26 | 9,488,000 | 7,821,670 |
| Patrick Industries, Inc. | | |
| 1.75%, due 12/1/28 | 17,313,000 | 14,225,025 |
| | | 46,241,635 |
| Semiconductors 4.9% |
| Impinj, Inc. | | |
| 1.125%, due 5/15/27 | 4,870,000 | 5,868,350 |
| Microchip Technology, Inc. | | |
| 0.125%, due 11/15/24 (c) | 35,083,000 | 37,801,932 |
| ON Semiconductor Corp. | | |
| 1.625%, due 10/15/23 | 5,984,000 | 17,990,896 |
| Rambus, Inc. | | |
| 1.375%, due 2/1/23 | 3,527,000 | 6,661,664 |
| Wolfspeed, Inc. (b) | | |
| 0.25%, due 2/15/28 | 9,771,000 | 8,471,457 |
| 1.875%, due 12/1/29 | 4,785,000 | 4,332,818 |
| | | 81,127,117 |
| Software 7.4% |
| Akamai Technologies, Inc. | | |
| 0.375%, due 9/1/27 | 18,297,000 | 17,711,496 |
| Bentley Systems, Inc. | | |
| 0.125%, due 1/15/26 | 3,445,000 | 3,159,065 |
| Bill.com Holdings, Inc. | | |
| (zero coupon), due 12/1/25 | 5,190,000 | 5,335,320 |
| Coupa Software, Inc. | | |
| 0.375%, due 6/15/26 | 11,250,000 | 10,873,125 |
| Datadog, Inc. | | |
| 0.125%, due 6/15/25 | 10,168,000 | 11,146,670 |
| DigitalOcean Holdings, Inc. | | |
| (zero coupon), due 12/1/26 | 6,410,000 | 4,823,525 |
| Dropbox, Inc. | | |
| (zero coupon), due 3/1/28 | 12,063,000 | 10,808,448 |
| Envestnet, Inc. | | |
| 2.625%, due 12/1/27 (b) | 11,969,000 | 12,902,582 |
| Everbridge, Inc. | | |
| 0.125%, due 12/15/24 | 13,318,000 | 12,136,251 |
| MongoDB, Inc. | | |
| 0.25%, due 1/15/26 | 7,540,000 | 8,868,925 |
The notes to the financial statements are an integral part of, and should be read in conjunction with, the financial statements.
13
Portfolio of Investments December 31, 2022† (continued)
| | Principal
Amount | Value |
| Convertible Bonds (continued) |
| Software (continued) |
| Splunk, Inc. | | |
| 0.50%, due 9/15/23 | $ 17,072,000 | $ 16,534,232 |
| Zynga, Inc. | | |
| (zero coupon), due 12/15/26 | 8,495,000 | 8,410,974 |
| | | 122,710,613 |
| Telecommunications 4.1% |
| Infinera Corp. | | |
| 2.50%, due 3/1/27 | 4,490,000 | 5,018,408 |
| InterDigital, Inc. | | |
| 2.00%, due 6/1/24 | 2,860,000 | 2,750,963 |
| NICE Ltd. | | |
| (zero coupon), due 9/15/25 | 48,248,000 | 45,714,980 |
| Viavi Solutions, Inc. | | |
| 1.00%, due 3/1/24 | 14,133,000 | 14,242,531 |
| | | 67,726,882 |
| Trucking & Leasing 0.5% |
| Greenbrier Cos., Inc. (The) | | |
| 2.875%, due 4/15/28 | 9,472,000 | 8,396,928 |
Total Convertible Bonds
(Cost $1,394,621,894) | | 1,360,210,478 |
| |
| | Shares | |
| Convertible Preferred Stocks 8.4% |
| Banks 1.7% |
| Bank of America Corp. | |
| Series L | | |
| 7.25% (e) | 11,636 | 13,497,760 |
| Wells Fargo & Co. | |
| Series L | | |
| 7.50% (e) | 12,264 | 14,532,840 |
| | | 28,030,600 |
| Capital Markets 1.0% |
| KKR Group Co., Inc. | |
| Series C | | |
| 6.00% | 283,400 | 16,224,650 |
| Electric Utilities 1.4% |
| PG&E Corp. | |
| 5.50% | 154,100 | 22,227,384 |
| | Shares | Value |
| |
| Health Care Equipment & Supplies 0.3% |
| Becton Dickinson and Co. | |
| Series B | | |
| 6.00% | 106,750 | $ 5,346,040 |
| Independent Power and Renewable Electricity Producers 0.9% |
| AES Corp. (The) | |
| 6.875% | 150,600 | 15,362,706 |
| Life Sciences Tools & Services 3.1% |
| Danaher Corp. | |
| Series B | | |
| 5.00% (c) | 38,229 | 51,859,550 |
Total Convertible Preferred Stocks
(Cost $139,244,982) | | 139,050,930 |
Total Convertible Securities
(Cost $1,533,866,876) | | 1,499,261,408 |
| Common Stocks 1.6% |
| Banks 0.5% |
| Bank of America Corp. | 267,678 | 8,865,495 |
| Energy Equipment & Services 0.5% |
| Weatherford International plc (f) | 157,538 | 8,021,835 |
| Oil, Gas & Consumable Fuels 0.6% |
| Kosmos Energy Ltd. (f) | 653,900 | 4,158,804 |
| PDC Energy, Inc. | 79,100 | 5,021,268 |
| | | 9,180,072 |
Total Common Stocks
(Cost $16,003,167) | | 26,067,402 |
| Short-Term Investments 12.1% |
| Affiliated Investment Company 5.3% |
| MainStay U.S. Government Liquidity Fund, 3.602% (g)(h) | 87,784,336 | 87,784,336 |
| Unaffiliated Investment Companies 6.8% |
| Goldman Sachs Financial Square Government Fund, 4.24% (h)(i) | 5,000,000 | 5,000,000 |
The notes to the financial statements are an integral part of, and should be read in conjunction with, the financial statements.
| 14 | MainStay VP MacKay Convertible Portfolio |
| | Shares | | Value |
| Short-Term Investments (continued) |
| Unaffiliated Investment Companies (continued) |
| Invesco Government and Agency Portfolio, 4.301% (h)(i) | 108,717,583 | | $ 108,717,583 |
| | | | 113,717,583 |
Total Short-Term Investments
(Cost $201,501,919) | | | 201,501,919 |
Total Investments
(Cost $1,806,608,749) | 106.6% | | 1,771,904,185 |
| Other Assets, Less Liabilities | (6.6) | | (110,051,568) |
| Net Assets | 100.0% | | $ 1,661,852,617 |
| † | Percentages indicated are based on Portfolio net assets. |
| ‡ | Less than one-tenth of a percent. |
| (a) | PIK ("Payment-in-Kind")—issuer may pay interest or dividends with additional securities and/or in cash. |
| (b) | May be sold to institutional investors only under Rule 144A or securities offered pursuant to Section 4(a)(2) of the Securities Act of 1933, as amended. |
| (c) | All or a portion of this security was held on loan. As of December 31, 2022, the aggregate market value of securities on loan was $120,698,880; the total market value of collateral held by the Portfolio was $122,744,706. The market value of the collateral held included non-cash collateral in the form of U.S. Treasury securities with a value of $9,027,123. The Portfolio received cash collateral with a value of $113,717,583. (See Note 2(G)) |
| (d) | Step coupon—Rate shown was the rate in effect as of December 31, 2022. |
| (e) | Security is perpetual and, thus, does not have a predetermined maturity date. The date shown, if applicable, reflects the next call date. |
| (f) | Non-income producing security. |
| (g) | As of December 31, 2022, the Portfolio's ownership exceeds 5% of the outstanding shares of the Underlying Portfolio's share class. |
| (h) | Current yield as of December 31, 2022. |
| (i) | Represents a security purchased with cash collateral received for securities on loan. |
Investments in Affiliates (in 000's)
Investments in issuers considered to be affiliate(s) of the Portfolio during the year ended December 31, 2022 for purposes of Section 2(a)(3) of the Investment Company Act of 1940, as amended, were as follows:
| Affiliated Investment Companies | Value,
Beginning
of Year | Purchases
at Cost | Proceeds
from
Sales | Net
Realized
Gain/(Loss)
on Sales | Change in
Unrealized
Appreciation/
(Depreciation) | Value,
End of
Year | Dividend
Income | Other
Distributions | Shares
End of
Year |
| MainStay U.S. Government Liquidity Fund | $ 98,790 | $ 238,310 | $ (249,316) | $ — | $ — | $ 87,784 | $ 1,093 | $ — | 87,784 |
The notes to the financial statements are an integral part of, and should be read in conjunction with, the financial statements.
15
Portfolio of Investments December 31, 2022† (continued)
The following is a summary of the fair valuations according to the inputs used as of December 31, 2022, for valuing the Portfolio’s assets:
| Description | Quoted
Prices in
Active
Markets for
Identical
Assets
(Level 1) | | Significant
Other
Observable
Inputs
(Level 2) | | Significant
Unobservable
Inputs
(Level 3) | | Total |
| Asset Valuation Inputs | | | | | | | |
| Investments in Securities (a) | | | | | | | |
| Long-Term Bonds | | | | | | | |
| Corporate Bonds | $ — | | $ 45,073,456 | | $ — | | $ 45,073,456 |
| Total Corporate Bonds | — | | 45,073,456 | | — | | 45,073,456 |
| Convertible Securities | | | | | | | |
| Convertible Bonds | — | | 1,360,210,478 | | — | | 1,360,210,478 |
| Convertible Preferred Stocks | 139,050,930 | | — | | — | | 139,050,930 |
| Total Convertible Securities | 139,050,930 | | 1,360,210,478 | | — | | 1,499,261,408 |
| Common Stocks | 26,067,402 | | — | | — | | 26,067,402 |
| Short-Term Investments | | | | | | | |
| Affiliated Investment Company | 87,784,336 | | — | | — | | 87,784,336 |
| Unaffiliated Investment Companies | 113,717,583 | | — | | — | | 113,717,583 |
| Total Short-Term Investments | 201,501,919 | | — | | — | | 201,501,919 |
| Total Investments in Securities | $ 366,620,251 | | $ 1,405,283,934 | | $ — | | $ 1,771,904,185 |
| (a) | For a complete listing of investments and their industries, see the Portfolio of Investments. |
The notes to the financial statements are an integral part of, and should be read in conjunction with, the financial statements.
| 16 | MainStay VP MacKay Convertible Portfolio |
Statement of Assets and Liabilities as of December 31, 2022
| Assets |
Investment in unaffiliated securities, at value
(identified cost $1,718,824,413) including securities on loan of $120,698,880 | $1,684,119,849 |
Investment in affiliated investment companies, at value
(identified cost $87,784,336) | 87,784,336 |
| Receivables: | |
| Dividends and interest | 4,228,466 |
| Portfolio shares sold | 605,897 |
| Securities lending | 283,481 |
| Other assets | 9,290 |
| Total assets | 1,777,031,319 |
| Liabilities |
| Cash collateral received for securities on loan | 113,717,583 |
| Due to custodian | 24 |
| Payables: | |
| Manager (See Note 3) | 781,237 |
| Portfolio shares redeemed | 388,158 |
| NYLIFE Distributors (See Note 3) | 190,502 |
| Professional fees | 50,130 |
| Shareholder communication | 32,857 |
| Custodian | 11,707 |
| Accrued expenses | 6,504 |
| Total liabilities | 115,178,702 |
| Net assets | $1,661,852,617 |
| Composition of Net Assets |
| Shares of beneficial interest outstanding (par value of $.001 per share) unlimited number of shares authorized | $ 120,074 |
| Additional paid-in-capital | 1,702,291,230 |
| | 1,702,411,304 |
| Total distributable earnings (loss) | (40,558,687) |
| Net assets | $1,661,852,617 |
| Initial Class | |
| Net assets applicable to outstanding shares | $782,969,652 |
| Shares of beneficial interest outstanding | 56,205,392 |
| Net asset value per share outstanding | $ 13.93 |
| Service Class | |
| Net assets applicable to outstanding shares | $872,109,222 |
| Shares of beneficial interest outstanding | 63,376,613 |
| Net asset value per share outstanding | $ 13.76 |
| Service 2 Class | |
| Net assets applicable to outstanding shares | $ 6,773,743 |
| Shares of beneficial interest outstanding | 492,163 |
| Net asset value and offering price per share outstanding | $ 13.76 |
The notes to the financial statements are an integral part of, and should be read in conjunction with, the financial statements.
17
Statement of Operations for the year ended December 31, 2022
| Investment Income (Loss) |
| Income | |
| Interest | $ 12,982,460 |
| Dividends-unaffiliated | 8,806,491 |
| Securities lending, net | 2,206,257 |
| Dividends-affiliated | 1,092,917 |
| Total income | 25,088,125 |
| Expenses | |
| Manager (See Note 3) | 9,784,332 |
| Distribution/Service—Service Class (See Note 3) | 2,413,002 |
| Distribution/Service—Service 2 Class (See Note 3) | 18,715 |
| Professional fees | 189,859 |
| Shareholder communication | 145,004 |
| Custodian | 46,280 |
| Trustees | 39,756 |
| Shareholder service (See Note 3) | 7,486 |
| Miscellaneous | 70,952 |
| Total expenses | 12,715,386 |
| Net investment income (loss) | 12,372,739 |
| Realized and Unrealized Gain (Loss) |
| Net realized gain (loss) on unaffiliated investments | (1,458,820) |
| Net change in unrealized appreciation (depreciation) on unaffiliated investments | (272,476,633) |
| Net realized and unrealized gain (loss) | (273,935,453) |
| Net increase (decrease) in net assets resulting from operations | $(261,562,714) |
The notes to the financial statements are an integral part of, and should be read in conjunction with, the financial statements.
| 18 | MainStay VP MacKay Convertible Portfolio |
Statements of Changes in Net Assets
for the years ended December 31, 2022 and December 31, 2021
| | 2022 | 2021 |
| Increase (Decrease) in Net Assets |
| Operations: | | |
| Net investment income (loss) | $ 12,372,739 | $ 7,292,515 |
| Net realized gain (loss) | (1,458,820) | 248,922,270 |
| Net change in unrealized appreciation (depreciation) | (272,476,633) | (98,533,563) |
| Net increase (decrease) in net assets resulting from operations | (261,562,714) | 157,681,222 |
| Distributions to shareholders: | | |
| Initial Class | (119,474,150) | (55,054,387) |
| Service Class | (135,597,007) | (63,916,632) |
| Service 2 Class | (1,046,632) | (497,943) |
| Total distributions to shareholders | (256,117,789) | (119,468,962) |
| Capital share transactions: | | |
| Net proceeds from sales of shares | 113,733,843 | 742,122,288 |
| Net asset value of shares issued to shareholders in reinvestment of distributions | 256,117,789 | 119,468,962 |
| Cost of shares redeemed | (275,440,951) | (176,472,885) |
| Increase (decrease) in net assets derived from capital share transactions | 94,410,681 | 685,118,365 |
| Net increase (decrease) in net assets | (423,269,822) | 723,330,625 |
| Net Assets |
| Beginning of year | 2,085,122,439 | 1,361,791,814 |
| End of year | $1,661,852,617 | $2,085,122,439 |
The notes to the financial statements are an integral part of, and should be read in conjunction with, the financial statements.
19
Financial Highlights selected per share data and ratios
| | Year Ended December 31, |
| Initial Class | 2022 | | 2021 | | 2020 | | 2019 | | 2018 |
| Net asset value at beginning of year | $ 18.68 | | $ 18.17 | | $ 13.60 | | $ 12.31 | | $ 13.29 |
| Net investment income (loss) (a) | 0.13 | | 0.10 | | 0.10 | | 0.13 | | 0.17 |
| Net realized and unrealized gain (loss) | (2.49) | | 1.56 | | 4.74 | | 2.56 | | (0.41) |
| Total from investment operations | (2.36) | | 1.66 | | 4.84 | | 2.69 | | (0.24) |
| Less distributions: | | | | | | | | | |
| From net investment income | (0.55) | | (0.22) | | (0.11) | | (0.20) | | (0.23) |
| From net realized gain on investments | (1.84) | | (0.93) | | (0.16) | | (1.20) | | (0.51) |
| Total distributions | (2.39) | | (1.15) | | (0.27) | | (1.40) | | (0.74) |
| Net asset value at end of year | $ 13.93 | | $ 18.68 | | $ 18.17 | | $ 13.60 | | $ 12.31 |
| Total investment return (b) | (12.67)% | | 9.25% | | 36.04% | | 22.46% | | (2.27)% |
| Ratios (to average net assets)/Supplemental Data: | | | | | | | | | |
| Net investment income (loss) | 0.82% | | 0.51% | | 0.70% | | 0.94% | | 1.24% |
| Net expenses (c) | 0.57% | | 0.56% | | 0.61% | | 0.61% | | 0.61% |
| Portfolio turnover rate | 14% | | 41% | | 49% | | 26% | | 43% |
| Net assets at end of year (in 000's) | $ 782,970 | | $ 946,696 | | $ 370,733 | | $ 202,104 | | $ 177,136 |
| (a) | Per share data based on average shares outstanding during the year. |
| (b) | Total return does not reflect any deduction of sales charges, mortality and expense charges, contract charges or administrative charges. For periods of less than one year, total return is not annualized. |
| (c) | In addition to the fees and expenses which the Portfolio bears directly, it also indirectly bears a pro-rata share of the fees and expenses of the underlying funds in which it invests. Such indirect expenses are not included in the above expense ratios. |
| | Year Ended December 31, |
| Service Class | 2022 | | 2021 | | 2020 | | 2019 | | 2018 |
| Net asset value at beginning of year | $ 18.48 | | $ 17.99 | | $ 13.47 | | $ 12.21 | | $ 13.18 |
| Net investment income (loss) (a) | 0.09 | | 0.05 | | 0.06 | | 0.09 | | 0.13 |
| Net realized and unrealized gain (loss) | (2.46) | | 1.54 | | 4.69 | | 2.53 | | (0.40) |
| Total from investment operations | (2.37) | | 1.59 | | 4.75 | | 2.62 | | (0.27) |
| Less distributions: | | | | | | | | | |
| From net investment income | (0.51) | | (0.17) | | (0.07) | | (0.16) | | (0.19) |
| From net realized gain on investments | (1.84) | | (0.93) | | (0.16) | | (1.20) | | (0.51) |
| Total distributions | (2.35) | | (1.10) | | (0.23) | | (1.36) | | (0.70) |
| Net asset value at end of year | $ 13.76 | | $ 18.48 | | $ 17.99 | | $ 13.47 | | $ 12.21 |
| Total investment return (b) | (12.89)% | | 8.98% | | 35.70% | | 22.15% | | (2.52)% |
| Ratios (to average net assets)/Supplemental Data: | | | | | | | | | |
| Net investment income (loss) | 0.57% | | 0.25% | | 0.44% | | 0.69% | | 0.99% |
| Net expenses (c) | 0.82% | | 0.81% | | 0.86% | | 0.86% | | 0.86% |
| Portfolio turnover rate | 14% | | 41% | | 49% | | 26% | | 43% |
| Net assets at end of year (in 000's) | $ 872,109 | | $ 1,129,151 | | $ 982,863 | | $ 752,670 | | $ 592,673 |
| (a) | Per share data based on average shares outstanding during the year. |
| (b) | Total return does not reflect any deduction of sales charges, mortality and expense charges, contract charges or administrative charges. For periods of less than one year, total return is not annualized. |
| (c) | In addition to the fees and expenses which the Portfolio bears directly, it also indirectly bears a pro-rata share of the fees and expenses of the underlying funds in which it invests. Such indirect expenses are not included in the above expense ratios. |
The notes to the financial statements are an integral part of, and should be read in conjunction with, the financial statements.
| 20 | MainStay VP MacKay Convertible Portfolio |
Financial Highlights selected per share data and ratios
| | Year Ended December 31, |
| Service Class 2 | 2022 | | 2021 | | 2020 | | 2019 | | 2018 |
| Net asset value at beginning of year | $ 18.48 | | $ 18.00 | | $ 13.47 | | $ 12.21 | | $ 13.18 |
| Net investment income (loss) (a) | 0.08 | | 0.03 | | 0.05 | | 0.08 | | 0.12 |
| Net realized and unrealized gain (loss) | (2.47) | | 1.53 | | 4.70 | | 2.53 | | (0.40) |
| Total from investment operations | (2.39) | | 1.56 | | 4.75 | | 2.61 | | (0.28) |
| Less distributions: | | | | | | | | | |
| From net investment income | (0.49) | | (0.15) | | (0.06) | | (0.15) | | (0.18) |
| From net realized gain on investments | (1.84) | | (0.93) | | (0.16) | | (1.20) | | (0.51) |
| Total distributions | (2.33) | | (1.08) | | (0.22) | | (1.35) | | (0.69) |
| Net asset value at end of year | $ 13.76 | | $ 18.48 | | $ 18.00 | | $ 13.47 | | $ 12.21 |
| Total investment return (b) | (12.97)% | | 8.87% | | 35.57% | | 22.03% | | (2.59)% |
| Ratios (to average net assets)/Supplemental Data: | | | | | | | | | |
| Net investment income (loss) | 0.47% | | 0.16% | | 0.32% | | 0.56% | | 0.88% |
| Net expenses (c) | 0.92% | | 0.91% | | 0.96% | | 0.96% | | 0.96% |
| Portfolio turnover rate | 14% | | 41% | | 49% | | 26% | | 43% |
| Net assets at end of year (in 000's) | $ 6,774 | | $ 9,275 | | $ 8,196 | | $ 6,555 | | $ 3,016 |
| (a) | Per share data based on average shares outstanding during the year. |
| (b) | Total return does not reflect any deduction of sales charges, mortality and expense charges, contract charges or administrative charges. For periods of less than one year, total return is not annualized. |
| (c) | In addition to the fees and expenses which the Portfolio bears directly, it also indirectly bears a pro-rata share of the fees and expenses of the underlying funds in which it invests. Such indirect expenses are not included in the above expense ratios. |
The notes to the financial statements are an integral part of, and should be read in conjunction with, the financial statements.
21
Notes to Financial Statements
Note 1–Organization and Business
MainStay VP Funds Trust (the “Fund”) was organized as a Delaware statutory trust on February 1, 2011. The Fund is registered under the Investment Company Act of 1940, as amended (the “1940 Act”), as an open-end management investment company. The Fund is comprised of thirty-one separate series (collectively referred to as the “Portfolios”). These financial statements and notes relate to the MainStay VP MacKay Convertible Portfolio (the "Portfolio"), a "diversified” portfolio, as that term is defined in the 1940 Act, as interpreted or modified by regulatory authorities having jurisdiction, from time to time.
Shares of the Portfolio are currently offered to certain separate accounts to fund variable annuity policies and variable universal life insurance policies issued by New York Life Insurance and Annuity Corporation (“NYLIAC”), a wholly-owned subsidiary of New York Life Insurance Company (“New York Life”) and may also be offered to fund variable annuity policies and variable universal life insurance policies issued by other insurance companies. NYLIAC allocates shares of the Portfolio to, among others, certain NYLIAC separate accounts. Service 2 Class shares of the Portfolio are currently offered to certain separate accounts to fund variable annuity policies and variable universal life insurance policies issued by participating insurance companies. Shares of the Portfolio are also offered to the MainStay VP Conservative Allocation Portfolio, MainStay VP Moderate Allocation Portfolio, MainStay VP Growth Allocation Portfolio and MainStay VP Equity Allocation Portfolio, which operate as “funds-of-funds," and other variable insurance funds.
The following table lists the Portfolio's share classes that have been registered and commenced operations:
| Class | Commenced Operations |
| Initial Class | October 1, 1996 |
| Service Class | June 5, 2003 |
| Service 2 Class | April 26, 2016 |
Shares of the Portfolio are offered and are redeemed at a price equal to their respective net asset value (“NAV”) per share. No sales or redemption charge is applicable to the purchase or redemption of the Portfolio's shares. Under the terms of the Fund’s multiple class plan, adopted pursuant to Rule 18f-3 under the 1940 Act, the classes differ in that, among other things, each of Service Class and Service 2 Class shares of the Portfolio pay a combined distribution and service fee of 0.25% of average daily net assets attributable to such Class's shares of the Portfolio to the Distributor (as defined in Note 3(B)) pursuant to a plan adopted in accordance with Rule 12b-1 under the 1940 Act. Contract owners of variable annuity contracts purchased after June 2, 2003, are permitted to invest only in the Service Class and Service 2 Class shares.
The Portfolio's investment objective is to seek capital appreciation together with current income.
Note 2–Significant Accounting Policies
The Portfolio is an investment company and accordingly follows the investment company accounting and reporting guidance of the Financial Accounting Standards Board (“FASB”) Accounting Standards Codification Topic 946 Financial Services—Investment Companies. The Portfolio prepares its financial statements in accordance with generally accepted accounting principles (“GAAP”) in the United States of America and follows the significant accounting policies described below.
(A) Securities Valuation. Investments are usually valued as of the close of regular trading on the New York Stock Exchange (the "Exchange") (usually 4:00 p.m. Eastern time) on each day the Portfolio is open for business ("valuation date").
Effective September 8, 2022, and pursuant to Rule 2a-5 under the 1940 Act, the Board of Trustees of the Fund (the "Board") designated New York Life Investment Management LLC (“New York Life Investments” or the "Manager") as its Valuation Designee (the "Valuation Designee"). The Valuation Designee is responsible for performing fair valuations relating to all investments in the Portfolio’s portfolio for which market quotations are not readily available; periodically assessing and managing material valuation risks; establishing and applying fair value methodologies; testing fair valuation methodologies; evaluating and overseeing pricing services; ensuring appropriate segregation of valuation and portfolio management functions; providing quarterly, annual and prompt reporting to the Board, as appropriate; identifying potential conflicts of interest; and maintaining appropriate records. The Valuation Designee has established a valuation committee ("Valuation Committee") to assist in carrying out the Valuation Designee’s responsibilities and establish prices of securities for which market quotations are not readily available. The Portfolio’s and the Valuation Designee's policies and procedures ("Valuation Procedures") govern the Valuation Designee’s selection and application of methodologies for determining and calculating the fair value of Portfolio investments. The Valuation Designee may value the Portfolio's portfolio securities for which market quotations are not readily available and other Portfolio assets utilizing inputs from pricing services and other third-party sources (together, “Pricing Sources”). The Valuation Committee meets (in person, via electronic mail or via teleconference) on an ad-hoc basis to determine fair valuations and on a quarterly basis to review fair value events with respect to certain securities for which market quotations are not readily available, including valuation risks and back-testing results, and preview reports to the Board.
The Valuation Committee establishes prices of securities for which market quotations are not readily available based on such methodologies and measurements on a regular basis after considering information that is reasonably available and deemed relevant by the Valuation Committee. The Board shall oversee the Valuation Designee and review fair valuation materials on a prompt, quarterly and annual basis and approve proposed revisions to the Valuation Procedures.
Investments for which market quotations are not readily available are valued at fair value as determined in good faith pursuant to the Valuation
| 22 | MainStay VP MacKay Convertible Portfolio |
Procedures. A market quotation is readily available only when that quotation is a quoted price (unadjusted) in active markets for identical investments that the Portfolio can access at the measurement date, provided that a quotation will not be readily available if it is not reliable. "Fair value" is defined as the price the Portfolio would reasonably expect to receive upon selling an asset or liability in an orderly transaction to an independent buyer in the principal or most advantageous market for the asset or liability. Fair value measurements are determined within a framework that establishes a three-tier hierarchy that maximizes the use of observable market data and minimizes the use of unobservable inputs to establish a classification of fair value measurements for disclosure purposes. "Inputs" refer broadly to the assumptions that market participants would use in pricing the asset or liability, including assumptions about risk, such as the risk inherent in a particular valuation technique used to measure fair value using a pricing model and/or the risk inherent in the inputs for the valuation technique. Inputs may be observable or unobservable. Observable inputs reflect the assumptions market participants would use in pricing the asset or liability based on market data obtained from sources independent of the Portfolio. Unobservable inputs reflect the Portfolio’s own assumptions about the assumptions market participants would use in pricing the asset or liability based on the information available. The inputs or methodology used for valuing assets or liabilities may not be an indication of the risks associated with investing in those assets or liabilities. The three-tier hierarchy of inputs is summarized below.
| • | Level 1—quoted prices (unadjusted) in active markets for an identical asset or liability |
| • | Level 2—other significant observable inputs (including quoted prices for a similar asset or liability in active markets, interest rates and yield curves, prepayment speeds, credit risk, etc.) |
| • | Level 3—significant unobservable inputs (including the Portfolio's own assumptions about the assumptions that market participants would use in measuring fair value of an asset or liability) |
The level of an asset or liability within the fair value hierarchy is based on the lowest level of an input, both individually and in the aggregate, that is significant to the fair value measurement. The aggregate value by input level of the Portfolio’s assets and liabilities as of December 31, 2022, is included at the end of the Portfolio of Investments.
The Portfolio may use third-party vendor evaluations, whose prices may be derived from one or more of the following standard inputs, among others:
| • Benchmark yields | • Reported trades |
| • Broker/dealer quotes | • Issuer spreads |
| • Two-sided markets | • Benchmark securities |
| • Bids/offers | • Reference data (corporate actions or material event notices) |
| • Industry and economic events | • Comparable bonds |
| • Monthly payment information | |
An asset or liability for which a market quotation is not readily available is valued by methods deemed reasonable in good faith by the Valuation Committee, following the Valuation Procedures to represent fair value. Under these procedures, the Valuation Designee generally uses a market-based approach which may use related or comparable assets or liabilities, recent transactions, market multiples, book values and other relevant information. The Valuation Designee may also use an income-based valuation approach in which the anticipated future cash flows of the asset or liability are discounted to calculate fair value. Discounts may also be applied due to the nature and/or duration of any restrictions on the disposition of the asset or liability. Fair value represents a good faith approximation of the value of a security. Fair value determinations involve the consideration of a number of subjective factors, an analysis of applicable facts and circumstances and the exercise of judgment. As a result, it is possible that the fair value for a security determined in good faith in accordance with the Valuation Procedures may differ from valuations for the same security determined for other funds using their own valuation procedures. Although the Valuation Procedures are designed to value a security at the price the Portfolio may reasonably expect to receive upon the security's sale in an orderly transaction, there can be no assurance that any fair value determination thereunder would, in fact, approximate the amount that the Portfolio would actually realize upon the sale of the security or the price at which the security would trade if a reliable market price were readily available. During the year ended December 31, 2022, there were no material changes to the fair value methodologies.
Securities which may be valued in this manner include, but are not limited to: (i) a security for which trading has been halted or suspended or otherwise does not have a readily available market quotation on a given day; (ii) a debt security that has recently gone into default and for which there is not a current market quotation; (iii) a security of an issuer that has entered into a restructuring; (iv) a security that has been delisted from a national exchange; (v) a security subject to trading collars for which no or limited trading takes place; and (vi) a security whose principal market has been temporarily closed at a time when, under normal conditions, it would be open. Securities valued in this manner are generally categorized as Level 2 or 3 in the hierarchy.
Equity securities are valued at the last quoted sales prices as of the close of regular trading on the relevant exchange on each valuation date. Securities that are not traded on the valuation date are valued at the mean of the last quoted bid and ask prices. Prices are normally taken from the principal market in which each security trades. These securities are generally categorized as Level 1 in the hierarchy.
Certain convertible preferred stocks may be valued utilizing evaluated prices based on market inputs obtained from the pricing vendor and are generally categorized as Level 2 in the hierarchy. No securities held by the Portfolio as of December 31, 2022, were fair valued in such a manner.
Notes to Financial Statements (continued)
Investments in mutual funds, including money market funds, are valued at their respective NAVs at the close of business each day on the valuation date. These securities are generally categorized as Level 1 in the hierarchy.
Debt securities (other than convertible and municipal bonds) are valued at the evaluated bid prices (evaluated mean prices in the case of convertible and municipal bonds) supplied by a pricing agent or broker selected by the Valuation Designee, in consultation with the Subadvisor. The evaluations are market-based measurements processed through a pricing application and represents the pricing agent’s good faith determination as to what a holder may receive in an orderly transaction under market conditions. The rules-based logic utilizes valuation techniques that reflect participants’ assumptions and vary by asset class and per methodology, maximizing the use of relevant observable data including quoted prices for similar assets, benchmark yield curves and market corroborated inputs. The evaluated bid or mean prices are deemed by the Valuation Designee, in consultation with the Subadvisor, to be representative of market values at the regular close of trading of the Exchange on each valuation date. Debt securities purchased on a delayed delivery basis are marked to market daily until settlement at the forward settlement date. Debt securities, including corporate bonds, U.S. government and federal agency bonds, municipal bonds, foreign bonds, convertible bonds, asset-backed securities and mortgage-backed securities are generally categorized as Level 2 in the hierarchy.
Temporary cash investments acquired in excess of 60 days to maturity at the time of purchase are valued using the latest bid prices or using valuations based on a matrix system (which considers such factors as security prices, yields, maturities and ratings), both as furnished by independent pricing services. Temporary cash investments that mature in 60 days or less at the time of purchase ("Short-Term Investments") are valued using the amortized cost method of valuation, unless the use of such method would be inappropriate. The amortized cost method involves valuing a security at its cost on the date of purchase and thereafter assuming a constant amortization to maturity of the difference between such cost and the value on maturity date. Amortized cost approximates the current fair value of a security. Securities valued using the amortized cost method are not valued using quoted prices in an active market and are generally categorized as Level 2 in the hierarchy.
The information above is not intended to reflect an exhaustive list of the methodologies that may be used to value portfolio investments. The Valuation Procedures permit the use of a variety of valuation methodologies in connection with valuing portfolio investments. The methodology used for a specific type of investment may vary based on the market data available or other considerations. The methodologies summarized above may not represent the specific means by which portfolio investments are valued on any particular business day.
(B) Income Taxes. The Portfolio's policy is to comply with the requirements of the Internal Revenue Code of 1986, as amended (the “Internal Revenue Code”), applicable to regulated investment companies
and to distribute all of its taxable income to the shareholders of the Portfolio within the allowable time limits.
The Manager evaluates the Portfolio’s tax positions to determine if the tax positions taken meet the minimum recognition threshold in connection with accounting for uncertainties in income tax positions taken or expected to be taken for the purposes of measuring and recognizing tax liabilities in the financial statements. Recognition of tax benefits of an uncertain tax position is permitted only to the extent the position is “more likely than not” to be sustained assuming examination by taxing authorities. The Manager analyzed the Portfolio's tax positions taken on federal, state and local income tax returns for all open tax years (for up to three tax years) and has concluded that no provisions for federal, state and local income tax are required in the Portfolio's financial statements. The Portfolio's federal, state and local income tax and federal excise tax returns for tax years for which the applicable statutes of limitations have not expired are subject to examination by the Internal Revenue Service and state and local departments of revenue.
(C) Dividends and Distributions to Shareholders. Dividends and distributions are recorded on the ex-dividend date. The Portfolio intends to declare and pay dividends from net investment income, if any, at least quarterly and distributions from net realized capital and currency gains, if any, at least annually. All dividends and distributions are reinvested at NAV in the same class of shares of the Portfolio. Dividends and distributions to shareholders are determined in accordance with federal income tax regulations and may differ from determinations using GAAP.
(D) Security Transactions and Investment Income. The Portfolio records security transactions on the trade date. Realized gains and losses on security transactions are determined using the identified cost method. Dividend income is recognized on the ex-dividend date, net of any foreign tax withheld at the source, and interest income is accrued as earned using the effective interest rate method. Distributions received from real estate investment trusts may be classified as dividends, capital gains and/or return of capital. Discounts and premiums on securities purchased for the Portfolio are accreted and amortized, respectively, on the effective interest rate method. Premium associated with the conversion feature on a convertible bond is not amortized.
Investment income and realized and unrealized gains and losses on investments of the Portfolio are allocated pro rata to the separate classes of shares based upon their relative net assets on the date the income is earned or realized and unrealized gains and losses are incurred.
The Portfolio may place a debt security on non-accrual status and reduce related interest income by ceasing current accruals and writing off all or a portion of any interest receivables when the collection of all or a portion of such interest has become doubtful. A debt security is removed from non-accrual status when the issuer resumes interest payments or when collectability of interest is reasonably assured.
(E) Expenses. Expenses of the Fund are allocated to the individual Portfolios in proportion to the net assets of the respective Portfolios when the expenses are incurred, except where direct allocations of expenses
| 24 | MainStay VP MacKay Convertible Portfolio |
can be made. Expenses (other than fees incurred under the distribution and service plans and shareholder service plans, further discussed in Note 3(B), which are charged directly to the Service Class and Service 2 Class shares, as applicable) are allocated to separate classes of shares pro rata based upon their relative net assets on the date the expenses are incurred. The expenses borne by the Portfolio, including those of related parties to the Portfolio, are shown in the Statement of Operations.
Additionally, the Portfolio may invest in mutual funds, which are subject to management fees and other fees that may cause the costs of investing in mutual funds to be greater than the costs of owning the underlying securities directly. These indirect expenses of mutual funds are not included in the amounts shown as expenses in the Statement of Operations or in the expense ratios included in the Financial Highlights.
(F) Use of Estimates. In preparing financial statements in conformity with GAAP, the Manager makes estimates and assumptions that affect the reported amounts and disclosures in the financial statements. Actual results could differ from those estimates and assumptions.
(G) Securities Lending. In order to realize additional income, the Portfolio may engage in securities lending, subject to the limitations set forth in the 1940 Act and relevant guidance by the staff of the Securities and Exchange Commission (“SEC”). If the Portfolio engages in securities lending, the Portfolio will lend through its custodian, JPMorgan Chase Bank, N.A., ("JPMorgan"), acting as securities lending agent on behalf of the Portfolio. Under the current arrangement, JPMorgan will manage the Portfolio's collateral in accordance with the securities lending agency agreement between the Portfolio and JPMorgan, and indemnify the Portfolio against counterparty risk. The loans will be collateralized by cash (which may be invested in a money market fund) and/or non-cash collateral (which may include U.S. Treasury securities and/or U.S. government agency securities issued or guaranteed by the United States government or its agencies or instrumentalities) at least equal at all times to the market value of the securities loaned. Non-cash collateral held at year end is segregated and cannot be transferred by the Portfolio. The Portfolio bears the risk of delay in recovery of, or loss of rights in, the securities loaned. The Portfolio may also record a realized gain or loss on securities deemed sold due to a borrower’s inability to return securities on loan. The Portfolio bears the risk of any loss on investment of cash collateral. The Portfolio will receive compensation for lending its securities in the form of fees or it will retain a portion of interest earned on the investment of any cash collateral. The Portfolio will also continue to receive interest and dividends on the securities loaned and any gain or loss in the market price of the securities loaned that may occur during the term of the loan will be for the account of the Portfolio. Income earned from securities lending activities, if any, is reflected in the Statement of Operations. Securities on loan as of December 31, 2022, are shown in the Portfolio of Investments.
(H) Debt and Convertible Securities Risk. The ability of issuers of debt securities held by the Portfolio to meet their obligations may be affected by, among other things, economic or political developments in a
specific country, industry or region. Debt securities are also subject to the risks associated with changes in interest rates.
Convertible securities may be subordinate to other securities. In part, the total return for a convertible security depends upon the performance of the underlying stock into which it can be converted. Also, issuers of convertible securities are often not as strong financially as those issuing securities with higher credit ratings, are more likely to encounter financial difficulties and typically are more vulnerable to changes in the economy, such as a recession or a sustained period of rising interest rates, which could affect their ability to make interest and principal payments.
(I) Indemnifications. Under the Fund’s organizational documents, its officers and trustees are indemnified against certain liabilities that may arise out of performance of their duties to the Fund. Additionally, in the normal course of business, the Portfolio enters into contracts with third-party service providers that contain a variety of representations and warranties and that may provide general indemnifications. The Portfolio's maximum exposure under these arrangements is unknown, as this would involve future claims that may be made against the Portfolio that have not yet occurred. The Manager believes that the risk of loss in connection with these potential indemnification obligations is remote. However, there can be no assurance that material liabilities related to such obligations will not arise in the future, which could adversely impact the Portfolio.
Note 3–Fees and Related Party Transactions
(A) Manager and Subadvisor. New York Life Investments, a registered investment adviser and an indirect, wholly-owned subsidiary of New York Life, serves as the Portfolio's Manager, pursuant to an Amended and Restated Management Agreement ("Management Agreement"). The Manager provides offices, conducts clerical, recordkeeping and bookkeeping services and keeps most of the financial and accounting records required to be maintained by the Portfolio. Except for the portion of salaries and expenses that are the responsibility of the Portfolio, the Manager pays the salaries and expenses of all personnel affiliated with the Portfolio and certain operational expenses of the Portfolio. During a portion of the year ended December 31, 2022, the Portfolio reimbursed New York Life Investments in an amount equal to the portion of the compensation of the Chief Compliance Officer attributable to the Portfolio. MacKay Shields LLC ("MacKay Shields" or the "Subadvisor"), a registered investment adviser and an indirect, wholly-owned subsidiary of New York Life, serves as the Subadvisor to the Portfolio and is responsible for the day-to-day portfolio management of the Portfolio. Pursuant to the terms of an Amended and Restated Subadvisory Agreement between New York Life Investments and MacKay Shields, New York Life Investments pays for the services of the Subadvisor.
Pursuant to the Management Agreement, the Fund pays the Manager, on behalf of the Portfolio, a monthly fee for the services performed and the facilities furnished at an annual rate of the Portfolio's average daily net assets as follows: 0.60% up to $500 million; 0.55% from $500 million to $1 billion; 0.50% from $1 billion to $2 billion; and 0.49% in excess of
Notes to Financial Statements (continued)
$2 billion. During the year ended December 31, 2022, the effective management fee rate was 0.54%.
During the year ended December 31, 2022, New York Life Investments earned fees from the Portfolio in the amount of $9,784,332 and paid the Subadvisor fees of $4,892,168.
JPMorgan provides sub-administration and sub-accounting services to the Portfolio pursuant to an agreement with New York Life Investments. These services include calculating the daily NAVs of the Portfolio, maintaining the general ledger and sub-ledger accounts for the calculation of the Portfolio's NAVs, and assisting New York Life Investments in conducting various aspects of the Portfolio's administrative operations. For providing these services to the Portfolio, JPMorgan is compensated by New York Life Investments.
Pursuant to an agreement between the Fund and New York Life Investments, New York Life Investments is responsible for providing or procuring certain regulatory reporting services for the Portfolio. The Portfolio will reimburse New York Life Investments for the actual costs incurred by New York Life Investments in connection with providing or procuring these services for the Portfolio.
(B) Distribution, Service and Shareholder Service Fees. The Fund, on behalf of the Portfolio, has entered into a distribution agreement with NYLIFE Distributors LLC (the “Distributor”), an affiliate of New York Life Investments. The Portfolio has adopted a distribution plan (the “Plan”) in accordance with the provisions of Rule 12b-1 under the 1940 Act. Under the Plan, the Distributor has agreed to provide, through its affiliates or independent third parties, various distribution-related, shareholder and administrative support services to the Service Class and Service 2 Class shareholders. For its services, the Distributor is entitled to a combined distribution and service fee accrued daily and paid monthly at an annual rate of 0.25% of the average daily net assets attributable to the Service Class and Service 2 Class shares of the Portfolio.
The Board has adopted a shareholder services plan (the “Service Plan”) with respect to the Service 2 Class shares of the Portfolio. Under the terms of the Services Plan, the Portfolio is authorized to pay to New York Life Investments, its affiliates or independent third-party service providers, as compensation for services rendered to shareholders of the Service 2 Class shares, in connection with the administration of plans or programs that use Portfolio shares as their funding medium a shareholder servicing fee at the rate of 0.10% on an annualized basis of the average daily net assets of the Service 2 Class shares.
(C) Transfer and Dividend Disbursing Agent. NYLIM Service Company LLC, an affiliate of New York Life Investments, serves as the transfer agent and dividend disbursing agent for Service Class and Service 2 Class shares of the Portfolio. NYLIM Service Company LLC has entered into an agreement with DST Asset Manager Solutions, Inc.(“DST”), pursuant to which DST performs certain transfer agent services on behalf of NYLIM Service Company LLC. During the year ended December 31, 2022, all associated fees were paid by the Manager.
Note 4-Federal Income Tax
As of December 31, 2022, the cost and unrealized appreciation (depreciation) of the Portfolio’s investment portfolio, including applicable derivative contracts and other financial instruments, as determined on a federal income tax basis, were as follows:
| | Federal Tax
Cost | Gross
Unrealized
Appreciation | Gross
Unrealized
(Depreciation) | Net
Unrealized
Appreciation/
(Depreciation) |
| Investments in Securities | $1,820,415,954 | $158,307,822 | $(206,819,591) | $(48,511,769) |
As of December 31, 2022, the components of accumulated gain (loss) on a tax basis were as follows:
Ordinary
Income | Accumulated
Capital
and Other
Gain (Loss) | Other
Temporary
Differences | Unrealized
Appreciation
(Depreciation) | Total
Accumulated
Gain (Loss) |
| $13,517,506 | $(5,201,253) | $(363,171) | $(48,511,769) | $(40,558,687) |
The difference between book-basis and tax-basis unrealized appreciation (depreciation) is primarily due to cumulative convertible bond adjustments, wash sale adjustments, contingent payment debt instruments (“CPDI”), and debt to equity adjustments. The other temporary difference is primarily due to interest accrued on defaulted securities.
As of December 31, 2022, for federal income tax purposes, capital loss carryforwards of $5,201,253, as shown in the table below, were available to the extent provided by the regulations to offset future realized gains of the Portfolio. Accordingly, no capital gains distributions are expected to be paid to shareholders until net gains have been realized in excess of such amounts.
Capital Loss
Available Through | Short-Term
Capital Loss
Amounts (000’s) | Long-Term
Capital Loss
Amounts (000’s) |
| Unlimited | $— | $5,201 |
During the years ended December 31, 2022 and December 31, 2021, the tax character of distributions paid as reflected in the Statements of Changes in Net Assets was as follows:
| | 2022 | 2021 |
| Distributions paid from: | | |
| Ordinary Income | $ 81,124,031 | $ 38,710,804 |
| Long-Term Capital Gains | 174,993,758 | 80,758,158 |
| Total | $256,117,789 | $119,468,962 |
Note 5–Custodian
JPMorgan is the custodian of cash and securities held by the Portfolio. Custodial fees are charged to the Portfolio based on the Portfolio's net assets and/or the market value of securities held by the Portfolio and the number of certain transactions incurred by the Portfolio.
| 26 | MainStay VP MacKay Convertible Portfolio |
Note 6–Line of Credit
The Portfolio and certain other funds managed by New York Life Investments maintain a line of credit with a syndicate of banks in order to secure a source of funds for temporary purposes to meet unanticipated or excessive redemption requests.
Effective July 26, 2022, under the credit agreement (the “Credit Agreement”), the aggregate commitment amount is $600,000,000 with an additional uncommitted amount of $100,000,000. The commitment fee is an annual rate of 0.15% of the average commitment amount payable quarterly, regardless of usage, to JPMorgan, who serves as the agent to the syndicate. The commitment fee is allocated among the Portfolio and certain other funds managed by New York Life Investments based upon their respective net assets and other factors. Interest on any revolving credit loan is charged based upon the Federal Funds Rate, Daily Simple Secured Overnight Financing Rate ("SOFR") + 0.10%, or the Overnight Bank Funding Rate, whichever is higher. The Credit Agreement expires on July 25, 2023, although the Portfolio, certain other funds managed by New York Life Investments and the syndicate of banks may renew the Credit Agreement for an additional year on the same or different terms or enter into a credit agreement with a different syndicate of banks. Prior to July 26, 2022, the aggregate commitment amount and the commitment fee were the same as those under the current Credit Agreement. During the year ended December 31, 2022, there were no borrowings made or outstanding with respect to the Portfolio under the Credit Agreement.
Note 7–Interfund Lending Program
Pursuant to an exemptive order issued by the SEC, the Portfolio, along with certain other funds managed by New York Life Investments, may participate in an interfund lending program. The interfund lending program provides an alternative credit facility that permits the Portfolio and certain other funds managed by New York Life Investments to lend or borrow money for temporary purposes directly to or from one another, subject to the conditions of the exemptive order. During the year ended December 31, 2022, there were no interfund loans made or outstanding with respect to the Portfolio.
Note 8–Purchases and Sales of Securities (in 000’s)
During the year ended December 31, 2022, purchases and sales of securities, other than short-term securities, were $242,833 and $368,810, respectively.
Note 9–Capital Share Transactions
Transactions in capital shares for the years ended December 31, 2022 and December 31, 2021, were as follows:
| Initial Class | Shares | Amount |
| Year ended December 31, 2022: | | |
| Shares sold | 960,462 | $ 15,906,247 |
| Shares issued to shareholders in reinvestment of distributions | 8,323,723 | 119,474,150 |
| Shares redeemed | (3,767,669) | (61,588,499) |
| Net increase (decrease) | 5,516,516 | $ 73,791,898 |
| Year ended December 31, 2021: | | |
| Shares sold | 28,905,024 | $ 539,730,987 |
| Shares issued to shareholders in reinvestment of distributions | 2,990,672 | 55,054,387 |
| Shares redeemed | (1,606,291) | (30,266,824) |
| Net increase (decrease) | 30,289,405 | $ 564,518,550 |
| |
| Service Class | Shares | Amount |
| Year ended December 31, 2022: | | |
| Shares sold | 5,529,322 | $ 89,567,994 |
| Shares issued to shareholders in reinvestment of distributions | 9,560,026 | 135,597,007 |
| Shares redeemed | (12,812,180) | (204,200,397) |
| Net increase (decrease) | 2,277,168 | $ 20,964,604 |
| Year ended December 31, 2021: | | |
| Shares sold | 10,612,726 | $ 197,997,196 |
| Shares issued to shareholders in reinvestment of distributions | 3,510,792 | 63,916,632 |
| Shares redeemed | (7,643,368) | (142,139,912) |
| Net increase (decrease) | 6,480,150 | $ 119,773,916 |
| |
| Service 2 Class | Shares | Amount |
| Year ended December 31, 2022: | | |
| Shares sold | 499,962 | $ 8,259,602 |
| Shares issued to shareholders in reinvestment of distributions | 73,917 | 1,046,632 |
| Shares redeemed | (583,606) | (9,652,055) |
| Net increase (decrease) | (9,727) | $ (345,821) |
| Year ended December 31, 2021: | | |
| Shares sold | 235,940 | $ 4,394,105 |
| Shares issued to shareholders in reinvestment of distributions | 27,351 | 497,943 |
| Shares redeemed | (216,834) | (4,066,149) |
| Net increase (decrease) | 46,457 | $ 825,899 |
Note 10–Other Matters
As of the date of this report, interest rates in the United States and many parts of the world, including certain European countries, are ascending from historically low levels. Thus, the Portfolio currently faces a heightened level of risk associated with rising interest rates. This could be driven by a variety of factors, including but not limited to central bank monetary policies, changing inflation or real growth rates, general economic conditions, increasing bond issuances or reduced market demand for low yielding investments.
Notes to Financial Statements (continued)
An outbreak of COVID-19, first detected in December 2019, has developed into a global pandemic and has resulted in travel restrictions, closure of international borders, certain businesses and securities markets, restrictions on securities trading activities, prolonged quarantines, supply chain disruptions, and lower consumer demand, as well as general concern and uncertainty. In 2022, many countries lifted some or all restrictions related to COVID-19. However, the continued impact of COVID-19 and related variants is uncertain and could further adversely affect the global economy, national economies, individual issuers and capital markets in unforeseeable ways and result in a substantial and extended economic downturn. Developments that disrupt global economies and financial markets, such as COVID-19, may magnify factors that affect the Portfolio's performance.
Note 11–Subsequent Events
In connection with the preparation of the financial statements of the Portfolio as of and for the year ended December 31, 2022, events and transactions subsequent to December 31, 2022, through the date the financial statements were issued have been evaluated by the Manager for possible adjustment and/or disclosure. No subsequent events requiring financial statement adjustment or disclosure have been identified.
| 28 | MainStay VP MacKay Convertible Portfolio |
Report of Independent Registered Public Accounting Firm
To the Board of Trustees of MainStay VP Funds Trust and Shareholders of
MainStay VP MacKay Convertible Portfolio
Opinion on the Financial Statements
We have audited the accompanying statement of assets and liabilities, including the portfolio of investments, of MainStay VP MacKay Convertible Portfolio (one of the portfolios constituting MainStay VP Funds Trust, referred to hereafter as the “Portfolio”) as of December 31, 2022, the related statement of operations for the year ended December 31, 2022, the statements of changes in net assets for each of the two years in the period ended December 31, 2022, including the related notes, and the financial highlights for each of the five years in the period ended December 31, 2022 (collectively referred to as the “financial statements”). In our opinion, the financial statements present fairly, in all material respects, the financial position of the Portfolio as of December 31, 2022, the results of its operations for the year then ended, the changes in its net assets for each of the two years in the period ended December 31, 2022 and the financial highlights for each of the five years in the period ended December 31, 2022 in conformity with accounting principles generally accepted in the United States of America.
Basis for Opinion
These financial statements are the responsibility of the Portfolio’s management. Our responsibility is to express an opinion on the Portfolio’s financial statements based on our audits. We are a public accounting firm registered with the Public Company Accounting Oversight Board (United States) (PCAOB) and are required to be independent with respect to the Portfolio in accordance with the U.S. federal securities laws and the applicable rules and regulations of the Securities and Exchange Commission and the PCAOB.
We conducted our audits of these financial statements in accordance with the standards of the PCAOB. Those standards require that we plan and perform the audit to obtain reasonable assurance about whether the financial statements are free of material misstatement, whether due to error or fraud.
Our audits included performing procedures to assess the risks of material misstatement of the financial statements, whether due to error or fraud, and performing procedures that respond to those risks. Such procedures included examining, on a test basis, evidence regarding the amounts and disclosures in the financial statements. Our audits also included evaluating the accounting principles used and significant estimates made by management, as well as evaluating the overall presentation of the financial statements. Our procedures included confirmation of securities owned as of December 31, 2022 by correspondence with the custodian and transfer agents. We believe that our audits provide a reasonable basis for our opinion.
/s/PricewaterhouseCoopers LLP
New York, New York
February 24, 2023
We have served as the auditor of one or more investment companies in the MainStay group of funds since 1984.
Board Consideration and Approval of Management Agreement and Subadvisory Agreement (Unaudited)
The continuation of the Management Agreement with respect to the MainStay VP MacKay Convertible Portfolio (“Portfolio”) and New York Life Investment Management LLC (“New York Life Investments”) and the Subadvisory Agreement between New York Life Investments and MacKay Shields LLC (“MacKay”) with respect to the Portfolio (together, “Advisory Agreements”) is subject to annual review and approval by the Board of Trustees of MainStay VP Funds Trust (“Board” of the “Trust”) in accordance with Section 15 of the Investment Company Act of 1940, as amended (“1940 Act”). At its December 6–7, 2022 meeting, the Board, which is comprised solely of Trustees who are not an “interested person” (as such term is defined in the 1940 Act) of the Trust (“Independent Trustees”), unanimously approved the continuation of each of the Advisory Agreements for a one-year period.
In reaching the decision to approve the continuation of each of the Advisory Agreements, the Board considered information and materials furnished by New York Life Investments and MacKay in connection with an annual contract review process undertaken by the Board that took place at meetings of the Board and its Contracts Committee during October 2022 through December 2022, including information and materials furnished by New York Life Investments and MacKay in response to requests prepared on behalf of the Board, and in consultation with the Board, by independent legal counsel to the Independent Trustees, which encompassed a variety of topics, including those summarized below. Information and materials requested by and furnished to the Board for consideration in connection with the contract review process included, among other items, reports on the Portfolio and “peer funds” prepared by Institutional Shareholder Services Inc. (“ISS”), an independent third-party service provider engaged by the Board to report objectively on the Portfolio’s investment performance, management fee and total expenses. The Board also considered information on the fees charged to other investment advisory clients of New York Life Investments and/or MacKay that follow investment strategies similar to those of the Portfolio, if any, and, when applicable, the rationale for any differences in the Portfolio’s management and subadvisory fees and the fees charged to those other investment advisory clients. In addition, the Board considered information regarding the legal standards and fiduciary obligations applicable to its consideration of the continuation of each of the Advisory Agreements. The contract review process, including the structure and format for information and materials provided to the Board, has been developed in consultation with the Board. The Independent Trustees also met in executive sessions with their independent legal counsel and, for portions thereof, with senior management of New York Life Investments.
The Board’s deliberations with respect to the continuation of each of the Advisory Agreements reflect a year-long process, and the Board also took into account information furnished to the Board and its Committees throughout the year, as deemed relevant and appropriate by the Trustees, including, among other items, reports on investment performance of the Portfolio and investment-related matters for the Portfolio as well as presentations from New York Life Investments and, generally annually, MacKay personnel. In addition, the Board took into account other information received from New York Life Investments throughout the year,
including, among other items, periodic reports on legal and compliance matters, risk management, portfolio turnover, brokerage commissions and non-advisory services provided to the Portfolio by New York Life Investments, as deemed relevant and appropriate by the Trustees.
In addition to information provided to the Board throughout the year, the Board received information in connection with its June 2022 meeting provided specifically in response to requests prepared on behalf of the Board, and in consultation with the Board, by independent legal counsel to the Independent Trustees regarding the Portfolio’s distribution arrangements. In addition, the Board received information regarding the Portfolio’s asset levels, share purchase and redemption activity and the payment of Rule 12b-1 and/or other fees by applicable share classes of the Portfolio, among other information.
In considering the continuation of each of the Advisory Agreements, the Trustees reviewed and evaluated the information and factors they believed to reasonably be necessary and appropriate in light of legal advice furnished to them by independent legal counsel to the Independent Trustees and through the exercise of their own business judgment. Although individual Trustees may have weighed certain factors or information differently and the Board did not consider any single factor or information controlling in reaching its decision, the factors considered by the Board are summarized in more detail below and include, among other factors: (i) the nature, extent and quality of the services provided to the Portfolio by New York Life Investments and MacKay; (ii) the qualifications of the portfolio manager of the Portfolio and the historical investment performance of the Portfolio, New York Life Investments and MacKay; (iii) the costs of the services provided, and profits realized, by New York Life Investments and MacKay with respect to their relationships with the Portfolio; (iv) the extent to which economies of scale have been realized or may be realized if the Portfolio grows and the extent to which any economies of scale have been shared, have benefited or may benefit the Portfolio’s shareholders; and (v) the reasonableness of the Portfolio’s management and subadvisory fees and total ordinary operating expenses. Although the Board recognized that comparisons between the Portfolio’s fees and expenses and those of other funds are imprecise given different terms of agreements, variations in fund strategies and other factors, the Board considered the reasonableness of the Portfolio’s management fee and total ordinary operating expenses as compared to the peer funds identified by ISS. Throughout their considerations, the Trustees acknowledged the commitment of New York Life Investments and its affiliates to serve the MainStay Group of Funds, as well as their capacity, experience, resources, financial stability and reputations. The Trustees also acknowledged the entrepreneurial and other risks assumed by New York Life Investments in sponsoring and managing the Portfolio. With respect to the Subadvisory Agreement, the Board took into account New York Life Investments’ recommendation to approve the continuation of the Subadvisory Agreement.
The Trustees noted that, throughout the year, the Trustees are afforded an opportunity to ask questions of, and request additional information or materials from, New York Life Investments and MacKay. The Board’s decision with respect to each of the Advisory Agreements may have also
| 30 | MainStay VP MacKay Convertible Portfolio |
been based, in part, on the Board’s knowledge of New York Life Investments and MacKay resulting from, among other things, the Board’s consideration of each of the Advisory Agreements in prior years, the advisory agreements for other funds in the MainStay Group of Funds, the Board’s review throughout the year of the performance and operations of other funds in the MainStay Group of Funds and each Trustee’s business judgment and industry experience. In addition to considering the above-referenced factors, the Board observed that in the marketplace, notably under variable life insurance policies and variable annuity contracts for which the Portfolio serves as an investment option, there are a range of investment options available to investors and that the Portfolio’s shareholders, having had the opportunity to consider other investment options, have chosen to invest in the Portfolio.
The factors that figured prominently in the Board’s decision to approve the continuation of each of the Advisory Agreements during its December 6–7, 2022 meeting are summarized in more detail below.
Nature, Extent and Quality of Services Provided by New York Life Investments and MacKay
The Board examined the nature, extent and quality of the services that New York Life Investments provides to the Portfolio. The Board evaluated New York Life Investments’ experience and capabilities in serving as manager of the Portfolio and considered that the Portfolio operates in a “manager-of-managers” structure. The Board also considered New York Life Investments’ responsibilities and services provided pursuant to this structure, including overseeing the services provided by MacKay, evaluating the performance of MacKay, making recommendations to the Board as to whether the Subadvisory Agreement should be renewed, modified or terminated and periodically reporting to the Board regarding the results of New York Life Investments’ evaluation and monitoring functions. The Board noted that New York Life Investments manages other mutual funds, serves a variety of other investment advisory clients, including other pooled investment vehicles, and has experience overseeing mutual fund service providers, including subadvisors. The Board considered the experience of senior personnel at New York Life Investments providing management and administrative and other non-advisory services to the Portfolio. The Board observed that New York Life Investments devotes significant resources and time to providing management and administrative and other non-advisory services to the Portfolio, including New York Life Investments’ oversight and due diligence reviews of MacKay and ongoing analysis of, and interactions with, MacKay with respect to, among other things, the Portfolio’s investment performance and risks as well as MacKay’s investment capabilities and subadvisory services with respect to the Portfolio.
The Board also considered the range of services that New York Life Investments provides to the Portfolio under the terms of the Management Agreement, including: (i) fund accounting and ongoing supervisory services provided by New York Life Investments’ Fund Administration and Accounting Group; (ii) investment supervisory and analytical services provided by New York Life Investments’ Investment Consulting Group; (iii) compliance services provided by the Trust’s Chief Compliance Officer as
well as New York Life Investments’ compliance department, including supervision and implementation of the Portfolio’s compliance program; (iv) legal services provided by New York Life Investments’ Office of the General Counsel; and (v) risk management monitoring and analysis by compliance and investment personnel. In addition, the Board considered New York Life Investments’ willingness to invest in personnel and other resources, such as cyber security, information security and business continuity planning, designed to benefit the Portfolio and noted that New York Life Investments is responsible for compensating the Trust’s officers, except for a portion of the salary of the Trust’s Chief Compliance Officer. The Board recognized that New York Life Investments provides certain other non-advisory services to the Portfolio and has provided an increasingly broad array of non-advisory services to the MainStay Group of Funds as a result of regulatory and other developments, including in connection with the implementation of the MainStay Group of Funds’ derivatives risk management program and policies and procedures adopted pursuant to Rule 18f-4 under the 1940 Act.
The Board also examined the range, and the nature, extent and quality, of the investment advisory services that MacKay provides to the Portfolio and considered the terms of each of the Advisory Agreements. The Board evaluated MacKay’s experience and performance in serving as subadvisor to the Portfolio and advising other portfolios and MacKay’s track record and experience in providing investment advisory services, the experience of investment advisory, senior management and administrative personnel at MacKay. The Board considered New York Life Investments’ and MacKay’s overall resources, legal and compliance environment, capabilities, reputation, financial condition and history. In addition to information provided in connection with quarterly meetings with the Trust’s Chief Compliance Officer, the Board considered information regarding the compliance policies and procedures of New York Life Investments and MacKay and acknowledged their commitment to further developing and strengthening compliance programs relating to the Portfolio. The Board also considered MacKay’s ability to recruit and retain qualified investment professionals and willingness to invest in personnel and other resources to service and support the Portfolio. In this regard, the Board considered the qualifications and experience of the Portfolio’s portfolio manager, the number of accounts managed by the portfolio manager and the method for compensating the portfolio manager.
In addition, the Board considered information provided by New York Life Investments and MacKay regarding the operations of their respective business continuity plans in response to the COVID-19 pandemic and the continued remote work environment.
Based on these considerations, among others, the Board concluded that the Portfolio would likely continue to benefit from the nature, extent and quality of these services.
Investment Performance
In evaluating the Portfolio’s investment performance, the Board considered investment performance results over various periods in light of the Portfolio’s investment objective, strategies and risks. The Board
Board Consideration and Approval of Management Agreement and Subadvisory Agreement (Unaudited) (continued)
considered investment reports on, and analysis of, the Portfolio’s performance provided to the Board throughout the year. These reports include, among other items, information on the Portfolio’s gross and net returns, the Portfolio’s investment performance compared to a relevant investment category and the Portfolio’s benchmark, the Portfolio’s risk-adjusted investment performance and the Portfolio’s investment performance as compared to peer funds, as appropriate, as well as portfolio attribution information and commentary on the effect of market conditions. The Board also considered information provided by ISS showing the investment performance of the Portfolio as compared to peer funds. In addition, the Board reviewed the methodology used by ISS to construct the group of peer funds for comparative purposes.
The Board also took into account its discussions with senior management at New York Life Investments concerning the Portfolio’s investment performance over various periods as well as discussions between the Portfolio’s portfolio management team and the members of the Board’s Investment Committee, which generally occur on an annual basis. In addition, the Board considered any specific actions that New York Life Investments or MacKay had taken, or had agreed to take, to seek to enhance Portfolio investment performance and the results of those actions.
Based on these considerations, among others, the Board concluded that its review of the Portfolio’s investment performance and related information supported a determination to approve the continuation of each of the Advisory Agreements.
Costs of the Services Provided, and Profits and Other Benefits Realized, by New York Life Investments and MacKay
The Board considered the costs of the services provided under each of the Advisory Agreements. The Board also considered the profits realized by New York Life Investments and its affiliates, including MacKay, due to their relationships with the Portfolio as well as the MainStay Group of Funds. Because MacKay is an affiliate of New York Life Investments whose subadvisory fee is paid by New York Life Investments, not the Portfolio, the Board considered cost and profitability information for New York Life Investments and MacKay in the aggregate.
In addition, the Board acknowledged the difficulty in obtaining reliable comparative data about mutual fund managers’ profitability because such information generally is not publicly available and may be impacted by numerous factors, including the structure of a fund manager’s organization, the types of funds it manages, the methodology used to allocate certain fixed costs to specific funds and the manager’s capital structure and costs of capital.
In evaluating the costs of the services provided by New York Life Investments and MacKay and profits realized by New York Life Investments and its affiliates, including MacKay, the Board considered, among other factors, New York Life Investments’ and its affiliates’, including MacKay’s, continuing investments in, or willingness to invest in, personnel and other resources to support and further enhance the management of the Portfolio, and that New York Life Investments is
responsible for paying the subadvisory fee for the Portfolio. The Board also considered the financial resources of New York Life Investments and MacKay and acknowledged that New York Life Investments and MacKay must be in a position to recruit and retain experienced professional personnel and to maintain a strong financial position for New York Life Investments and MacKay to continue to provide high-quality services to the Portfolio. The Board recognized that the Portfolio benefits from the allocation of certain fixed costs among the funds in the MainStay Group of Funds, among other expected benefits resulting from its relationship with New York Life Investments.
The Board considered information regarding New York Life Investments’ methodology for calculating profitability and allocating costs provided by New York Life Investments in connection with the fund profitability analysis presented to the Board. The Board noted it had previously engaged an independent consultant to review the methods used to allocate costs among the funds in the MainStay Group of Funds. The Board also noted that the independent consultant had concluded that New York Life Investments’ methods for allocating costs and procedures for estimating overall profitability of the relationship with the funds in the MainStay Group of Funds are reasonable and that New York Life Investments continued to use the same method of calculating profit and allocating costs since the independent consultant’s review. The Board recognized the difficulty in calculating and evaluating a manager’s profitability with respect to the Portfolio and considered that other profitability methodologies may also be reasonable.
The Board also considered certain fall-out benefits that may be realized by New York Life Investments and its affiliates due to their relationships with the Portfolio, including reputational and other indirect benefits. The Board recognized, for example, the benefits to MacKay from legally permitted “soft-dollar” arrangements by which brokers provide research and other services to MacKay in exchange for commissions paid by the Portfolio with respect to trades in the Portfolio’s portfolio securities. In addition, the Board considered its review of the management agreement for a money market fund advised by New York Life Investments and an affiliated subadvisor that serves as an investment option for the Portfolio, including the potential rationale for and costs associated with investments in this money market fund by the Portfolio, if any, and considered information from New York Life Investments that the nature and type of specific investment advisory services provided to this money market fund are distinct from, or in addition to, the investment advisory services provided to the Portfolio. In addition, the Board considered the potential dividend received tax deduction for insurance company affiliates of New York Life Investments from the Portfolio’s securities lending activity.
The Board noted that the Portfolio serves as an investment option primarily under variable contracts issued by affiliates of New York Life Investments that would receive fees under those contracts. The Board observed that, in addition to fees earned by New York Life Investments under the Management Agreement for managing the Portfolio, New York Life Investments’ affiliates also earn revenues from serving the Portfolio in various other capacities, including as the Portfolio’s distributor. The Board considered information about these other revenues and their impact on
| 32 | MainStay VP MacKay Convertible Portfolio |
the profitability of the relationship with the Portfolio to New York Life Investments and its affiliates. The Board noted that, although it assessed the overall profitability of the relationship with the Portfolio to New York Life Investments and its affiliates as part of the contract review process, when considering the reasonableness of the fee paid to New York Life Investments under the Management Agreement, the Board considered the profitability of New York Life Investments’ relationship with the Portfolio on a pre-tax basis and without regard to distribution expenses incurred by New York Life Investments from its own resources.
After evaluating the information deemed relevant by the Trustees, the Board concluded that any profits realized by New York Life Investments and its affiliates, including MacKay, due to their relationships with the Portfolio were not excessive and other benefits that may accrue to New York Life Investments and its affiliates, including MacKay, are reasonable.
Management and Subadvisory Fees and Total Ordinary Operating Expenses
The Board evaluated the reasonableness of the fee paid under each of the Advisory Agreements and the Portfolio’s total ordinary operating expenses. The Board primarily considered the reasonableness of the management fee paid by the Portfolio to New York Life Investments because the subadvisory fee paid to MacKay is paid by New York Life Investments, not the Portfolio. The Board also considered the reasonableness of the subadvisory fee paid by New York Life Investments and the amount of the management fee retained by New York Life Investments.
In assessing the reasonableness of the Portfolio’s fees and expenses, the Board primarily considered comparative data provided by ISS on the fees and expenses charged by similar mutual funds managed by other investment advisers. The Board reviewed the methodology used by ISS to construct the group of peer funds for comparative purposes. In addition, the Board considered information provided by New York Life Investments and MacKay on fees charged to other investment advisory clients, including institutional separate accounts and/or other funds that follow investment strategies similar to those of the Portfolio, if any. The Board considered the contractual management fee schedules of the Portfolio as compared to those of such other investment advisory clients, taking into account the rationale for any differences in fee schedules. The Board also took into account information provided by New York Life Investments about the more extensive scope of services provided to registered investment companies, such as the Portfolio, as compared with other investment advisory clients. Additionally, the Board considered the impact of contractual breakpoints on the Portfolio’s net management fee and expenses. The Board also considered that in proposing fees for the Portfolio, New York Life Investments considers the competitive marketplace for mutual funds.
Additionally, the Board noted that NYLIM Service Company LLC, an affiliate of New York Life Investments, serves as the transfer agent and dividend disbursing agent for the Service Class and Service 2 Class Shares of the Portfolio but that the Service Class and Service 2 Class Shares do not incur any fees for these services.
Based on the factors outlined above, among other considerations, the Board concluded that the Portfolio’s management fee and total ordinary operating expenses are within a range that is competitive and support a conclusion that these fees and expenses are reasonable.
Economies of Scale
The Board considered information regarding economies of scale, including whether economies of scale may exist for the Portfolio and whether the Portfolio’s expense structure permits any economies of scale to be appropriately shared with the Portfolio’s beneficial shareholders. The Board also considered a report from New York Life Investments, previously prepared at the request of the Board, that addressed economies of scale, including with respect to the mutual fund business generally, and the various ways in which the benefits of economies of scale may be shared with the funds in the MainStay Group of Funds. Although the Board recognized the difficulty of determining economies of scale with precision, the Board acknowledged that economies of scale may be shared with the Portfolio in a number of ways, including, for example, through the imposition of fee breakpoints, initially setting management fee rates at scale or making additional investments to enhance the services provided to the Portfolio. The Board reviewed information from New York Life Investments showing how the Portfolio’s management fee schedule compared to fee schedules of other funds and accounts managed by New York Life Investments. The Board also reviewed information from ISS showing how the Portfolio’s management fee schedule compared with fees paid for similar services by peer funds at varying asset levels.
Based on this information, the Board concluded that economies of scale are appropriately reflected for the benefit of the Portfolio’s beneficial shareholders through the Portfolio’s expense structure and other methods to share benefits from economies of scale.
Conclusion
On the basis of the information and factors summarized above, among other information and factors deemed relevant by the Trustees, and the evaluation thereof, the Board unanimously voted to approve the continuation of each of the Advisory Agreements.
Proxy Voting Policies and Procedures and Proxy Voting Record
The Portfolio is required to file with the SEC its proxy voting record for the 12-month period ending June 30 on Form N-PX. A description of the policies and procedures that are used to vote proxies relating to portfolio securities of the Portfolio is available free of charge upon request by calling 800-598-2019 or visiting the SEC's website at www.sec.gov. The most recent Form N-PX or proxy voting record is available free of charge upon request by calling 800-598-2019; visiting https://www.newyorklifeinvestments.com/investment-products/vp; or visiting the SEC’s website at www.sec.gov.
Shareholder Reports and Quarterly Portfolio Disclosure
The Portfolio is required to file its complete schedule of portfolio holdings with the SEC 60 days after its first and third fiscal quarter on Form N-PORT. The Portfolio's holdings report is available free of charge upon request by calling 800-598-2019 or by visiting the SEC’s website at www.sec.gov.
| 34 | MainStay VP MacKay Convertible Portfolio |
Board of Trustees and Officers (Unaudited)
The Trustees and officers of the Portfolio are listed below. The Board oversees the MainStay Group of Funds (which consists of MainStay Funds and MainStay Funds Trust), MainStay VP Funds Trust, MainStay MacKay DefinedTerm Municipal Opportunities Fund, MainStay CBRE Global Infrastructure Megatrends Fund, the Manager and the Subadvisors, and elects the officers of the Portfolios who are responsible for the day-to-day operations of the Portfolio. Information pertaining to the Trustees and officers is set forth below. Each Trustee serves until his or her successor
is elected and qualified or until his or her resignation, death or removal. Under the Board’s retirement policy, unless an exception is made, a Trustee must tender his or her resignation by the end of the calendar year during which he or she reaches the age of 75. The business address of each Trustee and officer listed below is 51 Madison Avenue, New York, New York 10010. None of the Trustees are “interested persons” (as defined by the 1940 Act and rules adopted by the SEC thereunder) of the Portfolio (“Independent Trustees”).
| | Name and
Year of Birth | Term of Office,
Position(s) Held and
Length of Service | Principal Occupation(s)
During Past Five Years | Number of
Portfolios in
Fund Complex
Overseen by
Trustee | Other Directorships
Held by Trustee |
| | | | | | |
| | David H. Chow
1957 | MainStay VP Funds Trust: Trustee since January 2016, Advisory Board Member (June 2015 to December 2015) | Founder and CEO, DanCourt Management, LLC since 1999 | 78 | MainStay Funds: Trustee since January 2016, Advisory Board Member (June 2015 to December 2015) (12 Funds);
MainStay Funds Trust: Trustee since January 2016, Advisory Board Member (June 2015 to December 2015) (33 Funds);
MainStay MacKay DefinedTerm Municipal Opportunities Fund: Trustee since January 2016, Advisory Board Member (June 2015 to December 2015);
MainStay CBRE Global Infrastructure Megatrends Fund: Trustee since June 2021;VanEck Vectors Group of Exchange-Traded Funds: Independent Chairman of the Board of Trustees since 2008 and Trustee since 2006 (57 portfolios); and Berea College of Kentucky: Trustee since 2009, Chair of the Committee since 2018 |
| | Susan B. Kerley
1951 | MainStay VP Funds Trust: Chairman since 2017 and Trustee since 2007* | President, Strategic Management Advisors LLC since 1990 | 78 | MainStay Funds: Chairman since 2017 and Trustee since 2007 (12 Funds); MainStay Funds Trust: Chairman since 2017 and Trustee since 1990 (33 Funds)**;
MainStay MacKay DefinedTerm Municipal Opportunities Fund: Chairman since 2017 and Trustee since 2011; MainStay CBRE Global Infrastructure Megatrends Fund: Trustee since June 2021; and Legg Mason Partners Funds: Trustee since 1991 (45 portfolios) |
| | Alan R. Latshaw
1951 | MainStay VP Funds Trust: Trustee since 2007* | Retired; Partner, Ernst & Young LLP (2002 to 2003); Partner, Arthur Andersen LLP (1989 to 2002); Consultant to the MainStay Funds Audit and Compliance Committee (2004 to 2006) | 78 | MainStay Funds: Trustee since 2006 (12 Funds);
MainStay Funds Trust: Trustee since 2007 (33 Funds)**;
MainStay MacKay DefinedTerm Municipal Opportunities Fund: Trustee since 2011; and
MainStay CBRE Global Infrastructure Megatrends Fund: Trustee since June 2021 |
Board of Trustees and Officers (Unaudited) (continued)
| | Name and
Year of Birth | Term of Office,
Position(s) Held and
Length of Service | Principal Occupation(s)
During Past Five Years | Number of
Portfolios in
Fund Complex
Overseen by
Trustee | Other Directorships
Held by Trustee |
| | | | | | |
| | Karen Hammond
1956 | MainStay VP Funds Trust: Trustee since December 2021, Advisory Board Member (June 2021 to December 2021)
| Retired, Managing Director, Devonshire Investors (2007 to 2013); Senior Vice President, Fidelity Management & Research Co. (2005 to 2007); Senior Vice President and Corporate Treasurer, FMR Corp. (2003 to 2005); Chief Operating Officer, Fidelity Investments Japan (2001 to 2003) | 78 | MainStay Funds: Trustee since December 2021, Advisory Board Member (June 2021 to December 2021) (12 Funds);
MainStay Funds Trust: Trustee since December 2021, Advisory Board Member (June 2021 to December 2021) (33 Funds);
MainStay MacKay DefinedTerm Municipal Opportunities Fund: Trustee since December 2021, Advisory Board Member (June 2021 to December 2021);
MainStay CBRE Global Infrastructure Megatrends Fund: Trustee since December 2021, Advisory Board Member (June 2021 to December 2021);
Two Harbors Investment Corp.: Director since 2018; Rhode Island State Investment Commission: Member since 2017; and Blue Cross Blue Shield of Rhode Island: Director since 2019
|
| | Jacques P. Perold
1958 | MainStay VP Funds Trust: Trustee since January 2016, Advisory Board Member (June 2015 to December 2015) | Founder and Chief Executive Officer, CapShift Advisors LLC (since 2018); President, Fidelity Management & Research Company (2009 to 2014); President and Chief Investment Officer, Geode Capital Management, LLC (2001 to 2009) | 78 | MainStay Funds: Trustee since January 2016, Advisory Board Member (June 2015 to December 2015) (12 Funds);
MainStay Funds Trust: Trustee since January 2016, Advisory Board Member (June 2015 to December 2015) (33 Funds); MainStay MacKay DefinedTerm Municipal Opportunities Fund: Trustee since January 2016, Advisory Board Member (June 2015 to December 2015);
MainStay CBRE Global Infrastructure Megatrends Fund: Trustee since June 2021; Allstate Corporation: Director since 2015;
Partners in Health: Trustee since 2019; and
MSCI Inc.: Director since 2017 |
| | Richard S. Trutanic
1952 | MainStay VP Funds Trust: Trustee since 2007* | Chairman and Chief Executive Officer, Somerset & Company (financial advisory firm) since 2004; Managing Director, The Carlyle Group (private investment firm) (2002 to 2004); Senior Managing Director, Partner and Board Member, Groupe Arnault S.A. (private investment firm) (1999 to 2002)
| 78 | MainStay Funds: Trustee since 1994 (12 Funds);
MainStay Funds Trust: Trustee since 2007 (33 Funds)**;
MainStay MacKay DefinedTerm Municipal Opportunities Fund: Trustee since 2011; and
MainStay CBRE Global Infrastructure Megatrends Fund: Trustee since June 2021 |
| * | Includes prior service as a Director of MainStay VP Series Fund, Inc., the predecessor to MainStay VP Funds Trust. |
| ** | Includes prior service as a Director/Trustee of certain predecessor entities to MainStay Funds Trust. |
| 36 | MainStay VP MacKay Convertible Portfolio |
| | Name and
Year of Birth | Position(s) Held and
Length of Service | Principal Occupation(s)
During Past Five Years | |
| | | | | |
| | Kirk C. Lehneis
1974 | President, MainStay VP Funds Trust (since 2017) | Chief Operating Officer and Senior Managing Director (since 2016), New York Life Investment Management LLC and New York Life Investment Management Holdings LLC; Member of the Board of Managers (since 2017) and Senior Managing Director (since 2018), NYLIFE Distributors LLC; Chairman of the Board and Senior Managing Director, NYLIM Service Company LLC (since 2017); Trustee, President and Principal Executive Officer of IndexIQ Trust, IndexIQ ETF Trust and IndexIQ Active ETF Trust (since January 2018); President, MainStay CBRE Global Infrastructure Megatrends Fund (since 2021), MainStay MacKay DefinedTerm Municipal Opportunities Fund, MainStay Funds and MainStay Funds Trust (since 2017); Senior Managing Director, Global Product Development (from 2015-2016); Managing Director, Product Development (from 2010-2015), New York Life Investment Management LLC | |
| | Jack R. Benintende
1964 | Treasurer and Principal Financial and Accounting Officer, MainStay VP Funds Trust (since 2007)** | Managing Director, New York Life Investment Management LLC (since 2007); Treasurer and Principal Financial and Accounting Officer, MainStay CBRE Global Infrastructure Megatrends Fund (since 2021), MainStay MacKay DefinedTerm Municipal Opportunities Fund (since 2011), MainStay Funds Trust (since 2009) and MainStay Funds (since 2007); and Assistant Treasurer, New York Life Investment Management Holdings LLC (2008 to 2012) | |
| | J. Kevin Gao
1967 | Secretary and Chief Legal Officer, MainStay VP Funds Trust (since 2010)** | Managing Director and Associate General Counsel, New York Life Investment Management LLC (since 2010); Secretary and Chief Legal Officer, MainStay CBRE Global Infrastructure Megatrends Fund (since 2021), MainStay MacKay DefinedTerm Municipal Opportunities Fund (since 2011), MainStay Funds and MainStay Funds Trust (since 2010) | |
| | Scott T. Harrington
1959 | Vice President— Administration, MainStay VP Funds Trust (since 2005)** | Managing Director, New York Life Investment Management LLC (including predecessor advisory organizations) (since 2000); Member of the Board of Directors, New York Life Trust Company (since 2009); Vice President—Administration, MainStay CBRE Global Infrastructure Megatrends Fund (since 2021), MainStay MacKay DefinedTerm Municipal Opportunities Fund (since 2011), MainStay Funds Trust and MainStay Funds (since 2009) | |
| | Kevin M. Gleason
1967 | Vice President and Chief Compliance Officer, MainStay VP Funds Trust (since June 2022) | Vice President and Chief Compliance Officer, IndexIQ, IndexIQ ETF Trust and Index IQ Active ETF Trust (since June 2022); Vice President and Chief Compliance Officer, MainStay CBRE Global Infrastructure Megatrends Fund, MainStay MacKay DefinedTerm Municipal Opportunities Fund (since June 2022); MainStay Funds Trust and MainStay Funds (since June 2022); Senior Vice President, Voya Investment Management and Chief Compliance Officer, Voya Family of Funds (2012-2022) | |
| * | The officers listed above are considered to be “interested persons” of the MainStay Group of Funds, MainStay VP Funds Trust, MainStay CBRE Global Infrastructure Megatrends Fund and MainStay MacKay DefinedTerm Municipal Opportunities Fund within the meaning of the 1940 Act because of their affiliation with the MainStay Group of Funds, New York Life Insurance Company and/or its affiliates, including New York Life Investment Management LLC, NYLIM Service Company LLC, NYLIFE Securities LLC and/or NYLIFE Distributors LLC, as described in detail in the column captioned “Principal Occupation(s) During Past Five Years.” Officers are elected annually by the Board. |
| ** | Includes prior service as an Officer of MainStay VP Series Fund, Inc., the predecessor to MainStay VP Funds Trust. |
Officers of the Trust (Who are not Trustees)*
This page intentionally left blank.
MainStay VP Portfolios
MainStay VP offers a wide range of Portfolios. The full array of MainStay VP offerings is listed here, with information about the manager, subadvisors, legal counsel, and independent registered public accounting firm.
Equity
MainStay VP American Century Sustainable Equity Portfolio1
MainStay VP Candriam Emerging Markets Equity Portfolio
MainStay VP Epoch U.S. Equity Yield Portfolio
MainStay VP Fidelity Institutional AM® Utilities Portfolio†
MainStay VP MacKay International Equity Portfolio
MainStay VP Natural Resources Portfolio
MainStay VP S&P 500 Index Portfolio2
MainStay VP Small Cap Growth Portfolio
MainStay VP Wellington Growth Portfolio
MainStay VP Wellington Mid Cap Portfolio
MainStay VP Wellington Small Cap Portfolio
MainStay VP Wellington U.S. Equity Portfolio
MainStay VP Winslow Large Cap Growth Portfolio
Mixed Asset
MainStay VP Balanced Portfolio
MainStay VP Income Builder Portfolio
MainStay VP Janus Henderson Balanced Portfolio
MainStay VP MacKay Convertible Portfolio
Income
MainStay VP Bond Portfolio
MainStay VP Floating Rate Portfolio
MainStay VP Indexed Bond Portfolio
MainStay VP MacKay Government Portfolio
MainStay VP MacKay High Yield Corporate Bond Portfolio
MainStay VP MacKay Strategic Bond Portfolio
MainStay VP PIMCO Real Return Portfolio
Money Market
MainStay VP U.S. Government Money Market Portfolio
Alternative
MainStay VP CBRE Global Infrastructure Portfolio
MainStay VP IQ Hedge Multi-Strategy Portfolio
Asset Allocation
MainStay VP Conservative Allocation Portfolio
MainStay VP Equity Allocation Portfolio
MainStay VP Growth Allocation Portfolio
MainStay VP Moderate Allocation Portfolio
Manager
New York Life Investment Management LLC
New York, New York
Subadvisors
American Century Investment Management, Inc.
Kansas City, Missouri
Brown Advisory LLC
Baltimore, Maryland
Candriam*
Strassen, Luxembourg
CBRE Investment Management Listed Real Assets LLC
Radnor, Pennsylvania
Epoch Investment Partners, Inc.
New York, New York
FIAM LLC
Smithfield, Rhode Island
IndexIQ Advisors LLC*
New York, New York
Janus Henderson Investors US LLC
Denver, Colorado
MacKay Shields LLC*
New York, New York
Newton Investment Management North America, LLC
Boston, Massachusetts
NYL Investors LLC*
New York, New York
Pacific Investment Management Company LLC
Newport Beach, California
Segall Bryant & Hamill, LLC
Chicago, Illinois
Wellington Management Company LLP
Boston, Massachusetts
Winslow Capital Management, LLC
Minneapolis, Minnesota
Legal Counsel
Dechert LLP
Washington, District of Columbia
Independent Registered Public Accounting Firm
PricewaterhouseCoopers LLP
New York, New York
Distributor
NYLIFE Distributors LLC*
Jersey City, New Jersey
Custodian
JPMorgan Chase Bank, N.A.
New York, New York
Some Portfolios may not be available in all products.
† Fidelity Institutional AM is a registered trade mark of FMR LLC. Used with permission.
* An affiliate of New York Life Investment Management LLC.
| 1. | Prior to May 1, 2022, the Portfolio's name was MainStay VP T. Rowe Price Equity Income Portfolio. |
| 2. | Prior to May 1, 2022, the Portfolio's name was MainStay VP MacKay S&P 500 Index Portfolio. |
Not part of the Annual Report
2022 Annual Report
This report is for the general information of New York Life Variable Annuities and NYLIAC Variable Universal Life Insurance Products policyowners. It must be preceded or accompanied by the appropriate product(s) and funds prospectuses if it is given to anyone who is not an owner of a New York Life variable annuity policy or a NYLIAC Variable Universal Life Insurance Product. This report does not offer for sale or solicit orders to purchase securities.
The performance data quoted in this report represents past performance. Past performance is no guarantee of future results. Due to market volatility and other factors, current performance may be lower or higher than the figures shown. The most recent month-end performance summary for your variable annuity or variable life policy is available by calling 800-598-2019 and is updated periodically on newyorklife.com.
The New York Life Variable Annuities and NYLIAC Variable Universal Life Insurance Products are issued by New York Life Insurance and Annuity Corporation (a Delaware Corporation) and distributed by NYLIFE Distributors LLC (Member FINRA/SIPC).
New York Life Insurance Company
New York Life Insurance and Annuity
Corporation (NYLIAC) (A Delaware Corporation)
51 Madison Avenue, Room 551
New York, NY 10010
newyorklife.com
newyorklifeinvestments.com
NYLIFE Distributors LLC, 30 Hudson Street, Jersey City, NJ 07302
New York Life Investment Management LLC is the investment manager to the MainStay VP Funds Trust
©2023 by NYLIFE Distributors LLC. All rights reserved.
You may obtain copies of the Prospectus and the Statement of Additional Information free of charge, upon request, by calling toll-free 800-598-2019 or writing to New York Life Insurance and Annuity Corporation, 51 Madison Avenue, New York, NY 10010.
| Not FDIC Insured | No Bank Guarantee | May Lose Value |
(NYLIAC) NI512
MainStay VP Wellington Growth Portfolio
Message from the President and Annual Report
December 31, 2022
Sign up for e-delivery of your shareholder reports. For full details on e-delivery, including who can participate and what you can receive via e-delivery,
please log in to newyorklifeinvestments.com/accounts.
| Not FDIC/NCUA Insured | Not a Deposit | May Lose Value | No Bank Guarantee | Not Insured by Any Government Agency |
This page intentionally left blank
Message from the President
The 12-month reporting period ended December 31, 2022, proved exceptionally challenging for investors as both stock and bond markets suffered steep declines. A variety of economic and geopolitical forces drove the market’s losses, all centered around rising inflation and monetary efforts to rein it in.
Inflationary alarms began to sound well before the reporting period began. In late 2021, after nearly two years of accommodative policies designed to encourage economic growth in the face of the COVID-19 pandemic, the U.S. Federal Reserve (the “Fed”) warned of the increasing need to tighten monetary policy. Nevertheless, the pace and persistence of inflation in early 2022 caught most market participants—the Fed included—off guard. Russia’s invasion of Ukraine in February exacerbated global inflationary pressures while increasing investor uncertainty. Domestic supply shortages, international trade imbalances and rising inflation caused U.S. GDP (gross domestic product) to contract in the first and second quarters of the year, although employment and consumer spending proved resilient. Prices for petroleum surged to multi-year highs, while many key agricultural chemicals and industrial metals soared as well. Accelerating inflationary forces prompted the Fed to implement its most aggressive series of interest rate hikes since the 1980s, with a 0.25% increase in March followed by six further rate increases totaling 4.25%. International central banks generally followed suit and raised rates by varying degrees in efforts to curb local inflation, although most increases remained significantly more modest than those in the United States. Relatively high U.S. interest rates and an international risk averse sentiment pushed U.S. dollar values higher compared to most other currencies, with negative impacts on global prices for food, fuel and other key U.S.-dollar-denominated products.
The effects of these interrelated challenges were felt throughout U.S. and international financial markets. The S&P 500® Index, a widely regarded benchmark of market performance, declined by more than 18% during the reporting period. Although the energy sector generated strong gains, bolstered by elevated oil and gas prices, most other industry segments recorded losses. The more cyclical and growth-oriented sectors of consumer discretionary, information technology and real estate delivered the weakest returns, while the traditionally defensive and value-oriented
consumer staples, utilities and health care sectors outperformed. On average, international developed-country equity markets mildly outperformed their U.S. counterparts, while emerging markets lagged slightly. Fixed-income markets proved unusually volatile, with bond prices trending sharply lower as yields rose along with interest rates. Short-term yields rose faster than long-term yields, producing a yield curve inversion from July through the end of the reporting period as long-term rates remained below short-term rates. While floating-rate instruments, which feature variable interest rates that allow investors to benefit from a rising rate environment, provided a degree of insulation from inflation-driven trends, they were not immune to the market’s widespread declines.
Although, according to the most recent estimates, the annualized inflation rate in the United States has declined from a peak of 9.1% in July 2022 to 6.5% in December, the Fed remains focused on achieving more substantial and lasting reductions, aiming for a target rate of 2%. As a result, further rate hikes and additional market volatility are potential headwinds in the coming months. The question remains as to whether the Fed and other central banks will manage a so-called “soft landing,” curbing inflation while avoiding a persistent economic slowdown. If they prove successful, we believe that the increasingly attractive valuations we have observed in both equity and bond markets should eventually translate into sustainable improvements in the investment environment.
Whatever actions the Fed takes and however financial markets react, as a MainStay VP investor you can depend on us to continue managing our portfolios with the insight, expertise and level of service that have long defined New York Life Investments. Thank you for trusting us to help you meet your investment needs.
Sincerely,
Kirk C. Lehneis
President
The opinions expressed are as of the date of this report and are subject to change. There is no guarantee that any forecast made will come to pass. This material does not constitute investment advice and is not intended as an endorsement of any specific investment. Past performance is no guarantee of future results.
Not part of the Annual Report
Investors should refer to the Portfolio’s Summary Prospectus and/or Prospectus and consider the Portfolio’s investment objectives, strategies, risks, charges and expenses carefully before investing. The Summary Prospectus and/or Prospectus contain this and other information about the Portfolio. You may obtain copies of the Portfolio’s Summary Prospectus, Prospectus and Statement of Additional Information, which includes information about the MainStay VP Funds Trust's Trustees, free of charge, upon request, by calling toll-free 800-598-2019, by writing to New York Life Insurance and Annuity Corporation, 51 Madison Avenue, Room 251, New York, New York 10010 or by sending an email to MainStayShareholdersServices@nylim.com. These documents are also available at newyorklifeinvestments.com/investment-products/vp. Please read the Portfolio's Summary Prospectus and/or Prospectus carefully before investing. MainStay VP Funds Trust portfolios are separate account options which are purchased through a variable insurance or variable annuity contract.
MainStay VP Wellington Growth Portfolio
Investment and Performance Comparison (Unaudited)
Performance data quoted represents past performance. Past performance is no guarantee of future results. Because of market volatility and other factors, current performance may be lower or higher than the figures shown. Investment return and principal value will fluctuate, and as a result, when shares are redeemed, they may be worth more or less than their original cost. The performance table and graph do not reflect any deduction of sales charges, mortality and expense charges, contract charges or administrative charges. Please refer to the Performance Summary appropriate for your policy. For performance information current to the most recent month-end, please call 800-598-2019 or visit www.newyorklife.com.
Performance figures may reflect certain fee waivers and/or expense limitations, without which total returns may have been different. For information on current fee waivers and/or expense limitations (if any), please refer to the Notes to Financial Statements.
| Average Annual Total Returns for the Year-Ended December 31, 2022 |
| Class | Inception
Date1, 2, 3 | One
Year | Five
Years | Ten
Years | Gross
Expense
Ratio4 |
| Initial Class Shares | 1/29/1993 | -33.17% | 5.68% | 9.16% | 0.73% |
| Service Class Shares | 6/5/2003 | -33.33 | 5.42 | 8.89 | 0.98 |
| 1. | Effective January 11, 2013 and July 29, 2016, the Portfolio modified its principal investment strategies in connection with changes in the Portfolio’s Subadvisor. The past performance in the graph and table reflect the Subadvisors and strategies in place during their respective time periods. |
| 2. | Effective January 1, 2018 due to an organizational restructuring, all investment personnel of Cornerstone Capital Management Holdings LLC, a former subadvisor, transitioned to MacKay Shields LLC, a former subadvisor. |
| 3. | Effective May 1, 2021, the Portfolio replaced its subadvisor and modified its principal investment strategies. The past performance in the graph and table prior to that date reflects the Portfolio's prior subadvisors and principal investment strategies. |
| 4. | The gross expense ratios presented reflect the Portfolio’s “Total Annual Portfolio Operating Expenses” from the most recent Prospectus and may differ from other expense ratios disclosed in this report. |
| Benchmark Performance* | One
Year | Five
Years | Ten
Years |
| Russell 1000® Growth Index1 | -29.14% | 10.96% | 14.10% |
| Morningstar Large Growth Category Average2 | -30.20 | 7.88 | 11.39 |
| * | Returns for indices reflect no deductions for fees, expenses or taxes, except for foreign withholding taxes where applicable. Results assume reinvestment of all dividends and capital gains. An investment cannot be made directly in an index. |
| 1. | The Russell 1000® Growth Index is the Portfolio's primary benchmark. The Russell 1000® Growth Index is a broad-based benchmark that measures the performance of the large-cap growth segment of the U.S. equity universe. It includes those Russell 1000® Index companies with higher price-to-book ratios and higher forecasted growth values. |
| 2. | The Morningstar Large Growth Category Average is representative of funds that invest primarily in big U.S. companies that are projected to grow faster than other large-cap stocks. Stocks in the top 70% of the capitalization of the U.S. equity market are defined as large cap. Growth is defined based on fast growth and high valuations. Most of these funds focus on companies in rapidly expanding industries. Results are based on average total returns of similar funds with all dividends and capital gain distributions reinvested. |
Cost in Dollars of a $1,000 Investment in MainStay VP Wellington Growth Portfolio (Unaudited)
The example below is intended to describe the fees and expenses borne by shareholders during the six-month period from July 1, 2022 to December 31, 2022, and the impact of those costs on your investment.
Example
As a shareholder of the Portfolio you incur two types of costs: (1) transaction costs, including exchange fees and sales charges (loads) on purchases (as applicable), and (2) ongoing costs, including management fees, distribution and/or service (12b-1) fees and other Portfolio expenses (as applicable). This example is intended to help you understand your ongoing costs (in dollars) of investing in the Portfolio and to compare these costs with the ongoing costs of investing in other mutual funds. The example is based on an investment of $1,000 made at the beginning of the six-month period and held for the entire period from July 1, 2022 to December 31, 2022. Shares are only sold in connection with variable life and annuity contracts and the example does not reflect any contract level or transactional fees or expenses. If these costs had been included, your costs would have been higher.
This example illustrates your Portfolio’s ongoing costs in two ways:
Actual Expenses
The second and third data columns in the table below provide information about actual account values and actual expenses. You may use the information in these columns, together with the amount you invested, to estimate the expenses that you paid during the six months ended
December 31, 2022. Simply divide your account value by $1,000 (for example, an $8,600 account value divided by $1,000 = 8.6), then multiply the result by the number under the heading entitled “Expenses Paid During Period” to estimate the expenses you paid on your account during this period.
Hypothetical Example for Comparison Purposes
The fourth and fifth data columns in the table below provide information about hypothetical account values and hypothetical expenses based on the Portfolio’s actual expense ratio and an assumed rate of return of 5% per year before expenses, which is not the Portfolio’s actual return. The hypothetical account values and expenses may not be used to estimate the actual ending account balances or expenses you paid for the six-month period shown. You may use this information to compare the ongoing costs of investing in the Portfolio with the ongoing costs of investing in other mutual funds. To do so, compare this 5% hypothetical example with the 5% hypothetical examples that appear in the shareholder reports of the other mutual funds.
Please note that the expenses shown in the table are meant to highlight your ongoing costs only and do not reflect any transactional costs, such as exchange fees or sales charges (loads). Therefore, the fourth and fifth data columns of the table are useful in comparing ongoing costs only and will not help you determine the relative total costs of owning different funds. In addition, if these transactional costs were included, your costs would have been higher.
| Share Class | Beginning
Account
Value
7/1/22 | Ending Account
Value (Based
on Actual
Returns and
Expenses)
12/31/22 | Expenses
Paid
During
Period1 | Ending Account
Value (Based
on Hypothetical
5% Annualized
Return and
Actual Expenses)
12/31/22 | Expenses
Paid
During
Period1 | Net Expense
Ratio
During
Period2 |
| Initial Class Shares | $1,000.00 | $992.50 | $3.67 | $1,021.53 | $3.72 | 0.73% |
| Service Class Shares | $1,000.00 | $991.20 | $4.92 | $1,020.26 | $4.99 | 0.98% |
| 1. | Expenses are equal to the Portfolio’s annualized expense ratio of each class multiplied by the average account value over the period, divided by 365 and multiplied by 184 (to reflect the six-month period). The table above represents the actual expenses incurred during the six-month period. In addition to the fees and expenses which the Portfolio bears directly, it also indirectly bears a pro rata share of the fees and expenses of the underlying funds in which it invests. Such indirect expenses are not included in the above-reported expense figures. |
| 2. | Expenses are equal to the Portfolio's annualized expense ratio to reflect the six-month period. |
| 6 | MainStay VP Wellington Growth Portfolio |
Industry Composition as of December 31, 2022 (Unaudited)
| Software | 16.4% |
| IT Services | 13.8 |
| Technology Hardware, Storage & Peripherals | 8.5 |
| Interactive Media & Services | 6.5 |
| Internet & Direct Marketing Retail | 5.4 |
| Semiconductors & Semiconductor Equipment | 5.0 |
| Health Care Equipment & Supplies | 4.9 |
| Health Care Providers & Services | 4.4 |
| Life Sciences Tools & Services | 4.1 |
| Capital Markets | 3.8 |
| Aerospace & Defense | 2.8 |
| Professional Services | 2.6 |
| Textiles, Apparel & Luxury Goods | 2.4 |
| Hotels, Restaurants & Leisure | 2.1 |
| Insurance | 1.9 |
| Equity Real Estate Investment Trusts | 1.9% |
| Energy Equipment & Services | 1.8 |
| Specialty Retail | 1.6 |
| Beverages | 1.5 |
| Pharmaceuticals | 1.5 |
| Consumer Finance | 1.4 |
| Road & Rail | 1.1 |
| Personal Products | 0.9 |
| Automobiles | 0.5 |
| Machinery | 0.3 |
| Media | 0.0‡ |
| Short–Term Investment | 3.0 |
| Other Assets, Less Liabilities | –0.1 |
| | 100.0% |
‡ Less than one-tenth of percent.
See Portfolio of Investments beginning on page 10 for specific holdings within these categories. The Portfolio's holdings are subject to change.
Top Ten Holdings and/or Issuers Held as of December 31, 2022 (excluding short-term investments) (Unaudited)
| 1. | Microsoft Corp. |
| 2. | Apple, Inc. |
| 3. | Alphabet, Inc., Class C |
| 4. | Mastercard, Inc., Class A |
| 5. | Amazon.com, Inc. |
| 6. | UnitedHealth Group, Inc. |
| 7. | Boston Scientific Corp. |
| 8. | Schlumberger Ltd. |
| 9. | S&P Global, Inc. |
| 10. | Global Payments, Inc. |
Portfolio Management Discussion and Analysis (Unaudited)
Answers to the questions reflect the views of portfolio managers Andrew J. Shilling, CFA, of Wellington Management Company LLP (“Wellington”), the Portfolio’s Subadvisor.
How did MainStay VP Wellington Growth Portfolio perform relative to its benchmark and peers during the 12 months ended December 31, 2022?
For the 12 months ended December 31, 2022, MainStay VP Wellington Growth Portfolio returned −33.17% for Initial Class shares and −33.33% for Service Class shares. Over the same period, both share classes underperformed the −29.14% return of the Russell 1000® Growth Index (“the Index”), which is the Portfolio’s benchmark, and the −30.20% return of the Morningstar Large Growth Category Average.1
What factors affected the Portfolio’s relative performance during the reporting period?
During the reporting period, the Portfolio underperformed the Index primarily due to security selection. Sector allocation, a residual of the Portfolio’s bottom-up stock selection process, modestly offset weak relative results.
Which sectors were the strongest positive contributors to the Portfolio’s relative performance, and which sectors were particularly weak?
Security selection in the information technology, industrials and financials sectors detracted from results relative to the Index, while selection in energy and consumer discretionary made modestly positive contributions. (Contributions take weightings and total returns into account.) With the exception of energy, all of the sectors listed above posted negative total returns for the year.
From a sector perspective, an underweight allocation to consumer discretionary and an overweight allocation to financials bolstered relative returns. These positives were offset by the Portfolio’s underweight exposure to consumer staples, which detracted from relative performance.
During the reporting period, which individual stocks made the strongest positive contributions to the Portfolio’s absolute performance and which stocks detracted the most?
The individual stocks making the strongest positive contributions to absolute performance included oilfield services company Schlumberger, off-price apparel and home goods retailer The TJX Companies, and medical device maker Abiomed. Shares of Schlumberger rose after the company delivered a better-than-expected earnings release, posting the company’s strongest quarterly profit since 2015. Oil and gas producers increased production with crude prices near eight-year highs, boosting demand for Schlumberger's equipment, services and technology. TJX shares rose after the company reported strong quarterly results in the third quarter of 2022. U.S. comparable store sales exceeded expectations, and earnings per share were strong. Management remains focused on future profitability and
their long-term revenue targets. Abiomed makes the world’s smallest heart pump, Impella, a minimally invasive, forward flow pump. Shares of Abiomed soared on news that Johnson & Johnson will be acquiring the company at a significant premium to its pre-acquisition stock price. The acquisition is expected to close by the end of the first quarter 2023.
The most significant detractors from absolute performance were consumer electronics maker Apple, software and cloud services company Microsoft and online retailer Amazon.com. All three companies were negatively affected by inflationary headwinds and rising interest rates, which set the stage for investors to rotate into less-risky assets. Shares of Apple ended the reporting period lower as supply constraints, recent COVID-19-related factory closures in China and a global chip shortage pressured the company’s outlook. Shares of Microsoft lost ground amid a broad sell-off in high-growth names triggered by tighter monetary policy. Near the end of the reporting period, Microsoft delivered strong quarterly results across its product set, with management setting an optimistic tone while offering guidance for continued fundamental strength. Shares of Amazon.com fell after the company reported an unexpected loss for the first quarter of 2022. The company is confronting inflation, rising interest rates and a slowdown in its core retail business as customers return to stores. Amazon.com has been forced to scale back its workforce after expanding it during the pandemic, and has begun layoffs. However, we believe its cloud computing business is likely to benefit from a long-term secular growth tailwind. The Portfolio maintained underweight positions in all three large benchmark constituents as of the end of the reporting period.
Did the Portfolio make any significant purchases or sales during the reporting period?
During the reporting period, the Portfolio initiated positions in communications infrastructure REIT (real estate investment trust) American Tower and oil & gas services & equipment company Schlumberger. The Portfolio added the position in American Tower based on the continued roll-out of 5G spending, which is accelerating the company’s core organic growth across all regions. We believe American Tower’s recent acquisition of CoreSite, a provider of data center and interconnection solutions, is likely to further this trend. The Portfolio initiated the Schlumberger position as drilling capacity demand increased due to Russia’s invasion of Ukraine and in response to the subsequent, sanction-driven energy shortage.
During the same period, the Portfolio eliminated positions in social media company Meta Platforms and medical device maker Abiomed. We believe Meta Platforms is likely to face increasing headwinds following tighter privacy rules and the growth of competitor TikTok. As mentioned above, shares of Abiomed soared on news that Johnson & Johnson will be acquiring the company
| 1. | See page 5 for more information on benchmark and peer group returns. |
| 8 | MainStay VP Wellington Growth Portfolio |
for $16.6 billion, representing one of the largest deals in health care in 2022.
How did the Portfolio’s sector weightings change during the reporting period?
The most notable increase to sector exposure was in consumer discretionary, where the Portfolio continued to hold an underweight allocation relative to the Index as of the end of the reporting period. The most notable reduction to sector exposure was in information technology, where the Portfolio continued to hold a slightly overweight allocation.
How was the Portfolio positioned at the end of the reporting period?
As of December 31, 2022, the Portfolio held its most overweight exposures relative to the Index in the financials and health care sectors. As of the same date, the Portfolio’s most significantly underweight positions were in the consumer staples and consumer discretionary sectors.
The opinions expressed are those of the portfolio managers as of the date of this report and are subject to change. There is no guarantee that any forecasts will come to pass. This material does not constitute investment advice and is not intended as an endorsement of any specific investment.
Not all MainStay VP Portfolios and/or share classes are available under all policies.
Portfolio of Investments December 31, 2022†
| | Shares | Value |
| Common Stocks 97.1% |
| Aerospace & Defense 2.8% |
| Airbus SE, ADR | 123,321 | $ 3,657,701 |
| General Dynamics Corp. | 22,612 | 5,610,263 |
| Northrop Grumman Corp. | 10,700 | 5,838,027 |
| | | 15,105,991 |
| Automobiles 0.5% |
| Tesla, Inc. (a) | 22,038 | 2,714,641 |
| Beverages 1.5% |
| Constellation Brands, Inc., Class A | 35,868 | 8,312,409 |
| Capital Markets 3.8% |
| Blackstone, Inc. | 46,235 | 3,430,175 |
| Charles Schwab Corp. (The) | 100,146 | 8,338,156 |
| S&P Global, Inc. | 27,473 | 9,201,806 |
| | | 20,970,137 |
| Consumer Finance 1.4% |
| American Express Co. | 50,789 | 7,504,075 |
| Energy Equipment & Services 1.8% |
| Schlumberger Ltd. | 178,855 | 9,561,588 |
| Equity Real Estate Investment Trusts 1.9% |
| American Tower Corp. | 34,990 | 7,412,981 |
| Equinix, Inc. | 4,181 | 2,738,681 |
| | | 10,151,662 |
| Health Care Equipment & Supplies 4.9% |
| Align Technology, Inc. (a) | 13,209 | 2,785,778 |
| Boston Scientific Corp. (a) | 231,224 | 10,698,735 |
| Insulet Corp. (a) | 19,972 | 5,879,557 |
| Stryker Corp. | 29,747 | 7,272,844 |
| | | 26,636,914 |
| Health Care Providers & Services 4.4% |
| Elevance Health, Inc. | 11,442 | 5,869,403 |
| UnitedHealth Group, Inc. | 33,696 | 17,864,945 |
| | | 23,734,348 |
| Hotels, Restaurants & Leisure 2.1% |
| Airbnb, Inc., Class A (a) | 61,297 | 5,240,893 |
| Hilton Worldwide Holdings, Inc. | 48,705 | 6,154,364 |
| | | 11,395,257 |
| Insurance 1.9% |
| Marsh & McLennan Cos., Inc. | 33,611 | 5,561,948 |
| | Shares | Value |
| |
| Insurance (continued) |
| Progressive Corp. (The) | 38,566 | $ 5,002,396 |
| | | 10,564,344 |
| Interactive Media & Services 6.5% |
| Alphabet, Inc., Class C (a) | 324,189 | 28,765,290 |
| ZoomInfo Technologies, Inc., Class A (a) | 213,381 | 6,424,902 |
| | | 35,190,192 |
| Internet & Direct Marketing Retail 5.4% |
| Amazon.com, Inc. (a) | 289,580 | 24,324,720 |
| Etsy, Inc. (a) | 44,634 | 5,346,261 |
| | | 29,670,981 |
| IT Services 13.8% |
| Block, Inc., Class A (a) | 97,835 | 6,147,951 |
| Fidelity National Information Services, Inc. | 73,238 | 4,969,198 |
| FleetCor Technologies, Inc. (a) | 48,342 | 8,879,459 |
| Global Payments, Inc. | 92,052 | 9,142,605 |
| Mastercard, Inc., Class A | 77,157 | 26,829,804 |
| MongoDB, Inc. (a) | 31,678 | 6,235,498 |
| Okta, Inc. (a) | 49,222 | 3,363,339 |
| Snowflake, Inc., Class A (a) | 8,809 | 1,264,444 |
| Visa, Inc., Class A | 40,519 | 8,418,227 |
| | | 75,250,525 |
| Life Sciences Tools & Services 4.1% |
| Agilent Technologies, Inc. | 49,955 | 7,475,766 |
| Danaher Corp. | 22,359 | 5,934,526 |
| Illumina, Inc. (a) | 26,356 | 5,329,183 |
| Mettler-Toledo International, Inc. (a) | 2,530 | 3,656,988 |
| | | 22,396,463 |
| Machinery 0.3% |
| IDEX Corp. | 8,071 | 1,842,851 |
| Media 0.0% ‡ |
| Interpublic Group of Cos., Inc. (The) (b) | 7,626 | 254,022 |
| Personal Products 0.9% |
| Estee Lauder Cos., Inc. (The), Class A | 18,991 | 4,711,857 |
| Pharmaceuticals 1.5% |
| Zoetis, Inc. | 55,292 | 8,103,043 |
| Professional Services 2.6% |
| Equifax, Inc. | 37,502 | 7,288,889 |
| TransUnion | 125,537 | 7,124,225 |
| | | 14,413,114 |
The notes to the financial statements are an integral part of, and should be read in conjunction with, the financial statements.
| 10 | MainStay VP Wellington Growth Portfolio |
| | Shares | Value |
| Common Stocks (continued) |
| Road & Rail 1.1% |
| Uber Technologies, Inc. (a) | 237,551 | $ 5,874,636 |
| Semiconductors & Semiconductor Equipment 5.0% |
| Advanced Micro Devices, Inc. (a) | 54,975 | 3,560,731 |
| ASML Holding NV (Registered) | 5,771 | 3,153,274 |
| Marvell Technology, Inc. | 98,037 | 3,631,291 |
| Microchip Technology, Inc. | 89,330 | 6,275,433 |
| Monolithic Power Systems, Inc. | 5,981 | 2,114,941 |
| NVIDIA Corp. | 57,180 | 8,356,285 |
| | | 27,091,955 |
| Software 16.4% |
| Atlassian Corp., Class A (a) | 28,263 | 3,636,883 |
| Autodesk, Inc. (a) | 27,676 | 5,171,814 |
| Ceridian HCM Holding, Inc. (a) | 77,556 | 4,975,217 |
| Intuit, Inc. | 11,884 | 4,625,491 |
| Microsoft Corp. | 235,096 | 56,380,723 |
| nCino, Inc. (a) | 64,872 | 1,715,216 |
| Salesforce, Inc. (a) | 57,616 | 7,639,305 |
| ServiceNow, Inc. (a) | 12,572 | 4,881,330 |
| | | 89,025,979 |
| Specialty Retail 1.6% |
| TJX Cos., Inc. (The) | 108,299 | 8,620,600 |
| Technology Hardware, Storage & Peripherals 8.5% |
| Apple, Inc. | 355,210 | 46,152,435 |
| | Shares | | Value |
| |
| Textiles, Apparel & Luxury Goods 2.4% |
| Lululemon Athletica, Inc. (a) | 21,388 | | $ 6,852,287 |
| NIKE, Inc., Class B | 54,172 | | 6,338,666 |
| | | | 13,190,953 |
Total Common Stocks
(Cost $584,821,208) | | | 528,440,972 |
| Short-Term Investment 3.0% |
| Affiliated Investment Company 3.0% |
| MainStay U.S. Government Liquidity Fund, 3.602% (c) | 16,085,333 | | 16,085,333 |
Total Short-Term Investment
(Cost $16,085,333) | | | 16,085,333 |
Total Investments
(Cost $600,906,541) | 100.1% | | 544,526,305 |
| Other Assets, Less Liabilities | (0.1) | | (368,323) |
| Net Assets | 100.0% | | $ 544,157,982 |
| † | Percentages indicated are based on Portfolio net assets. |
| ‡ | Less than one-tenth of a percent. |
| (a) | Non-income producing security. |
| (b) | Illiquid security—As of December 31, 2022, the total market value deemed illiquid under procedures approved by the Board of Trustees was $254,022, which represented less than one-tenth of a percent of the Portfolio’s net assets. (Unaudited) |
| (c) | Current yield as of December 31, 2022. |
Investments in Affiliates (in 000's)
Investments in issuers considered to be affiliate(s) of the Portfolio during the year ended December 31, 2022 for purposes of Section 2(a)(3) of the Investment Company Act of 1940, as amended, were as follows:
| Affiliated Investment Companies | Value,
Beginning
of Year | Purchases
at Cost | Proceeds
from
Sales | Net
Realized
Gain/(Loss)
on Sales | Change in
Unrealized
Appreciation/
(Depreciation) | Value,
End of
Year | Dividend
Income | Other
Distributions | Shares
End of
Year |
| MainStay U.S. Government Liquidity Fund | $ 6,654 | $ 210,732 | $ (201,301) | $ — | $ — | $ 16,085 | $ 327 | $ — | 16,085 |
| Abbreviation(s): |
| ADR—American Depositary Receipt |
The notes to the financial statements are an integral part of, and should be read in conjunction with, the financial statements.
11
Portfolio of Investments December 31, 2022† (continued)
The following is a summary of the fair valuations according to the inputs used as of December 31, 2022, for valuing the Portfolio’s assets:
| Description | Quoted
Prices in
Active
Markets for
Identical
Assets
(Level 1) | | Significant
Other
Observable
Inputs
(Level 2) | | Significant
Unobservable
Inputs
(Level 3) | | Total |
| Asset Valuation Inputs | | | | | | | |
| Investments in Securities (a) | | | | | | | |
| Common Stocks | $ 528,440,972 | | $ — | | $ — | | $ 528,440,972 |
| Short-Term Investment | | | | | | | |
| Affiliated Investment Company | 16,085,333 | | — | | — | | 16,085,333 |
| Total Investments in Securities | $ 544,526,305 | | $ — | | $ — | | $ 544,526,305 |
| (a) | For a complete listing of investments and their industries, see the Portfolio of Investments. |
The notes to the financial statements are an integral part of, and should be read in conjunction with, the financial statements.
| 12 | MainStay VP Wellington Growth Portfolio |
Statement of Assets and Liabilities as of December 31, 2022
| Assets |
Investment in unaffiliated securities, at value
(identified cost $584,821,208) | $ 528,440,972 |
Investment in affiliated investment companies, at value
(identified cost $16,085,333) | 16,085,333 |
| Receivables: | |
| Dividends | 192,812 |
| Portfolio shares sold | 3,218 |
| Other assets | 3,226 |
| Total assets | 544,725,561 |
| Liabilities |
| Payables: | |
| Manager (See Note 3) | 330,755 |
| Portfolio shares redeemed | 116,665 |
| Shareholder communication | 73,733 |
| Professional fees | 29,621 |
| NYLIFE Distributors (See Note 3) | 7,699 |
| Custodian | 4,036 |
| Securities lending | 143 |
| Accrued expenses | 4,927 |
| Total liabilities | 567,579 |
| Net assets | $ 544,157,982 |
| Composition of Net Assets |
| Shares of beneficial interest outstanding (par value of $.001 per share) unlimited number of shares authorized | $ 30,917 |
| Additional paid-in-capital | 660,219,899 |
| | 660,250,816 |
| Total distributable earnings (loss) | (116,092,834) |
| Net assets | $ 544,157,982 |
| Initial Class | |
| Net assets applicable to outstanding shares | $509,029,971 |
| Shares of beneficial interest outstanding | 28,863,549 |
| Net asset value per share outstanding | $ 17.64 |
| Service Class | |
| Net assets applicable to outstanding shares | $ 35,128,011 |
| Shares of beneficial interest outstanding | 2,053,646 |
| Net asset value per share outstanding | $ 17.11 |
The notes to the financial statements are an integral part of, and should be read in conjunction with, the financial statements.
13
Statement of Operations for the year ended December 31, 2022
| Investment Income (Loss) |
| Income | |
| Dividends-unaffiliated (net of foreign tax withholding of $10,292) | $ 3,449,205 |
| Dividends-affiliated | 326,882 |
| Securities lending, net | 5,239 |
| Total income | 3,781,326 |
| Expenses | |
| Manager (See Note 3) | 4,278,824 |
| Distribution/Service—Service Class (See Note 3) | 105,504 |
| Professional fees | 88,653 |
| Shareholder communication | 77,598 |
| Custodian | 23,285 |
| Trustees | 13,970 |
| Miscellaneous | 20,619 |
| Total expenses | 4,608,453 |
| Net investment income (loss) | (827,127) |
| Realized and Unrealized Gain (Loss) |
| Net realized gain (loss) on unaffiliated investments | (58,896,810) |
| Net change in unrealized appreciation (depreciation) on unaffiliated investments | (205,606,983) |
| Net realized and unrealized gain (loss) | (264,503,793) |
| Net increase (decrease) in net assets resulting from operations | $(265,330,920) |
The notes to the financial statements are an integral part of, and should be read in conjunction with, the financial statements.
| 14 | MainStay VP Wellington Growth Portfolio |
Statements of Changes in Net Assets
for the years ended December 31, 2022 and December 31, 2021
| | 2022 | 2021 |
| Increase (Decrease) in Net Assets |
| Operations: | | |
| Net investment income (loss) | $ (827,127) | $ (2,140,928) |
| Net realized gain (loss) | (58,896,810) | 187,628,438 |
| Net change in unrealized appreciation (depreciation) | (205,606,983) | (60,913,826) |
| Net increase (decrease) in net assets resulting from operations | (265,330,920) | 124,573,684 |
| Distributions to shareholders: | | |
| Initial Class | (171,459,297) | (97,692,566) |
| Service Class | (12,259,342) | (8,338,204) |
| Total distributions to shareholders | (183,718,639) | (106,030,770) |
| Capital share transactions: | | |
| Net proceeds from sales of shares | 94,150,878 | 81,855,689 |
| Net asset value of shares issued to shareholders in reinvestment of distributions | 183,718,639 | 106,030,770 |
| Cost of shares redeemed | (58,166,556) | (81,116,553) |
| Increase (decrease) in net assets derived from capital share transactions | 219,702,961 | 106,769,906 |
| Net increase (decrease) in net assets | (229,346,598) | 125,312,820 |
| Net Assets |
| Beginning of year | 773,504,580 | 648,191,760 |
| End of year | $ 544,157,982 | $ 773,504,580 |
The notes to the financial statements are an integral part of, and should be read in conjunction with, the financial statements.
15
Financial Highlights selected per share data and ratios
| | Year Ended December 31, |
| Initial Class | 2022 | | 2021 | | 2020 | | 2019 | | 2018 |
| Net asset value at beginning of year | $ 40.09 | | $ 39.15 | | $ 32.64 | | $ 27.74 | | $ 30.87 |
| Net investment income (loss) (a) | (0.03) | | (0.12) | | 0.12 | | 0.18 | | 0.19 |
| Net realized and unrealized gain (loss) | (13.45) | | 7.70 | | 10.08 | | 7.77 | | (1.10) |
| Total from investment operations | (13.48) | | 7.58 | | 10.20 | | 7.95 | | (0.91) |
| Less distributions: | | | | | | | | | |
| From net investment income | — | | (0.15) | | (0.21) | | (0.19) | | (0.21) |
| From net realized gain on investments | (8.97) | | (6.49) | | (3.48) | | (2.86) | | (2.01) |
| Total distributions | (8.97) | | (6.64) | | (3.69) | | (3.05) | | (2.22) |
| Net asset value at end of year | $ 17.64 | | $ 40.09 | | $ 39.15 | | $ 32.64 | | $ 27.74 |
| Total investment return (b) | (33.17)% | | 19.75% | | 32.30% | | 30.01% | | (4.24)% |
| Ratios (to average net assets)/Supplemental Data: | | | | | | | | | |
| Net investment income (loss) | (0.12)% | | (0.28)% | | 0.35% | | 0.56% | | 0.60% |
| Net expenses (c) | 0.73% | | 0.72% | | 0.73% | | 0.72% | | 0.73% |
| Expenses (before waiver/reimbursement) (c) | 0.73% | | 0.73% | | 0.73% | | 0.72% | | 0.73% |
| Portfolio turnover rate | 42% | | 48% | | 144% | | 156% | | 127% |
| Net assets at end of year (in 000's) | $ 509,030 | | $ 716,521 | | $ 590,841 | | $ 652,081 | | $ 461,537 |
| (a) | Per share data based on average shares outstanding during the year. |
| (b) | Total return does not reflect any deduction of sales charges, mortality and expense charges, contract charges or administrative charges. For periods of less than one year, total return is not annualized. |
| (c) | In addition to the fees and expenses which the Portfolio bears directly, it also indirectly bears a pro-rata share of the fees and expenses of the underlying funds in which it invests. Such indirect expenses are not included in the above expense ratios. |
| | Year Ended December 31, |
| Service Class | 2022 | | 2021 | | 2020 | | 2019 | | 2018 |
| Net asset value at beginning of year | $ 39.39 | | $ 38.57 | | $ 32.19 | | $ 27.38 | | $ 30.50 |
| Net investment income (loss) (a) | (0.10) | | (0.22) | | 0.04 | | 0.10 | | 0.11 |
| Net realized and unrealized gain (loss) | (13.21) | | 7.57 | | 9.93 | | 7.66 | | (1.10) |
| Total from investment operations | (13.31) | | 7.35 | | 9.97 | | 7.76 | | (0.99) |
| Less distributions: | | | | | | | | | |
| From net investment income | — | | (0.04) | | (0.11) | | (0.09) | | (0.12) |
| From net realized gain on investments | (8.97) | | (6.49) | | (3.48) | | (2.86) | | (2.01) |
| Total distributions | (8.97) | | (6.53) | | (3.59) | | (2.95) | | (2.13) |
| Net asset value at end of year | $ 17.11 | | $ 39.39 | | $ 38.57 | | $ 32.19 | | $ 27.38 |
| Total investment return (b) | (33.33)% | | 19.45% | | 31.97% | | 29.69% | | (4.48)% |
| Ratios (to average net assets)/Supplemental Data: | | | | | | | | | |
| Net investment income (loss) | (0.37)% | | (0.53)% | | 0.11% | | 0.32% | | 0.35% |
| Net expenses (c) | 0.98% | | 0.97% | | 0.98% | | 0.97% | | 0.98% |
| Expenses (before waiver/reimbursement) (c) | 0.98% | | 0.98% | | 0.98% | | 0.97% | | 0.98% |
| Portfolio turnover rate | 42% | | 48% | | 144% | | 156% | | 127% |
| Net assets at end of year (in 000's) | $ 35,128 | | $ 56,983 | | $ 57,351 | | $ 56,122 | | $ 51,674 |
| (a) | Per share data based on average shares outstanding during the year. |
| (b) | Total return does not reflect any deduction of sales charges, mortality and expense charges, contract charges or administrative charges. For periods of less than one year, total return is not annualized. |
| (c) | In addition to the fees and expenses which the Portfolio bears directly, it also indirectly bears a pro-rata share of the fees and expenses of the underlying funds in which it invests. Such indirect expenses are not included in the above expense ratios. |
The notes to the financial statements are an integral part of, and should be read in conjunction with, the financial statements.
| 16 | MainStay VP Wellington Growth Portfolio |
Notes to Financial Statements
Note 1–Organization and Business
MainStay VP Funds Trust (the “Fund”) was organized as a Delaware statutory trust on February 1, 2011. The Fund is registered under the Investment Company Act of 1940, as amended (the “1940 Act”), as an open-end management investment company. The Fund is comprised of thirty-one separate series (collectively referred to as the “Portfolios”). These financial statements and notes relate to the MainStay VP Wellington Growth Portfolio (the "Portfolio"), a "diversified” portfolio, as that term is defined in the 1940 Act, as interpreted or modified by regulatory authorities having jurisdiction, from time to time.
Shares of the Portfolio are currently offered to certain separate accounts to fund variable annuity policies and variable universal life insurance policies issued by New York Life Insurance and Annuity Corporation (“NYLIAC”), a wholly-owned subsidiary of New York Life Insurance Company (“New York Life”) and may also be offered to fund variable annuity policies and variable universal life insurance policies issued by other insurance companies. NYLIAC allocates shares of the Portfolio to, among others, certain NYLIAC separate accounts. Shares of the Portfolio are also offered to the MainStay VP Conservative Allocation Portfolio, MainStay VP Moderate Allocation Portfolio, MainStay VP Growth Allocation Portfolio and MainStay VP Equity Allocation Portfolio, which operate as “funds-of-funds," and other variable insurance funds.
The following table lists the Portfolio's share classes that have been registered and commenced operations:
| Class | Commenced Operations |
| Initial Class | January 29, 1993 |
| Service Class | June 5, 2003 |
Shares of the Portfolio are offered and are redeemed at a price equal to their respective net asset value (“NAV”) per share. No sales or redemption charge is applicable to the purchase or redemption of the Portfolio's shares. Under the terms of the Fund’s multiple class plan, adopted pursuant to Rule 18f-3 under the 1940 Act, the classes differ in that, among other things, Service Class shares of the Portfolio pay a combined distribution and service fee of 0.25% of average daily net assets attributable to Service Class shares of the Portfolio to the Distributor (as defined in Note 3(B)) pursuant to a plan adopted in accordance with Rule 12b-1 under the 1940 Act. Contract owners of variable annuity contracts purchased after June 2, 2003, are permitted to invest only in the Service Class shares.
The Portfolio's investment objective is to seek long-term growth of capital.
Note 2–Significant Accounting Policies
The Portfolio is an investment company and accordingly follows the investment company accounting and reporting guidance of the Financial Accounting Standards Board (“FASB”) Accounting Standards Codification Topic 946 Financial Services—Investment Companies. The Portfolio prepares its financial statements in accordance with generally accepted
accounting principles (“GAAP”) in the United States of America and follows the significant accounting policies described below.
(A) Securities Valuation. Investments are usually valued as of the close of regular trading on the New York Stock Exchange (the "Exchange") (usually 4:00 p.m. Eastern time) on each day the Portfolio is open for business ("valuation date").
Effective September 8, 2022, and pursuant to Rule 2a-5 under the 1940 Act, the Board of Trustees of the Fund (the "Board") designated New York Life Investment Management LLC (“New York Life Investments” or the "Manager") as its Valuation Designee (the "Valuation Designee"). The Valuation Designee is responsible for performing fair valuations relating to all investments in the Portfolio’s portfolio for which market quotations are not readily available; periodically assessing and managing material valuation risks; establishing and applying fair value methodologies; testing fair valuation methodologies; evaluating and overseeing pricing services; ensuring appropriate segregation of valuation and portfolio management functions; providing quarterly, annual and prompt reporting to the Board, as appropriate; identifying potential conflicts of interest; and maintaining appropriate records. The Valuation Designee has established a valuation committee ("Valuation Committee") to assist in carrying out the Valuation Designee’s responsibilities and establish prices of securities for which market quotations are not readily available. The Portfolio’s and the Valuation Designee's policies and procedures ("Valuation Procedures") govern the Valuation Designee’s selection and application of methodologies for determining and calculating the fair value of Portfolio investments. The Valuation Designee may value the Portfolio's portfolio securities for which market quotations are not readily available and other Portfolio assets utilizing inputs from pricing services and other third-party sources (together, “Pricing Sources”). The Valuation Committee meets (in person, via electronic mail or via teleconference) on an ad-hoc basis to determine fair valuations and on a quarterly basis to review fair value events with respect to certain securities for which market quotations are not readily available, including valuation risks and back-testing results, and preview reports to the Board.
The Valuation Committee establishes prices of securities for which market quotations are not readily available based on such methodologies and measurements on a regular basis after considering information that is reasonably available and deemed relevant by the Valuation Committee. The Board shall oversee the Valuation Designee and review fair valuation materials on a prompt, quarterly and annual basis and approve proposed revisions to the Valuation Procedures.
Investments for which market quotations are not readily available are valued at fair value as determined in good faith pursuant to the Valuation Procedures. A market quotation is readily available only when that quotation is a quoted price (unadjusted) in active markets for identical investments that the Portfolio can access at the measurement date, provided that a quotation will not be readily available if it is not reliable. "Fair value" is defined as the price the Portfolio would reasonably expect to receive upon selling an asset or liability in an orderly transaction to an independent buyer in the principal or most advantageous market for the
Notes to Financial Statements (continued)
asset or liability. Fair value measurements are determined within a framework that establishes a three-tier hierarchy that maximizes the use of observable market data and minimizes the use of unobservable inputs to establish a classification of fair value measurements for disclosure purposes. "Inputs" refer broadly to the assumptions that market participants would use in pricing the asset or liability, including assumptions about risk, such as the risk inherent in a particular valuation technique used to measure fair value using a pricing model and/or the risk inherent in the inputs for the valuation technique. Inputs may be observable or unobservable. Observable inputs reflect the assumptions market participants would use in pricing the asset or liability based on market data obtained from sources independent of the Portfolio. Unobservable inputs reflect the Portfolio’s own assumptions about the assumptions market participants would use in pricing the asset or liability based on the information available. The inputs or methodology used for valuing assets or liabilities may not be an indication of the risks associated with investing in those assets or liabilities. The three-tier hierarchy of inputs is summarized below.
| • | Level 1—quoted prices (unadjusted) in active markets for an identical asset or liability |
| • | Level 2—other significant observable inputs (including quoted prices for a similar asset or liability in active markets, interest rates and yield curves, prepayment speeds, credit risk, etc.) |
| • | Level 3—significant unobservable inputs (including the Portfolio's own assumptions about the assumptions that market participants would use in measuring fair value of an asset or liability) |
The level of an asset or liability within the fair value hierarchy is based on the lowest level of an input, both individually and in the aggregate, that is significant to the fair value measurement. The aggregate value by input level of the Portfolio’s assets and liabilities as of December 31, 2022, is included at the end of the Portfolio of Investments.
The Portfolio may use third-party vendor evaluations, whose prices may be derived from one or more of the following standard inputs, among others:
| • Broker/dealer quotes | • Benchmark securities |
| • Two-sided markets | • Reference data (corporate actions or material event notices) |
| • Bids/offers | • Monthly payment information |
| • Industry and economic events | • Reported trades |
An asset or liability for which a market quotation is not readily available is valued by methods deemed reasonable in good faith by the Valuation Committee, following the Valuation Procedures to represent fair value. Under these procedures, the Valuation Designee generally uses a market-based approach which may use related or comparable assets or liabilities, recent transactions, market multiples, book values and other relevant information. The Valuation Designee may also use an income-based valuation approach in which the anticipated future cash flows of the asset or liability are discounted to calculate fair value.
Discounts may also be applied due to the nature and/or duration of any restrictions on the disposition of the asset or liability. Fair value represents a good faith approximation of the value of a security. Fair value determinations involve the consideration of a number of subjective factors, an analysis of applicable facts and circumstances and the exercise of judgment. As a result, it is possible that the fair value for a security determined in good faith in accordance with the Valuation Procedures may differ from valuations for the same security determined for other funds using their own valuation procedures. Although the Valuation Procedures are designed to value a security at the price the Portfolio may reasonably expect to receive upon the security's sale in an orderly transaction, there can be no assurance that any fair value determination thereunder would, in fact, approximate the amount that the Portfolio would actually realize upon the sale of the security or the price at which the security would trade if a reliable market price were readily available. During the year ended December 31, 2022, there were no material changes to the fair value methodologies.
Securities which may be valued in this manner include, but are not limited to: (i) a security for which trading has been halted or suspended or otherwise does not have a readily available market quotation on a given day; (ii) a debt security that has recently gone into default and for which there is not a current market quotation; (iii) a security of an issuer that has entered into a restructuring; (iv) a security that has been delisted from a national exchange; (v) a security subject to trading collars for which no or limited trading takes place; and (vi) a security whose principal market has been temporarily closed at a time when, under normal conditions, it would be open. Securities valued in this manner are generally categorized as Level 2 or 3 in the hierarchy.
Equity securities are valued at the last quoted sales prices as of the close of regular trading on the relevant exchange on each valuation date. Securities that are not traded on the valuation date are valued at the mean of the last quoted bid and ask prices. Prices are normally taken from the principal market in which each security trades. These securities are generally categorized as Level 1 in the hierarchy.
Investments in mutual funds, including money market funds, are valued at their respective NAVs at the close of business each day on the valuation date. These securities are generally categorized as Level 1 in the hierarchy.
Temporary cash investments acquired in excess of 60 days to maturity at the time of purchase are valued using the latest bid prices or using valuations based on a matrix system (which considers such factors as security prices, yields, maturities and ratings), both as furnished by independent pricing services. Temporary cash investments that mature in 60 days or less at the time of purchase ("Short-Term Investments") are valued using the amortized cost method of valuation, unless the use of such method would be inappropriate. The amortized cost method involves valuing a security at its cost on the date of purchase and thereafter assuming a constant amortization to maturity of the difference between such cost and the value on maturity date. Amortized cost approximates the current fair value of a security. Securities valued using the amortized
| 18 | MainStay VP Wellington Growth Portfolio |
cost method are not valued using quoted prices in an active market and are generally categorized as Level 2 in the hierarchy.
The information above is not intended to reflect an exhaustive list of the methodologies that may be used to value portfolio investments. The Valuation Procedures permit the use of a variety of valuation methodologies in connection with valuing portfolio investments. The methodology used for a specific type of investment may vary based on the market data available or other considerations. The methodologies summarized above may not represent the specific means by which portfolio investments are valued on any particular business day.
A portfolio investment may be classified as an illiquid investment under the Portfolio's written liquidity risk management program and related procedures (“Liquidity Program”). Illiquidity of an investment might prevent the sale of such investment at a time when the Manager or the Subadvisor might wish to sell, and these investments could have the effect of decreasing the overall level of the Portfolio's liquidity. Further, the lack of an established secondary market may make it more difficult to value illiquid investments, requiring the Portfolio to rely on judgments that may be somewhat subjective in measuring value, which could vary materially from the amount that the Portfolio could realize upon disposition. Difficulty in selling illiquid investments may result in a loss or may be costly to the Portfolio. An illiquid investment is any investment that the Manager or Subadvisor reasonably expects cannot be sold or disposed of in current market conditions in seven calendar days or less without the sale or disposition significantly changing the market value of the investment. The liquidity classification of each investment will be made using information obtained after reasonable inquiry and taking into account, among other things, relevant market, trading and investment-specific considerations in accordance with the Liquidity Program. Illiquid investments are often fair valued in accordance with the Portfolio's procedures described above. The liquidity of the Portfolio's investments was determined as of December 31, 2022, and can change at any time. Illiquid investments as of December 31, 2022, are shown in the Portfolio of Investments.
(B) Income Taxes. The Portfolio's policy is to comply with the requirements of the Internal Revenue Code of 1986, as amended (the “Internal Revenue Code”), applicable to regulated investment companies and to distribute all of its taxable income to the shareholders of the Portfolio within the allowable time limits.
The Manager evaluates the Portfolio’s tax positions to determine if the tax positions taken meet the minimum recognition threshold in connection with accounting for uncertainties in income tax positions taken or expected to be taken for the purposes of measuring and recognizing tax liabilities in the financial statements. Recognition of tax benefits of an uncertain tax position is permitted only to the extent the position is “more likely than not” to be sustained assuming examination by taxing authorities. The Manager analyzed the Portfolio's tax positions taken on federal, state and local income tax returns for all open tax years (for up to three tax years) and has concluded that no provisions for federal, state and local income tax are required in the Portfolio's financial statements.
The Portfolio's federal, state and local income tax and federal excise tax returns for tax years for which the applicable statutes of limitations have not expired are subject to examination by the Internal Revenue Service and state and local departments of revenue.
(C) Dividends and Distributions to Shareholders. Dividends and distributions are recorded on the ex-dividend date. The Portfolio intends to declare and pay dividends from net investment income and distributions from net realized capital and currency gains, if any, at least annually. All dividends and distributions are reinvested at NAV in the same class of shares of the Portfolio. Dividends and distributions to shareholders are determined in accordance with federal income tax regulations and may differ from determinations using GAAP.
(D) Security Transactions and Investment Income. The Portfolio records security transactions on the trade date. Realized gains and losses on security transactions are determined using the identified cost method. Dividend income is recognized on the ex-dividend date, net of any foreign tax withheld at the source, and interest income is accrued as earned using the effective interest rate method. Distributions received from real estate investment trusts may be classified as dividends, capital gains and/or return of capital.
Investment income and realized and unrealized gains and losses on investments of the Portfolio are allocated pro rata to the separate classes of shares based upon their relative net assets on the date the income is earned or realized and unrealized gains and losses are incurred.
(E) Expenses. Expenses of the Fund are allocated to the individual Portfolios in proportion to the net assets of the respective Portfolios when the expenses are incurred, except where direct allocations of expenses can be made. Expenses (other than fees incurred under the distribution and service plans, further discussed in Note 3(B), which are charged directly to the Service Class shares) are allocated to separate classes of shares pro rata based upon their relative net assets on the date the expenses are incurred. The expenses borne by the Portfolio, including those of related parties to the Portfolio, are shown in the Statement of Operations.
Additionally, the Portfolio may invest in mutual funds, which are subject to management fees and other fees that may cause the costs of investing in mutual funds to be greater than the costs of owning the underlying securities directly. These indirect expenses of mutual funds are not included in the amounts shown as expenses in the Statement of Operations or in the expense ratios included in the Financial Highlights.
(F) Use of Estimates. In preparing financial statements in conformity with GAAP, the Manager makes estimates and assumptions that affect the reported amounts and disclosures in the financial statements. Actual results could differ from those estimates and assumptions.
(G) Securities Lending. In order to realize additional income, the Portfolio may engage in securities lending, subject to the limitations set forth in the 1940 Act and relevant guidance by the staff of the Securities and Exchange Commission (“SEC”). If the Portfolio engages in securities
Notes to Financial Statements (continued)
lending, the Portfolio will lend through its custodian, JPMorgan Chase Bank, N.A., ("JPMorgan"), acting as securities lending agent on behalf of the Portfolio. Under the current arrangement, JPMorgan will manage the Portfolio's collateral in accordance with the securities lending agency agreement between the Portfolio and JPMorgan, and indemnify the Portfolio against counterparty risk. The loans will be collateralized by cash (which may be invested in a money market fund) and/or non-cash collateral (which may include U.S. Treasury securities and/or U.S. government agency securities issued or guaranteed by the United States government or its agencies or instrumentalities) at least equal at all times to the market value of the securities loaned. Non-cash collateral held at year end is segregated and cannot be transferred by the Portfolio. The Portfolio bears the risk of delay in recovery of, or loss of rights in, the securities loaned. The Portfolio may also record a realized gain or loss on securities deemed sold due to a borrower’s inability to return securities on loan. The Portfolio bears the risk of any loss on investment of cash collateral. The Portfolio will receive compensation for lending its securities in the form of fees or it will retain a portion of interest earned on the investment of any cash collateral. The Portfolio will also continue to receive interest and dividends on the securities loaned and any gain or loss in the market price of the securities loaned that may occur during the term of the loan will be for the account of the Portfolio. Income earned from securities lending activities, if any, is reflected in the Statement of Operations. As of December 31, 2022, the Portfolio did not have any portfolio securities on loan.
(H) Indemnifications. Under the Fund’s organizational documents, its officers and trustees are indemnified against certain liabilities that may arise out of performance of their duties to the Fund. Additionally, in the normal course of business, the Portfolio enters into contracts with third-party service providers that contain a variety of representations and warranties and that may provide general indemnifications. The Portfolio's maximum exposure under these arrangements is unknown, as this would involve future claims that may be made against the Portfolio that have not yet occurred. The Manager believes that the risk of loss in connection with these potential indemnification obligations is remote. However, there can be no assurance that material liabilities related to such obligations will not arise in the future, which could adversely impact the Portfolio.
Note 3–Fees and Related Party Transactions
(A) Manager and Subadvisor. New York Life Investments, a registered investment adviser and an indirect, wholly-owned subsidiary of New York Life, serves as the Portfolio's Manager, pursuant to an Amended and Restated Management Agreement ("Management Agreement"). The Manager provides offices, conducts clerical, recordkeeping and bookkeeping services and keeps most of the financial and accounting records required to be maintained by the Portfolio. Except for the portion of salaries and expenses that are the responsibility of the Portfolio, the Manager pays the salaries and expenses of all personnel affiliated with the Portfolio and certain operational expenses of the Portfolio. During a portion of the year ended December 31, 2022, the Portfolio reimbursed New York Life Investments in an amount equal to the portion of the
compensation of the Chief Compliance Officer attributable to the Portfolio. Wellington Management Company LLP ("Wellington" or the "Subadvisor"), a registered investment adviser, serves as the Subadvisor to the Portfolio and is responsible for the day-to-day portfolio management of the Portfolio. Pursuant to the terms of a Subadvisory Agreement between New York Life Investments and Wellington, New York Life Investments pays for the services of the Subadvisor.
Pursuant to the Management Agreement, the Fund pays the Manager, on behalf of the Portfolio, a monthly fee for the services performed and the facilities furnished at an annual rate of the Portfolio's average daily net assets as follows: 0.70% up to $500 million; 0.65% from $500 million to $1 billion; 0.625% from $1 billion to $2 billion; and 0.60% in excess of $2 billion. During the year ended December 31, 2022, the effective management fee rate was 0.69%.
During the year ended December 31, 2022, New York Life Investments earned fees from the Portfolio in the amount of $4,278,824 and paid the Subadvisor fees of $1,767,521.
JPMorgan provides sub-administration and sub-accounting services to the Portfolio pursuant to an agreement with New York Life Investments. These services include calculating the daily NAVs of the Portfolio, maintaining the general ledger and sub-ledger accounts for the calculation of the Portfolio's NAVs, and assisting New York Life Investments in conducting various aspects of the Portfolio's administrative operations. For providing these services to the Portfolio, JPMorgan is compensated by New York Life Investments.
Pursuant to an agreement between the Fund and New York Life Investments, New York Life Investments is responsible for providing or procuring certain regulatory reporting services for the Portfolio. The Portfolio will reimburse New York Life Investments for the actual costs incurred by New York Life Investments in connection with providing or procuring these services for the Portfolio.
(B) Distribution and Service Fees. The Fund, on behalf of the Portfolio, has entered into a distribution agreement with NYLIFE Distributors LLC (the “Distributor”), an affiliate of New York Life Investments. The Portfolio has adopted a distribution plan (the “Plan”) in accordance with the provisions of Rule 12b-1 under the 1940 Act. Under the Plan, the Distributor has agreed to provide, through its affiliates or independent third parties, various distribution-related, shareholder and administrative support services to the Service Class shareholders. For its services, the Distributor is entitled to a combined distribution and service fee accrued daily and paid monthly at an annual rate of 0.25% of the average daily net assets attributable to the Service Class shares of the Portfolio.
| 20 | MainStay VP Wellington Growth Portfolio |
Note 4-Federal Income Tax
As of December 31, 2022, the cost and unrealized appreciation (depreciation) of the Portfolio’s investment portfolio, including applicable derivative contracts and other financial instruments, as determined on a federal income tax basis, were as follows:
| | Federal Tax
Cost | Gross
Unrealized
Appreciation | Gross
Unrealized
(Depreciation) | Net
Unrealized
Appreciation/
(Depreciation) |
| Investments in Securities | $604,973,533 | $51,327,219 | $(111,774,447) | $(60,447,228) |
As of December 31, 2022, the components of accumulated gain (loss) on a tax basis were as follows:
Ordinary
Income | Accumulated
Capital
and Other
Gain (Loss) | Other
Temporary
Differences | Unrealized
Appreciation
(Depreciation) | Total
Accumulated
Gain (Loss) |
| $— | $(55,645,606) | $— | $(60,447,228) | $(116,092,834) |
The difference between book-basis and tax-basis unrealized appreciation (depreciation) is primarily due to wash sale adjustments.
The following table discloses the current year reclassifications between total distributable earnings (loss) and additional paid-in capital arising from permanent differences; net assets as of December 31, 2022 were not affected.
| | Total
Distributable
Earnings (Loss) | Additional
Paid-In
Capital |
| | $663,121 | $(663,121) |
The reclassifications for the Portfolio are primarily due to different book and tax treatment of reclassification of net operating losses.
As of December 31, 2022, for federal income tax purposes, capital loss carryforwards of $55,645,606, as shown in the table below, were available to the extent provided by the regulations to offset future realized gains of the Portfolio. Accordingly, no capital gains distributions are expected to be paid to shareholders until net gains have been realized in excess of such amounts.
Capital Loss
Available Through | Short-Term
Capital Loss
Amounts (000’s) | Long-Term
Capital Loss
Amounts (000’s) |
| Unlimited | $39,989 | $15,657 |
During the years ended December 31, 2022 and December 31, 2021, the tax character of distributions paid as reflected in the Statements of Changes in Net Assets was as follows:
| | 2022 | 2021 |
| Distributions paid from: | | |
| Ordinary Income | $ 50,614,417 | $ 16,747,990 |
| Long-Term Capital Gains | 133,104,222 | 89,282,780 |
| Total | $183,718,639 | $106,030,770 |
Note 5–Custodian
JPMorgan is the custodian of cash and securities held by the Portfolio. Custodial fees are charged to the Portfolio based on the Portfolio's net assets and/or the market value of securities held by the Portfolio and the number of certain transactions incurred by the Portfolio.
Note 6–Line of Credit
The Portfolio and certain other funds managed by New York Life Investments maintain a line of credit with a syndicate of banks in order to secure a source of funds for temporary purposes to meet unanticipated or excessive redemption requests.
Effective July 26, 2022, under the credit agreement (the “Credit Agreement”), the aggregate commitment amount is $600,000,000 with an additional uncommitted amount of $100,000,000. The commitment fee is an annual rate of 0.15% of the average commitment amount payable quarterly, regardless of usage, to JPMorgan, who serves as the agent to the syndicate. The commitment fee is allocated among the Portfolio and certain other funds managed by New York Life Investments based upon their respective net assets and other factors. Interest on any revolving credit loan is charged based upon the Federal Funds Rate, Daily Simple Secured Overnight Financing Rate ("SOFR") + 0.10%, or the Overnight Bank Funding Rate, whichever is higher. The Credit Agreement expires on July 25, 2023, although the Portfolio, certain other funds managed by New York Life Investments and the syndicate of banks may renew the Credit Agreement for an additional year on the same or different terms or enter into a credit agreement with a different syndicate of banks. Prior to July 26, 2022, the aggregate commitment amount and the commitment fee were the same as those under the current Credit Agreement. During the year ended December 31, 2022, there were no borrowings made or outstanding with respect to the Portfolio under the Credit Agreement.
Note 7–Interfund Lending Program
Pursuant to an exemptive order issued by the SEC, the Portfolio, along with certain other funds managed by New York Life Investments, may participate in an interfund lending program. The interfund lending program provides an alternative credit facility that permits the Portfolio and certain other funds managed by New York Life Investments to lend or borrow money for temporary purposes directly to or from one another, subject to the conditions of the exemptive order. During the year ended
Notes to Financial Statements (continued)
December 31, 2022, there were no interfund loans made or outstanding with respect to the Portfolio.
Note 8–Purchases and Sales of Securities (in 000’s)
During the year ended December 31, 2022, purchases and sales of securities, other than short-term securities, were $279,177 and $254,580, respectively.
The Portfolio may purchase securities from or sell securities to other portfolios managed by the Subadvisor. These interportfolio transactions are primarily used for cash management purposes and are made pursuant to Rule 17a-7 under the 1940 Act. The Rule 17a-7 transactions during the year ended December 31, 2022, were as follows:
Sales
(000's) | Realized
Gain / (Loss)
(000's) |
| $1,484 | $(636) |
Note 9–Capital Share Transactions
Transactions in capital shares for the years ended December 31, 2022 and December 31, 2021, were as follows:
| Initial Class | Shares | Amount |
| Year ended December 31, 2022: | | |
| Shares sold | 2,942,593 | $ 91,387,732 |
| Shares issued to shareholders in reinvestment of distributions | 9,922,872 | 171,459,297 |
| Shares redeemed | (1,875,302) | (52,233,565) |
| Net increase (decrease) | 10,990,163 | $210,613,464 |
| Year ended December 31, 2021: | | |
| Shares sold | 1,949,803 | $ 81,230,189 |
| Shares issued to shareholders in reinvestment of distributions | 2,496,099 | 97,692,566 |
| Shares redeemed | (1,662,755) | (69,745,620) |
| Net increase (decrease) | 2,783,147 | $109,177,135 |
| |
| Service Class | Shares | Amount |
| Year ended December 31, 2022: | | |
| Shares sold | 98,484 | $ 2,763,146 |
| Shares issued to shareholders in reinvestment of distributions | 731,094 | 12,259,342 |
| Shares redeemed | (222,717) | (5,932,991) |
| Net increase (decrease) | 606,861 | $ 9,089,497 |
| Year ended December 31, 2021: | | |
| Shares sold | 15,229 | $ 625,500 |
| Shares issued to shareholders in reinvestment of distributions | 216,720 | 8,338,204 |
| Shares redeemed | (272,037) | (11,370,933) |
| Net increase (decrease) | (40,088) | $ (2,407,229) |
Note 10–Other Matters
As of the date of this report, interest rates in the United States and many parts of the world, including certain European countries, are ascending from historically low levels. Thus, the Portfolio currently faces a heightened level of risk associated with rising interest rates. This could be driven by a variety of factors, including but not limited to central bank monetary policies, changing inflation or real growth rates, general economic conditions, increasing bond issuances or reduced market demand for low yielding investments.
An outbreak of COVID-19, first detected in December 2019, has developed into a global pandemic and has resulted in travel restrictions, closure of international borders, certain businesses and securities markets, restrictions on securities trading activities, prolonged quarantines, supply chain disruptions, and lower consumer demand, as well as general concern and uncertainty. In 2022, many countries lifted some or all restrictions related to COVID-19. However, the continued impact of COVID-19 and related variants is uncertain and could further adversely affect the global economy, national economies, individual issuers and capital markets in unforeseeable ways and result in a substantial and extended economic downturn. Developments that disrupt global economies and financial markets, such as COVID-19, may magnify factors that affect the Portfolio's performance.
Note 11–Subsequent Events
In connection with the preparation of the financial statements of the Portfolio as of and for the year ended December 31, 2022, events and transactions subsequent to December 31, 2022, through the date the financial statements were issued have been evaluated by the Manager for possible adjustment and/or disclosure. No subsequent events requiring financial statement adjustment or disclosure have been identified.
| 22 | MainStay VP Wellington Growth Portfolio |
Report of Independent Registered Public Accounting Firm
To the Board of Trustees of MainStay VP Funds Trust and Shareholders of
MainStay VP Wellington Growth Portfolio
Opinion on the Financial Statements
We have audited the accompanying statement of assets and liabilities, including the portfolio of investments, of MainStay VP Wellington Growth Portfolio (one of the portfolios constituting MainStay VP Funds Trust, referred to hereafter as the “Portfolio”) as of December 31, 2022, the related statement of operations for the year ended December 31, 2022, the statements of changes in net assets for each of the two years in the period ended December 31, 2022, including the related notes, and the financial highlights for each of the five years in the period ended December 31, 2022 (collectively referred to as the “financial statements”). In our opinion, the financial statements present fairly, in all material respects, the financial position of the Portfolio as of December 31, 2022, the results of its operations for the year then ended, the changes in its net assets for each of the two years in the period ended December 31, 2022 and the financial highlights for each of the five years in the period ended December 31, 2022 in conformity with accounting principles generally accepted in the United States of America.
Basis for Opinion
These financial statements are the responsibility of the Portfolio’s management. Our responsibility is to express an opinion on the Portfolio’s financial statements based on our audits. We are a public accounting firm registered with the Public Company Accounting Oversight Board (United States) (PCAOB) and are required to be independent with respect to the Portfolio in accordance with the U.S. federal securities laws and the applicable rules and regulations of the Securities and Exchange Commission and the PCAOB.
We conducted our audits of these financial statements in accordance with the standards of the PCAOB. Those standards require that we plan and perform the audit to obtain reasonable assurance about whether the financial statements are free of material misstatement, whether due to error or fraud.
Our audits included performing procedures to assess the risks of material misstatement of the financial statements, whether due to error or fraud, and performing procedures that respond to those risks. Such procedures included examining, on a test basis, evidence regarding the amounts and disclosures in the financial statements. Our audits also included evaluating the accounting principles used and significant estimates made by management, as well as evaluating the overall presentation of the financial statements. Our procedures included confirmation of securities owned as of December 31, 2022 by correspondence with the custodian and transfer agents. We believe that our audits provide a reasonable basis for our opinion.
/s/PricewaterhouseCoopers LLP
New York, New York
February 24, 2023
We have served as the auditor of one or more investment companies in the MainStay group of funds since 1984.
Board Consideration and Approval of Management Agreement and Subadvisory Agreement (Unaudited)
The continuation of the Management Agreement with respect to the MainStay VP Wellington Growth Portfolio (“Portfolio”) and New York Life Investment Management LLC (“New York Life Investments”) and the Subadvisory Agreement between New York Life Investments and Wellington Management Company LLP (“WMC”) with respect to the Portfolio (together, “Advisory Agreements”) is subject to annual review and approval by the Board of Trustees of MainStay VP Funds Trust (“Board” of the “Trust”) in accordance with Section 15 of the Investment Company Act of 1940, as amended (“1940 Act”). At its December 6–7, 2022 meeting, the Board, which is comprised solely of Trustees who are not an “interested person” (as such term is defined in the 1940 Act) of the Trust (“Independent Trustees”), unanimously approved the continuation of each of the Advisory Agreements for a one-year period.
In reaching the decision to approve the continuation of each of the Advisory Agreements, the Board considered information and materials furnished by New York Life Investments and WMC in connection with an annual contract review process undertaken by the Board that took place at meetings of the Board and its Contracts Committee during October 2022 through December 2022, including information and materials furnished by New York Life Investments and WMC in response to requests prepared on behalf of the Board, and in consultation with the Board, by independent legal counsel to the Independent Trustees, which encompassed a variety of topics, including those summarized below. Information and materials requested by and furnished to the Board for consideration in connection with the contract review process included, among other items, reports on the Portfolio and “peer funds” prepared by Institutional Shareholder Services Inc. (“ISS”), an independent third-party service provider engaged by the Board to report objectively on the Portfolio’s investment performance, management fee and total expenses. The Board also considered information on the fees charged to other investment advisory clients of New York Life Investments and/or WMC that follow investment strategies similar to those of the Portfolio, if any, and, when applicable, the rationale for any differences in the Portfolio’s management and subadvisory fees and the fees charged to those other investment advisory clients. In addition, the Board considered information regarding the legal standards and fiduciary obligations applicable to its consideration of the continuation of each of the Advisory Agreements. The contract review process, including the structure and format for information and materials provided to the Board, has been developed in consultation with the Board. The Independent Trustees also met in executive sessions with their independent legal counsel and, for portions thereof, with senior management of New York Life Investments.
The Board’s deliberations with respect to the continuation of each of the Advisory Agreements reflect a year-long process, and the Board also took into account information furnished to the Board and its Committees throughout the year, as deemed relevant and appropriate by the Trustees, including, among other items, reports on investment performance of the Portfolio and investment-related matters for the Portfolio as well as presentations from New York Life Investments and, generally annually, WMC personnel. In addition, the Board took into account other information received from New York Life Investments throughout the year,
including, among other items, periodic reports on legal and compliance matters, risk management, portfolio turnover, brokerage commissions and non-advisory services provided to the Portfolio by New York Life Investments, as deemed relevant and appropriate by the Trustees.
In addition to information provided to the Board throughout the year, the Board received information in connection with its June 2022 meeting provided specifically in response to requests prepared on behalf of the Board, and in consultation with the Board, by independent legal counsel to the Independent Trustees regarding the Portfolio’s distribution arrangements. In addition, the Board received information regarding the Portfolio’s asset levels, share purchase and redemption activity and the payment of Rule 12b-1 and/or other fees by the applicable share classes of the Portfolio, among other information.
In considering the continuation of each of the Advisory Agreements, the Trustees reviewed and evaluated the information and factors they believed to reasonably be necessary and appropriate in light of legal advice furnished to them by independent legal counsel to the Independent Trustees and through the exercise of their own business judgment. Although individual Trustees may have weighed certain factors or information differently and the Board did not consider any single factor or information controlling in reaching its decision, the factors considered by the Board are summarized in more detail below and include, among other factors: (i) the nature, extent and quality of the services provided to the Portfolio by New York Life Investments and WMC; (ii) the qualifications of the portfolio manager of the Portfolio and the historical investment performance of the Portfolio, New York Life Investments and WMC; (iii) the costs of the services provided, and profits realized, by New York Life Investments and WMC with respect to their relationships with the Portfolio; (iv) the extent to which economies of scale have been realized or may be realized if the Portfolio grows and the extent to which any economies of scale have been shared, have benefited or may benefit the Portfolio’s shareholders; and (v) the reasonableness of the Portfolio’s management and subadvisory fees and total ordinary operating expenses. Although the Board recognized that comparisons between the Portfolio’s fees and expenses and those of other funds are imprecise given different terms of agreements, variations in fund strategies and other factors, the Board considered the reasonableness of the Portfolio’s management fee and total ordinary operating expenses as compared to the peer funds identified by ISS. Throughout their considerations, the Trustees acknowledged the commitment of New York Life Investments and its affiliates to serve the MainStay Group of Funds, as well as their capacity, experience, resources, financial stability and reputations. The Trustees also acknowledged the entrepreneurial and other risks assumed by New York Life Investments in sponsoring and managing the Portfolio. With respect to the Subadvisory Agreement, the Board took into account New York Life Investments’ recommendation to approve the continuation of the Subadvisory Agreement.
The Trustees noted that, throughout the year, the Trustees are afforded an opportunity to ask questions of, and request additional information or materials from, New York Life Investments and WMC. The Board’s decision with respect to each of the Advisory Agreements may have also
| 24 | MainStay VP Wellington Growth Portfolio |
been based, in part, on the Board’s knowledge of New York Life Investments and WMC resulting from, among other things, the Board’s consideration of each of the Advisory Agreements in prior years, the advisory agreements for other funds in the MainStay Group of Funds, the Board’s review throughout the year of the performance and operations of other funds in the MainStay Group of Funds and each Trustee’s business judgment and industry experience. In addition to considering the above-referenced factors, the Board observed that in the marketplace, notably under variable life insurance policies and variable annuity contracts for which the Portfolio serves as an investment option, there are a range of investment options available to investors and that the Portfolio’s shareholders, having had the opportunity to consider other investment options, have chosen to invest in the Portfolio.
The factors that figured prominently in the Board’s decision to approve the continuation of each of the Advisory Agreements during its December 6–7, 2022 meeting are summarized in more detail below.
Nature, Extent and Quality of Services Provided by New York Life Investments and WMC
The Board examined the nature, extent and quality of the services that New York Life Investments provides to the Portfolio. The Board evaluated New York Life Investments’ experience and capabilities in serving as manager of the Portfolio and considered that the Portfolio operates in a “manager-of-managers” structure. The Board also considered New York Life Investments’ responsibilities and services provided pursuant to this structure, including overseeing the services provided by WMC, evaluating the performance of WMC, making recommendations to the Board as to whether the Subadvisory Agreement should be renewed, modified or terminated and periodically reporting to the Board regarding the results of New York Life Investments’ evaluation and monitoring functions. The Board noted that New York Life Investments manages other mutual funds, serves a variety of other investment advisory clients, including other pooled investment vehicles, and has experience overseeing mutual fund service providers, including subadvisors. The Board considered the experience of senior personnel at New York Life Investments providing management and administrative and other non-advisory services to the Portfolio. The Board observed that New York Life Investments devotes significant resources and time to providing management and administrative and other non-advisory services to the Portfolio, including New York Life Investments’ oversight and due diligence reviews of WMC and ongoing analysis of, and interactions with, WMC with respect to, among other things, the Portfolio’s investment performance and risks as well as WMC’s investment capabilities and subadvisory services with respect to the Portfolio.
The Board also considered the range of services that New York Life Investments provides to the Portfolio under the terms of the Management Agreement, including: (i) fund accounting and ongoing supervisory services provided by New York Life Investments’ Fund Administration and Accounting Group; (ii) investment supervisory and analytical services provided by New York Life Investments’ Investment Consulting Group; (iii) compliance services provided by the Trust’s Chief Compliance Officer as
well as New York Life Investments’ compliance department, including supervision and implementation of the Portfolio’s compliance program; (iv) legal services provided by New York Life Investments’ Office of the General Counsel; and (v) risk management monitoring and analysis by compliance and investment personnel. In addition, the Board considered New York Life Investments’ willingness to invest in personnel and other resources, such as cyber security, information security and business continuity planning, designed to benefit the Portfolio and noted that New York Life Investments is responsible for compensating the Trust’s officers, except for a portion of the salary of the Trust’s Chief Compliance Officer. The Board recognized that New York Life Investments provides certain other non-advisory services to the Portfolio and has provided an increasingly broad array of non-advisory services to the MainStay Group of Funds as a result of regulatory and other developments, including in connection with the implementation of the MainStay Group of Funds’ derivatives risk management program and policies and procedures adopted pursuant to Rule 18f-4 under the 1940 Act.
The Board also examined the range, and the nature, extent and quality, of the investment advisory services that WMC provides to the Portfolio and considered the terms of each of the Advisory Agreements. The Board evaluated WMC’s experience and performance in serving as subadvisor to the Portfolio and advising other portfolios and WMC’s track record and experience in providing investment advisory services, the experience of investment advisory, senior management and administrative personnel at WMC. The Board considered New York Life Investments’ and WMC’s overall resources, legal and compliance environment, capabilities, reputation, financial condition and history. In addition to information provided in connection with quarterly meetings with the Trust’s Chief Compliance Officer, the Board considered information regarding the compliance policies and procedures of New York Life Investments and WMC and acknowledged their commitment to further developing and strengthening compliance programs relating to the Portfolio. The Board also considered WMC’s ability to recruit and retain qualified investment professionals and willingness to invest in personnel and other resources to service and support the Portfolio. In this regard, the Board considered the qualifications and experience of the Portfolio’s portfolio manager, the number of accounts managed by the portfolio manager and the method for compensating the portfolio manager.
In addition, the Board considered information provided by New York Life Investments and WMC regarding the operations of their respective business continuity plans in response to the COVID-19 pandemic and the continued remote work environment.
Based on these considerations, among others, the Board concluded that the Portfolio would likely continue to benefit from the nature, extent and quality of these services.
Investment Performance
In evaluating the Portfolio’s investment performance, the Board considered investment performance results over various periods in light of the Portfolio’s investment objective, strategies and risks. The Board
Board Consideration and Approval of Management Agreement and Subadvisory Agreement (Unaudited) (continued)
considered investment reports on, and analysis of, the Portfolio’s performance provided to the Board throughout the year. These reports include, among other items, information on the Portfolio’s gross and net returns, the Portfolio’s investment performance compared to a relevant investment category and the Portfolio’s benchmark, the Portfolio’s risk-adjusted investment performance and the Portfolio’s investment performance as compared to peer funds, as appropriate, as well as portfolio attribution information and commentary on the effect of market conditions. The Board also considered information provided by ISS showing the investment performance of the Portfolio as compared to peer funds. In addition, the Board reviewed the methodology used by ISS to construct the group of peer funds for comparative purposes.
The Board also took into account its discussions with senior management at New York Life Investments concerning the Portfolio’s investment performance over various periods as well as discussions between the Portfolio’s portfolio management team and the members of the Board’s Investment Committee, which generally occur on an annual basis. In addition, the Board considered any specific actions that New York Life Investments or WMC had taken, or had agreed to take, to seek to enhance Portfolio investment performance and the results of those actions. In considering the investment performance of the Portfolio, the Board noted that the Portfolio underperformed its peer funds for the one-, three-, five- and ten-year periods ended July 31, 2022. The Board considered its discussions with representatives from New York Life Investments and WMC regarding the Portfolio’s investment performance.
Based on these considerations, among others, the Board concluded that its review of the Portfolio’s investment performance and related information supported a determination to approve the continuation of each of the Advisory Agreements.
Costs of the Services Provided, and Profits and Other Benefits Realized, by New York Life Investments and WMC
The Board considered the costs of the services provided under each of the Advisory Agreements. The Board also considered the profits realized by New York Life Investments and its affiliates and WMC due to their relationships with the Portfolio as well as by New York Life Investments and its affiliates due to their relationship with the MainStay Group of Funds. The Board considered information from New York Life Investments that WMC’s subadvisory fee reflected an arm’s-length negotiation and that this fee is paid by New York Life Investments, not the Portfolio, and the relevance of WMC’s profitability was considered by the Trustees in that context. On this basis, the Board primarily considered the costs and profitability for New York Life Investments and its affiliates with respect to the Portfolio.
In addition, the Board acknowledged the difficulty in obtaining reliable comparative data about mutual fund managers’ profitability because such information generally is not publicly available and may be impacted by numerous factors, including the structure of a fund manager’s
organization, the types of funds it manages, the methodology used to allocate certain fixed costs to specific funds and the manager’s capital structure and costs of capital.
In evaluating the costs of the services provided by New York Life Investments and WMC and profits realized by New York Life Investments and its affiliates and WMC, the Board considered, among other factors, New York Life Investments’ and its affiliates’ and WMC’s continuing investments in, or willingness to invest in, personnel and other resources to support and further enhance the management of the Portfolio, and that New York Life Investments is responsible for paying the subadvisory fee for the Portfolio. The Board also considered the financial resources of New York Life Investments and WMC and acknowledged that New York Life Investments and WMC must be in a position to recruit and retain experienced professional personnel and to maintain a strong financial position for New York Life Investments and WMC to continue to provide high-quality services to the Portfolio. The Board recognized that the Portfolio benefits from the allocation of certain fixed costs among the funds in the MainStay Group of Funds, among other expected benefits resulting from its relationship with New York Life Investments.
The Board considered information regarding New York Life Investments’ methodology for calculating profitability and allocating costs provided by New York Life Investments in connection with the fund profitability analysis presented to the Board. The Board noted it had previously engaged an independent consultant to review the methods used to allocate costs among the funds in the MainStay Group of Funds. The Board also noted that the independent consultant had concluded that New York Life Investments’ methods for allocating costs and procedures for estimating overall profitability of the relationship with the funds in the MainStay Group of Funds are reasonable and that New York Life Investments continued to use the same method of calculating profit and allocating costs since the independent consultant’s review. The Board recognized the difficulty in calculating and evaluating a manager’s profitability with respect to the Portfolio and considered that other profitability methodologies may also be reasonable.
The Board also considered certain fall-out benefits that may be realized by New York Life Investments and its affiliates due to their relationships with the Portfolio, including reputational and other indirect benefits. The Board recognized, for example, the benefits to WMC from legally permitted “soft-dollar” arrangements by which brokers provide research and other services to WMC in exchange for commissions paid by the Portfolio with respect to trades in the Portfolio’s portfolio securities. In this regard, the Board also requested and considered information from New York Life Investments concerning other material business relationships between WMC and its affiliates and New York Life Investments and its affiliates and considered the existence of a strategic partnership between New York Life Investments and WMC that relates to certain current and future products and represents a potential conflict of interest associated with New York Life Investments’ recommendation to approve the Subadvisory Agreement. In addition, the Board considered its review of the management agreement for a money market fund advised by New York Life Investments and an affiliated subadvisor that serves as an
| 26 | MainStay VP Wellington Growth Portfolio |
investment option for the Portfolio, including the potential rationale for and costs associated with investments in this money market fund by the Portfolio, if any, and considered information from New York Life Investments that the nature and type of specific investment advisory services provided to this money market fund are distinct from, or in addition to, the investment advisory services provided to the Portfolio. In addition, the Board considered the potential dividend received tax deduction for insurance company affiliates of New York Life Investments from the Portfolio’s securities lending activity.
The Board noted that the Portfolio serves as an investment option primarily under variable contracts issued by affiliates of New York Life Investments that would receive fees under those contracts. The Board observed that, in addition to fees earned by New York Life Investments under the Management Agreement for managing the Portfolio, New York Life Investments’ affiliates also earn revenues from serving the Portfolio in various other capacities, including as the Portfolio’s distributor. The Board considered information about these other revenues and their impact on the profitability of the relationship with the Portfolio to New York Life Investments and its affiliates. The Board noted that, although it assessed the overall profitability of the relationship with the Portfolio to New York Life Investments and its affiliates as part of the contract review process, when considering the reasonableness of the fee paid to New York Life Investments under the Management Agreement, the Board considered the profitability of New York Life Investments’ relationship with the Portfolio on a pre-tax basis and without regard to distribution expenses incurred by New York Life Investments from its own resources.
After evaluating the information deemed relevant by the Trustees, the Board concluded that any profits realized by New York Life Investments and its affiliates due to their relationships with the Portfolio were not excessive, other benefits that may accrue to New York Life Investments and its affiliates are reasonable and benefits that may accrue to WMC and its affiliates are consistent with those expected for a subadvisor to a mutual fund. With respect to WMC, the Board considered that any profits realized by WMC due to its relationship with the Portfolio are the result of arm’s-length negotiations between New York Life Investments and WMC, acknowledging that any such profits are based on the subadvisory fee paid to WMC by New York Life Investments, not the Portfolio.
Management and Subadvisory Fees and Total Ordinary Operating Expenses
The Board evaluated the reasonableness of the fee paid under each of the Advisory Agreements and the Portfolio’s total ordinary operating expenses. The Board primarily considered the reasonableness of the management fee paid by the Portfolio to New York Life Investments because the subadvisory fee paid to WMC is paid by New York Life Investments, not the Portfolio. The Board also considered the reasonableness of the subadvisory fee paid by New York Life Investments and the amount of the management fee retained by New York Life Investments.
In assessing the reasonableness of the Portfolio’s fees and expenses, the Board primarily considered comparative data provided by ISS on the fees and expenses charged by similar mutual funds managed by other investment advisers. The Board reviewed the methodology used by ISS to construct the group of peer funds for comparative purposes. In addition, the Board considered information provided by New York Life Investments and WMC on fees charged to other investment advisory clients, including institutional separate accounts and/or other funds that follow investment strategies similar to those of the Portfolio, if any. The Board considered the contractual management fee schedules of the Portfolio as compared to those of such other investment advisory clients, taking into account the rationale for any differences in fee schedules. The Board also took into account information provided by New York Life Investments about the more extensive scope of services provided to registered investment companies, such as the Portfolio, as compared with other investment advisory clients. Additionally, the Board considered the impact of contractual breakpoints on the Portfolio’s net management fee and expenses. The Board also considered that in proposing fees for the Portfolio, New York Life Investments considers the competitive marketplace for mutual funds.
Based on the factors outlined above, among other considerations, the Board concluded that the Portfolio’s management fee and total ordinary operating expenses are within a range that is competitive and support a conclusion that these fees and expenses are reasonable.
Economies of Scale
The Board considered information regarding economies of scale, including whether economies of scale may exist for the Portfolio and whether the Portfolio’s expense structure permits any economies of scale to be appropriately shared with the Portfolio’s beneficial shareholders. The Board also considered a report from New York Life Investments, previously prepared at the request of the Board, that addressed economies of scale, including with respect to the mutual fund business generally, and the various ways in which the benefits of economies of scale may be shared with the funds in the MainStay Group of Funds. Although the Board recognized the difficulty of determining economies of scale with precision, the Board acknowledged that economies of scale may be shared with the Portfolio in a number of ways, including, for example, through the imposition of fee breakpoints, initially setting management fee rates at scale or making additional investments to enhance the services provided to the Portfolio. The Board reviewed information from New York Life Investments showing how the Portfolio’s management fee schedule compared to fee schedules of other funds and accounts managed by New York Life Investments. The Board also reviewed information from ISS showing how the Portfolio’s management fee schedule compared with fees paid for similar services by peer funds at varying asset levels.
Based on this information, the Board concluded that economies of scale are appropriately reflected for the benefit of the Portfolio’s beneficial shareholders through the Portfolio’s expense structure and other methods to share benefits from economies of scale.
Board Consideration and Approval of Management Agreement and Subadvisory Agreement (Unaudited) (continued)
Conclusion
On the basis of the information and factors summarized above, among other information and factors deemed relevant by the Trustees, and the evaluation thereof, the Board unanimously voted to approve the continuation of each of the Advisory Agreements.
| 28 | MainStay VP Wellington Growth Portfolio |
Proxy Voting Policies and Procedures and Proxy Voting Record
The Portfolio is required to file with the SEC its proxy voting record for the 12-month period ending June 30 on Form N-PX. A description of the policies and procedures that are used to vote proxies relating to portfolio securities of the Portfolio is available free of charge upon request by calling 800-598-2019 or visiting the SEC's website at www.sec.gov. The most recent Form N-PX or proxy voting record is available free of charge upon request by calling 800-598-2019; visiting https://www.newyorklifeinvestments.com/investment-products/vp; or visiting the SEC’s website at www.sec.gov.
Shareholder Reports and Quarterly Portfolio Disclosure
The Portfolio is required to file its complete schedule of portfolio holdings with the SEC 60 days after its first and third fiscal quarter on Form N-PORT. The Portfolio's holdings report is available free of charge upon request by calling 800-598-2019 or by visiting the SEC’s website at www.sec.gov.
Board of Trustees and Officers (Unaudited)
The Trustees and officers of the Portfolio are listed below. The Board oversees the MainStay Group of Funds (which consists of MainStay Funds and MainStay Funds Trust), MainStay VP Funds Trust, MainStay MacKay DefinedTerm Municipal Opportunities Fund, MainStay CBRE Global Infrastructure Megatrends Fund, the Manager and the Subadvisors, and elects the officers of the Portfolios who are responsible for the day-to-day operations of the Portfolio. Information pertaining to the Trustees and officers is set forth below. Each Trustee serves until his or her successor
is elected and qualified or until his or her resignation, death or removal. Under the Board’s retirement policy, unless an exception is made, a Trustee must tender his or her resignation by the end of the calendar year during which he or she reaches the age of 75. The business address of each Trustee and officer listed below is 51 Madison Avenue, New York, New York 10010. None of the Trustees are “interested persons” (as defined by the 1940 Act and rules adopted by the SEC thereunder) of the Portfolio (“Independent Trustees”).
| | Name and
Year of Birth | Term of Office,
Position(s) Held and
Length of Service | Principal Occupation(s)
During Past Five Years | Number of
Portfolios in
Fund Complex
Overseen by
Trustee | Other Directorships
Held by Trustee |
| | | | | | |
| | David H. Chow
1957 | MainStay VP Funds Trust: Trustee since January 2016, Advisory Board Member (June 2015 to December 2015) | Founder and CEO, DanCourt Management, LLC since 1999 | 78 | MainStay Funds: Trustee since January 2016, Advisory Board Member (June 2015 to December 2015) (12 Funds);
MainStay Funds Trust: Trustee since January 2016, Advisory Board Member (June 2015 to December 2015) (33 Funds);
MainStay MacKay DefinedTerm Municipal Opportunities Fund: Trustee since January 2016, Advisory Board Member (June 2015 to December 2015);
MainStay CBRE Global Infrastructure Megatrends Fund: Trustee since June 2021;VanEck Vectors Group of Exchange-Traded Funds: Independent Chairman of the Board of Trustees since 2008 and Trustee since 2006 (57 portfolios); and Berea College of Kentucky: Trustee since 2009, Chair of the Committee since 2018 |
| | Susan B. Kerley
1951 | MainStay VP Funds Trust: Chairman since 2017 and Trustee since 2007* | President, Strategic Management Advisors LLC since 1990 | 78 | MainStay Funds: Chairman since 2017 and Trustee since 2007 (12 Funds); MainStay Funds Trust: Chairman since 2017 and Trustee since 1990 (33 Funds)**;
MainStay MacKay DefinedTerm Municipal Opportunities Fund: Chairman since 2017 and Trustee since 2011; MainStay CBRE Global Infrastructure Megatrends Fund: Trustee since June 2021; and Legg Mason Partners Funds: Trustee since 1991 (45 portfolios) |
| | Alan R. Latshaw
1951 | MainStay VP Funds Trust: Trustee since 2007* | Retired; Partner, Ernst & Young LLP (2002 to 2003); Partner, Arthur Andersen LLP (1989 to 2002); Consultant to the MainStay Funds Audit and Compliance Committee (2004 to 2006) | 78 | MainStay Funds: Trustee since 2006 (12 Funds);
MainStay Funds Trust: Trustee since 2007 (33 Funds)**;
MainStay MacKay DefinedTerm Municipal Opportunities Fund: Trustee since 2011; and
MainStay CBRE Global Infrastructure Megatrends Fund: Trustee since June 2021 |
| 30 | MainStay VP Wellington Growth Portfolio |
| | Name and
Year of Birth | Term of Office,
Position(s) Held and
Length of Service | Principal Occupation(s)
During Past Five Years | Number of
Portfolios in
Fund Complex
Overseen by
Trustee | Other Directorships
Held by Trustee |
| | | | | | |
| | Karen Hammond
1956 | MainStay VP Funds Trust: Trustee since December 2021, Advisory Board Member (June 2021 to December 2021)
| Retired, Managing Director, Devonshire Investors (2007 to 2013); Senior Vice President, Fidelity Management & Research Co. (2005 to 2007); Senior Vice President and Corporate Treasurer, FMR Corp. (2003 to 2005); Chief Operating Officer, Fidelity Investments Japan (2001 to 2003) | 78 | MainStay Funds: Trustee since December 2021, Advisory Board Member (June 2021 to December 2021) (12 Funds);
MainStay Funds Trust: Trustee since December 2021, Advisory Board Member (June 2021 to December 2021) (33 Funds);
MainStay MacKay DefinedTerm Municipal Opportunities Fund: Trustee since December 2021, Advisory Board Member (June 2021 to December 2021);
MainStay CBRE Global Infrastructure Megatrends Fund: Trustee since December 2021, Advisory Board Member (June 2021 to December 2021);
Two Harbors Investment Corp.: Director since 2018; Rhode Island State Investment Commission: Member since 2017; and Blue Cross Blue Shield of Rhode Island: Director since 2019
|
| | Jacques P. Perold
1958 | MainStay VP Funds Trust: Trustee since January 2016, Advisory Board Member (June 2015 to December 2015) | Founder and Chief Executive Officer, CapShift Advisors LLC (since 2018); President, Fidelity Management & Research Company (2009 to 2014); President and Chief Investment Officer, Geode Capital Management, LLC (2001 to 2009) | 78 | MainStay Funds: Trustee since January 2016, Advisory Board Member (June 2015 to December 2015) (12 Funds);
MainStay Funds Trust: Trustee since January 2016, Advisory Board Member (June 2015 to December 2015) (33 Funds); MainStay MacKay DefinedTerm Municipal Opportunities Fund: Trustee since January 2016, Advisory Board Member (June 2015 to December 2015);
MainStay CBRE Global Infrastructure Megatrends Fund: Trustee since June 2021; Allstate Corporation: Director since 2015;
Partners in Health: Trustee since 2019; and
MSCI Inc.: Director since 2017 |
| | Richard S. Trutanic
1952 | MainStay VP Funds Trust: Trustee since 2007* | Chairman and Chief Executive Officer, Somerset & Company (financial advisory firm) since 2004; Managing Director, The Carlyle Group (private investment firm) (2002 to 2004); Senior Managing Director, Partner and Board Member, Groupe Arnault S.A. (private investment firm) (1999 to 2002)
| 78 | MainStay Funds: Trustee since 1994 (12 Funds);
MainStay Funds Trust: Trustee since 2007 (33 Funds)**;
MainStay MacKay DefinedTerm Municipal Opportunities Fund: Trustee since 2011; and
MainStay CBRE Global Infrastructure Megatrends Fund: Trustee since June 2021 |
| * | Includes prior service as a Director of MainStay VP Series Fund, Inc., the predecessor to MainStay VP Funds Trust. |
| ** | Includes prior service as a Director/Trustee of certain predecessor entities to MainStay Funds Trust. |
Board of Trustees and Officers (Unaudited) (continued)
| | Name and
Year of Birth | Position(s) Held and
Length of Service | Principal Occupation(s)
During Past Five Years | |
| | | | | |
| | Kirk C. Lehneis
1974 | President, MainStay VP Funds Trust (since 2017) | Chief Operating Officer and Senior Managing Director (since 2016), New York Life Investment Management LLC and New York Life Investment Management Holdings LLC; Member of the Board of Managers (since 2017) and Senior Managing Director (since 2018), NYLIFE Distributors LLC; Chairman of the Board and Senior Managing Director, NYLIM Service Company LLC (since 2017); Trustee, President and Principal Executive Officer of IndexIQ Trust, IndexIQ ETF Trust and IndexIQ Active ETF Trust (since January 2018); President, MainStay CBRE Global Infrastructure Megatrends Fund (since 2021), MainStay MacKay DefinedTerm Municipal Opportunities Fund, MainStay Funds and MainStay Funds Trust (since 2017); Senior Managing Director, Global Product Development (from 2015-2016); Managing Director, Product Development (from 2010-2015), New York Life Investment Management LLC | |
| | Jack R. Benintende
1964 | Treasurer and Principal Financial and Accounting Officer, MainStay VP Funds Trust (since 2007)** | Managing Director, New York Life Investment Management LLC (since 2007); Treasurer and Principal Financial and Accounting Officer, MainStay CBRE Global Infrastructure Megatrends Fund (since 2021), MainStay MacKay DefinedTerm Municipal Opportunities Fund (since 2011), MainStay Funds Trust (since 2009) and MainStay Funds (since 2007); and Assistant Treasurer, New York Life Investment Management Holdings LLC (2008 to 2012) | |
| | J. Kevin Gao
1967 | Secretary and Chief Legal Officer, MainStay VP Funds Trust (since 2010)** | Managing Director and Associate General Counsel, New York Life Investment Management LLC (since 2010); Secretary and Chief Legal Officer, MainStay CBRE Global Infrastructure Megatrends Fund (since 2021), MainStay MacKay DefinedTerm Municipal Opportunities Fund (since 2011), MainStay Funds and MainStay Funds Trust (since 2010) | |
| | Scott T. Harrington
1959 | Vice President— Administration, MainStay VP Funds Trust (since 2005)** | Managing Director, New York Life Investment Management LLC (including predecessor advisory organizations) (since 2000); Member of the Board of Directors, New York Life Trust Company (since 2009); Vice President—Administration, MainStay CBRE Global Infrastructure Megatrends Fund (since 2021), MainStay MacKay DefinedTerm Municipal Opportunities Fund (since 2011), MainStay Funds Trust and MainStay Funds (since 2009) | |
| | Kevin M. Gleason
1967 | Vice President and Chief Compliance Officer, MainStay VP Funds Trust (since June 2022) | Vice President and Chief Compliance Officer, IndexIQ, IndexIQ ETF Trust and Index IQ Active ETF Trust (since June 2022); Vice President and Chief Compliance Officer, MainStay CBRE Global Infrastructure Megatrends Fund, MainStay MacKay DefinedTerm Municipal Opportunities Fund (since June 2022); MainStay Funds Trust and MainStay Funds (since June 2022); Senior Vice President, Voya Investment Management and Chief Compliance Officer, Voya Family of Funds (2012-2022) | |
| * | The officers listed above are considered to be “interested persons” of the MainStay Group of Funds, MainStay VP Funds Trust, MainStay CBRE Global Infrastructure Megatrends Fund and MainStay MacKay DefinedTerm Municipal Opportunities Fund within the meaning of the 1940 Act because of their affiliation with the MainStay Group of Funds, New York Life Insurance Company and/or its affiliates, including New York Life Investment Management LLC, NYLIM Service Company LLC, NYLIFE Securities LLC and/or NYLIFE Distributors LLC, as described in detail in the column captioned “Principal Occupation(s) During Past Five Years.” Officers are elected annually by the Board. |
| ** | Includes prior service as an Officer of MainStay VP Series Fund, Inc., the predecessor to MainStay VP Funds Trust. |
Officers of the Trust (Who are not Trustees)*
| 32 | MainStay VP Wellington Growth Portfolio |
This page intentionally left blank
This page intentionally left blank.
MainStay VP Portfolios
MainStay VP offers a wide range of Portfolios. The full array of MainStay VP offerings is listed here, with information about the manager, subadvisors, legal counsel, and independent registered public accounting firm.
Equity
MainStay VP American Century Sustainable Equity Portfolio1
MainStay VP Candriam Emerging Markets Equity Portfolio
MainStay VP Epoch U.S. Equity Yield Portfolio
MainStay VP Fidelity Institutional AM® Utilities Portfolio†
MainStay VP MacKay International Equity Portfolio
MainStay VP Natural Resources Portfolio
MainStay VP S&P 500 Index Portfolio2
MainStay VP Small Cap Growth Portfolio
MainStay VP Wellington Growth Portfolio
MainStay VP Wellington Mid Cap Portfolio
MainStay VP Wellington Small Cap Portfolio
MainStay VP Wellington U.S. Equity Portfolio
MainStay VP Winslow Large Cap Growth Portfolio
Mixed Asset
MainStay VP Balanced Portfolio
MainStay VP Income Builder Portfolio
MainStay VP Janus Henderson Balanced Portfolio
MainStay VP MacKay Convertible Portfolio
Income
MainStay VP Bond Portfolio
MainStay VP Floating Rate Portfolio
MainStay VP Indexed Bond Portfolio
MainStay VP MacKay Government Portfolio
MainStay VP MacKay High Yield Corporate Bond Portfolio
MainStay VP MacKay Strategic Bond Portfolio
MainStay VP PIMCO Real Return Portfolio
Money Market
MainStay VP U.S. Government Money Market Portfolio
Alternative
MainStay VP CBRE Global Infrastructure Portfolio
MainStay VP IQ Hedge Multi-Strategy Portfolio
Asset Allocation
MainStay VP Conservative Allocation Portfolio
MainStay VP Equity Allocation Portfolio
MainStay VP Growth Allocation Portfolio
MainStay VP Moderate Allocation Portfolio
Manager
New York Life Investment Management LLC
New York, New York
Subadvisors
American Century Investment Management, Inc.
Kansas City, Missouri
Brown Advisory LLC
Baltimore, Maryland
Candriam*
Strassen, Luxembourg
CBRE Investment Management Listed Real Assets LLC
Radnor, Pennsylvania
Epoch Investment Partners, Inc.
New York, New York
FIAM LLC
Smithfield, Rhode Island
IndexIQ Advisors LLC*
New York, New York
Janus Henderson Investors US LLC
Denver, Colorado
MacKay Shields LLC*
New York, New York
Newton Investment Management North America, LLC
Boston, Massachusetts
NYL Investors LLC*
New York, New York
Pacific Investment Management Company LLC
Newport Beach, California
Segall Bryant & Hamill, LLC
Chicago, Illinois
Wellington Management Company LLP
Boston, Massachusetts
Winslow Capital Management, LLC
Minneapolis, Minnesota
Legal Counsel
Dechert LLP
Washington, District of Columbia
Independent Registered Public Accounting Firm
KPMG LLP
Philadelphia, Pennsylvania
Distributor
NYLIFE Distributors LLC*
Jersey City, New Jersey
Custodian
JPMorgan Chase Bank, N.A.
New York, New York
Some Portfolios may not be available in all products.
† Fidelity Institutional AM is a registered trade mark of FMR LLC. Used with permission.
* An affiliate of New York Life Investment Management LLC.
| 1. | Prior to May 1, 2022, the Portfolio's name was MainStay VP T. Rowe Price Equity Income Portfolio. |
| 2. | Prior to May 1, 2022, the Portfolio's name was MainStay VP MacKay S&P 500 Index Portfolio. |
Not part of the Annual Report
2022 Annual Report
This report is for the general information of New York Life Variable Annuities and NYLIAC Variable Universal Life Insurance Products policyowners. It must be preceded or accompanied by the appropriate product(s) and funds prospectuses if it is given to anyone who is not an owner of a New York Life variable annuity policy or a NYLIAC Variable Universal Life Insurance Product. This report does not offer for sale or solicit orders to purchase securities.
The performance data quoted in this report represents past performance. Past performance is no guarantee of future results. Due to market volatility and other factors, current performance may be lower or higher than the figures shown. The most recent month-end performance summary for your variable annuity or variable life policy is available by calling 800-598-2019 and is updated periodically on newyorklife.com.
The New York Life Variable Annuities and NYLIAC Variable Universal Life Insurance Products are issued by New York Life Insurance and Annuity Corporation (a Delaware Corporation) and distributed by NYLIFE Distributors LLC (Member FINRA/SIPC).
New York Life Insurance Company
New York Life Insurance and Annuity
Corporation (NYLIAC) (A Delaware Corporation)
51 Madison Avenue, Room 551
New York, NY 10010
newyorklife.com
newyorklifeinvestments.com
NYLIFE Distributors LLC, 30 Hudson Street, Jersey City, NJ 07302
New York Life Investment Management LLC is the investment manager to the MainStay VP Funds Trust
©2023 by NYLIFE Distributors LLC. All rights reserved.
You may obtain copies of the Prospectus and the Statement of Additional Information free of charge, upon request, by calling toll-free 800-598-2019 or writing to New York Life Insurance and Annuity Corporation, 51 Madison Avenue, New York, NY 10010.
| Not FDIC Insured | No Bank Guarantee | May Lose Value |
(NYLIAC) NI513
MainStay VP Epoch U.S. Equity Yield Portfolio
Message from the President and Annual Report
December 31, 2022
Sign up for e-delivery of your shareholder reports. For full details on e-delivery, including who can participate and what you can receive via e-delivery,
please log in to newyorklifeinvestments.com/accounts.
| Not FDIC/NCUA Insured | Not a Deposit | May Lose Value | No Bank Guarantee | Not Insured by Any Government Agency |
This page intentionally left blank
Message from the President
The 12-month reporting period ended December 31, 2022, proved exceptionally challenging for investors as both stock and bond markets suffered steep declines. A variety of economic and geopolitical forces drove the market’s losses, all centered around rising inflation and monetary efforts to rein it in.
Inflationary alarms began to sound well before the reporting period began. In late 2021, after nearly two years of accommodative policies designed to encourage economic growth in the face of the COVID-19 pandemic, the U.S. Federal Reserve (the “Fed”) warned of the increasing need to tighten monetary policy. Nevertheless, the pace and persistence of inflation in early 2022 caught most market participants—the Fed included—off guard. Russia’s invasion of Ukraine in February exacerbated global inflationary pressures while increasing investor uncertainty. Domestic supply shortages, international trade imbalances and rising inflation caused U.S. GDP (gross domestic product) to contract in the first and second quarters of the year, although employment and consumer spending proved resilient. Prices for petroleum surged to multi-year highs, while many key agricultural chemicals and industrial metals soared as well. Accelerating inflationary forces prompted the Fed to implement its most aggressive series of interest rate hikes since the 1980s, with a 0.25% increase in March followed by six further rate increases totaling 4.25%. International central banks generally followed suit and raised rates by varying degrees in efforts to curb local inflation, although most increases remained significantly more modest than those in the United States. Relatively high U.S. interest rates and an international risk averse sentiment pushed U.S. dollar values higher compared to most other currencies, with negative impacts on global prices for food, fuel and other key U.S.-dollar-denominated products.
The effects of these interrelated challenges were felt throughout U.S. and international financial markets. The S&P 500® Index, a widely regarded benchmark of market performance, declined by more than 18% during the reporting period. Although the energy sector generated strong gains, bolstered by elevated oil and gas prices, most other industry segments recorded losses. The more cyclical and growth-oriented sectors of consumer discretionary, information technology and real estate delivered the weakest returns, while the traditionally defensive and value-oriented
consumer staples, utilities and health care sectors outperformed. On average, international developed-country equity markets mildly outperformed their U.S. counterparts, while emerging markets lagged slightly. Fixed-income markets proved unusually volatile, with bond prices trending sharply lower as yields rose along with interest rates. Short-term yields rose faster than long-term yields, producing a yield curve inversion from July through the end of the reporting period as long-term rates remained below short-term rates. While floating-rate instruments, which feature variable interest rates that allow investors to benefit from a rising rate environment, provided a degree of insulation from inflation-driven trends, they were not immune to the market’s widespread declines.
Although, according to the most recent estimates, the annualized inflation rate in the United States has declined from a peak of 9.1% in July 2022 to 6.5% in December, the Fed remains focused on achieving more substantial and lasting reductions, aiming for a target rate of 2%. As a result, further rate hikes and additional market volatility are potential headwinds in the coming months. The question remains as to whether the Fed and other central banks will manage a so-called “soft landing,” curbing inflation while avoiding a persistent economic slowdown. If they prove successful, we believe that the increasingly attractive valuations we have observed in both equity and bond markets should eventually translate into sustainable improvements in the investment environment.
Whatever actions the Fed takes and however financial markets react, as a MainStay VP investor you can depend on us to continue managing our portfolios with the insight, expertise and level of service that have long defined New York Life Investments. Thank you for trusting us to help you meet your investment needs.
Sincerely,
Kirk C. Lehneis
President
The opinions expressed are as of the date of this report and are subject to change. There is no guarantee that any forecast made will come to pass. This material does not constitute investment advice and is not intended as an endorsement of any specific investment. Past performance is no guarantee of future results.
Not part of the Annual Report
Investors should refer to the Portfolio’s Summary Prospectus and/or Prospectus and consider the Portfolio’s investment objectives, strategies, risks, charges and expenses carefully before investing. The Summary Prospectus and/or Prospectus contain this and other information about the Portfolio. You may obtain copies of the Portfolio’s Summary Prospectus, Prospectus and Statement of Additional Information, which includes information about the MainStay VP Funds Trust's Trustees, free of charge, upon request, by calling toll-free 800-598-2019, by writing to New York Life Insurance and Annuity Corporation, 51 Madison Avenue, Room 251, New York, New York 10010 or by sending an email to MainStayShareholdersServices@nylim.com. These documents are also available at newyorklifeinvestments.com/investment-products/vp. Please read the Portfolio's Summary Prospectus and/or Prospectus carefully before investing. MainStay VP Funds Trust portfolios are separate account options which are purchased through a variable insurance or variable annuity contract.
Investment and Performance Comparison (Unaudited)
Performance data quoted represents past performance. Past performance is no guarantee of future results. Because of market volatility and other factors, current performance may be lower or higher than the figures shown. Investment return and principal value will fluctuate, and as a result, when shares are redeemed, they may be worth more or less than their original cost. The performance table and graph do not reflect any deduction of sales charges, mortality and expense charges, contract charges or administrative charges. Please refer to the Performance Summary appropriate for your policy. For performance information current to the most recent month-end, please call 800-598-2019 or visit www.newyorklife.com.
Performance figures may reflect certain fee waivers and/or expense limitations, without which total returns may have been different. For information on current fee waivers and/or expense limitations (if any), please refer to the Notes to Financial Statements.
| Average Annual Total Returns for the Year-Ended December 31, 2022 |
| Class | Inception
Date1 | One
Year | Five
Years | Ten
Years | Gross
Expense
Ratio2 |
| Initial Class Shares | 5/1/1998 | -2.50% | 7.12% | 9.13% | 0.72% |
| Service Class Shares | 6/5/2003 | -2.74 | 6.85 | 8.86 | 0.97 |
| 1. | Effective January 9, 2017, the Portfolio replaced its subadvisor and modified its principal investment as of March 13, 2017. The past performance in the graph and table prior to those dates reflects the Portfolio’s prior subadvisor and principal investment strategies. |
| 2. | The gross expense ratios presented reflect the Portfolio’s “Total Annual Portfolio Operating Expenses” from the most recent Prospectus and may differ from other expense ratios disclosed in this report. |
| Benchmark Performance* | One
Year | Five
Years | Ten
Years |
| Russell 1000® Value Index1 | -7.54% | 6.67% | 10.29% |
| U.S. Equity Yield Composite Index2 | -6.61 | 7.03 | 10.73 |
| Morningstar Large Value Category Average3 | -6.02 | 6.81 | 9.86 |
| * | Returns for indices reflect no deductions for fees, expenses or taxes, except for foreign withholding taxes where applicable. Results assume reinvestment of all dividends and capital gains. An investment cannot be made directly in an index. |
| 1. | The Portfolio has selected the Russell 1000® Value Index as its primary benchmark. The Russell 1000® Value Index measures the performance of the large-cap value segment of the U.S. equity universe. It includes those Russell 1000® Index companies with lower price-to-book ratios and lower expected growth values. |
| 2. | The Portfolio has selected the U.S. Equity Yield Composite Index as its secondary benchmark. The U.S. Equity Yield Composite Index consists of the MSCI USA High Dividend Yield Index and the MSCI USA Minimum Volatility (USD) Index weighted at 60% and 40%, respectively. The MSCI USA High Dividend Yield Index is based on the MSCI USA Index and includes large and mid-cap stocks. The MSCI USA High Dividend Yield Index is designed to reflect the performance of equities in the MSCI USA Index (excluding real estate investment trusts) with higher dividend income and quality characteristics than average dividend yields that are both sustainable and persistent. The MSCI USA Minimum Volatility (USD) Index aims to reflect the performance characteristics of a minimum variance strategy applied to the large and mid-cap USA equity universe. The MSCI USA Minimum Volatility (USD) Index is calculated by optimizing the MSCI USA Index in USD for the lowest absolute risk (within a given set of constraints). |
| 3. | The Morningstar Large Value Category Average is representative of funds that invest primarily in big U.S. companies that are less expensive or growing more slowly than other large-cap stocks. Results are based on average total returns of similar funds with all dividends and capital gain distributions reinvested. |
Cost in Dollars of a $1,000 Investment in MainStay VP Epoch U.S. Equity Yield Portfolio (Unaudited)
The example below is intended to describe the fees and expenses borne by shareholders during the six-month period from July 1, 2022 to December 31, 2022, and the impact of those costs on your investment.
Example
As a shareholder of the Portfolio you incur two types of costs: (1) transaction costs, including exchange fees and sales charges (loads) on purchases (as applicable), and (2) ongoing costs, including management fees, distribution and/or service (12b-1) fees and other Portfolio expenses (as applicable). This example is intended to help you understand your ongoing costs (in dollars) of investing in the Portfolio and to compare these costs with the ongoing costs of investing in other mutual funds. The example is based on an investment of $1,000 made at the beginning of the six-month period and held for the entire period from July 1, 2022 to December 31, 2022. Shares are only sold in connection with variable life and annuity contracts and the example does not reflect any contract level or transactional fees or expenses. If these costs had been included, your costs would have been higher.
This example illustrates your Portfolio’s ongoing costs in two ways:
Actual Expenses
The second and third data columns in the table below provide information about actual account values and actual expenses. You may use the information in these columns, together with the amount you invested, to estimate the expenses that you paid during the six months ended
December 31, 2022. Simply divide your account value by $1,000 (for example, an $8,600 account value divided by $1,000 = 8.6), then multiply the result by the number under the heading entitled “Expenses Paid During Period” to estimate the expenses you paid on your account during this period.
Hypothetical Example for Comparison Purposes
The fourth and fifth data columns in the table below provide information about hypothetical account values and hypothetical expenses based on the Portfolio’s actual expense ratio and an assumed rate of return of 5% per year before expenses, which is not the Portfolio’s actual return. The hypothetical account values and expenses may not be used to estimate the actual ending account balances or expenses you paid for the six-month period shown. You may use this information to compare the ongoing costs of investing in the Portfolio with the ongoing costs of investing in other mutual funds. To do so, compare this 5% hypothetical example with the 5% hypothetical examples that appear in the shareholder reports of the other mutual funds.
Please note that the expenses shown in the table are meant to highlight your ongoing costs only and do not reflect any transactional costs, such as exchange fees or sales charges (loads). Therefore, the fourth and fifth data columns of the table are useful in comparing ongoing costs only and will not help you determine the relative total costs of owning different funds. In addition, if these transactional costs were included, your costs would have been higher.
| Share Class | Beginning
Account
Value
7/1/22 | Ending Account
Value (Based
on Actual
Returns and
Expenses)
12/31/22 | Expenses
Paid
During
Period1 | Ending Account
Value (Based
on Hypothetical
5% Annualized
Return and
Actual Expenses)
12/31/22 | Expenses
Paid
During
Period1 | Net Expense
Ratio
During
Period2 |
| Initial Class Shares | $1,000.00 | $1,064.30 | $3.54 | $1,021.78 | $3.47 | 0.68% |
| Service Class Shares | $1,000.00 | $1,062.90 | $4.84 | $1,020.52 | $4.74 | 0.93% |
| 1. | Expenses are equal to the Portfolio’s annualized expense ratio of each class multiplied by the average account value over the period, divided by 365 and multiplied by 184 (to reflect the six-month period). The table above represents the actual expenses incurred during the six-month period. In addition to the fees and expenses which the Portfolio bears directly, it also indirectly bears a pro rata share of the fees and expenses of the underlying funds in which it invests. Such indirect expenses are not included in the above-reported expense figures. |
| 2. | Expenses are equal to the Portfolio's annualized expense ratio to reflect the six-month period. |
| 6 | MainStay VP Epoch U.S. Equity Yield Portfolio |
Industry Composition as of December 31, 2022 (Unaudited)
| Banks | 9.7% |
| Electric Utilities | 6.8 |
| Pharmaceuticals | 6.5 |
| Semiconductors & Semiconductor Equipment | 5.8 |
| Insurance | 5.8 |
| Oil, Gas & Consumable Fuels | 5.8 |
| Chemicals | 5.0 |
| Equity Real Estate Investment Trusts | 4.0 |
| Electrical Equipment | 3.9 |
| Health Care Providers & Services | 3.4 |
| Biotechnology | 3.2 |
| Aerospace & Defense | 3.1 |
| IT Services | 2.4 |
| Beverages | 2.4 |
| Capital Markets | 2.4 |
| Multi–Utilities | 2.2 |
| Household Products | 2.2 |
| Media | 2.1 |
| Hotels, Restaurants & Leisure | 2.0 |
| Tobacco | 1.9 |
| Machinery | 1.8% |
| Health Care Equipment & Supplies | 1.6 |
| Food & Staples Retailing | 1.6 |
| Software | 1.6 |
| Diversified Telecommunication Services | 1.5 |
| Specialty Retail | 1.3 |
| Communications Equipment | 1.3 |
| Leisure Products | 1.2 |
| Air Freight & Logistics | 1.2 |
| Technology Hardware, Storage & Peripherals | 1.1 |
| Industrial Conglomerates | 1.1 |
| Commercial Services & Supplies | 1.0 |
| Trading Companies & Distributors | 0.9 |
| Containers & Packaging | 0.7 |
| Household Durables | 0.6 |
| Short–Term Investment | 0.8 |
| Other Assets, Less Liabilities | 0.1 |
| | 100.0% |
See Portfolio of Investments beginning on page 11 for specific holdings within these categories. The Portfolio's holdings are subject to change.
Top Ten Holdings and/or Issuers Held as of December 31, 2022 (excluding short-term investments) (Unaudited)
| 1. | AbbVie, Inc. |
| 2. | Chevron Corp. |
| 3. | MetLife, Inc. |
| 4. | UnitedHealth Group, Inc. |
| 5. | Broadcom, Inc. |
| 6. | JPMorgan Chase & Co. |
| 7. | Merck & Co., Inc. |
| 8. | Johnson & Johnson |
| 9. | U.S. Bancorp |
| 10. | Cummins, Inc. |
Portfolio Management Discussion and Analysis (Unaudited)
Answers to the questions reflect the views of portfolio managers Michael A. Welhoelter, CFA, William W. Priest, CFA, John M. Tobin, PhD, CFA, and Kera Van Valen, CFA, of Epoch Investment Partners, Inc. (“Epoch”), the Portfolio’s Subadvisor.
How did MainStay VP Epoch U.S. Equity Yield Portfolio perform relative to its benchmarks and peers during the 12 months ended December 31, 2022?
For the 12 months ended December 31, 2022, MainStay VP Epoch U.S. Equity Yield Portfolio returned −2.50% for Initial Class shares and −2.74% for Service Class shares. Over the same period, both share classes outperformed the −7.54% return of the Russell 1000® Value Index, which is the Portfolio’s primary benchmark, and the −6.61% return of the U.S. Equity Yield Composite Index, which is the Portfolio’s secondary benchmark. For the 12 months ended December 31, 2022, both share classes also outperformed the −6.02% return of the Morningstar Large Value Category Average.1
During the reporting period, were there any market events that materially impacted the Portfolio’s performance or liquidity?
For equity markets, 2022 was a period characterized by change and challenges. The year saw markets primarily ruled by three major influences: inflation, monetary tightening and war in Ukraine. As the Covid-19 pandemic that monopolized investors' focus for two years finally began to fade from headlines, all eyes turned toward the impending economic aftershocks of COVID-19 lockdowns and global stimulus. Inflation, fueled by a rapid snapback in demand and fragmented global supply chains, proved far from "transitory," and as prices trended upward, the specter of looming rate hikes saw the start of the year permeated by risk-averse sentiment. Price multiples contracted rapidly as investors sought to better position themselves for monetary tightening, driving a broad rotation from growth to value that extended throughout the year. Valuations for long-duration growth stocks, which had been the largest beneficiaries of the preceding decade of abundant liquidity, were especially challenged. We believe the Portfolio delivered very good downside participation and performed in line with expectations given the volatile and challenging market landscape.
What factors affected the Portfolio’s relative performance during the reporting period?
The year began on a volatile note as investors' exuberance from December 2021 shifted to caution when the prospects for, and then the reality of, tightening monetary policy and supply-chain constraints fueled a challenging start to the year. Those challenges were quickly exacerbated by Russia’s invasion of Ukraine in February. The war's threat to geopolitical stability in Europe and economic sanctions imposed by Western nations on Russia weighed on investor sentiment. Markets turned positive in March despite surging prices in energy and other commodities which aggravated concerns about inflation, along with the
announcement by the U.S. Federal Reserve (the “Fed”) of its first interest rate hike since 2018. We believe the Portfolio showed resilience in a turbulent market and provided some downside participation for the first quarter of the year as low exposure to market sensitivity and volatility was a tailwind, and as dividend yielding stocks held up relatively well.
The markets and the Portfolio continued to be challenged as the year progressed, with persistent inflation, rising interest rates and supply-chain issues remaining headwinds. A Consumer Price Index (“CPI”) report in May showing reaccelerating inflation resulted in the Fed’s largest rate hike in almost thirty years, and slowing global growth became a concern that undermined investor sentiment. The Portfolio produced strong relative performance in the second quarter, bolstered by stock selection in financials and industrials. At the same time, the Portfolio provided significant downside participation in the quarter, helped by its low exposure to beta2 and volatility.
The market rallied in July and the first part of August as more risk-tolerant sentiment was triggered by speculation that inflation might be peaking, potentially prompting the Fed to move away from front-loading rate hikes. Stronger-than-expected earnings from large technology companies led the market. While the Portfolio provided a degree of upside participation during this surge, dividend stocks were not rewarded, and the Portfolio's low beta dragged on relative return. The second half of August and September were marked by risk-averse sentiment as the Fed made it clear that monetary conditions would remain tight until inflation was under control. This caused the market to reverse course and sell off for the balance of the quarter. While the Portfolio was resilient on the downside in September, it lagged the Russell 1000® Value Index for the quarter due to underperformance during the July rally.
Shifting market sentiment regarding the Fed's messaging on interest rates and inflation drove market behavior during the last part of the year. After the market pullback in September, markets raced higher in October as another challenging CPI report, coupled with slowing growth evidenced by disappointing third quarter earnings, fueled a strong value rotation, with investors placing a higher premium on strong company fundamentals. The Portfolio largely kept pace with the Index in October as the market rose by nearly 10%. Markets and the Portfolio rose again in November, as indications emerged that the Fed would slow the pace of rate increases, and as inflation eased more than expected. The final month of the year was challenging for markets, despite the Fed's decision to reduce the pace of rate hikes and a better-than-expected November CPI report. Overall, we believe that the Portfolio provided very good upside participation during the October and November rallies, performing
| 1. | See page 5 for more information on benchmark and peer group returns. |
| 2. | Beta is a measure of volatility in relation to the market as a whole. A beta higher than 1 indicates that a security or portfolio will tend to exhibit higher volatility than the market. A beta lower than 1 indicates that a security or portfolio will tend to exhibit lower volatility than the market. |
| 8 | MainStay VP Epoch U.S. Equity Yield Portfolio |
in-line with the Index, and resilience on the downside during December's pullback, to outpace the broad market for the last quarter of the year.
Which sectors were the strongest positive contributors to the Portfolio’s relative performance, and which sectors were particularly weak?
During the reporting period, the strongest positive sector contribution to the Portfolio’s performance relative to the Russell 1000® Value Index came from industrials, driven primarily by favorable stock selection. (Contributions take weightings and total returns into account.) The communication services sector provided the next-largest contribution, driven by an underweight allocation and stock selection. Information technology made the third-largest contribution, due to stock selection. Conversely, energy provided the weakest contribution to the Portfolio’s relative performance, driven by stock selection and an underweight allocation. Consumer discretionary was the next most significant detractor, driven by an overweight allocation. The financials sector also hurt results, though to a more modest degree.
During the reporting period, which individual stocks made the strongest positive contributions to the Portfolio’s absolute performance and which stocks detracted the most?
The strongest positive contributions to the Portfolio’s absolute performance came from positions in integrated oil & gas company Chevron and global pharmaceutical companies Merck and AbbVie.
Chevron shares outperformed after the OPEC+ group of oil-producing nations decided in early October 2022 to cut production to reduce supply. A tight refining market also helped the shares. The company's integrated business model, geographic and product diversification, strong balance sheet, and continued efforts to manage costs and improve capital efficiencies allow Chevron to generate sustainable cash flow through commodity price cycles. Additionally, the company returns cash to shareholders via an attractive and growing dividend and share buyback program using excess free cash flow.
Merck shares trended generally higher, outperforming peers in the pharmaceutical industry as well as the overall market, supported by a favorable third-quarter 2022 earnings report and positive news flow. Earnings reflected continued strong growth in Merck's successful cancer drug, Keytruda, and for the HPV vaccine, Gardasil. Encouraging headlines included positive phase 3 trial results for cardiovascular drug sotatercept, and a European Union recommendation for approval of Lynparza (co-developed with AstraZeneca) for prostate cancer. In addition, Merck incrementally increased its pipeline of oncology drugs with two clinical
collaboration agreements (with IO Biotech and Portage Biotech) and a bolt-on acquisition3 (Imago Biosciences). Finally, the company announced a dividend increase. Merck pays an attractive and growing dividend, which is well-covered by free cash flow, and regularly repurchases shares.
AbbVie shares traded higher in the fourth quarter of 2022, modestly outperforming peers in the pharmaceutical industry as well as the overall market, helped by a favorable third quarter earnings report and positive news flow. The earnings report indicated strong revenue growth in key immunology drugs Skyrizi and Rinvoq. Positive news flow included regulatory approvals in the United States and Europe for Rinvoq, Skyrizi, and Imbruvica in new therapeutic indications. Significantly, pharmacy benefit manager Optum Rx reported that Humira, AbbVie's successful immunology drug, will remain in their formulary alongside new biosimilars when the biosimilars enter the market in 2023. This announcement allayed concerns about the possibility of rapid market share loss to biosimilars. In addition, both Moody's and S&P credit rating services upgraded AbbVie's debt rating. AbbVie is committed to distributing cash to shareholders via an attractive, growing and well-covered dividend, share repurchases, and reduction of debt related to the company’s 2020 Allergan acquisition.
The most significant detractors from the Portfolio’s absolute returns included global play and entertainment company Hasbro, medical device maker Medtronic, and general merchandise retailer Target.
Hasbro shares underperformed throughout the year, with most of the underperformance occurring in the second half of 2022. Sentiment through much of the third quarter was negatively affected by the fear that retailers—some hindered by lower working capital—would not purchase as much inventory as previously planned, and that the end consumer would also reduce spending over the key holiday period. In the fourth quarter, shares were further impacted by news of the longtime chief financial officer’s retirement and a broker downgrade. Looking ahead, we believe Hasbro's opportunities to align its toy and media assets, reduce costs and grow its gaming segment will allow the company to continue expanding margins and returning capital to shareholders through an attractive dividend and debt repayment.
Medtronic shares outperformed the broader market through the first ten months of the 2022 but lagged materially in November when the market rallied. The catalyst for the underperformance late in the year was the release of a disappointing earnings report indicating that the company continued to face pandemic-related headwinds, including ongoing supply-chain issues, input cost pressures and procedure volumes that, in some areas, remained below pre-COVID-19 levels. We view these challenges as
| 3. | A bolt-on acquisition is the acquisition of a smaller company, usually in the same line of business, that presents strategic value to the acquiring entity. The smaller company is generally merged into a division of the acquiring entity. |
temporary macro headwinds and believe financial performance will improve going forward. We also note that cash flow generation has continued to comfortably cover the company’s dividend (which was increased by 8% in May) as well as share repurchases. Medtronic produces a broad portfolio of medical devices, serving multiple therapeutic areas, that it sells to a global customer base. The company has a track record of innovation, a promising development pipeline, and has returned capital to shareholders through a consistently growing dividend and regular share repurchases, with a minimum combined payout of 50% of free cash flow.
Target’s shares came under pressure as the second-quarter 2022 earnings season progressed and it became clear that general merchandise retailers as a group had accumulated excessive levels of inventory and were likely to see continued deterioration in metrics, including inventory days, gross margin and cash flow growth. Given Target’s heavy reliance on general merchandise sales, we think the company will be challenged for some time and decided to close the Portfolio’s position.
Did the Portfolio make any significant purchases or sales during the reporting period?
The Portfolio initiated multiple positions during the reporting period, with regional bank KeyCorp and enterprise network storage solutions provider NetApp among the largest. In our opinion, KeyCorp’s valuable, low-cost deposit franchise, diversified loan portfolio and well-capitalized balance sheet should allow the company to earn mid-teens returns on equity on a mid-cycle basis. KeyCorp has a history of returning capital to shareholders through consistent dividends and share buybacks, and we believe the company's high dividend coverage and attractive current and prospective shareholder yield make the shares a strong investment opportunity. NetApp is a provider of network storage for enterprises, including on-premises, cloud and hybrid solutions. NetApp’s growth is driven by a combination of an overall increase in data storage needs, an increased need for better tools to manage data storage complexity and increasing market share, as alternatives to on-premises solutions grow in importance. We believe these trends position NetApp to outgrow the industry, delivering mid-single-digit operating cash flow growth. The company has returned the majority of its free cash flow to shareholders, split between a dividend and share repurchases, while targeting the remaining cash toward tuck-in acquisitions.
The most notable positions closed during the reporting period included utility Dominion Energy and apparel maker Hanesbrands. One of the largest utility companies in the United States, Dominion is focused on investing in regulated growth, driven by the need to
improve transmission and distribution infrastructure and to generate electricity from renewable sources. We believe the company’s undertaking of a sizeable offshore wind project is likely to lead to a heavier debt burden on its balance sheet and possibly more equity issuance. We closed the position to fund other shareholder yield opportunities. Hanesbrands produces activewear and underwear for Hanes, Champion, Bali, and other labels. Approximately 75% of revenue is earned in the United States from sales into mass retailers and department stores, as well as direct-to-consumer channels. We closed the position in the expectation that persistently deteriorating traffic trends at some of Hanesbrands’ wholesale partners would negatively impact the company’s ability to return capital to shareholders.
How did the Portfolio’s sector weightings change during the reporting period?
The Portfolio's most significant sector allocation changes during the reporting period were increases in energy and industrials, and decreases in consumer staples and information technology. The Portfolio’s sector allocations are a result of our bottom-up fundamental investment process and reflect the companies and securities that we confidently believe can collect and distribute sustainable, growing shareholder yield potential.
How was the Portfolio positioned at the end of the reporting period?
As of December 31, 2022, the Portfolio held its most overweight allocations relative to the Russell 1000® Value Index in the information technology and utilities sectors. The Portfolio's most underweight allocations were in the communications services and energy sectors. These positions, in terms of sector allocations, are an outcome of our bottom-up fundamental investment process and reflect where we find opportunities in which we are confident in our ability to collect sustainable, growing shareholder yield potential.
The opinions expressed are those of the portfolio managers as of the date of this report and are subject to change. There is no guarantee that any forecasts will come to pass. This material does not constitute investment advice and is not intended as an endorsement of any specific investment.
Not all MainStay VP Portfolios and/or share classes are available under all policies.
| 10 | MainStay VP Epoch U.S. Equity Yield Portfolio |
Portfolio of Investments December 31, 2022†
| | Shares | Value |
| Common Stocks 99.1% |
| Aerospace & Defense 3.1% |
| General Dynamics Corp. | 32,103 | $ 7,965,075 |
| Lockheed Martin Corp. | 18,706 | 9,100,282 |
| Raytheon Technologies Corp. | 122,988 | 12,411,949 |
| | | 29,477,306 |
| Air Freight & Logistics 1.2% |
| United Parcel Service, Inc., Class B | 63,731 | 11,078,997 |
| Banks 9.7% |
| Bank of America Corp. | 478,383 | 15,844,045 |
| Columbia Banking System, Inc. | 250,953 | 7,561,214 |
| JPMorgan Chase & Co. | 143,632 | 19,261,051 |
| KeyCorp | 778,646 | 13,564,013 |
| PNC Financial Services Group, Inc. (The) | 58,839 | 9,293,032 |
| Truist Financial Corp. | 219,141 | 9,429,637 |
| U.S. Bancorp | 391,863 | 17,089,146 |
| | | 92,042,138 |
| Beverages 2.4% |
| Coca-Cola Co. (The) | 119,688 | 7,613,354 |
| Coca-Cola Europacific Partners plc | 156,655 | 8,666,155 |
| PepsiCo, Inc. | 36,464 | 6,587,586 |
| | | 22,867,095 |
| Biotechnology 3.2% |
| AbbVie, Inc. | 146,406 | 23,660,674 |
| Amgen, Inc. | 25,917 | 6,806,841 |
| | | 30,467,515 |
| Capital Markets 2.4% |
| BlackRock, Inc. | 11,567 | 8,196,723 |
| CME Group, Inc. | 25,618 | 4,307,923 |
| Lazard Ltd., Class A | 144,159 | 4,997,992 |
| T. Rowe Price Group, Inc. | 43,963 | 4,794,605 |
| | | 22,297,243 |
| Chemicals 5.0% |
| Air Products and Chemicals, Inc. | 28,509 | 8,788,184 |
| Dow, Inc. | 143,372 | 7,224,515 |
| Linde plc | 36,919 | 12,042,240 |
| LyondellBasell Industries NV, Class A | 77,668 | 6,448,774 |
| Nutrien Ltd. (a) | 67,486 | 4,928,503 |
| PPG Industries, Inc. | 67,107 | 8,438,034 |
| | | 47,870,250 |
| Commercial Services & Supplies 1.0% |
| Republic Services, Inc. | 35,601 | 4,592,173 |
| | Shares | Value |
| |
| Commercial Services & Supplies (continued) |
| Waste Management, Inc. | 30,235 | $ 4,743,267 |
| | | 9,335,440 |
| Communications Equipment 1.3% |
| Cisco Systems, Inc. | 248,858 | 11,855,595 |
| Containers & Packaging 0.7% |
| Amcor plc | 552,032 | 6,574,701 |
| Diversified Telecommunication Services 1.5% |
| AT&T, Inc. | 323,663 | 5,958,636 |
| Verizon Communications, Inc. | 201,073 | 7,922,276 |
| | | 13,880,912 |
| Electric Utilities 6.8% |
| Alliant Energy Corp. | 94,137 | 5,197,304 |
| American Electric Power Co., Inc. | 163,064 | 15,482,927 |
| Duke Energy Corp. | 49,538 | 5,101,919 |
| Entergy Corp. | 93,161 | 10,480,612 |
| Evergy, Inc. | 138,394 | 8,709,134 |
| Eversource Energy | 75,431 | 6,324,135 |
| NextEra Energy, Inc. | 157,072 | 13,131,219 |
| | | 64,427,250 |
| Electrical Equipment 3.9% |
| Eaton Corp. plc | 92,061 | 14,448,974 |
| Emerson Electric Co. | 167,330 | 16,073,720 |
| Hubbell, Inc. | 26,907 | 6,314,535 |
| | | 36,837,229 |
| Equity Real Estate Investment Trusts 4.0% |
| American Tower Corp. | 25,836 | 5,473,615 |
| Iron Mountain, Inc. | 254,205 | 12,672,119 |
| Realty Income Corp. | 89,984 | 5,707,685 |
| Welltower, Inc. | 83,268 | 5,458,217 |
| WP Carey, Inc. | 112,796 | 8,815,008 |
| | | 38,126,644 |
| Food & Staples Retailing 1.6% |
| Walmart, Inc. | 105,429 | 14,948,778 |
| Health Care Equipment & Supplies 1.6% |
| Medtronic plc | 200,334 | 15,569,959 |
| Health Care Providers & Services 3.4% |
| CVS Health Corp. | 133,113 | 12,404,800 |
| UnitedHealth Group, Inc. | 38,009 | 20,151,612 |
| | | 32,556,412 |
The notes to the financial statements are an integral part of, and should be read in conjunction with, the financial statements.
11
Portfolio of Investments December 31, 2022† (continued)
| | Shares | Value |
| Common Stocks (continued) |
| Hotels, Restaurants & Leisure 2.0% |
| McDonald's Corp. | 39,801 | $ 10,488,758 |
| Vail Resorts, Inc. | 37,147 | 8,853,987 |
| | | 19,342,745 |
| Household Durables 0.6% |
| Leggett & Platt, Inc. | 186,615 | 6,014,601 |
| Household Products 2.2% |
| Colgate-Palmolive Co. | 61,475 | 4,843,615 |
| Kimberly-Clark Corp. | 41,157 | 5,587,063 |
| Procter & Gamble Co. (The) | 67,940 | 10,296,986 |
| | | 20,727,664 |
| Industrial Conglomerates 1.1% |
| Honeywell International, Inc. | 48,116 | 10,311,259 |
| Insurance 5.8% |
| Arthur J. Gallagher & Co. | 73,307 | 13,821,302 |
| Marsh & McLennan Cos., Inc. | 44,845 | 7,420,950 |
| MetLife, Inc. | 279,860 | 20,253,468 |
| Travelers Cos., Inc. (The) | 69,922 | 13,109,676 |
| | | 54,605,396 |
| IT Services 2.4% |
| Automatic Data Processing, Inc. | 25,238 | 6,028,349 |
| International Business Machines Corp. | 81,575 | 11,493,102 |
| Paychex, Inc. | 48,410 | 5,594,259 |
| | | 23,115,710 |
| Leisure Products 1.2% |
| Hasbro, Inc. | 193,802 | 11,823,860 |
| Machinery 1.8% |
| Cummins, Inc. | 70,178 | 17,003,428 |
| Media 2.1% |
| Comcast Corp., Class A | 297,865 | 10,416,339 |
| Omnicom Group, Inc. | 117,906 | 9,617,592 |
| | | 20,033,931 |
| Multi-Utilities 2.2% |
| Ameren Corp. | 68,131 | 6,058,208 |
| CMS Energy Corp. | 76,616 | 4,852,091 |
| NiSource, Inc. | 197,195 | 5,407,087 |
| WEC Energy Group, Inc. | 53,160 | 4,984,282 |
| | | 21,301,668 |
| | Shares | Value |
| |
| Oil, Gas & Consumable Fuels 5.8% |
| Chevron Corp. | 118,949 | $ 21,350,156 |
| Enterprise Products Partners LP | 523,155 | 12,618,498 |
| Magellan Midstream Partners LP | 141,656 | 7,112,548 |
| MPLX LP | 219,640 | 7,212,978 |
| TotalEnergies SE, Sponsored ADR | 113,222 | 7,028,822 |
| | | 55,323,002 |
| Pharmaceuticals 6.5% |
| Eli Lilly and Co. | 39,299 | 14,377,146 |
| Johnson & Johnson | 103,940 | 18,361,001 |
| Merck & Co., Inc. | 167,653 | 18,601,100 |
| Pfizer, Inc. | 199,869 | 10,241,288 |
| | | 61,580,535 |
| Semiconductors & Semiconductor Equipment 5.8% |
| Analog Devices, Inc. | 92,355 | 15,148,991 |
| Broadcom, Inc. | 34,738 | 19,423,058 |
| KLA Corp. | 33,885 | 12,775,661 |
| Texas Instruments, Inc. | 47,519 | 7,851,089 |
| | | 55,198,799 |
| Software 1.6% |
| Microsoft Corp. | 61,683 | 14,792,817 |
| Specialty Retail 1.3% |
| Home Depot, Inc. (The) | 39,801 | 12,571,544 |
| Technology Hardware, Storage & Peripherals 1.1% |
| Apple, Inc. | 45,442 | 5,904,279 |
| NetApp, Inc. | 82,832 | 4,974,890 |
| | | 10,879,169 |
| Tobacco 1.9% |
| British American Tobacco plc, Sponsored ADR | 123,357 | 4,931,813 |
| Philip Morris International, Inc. | 132,158 | 13,375,711 |
| | | 18,307,524 |
| Trading Companies & Distributors 0.9% |
| MSC Industrial Direct Co., Inc., Class A | 98,593 | 8,055,048 |
Total Common Stocks
(Cost $770,625,189) | | 941,202,164 |
The notes to the financial statements are an integral part of, and should be read in conjunction with, the financial statements.
| 12 | MainStay VP Epoch U.S. Equity Yield Portfolio |
| | Shares | | Value |
| Short-Term Investment 0.8% |
| Affiliated Investment Company 0.8% |
| MainStay U.S. Government Liquidity Fund, 3.602% (b) | 7,380,137 | | $ 7,380,137 |
Total Short-Term Investment
(Cost $7,380,137) | | | 7,380,137 |
Total Investments
(Cost $778,005,326) | 99.9% | | 948,582,301 |
| Other Assets, Less Liabilities | 0.1 | | 1,264,486 |
| Net Assets | 100.0% | | $ 949,846,787 |
| † | Percentages indicated are based on Portfolio net assets. |
| (a) | All or a portion of this security was held on loan. As of December 31, 2022, the aggregate market value of securities on loan was $4,928,430. The market value of the collateral held included non-cash collateral in the form of U.S. Treasury securities with a value of $5,049,934. (See Note 2(H)) |
| (b) | Current yield as of December 31, 2022. |
Investments in Affiliates (in 000's)
Investments in issuers considered to be affiliate(s) of the Portfolio during the year ended December 31, 2022 for purposes of Section 2(a)(3) of the Investment Company Act of 1940, as amended, were as follows:
| Affiliated Investment Companies | Value,
Beginning
of Year | Purchases
at Cost | Proceeds
from
Sales | Net
Realized
Gain/(Loss)
on Sales | Change in
Unrealized
Appreciation/
(Depreciation) | Value,
End of
Year | Dividend
Income | Other
Distributions | Shares
End of
Year |
| MainStay U.S. Government Liquidity Fund | $ 9,626 | $ 146,844 | $ (149,090) | $ — | $ — | $ 7,380 | $ 176 | $ — | 7,380 |
| Abbreviation(s): |
| ADR—American Depositary Receipt |
The following is a summary of the fair valuations according to the inputs used as of December 31, 2022, for valuing the Portfolio’s assets:
| Description | Quoted
Prices in
Active
Markets for
Identical
Assets
(Level 1) | | Significant
Other
Observable
Inputs
(Level 2) | | Significant
Unobservable
Inputs
(Level 3) | | Total |
| Asset Valuation Inputs | | | | | | | |
| Investments in Securities (a) | | | | | | | |
| Common Stocks | $ 941,202,164 | | $ — | | $ — | | $ 941,202,164 |
| Short-Term Investment | | | | | | | |
| Affiliated Investment Company | 7,380,137 | | — | | — | | 7,380,137 |
| Total Investments in Securities | $ 948,582,301 | | $ — | | $ — | | $ 948,582,301 |
| (a) | For a complete listing of investments and their industries, see the Portfolio of Investments. |
The notes to the financial statements are an integral part of, and should be read in conjunction with, the financial statements.
13
Statement of Assets and Liabilities as of December 31, 2022
| Assets |
Investment in unaffiliated securities, at value
(identified cost $770,625,189) including securities on loan of $4,928,430 | $941,202,164 |
Investment in affiliated investment companies, at value
(identified cost $7,380,137) | 7,380,137 |
| Receivables: | |
| Dividends | 1,956,215 |
| Portfolio shares sold | 152,231 |
| Securities lending | 811 |
| Other assets | 4,787 |
| Total assets | 950,696,345 |
| Liabilities |
| Due to custodian | 9,964 |
| Payables: | |
| Manager (See Note 3) | 544,718 |
| Portfolio shares redeemed | 122,531 |
| NYLIFE Distributors (See Note 3) | 88,631 |
| Professional fees | 36,583 |
| Shareholder communication | 34,275 |
| Custodian | 5,433 |
| Accrued expenses | 7,423 |
| Total liabilities | 849,558 |
| Net assets | $949,846,787 |
| Composition of Net Assets |
| Shares of beneficial interest outstanding (par value of $.001 per share) unlimited number of shares authorized | $ 56,785 |
| Additional paid-in-capital | 704,485,405 |
| | 704,542,190 |
| Total distributable earnings (loss) | 245,304,597 |
| Net assets | $949,846,787 |
| Initial Class | |
| Net assets applicable to outstanding shares | $539,761,863 |
| Shares of beneficial interest outstanding | 32,042,351 |
| Net asset value per share outstanding | $ 16.85 |
| Service Class | |
| Net assets applicable to outstanding shares | $410,084,924 |
| Shares of beneficial interest outstanding | 24,742,407 |
| Net asset value per share outstanding | $ 16.57 |
The notes to the financial statements are an integral part of, and should be read in conjunction with, the financial statements.
| 14 | MainStay VP Epoch U.S. Equity Yield Portfolio |
Statement of Operations for the year ended December 31, 2022
| Investment Income (Loss) |
| Income | |
| Dividends-unaffiliated (net of foreign tax withholding of $235,182) | $ 27,596,899 |
| Dividends-affiliated | 175,797 |
| Securities lending, net | 21,081 |
| Other | 315 |
| Total income | 27,794,092 |
| Expenses | |
| Manager (See Note 3) | 6,819,259 |
| Distribution/Service—Service Class (See Note 3) | 1,052,815 |
| Professional fees | 116,335 |
| Shareholder communication | 49,984 |
| Custodian | 29,272 |
| Trustees | 21,057 |
| Miscellaneous | 27,336 |
| Total expenses before waiver/reimbursement | 8,116,058 |
| Expense waiver/reimbursement from Manager (See Note 3) | (339,333) |
| Net expenses | 7,776,725 |
| Net investment income (loss) | 20,017,367 |
| Realized and Unrealized Gain (Loss) |
| Net realized gain (loss) on: | |
| Unaffiliated investment transactions | 59,958,026 |
| Foreign currency transactions | 1,174 |
| Net realized gain (loss) | 59,959,200 |
| Net change in unrealized appreciation (depreciation) on unaffiliated investments | (109,365,957) |
| Net realized and unrealized gain (loss) | (49,406,757) |
| Net increase (decrease) in net assets resulting from operations | $ (29,389,390) |
The notes to the financial statements are an integral part of, and should be read in conjunction with, the financial statements.
15
Statements of Changes in Net Assets
for the years ended December 31, 2022 and December 31, 2021
| | 2022 | 2021 |
| Increase (Decrease) in Net Assets |
| Operations: | | |
| Net investment income (loss) | $ 20,017,367 | $ 19,274,214 |
| Net realized gain (loss) | 59,959,200 | 55,301,596 |
| Net change in unrealized appreciation (depreciation) | (109,365,957) | 129,641,555 |
| Net increase (decrease) in net assets resulting from operations | (29,389,390) | 204,217,365 |
| Distributions to shareholders: | | |
| Initial Class | (24,054,585) | (14,032,271) |
| Service Class | (17,626,723) | (9,739,276) |
| Total distributions to shareholders | (41,681,308) | (23,771,547) |
| Capital share transactions: | | |
| Net proceeds from sales of shares | 75,116,545 | 119,905,528 |
| Net asset value of shares issued to shareholders in reinvestment of distributions | 41,681,308 | 23,771,547 |
| Cost of shares redeemed | (198,345,383) | (138,903,490) |
| Increase (decrease) in net assets derived from capital share transactions | (81,547,530) | 4,773,585 |
| Net increase (decrease) in net assets | (152,618,228) | 185,219,403 |
| Net Assets |
| Beginning of year | 1,102,465,015 | 917,245,612 |
| End of year | $ 949,846,787 | $1,102,465,015 |
The notes to the financial statements are an integral part of, and should be read in conjunction with, the financial statements.
| 16 | MainStay VP Epoch U.S. Equity Yield Portfolio |
Financial Highlights selected per share data and ratios
| | Year Ended December 31, |
| Initial Class | 2022 | | 2021 | | 2020 | | 2019 | | 2018 |
| Net asset value at beginning of year | $ 18.15 | | $ 15.13 | | $ 16.12 | | $ 14.01 | | $ 16.15 |
| Net investment income (loss) (a) | 0.37 | | 0.34 | | 0.35 | | 0.38 | | 0.39 |
| Net realized and unrealized gain (loss) | (0.90) | | 3.09 | | (0.41) | | 2.92 | | (1.12) |
| Total from investment operations | (0.53) | | 3.43 | | (0.06) | | 3.30 | | (0.73) |
| Less distributions: | | | | | | | | | |
| From net investment income | (0.37) | | (0.41) | | (0.41) | | (0.52) | | (0.35) |
| From net realized gain on investments | (0.40) | | — | | (0.52) | | (0.67) | | (1.06) |
| Total distributions | (0.77) | | (0.41) | | (0.93) | | (1.19) | | (1.41) |
| Net asset value at end of year | $ 16.85 | | $ 18.15 | | $ 15.13 | | $ 16.12 | | $ 14.01 |
| Total investment return (b) | (2.50)% | | 22.89% | | 0.03% | | 24.18% | | (5.23)% |
| Ratios (to average net assets)/Supplemental Data: | | | | | | | | | |
| Net investment income (loss) | 2.13% | | 2.02% | | 2.47% | | 2.43% | | 2.49% |
| Net expenses (c) | 0.68% | | 0.68% | | 0.68% | | 0.68% | | 0.68% |
| Expenses (before waiver/reimbursement) (c) | 0.71% | | 0.72% | | 0.73% | | 0.72% | | 0.71% |
| Portfolio turnover rate | 19% | | 20% | | 26% | | 22% | | 25% |
| Net assets at end of year (in 000's) | $ 539,762 | | $ 640,585 | | $ 495,193 | | $ 591,185 | | $ 548,881 |
| (a) | Per share data based on average shares outstanding during the year. |
| (b) | Total return does not reflect any deduction of sales charges, mortality and expense charges, contract charges or administrative charges. For periods of less than one year, total return is not annualized. |
| (c) | In addition to the fees and expenses which the Portfolio bears directly, it also indirectly bears a pro-rata share of the fees and expenses of the underlying funds in which it invests. Such indirect expenses are not included in the above expense ratios. |
| | Year Ended December 31, |
| Service Class | 2022 | | 2021 | | 2020 | | 2019 | | 2018 |
| Net asset value at beginning of year | $ 17.86 | | $ 14.90 | | $ 15.89 | | $ 13.81 | | $ 15.94 |
| Net investment income (loss) (a) | 0.32 | | 0.29 | | 0.31 | | 0.34 | | 0.35 |
| Net realized and unrealized gain (loss) | (0.88) | | 3.05 | | (0.42) | | 2.88 | | (1.12) |
| Total from investment operations | (0.56) | | 3.34 | | (0.11) | | 3.22 | | (0.77) |
| Less distributions: | | | | | | | | | |
| From net investment income | (0.33) | | (0.38) | | (0.36) | | (0.47) | | (0.30) |
| From net realized gain on investments | (0.40) | | — | | (0.52) | | (0.67) | | (1.06) |
| Total distributions | (0.73) | | (0.38) | | (0.88) | | (1.14) | | (1.36) |
| Net asset value at end of year | $ 16.57 | | $ 17.86 | | $ 14.90 | | $ 15.89 | | $ 13.81 |
| Total investment return (b) | (2.74)% | | 22.58% | | (0.22)% | | 23.87% | | (5.46)% |
| Ratios (to average net assets)/Supplemental Data: | | | | | | | | | |
| Net investment income (loss) | 1.89% | | 1.77% | | 2.21% | | 2.18% | | 2.23% |
| Net expenses (c) | 0.93% | | 0.93% | | 0.93% | | 0.93% | | 0.93% |
| Expenses (before waiver/reimbursement) (c) | 0.96% | | 0.97% | | 0.98% | | 0.97% | | 0.96% |
| Portfolio turnover rate | 19% | | 20% | | 26% | | 22% | | 25% |
| Net assets at end of year (in 000's) | $ 410,085 | | $ 461,880 | | $ 422,053 | | $ 460,793 | | $ 431,635 |
| (a) | Per share data based on average shares outstanding during the year. |
| (b) | Total return does not reflect any deduction of sales charges, mortality and expense charges, contract charges or administrative charges. For periods of less than one year, total return is not annualized. |
| (c) | In addition to the fees and expenses which the Portfolio bears directly, it also indirectly bears a pro-rata share of the fees and expenses of the underlying funds in which it invests. Such indirect expenses are not included in the above expense ratios. |
The notes to the financial statements are an integral part of, and should be read in conjunction with, the financial statements.
17
Notes to Financial Statements
Note 1–Organization and Business
MainStay VP Funds Trust (the “Fund”) was organized as a Delaware statutory trust on February 1, 2011. The Fund is registered under the Investment Company Act of 1940, as amended (the “1940 Act”), as an open-end management investment company. The Fund is comprised of thirty-one separate series (collectively referred to as the “Portfolios”). These financial statements and notes relate to the MainStay VP Epoch U.S. Equity Yield Portfolio (the "Portfolio"), a "diversified” portfolio, as that term is defined in the 1940 Act, as interpreted or modified by regulatory authorities having jurisdiction, from time to time.
Shares of the Portfolio are currently offered to certain separate accounts to fund variable annuity policies and variable universal life insurance policies issued by New York Life Insurance and Annuity Corporation (“NYLIAC”), a wholly-owned subsidiary of New York Life Insurance Company (“New York Life”) and may also be offered to fund variable annuity policies and variable universal life insurance policies issued by other insurance companies. NYLIAC allocates shares of the Portfolio to, among others, certain NYLIAC separate accounts. Shares of the Portfolio are also offered to the MainStay VP Conservative Allocation Portfolio, MainStay VP Moderate Allocation Portfolio, MainStay VP Growth Allocation Portfolio and MainStay VP Equity Allocation Portfolio, which operate as “funds-of-funds," and other variable insurance funds.
The following table lists the Portfolio's share classes that have been registered and commenced operations:
| Class | Commenced Operations |
| Initial Class | May 1, 1998 |
| Service Class | June 5, 2003 |
Shares of the Portfolio are offered and are redeemed at a price equal to their respective net asset value (“NAV”) per share. No sales or redemption charge is applicable to the purchase or redemption of the Portfolio's shares. Under the terms of the Fund’s multiple class plan, adopted pursuant to Rule 18f-3 under the 1940 Act, the classes differ in that, among other things, Service Class shares of the Portfolio pay a combined distribution and service fee of 0.25% of average daily net assets attributable to Service Class shares of the Portfolio to the Distributor (as defined in Note 3(B)) pursuant to a plan adopted in accordance with Rule 12b-1 under the 1940 Act. Contract owners of variable annuity contracts purchased after June 2, 2003, are permitted to invest only in the Service Class shares.
The Portfolio's investment objective is to seek current income and capital appreciation.
Note 2–Significant Accounting Policies
The Portfolio is an investment company and accordingly follows the investment company accounting and reporting guidance of the Financial Accounting Standards Board (“FASB”) Accounting Standards Codification Topic 946 Financial Services—Investment Companies. The Portfolio prepares its financial statements in accordance with generally accepted
accounting principles (“GAAP”) in the United States of America and follows the significant accounting policies described below.
(A) Securities Valuation. Investments are usually valued as of the close of regular trading on the New York Stock Exchange (the "Exchange") (usually 4:00 p.m. Eastern time) on each day the Portfolio is open for business ("valuation date").
Effective September 8, 2022, and pursuant to Rule 2a-5 under the 1940 Act, the Board of Trustees of the Fund (the "Board") designated New York Life Investment Management LLC (“New York Life Investments” or the "Manager") as its Valuation Designee (the "Valuation Designee"). The Valuation Designee is responsible for performing fair valuations relating to all investments in the Portfolio’s portfolio for which market quotations are not readily available; periodically assessing and managing material valuation risks; establishing and applying fair value methodologies; testing fair valuation methodologies; evaluating and overseeing pricing services; ensuring appropriate segregation of valuation and portfolio management functions; providing quarterly, annual and prompt reporting to the Board, as appropriate; identifying potential conflicts of interest; and maintaining appropriate records. The Valuation Designee has established a valuation committee ("Valuation Committee") to assist in carrying out the Valuation Designee’s responsibilities and establish prices of securities for which market quotations are not readily available. The Portfolio’s and the Valuation Designee's policies and procedures ("Valuation Procedures") govern the Valuation Designee’s selection and application of methodologies for determining and calculating the fair value of Portfolio investments. The Valuation Designee may value the Portfolio's portfolio securities for which market quotations are not readily available and other Portfolio assets utilizing inputs from pricing services and other third-party sources (together, “Pricing Sources”). The Valuation Committee meets (in person, via electronic mail or via teleconference) on an ad-hoc basis to determine fair valuations and on a quarterly basis to review fair value events with respect to certain securities for which market quotations are not readily available, including valuation risks and back-testing results, and preview reports to the Board.
The Valuation Committee establishes prices of securities for which market quotations are not readily available based on such methodologies and measurements on a regular basis after considering information that is reasonably available and deemed relevant by the Valuation Committee. The Board shall oversee the Valuation Designee and review fair valuation materials on a prompt, quarterly and annual basis and approve proposed revisions to the Valuation Procedures.
Investments for which market quotations are not readily available are valued at fair value as determined in good faith pursuant to the Valuation Procedures. A market quotation is readily available only when that quotation is a quoted price (unadjusted) in active markets for identical investments that the Portfolio can access at the measurement date, provided that a quotation will not be readily available if it is not reliable. "Fair value" is defined as the price the Portfolio would reasonably expect to receive upon selling an asset or liability in an orderly transaction to an independent buyer in the principal or most advantageous market for the
| 18 | MainStay VP Epoch U.S. Equity Yield Portfolio |
asset or liability. Fair value measurements are determined within a framework that establishes a three-tier hierarchy that maximizes the use of observable market data and minimizes the use of unobservable inputs to establish a classification of fair value measurements for disclosure purposes. "Inputs" refer broadly to the assumptions that market participants would use in pricing the asset or liability, including assumptions about risk, such as the risk inherent in a particular valuation technique used to measure fair value using a pricing model and/or the risk inherent in the inputs for the valuation technique. Inputs may be observable or unobservable. Observable inputs reflect the assumptions market participants would use in pricing the asset or liability based on market data obtained from sources independent of the Portfolio. Unobservable inputs reflect the Portfolio’s own assumptions about the assumptions market participants would use in pricing the asset or liability based on the information available. The inputs or methodology used for valuing assets or liabilities may not be an indication of the risks associated with investing in those assets or liabilities. The three-tier hierarchy of inputs is summarized below.
| • | Level 1—quoted prices (unadjusted) in active markets for an identical asset or liability |
| • | Level 2—other significant observable inputs (including quoted prices for a similar asset or liability in active markets, interest rates and yield curves, prepayment speeds, credit risk, etc.) |
| • | Level 3—significant unobservable inputs (including the Portfolio's own assumptions about the assumptions that market participants would use in measuring fair value of an asset or liability) |
The level of an asset or liability within the fair value hierarchy is based on the lowest level of an input, both individually and in the aggregate, that is significant to the fair value measurement. The aggregate value by input level of the Portfolio’s assets and liabilities as of December 31, 2022, is included at the end of the Portfolio of Investments.
The Portfolio may use third-party vendor evaluations, whose prices may be derived from one or more of the following standard inputs, among others:
| • Broker/dealer quotes | • Benchmark securities |
| • Two-sided markets | • Reference data (corporate actions or material event notices) |
| • Bids/offers | • Monthly payment information |
| • Industry and economic events | • Reported trades |
An asset or liability for which a market quotation is not readily available is valued by methods deemed reasonable in good faith by the Valuation Committee, following the Valuation Procedures to represent fair value. Under these procedures, the Valuation Designee generally uses a market-based approach which may use related or comparable assets or liabilities, recent transactions, market multiples, book values and other relevant information. The Valuation Designee may also use an income-based valuation approach in which the anticipated future cash flows of the asset or liability are discounted to calculate fair value.
Discounts may also be applied due to the nature and/or duration of any restrictions on the disposition of the asset or liability. Fair value represents a good faith approximation of the value of a security. Fair value determinations involve the consideration of a number of subjective factors, an analysis of applicable facts and circumstances and the exercise of judgment. As a result, it is possible that the fair value for a security determined in good faith in accordance with the Valuation Procedures may differ from valuations for the same security determined for other funds using their own valuation procedures. Although the Valuation Procedures are designed to value a security at the price the Portfolio may reasonably expect to receive upon the security's sale in an orderly transaction, there can be no assurance that any fair value determination thereunder would, in fact, approximate the amount that the Portfolio would actually realize upon the sale of the security or the price at which the security would trade if a reliable market price were readily available. During the year ended December 31, 2022, there were no material changes to the fair value methodologies.
Securities which may be valued in this manner include, but are not limited to: (i) a security for which trading has been halted or suspended or otherwise does not have a readily available market quotation on a given day; (ii) a debt security that has recently gone into default and for which there is not a current market quotation; (iii) a security of an issuer that has entered into a restructuring; (iv) a security that has been delisted from a national exchange; (v) a security subject to trading collars for which no or limited trading takes place; and (vi) a security whose principal market has been temporarily closed at a time when, under normal conditions, it would be open. Securities valued in this manner are generally categorized as Level 2 or 3 in the hierarchy.
Equity securities are valued at the last quoted sales prices as of the close of regular trading on the relevant exchange on each valuation date. Securities that are not traded on the valuation date are valued at the mean of the last quoted bid and ask prices. Prices are normally taken from the principal market in which each security trades. These securities are generally categorized as Level 1 in the hierarchy.
Investments in mutual funds, including money market funds, are valued at their respective NAVs at the close of business each day on the valuation date. These securities are generally categorized as Level 1 in the hierarchy.
Temporary cash investments acquired in excess of 60 days to maturity at the time of purchase are valued using the latest bid prices or using valuations based on a matrix system (which considers such factors as security prices, yields, maturities and ratings), both as furnished by independent pricing services. Temporary cash investments that mature in 60 days or less at the time of purchase ("Short-Term Investments") are valued using the amortized cost method of valuation, unless the use of such method would be inappropriate. The amortized cost method involves valuing a security at its cost on the date of purchase and thereafter assuming a constant amortization to maturity of the difference between such cost and the value on maturity date. Amortized cost approximates the current fair value of a security. Securities valued using the amortized
Notes to Financial Statements (continued)
cost method are not valued using quoted prices in an active market and are generally categorized as Level 2 in the hierarchy.
The information above is not intended to reflect an exhaustive list of the methodologies that may be used to value portfolio investments. The Valuation Procedures permit the use of a variety of valuation methodologies in connection with valuing portfolio investments. The methodology used for a specific type of investment may vary based on the market data available or other considerations. The methodologies summarized above may not represent the specific means by which portfolio investments are valued on any particular business day.
(B) Income Taxes. The Portfolio's policy is to comply with the requirements of the Internal Revenue Code of 1986, as amended (the “Internal Revenue Code”), applicable to regulated investment companies and to distribute all of its taxable income to the shareholders of the Portfolio within the allowable time limits.
The Manager evaluates the Portfolio’s tax positions to determine if the tax positions taken meet the minimum recognition threshold in connection with accounting for uncertainties in income tax positions taken or expected to be taken for the purposes of measuring and recognizing tax liabilities in the financial statements. Recognition of tax benefits of an uncertain tax position is permitted only to the extent the position is “more likely than not” to be sustained assuming examination by taxing authorities. The Manager analyzed the Portfolio's tax positions taken on federal, state and local income tax returns for all open tax years (for up to three tax years) and has concluded that no provisions for federal, state and local income tax are required in the Portfolio's financial statements. The Portfolio's federal, state and local income tax and federal excise tax returns for tax years for which the applicable statutes of limitations have not expired are subject to examination by the Internal Revenue Service and state and local departments of revenue.
(C) Dividends and Distributions to Shareholders. Dividends and distributions are recorded on the ex-dividend date. The Portfolio intends to declare and pay dividends from net investment income and distributions from net realized capital and currency gains, if any, at least annually. All dividends and distributions are reinvested at NAV in the same class of shares of the Portfolio. Dividends and distributions to shareholders are determined in accordance with federal income tax regulations and may differ from determinations using GAAP.
(D) Security Transactions and Investment Income. The Portfolio records security transactions on the trade date. Realized gains and losses on security transactions are determined using the identified cost method. Dividend income is recognized on the ex-dividend date, net of any foreign tax withheld at the source, and interest income is accrued as earned using the effective interest rate method. Distributions received from real estate investment trusts may be classified as dividends, capital gains and/or return of capital.
Investment income and realized and unrealized gains and losses on investments of the Portfolio are allocated pro rata to the separate classes
of shares based upon their relative net assets on the date the income is earned or realized and unrealized gains and losses are incurred.
(E) Expenses. Expenses of the Fund are allocated to the individual Portfolios in proportion to the net assets of the respective Portfolios when the expenses are incurred, except where direct allocations of expenses can be made. Expenses (other than fees incurred under the distribution and service plans, further discussed in Note 3(B), which are charged directly to the Service Class shares) are allocated to separate classes of shares pro rata based upon their relative net assets on the date the expenses are incurred. The expenses borne by the Portfolio, including those of related parties to the Portfolio, are shown in the Statement of Operations.
Additionally, the Portfolio may invest in mutual funds, which are subject to management fees and other fees that may cause the costs of investing in mutual funds to be greater than the costs of owning the underlying securities directly. These indirect expenses of mutual funds are not included in the amounts shown as expenses in the Statement of Operations or in the expense ratios included in the Financial Highlights.
(F) Use of Estimates. In preparing financial statements in conformity with GAAP, the Manager makes estimates and assumptions that affect the reported amounts and disclosures in the financial statements. Actual results could differ from those estimates and assumptions.
(G) Foreign Currency Transactions. The Portfolio's books and records are maintained in U.S. dollars. Prices of securities denominated in foreign currency amounts are translated into U.S. dollars at the mean between the buying and selling rates last quoted by any major U.S. bank at the following dates:
(i) market value of investment securities, other assets and liabilities— at the valuation date; and
(ii) purchases and sales of investment securities, income and expenses—at the date of such transactions.
The assets and liabilities that are denominated in foreign currency amounts are presented at the exchange rates and market values at the close of the period. The realized and unrealized changes in net assets arising from fluctuations in exchange rates and market prices of securities are not separately presented.
Net realized gain (loss) on foreign currency transactions represents net currency gains or losses realized as a result of differences between the amounts of securities sale proceeds or purchase cost, dividends, interest and withholding taxes as recorded on the Portfolio's books, and the U.S. dollar equivalent amount actually received or paid. Net currency gains or losses from valuing such foreign currency denominated assets and liabilities, other than investments at valuation date exchange rates, are reflected in unrealized foreign exchange gains or losses.
(H) Securities Lending. In order to realize additional income, the Portfolio may engage in securities lending, subject to the limitations set forth in the 1940 Act and relevant guidance by the staff of the Securities
| 20 | MainStay VP Epoch U.S. Equity Yield Portfolio |
and Exchange Commission (“SEC”). If the Portfolio engages in securities lending, the Portfolio will lend through its custodian, JPMorgan Chase Bank, N.A., ("JPMorgan"), acting as securities lending agent on behalf of the Portfolio. Under the current arrangement, JPMorgan will manage the Portfolio's collateral in accordance with the securities lending agency agreement between the Portfolio and JPMorgan, and indemnify the Portfolio against counterparty risk. The loans will be collateralized by cash (which may be invested in a money market fund) and/or non-cash collateral (which may include U.S. Treasury securities and/or U.S. government agency securities issued or guaranteed by the United States government or its agencies or instrumentalities) at least equal at all times to the market value of the securities loaned. Non-cash collateral held at year end is segregated and cannot be transferred by the Portfolio. The Portfolio bears the risk of delay in recovery of, or loss of rights in, the securities loaned. The Portfolio may also record a realized gain or loss on securities deemed sold due to a borrower’s inability to return securities on loan. The Portfolio bears the risk of any loss on investment of cash collateral. The Portfolio will receive compensation for lending its securities in the form of fees or it will retain a portion of interest earned on the investment of any cash collateral. The Portfolio will also continue to receive interest and dividends on the securities loaned and any gain or loss in the market price of the securities loaned that may occur during the term of the loan will be for the account of the Portfolio. Income earned from securities lending activities, if any, is reflected in the Statement of Operations. Securities on loan as of December 31, 2022, are shown in the Portfolio of Investments.
(I) Indemnifications. Under the Fund’s organizational documents, its officers and trustees are indemnified against certain liabilities that may arise out of performance of their duties to the Fund. Additionally, in the normal course of business, the Portfolio enters into contracts with third-party service providers that contain a variety of representations and warranties and that may provide general indemnifications. The Portfolio's maximum exposure under these arrangements is unknown, as this would involve future claims that may be made against the Portfolio that have not yet occurred. The Manager believes that the risk of loss in connection with these potential indemnification obligations is remote. However, there can be no assurance that material liabilities related to such obligations will not arise in the future, which could adversely impact the Portfolio.
Note 3–Fees and Related Party Transactions
(A) Manager and Subadvisor. New York Life Investments, a registered investment adviser and an indirect, wholly-owned subsidiary of New York Life, serves as the Portfolio's Manager, pursuant to an Amended and Restated Management Agreement (“Management Agreement”). The Manager provides offices, conducts clerical, recordkeeping and bookkeeping services and keeps most of the financial and accounting records required to be maintained by the Portfolio. Except for the portion of salaries and expenses that are the responsibility of the Portfolio, the Manager pays the salaries and expenses of all personnel affiliated with the Portfolio and certain operational expenses of the Portfolio. During a portion of the year ended December 31, 2022, the Portfolio reimbursed
New York Life Investments in an amount equal to the portion of the compensation of the Chief Compliance Officer attributable to the Portfolio. Epoch Investment Partners, Inc. (“Epoch” or the “Subadvisor”), a registered investment adviser, serves as the Subadvisor to the Portfolio and is responsible for the day-to-day portfolio management of the Portfolio. Pursuant to the terms of an Amended and Restated Subadvisory Agreement between New York Life Investments and Epoch, New York Life Investments pays for the services of the Subadvisor.
Pursuant to the Management Agreement, the Fund pays the Manager, on behalf of the Portfolio, a monthly fee for the services performed and the facilities furnished at an annual rate of the Portfolio's average daily net assets as follows: 0.70% up to $500 million; 0.68% from $500 million to $1 billion; 0.66% from $1 billion to $2 billion; and 0.65% in excess of $2 billion. During the year ended December 31, 2022, the effective management fee rate was 0.69% (exclusive of any applicable waivers/reimbursements).
New York Life Investments has contractually agreed to waive fees and/or reimburse expenses so that Total Annual Portfolio Operating Expenses (excluding taxes, interest, litigation, extraordinary expenses, brokerage and other transaction expenses relating to the purchase or sale of portfolio investments and acquired (underlying) portfolio/fund fees and expenses) of Service Class shares do not exceed 0.93% of its average daily net assets. New York Life Investments will apply an equivalent waiver or reimbursement to Initial Class shares. This agreement will remain in effect until May 1, 2023, and shall renew automatically for one-year terms unless New York Life Investments provides written notice of termination prior to the start of the next term or upon approval of the Board.
During the year ended December 31, 2022, New York Life Investments earned fees from the Portfolio in the amount of $6,819,259 and waived fees and/or reimbursed expenses in the amount of $339,333 and paid the Subadvisor fees of $3,239,963.
JPMorgan provides sub-administration and sub-accounting services to the Portfolio pursuant to an agreement with New York Life Investments. These services include calculating the daily NAVs of the Portfolio, maintaining the general ledger and sub-ledger accounts for the calculation of the Portfolio's NAVs, and assisting New York Life Investments in conducting various aspects of the Portfolio's administrative operations. For providing these services to the Portfolio, JPMorgan is compensated by New York Life Investments.
Pursuant to an agreement between the Fund and New York Life Investments, New York Life Investments is responsible for providing or procuring certain regulatory reporting services for the Portfolio. The Portfolio will reimburse New York Life Investments for the actual costs incurred by New York Life Investments in connection with providing or procuring these services for the Portfolio.
(B) Distribution and Service Fees. The Fund, on behalf of the Portfolio, has entered into a distribution agreement with NYLIFE Distributors LLC (the “Distributor”), an affiliate of New York Life
Notes to Financial Statements (continued)
Investments. The Portfolio has adopted a distribution plan (the “Plan”) in accordance with the provisions of Rule 12b-1 under the 1940 Act. Under the Plan, the Distributor has agreed to provide, through its affiliates or independent third parties, various distribution-related, shareholder and administrative support services to the Service Class shareholders. For its services, the Distributor is entitled to a combined distribution and service fee accrued daily and paid monthly at an annual rate of 0.25% of the average daily net assets attributable to the Service Class shares of the Portfolio.
Note 4-Federal Income Tax
As of December 31, 2022, the cost and unrealized appreciation (depreciation) of the Portfolio’s investment portfolio, including applicable derivative contracts and other financial instruments, as determined on a federal income tax basis, were as follows:
| | Federal Tax
Cost | Gross
Unrealized
Appreciation | Gross
Unrealized
(Depreciation) | Net
Unrealized
Appreciation/
(Depreciation) |
| Investments in Securities | $783,821,245 | $196,270,393 | $(31,509,337) | $164,761,056 |
As of December 31, 2022, the components of accumulated gain (loss) on a tax basis were as follows:
Ordinary
Income | Accumulated
Capital
and Other
Gain (Loss) | Other
Temporary
Differences | Unrealized
Appreciation
(Depreciation) | Total
Accumulated
Gain (Loss) |
| $22,567,053 | $57,685,823 | $290,665 | $164,761,056 | $245,304,597 |
The difference between book-basis and tax-basis unrealized appreciation (depreciation) is primarily due to wash sale adjustments, and partnership adjustments. The other temporary differences are primarily due to deferred dividends from real estate investment trusts ("REITs").
During the years ended December 31, 2022 and December 31, 2021, the tax character of distributions paid as reflected in the Statements of Changes in Net Assets was as follows:
| | 2022 | 2021 |
| Distributions paid from: | | |
| Ordinary Income | $19,553,373 | $23,771,547 |
| Long-Term Capital Gains | 22,127,935 | — |
| Total | $41,681,308 | $23,771,547 |
Note 5–Custodian
JPMorgan is the custodian of cash and securities held by the Portfolio. Custodial fees are charged to the Portfolio based on the Portfolio's net assets and/or the market value of securities held by the Portfolio and the number of certain transactions incurred by the Portfolio.
Note 6–Line of Credit
The Portfolio and certain other funds managed by New York Life Investments maintain a line of credit with a syndicate of banks in order to secure a source of funds for temporary purposes to meet unanticipated or excessive redemption requests.
Effective July 26, 2022, under the credit agreement (the “Credit Agreement”), the aggregate commitment amount is $600,000,000 with an additional uncommitted amount of $100,000,000. The commitment fee is an annual rate of 0.15% of the average commitment amount payable quarterly, regardless of usage, to JPMorgan, who serves as the agent to the syndicate. The commitment fee is allocated among the Portfolio and certain other funds managed by New York Life Investments based upon their respective net assets and other factors. Interest on any revolving credit loan is charged based upon the Federal Funds Rate, Daily Simple Secured Overnight Financing Rate ("SOFR") + 0.10%, or the Overnight Bank Funding Rate, whichever is higher. The Credit Agreement expires on July 25, 2023, although the Portfolio, certain other funds managed by New York Life Investments and the syndicate of banks may renew the Credit Agreement for an additional year on the same or different terms or enter into a credit agreement with a different syndicate of banks. Prior to July 26, 2022, the aggregate commitment amount and the commitment fee were the same as those under the current Credit Agreement. During the year ended December 31, 2022, there were no borrowings made or outstanding with respect to the Portfolio under the Credit Agreement.
Note 7–Interfund Lending Program
Pursuant to an exemptive order issued by the SEC, the Portfolio, along with certain other funds managed by New York Life Investments, may participate in an interfund lending program. The interfund lending program provides an alternative credit facility that permits the Portfolio and certain other funds managed by New York Life Investments to lend or borrow money for temporary purposes directly to or from one another, subject to the conditions of the exemptive order. During the year ended December 31, 2022, there were no interfund loans made or outstanding with respect to the Portfolio.
Note 8–Purchases and Sales of Securities (in 000’s)
During the year ended December 31, 2022, purchases and sales of securities, other than short-term securities, were $188,913 and $288,788, respectively.
Note 9–Capital Share Transactions
Transactions in capital shares for the years ended December 31, 2022 and December 31, 2021, were as follows:
| 22 | MainStay VP Epoch U.S. Equity Yield Portfolio |
| Initial Class | Shares | Amount |
| Year ended December 31, 2022: | | |
| Shares sold | 1,806,350 | $ 31,122,708 |
| Shares issued to shareholders in reinvestment of distributions | 1,580,024 | 24,054,585 |
| Shares redeemed | (6,640,134) | (115,275,069) |
| Net increase (decrease) | (3,253,760) | $ (60,097,776) |
| Year ended December 31, 2021: | | |
| Shares sold | 5,530,435 | $ 94,089,547 |
| Shares issued to shareholders in reinvestment of distributions | 822,245 | 14,032,271 |
| Shares redeemed | (3,793,315) | (62,560,476) |
| Net increase (decrease) | 2,559,365 | $ 45,561,342 |
| |
| Service Class | Shares | Amount |
| Year ended December 31, 2022: | | |
| Shares sold | 2,619,444 | $ 43,993,837 |
| Shares issued to shareholders in reinvestment of distributions | 1,176,110 | 17,626,723 |
| Shares redeemed | (4,908,892) | (83,070,314) |
| Net increase (decrease) | (1,113,338) | $ (21,449,754) |
| Year ended December 31, 2021: | | |
| Shares sold | 1,557,270 | $ 25,815,981 |
| Shares issued to shareholders in reinvestment of distributions | 579,460 | 9,739,276 |
| Shares redeemed | (4,609,938) | (76,343,014) |
| Net increase (decrease) | (2,473,208) | $ (40,787,757) |
Note 10–Other Matters
As of the date of this report, interest rates in the United States and many parts of the world, including certain European countries, are ascending from historically low levels. Thus, the Portfolio currently faces a heightened level of risk associated with rising interest rates. This could be driven by a variety of factors, including but not limited to central bank monetary policies, changing inflation or real growth rates, general economic conditions, increasing bond issuances or reduced market demand for low yielding investments.
An outbreak of COVID-19, first detected in December 2019, has developed into a global pandemic and has resulted in travel restrictions, closure of international borders, certain businesses and securities markets, restrictions on securities trading activities, prolonged quarantines, supply chain disruptions, and lower consumer demand, as well as general concern and uncertainty. In 2022, many countries lifted some or all restrictions related to COVID-19. However, the continued impact of COVID-19 and related variants is uncertain and could further adversely affect the global economy, national economies, individual issuers and capital markets in unforeseeable ways and result in a substantial and extended economic downturn. Developments that disrupt global economies and financial markets, such as COVID-19, may magnify factors that affect the Portfolio's performance.
Note 11–Subsequent Events
In connection with the preparation of the financial statements of the Portfolio as of and for the year ended December 31, 2022, events and transactions subsequent to December 31, 2022, through the date the financial statements were issued have been evaluated by the Manager for possible adjustment and/or disclosure. No subsequent events requiring financial statement adjustment or disclosure have been identified.
Report of Independent Registered Public Accounting Firm
To the Board of Trustees of MainStay VP Funds Trust and Shareholders of
MainStay VP Epoch U.S. Equity Yield Portfolio
Opinion on the Financial Statements
We have audited the accompanying statement of assets and liabilities, including the portfolio of investments, of MainStay VP Epoch U.S. Equity Yield Portfolio (one of the portfolios constituting MainStay VP Funds Trust, referred to hereafter as the “Portfolio”) as of December 31, 2022, the related statement of operations for the year ended December 31, 2022, the statements of changes in net assets for each of the two years in the period ended December 31, 2022, including the related notes, and the financial highlights for each of the five years in the period ended December 31, 2022 (collectively referred to as the “financial statements”). In our opinion, the financial statements present fairly, in all material respects, the financial position of the Portfolio as of December 31, 2022, the results of its operations for the year then ended, the changes in its net assets for each of the two years in the period ended December 31, 2022 and the financial highlights for each of the five years in the period ended December 31, 2022 in conformity with accounting principles generally accepted in the United States of America.
Basis for Opinion
These financial statements are the responsibility of the Portfolio’s management. Our responsibility is to express an opinion on the Portfolio’s financial statements based on our audits. We are a public accounting firm registered with the Public Company Accounting Oversight Board (United States) (PCAOB) and are required to be independent with respect to the Portfolio in accordance with the U.S. federal securities laws and the applicable rules and regulations of the Securities and Exchange Commission and the PCAOB.
We conducted our audits of these financial statements in accordance with the standards of the PCAOB. Those standards require that we plan and perform the audit to obtain reasonable assurance about whether the financial statements are free of material misstatement, whether due to error or fraud.
Our audits included performing procedures to assess the risks of material misstatement of the financial statements, whether due to error or fraud, and performing procedures that respond to those risks. Such procedures included examining, on a test basis, evidence regarding the amounts and disclosures in the financial statements. Our audits also included evaluating the accounting principles used and significant estimates made by management, as well as evaluating the overall presentation of the financial statements. Our procedures included confirmation of securities owned as of December 31, 2022 by correspondence with the custodian and transfer agent. We believe that our audits provide a reasonable basis for our opinion.
/s/PricewaterhouseCoopers LLP
New York, New York
February 24, 2023
We have served as the auditor of one or more investment companies in the MainStay group of funds since 1984.
| 24 | MainStay VP Epoch U.S. Equity Yield Portfolio |
Board Consideration and Approval of Management Agreement and Subadvisory Agreement (Unaudited)
The continuation of the Management Agreement with respect to the MainStay VP Epoch U.S. Equity Yield Portfolio (“Portfolio”) and New York Life Investment Management LLC (“New York Life Investments”) and the Subadvisory Agreement between New York Life Investments and Epoch Investment Partners, Inc. (“Epoch”) with respect to the Portfolio (together, “Advisory Agreements”) is subject to annual review and approval by the Board of Trustees of MainStay VP Funds Trust (“Board” of the “Trust”) in accordance with Section 15 of the Investment Company Act of 1940, as amended (“1940 Act”). At its December 6–7, 2022 meeting, the Board, which is comprised solely of Trustees who are not an “interested person” (as such term is defined in the 1940 Act) of the Trust (“Independent Trustees”), unanimously approved the continuation of each of the Advisory Agreements for a one-year period.
In reaching the decision to approve the continuation of each of the Advisory Agreements, the Board considered information and materials furnished by New York Life Investments and Epoch in connection with an annual contract review process undertaken by the Board that took place at meetings of the Board and its Contracts Committee during October 2022 through December 2022, including information and materials furnished by New York Life Investments and Epoch in response to requests prepared on behalf of the Board, and in consultation with the Board, by independent legal counsel to the Independent Trustees, which encompassed a variety of topics, including those summarized below. Information and materials requested by and furnished to the Board for consideration in connection with the contract review process included, among other items, reports on the Portfolio and “peer funds” prepared by Institutional Shareholder Services Inc. (“ISS”), an independent third-party service provider engaged by the Board to report objectively on the Portfolio’s investment performance, management fee and total expenses. The Board also considered information on the fees charged to other investment advisory clients of New York Life Investments and/or Epoch that follow investment strategies similar to those of the Portfolio, if any, and, when applicable, the rationale for any differences in the Portfolio’s management and subadvisory fees and the fees charged to those other investment advisory clients. In addition, the Board considered information regarding the legal standards and fiduciary obligations applicable to its consideration of the continuation of each of the Advisory Agreements. The contract review process, including the structure and format for information and materials provided to the Board, has been developed in consultation with the Board. The Independent Trustees also met in executive sessions with their independent legal counsel and, for portions thereof, with senior management of New York Life Investments.
The Board’s deliberations with respect to the continuation of each of the Advisory Agreements reflect a year-long process, and the Board also took into account information furnished to the Board and its Committees throughout the year, as deemed relevant and appropriate by the Trustees, including, among other items, reports on investment performance of the Portfolio and investment-related matters for the Portfolio as well as presentations from New York Life Investments and, generally annually, Epoch personnel. In addition, the Board took into account other information received from New York Life Investments throughout the year,
including, among other items, periodic reports on legal and compliance matters, risk management, portfolio turnover, brokerage commissions and non-advisory services provided to the Portfolio by New York Life Investments, as deemed relevant and appropriate by the Trustees.
In addition to information provided to the Board throughout the year, the Board received information in connection with its June 2022 meeting provided specifically in response to requests prepared on behalf of the Board, and in consultation with the Board, by independent legal counsel to the Independent Trustees regarding the Portfolio’s distribution arrangements. In addition, the Board received information regarding the Portfolio’s asset levels, share purchase and redemption activity and the payment of Rule 12b-1 and/or other fees by the applicable share classes of the Portfolio, among other information.
In considering the continuation of each of the Advisory Agreements, the Trustees reviewed and evaluated the information and factors they believed to reasonably be necessary and appropriate in light of legal advice furnished to them by independent legal counsel to the Independent Trustees and through the exercise of their own business judgment. Although individual Trustees may have weighed certain factors or information differently and the Board did not consider any single factor or information controlling in reaching its decision, the factors considered by the Board are summarized in more detail below and include, among other factors: (i) the nature, extent and quality of the services provided to the Portfolio by New York Life Investments and Epoch; (ii) the qualifications of the portfolio managers of the Portfolio and the historical investment performance of the Portfolio, New York Life Investments and Epoch; (iii) the costs of the services provided, and profits realized, by New York Life Investments and Epoch with respect to their relationships with the Portfolio; (iv) the extent to which economies of scale have been realized or may be realized if the Portfolio grows and the extent to which any economies of scale have been shared, have benefited or may benefit the Portfolio’s shareholders; and (v) the reasonableness of the Portfolio’s management and subadvisory fees and total ordinary operating expenses. Although the Board recognized that comparisons between the Portfolio’s fees and expenses and those of other funds are imprecise given different terms of agreements, variations in fund strategies and other factors, the Board considered the reasonableness of the Portfolio’s management fee and total ordinary operating expenses as compared to the peer funds identified by ISS. Throughout their considerations, the Trustees acknowledged the commitment of New York Life Investments and its affiliates to serve the MainStay Group of Funds, as well as their capacity, experience, resources, financial stability and reputations. The Trustees also acknowledged the entrepreneurial and other risks assumed by New York Life Investments in sponsoring and managing the Portfolio. With respect to the Subadvisory Agreement, the Board took into account New York Life Investments’ recommendation to approve the continuation of the Subadvisory Agreement.
The Trustees noted that, throughout the year, the Trustees are afforded an opportunity to ask questions of, and request additional information or materials from, New York Life Investments and Epoch. The Board’s decision with respect to each of the Advisory Agreements may have also
Board Consideration and Approval of Management Agreement and Subadvisory Agreement (Unaudited) (continued)
been based, in part, on the Board’s knowledge of New York Life Investments and Epoch resulting from, among other things, the Board’s consideration of each of the Advisory Agreements in prior years, the advisory agreements for other funds in the MainStay Group of Funds, the Board’s review throughout the year of the performance and operations of other funds in the MainStay Group of Funds and each Trustee’s business judgment and industry experience. In addition to considering the above-referenced factors, the Board observed that in the marketplace, notably under variable life insurance policies and variable annuity contracts for which the Portfolio serves as an investment option, there are a range of investment options available to investors and that the Portfolio’s shareholders, having had the opportunity to consider other investment options, have chosen to invest in the Portfolio.
The factors that figured prominently in the Board’s decision to approve the continuation of each of the Advisory Agreements during its December 6–7, 2022 meeting are summarized in more detail below.
Nature, Extent and Quality of Services Provided by New York Life Investments and Epoch
The Board examined the nature, extent and quality of the services that New York Life Investments provides to the Portfolio. The Board evaluated New York Life Investments’ experience and capabilities in serving as manager of the Portfolio and considered that the Portfolio operates in a “manager-of-managers” structure. The Board also considered New York Life Investments’ responsibilities and services provided pursuant to this structure, including overseeing the services provided by Epoch, evaluating the performance of Epoch, making recommendations to the Board as to whether the Subadvisory Agreement should be renewed, modified or terminated and periodically reporting to the Board regarding the results of New York Life Investments’ evaluation and monitoring functions. The Board noted that New York Life Investments manages other mutual funds, serves a variety of other investment advisory clients, including other pooled investment vehicles, and has experience overseeing mutual fund service providers, including subadvisors. The Board considered the experience of senior personnel at New York Life Investments providing management and administrative and other non-advisory services to the Portfolio. The Board observed that New York Life Investments devotes significant resources and time to providing management and administrative and other non-advisory services to the Portfolio, including New York Life Investments’ oversight and due diligence reviews of Epoch and ongoing analysis of, and interactions with, Epoch with respect to, among other things, the Portfolio’s investment performance and risks as well as Epoch’s investment capabilities and subadvisory services with respect to the Portfolio.
The Board also considered the range of services that New York Life Investments provides to the Portfolio under the terms of the Management Agreement, including: (i) fund accounting and ongoing supervisory services provided by New York Life Investments’ Fund Administration and Accounting Group; (ii) investment supervisory and analytical services provided by New York Life Investments’ Investment Consulting Group; (iii) compliance services provided by the Trust’s Chief Compliance Officer as
well as New York Life Investments’ compliance department, including supervision and implementation of the Portfolio’s compliance program; (iv) legal services provided by New York Life Investments’ Office of the General Counsel; and (v) risk management monitoring and analysis by compliance and investment personnel. In addition, the Board considered New York Life Investments’ willingness to invest in personnel and other resources, such as cyber security, information security and business continuity planning, designed to benefit the Portfolio and noted that New York Life Investments is responsible for compensating the Trust’s officers, except for a portion of the salary of the Trust’s Chief Compliance Officer. The Board recognized that New York Life Investments provides certain other non-advisory services to the Portfolio and has provided an increasingly broad array of non-advisory services to the MainStay Group of Funds as a result of regulatory and other developments, including in connection with the implementation of the MainStay Group of Funds’ derivatives risk management program and policies and procedures adopted pursuant to Rule 18f-4 under the 1940 Act.
The Board also examined the range, and the nature, extent and quality, of the investment advisory services that Epoch provides to the Portfolio and considered the terms of each of the Advisory Agreements. The Board evaluated Epoch’s experience and performance in serving as subadvisor to the Portfolio and advising other portfolios and Epoch’s track record and experience in providing investment advisory services, the experience of investment advisory, senior management and administrative personnel at Epoch. The Board considered New York Life Investments’ and Epoch’s overall resources, legal and compliance environment, capabilities, reputation, financial condition and history. In addition to information provided in connection with quarterly meetings with the Trust’s Chief Compliance Officer, the Board considered information regarding the compliance policies and procedures of New York Life Investments and Epoch and acknowledged their commitment to further developing and strengthening compliance programs relating to the Portfolio. The Board also considered Epoch’s ability to recruit and retain qualified investment professionals and willingness to invest in personnel and other resources to service and support the Portfolio. In this regard, the Board considered the qualifications and experience of the Portfolio’s portfolio managers, the number of accounts managed by the portfolio managers and the method for compensating the portfolio managers.
In addition, the Board considered information provided by New York Life Investments and Epoch regarding the operations of their respective business continuity plans in response to the COVID-19 pandemic and the continued remote work environment.
Based on these considerations, among others, the Board concluded that the Portfolio would likely continue to benefit from the nature, extent and quality of these services.
Investment Performance
In evaluating the Portfolio’s investment performance, the Board considered investment performance results over various periods in light of the Portfolio’s investment objective, strategies and risks. The Board
| 26 | MainStay VP Epoch U.S. Equity Yield Portfolio |
considered investment reports on, and analysis of, the Portfolio’s performance provided to the Board throughout the year. These reports include, among other items, information on the Portfolio’s gross and net returns, the Portfolio’s investment performance compared to a relevant investment category and the Portfolio’s benchmarks, the Portfolio’s risk-adjusted investment performance and the Portfolio’s investment performance as compared to peer funds, as appropriate, as well as portfolio attribution information and commentary on the effect of market conditions. The Board also considered information provided by ISS showing the investment performance of the Portfolio as compared to peer funds. In addition, the Board reviewed the methodology used by ISS to construct the group of peer funds for comparative purposes.
The Board also took into account its discussions with senior management at New York Life Investments concerning the Portfolio’s investment performance over various periods as well as discussions between the Portfolio’s portfolio management team and the members of the Board’s Investment Committee, which generally occur on an annual basis. In addition, the Board considered any specific actions that New York Life Investments or Epoch had taken, or had agreed to take, to seek to enhance Portfolio investment performance and the results of those actions.
Based on these considerations, among others, the Board concluded that its review of the Portfolio’s investment performance and related information supported a determination to approve the continuation of each of the Advisory Agreements.
Costs of the Services Provided, and Profits and Other Benefits Realized, by New York Life Investments and Epoch
The Board considered the costs of the services provided under each of the Advisory Agreements. The Board also considered the profits realized by New York Life Investments and its affiliates and Epoch due to their relationships with the Portfolio as well as by New York Life Investments and its affiliates due to their relationships with the MainStay Group of Funds. The Board considered information from New York Life Investments that Epoch’s subadvisory fee reflected an arm’s-length negotiation and that this fee is paid by New York Life Investments, not the Portfolio, and the relevance of Epoch’s profitability was considered by the Trustees in that context. On this basis, the Board primarily considered the costs and profitability for New York Life Investments and its affiliates with respect to the Portfolio.
In addition, the Board acknowledged the difficulty in obtaining reliable comparative data about mutual fund managers’ profitability because such information generally is not publicly available and may be impacted by numerous factors, including the structure of a fund manager’s organization, the types of funds it manages, the methodology used to allocate certain fixed costs to specific funds and the manager’s capital structure and costs of capital.
In evaluating the costs of the services provided by New York Life Investments and Epoch and profits realized by New York Life Investments and its affiliates and Epoch, the Board considered, among other factors,
New York Life Investments’ and its affiliates’ and Epoch’s continuing investments in, or willingness to invest in, personnel and other resources to support and further enhance the management of the Portfolio, and that New York Life Investments is responsible for paying the subadvisory fee for the Portfolio. The Board also considered the financial resources of New York Life Investments and Epoch and acknowledged that New York Life Investments and Epoch must be in a position to recruit and retain experienced professional personnel and to maintain a strong financial position for New York Life Investments and Epoch to continue to provide high-quality services to the Portfolio. The Board recognized that the Portfolio benefits from the allocation of certain fixed costs among the funds in the MainStay Group of Funds, among other expected benefits resulting from its relationship with New York Life Investments.
The Board considered information regarding New York Life Investments’ methodology for calculating profitability and allocating costs provided by New York Life Investments in connection with the fund profitability analysis presented to the Board. The Board noted it had previously engaged an independent consultant to review the methods used to allocate costs among the funds in the MainStay Group of Funds. The Board also noted that the independent consultant had concluded that New York Life Investments’ methods for allocating costs and procedures for estimating overall profitability of the relationship with the funds in the MainStay Group of Funds are reasonable and that New York Life Investments continued to use the same method of calculating profit and allocating costs since the independent consultant’s review. The Board recognized the difficulty in calculating and evaluating a manager’s profitability with respect to the Portfolio and considered that other profitability methodologies may also be reasonable.
The Board also considered certain fall-out benefits that may be realized by New York Life Investments and its affiliates due to their relationships with the Portfolio, including reputational and other indirect benefits. The Board recognized, for example, the benefits to Epoch from legally permitted “soft-dollar” arrangements by which brokers provide research and other services to Epoch in exchange for commissions paid by the Portfolio with respect to trades in the Portfolio’s portfolio securities. In this regard, the Board also requested and considered information from New York Life Investments concerning other material business relationships between Epoch and its affiliates and New York Life Investments and its affiliates and considered the existence of a strategic partnership between New York Life Investments and Epoch that relates to certain current and future products and represents a potential conflict of interest associated with New York Life Investments’ recommendation to approve the Subadvisory Agreement. In addition, the Board considered its review of the management agreement for a money market fund advised by New York Life Investments and an affiliated subadvisor that serves as an investment option for the Portfolio, including the potential rationale for and costs associated with investments in this money market fund by the Portfolio, if any, and considered information from New York Life Investments that the nature and type of specific investment advisory services provided to this money market fund are distinct from, or in addition to, the investment advisory services provided to the Portfolio. In
Board Consideration and Approval of Management Agreement and Subadvisory Agreement (Unaudited) (continued)
addition, the Board considered the potential dividend received tax deduction for insurance company affiliates of New York Life Investments from the Portfolio’s securities lending activity.
The Board noted that the Portfolio serves as an investment option primarily under variable contracts issued by affiliates of New York Life Investments that would receive fees under those contracts. The Board observed that, in addition to fees earned by New York Life Investments under the Management Agreement for managing the Portfolio, New York Life Investments’ affiliates also earn revenues from serving the Portfolio in various other capacities, including as the Portfolio’s distributor. The Board considered information about these other revenues and their impact on the profitability of the relationship with the Portfolio to New York Life Investments and its affiliates. The Board noted that, although it assessed the overall profitability of the relationship with the Portfolio to New York Life Investments and its affiliates as part of the contract review process, when considering the reasonableness of the fee paid to New York Life Investments under the Management Agreement, the Board considered the profitability of New York Life Investments’ relationship with the Portfolio on a pre-tax basis and without regard to distribution expenses incurred by New York Life Investments from its own resources.
After evaluating the information deemed relevant by the Trustees, the Board concluded that any profits realized by New York Life Investments and its affiliates due to their relationships with the Portfolio were not excessive, other benefits that may accrue to New York Life Investments and its affiliates are reasonable and benefits that may accrue to Epoch and its affiliates are consistent with those expected for a subadvisor to a mutual fund. With respect to Epoch, the Board considered that any profits realized by Epoch due to its relationship with the Portfolio are the result of arm’s-length negotiations between New York Life Investments and Epoch, acknowledging that any such profits are based on the subadvisory fee paid to Epoch by New York Life Investments, not the Portfolio.
Management and Subadvisory Fees and Total Ordinary Operating Expenses
The Board evaluated the reasonableness of the fee paid under each of the Advisory Agreements and the Portfolio’s total ordinary operating expenses. The Board primarily considered the reasonableness of the management fee paid by the Portfolio to New York Life Investments because the subadvisory fee paid to Epoch is paid by New York Life Investments, not the Portfolio. The Board also considered the reasonableness of the subadvisory fee paid by New York Life Investments and the amount of the management fee retained by New York Life Investments.
In assessing the reasonableness of the Portfolio’s fees and expenses, the Board primarily considered comparative data provided by ISS on the fees and expenses charged by similar mutual funds managed by other investment advisers. The Board reviewed the methodology used by ISS to construct the group of peer funds for comparative purposes. In addition, the Board considered information provided by New York Life Investments and Epoch on fees charged to other investment advisory clients, including
institutional separate accounts and/or other funds that follow investment strategies similar to those of the Portfolio, if any. The Board considered the contractual management fee schedules of the Portfolio as compared to those of such other investment advisory clients, taking into account the rationale for any differences in fee schedules. The Board also took into account information provided by New York Life Investments about the more extensive scope of services provided to registered investment companies, such as the Portfolio, as compared with other investment advisory clients. Additionally, the Board considered the impact of contractual breakpoints and expense limitation arrangements on the Portfolio’s net management fee and expenses. The Board also considered that in proposing fees for the Portfolio, New York Life Investments considers the competitive marketplace for mutual funds. The Board considered its discussions with representatives from New York Life Investments regarding the management fee paid by the Portfolio.
Based on the factors outlined above, among other considerations, the Board concluded that the Portfolio’s management fee and total ordinary operating expenses are within a range that is competitive and support a conclusion that these fees and expenses are reasonable.
Economies of Scale
The Board considered information regarding economies of scale, including whether economies of scale may exist for the Portfolio and whether the Portfolio’s expense structure permits any economies of scale to be appropriately shared with the Portfolio’s beneficial shareholders. The Board also considered a report from New York Life Investments, previously prepared at the request of the Board, that addressed economies of scale, including with respect to the mutual fund business generally, and the various ways in which the benefits of economies of scale may be shared with the funds in the MainStay Group of Funds. Although the Board recognized the difficulty of determining economies of scale with precision, the Board acknowledged that economies of scale may be shared with the Portfolio in a number of ways, including, for example, through the imposition of fee breakpoints, initially setting management fee rates at scale or making additional investments to enhance the services provided to the Portfolio. The Board reviewed information from New York Life Investments showing how the Portfolio’s management fee schedule compared to fee schedules of other funds and accounts managed by New York Life Investments. The Board also reviewed information from ISS showing how the Portfolio’s management fee schedule compared with fees paid for similar services by peer funds at varying asset levels.
Based on this information, the Board concluded that economies of scale are appropriately reflected for the benefit of the Portfolio’s beneficial shareholders through the Portfolio’s expense structure and other methods to share benefits from economies of scale.
| 28 | MainStay VP Epoch U.S. Equity Yield Portfolio |
Conclusion
On the basis of the information and factors summarized above, among other information and factors deemed relevant by the Trustees, and the evaluation thereof, the Board unanimously voted to approve the continuation of each of the Advisory Agreements.
Proxy Voting Policies and Procedures and Proxy Voting Record
The Portfolio is required to file with the SEC its proxy voting record for the 12-month period ending June 30 on Form N-PX. A description of the policies and procedures that are used to vote proxies relating to portfolio securities of the Portfolio is available free of charge upon request by calling 800-598-2019 or visiting the SEC's website at www.sec.gov. The most recent Form N-PX or proxy voting record is available free of charge upon request by calling 800-598-2019; visiting https://www.newyorklifeinvestments.com/investment-products/vp; or visiting the SEC’s website at www.sec.gov.
Shareholder Reports and Quarterly Portfolio Disclosure
The Portfolio is required to file its complete schedule of portfolio holdings with the SEC 60 days after its first and third fiscal quarter on Form N-PORT. The Portfolio's holdings report is available free of charge upon request by calling 800-598-2019 or by visiting the SEC’s website at www.sec.gov.
| 30 | MainStay VP Epoch U.S. Equity Yield Portfolio |
Board of Trustees and Officers (Unaudited)
The Trustees and officers of the Portfolio are listed below. The Board oversees the MainStay Group of Funds (which consists of MainStay Funds and MainStay Funds Trust), MainStay VP Funds Trust, MainStay MacKay DefinedTerm Municipal Opportunities Fund, MainStay CBRE Global Infrastructure Megatrends Fund, the Manager and the Subadvisors, and elects the officers of the Portfolios who are responsible for the day-to-day operations of the Portfolio. Information pertaining to the Trustees and officers is set forth below. Each Trustee serves until his or her successor
is elected and qualified or until his or her resignation, death or removal. Under the Board’s retirement policy, unless an exception is made, a Trustee must tender his or her resignation by the end of the calendar year during which he or she reaches the age of 75. The business address of each Trustee and officer listed below is 51 Madison Avenue, New York, New York 10010. None of the Trustees are “interested persons” (as defined by the 1940 Act and rules adopted by the SEC thereunder) of the Portfolio (“Independent Trustees”).
| | Name and
Year of Birth | Term of Office,
Position(s) Held and
Length of Service | Principal Occupation(s)
During Past Five Years | Number of
Portfolios in
Fund Complex
Overseen by
Trustee | Other Directorships
Held by Trustee |
| | | | | | |
| | David H. Chow
1957 | MainStay VP Funds Trust: Trustee since January 2016, Advisory Board Member (June 2015 to December 2015) | Founder and CEO, DanCourt Management, LLC since 1999 | 78 | MainStay Funds: Trustee since January 2016, Advisory Board Member (June 2015 to December 2015) (12 Funds);
MainStay Funds Trust: Trustee since January 2016, Advisory Board Member (June 2015 to December 2015) (33 Funds);
MainStay MacKay DefinedTerm Municipal Opportunities Fund: Trustee since January 2016, Advisory Board Member (June 2015 to December 2015);
MainStay CBRE Global Infrastructure Megatrends Fund: Trustee since June 2021;VanEck Vectors Group of Exchange-Traded Funds: Independent Chairman of the Board of Trustees since 2008 and Trustee since 2006 (57 portfolios); and Berea College of Kentucky: Trustee since 2009, Chair of the Committee since 2018 |
| | Susan B. Kerley
1951 | MainStay VP Funds Trust: Chairman since 2017 and Trustee since 2007* | President, Strategic Management Advisors LLC since 1990 | 78 | MainStay Funds: Chairman since 2017 and Trustee since 2007 (12 Funds); MainStay Funds Trust: Chairman since 2017 and Trustee since 1990 (33 Funds)**;
MainStay MacKay DefinedTerm Municipal Opportunities Fund: Chairman since 2017 and Trustee since 2011; MainStay CBRE Global Infrastructure Megatrends Fund: Trustee since June 2021; and Legg Mason Partners Funds: Trustee since 1991 (45 portfolios) |
| | Alan R. Latshaw
1951 | MainStay VP Funds Trust: Trustee since 2007* | Retired; Partner, Ernst & Young LLP (2002 to 2003); Partner, Arthur Andersen LLP (1989 to 2002); Consultant to the MainStay Funds Audit and Compliance Committee (2004 to 2006) | 78 | MainStay Funds: Trustee since 2006 (12 Funds);
MainStay Funds Trust: Trustee since 2007 (33 Funds)**;
MainStay MacKay DefinedTerm Municipal Opportunities Fund: Trustee since 2011; and
MainStay CBRE Global Infrastructure Megatrends Fund: Trustee since June 2021 |
Board of Trustees and Officers (Unaudited) (continued)
| | Name and
Year of Birth | Term of Office,
Position(s) Held and
Length of Service | Principal Occupation(s)
During Past Five Years | Number of
Portfolios in
Fund Complex
Overseen by
Trustee | Other Directorships
Held by Trustee |
| | | | | | |
| | Karen Hammond
1956 | MainStay VP Funds Trust: Trustee since December 2021, Advisory Board Member (June 2021 to December 2021)
| Retired, Managing Director, Devonshire Investors (2007 to 2013); Senior Vice President, Fidelity Management & Research Co. (2005 to 2007); Senior Vice President and Corporate Treasurer, FMR Corp. (2003 to 2005); Chief Operating Officer, Fidelity Investments Japan (2001 to 2003) | 78 | MainStay Funds: Trustee since December 2021, Advisory Board Member (June 2021 to December 2021) (12 Funds);
MainStay Funds Trust: Trustee since December 2021, Advisory Board Member (June 2021 to December 2021) (33 Funds);
MainStay MacKay DefinedTerm Municipal Opportunities Fund: Trustee since December 2021, Advisory Board Member (June 2021 to December 2021);
MainStay CBRE Global Infrastructure Megatrends Fund: Trustee since December 2021, Advisory Board Member (June 2021 to December 2021);
Two Harbors Investment Corp.: Director since 2018; Rhode Island State Investment Commission: Member since 2017; and Blue Cross Blue Shield of Rhode Island: Director since 2019
|
| | Jacques P. Perold
1958 | MainStay VP Funds Trust: Trustee since January 2016, Advisory Board Member (June 2015 to December 2015) | Founder and Chief Executive Officer, CapShift Advisors LLC (since 2018); President, Fidelity Management & Research Company (2009 to 2014); President and Chief Investment Officer, Geode Capital Management, LLC (2001 to 2009) | 78 | MainStay Funds: Trustee since January 2016, Advisory Board Member (June 2015 to December 2015) (12 Funds);
MainStay Funds Trust: Trustee since January 2016, Advisory Board Member (June 2015 to December 2015) (33 Funds); MainStay MacKay DefinedTerm Municipal Opportunities Fund: Trustee since January 2016, Advisory Board Member (June 2015 to December 2015);
MainStay CBRE Global Infrastructure Megatrends Fund: Trustee since June 2021; Allstate Corporation: Director since 2015;
Partners in Health: Trustee since 2019; and
MSCI Inc.: Director since 2017 |
| | Richard S. Trutanic
1952 | MainStay VP Funds Trust: Trustee since 2007* | Chairman and Chief Executive Officer, Somerset & Company (financial advisory firm) since 2004; Managing Director, The Carlyle Group (private investment firm) (2002 to 2004); Senior Managing Director, Partner and Board Member, Groupe Arnault S.A. (private investment firm) (1999 to 2002)
| 78 | MainStay Funds: Trustee since 1994 (12 Funds);
MainStay Funds Trust: Trustee since 2007 (33 Funds)**;
MainStay MacKay DefinedTerm Municipal Opportunities Fund: Trustee since 2011; and
MainStay CBRE Global Infrastructure Megatrends Fund: Trustee since June 2021 |
| * | Includes prior service as a Director of MainStay VP Series Fund, Inc., the predecessor to MainStay VP Funds Trust. |
| ** | Includes prior service as a Director/Trustee of certain predecessor entities to MainStay Funds Trust. |
| 32 | MainStay VP Epoch U.S. Equity Yield Portfolio |
| | Name and
Year of Birth | Position(s) Held and
Length of Service | Principal Occupation(s)
During Past Five Years | |
| | | | | |
| | Kirk C. Lehneis
1974 | President, MainStay VP Funds Trust (since 2017) | Chief Operating Officer and Senior Managing Director (since 2016), New York Life Investment Management LLC and New York Life Investment Management Holdings LLC; Member of the Board of Managers (since 2017) and Senior Managing Director (since 2018), NYLIFE Distributors LLC; Chairman of the Board and Senior Managing Director, NYLIM Service Company LLC (since 2017); Trustee, President and Principal Executive Officer of IndexIQ Trust, IndexIQ ETF Trust and IndexIQ Active ETF Trust (since January 2018); President, MainStay CBRE Global Infrastructure Megatrends Fund (since 2021), MainStay MacKay DefinedTerm Municipal Opportunities Fund, MainStay Funds and MainStay Funds Trust (since 2017); Senior Managing Director, Global Product Development (from 2015-2016); Managing Director, Product Development (from 2010-2015), New York Life Investment Management LLC | |
| | Jack R. Benintende
1964 | Treasurer and Principal Financial and Accounting Officer, MainStay VP Funds Trust (since 2007)** | Managing Director, New York Life Investment Management LLC (since 2007); Treasurer and Principal Financial and Accounting Officer, MainStay CBRE Global Infrastructure Megatrends Fund (since 2021), MainStay MacKay DefinedTerm Municipal Opportunities Fund (since 2011), MainStay Funds Trust (since 2009) and MainStay Funds (since 2007); and Assistant Treasurer, New York Life Investment Management Holdings LLC (2008 to 2012) | |
| | J. Kevin Gao
1967 | Secretary and Chief Legal Officer, MainStay VP Funds Trust (since 2010)** | Managing Director and Associate General Counsel, New York Life Investment Management LLC (since 2010); Secretary and Chief Legal Officer, MainStay CBRE Global Infrastructure Megatrends Fund (since 2021), MainStay MacKay DefinedTerm Municipal Opportunities Fund (since 2011), MainStay Funds and MainStay Funds Trust (since 2010) | |
| | Scott T. Harrington
1959 | Vice President— Administration, MainStay VP Funds Trust (since 2005)** | Managing Director, New York Life Investment Management LLC (including predecessor advisory organizations) (since 2000); Member of the Board of Directors, New York Life Trust Company (since 2009); Vice President—Administration, MainStay CBRE Global Infrastructure Megatrends Fund (since 2021), MainStay MacKay DefinedTerm Municipal Opportunities Fund (since 2011), MainStay Funds Trust and MainStay Funds (since 2009) | |
| | Kevin M. Gleason
1967 | Vice President and Chief Compliance Officer, MainStay VP Funds Trust (since June 2022) | Vice President and Chief Compliance Officer, IndexIQ, IndexIQ ETF Trust and Index IQ Active ETF Trust (since June 2022); Vice President and Chief Compliance Officer, MainStay CBRE Global Infrastructure Megatrends Fund, MainStay MacKay DefinedTerm Municipal Opportunities Fund (since June 2022); MainStay Funds Trust and MainStay Funds (since June 2022); Senior Vice President, Voya Investment Management and Chief Compliance Officer, Voya Family of Funds (2012-2022) | |
| * | The officers listed above are considered to be “interested persons” of the MainStay Group of Funds, MainStay VP Funds Trust, MainStay CBRE Global Infrastructure Megatrends Fund and MainStay MacKay DefinedTerm Municipal Opportunities Fund within the meaning of the 1940 Act because of their affiliation with the MainStay Group of Funds, New York Life Insurance Company and/or its affiliates, including New York Life Investment Management LLC, NYLIM Service Company LLC, NYLIFE Securities LLC and/or NYLIFE Distributors LLC, as described in detail in the column captioned “Principal Occupation(s) During Past Five Years.” Officers are elected annually by the Board. |
| ** | Includes prior service as an Officer of MainStay VP Series Fund, Inc., the predecessor to MainStay VP Funds Trust. |
Officers of the Trust (Who are not Trustees)*
This page intentionally left blank.
MainStay VP Portfolios
MainStay VP offers a wide range of Portfolios. The full array of MainStay VP offerings is listed here, with information about the manager, subadvisors, legal counsel, and independent registered public accounting firm.
Equity
MainStay VP American Century Sustainable Equity Portfolio1
MainStay VP Candriam Emerging Markets Equity Portfolio
MainStay VP Epoch U.S. Equity Yield Portfolio
MainStay VP Fidelity Institutional AM® Utilities Portfolio†
MainStay VP MacKay International Equity Portfolio
MainStay VP Natural Resources Portfolio
MainStay VP S&P 500 Index Portfolio2
MainStay VP Small Cap Growth Portfolio
MainStay VP Wellington Growth Portfolio
MainStay VP Wellington Mid Cap Portfolio
MainStay VP Wellington Small Cap Portfolio
MainStay VP Wellington U.S. Equity Portfolio
MainStay VP Winslow Large Cap Growth Portfolio
Mixed Asset
MainStay VP Balanced Portfolio
MainStay VP Income Builder Portfolio
MainStay VP Janus Henderson Balanced Portfolio
MainStay VP MacKay Convertible Portfolio
Income
MainStay VP Bond Portfolio
MainStay VP Floating Rate Portfolio
MainStay VP Indexed Bond Portfolio
MainStay VP MacKay Government Portfolio
MainStay VP MacKay High Yield Corporate Bond Portfolio
MainStay VP MacKay Strategic Bond Portfolio
MainStay VP PIMCO Real Return Portfolio
Money Market
MainStay VP U.S. Government Money Market Portfolio
Alternative
MainStay VP CBRE Global Infrastructure Portfolio
MainStay VP IQ Hedge Multi-Strategy Portfolio
Asset Allocation
MainStay VP Conservative Allocation Portfolio
MainStay VP Equity Allocation Portfolio
MainStay VP Growth Allocation Portfolio
MainStay VP Moderate Allocation Portfolio
Manager
New York Life Investment Management LLC
New York, New York
Subadvisors
American Century Investment Management, Inc.
Kansas City, Missouri
Brown Advisory LLC
Baltimore, Maryland
Candriam*
Strassen, Luxembourg
CBRE Investment Management Listed Real Assets LLC
Radnor, Pennsylvania
Epoch Investment Partners, Inc.
New York, New York
FIAM LLC
Smithfield, Rhode Island
IndexIQ Advisors LLC*
New York, New York
Janus Henderson Investors US LLC
Denver, Colorado
MacKay Shields LLC*
New York, New York
Newton Investment Management North America, LLC
Boston, Massachusetts
NYL Investors LLC*
New York, New York
Pacific Investment Management Company LLC
Newport Beach, California
Segall Bryant & Hamill, LLC
Chicago, Illinois
Wellington Management Company LLP
Boston, Massachusetts
Winslow Capital Management, LLC
Minneapolis, Minnesota
Legal Counsel
Dechert LLP
Washington, District of Columbia
Independent Registered Public Accounting Firm
KPMG LLP
Philadelphia, Pennsylvania
Distributor
NYLIFE Distributors LLC*
Jersey City, New Jersey
Custodian
JPMorgan Chase Bank, N.A.
New York, New York
Some Portfolios may not be available in all products.
† Fidelity Institutional AM is a registered trade mark of FMR LLC. Used with permission.
* An affiliate of New York Life Investment Management LLC.
| 1. | Prior to May 1, 2022, the Portfolio's name was MainStay VP T. Rowe Price Equity Income Portfolio. |
| 2. | Prior to May 1, 2022, the Portfolio's name was MainStay VP MacKay S&P 500 Index Portfolio. |
Not part of the Annual Report
2022 Annual Report
This report is for the general information of New York Life Variable Annuities and NYLIAC Variable Universal Life Insurance Products policyowners. It must be preceded or accompanied by the appropriate product(s) and funds prospectuses if it is given to anyone who is not an owner of a New York Life variable annuity policy or a NYLIAC Variable Universal Life Insurance Product. This report does not offer for sale or solicit orders to purchase securities.
The performance data quoted in this report represents past performance. Past performance is no guarantee of future results. Due to market volatility and other factors, current performance may be lower or higher than the figures shown. The most recent month-end performance summary for your variable annuity or variable life policy is available by calling 800-598-2019 and is updated periodically on newyorklife.com.
The New York Life Variable Annuities and NYLIAC Variable Universal Life Insurance Products are issued by New York Life Insurance and Annuity Corporation (a Delaware Corporation) and distributed by NYLIFE Distributors LLC (Member FINRA/SIPC).
New York Life Insurance Company
New York Life Insurance and Annuity
Corporation (NYLIAC) (A Delaware Corporation)
51 Madison Avenue, Room 551
New York, NY 10010
newyorklife.com
newyorklifeinvestments.com
NYLIFE Distributors LLC, 30 Hudson Street, Jersey City, NJ 07302
New York Life Investment Management LLC is the investment manager to the MainStay VP Funds Trust
©2023 by NYLIFE Distributors LLC. All rights reserved.
You may obtain copies of the Prospectus and the Statement of Additional Information free of charge, upon request, by calling toll-free 800-598-2019 or writing to New York Life Insurance and Annuity Corporation, 51 Madison Avenue, New York, NY 10010.
| Not FDIC Insured | No Bank Guarantee | May Lose Value |
(NYLIAC) NI521
MainStay VP American Century Sustainable Equity Portfolio
(formerly known as MainStay VP T. Rowe Price Equity Income Portfolio)
Message from the President and Annual Report
December 31, 2022
Sign up for e-delivery of your shareholder reports. For full details on e-delivery, including who can participate and what you can receive via e-delivery,
please log in to newyorklifeinvestments.com/accounts.
| Not FDIC/NCUA Insured | Not a Deposit | May Lose Value | No Bank Guarantee | Not Insured by Any Government Agency |
This page intentionally left blank
Message from the President
The 12-month reporting period ended December 31, 2022, proved exceptionally challenging for investors as both stock and bond markets suffered steep declines. A variety of economic and geopolitical forces drove the market’s losses, all centered around rising inflation and monetary efforts to rein it in.
Inflationary alarms began to sound well before the reporting period began. In late 2021, after nearly two years of accommodative policies designed to encourage economic growth in the face of the COVID-19 pandemic, the U.S. Federal Reserve (the “Fed”) warned of the increasing need to tighten monetary policy. Nevertheless, the pace and persistence of inflation in early 2022 caught most market participants—the Fed included—off guard. Russia’s invasion of Ukraine in February exacerbated global inflationary pressures while increasing investor uncertainty. Domestic supply shortages, international trade imbalances and rising inflation caused U.S. GDP (gross domestic product) to contract in the first and second quarters of the year, although employment and consumer spending proved resilient. Prices for petroleum surged to multi-year highs, while many key agricultural chemicals and industrial metals soared as well. Accelerating inflationary forces prompted the Fed to implement its most aggressive series of interest rate hikes since the 1980s, with a 0.25% increase in March followed by six further rate increases totaling 4.25%. International central banks generally followed suit and raised rates by varying degrees in efforts to curb local inflation, although most increases remained significantly more modest than those in the United States. Relatively high U.S. interest rates and an international risk averse sentiment pushed U.S. dollar values higher compared to most other currencies, with negative impacts on global prices for food, fuel and other key U.S.-dollar-denominated products.
The effects of these interrelated challenges were felt throughout U.S. and international financial markets. The S&P 500® Index, a widely regarded benchmark of market performance, declined by more than 18% during the reporting period. Although the energy sector generated strong gains, bolstered by elevated oil and gas prices, most other industry segments recorded losses. The more cyclical and growth-oriented sectors of consumer discretionary, information technology and real estate delivered the weakest returns, while the traditionally defensive and value-oriented
consumer staples, utilities and health care sectors outperformed. On average, international developed-country equity markets mildly outperformed their U.S. counterparts, while emerging markets lagged slightly. Fixed-income markets proved unusually volatile, with bond prices trending sharply lower as yields rose along with interest rates. Short-term yields rose faster than long-term yields, producing a yield curve inversion from July through the end of the reporting period as long-term rates remained below short-term rates. While floating-rate instruments, which feature variable interest rates that allow investors to benefit from a rising rate environment, provided a degree of insulation from inflation-driven trends, they were not immune to the market’s widespread declines.
Although, according to the most recent estimates, the annualized inflation rate in the United States has declined from a peak of 9.1% in July 2022 to 6.5% in December, the Fed remains focused on achieving more substantial and lasting reductions, aiming for a target rate of 2%. As a result, further rate hikes and additional market volatility are potential headwinds in the coming months. The question remains as to whether the Fed and other central banks will manage a so-called “soft landing,” curbing inflation while avoiding a persistent economic slowdown. If they prove successful, we believe that the increasingly attractive valuations we have observed in both equity and bond markets should eventually translate into sustainable improvements in the investment environment.
Whatever actions the Fed takes and however financial markets react, as a MainStay VP investor you can depend on us to continue managing our portfolios with the insight, expertise and level of service that have long defined New York Life Investments. Thank you for trusting us to help you meet your investment needs.
Sincerely,
Kirk C. Lehneis
President
The opinions expressed are as of the date of this report and are subject to change. There is no guarantee that any forecast made will come to pass. This material does not constitute investment advice and is not intended as an endorsement of any specific investment. Past performance is no guarantee of future results.
Not part of the Annual Report
Investors should refer to the Portfolio’s Summary Prospectus and/or Prospectus and consider the Portfolio’s investment objectives, strategies, risks, charges and expenses carefully before investing. The Summary Prospectus and/or Prospectus contain this and other information about the Portfolio. You may obtain copies of the Portfolio’s Summary Prospectus, Prospectus and Statement of Additional Information, which includes information about the MainStay VP Funds Trust's Trustees, free of charge, upon request, by calling toll-free 800-598-2019, by writing to New York Life Insurance and Annuity Corporation, 51 Madison Avenue, Room 251, New York, New York 10010 or by sending an email to MainStayShareholdersServices@nylim.com. These documents are also available at newyorklifeinvestments.com/investment-products/vp. Please read the Portfolio's Summary Prospectus and/or Prospectus carefully before investing. MainStay VP Funds Trust portfolios are separate account options which are purchased through a variable insurance or variable annuity contract.
Investment and Performance Comparison (Unaudited)
Performance data quoted represents past performance. Past performance is no guarantee of future results. Because of market volatility and other factors, current performance may be lower or higher than the figures shown. Investment return and principal value will fluctuate, and as a result, when shares are redeemed, they may be worth more or less than their original cost. The performance table and graph do not reflect any deduction of sales charges, mortality and expense charges, contract charges or administrative charges. Please refer to the Performance Summary appropriate for your policy. For performance information current to the most recent month-end, please call 800-598-2019 or visit www.newyorklife.com.
Performance figures may reflect certain fee waivers and/or expense limitations, without which total returns may have been different. For information on current fee waivers and/or expense limitations (if any), please refer to the Notes to Financial Statements.
| Average Annual Total Returns for the Year-Ended December 31, 2022 |
| Class | Inception
Date1 | One
Year | Five
Years | Ten
Years | Gross
Expense
Ratio2 |
| Initial Class Shares | 2/17/2012 | -7.70% | 6.01% | 9.24% | 0.67% |
| Service Class Shares | 2/17/2012 | -7.93 | 5.75 | 8.97 | 0.92 |
| 1. | Effective May 1, 2022, the Portfolio replaced its subadvisor, changed its investment objective and modified its principal investment strategies. The past performance in the graph and table prior to that date reflects the Portfolio's prior subadvisor and principal investment strategies. |
| 2. | The gross expense ratios presented reflect the Portfolio’s “Total Annual Portfolio Operating Expenses” from the most recent Prospectus and may differ from other expense ratios disclosed in this report. |
| Benchmark Performance* | One
Year | Five
Years | Ten
Years |
| S&P 500® Index1 | -18.11% | 9.42% | 12.56% |
| Russell 1000® Value Index2 | -7.54 | 6.67 | 10.29 |
| Morningstar Large Value Category Average3 | -6.02 | 6.81 | 9.86 |
| * | Returns for indices reflect no deductions for fees, expenses or taxes, except for foreign withholding taxes where applicable. Results assume reinvestment of all dividends and capital gains. An investment cannot be made directly in an index. |
| 1. | The Portfolio has selected the S&P 500® Index as a replacement for the Russell 1000® Value Index as its primary benchmark because it believes that the S&P 500® Index is more reflective of its principal investment strategies. The S&P 500® Index is the Portfolio's primary benchmark. “S&P 500®" is a trademark of The McGraw-Hill Companies, Inc. The S&P 500® Index is widely regarded as the standard index for measuring large-cap U.S. stock market performance. |
| 2. | Prior to May 1, 2022, the Russell 1000® Value Index was the Portfolio's primary benchmark. The Russell 1000® Value Index measures the performance of the large-cap value segment of the U.S. equity universe. It includes those Russell 1000® Index companies with lower price-to-book ratios and lower expected growth values. |
| 3. | The Morningstar Large Value Category Average is representative of funds that invest primarily in big U.S. companies that are less expensive or growing more slowly than other large-cap stocks. Results are based on average total returns of similar funds with all dividends and capital gain distributions reinvested. |
Cost in Dollars of a $1,000 Investment in MainStay VP American Century Sustainable Equity Portfolio (Unaudited)
The example below is intended to describe the fees and expenses borne by shareholders during the six-month period from July 1, 2022 to December 31, 2022, and the impact of those costs on your investment.
Example
As a shareholder of the Portfolio you incur two types of costs: (1) transaction costs, including exchange fees and sales charges (loads) on purchases (as applicable), and (2) ongoing costs, including management fees, distribution and/or service (12b-1) fees and other Portfolio expenses (as applicable). This example is intended to help you understand your ongoing costs (in dollars) of investing in the Portfolio and to compare these costs with the ongoing costs of investing in other mutual funds. The example is based on an investment of $1,000 made at the beginning of the six-month period and held for the entire period from July 1, 2022 to December 31, 2022. Shares are only sold in connection with variable life and annuity contracts and the example does not reflect any contract level or transactional fees or expenses. If these costs had been included, your costs would have been higher.
This example illustrates your Portfolio’s ongoing costs in two ways:
Actual Expenses
The second and third data columns in the table below provide information about actual account values and actual expenses. You may use the information in these columns, together with the amount you invested, to estimate the expenses that you paid during the six months ended
December 31, 2022. Simply divide your account value by $1,000 (for example, an $8,600 account value divided by $1,000 = 8.6), then multiply the result by the number under the heading entitled “Expenses Paid During Period” to estimate the expenses you paid on your account during this period.
Hypothetical Example for Comparison Purposes
The fourth and fifth data columns in the table below provide information about hypothetical account values and hypothetical expenses based on the Portfolio’s actual expense ratio and an assumed rate of return of 5% per year before expenses, which is not the Portfolio’s actual return. The hypothetical account values and expenses may not be used to estimate the actual ending account balances or expenses you paid for the six-month period shown. You may use this information to compare the ongoing costs of investing in the Portfolio with the ongoing costs of investing in other mutual funds. To do so, compare this 5% hypothetical example with the 5% hypothetical examples that appear in the shareholder reports of the other mutual funds.
Please note that the expenses shown in the table are meant to highlight your ongoing costs only and do not reflect any transactional costs, such as exchange fees or sales charges (loads). Therefore, the fourth and fifth data columns of the table are useful in comparing ongoing costs only and will not help you determine the relative total costs of owning different funds. In addition, if these transactional costs were included, your costs would have been higher.
| Share Class | Beginning
Account
Value
7/1/22 | Ending Account
Value (Based
on Actual
Returns and
Expenses)
12/31/22 | Expenses
Paid
During
Period1 | Ending Account
Value (Based
on Hypothetical
5% Annualized
Return and
Actual Expenses)
12/31/22 | Expenses
Paid
During
Period1 | Net Expense
Ratio
During
Period2 |
| Initial Class Shares | $1,000.00 | $1,041.60 | $3.45 | $1,021.83 | $3.41 | 0.67% |
| Service Class Shares | $1,000.00 | $1,040.30 | $4.73 | $1,020.57 | $4.69 | 0.92% |
| 1. | Expenses are equal to the Portfolio’s annualized expense ratio of each class multiplied by the average account value over the period, divided by 365 and multiplied by 184 (to reflect the six-month period). The table above represents the actual expenses incurred during the six-month period. In addition to the fees and expenses which the Portfolio bears directly, it also indirectly bears a pro rata share of the fees and expenses of the underlying funds in which it invests. Such indirect expenses are not included in the above-reported expense figures. |
| 2. | Expenses are equal to the Portfolio's annualized expense ratio to reflect the six-month period. |
| 6 | MainStay VP American Century Sustainable Equity Portfolio |
Industry Composition as of December 31, 2022 (Unaudited)
| Software | 9.0% |
| Health Care Providers & Services | 5.7 |
| Capital Markets | 5.2 |
| Semiconductors & Semiconductor Equipment | 5.1 |
| Pharmaceuticals | 4.6 |
| IT Services | 4.2 |
| Technology Hardware, Storage & Peripherals | 4.1 |
| Interactive Media & Services | 3.8 |
| Specialty Retail | 3.4 |
| Banks | 3.3 |
| Equity Real Estate Investment Trusts | 2.7 |
| Biotechnology | 2.6 |
| Oil, Gas & Consumable Fuels | 2.5 |
| Chemicals | 2.5 |
| Food & Staples Retailing | 2.5 |
| Energy Equipment & Services | 2.5 |
| Insurance | 2.4 |
| Machinery | 2.3 |
| Life Sciences Tools & Services | 2.3 |
| Electronic Equipment, Instruments & Components | 2.2 |
| Electric Utilities | 2.2 |
| Internet & Direct Marketing Retail | 2.2 |
| Communications Equipment | 2.0 |
| Beverages | 1.9 |
| Household Products | 1.8% |
| Building Products | 1.7 |
| Entertainment | 1.4 |
| Aerospace & Defense | 1.4 |
| Road & Rail | 1.2 |
| Textiles, Apparel & Luxury Goods | 1.2 |
| Health Care Equipment & Supplies | 1.1 |
| Diversified Telecommunication Services | 1.1 |
| Industrial Conglomerates | 1.0 |
| Food Products | 1.0 |
| Electrical Equipment | 0.9 |
| Hotels, Restaurants & Leisure | 0.9 |
| Automobiles | 0.8 |
| Auto Components | 0.7 |
| Air Freight & Logistics | 0.7 |
| Consumer Finance | 0.5 |
| Containers & Packaging | 0.5 |
| Multiline Retail | 0.4 |
| Personal Products | 0.3 |
| Short–Term Investments | 0.3 |
| Other Assets, Less Liabilities | –0.1 |
| | 100.0% |
See Portfolio of Investments beginning on page 11 for specific holdings within these categories. The Portfolio's holdings are subject to change.
Top Ten Holdings and/or Issuers Held as of December 31, 2022 (excluding short-term investments) (Unaudited)
| 1. | Microsoft Corp. |
| 2. | Apple, Inc. |
| 3. | Alphabet, Inc., Class A |
| 4. | ConocoPhillips |
| 5. | Schlumberger Ltd. |
| 6. | NextEra Energy, Inc. |
| 7. | Amazon.com, Inc. |
| 8. | Prologis, Inc. |
| 9. | UnitedHealth Group, Inc. |
| 10. | Cisco Systems, Inc. |
Portfolio Management Discussion and Analysis (Unaudited)
Answers to the questions reflect the views of John D. Linehan, CFA, of T. Rowe Price Associates, Inc. (“T. Rowe Price”), the Portfolio’s former Subadvisor, and Justin M. Brown, CFA, Joseph Reiland, CFA, and Robert J. Bove of American Century Investment Management, Inc. (“American Century”), the Portfolio’s current Subadvisor.
How did MainStay VP American Century Sustainable Equity Portfolio perform relative to its benchmarks and peers during the 12 months ended December 31, 2022?
For the 12 months ended December 31, 2022, MainStay VP American Century Sustainable Equity Portfolio returned −7.70% for Initial Class shares and −7.93% for Service Class shares. Over the same period, both share classes outperformed the −18.11% return of the S&P 500® Index, which is the Portfolio’s current primary benchmark, and underperformed the −7.54% return of the Russell 1000® Value Index, which is the Portfolio’s former primary benchmark. For the 12 months ended December 31, 2022, both share classes underperformed the −6.02% return of the Morningstar Large Value Category Average.1
Were there any changes to the Portfolio during the reporting period?
At meetings held on December 8-9, 2021, the Board of Trustees of MainStay VP Funds Trust considered and approved, among other related proposals: (i) terminating T. Rowe Price as the Portfolio’s Subadvisor; (ii) appointing American Century as the Portfolio’s Subadvisor and the related Subadvisory Agreement; (iii) changing the Portfolio’s name, modifying its non-fundamental “names rule” investment policy and reducing its management fee; (iv) changing the Portfolio’s investment objective; (v) changing the Portfolio’s primary benchmark; and (vi) modifying the Portfolio’s principal investment strategies and investment process. For more information on these and other changes refer to the supplement dated December 10, 2021.
In the process of implementing the new principal investment strategies and investment process, the Portfolio experienced a high level of portfolio turnover. Also, during this transition period, the Portfolio may not have been pursuing its investment objective or may not have been managed consistent with its investment strategies as stated in the Prospectus. This may have impacted the Portfolio’s performance.
What factors affected the Portfolio’s relative performance during the reporting period?
T. Rowe Price
During the time T. Rowe Price managed the Portfolio, the Portfolio outperformed the Russell 1000® Value Index due to both stock selection and sector allocation.
American Century
During the time American Century managed the Portfolio, the Portfolio outperformed the S&P 500® Index primarily due to stock selection. Sector allocation also modestly enhanced relative performance.
Which sectors were the strongest positive contributors to the Portfolio’s relative performance, and which sectors were particularly weak?
T. Rowe Price
During the time T. Rowe Price managed the Portfolio, the health care sector made the strongest positive contribution to the Portfolio’s performance relative to the Russell 1000® Value Index due to stock selection. (Contributions take weightings and total returns into account.) The financials sector also added value due to stock selection. The utilities sector had a positive impact on relative returns due to security selection and an overweight allocation.
Conversely, the energy sector was the most significant detractor from the Portfolio’s relative returns due to security selection. The consumer staples sector also undermined relative results due to security choices. No other sector detracted meaningfully from relative performance.
American Century
During the time American Century managed the Portfolio, the energy sector made the strongest positive contribution to the Portfolio’s performance relative to the S&P 500® Index due to stock selection. Stock selection in the information technology and financials sectors also added value. Although information technology was a positive contributor on a relative basis, it posted negative total returns on an absolute basis.
The real estate and consumer staples sectors were the most significant detractors from performance relative to the benchmark as a result of stock selection. These were the only sectors that detracted from relative performance.
During the reporting period, which individual stocks made the strongest positive contributions to the Portfolio’s absolute performance and which stocks detracted the most?
T. Rowe Price
Leading positive contributors to the Portfolio’s absolute performance during the during the time T. Rowe Price managed the Portfolio included positions in low-cost nitrogen producer CF Industries, energy infrastructure company Sempra Energy and biopharmaceutical company AbbVie. Shares in CF Industries benefited from elevated natural gas prices and the prospect of increased demand for its products given the recent destabilization of the global agriculture industry. Sempra Energy shares rallied during the first quarter of 2022 as the company reported results that contained strong forward guidance along with a five-year capital plan that focuses on liquefied natural gas and green hydrogen. Additionally, shares benefited as natural gas, and
| 1. | See page 5 for more information on benchmark and peer group returns. |
| 8 | MainStay VP American Century Sustainable Equity Portfolio |
energy prices broadly, rose. Shares of biopharmaceutical company AbbVie rose following the U.S. Food and Drug Administration’s approval of two new drugs developed by the company, Rinvoq and Skyrizi, which may help reduce the sales deficits from the company’s anticipated loss of patent coverage for Humira in 2023. Shares also benefited from the company’s optimistic forward guidance for fiscal year 2022.
The most significant detractors from the Portfolio’s absolute performance during the reporting period included semiconductor company Qualcomm, multinational personal care corporation Kimberly-Clark and semiconductor fabrication equipment company Applied Materials. Qualcomm shares rose briefly in February 2022 following the company’s report of a solid earnings beat and again after a 10% dividend hike in March, then trended lower as investors moved to names with more defensive characteristics amid growing geopolitical turbulence and rising rates. Kimberly-Clark’s share price declined after the company reported a mixed earnings report and conservative calendar year guidance that implied a reduction in operating margin. The stock was also pressured by ongoing demand concerns, increasing commodity costs and rising inflation. Applied Materials shares lost ground despite the company’s better-than-expected quarterly earnings amid continued supply chain challenges. Overall, the sector suffered on broad-based macroeconomic concerns, with growth-oriented technology names selling off as investors flocked toward more defensive stocks amid rising inflation and impending interest rate hikes.
American Century
Top contributors to the Portfolio’s absolute performance during the during the time American Century managed the Portfolio included oil field services company Schlumberger, oil company ConocoPhillips and managed care company Cigna. Schlumberger reported strong quarterly results, surprising positively with revenues, margins and earnings. Pricing remained strong, supporting margins, and the company’s growing focus on its new energy division (energy transition, low-carbon solutions) continued to gain momentum. ConocoPhillips reported solid quarterly earnings and increased its 2022 capital return guidance by 50%. The management team continued to demonstrate strong execution and capital return discipline. Managed care companies, including Cigna, benefited from their defensive profile, meaning that they are expected to remain relatively insulated from the current economic environment of increasing inflation and recession risk. Cigna’s pharmacy benefit management division is also expected to be able to take advantage of new biosimilar pharmaceutical launches in the coming years.
Major detractors from the portfolio’s absolute performance included the REIT (real estate investment trust) Prologis, oil company Exxon Mobil and online travel agency Expedia Group. While we believe industrial warehouse space offers attractive long-term growth potential, recent cutbacks by Amazon and FedEx
weighed on REITs such as Prologis. Rising interest rates and a strong dollar also increased the cost of debt and undermined asset valuations. Lack of exposure to Exxon Mobil, which participated in the energy sector’s strong performance, detracted from relative performance. Expedia Group lagged as investors became increasingly concerned about the impact of inflation on consumers.
Did the Portfolio make any significant purchases or sales during the reporting period?
T. Rowe Price
During the time T. Rowe Price managed the Portfolio, the Portfolio continued to build its position in energy infrastructure company TC Energy, reflecting our belief that the market underappreciated the company’s pipeline assets amid an uncertain global environment for energy supply. The Portfolio also purchased shares of global exploration and production company Hess. In our view, the value of Hess’s offshore Guyana assets was underappreciated by the market.
Significant sales included shares of multinational financial services company Wells Fargo on relative strength. While we continued to have confidence in the bank and it remained one the Portfolio’s largest holdings, we sought to manage the Portfolio’s position size. We also reduced the Portfolio’s position in regional bank Fifth Third Bancorp. In our view, the bank was approaching fair valuation relative to its peers, leading us to reinvest the assets into other names with more attractive risk/reward characteristics.
American Century
During the time American Century managed the Portfolio, the Portfolio initiated a position in grocery chain The Kroger Co., which benefited from the shift to greater eating at home during the pandemic. Consumers have been slow to return to prior spending patterns, and Kroger held on to much of the surge in volumes. Grocers are also adept at passing inflationary costs to consumers. The Portfolio also established a position in GlobalFoundries, a semiconductor chipmaker. We expect GlobalFoundries to benefit from demand for more geographically neutral foundry locations, and from significant improvement in profitability as the company shifts to less capital-intensive manufacturing technology.
During the same period, we eliminated the Portfolio’s position in paint manufacturer The Sherwin-Williams Company after the company reported several earnings disappointments and lost market share in professional painter sales. We also eliminated the Portfolio’s position in Expedia Group to fund positions that we believe have stronger operating results and more favorable ESG (environmental, social and corporate governance) profiles, particularly with respect to governance practices.
How did the Portfolio’s sector weightings change during the reporting period?
T. Rowe Price
At the beginning of the reporting period, the Portfolio's most substantially overweight positions relative to the Russell 1000® Value Index were utilities and financials. At the end of the time T. Rowe Price managed the Portfolio, utilities and materials were the most substantially overweight positions. The most substantial increases in relative weighting in the Portfolio were in the health care and consumer discretionary sectors.
The most substantially underweight positions relative to the benchmark at the beginning of the reporting period were communication services and consumer discretionary. At the end of the time T. Rowe Price managed the Portfolio, communication services and consumer discretionary remained the most substantially underweight positions. The most meaningful decreases in relative weighting in the Portfolio occurred in financials and energy.
American Century
During the time American Century managed the Portfolio, health care exposure increased from an underweight position to an overweight position versus the S&P 500® Index, driven primarily by increased exposure to the biotechnology industry. The industrials sector went from the Portfolio’s largest overweight position to a more modestly overweight position as we reduced holdings across various industries within the sector due to concerns about the effects of higher inflation and a slowing economy. In consumer discretionary, the Portfolio shifted from an overweight position to an underweight position, primarily due to reduced exposure to online travel agencies based on concerns about slowing consumer travel.
How was the Portfolio positioned at the end of the reporting period?
As of December 31, 2022, the Portfolio held its largest sector position relative to the S&P 500® Index in information technology. Our investment process focuses on companies that meet our sustainability and ESG criteria with what we view as improving business fundamentals. At present, we see opportunities in the electronic equipment, instruments and components industry. We also like select companies in information technology services. In addition, the Portfolio holds overweight exposure to the industrials sector, which is home to several longer-term sustainable themes, including decarbonization, industrial automation, building efficiency, reshoring of manufacturing back to the United States and electrification.
As of the same date, the Portfolio held underweight exposure to the communication services and utilities sectors, reflecting a comparative lack of fundamental business opportunities within those sectors, as well as market movements during the reporting period.
The opinions expressed are those of the portfolio managers as of the date of this report and are subject to change. There is no guarantee that any forecasts will come to pass. This material does not constitute investment advice and is not intended as an endorsement of any specific investment.
Not all MainStay VP Portfolios and/or share classes are available under all policies.
| 10 | MainStay VP American Century Sustainable Equity Portfolio |
Portfolio of Investments December 31, 2022†
| | Shares | Value |
| Common Stocks 99.2% |
| Aerospace & Defense 1.4% |
| Lockheed Martin Corp. | 12,603 | $ 6,131,234 |
| Air Freight & Logistics 0.7% |
| United Parcel Service, Inc., Class B | 18,023 | 3,133,118 |
| Auto Components 0.7% |
| Aptiv plc (a) | 34,978 | 3,257,501 |
| Automobiles 0.8% |
| Tesla, Inc. (a) | 28,812 | 3,549,062 |
| Banks 3.3% |
| Bank of America Corp. | 46,759 | 1,548,658 |
| JPMorgan Chase & Co. | 53,597 | 7,187,358 |
| Regions Financial Corp. | 296,697 | 6,396,787 |
| | | 15,132,803 |
| Beverages 1.9% |
| PepsiCo, Inc. | 46,507 | 8,401,955 |
| Biotechnology 2.6% |
| AbbVie, Inc. | 38,065 | 6,151,685 |
| Amgen, Inc. | 11,518 | 3,025,087 |
| Vertex Pharmaceuticals, Inc. (a) | 8,564 | 2,473,112 |
| | | 11,649,884 |
| Building Products 1.7% |
| Johnson Controls International plc | 89,795 | 5,746,880 |
| Masco Corp. | 46,065 | 2,149,854 |
| | | 7,896,734 |
| Capital Markets 4.6% |
| Ameriprise Financial, Inc. | 11,819 | 3,680,082 |
| BlackRock, Inc. | 6,656 | 4,716,641 |
| Intercontinental Exchange, Inc. | 23,718 | 2,433,230 |
| Morgan Stanley | 87,052 | 7,401,161 |
| S&P Global, Inc. | 8,360 | 2,800,098 |
| | | 21,031,212 |
| Chemicals 2.5% |
| Air Products and Chemicals, Inc. | 9,746 | 3,004,302 |
| Ecolab, Inc. | 13,650 | 1,986,894 |
| Linde plc | 19,807 | 6,460,647 |
| | | 11,451,843 |
| | Shares | Value |
| |
| Communications Equipment 2.0% |
| Cisco Systems, Inc. | 187,272 | $ 8,921,638 |
| Consumer Finance 0.5% |
| American Express Co. | 16,281 | 2,405,518 |
| Containers & Packaging 0.5% |
| Ball Corp. | 46,817 | 2,394,221 |
| Diversified Telecommunication Services 1.1% |
| Verizon Communications, Inc. | 122,378 | 4,821,693 |
| Electric Utilities 2.2% |
| NextEra Energy, Inc. | 118,199 | 9,881,436 |
| Electrical Equipment 0.9% |
| Eaton Corp. plc | 23,466 | 3,682,989 |
| Generac Holdings, Inc. (a) | 5,964 | 600,336 |
| | | 4,283,325 |
| Electronic Equipment, Instruments & Components 2.2% |
| CDW Corp. | 25,474 | 4,549,147 |
| Cognex Corp. | 20,227 | 952,894 |
| Keysight Technologies, Inc. (a) | 27,020 | 4,622,311 |
| | | 10,124,352 |
| Energy Equipment & Services 2.5% |
| Schlumberger Ltd. | 209,927 | 11,222,697 |
| Entertainment 1.4% |
| Electronic Arts, Inc. | 15,565 | 1,901,732 |
| Liberty Media Corp.-Liberty Formula One, Class C (a) | 18,271 | 1,092,240 |
| Walt Disney Co. (The) (a) | 36,626 | 3,182,067 |
| | | 6,176,039 |
| Equity Real Estate Investment Trusts 2.7% |
| Prologis, Inc. | 85,084 | 9,591,519 |
| SBA Communications Corp. | 9,399 | 2,634,634 |
| | | 12,226,153 |
| Food & Staples Retailing 2.5% |
| Costco Wholesale Corp. | 6,329 | 2,889,189 |
| Kroger Co. (The) | 69,814 | 3,112,308 |
| Sysco Corp. | 71,067 | 5,433,072 |
| | | 11,434,569 |
The notes to the financial statements are an integral part of, and should be read in conjunction with, the financial statements.
11
Portfolio of Investments December 31, 2022† (continued)
| | Shares | Value |
| Common Stocks (continued) |
| Food Products 1.0% |
| Mondelez International, Inc., Class A | 62,945 | $ 4,195,284 |
| Vital Farms, Inc. (a) | 19,093 | 284,868 |
| | | 4,480,152 |
| Health Care Equipment & Supplies 1.1% |
| Edwards Lifesciences Corp. (a) | 47,358 | 3,533,381 |
| Medtronic plc | 8,557 | 665,050 |
| ResMed, Inc. | 4,533 | 943,453 |
| | | 5,141,884 |
| Health Care Providers & Services 5.7% |
| Cigna Corp. | 25,347 | 8,398,475 |
| CVS Health Corp. | 55,956 | 5,214,539 |
| Humana, Inc. | 5,226 | 2,676,705 |
| UnitedHealth Group, Inc. | 18,032 | 9,560,206 |
| | | 25,849,925 |
| Hotels, Restaurants & Leisure 0.9% |
| Airbnb, Inc., Class A (a) | 11,467 | 980,429 |
| Booking Holdings, Inc. (a) | 1,050 | 2,116,044 |
| Chipotle Mexican Grill, Inc. (a) | 755 | 1,047,555 |
| | | 4,144,028 |
| Household Products 1.8% |
| Colgate-Palmolive Co. | 28,045 | 2,209,666 |
| Procter & Gamble Co. (The) | 38,436 | 5,825,360 |
| | | 8,035,026 |
| Industrial Conglomerates 1.0% |
| Honeywell International, Inc. | 22,204 | 4,758,317 |
| Insurance 2.4% |
| Marsh & McLennan Cos., Inc. | 23,486 | 3,886,463 |
| Prudential Financial, Inc. | 35,014 | 3,482,493 |
| Travelers Cos., Inc. (The) | 19,559 | 3,667,117 |
| | | 11,036,073 |
| Interactive Media & Services 3.8% |
| Alphabet, Inc., Class A (a) | 194,179 | 17,132,413 |
| Internet & Direct Marketing Retail 2.2% |
| Amazon.com, Inc. (a) | 116,497 | 9,785,748 |
| IT Services 4.2% |
| Accenture plc, Class A | 18,879 | 5,037,672 |
| Mastercard, Inc., Class A | 16,623 | 5,780,316 |
| | Shares | Value |
| |
| IT Services (continued) |
| Visa, Inc., Class A | 40,722 | $ 8,460,403 |
| | | 19,278,391 |
| Life Sciences Tools & Services 2.3% |
| Agilent Technologies, Inc. | 36,026 | 5,391,291 |
| Thermo Fisher Scientific, Inc. | 9,293 | 5,117,562 |
| | | 10,508,853 |
| Machinery 2.3% |
| Cummins, Inc. | 17,066 | 4,134,921 |
| Deere & Co. | 5,104 | 2,188,391 |
| Parker-Hannifin Corp. | 5,972 | 1,737,852 |
| Xylem, Inc. | 22,645 | 2,503,858 |
| | | 10,565,022 |
| Multiline Retail 0.4% |
| Target Corp. | 11,903 | 1,774,023 |
| Oil, Gas & Consumable Fuels 2.5% |
| ConocoPhillips | 97,591 | 11,515,738 |
| Personal Products 0.3% |
| Estee Lauder Cos., Inc. (The), Class A | 5,276 | 1,309,028 |
| Pharmaceuticals 4.6% |
| Bristol-Myers Squibb Co. | 89,070 | 6,408,586 |
| Eli Lilly and Co. | 5,570 | 2,037,729 |
| Merck & Co., Inc. | 45,726 | 5,073,300 |
| Novo Nordisk A/S, Class B | 27,477 | 3,720,384 |
| Zoetis, Inc. | 24,078 | 3,528,631 |
| | | 20,768,630 |
| Road & Rail 1.2% |
| Norfolk Southern Corp. | 12,011 | 2,959,751 |
| Uber Technologies, Inc. (a) | 37,026 | 915,653 |
| Union Pacific Corp. | 7,760 | 1,606,863 |
| | | 5,482,267 |
| Semiconductors & Semiconductor Equipment 5.1% |
| Advanced Micro Devices, Inc. (a) | 46,212 | 2,993,151 |
| Analog Devices, Inc. | 32,095 | 5,264,543 |
| Applied Materials, Inc. | 49,864 | 4,855,756 |
| ASML Holding NV | 5,455 | 2,952,809 |
| GlobalFoundries, Inc. (a)(b) | 19,980 | 1,076,722 |
| NVIDIA Corp. | 42,346 | 6,188,445 |
| | | 23,331,426 |
| Software 9.0% |
| Adobe, Inc. (a) | 3,430 | 1,154,298 |
The notes to the financial statements are an integral part of, and should be read in conjunction with, the financial statements.
| 12 | MainStay VP American Century Sustainable Equity Portfolio |
| | Shares | Value |
| Common Stocks (continued) |
| Software (continued) |
| Cadence Design Systems, Inc. (a) | 12,600 | $ 2,024,064 |
| Microsoft Corp. | 138,789 | 33,284,378 |
| Salesforce, Inc. (a) | 18,359 | 2,434,220 |
| ServiceNow, Inc. (a) | 2,939 | 1,141,125 |
| Workday, Inc., Class A (a) | 5,981 | 1,000,801 |
| | | 41,038,886 |
| Specialty Retail 3.4% |
| Home Depot, Inc. (The) | 26,912 | 8,500,424 |
| TJX Cos., Inc. (The) | 63,089 | 5,021,885 |
| Tractor Supply Co. | 8,141 | 1,831,481 |
| | | 15,353,790 |
| Technology Hardware, Storage & Peripherals 4.1% |
| Apple, Inc. | 144,269 | 18,744,871 |
| Textiles, Apparel & Luxury Goods 1.2% |
| Deckers Outdoor Corp. (a) | 5,666 | 2,261,641 |
| NIKE, Inc., Class B | 25,391 | 2,971,001 |
| | | 5,232,642 |
Total Common Stocks
(Cost $484,206,174) | | 450,794,120 |
| Exchange-Traded Fund 0.6% |
| SPDR S&P 500 ETF Trust | 7,784 | 2,976,835 |
Total Exchange-Traded Fund
(Cost $2,958,555) | | 2,976,835 |
| | Shares | | Value |
| Short-Term Investments 0.3% |
| Affiliated Investment Company 0.1% |
| MainStay U.S. Government Liquidity Fund, 3.602% (c) | 467,454 | | $ 467,454 |
| Unaffiliated Investment Company 0.2% |
| Invesco Government and Agency Portfolio, 4.301% (c)(d) | 877,728 | | 877,728 |
Total Short-Term Investments
(Cost $1,345,182) | | | 1,345,182 |
Total Investments
(Cost $488,509,911) | 100.1% | | 455,116,137 |
| Other Assets, Less Liabilities | (0.1) | | (548,158) |
| Net Assets | 100.0% | | $ 454,567,979 |
| † | Percentages indicated are based on Portfolio net assets. |
| (a) | Non-income producing security. |
| (b) | All or a portion of this security was held on loan. As of December 31, 2022, the aggregate market value of securities on loan was $860,893. The Portfolio received cash collateral with a value of $877,728. (See Note 2(J)) |
| (c) | Current yield as of December 31, 2022. |
| (d) | Represents a security purchased with cash collateral received for securities on loan. |
Investments in Affiliates (in 000's)
Investments in issuers considered to be affiliate(s) of the Portfolio during the year ended December 31, 2022 for purposes of Section 2(a)(3) of the Investment Company Act of 1940, as amended, were as follows:
| Affiliated Investment Companies | Value,
Beginning
of Year | Purchases
at Cost | Proceeds
from
Sales | Net
Realized
Gain/(Loss)
on Sales | Change in
Unrealized
Appreciation/
(Depreciation) | Value,
End of
Year | Dividend
Income | Other
Distributions | Shares
End of
Year |
| MainStay U.S. Government Liquidity Fund | $ 7,977 | $ 68,577 | $ (76,087) | $ — | $ — | $ 467 | $ 11 | $ — | 467 |
The notes to the financial statements are an integral part of, and should be read in conjunction with, the financial statements.
13
Portfolio of Investments December 31, 2022† (continued)
Foreign Currency Forward Contracts
As of December 31, 2022, the Portfolio held the following foreign currency forward contracts1:
| Currency Purchased | Currency Sold | Counterparty | Settlement
Date | Unrealized
Appreciation
(Depreciation) |
| EUR | 160,326 | USD | 171,429 | JPMorgan Chase Bank N.A. | 3/31/23 | $ 1,218 |
| EUR | 103,863 | USD | 111,101 | JPMorgan Chase Bank N.A. | 3/31/23 | 744 |
| EUR | 57,959 | USD | 62,024 | JPMorgan Chase Bank N.A. | 3/31/23 | 389 |
| Total Unrealized Appreciation | 2,351 |
| USD | 2,803,102 | EUR | 2,617,804 | JPMorgan Chase Bank N.A. | 3/31/23 | (15,869) |
| USD | 75,082 | EUR | 70,479 | JPMorgan Chase Bank N.A. | 3/31/23 | (813) |
| Total Unrealized Depreciation | (16,682) |
| Net Unrealized Depreciation | $ (14,331) |
| 1. | Foreign Currency Forward Contracts are subject to limitations such that they cannot be “sold or repurchased,” although the Portfolio would be able to exit the transaction through other means, such as through the execution of an offsetting transaction. |
| Abbreviation(s): |
| ETF—Exchange-Traded Fund |
| EUR—Euro |
| SPDR—Standard & Poor’s Depositary Receipt |
| USD—United States Dollar |
The following is a summary of the fair valuations according to the inputs used as of December 31, 2022, for valuing the Portfolio’s assets and liabilities:
| Description | Quoted
Prices in
Active
Markets for
Identical
Assets
(Level 1) | | Significant
Other
Observable
Inputs
(Level 2) | | Significant
Unobservable
Inputs
(Level 3) | | Total |
| Asset Valuation Inputs | | | | | | | |
| Investments in Securities (a) | | | | | | | |
| Common Stocks | | | | | | | |
| Pharmaceuticals | $ 17,048,246 | | $ 3,720,384 | | $ — | | $ 20,768,630 |
| Semiconductors & Semiconductor Equipment | 20,378,617 | | 2,952,809 | | — | | 23,331,426 |
| All Other Industries | 406,694,064 | | — | | — | | 406,694,064 |
| Total Common Stocks | 444,120,927 | | 6,673,193 | | — | | 450,794,120 |
| Exchange-Traded Fund | 2,976,835 | | — | | — | | 2,976,835 |
| Short-Term Investments | | | | | | | |
| Affiliated Investment Company | 467,454 | | — | | — | | 467,454 |
| Unaffiliated Investment Company | 877,728 | | — | | — | | 877,728 |
| Total Short-Term Investments | 1,345,182 | | — | | — | | 1,345,182 |
| Total Investments in Securities | 448,442,944 | | 6,673,193 | | — | | 455,116,137 |
| Other Financial Instruments | | | | | | | |
| Foreign Currency Forward Contracts (b) | — | | 2,351 | | — | | 2,351 |
| Total Investments in Securities and Other Financial Instruments | $ 448,442,944 | | $ 6,675,544 | | $ — | | $ 455,118,488 |
| Liability Valuation Inputs | | | | | | | |
| Other Financial Instruments | | | | | | | |
| Foreign Currency Forward Contracts (b) | $ — | | $ (16,682) | | $ — | | $ (16,682) |
| (a) | For a complete listing of investments and their industries, see the Portfolio of Investments. |
| (b) | The value listed for these securities reflects unrealized appreciation (depreciation) as shown on the Portfolio of Investments. |
The notes to the financial statements are an integral part of, and should be read in conjunction with, the financial statements.
| 14 | MainStay VP American Century Sustainable Equity Portfolio |
Statement of Assets and Liabilities as of December 31, 2022
| Assets |
Investment in unaffiliated securities, at value
(identified cost $488,042,457) including securities on loan of $860,893 | $454,648,683 |
Investment in affiliated investment companies, at value
(identified cost $467,454) | 467,454 |
| Receivables: | |
| Investment securities sold | 449,559 |
| Dividends | 402,341 |
| Portfolio shares sold | 12,787 |
| Securities lending | 2,153 |
| Unrealized appreciation on foreign currency forward contracts | 2,351 |
| Other assets | 4,029 |
| Total assets | 455,989,357 |
| Liabilities |
| Cash collateral received for securities on loan | 877,728 |
| Due to custodian | 675 |
| Payables: | |
| Manager (See Note 3) | 250,515 |
| Portfolio shares redeemed | 169,317 |
| NYLIFE Distributors (See Note 3) | 37,955 |
| Professional fees | 34,668 |
| Shareholder communication | 18,256 |
| Custodian | 3,651 |
| Accrued expenses | 11,931 |
| Unrealized depreciation on foreign currency forward contracts | 16,682 |
| Total liabilities | 1,421,378 |
| Net assets | $454,567,979 |
| Composition of Net Assets |
| Shares of beneficial interest outstanding (par value of $.001 per share) unlimited number of shares authorized | $ 41,130 |
| Additional paid-in-capital | 342,066,088 |
| | 342,107,218 |
| Total distributable earnings (loss) | 112,460,761 |
| Net assets | $454,567,979 |
| Initial Class | |
| Net assets applicable to outstanding shares | $281,471,355 |
| Shares of beneficial interest outstanding | 25,432,573 |
| Net asset value per share outstanding | $ 11.07 |
| Service Class | |
| Net assets applicable to outstanding shares | $173,096,624 |
| Shares of beneficial interest outstanding | 15,697,227 |
| Net asset value per share outstanding | $ 11.03 |
The notes to the financial statements are an integral part of, and should be read in conjunction with, the financial statements.
15
Statement of Operations for the year ended December 31, 2022
| Investment Income (Loss) |
| Income | |
| Dividends-unaffiliated (net of foreign tax withholding of $89,785) | $ 8,659,956 |
| Securities lending, net | 12,812 |
| Dividends-affiliated | 10,968 |
| Total income | 8,683,736 |
| Expenses | |
| Manager (See Note 3) | 3,311,247 |
| Distribution/Service—Service Class (See Note 3) | 493,648 |
| Professional fees | 103,923 |
| Shareholder communication | 41,486 |
| Custodian | 22,635 |
| Trustees | 10,317 |
| Miscellaneous | 27,324 |
| Total expenses | 4,010,580 |
| Net investment income (loss) | 4,673,156 |
| Realized and Unrealized Gain (Loss) |
| Net realized gain (loss) on: | |
| Unaffiliated investment transactions | 145,810,295 |
| Futures transactions | 32,451 |
| Foreign currency transactions | (17,332) |
| Foreign currency forward transactions | 9,547 |
| Net realized gain (loss) | 145,834,961 |
| Net change in unrealized appreciation (depreciation) on: | |
| Unaffiliated investments | (190,229,945) |
| Foreign currency forward contracts | (14,331) |
| Translation of other assets and liabilities in foreign currencies | (2,499) |
| Net change in unrealized appreciation (depreciation) | (190,246,775) |
| Net realized and unrealized gain (loss) | (44,411,814) |
| Net increase (decrease) in net assets resulting from operations | $ (39,738,658) |
The notes to the financial statements are an integral part of, and should be read in conjunction with, the financial statements.
| 16 | MainStay VP American Century Sustainable Equity Portfolio |
Statements of Changes in Net Assets
for the years ended December 31, 2022 and December 31, 2021
| | 2022 | 2021 |
| Increase (Decrease) in Net Assets |
| Operations: | | |
| Net investment income (loss) | $ 4,673,156 | $ 7,902,908 |
| Net realized gain (loss) | 145,834,961 | 58,112,895 |
| Net change in unrealized appreciation (depreciation) | (190,246,775) | 56,572,246 |
| Net increase (decrease) in net assets resulting from operations | (39,738,658) | 122,588,049 |
| Distributions to shareholders: | | |
| Initial Class | (38,151,110) | (12,318,709) |
| Service Class | (23,305,146) | (8,560,289) |
| Total distributions to shareholders | (61,456,256) | (20,878,998) |
| Capital share transactions: | | |
| Net proceeds from sales of shares | 21,588,692 | 11,605,051 |
| Net asset value of shares issued to shareholders in reinvestment of distributions | 61,456,256 | 20,878,998 |
| Cost of shares redeemed | (80,669,845) | (110,225,246) |
| Increase (decrease) in net assets derived from capital share transactions | 2,375,103 | (77,741,197) |
| Net increase (decrease) in net assets | (98,819,811) | 23,967,854 |
| Net Assets |
| Beginning of year | 553,387,790 | 529,419,936 |
| End of year | $ 454,567,979 | $ 553,387,790 |
The notes to the financial statements are an integral part of, and should be read in conjunction with, the financial statements.
17
Financial Highlights selected per share data and ratios
| | Year Ended December 31, |
| Initial Class | 2022 | | 2021 | | 2020 | | 2019 | | 2018 |
| Net asset value at beginning of year | $ 13.93 | | $ 11.56 | | $ 12.89 | | $ 11.39 | | $ 14.10 |
| Net investment income (loss) (a) | 0.13 | | 0.21 | | 0.25 | | 0.29 | | 0.29 |
| Net realized and unrealized gain (loss) | (1.30) | | 2.71 | | (0.33) | | 2.58 | | (1.40) |
| Total from investment operations | (1.17) | | 2.92 | | (0.08) | | 2.87 | | (1.11) |
| Less distributions: | | | | | | | | | |
| From net investment income | (0.23) | | (0.34) | | (0.40) | | (0.31) | | (0.29) |
| From net realized gain on investments | (1.46) | | (0.21) | | (0.85) | | (1.06) | | (1.31) |
| Total distributions | (1.69) | | (0.55) | | (1.25) | | (1.37) | | (1.60) |
| Net asset value at end of year | $ 11.07 | | $ 13.93 | | $ 11.56 | | $ 12.89 | | $ 11.39 |
| Total investment return (b) | (7.70)% | | 25.49% | | 0.96% | | 26.36%(c) | | (9.38)% |
| Ratios (to average net assets)/Supplemental Data: | | | | | | | | | |
| Net investment income (loss) | 1.03% | | 1.57% | | 2.32% | | 2.30% | | 2.11% |
| Net expenses (d) | 0.70% | | 0.76% | | 0.76% | | 0.75% | | 0.77% |
| Portfolio turnover rate | 20% | | 18% | | 28% | | 16% | | 22% |
| Net assets at end of year (in 000's) | $ 281,471 | | $ 324,378 | | $ 302,584 | | $ 464,120 | | $ 431,672 |
| (a) | Per share data based on average shares outstanding during the year. |
| (b) | Total return does not reflect any deduction of sales charges, mortality and expense charges, contract charges or administrative charges. For periods of less than one year, total return is not annualized. |
| (c) | In 2019, the Portfolio’s total investment return includes impact of payments from affiliates due to trade communications error. Excluding these items, total return would have been 26.36%. |
| (d) | In addition to the fees and expenses which the Portfolio bears directly, it also indirectly bears a pro-rata share of the fees and expenses of the underlying funds in which it invests. Such indirect expenses are not included in the above expense ratios. |
| | Year Ended December 31, |
| Service Class | 2022 | | 2021 | | 2020 | | 2019 | | 2018 |
| Net asset value at beginning of year | $ 13.87 | | $ 11.51 | | $ 12.83 | | $ 11.34 | | $ 14.04 |
| Net investment income (loss) (a) | 0.10 | | 0.17 | | 0.22 | | 0.26 | | 0.25 |
| Net realized and unrealized gain (loss) | (1.29) | | 2.71 | | (0.33) | | 2.56 | | (1.39) |
| Total from investment operations | (1.19) | | 2.88 | | (0.11) | | 2.82 | | (1.14) |
| Less distributions: | | | | | | | | | |
| From net investment income | (0.19) | | (0.31) | | (0.36) | | (0.27) | | (0.25) |
| From net realized gain on investments | (1.46) | | (0.21) | | (0.85) | | (1.06) | | (1.31) |
| Total distributions | (1.65) | | (0.52) | | (1.21) | | (1.33) | | (1.56) |
| Net asset value at end of year | $ 11.03 | | $ 13.87 | | $ 11.51 | | $ 12.83 | | $ 11.34 |
| Total investment return (b) | (7.93)% | | 25.18% | | 0.71% | | 26.04%(c) | | (9.61)% |
| Ratios (to average net assets)/Supplemental Data: | | | | | | | | | |
| Net investment income (loss) | 0.79% | | 1.32% | | 2.05% | | 2.05% | | 1.84% |
| Net expenses (d) | 0.95% | | 1.01% | | 1.01% | | 1.00% | | 1.02% |
| Portfolio turnover rate | 20% | | 18% | | 28% | | 16% | | 22% |
| Net assets at end of year (in 000's) | $ 173,097 | | $ 229,010 | | $ 226,836 | | $ 262,717 | | $ 257,159 |
| (a) | Per share data based on average shares outstanding during the year. |
| (b) | Total return does not reflect any deduction of sales charges, mortality and expense charges, contract charges or administrative charges. For periods of less than one year, total return is not annualized. |
| (c) | In 2019, the Portfolio’s total investment return includes impact of payments from affiliates due to trade communications error. Excluding these items, total return would have been 26.04%. |
| (d) | In addition to the fees and expenses which the Portfolio bears directly, it also indirectly bears a pro-rata share of the fees and expenses of the underlying funds in which it invests. Such indirect expenses are not included in the above expense ratios. |
The notes to the financial statements are an integral part of, and should be read in conjunction with, the financial statements.
| 18 | MainStay VP American Century Sustainable Equity Portfolio |
Notes to Financial Statements
Note 1–Organization and Business
MainStay VP Funds Trust (the “Fund”) was organized as a Delaware statutory trust on February 1, 2011. The Fund is registered under the Investment Company Act of 1940, as amended (the “1940 Act”), as an open-end management investment company. The Fund is comprised of thirty-one separate series (collectively referred to as the “Portfolios”). These financial statements and notes relate to the MainStay VP American Century Sustainable Equity Portfolio (formerly known as MainStay VP T. Rowe Price Equity Income Portfolio) (the "Portfolio"), a "diversified” portfolio, as that term is defined in the 1940 Act, as interpreted or modified by regulatory authorities having jurisdiction, from time to time.
Shares of the Portfolio are currently offered to certain separate accounts to fund variable annuity policies and variable universal life insurance policies issued by New York Life Insurance and Annuity Corporation (“NYLIAC”), a wholly-owned subsidiary of New York Life Insurance Company (“New York Life”) and may also be offered to fund variable annuity policies and variable universal life insurance policies issued by other insurance companies. NYLIAC allocates shares of the Portfolio to, among others, certain NYLIAC separate accounts. Shares of the Portfolio are also offered to the MainStay VP Conservative Allocation Portfolio, MainStay VP Moderate Allocation Portfolio, MainStay VP Growth Allocation Portfolio and MainStay VP Equity Allocation Portfolio, which operate as “funds-of-funds," and other variable insurance funds.
The following table lists the Portfolio's share classes that have been registered and commenced operations:
| Class | Commenced Operations |
| Initial Class | February 17, 2012 |
| Service Class | February 17, 2012 |
Shares of the Portfolio are offered and are redeemed at a price equal to their respective net asset value (“NAV”) per share. No sales or redemption charge is applicable to the purchase or redemption of the Portfolio's shares. Under the terms of the Fund’s multiple class plan, adopted pursuant to Rule 18f-3 under the 1940 Act, the classes differ in that, among other things, Service Class shares of the Portfolio pay a combined distribution and service fee of 0.25% of average daily net assets attributable to Service Class shares of the Portfolio to the Distributor (as defined in Note 3(B)) pursuant to a plan adopted in accordance with Rule 12b-1 under the 1940 Act. Contract owners of variable annuity contracts purchased after June 2, 2003, are permitted to invest only in the Service Class shares.
The Portfolio's investment objective is to seek a high level of dividend income and long-term capital growth primarily through investments in stocks.
Note 2–Significant Accounting Policies
The Portfolio is an investment company and accordingly follows the investment company accounting and reporting guidance of the Financial Accounting Standards Board (“FASB”) Accounting Standards Codification
Topic 946 Financial Services—Investment Companies. The Portfolio prepares its financial statements in accordance with generally accepted accounting principles (“GAAP”) in the United States of America and follows the significant accounting policies described below.
(A) Securities Valuation. Investments are usually valued as of the close of regular trading on the New York Stock Exchange (the "Exchange") (usually 4:00 p.m. Eastern time) on each day the Portfolio is open for business ("valuation date").
Effective September 8, 2022, and pursuant to Rule 2a-5 under the 1940 Act, the Board of Trustees of the Fund (the "Board") designated New York Life Investment Management LLC (“New York Life Investments” or the "Manager") as its Valuation Designee (the "Valuation Designee"). The Valuation Designee is responsible for performing fair valuations relating to all investments in the Portfolio’s portfolio for which market quotations are not readily available; periodically assessing and managing material valuation risks; establishing and applying fair value methodologies; testing fair valuation methodologies; evaluating and overseeing pricing services; ensuring appropriate segregation of valuation and portfolio management functions; providing quarterly, annual and prompt reporting to the Board, as appropriate; identifying potential conflicts of interest; and maintaining appropriate records. The Valuation Designee has established a valuation committee ("Valuation Committee") to assist in carrying out the Valuation Designee’s responsibilities and establish prices of securities for which market quotations are not readily available. The Portfolio’s and the Valuation Designee's policies and procedures ("Valuation Procedures") govern the Valuation Designee’s selection and application of methodologies for determining and calculating the fair value of Portfolio investments. The Valuation Designee may value the Portfolio's portfolio securities for which market quotations are not readily available and other Portfolio assets utilizing inputs from pricing services and other third-party sources (together, “Pricing Sources”). The Valuation Committee meets (in person, via electronic mail or via teleconference) on an ad-hoc basis to determine fair valuations and on a quarterly basis to review fair value events with respect to certain securities for which market quotations are not readily available, including valuation risks and back-testing results, and preview reports to the Board.
The Valuation Committee establishes prices of securities for which market quotations are not readily available based on such methodologies and measurements on a regular basis after considering information that is reasonably available and deemed relevant by the Valuation Committee. The Board shall oversee the Valuation Designee and review fair valuation materials on a prompt, quarterly and annual basis and approve proposed revisions to the Valuation Procedures.
Investments for which market quotations are not readily available are valued at fair value as determined in good faith pursuant to the Valuation Procedures. A market quotation is readily available only when that quotation is a quoted price (unadjusted) in active markets for identical investments that the Portfolio can access at the measurement date, provided that a quotation will not be readily available if it is not reliable. "Fair value" is defined as the price the Portfolio would reasonably expect
Notes to Financial Statements (continued)
to receive upon selling an asset or liability in an orderly transaction to an independent buyer in the principal or most advantageous market for the asset or liability. Fair value measurements are determined within a framework that establishes a three-tier hierarchy that maximizes the use of observable market data and minimizes the use of unobservable inputs to establish a classification of fair value measurements for disclosure purposes. "Inputs" refer broadly to the assumptions that market participants would use in pricing the asset or liability, including assumptions about risk, such as the risk inherent in a particular valuation technique used to measure fair value using a pricing model and/or the risk inherent in the inputs for the valuation technique. Inputs may be observable or unobservable. Observable inputs reflect the assumptions market participants would use in pricing the asset or liability based on market data obtained from sources independent of the Portfolio. Unobservable inputs reflect the Portfolio’s own assumptions about the assumptions market participants would use in pricing the asset or liability based on the information available. The inputs or methodology used for valuing assets or liabilities may not be an indication of the risks associated with investing in those assets or liabilities. The three-tier hierarchy of inputs is summarized below.
| • | Level 1—quoted prices (unadjusted) in active markets for an identical asset or liability |
| • | Level 2—other significant observable inputs (including quoted prices for a similar asset or liability in active markets, interest rates and yield curves, prepayment speeds, credit risk, etc.) |
| • | Level 3—significant unobservable inputs (including the Portfolio's own assumptions about the assumptions that market participants would use in measuring fair value of an asset or liability) |
The level of an asset or liability within the fair value hierarchy is based on the lowest level of an input, both individually and in the aggregate, that is significant to the fair value measurement. The aggregate value by input level of the Portfolio’s assets and liabilities as of December 31, 2022, is included at the end of the Portfolio of Investments.
The Portfolio may use third-party vendor evaluations, whose prices may be derived from one or more of the following standard inputs, among others:
| • Benchmark yields | • Reported trades |
| • Broker/dealer quotes | • Issuer spreads |
| • Two-sided markets | • Benchmark securities |
| • Bids/offers | • Reference data (corporate actions or material event notices) |
| • Industry and economic events | • Comparable bonds |
| • Monthly payment information | |
An asset or liability for which a market quotation is not readily available is valued by methods deemed reasonable in good faith by the Valuation Committee, following the Valuation Procedures to represent fair value. Under these procedures, the Valuation Designee generally uses a market-based approach which may use related or comparable assets or
liabilities, recent transactions, market multiples, book values and other relevant information. The Valuation Designee may also use an income-based valuation approach in which the anticipated future cash flows of the asset or liability are discounted to calculate fair value. Discounts may also be applied due to the nature and/or duration of any restrictions on the disposition of the asset or liability. Fair value represents a good faith approximation of the value of a security. Fair value determinations involve the consideration of a number of subjective factors, an analysis of applicable facts and circumstances and the exercise of judgment. As a result, it is possible that the fair value for a security determined in good faith in accordance with the Valuation Procedures may differ from valuations for the same security determined for other funds using their own valuation procedures. Although the Valuation Procedures are designed to value a security at the price the Portfolio may reasonably expect to receive upon the security's sale in an orderly transaction, there can be no assurance that any fair value determination thereunder would, in fact, approximate the amount that the Portfolio would actually realize upon the sale of the security or the price at which the security would trade if a reliable market price were readily available. During the year ended December 31, 2022, there were no material changes to the fair value methodologies.
Securities which may be valued in this manner include, but are not limited to: (i) a security for which trading has been halted or suspended or otherwise does not have a readily available market quotation on a given day; (ii) a debt security that has recently gone into default and for which there is not a current market quotation; (iii) a security of an issuer that has entered into a restructuring; (iv) a security that has been delisted from a national exchange; (v) a security subject to trading collars for which no or limited trading takes place; and (vi) a security whose principal market has been temporarily closed at a time when, under normal conditions, it would be open. Securities valued in this manner are generally categorized as Level 2 or 3 in the hierarchy.
Equity securities are valued at the last quoted sales prices as of the close of regular trading on the relevant exchange on each valuation date. Securities that are not traded on the valuation date are valued at the mean of the last quoted bid and ask prices. Prices are normally taken from the principal market in which each security trades. These securities are generally categorized as Level 1 in the hierarchy.
Exchange-traded funds (“ETFs”) are valued at the last quoted sales prices as of the close of regular trading on the relevant exchange on each valuation date. Securities that are not traded on the valuation date are valued at the mean of the last quoted bid and ask prices. Prices are normally taken from the principal market in which each security trades. These securities are generally categorized as Level 1 in the hierarchy.
Investments in mutual funds, including money market funds, are valued at their respective NAVs at the close of business each day on the valuation date. These securities are generally categorized as Level 1 in the hierarchy.
Foreign currency forward contracts are valued at their fair market values measured on the basis of the mean between the last current bid and ask
| 20 | MainStay VP American Century Sustainable Equity Portfolio |
prices based on dealer or exchange quotations and are generally categorized as Level 2 in the hierarchy.
Temporary cash investments acquired in excess of 60 days to maturity at the time of purchase are valued using the latest bid prices or using valuations based on a matrix system (which considers such factors as security prices, yields, maturities and ratings), both as furnished by independent pricing services. Temporary cash investments that mature in 60 days or less at the time of purchase ("Short-Term Investments") are valued using the amortized cost method of valuation, unless the use of such method would be inappropriate. The amortized cost method involves valuing a security at its cost on the date of purchase and thereafter assuming a constant amortization to maturity of the difference between such cost and the value on maturity date. Amortized cost approximates the current fair value of a security. Securities valued using the amortized cost method are not valued using quoted prices in an active market and are generally categorized as Level 2 in the hierarchy.
The information above is not intended to reflect an exhaustive list of the methodologies that may be used to value portfolio investments. The Valuation Procedures permit the use of a variety of valuation methodologies in connection with valuing portfolio investments. The methodology used for a specific type of investment may vary based on the market data available or other considerations. The methodologies summarized above may not represent the specific means by which portfolio investments are valued on any particular business day.
(B) Income Taxes. The Portfolio's policy is to comply with the requirements of the Internal Revenue Code of 1986, as amended (the “Internal Revenue Code”), applicable to regulated investment companies and to distribute all of its taxable income to the shareholders of the Portfolio within the allowable time limits.
The Manager evaluates the Portfolio’s tax positions to determine if the tax positions taken meet the minimum recognition threshold in connection with accounting for uncertainties in income tax positions taken or expected to be taken for the purposes of measuring and recognizing tax liabilities in the financial statements. Recognition of tax benefits of an uncertain tax position is permitted only to the extent the position is “more likely than not” to be sustained assuming examination by taxing authorities. The Manager analyzed the Portfolio's tax positions taken on federal, state and local income tax returns for all open tax years (for up to three tax years) and has concluded that no provisions for federal, state and local income tax are required in the Portfolio's financial statements. The Portfolio's federal, state and local income tax and federal excise tax returns for tax years for which the applicable statutes of limitations have not expired are subject to examination by the Internal Revenue Service and state and local departments of revenue.
(C) Dividends and Distributions to Shareholders. Dividends and distributions are recorded on the ex-dividend date. The Portfolio intends to declare and pay dividends from net investment income and distributions from net realized capital and currency gains, if any, at least annually. All dividends and distributions are reinvested at NAV in the same
class of shares of the Portfolio. Dividends and distributions to shareholders are determined in accordance with federal income tax regulations and may differ from determinations using GAAP.
(D) Security Transactions and Investment Income. The Portfolio records security transactions on the trade date. Realized gains and losses on security transactions are determined using the identified cost method. Dividend income is recognized on the ex-dividend date, net of any foreign tax withheld at the source, and interest income is accrued as earned using the effective interest rate method and includes any realized gains and losses from repayments of principal on mortgage-backed securities. Distributions received from real estate investment trusts may be classified as dividends, capital gains and/or return of capital. Discounts and premiums on securities purchased for the Portfolio are accreted and amortized, respectively, on the effective interest rate method.
Investment income and realized and unrealized gains and losses on investments of the Portfolio are allocated pro rata to the separate classes of shares based upon their relative net assets on the date the income is earned or realized and unrealized gains and losses are incurred.
(E) Expenses. Expenses of the Fund are allocated to the individual Portfolios in proportion to the net assets of the respective Portfolios when the expenses are incurred, except where direct allocations of expenses can be made. Expenses (other than fees incurred under the distribution and service plans, further discussed in Note 3(B), which are charged directly to the Service Class shares) are allocated to separate classes of shares pro rata based upon their relative net assets on the date the expenses are incurred. The expenses borne by the Portfolio, including those of related parties to the Portfolio, are shown in the Statement of Operations.
Additionally, the Portfolio may invest in mutual funds, which are subject to management fees and other fees that may cause the costs of investing in mutual funds to be greater than the costs of owning the underlying securities directly. These indirect expenses of mutual funds are not included in the amounts shown as expenses in the Statement of Operations or in the expense ratios included in the Financial Highlights.
(F) Use of Estimates. In preparing financial statements in conformity with GAAP, the Manager makes estimates and assumptions that affect the reported amounts and disclosures in the financial statements. Actual results could differ from those estimates and assumptions.
(G) Futures Contracts. A futures contract is an agreement to purchase or sell a specified quantity of an underlying instrument at a specified future date and price, or to make or receive a cash payment based on the value of a financial instrument (e.g., foreign currency, interest rate, security or securities index). The Portfolio is subject to risks such as market price risk, leverage risk, liquidity risk, counterparty risk, operational risk, legal risk and/or interest rate risk in the normal course of investing in these contracts. Upon entering into a futures contract, the Portfolio is required to pledge to the broker or futures commission merchant an amount of cash and/or U.S. government securities equal to a certain percentage of the collateral amount, known as the “initial
Notes to Financial Statements (continued)
margin.” During the period the futures contract is open, changes in the value of the contract are recognized as unrealized appreciation or depreciation by marking to market such contract on a daily basis to reflect the market value of the contract at the end of each day’s trading. The Portfolio agrees to receive from or pay to the broker or futures commission merchant an amount of cash equal to the daily fluctuation in the value of the contract. Such receipts or payments are known as “variation margin.” When the futures contract is closed, the Portfolio records a realized gain or loss equal to the difference between the proceeds from (or cost of) the closing transaction and the Portfolio's basis in the contract.
The use of futures contracts involves, to varying degrees, elements of market risk in excess of the amount recognized in the Statement of Assets and Liabilities. The contract or notional amounts and variation margin reflect the extent of the Portfolio's involvement in open futures positions. There are several risks associated with the use of futures contracts as hedging techniques. There can be no assurance that a liquid market will exist at the time when the Portfolio seeks to close out a futures contract. If no liquid market exists, the Portfolio would remain obligated to meet margin requirements until the position is closed. Futures contracts may involve a small initial investment relative to the risk assumed, which could result in losses greater than if the Portfolio did not invest in futures contracts. Futures contracts may be more volatile than direct investments in the instrument underlying the futures and may not correlate to the underlying instrument, causing a given hedge not to achieve its objectives. The Portfolio's activities in futures contracts have minimal counterparty risk as they are conducted through regulated exchanges that guarantee the futures against default by the counterparty. In the event of a bankruptcy or insolvency of a futures commission merchant that holds margin on behalf of the Portfolio, the Portfolio may not be entitled to the return of the entire margin owed to the Portfolio, potentially resulting in a loss. The Portfolio may invest in futures contracts to seek enhanced returns or to reduce the risk of loss by hedging certain of its holdings. The Portfolio's investment in futures contracts and other derivatives may increase the volatility of the Portfolio's NAVs and may result in a loss to the Portfolio. As of December 31, 2022, the Portfolio did not hold any open futures contracts.
(H) Foreign Currency Forward Contracts. The Portfolio may enter into foreign currency forward contracts, which are agreements to buy or sell foreign currencies on a specified future date at a specified rate. The Portfolio is subject to foreign currency exchange rate risk in the normal course of investing in these transactions. During the period the forward contract is open, changes in the value of the contract are recognized as unrealized appreciation or depreciation by marking to market such contract on a daily basis to reflect the market value of the contract at the end of each day’s trading. Cash movement occurs on the settlement date. When the forward contract is closed, the Portfolio records a realized gain or loss equal to the difference between the proceeds from (or cost of) the closing transaction and the Portfolio's basis in the contract. The Portfolio may purchase and sell foreign currency forward contracts for purposes of seeking to enhance portfolio returns and manage portfolio risk more
efficiently. Foreign currency forward contracts may also be used to gain exposure to a particular currency or to hedge against the risk of loss due to changing currency exchange rates. Foreign currency forward contracts to purchase or sell a foreign currency may also be used in anticipation of future purchases or sales of securities denominated in foreign currency, even if the specific investments have not yet been selected.
The use of foreign currency forward contracts involves, to varying degrees, elements of risk in excess of the amount recognized in the Statement of Assets and Liabilities, including counterparty risk, market risk, leverage risk, operational risk, legal risk and liquidity risk. Counterparty risk is heightened for these instruments because foreign currency forward contracts are not exchange-traded and therefore no clearinghouse or exchange stands ready to meet the obligations under such contracts. Thus, the Portfolio faces the risk that its counterparties under such contracts may not perform their obligations. Market risk is the risk that the value of a foreign currency forward contract will depreciate due to unfavorable changes in exchange rates. Liquidity risk arises because the secondary market for foreign currency forward contracts may have less liquidity relative to markets for other securities and financial instruments. Liquidity risk also can arise when forward currency contracts create margin or settlement payment obligations for the Fund. Leverage risk is the risk that a foreign currency forward contract can magnify the Portfolio's gains and losses. Operational risk refers to risk related to potential operational issues (including documentation issues, settlement issues, systems failures, inadequate controls and human error), and legal risk refers to insufficient documentation, insufficient capacity or authority of the counterparty, or legality or enforceability of a foreign currency forward contract. Risks also arise from the possible movements in the foreign exchange rates underlying these instruments. While the Portfolio may enter into forward contracts to reduce currency exchange risks, changes in currency exchange rates may result in poorer overall performance for the Portfolio than if it had not engaged in such transactions. Exchange rate movements can be large, depending on the currency, and can last for extended periods of time, affecting the value of the Portfolio's assets. Moreover, there may be an imperfect correlation between the Portfolio's holdings of securities denominated in a particular currency and forward contracts entered into by the Portfolio. Such imperfect correlation may prevent the Portfolio from achieving the intended hedge or expose the Portfolio to the risk of currency exchange loss. The unrealized appreciation (depreciation) on forward contracts also reflects the Portfolio's exposure at the valuation date to credit loss in the event of a counterparty’s failure to perform its obligations. Open foreign currency forward contracts as of December 31, 2022, are shown in the Portfolio of Investments.
(I) Foreign Currency Transactions. The Portfolio's books and records are maintained in U.S. dollars. Prices of securities denominated in foreign currency amounts are translated into U.S. dollars at the mean
| 22 | MainStay VP American Century Sustainable Equity Portfolio |
between the buying and selling rates last quoted by any major U.S. bank at the following dates:
(i) market value of investment securities, other assets and liabilities— at the valuation date; and
(ii) purchases and sales of investment securities, income and expenses—at the date of such transactions.
The assets and liabilities that are denominated in foreign currency amounts are presented at the exchange rates and market values at the close of the period. The realized and unrealized changes in net assets arising from fluctuations in exchange rates and market prices of securities are not separately presented.
Net realized gain (loss) on foreign currency transactions represents net currency gains or losses realized as a result of differences between the amounts of securities sale proceeds or purchase cost, dividends, interest and withholding taxes as recorded on the Portfolio's books, and the U.S. dollar equivalent amount actually received or paid. Net currency gains or losses from valuing such foreign currency denominated assets and liabilities, other than investments at valuation date exchange rates, are reflected in unrealized foreign exchange gains or losses.
(J) Securities Lending. In order to realize additional income, the Portfolio may engage in securities lending, subject to the limitations set forth in the 1940 Act and relevant guidance by the staff of the Securities and Exchange Commission (“SEC”). If the Portfolio engages in securities lending, the Portfolio will lend through its custodian, JPMorgan Chase Bank, N.A., ("JPMorgan"), acting as securities lending agent on behalf of the Portfolio. Under the current arrangement, JPMorgan will manage the Portfolio's collateral in accordance with the securities lending agency agreement between the Portfolio and JPMorgan, and indemnify the Portfolio against counterparty risk. The loans will be collateralized by cash (which may be invested in a money market fund) and/or non-cash collateral (which may include U.S. Treasury securities and/or U.S. government agency securities issued or guaranteed by the United States government or its agencies or instrumentalities) at least equal at all times to the market value of the securities loaned. Non-cash collateral held at year end is segregated and cannot be transferred by the Portfolio. The Portfolio bears the risk of delay in recovery of, or loss of rights in, the securities loaned. The Portfolio may also record a realized gain or loss on securities deemed sold due to a borrower’s inability to return securities on loan. The Portfolio bears the risk of any loss on investment of cash collateral. The Portfolio will receive compensation for lending its securities in the form of fees or it will retain a portion of interest earned on the investment of any cash collateral. The Portfolio will also continue to receive interest and dividends on the securities loaned and any gain or loss in the market price of the securities loaned that may occur during the term of the loan will be for the account of the Portfolio. Income earned from securities lending activities, if any, is reflected in the Statement of Operations. Securities on loan as of December 31, 2022, are shown in the Portfolio of Investments.
(K) Securities Risk. The ability of issuers of debt securities held by the Portfolio to meet their obligations may be affected by, among other things, economic or political developments in a specific country, industry or region. Debt securities are also subject to the risks associated with changes in interest rates.
Convertible securities may be subordinate to other securities. In part, the total return for a convertible security depends upon the performance of the underlying stock into which it can be converted. Also, issuers of convertible securities are often not as strong financially as those issuing securities with higher credit ratings, are more likely to encounter financial difficulties and typically are more vulnerable to changes in the economy, such as a recession or a sustained period of rising interest rates, which could affect their ability to make interest and principal payments.
The Portfolio invests in foreign securities, which carry certain risks that are in addition to the usual risks inherent in domestic securities. These risks include those resulting from currency fluctuations, future adverse political or economic developments and possible imposition of currency exchange blockages or other foreign governmental laws or restrictions. These risks are likely to be greater in emerging markets than in developed markets. The ability of issuers of securities held by the Portfolio to meet their obligations may be affected by, among other things, economic or political developments in a specific country, industry or region.
(L) Indemnifications. Under the Fund’s organizational documents, its officers and trustees are indemnified against certain liabilities that may arise out of performance of their duties to the Fund. Additionally, in the normal course of business, the Portfolio enters into contracts with third-party service providers that contain a variety of representations and warranties and that may provide general indemnifications. The Portfolio's maximum exposure under these arrangements is unknown, as this would involve future claims that may be made against the Portfolio that have not yet occurred. The Manager believes that the risk of loss in connection with these potential indemnification obligations is remote. However, there can be no assurance that material liabilities related to such obligations will not arise in the future, which could adversely impact the Portfolio.
(M) Quantitative Disclosure of Derivative Holdings. The following tables show additional disclosures related to the Portfolio's derivative and hedging activities, including how such activities are accounted for and their effect on the Portfolio's financial positions, performance and cash flows.
The Portfolio entered into futures contracts to manage its exposure to the securities markets or to movements in interest rates and currency values.
The Portfolio entered into foreign currency forward contracts to hedge currency risk due its exposure in foreign securities.
Notes to Financial Statements (continued)
Fair value of derivative instruments as of December 31, 2022:
| Asset Derivatives | Foreign
Exchange
Contracts
Risk | Total |
| Forward Contracts - Unrealized appreciation on foreign currency forward contracts | $2,351 | $2,351 |
| Total Fair Value | $2,351 | $2,351 |
| Liability Derivatives | Foreign
Exchange
Contracts
Risk | Total |
| Forward Contracts - Unrealized depreciation on foreign currency forward contracts | $(16,682) | $(16,682) |
| Total Fair Value | $(16,682) | $(16,682) |
The effect of derivative instruments on the Statement of Operations for the year ended December 31, 2022:
| Net Realized Gain (Loss) from: | Foreign
Exchange
Contracts
Risk | Equity
Contracts
Risk | Total |
| Futures Contracts | $ — | $32,451 | $32,451 |
| Forward Contracts | 9,547 | — | 9,547 |
| Total Net Realized Gain (Loss) | $9,547 | $32,451 | $41,998 |
| Net Change in Unrealized Appreciation (Depreciation) | Foreign
Exchange
Contracts
Risk | Total |
| Forward Contracts | $(14,331) | $(14,331) |
| Total Net Change in Unrealized Appreciation (Depreciation) | $(14,331) | $(14,331) |
| Average Notional Amount | Total |
| Forward Contracts Long (a) | $ 703,733 |
| Forward Contracts Short (a) | $(3,272,281) |
| (a) | Positions were open for eight months during the reporting period. |
Note 3–Fees and Related Party Transactions
(A) Manager and Subadvisor. New York Life Investments, a registered investment adviser and an indirect, wholly-owned subsidiary of New York Life, serves as the Portfolio’s Manager pursuant to an Amended and Restated Management Agreement (“Management Agreement”). The Manager provides offices, conducts clerical, recordkeeping and bookkeeping services, and keeps most of the financial and accounting records required to be maintained by the Portfolio. Except for the portion of salaries and expenses that are the responsibility of the Portfolio, the Manager pays the salaries and expenses of all personnel affiliated with the Portfolio and certain operational expenses of the Portfolio. During a portion of the year ended December 31, 2022, the Portfolio reimbursed
New York Life Investments in an amount equal to the portion of the compensation of the Chief Compliance Officer attributable to the Portfolio. The Portfolio’s subadvisor changed effective May 1, 2022, due to the replacement of T. Rowe Price Associates, Inc. as the Portfolio’s subadvisor and the appointment of American Century Investment Management, Inc. (“American Century” or the “Subadvisor”) as the Portfolio’s subadvisor. American Century, a registered investment adviser, is responsible for the day-to-day portfolio management of the Portfolio. Pursuant to the terms of a Subadvisory Agreement between New York Life Investments and American Century, New York Life Investments pays for the services of the Subadvisor.
Effective May 1, 2022, pursuant to the Management Agreement, the Portfolio pays the Manager a monthly fee for the services performed and the facilities furnished at an annual rate of the Portfolio’s average daily net assets as follows: 0.63% up to $500 million; 0.61% from $500 million to $1 billion; and 0.585% in excess of $1 billion.
Prior to May 1, 2022, pursuant to the Management Agreement, the Portfolio paid the Manager, on behalf of the Portfolio, a monthly fee for the services performed and the facilities furnished at an annual rate of the Portfolio's average daily net assets as follows: 0.725% up to $500 million; 0.70% from $500 million to $1 billion; and 0.675% in excess of $1 billion. During the year ended December 31, 2022, the effective management fee rate was 0.66%.
During the year ended December 31, 2022, New York Life Investments earned fees from the Portfolio in the amount of $3,311,247 and paid T. Rowe and American Century fees of $533,396 and $704,442, respectively.
JPMorgan provides sub-administration and sub-accounting services to the Portfolio pursuant to an agreement with New York Life Investments. These services include calculating the daily NAVs of the Portfolio, maintaining the general ledger and sub-ledger accounts for the calculation of the Portfolio's NAVs, and assisting New York Life Investments in conducting various aspects of the Portfolio's administrative operations. For providing these services to the Portfolio, JPMorgan is compensated by New York Life Investments.
Pursuant to an agreement between the Fund and New York Life Investments, New York Life Investments is responsible for providing or procuring certain regulatory reporting services for the Portfolio. The Portfolio will reimburse New York Life Investments for the actual costs incurred by New York Life Investments in connection with providing or procuring these services for the Portfolio.
(B) Distribution and Service Fees. The Fund, on behalf of the Portfolio, has entered into a distribution agreement with NYLIFE Distributors LLC (the “Distributor”), an affiliate of New York Life Investments. The Portfolio has adopted a distribution plan (the “Plan”) in accordance with the provisions of Rule 12b-1 under the 1940 Act. Under the Plan, the Distributor has agreed to provide, through its affiliates or independent third parties, various distribution-related, shareholder and administrative support services to the Service Class shareholders. For its
| 24 | MainStay VP American Century Sustainable Equity Portfolio |
services, the Distributor is entitled to a combined distribution and service fee accrued daily and paid monthly at an annual rate of 0.25% of the average daily net assets attributable to the Service Class shares of the Portfolio.
Note 4-Federal Income Tax
As of December 31, 2022, the cost and unrealized appreciation (depreciation) of the Portfolio’s investment portfolio, including applicable derivative contracts and other financial instruments, as determined on a federal income tax basis, were as follows:
| | Federal Tax
Cost | Gross
Unrealized
Appreciation | Gross
Unrealized
(Depreciation) | Net
Unrealized
Appreciation/
(Depreciation) |
| Investments in Securities | $489,113,047 | $26,445,770 | $(60,442,680) | $(33,996,910) |
As of December 31, 2022, the components of accumulated gain (loss) on a tax basis were as follows:
Ordinary
Income | Accumulated
Capital
and Other
Gain (Loss) | Other
Temporary
Differences | Unrealized
Appreciation
(Depreciation) | Total
Accumulated
Gain (Loss) |
| $5,018,229 | $141,443,328 | $— | $(34,000,796) | $112,460,761 |
The difference between book-basis and tax-basis unrealized appreciation (depreciation) is primarily due to wash sale adjustments, and mark to market of forward contracts.
During the years ended December 31, 2022 and December 31, 2021, the tax character of distributions paid as reflected in the Statements of Changes in Net Assets was as follows:
| | 2022 | 2021 |
| Distributions paid from: | | |
| Ordinary Income | $13,654,316 | $14,172,080 |
| Long-Term Capital Gains | 47,801,940 | 6,706,918 |
| Total | $61,456,256 | $20,878,998 |
Note 5–Custodian
JPMorgan is the custodian of cash and securities held by the Portfolio. Custodial fees are charged to the Portfolio based on the Portfolio's net assets and/or the market value of securities held by the Portfolio and the number of certain transactions incurred by the Portfolio.
Note 6–Line of Credit
The Portfolio and certain other funds managed by New York Life Investments maintain a line of credit with a syndicate of banks in order to secure a source of funds for temporary purposes to meet unanticipated or excessive redemption requests.
Effective July 26, 2022, under the credit agreement (the “Credit Agreement”), the aggregate commitment amount is $600,000,000 with an additional uncommitted amount of $100,000,000. The commitment fee is an annual rate of 0.15% of the average commitment amount payable quarterly, regardless of usage, to JPMorgan, who serves as the agent to the syndicate. The commitment fee is allocated among the Portfolio and certain other funds managed by New York Life Investments based upon their respective net assets and other factors. Interest on any revolving credit loan is charged based upon the Federal Funds Rate, Daily Simple Secured Overnight Financing Rate ("SOFR") + 0.10%, or the Overnight Bank Funding Rate, whichever is higher. The Credit Agreement expires on July 25, 2023, although the Portfolio, certain other funds managed by New York Life Investments and the syndicate of banks may renew the Credit Agreement for an additional year on the same or different terms or enter into a credit agreement with a different syndicate of banks. Prior to July 26, 2022, the aggregate commitment amount and the commitment fee were the same as those under the current Credit Agreement. During the year ended December 31, 2022, there were no borrowings made or outstanding with respect to the Portfolio under the Credit Agreement.
Note 7–Interfund Lending Program
Pursuant to an exemptive order issued by the SEC, the Portfolio, along with certain other funds managed by New York Life Investments, may participate in an interfund lending program. The interfund lending program provides an alternative credit facility that permits the Portfolio and certain other funds managed by New York Life Investments to lend or borrow money for temporary purposes directly to or from one another, subject to the conditions of the exemptive order. During the year ended December 31, 2022, there were no interfund loans made or outstanding with respect to the Portfolio.
Note 8–Purchases and Sales of Securities (in 000’s)
During the year ended December 31, 2022, purchases and sales of securities, other than short-term securities, were $100,864 and $140,314, respectively.
Note 9–Capital Share Transactions
Transactions in capital shares for the years ended December 31, 2022 and December 31, 2021, were as follows:
Notes to Financial Statements (continued)
| Initial Class | Shares | Amount |
| Year ended December 31, 2022: | | |
| Shares sold | 1,253,742 | $ 16,610,052 |
| Shares issued to shareholders in reinvestment of distributions | 3,651,418 | 38,151,110 |
| Shares redeemed | (2,760,864) | (35,999,613) |
| Net increase (decrease) | 2,144,296 | $ 18,761,549 |
| Year ended December 31, 2021: | | |
| Shares sold | 677,739 | $ 9,236,783 |
| Shares issued to shareholders in reinvestment of distributions | 926,930 | 12,318,709 |
| Shares redeemed | (4,493,782) | (57,536,915) |
| Net increase (decrease) | (2,889,113) | $(35,981,423) |
| |
| Service Class | Shares | Amount |
| Year ended December 31, 2022: | | |
| Shares sold | 397,512 | $ 4,978,640 |
| Shares issued to shareholders in reinvestment of distributions | 2,237,437 | 23,305,146 |
| Shares redeemed | (3,446,787) | (44,670,232) |
| Net increase (decrease) | (811,838) | $(16,386,446) |
| Year ended December 31, 2021: | | |
| Shares sold | 178,175 | $ 2,368,268 |
| Shares issued to shareholders in reinvestment of distributions | 646,396 | 8,560,289 |
| Shares redeemed | (4,014,733) | (52,688,331) |
| Net increase (decrease) | (3,190,162) | $(41,759,774) |
Note 10–Other Matters
As of the date of this report, interest rates in the United States and many parts of the world, including certain European countries, are ascending from historically low levels. Thus, the Portfolio currently faces a heightened level of risk associated with rising interest rates. This could be driven by a variety of factors, including but not limited to central bank monetary policies, changing inflation or real growth rates, general economic conditions, increasing bond issuances or reduced market demand for low yielding investments.
An outbreak of COVID-19, first detected in December 2019, has developed into a global pandemic and has resulted in travel restrictions, closure of international borders, certain businesses and securities markets, restrictions on securities trading activities, prolonged quarantines, supply chain disruptions, and lower consumer demand, as well as general concern and uncertainty. In 2022, many countries lifted some or all restrictions related to COVID-19. However, the continued impact of COVID-19 and related variants is uncertain and could further adversely affect the global economy, national economies, individual issuers and capital markets in unforeseeable ways and result in a substantial and extended economic downturn. Developments that disrupt global economies and financial markets, such as COVID-19, may magnify factors that affect the Portfolio's performance.
Note 11–Subsequent Events
In connection with the preparation of the financial statements of the Portfolio as of and for the year ended December 31, 2022, events and transactions subsequent to December 31, 2022, through the date the financial statements were issued have been evaluated by the Manager for possible adjustment and/or disclosure. No subsequent events requiring financial statement adjustment or disclosure have been identified.
| 26 | MainStay VP American Century Sustainable Equity Portfolio |
Report of Independent Registered Public Accounting Firm
To the Board of Trustees of MainStay VP Funds Trust and Shareholders of
MainStay VP American Century Sustainable Equity Portfolio (formerly known as MainStay VP T. Rowe Price Equity Income Portfolio)
Opinion on the Financial Statements
We have audited the accompanying statement of assets and liabilities, including the portfolio of investments, of MainStay VP American Century Sustainable Equity Portfolio (one of the portfolios constituting MainStay VP Funds Trust, referred to hereafter as the “Portfolio”) as of December 31, 2022, the related statement of operations for the year ended December 31, 2022, the statements of changes in net assets for each of the two years in the period ended December 31, 2022, including the related notes, and the financial highlights for each of the five years in the period ended December 31, 2022 (collectively referred to as the “financial statements”). In our opinion, the financial statements present fairly, in all material respects, the financial position of the Portfolio as of December 31, 2022, the results of its operations for the year then ended, the changes in its net assets for each of the two years in the period ended December 31, 2022 and the financial highlights for each of the five years in the period ended December 31, 2022 in conformity with accounting principles generally accepted in the United States of America.
Basis for Opinion
These financial statements are the responsibility of the Portfolio’s management. Our responsibility is to express an opinion on the Portfolio’s financial statements based on our audits. We are a public accounting firm registered with the Public Company Accounting Oversight Board (United States) (PCAOB) and are required to be independent with respect to the Portfolio in accordance with the U.S. federal securities laws and the applicable rules and regulations of the Securities and Exchange Commission and the PCAOB.
We conducted our audits of these financial statements in accordance with the standards of the PCAOB. Those standards require that we plan and perform the audit to obtain reasonable assurance about whether the financial statements are free of material misstatement, whether due to error or fraud.
Our audits included performing procedures to assess the risks of material misstatement of the financial statements, whether due to error or fraud, and performing procedures that respond to those risks. Such procedures included examining, on a test basis, evidence regarding the amounts and disclosures in the financial statements. Our audits also included evaluating the accounting principles used and significant estimates made by management, as well as evaluating the overall presentation of the financial statements. Our procedures included confirmation of securities owned as of December 31, 2022 by correspondence with the custodian, transfer agents and brokers. We believe that our audits provide a reasonable basis for our opinion.
/s/PricewaterhouseCoopers LLP
New York, New York
February 24, 2023
We have served as the auditor of one or more investment companies in the MainStay group of funds since 1984.
Board Consideration and Approval of Management Agreement (Unaudited)
The continuation of the Management Agreement with respect to the MainStay VP American Century Sustainable Equity Portfolio (“Portfolio”) and New York Life Investment Management LLC (“New York Life Investments”) is subject to annual review and approval by the Board of Trustees of MainStay VP Funds Trust (“Board” of the “Trust”) in accordance with Section 15 of the Investment Company Act of 1940, as amended (“1940 Act”). At its December 6–7, 2022 meeting, the Board, which is comprised solely of Trustees who are not an “interested person” (as such term is defined in the 1940 Act) of the Trust (“Independent Trustees”), unanimously approved the continuation of the Management Agreement for a one-year period.
In reaching the decision to approve the continuation of the Management Agreement, the Board considered information and materials furnished by New York Life Investments in connection with an annual contract review process undertaken by the Board that took place at meetings of the Board and its Contracts Committee during October 2022 through December 2022, including information and materials furnished by New York Life Investments in response to requests prepared on behalf of the Board, and in consultation with the Board, by independent legal counsel to the Independent Trustees, which encompassed a variety of topics, including those summarized below. Information and materials requested by and furnished to the Board for consideration in connection with the contract review process included, among other items, reports on the Portfolio and “peer funds” prepared by Institutional Shareholder Services Inc. (“ISS”), an independent third-party service provider engaged by the Board to report objectively on the Portfolio’s investment performance, management fee and total expenses. The Board also considered information on the fees charged to other investment advisory clients of New York Life Investments that follow investment strategies similar to those of the Portfolio, if any, and, when applicable, the rationale for any differences in the Portfolio’s management fee and the fees charged to those other investment advisory clients. In addition, the Board considered information regarding the legal standards and fiduciary obligations applicable to its consideration of the continuation of the Management Agreement. The contract review process, including the structure and format for information and materials provided to the Board, has been developed in consultation with the Board. The Independent Trustees also met in executive sessions with their independent legal counsel and, for portions thereof, with senior management of New York Life Investments.
The Board’s deliberations with respect to the continuation of the Management Agreement reflect a year-long process, and the Board also took into account information furnished to the Board and its Committees throughout the year, as deemed relevant and appropriate by the Trustees, including, among other items, reports on investment performance of the Portfolio and investment-related matters for the Portfolio as well as presentations from New York Life Investments personnel. In addition, the Board took into account other information received from New York Life Investments throughout the year, including, among other items, periodic reports on legal and compliance matters, risk management, portfolio
turnover, brokerage commissions and non-advisory services provided to the Portfolio by New York Life Investments, as deemed relevant and appropriate by the Trustees.
In addition to information provided to the Board throughout the year, the Board received information in connection with its June 2022 meeting provided specifically in response to requests prepared on behalf of the Board, and in consultation with the Board, by independent legal counsel to the Independent Trustees regarding the Portfolio’s distribution arrangements. In addition, the Board received information regarding the Portfolio’s asset levels, share purchase and redemption activity and the payment of Rule 12b-1 and/or other fees by applicable share classes of the Portfolio, among other information.
In considering the continuation of the Management Agreement, the Trustees reviewed and evaluated the information and factors they believed to reasonably be necessary and appropriate in light of legal advice furnished to them by independent legal counsel to the Independent Trustees and through the exercise of their own business judgment. Although individual Trustees may have weighed certain factors or information differently and the Board did not consider any single factor or information controlling in reaching its decision, the factors considered by the Board are summarized in more detail below and include, among other factors: (i) the nature, extent and quality of the services provided to the Portfolio by New York Life Investments; (ii) the qualifications of the portfolio managers of the Portfolio and the historical investment performance of the Portfolio and New York Life Investments; (iii) the costs of the services provided, and profits realized, by New York Life Investments with respect to its relationship with the Portfolio; (iv) the extent to which economies of scale have been realized or may be realized if the Portfolio grows and the extent to which any economies of scale have been shared, have benefited or may benefit the Portfolio’s shareholders; and (v) the reasonableness of the Portfolio’s management fee and total ordinary operating expenses. Although the Board recognized that comparisons between the Portfolio’s fees and expenses and those of other funds are imprecise given different terms of agreements, variations in fund strategies and other factors, the Board considered the reasonableness of the Portfolio’s management fee and total ordinary operating expenses as compared to the peer funds identified by ISS. Throughout their considerations, the Trustees acknowledged the commitment of New York Life Investments and its affiliates to serve the MainStay Group of Funds, as well as their capacity, experience, resources, financial stability and reputations. The Trustees also acknowledged the entrepreneurial and other risks assumed by New York Life Investments in sponsoring and managing the Portfolio.
The Trustees noted that, throughout the year, the Trustees are afforded an opportunity to ask questions of, and request additional information or materials from, New York Life Investments. The Board’s decision with respect to the Management Agreement may have also been based, in part, on the Board’s knowledge of New York Life Investments resulting from, among other things, the Board’s consideration of the Management Agreement in prior years, the advisory agreements for other funds in the MainStay Group of Funds, the Board’s review throughout the year of the
| 28 | MainStay VP American Century Sustainable Equity Portfolio |
performance and operations of other funds in the MainStay Group of Funds and each Trustee’s business judgment and industry experience. In addition to considering the above-referenced factors, the Board observed that in the marketplace, notably under variable life insurance policies and variable annuity contracts for which the Portfolio serves as an investment option, there are a range of investment options available to investors and that the Portfolio’s shareholders, having had the opportunity to consider other investment options, have chosen to invest in the Portfolio.
The factors that figured prominently in the Board’s decision to approve the continuation of the Management Agreement during its December 6–7, 2022 meeting are summarized in more detail below.
Nature, Extent and Quality of Services Provided by New York Life Investments
The Board examined the nature, extent and quality of the services that New York Life Investments provides to the Portfolio. The Board evaluated New York Life Investments’ experience and capabilities in serving as manager of the Portfolio. The Board noted that New York Life Investments manages other mutual funds, serves a variety of other investment advisory clients, including other pooled investment vehicles, and has experience overseeing mutual fund service providers. The Board considered the experience of senior personnel at New York Life Investments providing management and administrative and other non-advisory services to the Portfolio. The Board observed that New York Life Investments devotes significant resources and time to providing management and administrative and other non-advisory services to the Portfolio.
The Board also considered the range of services that New York Life Investments provides to the Portfolio under the terms of the Management Agreement, including: (i) fund accounting and ongoing supervisory services provided by New York Life Investments’ Fund Administration and Accounting Group; (ii) investment supervisory and analytical services provided by New York Life Investments’ Investment Consulting Group; (iii) compliance services provided by the Trust’s Chief Compliance Officer as well as New York Life Investments’ compliance department, including supervision and implementation of the Portfolio’s compliance program; (iv) legal services provided by New York Life Investments’ Office of the General Counsel; and (v) risk management monitoring and analysis by compliance and investment personnel. In addition, the Board considered New York Life Investments’ willingness to invest in personnel and other resources, such as cyber security, information security and business continuity planning, designed to benefit the Portfolio and noted that New York Life Investments is responsible for compensating the Trust’s officers, except for a portion of the salary of the Trust’s Chief Compliance Officer. The Board recognized that New York Life Investments provides certain other non-advisory services to the Portfolio and has provided an increasingly broad array of non-advisory services to the MainStay Group of Funds as a result of regulatory and other developments, including in connection with the implementation of the MainStay Group of Funds’ derivatives risk management program and policies and procedures adopted pursuant to Rule 18f-4 under the 1940 Act.
The Board also examined the range, and the nature, extent and quality, of the investment advisory services that New York Life Investments provides to the Portfolio and considered the terms of the Management Agreement. The Board evaluated New York Life Investments’ experience and performance in serving as investment adviser to the Portfolio and advising other portfolios and New York Life Investments’ track record and experience in providing investment advisory services, the experience of investment advisory, senior management and administrative personnel at New York Life Investments. The Board considered New York Life Investments’ overall resources, legal and compliance environment, capabilities, reputation, financial condition and history. In addition to information provided in connection with quarterly meetings with the Trust’s Chief Compliance Officer, the Board considered information regarding the compliance policies and procedures of New York Life Investments and acknowledged New York Life Investments’ commitment to further developing and strengthening compliance programs relating to the Portfolio. The Board also considered New York Life Investments’ ability to recruit and retain qualified investment professionals and willingness to invest in personnel and other resources to service and support the Portfolio. In this regard, the Board considered the qualifications and experience of the Portfolio’s portfolio managers, the number of accounts managed by the portfolio managers and the method for compensating the portfolio managers.
In addition, the Board considered information provided by New York Life Investments regarding the operations of its business continuity plans in response to the COVID-19 pandemic and the continued remote work environment.
Based on these considerations, among others, the Board concluded that the Portfolio would likely continue to benefit from the nature, extent and quality of these services.
Investment Performance
In evaluating the Portfolio’s investment performance, the Board considered investment performance results over various periods in light of the Portfolio’s investment objective, strategies and risks. The Board considered investment reports on, and analysis of, the Portfolio’s performance provided to the Board throughout the year. These reports include, among other items, information on the Portfolio’s gross and net returns, the Portfolio’s investment performance compared to a relevant investment category and the Portfolio’s benchmark, the Portfolio’s risk-adjusted investment performance and the Portfolio’s investment performance as compared to peer funds, as appropriate, as well as portfolio attribution information and commentary on the effect of market conditions. The Board also considered information provided by ISS showing the investment performance of the Portfolio as compared to peer funds. In addition, the Board reviewed the methodology used by ISS to construct the group of peer funds for comparative purposes.
The Board also took into account its discussions with senior management at New York Life Investments concerning the Portfolio’s investment performance over various periods as well as discussions between the
Board Consideration and Approval of Management Agreement (Unaudited) (continued)
Portfolio’s portfolio management team and the members of the Board’s Investment Committee, which generally occur on an annual basis. In addition, the Board considered any specific actions that New York Life Investments had taken, or had agreed to take, to seek to enhance Portfolio investment performance and the results of those actions. In considering the investment performance of the Portfolio, the Board noted that the Portfolio underperformed its peer funds for the three-, five- and ten-year periods ended July 31, 2022, and performed favorably relative to its peer funds for the one-year period ended July 31, 2022. The Board considered its discussions with representatives from New York Life Investments and American Century regarding the Portfolio’s investment performance and the Board’s approval to terminate a previous subadvisor, approve a new subadvisory agreement between New York Life Investments and American Century Investment Management, Inc. with respect to the Portfolio and reposition the Portfolio, effective May 1, 2022.
Based on these considerations, among others, the Board concluded that its review of the Portfolio’s investment performance and related information supported a determination to approve the continuation of the Management Agreement.
Costs of the Services Provided, and Profits and Other Benefits Realized, by New York Life Investments
The Board considered the costs of the services provided under the Management Agreement. The Board also considered the profits realized by New York Life Investments and its affiliates due to their relationships with the Portfolio as well as by New York Life Investments and its affiliates due to their relationships with the MainStay Group of Funds.
In addition, the Board acknowledged the difficulty in obtaining reliable comparative data about mutual fund managers’ profitability because such information generally is not publicly available and may be impacted by numerous factors, including the structure of a fund manager’s organization, the types of funds it manages, the methodology used to allocate certain fixed costs to specific funds and the manager’s capital structure and costs of capital.
In evaluating the costs of the services provided by New York Life Investments and profits realized by New York Life Investments and its affiliates, the Board considered, among other factors, New York Life Investments’ and its affiliates’ continuing investments in, or willingness to invest in, personnel and other resources to support and further enhance the management of the Portfolio. The Board also considered the financial resources of New York Life Investments and acknowledged that New York Life Investments must be in a position to recruit and retain experienced professional personnel and to maintain a strong financial position for New York Life Investments to continue to provide high-quality services to the Portfolio. The Board recognized that the Portfolio benefits from the allocation of certain fixed costs among the funds in the MainStay Group of Funds, among other expected benefits resulting from its relationship with New York Life Investments.
The Board considered information regarding New York Life Investments’ methodology for calculating profitability and allocating costs provided by New York Life Investments in connection with the fund profitability analysis presented to the Board. The Board noted it had previously engaged an independent consultant to review the methods used to allocate costs among the funds in the MainStay Group of Funds. The Board also noted that the independent consultant had concluded that New York Life Investments’ methods for allocating costs and procedures for estimating overall profitability of the relationship with the funds in the MainStay Group of Funds are reasonable and that New York Life Investments continued to use the same method of calculating profit and allocating costs since the independent consultant’s review. The Board recognized the difficulty in calculating and evaluating a manager’s profitability with respect to the Portfolio and considered that other profitability methodologies may also be reasonable.
The Board also considered certain fall-out benefits that may be realized by New York Life Investments and its affiliates due to their relationships with the Portfolio, including reputational and other indirect benefits. In addition, the Board considered its review of the management agreement for a money market fund advised by New York Life Investments and an affiliated subadvisor that serves as an investment option for the Portfolio, including the potential rationale for and costs associated with investments in this money market fund by the Portfolio, if any, and considered information from New York Life Investments that the nature and type of specific investment advisory services provided to this money market fund are distinct from, or in addition to, the investment advisory services provided to the Portfolio. In addition, the Board considered the potential dividend received tax deduction for insurance company affiliates of New York Life Investments from the Portfolio’s securities lending activity.
The Board noted that the Portfolio serves as an investment option primarily under variable contracts issued by affiliates of New York Life Investments that would receive fees under those contracts. The Board observed that, in addition to fees earned by New York Life Investments under the Management Agreement for managing the Portfolio, New York Life Investments’ affiliates also earn revenues from serving the Portfolio in various other capacities, including as the Portfolio’s distributor. The Board considered information about these other revenues and their impact on the profitability of the relationship with the Portfolio to New York Life Investments and its affiliates. The Board noted that, although it assessed the overall profitability of the relationship with the Portfolio to New York Life Investments and its affiliates as part of the contract review process, when considering the reasonableness of the fee paid to New York Life Investments under the Management Agreement, the Board considered the profitability of New York Life Investments’ relationship with the Portfolio on a pre-tax basis and without regard to distribution expenses incurred by New York Life Investments from its own resources.
After evaluating the information deemed relevant by the Trustees, the Board concluded that any profits realized by New York Life Investments and its affiliates due to their relationships with the Portfolio were not excessive.
| 30 | MainStay VP American Century Sustainable Equity Portfolio |
Management Fee and Total Ordinary Operating Expenses
The Board evaluated the reasonableness of the fee paid under the Management Agreement and the Portfolio’s total ordinary operating expenses.
In assessing the reasonableness of the Portfolio’s fees and expenses, the Board primarily considered comparative data provided by ISS on the fees and expenses charged by similar mutual funds managed by other investment advisers. The Board reviewed the methodology used by ISS to construct the group of peer funds for comparative purposes. In addition, the Board considered information provided by New York Life Investments on fees charged to other investment advisory clients, including institutional separate accounts and/or other funds that follow investment strategies similar to those of the Portfolio, if any. The Board considered the contractual management fee schedules of the Portfolio as compared to those of such other investment advisory clients, taking into account the rationale for any differences in fee schedules. The Board also took into account information provided by New York Life Investments about the more extensive scope of services provided to registered investment companies, such as the Portfolio, as compared with other investment advisory clients. Additionally, the Board considered the impact of contractual breakpoints on the Portfolio’s net management fee and expenses. The Board also considered that in proposing fees for the Portfolio, New York Life Investments considers the competitive marketplace for mutual funds.
Based on the factors outlined above, among other considerations, the Board concluded that the Portfolio’s management fee and total ordinary operating expenses are within a range that is competitive and support a conclusion that these fees and expenses are reasonable.
Economies of Scale
The Board considered information regarding economies of scale, including whether economies of scale may exist for the Portfolio and whether the Portfolio’s expense structure permits any economies of scale to be appropriately shared with the Portfolio’s beneficial shareholders. The Board also considered a report from New York Life Investments, previously prepared at the request of the Board, that addressed economies of scale, including with respect to the mutual fund business generally, and the various ways in which the benefits of economies of scale may be shared with the funds in the MainStay Group of Funds. Although the Board recognized the difficulty of determining economies of scale with precision, the Board acknowledged that economies of scale may be shared with the Portfolio in a number of ways, including, for example, through the imposition of fee breakpoints, initially setting management fee rates at scale or making additional investments to enhance the services provided to the Portfolio. The Board reviewed information from New York Life Investments showing how the Portfolio’s management fee schedule compared to fee schedules of other funds and accounts managed by New York Life Investments. The Board also
reviewed information from ISS showing how the Portfolio’s management fee schedule compared with fees paid for similar services by peer funds at varying asset levels.
Based on this information, the Board concluded that economies of scale are appropriately reflected for the benefit of the Portfolio’s beneficial shareholders through the Portfolio’s expense structure and other methods to share benefits from economies of scale.
Conclusion
On the basis of the information and factors summarized above, among other information and factors deemed relevant by the Trustees, and the evaluation thereof, the Board unanimously voted to approve the continuation of the Management Agreement.
Proxy Voting Policies and Procedures and Proxy Voting Record
The Portfolio is required to file with the SEC its proxy voting record for the 12-month period ending June 30 on Form N-PX. A description of the policies and procedures that are used to vote proxies relating to portfolio securities of the Portfolio is available free of charge upon request by calling 800-598-2019 or visiting the SEC's website at www.sec.gov. The most recent Form N-PX or proxy voting record is available free of charge upon request by calling 800-598-2019; visiting https://www.newyorklifeinvestments.com/investment-products/vp; or visiting the SEC’s website at www.sec.gov.
Shareholder Reports and Quarterly Portfolio Disclosure
The Portfolio is required to file its complete schedule of portfolio holdings with the SEC 60 days after its first and third fiscal quarter on Form N-PORT. The Portfolio's holdings report is available free of charge upon request by calling 800-598-2019 or by visiting the SEC’s website at www.sec.gov.
| 32 | MainStay VP American Century Sustainable Equity Portfolio |
Board of Trustees and Officers (Unaudited)
The Trustees and officers of the Portfolio are listed below. The Board oversees the MainStay Group of Funds (which consists of MainStay Funds and MainStay Funds Trust), MainStay VP Funds Trust, MainStay MacKay DefinedTerm Municipal Opportunities Fund, MainStay CBRE Global Infrastructure Megatrends Fund, the Manager and the Subadvisors, and elects the officers of the Portfolios who are responsible for the day-to-day operations of the Portfolio. Information pertaining to the Trustees and officers is set forth below. Each Trustee serves until his or her successor
is elected and qualified or until his or her resignation, death or removal. Under the Board’s retirement policy, unless an exception is made, a Trustee must tender his or her resignation by the end of the calendar year during which he or she reaches the age of 75. The business address of each Trustee and officer listed below is 51 Madison Avenue, New York, New York 10010. None of the Trustees are “interested persons” (as defined by the 1940 Act and rules adopted by the SEC thereunder) of the Portfolio (“Independent Trustees”).
| | Name and
Year of Birth | Term of Office,
Position(s) Held and
Length of Service | Principal Occupation(s)
During Past Five Years | Number of
Portfolios in
Fund Complex
Overseen by
Trustee | Other Directorships
Held by Trustee |
| | | | | | |
| | David H. Chow
1957 | MainStay VP Funds Trust: Trustee since January 2016, Advisory Board Member (June 2015 to December 2015) | Founder and CEO, DanCourt Management, LLC since 1999 | 78 | MainStay Funds: Trustee since January 2016, Advisory Board Member (June 2015 to December 2015) (12 Funds);
MainStay Funds Trust: Trustee since January 2016, Advisory Board Member (June 2015 to December 2015) (33 Funds);
MainStay MacKay DefinedTerm Municipal Opportunities Fund: Trustee since January 2016, Advisory Board Member (June 2015 to December 2015);
MainStay CBRE Global Infrastructure Megatrends Fund: Trustee since June 2021;VanEck Vectors Group of Exchange-Traded Funds: Independent Chairman of the Board of Trustees since 2008 and Trustee since 2006 (57 portfolios); and Berea College of Kentucky: Trustee since 2009, Chair of the Committee since 2018 |
| | Susan B. Kerley
1951 | MainStay VP Funds Trust: Chairman since 2017 and Trustee since 2007* | President, Strategic Management Advisors LLC since 1990 | 78 | MainStay Funds: Chairman since 2017 and Trustee since 2007 (12 Funds); MainStay Funds Trust: Chairman since 2017 and Trustee since 1990 (33 Funds)**;
MainStay MacKay DefinedTerm Municipal Opportunities Fund: Chairman since 2017 and Trustee since 2011; MainStay CBRE Global Infrastructure Megatrends Fund: Trustee since June 2021; and Legg Mason Partners Funds: Trustee since 1991 (45 portfolios) |
| | Alan R. Latshaw
1951 | MainStay VP Funds Trust: Trustee since 2007* | Retired; Partner, Ernst & Young LLP (2002 to 2003); Partner, Arthur Andersen LLP (1989 to 2002); Consultant to the MainStay Funds Audit and Compliance Committee (2004 to 2006) | 78 | MainStay Funds: Trustee since 2006 (12 Funds);
MainStay Funds Trust: Trustee since 2007 (33 Funds)**;
MainStay MacKay DefinedTerm Municipal Opportunities Fund: Trustee since 2011; and
MainStay CBRE Global Infrastructure Megatrends Fund: Trustee since June 2021 |
Board of Trustees and Officers (Unaudited) (continued)
| | Name and
Year of Birth | Term of Office,
Position(s) Held and
Length of Service | Principal Occupation(s)
During Past Five Years | Number of
Portfolios in
Fund Complex
Overseen by
Trustee | Other Directorships
Held by Trustee |
| | | | | | |
| | Karen Hammond
1956 | MainStay VP Funds Trust: Trustee since December 2021, Advisory Board Member (June 2021 to December 2021)
| Retired, Managing Director, Devonshire Investors (2007 to 2013); Senior Vice President, Fidelity Management & Research Co. (2005 to 2007); Senior Vice President and Corporate Treasurer, FMR Corp. (2003 to 2005); Chief Operating Officer, Fidelity Investments Japan (2001 to 2003) | 78 | MainStay Funds: Trustee since December 2021, Advisory Board Member (June 2021 to December 2021) (12 Funds);
MainStay Funds Trust: Trustee since December 2021, Advisory Board Member (June 2021 to December 2021) (33 Funds);
MainStay MacKay DefinedTerm Municipal Opportunities Fund: Trustee since December 2021, Advisory Board Member (June 2021 to December 2021);
MainStay CBRE Global Infrastructure Megatrends Fund: Trustee since December 2021, Advisory Board Member (June 2021 to December 2021);
Two Harbors Investment Corp.: Director since 2018; Rhode Island State Investment Commission: Member since 2017; and Blue Cross Blue Shield of Rhode Island: Director since 2019
|
| | Jacques P. Perold
1958 | MainStay VP Funds Trust: Trustee since January 2016, Advisory Board Member (June 2015 to December 2015) | Founder and Chief Executive Officer, CapShift Advisors LLC (since 2018); President, Fidelity Management & Research Company (2009 to 2014); President and Chief Investment Officer, Geode Capital Management, LLC (2001 to 2009) | 78 | MainStay Funds: Trustee since January 2016, Advisory Board Member (June 2015 to December 2015) (12 Funds);
MainStay Funds Trust: Trustee since January 2016, Advisory Board Member (June 2015 to December 2015) (33 Funds); MainStay MacKay DefinedTerm Municipal Opportunities Fund: Trustee since January 2016, Advisory Board Member (June 2015 to December 2015);
MainStay CBRE Global Infrastructure Megatrends Fund: Trustee since June 2021; Allstate Corporation: Director since 2015;
Partners in Health: Trustee since 2019; and
MSCI Inc.: Director since 2017 |
| | Richard S. Trutanic
1952 | MainStay VP Funds Trust: Trustee since 2007* | Chairman and Chief Executive Officer, Somerset & Company (financial advisory firm) since 2004; Managing Director, The Carlyle Group (private investment firm) (2002 to 2004); Senior Managing Director, Partner and Board Member, Groupe Arnault S.A. (private investment firm) (1999 to 2002)
| 78 | MainStay Funds: Trustee since 1994 (12 Funds);
MainStay Funds Trust: Trustee since 2007 (33 Funds)**;
MainStay MacKay DefinedTerm Municipal Opportunities Fund: Trustee since 2011; and
MainStay CBRE Global Infrastructure Megatrends Fund: Trustee since June 2021 |
| * | Includes prior service as a Director of MainStay VP Series Fund, Inc., the predecessor to MainStay VP Funds Trust. |
| ** | Includes prior service as a Director/Trustee of certain predecessor entities to MainStay Funds Trust. |
| 34 | MainStay VP American Century Sustainable Equity Portfolio |
| | Name and
Year of Birth | Position(s) Held and
Length of Service | Principal Occupation(s)
During Past Five Years | |
| | | | | |
| | Kirk C. Lehneis
1974 | President, MainStay VP Funds Trust (since 2017) | Chief Operating Officer and Senior Managing Director (since 2016), New York Life Investment Management LLC and New York Life Investment Management Holdings LLC; Member of the Board of Managers (since 2017) and Senior Managing Director (since 2018), NYLIFE Distributors LLC; Chairman of the Board and Senior Managing Director, NYLIM Service Company LLC (since 2017); Trustee, President and Principal Executive Officer of IndexIQ Trust, IndexIQ ETF Trust and IndexIQ Active ETF Trust (since January 2018); President, MainStay CBRE Global Infrastructure Megatrends Fund (since 2021), MainStay MacKay DefinedTerm Municipal Opportunities Fund, MainStay Funds and MainStay Funds Trust (since 2017); Senior Managing Director, Global Product Development (from 2015-2016); Managing Director, Product Development (from 2010-2015), New York Life Investment Management LLC | |
| | Jack R. Benintende
1964 | Treasurer and Principal Financial and Accounting Officer, MainStay VP Funds Trust (since 2007)** | Managing Director, New York Life Investment Management LLC (since 2007); Treasurer and Principal Financial and Accounting Officer, MainStay CBRE Global Infrastructure Megatrends Fund (since 2021), MainStay MacKay DefinedTerm Municipal Opportunities Fund (since 2011), MainStay Funds Trust (since 2009) and MainStay Funds (since 2007); and Assistant Treasurer, New York Life Investment Management Holdings LLC (2008 to 2012) | |
| | J. Kevin Gao
1967 | Secretary and Chief Legal Officer, MainStay VP Funds Trust (since 2010)** | Managing Director and Associate General Counsel, New York Life Investment Management LLC (since 2010); Secretary and Chief Legal Officer, MainStay CBRE Global Infrastructure Megatrends Fund (since 2021), MainStay MacKay DefinedTerm Municipal Opportunities Fund (since 2011), MainStay Funds and MainStay Funds Trust (since 2010) | |
| | Scott T. Harrington
1959 | Vice President— Administration, MainStay VP Funds Trust (since 2005)** | Managing Director, New York Life Investment Management LLC (including predecessor advisory organizations) (since 2000); Member of the Board of Directors, New York Life Trust Company (since 2009); Vice President—Administration, MainStay CBRE Global Infrastructure Megatrends Fund (since 2021), MainStay MacKay DefinedTerm Municipal Opportunities Fund (since 2011), MainStay Funds Trust and MainStay Funds (since 2009) | |
| | Kevin M. Gleason
1967 | Vice President and Chief Compliance Officer, MainStay VP Funds Trust (since June 2022) | Vice President and Chief Compliance Officer, IndexIQ, IndexIQ ETF Trust and Index IQ Active ETF Trust (since June 2022); Vice President and Chief Compliance Officer, MainStay CBRE Global Infrastructure Megatrends Fund, MainStay MacKay DefinedTerm Municipal Opportunities Fund (since June 2022); MainStay Funds Trust and MainStay Funds (since June 2022); Senior Vice President, Voya Investment Management and Chief Compliance Officer, Voya Family of Funds (2012-2022) | |
| * | The officers listed above are considered to be “interested persons” of the MainStay Group of Funds, MainStay VP Funds Trust, MainStay CBRE Global Infrastructure Megatrends Fund and MainStay MacKay DefinedTerm Municipal Opportunities Fund within the meaning of the 1940 Act because of their affiliation with the MainStay Group of Funds, New York Life Insurance Company and/or its affiliates, including New York Life Investment Management LLC, NYLIM Service Company LLC, NYLIFE Securities LLC and/or NYLIFE Distributors LLC, as described in detail in the column captioned “Principal Occupation(s) During Past Five Years.” Officers are elected annually by the Board. |
| ** | Includes prior service as an Officer of MainStay VP Series Fund, Inc., the predecessor to MainStay VP Funds Trust. |
Officers of the Trust (Who are not Trustees)*
This page intentionally left blank
This page intentionally left blank.
This page intentionally left blank.
MainStay VP Portfolios
MainStay VP offers a wide range of Portfolios. The full array of MainStay VP offerings is listed here, with information about the manager, subadvisors, legal counsel, and independent registered public accounting firm.
Equity
MainStay VP American Century Sustainable Equity Portfolio1
MainStay VP Candriam Emerging Markets Equity Portfolio
MainStay VP Epoch U.S. Equity Yield Portfolio
MainStay VP Fidelity Institutional AM® Utilities Portfolio†
MainStay VP MacKay International Equity Portfolio
MainStay VP Natural Resources Portfolio
MainStay VP S&P 500 Index Portfolio2
MainStay VP Small Cap Growth Portfolio
MainStay VP Wellington Growth Portfolio
MainStay VP Wellington Mid Cap Portfolio
MainStay VP Wellington Small Cap Portfolio
MainStay VP Wellington U.S. Equity Portfolio
MainStay VP Winslow Large Cap Growth Portfolio
Mixed Asset
MainStay VP Balanced Portfolio
MainStay VP Income Builder Portfolio
MainStay VP Janus Henderson Balanced Portfolio
MainStay VP MacKay Convertible Portfolio
Income
MainStay VP Bond Portfolio
MainStay VP Floating Rate Portfolio
MainStay VP Indexed Bond Portfolio
MainStay VP MacKay Government Portfolio
MainStay VP MacKay High Yield Corporate Bond Portfolio
MainStay VP MacKay Strategic Bond Portfolio
MainStay VP PIMCO Real Return Portfolio
Money Market
MainStay VP U.S. Government Money Market Portfolio
Alternative
MainStay VP CBRE Global Infrastructure Portfolio
MainStay VP IQ Hedge Multi-Strategy Portfolio
Asset Allocation
MainStay VP Conservative Allocation Portfolio
MainStay VP Equity Allocation Portfolio
MainStay VP Growth Allocation Portfolio
MainStay VP Moderate Allocation Portfolio
Manager
New York Life Investment Management LLC
New York, New York
Subadvisors
American Century Investment Management, Inc.
Kansas City, Missouri
Brown Advisory LLC
Baltimore, Maryland
Candriam*
Strassen, Luxembourg
CBRE Investment Management Listed Real Assets LLC
Radnor, Pennsylvania
Epoch Investment Partners, Inc.
New York, New York
FIAM LLC
Smithfield, Rhode Island
IndexIQ Advisors LLC*
New York, New York
Janus Henderson Investors US LLC
Denver, Colorado
MacKay Shields LLC*
New York, New York
Newton Investment Management North America, LLC
Boston, Massachusetts
NYL Investors LLC*
New York, New York
Pacific Investment Management Company LLC
Newport Beach, California
Segall Bryant & Hamill, LLC
Chicago, Illinois
Wellington Management Company LLP
Boston, Massachusetts
Winslow Capital Management, LLC
Minneapolis, Minnesota
Legal Counsel
Dechert LLP
Washington, District of Columbia
Independent Registered Public Accounting Firm
PricewaterhouseCoopers LLP
New York, New York
Distributor
NYLIFE Distributors LLC*
Jersey City, New Jersey
Custodian
JPMorgan Chase Bank, N.A.
New York, New York
Some Portfolios may not be available in all products.
† Fidelity Institutional AM is a registered trade mark of FMR LLC. Used with permission.
* An affiliate of New York Life Investment Management LLC.
| 1. | Prior to May 1, 2022, the Portfolio's name was MainStay VP T. Rowe Price Equity Income Portfolio. |
| 2. | Prior to May 1, 2022, the Portfolio's name was MainStay VP MacKay S&P 500 Index Portfolio. |
Not part of the Annual Report
2022 Annual Report
This report is for the general information of New York Life Variable Annuities and NYLIAC Variable Universal Life Insurance Products policyowners. It must be preceded or accompanied by the appropriate product(s) and funds prospectuses if it is given to anyone who is not an owner of a New York Life variable annuity policy or a NYLIAC Variable Universal Life Insurance Product. This report does not offer for sale or solicit orders to purchase securities.
The performance data quoted in this report represents past performance. Past performance is no guarantee of future results. Due to market volatility and other factors, current performance may be lower or higher than the figures shown. The most recent month-end performance summary for your variable annuity or variable life policy is available by calling 800-598-2019 and is updated periodically on newyorklife.com.
The New York Life Variable Annuities and NYLIAC Variable Universal Life Insurance Products are issued by New York Life Insurance and Annuity Corporation (a Delaware Corporation) and distributed by NYLIFE Distributors LLC (Member FINRA/SIPC).
New York Life Insurance Company
New York Life Insurance and Annuity
Corporation (NYLIAC) (A Delaware Corporation)
51 Madison Avenue, Room 551
New York, NY 10010
newyorklife.com
newyorklifeinvestments.com
NYLIFE Distributors LLC, 30 Hudson Street, Jersey City, NJ 07302
New York Life Investment Management LLC is the investment manager to the MainStay VP Funds Trust
©2023 by NYLIFE Distributors LLC. All rights reserved.
You may obtain copies of the Prospectus and the Statement of Additional Information free of charge, upon request, by calling toll-free 800-598-2019 or writing to New York Life Insurance and Annuity Corporation, 51 Madison Avenue, New York, NY 10010.
| Not FDIC Insured | No Bank Guarantee | May Lose Value |
(NYLIAC) NI531
MainStay VP Natural Resources Portfolio
Message from the President and Annual Report
December 31, 2022
Sign up for e-delivery of your shareholder reports. For full details on e-delivery, including who can participate and what you can receive via e-delivery,
please log in to newyorklifeinvestments.com/accounts.
| Not FDIC/NCUA Insured | Not a Deposit | May Lose Value | No Bank Guarantee | Not Insured by Any Government Agency |
This page intentionally left blank
Message from the President
The 12-month reporting period ended December 31, 2022, proved exceptionally challenging for investors as both stock and bond markets suffered steep declines. A variety of economic and geopolitical forces drove the market’s losses, all centered around rising inflation and monetary efforts to rein it in.
Inflationary alarms began to sound well before the reporting period began. In late 2021, after nearly two years of accommodative policies designed to encourage economic growth in the face of the COVID-19 pandemic, the U.S. Federal Reserve (the “Fed”) warned of the increasing need to tighten monetary policy. Nevertheless, the pace and persistence of inflation in early 2022 caught most market participants—the Fed included—off guard. Russia’s invasion of Ukraine in February exacerbated global inflationary pressures while increasing investor uncertainty. Domestic supply shortages, international trade imbalances and rising inflation caused U.S. GDP (gross domestic product) to contract in the first and second quarters of the year, although employment and consumer spending proved resilient. Prices for petroleum surged to multi-year highs, while many key agricultural chemicals and industrial metals soared as well. Accelerating inflationary forces prompted the Fed to implement its most aggressive series of interest rate hikes since the 1980s, with a 0.25% increase in March followed by six further rate increases totaling 4.25%. International central banks generally followed suit and raised rates by varying degrees in efforts to curb local inflation, although most increases remained significantly more modest than those in the United States. Relatively high U.S. interest rates and an international risk averse sentiment pushed U.S. dollar values higher compared to most other currencies, with negative impacts on global prices for food, fuel and other key U.S.-dollar-denominated products.
The effects of these interrelated challenges were felt throughout U.S. and international financial markets. The S&P 500® Index, a widely regarded benchmark of market performance, declined by more than 18% during the reporting period. Although the energy sector generated strong gains, bolstered by elevated oil and gas prices, most other industry segments recorded losses. The more cyclical and growth-oriented sectors of consumer discretionary, information technology and real estate delivered the weakest returns, while the traditionally defensive and value-oriented
consumer staples, utilities and health care sectors outperformed. On average, international developed-country equity markets mildly outperformed their U.S. counterparts, while emerging markets lagged slightly. Fixed-income markets proved unusually volatile, with bond prices trending sharply lower as yields rose along with interest rates. Short-term yields rose faster than long-term yields, producing a yield curve inversion from July through the end of the reporting period as long-term rates remained below short-term rates. While floating-rate instruments, which feature variable interest rates that allow investors to benefit from a rising rate environment, provided a degree of insulation from inflation-driven trends, they were not immune to the market’s widespread declines.
Although, according to the most recent estimates, the annualized inflation rate in the United States has declined from a peak of 9.1% in July 2022 to 6.5% in December, the Fed remains focused on achieving more substantial and lasting reductions, aiming for a target rate of 2%. As a result, further rate hikes and additional market volatility are potential headwinds in the coming months. The question remains as to whether the Fed and other central banks will manage a so-called “soft landing,” curbing inflation while avoiding a persistent economic slowdown. If they prove successful, we believe that the increasingly attractive valuations we have observed in both equity and bond markets should eventually translate into sustainable improvements in the investment environment.
Whatever actions the Fed takes and however financial markets react, as a MainStay VP investor you can depend on us to continue managing our portfolios with the insight, expertise and level of service that have long defined New York Life Investments. Thank you for trusting us to help you meet your investment needs.
Sincerely,
Kirk C. Lehneis
President
The opinions expressed are as of the date of this report and are subject to change. There is no guarantee that any forecast made will come to pass. This material does not constitute investment advice and is not intended as an endorsement of any specific investment. Past performance is no guarantee of future results.
Not part of the Annual Report
Investors should refer to the Portfolio’s Summary Prospectus and/or Prospectus and consider the Portfolio’s investment objectives, strategies, risks, charges and expenses carefully before investing. The Summary Prospectus and/or Prospectus contain this and other information about the Portfolio. You may obtain copies of the Portfolio’s Summary Prospectus, Prospectus and Statement of Additional Information, which includes information about the MainStay VP Funds Trust's Trustees, free of charge, upon request, by calling toll-free 800-598-2019, by writing to New York Life Insurance and Annuity Corporation, 51 Madison Avenue, Room 251, New York, New York 10010 or by sending an email to MainStayShareholdersServices@nylim.com. These documents are also available at newyorklifeinvestments.com/investment-products/vp. Please read the Portfolio's Summary Prospectus and/or Prospectus carefully before investing. MainStay VP Funds Trust portfolios are separate account options which are purchased through a variable insurance or variable annuity contract.
Investment and Performance Comparison (Unaudited)
Performance data quoted represents past performance. Past performance is no guarantee of future results. Because of market volatility and other factors, current performance may be lower or higher than the figures shown. Investment return and principal value will fluctuate, and as a result, when shares are redeemed, they may be worth more or less than their original cost. The performance table and graph do not reflect any deduction of sales charges, mortality and expense charges, contract charges or administrative charges. Please refer to the Performance Summary appropriate for your policy. For performance information current to the most recent month-end, please call 800-598-2019 or visit www.newyorklife.com.
Performance figures may reflect certain fee waivers and/or expense limitations, without which total returns may have been different. For information on current fee waivers and/or expense limitations (if any), please refer to the Notes to Financial Statements.
| Average Annual Total Returns for the Year-Ended December 31, 20221 |
| Class | Inception
Date2 | One
Year | Five
Years | Ten
Years | Gross
Expense
Ratio3 |
| Initial Class Shares | 2/17/2012 | 35.84% | 10.78% | 3.67% | 0.85% |
| 1. | The Portfolio replaced its subadvisor and modified its principal investment strategies as of November 30, 2018. Therefore, the performance information shown in this report prior to November 30, 2018 reflects the Portfolio’s prior subadvisor, investment objective and principal investment strategies. |
| 2. | Effective September 1, 2021, due to an organizational restructuring, the portfolio managers from Mellon Investments Corporation who managed the day-to-day operations of the Portfolio transitioned to Newton Investment Management North America, LLC. The past performance in the graph and table prior to that date reflects the Portfolio’s prior subadvisor. |
| 3. | The gross expense ratios presented reflect the Portfolio’s “Total Annual Portfolio Operating Expenses” from the most recent Prospectus and may differ from other expense ratios disclosed in this report. |
| Benchmark Performance* | One
Year | Five
Years | Ten
Years |
| S&P Global Natural Resources Index1 | 10.32% | 7.34% | 4.89% |
| Morningstar Natural Resources Category Average2 | -3.39 | 5.80 | 3.18 |
| * | Returns for indices reflect no deductions for fees, expenses or taxes, except for foreign withholding taxes where applicable. Results assume reinvestment of all dividends and capital gains. An investment cannot be made directly in an index. |
| 1. | The Portfolio has selected the S&P Global Natural Resources Index as its primary benchmark. The S&P Global Natural Resources Index includes 90 of the largest publicly-traded companies in natural resources and commodities businesses that meet specific investability requirements, offering investors diversified and investable equity exposure across 3 primary commodity-related sectors: agribusiness, energy, and metals & mining. |
| 2. | The Morningstar Natural Resources Category Average is representative of funds that invest primarily on commodity-based industries such as energy, chemicals, minerals, and forest products in the United States or outside of the United States. Some funds invest across this spectrum to offer broad natural-resources exposure. Others concentrate heavily or even exclusively in specific industries. Funds that concentrate primarily in energy-related industries are part of the equity energy category. Results are based on average total returns of similar funds with all dividends and capital gain distributions reinvested. |
Cost in Dollars of a $1,000 Investment in MainStay VP Natural Resources Portfolio (Unaudited)
The example below is intended to describe the fees and expenses borne by shareholders during the six-month period from July 1, 2022 to December 31, 2022, and the impact of those costs on your investment.
Example
As a shareholder of the Portfolio you incur two types of costs: (1) transaction costs, including exchange fees and sales charges (loads) on purchases (as applicable), and (2) ongoing costs, including management fees and other Portfolio expenses (as applicable). This example is intended to help you understand your ongoing costs (in dollars) of investing in the Portfolio and to compare these costs with the ongoing costs of investing in other mutual funds. The example is based on an investment of $1,000 made at the beginning of the six-month period and held for the entire period from July 1, 2022 to December 31, 2022. Shares are only sold in connection with variable life and annuity contracts and the example does not reflect any contract level or transactional fees or expenses. If these costs had been included, your costs would have been higher.
This example illustrates your Portfolio’s ongoing costs in two ways:
Actual Expenses
The second and third data columns in the table below provide information about actual account values and actual expenses. You may use the information in these columns, together with the amount you invested, to estimate the expenses that you paid during the six months ended
December 31, 2022. Simply divide your account value by $1,000 (for example, an $8,600 account value divided by $1,000 = 8.6), then multiply the result by the number under the heading entitled “Expenses Paid During Period” to estimate the expenses you paid on your account during this period.
Hypothetical Example for Comparison Purposes
The fourth and fifth data columns in the table below provide information about hypothetical account values and hypothetical expenses based on the Portfolio’s actual expense ratio and an assumed rate of return of 5% per year before expenses, which is not the Portfolio’s actual return. The hypothetical account values and expenses may not be used to estimate the actual ending account balances or expenses you paid for the six-month period shown. You may use this information to compare the ongoing costs of investing in the Portfolio with the ongoing costs of investing in other mutual funds. To do so, compare this 5% hypothetical example with the 5% hypothetical examples that appear in the shareholder reports of the other mutual funds.
Please note that the expenses shown in the table are meant to highlight your ongoing costs only and do not reflect any transactional costs, such as exchange fees or sales charges (loads). Therefore, the fourth and fifth data columns of the table are useful in comparing ongoing costs only and will not help you determine the relative total costs of owning different funds. In addition, if these transactional costs were included, your costs would have been higher.
| Share Class | Beginning
Account
Value
7/1/22 | Ending Account
Value (Based
on Actual
Returns and
Expenses)
12/31/22 | Expenses
Paid
During
Period1 | Ending Account
Value (Based
on Hypothetical
5% Annualized
Return and
Actual Expenses)
12/31/22 | Expenses
Paid
During
Period1 | Net Expense
Ratio
During
Period2 |
| Initial Class Shares | $1,000.00 | $1,156.20 | $4.46 | $1,021.07 | $4.18 | 0.82% |
| 1. | Expenses are equal to the Portfolio’s annualized expense ratio of each class multiplied by the average account value over the period, divided by 365 and multiplied by 184 (to reflect the six-month period). The table above represents the actual expenses incurred during the six-month period. In addition to the fees and expenses which the Portfolio bears directly, it also indirectly bears a pro rata share of the fees and expenses of the underlying funds in which it invests. Such indirect expenses are not included in the above-reported expense figures. |
| 2. | Expenses are equal to the Portfolio's annualized expense ratio to reflect the six-month period. |
| 6 | MainStay VP Natural Resources Portfolio |
Country Composition as of December 31, 2022 (Unaudited)
| United States | 78.6% |
| Canada | 10.2 |
| South Africa | 3.8 |
| Norway | 3.0 |
| Zambia | 2.1 |
| Australia | 2.0 |
| Monaco | 1.4 |
| Brazil | 1.2% |
| Netherlands | 0.4 |
| United Kingdom | 0.3 |
| Other Assets, Less Liabilities | –3.0 |
| | 100.0% |
See Portfolio of Investments beginning on page 9 for specific holdings within these categories. The Portfolio's holdings are subject to change.
Top Ten Holdings and/or Issuers Held as of December 31, 2022 (excluding short-term investments) (Unaudited)
| 1. | Hess Corp. |
| 2. | Freeport-McMoRan, Inc. |
| 3. | Schlumberger Ltd. |
| 4. | Fluor Corp. |
| 5. | EOG Resources, Inc. |
| 6. | Occidental Petroleum Corp. |
| 7. | Marathon Petroleum Corp. |
| 8. | Anglo American plc |
| 9. | Alcoa Corp. |
| 10. | Bunge Ltd. |
Portfolio Management Discussion and Analysis (Unaudited)
Answers to the questions reflect the views of portfolio manager Albert Chu, CFA, Brock Campbell, CFA, and David S. Intoppa of Newton Investment Management North America, LLC, the Portfolio’s Subadvisor.
How did MainStay VP Natural Resources Portfolio perform relative to its benchmark and peers during the 12 months ended December 31, 2022?
For the 12 months ended December 31, 2022, MainStay VP Natural Resources Portfolio returned 35.84% for Initial Class shares. Over the same period, Initial Class shares of the Portfolio outperformed the 10.32% return of the S&P Global Natural Resources Index (“the Index”), which is the Portfolio’s benchmark, and the −3.39% return of the Morningstar Natural Resources Category Average.1
What factors affected the Portfolio’s relative performance during the reporting period?
During the reporting period, overweight exposure to the energy complex bolstered the Portfolio’s performance relative to the Index, as global supply/demand balances tightened due to both cyclical underinvestment and geopolitical events.
Which sectors were the strongest contributors to the Portfolio’s relative performance and which sectors were particularly weak?
An overweight position and effective stock selection in the U.S. onshore upstream segment made the strongest positive contribution to the Portfolio’s performance relative to the Index, followed by effective sector positioning and stock selection in the refining & chemicals space. (Contributions take weightings and total returns into account.) Underweight exposure in the integrated energy segment, followed by weak stock selection in metals & mining, detracted most significantly from relative returns.
During the reporting period, which individual stocks made the strongest positive contributions to the Portfolio’s absolute performance and which stocks detracted the most?
The strongest positive contributions to the Portfolio’s absolute performance came from oil & gas exploration companies Occidental Petroleum, Hess and Marathon Petroleum. Occidental shares benefited from the notable rally in oil and gas prices during first half of 2022, driven by supply issues and the Russia/Ukraine war. In addition, Warren Buffet, chairman and CEO of Berkshire Hathaway, disclosed a purchase in Occidental stock, and the company hosted a well-received analyst day focused on its carbon capture operations. Hess reported robust third-quarter earnings and continued to report increasing exploration and operational success in Guyana. Shares in Marathon Petroleum gained as the company continued its share buyback program. We believe Marathon is well positioned to continue benefiting from the extremely tight refined-products market, as well as access to relatively cheap U.S. natural gas and oil.
The most significant detractors from the Portfolio’s absolute performance during the same period included positions in gold miners Newmont and Barrick Gold, and pharmaceutical company
Bayer. Newmont and Barrick Gold detracted as the market continued to anticipate rising interest rates following a notable rally seen in the U.S. dollar and underperformance in gold. Bayer shares lagged as the company was hampered by an overhanging litigation.
Did the Portfolio make any significant purchases or sales during the reporting period?
Key additions to the Portfolio during the reporting period included positions in offshore drilling contractor Transocean, Canadian uranium producer NexGen Energy and Canadian miner Ivanhoe Mines. As the world’s largest offshore drilling contractor, we believe Transocean is well positioned to benefit from an upcycle in offshore energy activity. Regarding NexGen Energy, we remain constructive on the long-term prospect for uranium and its role as a clean bridge fuel. In our opinion, the recent sell-off in shares represented an attractive investment opportunity. The Portfolio’s purchase of shares in Ivanhoe Mines reflects our increasingly optimistic view of the cyclical and secular prospects for copper.
During the same period, the Portfolio eliminated its entire positions in Norway-based aluminum producer Norsk Hydro, U.S.-based titanium pigment manufacturer Tronox Holdings and U.S.-based energy company HF Sinclair in favor of more compelling risk/reward opportunities.
How did the Portfolio’s subsector and subindustry weightings change during the reporting period?
During the reporting period, we reduced the Portfolio’s exposure to the refining & chemicals and natural gas exploration & production segments, while increasing allocations to the energy services and industrials segments.
How was the Portfolio positioned at the end of the reporting period?
As of December 31, 2022, we maintain strong conviction in the natural resources sector and foresee a tight supply/demand environment in the coming years. Inflation has started to permeate the global economy, and we believe the supply response will take some time to alleviate inflationary pressures. The rise of environmental, social and governance (ESG) concerns are likely to continue to distort price signals to commodity producers, thereby exacerbating supply shortfalls. In this environment, the Portfolio’s investment process and style remains unchanged. We continue to seek investments in areas where the commodity macroeconomic and company-specific factors are aligned. In our opinion, the natural resources sector remains one of the best sources of overall portfolio diversification, inflation hedge and dividend yield generation.
| 1. | See page 5 for more information on benchmark and peer group returns. |
The opinions expressed are those of the portfolio managers as of the date of this report and are subject to change. There is no guarantee that any forecasts will come to pass. This material does not constitute investment advice and is not intended as an endorsement of any specific investment.
Not all MainStay VP Portfolios and/or share classes are available under all policies.
| 8 | MainStay VP Natural Resources Portfolio |
Portfolio of Investments December 31, 2022†
| | Shares | Value |
| Common Stocks 99.5% |
| Australia 2.0% |
| BHP Group Ltd., Sponsored ADR (Metals & Mining) (a) | 63,097 | $ 3,915,169 |
| Woodside Energy Group Ltd. (Oil, Gas & Consumable Fuels) | 168,481 | 4,076,415 |
| | | 7,991,584 |
| Brazil 1.2% |
| Adecoagro SA (Food Products) (a) | 585,404 | 4,852,999 |
| Canada 10.2% |
| Cameco Corp. (Oil, Gas & Consumable Fuels) | 532,129 | 12,063,364 |
| Ivanhoe Mines Ltd., Class A (Metals & Mining) (a)(b) | 703,447 | 5,558,998 |
| Li-Cycle Holdings Corp. (Commercial Services & Supplies) (a)(b) | 89,224 | 424,706 |
| NexGen Energy Ltd. (Oil, Gas & Consumable Fuels) (b) | 1,388,288 | 6,141,688 |
| Nutrien Ltd. (Chemicals) (a) | 92,488 | 6,754,399 |
| Teck Resources Ltd., Class B (Metals & Mining) | 245,059 | 9,268,131 |
| | | 40,211,286 |
| Monaco 1.4% |
| Scorpio Tankers, Inc. (Oil, Gas & Consumable Fuels) | 99,569 | 5,353,825 |
| Netherlands 0.4% |
| OCI NV (Chemicals) | 41,443 | 1,478,874 |
| Norway 3.0% |
| Equinor ASA (Oil, Gas & Consumable Fuels) | 172,603 | 6,190,991 |
| Frontline plc (Oil, Gas & Consumable Fuels) (a) | 484,648 | 5,883,627 |
| | | 12,074,618 |
| South Africa 3.8% |
| Anglo American plc (Metals & Mining) | 360,747 | 14,109,782 |
| Sibanye Stillwater Ltd. (Metals & Mining) | 415,398 | 1,102,899 |
| | | 15,212,681 |
| United Kingdom 0.3% |
| Weir Group plc (The) (Machinery) | 55,708 | 1,118,001 |
| | Shares | Value |
| |
| United States 75.1% |
| Alcoa Corp. (Metals & Mining) | 308,230 | $ 14,015,218 |
| Archer-Daniels-Midland Co. (Food Products) | 134,540 | 12,492,039 |
| Bunge Ltd. (Food Products) | 137,787 | 13,747,009 |
| Caterpillar, Inc. (Machinery) | 19,156 | 4,589,011 |
| CF Industries Holdings, Inc. (Chemicals) | 157,494 | 13,418,489 |
| Chesapeake Energy Corp. (Oil, Gas & Consumable Fuels) (a) | 75,124 | 7,089,452 |
| Comstock Resources, Inc. (Oil, Gas & Consumable Fuels) | 196,186 | 2,689,710 |
| ConocoPhillips (Oil, Gas & Consumable Fuels) | 69,409 | 8,190,262 |
| Corteva, Inc. (Chemicals) | 210,840 | 12,393,175 |
| Darling Ingredients, Inc. (Food Products) (b) | 87,179 | 5,456,534 |
| Devon Energy Corp. (Oil, Gas & Consumable Fuels) | 113,328 | 6,970,805 |
| Energy Fuels, Inc. (Oil, Gas & Consumable Fuels) (a)(b) | 505,385 | 3,138,441 |
| Energy Recovery, Inc. (Machinery) (b) | 80,289 | 1,645,122 |
| EOG Resources, Inc. (Oil, Gas & Consumable Fuels) | 135,215 | 17,513,047 |
| EQT Corp. (Oil, Gas & Consumable Fuels) | 207,101 | 7,006,227 |
| Flowserve Corp. (Machinery) | 137,843 | 4,229,023 |
| Fluor Corp. (Construction & Engineering) (b) | 505,657 | 17,526,072 |
| Freeport-McMoRan, Inc. (Metals & Mining) | 502,351 | 19,089,338 |
| Halliburton Co. (Energy Equipment & Services) | 226,666 | 8,919,307 |
| Hess Corp. (Oil, Gas & Consumable Fuels) | 137,003 | 19,429,765 |
| Kirby Corp. (Marine) (b) | 45,796 | 2,946,973 |
| Liberty Energy, Inc., Class A (Energy Equipment & Services) | 254,724 | 4,078,131 |
| Marathon Petroleum Corp. (Oil, Gas & Consumable Fuels) | 136,377 | 15,872,919 |
| Mosaic Co. (The) (Chemicals) | 42,173 | 1,850,129 |
| MP Materials Corp. (Metals & Mining) (b) | 32,485 | 788,736 |
| NexTier Oilfield Solutions, Inc. (Energy Equipment & Services) (b) | 414,503 | 3,830,008 |
| NOV, Inc. (Energy Equipment & Services) | 148,514 | 3,102,457 |
| Occidental Petroleum Corp. (Oil, Gas & Consumable Fuels) | 256,157 | 16,135,329 |
| Patterson-UTI Energy, Inc. (Energy Equipment & Services) | 383,702 | 6,461,542 |
| Range Resources Corp. (Oil, Gas & Consumable Fuels) | 54,011 | 1,351,355 |
The notes to the financial statements are an integral part of, and should be read in conjunction with, the financial statements.
9
Portfolio of Investments December 31, 2022† (continued)
| | Shares | Value |
| Common Stocks (continued) |
| United States (continued) |
| Schlumberger Ltd. (Energy Equipment & Services) | 328,581 | $ 17,565,940 |
| Stem, Inc. (Electrical Equipment) (b) | 51,989 | 464,782 |
| Terex Corp. (Machinery) | 117,315 | 5,011,697 |
| Transocean Ltd. (Energy Equipment & Services) (b) | 1,866,753 | 8,512,394 |
| Weatherford International plc (Energy Equipment & Services) (b) | 197,437 | 10,053,492 |
| | | 297,573,930 |
| Zambia 2.1% |
| First Quantum Minerals Ltd. (Metals & Mining) | 394,916 | 8,251,236 |
Total Common Stocks
(Cost $328,019,898) | | 394,119,034 |
| Short-Term Investments 3.5% |
| Affiliated Investment Company 0.5% |
| United States 0.5% |
| MainStay U.S. Government Liquidity Fund, 3.602% (c) | 1,916,973 | 1,916,973 |
| | Shares | | Value |
| |
| Unaffiliated Investment Company 3.0% |
| United States 3.0% |
| Invesco Government and Agency Portfolio, 4.301% (c)(d) | 11,796,043 | | $ 11,796,043 |
Total Short-Term Investments
(Cost $13,713,016) | | | 13,713,016 |
Total Investments
(Cost $341,732,914) | 103.0% | | 407,832,050 |
| Other Assets, Less Liabilities | (3.0) | | (11,694,914) |
| Net Assets | 100.0% | | $ 396,137,136 |
| † | Percentages indicated are based on Portfolio net assets. |
| (a) | All or a portion of this security was held on loan. As of December 31, 2022, the aggregate market value of securities on loan was $18,833,963; the total market value of collateral held by the Portfolio was $19,364,717. The market value of the collateral held included non-cash collateral in the form of U.S. Treasury securities with a value of $7,568,674. The Portfolio received cash collateral with a value of $11,796,043. (See Note 2(I)) |
| (b) | Non-income producing security. |
| (c) | Current yield as of December 31, 2022. |
| (d) | Represents a security purchased with cash collateral received for securities on loan. |
Investments in Affiliates (in 000's)
Investments in issuers considered to be affiliate(s) of the Portfolio during the year ended December 31, 2022 for purposes of Section 2(a)(3) of the Investment Company Act of 1940, as amended, were as follows:
| Affiliated Investment Companies | Value,
Beginning
of Year | Purchases
at Cost | Proceeds
from
Sales | Net
Realized
Gain/(Loss)
on Sales | Change in
Unrealized
Appreciation/
(Depreciation) | Value,
End of
Year | Dividend
Income | Other
Distributions | Shares
End of
Year |
| MainStay U.S. Government Liquidity Fund | $ 2,646 | $ 133,635 | $ (134,364) | $ — | $ — | $ 1,917 | $ 64 | $ — | 1,917 |
| Abbreviation(s): |
| ADR—American Depositary Receipt |
The notes to the financial statements are an integral part of, and should be read in conjunction with, the financial statements.
| 10 | MainStay VP Natural Resources Portfolio |
The following is a summary of the fair valuations according to the inputs used as of December 31, 2022, for valuing the Portfolio’s assets:
| Description | Quoted
Prices in
Active
Markets for
Identical
Assets
(Level 1) | | Significant
Other
Observable
Inputs
(Level 2) | | Significant
Unobservable
Inputs
(Level 3) | | Total |
| Asset Valuation Inputs | | | | | | | |
| Investments in Securities (a) | | | | | | | |
| Common Stocks | | | | | | | |
| Australia | $ 3,915,169 | | $ 4,076,415 | | $ — | | $ 7,991,584 |
| Netherlands | — | | 1,478,874 | | — | | 1,478,874 |
| Norway | 5,883,627 | | 6,190,991 | | — | | 12,074,618 |
| South Africa | — | | 15,212,681 | | — | | 15,212,681 |
| United Kingdom | — | | 1,118,001 | | — | | 1,118,001 |
| All Other Countries | 356,243,276 | | — | | — | | 356,243,276 |
| Total Common Stocks | 366,042,072 | | 28,076,962 | | — | | 394,119,034 |
| Short-Term Investments | | | | | | | |
| Affiliated Investment Company | 1,916,973 | | — | | — | | 1,916,973 |
| Unaffiliated Investment Company | 11,796,043 | | — | | — | | 11,796,043 |
| Total Short-Term Investments | 13,713,016 | | — | | — | | 13,713,016 |
| Total Investments in Securities | $ 379,755,088 | | $ 28,076,962 | | $ — | | $ 407,832,050 |
| (a) | For a complete listing of investments and their industries, see the Portfolio of Investments. |
The notes to the financial statements are an integral part of, and should be read in conjunction with, the financial statements.
11
Portfolio of Investments December 31, 2022† (continued)
The table below sets forth the diversification of the Portfolio’s investments by industry.
Industry Diversification
| | Value | | Percent † |
| Chemicals | $ 35,895,066 | | 9.1% |
| Commercial Services & Supplies | 424,706 | | 0.1 |
| Construction & Engineering | 17,526,072 | | 4.4 |
| Electrical Equipment | 464,782 | | 0.1 |
| Energy Equipment & Services | 62,523,271 | | 15.8 |
| Food Products | 36,548,581 | | 9.2 |
| Machinery | 16,592,854 | | 4.2 |
| Marine | 2,946,973 | | 0.8 |
| Metals & Mining | 76,099,507 | | 19.2 |
| Oil, Gas & Consumable Fuels | 145,097,222 | | 36.6 |
| | 394,119,034 | | 99.5 |
| Short-Term Investments | 13,713,016 | | 3.5 |
| Other Assets, Less Liabilities | (11,694,914) | | (3.0) |
| Net Assets | $396,137,136 | | 100.0% |
| † | Percentages indicated are based on Portfolio net assets. |
The notes to the financial statements are an integral part of, and should be read in conjunction with, the financial statements.
| 12 | MainStay VP Natural Resources Portfolio |
Statement of Assets and Liabilities as of December 31, 2022
| Assets |
Investment in unaffiliated securities, at value
(identified cost $339,815,941) including securities on loan of $18,833,963 | $405,915,077 |
Investment in affiliated investment companies, at value
(identified cost $1,916,973) | 1,916,973 |
Cash denominated in foreign currencies
(identified cost $457,268) | 462,395 |
| Receivables: | |
| Dividends | 226,382 |
| Portfolio shares sold | 173,184 |
| Securities lending | 10,188 |
| Other assets | 1,349 |
| Total assets | 408,705,548 |
| Liabilities |
| Cash collateral received for securities on loan | 11,796,043 |
| Payables: | |
| Portfolio shares redeemed | 461,204 |
| Manager (See Note 3) | 269,161 |
| Professional fees | 26,327 |
| Shareholder communication | 6,708 |
| Custodian | 3,567 |
| Accrued expenses | 5,402 |
| Total liabilities | 12,568,412 |
| Net assets | $396,137,136 |
| Composition of Net Assets |
| Shares of beneficial interest outstanding (par value of $.001 per share) unlimited number of shares authorized | $ 33,004 |
| Additional paid-in-capital | 402,793,023 |
| | 402,826,027 |
| Total distributable earnings (loss) | (6,688,891) |
| Net assets | $396,137,136 |
| Initial Class | |
| Net assets applicable to outstanding shares | $396,137,136 |
| Shares of beneficial interest outstanding | 33,003,943 |
| Net asset value per share outstanding | $ 12.00 |
The notes to the financial statements are an integral part of, and should be read in conjunction with, the financial statements.
13
Statement of Operations for the year ended December 31, 2022
| Investment Income (Loss) |
| Income | |
| Dividends-unaffiliated (net of foreign tax withholding of $416,550) | $ 10,434,355 |
| Securities lending, net | 97,761 |
| Dividends-affiliated | 63,979 |
| Total income | 10,596,095 |
| Expenses | |
| Manager (See Note 3) | 3,023,679 |
| Professional fees | 82,923 |
| Custodian | 25,904 |
| Shareholder communication | 16,318 |
| Trustees | 8,069 |
| Miscellaneous | 25,656 |
| Total expenses | 3,182,549 |
| Net investment income (loss) | 7,413,546 |
| Realized and Unrealized Gain (Loss) |
| Net realized gain (loss) on: | |
| Unaffiliated investment transactions | 107,549,019 |
| Foreign currency transactions | (124,601) |
| Net realized gain (loss) | 107,424,418 |
| Net change in unrealized appreciation (depreciation) on: | |
| Unaffiliated investments | (8,350,308) |
| Translation of other assets and liabilities in foreign currencies | 1,256 |
| Net change in unrealized appreciation (depreciation) | (8,349,052) |
| Net realized and unrealized gain (loss) | 99,075,366 |
| Net increase (decrease) in net assets resulting from operations | $106,488,912 |
The notes to the financial statements are an integral part of, and should be read in conjunction with, the financial statements.
| 14 | MainStay VP Natural Resources Portfolio |
Statements of Changes in Net Assets
for the years ended December 31, 2022 and December 31, 2021
| | 2022 | 2021 |
| Increase (Decrease) in Net Assets |
| Operations: | | |
| Net investment income (loss) | $ 7,413,546 | $ 4,202,003 |
| Net realized gain (loss) | 107,424,418 | 39,948,671 |
| Net change in unrealized appreciation (depreciation) | (8,349,052) | 41,643,391 |
| Net increase (decrease) in net assets resulting from operations | 106,488,912 | 85,794,065 |
| Distributions to shareholders: | | |
| Initial Class | (4,193,860) | (3,323,461) |
| Capital share transactions: | | |
| Net proceeds from sales of shares | 117,317,650 | 39,038,894 |
| Net asset value of shares issued to shareholders in reinvestment of distributions | 4,193,860 | 3,323,461 |
| Cost of shares redeemed | (120,252,694) | (71,157,994) |
| Increase (decrease) in net assets derived from capital share transactions | 1,258,816 | (28,795,639) |
| Net increase (decrease) in net assets | 103,553,868 | 53,674,965 |
| Net Assets |
| Beginning of year | 292,583,268 | 238,908,303 |
| End of year | $ 396,137,136 | $292,583,268 |
The notes to the financial statements are an integral part of, and should be read in conjunction with, the financial statements.
15
Financial Highlights selected per share data and ratios
| | Year Ended December 31, |
| Initial Class | 2022 | | 2021 | | 2020 | | 2019 | | 2018 |
| Net asset value at beginning of year | $ 8.93 | | $ 6.55 | | $ 6.29 | | $ 5.43 | | $ 7.61 |
| Net investment income (loss) | 0.22 | | 0.12(a) | | 0.09(a) | | 0.13(a) | | 0.04 |
| Net realized and unrealized gain (loss) | 2.97 | | 2.36 | | 0.32 | | 0.78 | | (2.22) |
| Total from investment operations | 3.19 | | 2.48 | | 0.41 | | 0.91 | | (2.18) |
| Less distributions: | | | | | | | | | |
| From net investment income | (0.12) | | (0.10) | | (0.15) | | (0.05) | | — |
| Net asset value at end of year | $ 12.00 | | $ 8.93 | | $ 6.55 | | $ 6.29 | | $ 5.43 |
| Total investment return (b) | 35.84% | | 38.02% | | 6.89% | | 16.62% | | (28.65)%(c) |
| Ratios (to average net assets)/Supplemental Data: | | | | | | | | | |
| Net investment income (loss) | 1.94% | | 1.56% | | 1.68% | | 2.17% | | 0.59% |
| Net expenses (d) | 0.83% | | 0.85% | | 0.86% | | 0.96% | | 0.94% |
| Portfolio turnover rate | 92% | | 72% | | 68% | | 87% | | 78% |
| Net assets at end of year (in 000's) | $ 396,137 | | $ 292,583 | | $ 238,908 | | $ 249,276 | | $ 240,067 |
| (a) | Per share data based on average shares outstanding during the year. |
| (b) | Total return does not reflect any deduction of sales charges, mortality and expense charges, contract charges or administrative charges. For periods of less than one year, total return is not annualized. |
| (c) | Total investment return may reflect adjustments to conform to generally accepted accounting principles. |
| (d) | In addition to the fees and expenses which the Portfolio bears directly, it also indirectly bears a pro-rata share of the fees and expenses of the underlying funds in which it invests. Such indirect expenses are not included in the above expense ratios. |
The notes to the financial statements are an integral part of, and should be read in conjunction with, the financial statements.
| 16 | MainStay VP Natural Resources Portfolio |
Notes to Financial Statements
Note 1–Organization and Business
MainStay VP Funds Trust (the “Fund”) was organized as a Delaware statutory trust on February 1, 2011. The Fund is registered under the Investment Company Act of 1940, as amended (the “1940 Act”), as an open-end management investment company. The Fund is comprised of thirty-one separate series (collectively referred to as the “Portfolios”). These financial statements and notes relate to the MainStay VP Natural Resources Portfolio (the "Portfolio"), a "non-diversified” portfolio, as that term is defined in the 1940 Act, as interpreted or modified by regulatory authorities having jurisdiction, from time to time. However, due to its principal investment strategies and investment processes, the Portfolio has historically operated as a "diversified" portfolio. Therefore, the Portfolio will not operate as "non-diversified" portfolio without first obtaining shareholder approval.
Shares of the Portfolio are currently offered to certain separate accounts to fund variable annuity policies and variable universal life insurance policies issued by New York Life Insurance and Annuity Corporation (“NYLIAC”), a wholly-owned subsidiary of New York Life Insurance Company (“New York Life”) and may also be offered to fund variable annuity policies and variable universal life insurance policies issued by other insurance companies. NYLIAC allocates shares of the Portfolio to, among others, certain NYLIAC separate accounts. Shares of the Portfolio are also offered to the MainStay VP Conservative Allocation Portfolio, MainStay VP Moderate Allocation Portfolio, MainStay VP Growth Allocation Portfolio and MainStay VP Equity Allocation Portfolio, which operate as “funds-of-funds," and other variable insurance funds.
The following table lists the Portfolio's share class that has been registered and commenced operations:
| Class | Commenced Operations |
| Initial Class | February 17, 2012 |
Shares of the Portfolio are offered and are redeemed at a price equal to their respective net asset value (“NAV”) per share. No sales or redemption charge is applicable to the purchase or redemption of the Portfolio's shares.
The Portfolio's investment objective is to seek long-term capital appreciation.
Note 2–Significant Accounting Policies
The Portfolio is an investment company and accordingly follows the investment company accounting and reporting guidance of the Financial Accounting Standards Board (“FASB”) Accounting Standards Codification Topic 946 Financial Services—Investment Companies. The Portfolio prepares its financial statements in accordance with generally accepted accounting principles (“GAAP”) in the United States of America and follows the significant accounting policies described below.
(A) Securities Valuation. Investments are usually valued as of the close of regular trading on the New York Stock Exchange (the "Exchange") (usually 4:00 p.m. Eastern time) on each day the Portfolio is open for business ("valuation date").
Effective September 8, 2022, and pursuant to Rule 2a-5 under the 1940 Act, the Board of Trustees of the Fund (the "Board") designated New York Life Investment Management LLC (“New York Life Investments” or the "Manager") as its Valuation Designee (the "Valuation Designee"). The Valuation Designee is responsible for performing fair valuations relating to all investments in the Portfolio’s portfolio for which market quotations are not readily available; periodically assessing and managing material valuation risks; establishing and applying fair value methodologies; testing fair valuation methodologies; evaluating and overseeing pricing services; ensuring appropriate segregation of valuation and portfolio management functions; providing quarterly, annual and prompt reporting to the Board, as appropriate; identifying potential conflicts of interest; and maintaining appropriate records. The Valuation Designee has established a valuation committee ("Valuation Committee") to assist in carrying out the Valuation Designee’s responsibilities and establish prices of securities for which market quotations are not readily available. The Portfolio’s and the Valuation Designee's policies and procedures ("Valuation Procedures") govern the Valuation Designee’s selection and application of methodologies for determining and calculating the fair value of Portfolio investments. The Valuation Designee may value the Portfolio's portfolio securities for which market quotations are not readily available and other Portfolio assets utilizing inputs from pricing services and other third-party sources (together, “Pricing Sources”). The Valuation Committee meets (in person, via electronic mail or via teleconference) on an ad-hoc basis to determine fair valuations and on a quarterly basis to review fair value events with respect to certain securities for which market quotations are not readily available, including valuation risks and back-testing results, and preview reports to the Board.
The Valuation Committee establishes prices of securities for which market quotations are not readily available based on such methodologies and measurements on a regular basis after considering information that is reasonably available and deemed relevant by the Valuation Committee. The Board shall oversee the Valuation Designee and review fair valuation materials on a prompt, quarterly and annual basis and approve proposed revisions to the Valuation Procedures.
Investments for which market quotations are not readily available are valued at fair value as determined in good faith pursuant to the Valuation Procedures. A market quotation is readily available only when that quotation is a quoted price (unadjusted) in active markets for identical investments that the Portfolio can access at the measurement date, provided that a quotation will not be readily available if it is not reliable. "Fair value" is defined as the price the Portfolio would reasonably expect to receive upon selling an asset or liability in an orderly transaction to an independent buyer in the principal or most advantageous market for the asset or liability. Fair value measurements are determined within a framework that establishes a three-tier hierarchy that maximizes the use
Notes to Financial Statements (continued)
of observable market data and minimizes the use of unobservable inputs to establish a classification of fair value measurements for disclosure purposes. "Inputs" refer broadly to the assumptions that market participants would use in pricing the asset or liability, including assumptions about risk, such as the risk inherent in a particular valuation technique used to measure fair value using a pricing model and/or the risk inherent in the inputs for the valuation technique. Inputs may be observable or unobservable. Observable inputs reflect the assumptions market participants would use in pricing the asset or liability based on market data obtained from sources independent of the Portfolio. Unobservable inputs reflect the Portfolio’s own assumptions about the assumptions market participants would use in pricing the asset or liability based on the information available. The inputs or methodology used for valuing assets or liabilities may not be an indication of the risks associated with investing in those assets or liabilities. The three-tier hierarchy of inputs is summarized below.
| • | Level 1—quoted prices (unadjusted) in active markets for an identical asset or liability |
| • | Level 2—other significant observable inputs (including quoted prices for a similar asset or liability in active markets, interest rates and yield curves, prepayment speeds, credit risk, etc.) |
| • | Level 3—significant unobservable inputs (including the Portfolio's own assumptions about the assumptions that market participants would use in measuring fair value of an asset or liability) |
The level of an asset or liability within the fair value hierarchy is based on the lowest level of an input, both individually and in the aggregate, that is significant to the fair value measurement. The aggregate value by input level of the Portfolio’s assets and liabilities as of December 31, 2022, is included at the end of the Portfolio of Investments.
The Portfolio may use third-party vendor evaluations, whose prices may be derived from one or more of the following standard inputs, among others:
| • Broker/dealer quotes | • Benchmark securities |
| • Two-sided markets | • Reference data (corporate actions or material event notices) |
| • Bids/offers | • Monthly payment information |
| • Industry and economic events | • Reported trades |
An asset or liability for which a market quotation is not readily available is valued by methods deemed reasonable in good faith by the Valuation Committee, following the Valuation Procedures to represent fair value. Under these procedures, the Valuation Designee generally uses a market-based approach which may use related or comparable assets or liabilities, recent transactions, market multiples, book values and other relevant information. The Valuation Designee may also use an income-based valuation approach in which the anticipated future cash flows of the asset or liability are discounted to calculate fair value. Discounts may also be applied due to the nature and/or duration of any restrictions on the disposition of the asset or liability. Fair value represents
a good faith approximation of the value of a security. Fair value determinations involve the consideration of a number of subjective factors, an analysis of applicable facts and circumstances and the exercise of judgment. As a result, it is possible that the fair value for a security determined in good faith in accordance with the Valuation Procedures may differ from valuations for the same security determined for other funds using their own valuation procedures. Although the Valuation Procedures are designed to value a security at the price the Portfolio may reasonably expect to receive upon the security's sale in an orderly transaction, there can be no assurance that any fair value determination thereunder would, in fact, approximate the amount that the Portfolio would actually realize upon the sale of the security or the price at which the security would trade if a reliable market price were readily available. During the year ended December 31, 2022, there were no material changes to the fair value methodologies.
Securities which may be valued in this manner include, but are not limited to: (i) a security for which trading has been halted or suspended or otherwise does not have a readily available market quotation on a given day; (ii) a debt security that has recently gone into default and for which there is not a current market quotation; (iii) a security of an issuer that has entered into a restructuring; (iv) a security that has been delisted from a national exchange; (v) a security subject to trading collars for which no or limited trading takes place; and (vi) a security whose principal market has been temporarily closed at a time when, under normal conditions, it would be open. Securities valued in this manner are generally categorized as Level 2 or 3 in the hierarchy.
Certain securities held by the Portfolio may principally trade in foreign markets. Events may occur between the time the foreign markets close and the time at which the Portfolio's NAVs are calculated. These events may include, but are not limited to, situations relating to a single issuer in a market sector, significant fluctuations in U.S. or foreign markets, natural disasters, armed conflicts, governmental actions or other developments not tied directly to the securities markets. Should the Valuation Designee conclude that such events may have affected the accuracy of the last price of such securities reported on the local foreign market, the Valuation Designee may, pursuant to the Valuation Procedures, adjust the value of the local price to reflect the estimated impact on the price of such securities as a result of such events. In this instance, securities are generally categorized as Level 3 in the hierarchy. Additionally, certain foreign equity securities are also fair valued whenever the movement of a particular index exceeds certain thresholds. In such cases, the securities are fair valued by applying factors provided by a third-party vendor in accordance with the Valuation Procedures and are generally categorized as Level 2 in the hierarchy. Securities that were fair valued in such a manner as of December 31, 2022, are shown in the Portfolio of Investments.
If the principal market of certain foreign equity securities is closed in observance of a local foreign holiday, these securities are valued using the last closing price of regular trading on the relevant exchange and fair valued by applying factors provided by a third-party vendor in accordance with the Valuation Procedures. These securities are generally categorized
| 18 | MainStay VP Natural Resources Portfolio |
as Level 2 in the hierarchy. No securities held by the Portfolio as of December 31, 2022, were fair valued in such a manner.
Equity securities are valued at the last quoted sales prices as of the close of regular trading on the relevant exchange on each valuation date. Securities that are not traded on the valuation date are valued at the mean of the last quoted bid and ask prices. Prices are normally taken from the principal market in which each security trades. These securities are generally categorized as Level 1 in the hierarchy.
Investments in mutual funds, including money market funds, are valued at their respective NAVs at the close of business each day on the valuation date. These securities are generally categorized as Level 1 in the hierarchy.
Temporary cash investments acquired in excess of 60 days to maturity at the time of purchase are valued using the latest bid prices or using valuations based on a matrix system (which considers such factors as security prices, yields, maturities and ratings), both as furnished by independent pricing services. Temporary cash investments that mature in 60 days or less at the time of purchase ("Short-Term Investments") are valued using the amortized cost method of valuation, unless the use of such method would be inappropriate. The amortized cost method involves valuing a security at its cost on the date of purchase and thereafter assuming a constant amortization to maturity of the difference between such cost and the value on maturity date. Amortized cost approximates the current fair value of a security. Securities valued using the amortized cost method are not valued using quoted prices in an active market and are generally categorized as Level 2 in the hierarchy.
The information above is not intended to reflect an exhaustive list of the methodologies that may be used to value portfolio investments. The Valuation Procedures permit the use of a variety of valuation methodologies in connection with valuing portfolio investments. The methodology used for a specific type of investment may vary based on the market data available or other considerations. The methodologies summarized above may not represent the specific means by which portfolio investments are valued on any particular business day.
(B) Income Taxes. The Portfolio's policy is to comply with the requirements of the Internal Revenue Code of 1986, as amended (the “Internal Revenue Code”), applicable to regulated investment companies and to distribute all of its taxable income to the shareholders of the Portfolio within the allowable time limits.
The Manager evaluates the Portfolio’s tax positions to determine if the tax positions taken meet the minimum recognition threshold in connection with accounting for uncertainties in income tax positions taken or expected to be taken for the purposes of measuring and recognizing tax liabilities in the financial statements. Recognition of tax benefits of an uncertain tax position is permitted only to the extent the position is “more likely than not” to be sustained assuming examination by taxing authorities. The Manager analyzed the Portfolio's tax positions taken on federal, state and local income tax returns for all open tax years (for up to three tax years) and has concluded that no provisions for federal, state
and local income tax are required in the Portfolio's financial statements. The Portfolio's federal, state and local income tax and federal excise tax returns for tax years for which the applicable statutes of limitations have not expired are subject to examination by the Internal Revenue Service and state and local departments of revenue.
(C) Foreign Taxes. The Portfolio may be subject to foreign taxes on income and other transaction-based taxes imposed by certain countries in which it invests. A portion of the taxes on gains on investments or currency purchases/repatriation may be reclaimable. The Portfolio will accrue such taxes and reclaims as applicable, based upon its current interpretation of tax rules and regulations that exist in the markets in which it invests.
The Portfolio may be subject to taxation on realized capital gains, repatriation proceeds and other transaction-based taxes imposed by certain countries in which it invests. The Portfolio will accrue such taxes as applicable based upon its current interpretation of tax rules and regulations that exist in the market in which it invests. Capital gains taxes relating to positions still held are reflected as a liability in the Statement of Assets and Liabilities, as well as an adjustment to the Portfolio's net unrealized appreciation (depreciation). Taxes related to capital gains realized, if any, are reflected as part of net realized gain (loss) in the Statement of Operations. Changes in tax liabilities related to capital gains taxes on unrealized investment gains, if any, are reflected as part of the change in net unrealized appreciation (depreciation) on investments in the Statement of Operations. Transaction-based charges are generally assessed as a percentage of the transaction amount.
(D) Dividends and Distributions to Shareholders. Dividends and distributions are recorded on the ex-dividend date. The Portfolio intends to declare and pay dividends from net investment income and distributions from net realized capital and currency gains, if any, at least annually. All dividends and distributions are reinvested at NAV in the same class of shares of the Portfolio. Dividends and distributions to shareholders are determined in accordance with federal income tax regulations and may differ from determinations using GAAP.
(E) Security Transactions and Investment Income. The Portfolio records security transactions on the trade date. Realized gains and losses on security transactions are determined using the identified cost method. Dividend income is recognized on the ex-dividend date, net of any foreign tax withheld at the source, and interest income is accrued as earned using the effective interest rate method. Distributions received from real estate investment trusts may be classified as dividends, capital gains and/or return of capital. Discounts and premiums on securities purchased for the Portfolio are accreted and amortized, respectively, on the effective interest rate method.
(F) Expenses. Expenses of the Fund are allocated to the individual Portfolios in proportion to the net assets of the respective Portfolios when the expenses are incurred, except where direct allocations of expenses can be made. The expenses borne by the Portfolio, including those of related parties to the Portfolio, are shown in the Statement of Operations.
Notes to Financial Statements (continued)
Additionally, the Portfolio may invest in mutual funds, which are subject to management fees and other fees that may cause the costs of investing in mutual funds to be greater than the costs of owning the underlying securities directly. These indirect expenses of mutual funds are not included in the amounts shown as expenses in the Statement of Operations or in the expense ratios included in the Financial Highlights.
(G) Use of Estimates. In preparing financial statements in conformity with GAAP, the Manager makes estimates and assumptions that affect the reported amounts and disclosures in the financial statements. Actual results could differ from those estimates and assumptions.
(H) Foreign Currency Transactions. The Portfolio's books and records are maintained in U.S. dollars. Prices of securities denominated in foreign currency amounts are translated into U.S. dollars at the mean between the buying and selling rates last quoted by any major U.S. bank at the following dates:
(i) market value of investment securities, other assets and liabilities— at the valuation date; and
(ii) purchases and sales of investment securities, income and expenses—at the date of such transactions.
The assets and liabilities that are denominated in foreign currency amounts are presented at the exchange rates and market values at the close of the period. The realized and unrealized changes in net assets arising from fluctuations in exchange rates and market prices of securities are not separately presented.
Net realized gain (loss) on foreign currency transactions represents net currency gains or losses realized as a result of differences between the amounts of securities sale proceeds or purchase cost, dividends, interest and withholding taxes as recorded on the Portfolio's books, and the U.S. dollar equivalent amount actually received or paid. Net currency gains or losses from valuing such foreign currency denominated assets and liabilities, other than investments at valuation date exchange rates, are reflected in unrealized foreign exchange gains or losses.
(I) Securities Lending. In order to realize additional income, the Portfolio may engage in securities lending, subject to the limitations set forth in the 1940 Act and relevant guidance by the staff of the Securities and Exchange Commission (“SEC”). If the Portfolio engages in securities lending, the Portfolio will lend through its custodian, JPMorgan Chase Bank, N.A., ("JPMorgan"), acting as securities lending agent on behalf of the Portfolio. Under the current arrangement, JPMorgan will manage the Portfolio's collateral in accordance with the securities lending agency agreement between the Portfolio and JPMorgan, and indemnify the Portfolio against counterparty risk. The loans will be collateralized by cash (which may be invested in a money market fund) and/or non-cash collateral (which may include U.S. Treasury securities and/or U.S. government agency securities issued or guaranteed by the United States government or its agencies or instrumentalities) at least equal at all times to the market value of the securities loaned. Non-cash collateral held at year end is segregated and cannot be transferred by the Portfolio. The
Portfolio bears the risk of delay in recovery of, or loss of rights in, the securities loaned. The Portfolio may also record a realized gain or loss on securities deemed sold due to a borrower’s inability to return securities on loan. The Portfolio bears the risk of any loss on investment of cash collateral. The Portfolio will receive compensation for lending its securities in the form of fees or it will retain a portion of interest earned on the investment of any cash collateral. The Portfolio will also continue to receive interest and dividends on the securities loaned and any gain or loss in the market price of the securities loaned that may occur during the term of the loan will be for the account of the Portfolio. Income earned from securities lending activities, if any, is reflected in the Statement of Operations. Securities on loan as of December 31, 2022, are shown in the Portfolio of Investments.
(J) Foreign Securities Risk. The Portfolio may invest in foreign securities, which carry certain risks that are in addition to the usual risks inherent in domestic securities. These risks include those resulting from currency fluctuations, future adverse political or economic developments and possible imposition of currency exchange blockages or other foreign governmental laws or restrictions. These risks are likely to be greater in emerging markets than in developed markets. The ability of issuers of debt securities held by the Portfolio to meet their obligations may be affected by, among other things, economic or political developments in a specific country, industry or region.
(K) Indemnifications. Under the Fund’s organizational documents, its officers and trustees are indemnified against certain liabilities that may arise out of performance of their duties to the Fund. Additionally, in the normal course of business, the Portfolio enters into contracts with third-party service providers that contain a variety of representations and warranties and that may provide general indemnifications. The Portfolio's maximum exposure under these arrangements is unknown, as this would involve future claims that may be made against the Portfolio that have not yet occurred. The Manager believes that the risk of loss in connection with these potential indemnification obligations is remote. However, there can be no assurance that material liabilities related to such obligations will not arise in the future, which could adversely impact the Portfolio.
Note 3–Fees and Related Party Transactions
(A) Manager and Subadvisor. New York Life Investments, a registered investment adviser and an indirect, wholly-owned subsidiary of New York Life, serves as the Portfolio’s Manager, pursuant to an Amended and Restated Management Agreement (“Management Agreement”). The Manager provides offices, conducts clerical, recordkeeping and bookkeeping services, and keeps most of the financial and accounting records required to be maintained by the Portfolio. Except for the portion of salaries and expenses that are the responsibility of the Portfolio, the Manager pays the salaries and expenses of all personnel affiliated with the Portfolio and certain operational expenses of the Portfolio. During a portion of the year ended December 31, 2022, the Portfolio reimbursed New York Life Investments in an amount equal to the portion of the compensation of the Chief Compliance Officer attributable to the Portfolio.
| 20 | MainStay VP Natural Resources Portfolio |
Newton Investment Management North America, LLC (“Newton” or the “Subadvisor”), a registered investment adviser, serves as Subadvisor to the Portfolio and is responsible for the day-to-day portfolio management of the Portfolio. Pursuant to the terms of a Subadvisory Agreement between New York Life Investments and Newton, New York Life Investments pays for the services of the Subadvisor.
Pursuant to the Management Agreement, the Fund pays the Manager, on behalf of the Portfolio, a monthly fee for the services performed and the facilities furnished at an annual rate of the Portfolio's average daily net assets as follows: 0.79% up to $1 billion; and 0.78% in excess of $1 billion. During the year ended December 31, 2022, the effective management fee rate was 0.79%.
During the year ended December 31, 2022, New York Life Investments earned fees from the Portfolio in the amount of $3,023,679 and paid the Subadvisor and former subadvisor aggregate fees of $1,373,196.
JPMorgan provides sub-administration and sub-accounting services to the Portfolio pursuant to an agreement with New York Life Investments. These services include calculating the daily NAVs of the Portfolio, maintaining the general ledger and sub-ledger accounts for the calculation of the Portfolio's NAVs, and assisting New York Life Investments in conducting various aspects of the Portfolio's administrative operations. For providing these services to the Portfolio, JPMorgan is compensated by New York Life Investments.
Pursuant to an agreement between the Fund and New York Life Investments, New York Life Investments is responsible for providing or procuring certain regulatory reporting services for the Portfolio. The Portfolio will reimburse New York Life Investments for the actual costs incurred by New York Life Investments in connection with providing or procuring these services for the Portfolio.
Note 4-Federal Income Tax
As of December 31, 2022, the cost and unrealized appreciation (depreciation) of the Portfolio’s investment portfolio, including applicable derivative contracts and other financial instruments, as determined on a federal income tax basis, were as follows:
| | Federal Tax
Cost | Gross
Unrealized
Appreciation | Gross
Unrealized
(Depreciation) | Net
Unrealized
Appreciation/
(Depreciation) |
| Investments in Securities | $342,772,241 | $75,925,640 | $(10,865,831) | $65,059,809 |
As of December 31, 2022, the components of accumulated gain (loss) on a tax basis were as follows:
Ordinary
Income | Accumulated
Capital
and Other
Gain (Loss) | Other
Temporary
Differences | Unrealized
Appreciation
(Depreciation) | Total
Accumulated
Gain (Loss) |
| $7,514,525 | $(79,265,426) | $1 | $65,062,009 | $(6,688,891) |
The difference between book-basis and tax-basis unrealized appreciation (depreciation) is primarily due to wash sale adjustments and Passive Foreign Investment Company ("PFIC") adjustments.
As of December 31, 2022, for federal income tax purposes, capital loss carryforwards of $79,265,426, as shown in the table below, were available to the extent provided by the regulations to offset future realized gains of the Portfolio. Accordingly, no capital gains distributions are expected to be paid to shareholders until net gains have been realized in excess of such amounts.
Capital Loss
Available Through | Short-Term
Capital Loss
Amounts (000’s) | Long-Term
Capital Loss
Amounts (000’s) |
| Unlimited | $23,149 | $56,116 |
The Portfolio utilized $107,609,329 of capital loss carryforwards during the year ended December 31, 2022.
During the years ended December 31, 2022 and December 31, 2021, the tax character of distributions paid as reflected in the Statements of Changes in Net Assets was as follows:
| | 2022 | 2021 |
| Distributions paid from: | | |
| Ordinary Income | $4,193,860 | $3,323,461 |
Note 5–Custodian
JPMorgan is the custodian of cash and securities held by the Portfolio. Custodial fees are charged to the Portfolio based on the Portfolio's net assets and/or the market value of securities held by the Portfolio and the number of certain transactions incurred by the Portfolio.
Note 6–Line of Credit
The Portfolio and certain other funds managed by New York Life Investments maintain a line of credit with a syndicate of banks in order to secure a source of funds for temporary purposes to meet unanticipated or excessive redemption requests.
Effective July 26, 2022, under the credit agreement (the “Credit Agreement”), the aggregate commitment amount is $600,000,000 with an additional uncommitted amount of $100,000,000. The commitment fee is an annual rate of 0.15% of the average commitment amount payable quarterly, regardless of usage, to JPMorgan, who serves as the agent to the syndicate. The commitment fee is allocated among the Portfolio and certain other funds managed by New York Life Investments based upon their respective net assets and other factors. Interest on any revolving credit loan is charged based upon the Federal Funds Rate, Daily Simple Secured Overnight Financing Rate ("SOFR") + 0.10%, or the Overnight Bank Funding Rate, whichever is higher. The Credit Agreement expires on July 25, 2023, although the Portfolio, certain other funds managed by New York Life Investments and the syndicate of banks may renew the Credit Agreement for an additional year on the same or different terms or enter into a credit agreement with a different syndicate
Notes to Financial Statements (continued)
of banks. Prior to July 26, 2022, the aggregate commitment amount and the commitment fee were the same as those under the current Credit Agreement. During the year ended December 31, 2022, there were no borrowings made or outstanding with respect to the Portfolio under the Credit Agreement.
Note 7–Interfund Lending Program
Pursuant to an exemptive order issued by the SEC, the Portfolio, along with certain other funds managed by New York Life Investments, may participate in an interfund lending program. The interfund lending program provides an alternative credit facility that permits the Portfolio and certain other funds managed by New York Life Investments to lend or borrow money for temporary purposes directly to or from one another, subject to the conditions of the exemptive order. During the year ended December 31, 2022, there were no interfund loans made or outstanding with respect to the Portfolio.
Note 8–Purchases and Sales of Securities (in 000’s)
During the year ended December 31, 2022, purchases and sales of securities, other than short-term securities, were $346,640 and $341,417, respectively.
Note 9–Capital Share Transactions
Transactions in capital shares for the years ended December 31, 2022 and December 31, 2021, were as follows:
| Initial Class | Shares | Amount |
| Year ended December 31, 2022: | | |
| Shares sold | 10,407,226 | $ 117,317,650 |
| Shares issued to shareholders in reinvestment of distributions | 365,214 | 4,193,860 |
| Shares redeemed | (10,531,284) | (120,252,694) |
| Net increase (decrease) | 241,156 | $ 1,258,816 |
| Year ended December 31, 2021: | | |
| Shares sold | 4,898,908 | $ 39,038,894 |
| Shares issued to shareholders in reinvestment of distributions | 391,318 | 3,323,461 |
| Shares redeemed | (9,026,803) | (71,157,994) |
| Net increase (decrease) | (3,736,577) | $ (28,795,639) |
Note 10–Other Matters
As of the date of this report, interest rates in the United States and many parts of the world, including certain European countries, are ascending from historically low levels. Thus, the Portfolio currently faces a heightened level of risk associated with rising interest rates. This could be driven by a variety of factors, including but not limited to central bank monetary policies, changing inflation or real growth rates, general economic conditions, increasing bond issuances or reduced market demand for low yielding investments.
An outbreak of COVID-19, first detected in December 2019, has developed into a global pandemic and has resulted in travel restrictions, closure of international borders, certain businesses and securities markets, restrictions on securities trading activities, prolonged quarantines, supply chain disruptions, and lower consumer demand, as well as general concern and uncertainty. In 2022, many countries lifted some or all restrictions related to COVID-19. However, the continued impact of COVID-19 and related variants is uncertain and could further adversely affect the global economy, national economies, individual issuers and capital markets in unforeseeable ways and result in a substantial and extended economic downturn. Developments that disrupt global economies and financial markets, such as COVID-19, may magnify factors that affect the Portfolio's performance.
Note 11–Subsequent Events
In connection with the preparation of the financial statements of the Portfolio as of and for the year ended December 31, 2022, events and transactions subsequent to December 31, 2022, through the date the financial statements were issued have been evaluated by the Manager for possible adjustment and/or disclosure. No subsequent events requiring financial statement adjustment or disclosure have been identified.
| 22 | MainStay VP Natural Resources Portfolio |
Report of Independent Registered Public Accounting Firm
To the Board of Trustees of MainStay VP Funds Trust and Shareholders of
MainStay VP Natural Resources Portfolio
Opinion on the Financial Statements
We have audited the accompanying statement of assets and liabilities, including the portfolio of investments, of MainStay VP Natural Resources Portfolio (one of the portfolios constituting MainStay VP Funds Trust, referred to hereafter as the “Portfolio”) as of December 31, 2022, the related statement of operations for the year ended December 31, 2022, the statements of changes in net assets for each of the two years in the period ended December 31, 2022, including the related notes, and the financial highlights for each of the five years in the period ended December 31, 2022 (collectively referred to as the “financial statements”). In our opinion, the financial statements present fairly, in all material respects, the financial position of the Portfolio as of December 31, 2022, the results of its operations for the year then ended, the changes in its net assets for each of the two years in the period ended December 31, 2022 and the financial highlights for each of the five years in the period ended December 31, 2022 in conformity with accounting principles generally accepted in the United States of America.
Basis for Opinion
These financial statements are the responsibility of the Portfolio’s management. Our responsibility is to express an opinion on the Portfolio’s financial statements based on our audits. We are a public accounting firm registered with the Public Company Accounting Oversight Board (United States) (PCAOB) and are required to be independent with respect to the Portfolio in accordance with the U.S. federal securities laws and the applicable rules and regulations of the Securities and Exchange Commission and the PCAOB.
We conducted our audits of these financial statements in accordance with the standards of the PCAOB. Those standards require that we plan and perform the audit to obtain reasonable assurance about whether the financial statements are free of material misstatement, whether due to error or fraud.
Our audits included performing procedures to assess the risks of material misstatement of the financial statements, whether due to error or fraud, and performing procedures that respond to those risks. Such procedures included examining, on a test basis, evidence regarding the amounts and disclosures in the financial statements. Our audits also included evaluating the accounting principles used and significant estimates made by management, as well as evaluating the overall presentation of the financial statements. Our procedures included confirmation of securities owned as of December 31, 2022 by correspondence with the custodian and transfer agents. We believe that our audits provide a reasonable basis for our opinion.
/s/PricewaterhouseCoopers LLP
New York, New York
February 24, 2023
We have served as the auditor of one or more investment companies in the MainStay group of funds since 1984.
Board Consideration and Approval of Management Agreement and Subadvisory Agreement (Unaudited)
The continuation of the Management Agreement with respect to the MainStay VP Natural Resources Portfolio (“Portfolio”) and New York Life Investment Management LLC (“New York Life Investments”) and the Subadvisory Agreement between New York Life Investments and Newton Investment Management North America, LLC (“Newton”) with respect to the Portfolio (together, “Advisory Agreements”) is subject to annual review and approval by the Board of Trustees of MainStay VP Funds Trust (“Board” of the “Trust”) in accordance with Section 15 of the Investment Company Act of 1940, as amended (“1940 Act”). At its December 6–7, 2022 meeting, the Board, which is comprised solely of Trustees who are not an “interested person” (as such term is defined in the 1940 Act) of the Trust (“Independent Trustees”), unanimously approved the continuation of each of the Advisory Agreements for a one-year period.
In reaching the decision to approve the continuation of each of the Advisory Agreements, the Board considered information and materials furnished by New York Life Investments and Newton in connection with an annual contract review process undertaken by the Board that took place at meetings of the Board and its Contracts Committee during October 2022 through December 2022, including information and materials furnished by New York Life Investments and Newton in response to requests prepared on behalf of the Board, and in consultation with the Board, by independent legal counsel to the Independent Trustees, which encompassed a variety of topics, including those summarized below. Information and materials requested by and furnished to the Board for consideration in connection with the contract review process included, among other items, reports on the Portfolio and “peer funds” prepared by Institutional Shareholder Services Inc. (“ISS”), an independent third-party service provider engaged by the Board to report objectively on the Portfolio’s investment performance, management fee and total expenses. The Board also considered information on the fees charged to other investment advisory clients of New York Life Investments and/or Newton that follow investment strategies similar to those of the Portfolio, if any, and, when applicable, the rationale for any differences in the Portfolio’s management and subadvisory fees and the fees charged to those other investment advisory clients. In addition, the Board considered information regarding the legal standards and fiduciary obligations applicable to its consideration of the continuation of each of the Advisory Agreements. The contract review process, including the structure and format for information and materials provided to the Board, has been developed in consultation with the Board. The Independent Trustees also met in executive sessions with their independent legal counsel and, for portions thereof, with senior management of New York Life Investments.
The Board’s deliberations with respect to the continuation of each of the Advisory Agreements reflect a year-long process, and the Board also took into account information furnished to the Board and its Committees throughout the year, as deemed relevant and appropriate by the Trustees, including, among other items, reports on investment performance of the Portfolio and investment-related matters for the Portfolio as well as presentations from New York Life Investments and, generally annually, Newton personnel. In addition, the Board took into account other information received from New York Life Investments throughout the year,
including, among other items, periodic reports on legal and compliance matters, risk management, portfolio turnover, brokerage commissions and non-advisory services provided to the Portfolio by New York Life Investments, as deemed relevant and appropriate by the Trustees.
In addition to information provided to the Board throughout the year, the Board received information in connection with its June 2022 meeting provided specifically in response to requests prepared on behalf of the Board, and in consultation with the Board, by independent legal counsel to the Independent Trustees regarding the Portfolio’s distribution arrangements. In addition, the Board received information regarding the Portfolio’s asset levels, share purchase and redemption activity and the payment of fees by the share class of the Portfolio, among other information.
In considering the continuation of each of the Advisory Agreements, the Trustees reviewed and evaluated the information and factors they believed to reasonably be necessary and appropriate in light of legal advice furnished to them by independent legal counsel to the Independent Trustees and through the exercise of their own business judgment. Although individual Trustees may have weighed certain factors or information differently and the Board did not consider any single factor or information controlling in reaching its decision, the factors considered by the Board are summarized in more detail below and include, among other factors: (i) the nature, extent and quality of the services provided to the Portfolio by New York Life Investments and Newton; (ii) the qualifications of the portfolio managers of the Portfolio and the historical investment performance of the Portfolio, New York Life Investments and Newton; (iii) the costs of the services provided, and profits realized, by New York Life Investments and Newton with respect to their relationships with the Portfolio; (iv) the extent to which economies of scale have been realized or may be realized if the Portfolio grows and the extent to which any economies of scale have been shared, have benefited or may benefit the Portfolio’s shareholders; and (v) the reasonableness of the Portfolio’s management and subadvisory fees and total ordinary operating expenses. Although the Board recognized that comparisons between the Portfolio’s fees and expenses and those of other funds are imprecise given different terms of agreements, variations in fund strategies and other factors, the Board considered the reasonableness of the Portfolio’s management fee and total ordinary operating expenses as compared to the peer funds identified by ISS. Throughout their considerations, the Trustees acknowledged the commitment of New York Life Investments and its affiliates to serve the MainStay Group of Funds, as well as their capacity, experience, resources, financial stability and reputations. The Trustees also acknowledged the entrepreneurial and other risks assumed by New York Life Investments in sponsoring and managing the Portfolio. With respect to the Subadvisory Agreement, the Board took into account New York Life Investments’ recommendation to approve the continuation of the Subadvisory Agreement.
The Trustees noted that, throughout the year, the Trustees are afforded an opportunity to ask questions of, and request additional information or materials from, New York Life Investments and Newton. The Board’s decision with respect to each of the Advisory Agreements may have also
| 24 | MainStay VP Natural Resources Portfolio |
been based, in part, on the Board’s knowledge of New York Life Investments and Newton resulting from, among other things, the Board’s consideration of each of the Advisory Agreements in prior years, the advisory agreements for other funds in the MainStay Group of Funds, the Board’s review throughout the year of the performance and operations of other funds in the MainStay Group of Funds and each Trustee’s business judgment and industry experience. In addition to considering the above-referenced factors, the Board observed that in the marketplace, notably under variable life insurance policies and variable annuity contracts for which the Portfolio serves as an investment option, there are a range of investment options available to investors and that the Portfolio’s shareholders, having had the opportunity to consider other investment options, have chosen to invest in the Portfolio.
The factors that figured prominently in the Board’s decision to approve the continuation of each of the Advisory Agreements during its December 6–7, 2022 meeting are summarized in more detail below.
Nature, Extent and Quality of Services Provided by New York Life Investments and Newton
The Board examined the nature, extent and quality of the services that New York Life Investments provides to the Portfolio. The Board evaluated New York Life Investments’ experience and capabilities in serving as manager of the Portfolio and considered that the Portfolio operates in a “manager-of-managers” structure. The Board also considered New York Life Investments’ responsibilities and services provided pursuant to this structure, including overseeing the services provided by Newton, evaluating the performance of Newton, making recommendations to the Board as to whether the Subadvisory Agreement should be renewed, modified or terminated and periodically reporting to the Board regarding the results of New York Life Investments’ evaluation and monitoring functions. The Board noted that New York Life Investments manages other mutual funds, serves a variety of other investment advisory clients, including other pooled investment vehicles, and has experience overseeing mutual fund service providers, including subadvisors. The Board considered the experience of senior personnel at New York Life Investments providing management and administrative and other non-advisory services to the Portfolio. The Board observed that New York Life Investments devotes significant resources and time to providing management and administrative and other non-advisory services to the Portfolio, including New York Life Investments’ oversight and due diligence reviews of Newton and ongoing analysis of, and interactions with, Newton with respect to, among other things, the Portfolio’s investment performance and risks as well as Newton’s investment capabilities and subadvisory services with respect to the Portfolio.
The Board also considered the range of services that New York Life Investments provides to the Portfolio under the terms of the Management Agreement, including: (i) fund accounting and ongoing supervisory services provided by New York Life Investments’ Fund Administration and Accounting Group; (ii) investment supervisory and analytical services provided by New York Life Investments’ Investment Consulting Group; (iii) compliance services provided by the Trust’s Chief Compliance Officer as
well as New York Life Investments’ compliance department, including supervision and implementation of the Portfolio’s compliance program; (iv) legal services provided by New York Life Investments’ Office of the General Counsel; and (v) risk management monitoring and analysis by compliance and investment personnel. In addition, the Board considered New York Life Investments’ willingness to invest in personnel and other resources, such as cyber security, information security and business continuity planning, designed to benefit the Portfolio and noted that New York Life Investments is responsible for compensating the Trust’s officers, except for a portion of the salary of the Trust’s Chief Compliance Officer. The Board recognized that New York Life Investments provides certain other non-advisory services to the Portfolio and has provided an increasingly broad array of non-advisory services to the MainStay Group of Funds as a result of regulatory and other developments, including in connection with the implementation of the MainStay Group of Funds’ derivatives risk management program and policies and procedures adopted pursuant to Rule 18f-4 under the 1940 Act.
The Board also examined the range, and the nature, extent and quality, of the investment advisory services that Newton provides to the Portfolio and considered the terms of each of the Advisory Agreements. The Board evaluated Newton’s experience and performance in serving as subadvisor to the Portfolio and advising other portfolios and Newton’s track record and experience in providing investment advisory services, the experience of investment advisory, senior management and administrative personnel at Newton. The Board considered New York Life Investments’ and Newton’s overall resources, legal and compliance environment, capabilities, reputation, financial condition and history. In addition to information provided in connection with quarterly meetings with the Trust’s Chief Compliance Officer, the Board considered information regarding the compliance policies and procedures of New York Life Investments and Newton and acknowledged their commitment to further developing and strengthening compliance programs relating to the Portfolio. The Board also considered Newton’s ability to recruit and retain qualified investment professionals and willingness to invest in personnel and other resources to service and support the Portfolio. In this regard, the Board considered the qualifications and experience of the Portfolio’s portfolio managers, the number of accounts managed by the portfolio managers and the method for compensating the portfolio managers.
In addition, the Board considered information provided by New York Life Investments and Newton regarding the operations of their respective business continuity plans in response to the COVID-19 pandemic and the continued remote work environment.
Based on these considerations, among others, the Board concluded that the Portfolio would likely continue to benefit from the nature, extent and quality of these services.
Investment Performance
In evaluating the Portfolio’s investment performance, the Board considered investment performance results over various periods in light of the Portfolio’s investment objective, strategies and risks. The Board
Board Consideration and Approval of Management Agreement and Subadvisory Agreement (Unaudited) (continued)
considered investment reports on, and analysis of, the Portfolio’s performance provided to the Board throughout the year. These reports include, among other items, information on the Portfolio’s gross and net returns, the Portfolio’s investment performance compared to a relevant investment category and the Portfolio’s benchmark, the Portfolio’s risk-adjusted investment performance and the Portfolio’s investment performance as compared to peer funds, as appropriate, as well as portfolio attribution information and commentary on the effect of market conditions. The Board also considered information provided by ISS showing the investment performance of the Portfolio as compared to peer funds. In addition, the Board reviewed the methodology used by ISS to construct the group of peer funds for comparative purposes.
The Board also took into account its discussions with senior management at New York Life Investments concerning the Portfolio’s investment performance over various periods as well as discussions between the Portfolio’s portfolio management team and the members of the Board’s Investment Committee, which generally occur on an annual basis. In addition, the Board considered any specific actions that New York Life Investments or Newton had taken, or had agreed to take, to seek to enhance Portfolio investment performance and the results of those actions.
Based on these considerations, among others, the Board concluded that its review of the Portfolio’s investment performance and related information supported a determination to approve the continuation of each of the Advisory Agreements.
Costs of the Services Provided, and Profits and Other Benefits Realized, by New York Life Investments and Newton
The Board considered the costs of the services provided under each of the Advisory Agreements. The Board also considered the profits realized by New York Life Investments and its affiliates and Newton due to their relationships with the Portfolio as well as by New York Life Investments and its affiliates due to their relationships with the MainStay Group of Funds. The Board considered information from New York Life Investments that Newton’s subadvisory fee reflected an arm’s-length negotiation and that this fee is paid by New York Life Investments, not the Portfolio, and the relevance of Newton’s profitability was considered by the Trustees in that context. On this basis, the Board primarily considered the costs and profitability for New York Life Investments and its affiliates with respect to the Portfolio.
In addition, the Board acknowledged the difficulty in obtaining reliable comparative data about mutual fund managers’ profitability because such information generally is not publicly available and may be impacted by numerous factors, including the structure of a fund manager’s organization, the types of funds it manages, the methodology used to allocate certain fixed costs to specific funds and the manager’s capital structure and costs of capital.
In evaluating the costs of the services provided by New York Life Investments and Newton and profits realized by New York Life Investments and its affiliates and Newton, the Board considered, among
other factors, New York Life Investments’ and its affiliates’ and Newton’s continuing investments in, or willingness to invest in, personnel and other resources to support and further enhance the management of the Portfolio, and that New York Life Investments is responsible for paying the subadvisory fee for the Portfolio. The Board also considered the financial resources of New York Life Investments and Newton and acknowledged that New York Life Investments and Newton must be in a position to recruit and retain experienced professional personnel and to maintain a strong financial position for New York Life Investments and Newton to continue to provide high-quality services to the Portfolio. The Board recognized that the Portfolio benefits from the allocation of certain fixed costs among the funds in the MainStay Group of Funds, among other expected benefits resulting from its relationship with New York Life Investments.
The Board considered information regarding New York Life Investments’ methodology for calculating profitability and allocating costs provided by New York Life Investments in connection with the fund profitability analysis presented to the Board. The Board noted it had previously engaged an independent consultant to review the methods used to allocate costs among the funds in the MainStay Group of Funds. The Board also noted that the independent consultant had concluded that New York Life Investments’ methods for allocating costs and procedures for estimating overall profitability of the relationship with the funds in the MainStay Group of Funds are reasonable and that New York Life Investments continued to use the same method of calculating profit and allocating costs since the independent consultant’s review. The Board recognized the difficulty in calculating and evaluating a manager’s profitability with respect to the Portfolio and considered that other profitability methodologies may also be reasonable.
The Board also considered certain fall-out benefits that may be realized by New York Life Investments and its affiliates due to their relationships with the Portfolio, including reputational and other indirect benefits. The Board recognized, for example, the benefits to Newton from legally permitted “soft-dollar” arrangements by which brokers provide research and other services to Newton in exchange for commissions paid by the Portfolio with respect to trades in the Portfolio’s portfolio securities. In this regard, the Board also requested and considered information from New York Life Investments concerning other material business relationships between Newton and its affiliates and New York Life Investments and its affiliates. In addition, the Board considered its review of the management agreement for a money market fund advised by New York Life Investments and an affiliated subadvisor that serves as an investment option for the Portfolio, including the potential rationale for and costs associated with investments in this money market fund by the Portfolio, if any, and considered information from New York Life Investments that the nature and type of specific investment advisory services provided to this money market fund are distinct from, or in addition to, the investment advisory services provided to the Portfolio. In addition, the Board considered the potential dividend received tax deduction for insurance company affiliates of New York Life Investments from the Portfolio’s securities lending activity.
| 26 | MainStay VP Natural Resources Portfolio |
The Board noted that the Portfolio serves as an investment option primarily under variable contracts issued by affiliates of New York Life Investments that would receive fees under those contracts. The Board observed that, in addition to fees earned by New York Life Investments under the Management Agreement for managing the Portfolio, New York Life Investments’ affiliates also earn revenues from serving the Portfolio in various other capacities, including as the Portfolio’s distributor. The Board considered information about these other revenues and their impact on the profitability of the relationship with the Portfolio to New York Life Investments and its affiliates. The Board noted that, although it assessed the overall profitability of the relationship with the Portfolio to New York Life Investments and its affiliates as part of the contract review process, when considering the reasonableness of the fee paid to New York Life Investments under the Management Agreement, the Board considered the profitability of New York Life Investments’ relationship with the Portfolio on a pre-tax basis and without regard to distribution expenses incurred by New York Life Investments from its own resources.
After evaluating the information deemed relevant by the Trustees, the Board concluded that any profits realized by New York Life Investments and its affiliates due to their relationships with the Portfolio were not excessive, other benefits that may accrue to New York Life Investments and its affiliates are reasonable and benefits that may accrue to Newton and its affiliates are consistent with those expected for a subadvisor to a mutual fund. With respect to Newton, the Board considered that any profits realized by Newton due to its relationship with the Portfolio are the result of arm’s-length negotiations between New York Life Investments and Newton, acknowledging that any such profits are based on the subadvisory fee paid to Newton by New York Life Investments, not the Portfolio.
Management and Subadvisory Fees and Total Ordinary Operating Expenses
The Board evaluated the reasonableness of the fee paid under each of the Advisory Agreements and the Portfolio’s total ordinary operating expenses. The Board primarily considered the reasonableness of the management fee paid by the Portfolio to New York Life Investments because the subadvisory fee paid to Newton is paid by New York Life Investments, not the Portfolio. The Board also considered the reasonableness of the subadvisory fee paid by New York Life Investments and the amount of the management fee retained by New York Life Investments.
In assessing the reasonableness of the Portfolio’s fees and expenses, the Board primarily considered comparative data provided by ISS on the fees and expenses charged by similar mutual funds managed by other investment advisers. The Board reviewed the methodology used by ISS to construct the group of peer funds for comparative purposes. In addition, the Board considered information provided by New York Life Investments and Newton on fees charged to other investment advisory clients, including institutional separate accounts and/or other funds that follow investment strategies similar to those of the Portfolio, if any. The Board considered the contractual management fee schedules of the Portfolio as
compared to those of such other investment advisory clients, taking into account the rationale for any differences in fee schedules. The Board also took into account information provided by New York Life Investments about the more extensive scope of services provided to registered investment companies, such as the Portfolio, as compared with other investment advisory clients. Additionally, the Board considered the impact of contractual breakpoints on the Portfolio’s net management fee and expenses. The Board also considered that in proposing fees for the Portfolio, New York Life Investments considers the competitive marketplace for mutual funds.
Based on the factors outlined above, among other considerations, the Board concluded that the Portfolio’s management fee and total ordinary operating expenses are within a range that is competitive and support a conclusion that these fees and expenses are reasonable.
Economies of Scale
The Board considered information regarding economies of scale, including whether economies of scale may exist for the Portfolio and whether the Portfolio’s expense structure permits any economies of scale to be appropriately shared with the Portfolio’s beneficial shareholders. The Board also considered a report from New York Life Investments, previously prepared at the request of the Board, that addressed economies of scale, including with respect to the mutual fund business generally, and the various ways in which the benefits of economies of scale may be shared with the funds in the MainStay Group of Funds. Although the Board recognized the difficulty of determining economies of scale with precision, the Board acknowledged that economies of scale may be shared with the Portfolio in a number of ways, including, for example, through the imposition of fee breakpoints, initially setting management fee rates at scale or making additional investments to enhance the services provided to the Portfolio. The Board reviewed information from New York Life Investments showing how the Portfolio’s management fee schedule compared to fee schedules of other funds and accounts managed by New York Life Investments. The Board also reviewed information from ISS showing how the Portfolio’s management fee schedule compared with fees paid for similar services by peer funds at varying asset levels.
Based on this information, the Board concluded that economies of scale are appropriately reflected for the benefit of the Portfolio’s beneficial shareholders through the Portfolio’s expense structure and other methods to share benefits from economies of scale.
Conclusion
On the basis of the information and factors summarized above, among other information and factors deemed relevant by the Trustees, and the evaluation thereof, the Board unanimously voted to approve the continuation of each of the Advisory Agreements.
Proxy Voting Policies and Procedures and Proxy Voting Record
The Portfolio is required to file with the SEC its proxy voting record for the 12-month period ending June 30 on Form N-PX. A description of the policies and procedures that are used to vote proxies relating to portfolio securities of the Portfolio is available free of charge upon request by calling 800-598-2019 or visiting the SEC's website at www.sec.gov. The most recent Form N-PX or proxy voting record is available free of charge upon request by calling 800-598-2019; visiting https://www.newyorklifeinvestments.com/investment-products/vp; or visiting the SEC’s website at www.sec.gov.
Shareholder Reports and Quarterly Portfolio Disclosure
The Portfolio is required to file its complete schedule of portfolio holdings with the SEC 60 days after its first and third fiscal quarter on Form N-PORT. The Portfolio's holdings report is available free of charge upon request by calling 800-598-2019 or by visiting the SEC’s website at www.sec.gov.
| 28 | MainStay VP Natural Resources Portfolio |
Board of Trustees and Officers (Unaudited)
The Trustees and officers of the Portfolio are listed below. The Board oversees the MainStay Group of Funds (which consists of MainStay Funds and MainStay Funds Trust), MainStay VP Funds Trust, MainStay MacKay DefinedTerm Municipal Opportunities Fund, MainStay CBRE Global Infrastructure Megatrends Fund, the Manager and the Subadvisors, and elects the officers of the Portfolios who are responsible for the day-to-day operations of the Portfolio. Information pertaining to the Trustees and officers is set forth below. Each Trustee serves until his or her successor
is elected and qualified or until his or her resignation, death or removal. Under the Board’s retirement policy, unless an exception is made, a Trustee must tender his or her resignation by the end of the calendar year during which he or she reaches the age of 75. The business address of each Trustee and officer listed below is 51 Madison Avenue, New York, New York 10010. None of the Trustees are “interested persons” (as defined by the 1940 Act and rules adopted by the SEC thereunder) of the Portfolio (“Independent Trustees”).
| | Name and
Year of Birth | Term of Office,
Position(s) Held and
Length of Service | Principal Occupation(s)
During Past Five Years | Number of
Portfolios in
Fund Complex
Overseen by
Trustee | Other Directorships
Held by Trustee |
| | | | | | |
| | David H. Chow
1957 | MainStay VP Funds Trust: Trustee since January 2016, Advisory Board Member (June 2015 to December 2015) | Founder and CEO, DanCourt Management, LLC since 1999 | 78 | MainStay Funds: Trustee since January 2016, Advisory Board Member (June 2015 to December 2015) (12 Funds);
MainStay Funds Trust: Trustee since January 2016, Advisory Board Member (June 2015 to December 2015) (33 Funds);
MainStay MacKay DefinedTerm Municipal Opportunities Fund: Trustee since January 2016, Advisory Board Member (June 2015 to December 2015);
MainStay CBRE Global Infrastructure Megatrends Fund: Trustee since June 2021;VanEck Vectors Group of Exchange-Traded Funds: Independent Chairman of the Board of Trustees since 2008 and Trustee since 2006 (57 portfolios); and Berea College of Kentucky: Trustee since 2009, Chair of the Committee since 2018 |
| | Susan B. Kerley
1951 | MainStay VP Funds Trust: Chairman since 2017 and Trustee since 2007* | President, Strategic Management Advisors LLC since 1990 | 78 | MainStay Funds: Chairman since 2017 and Trustee since 2007 (12 Funds); MainStay Funds Trust: Chairman since 2017 and Trustee since 1990 (33 Funds)**;
MainStay MacKay DefinedTerm Municipal Opportunities Fund: Chairman since 2017 and Trustee since 2011; MainStay CBRE Global Infrastructure Megatrends Fund: Trustee since June 2021; and Legg Mason Partners Funds: Trustee since 1991 (45 portfolios) |
| | Alan R. Latshaw
1951 | MainStay VP Funds Trust: Trustee since 2007* | Retired; Partner, Ernst & Young LLP (2002 to 2003); Partner, Arthur Andersen LLP (1989 to 2002); Consultant to the MainStay Funds Audit and Compliance Committee (2004 to 2006) | 78 | MainStay Funds: Trustee since 2006 (12 Funds);
MainStay Funds Trust: Trustee since 2007 (33 Funds)**;
MainStay MacKay DefinedTerm Municipal Opportunities Fund: Trustee since 2011; and
MainStay CBRE Global Infrastructure Megatrends Fund: Trustee since June 2021 |
Board of Trustees and Officers (Unaudited) (continued)
| | Name and
Year of Birth | Term of Office,
Position(s) Held and
Length of Service | Principal Occupation(s)
During Past Five Years | Number of
Portfolios in
Fund Complex
Overseen by
Trustee | Other Directorships
Held by Trustee |
| | | | | | |
| | Karen Hammond
1956 | MainStay VP Funds Trust: Trustee since December 2021, Advisory Board Member (June 2021 to December 2021)
| Retired, Managing Director, Devonshire Investors (2007 to 2013); Senior Vice President, Fidelity Management & Research Co. (2005 to 2007); Senior Vice President and Corporate Treasurer, FMR Corp. (2003 to 2005); Chief Operating Officer, Fidelity Investments Japan (2001 to 2003) | 78 | MainStay Funds: Trustee since December 2021, Advisory Board Member (June 2021 to December 2021) (12 Funds);
MainStay Funds Trust: Trustee since December 2021, Advisory Board Member (June 2021 to December 2021) (33 Funds);
MainStay MacKay DefinedTerm Municipal Opportunities Fund: Trustee since December 2021, Advisory Board Member (June 2021 to December 2021);
MainStay CBRE Global Infrastructure Megatrends Fund: Trustee since December 2021, Advisory Board Member (June 2021 to December 2021);
Two Harbors Investment Corp.: Director since 2018; Rhode Island State Investment Commission: Member since 2017; and Blue Cross Blue Shield of Rhode Island: Director since 2019
|
| | Jacques P. Perold
1958 | MainStay VP Funds Trust: Trustee since January 2016, Advisory Board Member (June 2015 to December 2015) | Founder and Chief Executive Officer, CapShift Advisors LLC (since 2018); President, Fidelity Management & Research Company (2009 to 2014); President and Chief Investment Officer, Geode Capital Management, LLC (2001 to 2009) | 78 | MainStay Funds: Trustee since January 2016, Advisory Board Member (June 2015 to December 2015) (12 Funds);
MainStay Funds Trust: Trustee since January 2016, Advisory Board Member (June 2015 to December 2015) (33 Funds); MainStay MacKay DefinedTerm Municipal Opportunities Fund: Trustee since January 2016, Advisory Board Member (June 2015 to December 2015);
MainStay CBRE Global Infrastructure Megatrends Fund: Trustee since June 2021; Allstate Corporation: Director since 2015;
Partners in Health: Trustee since 2019; and
MSCI Inc.: Director since 2017 |
| | Richard S. Trutanic
1952 | MainStay VP Funds Trust: Trustee since 2007* | Chairman and Chief Executive Officer, Somerset & Company (financial advisory firm) since 2004; Managing Director, The Carlyle Group (private investment firm) (2002 to 2004); Senior Managing Director, Partner and Board Member, Groupe Arnault S.A. (private investment firm) (1999 to 2002)
| 78 | MainStay Funds: Trustee since 1994 (12 Funds);
MainStay Funds Trust: Trustee since 2007 (33 Funds)**;
MainStay MacKay DefinedTerm Municipal Opportunities Fund: Trustee since 2011; and
MainStay CBRE Global Infrastructure Megatrends Fund: Trustee since June 2021 |
| * | Includes prior service as a Director of MainStay VP Series Fund, Inc., the predecessor to MainStay VP Funds Trust. |
| ** | Includes prior service as a Director/Trustee of certain predecessor entities to MainStay Funds Trust. |
| 30 | MainStay VP Natural Resources Portfolio |
| | Name and
Year of Birth | Position(s) Held and
Length of Service | Principal Occupation(s)
During Past Five Years | |
| | | | | |
| | Kirk C. Lehneis
1974 | President, MainStay VP Funds Trust (since 2017) | Chief Operating Officer and Senior Managing Director (since 2016), New York Life Investment Management LLC and New York Life Investment Management Holdings LLC; Member of the Board of Managers (since 2017) and Senior Managing Director (since 2018), NYLIFE Distributors LLC; Chairman of the Board and Senior Managing Director, NYLIM Service Company LLC (since 2017); Trustee, President and Principal Executive Officer of IndexIQ Trust, IndexIQ ETF Trust and IndexIQ Active ETF Trust (since January 2018); President, MainStay CBRE Global Infrastructure Megatrends Fund (since 2021), MainStay MacKay DefinedTerm Municipal Opportunities Fund, MainStay Funds and MainStay Funds Trust (since 2017); Senior Managing Director, Global Product Development (from 2015-2016); Managing Director, Product Development (from 2010-2015), New York Life Investment Management LLC | |
| | Jack R. Benintende
1964 | Treasurer and Principal Financial and Accounting Officer, MainStay VP Funds Trust (since 2007)** | Managing Director, New York Life Investment Management LLC (since 2007); Treasurer and Principal Financial and Accounting Officer, MainStay CBRE Global Infrastructure Megatrends Fund (since 2021), MainStay MacKay DefinedTerm Municipal Opportunities Fund (since 2011), MainStay Funds Trust (since 2009) and MainStay Funds (since 2007); and Assistant Treasurer, New York Life Investment Management Holdings LLC (2008 to 2012) | |
| | J. Kevin Gao
1967 | Secretary and Chief Legal Officer, MainStay VP Funds Trust (since 2010)** | Managing Director and Associate General Counsel, New York Life Investment Management LLC (since 2010); Secretary and Chief Legal Officer, MainStay CBRE Global Infrastructure Megatrends Fund (since 2021), MainStay MacKay DefinedTerm Municipal Opportunities Fund (since 2011), MainStay Funds and MainStay Funds Trust (since 2010) | |
| | Scott T. Harrington
1959 | Vice President— Administration, MainStay VP Funds Trust (since 2005)** | Managing Director, New York Life Investment Management LLC (including predecessor advisory organizations) (since 2000); Member of the Board of Directors, New York Life Trust Company (since 2009); Vice President—Administration, MainStay CBRE Global Infrastructure Megatrends Fund (since 2021), MainStay MacKay DefinedTerm Municipal Opportunities Fund (since 2011), MainStay Funds Trust and MainStay Funds (since 2009) | |
| | Kevin M. Gleason
1967 | Vice President and Chief Compliance Officer, MainStay VP Funds Trust (since June 2022) | Vice President and Chief Compliance Officer, IndexIQ, IndexIQ ETF Trust and Index IQ Active ETF Trust (since June 2022); Vice President and Chief Compliance Officer, MainStay CBRE Global Infrastructure Megatrends Fund, MainStay MacKay DefinedTerm Municipal Opportunities Fund (since June 2022); MainStay Funds Trust and MainStay Funds (since June 2022); Senior Vice President, Voya Investment Management and Chief Compliance Officer, Voya Family of Funds (2012-2022) | |
| * | The officers listed above are considered to be “interested persons” of the MainStay Group of Funds, MainStay VP Funds Trust, MainStay CBRE Global Infrastructure Megatrends Fund and MainStay MacKay DefinedTerm Municipal Opportunities Fund within the meaning of the 1940 Act because of their affiliation with the MainStay Group of Funds, New York Life Insurance Company and/or its affiliates, including New York Life Investment Management LLC, NYLIM Service Company LLC, NYLIFE Securities LLC and/or NYLIFE Distributors LLC, as described in detail in the column captioned “Principal Occupation(s) During Past Five Years.” Officers are elected annually by the Board. |
| ** | Includes prior service as an Officer of MainStay VP Series Fund, Inc., the predecessor to MainStay VP Funds Trust. |
Officers of the Trust (Who are not Trustees)*
This page intentionally left blank
This page intentionally left blank.
This page intentionally left blank.
MainStay VP Portfolios
MainStay VP offers a wide range of Portfolios. The full array of MainStay VP offerings is listed here, with information about the manager, subadvisors, legal counsel, and independent registered public accounting firm.
Equity
MainStay VP American Century Sustainable Equity Portfolio1
MainStay VP Candriam Emerging Markets Equity Portfolio
MainStay VP Epoch U.S. Equity Yield Portfolio
MainStay VP Fidelity Institutional AM® Utilities Portfolio†
MainStay VP MacKay International Equity Portfolio
MainStay VP Natural Resources Portfolio
MainStay VP S&P 500 Index Portfolio2
MainStay VP Small Cap Growth Portfolio
MainStay VP Wellington Growth Portfolio
MainStay VP Wellington Mid Cap Portfolio
MainStay VP Wellington Small Cap Portfolio
MainStay VP Wellington U.S. Equity Portfolio
MainStay VP Winslow Large Cap Growth Portfolio
Mixed Asset
MainStay VP Balanced Portfolio
MainStay VP Income Builder Portfolio
MainStay VP Janus Henderson Balanced Portfolio
MainStay VP MacKay Convertible Portfolio
Income
MainStay VP Bond Portfolio
MainStay VP Floating Rate Portfolio
MainStay VP Indexed Bond Portfolio
MainStay VP MacKay Government Portfolio
MainStay VP MacKay High Yield Corporate Bond Portfolio
MainStay VP MacKay Strategic Bond Portfolio
MainStay VP PIMCO Real Return Portfolio
Money Market
MainStay VP U.S. Government Money Market Portfolio
Alternative
MainStay VP CBRE Global Infrastructure Portfolio
MainStay VP IQ Hedge Multi-Strategy Portfolio
Asset Allocation
MainStay VP Conservative Allocation Portfolio
MainStay VP Equity Allocation Portfolio
MainStay VP Growth Allocation Portfolio
MainStay VP Moderate Allocation Portfolio
Manager
New York Life Investment Management LLC
New York, New York
Subadvisors
American Century Investment Management, Inc.
Kansas City, Missouri
Brown Advisory LLC
Baltimore, Maryland
Candriam*
Strassen, Luxembourg
CBRE Investment Management Listed Real Assets LLC
Radnor, Pennsylvania
Epoch Investment Partners, Inc.
New York, New York
FIAM LLC
Smithfield, Rhode Island
IndexIQ Advisors LLC*
New York, New York
Janus Henderson Investors US LLC
Denver, Colorado
MacKay Shields LLC*
New York, New York
Newton Investment Management North America, LLC
Boston, Massachusetts
NYL Investors LLC*
New York, New York
Pacific Investment Management Company LLC
Newport Beach, California
Segall Bryant & Hamill, LLC
Chicago, Illinois
Wellington Management Company LLP
Boston, Massachusetts
Winslow Capital Management, LLC
Minneapolis, Minnesota
Legal Counsel
Dechert LLP
Washington, District of Columbia
Independent Registered Public Accounting Firm
PricewaterhouseCoopers LLP
New York, New York
Distributor
NYLIFE Distributors LLC*
Jersey City, New Jersey
Custodian
JPMorgan Chase Bank, N.A.
New York, New York
Some Portfolios may not be available in all products.
† Fidelity Institutional AM is a registered trade mark of FMR LLC. Used with permission.
* An affiliate of New York Life Investment Management LLC.
| 1. | Prior to May 1, 2022, the Portfolio's name was MainStay VP T. Rowe Price Equity Income Portfolio. |
| 2. | Prior to May 1, 2022, the Portfolio's name was MainStay VP MacKay S&P 500 Index Portfolio. |
Not part of the Annual Report
2022 Annual Report
This report is for the general information of New York Life Variable Annuities and NYLIAC Variable Universal Life Insurance Products policyowners. It must be preceded or accompanied by the appropriate product(s) and funds prospectuses if it is given to anyone who is not an owner of a New York Life variable annuity policy or a NYLIAC Variable Universal Life Insurance Product. This report does not offer for sale or solicit orders to purchase securities.
The performance data quoted in this report represents past performance. Past performance is no guarantee of future results. Due to market volatility and other factors, current performance may be lower or higher than the figures shown. The most recent month-end performance summary for your variable annuity or variable life policy is available by calling 800-598-2019 and is updated periodically on newyorklife.com.
The New York Life Variable Annuities and NYLIAC Variable Universal Life Insurance Products are issued by New York Life Insurance and Annuity Corporation (a Delaware Corporation) and distributed by NYLIFE Distributors LLC (Member FINRA/SIPC).
New York Life Insurance Company
New York Life Insurance and Annuity
Corporation (NYLIAC) (A Delaware Corporation)
51 Madison Avenue, Room 551
New York, NY 10010
newyorklife.com
newyorklifeinvestments.com
NYLIFE Distributors LLC, 30 Hudson Street, Jersey City, NJ 07302
New York Life Investment Management LLC is the investment manager to the MainStay VP Funds Trust
©2023 by NYLIFE Distributors LLC. All rights reserved.
You may obtain copies of the Prospectus and the Statement of Additional Information free of charge, upon request, by calling toll-free 800-598-2019 or writing to New York Life Insurance and Annuity Corporation, 51 Madison Avenue, New York, NY 10010.
| Not FDIC Insured | No Bank Guarantee | May Lose Value |
(NYLIAC) NI533
MainStay VP S&P 500 Index Portfolio
(formerly known as MainStay VP MacKay S&P 500 Index Portfolio)
Message from the President and Annual Report
December 31, 2022
Sign up for e-delivery of your shareholder reports. For full details on e-delivery, including who can participate and what you can receive via e-delivery,
please log in to newyorklifeinvestments.com/accounts.
| Not FDIC/NCUA Insured | Not a Deposit | May Lose Value | No Bank Guarantee | Not Insured by Any Government Agency |
This page intentionally left blank
Message from the President
The 12-month reporting period ended December 31, 2022, proved exceptionally challenging for investors as both stock and bond markets suffered steep declines. A variety of economic and geopolitical forces drove the market’s losses, all centered around rising inflation and monetary efforts to rein it in.
Inflationary alarms began to sound well before the reporting period began. In late 2021, after nearly two years of accommodative policies designed to encourage economic growth in the face of the COVID-19 pandemic, the U.S. Federal Reserve (the “Fed”) warned of the increasing need to tighten monetary policy. Nevertheless, the pace and persistence of inflation in early 2022 caught most market participants—the Fed included—off guard. Russia’s invasion of Ukraine in February exacerbated global inflationary pressures while increasing investor uncertainty. Domestic supply shortages, international trade imbalances and rising inflation caused U.S. GDP (gross domestic product) to contract in the first and second quarters of the year, although employment and consumer spending proved resilient. Prices for petroleum surged to multi-year highs, while many key agricultural chemicals and industrial metals soared as well. Accelerating inflationary forces prompted the Fed to implement its most aggressive series of interest rate hikes since the 1980s, with a 0.25% increase in March followed by six further rate increases totaling 4.25%. International central banks generally followed suit and raised rates by varying degrees in efforts to curb local inflation, although most increases remained significantly more modest than those in the United States. Relatively high U.S. interest rates and an international risk averse sentiment pushed U.S. dollar values higher compared to most other currencies, with negative impacts on global prices for food, fuel and other key U.S.-dollar-denominated products.
The effects of these interrelated challenges were felt throughout U.S. and international financial markets. The S&P 500® Index, a widely regarded benchmark of market performance, declined by more than 18% during the reporting period. Although the energy sector generated strong gains, bolstered by elevated oil and gas prices, most other industry segments recorded losses. The more cyclical and growth-oriented sectors of consumer discretionary, information technology and real estate delivered the weakest returns, while the traditionally defensive and value-oriented
consumer staples, utilities and health care sectors outperformed. On average, international developed-country equity markets mildly outperformed their U.S. counterparts, while emerging markets lagged slightly. Fixed-income markets proved unusually volatile, with bond prices trending sharply lower as yields rose along with interest rates. Short-term yields rose faster than long-term yields, producing a yield curve inversion from July through the end of the reporting period as long-term rates remained below short-term rates. While floating-rate instruments, which feature variable interest rates that allow investors to benefit from a rising rate environment, provided a degree of insulation from inflation-driven trends, they were not immune to the market’s widespread declines.
Although, according to the most recent estimates, the annualized inflation rate in the United States has declined from a peak of 9.1% in July 2022 to 6.5% in December, the Fed remains focused on achieving more substantial and lasting reductions, aiming for a target rate of 2%. As a result, further rate hikes and additional market volatility are potential headwinds in the coming months. The question remains as to whether the Fed and other central banks will manage a so-called “soft landing,” curbing inflation while avoiding a persistent economic slowdown. If they prove successful, we believe that the increasingly attractive valuations we have observed in both equity and bond markets should eventually translate into sustainable improvements in the investment environment.
Whatever actions the Fed takes and however financial markets react, as a MainStay VP investor you can depend on us to continue managing our portfolios with the insight, expertise and level of service that have long defined New York Life Investments. Thank you for trusting us to help you meet your investment needs.
Sincerely,
Kirk C. Lehneis
President
The opinions expressed are as of the date of this report and are subject to change. There is no guarantee that any forecast made will come to pass. This material does not constitute investment advice and is not intended as an endorsement of any specific investment. Past performance is no guarantee of future results.
Not part of the Annual Report
Investors should refer to the Portfolio’s Summary Prospectus and/or Prospectus and consider the Portfolio’s investment objectives, strategies, risks, charges and expenses carefully before investing. The Summary Prospectus and/or Prospectus contain this and other information about the Portfolio. You may obtain copies of the Portfolio’s Summary Prospectus, Prospectus and Statement of Additional Information, which includes information about the MainStay VP Funds Trust's Trustees, free of charge, upon request, by calling toll-free 800-598-2019, by writing to New York Life Insurance and Annuity Corporation, 51 Madison Avenue, Room 251, New York, New York 10010 or by sending an email to MainStayShareholdersServices@nylim.com. These documents are also available at newyorklifeinvestments.com/investment-products/vp. Please read the Portfolio's Summary Prospectus and/or Prospectus carefully before investing. MainStay VP Funds Trust portfolios are separate account options which are purchased through a variable insurance or variable annuity contract.
Investment and Performance Comparison (Unaudited)
Performance data quoted represents past performance. Past performance is no guarantee of future results. Because of market volatility and other factors, current performance may be lower or higher than the figures shown. Investment return and principal value will fluctuate, and as a result, when shares are redeemed, they may be worth more or less than their original cost. The performance table and graph do not reflect any deduction of sales charges, mortality and expense charges, contract charges or administrative charges. Please refer to the Performance Summary appropriate for your policy. For performance information current to the most recent month-end, please call 800-598-2019 or visit www.newyorklife.com.
Performance figures may reflect certain fee waivers and/or expense limitations, without which total returns may have been different. For information on current fee waivers and/or expense limitations (if any), please refer to the Notes to Financial Statements.
| Average Annual Total Returns for the Year-Ended December 31, 2022 |
| Class | Inception
Date1 | One
Year | Five
Years | Ten
Years | Gross
Expense
Ratio2 |
| Initial Class Shares | 1/29/1993 | -18.19% | 9.28% | 12.32% | 0.18% |
| Service Class Shares | 6/5/2003 | -18.40 | 9.00 | 12.04 | 0.43 |
| 1. | Effective June 13, 2022, the Portfolio replaced its subadvisor. The past performance in the graph and table prior to that date reflects the Portfolio's prior subadvisor. |
| 2. | The gross expense ratios presented reflect the Portfolio’s “Total Annual Portfolio Operating Expenses” from the most recent Prospectus and may differ from other expense ratios disclosed in this report. |
| Benchmark Performance* | One
Year | Five
Years | Ten
Years |
| S&P 500® Index1 | -18.11% | 9.42% | 12.56% |
| Morningstar Large Blend Category Average2 | -16.92 | 7.65 | 10.63 |
| * | Returns for indices reflect no deductions for fees, expenses or taxes, except for foreign withholding taxes where applicable. Results assume reinvestment of all dividends and capital gains. An investment cannot be made directly in an index. |
| 1. | The S&P 500® Index is the Portfolio's primary broad-based securities market index for comparison purposes. The S&P 500® Index is widely regarded as the standard index for measuring large-cap U.S. stock market performance. S&P® and S&P 500® are registered trademarks of Standard & Poor’s Financial Services LLC (“S&P”) and Dow Jones® is a registered trademark of Dow Jones Trademark Holdings LLC (“Dow Jones”). The foregoing trademarks have been licensed for use by S&P Dow Jones Indices LLC and sublicensed for certain purposes by New York Life Investment Management LLC. The S&P 500® Index is a product of S&P Dow Jones Indices LLC and has been licensed for use by New York Life Investment Management LLC. MainStay S&P 500 Index Portfolio is not sponsored, endorsed, sold or promoted by S&P Dow Jones Indices LLC, Dow Jones, S&P or their respective affiliates and neither S&P Dow Jones Indices LLC, Dow Jones, S&P nor their respective affiliates make any representation regarding the advisability of investing in such product(s). |
| 2. | The Morningstar Large Blend Category Average is representative of funds that represent the overall U.S. stock market in size, growth rates and price. Stocks in the top 70% of the capitalization of the U.S. equity market are defined as large cap. The blend style is assigned to portfolios where neither growth nor value characteristics predominate. These portfolios tend to invest across the spectrum of U.S. industries, and owing to their broad exposure, the portfolios' returns are often similar to those of the S&P 500® Index. Results are based on average total returns of similar funds with all dividends and capital gain distributions reinvested. |
Cost in Dollars of a $1,000 Investment in MainStay VP S&P 500 Index Portfolio (Unaudited)
The example below is intended to describe the fees and expenses borne by shareholders during the six-month period from July 1, 2022 to December 31, 2022, and the impact of those costs on your investment.
Example
As a shareholder of the Portfolio you incur two types of costs: (1) transaction costs, including exchange fees and sales charges (loads) on purchases (as applicable), and (2) ongoing costs, including management fees, distribution and/or service (12b-1) fees and other Portfolio expenses (as applicable). This example is intended to help you understand your ongoing costs (in dollars) of investing in the Portfolio and to compare these costs with the ongoing costs of investing in other mutual funds. The example is based on an investment of $1,000 made at the beginning of the six-month period and held for the entire period from July 1, 2022 to December 31, 2022. Shares are only sold in connection with variable life and annuity contracts and the example does not reflect any contract level or transactional fees or expenses. If these costs had been included, your costs would have been higher.
This example illustrates your Portfolio’s ongoing costs in two ways:
Actual Expenses
The second and third data columns in the table below provide information about actual account values and actual expenses. You may use the information in these columns, together with the amount you invested, to estimate the expenses that you paid during the six months ended
December 31, 2022. Simply divide your account value by $1,000 (for example, an $8,600 account value divided by $1,000 = 8.6), then multiply the result by the number under the heading entitled “Expenses Paid During Period” to estimate the expenses you paid on your account during this period.
Hypothetical Example for Comparison Purposes
The fourth and fifth data columns in the table below provide information about hypothetical account values and hypothetical expenses based on the Portfolio’s actual expense ratio and an assumed rate of return of 5% per year before expenses, which is not the Portfolio’s actual return. The hypothetical account values and expenses may not be used to estimate the actual ending account balances or expenses you paid for the six-month period shown. You may use this information to compare the ongoing costs of investing in the Portfolio with the ongoing costs of investing in other mutual funds. To do so, compare this 5% hypothetical example with the 5% hypothetical examples that appear in the shareholder reports of the other mutual funds.
Please note that the expenses shown in the table are meant to highlight your ongoing costs only and do not reflect any transactional costs, such as exchange fees or sales charges (loads). Therefore, the fourth and fifth data columns of the table are useful in comparing ongoing costs only and will not help you determine the relative total costs of owning different funds. In addition, if these transactional costs were included, your costs would have been higher.
| Share Class | Beginning
Account
Value
7/1/22 | Ending Account
Value (Based
on Actual
Returns and
Expenses)
12/31/22 | Expenses
Paid
During
Period1 | Ending Account
Value (Based
on Hypothetical
5% Annualized
Return and
Actual Expenses)
12/31/22 | Expenses
Paid
During
Period1 | Net Expense
Ratio
During
Period2 |
| Initial Class Shares | $1,000.00 | $1,022.40 | $0.61 | $1,024.60 | $0.61 | 0.12% |
| Service Class Shares | $1,000.00 | $1,021.20 | $1.88 | $1,023.34 | $1.89 | 0.37% |
| 1. | Expenses are equal to the Portfolio’s annualized expense ratio of each class multiplied by the average account value over the period, divided by 365 and multiplied by 184 (to reflect the six-month period). The table above represents the actual expenses incurred during the six-month period. In addition to the fees and expenses which the Portfolio bears directly, it also indirectly bears a pro rata share of the fees and expenses of the underlying funds in which it invests. Such indirect expenses are not included in the above-reported expense figures. |
| 2. | Expenses are equal to the Portfolio's annualized expense ratio to reflect the six-month period. |
| 6 | MainStay VP S&P 500 Index Portfolio |
Industry Composition as of December 31, 2022 (Unaudited)
| Software | 8.3% |
| Technology Hardware, Storage & Peripherals | 6.2 |
| Semiconductors & Semiconductor Equipment | 5.0 |
| Pharmaceuticals | 4.8 |
| Oil, Gas & Consumable Fuels | 4.7 |
| IT Services | 4.4 |
| Interactive Media & Services | 3.9 |
| Banks | 3.8 |
| Health Care Providers & Services | 3.6 |
| Capital Markets | 3.1 |
| Health Care Equipment & Supplies | 2.8 |
| Equity Real Estate Investment Trusts | 2.6 |
| Biotechnology | 2.5 |
| Insurance | 2.4 |
| Internet & Direct Marketing Retail | 2.4 |
| Specialty Retail | 2.4 |
| Electric Utilities | 2.1 |
| Hotels, Restaurants & Leisure | 2.0 |
| Life Sciences Tools & Services | 1.9 |
| Beverages | 1.9 |
| Aerospace & Defense | 1.9 |
| Machinery | 1.9 |
| Chemicals | 1.9 |
| Diversified Financial Services | 1.7 |
| Household Products | 1.6 |
| Food & Staples Retailing | 1.5 |
| Automobiles | 1.3 |
| Entertainment | 1.3 |
| Food Products | 1.2 |
| Industrial Conglomerates | 0.9 |
| Diversified Telecommunication Services | 0.9 |
| Road & Rail | 0.9 |
| Multi–Utilities | 0.9 |
| Communications Equipment | 0.9% |
| Media | 0.8 |
| Tobacco | 0.7 |
| Electronic Equipment, Instruments & Components | 0.6 |
| Air Freight & Logistics | 0.6 |
| Electrical Equipment | 0.6 |
| Textiles, Apparel & Luxury Goods | 0.5 |
| Consumer Finance | 0.5 |
| Commercial Services & Supplies | 0.5 |
| Multiline Retail | 0.5 |
| Building Products | 0.4 |
| Metals & Mining | 0.4 |
| Energy Equipment & Services | 0.4 |
| Professional Services | 0.4 |
| Household Durables | 0.3 |
| Containers & Packaging | 0.3 |
| Wireless Telecommunication Services | 0.3 |
| Trading Companies & Distributors | 0.2 |
| Airlines | 0.2 |
| Personal Products | 0.2 |
| Distributors | 0.2 |
| Construction Materials | 0.1 |
| Auto Components | 0.1 |
| Water Utilities | 0.1 |
| Real Estate Management & Development | 0.1 |
| Construction & Engineering | 0.1 |
| Independent Power and Renewable Electricity Producers | 0.1 |
| Gas Utilities | 0.0‡ |
| Leisure Products | 0.0‡ |
| Short–Term Investments | 1.1 |
| Other Assets, Less Liabilities | 0.1 |
| | 100.0% |
| ‡ | Less than one–tenth of a percent. |
See Portfolio of Investments beginning on page 9 for specific holdings within these categories. The Portfolio's holdings are subject to change.
Top Ten Holdings and/or Issuers Held as of December 31, 2022 (excluding short-term investments) (Unaudited)
| 1. | Apple, Inc. |
| 2. | Microsoft Corp. |
| 3. | Alphabet, Inc. |
| 4. | Amazon.com, Inc. |
| 5. | Berkshire Hathaway, Inc., Class B |
| 6. | UnitedHealth Group, Inc. |
| 7. | Johnson & Johnson |
| 8. | Exxon Mobil Corp. |
| 9. | JPMorgan Chase & Co. |
| 10. | NVIDIA Corp. |
Portfolio Management Discussion and Analysis (Unaudited)
Answers to the questions reflect the views of portfolio manager Francis J. Ok of IndexIQ Advisors LLC, the Portfolio’s Subadvisor.
How did MainStay VP S&P 500® Index Portfolio perform relative to its benchmark and peers during the 12 months ended December 31, 2022?
For the 12 months December 31, 2022, MainStay VP S&P 500® Index Portfolio returned −18.19% for Initial Class shares and −18.40% for Service Class shares. Over the same period, both share classes underperformed the −18.11% return of the S&P 500® Index (“the Index”), which is the Portfolio’s benchmark. Although the Portfolio seeks investment results that correspond to the total return performance of common stocks in the aggregate as represented by the S&P 500® Index, the Portfolio’s net performance will typically lag that of the Index because the Portfolio incurs operating expenses that the Index does not. For the 12 months ended December 31, 2022, both share classes underperformed the −16.92% return of the Morningstar Large Blend Category Average.1
Were there any changes to the Portfolio during the reporting period?
Effective May 1, 2022, the Portfolio was renamed MainStay VP S&P 500 Portfolio.
Effective June 10, 2022, Francis J. Ok, the portfolio manager from MacKay Shields LLC (“MacKay Shields”) who manages the day-to-day investment operations of the Fund, transitioned from MacKay Shields to IndexIQ Advisors LLC ("IndexIQ"), which is a wholly owned, indirect subsidiary of New York Life Investment Management Holdings LLC. For more information on this transition refer to the prospectus supplement dated June 10, 2022.
During the reporting period, how was the Portfolio’s performance materially affected by investments in derivatives?
The MainStay VP S&P 500 Index Portfolio invested in futures contracts to provide an efficient means of maintaining liquidity while remaining fully invested in the market.
During the reporting period, which S&P 500® industries had the highest total returns and which industries had the lowest total returns?
The Index industry groups with the highest total returns during the reporting period included oil, gas & consumable fuels; energy equipment & services; and construction & engineering. Conversely, the industry groups that had the lowest total returns were automobiles, internet & direct marketing retail and interactive media & services.
During the reporting period, which S&P 500® industries made the strongest positive contributions to the Portfolio’s absolute performance and which industries made the weakest contributions?
The Index industries that made the strongest positive contributions to the Portfolio’s absolute performance during the reporting period included oil, gas & consumable fuels; pharmaceuticals; and biotechnology. (Contributions take weightings and total returns into account.) During the same period, the industries that made the weakest contributions to the Portfolio’s absolute performance included interactive media & services, software, and semiconductor & semiconductor equipment.
During the reporting period, which individual stocks in the S&P 500® Index had the highest total returns and which individual stocks had the lowest total returns?
The Index stocks with the highest total returns during the reporting period were oil & gas exploration & production companies Occidental Petroleum and Hess, and integrated oil & gas company Exxon Mobil. Conversely, the stocks with the lowest total returns were power generation equipment maker Generac, online dating company Match Group and dental device maker Align Technology.
During the reporting period, which S&P 500® stocks made the strongest positive contributions to the Portfolio’s absolute performance and which S&P 500® stocks made the weakest contributions?
The Index stocks that made the strongest positive contributions to the Portfolio’s absolute performance during the reporting period included integrated oil & gas companies Exxon Mobil and Chevron, and pharmaceutical company Merck. The stocks making the weakest contributions were consumer electronics and services company Apple, online retailer Amazon.com, and software and cloud services provider Microsoft.
Were there any changes in the S&P 500® Index during the reporting period?
During the reporting period, there were 19 additions to and 21 deletions from the S&P 500® Index. In terms of index weight, significant additions to the S&P 500® Index included Costar Group and VICI Properties, while significant deletions included Twitter and Cerner.
| 1. | See page 5 for more information on benchmark and peer group returns. |
The opinions expressed are those of the portfolio manager as of the date of this report and are subject to change. There is no guarantee that any forecasts will come to pass. This material does not constitute investment advice and is not intended as an endorsement of any specific investment.
Not all MainStay VP Portfolios and/or share classes are available under all policies.
| 8 | MainStay VP S&P 500 Index Portfolio |
Portfolio of Investments December 31, 2022†
| | Shares | Value |
| Common Stocks 98.8% |
| Aerospace & Defense 1.9% |
| Boeing Co. (The) (a) | 51,741 | $ 9,856,143 |
| General Dynamics Corp. | 20,793 | 5,158,951 |
| Howmet Aerospace, Inc. | 34,013 | 1,340,452 |
| Huntington Ingalls Industries, Inc. | 3,685 | 850,056 |
| L3Harris Technologies, Inc. | 17,585 | 3,661,373 |
| Lockheed Martin Corp. | 21,542 | 10,479,968 |
| Northrop Grumman Corp. | 13,362 | 7,290,441 |
| Raytheon Technologies Corp. | 135,772 | 13,702,110 |
| Textron, Inc. | 19,282 | 1,365,166 |
| TransDigm Group, Inc. | 4,771 | 3,004,060 |
| | | 56,708,720 |
| Air Freight & Logistics 0.6% |
| CH Robinson Worldwide, Inc. | 10,871 | 995,349 |
| Expeditors International of Washington, Inc. | 14,697 | 1,527,312 |
| FedEx Corp. | 22,111 | 3,829,625 |
| United Parcel Service, Inc., Class B | 67,405 | 11,717,685 |
| | | 18,069,971 |
| Airlines 0.2% |
| Alaska Air Group, Inc. (a) | 11,714 | 502,999 |
| American Airlines Group, Inc. (a) | 60,023 | 763,493 |
| Delta Air Lines, Inc. (a) | 59,219 | 1,945,936 |
| Southwest Airlines Co. (a) | 54,838 | 1,846,395 |
| United Airlines Holdings, Inc. (a) | 30,194 | 1,138,314 |
| | | 6,197,137 |
| Auto Components 0.1% |
| Aptiv plc (a) | 25,024 | 2,330,485 |
| BorgWarner, Inc. | 21,626 | 870,447 |
| | | 3,200,932 |
| Automobiles 1.3% |
| Ford Motor Co. | 364,780 | 4,242,391 |
| General Motors Co. | 131,212 | 4,413,972 |
| Tesla, Inc. (a) | 247,897 | 30,535,952 |
| | | 39,192,315 |
| Banks 3.8% |
| Bank of America Corp. | 644,613 | 21,349,583 |
| Citigroup, Inc. | 178,884 | 8,090,923 |
| Citizens Financial Group, Inc. | 45,485 | 1,790,744 |
| Comerica, Inc. | 12,094 | 808,484 |
| Fifth Third Bancorp | 63,394 | 2,079,957 |
| First Republic Bank | 16,895 | 2,059,332 |
| Huntington Bancshares, Inc. | 133,248 | 1,878,797 |
| JPMorgan Chase & Co. | 270,904 | 36,328,226 |
| | Shares | Value |
| |
| Banks (continued) |
| KeyCorp | 86,167 | $ 1,501,029 |
| M&T Bank Corp. | 15,942 | 2,312,547 |
| PNC Financial Services Group, Inc. (The) | 37,250 | 5,883,265 |
| Regions Financial Corp. | 86,303 | 1,860,693 |
| Signature Bank | 5,812 | 669,659 |
| SVB Financial Group (a) | 5,459 | 1,256,334 |
| Truist Financial Corp. | 122,537 | 5,272,767 |
| U.S. Bancorp | 124,877 | 5,445,886 |
| Wells Fargo & Co. | 351,929 | 14,531,148 |
| Zions Bancorp NA | 13,843 | 680,522 |
| | | 113,799,896 |
| Beverages 1.9% |
| Brown-Forman Corp., Class B | 16,888 | 1,109,204 |
| Coca-Cola Co. (The) | 359,462 | 22,865,378 |
| Constellation Brands, Inc., Class A | 14,992 | 3,474,396 |
| Keurig Dr Pepper, Inc. | 78,481 | 2,798,632 |
| Molson Coors Beverage Co., Class B | 17,363 | 894,542 |
| Monster Beverage Corp. (a) | 35,177 | 3,571,521 |
| PepsiCo, Inc. | 127,242 | 22,987,539 |
| | | 57,701,212 |
| Biotechnology 2.5% |
| AbbVie, Inc. | 163,333 | 26,396,246 |
| Amgen, Inc. | 49,280 | 12,942,899 |
| Biogen, Inc. (a) | 13,300 | 3,683,036 |
| Gilead Sciences, Inc. | 115,839 | 9,944,778 |
| Incyte Corp. (a) | 17,054 | 1,369,777 |
| Moderna, Inc. (a) | 30,515 | 5,481,105 |
| Regeneron Pharmaceuticals, Inc. (a) | 9,890 | 7,135,536 |
| Vertex Pharmaceuticals, Inc. (a) | 23,707 | 6,846,108 |
| | | 73,799,485 |
| Building Products 0.4% |
| Allegion plc | 8,113 | 853,974 |
| AO Smith Corp. | 11,717 | 670,681 |
| Carrier Global Corp. | 77,235 | 3,185,944 |
| Johnson Controls International plc | 63,607 | 4,070,848 |
| Masco Corp. | 20,829 | 972,090 |
| Trane Technologies plc | 21,271 | 3,575,442 |
| | | 13,328,979 |
| Capital Markets 3.1% |
| Ameriprise Financial, Inc. | 9,828 | 3,060,144 |
| Bank of New York Mellon Corp. (The) | 67,932 | 3,092,265 |
| BlackRock, Inc. | 13,871 | 9,829,407 |
| Cboe Global Markets, Inc. | 9,798 | 1,229,355 |
| Charles Schwab Corp. (The) | 140,874 | 11,729,169 |
The notes to the financial statements are an integral part of, and should be read in conjunction with, the financial statements.
9
Portfolio of Investments December 31, 2022† (continued)
| | Shares | Value |
| Common Stocks (continued) |
| Capital Markets (continued) |
| CME Group, Inc. | 33,223 | $ 5,586,780 |
| FactSet Research Systems, Inc. | 3,519 | 1,411,858 |
| Franklin Resources, Inc. | 26,235 | 692,079 |
| Goldman Sachs Group, Inc. (The) | 31,276 | 10,739,553 |
| Intercontinental Exchange, Inc. | 51,587 | 5,292,310 |
| Invesco Ltd. | 42,004 | 755,652 |
| MarketAxess Holdings, Inc. | 3,476 | 969,422 |
| Moody's Corp. | 14,551 | 4,054,200 |
| Morgan Stanley | 121,754 | 10,351,525 |
| MSCI, Inc. | 7,385 | 3,435,280 |
| Nasdaq, Inc. | 31,308 | 1,920,746 |
| Northern Trust Corp. | 19,249 | 1,703,344 |
| Raymond James Financial, Inc. | 17,870 | 1,909,410 |
| S&P Global, Inc. | 30,755 | 10,301,080 |
| State Street Corp. | 33,890 | 2,628,847 |
| T. Rowe Price Group, Inc. | 20,639 | 2,250,889 |
| | | 92,943,315 |
| Chemicals 1.9% |
| Air Products and Chemicals, Inc. | 20,485 | 6,314,706 |
| Albemarle Corp. | 10,820 | 2,346,425 |
| Celanese Corp. | 9,213 | 941,937 |
| CF Industries Holdings, Inc. | 18,120 | 1,543,824 |
| Corteva, Inc. | 65,989 | 3,878,834 |
| Dow, Inc. | 64,998 | 3,275,249 |
| DuPont de Nemours, Inc. | 45,882 | 3,148,882 |
| Eastman Chemical Co. | 11,082 | 902,518 |
| Ecolab, Inc. | 22,886 | 3,331,286 |
| FMC Corp. | 11,634 | 1,451,923 |
| International Flavors & Fragrances, Inc. | 23,548 | 2,468,772 |
| Linde plc | 45,660 | 14,893,379 |
| LyondellBasell Industries NV, Class A | 23,458 | 1,947,718 |
| Mosaic Co. (The) | 31,446 | 1,379,536 |
| PPG Industries, Inc. | 21,707 | 2,729,438 |
| Sherwin-Williams Co. (The) | 21,780 | 5,169,048 |
| | | 55,723,475 |
| Commercial Services & Supplies 0.5% |
| Cintas Corp. | 7,972 | 3,600,315 |
| Copart, Inc. (a) | 39,578 | 2,409,904 |
| Republic Services, Inc. | 18,970 | 2,446,940 |
| Rollins, Inc. | 21,377 | 781,116 |
| Waste Management, Inc. | 34,499 | 5,412,203 |
| | | 14,650,478 |
| Communications Equipment 0.9% |
| Arista Networks, Inc. (a) | 22,860 | 2,774,061 |
| Cisco Systems, Inc. | 379,218 | 18,065,945 |
| | Shares | Value |
| |
| Communications Equipment (continued) |
| F5, Inc. (a) | 5,529 | $ 793,467 |
| Juniper Networks, Inc. | 29,975 | 958,001 |
| Motorola Solutions, Inc. | 15,443 | 3,979,816 |
| | | 26,571,290 |
| Construction & Engineering 0.1% |
| Quanta Services, Inc. | 13,198 | 1,880,715 |
| Construction Materials 0.1% |
| Martin Marietta Materials, Inc. | 5,738 | 1,939,272 |
| Vulcan Materials Co. | 12,275 | 2,149,475 |
| | | 4,088,747 |
| Consumer Finance 0.5% |
| American Express Co. | 55,210 | 8,157,278 |
| Capital One Financial Corp. | 35,253 | 3,277,119 |
| Discover Financial Services | 25,235 | 2,468,740 |
| Synchrony Financial | 41,611 | 1,367,337 |
| | | 15,270,474 |
| Containers & Packaging 0.3% |
| Amcor plc | 137,523 | 1,637,899 |
| Avery Dennison Corp. | 7,476 | 1,353,156 |
| Ball Corp. | 28,993 | 1,482,702 |
| International Paper Co. | 32,849 | 1,137,561 |
| Packaging Corp. of America | 8,546 | 1,093,119 |
| Sealed Air Corp. | 13,361 | 666,446 |
| Westrock Co. | 23,486 | 825,768 |
| | | 8,196,651 |
| Distributors 0.2% |
| Genuine Parts Co. | 13,012 | 2,257,712 |
| LKQ Corp. | 23,442 | 1,252,037 |
| Pool Corp. | 3,607 | 1,090,505 |
| | | 4,600,254 |
| Diversified Financial Services 1.7% |
| Berkshire Hathaway, Inc., Class B (a) | 166,403 | 51,401,887 |
| Diversified Telecommunication Services 0.9% |
| AT&T, Inc. | 658,234 | 12,118,088 |
| Lumen Technologies, Inc. | 87,632 | 457,439 |
| Verizon Communications, Inc. | 387,886 | 15,282,708 |
| | | 27,858,235 |
| Electric Utilities 2.1% |
| Alliant Energy Corp. | 23,184 | 1,279,989 |
| American Electric Power Co., Inc. | 47,459 | 4,506,232 |
| Constellation Energy Corp. | 30,203 | 2,603,801 |
The notes to the financial statements are an integral part of, and should be read in conjunction with, the financial statements.
| 10 | MainStay VP S&P 500 Index Portfolio |
| | Shares | Value |
| Common Stocks (continued) |
| Electric Utilities (continued) |
| Duke Energy Corp. | 71,121 | $ 7,324,752 |
| Edison International | 35,269 | 2,243,814 |
| Entergy Corp. | 18,793 | 2,114,212 |
| Evergy, Inc. | 21,199 | 1,334,053 |
| Eversource Energy | 32,169 | 2,697,049 |
| Exelon Corp. | 91,780 | 3,967,649 |
| FirstEnergy Corp. | 50,166 | 2,103,962 |
| NextEra Energy, Inc. | 183,530 | 15,343,108 |
| NRG Energy, Inc. | 21,278 | 677,066 |
| PG&E Corp. (a) | 148,699 | 2,417,846 |
| Pinnacle West Capital Corp. | 10,449 | 794,542 |
| PPL Corp. | 68,005 | 1,987,106 |
| Southern Co. (The) | 100,547 | 7,180,061 |
| Xcel Energy, Inc. | 50,543 | 3,543,570 |
| | | 62,118,812 |
| Electrical Equipment 0.6% |
| AMETEK, Inc. | 21,210 | 2,963,461 |
| Eaton Corp. plc | 36,731 | 5,764,930 |
| Emerson Electric Co. | 54,611 | 5,245,933 |
| Generac Holdings, Inc. (a) | 5,851 | 588,962 |
| Rockwell Automation, Inc. | 10,607 | 2,732,045 |
| | | 17,295,331 |
| Electronic Equipment, Instruments & Components 0.6% |
| Amphenol Corp., Class A | 54,962 | 4,184,807 |
| CDW Corp. | 12,504 | 2,232,964 |
| Corning, Inc. | 70,306 | 2,245,574 |
| Keysight Technologies, Inc. (a) | 16,513 | 2,824,879 |
| TE Connectivity Ltd. | 29,377 | 3,372,479 |
| Teledyne Technologies, Inc. (a) | 4,329 | 1,731,210 |
| Trimble, Inc. (a) | 22,785 | 1,152,010 |
| Zebra Technologies Corp., Class A (a) | 4,765 | 1,221,794 |
| | | 18,965,717 |
| Energy Equipment & Services 0.4% |
| Baker Hughes Co. | 92,493 | 2,731,318 |
| Halliburton Co. | 83,865 | 3,300,088 |
| Schlumberger Ltd. | 130,963 | 7,001,282 |
| | | 13,032,688 |
| Entertainment 1.3% |
| Activision Blizzard, Inc. | 65,776 | 5,035,153 |
| Electronic Arts, Inc. | 24,223 | 2,959,566 |
| Live Nation Entertainment, Inc. (a) | 13,192 | 920,010 |
| Netflix, Inc. (a) | 41,101 | 12,119,863 |
| Take-Two Interactive Software, Inc. (a) | 14,569 | 1,517,070 |
| Walt Disney Co. (The) (a) | 168,374 | 14,628,333 |
| | Shares | Value |
| |
| Entertainment (continued) |
| Warner Bros Discovery, Inc. (a) | 204,096 | $ 1,934,830 |
| | | 39,114,825 |
| Equity Real Estate Investment Trusts 2.6% |
| Alexandria Real Estate Equities, Inc. | 13,791 | 2,008,935 |
| American Tower Corp. | 43,002 | 9,110,404 |
| AvalonBay Communities, Inc. | 12,921 | 2,087,000 |
| Boston Properties, Inc. | 13,175 | 890,366 |
| Camden Property Trust | 9,839 | 1,100,787 |
| Crown Castle, Inc. | 39,995 | 5,424,922 |
| Digital Realty Trust, Inc. | 26,555 | 2,662,670 |
| Equinix, Inc. | 8,547 | 5,598,541 |
| Equity Residential | 31,413 | 1,853,367 |
| Essex Property Trust, Inc. | 5,981 | 1,267,494 |
| Extra Space Storage, Inc. | 12,369 | 1,820,469 |
| Federal Realty OP LP | 6,750 | 682,020 |
| Healthpeak Properties, Inc. | 49,642 | 1,244,525 |
| Host Hotels & Resorts, Inc. | 66,038 | 1,059,910 |
| Invitation Homes, Inc. | 53,645 | 1,590,038 |
| Iron Mountain, Inc. | 26,850 | 1,338,472 |
| KRC Interim Corp. | 57,120 | 1,209,802 |
| Mid-America Apartment Communities, Inc. | 10,665 | 1,674,298 |
| Prologis, Inc. | 85,253 | 9,610,571 |
| Public Storage | 14,599 | 4,090,494 |
| Realty Income Corp. | 57,923 | 3,674,056 |
| Regency Centers Corp. | 14,224 | 889,000 |
| SBA Communications Corp. | 9,972 | 2,795,251 |
| Simon Property Group, Inc. | 30,196 | 3,547,426 |
| UDR, Inc. | 28,262 | 1,094,587 |
| Ventas, Inc. | 36,917 | 1,663,111 |
| VICI Properties, Inc. | 88,950 | 2,881,980 |
| Vornado Realty Trust | 14,821 | 308,425 |
| Welltower, Inc. | 43,641 | 2,860,668 |
| Weyerhaeuser Co. | 67,968 | 2,107,008 |
| | | 78,146,597 |
| Food & Staples Retailing 1.5% |
| Costco Wholesale Corp. | 40,878 | 18,660,807 |
| Kroger Co. (The) | 60,160 | 2,681,933 |
| Sysco Corp. | 46,804 | 3,578,166 |
| Walgreens Boots Alliance, Inc. | 66,294 | 2,476,744 |
| Walmart, Inc. | 130,354 | 18,482,893 |
| | | 45,880,543 |
| Food Products 1.2% |
| Archer-Daniels-Midland Co. | 50,735 | 4,710,745 |
| Campbell Soup Co. | 18,528 | 1,051,464 |
| Conagra Brands, Inc. | 44,263 | 1,712,978 |
The notes to the financial statements are an integral part of, and should be read in conjunction with, the financial statements.
11
Portfolio of Investments December 31, 2022† (continued)
| | Shares | Value |
| Common Stocks (continued) |
| Food Products (continued) |
| General Mills, Inc. | 54,806 | $ 4,595,483 |
| Hershey Co. (The) | 13,574 | 3,143,331 |
| Hormel Foods Corp. | 26,736 | 1,217,825 |
| J M Smucker Co. (The) | 9,841 | 1,559,405 |
| Kellogg Co. | 23,640 | 1,684,114 |
| Kraft Heinz Co. (The) | 73,536 | 2,993,650 |
| Lamb Weston Holdings, Inc. | 13,284 | 1,187,058 |
| McCormick & Co., Inc. (Non-Voting) | 23,145 | 1,918,489 |
| Mondelez International, Inc., Class A | 126,126 | 8,406,298 |
| Tyson Foods, Inc., Class A | 26,748 | 1,665,063 |
| | | 35,845,903 |
| Gas Utilities 0.0% ‡ |
| Atmos Energy Corp. (b) | 12,920 | 1,447,944 |
| Health Care Equipment & Supplies 2.8% |
| Abbott Laboratories | 161,033 | 17,679,813 |
| ABIOMED, Inc. (a) | 4,165 | 4,248 |
| Align Technology, Inc. (a) | 6,709 | 1,414,928 |
| Baxter International, Inc. | 46,560 | 2,373,163 |
| Becton Dickinson and Co. | 26,340 | 6,698,262 |
| Boston Scientific Corp. (a) | 132,285 | 6,120,827 |
| Cooper Cos., Inc. (The) | 4,557 | 1,506,863 |
| Dentsply Sirona, Inc. | 19,822 | 631,132 |
| Dexcom, Inc. (a) | 35,674 | 4,039,724 |
| Edwards Lifesciences Corp. (a) | 57,101 | 4,260,306 |
| Hologic, Inc. (a) | 23,057 | 1,724,894 |
| IDEXX Laboratories, Inc. (a) | 7,649 | 3,120,486 |
| Intuitive Surgical, Inc. (a) | 32,638 | 8,660,493 |
| Medtronic plc | 122,758 | 9,540,752 |
| ResMed, Inc. | 13,529 | 2,815,791 |
| STERIS plc | 9,219 | 1,702,657 |
| Stryker Corp. | 31,106 | 7,605,106 |
| Teleflex, Inc. | 4,332 | 1,081,397 |
| Zimmer Biomet Holdings, Inc. | 19,381 | 2,471,078 |
| | | 83,451,920 |
| Health Care Providers & Services 3.6% |
| AmerisourceBergen Corp. | 14,958 | 2,478,690 |
| Cardinal Health, Inc. | 24,210 | 1,861,023 |
| Centene Corp. (a) | 52,299 | 4,289,041 |
| Cigna Corp. | 28,237 | 9,356,048 |
| CVS Health Corp. | 121,355 | 11,309,072 |
| DaVita, Inc. (a) | 5,076 | 379,025 |
| Elevance Health, Inc. | 22,058 | 11,315,092 |
| HCA Healthcare, Inc. | 19,583 | 4,699,137 |
| Henry Schein, Inc. (a) | 12,523 | 1,000,212 |
| | Shares | Value |
| |
| Health Care Providers & Services (continued) |
| Humana, Inc. | 11,692 | $ 5,988,525 |
| Laboratory Corp. of America Holdings | 8,183 | 1,926,933 |
| McKesson Corp. | 13,096 | 4,912,571 |
| Molina Healthcare, Inc. (a) | 5,394 | 1,781,207 |
| Quest Diagnostics, Inc. | 10,518 | 1,645,436 |
| UnitedHealth Group, Inc. | 86,294 | 45,751,353 |
| Universal Health Services, Inc., Class B | 5,925 | 834,773 |
| | | 109,528,138 |
| Hotels, Restaurants & Leisure 2.0% |
| Booking Holdings, Inc. (a) | 3,582 | 7,218,733 |
| Caesars Entertainment, Inc. (a) | 19,817 | 824,387 |
| Carnival Corp. (a) | 92,490 | 745,469 |
| Chipotle Mexican Grill, Inc. (a) | 2,560 | 3,551,974 |
| Darden Restaurants, Inc. | 11,303 | 1,563,544 |
| Domino's Pizza, Inc. | 3,269 | 1,132,382 |
| Expedia Group, Inc. (a) | 13,906 | 1,218,166 |
| Hilton Worldwide Holdings, Inc. | 24,979 | 3,156,346 |
| Las Vegas Sands Corp. (a) | 30,348 | 1,458,828 |
| Marriott International, Inc., Class A | 24,850 | 3,699,917 |
| McDonald's Corp. | 67,645 | 17,826,487 |
| MGM Resorts International | 29,438 | 987,056 |
| Norwegian Cruise Line Holdings Ltd. (a)(b) | 38,919 | 476,369 |
| Royal Caribbean Cruises Ltd. (a) | 20,269 | 1,001,897 |
| Starbucks Corp. | 106,018 | 10,516,986 |
| Wynn Resorts Ltd. (a) | 9,522 | 785,279 |
| Yum! Brands, Inc. | 26,016 | 3,332,129 |
| | | 59,495,949 |
| Household Durables 0.3% |
| DR Horton, Inc. | 28,908 | 2,576,859 |
| Garmin Ltd. | 14,161 | 1,306,919 |
| Lennar Corp., Class A | 23,530 | 2,129,465 |
| Mohawk Industries, Inc. (a) | 4,870 | 497,811 |
| Newell Brands, Inc. | 34,761 | 454,674 |
| NVR, Inc. (a) | 277 | 1,277,685 |
| PulteGroup, Inc. | 21,041 | 957,997 |
| Whirlpool Corp. | 5,031 | 711,685 |
| | | 9,913,095 |
| Household Products 1.6% |
| Church & Dwight Co., Inc. | 22,523 | 1,815,579 |
| Clorox Co. (The) | 11,396 | 1,599,201 |
| Colgate-Palmolive Co. | 77,139 | 6,077,782 |
| Kimberly-Clark Corp. | 31,170 | 4,231,327 |
| Procter & Gamble Co. (The) | 218,860 | 33,170,422 |
| | | 46,894,311 |
The notes to the financial statements are an integral part of, and should be read in conjunction with, the financial statements.
| 12 | MainStay VP S&P 500 Index Portfolio |
| | Shares | Value |
| Common Stocks (continued) |
| Independent Power and Renewable Electricity Producers 0.1% |
| AES Corp. (The) | 61,690 | $ 1,774,204 |
| Industrial Conglomerates 0.9% |
| 3M Co. | 51,050 | 6,121,916 |
| General Electric Co. | 100,916 | 8,455,752 |
| Honeywell International, Inc. | 62,094 | 13,306,744 |
| | | 27,884,412 |
| Insurance 2.4% |
| Aflac, Inc. | 52,259 | 3,759,512 |
| Allstate Corp. (The) | 24,494 | 3,321,386 |
| American International Group, Inc. | 68,620 | 4,339,529 |
| Aon plc, Class A | 19,104 | 5,733,874 |
| Arch Capital Group Ltd. (a) | 34,161 | 2,144,628 |
| Arthur J. Gallagher & Co. | 19,473 | 3,671,439 |
| Assurant, Inc. | 4,879 | 610,168 |
| Brown & Brown, Inc. | 21,711 | 1,236,876 |
| Chubb Ltd. | 38,333 | 8,456,260 |
| Cincinnati Financial Corp. | 14,517 | 1,486,396 |
| Everest Re Group Ltd. | 3,617 | 1,198,204 |
| Globe Life, Inc. | 8,355 | 1,007,195 |
| Hartford Financial Services Group, Inc. (The) | 29,379 | 2,227,810 |
| Lincoln National Corp. | 14,251 | 437,791 |
| Loews Corp. | 18,200 | 1,061,606 |
| Marsh & McLennan Cos., Inc. | 45,810 | 7,580,639 |
| MetLife, Inc. | 60,870 | 4,405,162 |
| Principal Financial Group, Inc. | 21,016 | 1,763,663 |
| Progressive Corp. (The) | 54,036 | 7,009,009 |
| Prudential Financial, Inc. | 33,988 | 3,380,446 |
| Travelers Cos., Inc. (The) | 21,644 | 4,058,033 |
| W R Berkley Corp. | 18,879 | 1,370,049 |
| Willis Towers Watson plc | 9,997 | 2,445,066 |
| | | 72,704,741 |
| Interactive Media & Services 3.9% |
| Alphabet, Inc. (a) | | |
| Class A | 551,637 | 48,670,932 |
| Class C | 489,018 | 43,390,567 |
| |
| Match Group, Inc. (a) | 25,796 | 1,070,276 |
| Meta Platforms, Inc., Class A (a) | 207,682 | 24,992,452 |
| | | 118,124,227 |
| Internet & Direct Marketing Retail 2.4% |
| Amazon.com, Inc. (a) | 819,716 | 68,856,144 |
| eBay, Inc. | 50,119 | 2,078,435 |
| | Shares | Value |
| |
| Internet & Direct Marketing Retail (continued) |
| Etsy, Inc. (a) | 11,608 | $ 1,390,406 |
| | | 72,324,985 |
| IT Services 4.4% |
| Accenture plc, Class A | 58,195 | 15,528,754 |
| Akamai Technologies, Inc. (a) | 14,523 | 1,224,289 |
| Automatic Data Processing, Inc. | 38,313 | 9,151,443 |
| Broadridge Financial Solutions, Inc. | 10,866 | 1,457,457 |
| Cognizant Technology Solutions Corp., Class A | 47,465 | 2,714,523 |
| DXC Technology Co. (a) | 21,248 | 563,072 |
| EPAM Systems, Inc. (a) | 5,312 | 1,740,955 |
| Fidelity National Information Services, Inc. | 54,803 | 3,718,383 |
| Fiserv, Inc. (a) | 58,650 | 5,927,755 |
| FleetCor Technologies, Inc. (a) | 6,812 | 1,251,228 |
| Gartner, Inc. (a) | 7,298 | 2,453,150 |
| Global Payments, Inc. | 24,974 | 2,480,418 |
| International Business Machines Corp. | 83,503 | 11,764,738 |
| Jack Henry & Associates, Inc. | 6,737 | 1,182,748 |
| Mastercard, Inc., Class A | 78,401 | 27,262,380 |
| Paychex, Inc. | 29,624 | 3,423,349 |
| PayPal Holdings, Inc. (a) | 105,290 | 7,498,754 |
| VeriSign, Inc. (a) | 8,519 | 1,750,143 |
| Visa, Inc., Class A | 151,006 | 31,373,007 |
| | | 132,466,546 |
| Leisure Products 0.0% ‡ |
| Hasbro, Inc. | 11,991 | 731,571 |
| Life Sciences Tools & Services 1.9% |
| Agilent Technologies, Inc. | 27,342 | 4,091,730 |
| Bio-Rad Laboratories, Inc., Class A (a) | 1,989 | 836,355 |
| Bio-Techne Corp. | 14,497 | 1,201,511 |
| Charles River Laboratories International, Inc. (a) | 4,699 | 1,023,912 |
| Danaher Corp. | 60,510 | 16,060,564 |
| Illumina, Inc. (a) | 14,528 | 2,937,562 |
| IQVIA Holdings, Inc. (a) | 17,159 | 3,515,708 |
| Mettler-Toledo International, Inc. (a) | 2,059 | 2,976,182 |
| PerkinElmer, Inc. | 11,658 | 1,634,685 |
| Thermo Fisher Scientific, Inc. | 36,222 | 19,947,093 |
| Waters Corp. (a) | 5,487 | 1,879,736 |
| West Pharmaceutical Services, Inc. | 6,838 | 1,609,323 |
| | | 57,714,361 |
| Machinery 1.9% |
| Caterpillar, Inc. | 48,064 | 11,514,212 |
| Cummins, Inc. | 13,024 | 3,155,585 |
The notes to the financial statements are an integral part of, and should be read in conjunction with, the financial statements.
13
Portfolio of Investments December 31, 2022† (continued)
| | Shares | Value |
| Common Stocks (continued) |
| Machinery (continued) |
| Deere & Co. | 25,367 | $ 10,876,355 |
| Dover Corp. | 12,963 | 1,755,320 |
| Fortive Corp. | 32,677 | 2,099,497 |
| IDEX Corp. | 6,966 | 1,590,547 |
| Illinois Tool Works, Inc. | 25,818 | 5,687,705 |
| Ingersoll Rand, Inc. | 37,398 | 1,954,046 |
| Nordson Corp. | 4,967 | 1,180,755 |
| Otis Worldwide Corp. | 38,475 | 3,012,977 |
| PACCAR, Inc. | 32,119 | 3,178,817 |
| Parker-Hannifin Corp. | 11,859 | 3,450,969 |
| Pentair plc | 15,193 | 683,381 |
| Snap-on, Inc. | 4,909 | 1,121,657 |
| Stanley Black & Decker, Inc. | 13,664 | 1,026,440 |
| Westinghouse Air Brake Technologies Corp. | 16,797 | 1,676,509 |
| Xylem, Inc. | 16,645 | 1,840,438 |
| | | 55,805,210 |
| Media 0.8% |
| Charter Communications, Inc., Class A (a) | 9,920 | 3,363,872 |
| Comcast Corp., Class A | 398,428 | 13,933,027 |
| DISH Network Corp., Class A (a) | 23,214 | 325,924 |
| Fox Corp. | | |
| Class A | 27,936 | 848,416 |
| Class B | 12,868 | 366,095 |
| |
| Interpublic Group of Cos., Inc. (The) | 35,883 | 1,195,263 |
| News Corp. | | |
| Class A | 35,313 | 642,697 |
| Class B | 10,889 | 200,793 |
| |
| Omnicom Group, Inc. | 18,846 | 1,537,268 |
| Paramount Global, Class B (b) | 46,643 | 787,334 |
| | | 23,200,689 |
| Metals & Mining 0.4% |
| Freeport-McMoRan, Inc. | 132,010 | 5,016,380 |
| Newmont Corp. | 73,308 | 3,460,138 |
| Nucor Corp. | 23,694 | 3,123,106 |
| Steel Dynamics, Inc. | 15,389 | 1,503,505 |
| | | 13,103,129 |
| Multiline Retail 0.5% |
| Dollar General Corp. | 20,833 | 5,130,126 |
| Dollar Tree, Inc. (a) | 19,441 | 2,749,735 |
| Target Corp. | 42,509 | 6,335,542 |
| | | 14,215,403 |
| | Shares | Value |
| |
| Multi-Utilities 0.9% |
| Ameren Corp. | 23,877 | $ 2,123,143 |
| CenterPoint Energy, Inc. | 58,143 | 1,743,708 |
| CMS Energy Corp. | 26,807 | 1,697,687 |
| Consolidated Edison, Inc. | 32,774 | 3,123,690 |
| Dominion Energy, Inc. | 76,959 | 4,719,126 |
| DTE Energy Co. | 17,894 | 2,103,082 |
| NiSource, Inc. | 37,510 | 1,028,524 |
| Public Service Enterprise Group, Inc. | 46,082 | 2,823,444 |
| Sempra Energy | 29,031 | 4,486,451 |
| WEC Energy Group, Inc. | 29,133 | 2,731,510 |
| | | 26,580,365 |
| Oil, Gas & Consumable Fuels 4.7% |
| APA Corp. | 29,694 | 1,386,116 |
| Chevron Corp. | 164,300 | 29,490,207 |
| ConocoPhillips | 115,084 | 13,579,912 |
| Coterra Energy, Inc. | 72,821 | 1,789,212 |
| Devon Energy Corp. | 60,374 | 3,713,605 |
| Diamondback Energy, Inc. | 16,255 | 2,223,359 |
| EOG Resources, Inc. | 54,250 | 7,026,460 |
| EQT Corp. | 33,900 | 1,146,837 |
| Exxon Mobil Corp. | 380,357 | 41,953,377 |
| Hess Corp. | 25,636 | 3,635,698 |
| Kinder Morgan, Inc. | 182,685 | 3,302,945 |
| Marathon Oil Corp. | 58,653 | 1,587,737 |
| Marathon Petroleum Corp. | 43,285 | 5,037,941 |
| Occidental Petroleum Corp. | 67,156 | 4,230,156 |
| ONEOK, Inc. | 41,280 | 2,712,096 |
| Phillips 66 | 43,651 | 4,543,196 |
| Pioneer Natural Resources Co. | 21,944 | 5,011,790 |
| Targa Resources Corp. | 20,907 | 1,536,664 |
| Valero Energy Corp. | 35,606 | 4,516,977 |
| Williams Cos., Inc. (The) | 112,492 | 3,700,987 |
| | | 142,125,272 |
| Personal Products 0.2% |
| Estee Lauder Cos., Inc. (The), Class A | 21,360 | 5,299,630 |
| Pharmaceuticals 4.8% |
| Bristol-Myers Squibb Co. | 196,367 | 14,128,606 |
| Catalent, Inc. (a) | 16,621 | 748,111 |
| Eli Lilly and Co. | 72,838 | 26,647,054 |
| Johnson & Johnson | 241,468 | 42,655,322 |
| Merck & Co., Inc. | 234,164 | 25,980,496 |
| Organon & Co. | 23,493 | 656,159 |
| Pfizer, Inc. | 518,433 | 26,564,507 |
| Viatris, Inc. | 112,001 | 1,246,571 |
The notes to the financial statements are an integral part of, and should be read in conjunction with, the financial statements.
| 14 | MainStay VP S&P 500 Index Portfolio |
| | Shares | Value |
| Common Stocks (continued) |
| Pharmaceuticals (continued) |
| Zoetis, Inc. | 43,045 | $ 6,308,245 |
| | | 144,935,071 |
| Professional Services 0.4% |
| CoStar Group, Inc. (a) | 37,561 | 2,902,714 |
| Equifax, Inc. | 11,309 | 2,198,017 |
| Jacobs Solutions, Inc. | 11,785 | 1,415,025 |
| Leidos Holdings, Inc. | 12,624 | 1,327,919 |
| Robert Half International, Inc. | 10,021 | 739,850 |
| Verisk Analytics, Inc. | 14,440 | 2,547,505 |
| | | 11,131,030 |
| Real Estate Management & Development 0.1% |
| CBRE Group, Inc., Class A (a) | 29,180 | 2,245,693 |
| Road & Rail 0.9% |
| CSX Corp. | 194,174 | 6,015,511 |
| JB Hunt Transport Services, Inc. | 7,650 | 1,333,854 |
| Norfolk Southern Corp. | 21,382 | 5,268,952 |
| Old Dominion Freight Line, Inc. | 8,367 | 2,374,387 |
| Union Pacific Corp. | 56,782 | 11,757,849 |
| | | 26,750,553 |
| Semiconductors & Semiconductor Equipment 5.0% |
| Advanced Micro Devices, Inc. (a) | 148,914 | 9,645,160 |
| Analog Devices, Inc. | 47,504 | 7,792,081 |
| Applied Materials, Inc. | 79,456 | 7,737,425 |
| Broadcom, Inc. | 37,406 | 20,914,817 |
| Enphase Energy, Inc. (a) | 12,554 | 3,326,308 |
| First Solar, Inc. (a) | 9,157 | 1,371,627 |
| Intel Corp. | 381,161 | 10,074,085 |
| KLA Corp. | 13,089 | 4,934,946 |
| Lam Research Corp. | 12,596 | 5,294,099 |
| Microchip Technology, Inc. | 50,798 | 3,568,559 |
| Micron Technology, Inc. | 100,409 | 5,018,442 |
| Monolithic Power Systems, Inc. | 4,119 | 1,456,519 |
| NVIDIA Corp. | 229,971 | 33,607,962 |
| NXP Semiconductors NV | 23,933 | 3,782,132 |
| ON Semiconductor Corp. (a) | 39,938 | 2,490,933 |
| Qorvo, Inc. (a) | 9,364 | 848,753 |
| QUALCOMM, Inc. | 103,533 | 11,382,418 |
| Skyworks Solutions, Inc. | 14,818 | 1,350,364 |
| SolarEdge Technologies, Inc. (a) | 5,162 | 1,462,240 |
| Teradyne, Inc. | 14,385 | 1,256,530 |
| Texas Instruments, Inc. | 83,821 | 13,848,906 |
| | | 151,164,306 |
| | Shares | Value |
| |
| Software 8.3% |
| Adobe, Inc. (a) | 42,937 | $ 14,449,589 |
| ANSYS, Inc. (a) | 8,045 | 1,943,592 |
| Autodesk, Inc. (a) | 19,936 | 3,725,440 |
| Cadence Design Systems, Inc. (a) | 25,335 | 4,069,814 |
| Ceridian HCM Holding, Inc. (a) | 14,186 | 910,032 |
| Fortinet, Inc. (a) | 59,887 | 2,927,875 |
| Gen Digital, Inc. | 53,541 | 1,147,384 |
| Intuit, Inc. | 26,033 | 10,132,564 |
| Microsoft Corp. | 688,479 | 165,111,034 |
| Oracle Corp. | 141,937 | 11,601,930 |
| Paycom Software, Inc. (a) | 4,489 | 1,392,982 |
| PTC, Inc. (a) | 9,764 | 1,172,071 |
| Roper Technologies, Inc. | 9,795 | 4,232,321 |
| Salesforce, Inc. (a) | 92,358 | 12,245,747 |
| ServiceNow, Inc. (a) | 18,656 | 7,243,565 |
| Synopsys, Inc. (a) | 14,123 | 4,509,333 |
| Tyler Technologies, Inc. (a) | 3,846 | 1,239,989 |
| | | 248,055,262 |
| Specialty Retail 2.4% |
| Advance Auto Parts, Inc. | 5,552 | 816,311 |
| AutoZone, Inc. (a) | 1,753 | 4,323,214 |
| Bath & Body Works, Inc. | 21,092 | 888,817 |
| Best Buy Co., Inc. | 18,505 | 1,484,286 |
| CarMax, Inc. (a) | 14,594 | 888,629 |
| Home Depot, Inc. (The) | 94,549 | 29,864,247 |
| Lowe's Cos., Inc. | 57,327 | 11,421,831 |
| O'Reilly Automotive, Inc. (a) | 5,779 | 4,877,649 |
| Ross Stores, Inc. | 32,054 | 3,720,508 |
| TJX Cos., Inc. (The) | 107,232 | 8,535,667 |
| Tractor Supply Co. | 10,202 | 2,295,144 |
| Ulta Beauty, Inc. (a) | 4,731 | 2,219,170 |
| | | 71,335,473 |
| Technology Hardware, Storage & Peripherals 6.2% |
| Apple, Inc. (c) | 1,381,085 | 179,444,374 |
| Hewlett Packard Enterprise Co. | 118,837 | 1,896,639 |
| HP, Inc. | 81,758 | 2,196,837 |
| NetApp, Inc. | 20,075 | 1,205,705 |
| Seagate Technology Holdings plc | 17,733 | 932,933 |
| Western Digital Corp. (a) | 29,337 | 925,582 |
| | | 186,602,070 |
| Textiles, Apparel & Luxury Goods 0.5% |
| NIKE, Inc., Class B | 116,342 | 13,613,177 |
| Ralph Lauren Corp. | 3,795 | 401,018 |
| Tapestry, Inc. | 22,255 | 847,470 |
| VF Corp. | 30,504 | 842,216 |
| | | 15,703,881 |
The notes to the financial statements are an integral part of, and should be read in conjunction with, the financial statements.
15
Portfolio of Investments December 31, 2022† (continued)
| | Shares | | Value |
| Common Stocks (continued) |
| Tobacco 0.7% |
| Altria Group, Inc. | 165,521 | | $ 7,565,965 |
| Philip Morris International, Inc. | 143,173 | | 14,490,539 |
| | | | 22,056,504 |
| Trading Companies & Distributors 0.2% |
| Fastenal Co. | 52,871 | | 2,501,856 |
| United Rentals, Inc. (a) | 6,401 | | 2,275,043 |
| WW Grainger, Inc. | 4,153 | | 2,310,106 |
| | | | 7,087,005 |
| Water Utilities 0.1% |
| American Water Works Co., Inc. | 16,793 | | 2,559,589 |
| Wireless Telecommunication Services 0.3% |
| T-Mobile US, Inc. (a) | 55,156 | | 7,721,840 |
Total Common Stocks (d)
(Cost $999,995,092) | | | 2,967,718,963 |
| |
| Short-Term Investments 1.1% |
| Affiliated Investment Company 0.0% ‡ |
| MainStay U.S. Government Liquidity Fund, 3.602% (e) | 67 | | 67 |
| Unaffiliated Investment Company 0.0% ‡ |
| Invesco Government and Agency Portfolio, 4.301% (e)(f) | 49,623 | | 49,623 |
| |
| | Principal
Amount | | |
| U.S. Treasury Debt 1.1% |
| U.S. Treasury Bills | | | |
| 4.42%, due 4/20/23 (c)(g) | $ 33,100,000 | | 32,668,454 |
Total Short-Term Investments
(Cost $32,713,842) | | | 32,718,144 |
Total Investments
(Cost $1,032,708,934) | 99.9% | | 3,000,437,107 |
| Other Assets, Less Liabilities | 0.1 | | 2,284,068 |
| Net Assets | 100.0% | | $ 3,002,721,175 |
| † | Percentages indicated are based on Portfolio net assets. |
| ‡ | Less than one-tenth of a percent. |
| (a) | Non-income producing security. |
| (b) | All or a portion of this security was held on loan. As of December 31, 2022, the aggregate market value of securities on loan was $1,972,961; the total market value of collateral held by the Portfolio was $2,053,199. The market value of the collateral held included non-cash collateral in the form of U.S. Treasury securities with a value of $2,003,576. The Portfolio received cash collateral with a value of $49,623. (See Note 2(H)) |
| (c) | Represents a security, or portion thereof, which was maintained at the broker as collateral for futures contracts. |
| (d) | The combined market value of common stocks and notional value of Standard & Poor’s 500 Index futures contracts represents 99.9% of the Portfolio’s net assets. |
| (e) | Current yield as of December 31, 2022. |
| (f) | Represents a security purchased with cash collateral received for securities on loan. |
| (g) | Interest rate shown represents yield to maturity. |
The notes to the financial statements are an integral part of, and should be read in conjunction with, the financial statements.
| 16 | MainStay VP S&P 500 Index Portfolio |
Investments in Affiliates (in 000's)
Investments in issuers considered to be affiliate(s) of the Portfolio during the year ended December 31, 2022 for purposes of Section 2(a)(3) of the Investment Company Act of 1940, as amended, were as follows:
| Affiliated Investment Companies | Value,
Beginning
of Year | Purchases
at Cost | Proceeds
from
Sales | Net
Realized
Gain/(Loss)
on Sales | Change in
Unrealized
Appreciation/
(Depreciation) | Value,
End of
Year | Dividend
Income | Other
Distributions | Shares
End of
Year |
| MainStay U.S. Government Liquidity Fund | $ 73 | $ 33,507 | $ (33,580) | $ — | $ — | $ —(a) | $ 4 | $ — | —(b) |
| | |
| (a) | Less than $500. |
| (b) | Less than 500 Shares. |
Futures Contracts
As of December 31, 2022, the Portfolio held the following futures contracts:
| Type | Number of
Contracts | Expiration
Date | Value at
Trade Date | Current
Notional
Amount | Unrealized
Appreciation
(Depreciation)1 |
| Long Contracts | | | | | |
| S&P 500 E-Mini Index | 169 | March 2023 | $ 33,440,175 | $ 32,625,450 | $ (814,725) |
| 1. | Represents the difference between the value of the contracts at the time they were opened and the value as of December 31, 2022. |
The following is a summary of the fair valuations according to the inputs used as of December 31, 2022, for valuing the Portfolio’s assets and liabilities:
| Description | Quoted
Prices in
Active
Markets for
Identical
Assets
(Level 1) | | Significant
Other
Observable
Inputs
(Level 2) | | Significant
Unobservable
Inputs
(Level 3) | | Total |
| Asset Valuation Inputs | | | | | | | |
| Investments in Securities (a) | | | | | | | |
| Common Stocks | $ 2,967,714,715 | | $ 4,248 | | $ — | | $ 2,967,718,963 |
| Short-Term Investments | | | | | | | |
| Affiliated Investment Company | 67 | | — | | — | | 67 |
| Unaffiliated Investment Company | 49,623 | | — | | — | | 49,623 |
| U.S. Treasury Debt | — | | 32,668,454 | | — | | 32,668,454 |
| Total Short-Term Investments | 49,690 | | 32,668,454 | | — | | 32,718,144 |
| Total Investments in Securities | $ 2,967,764,405 | | $ 32,672,702 | | $ — | | $ 3,000,437,107 |
| Liability Valuation Inputs | | | | | | | |
| Other Financial Instruments | | | | | | | |
| Futures Contracts (b) | $ (814,725) | | $ — | | $ — | | $ (814,725) |
| (a) | For a complete listing of investments and their industries, see the Portfolio of Investments. |
| (b) | The value listed for these securities reflects unrealized appreciation (depreciation) as shown on the Portfolio of Investments. |
The notes to the financial statements are an integral part of, and should be read in conjunction with, the financial statements.
17
Statement of Assets and Liabilities as of December 31, 2022
| Assets |
Investment in unaffiliated securities, at value
(identified cost $1,032,708,867) including securities on loan of $1,972,961 | $3,000,437,040 |
Investment in affiliated investment companies, at value
(identified cost $67) | 67 |
| Receivables: | |
| Dividends | 2,586,634 |
| Portfolio shares sold | 1,278,980 |
| Securities lending | 621 |
| Other assets | 16,727 |
| Total assets | 3,004,320,069 |
| Liabilities |
| Cash collateral received for securities on loan | 49,623 |
| Due to custodian | 53,087 |
| Payables: | |
| Portfolio shares redeemed | 662,800 |
| NYLIFE Distributors (See Note 3) | 375,193 |
| Manager (See Note 3) | 227,779 |
| Shareholder communication | 95,722 |
| Variation margin on futures contracts | 78,623 |
| Professional fees | 43,978 |
| Custodian | 6,635 |
| Accrued expenses | 5,454 |
| Total liabilities | 1,598,894 |
| Net assets | $3,002,721,175 |
| Composition of Net Assets |
| Shares of beneficial interest outstanding (par value of $.001 per share) unlimited number of shares authorized | $ 43,332 |
| Additional paid-in-capital | 955,131,204 |
| | 955,174,536 |
| Total distributable earnings (loss) | 2,047,546,639 |
| Net assets | $3,002,721,175 |
| Initial Class | |
| Net assets applicable to outstanding shares | $1,271,410,881 |
| Shares of beneficial interest outstanding | 18,242,582 |
| Net asset value per share outstanding | $ 69.69 |
| Service Class | |
| Net assets applicable to outstanding shares | $1,731,310,294 |
| Shares of beneficial interest outstanding | 25,089,265 |
| Net asset value per share outstanding | $ 69.01 |
The notes to the financial statements are an integral part of, and should be read in conjunction with, the financial statements.
| 18 | MainStay VP S&P 500 Index Portfolio |
Statement of Operations for the year ended December 31, 2022
| Investment Income (Loss) |
| Income | |
| Dividends-unaffiliated (net of foreign tax withholding of $12,299) | $ 50,144,762 |
| Interest | 394,072 |
| Securities lending, net | 49,236 |
| Dividends-affiliated | 3,643 |
| Total income | 50,591,713 |
| Expenses | |
| Manager (See Note 3) | 5,072,882 |
| Distribution/Service—Service Class (See Note 3) | 4,526,522 |
| Professional fees | 220,462 |
| Shareholder communication | 190,144 |
| Trustees | 67,881 |
| Custodian | 53,297 |
| Miscellaneous | 561,140 |
| Total expenses before waiver/reimbursement | 10,692,328 |
| Expense waiver/reimbursement from Manager (See Note 3) | (2,307,574) |
| Net expenses | 8,384,754 |
| Net investment income (loss) | 42,206,959 |
| Realized and Unrealized Gain (Loss) |
| Net realized gain (loss) on: | |
| Unaffiliated investment transactions | 58,211,935 |
| Futures transactions | (3,263,378) |
| Net realized gain (loss) | 54,948,557 |
| Net change in unrealized appreciation (depreciation) on: | |
| Unaffiliated investments | (779,766,357) |
| Futures contracts | (909,668) |
| Net change in unrealized appreciation (depreciation) | (780,676,025) |
| Net realized and unrealized gain (loss) | (725,727,468) |
| Net increase (decrease) in net assets resulting from operations | $(683,520,509) |
The notes to the financial statements are an integral part of, and should be read in conjunction with, the financial statements.
19
Statements of Changes in Net Assets
for the years ended December 31, 2022 and December 31, 2021
| | 2022 | 2021 |
| Increase (Decrease) in Net Assets |
| Operations: | | |
| Net investment income (loss) | $ 42,206,959 | $ 41,890,389 |
| Net realized gain (loss) | 54,948,557 | 103,780,431 |
| Net change in unrealized appreciation (depreciation) | (780,676,025) | 764,502,805 |
| Net increase (decrease) in net assets resulting from operations | (683,520,509) | 910,173,625 |
| Distributions to shareholders: | | |
| Initial Class | (62,047,386) | (37,666,492) |
| Service Class | (79,677,136) | (39,080,413) |
| Total distributions to shareholders | (141,724,522) | (76,746,905) |
| Capital share transactions: | | |
| Net proceeds from sales of shares | 291,292,111 | 364,010,795 |
| Net asset value of shares issued to shareholders in reinvestment of distributions | 141,724,522 | 76,746,905 |
| Cost of shares redeemed | (417,633,674) | (831,676,688) |
| Increase (decrease) in net assets derived from capital share transactions | 15,382,959 | (390,918,988) |
| Net increase (decrease) in net assets | (809,862,072) | 442,507,732 |
| Net Assets |
| Beginning of year | 3,812,583,247 | 3,370,075,515 |
| End of year | $3,002,721,175 | $3,812,583,247 |
The notes to the financial statements are an integral part of, and should be read in conjunction with, the financial statements.
| 20 | MainStay VP S&P 500 Index Portfolio |
Financial Highlights selected per share data and ratios
| | Year Ended December 31, |
| Initial Class | 2022 | | 2021 | | 2020 | | 2019 | | 2018 |
| Net asset value at beginning of year | $ 89.76 | | $ 71.41 | | $ 61.70 | | $ 48.11 | | $ 52.02 |
| Net investment income (loss) (a) | 1.12 | | 1.03 | | 1.00 | | 1.01 | | 1.04 |
| Net realized and unrealized gain (loss) | (17.63) | | 19.19 | | 10.13 | | 13.88 | | (3.15) |
| Total from investment operations | (16.51) | | 20.22 | | 11.13 | | 14.89 | | (2.11) |
| Less distributions: | | | | | | | | | |
| From net investment income | (1.12) | | (1.01) | | (0.91) | | (1.00) | | (0.78) |
| From net realized gain on investments | (2.44) | | (0.86) | | (0.51) | | (0.30) | | (1.02) |
| Total distributions | (3.56) | | (1.87) | | (1.42) | | (1.30) | | (1.80) |
| Net asset value at end of year | $ 69.69 | | $ 89.76 | | $ 71.41 | | $ 61.70 | | $ 48.11 |
| Total investment return (b) | (18.19)% | | 28.55% | | 18.24% | | 31.25% | | (4.52)% |
| Ratios (to average net assets)/Supplemental Data: | | | | | | | | | |
| Net investment income (loss) | 1.45% | | 1.28% | | 1.61% | | 1.80% | | 1.95% |
| Net expenses (c) | 0.12% | | 0.12% | | 0.13% | | 0.16% | | 0.16% |
| Expenses (before waiver/reimbursement) (c) | 0.19% | | 0.18% | | 0.20% | | 0.19% | | 0.19% |
| Portfolio turnover rate | 2% | | 3% | | 2% | | 7% | | 9% |
| Net assets at end of year (in 000's) | $ 1,271,411 | | $ 1,745,640 | | $ 1,749,834 | | $ 1,123,943 | | $ 1,001,911 |
| (a) | Per share data based on average shares outstanding during the year. |
| (b) | Total return does not reflect any deduction of sales charges, mortality and expense charges, contract charges or administrative charges. For periods of less than one year, total return is not annualized. |
| (c) | In addition to the fees and expenses which the Portfolio bears directly, it also indirectly bears a pro-rata share of the fees and expenses of the underlying funds in which it invests. Such indirect expenses are not included in the above expense ratios. |
| | Year Ended December 31, |
| Service Class | 2022 | | 2021 | | 2020 | | 2019 | | 2018 |
| Net asset value at beginning of year | $ 88.87 | | $ 70.76 | | $ 61.19 | | $ 47.74 | | $ 51.66 |
| Net investment income (loss) (a) | 0.92 | | 0.83 | | 0.83 | | 0.86 | | 0.90 |
| Net realized and unrealized gain (loss) | (17.43) | | 18.99 | | 10.03 | | 13.77 | | (3.13) |
| Total from investment operations | (16.51) | | 19.82 | | 10.86 | | 14.63 | | (2.23) |
| Less distributions: | | | | | | | | | |
| From net investment income | (0.91) | | (0.85) | | (0.78) | | (0.88) | | (0.67) |
| From net realized gain on investments | (2.44) | | (0.86) | | (0.51) | | (0.30) | | (1.02) |
| Total distributions | (3.35) | | (1.71) | | (1.29) | | (1.18) | | (1.69) |
| Net asset value at end of year | $ 69.01 | | $ 88.87 | | $ 70.76 | | $ 61.19 | | $ 47.74 |
| Total investment return (b) | (18.40)% | | 28.23% | | 17.95% | | 30.92% | | (4.76)% |
| Ratios (to average net assets)/Supplemental Data: | | | | | | | | | |
| Net investment income (loss) | 1.21% | | 1.03% | | 1.37% | | 1.54% | | 1.70% |
| Net expenses (c) | 0.37% | | 0.37% | | 0.38% | | 0.41% | | 0.41% |
| Expenses (before waiver/reimbursement) (c) | 0.44% | | 0.43% | | 0.45% | | 0.44% | | 0.44% |
| Portfolio turnover rate | 2% | | 3% | | 2% | | 7% | | 9% |
| Net assets at end of year (in 000's) | $ 1,731,310 | | $ 2,066,943 | | $ 1,620,242 | | $ 1,341,639 | | $ 920,531 |
| (a) | Per share data based on average shares outstanding during the year. |
| (b) | Total return does not reflect any deduction of sales charges, mortality and expense charges, contract charges or administrative charges. For periods of less than one year, total return is not annualized. |
| (c) | In addition to the fees and expenses which the Portfolio bears directly, it also indirectly bears a pro-rata share of the fees and expenses of the underlying funds in which it invests. Such indirect expenses are not included in the above expense ratios. |
The notes to the financial statements are an integral part of, and should be read in conjunction with, the financial statements.
21
Notes to Financial Statements
Note 1–Organization and Business
MainStay VP Funds Trust (the “Fund”) was organized as a Delaware statutory trust on February 1, 2011. The Fund is registered under the Investment Company Act of 1940, as amended (the “1940 Act”), as an open-end management investment company. The Fund is comprised of thirty-one separate series (collectively referred to as the “Portfolios”). These financial statements and notes relate to the MainStay VP S&P 500 Index Portfolio (formerly known as MainStay VP MacKay S&P 500 Index Portfolio) (the "Portfolio"), a "diversified” portfolio, as that term is defined in the 1940 Act, as interpreted or modified by regulatory authorities having jurisdiction, from time to time.
Shares of the Portfolio are currently offered to certain separate accounts to fund variable annuity policies and variable universal life insurance policies issued by New York Life Insurance and Annuity Corporation (“NYLIAC”), a wholly-owned subsidiary of New York Life Insurance Company (“New York Life”) and may also be offered to fund variable annuity policies and variable universal life insurance policies issued by other insurance companies. NYLIAC allocates shares of the Portfolio to, among others, certain NYLIAC separate accounts. Shares of the Portfolio are also offered to the MainStay VP Conservative Allocation Portfolio, MainStay VP Moderate Allocation Portfolio, MainStay VP Growth Allocation Portfolio and MainStay VP Equity Allocation Portfolio, which operate as “funds-of-funds," and other variable insurance funds.
The following table lists the Portfolio's share classes that have been registered and commenced operations:
| Class | Commenced Operations |
| Initial Class | January 29, 1993 |
| Service Class | June 5, 2003 |
Shares of the Portfolio are offered and are redeemed at a price equal to their respective net asset value (“NAV”) per share. No sales or redemption charge is applicable to the purchase or redemption of the Portfolio's shares. Under the terms of the Fund’s multiple class plan, adopted pursuant to Rule 18f-3 under the 1940 Act, the classes differ in that, among other things, Service Class shares of the Portfolio pay a combined distribution and service fee of 0.25% of average daily net assets attributable to Service Class shares of the Portfolio to the Distributor (as defined in Note 3(B)) pursuant to a plan adopted in accordance with Rule 12b-1 under the 1940 Act. Contract owners of variable annuity contracts purchased after June 2, 2003, are permitted to invest only in the Service Class shares.
The Portfolio's investment objective is to seek investment results that correspond to the total return performance (reflecting reinvestment of dividends) of common stocks in the aggregate, as represented by the S&P 500® Index.
Note 2–Significant Accounting Policies
The Portfolio is an investment company and accordingly follows the investment company accounting and reporting guidance of the Financial Accounting Standards Board (“FASB”) Accounting Standards Codification Topic 946 Financial Services—Investment Companies. The Portfolio prepares its financial statements in accordance with generally accepted accounting principles (“GAAP”) in the United States of America and follows the significant accounting policies described below.
(A) Securities Valuation. Investments are usually valued as of the close of regular trading on the New York Stock Exchange (the "Exchange") (usually 4:00 p.m. Eastern time) on each day the Portfolio is open for business ("valuation date").
Effective September 8, 2022, and pursuant to Rule 2a-5 under the 1940 Act, the Board of Trustees of the Fund (the "Board") designated New York Life Investment Management LLC (“New York Life Investments” or the "Manager") as its Valuation Designee (the "Valuation Designee"). The Valuation Designee is responsible for performing fair valuations relating to all investments in the Portfolio’s portfolio for which market quotations are not readily available; periodically assessing and managing material valuation risks; establishing and applying fair value methodologies; testing fair valuation methodologies; evaluating and overseeing pricing services; ensuring appropriate segregation of valuation and portfolio management functions; providing quarterly, annual and prompt reporting to the Board, as appropriate; identifying potential conflicts of interest; and maintaining appropriate records. The Valuation Designee has established a valuation committee ("Valuation Committee") to assist in carrying out the Valuation Designee’s responsibilities and establish prices of securities for which market quotations are not readily available. The Portfolio’s and the Valuation Designee's policies and procedures ("Valuation Procedures") govern the Valuation Designee’s selection and application of methodologies for determining and calculating the fair value of Portfolio investments. The Valuation Designee may value the Portfolio's portfolio securities for which market quotations are not readily available and other Portfolio assets utilizing inputs from pricing services and other third-party sources (together, “Pricing Sources”). The Valuation Committee meets (in person, via electronic mail or via teleconference) on an ad-hoc basis to determine fair valuations and on a quarterly basis to review fair value events with respect to certain securities for which market quotations are not readily available, including valuation risks and back-testing results, and preview reports to the Board.
The Valuation Committee establishes prices of securities for which market quotations are not readily available based on such methodologies and measurements on a regular basis after considering information that is reasonably available and deemed relevant by the Valuation Committee. The Board shall oversee the Valuation Designee and review fair valuation materials on a prompt, quarterly and annual basis and approve proposed revisions to the Valuation Procedures.
Investments for which market quotations are not readily available are valued at fair value as determined in good faith pursuant to the Valuation
| 22 | MainStay VP S&P 500 Index Portfolio |
Procedures. A market quotation is readily available only when that quotation is a quoted price (unadjusted) in active markets for identical investments that the Portfolio can access at the measurement date, provided that a quotation will not be readily available if it is not reliable. "Fair value" is defined as the price the Portfolio would reasonably expect to receive upon selling an asset or liability in an orderly transaction to an independent buyer in the principal or most advantageous market for the asset or liability. Fair value measurements are determined within a framework that establishes a three-tier hierarchy that maximizes the use of observable market data and minimizes the use of unobservable inputs to establish a classification of fair value measurements for disclosure purposes. "Inputs" refer broadly to the assumptions that market participants would use in pricing the asset or liability, including assumptions about risk, such as the risk inherent in a particular valuation technique used to measure fair value using a pricing model and/or the risk inherent in the inputs for the valuation technique. Inputs may be observable or unobservable. Observable inputs reflect the assumptions market participants would use in pricing the asset or liability based on market data obtained from sources independent of the Portfolio. Unobservable inputs reflect the Portfolio’s own assumptions about the assumptions market participants would use in pricing the asset or liability based on the information available. The inputs or methodology used for valuing assets or liabilities may not be an indication of the risks associated with investing in those assets or liabilities. The three-tier hierarchy of inputs is summarized below.
| • | Level 1—quoted prices (unadjusted) in active markets for an identical asset or liability |
| • | Level 2—other significant observable inputs (including quoted prices for a similar asset or liability in active markets, interest rates and yield curves, prepayment speeds, credit risk, etc.) |
| • | Level 3—significant unobservable inputs (including the Portfolio's own assumptions about the assumptions that market participants would use in measuring fair value of an asset or liability) |
The level of an asset or liability within the fair value hierarchy is based on the lowest level of an input, both individually and in the aggregate, that is significant to the fair value measurement. The aggregate value by input level of the Portfolio’s assets and liabilities as of December 31, 2022, is included at the end of the Portfolio of Investments.
The Portfolio may use third-party vendor evaluations, whose prices may be derived from one or more of the following standard inputs, among others:
| • Broker/dealer quotes | • Benchmark securities |
| • Two-sided markets | • Reference data (corporate actions or material event notices) |
| • Bids/offers | • Monthly payment information |
| • Industry and economic events | • Reported trades |
An asset or liability for which a market quotation is not readily available is valued by methods deemed reasonable in good faith by the Valuation
Committee, following the Valuation Procedures to represent fair value. Under these procedures, the Valuation Designee generally uses a market-based approach which may use related or comparable assets or liabilities, recent transactions, market multiples, book values and other relevant information. The Valuation Designee may also use an income-based valuation approach in which the anticipated future cash flows of the asset or liability are discounted to calculate fair value. Discounts may also be applied due to the nature and/or duration of any restrictions on the disposition of the asset or liability. Fair value represents a good faith approximation of the value of a security. Fair value determinations involve the consideration of a number of subjective factors, an analysis of applicable facts and circumstances and the exercise of judgment. As a result, it is possible that the fair value for a security determined in good faith in accordance with the Valuation Procedures may differ from valuations for the same security determined for other funds using their own valuation procedures. Although the Valuation Procedures are designed to value a security at the price the Portfolio may reasonably expect to receive upon the security's sale in an orderly transaction, there can be no assurance that any fair value determination thereunder would, in fact, approximate the amount that the Portfolio would actually realize upon the sale of the security or the price at which the security would trade if a reliable market price were readily available. During the year ended December 31, 2022, there were no material changes to the fair value methodologies.
Securities which may be valued in this manner include, but are not limited to: (i) a security for which trading has been halted or suspended or otherwise does not have a readily available market quotation on a given day; (ii) a debt security that has recently gone into default and for which there is not a current market quotation; (iii) a security of an issuer that has entered into a restructuring; (iv) a security that has been delisted from a national exchange; (v) a security subject to trading collars for which no or limited trading takes place; and (vi) a security whose principal market has been temporarily closed at a time when, under normal conditions, it would be open. Securities valued in this manner are generally categorized as Level 2 or 3 in the hierarchy.
Equity securities are valued at the last quoted sales prices as of the close of regular trading on the relevant exchange on each valuation date. Securities that are not traded on the valuation date are valued at the mean of the last quoted bid and ask prices. Prices are normally taken from the principal market in which each security trades. These securities are generally categorized as Level 1 in the hierarchy.
Investments in mutual funds, including money market funds, are valued at their respective NAVs at the close of business each day on the valuation date. These securities are generally categorized as Level 1 in the hierarchy.
Futures contracts are valued at the last posted settlement price on the market where such futures are primarily traded. These securities are generally categorized as Level 1 in the hierarchy.
Debt securities (other than convertible and municipal bonds) are valued at the evaluated bid prices (evaluated mean prices in the case of convertible
Notes to Financial Statements (continued)
and municipal bonds) supplied by a pricing agent or broker selected by the Valuation Designee, in consultation with the Subadvisor. The evaluations are market-based measurements processed through a pricing application and represents the pricing agent’s good faith determination as to what a holder may receive in an orderly transaction under market conditions. The rules-based logic utilizes valuation techniques that reflect participants’ assumptions and vary by asset class and per methodology, maximizing the use of relevant observable data including quoted prices for similar assets, benchmark yield curves and market corroborated inputs. The evaluated bid or mean prices are deemed by the Valuation Designee, in consultation with the Subadvisor, to be representative of market values at the regular close of trading of the Exchange on each valuation date. Debt securities purchased on a delayed delivery basis are marked to market daily until settlement at the forward settlement date. Debt securities, including corporate bonds, U.S. government and federal agency bonds, municipal bonds, foreign bonds, convertible bonds, asset-backed securities and mortgage-backed securities are generally categorized as Level 2 in the hierarchy.
Temporary cash investments acquired in excess of 60 days to maturity at the time of purchase are valued using the latest bid prices or using valuations based on a matrix system (which considers such factors as security prices, yields, maturities and ratings), both as furnished by independent pricing services. Temporary cash investments that mature in 60 days or less at the time of purchase ("Short-Term Investments") are valued using the amortized cost method of valuation, unless the use of such method would be inappropriate. The amortized cost method involves valuing a security at its cost on the date of purchase and thereafter assuming a constant amortization to maturity of the difference between such cost and the value on maturity date. Amortized cost approximates the current fair value of a security. Securities valued using the amortized cost method are not valued using quoted prices in an active market and are generally categorized as Level 2 in the hierarchy.
The information above is not intended to reflect an exhaustive list of the methodologies that may be used to value portfolio investments. The Valuation Procedures permit the use of a variety of valuation methodologies in connection with valuing portfolio investments. The methodology used for a specific type of investment may vary based on the market data available or other considerations. The methodologies summarized above may not represent the specific means by which portfolio investments are valued on any particular business day.
(B) Income Taxes. The Portfolio's policy is to comply with the requirements of the Internal Revenue Code of 1986, as amended (the “Internal Revenue Code”), applicable to regulated investment companies and to distribute all of its taxable income to the shareholders of the Portfolio within the allowable time limits.
The Manager evaluates the Portfolio’s tax positions to determine if the tax positions taken meet the minimum recognition threshold in connection with accounting for uncertainties in income tax positions taken or expected to be taken for the purposes of measuring and recognizing tax liabilities in the financial statements. Recognition of tax benefits of an
uncertain tax position is permitted only to the extent the position is “more likely than not” to be sustained assuming examination by taxing authorities. The Manager analyzed the Portfolio's tax positions taken on federal, state and local income tax returns for all open tax years (for up to three tax years) and has concluded that no provisions for federal, state and local income tax are required in the Portfolio's financial statements. The Portfolio's federal, state and local income tax and federal excise tax returns for tax years for which the applicable statutes of limitations have not expired are subject to examination by the Internal Revenue Service and state and local departments of revenue.
(C) Dividends and Distributions to Shareholders. Dividends and distributions are recorded on the ex-dividend date. The Portfolio intends to declare and pay dividends from net investment income and distributions from net realized capital and currency gains, if any, at least annually. All dividends and distributions are reinvested at NAV in the same class of shares of the Portfolio. Dividends and distributions to shareholders are determined in accordance with federal income tax regulations and may differ from determinations using GAAP.
(D) Security Transactions and Investment Income. The Portfolio records security transactions on the trade date. Realized gains and losses on security transactions are determined using the identified cost method. Dividend income is recognized on the ex-dividend date, net of any foreign tax withheld at the source, and interest income is accrued as earned using the effective interest rate method. Distributions received from real estate investment trusts may be classified as dividends, capital gains and/or return of capital.
Investment income and realized and unrealized gains and losses on investments of the Portfolio are allocated pro rata to the separate classes of shares based upon their relative net assets on the date the income is earned or realized and unrealized gains and losses are incurred.
(E) Expenses. Expenses of the Fund are allocated to the individual Portfolios in proportion to the net assets of the respective Portfolios when the expenses are incurred, except where direct allocations of expenses can be made. Expenses (other than fees incurred under the distribution and service plans, further discussed in Note 3(B), which are charged directly to the Service Class shares) are allocated to separate classes of shares pro rata based upon their relative net assets on the date the expenses are incurred. The expenses borne by the Portfolio, including those of related parties to the Portfolio, are shown in the Statement of Operations.
Additionally, the Portfolio may invest in mutual funds, which are subject to management fees and other fees that may cause the costs of investing in mutual funds to be greater than the costs of owning the underlying securities directly. These indirect expenses of mutual funds are not included in the amounts shown as expenses in the Statement of Operations or in the expense ratios included in the Financial Highlights.
| 24 | MainStay VP S&P 500 Index Portfolio |
(F) Use of Estimates. In preparing financial statements in conformity with GAAP, the Manager makes estimates and assumptions that affect the reported amounts and disclosures in the financial statements. Actual results could differ from those estimates and assumptions.
(G) Futures Contracts. A futures contract is an agreement to purchase or sell a specified quantity of an underlying instrument at a specified future date and price, or to make or receive a cash payment based on the value of a financial instrument (e.g., foreign currency, interest rate, security or securities index). The Portfolio is subject to risks such as market price risk, leverage risk, liquidity risk, counterparty risk, operational risk, legal risk and/or interest rate risk in the normal course of investing in these contracts. Upon entering into a futures contract, the Portfolio is required to pledge to the broker or futures commission merchant an amount of cash and/or U.S. government securities equal to a certain percentage of the collateral amount, known as the “initial margin.” During the period the futures contract is open, changes in the value of the contract are recognized as unrealized appreciation or depreciation by marking to market such contract on a daily basis to reflect the market value of the contract at the end of each day’s trading. The Portfolio agrees to receive from or pay to the broker or futures commission merchant an amount of cash equal to the daily fluctuation in the value of the contract. Such receipts or payments are known as “variation margin.” When the futures contract is closed, the Portfolio records a realized gain or loss equal to the difference between the proceeds from (or cost of) the closing transaction and the Portfolio's basis in the contract.
The use of futures contracts involves, to varying degrees, elements of market risk in excess of the amount recognized in the Statement of Assets and Liabilities. The contract or notional amounts and variation margin reflect the extent of the Portfolio's involvement in open futures positions. There are several risks associated with the use of futures contracts as hedging techniques. There can be no assurance that a liquid market will exist at the time when the Portfolio seeks to close out a futures contract. If no liquid market exists, the Portfolio would remain obligated to meet margin requirements until the position is closed. Futures contracts may involve a small initial investment relative to the risk assumed, which could result in losses greater than if the Portfolio did not invest in futures contracts. Futures contracts may be more volatile than direct investments in the instrument underlying the futures and may not correlate to the underlying instrument, causing a given hedge not to achieve its objectives. The Portfolio's activities in futures contracts have minimal counterparty risk as they are conducted through regulated exchanges that guarantee the futures against default by the counterparty. In the event of a bankruptcy or insolvency of a futures commission merchant that holds margin on behalf of the Portfolio, the Portfolio may not be entitled to the return of the entire margin owed to the Portfolio, potentially resulting in a loss. The Portfolio may invest in futures contracts to seek enhanced returns or to reduce the risk of loss by hedging certain of its holdings. The Portfolio's investment in futures contracts and other derivatives may increase the volatility of the Portfolio's NAVs and may
result in a loss to the Portfolio. Open futures contracts as of December 31, 2022, are shown in the Portfolio of Investments.
(H) Securities Lending. In order to realize additional income, the Portfolio may engage in securities lending, subject to the limitations set forth in the 1940 Act and relevant guidance by the staff of the Securities and Exchange Commission (“SEC”). If the Portfolio engages in securities lending, the Portfolio will lend through its custodian, JPMorgan Chase Bank, N.A., ("JPMorgan"), acting as securities lending agent on behalf of the Portfolio. Under the current arrangement, JPMorgan will manage the Portfolio's collateral in accordance with the securities lending agency agreement between the Portfolio and JPMorgan, and indemnify the Portfolio against counterparty risk. The loans will be collateralized by cash (which may be invested in a money market fund) and/or non-cash collateral (which may include U.S. Treasury securities and/or U.S. government agency securities issued or guaranteed by the United States government or its agencies or instrumentalities) at least equal at all times to the market value of the securities loaned. Non-cash collateral held at year end is segregated and cannot be transferred by the Portfolio. The Portfolio bears the risk of delay in recovery of, or loss of rights in, the securities loaned. The Portfolio may also record a realized gain or loss on securities deemed sold due to a borrower’s inability to return securities on loan. The Portfolio bears the risk of any loss on investment of cash collateral. The Portfolio will receive compensation for lending its securities in the form of fees or it will retain a portion of interest earned on the investment of any cash collateral. The Portfolio will also continue to receive interest and dividends on the securities loaned and any gain or loss in the market price of the securities loaned that may occur during the term of the loan will be for the account of the Portfolio. Income earned from securities lending activities, if any, is reflected in the Statement of Operations. Securities on loan as of December 31, 2022, are shown in the Portfolio of Investments.
(I) Securities Risk. The ability of issuers of debt securities held by the Portfolio to meet their obligations may be affected by, among other things, economic or political developments in a specific country, industry or region. Debt securities are also subject to the risks associated with changes in interest rates.
(J) Indemnifications. Under the Fund’s organizational documents, its officers and trustees are indemnified against certain liabilities that may arise out of performance of their duties to the Fund. Additionally, in the normal course of business, the Portfolio enters into contracts with third-party service providers that contain a variety of representations and warranties and that may provide general indemnifications. The Portfolio's maximum exposure under these arrangements is unknown, as this would involve future claims that may be made against the Portfolio that have not yet occurred. The Manager believes that the risk of loss in connection with these potential indemnification obligations is remote. However, there can be no assurance that material liabilities related to such obligations will not arise in the future, which could adversely impact the Portfolio.
Notes to Financial Statements (continued)
(K) Quantitative Disclosure of Derivative Holdings. The following tables show additional disclosures related to the Portfolio's derivative and hedging activities, including how such activities are accounted for and their effect on the Portfolio's financial positions, performance and cash flows.
The Portfolio entered into futures contracts to manage its exposure to the securities markets or to movements in interest rates and currency values.
Fair value of derivative instruments as of December 31, 2022:
| Liability Derivatives | Equity
Contracts
Risk | Total |
| Futures Contracts - Net Assets—Net unrealized depreciation on futures contracts (a) | $(814,725) | $(814,725) |
| Total Fair Value | $(814,725) | $(814,725) |
| (a) | Includes cumulative appreciation (depreciation) of futures contracts as reported in the Portfolio of Investments. Only current day’s variation margin is reported within the Statement of Assets and Liabilities. |
The effect of derivative instruments on the Statement of Operations for the year ended December 31, 2022:
| Net Realized Gain (Loss) from: | Equity
Contracts
Risk | Total |
| Futures Contracts | $(3,263,378) | $(3,263,378) |
| Total Net Realized Gain (Loss) | $(3,263,378) | $(3,263,378) |
| Net Change in Unrealized Appreciation (Depreciation) | Equity
Contracts
Risk | Total |
| Futures Contracts | $(909,668) | $(909,668) |
| Total Net Change in Unrealized Appreciation (Depreciation) | $(909,668) | $(909,668) |
| Average Notional Amount | Total |
| Futures Contracts Long | $22,648,371 |
Note 3–Fees and Related Party Transactions
(A) Manager and Subadvisor. New York Life Investments, a registered investment adviser and an indirect, wholly-owned subsidiary of New York Life, serves as the Portfolio's Manager, pursuant to an Amended and Restated Management Agreement ("Management Agreement"). The Manager provides offices, conducts clerical, recordkeeping and bookkeeping services and keeps most of the financial and accounting records required to be maintained by the Portfolio. Except for the portion of salaries and expenses that are the responsibility of the Portfolio, the Manager pays the salaries and expenses of all personnel affiliated with the Portfolio and certain operational expenses of the Portfolio. During a portion of the year ended December 31, 2022, the Portfolio reimbursed New York Life Investments in an amount equal to the portion of the
compensation of the Chief Compliance Officer attributable to the Portfolio. The Portfolio’s subadvisor changed effective June 10, 2022, due to the replacement of MacKay Shields LLC ("MacKay Shields") as the Portfolio’s subadvisor and the appointment of IndexIQ Advisors LLC (“IndexIQ” or the “Subadvisor”) as the Portfolio’s subadvisor. The Portfolio's portfolio manager did not change due to the change in subadvisor. IndexIQ, a registered investment adviser and an affiliate of New York Life Investments, is responsible for the day-to-day portfolio management of the Portfolio. Pursuant to the terms of an Amended and Restated Subadvisory Agreement between New York Life Investments and IndexIQ, New York Life Investments pays for the services of the Subadvisor.
Pursuant to the Management Agreement, the Fund pays the Manager, on behalf of the Portfolio, a monthly fee for the services performed and the facilities furnished at an annual rate of the Portfolio's average daily net assets as follows: 0.16% up to $2.5 billion; and 0.15% in excess of $2.5 billion. During the year ended December 31, 2022, the effective management fee rate was 0.16% (exclusive of any applicable waivers/reimbursements).
New York Life Investments has contractually agreed to waive fees and/or reimburse expenses so that the Total Annual Portfolio Operating Expenses (excluding taxes, interest, litigation, extraordinary expenses, brokerage and other transaction expenses relating to the purchase or sale of portfolio investments, and acquired (underlying) portfolio/fund fees and expenses) of Initial Class shares and Service Class shares do not exceed 0.12% and 0.37%, respectively, of the Portfolio's average daily net assets. This agreement will remain in effect until May 1, 2023, and shall renew automatically for one-year terms unless New York Life Investments provides written notice of termination prior to the start of the next term or upon approval of the Board.
During the year ended December 31, 2022, New York Life Investments earned fees from the Portfolio in the amount of $5,072,882 and waived fees and/or reimbursed expenses in the amount of $2,307,574 and paid MacKay Shields and IndexIQ fees of $705,793 and $676,861, respectively.
JPMorgan provides sub-administration and sub-accounting services to the Portfolio pursuant to an agreement with New York Life Investments. These services include calculating the daily NAVs of the Portfolio, maintaining the general ledger and sub-ledger accounts for the calculation of the Portfolio's NAVs, and assisting New York Life Investments in conducting various aspects of the Portfolio's administrative operations. For providing these services to the Portfolio, JPMorgan is compensated by New York Life Investments.
Pursuant to an agreement between the Fund and New York Life Investments, New York Life Investments is responsible for providing or procuring certain regulatory reporting services for the Portfolio. The Portfolio will reimburse New York Life Investments for the actual costs incurred by New York Life Investments in connection with providing or procuring these services for the Portfolio.
| 26 | MainStay VP S&P 500 Index Portfolio |
(B) Distribution and Service Fees. The Fund, on behalf of the Portfolio, has entered into a distribution agreement with NYLIFE Distributors LLC (the “Distributor”), an affiliate of New York Life Investments. The Portfolio has adopted a distribution plan (the “Plan”) in accordance with the provisions of Rule 12b-1 under the 1940 Act. Under the Plan, the Distributor has agreed to provide, through its affiliates or independent third parties, various distribution-related, shareholder and administrative support services to the Service Class shareholders. For its services, the Distributor is entitled to a combined distribution and service fee accrued daily and paid monthly at an annual rate of 0.25% of the average daily net assets attributable to the Service Class shares of the Portfolio.
Note 4-Federal Income Tax
As of December 31, 2022, the cost and unrealized appreciation (depreciation) of the Portfolio’s investment portfolio, including applicable derivative contracts and other financial instruments, as determined on a federal income tax basis, were as follows:
| | Federal Tax
Cost | Gross
Unrealized
Appreciation | Gross
Unrealized
(Depreciation) | Net
Unrealized
Appreciation/
(Depreciation) |
| Investments in Securities | $1,049,186,064 | $2,015,581,668 | $(64,330,625) | $1,951,251,043 |
As of December 31, 2022, the components of accumulated gain (loss) on a tax basis were as follows:
Ordinary
Income | Accumulated
Capital
and Other
Gain (Loss) | Other
Temporary
Differences | Unrealized
Appreciation
(Depreciation) | Total
Accumulated
Gain (Loss) |
| $43,104,254 | $53,015,047 | $176,295 | $1,951,251,043 | $2,047,546,639 |
The difference between book-basis and tax-basis unrealized appreciation (depreciation) is primarily due to wash sale adjustments, mark to market of futures contracts, and centurylink return of capital. The other temporary differences are primarily due to deferred dividends from real estate investment trusts (“REITs”).
During the years ended December 31, 2022 and December 31, 2021, the tax character of distributions paid as reflected in the Statements of Changes in Net Assets was as follows:
| | 2022 | 2021 |
| Distributions paid from: | | |
| Ordinary Income | $ 88,524,568 | $56,145,964 |
| Long-Term Capital Gains | 53,199,954 | 20,600,941 |
| Total | $141,724,522 | $76,746,905 |
Note 5–Custodian
JPMorgan is the custodian of cash and securities held by the Portfolio. Custodial fees are charged to the Portfolio based on the Portfolio's net assets and/or the market value of securities held by the Portfolio and the number of certain transactions incurred by the Portfolio.
Note 6–Line of Credit
The Portfolio and certain other funds managed by New York Life Investments maintain a line of credit with a syndicate of banks in order to secure a source of funds for temporary purposes to meet unanticipated or excessive redemption requests.
Effective July 26, 2022, under the credit agreement (the “Credit Agreement”), the aggregate commitment amount is $600,000,000 with an additional uncommitted amount of $100,000,000. The commitment fee is an annual rate of 0.15% of the average commitment amount payable quarterly, regardless of usage, to JPMorgan, who serves as the agent to the syndicate. The commitment fee is allocated among the Portfolio and certain other funds managed by New York Life Investments based upon their respective net assets and other factors. Interest on any revolving credit loan is charged based upon the Federal Funds Rate, Daily Simple Secured Overnight Financing Rate ("SOFR") + 0.10%, or the Overnight Bank Funding Rate, whichever is higher. The Credit Agreement expires on July 25, 2023, although the Portfolio, certain other funds managed by New York Life Investments and the syndicate of banks may renew the Credit Agreement for an additional year on the same or different terms or enter into a credit agreement with a different syndicate of banks. Prior to July 26, 2022, the aggregate commitment amount and the commitment fee were the same as those under the current Credit Agreement. During the year ended December 31, 2022, there were no borrowings made or outstanding with respect to the Portfolio under the Credit Agreement.
Note 7–Interfund Lending Program
Pursuant to an exemptive order issued by the SEC, the Portfolio, along with certain other funds managed by New York Life Investments, may participate in an interfund lending program. The interfund lending program provides an alternative credit facility that permits the Portfolio and certain other funds managed by New York Life Investments to lend or borrow money for temporary purposes directly to or from one another, subject to the conditions of the exemptive order. During the year ended December 31, 2022, there were no interfund loans made or outstanding with respect to the Portfolio.
Note 8–Purchases and Sales of Securities (in 000’s)
During the year ended December 31, 2022, purchases and sales of securities, other than short-term securities, were $66,955 and $181,615, respectively.
Notes to Financial Statements (continued)
Note 9–Capital Share Transactions
Transactions in capital shares for the years ended December 31, 2022 and December 31, 2021, were as follows:
| Initial Class | Shares | Amount |
| Year ended December 31, 2022: | | |
| Shares sold | 460,168 | $ 34,910,174 |
| Shares issued to shareholders in reinvestment of distributions | 934,676 | 62,047,386 |
| Shares redeemed | (2,599,133) | (206,953,691) |
| Net increase (decrease) | (1,204,289) | $(109,996,131) |
| Year ended December 31, 2021: | | |
| Shares sold | 1,447,144 | $ 111,542,140 |
| Shares issued to shareholders in reinvestment of distributions | 455,821 | 37,666,492 |
| Shares redeemed | (6,961,317) | (569,084,066) |
| Net increase (decrease) | (5,058,352) | $(419,875,434) |
| |
| Service Class | Shares | Amount |
| Year ended December 31, 2022: | | |
| Shares sold | 3,369,175 | $ 256,381,937 |
| Shares issued to shareholders in reinvestment of distributions | 1,211,573 | 79,677,136 |
| Shares redeemed | (2,748,435) | (210,679,983) |
| Net increase (decrease) | 1,832,313 | $ 125,379,090 |
| Year ended December 31, 2021: | | |
| Shares sold | 3,147,547 | $ 252,468,655 |
| Shares issued to shareholders in reinvestment of distributions | 477,391 | 39,080,413 |
| Shares redeemed | (3,266,373) | (262,592,622) |
| Net increase (decrease) | 358,565 | $ 28,956,446 |
Note 10–Other Matters
As of the date of this report, interest rates in the United States and many parts of the world, including certain European countries, are ascending from historically low levels. Thus, the Portfolio currently faces a heightened level of risk associated with rising interest rates. This could be driven by a variety of factors, including but not limited to central bank monetary policies, changing inflation or real growth rates, general economic conditions, increasing bond issuances or reduced market demand for low yielding investments.
An outbreak of COVID-19, first detected in December 2019, has developed into a global pandemic and has resulted in travel restrictions, closure of international borders, certain businesses and securities markets, restrictions on securities trading activities, prolonged quarantines, supply chain disruptions, and lower consumer demand, as well as general concern and uncertainty. In 2022, many countries lifted some or all restrictions related to COVID-19. However, the continued impact of COVID-19 and related variants is uncertain and could further adversely affect the global economy, national economies, individual issuers and capital markets in unforeseeable ways and result in a
substantial and extended economic downturn. Developments that disrupt global economies and financial markets, such as COVID-19, may magnify factors that affect the Portfolio's performance.
Note 11–Subsequent Events
In connection with the preparation of the financial statements of the Portfolio as of and for the year ended December 31, 2022, events and transactions subsequent to December 31, 2022, through the date the financial statements were issued have been evaluated by the Manager for possible adjustment and/or disclosure. No subsequent events requiring financial statement adjustment or disclosure have been identified.
| 28 | MainStay VP S&P 500 Index Portfolio |
Report of Independent Registered Public Accounting Firm
To the Board of Trustees of MainStay VP Funds Trust and Shareholders of
MainStay VP S&P 500 Index Portfolio (formerly known as MainStay VP MacKay S&P 500 Index Portfolio)
Opinion on the Financial Statements
We have audited the accompanying statement of assets and liabilities, including the portfolio of investments, of MainStay VP S&P 500 Index Portfolio (one of the portfolios constituting MainStay VP Funds Trust, referred to hereafter as the “Portfolio”) as of December 31, 2022, the related statement of operations for the year ended December 31, 2022, the statements of changes in net assets for each of the two years in the period ended December 31, 2022, including the related notes, and the financial highlights for each of the five years in the period ended December 31, 2022 (collectively referred to as the “financial statements”). In our opinion, the financial statements present fairly, in all material respects, the financial position of the Portfolio as of December 31, 2022, the results of its operations for the year then ended, the changes in its net assets for each of the two years in the period ended December 31, 2022 and the financial highlights for each of the five years in the period ended December 31, 2022 in conformity with accounting principles generally accepted in the United States of America.
Basis for Opinion
These financial statements are the responsibility of the Portfolio’s management. Our responsibility is to express an opinion on the Portfolio’s financial statements based on our audits. We are a public accounting firm registered with the Public Company Accounting Oversight Board (United States) (PCAOB) and are required to be independent with respect to the Portfolio in accordance with the U.S. federal securities laws and the applicable rules and regulations of the Securities and Exchange Commission and the PCAOB.
We conducted our audits of these financial statements in accordance with the standards of the PCAOB. Those standards require that we plan and perform the audit to obtain reasonable assurance about whether the financial statements are free of material misstatement, whether due to error or fraud.
Our audits included performing procedures to assess the risks of material misstatement of the financial statements, whether due to error or fraud, and performing procedures that respond to those risks. Such procedures included examining, on a test basis, evidence regarding the amounts and disclosures in the financial statements. Our audits also included evaluating the accounting principles used and significant estimates made by management, as well as evaluating the overall presentation of the financial statements. Our procedures included confirmation of securities owned as of December 31, 2022 by correspondence with the custodian, transfer agents and brokers. We believe that our audits provide a reasonable basis for our opinion.
/s/PricewaterhouseCoopers LLP
New York, New York
February 24, 2023
We have served as the auditor of one or more investment companies in the MainStay group of funds since 1984.
Board Consideration and Approval of Management Agreement and Subadvisory Agreement (Unaudited)
The continuation of the Management Agreement with respect to the MainStay VP S&P 500 Index Portfolio (“Portfolio”) and New York Life Investment Management LLC (“New York Life Investments”) and the Subadvisory Agreement between New York Life Investments and IndexIQ Advisors LLC (“IndexIQ”) with respect to the Portfolio (together, “Advisory Agreements”) is subject to annual review and approval by the Board of Trustees of MainStay VP Funds Trust (“Board” of the “Trust”) in accordance with Section 15 of the Investment Company Act of 1940, as amended (“1940 Act”). At its December 6–7, 2022 meeting, the Board, which is comprised solely of Trustees who are not an “interested person” (as such term is defined in the 1940 Act) of the Trust (“Independent Trustees”), unanimously approved the continuation of each of the Advisory Agreements for a one-year period.
In reaching the decision to approve the continuation of each of the Advisory Agreements, the Board considered information and materials furnished by New York Life Investments and IndexIQ in connection with an annual contract review process undertaken by the Board that took place at meetings of the Board and its Contracts Committee during October 2022 through December 2022, including information and materials furnished by New York Life Investments and IndexIQ in response to requests prepared on behalf of the Board, and in consultation with the Board, by independent legal counsel to the Independent Trustees, which encompassed a variety of topics, including those summarized below. Information and materials requested by and furnished to the Board for consideration in connection with the contract review process included, among other items, reports on the Portfolio and “peer funds” prepared by Institutional Shareholder Services Inc. (“ISS”), an independent third-party service provider engaged by the Board to report objectively on the Portfolio’s investment performance, management fee and total expenses. The Board also considered information on the fees charged to other investment advisory clients of New York Life Investments and/or IndexIQ that follow investment strategies similar to those of the Portfolio, if any, and, when applicable, the rationale for any differences in the Portfolio’s management and subadvisory fees and the fees charged to those other investment advisory clients. In addition, the Board considered information regarding the legal standards and fiduciary obligations applicable to its consideration of the continuation of each of the Advisory Agreements. The contract review process, including the structure and format for information and materials provided to the Board, has been developed in consultation with the Board. The Independent Trustees also met in executive sessions with their independent legal counsel and, for portions thereof, with senior management of New York Life Investments.
The Board’s deliberations with respect to the continuation of each of the Advisory Agreements reflect a year-long process, and the Board also took into account information furnished to the Board and its Committees throughout the year, as deemed relevant and appropriate by the Trustees, including, among other items, reports on investment performance of the Portfolio and investment-related matters for the Portfolio as well as presentations from New York Life Investments and, generally annually, IndexIQ personnel. In addition, the Board took into account other information received from New York Life Investments throughout the year,
including, among other items, periodic reports on legal and compliance matters, risk management, portfolio turnover, brokerage commissions and non-advisory services provided to the Portfolio by New York Life Investments, as deemed relevant and appropriate by the Trustees.
In addition to information provided to the Board throughout the year, the Board received information in connection with its June 2022 meeting provided specifically in response to requests prepared on behalf of the Board, and in consultation with the Board, by independent legal counsel to the Independent Trustees regarding the Portfolio’s distribution arrangements. In addition, the Board received information regarding the Portfolio’s asset levels, share purchase and redemption activity and the payment of Rule 12b-1 and/or other fees by applicable share classes of the Portfolio, among other information.
In considering the continuation of each of the Advisory Agreements, the Trustees reviewed and evaluated the information and factors they believed to reasonably be necessary and appropriate in light of legal advice furnished to them by independent legal counsel to the Independent Trustees and through the exercise of their own business judgment. Although individual Trustees may have weighed certain factors or information differently and the Board did not consider any single factor or information controlling in reaching its decision, the factors considered by the Board are summarized in more detail below and include, among other factors: (i) the nature, extent and quality of the services provided to the Portfolio by New York Life Investments and IndexIQ; (ii) the qualifications of the portfolio manager of the Portfolio and the historical investment performance of the Portfolio, New York Life Investments and IndexIQ; (iii) the costs of the services provided, and profits realized, by New York Life Investments and IndexIQ with respect to their relationships with the Portfolio; (iv) the extent to which economies of scale have been realized or may be realized if the Portfolio grows and the extent to which any economies of scale have been shared, have benefited or may benefit the Portfolio’s shareholders; and (v) the reasonableness of the Portfolio’s management and subadvisory fees and total ordinary operating expenses. Although the Board recognized that comparisons between the Portfolio’s fees and expenses and those of other funds are imprecise given different terms of agreements, variations in fund strategies and other factors, the Board considered the reasonableness of the Portfolio’s management fee and total ordinary operating expenses as compared to the peer funds identified by ISS. Throughout their considerations, the Trustees acknowledged the commitment of New York Life Investments and its affiliates to serve the MainStay Group of Funds, as well as their capacity, experience, resources, financial stability and reputations. The Trustees also acknowledged the entrepreneurial and other risks assumed by New York Life Investments in sponsoring and managing the Portfolio. With respect to the Subadvisory Agreement, the Board took into account New York Life Investments’ recommendation to approve the continuation of the Subadvisory Agreement.
The Trustees noted that, throughout the year, the Trustees are afforded an opportunity to ask questions of, and request additional information or materials from, New York Life Investments and IndexIQ. The Board’s decision with respect to each of the Advisory Agreements may have also
| 30 | MainStay VP S&P 500 Index Portfolio |
been based, in part, on the Board’s knowledge of New York Life Investments and IndexIQ resulting from, among other things, the Board’s consideration of each of the Advisory Agreements in prior years, the advisory agreements for other funds in the MainStay Group of Funds, the Board’s review throughout the year of the performance and operations of other funds in the MainStay Group of Funds and each Trustee’s business judgment and industry experience. In addition to considering the above-referenced factors, the Board observed that in the marketplace, notably under variable life insurance policies and variable annuity contracts for which the Portfolio serves as an investment option, there are a range of investment options available to investors and that the Portfolio’s shareholders, having had the opportunity to consider other investment options, have chosen to invest in the Portfolio.
The factors that figured prominently in the Board’s decision to approve the continuation of each of the Advisory Agreements during its December 6–7, 2022 meeting are summarized in more detail below.
Nature, Extent and Quality of Services Provided by New York Life Investments and IndexIQ
The Board examined the nature, extent and quality of the services that New York Life Investments provides to the Portfolio. The Board evaluated New York Life Investments’ experience and capabilities in serving as manager of the Portfolio and considered that the Portfolio operates in a “manager-of-managers” structure. The Board also considered New York Life Investments’ responsibilities and services provided pursuant to this structure, including overseeing the services provided by IndexIQ, evaluating the performance of IndexIQ, making recommendations to the Board as to whether the Subadvisory Agreement should be renewed, modified or terminated and periodically reporting to the Board regarding the results of New York Life Investments’ evaluation and monitoring functions. The Board noted that New York Life Investments manages other mutual funds, serves a variety of other investment advisory clients, including other pooled investment vehicles, and has experience overseeing mutual fund service providers, including subadvisors. The Board considered the experience of senior personnel at New York Life Investments providing management and administrative and other non-advisory services to the Portfolio. The Board observed that New York Life Investments devotes significant resources and time to providing management and administrative and other non-advisory services to the Portfolio, including New York Life Investments’ oversight and due diligence reviews of IndexIQ and ongoing analysis of, and interactions with, IndexIQ with respect to, among other things, the Portfolio’s investment performance and risks as well as IndexIQ’s investment capabilities and subadvisory services with respect to the Portfolio.
The Board also considered the range of services that New York Life Investments provides to the Portfolio under the terms of the Management Agreement, including: (i) fund accounting and ongoing supervisory services provided by New York Life Investments’ Fund Administration and Accounting Group; (ii) investment supervisory and analytical services provided by New York Life Investments’ Investment Consulting Group; (iii) compliance services provided by the Trust’s Chief Compliance Officer as
well as New York Life Investments’ compliance department, including supervision and implementation of the Portfolio’s compliance program; (iv) legal services provided by New York Life Investments’ Office of the General Counsel; and (v) risk management monitoring and analysis by compliance and investment personnel. In addition, the Board considered New York Life Investments’ willingness to invest in personnel and other resources, such as cyber security, information security and business continuity planning, designed to benefit the Portfolio and noted that New York Life Investments is responsible for compensating the Trust’s officers, except for a portion of the salary of the Trust’s Chief Compliance Officer. The Board recognized that New York Life Investments provides certain other non-advisory services to the Portfolio and has provided an increasingly broad array of non-advisory services to the MainStay Group of Funds as a result of regulatory and other developments, including in connection with the implementation of the MainStay Group of Funds’ derivatives risk management program and policies and procedures adopted pursuant to Rule 18f-4 under the 1940 Act.
The Board also examined the range, and the nature, extent and quality, of the investment advisory services that IndexIQ provides to the Portfolio and considered the terms of each of the Advisory Agreements. The Board evaluated IndexIQ’s experience and performance in serving as subadvisor to the Portfolio and advising other portfolios and IndexIQ’s track record and experience in providing investment advisory services, the experience of investment advisory, senior management and administrative personnel at IndexIQ. The Board considered New York Life Investments’ and IndexIQ’s overall resources, legal and compliance environment, capabilities, reputation, financial condition and history. In addition to information provided in connection with quarterly meetings with the Trust’s Chief Compliance Officer, the Board considered information regarding the compliance policies and procedures of New York Life Investments and IndexIQ and acknowledged their commitment to further developing and strengthening compliance programs relating to the Portfolio. The Board also considered IndexIQ’s ability to recruit and retain qualified investment professionals and willingness to invest in personnel and other resources to service and support the Portfolio. In this regard, the Board considered the qualifications and experience of the Portfolio’s portfolio manager, the number of accounts managed by the portfolio manager and the method for compensating the portfolio manager. The Board considered its discussions with representatives from New York Life Investments regarding the portfolio manager’s transition from a previous subadvisor to IndexIQ, effective June 10, 2022.
In addition, the Board considered information provided by New York Life Investments and IndexIQ regarding the operations of their respective business continuity plans in response to the COVID-19 pandemic and the continued remote work environment.
Based on these considerations, among others, the Board concluded that the Portfolio would likely continue to benefit from the nature, extent and quality of these services.
Board Consideration and Approval of Management Agreement and Subadvisory Agreement (Unaudited) (continued)
Investment Performance
In evaluating the Portfolio’s investment performance, the Board considered investment performance results over various periods in light of the Portfolio’s investment objective, strategies and risks. The Board considered investment reports on, and analysis of, the Portfolio’s performance provided to the Board throughout the year. These reports include, among other items, information on the Portfolio’s gross and net returns, the Portfolio’s investment performance compared to a relevant investment category and the Portfolio’s benchmark, the Portfolio’s risk-adjusted investment performance and the Portfolio’s investment performance as compared to peer funds, as appropriate, as well as portfolio attribution information and commentary on the effect of market conditions. The Board also considered information provided by ISS showing the investment performance of the Portfolio as compared to peer funds. In addition, the Board reviewed the methodology used by ISS to construct the group of peer funds for comparative purposes.
The Board also took into account its discussions with senior management at New York Life Investments concerning the Portfolio’s investment performance over various periods as well as discussions between the Portfolio’s portfolio management team and the members of the Board’s Investment Committee, which generally occur on an annual basis. In addition, the Board considered any specific actions that New York Life Investments or IndexIQ had taken, or had agreed to take, to seek to enhance Portfolio investment performance and the results of those actions. Based on these considerations, among others, the Board concluded that its review of the Portfolio’s investment performance and related information supported a determination to approve the continuation of each of the Advisory Agreements.
Costs of the Services Provided, and Profits and Other Benefits Realized, by New York Life Investments and IndexIQ
The Board considered the costs of the services provided under each of the Advisory Agreements. The Board also considered the profits realized by New York Life Investments and its affiliates, including IndexIQ, due to their relationships with the Portfolio as well as the MainStay Group of Funds. Because IndexIQ is an affiliate of New York Life Investments whose subadvisory fee is paid by New York Life Investments, not the Portfolio, the Board considered cost and profitability information for New York Life Investments and IndexIQ in the aggregate.
In addition, the Board acknowledged the difficulty in obtaining reliable comparative data about mutual fund managers’ profitability because such information generally is not publicly available and may be impacted by numerous factors, including the structure of a fund manager’s organization, the types of funds it manages, the methodology used to allocate certain fixed costs to specific funds and the manager’s capital structure and costs of capital.
In evaluating the costs of the services provided by New York Life Investments and IndexIQ and profits realized by New York Life Investments and its affiliates, including IndexIQ, the Board considered, among other factors, New York Life Investments’ and its affiliates’,
including IndexIQ’s, continuing investments in, or willingness to invest in, personnel and other resources to support and further enhance the management of the Portfolio, and that New York Life Investments is responsible for paying the subadvisory fee for the Portfolio. The Board also considered the financial resources of New York Life Investments and IndexIQ and acknowledged that New York Life Investments and IndexIQ must be in a position to recruit and retain experienced professional personnel and to maintain a strong financial position for New York Life Investments and IndexIQ to continue to provide high-quality services to the Portfolio. The Board recognized that the Portfolio benefits from the allocation of certain fixed costs among the funds in the MainStay Group of Funds, among other expected benefits resulting from its relationship with New York Life Investments.
The Board considered information regarding New York Life Investments’ methodology for calculating profitability and allocating costs provided by New York Life Investments in connection with the fund profitability analysis presented to the Board. The Board noted it had previously engaged an independent consultant to review the methods used to allocate costs among the funds in the MainStay Group of Funds. The Board also noted that the independent consultant had concluded that New York Life Investments’ methods for allocating costs and procedures for estimating overall profitability of the relationship with the funds in the MainStay Group of Funds are reasonable and that New York Life Investments continued to use the same method of calculating profit and allocating costs since the independent consultant’s review. The Board recognized the difficulty in calculating and evaluating a manager’s profitability with respect to the Portfolio and considered that other profitability methodologies may also be reasonable.
The Board also considered certain fall-out benefits that may be realized by New York Life Investments and its affiliates due to their relationships with the Portfolio, including reputational and other indirect benefits. The Board recognized, for example, the benefits to IndexIQ from legally permitted “soft-dollar” arrangements by which brokers provide research and other services to IndexIQ in exchange for commissions paid by the Portfolio with respect to trades in the Portfolio’s portfolio securities. In addition, the Board considered its review of the management agreement for a money market fund advised by New York Life Investments and an affiliated subadvisor that serves as an investment option for the Portfolio, including the potential rationale for and costs associated with investments in this money market fund by the Portfolio, if any, and considered information from New York Life Investments that the nature and type of specific investment advisory services provided to this money market fund are distinct from, or in addition to, the investment advisory services provided to the Portfolio. In addition, the Board considered the potential dividend received tax deduction for insurance company affiliates of New York Life Investments from the Portfolio’s securities lending activity.
The Board noted that the Portfolio serves as an investment option primarily under variable contracts issued by affiliates of New York Life Investments that would receive fees under those contracts. The Board observed that, in addition to fees earned by New York Life Investments under the Management Agreement for managing the Portfolio, New York
| 32 | MainStay VP S&P 500 Index Portfolio |
Life Investments’ affiliates also earn revenues from serving the Portfolio in various other capacities, including as the Portfolio’s distributor. The Board considered information about these other revenues and their impact on the profitability of the relationship with the Portfolio to New York Life Investments and its affiliates. The Board noted that, although it assessed the overall profitability of the relationship with the Portfolio to New York Life Investments and its affiliates as part of the contract review process, when considering the reasonableness of the fee paid to New York Life Investments under the Management Agreement, the Board considered the profitability of New York Life Investments’ relationship with the Portfolio on a pre-tax basis and without regard to distribution expenses incurred by New York Life Investments from its own resources.
After evaluating the information deemed relevant by the Trustees, the Board concluded that any profits realized by New York Life Investments and its affiliates, including IndexIQ, due to their relationships with the Portfolio were not excessive and other benefits that may accrue to New York Life Investments and its affiliates, including IndexIQ, are reasonable.
Management and Subadvisory Fees and Total Ordinary Operating Expenses
The Board evaluated the reasonableness of the fee paid under each of the Advisory Agreements and the Portfolio’s total ordinary operating expenses. The Board primarily considered the reasonableness of the management fee paid by the Portfolio to New York Life Investments because the subadvisory fee paid to IndexIQ is paid by New York Life Investments, not the Portfolio. The Board also considered the reasonableness of the subadvisory fee paid by New York Life Investments and the amount of the management fee retained by New York Life Investments.
In assessing the reasonableness of the Portfolio’s fees and expenses, the Board primarily considered comparative data provided by ISS on the fees and expenses charged by similar mutual funds managed by other investment advisers. The Board reviewed the methodology used by ISS to construct the group of peer funds for comparative purposes. In addition, the Board considered information provided by New York Life Investments and IndexIQ on fees charged to other investment advisory clients, including institutional separate accounts and/or other funds that follow investment strategies similar to those of the Portfolio, if any. The Board considered the contractual management fee schedules of the Portfolio as compared to those of such other investment advisory clients, taking into account the rationale for any differences in fee schedules. The Board also took into account information provided by New York Life Investments about the more extensive scope of services provided to registered investment companies, such as the Portfolio, as compared with other investment advisory clients. Additionally, the Board considered the impact of contractual breakpoints and expense limitation arrangements on the Portfolio’s net management fee and expenses. The Board also considered that in proposing fees for the Portfolio, New York Life Investments considers the competitive marketplace for mutual funds.
Based on the factors outlined above, among other considerations, the Board concluded that the Portfolio’s management fee and total ordinary operating expenses are within a range that is competitive and support a conclusion that these fees and expenses are reasonable.
Economies of Scale
The Board considered information regarding economies of scale, including whether economies of scale may exist for the Portfolio and whether the Portfolio’s expense structure permits any economies of scale to be appropriately shared with the Portfolio’s beneficial shareholders. The Board also considered a report from New York Life Investments, previously prepared at the request of the Board, that addressed economies of scale, including with respect to the mutual fund business generally, and the various ways in which the benefits of economies of scale may be shared with the funds in the MainStay Group of Funds. Although the Board recognized the difficulty of determining economies of scale with precision, the Board acknowledged that economies of scale may be shared with the Portfolio in a number of ways, including, for example, through the imposition of fee breakpoints, initially setting management fee rates at scale or making additional investments to enhance the services provided to the Portfolio. The Board reviewed information from New York Life Investments showing how the Portfolio’s management fee schedule compared to fee schedules of other funds and accounts managed by New York Life Investments. The Board also reviewed information from ISS showing how the Portfolio’s management fee schedule compared with fees paid for similar services by peer funds at varying asset levels.
Based on this information, the Board concluded that economies of scale are appropriately reflected for the benefit of the Portfolio’s beneficial shareholders through the Portfolio’s expense structure and other methods to share benefits from economies of scale.
Conclusion
On the basis of the information and factors summarized above, among other information and factors deemed relevant by the Trustees, and the evaluation thereof, the Board unanimously voted to approve the continuation of each of the Advisory Agreements.
Proxy Voting Policies and Procedures and Proxy Voting Record
The Portfolio is required to file with the SEC its proxy voting record for the 12-month period ending June 30 on Form N-PX. A description of the policies and procedures that are used to vote proxies relating to portfolio securities of the Portfolio is available free of charge upon request by calling 800-598-2019 or visiting the SEC's website at www.sec.gov. The most recent Form N-PX or proxy voting record is available free of charge upon request by calling 800-598-2019; visiting https://www.newyorklifeinvestments.com/investment-products/vp; or visiting the SEC’s website at www.sec.gov.
Shareholder Reports and Quarterly Portfolio Disclosure
The Portfolio is required to file its complete schedule of portfolio holdings with the SEC 60 days after its first and third fiscal quarter on Form N-PORT. The Portfolio's holdings report is available free of charge upon request by calling 800-598-2019 or by visiting the SEC’s website at www.sec.gov.
| 34 | MainStay VP S&P 500 Index Portfolio |
Board of Trustees and Officers (Unaudited)
The Trustees and officers of the Portfolio are listed below. The Board oversees the MainStay Group of Funds (which consists of MainStay Funds and MainStay Funds Trust), MainStay VP Funds Trust, MainStay MacKay DefinedTerm Municipal Opportunities Fund, MainStay CBRE Global Infrastructure Megatrends Fund, the Manager and the Subadvisors, and elects the officers of the Portfolios who are responsible for the day-to-day operations of the Portfolio. Information pertaining to the Trustees and officers is set forth below. Each Trustee serves until his or her successor
is elected and qualified or until his or her resignation, death or removal. Under the Board’s retirement policy, unless an exception is made, a Trustee must tender his or her resignation by the end of the calendar year during which he or she reaches the age of 75. The business address of each Trustee and officer listed below is 51 Madison Avenue, New York, New York 10010. None of the Trustees are “interested persons” (as defined by the 1940 Act and rules adopted by the SEC thereunder) of the Portfolio (“Independent Trustees”).
| | Name and
Year of Birth | Term of Office,
Position(s) Held and
Length of Service | Principal Occupation(s)
During Past Five Years | Number of
Portfolios in
Fund Complex
Overseen by
Trustee | Other Directorships
Held by Trustee |
| | | | | | |
| | David H. Chow
1957 | MainStay VP Funds Trust: Trustee since January 2016, Advisory Board Member (June 2015 to December 2015) | Founder and CEO, DanCourt Management, LLC since 1999 | 78 | MainStay Funds: Trustee since January 2016, Advisory Board Member (June 2015 to December 2015) (12 Funds);
MainStay Funds Trust: Trustee since January 2016, Advisory Board Member (June 2015 to December 2015) (33 Funds);
MainStay MacKay DefinedTerm Municipal Opportunities Fund: Trustee since January 2016, Advisory Board Member (June 2015 to December 2015);
MainStay CBRE Global Infrastructure Megatrends Fund: Trustee since June 2021;VanEck Vectors Group of Exchange-Traded Funds: Independent Chairman of the Board of Trustees since 2008 and Trustee since 2006 (57 portfolios); and Berea College of Kentucky: Trustee since 2009, Chair of the Committee since 2018 |
| | Susan B. Kerley
1951 | MainStay VP Funds Trust: Chairman since 2017 and Trustee since 2007* | President, Strategic Management Advisors LLC since 1990 | 78 | MainStay Funds: Chairman since 2017 and Trustee since 2007 (12 Funds); MainStay Funds Trust: Chairman since 2017 and Trustee since 1990 (33 Funds)**;
MainStay MacKay DefinedTerm Municipal Opportunities Fund: Chairman since 2017 and Trustee since 2011; MainStay CBRE Global Infrastructure Megatrends Fund: Trustee since June 2021; and Legg Mason Partners Funds: Trustee since 1991 (45 portfolios) |
| | Alan R. Latshaw
1951 | MainStay VP Funds Trust: Trustee since 2007* | Retired; Partner, Ernst & Young LLP (2002 to 2003); Partner, Arthur Andersen LLP (1989 to 2002); Consultant to the MainStay Funds Audit and Compliance Committee (2004 to 2006) | 78 | MainStay Funds: Trustee since 2006 (12 Funds);
MainStay Funds Trust: Trustee since 2007 (33 Funds)**;
MainStay MacKay DefinedTerm Municipal Opportunities Fund: Trustee since 2011; and
MainStay CBRE Global Infrastructure Megatrends Fund: Trustee since June 2021 |
Board of Trustees and Officers (Unaudited) (continued)
| | Name and
Year of Birth | Term of Office,
Position(s) Held and
Length of Service | Principal Occupation(s)
During Past Five Years | Number of
Portfolios in
Fund Complex
Overseen by
Trustee | Other Directorships
Held by Trustee |
| | | | | | |
| | Karen Hammond
1956 | MainStay VP Funds Trust: Trustee since December 2021, Advisory Board Member (June 2021 to December 2021)
| Retired, Managing Director, Devonshire Investors (2007 to 2013); Senior Vice President, Fidelity Management & Research Co. (2005 to 2007); Senior Vice President and Corporate Treasurer, FMR Corp. (2003 to 2005); Chief Operating Officer, Fidelity Investments Japan (2001 to 2003) | 78 | MainStay Funds: Trustee since December 2021, Advisory Board Member (June 2021 to December 2021) (12 Funds);
MainStay Funds Trust: Trustee since December 2021, Advisory Board Member (June 2021 to December 2021) (33 Funds);
MainStay MacKay DefinedTerm Municipal Opportunities Fund: Trustee since December 2021, Advisory Board Member (June 2021 to December 2021);
MainStay CBRE Global Infrastructure Megatrends Fund: Trustee since December 2021, Advisory Board Member (June 2021 to December 2021);
Two Harbors Investment Corp.: Director since 2018; Rhode Island State Investment Commission: Member since 2017; and Blue Cross Blue Shield of Rhode Island: Director since 2019
|
| | Jacques P. Perold
1958 | MainStay VP Funds Trust: Trustee since January 2016, Advisory Board Member (June 2015 to December 2015) | Founder and Chief Executive Officer, CapShift Advisors LLC (since 2018); President, Fidelity Management & Research Company (2009 to 2014); President and Chief Investment Officer, Geode Capital Management, LLC (2001 to 2009) | 78 | MainStay Funds: Trustee since January 2016, Advisory Board Member (June 2015 to December 2015) (12 Funds);
MainStay Funds Trust: Trustee since January 2016, Advisory Board Member (June 2015 to December 2015) (33 Funds); MainStay MacKay DefinedTerm Municipal Opportunities Fund: Trustee since January 2016, Advisory Board Member (June 2015 to December 2015);
MainStay CBRE Global Infrastructure Megatrends Fund: Trustee since June 2021; Allstate Corporation: Director since 2015;
Partners in Health: Trustee since 2019; and
MSCI Inc.: Director since 2017 |
| | Richard S. Trutanic
1952 | MainStay VP Funds Trust: Trustee since 2007* | Chairman and Chief Executive Officer, Somerset & Company (financial advisory firm) since 2004; Managing Director, The Carlyle Group (private investment firm) (2002 to 2004); Senior Managing Director, Partner and Board Member, Groupe Arnault S.A. (private investment firm) (1999 to 2002)
| 78 | MainStay Funds: Trustee since 1994 (12 Funds);
MainStay Funds Trust: Trustee since 2007 (33 Funds)**;
MainStay MacKay DefinedTerm Municipal Opportunities Fund: Trustee since 2011; and
MainStay CBRE Global Infrastructure Megatrends Fund: Trustee since June 2021 |
| * | Includes prior service as a Director of MainStay VP Series Fund, Inc., the predecessor to MainStay VP Funds Trust. |
| ** | Includes prior service as a Director/Trustee of certain predecessor entities to MainStay Funds Trust. |
| 36 | MainStay VP S&P 500 Index Portfolio |
| | Name and
Year of Birth | Position(s) Held and
Length of Service | Principal Occupation(s)
During Past Five Years | |
| | | | | |
| | Kirk C. Lehneis
1974 | President, MainStay VP Funds Trust (since 2017) | Chief Operating Officer and Senior Managing Director (since 2016), New York Life Investment Management LLC and New York Life Investment Management Holdings LLC; Member of the Board of Managers (since 2017) and Senior Managing Director (since 2018), NYLIFE Distributors LLC; Chairman of the Board and Senior Managing Director, NYLIM Service Company LLC (since 2017); Trustee, President and Principal Executive Officer of IndexIQ Trust, IndexIQ ETF Trust and IndexIQ Active ETF Trust (since January 2018); President, MainStay CBRE Global Infrastructure Megatrends Fund (since 2021), MainStay MacKay DefinedTerm Municipal Opportunities Fund, MainStay Funds and MainStay Funds Trust (since 2017); Senior Managing Director, Global Product Development (from 2015-2016); Managing Director, Product Development (from 2010-2015), New York Life Investment Management LLC | |
| | Jack R. Benintende
1964 | Treasurer and Principal Financial and Accounting Officer, MainStay VP Funds Trust (since 2007)** | Managing Director, New York Life Investment Management LLC (since 2007); Treasurer and Principal Financial and Accounting Officer, MainStay CBRE Global Infrastructure Megatrends Fund (since 2021), MainStay MacKay DefinedTerm Municipal Opportunities Fund (since 2011), MainStay Funds Trust (since 2009) and MainStay Funds (since 2007); and Assistant Treasurer, New York Life Investment Management Holdings LLC (2008 to 2012) | |
| | J. Kevin Gao
1967 | Secretary and Chief Legal Officer, MainStay VP Funds Trust (since 2010)** | Managing Director and Associate General Counsel, New York Life Investment Management LLC (since 2010); Secretary and Chief Legal Officer, MainStay CBRE Global Infrastructure Megatrends Fund (since 2021), MainStay MacKay DefinedTerm Municipal Opportunities Fund (since 2011), MainStay Funds and MainStay Funds Trust (since 2010) | |
| | Scott T. Harrington
1959 | Vice President— Administration, MainStay VP Funds Trust (since 2005)** | Managing Director, New York Life Investment Management LLC (including predecessor advisory organizations) (since 2000); Member of the Board of Directors, New York Life Trust Company (since 2009); Vice President—Administration, MainStay CBRE Global Infrastructure Megatrends Fund (since 2021), MainStay MacKay DefinedTerm Municipal Opportunities Fund (since 2011), MainStay Funds Trust and MainStay Funds (since 2009) | |
| | Kevin M. Gleason
1967 | Vice President and Chief Compliance Officer, MainStay VP Funds Trust (since June 2022) | Vice President and Chief Compliance Officer, IndexIQ, IndexIQ ETF Trust and Index IQ Active ETF Trust (since June 2022); Vice President and Chief Compliance Officer, MainStay CBRE Global Infrastructure Megatrends Fund, MainStay MacKay DefinedTerm Municipal Opportunities Fund (since June 2022); MainStay Funds Trust and MainStay Funds (since June 2022); Senior Vice President, Voya Investment Management and Chief Compliance Officer, Voya Family of Funds (2012-2022) | |
| * | The officers listed above are considered to be “interested persons” of the MainStay Group of Funds, MainStay VP Funds Trust, MainStay CBRE Global Infrastructure Megatrends Fund and MainStay MacKay DefinedTerm Municipal Opportunities Fund within the meaning of the 1940 Act because of their affiliation with the MainStay Group of Funds, New York Life Insurance Company and/or its affiliates, including New York Life Investment Management LLC, NYLIM Service Company LLC, NYLIFE Securities LLC and/or NYLIFE Distributors LLC, as described in detail in the column captioned “Principal Occupation(s) During Past Five Years.” Officers are elected annually by the Board. |
| ** | Includes prior service as an Officer of MainStay VP Series Fund, Inc., the predecessor to MainStay VP Funds Trust. |
Officers of the Trust (Who are not Trustees)*
This page intentionally left blank
MainStay VP Portfolios
MainStay VP offers a wide range of Portfolios. The full array of MainStay VP offerings is listed here, with information about the manager, subadvisors, legal counsel, and independent registered public accounting firm.
Equity
MainStay VP American Century Sustainable Equity Portfolio1
MainStay VP Candriam Emerging Markets Equity Portfolio
MainStay VP Epoch U.S. Equity Yield Portfolio
MainStay VP Fidelity Institutional AM® Utilities Portfolio†
MainStay VP MacKay International Equity Portfolio
MainStay VP Natural Resources Portfolio
MainStay VP S&P 500 Index Portfolio2
MainStay VP Small Cap Growth Portfolio
MainStay VP Wellington Growth Portfolio
MainStay VP Wellington Mid Cap Portfolio
MainStay VP Wellington Small Cap Portfolio
MainStay VP Wellington U.S. Equity Portfolio
MainStay VP Winslow Large Cap Growth Portfolio
Mixed Asset
MainStay VP Balanced Portfolio
MainStay VP Income Builder Portfolio
MainStay VP Janus Henderson Balanced Portfolio
MainStay VP MacKay Convertible Portfolio
Income
MainStay VP Bond Portfolio
MainStay VP Floating Rate Portfolio
MainStay VP Indexed Bond Portfolio
MainStay VP MacKay Government Portfolio
MainStay VP MacKay High Yield Corporate Bond Portfolio
MainStay VP MacKay Strategic Bond Portfolio
MainStay VP PIMCO Real Return Portfolio
Money Market
MainStay VP U.S. Government Money Market Portfolio
Alternative
MainStay VP CBRE Global Infrastructure Portfolio
MainStay VP IQ Hedge Multi-Strategy Portfolio
Asset Allocation
MainStay VP Conservative Allocation Portfolio
MainStay VP Equity Allocation Portfolio
MainStay VP Growth Allocation Portfolio
MainStay VP Moderate Allocation Portfolio
Manager
New York Life Investment Management LLC
New York, New York
Subadvisors
American Century Investment Management, Inc.
Kansas City, Missouri
Brown Advisory LLC
Baltimore, Maryland
Candriam*
Strassen, Luxembourg
CBRE Investment Management Listed Real Assets LLC
Radnor, Pennsylvania
Epoch Investment Partners, Inc.
New York, New York
FIAM LLC
Smithfield, Rhode Island
IndexIQ Advisors LLC*
New York, New York
Janus Henderson Investors US LLC
Denver, Colorado
MacKay Shields LLC*
New York, New York
Newton Investment Management North America, LLC
Boston, Massachusetts
NYL Investors LLC*
New York, New York
Pacific Investment Management Company LLC
Newport Beach, California
Segall Bryant & Hamill, LLC
Chicago, Illinois
Wellington Management Company LLP
Boston, Massachusetts
Winslow Capital Management, LLC
Minneapolis, Minnesota
Legal Counsel
Dechert LLP
Washington, District of Columbia
Independent Registered Public Accounting Firm
PricewaterhouseCoopers LLP
New York, New York
Distributor
NYLIFE Distributors LLC*
Jersey City, New Jersey
Custodian
JPMorgan Chase Bank, N.A.
New York, New York
Some Portfolios may not be available in all products.
† Fidelity Institutional AM is a registered trade mark of FMR LLC. Used with permission.
* An affiliate of New York Life Investment Management LLC.
| 1. | Prior to May 1, 2022, the Portfolio's name was MainStay VP T. Rowe Price Equity Income Portfolio. |
| 2. | Prior to May 1, 2022, the Portfolio's name was MainStay VP MacKay S&P 500 Index Portfolio. |
Not part of the Annual Report
2022 Annual Report
This report is for the general information of New York Life Variable Annuities and NYLIAC Variable Universal Life Insurance Products policyowners. It must be preceded or accompanied by the appropriate product(s) and funds prospectuses if it is given to anyone who is not an owner of a New York Life variable annuity policy or a NYLIAC Variable Universal Life Insurance Product. This report does not offer for sale or solicit orders to purchase securities.
The performance data quoted in this report represents past performance. Past performance is no guarantee of future results. Due to market volatility and other factors, current performance may be lower or higher than the figures shown. The most recent month-end performance summary for your variable annuity or variable life policy is available by calling 800-598-2019 and is updated periodically on newyorklife.com.
The New York Life Variable Annuities and NYLIAC Variable Universal Life Insurance Products are issued by New York Life Insurance and Annuity Corporation (a Delaware Corporation) and distributed by NYLIFE Distributors LLC (Member FINRA/SIPC).
New York Life Insurance Company
New York Life Insurance and Annuity
Corporation (NYLIAC) (A Delaware Corporation)
51 Madison Avenue, Room 551
New York, NY 10010
newyorklife.com
newyorklifeinvestments.com
NYLIFE Distributors LLC, 30 Hudson Street, Jersey City, NJ 07302
New York Life Investment Management LLC is the investment manager to the MainStay VP Funds Trust
©2023 by NYLIFE Distributors LLC. All rights reserved.
You may obtain copies of the Prospectus and the Statement of Additional Information free of charge, upon request, by calling toll-free 800-598-2019 or writing to New York Life Insurance and Annuity Corporation, 51 Madison Avenue, New York, NY 10010.
| Not FDIC Insured | No Bank Guarantee | May Lose Value |
(NYLIAC) NI529
MainStay VP CBRE Global Infrastructure Portfolio
Message from the President and Annual Report
December 31, 2022
Sign up for e-delivery of your shareholder reports. For full details on e-delivery, including who can participate and what you can receive via e-delivery,
please log in to newyorklifeinvestments.com/accounts.
| Not FDIC/NCUA Insured | Not a Deposit | May Lose Value | No Bank Guarantee | Not Insured by Any Government Agency |
This page intentionally left blank
Message from the President
The 12-month reporting period ended December 31, 2022, proved exceptionally challenging for investors as both stock and bond markets suffered steep declines. A variety of economic and geopolitical forces drove the market’s losses, all centered around rising inflation and monetary efforts to rein it in.
Inflationary alarms began to sound well before the reporting period began. In late 2021, after nearly two years of accommodative policies designed to encourage economic growth in the face of the COVID-19 pandemic, the U.S. Federal Reserve (the “Fed”) warned of the increasing need to tighten monetary policy. Nevertheless, the pace and persistence of inflation in early 2022 caught most market participants—the Fed included—off guard. Russia’s invasion of Ukraine in February exacerbated global inflationary pressures while increasing investor uncertainty. Domestic supply shortages, international trade imbalances and rising inflation caused U.S. GDP (gross domestic product) to contract in the first and second quarters of the year, although employment and consumer spending proved resilient. Prices for petroleum surged to multi-year highs, while many key agricultural chemicals and industrial metals soared as well. Accelerating inflationary forces prompted the Fed to implement its most aggressive series of interest rate hikes since the 1980s, with a 0.25% increase in March followed by six further rate increases totaling 4.25%. International central banks generally followed suit and raised rates by varying degrees in efforts to curb local inflation, although most increases remained significantly more modest than those in the United States. Relatively high U.S. interest rates and an international risk averse sentiment pushed U.S. dollar values higher compared to most other currencies, with negative impacts on global prices for food, fuel and other key U.S.-dollar-denominated products.
The effects of these interrelated challenges were felt throughout U.S. and international financial markets. The S&P 500® Index, a widely regarded benchmark of market performance, declined by more than 18% during the reporting period. Although the energy sector generated strong gains, bolstered by elevated oil and gas prices, most other industry segments recorded losses. The more cyclical and growth-oriented sectors of consumer discretionary, information technology and real estate delivered the weakest returns, while the traditionally defensive and value-oriented
consumer staples, utilities and health care sectors outperformed. On average, international developed-country equity markets mildly outperformed their U.S. counterparts, while emerging markets lagged slightly. Fixed-income markets proved unusually volatile, with bond prices trending sharply lower as yields rose along with interest rates. Short-term yields rose faster than long-term yields, producing a yield curve inversion from July through the end of the reporting period as long-term rates remained below short-term rates. While floating-rate instruments, which feature variable interest rates that allow investors to benefit from a rising rate environment, provided a degree of insulation from inflation-driven trends, they were not immune to the market’s widespread declines.
Although, according to the most recent estimates, the annualized inflation rate in the United States has declined from a peak of 9.1% in July 2022 to 6.5% in December, the Fed remains focused on achieving more substantial and lasting reductions, aiming for a target rate of 2%. As a result, further rate hikes and additional market volatility are potential headwinds in the coming months. The question remains as to whether the Fed and other central banks will manage a so-called “soft landing,” curbing inflation while avoiding a persistent economic slowdown. If they prove successful, we believe that the increasingly attractive valuations we have observed in both equity and bond markets should eventually translate into sustainable improvements in the investment environment.
Whatever actions the Fed takes and however financial markets react, as a MainStay VP investor you can depend on us to continue managing our portfolios with the insight, expertise and level of service that have long defined New York Life Investments. Thank you for trusting us to help you meet your investment needs.
Sincerely,
Kirk C. Lehneis
President
The opinions expressed are as of the date of this report and are subject to change. There is no guarantee that any forecast made will come to pass. This material does not constitute investment advice and is not intended as an endorsement of any specific investment. Past performance is no guarantee of future results.
Not part of the Annual Report
Investors should refer to the Portfolio’s Summary Prospectus and/or Prospectus and consider the Portfolio’s investment objectives, strategies, risks, charges and expenses carefully before investing. The Summary Prospectus and/or Prospectus contain this and other information about the Portfolio. You may obtain copies of the Portfolio’s Summary Prospectus, Prospectus and Statement of Additional Information, which includes information about the MainStay VP Funds Trust's Trustees, free of charge, upon request, by calling toll-free 800-598-2019, by writing to New York Life Insurance and Annuity Corporation, 51 Madison Avenue, Room 251, New York, New York 10010 or by sending an email to MainStayShareholdersServices@nylim.com. These documents are also available at newyorklifeinvestments.com/investment-products/vp. Please read the Portfolio's Summary Prospectus and/or Prospectus carefully before investing. MainStay VP Funds Trust portfolios are separate account options which are purchased through a variable insurance or variable annuity contract.
Investment and Performance Comparison (Unaudited)
Performance data quoted represents past performance. Past performance is no guarantee of future results. Because of market volatility and other factors, current performance may be lower or higher than the figures shown. Investment return and principal value will fluctuate, and as a result, when shares are redeemed, they may be worth more or less than their original cost. The performance table and graph do not reflect any deduction of sales charges, mortality and expense charges, contract charges or administrative charges. Please refer to the Performance Summary appropriate for your policy. For performance information current to the most recent month-end, please call 800-598-2019 or visit www.newyorklife.com.
Performance figures may reflect certain fee waivers and/or expense limitations, without which total returns may have been different. For information on current fee waivers and/or expense limitations (if any), please refer to the Notes to Financial Statements.
| Average Annual Total Returns for the Year-Ended December 31, 2022 |
| Class | Inception
Date1 | One
Year | Five
Years | Since
Inception | Gross
Expense
Ratio2 |
| Initial Class Shares | 5/1/2015 | -5.99% | -6.36% | -3.44% | 1.35% |
| Service Class Shares | 5/1/2015 | -6.22 | -6.60 | -3.68 | 1.60 |
| 1. | Effective February 28, 2020, the Portfolio replaced its subadvisor and modified its principal investment strategies. The past performance in the graph and table prior to that date reflects the Portfolio’s prior subadvisor and principal investment strategies. |
| 2. | The gross expense ratios presented reflect the Portfolio’s “Total Annual Portfolio Operating Expenses” from the most recent Prospectus and may differ from other expense ratios disclosed in this report. |
| Benchmark Performance* | One
Year | Five
Years | Since
Inception |
| FTSE Global Core Infrastructure 50/50 Index (Net)1 | -4.87% | 4.72% | 5.38% |
| Morningstar Infrastructure Category Average2 | -8.91 | 4.12 | 4.05 |
| * | Returns for indices reflect no deductions for fees, expenses or taxes, except for foreign withholding taxes where applicable. Results assume reinvestment of all dividends and capital gains. An investment cannot be made directly in an index. |
| 1. | The FTSE Global Core Infrastructure 50/50 Index (Net) is the Portfolio’s primary broad-based securities market index for comparison purposes. The FTSE Global Core Infrastructure 50/50 Index (Net) is a market-capitalization-weighted index of worldwide infrastructure and infrastructure-related securities. Constituent weights are adjusted semi-annually according to three broad industry sectors: 50% utilities, 30% transportation, and a 20% mix of other sectors. |
| 2. | The Morningstar Infrastructure Category Average is representative of funds that invest more than 60% of their assets in stocks of companies engaged in infrastructure activities. Industries considered to be part of the infrastructure sector include: oil & gas midstream; waste management; airports; integrated shipping; railroads; shipping & ports; trucking; engineering & construction; infrastructure operations; and the utilities sector. Results are based on average total returns of similar funds with all dividends and capital gain distributions reinvested. |
Cost in Dollars of a $1,000 Investment in MainStay VP CBRE Global Infrastructure Portfolio (Unaudited)
The example below is intended to describe the fees and expenses borne by shareholders during the six-month period from July 1, 2022 to December 31, 2022, and the impact of those costs on your investment.
Example
As a shareholder of the Portfolio you incur two types of costs: (1) transaction costs, including exchange fees and sales charges (loads) on purchases (as applicable), and (2) ongoing costs, including management fees, distribution and/or service (12b-1) fees and other Portfolio expenses (as applicable). This example is intended to help you understand your ongoing costs (in dollars) of investing in the Portfolio and to compare these costs with the ongoing costs of investing in other mutual funds. The example is based on an investment of $1,000 made at the beginning of the six-month period and held for the entire period from July 1, 2022 to December 31, 2022. Shares are only sold in connection with variable life and annuity contracts and the example does not reflect any contract level or transactional fees or expenses. If these costs had been included, your costs would have been higher.
This example illustrates your Portfolio’s ongoing costs in two ways:
Actual Expenses
The second and third data columns in the table below provide information about actual account values and actual expenses. You may use the information in these columns, together with the amount you invested, to estimate the expenses that you paid during the six months ended
December 31, 2022. Simply divide your account value by $1,000 (for example, an $8,600 account value divided by $1,000 = 8.6), then multiply the result by the number under the heading entitled “Expenses Paid During Period” to estimate the expenses you paid on your account during this period.
Hypothetical Example for Comparison Purposes
The fourth and fifth data columns in the table below provide information about hypothetical account values and hypothetical expenses based on the Portfolio’s actual expense ratio and an assumed rate of return of 5% per year before expenses, which is not the Portfolio’s actual return. The hypothetical account values and expenses may not be used to estimate the actual ending account balances or expenses you paid for the six-month period shown. You may use this information to compare the ongoing costs of investing in the Portfolio with the ongoing costs of investing in other mutual funds. To do so, compare this 5% hypothetical example with the 5% hypothetical examples that appear in the shareholder reports of the other mutual funds.
Please note that the expenses shown in the table are meant to highlight your ongoing costs only and do not reflect any transactional costs, such as exchange fees or sales charges (loads). Therefore, the fourth and fifth data columns of the table are useful in comparing ongoing costs only and will not help you determine the relative total costs of owning different funds. In addition, if these transactional costs were included, your costs would have been higher.
| Share Class | Beginning
Account
Value
7/1/22 | Ending Account
Value (Based
on Actual
Returns and
Expenses)
12/31/22 | Expenses
Paid
During
Period1 | Ending Account
Value (Based
on Hypothetical
5% Annualized
Return and
Actual Expenses)
12/31/22 | Expenses
Paid
During
Period1 | Net Expense
Ratio
During
Period2 |
| Initial Class Shares | $1,000.00 | $996.30 | $4.78 | $1,020.42 | $4.84 | 0.95% |
| Service Class Shares | $1,000.00 | $995.10 | $6.03 | $1,019.16 | $6.11 | 1.20% |
| 1. | Expenses are equal to the Portfolio’s annualized expense ratio of each class multiplied by the average account value over the period, divided by 365 and multiplied by 184 (to reflect the six-month period). The table above represents the actual expenses incurred during the six-month period. In addition to the fees and expenses which the Portfolio bears directly, it also indirectly bears a pro rata share of the fees and expenses of the underlying funds in which it invests. Such indirect expenses are not included in the above-reported expense figures. |
| 2. | Expenses are equal to the Portfolio's annualized expense ratio to reflect the six-month period. |
| 6 | MainStay VP CBRE Global Infrastructure Portfolio |
Country Composition as of December 31, 2022 (Unaudited)
| United States | 56.8% |
| Australia | 9.3 |
| Spain | 6.6 |
| Canada | 6.4 |
| France | 5.4 |
| United Kingdom | 3.7 |
| Italy | 2.8 |
| China | 2.4 |
| Japan | 2.2% |
| Portugal | 1.7 |
| Mexico | 1.2 |
| Hong Kong | 0.9 |
| New Zealand | 0.9 |
| Other Assets, Less Liabilities | –0.3 |
| | 100.0% |
See Portfolio of Investments beginning on page 10 for specific holdings within these categories. The Portfolio's holdings are subject to change.
Top Ten Holdings and/or Issuers Held as of December 31, 2022 (excluding short-term investments) (Unaudited)
| 1. | NextEra Energy, Inc. |
| 2. | American Tower Corp. |
| 3. | Transurban Group |
| 4. | WEC Energy Group, Inc. |
| 5. | American Electric Power Co., Inc. |
| 6. | Cellnex Telecom SA |
| 7. | Vinci SA |
| 8. | Ameren Corp. |
| 9. | Atlas Arteria Ltd. |
| 10. | Enbridge, Inc. |
Portfolio Management Discussion and Analysis (Unaudited)
Answers to the questions reflect the views of portfolio managers Jeremy Anagnos, CFA, Joseph P. Smith, CFA, Daniel Foley, CFA, and Hinds Howard of CBRE Investment Management Listed Real Assets LLC (“CBRE”), the Portfolio’s Subadvisor.
How did MainStay VP CBRE Global Infrastructure Portfolio perform relative to its benchmark and peers during the 12 months ended December 31, 2022?
For the 12 months ended December 31, 2022, MainStay VP CBRE Global Infrastructure Portfolio returned −5.99% for Initial Class shares and −6.22% for Service Class shares. Over the same period, both share classes underperformed the −4.87% return of the FTSE Global Core Infrastructure 50/50 Index (Net) (“the Index”), which is the Portfolio’s benchmark. For the 12 months ended December 31, 2022, both share classes outperformed the −8.91% return of the Morningstar Infrastructure Category Average.1
What factors affected the Portfolio’s relative performance during the reporting period?
Three key factors affected global markets during the reporting period: (1) the onset of war between Russia and Ukraine, which drove already-high energy prices even higher, especially in Europe; (2) rising inflation and the potential implications of policies to combat its effects, which, among other impacts, led to an increase in bond yields and increased the odds of a recession; and (3) lingering uncertainties related to the COVID-19 pandemic, notably in China, where the government’s policy response raised economic uncertainties and created a ripple effect in global supply chains.
The Portfolio underperformed the Index during the reporting period due to negative sector allocation, partially offset by positive stock selection. The most significant reason for underperformance was exposure to continental Europe, where the war in Ukraine and the resulting shock to energy prices dramatically escalated the risk profile of the region, destabilized stock prices and weakened the currency. Structurally underweight exposure to emerging markets also dragged notably on returns versus the Index.
During the reporting period, which sectors were the strongest positive contributors to the Portfolio’s relative performance, and which sectors were particularly weak?
The sectors providing the strongest positive contributions to the Portfolio’s performance relative to the Index included North American utilities, midstream and communications. (Contributions take weightings and total returns into account.) Outperforming holdings among North American utilities and midstream companies bolstered relative returns, more than compensating for slightly negative sector allocation. The Portfolio's North American utility holdings posted positive returns despite the sector’s negative returns in the Index. Midstream had the best overall returns in the Portfolio, significantly ahead of midstream returns for the Index. The North American communications sector, one of the worst performing sectors in the Index, contributed positively to
the Portfolio’s relative performance through both stock selection and sector allocation.
The weakest contributors to the Portfolio’s relative performance included continental European utilities, transports and communications, all of which posted negative returns. The majority of the relative drag versus the Index came from collective overweight sector allocations to these areas. Stock selection also proved negative, with the impact more pronounced in utilities and transports.
During the reporting period, which individual stocks made the strongest positive contributions to the Portfolio’s absolute performance and which stocks detracted the most?
The holdings that contributed most to the Portfolio’s absolute returns included Cheniere Energy, The Williams Companies and Constellation Energy. Cheniere Energy is a U.S. midstream company with a set of unique, fully contracted, natural gas export assets. The company benefited from improvement in the global liquid natural gas (LNG) market. Williams is one of the largest natural gas pipeline operators in the United States, operating those assets under long-term contracts serving downstream customers, including LNG export facilities. Constellation Energy saw shares rise sharply as it was spun out of parent company Exelon. Constellation’s power generation business benefited from growing policy support aimed at keeping nuclear plants profitable as a means of achieving state and federal decarbonization/net zero goals. Integrated utility AES, another strong contributor to Portfolio returns during the reporting period, benefited from the passage of the U.S. Inflation Reduction Act of 2022, which positioned the company to take advantage of tax credits and further enhance its investment opportunities.
The holdings that detracted the most from the Portfolio’s absolute returns were Spain-based European tower operator Cellnex, Italy-based European integrated utility/renewable developer Enel and U.S. rail company Union Pacific, all of which posted negative returns for the reporting period. Cellnex shares underperformed due to a combination of rising interest rates and concerns that the company might stretch its balance sheet to pursue mergers and acquisitions, which it ultimately did not endeavor to do. Enel shares suffered as investor sentiment turned against the European utility sector amid an unfolding energy crisis. Union Pacific shares declined on supply-chain issues and the resulting operational challenges across the rail industry, as well as mounting concerns that a recession could damage the company’s forward-looking revenue expectations.
| 1. | See page 5 for more information on benchmark and peer group returns. |
| 8 | MainStay VP CBRE Global Infrastructure Portfolio |
Did the Portfolio make any significant purchases or sales during the reporting period?
The most significant purchases during the reporting period included adding to the Portfolio’s position in tower company American Tower and new positions in U.S. regulated utilities PPL and XEL Energy. We increased the Portfolio’s exposure to American Tower as significant market underperformance left valuations more attractive, especially given the company’s inflation-protected cash flows, which we believe are likely to prove highly resilient in the face of a potential recession. We initiated Portfolio positions in PPL and XEL as part of a broader push to increase U.S. utility exposure. PPL has an attractive profile in this environment, given balance sheet strength following recent asset sales and reduced regulatory risks. XEL is a premium utility that we believe is particularly well positioned to benefit from the passage of the Inflation Reduction Act.
The Portfolio’s most significant sales during the same period included exiting positions in French utility ENGIE and U.S. regulated utility Exelon, and the partial sale of a position in Union Pacific. We sold the Portfolio’s position in ENGIE in the wake of the energy crisis that impacted European utilities, and in light of the company’s deteriorating outlook and increased risk profile. We sold the Exelon position after the investment thesis had played out positively, and due to concerns that the company would incur added tax expenses as a result of new legislation. We reduced Union Pacific holdings due to mounting concerns regarding the company’s forward outlook related to deteriorating economic conditions and operational challenges.
How did the Portfolio’s sector/subsector weightings change during the reporting period?
During the reporting period, we increased the Portfolio’s sector exposure most significantly to U.S. utilities and communications. We believe many U.S. utilities are well-positioned given the strength and stability of their earnings, while also operating in a relatively stable regulatory environment. The combination of stable current earnings and growth from energy transition efforts support what we believe is a particularly attractive outlook for U.S. utilities. We added to the Portfolio’s exposure to U.S. communications via towers and data center holdings that had underperformed and offered more compelling valuations. The group produces inflation-protected cash flows and benefits from secular demand, which offers more resilient cash flows amid growing macroeconomic uncertainty.
During the same period, the Portfolio’s most significant reductions in sector weightings came from utilities in continental Europe and transports in North America. We reduced the Portfolio’s
continental European utility exposure in order to de-risk exposure to the escalating energy crisis in Europe, where rising energy prices and concerns over natural gas supply challenged already tight markets. We reduced the Portfolio’s North American rail exposure due to our mounting concerns regarding the subsector's forward outlook amid deteriorating economic conditions and operational challenges across the industry.
How was the Portfolio positioned at the end of the reporting period?
As of December 31, 2022, the Portfolio held materially overweight exposure to communications globally. Communications continues to experience robust growth driven by trends in increasing data usage and the need for new infrastructure to support the digital economy. We believe communications infrastructure companies in the listed space are among the most well-positioned entities across the globe to benefit from the positive trends in this sector. Among transports, the Portfolio maintains an overweight bias toward toll roads, where volumes have remained resilient and valuations attractive. This positioning is largely reflected in European and Australian holdings.
As of the same date, the Portfolio held its most significantly underweight exposure to North American rail, which was significantly reduced because of its deteriorating outlook.
The Portfolio’s utility holdings continue to reflect a bias towards names producing strong growth within robust regulatory environments, and that we believe are positioned to benefit from investment opportunities tied to decarbonization. We are cautious regarding utilities operating in weaker regulatory environments, those exhibiting at-risk earnings profiles and high-carbon-intensity business models, and those subject to risks of severe weather and/or rate shocks to consumers. Given dramatically changing risk profiles in Europe, we have reallocated more of the Portfolio’s assets toward U.S. utilities and, to a lesser extent, Hong Kong-listed names.
The Portfolio’s midstream positioning is relatively in line with the Index, having been reduced following significant outperformance in 2022.
The opinions expressed are those of the portfolio managers as of the date of this report and are subject to change. There is no guarantee that any forecasts will come to pass. This material does not constitute investment advice and is not intended as an endorsement of any specific investment.
Not all MainStay VP Portfolios and/or share classes are available under all policies.
Portfolio of Investments December 31, 2022†
| | Shares | Value |
| Common Stocks 98.4% |
| Australia 9.3% |
| Atlas Arteria Ltd. (Transportation) | 229,924 | $ 1,033,804 |
| NEXTDC Ltd. (Communications) (a) | 82,972 | 513,232 |
| Transurban Group (Transportation) | 182,152 | 1,608,439 |
| | | 3,155,475 |
| Canada 6.4% |
| Canadian National Railway Co. (Transportation) | 4,140 | 491,786 |
| Enbridge, Inc. (Midstream / Pipelines) | 26,099 | 1,020,058 |
| Pembina Pipeline Corp. (Midstream / Pipelines) | 19,036 | 646,155 |
| | | 2,157,999 |
| China 2.4% |
| China Resources Gas Group Ltd. (Utilities) | 81,777 | 304,559 |
| ENN Energy Holdings Ltd. (Utilities) | 14,999 | 209,248 |
| Guangdong Investment Ltd. (Utilities) | 292,012 | 298,951 |
| | | 812,758 |
| France 5.4% |
| Eiffage SA (Transportation) | 7,272 | 717,061 |
| Vinci SA (Transportation) | 11,167 | 1,115,305 |
| | | 1,832,366 |
| Hong Kong 0.9% |
| CK Infrastructure Holdings Ltd. (Utilities) | 58,587 | 306,662 |
| Italy 2.8% |
| Enel SpA (Utilities) | 107,076 | 575,886 |
| Infrastrutture Wireless Italiane SpA (Communications) | 38,636 | 390,280 |
| | | 966,166 |
| Japan 2.2% |
| Central Japan Railway Co. (Transportation) | 4,041 | 497,134 |
| West Japan Railway Co. (Transportation) | 6,024 | 262,929 |
| | | 760,063 |
| Mexico 1.2% |
| Grupo Aeroportuario del Pacifico SAB de CV, Class B (Transportation) | 29,412 | 421,336 |
| New Zealand 0.9% |
| Infratil Ltd. (Diversified) | 53,660 | 293,856 |
| Portugal 1.7% |
| EDP - Energias de Portugal SA (Utilities) | 115,568 | 575,736 |
| | Shares | Value |
| |
| Spain 6.6% |
| Aena SME SA (Transportation) (a) | 6,403 | $ 806,398 |
| Cellnex Telecom SA (Communications) | 36,567 | 1,216,058 |
| Ferrovial SA (Transportation) | 7,987 | 208,935 |
| | | 2,231,391 |
| United Kingdom 3.7% |
| National Grid plc (Utilities) | 83,996 | 1,008,908 |
| Pennon Group plc (Utilities) | 21,561 | 231,783 |
| | | 1,240,691 |
| United States 54.9% |
| AES Corp. (The) (Utilities) | 19,486 | 560,417 |
| ALLETE, Inc. (Utilities) | 2,604 | 167,984 |
| Ameren Corp. (Utilities) | 12,468 | 1,108,655 |
| American Electric Power Co., Inc. (Utilities) | 13,567 | 1,288,187 |
| American Tower Corp. (Communications) | 8,271 | 1,752,293 |
| Cheniere Energy, Inc. (Midstream / Pipelines) | 6,166 | 924,654 |
| CMS Energy Corp. (Utilities) | 11,410 | 722,595 |
| Constellation Energy Corp. (Utilities) | 3,592 | 309,666 |
| Crown Castle, Inc. (Communications) | 6,250 | 847,750 |
| Dominion Energy, Inc. (Utilities) | 3,612 | 221,488 |
| Equinix, Inc. (Communications) | 1,032 | 675,991 |
| FirstEnergy Corp. (Utilities) | 13,722 | 575,501 |
| NextEra Energy Partners LP (Utilities) | 3,478 | 243,773 |
| NextEra Energy, Inc. (Utilities) | 22,325 | 1,866,370 |
| NiSource, Inc. (Utilities) | 14,927 | 409,298 |
| OGE Energy Corp. (Utilities) | 12,566 | 496,985 |
| PPL Corp. (Utilities) | 28,228 | 824,822 |
| Public Service Enterprise Group, Inc. (Utilities) | 12,743 | 780,764 |
| Sempra Energy (Utilities) | 5,384 | 832,043 |
| Southern Co. (The) (Utilities) | 4,727 | 337,555 |
| Targa Resources Corp. (Midstream / Pipelines) | 5,504 | 404,544 |
| Union Pacific Corp. (Transportation) | 2,269 | 469,842 |
| WEC Energy Group, Inc. (Utilities) | 14,507 | 1,360,176 |
| Williams Cos., Inc. (The) (Midstream / Pipelines) | 12,561 | 413,257 |
| Xcel Energy, Inc. (Utilities) | 14,325 | 1,004,326 |
| | | 18,598,936 |
Total Common Stocks
(Cost $32,140,327) | | 33,353,435 |
The notes to the financial statements are an integral part of, and should be read in conjunction with, the financial statements.
| 10 | MainStay VP CBRE Global Infrastructure Portfolio |
| | Shares | | Value |
| Short-Term Investment 1.9% |
| Affiliated Investment Company 1.9% |
| United States 1.9% |
| MainStay U.S. Government Liquidity Fund, 3.602% (b) | 631,122 | | $ 631,122 |
Total Short-Term Investment
(Cost $631,122) | | | 631,122 |
Total Investments
(Cost $32,771,449) | 100.3% | | 33,984,557 |
| Other Assets, Less Liabilities | (0.3) | | (93,508) |
| Net Assets | 100.0% | | $ 33,891,049 |
| † | Percentages indicated are based on Portfolio net assets. |
| (a) | Non-income producing security. |
| (b) | Current yield as of December 31, 2022. |
Investments in Affiliates (in 000's)
Investments in issuers considered to be affiliate(s) of the Portfolio during the year ended December 31, 2022 for purposes of Section 2(a)(3) of the Investment Company Act of 1940, as amended, were as follows:
| Affiliated Investment Companies | Value,
Beginning
of Year | Purchases
at Cost | Proceeds
from
Sales | Net
Realized
Gain/(Loss)
on Sales | Change in
Unrealized
Appreciation/
(Depreciation) | Value,
End of
Year | Dividend
Income | Other
Distributions | Shares
End of
Year |
| MainStay U.S. Government Liquidity Fund | $ 302 | $ 13,779 | $ (13,450) | $ — | $ — | $ 631 | $ 7 | $ — | 631 |
The notes to the financial statements are an integral part of, and should be read in conjunction with, the financial statements.
11
Portfolio of Investments December 31, 2022† (continued)
The following is a summary of the fair valuations according to the inputs used as of December 31, 2022, for valuing the Portfolio’s assets:
| Description | Quoted
Prices in
Active
Markets for
Identical
Assets
(Level 1) | | Significant
Other
Observable
Inputs
(Level 2) | | Significant
Unobservable
Inputs
(Level 3) | | Total |
| Asset Valuation Inputs | | | | | | | |
| Investments in Securities (a) | | | | | | | |
| Common Stocks | | | | | | | |
| Australia | $ — | | $ 3,155,475 | | $ — | | $ 3,155,475 |
| China | — | | 812,758 | | — | | 812,758 |
| France | — | | 1,832,366 | | — | | 1,832,366 |
| Hong Kong | — | | 306,662 | | — | | 306,662 |
| Italy | — | | 966,166 | | — | | 966,166 |
| Japan | — | | 760,063 | | — | | 760,063 |
| New Zealand | — | | 293,856 | | — | | 293,856 |
| Portugal | — | | 575,736 | | — | | 575,736 |
| Spain | — | | 2,231,391 | | — | | 2,231,391 |
| United Kingdom | — | | 1,240,691 | | — | | 1,240,691 |
| All Other Countries | 21,178,271 | | — | | — | | 21,178,271 |
| Total Common Stocks | 21,178,271 | | 12,175,164 | | — | | 33,353,435 |
| Short-Term Investment | | | | | | | |
| Affiliated Investment Company | 631,122 | | — | | — | | 631,122 |
| Total Investments in Securities | $ 21,809,393 | | $ 12,175,164 | | $ — | | $ 33,984,557 |
| (a) | For a complete listing of investments and their industries, see the Portfolio of Investments. |
The table below sets forth the diversification of the Portfolio’s investments by sector.
Sector Diversification
| | Value | | Percent |
| Utilities | $16,622,338 | | 49.1% |
| Transportation | 7,632,969 | | 22.5 |
| Communications | 5,395,604 | | 15.9 |
| Midstream / Pipelines | 3,408,668 | | 10.0 |
| Diversified | 293,856 | | 0.9 |
| | 33,353,435 | | 98.4 |
| Short-Term Investment | 631,122 | | 1.9 |
| Other Assets, Less Liabilities | (93,508) | | (0.3) |
| Net Assets | $33,891,049 | | 100.0% |
† Percentages indicated are based on Portfolio net assets.
The notes to the financial statements are an integral part of, and should be read in conjunction with, the financial statements.
| 12 | MainStay VP CBRE Global Infrastructure Portfolio |
Statement of Assets and Liabilities as of December 31, 2022
| Assets |
Investment in unaffiliated securities, at value
(identified cost $32,140,327) | $ 33,353,435 |
Investment in affiliated investment companies, at value
(identified cost $631,122) | 631,122 |
| Cash | 2,593 |
Cash denominated in foreign currencies
(identified cost $8) | 8 |
| Receivables: | |
| Investment securities sold | 161,986 |
| Dividends | 93,236 |
| Portfolio shares sold | 23,803 |
| Securities lending | 56 |
| Other assets | 112 |
| Total assets | 34,266,351 |
| Liabilities |
| Payables: | |
| Investment securities purchased | 250,864 |
| Portfolio shares redeemed | 32,590 |
| Shareholder communication | 29,816 |
| Professional fees | 23,349 |
| Manager (See Note 3) | 21,203 |
| NYLIFE Distributors (See Note 3) | 6,827 |
| Custodian | 4,240 |
| Accrued expenses | 6,413 |
| Total liabilities | 375,302 |
| Net assets | $ 33,891,049 |
| Composition of Net Assets |
| Shares of beneficial interest outstanding (par value of $.001 per share) unlimited number of shares authorized | $ 4,961 |
| Additional paid-in-capital | 69,103,968 |
| | 69,108,929 |
| Total distributable earnings (loss) | (35,217,880) |
| Net assets | $ 33,891,049 |
| Initial Class | |
| Net assets applicable to outstanding shares | $ 2,111,021 |
| Shares of beneficial interest outstanding | 305,263 |
| Net asset value per share outstanding | $ 6.92 |
| Service Class | |
| Net assets applicable to outstanding shares | $31,780,028 |
| Shares of beneficial interest outstanding | 4,655,977 |
| Net asset value per share outstanding | $ 6.83 |
The notes to the financial statements are an integral part of, and should be read in conjunction with, the financial statements.
13
Statement of Operations for the year ended December 31, 2022
| Investment Income (Loss) |
| Income | |
| Dividends-unaffiliated (net of foreign tax withholding of $49,481) | $ 891,138 |
| Dividends-affiliated | 6,562 |
| Securities lending, net | 941 |
| Total income | 898,641 |
| Expenses | |
| Manager (See Note 3) | 272,866 |
| Distribution/Service—Service Class (See Note 3) | 75,255 |
| Professional fees | 56,248 |
| Custodian | 28,498 |
| Trustees | 687 |
| Shareholder communication | 489 |
| Miscellaneous | 3,890 |
| Total expenses before waiver/reimbursement | 437,933 |
| Expense waiver/reimbursement from Manager (See Note 3) | (58,000) |
| Net expenses | 379,933 |
| Net investment income (loss) | 518,708 |
| Realized and Unrealized Gain (Loss) |
| Net realized gain (loss) on: | |
| Unaffiliated investment transactions | (924,641) |
| Foreign currency transactions | (12,492) |
| Net realized gain (loss) | (937,133) |
| Net change in unrealized appreciation (depreciation) on: | |
| Unaffiliated investments | (2,042,747) |
| Translation of other assets and liabilities in foreign currencies | (2,670) |
| Net change in unrealized appreciation (depreciation) | (2,045,417) |
| Net realized and unrealized gain (loss) | (2,982,550) |
| Net increase (decrease) in net assets resulting from operations | $(2,463,842) |
The notes to the financial statements are an integral part of, and should be read in conjunction with, the financial statements.
| 14 | MainStay VP CBRE Global Infrastructure Portfolio |
Statements of Changes in Net Assets
for the years ended December 31, 2022 and December 31, 2021
| | 2022 | 2021 |
| Increase (Decrease) in Net Assets |
| Operations: | | |
| Net investment income (loss) | $ 518,708 | $ 427,682 |
| Net realized gain (loss) | (937,133) | 1,106,214 |
| Net change in unrealized appreciation (depreciation) | (2,045,417) | 1,769,892 |
| Net increase (decrease) in net assets resulting from operations | (2,463,842) | 3,303,788 |
| Distributions to shareholders: | | |
| Initial Class | (27,062) | — |
| Service Class | (387,536) | — |
| Total distributions to shareholders | (414,598) | — |
| Capital share transactions: | | |
| Net proceeds from sales of shares | 20,290,734 | 7,248,924 |
| Net asset value of shares issued to shareholders in reinvestment of distributions | 414,598 | — |
| Cost of shares redeemed | (10,775,375) | (4,776,219) |
| Increase (decrease) in net assets derived from capital share transactions | 9,929,957 | 2,472,705 |
| Net increase (decrease) in net assets | 7,051,517 | 5,776,493 |
| Net Assets |
| Beginning of year | 26,839,532 | 21,063,039 |
| End of year | $ 33,891,049 | $26,839,532 |
The notes to the financial statements are an integral part of, and should be read in conjunction with, the financial statements.
15
Financial Highlights selected per share data and ratios
| | Year Ended December 31, |
| Initial Class | 2022 | | 2021 | | 2020 | | 2019 | | 2018 |
| Net asset value at beginning of year | $ 7.47 | | $ 6.48 | | $ 8.01 | | $ 7.61 | | $ 10.52 |
| Net investment income (loss) (a) | 0.13 | | 0.15 | | 0.03 | | 0.03 | | (0.07) |
| Net realized and unrealized gain (loss) | (0.58) | | 0.84 | | (1.08) | | 0.37 | | (2.84) |
| Total from investment operations | (0.45) | | 0.99 | | (1.05) | | 0.40 | | (2.91) |
| Less distributions: | | | | | | | | | |
| From net investment income | (0.10) | | — | | (0.48) | | — | | — |
| Net asset value at end of year | $ 6.92 | | $ 7.47 | | $ 6.48 | | $ 8.01 | | $ 7.61 |
| Total investment return (b) | (5.99)% | | 15.28%(c) | | (12.81)% | | 5.26%(c) | | (27.66)%(c) |
| Ratios (to average net assets)/Supplemental Data: | | | | | | | | | |
| Net investment income (loss) | 1.87% | | 2.08% | | 0.41% | | 0.33% | | (0.66)% |
| Net expenses (d) | 0.95% | | 0.95% | | 1.05% | | 1.21% | | 1.21% |
| Expenses (before waiver/reimbursement) (d) | 1.13% | | 1.32% | | 1.44% | | 1.21% | | 1.21% |
| Portfolio turnover rate | 54% | | 43% | | 163% | | 119% | | 162% |
| Net assets at end of year (in 000's) | $ 2,111 | | $ 1,899 | | $ 1,022 | | $ 1,009 | | $ 90,681 |
| (a) | Per share data based on average shares outstanding during the year. |
| (b) | Total return does not reflect any deduction of sales charges, mortality and expense charges, contract charges or administrative charges. For periods of less than one year, total return is not annualized. |
| (c) | Total investment return may reflect adjustments to conform to generally accepted accounting principles. |
| (d) | In addition to the fees and expenses which the Portfolio bears directly, it also indirectly bears a pro-rata share of the fees and expenses of the underlying funds in which it invests. Such indirect expenses are not included in the above expense ratios. |
| | Year Ended December 31, |
| Service Class | 2022 | | 2021 | | 2020 | | 2019 | | 2018 |
| Net asset value at beginning of year | $ 7.38 | | $ 6.42 | | $ 7.93 | | $ 7.55 | | $ 10.47 |
| Net investment income (loss) (a) | 0.11 | | 0.12 | | 0.04 | | 0.01 | | (0.09) |
| Net realized and unrealized gain (loss) | (0.58) | | 0.84 | | (1.09) | | 0.37 | | (2.83) |
| Total from investment operations | (0.47) | | 0.96 | | (1.05) | | 0.38 | | (2.92) |
| Less distributions: | | | | | | | | | |
| From net investment income | (0.08) | | — | | (0.46) | | — | | — |
| Net asset value at end of year | $ 6.83 | | $ 7.38 | | $ 6.42 | | $ 7.93 | | $ 7.55 |
| Total investment return (b) | (6.22)% | | 14.95%(c) | | (13.03)% | | 5.03%(c) | | (27.89)%(c) |
| Ratios (to average net assets)/Supplemental Data: | | | | | | | | | |
| Net investment income (loss) | 1.60% | | 1.79% | | 0.62% | | 0.11% | | (0.91)% |
| Net expenses (d) | 1.20% | | 1.20% | | 1.52% | | 1.62% | | 1.46% |
| Expenses (before waiver/reimbursement) (d) | 1.38% | | 1.60% | | 1.95% | | 1.62% | | 1.46% |
| Portfolio turnover rate | 54% | | 43% | | 163% | | 119% | | 162% |
| Net assets at end of year (in 000's) | $ 31,780 | | $ 24,941 | | $ 20,041 | | $ 22,798 | | $ 22,133 |
| (a) | Per share data based on average shares outstanding during the year. |
| (b) | Total return does not reflect any deduction of sales charges, mortality and expense charges, contract charges or administrative charges. For periods of less than one year, total return is not annualized. |
| (c) | Total investment return may reflect adjustments to conform to generally accepted accounting principles. |
| (d) | In addition to the fees and expenses which the Portfolio bears directly, it also indirectly bears a pro-rata share of the fees and expenses of the underlying funds in which it invests. Such indirect expenses are not included in the above expense ratios. |
The notes to the financial statements are an integral part of, and should be read in conjunction with, the financial statements.
| 16 | MainStay VP CBRE Global Infrastructure Portfolio |
Notes to Financial Statements
Note 1–Organization and Business
MainStay VP Funds Trust (the “Fund”) was organized as a Delaware statutory trust on February 1, 2011. The Fund is registered under the Investment Company Act of 1940, as amended (the “1940 Act”), as an open-end management investment company. The Fund is comprised of thirty-one separate series (collectively referred to as the “Portfolios”). These financial statements and notes relate to the MainStay VP CBRE Global Infrastructure Portfolio (the "Portfolio"), a "non-diversified” portfolio, as that term is defined in the 1940 Act, as interpreted or modified by regulatory authorities having jurisdiction, from time to time. However, due to its principal investment strategies and investment processes, the Portfolio has historically operated as a "diversified" portfolio. Therefore, the Portfolio will not operate as "non-diversified" portfolio without first obtaining shareholder approval.
Shares of the Portfolio are currently offered to certain separate accounts to fund variable annuity policies and variable universal life insurance policies issued by New York Life Insurance and Annuity Corporation (“NYLIAC”), a wholly-owned subsidiary of New York Life Insurance Company (“New York Life”) and may also be offered to fund variable annuity policies and variable universal life insurance policies issued by other insurance companies. NYLIAC allocates shares of the Portfolio to, among others, certain NYLIAC separate accounts. Shares of the Portfolio are also offered to the MainStay VP Conservative Allocation Portfolio, MainStay VP Moderate Allocation Portfolio, MainStay VP Growth Allocation Portfolio and MainStay VP Equity Allocation Portfolio, which operate as “funds-of-funds," and other variable insurance funds.
The following table lists the Portfolio's share classes that have been registered and commenced operations:
| Class | Commenced Operations |
| Initial Class | May 1, 2015 |
| Service Class | May 1, 2015 |
Shares of the Portfolio are offered and are redeemed at a price equal to their respective net asset value (“NAV”) per share. No sales or redemption charge is applicable to the purchase or redemption of the Portfolio's shares. Under the terms of the Fund’s multiple class plan, adopted pursuant to Rule 18f-3 under the 1940 Act, the classes differ in that, among other things, Service Class shares of the Portfolio pay a combined distribution and service fee of 0.25% of average daily net assets attributable to Service Class shares of the Portfolio to the Distributor (as defined in Note 3(B)) pursuant to a plan adopted in accordance with Rule 12b-1 under the 1940 Act. Contract owners of variable annuity contracts purchased after June 2, 2003, are permitted to invest only in the Service Class shares.
The Portfolio's investment objective is to seek total return.
Note 2–Significant Accounting Policies
The Portfolio is an investment company and accordingly follows the investment company accounting and reporting guidance of the Financial Accounting Standards Board (“FASB”) Accounting Standards Codification Topic 946 Financial Services—Investment Companies. The Portfolio prepares its financial statements in accordance with generally accepted accounting principles (“GAAP”) in the United States of America and follows the significant accounting policies described below.
(A) Securities Valuation. Investments are usually valued as of the close of regular trading on the New York Stock Exchange (the "Exchange") (usually 4:00 p.m. Eastern time) on each day the Portfolio is open for business ("valuation date").
Effective September 8, 2022, and pursuant to Rule 2a-5 under the 1940 Act, the Board of Trustees of the Fund (the "Board") designated New York Life Investment Management LLC (“New York Life Investments” or the "Manager") as its Valuation Designee (the "Valuation Designee"). The Valuation Designee is responsible for performing fair valuations relating to all investments in the Portfolio’s portfolio for which market quotations are not readily available; periodically assessing and managing material valuation risks; establishing and applying fair value methodologies; testing fair valuation methodologies; evaluating and overseeing pricing services; ensuring appropriate segregation of valuation and portfolio management functions; providing quarterly, annual and prompt reporting to the Board, as appropriate; identifying potential conflicts of interest; and maintaining appropriate records. The Valuation Designee has established a valuation committee ("Valuation Committee") to assist in carrying out the Valuation Designee’s responsibilities and establish prices of securities for which market quotations are not readily available. The Portfolio’s and the Valuation Designee's policies and procedures ("Valuation Procedures") govern the Valuation Designee’s selection and application of methodologies for determining and calculating the fair value of Portfolio investments. The Valuation Designee may value the Portfolio's portfolio securities for which market quotations are not readily available and other Portfolio assets utilizing inputs from pricing services and other third-party sources (together, “Pricing Sources”). The Valuation Committee meets (in person, via electronic mail or via teleconference) on an ad-hoc basis to determine fair valuations and on a quarterly basis to review fair value events with respect to certain securities for which market quotations are not readily available, including valuation risks and back-testing results, and preview reports to the Board.
The Valuation Committee establishes prices of securities for which market quotations are not readily available based on such methodologies and measurements on a regular basis after considering information that is reasonably available and deemed relevant by the Valuation Committee. The Board shall oversee the Valuation Designee and review fair valuation materials on a prompt, quarterly and annual basis and approve proposed revisions to the Valuation Procedures.
Investments for which market quotations are not readily available are valued at fair value as determined in good faith pursuant to the Valuation
Notes to Financial Statements (continued)
Procedures. A market quotation is readily available only when that quotation is a quoted price (unadjusted) in active markets for identical investments that the Portfolio can access at the measurement date, provided that a quotation will not be readily available if it is not reliable. "Fair value" is defined as the price the Portfolio would reasonably expect to receive upon selling an asset or liability in an orderly transaction to an independent buyer in the principal or most advantageous market for the asset or liability. Fair value measurements are determined within a framework that establishes a three-tier hierarchy that maximizes the use of observable market data and minimizes the use of unobservable inputs to establish a classification of fair value measurements for disclosure purposes. "Inputs" refer broadly to the assumptions that market participants would use in pricing the asset or liability, including assumptions about risk, such as the risk inherent in a particular valuation technique used to measure fair value using a pricing model and/or the risk inherent in the inputs for the valuation technique. Inputs may be observable or unobservable. Observable inputs reflect the assumptions market participants would use in pricing the asset or liability based on market data obtained from sources independent of the Portfolio. Unobservable inputs reflect the Portfolio’s own assumptions about the assumptions market participants would use in pricing the asset or liability based on the information available. The inputs or methodology used for valuing assets or liabilities may not be an indication of the risks associated with investing in those assets or liabilities. The three-tier hierarchy of inputs is summarized below.
| • | Level 1—quoted prices (unadjusted) in active markets for an identical asset or liability |
| • | Level 2—other significant observable inputs (including quoted prices for a similar asset or liability in active markets, interest rates and yield curves, prepayment speeds, credit risk, etc.) |
| • | Level 3—significant unobservable inputs (including the Portfolio's own assumptions about the assumptions that market participants would use in measuring fair value of an asset or liability) |
The level of an asset or liability within the fair value hierarchy is based on the lowest level of an input, both individually and in the aggregate, that is significant to the fair value measurement. The aggregate value by input level of the Portfolio’s assets and liabilities as of December 31, 2022, is included at the end of the Portfolio of Investments.
The Portfolio may use third-party vendor evaluations, whose prices may be derived from one or more of the following standard inputs, among others:
| • Broker/dealer quotes | • Benchmark securities |
| • Two-sided markets | • Reference data (corporate actions or material event notices) |
| • Bids/offers | • Monthly payment information |
| • Industry and economic events | • Reported trades |
An asset or liability for which a market quotation is not readily available is valued by methods deemed reasonable in good faith by the Valuation
Committee, following the Valuation Procedures to represent fair value. Under these procedures, the Valuation Designee generally uses a market-based approach which may use related or comparable assets or liabilities, recent transactions, market multiples, book values and other relevant information. The Valuation Designee may also use an income-based valuation approach in which the anticipated future cash flows of the asset or liability are discounted to calculate fair value. Discounts may also be applied due to the nature and/or duration of any restrictions on the disposition of the asset or liability. Fair value represents a good faith approximation of the value of a security. Fair value determinations involve the consideration of a number of subjective factors, an analysis of applicable facts and circumstances and the exercise of judgment. As a result, it is possible that the fair value for a security determined in good faith in accordance with the Valuation Procedures may differ from valuations for the same security determined for other funds using their own valuation procedures. Although the Valuation Procedures are designed to value a security at the price the Portfolio may reasonably expect to receive upon the security's sale in an orderly transaction, there can be no assurance that any fair value determination thereunder would, in fact, approximate the amount that the Portfolio would actually realize upon the sale of the security or the price at which the security would trade if a reliable market price were readily available. During the year ended December 31, 2022, there were no material changes to the fair value methodologies.
Securities which may be valued in this manner include, but are not limited to: (i) a security for which trading has been halted or suspended or otherwise does not have a readily available market quotation on a given day; (ii) a debt security that has recently gone into default and for which there is not a current market quotation; (iii) a security of an issuer that has entered into a restructuring; (iv) a security that has been delisted from a national exchange; (v) a security subject to trading collars for which no or limited trading takes place; and (vi) a security whose principal market has been temporarily closed at a time when, under normal conditions, it would be open. Securities valued in this manner are generally categorized as Level 2 or 3 in the hierarchy.
Certain securities held by the Portfolio may principally trade in foreign markets. Events may occur between the time the foreign markets close and the time at which the Portfolio's NAVs are calculated. These events may include, but are not limited to, situations relating to a single issuer in a market sector, significant fluctuations in U.S. or foreign markets, natural disasters, armed conflicts, governmental actions or other developments not tied directly to the securities markets. Should the Valuation Designee conclude that such events may have affected the accuracy of the last price of such securities reported on the local foreign market, the Valuation Designee may, pursuant to the Valuation Procedures, adjust the value of the local price to reflect the estimated impact on the price of such securities as a result of such events. In this instance, securities are generally categorized as Level 3 in the hierarchy. Additionally, certain foreign equity securities are also fair valued whenever the movement of a particular index exceeds certain thresholds. In such cases, the securities are fair valued by applying factors provided by a third-party vendor in
| 18 | MainStay VP CBRE Global Infrastructure Portfolio |
accordance with the Valuation Procedures and are generally categorized as Level 2 in the hierarchy. Securities that were fair valued in such a manner as of December 31, 2022, are shown in the Portfolio of Investments.
If the principal market of certain foreign equity securities is closed in observance of a local foreign holiday, these securities are valued using the last closing price of regular trading on the relevant exchange and fair valued by applying factors provided by a third-party vendor in accordance with the Valuation Procedures. These securities are generally categorized as Level 2 in the hierarchy. No securities held by the Portfolio as of December 31, 2022, were fair valued in such a manner.
Equity securities are valued at the last quoted sales prices as of the close of regular trading on the relevant exchange on each valuation date. Securities that are not traded on the valuation date are valued at the mean of the last quoted bid and ask prices. Prices are normally taken from the principal market in which each security trades. These securities are generally categorized as Level 1 in the hierarchy.
Investments in mutual funds, including money market funds, are valued at their respective NAVs at the close of business each day on the valuation date. These securities are generally categorized as Level 1 in the hierarchy.
Temporary cash investments acquired in excess of 60 days to maturity at the time of purchase are valued using the latest bid prices or using valuations based on a matrix system (which considers such factors as security prices, yields, maturities and ratings), both as furnished by independent pricing services. Temporary cash investments that mature in 60 days or less at the time of purchase ("Short-Term Investments") are valued using the amortized cost method of valuation, unless the use of such method would be inappropriate. The amortized cost method involves valuing a security at its cost on the date of purchase and thereafter assuming a constant amortization to maturity of the difference between such cost and the value on maturity date. Amortized cost approximates the current fair value of a security. Securities valued using the amortized cost method are not valued using quoted prices in an active market and are generally categorized as Level 2 in the hierarchy.
The information above is not intended to reflect an exhaustive list of the methodologies that may be used to value portfolio investments. The Valuation Procedures permit the use of a variety of valuation methodologies in connection with valuing portfolio investments. The methodology used for a specific type of investment may vary based on the market data available or other considerations. The methodologies summarized above may not represent the specific means by which portfolio investments are valued on any particular business day.
(B) Income Taxes. The Portfolio's policy is to comply with the requirements of the Internal Revenue Code of 1986, as amended (the “Internal Revenue Code”), applicable to regulated investment companies and to distribute all of its taxable income to the shareholders of the Portfolio within the allowable time limits.
The Manager evaluates the Portfolio’s tax positions to determine if the tax positions taken meet the minimum recognition threshold in connection with accounting for uncertainties in income tax positions taken or expected to be taken for the purposes of measuring and recognizing tax liabilities in the financial statements. Recognition of tax benefits of an uncertain tax position is permitted only to the extent the position is “more likely than not” to be sustained assuming examination by taxing authorities. The Manager analyzed the Portfolio's tax positions taken on federal, state and local income tax returns for all open tax years (for up to three tax years) and has concluded that no provisions for federal, state and local income tax are required in the Portfolio's financial statements. The Portfolio's federal, state and local income tax and federal excise tax returns for tax years for which the applicable statutes of limitations have not expired are subject to examination by the Internal Revenue Service and state and local departments of revenue.
(C) Foreign Taxes. The Portfolio may be subject to foreign taxes on income and other transaction-based taxes imposed by certain countries in which it invests. A portion of the taxes on gains on investments or currency purchases/repatriation may be reclaimable. The Portfolio will accrue such taxes and reclaims as applicable, based upon its current interpretation of tax rules and regulations that exist in the markets in which it invests.
The Portfolio may be subject to taxation on realized capital gains, repatriation proceeds and other transaction-based taxes imposed by certain countries in which it invests. The Portfolio will accrue such taxes as applicable based upon its current interpretation of tax rules and regulations that exist in the market in which it invests. Capital gains taxes relating to positions still held are reflected as a liability in the Statement of Assets and Liabilities, as well as an adjustment to the Portfolio's net unrealized appreciation (depreciation). Taxes related to capital gains realized, if any, are reflected as part of net realized gain (loss) in the Statement of Operations. Changes in tax liabilities related to capital gains taxes on unrealized investment gains, if any, are reflected as part of the change in net unrealized appreciation (depreciation) on investments in the Statement of Operations. Transaction-based charges are generally assessed as a percentage of the transaction amount.
(D) Dividends and Distributions to Shareholders. Dividends and distributions are recorded on the ex-dividend date. The Portfolio intends to declare and pay dividends from net investment income and distributions from net realized capital and currency gains, if any, at least annually. All dividends and distributions are reinvested at NAV in the same class of shares of the Portfolio. Dividends and distributions to shareholders are determined in accordance with federal income tax regulations and may differ from determinations using GAAP.
(E) Security Transactions and Investment Income. The Portfolio records security transactions on the trade date. Realized gains and losses on security transactions are determined using the identified cost method. Dividend income is recognized on the ex-dividend date, net of any foreign tax withheld at the source, and interest income is accrued as earned using the effective interest rate method. Distributions received from real
Notes to Financial Statements (continued)
estate investment trusts may be classified as dividends, capital gains and/or return of capital.
The Portfolio may also invest up to 25% of its net assets in master limited partnerships.
Investment income and realized and unrealized gains and losses on investments of the Portfolio are allocated pro rata to the separate classes of shares based upon their relative net assets on the date the income is earned or realized and unrealized gains and losses are incurred.
(F) Expenses. Expenses of the Fund are allocated to the individual Portfolios in proportion to the net assets of the respective Portfolios when the expenses are incurred, except where direct allocations of expenses can be made. Expenses (other than fees incurred under the distribution and service plans, further discussed in Note 3(B), which are charged directly to the Service Class shares) are allocated to separate classes of shares pro rata based upon their relative net assets on the date the expenses are incurred. The expenses borne by the Portfolio, including those of related parties to the Portfolio, are shown in the Statement of Operations.
Additionally, the Portfolio may invest in mutual funds, which are subject to management fees and other fees that may cause the costs of investing in mutual funds to be greater than the costs of owning the underlying securities directly. These indirect expenses of mutual funds are not included in the amounts shown as expenses in the Statement of Operations or in the expense ratios included in the Financial Highlights.
(G) Use of Estimates. In preparing financial statements in conformity with GAAP, the Manager makes estimates and assumptions that affect the reported amounts and disclosures in the financial statements. Actual results could differ from those estimates and assumptions.
(H) Foreign Currency Transactions. The Portfolio's books and records are maintained in U.S. dollars. Prices of securities denominated in foreign currency amounts are translated into U.S. dollars at the mean between the buying and selling rates last quoted by any major U.S. bank at the following dates:
(i) market value of investment securities, other assets and liabilities— at the valuation date; and
(ii) purchases and sales of investment securities, income and expenses—at the date of such transactions.
The assets and liabilities that are denominated in foreign currency amounts are presented at the exchange rates and market values at the close of the period. The realized and unrealized changes in net assets arising from fluctuations in exchange rates and market prices of securities are not separately presented.
Net realized gain (loss) on foreign currency transactions represents net currency gains or losses realized as a result of differences between the amounts of securities sale proceeds or purchase cost, dividends, interest and withholding taxes as recorded on the Portfolio's books, and the U.S. dollar equivalent amount actually received or paid. Net currency gains or
losses from valuing such foreign currency denominated assets and liabilities, other than investments at valuation date exchange rates, are reflected in unrealized foreign exchange gains or losses.
(I) Securities Lending. In order to realize additional income, the Portfolio may engage in securities lending, subject to the limitations set forth in the 1940 Act and relevant guidance by the staff of the Securities and Exchange Commission (“SEC”). If the Portfolio engages in securities lending, the Portfolio will lend through its custodian, JPMorgan Chase Bank, N.A., ("JPMorgan"), acting as securities lending agent on behalf of the Portfolio. Under the current arrangement, JPMorgan will manage the Portfolio's collateral in accordance with the securities lending agency agreement between the Portfolio and JPMorgan, and indemnify the Portfolio against counterparty risk. The loans will be collateralized by cash (which may be invested in a money market fund) and/or non-cash collateral (which may include U.S. Treasury securities and/or U.S. government agency securities issued or guaranteed by the United States government or its agencies or instrumentalities) at least equal at all times to the market value of the securities loaned. Non-cash collateral held at year end is segregated and cannot be transferred by the Portfolio. The Portfolio bears the risk of delay in recovery of, or loss of rights in, the securities loaned. The Portfolio may also record a realized gain or loss on securities deemed sold due to a borrower’s inability to return securities on loan. The Portfolio bears the risk of any loss on investment of cash collateral. The Portfolio will receive compensation for lending its securities in the form of fees or it will retain a portion of interest earned on the investment of any cash collateral. The Portfolio will also continue to receive interest and dividends on the securities loaned and any gain or loss in the market price of the securities loaned that may occur during the term of the loan will be for the account of the Portfolio. Income earned from securities lending activities, if any, is reflected in the Statement of Operations. As of December 31, 2022, the Portfolio did not have any portfolio securities on loan.
(J) Foreign Securities Risk. The Portfolio may invest in foreign securities, which carry certain risks that are in addition to the usual risks inherent in domestic securities. These risks include those resulting from currency fluctuations, future adverse political or economic developments and possible imposition of currency exchange blockages or other foreign governmental laws or restrictions. These risks are likely to be greater in emerging markets than in developed markets. The ability of issuers of debt securities held by the Portfolio to meet their obligations may be affected by, among other things, economic or political developments in a specific country, industry or region.
(K) Indemnifications. Under the Fund’s organizational documents, its officers and trustees are indemnified against certain liabilities that may arise out of performance of their duties to the Fund. Additionally, in the normal course of business, the Portfolio enters into contracts with third-party service providers that contain a variety of representations and warranties and that may provide general indemnifications. The Portfolio's maximum exposure under these arrangements is unknown, as this would involve future claims that may be made against the Portfolio that have not
| 20 | MainStay VP CBRE Global Infrastructure Portfolio |
yet occurred. The Manager believes that the risk of loss in connection with these potential indemnification obligations is remote. However, there can be no assurance that material liabilities related to such obligations will not arise in the future, which could adversely impact the Portfolio.
Note 3–Fees and Related Party Transactions
(A) Manager and Subadvisor. New York Life Investments, a registered investment adviser and an indirect, wholly-owned subsidiary of New York Life, serves as the Portfolio's Manager pursuant to an Amended and Restated Management Agreement ("Management Agreement"). The Manager provides offices, conducts clerical, recordkeeping and bookkeeping services and keeps most of the financial and accounting records required to be maintained by the Portfolio. Except for the portion of salaries and expenses that are the responsibility of the Portfolio, the Manager pays the salaries and expenses of all personnel affiliated with the Portfolio and certain operational expenses of the Portfolio. During a portion of the year ended December 31, 2022, the Portfolio reimbursed New York Life Investments in an amount equal to the portion of the compensation of the Chief Compliance Officer attributable to the Portfolio. CBRE Investment Management Listed Real Assets LLC ("CBRE" or the "Subadvisor"), a registered investment adviser, serves as the Subadvisor to the Portfolio and is responsible for the day-to-day portfolio management of the Portfolio. Pursuant to the terms of a Subadvisory Agreement between New York Life Investments and CBRE, New York Life Investments pays for the services of the Subadvisor.
Pursuant to the Management Agreement, the Fund pays the Manager, on behalf of the Portfolio, a monthly fee for the services performed and the facilities furnished at an annual rate of 0.85% of the Portfolio's average daily net assets.
New York Life Investments has contractually agreed to waive fees and/or reimburse expenses so that the Total Annual Portfolio Operating Expenses (excluding taxes, interest, litigation, extraordinary expenses, brokerage and other transaction expenses relating to the purchase or sale of portfolio investments, and acquired (underlying) portfolio/fund fees and expenses) of Initial Class shares and Service Class shares do not exceed 0.95% and 1.20%, respectively, of the Portfolio's average daily net assets. This agreement will remain in effect until May 1, 2023, and shall renew automatically for one-year terms unless New York Life Investments provides written notice of termination prior to the start of the next term or upon approval of the Board.
During the year ended December 31, 2022, New York Life Investments earned fees from the Portfolio in the amount of $272,866 and waived fees and/or reimbursed expenses in the amount of $58,000 and paid the Subadvisor fees of $107,406.
JPMorgan provides sub-administration and sub-accounting services to the Portfolio pursuant to an agreement with New York Life Investments. These services include calculating the daily NAVs of the Portfolio, maintaining the general ledger and sub-ledger accounts for the calculation of the Portfolio's NAVs, and assisting New York Life
Investments in conducting various aspects of the Portfolio's administrative operations. For providing these services to the Portfolio, JPMorgan is compensated by New York Life Investments.
Pursuant to an agreement between the Fund and New York Life Investments, New York Life Investments is responsible for providing or procuring certain regulatory reporting services for the Portfolio. The Portfolio will reimburse New York Life Investments for the actual costs incurred by New York Life Investments in connection with providing or procuring these services for the Portfolio.
(B) Distribution and Service Fees. The Fund, on behalf of the Portfolio, has entered into a distribution agreement with NYLIFE Distributors LLC (the “Distributor”), an affiliate of New York Life Investments. The Portfolio has adopted a distribution plan (the “Plan”) in accordance with the provisions of Rule 12b-1 under the 1940 Act. Under the Plan, the Distributor has agreed to provide, through its affiliates or independent third parties, various distribution-related, shareholder and administrative support services to the Service Class shareholders. For its services, the Distributor is entitled to a combined distribution and service fee accrued daily and paid monthly at an annual rate of 0.25% of the average daily net assets attributable to the Service Class shares of the Portfolio.
Note 4-Federal Income Tax
As of December 31, 2022, the cost and unrealized appreciation (depreciation) of the Portfolio’s investment portfolio, including applicable derivative contracts and other financial instruments, as determined on a federal income tax basis, were as follows:
| | Federal Tax
Cost | Gross
Unrealized
Appreciation | Gross
Unrealized
(Depreciation) | Net
Unrealized
Appreciation/
(Depreciation) |
| Investments in Securities | $33,585,048 | $1,906,566 | $(1,507,047) | $399,519 |
As of December 31, 2022, the components of accumulated gain (loss) on a tax basis were as follows:
Ordinary
Income | Accumulated
Capital
and Other
Gain (Loss) | Other
Temporary
Differences | Unrealized
Appreciation
(Depreciation) | Total
Accumulated
Gain (Loss) |
| $556,700 | $(36,173,359) | $— | $398,779 | $(35,217,880) |
The difference between book-basis and tax-basis unrealized appreciation (depreciation) is primarily due to wash sale adjustments.
As of December 31, 2022, for federal income tax purposes, capital loss carryforwards of $36,173,359, as shown in the table below, were available to the extent provided by the regulations to offset future realized gains of the Portfolio. Accordingly, no capital gains distributions are
Notes to Financial Statements (continued)
expected to be paid to shareholders until net gains have been realized in excess of such amounts.
Capital Loss
Available Through | Short-Term
Capital Loss
Amounts (000’s) | Long-Term
Capital Loss
Amounts (000’s) |
| Unlimited | $34,190 | $1,983 |
During the years ended December 31, 2022 and December 31, 2021, the tax character of distributions paid as reflected in the Statements of Changes in Net Assets was as follows:
| | 2022 | 2021 |
| Distributions paid from: | | |
| Ordinary Income | $414,598 | $— |
Note 5–Custodian
JPMorgan is the custodian of cash and securities held by the Portfolio. Custodial fees are charged to the Portfolio based on the Portfolio's net assets and/or the market value of securities held by the Portfolio and the number of certain transactions incurred by the Portfolio.
Note 6–Line of Credit
The Portfolio and certain other funds managed by New York Life Investments maintain a line of credit with a syndicate of banks in order to secure a source of funds for temporary purposes to meet unanticipated or excessive redemption requests.
Effective July 26, 2022, under the credit agreement (the “Credit Agreement”), the aggregate commitment amount is $600,000,000 with an additional uncommitted amount of $100,000,000. The commitment fee is an annual rate of 0.15% of the average commitment amount payable quarterly, regardless of usage, to JPMorgan, who serves as the agent to the syndicate. The commitment fee is allocated among the Portfolio and certain other funds managed by New York Life Investments based upon their respective net assets and other factors. Interest on any revolving credit loan is charged based upon the Federal Funds Rate, Daily Simple Secured Overnight Financing Rate ("SOFR") + 0.10%, or the Overnight Bank Funding Rate, whichever is higher. The Credit Agreement expires on July 25, 2023, although the Portfolio, certain other funds managed by New York Life Investments and the syndicate of banks may renew the Credit Agreement for an additional year on the same or different terms or enter into a credit agreement with a different syndicate of banks. Prior to July 26, 2022, the aggregate commitment amount and the commitment fee were the same as those under the current Credit Agreement. During the year ended December 31, 2022, there were no borrowings made or outstanding with respect to the Portfolio under the Credit Agreement.
Note 7–Interfund Lending Program
Pursuant to an exemptive order issued by the SEC, the Portfolio, along with certain other funds managed by New York Life Investments, may participate in an interfund lending program. The interfund lending program provides an alternative credit facility that permits the Portfolio and certain other funds managed by New York Life Investments to lend or borrow money for temporary purposes directly to or from one another, subject to the conditions of the exemptive order. During the year ended December 31, 2022, there were no interfund loans made or outstanding with respect to the Portfolio.
Note 8–Purchases and Sales of Securities (in 000’s)
During the year ended December 31, 2022, purchases and sales of securities, other than short-term securities, were $26,993 and $17,098, respectively.
Note 9–Capital Share Transactions
Transactions in capital shares for the years ended December 31, 2022 and December 31, 2021, were as follows:
| Initial Class | Shares | Amount |
| Year ended December 31, 2022: | | |
| Shares sold | 100,768 | $ 720,250 |
| Shares issued to shareholders in reinvestment of distributions | 4,406 | 27,062 |
| Shares redeemed | (54,059) | (380,690) |
| Net increase (decrease) | 51,115 | $ 366,622 |
| Year ended December 31, 2021: | | |
| Shares sold | 123,981 | $ 868,975 |
| Shares redeemed | (27,600) | (198,987) |
| Net increase (decrease) | 96,381 | $ 669,988 |
| |
| Service Class | Shares | Amount |
| Year ended December 31, 2022: | | |
| Shares sold | 2,756,775 | $ 19,570,484 |
| Shares issued to shareholders in reinvestment of distributions | 63,886 | 387,536 |
| Shares redeemed | (1,544,297) | (10,394,685) |
| Net increase (decrease) | 1,276,364 | $ 9,563,335 |
| Year ended December 31, 2021: | | |
| Shares sold | 921,622 | $ 6,379,949 |
| Shares redeemed | (665,037) | (4,577,232) |
| Net increase (decrease) | 256,585 | $ 1,802,717 |
Note 10–Other Matters
As of the date of this report, interest rates in the United States and many parts of the world, including certain European countries, are ascending from historically low levels. Thus, the Portfolio currently faces a heightened level of risk associated with rising interest rates. This could be driven by a variety of factors, including but not limited to central bank
| 22 | MainStay VP CBRE Global Infrastructure Portfolio |
monetary policies, changing inflation or real growth rates, general economic conditions, increasing bond issuances or reduced market demand for low yielding investments.
An outbreak of COVID-19, first detected in December 2019, has developed into a global pandemic and has resulted in travel restrictions, closure of international borders, certain businesses and securities markets, restrictions on securities trading activities, prolonged quarantines, supply chain disruptions, and lower consumer demand, as well as general concern and uncertainty. In 2022, many countries lifted some or all restrictions related to COVID-19. However, the continued impact of COVID-19 and related variants is uncertain and could further adversely affect the global economy, national economies, individual issuers and capital markets in unforeseeable ways and result in a substantial and extended economic downturn. Developments that disrupt global economies and financial markets, such as COVID-19, may magnify factors that affect the Portfolio's performance.
Note 11–Subsequent Events
In connection with the preparation of the financial statements of the Portfolio as of and for the year ended December 31, 2022, events and transactions subsequent to December 31, 2022, through the date the financial statements were issued have been evaluated by the Manager for possible adjustment and/or disclosure. No subsequent events requiring financial statement adjustment or disclosure have been identified.
Report of Independent Registered Public Accounting Firm
To the Board of Trustees of MainStay VP Funds Trust and Shareholders of
MainStay VP CBRE Global Infrastructure Portfolio
Opinion on the Financial Statements
We have audited the accompanying statement of assets and liabilities, including the portfolio of investments, of MainStay VP CBRE Global Infrastructure Portfolio (one of the portfolios constituting MainStay VP Funds Trust, referred to hereafter as the “Portfolio”) as of December 31, 2022, the related statement of operations for the year ended December 31, 2022, the statements of changes in net assets for each of the two years in the period ended December 31, 2022, including the related notes, and the financial highlights for each of the five years in the period ended December 31, 2022 (collectively referred to as the “financial statements”). In our opinion, the financial statements present fairly, in all material respects, the financial position of the Portfolio as of December 31, 2022, the results of its operations for the year then ended, the changes in its net assets for each of the two years in the period ended December 31, 2022 and the financial highlights for each of the five years in the period ended December 31, 2022 in conformity with accounting principles generally accepted in the United States of America.
Basis for Opinion
These financial statements are the responsibility of the Portfolio’s management. Our responsibility is to express an opinion on the Portfolio’s financial statements based on our audits. We are a public accounting firm registered with the Public Company Accounting Oversight Board (United States) (PCAOB) and are required to be independent with respect to the Portfolio in accordance with the U.S. federal securities laws and the applicable rules and regulations of the Securities and Exchange Commission and the PCAOB.
We conducted our audits of these financial statements in accordance with the standards of the PCAOB. Those standards require that we plan and perform the audit to obtain reasonable assurance about whether the financial statements are free of material misstatement, whether due to error or fraud.
Our audits included performing procedures to assess the risks of material misstatement of the financial statements, whether due to error or fraud, and performing procedures that respond to those risks. Such procedures included examining, on a test basis, evidence regarding the amounts and disclosures in the financial statements. Our audits also included evaluating the accounting principles used and significant estimates made by management, as well as evaluating the overall presentation of the financial statements. Our procedures included confirmation of securities owned as of December 31, 2022 by correspondence with the custodian, transfer agent and brokers; when replies were not received from brokers, we performed other auditing procedures. We believe that our audits provide a reasonable basis for our opinion.
/s/PricewaterhouseCoopers LLP
New York, New York
February 24, 2023
We have served as the auditor of one or more investment companies in the MainStay group of funds since 1984.
| 24 | MainStay VP CBRE Global Infrastructure Portfolio |
Board Consideration and Approval of Management Agreement and Subadvisory Agreement (Unaudited)
The continuation of the Management Agreement with respect to the MainStay VP CBRE Global Infrastructure Portfolio (“Portfolio”) and New York Life Investment Management LLC (“New York Life Investments”) and the Subadvisory Agreement between New York Life Investments and CBRE Investment Management Listed Real Assets LLC (“CBRE”) with respect to the Portfolio (together, “Advisory Agreements”) is subject to annual review and approval by the Board of Trustees of MainStay VP Funds Trust (“Board” of the “Trust”) in accordance with Section 15 of the Investment Company Act of 1940, as amended (“1940 Act”). At its December 6–7, 2022 meeting, the Board, which is comprised solely of Trustees who are not an “interested person” (as such term is defined in the 1940 Act) of the Trust (“Independent Trustees”), unanimously approved the continuation of each of the Advisory Agreements for a one-year period.
In reaching the decision to approve the continuation of each of the Advisory Agreements, the Board considered information and materials furnished by New York Life Investments and CBRE in connection with an annual contract review process undertaken by the Board that took place at meetings of the Board and its Contracts Committee during October 2022 through December 2022, including information and materials furnished by New York Life Investments and CBRE in response to requests prepared on behalf of the Board, and in consultation with the Board, by independent legal counsel to the Independent Trustees, which encompassed a variety of topics, including those summarized below. Information and materials requested by and furnished to the Board for consideration in connection with the contract review process included, among other items, reports on the Portfolio and “peer funds” prepared by Institutional Shareholder Services Inc. (“ISS”), an independent third-party service provider engaged by the Board to report objectively on the Portfolio’s investment performance, management fee and total expenses. The Board also considered information on the fees charged to other investment advisory clients of New York Life Investments and/or CBRE that follow investment strategies similar to those of the Portfolio, if any, and, when applicable, the rationale for any differences in the Portfolio’s management and subadvisory fees and the fees charged to those other investment advisory clients. In addition, the Board considered information regarding the legal standards and fiduciary obligations applicable to its consideration of the continuation of each of the Advisory Agreements. The contract review process, including the structure and format for information and materials provided to the Board, has been developed in consultation with the Board. The Independent Trustees also met in executive sessions with their independent legal counsel and, for portions thereof, with senior management of New York Life Investments.
The Board’s deliberations with respect to the continuation of each of the Advisory Agreements reflect a year-long process, and the Board also took into account information furnished to the Board and its Committees throughout the year, as deemed relevant and appropriate by the Trustees, including, among other items, reports on investment performance of the Portfolio and investment-related matters for the Portfolio as well as presentations from New York Life Investments and, generally annually, CBRE personnel. In addition, the Board took into account other
information received from New York Life Investments throughout the year, including, among other items, periodic reports on legal and compliance matters, risk management, portfolio turnover, brokerage commissions and non-advisory services provided to the Portfolio by New York Life Investments, as deemed relevant and appropriate by the Trustees.
In addition to information provided to the Board throughout the year, the Board received information in connection with its June 2022 meeting provided specifically in response to requests prepared on behalf of the Board, and in consultation with the Board, by independent legal counsel to the Independent Trustees regarding the Portfolio’s distribution arrangements. In addition, the Board received information regarding the Portfolio’s asset levels, share purchase and redemption activity and the payment of Rule 12b-1 and/or other fees by the applicable share classes of the Portfolio, among other information.
In considering the continuation of each of the Advisory Agreements, the Trustees reviewed and evaluated the information and factors they believed to reasonably be necessary and appropriate in light of legal advice furnished to them by independent legal counsel to the Independent Trustees and through the exercise of their own business judgment. Although individual Trustees may have weighed certain factors or information differently and the Board did not consider any single factor or information controlling in reaching its decision, the factors considered by the Board are summarized in more detail below and include, among other factors: (i) the nature, extent and quality of the services provided to the Portfolio by New York Life Investments and CBRE; (ii) the qualifications of the portfolio managers of the Portfolio and the historical investment performance of the Portfolio, New York Life Investments and CBRE; (iii) the costs of the services provided, and profits realized, by New York Life Investments and CBRE with respect to their relationships with the Portfolio; (iv) the extent to which economies of scale have been realized or may be realized if the Portfolio grows and the extent to which any economies of scale have been shared, have benefited or may benefit the Portfolio’s shareholders; and (v) the reasonableness of the Portfolio’s management and subadvisory fees and total ordinary operating expenses. Although the Board recognized that comparisons between the Portfolio’s fees and expenses and those of other funds are imprecise given different terms of agreements, variations in fund strategies and other factors, the Board considered the reasonableness of the Portfolio’s management fee and total ordinary operating expenses as compared to the peer funds identified by ISS. Throughout their considerations, the Trustees acknowledged the commitment of New York Life Investments and its affiliates to serve the MainStay Group of Funds, as well as their capacity, experience, resources, financial stability and reputations. The Trustees also acknowledged the entrepreneurial and other risks assumed by New York Life Investments in sponsoring and managing the Portfolio. With respect to the Subadvisory Agreement, the Board took into account New York Life Investments’ recommendation to approve the continuation of the Subadvisory Agreement.
The Trustees noted that, throughout the year, the Trustees are afforded an opportunity to ask questions of, and request additional information or materials from, New York Life Investments and CBRE. The Board’s
Board Consideration and Approval of Management Agreement and Subadvisory Agreement (Unaudited) (continued)
decision with respect to each of the Advisory Agreements may have also been based, in part, on the Board’s knowledge of New York Life Investments and CBRE resulting from, among other things, the Board’s consideration of each of the Advisory Agreements in prior years, the advisory agreements for other funds in the MainStay Group of Funds, the Board’s review throughout the year of the performance and operations of other funds in the MainStay Group of Funds and each Trustee’s business judgment and industry experience. In addition to considering the above-referenced factors, the Board observed that in the marketplace, notably under variable life insurance policies and variable annuity contracts for which the Portfolio serves as an investment option, there are a range of investment options available to investors and that the Portfolio’s shareholders, having had the opportunity to consider other investment options, have chosen to invest in the Portfolio.
The factors that figured prominently in the Board’s decision to approve the continuation of each of the Advisory Agreements during its December 6–7, 2022 meeting are summarized in more detail below.
Nature, Extent and Quality of Services Provided by New York Life Investments and CBRE
The Board examined the nature, extent and quality of the services that New York Life Investments provides to the Portfolio. The Board evaluated New York Life Investments’ experience and capabilities in serving as manager of the Portfolio and considered that the Portfolio operates in a “manager-of-managers” structure. The Board also considered New York Life Investments’ responsibilities and services provided pursuant to this structure, including overseeing the services provided by CBRE, evaluating the performance of CBRE, making recommendations to the Board as to whether the Subadvisory Agreement should be renewed, modified or terminated and periodically reporting to the Board regarding the results of New York Life Investments’ evaluation and monitoring functions. The Board noted that New York Life Investments manages other mutual funds, serves a variety of other investment advisory clients, including other pooled investment vehicles, and has experience overseeing mutual fund service providers, including subadvisors. The Board considered the experience of senior personnel at New York Life Investments providing management and administrative and other non-advisory services to the Portfolio. The Board observed that New York Life Investments devotes significant resources and time to providing management and administrative and other non-advisory services to the Portfolio, including New York Life Investments’ oversight and due diligence reviews of CBRE and ongoing analysis of, and interactions with, CBRE with respect to, among other things, the Portfolio’s investment performance and risks as well as CBRE’s investment capabilities and subadvisory services with respect to the Portfolio.
The Board also considered the range of services that New York Life Investments provides to the Portfolio under the terms of the Management Agreement, including: (i) fund accounting and ongoing supervisory services provided by New York Life Investments’ Fund Administration and Accounting Group; (ii) investment supervisory and analytical services provided by New York Life Investments’ Investment Consulting Group; (iii)
compliance services provided by the Trust’s Chief Compliance Officer as well as New York Life Investments’ compliance department, including supervision and implementation of the Portfolio’s compliance program; (iv) legal services provided by New York Life Investments’ Office of the General Counsel; and (v) risk management monitoring and analysis by compliance and investment personnel. In addition, the Board considered New York Life Investments’ willingness to invest in personnel and other resources, such as cyber security, information security and business continuity planning, designed to benefit the Portfolio and noted that New York Life Investments is responsible for compensating the Trust’s officers, except for a portion of the salary of the Trust’s Chief Compliance Officer. The Board recognized that New York Life Investments provides certain other non-advisory services to the Portfolio and has provided an increasingly broad array of non-advisory services to the MainStay Group of Funds as a result of regulatory and other developments, including in connection with the implementation of the MainStay Group of Funds’ derivatives risk management program and policies and procedures adopted pursuant to Rule 18f-4 under the 1940 Act.
The Board also examined the range, and the nature, extent and quality, of the investment advisory services that CBRE provides to the Portfolio and considered the terms of each of the Advisory Agreements. The Board evaluated CBRE’s experience and performance in serving as subadvisor to the Portfolio and advising other portfolios and CBRE’s track record and experience in providing investment advisory services, the experience of investment advisory, senior management and administrative personnel at CBRE. The Board considered New York Life Investments’ and CBRE’s overall resources, legal and compliance environment, capabilities, reputation, financial condition and history. In addition to information provided in connection with quarterly meetings with the Trust’s Chief Compliance Officer, the Board considered information regarding the compliance policies and procedures of New York Life Investments and CBRE and acknowledged their commitment to further developing and strengthening compliance programs relating to the Portfolio. The Board also considered CBRE’s ability to recruit and retain qualified investment professionals and willingness to invest in personnel and other resources to service and support the Portfolio. In this regard, the Board considered the qualifications and experience of the Portfolio’s portfolio managers, the number of accounts managed by the portfolio managers and the method for compensating the portfolio managers.
In addition, the Board considered information provided by New York Life Investments and CBRE regarding the operations of their respective business continuity plans in response to the COVID-19 pandemic and the continued remote work environment.
Based on these considerations, among others, the Board concluded that the Portfolio would likely continue to benefit from the nature, extent and quality of these services.
| 26 | MainStay VP CBRE Global Infrastructure Portfolio |
Investment Performance
In evaluating the Portfolio’s investment performance, the Board considered investment performance results over various periods in light of the Portfolio’s investment objective, strategies and risks. The Board considered investment reports on, and analysis of, the Portfolio’s performance provided to the Board throughout the year. These reports include, among other items, information on the Portfolio’s gross and net returns, the Portfolio’s investment performance compared to a relevant investment category and the Portfolio’s benchmark, the Portfolio’s risk-adjusted investment performance and the Portfolio’s investment performance as compared to peer funds, as appropriate, as well as portfolio attribution information and commentary on the effect of market conditions. The Board also considered information provided by ISS showing the investment performance of the Portfolio as compared to peer funds. In addition, the Board reviewed the methodology used by ISS to construct the group of peer funds for comparative purposes.
The Board also took into account its discussions with senior management at New York Life Investments concerning the Portfolio’s investment performance over various periods as well as discussions between the Portfolio’s portfolio management team and the members of the Board’s Investment Committee, which generally occur on an annual basis. In addition, the Board considered any specific actions that New York Life Investments or CBRE had taken, or had agreed to take, to seek to enhance Portfolio investment performance and the results of those actions. In considering the investment performance of the Portfolio, the Board noted that the Portfolio underperformed its peer funds for the three- and five-year periods ended July 31, 2022, and performed in line with its peer funds for the one-year period ended July 31, 2022. The Board considered its discussions with representatives from New York Life Investments and CBRE regarding the Portfolio’s investment performance.
Based on these considerations, among others, the Board concluded that its review of the Portfolio’s investment performance and related information supported a determination to approve the continuation of each of the Advisory Agreements.
Costs of the Services Provided, and Profits and Other Benefits Realized, by New York Life Investments and CBRE
The Board considered the costs of the services provided under each of the Advisory Agreements. The Board also considered the profits realized by New York Life Investments and its affiliates and CBRE due to their relationships with the Portfolio as well as by New York Life Investments and its affiliates due to their relationships with the MainStay Group of Funds. The Board considered information from New York Life Investments that CBRE’s subadvisory fee reflected an arm’s-length negotiation and that this fee is paid by New York Life Investments, not the Portfolio, and the relevance of CBRE’s profitability was considered by the Trustees in that context. On this basis, the Board primarily considered the costs and profitability for New York Life Investments and its affiliates with respect to the Portfolio.
In addition, the Board acknowledged the difficulty in obtaining reliable comparative data about mutual fund managers’ profitability because such information generally is not publicly available and may be impacted by numerous factors, including the structure of a fund manager’s organization, the types of funds it manages, the methodology used to allocate certain fixed costs to specific funds and the manager’s capital structure and costs of capital.
In evaluating the costs of the services provided by New York Life Investments and CBRE and profits realized by New York Life Investments and its affiliates and CBRE, the Board considered, among other factors, New York Life Investments’ and its affiliates’ and CBRE’s continuing investments in, or willingness to invest in, personnel and other resources to support and further enhance the management of the Portfolio, and that New York Life Investments is responsible for paying the subadvisory fee for the Portfolio. The Board also considered the financial resources of New York Life Investments and CBRE and acknowledged that New York Life Investments and CBRE must be in a position to recruit and retain experienced professional personnel and to maintain a strong financial position for New York Life Investments and CBRE to continue to provide high-quality services to the Portfolio. The Board recognized that the Portfolio benefits from the allocation of certain fixed costs among the funds in the MainStay Group of Funds, among other expected benefits resulting from its relationship with New York Life Investments.
The Board considered information regarding New York Life Investments’ methodology for calculating profitability and allocating costs provided by New York Life Investments in connection with the fund profitability analysis presented to the Board. The Board noted it had previously engaged an independent consultant to review the methods used to allocate costs among the funds in the MainStay Group of Funds. The Board also noted that the independent consultant had concluded that New York Life Investments’ methods for allocating costs and procedures for estimating overall profitability of the relationship with the funds in the MainStay Group of Funds are reasonable and that New York Life Investments continued to use the same method of calculating profit and allocating costs since the independent consultant’s review. The Board recognized the difficulty in calculating and evaluating a manager’s profitability with respect to the Portfolio and considered that other profitability methodologies may also be reasonable.
The Board also considered certain fall-out benefits that may be realized by New York Life Investments and its affiliates due to their relationships with the Portfolio, including reputational and other indirect benefits. The Board recognized, for example, the benefits to CBRE from legally permitted “soft-dollar” arrangements by which brokers provide research and other services to CBRE in exchange for commissions paid by the Portfolio with respect to trades in the Portfolio’s portfolio securities. In this regard, the Board also requested and considered information from New York Life Investments concerning other material business relationships between CBRE and its affiliates and New York Life Investments and its affiliates and considered the existence of a strategic partnership between New York Life Investments and CBRE that relates to certain current and future products and represents a potential conflict of interest associated
Board Consideration and Approval of Management Agreement and Subadvisory Agreement (Unaudited) (continued)
with New York Life Investments’ recommendation to approve the Subadvisory Agreement. In addition, the Board considered its review of the management agreement for a money market fund advised by New York Life Investments and an affiliated subadvisor that serves as an investment option for the Portfolio, including the potential rationale for and costs associated with investments in this money market fund by the Portfolio, if any, and considered information from New York Life Investments that the nature and type of specific investment advisory services provided to this money market fund are distinct from, or in addition to, the investment advisory services provided to the Portfolio. In addition, the Board considered the potential dividend received tax deduction for insurance company affiliates of New York Life Investments from the Portfolio’s securities lending activity.
The Board noted that the Portfolio serves as an investment option primarily under variable contracts issued by affiliates of New York Life Investments that would receive fees under those contracts. The Board observed that, in addition to fees earned by New York Life Investments under the Management Agreement for managing the Portfolio, New York Life Investments’ affiliates also earn revenues from serving the Portfolio in various other capacities, including as the Portfolio’s distributor. The Board considered information about these other revenues and their impact on the profitability of the relationship with the Portfolio to New York Life Investments and its affiliates. The Board noted that, although it assessed the overall profitability of the relationship with the Portfolio to New York Life Investments and its affiliates as part of the contract review process, when considering the reasonableness of the fee paid to New York Life Investments under the Management Agreement, the Board considered the profitability of New York Life Investments’ relationship with the Portfolio on a pre-tax basis and without regard to distribution expenses incurred by New York Life Investments from its own resources.
After evaluating the information deemed relevant by the Trustees, the Board concluded that any profits realized by New York Life Investments and its affiliates due to their relationships with the Portfolio were not excessive, other benefits that may accrue to New York Life Investments and its affiliates are reasonable and benefits that may accrue to CBRE and its affiliates are consistent with those expected for a subadvisor to a mutual fund. With respect to CBRE, the Board considered that any profits realized by CBRE due to its relationship with the Portfolio are the result of arm’s-length negotiations between New York Life Investments and CBRE, acknowledging that any such profits are based on the subadvisory fee paid to CBRE by New York Life Investments, not the Portfolio.
Management and Subadvisory Fees and Total Ordinary Operating Expenses
The Board evaluated the reasonableness of the fee paid under each of the Advisory Agreements and the Portfolio’s total ordinary operating expenses. The Board primarily considered the reasonableness of the management fee paid by the Portfolio to New York Life Investments because the subadvisory fee paid to CBRE is paid by New York Life Investments, not the Portfolio. The Board also considered the
reasonableness of the subadvisory fee paid by New York Life Investments and the amount of the management fee retained by New York Life Investments.
In assessing the reasonableness of the Portfolio’s fees and expenses, the Board primarily considered comparative data provided by ISS on the fees and expenses charged by similar mutual funds managed by other investment advisers. The Board reviewed the methodology used by ISS to construct the group of peer funds for comparative purposes. In addition, the Board considered information provided by New York Life Investments and CBRE on fees charged to other investment advisory clients, including institutional separate accounts and/or other funds that follow investment strategies similar to those of the Portfolio, if any. The Board considered the contractual management fee schedules of the Portfolio as compared to those of such other investment advisory clients, taking into account the rationale for any differences in fee schedules. The Board also took into account information provided by New York Life Investments about the more extensive scope of services provided to registered investment companies, such as the Portfolio, as compared with other investment advisory clients. Additionally, the Board considered the impact of expense limitation arrangements on the Portfolio’s net management fee and expenses. The Board also considered that in proposing fees for the Portfolio, New York Life Investments considers the competitive marketplace for mutual funds. The Board noted that New York Life Investments proposed an additional management fee and subadvisory fee breakpoint for the Portfolio, effective May 1, 2023.
Based on the factors outlined above, among other considerations, the Board concluded that the Portfolio’s management fee and total ordinary operating expenses are within a range that is competitive and support a conclusion that these fees and expenses are reasonable.
Economies of Scale
The Board considered information regarding economies of scale, including whether economies of scale may exist for the Portfolio and whether the Portfolio’s expense structure permits any economies of scale to be appropriately shared with the Portfolio’s beneficial shareholders. The Board also considered a report from New York Life Investments, previously prepared at the request of the Board, that addressed economies of scale, including with respect to the mutual fund business generally, and the various ways in which the benefits of economies of scale may be shared with the funds in the MainStay Group of Funds. Although the Board recognized the difficulty of determining economies of scale with precision, the Board acknowledged that economies of scale may be shared with the Portfolio in a number of ways, including, for example, through the imposition of fee breakpoints, initially setting management fee rates at scale or making additional investments to enhance the services provided to the Portfolio. The Board reviewed information from New York Life Investments showing how the Portfolio’s management fee schedule compared to fee schedules of other funds and accounts managed by New York Life Investments. The Board also
| 28 | MainStay VP CBRE Global Infrastructure Portfolio |
reviewed information from ISS showing how the Portfolio’s management fee schedule compared with fees paid for similar services by peer funds at varying asset levels.
Based on this information, the Board concluded that economies of scale are appropriately reflected for the benefit of the Portfolio’s beneficial shareholders through the Portfolio’s expense structure and other methods to share benefits from economies of scale.
Conclusion
On the basis of the information and factors summarized above, among other information and factors deemed relevant by the Trustees, and the evaluation thereof, the Board unanimously voted to approve the continuation of each of the Advisory Agreements.
Proxy Voting Policies and Procedures and Proxy Voting Record
The Portfolio is required to file with the SEC its proxy voting record for the 12-month period ending June 30 on Form N-PX. A description of the policies and procedures that are used to vote proxies relating to portfolio securities of the Portfolio is available free of charge upon request by calling 800-598-2019 or visiting the SEC's website at www.sec.gov. The most recent Form N-PX or proxy voting record is available free of charge upon request by calling 800-598-2019; visiting https://www.newyorklifeinvestments.com/investment-products/vp; or visiting the SEC’s website at www.sec.gov.
Shareholder Reports and Quarterly Portfolio Disclosure
The Portfolio is required to file its complete schedule of portfolio holdings with the SEC 60 days after its first and third fiscal quarter on Form N-PORT. The Portfolio's holdings report is available free of charge upon request by calling 800-598-2019 or by visiting the SEC’s website at www.sec.gov.
| 30 | MainStay VP CBRE Global Infrastructure Portfolio |
Board of Trustees and Officers (Unaudited)
The Trustees and officers of the Portfolio are listed below. The Board oversees the MainStay Group of Funds (which consists of MainStay Funds and MainStay Funds Trust), MainStay VP Funds Trust, MainStay MacKay DefinedTerm Municipal Opportunities Fund, MainStay CBRE Global Infrastructure Megatrends Fund, the Manager and the Subadvisors, and elects the officers of the Portfolios who are responsible for the day-to-day operations of the Portfolio. Information pertaining to the Trustees and officers is set forth below. Each Trustee serves until his or her successor
is elected and qualified or until his or her resignation, death or removal. Under the Board’s retirement policy, unless an exception is made, a Trustee must tender his or her resignation by the end of the calendar year during which he or she reaches the age of 75. The business address of each Trustee and officer listed below is 51 Madison Avenue, New York, New York 10010. None of the Trustees are “interested persons” (as defined by the 1940 Act and rules adopted by the SEC thereunder) of the Portfolio (“Independent Trustees”).
| | Name and
Year of Birth | Term of Office,
Position(s) Held and
Length of Service | Principal Occupation(s)
During Past Five Years | Number of
Portfolios in
Fund Complex
Overseen by
Trustee | Other Directorships
Held by Trustee |
| | | | | | |
| | David H. Chow
1957 | MainStay VP Funds Trust: Trustee since January 2016, Advisory Board Member (June 2015 to December 2015) | Founder and CEO, DanCourt Management, LLC since 1999 | 78 | MainStay Funds: Trustee since January 2016, Advisory Board Member (June 2015 to December 2015) (12 Funds);
MainStay Funds Trust: Trustee since January 2016, Advisory Board Member (June 2015 to December 2015) (33 Funds);
MainStay MacKay DefinedTerm Municipal Opportunities Fund: Trustee since January 2016, Advisory Board Member (June 2015 to December 2015);
MainStay CBRE Global Infrastructure Megatrends Fund: Trustee since June 2021;VanEck Vectors Group of Exchange-Traded Funds: Independent Chairman of the Board of Trustees since 2008 and Trustee since 2006 (57 portfolios); and Berea College of Kentucky: Trustee since 2009, Chair of the Committee since 2018 |
| | Susan B. Kerley
1951 | MainStay VP Funds Trust: Chairman since 2017 and Trustee since 2007* | President, Strategic Management Advisors LLC since 1990 | 78 | MainStay Funds: Chairman since 2017 and Trustee since 2007 (12 Funds); MainStay Funds Trust: Chairman since 2017 and Trustee since 1990 (33 Funds)**;
MainStay MacKay DefinedTerm Municipal Opportunities Fund: Chairman since 2017 and Trustee since 2011; MainStay CBRE Global Infrastructure Megatrends Fund: Trustee since June 2021; and Legg Mason Partners Funds: Trustee since 1991 (45 portfolios) |
| | Alan R. Latshaw
1951 | MainStay VP Funds Trust: Trustee since 2007* | Retired; Partner, Ernst & Young LLP (2002 to 2003); Partner, Arthur Andersen LLP (1989 to 2002); Consultant to the MainStay Funds Audit and Compliance Committee (2004 to 2006) | 78 | MainStay Funds: Trustee since 2006 (12 Funds);
MainStay Funds Trust: Trustee since 2007 (33 Funds)**;
MainStay MacKay DefinedTerm Municipal Opportunities Fund: Trustee since 2011; and
MainStay CBRE Global Infrastructure Megatrends Fund: Trustee since June 2021 |
Board of Trustees and Officers (Unaudited) (continued)
| | Name and
Year of Birth | Term of Office,
Position(s) Held and
Length of Service | Principal Occupation(s)
During Past Five Years | Number of
Portfolios in
Fund Complex
Overseen by
Trustee | Other Directorships
Held by Trustee |
| | | | | | |
| | Karen Hammond
1956 | MainStay VP Funds Trust: Trustee since December 2021, Advisory Board Member (June 2021 to December 2021)
| Retired, Managing Director, Devonshire Investors (2007 to 2013); Senior Vice President, Fidelity Management & Research Co. (2005 to 2007); Senior Vice President and Corporate Treasurer, FMR Corp. (2003 to 2005); Chief Operating Officer, Fidelity Investments Japan (2001 to 2003) | 78 | MainStay Funds: Trustee since December 2021, Advisory Board Member (June 2021 to December 2021) (12 Funds);
MainStay Funds Trust: Trustee since December 2021, Advisory Board Member (June 2021 to December 2021) (33 Funds);
MainStay MacKay DefinedTerm Municipal Opportunities Fund: Trustee since December 2021, Advisory Board Member (June 2021 to December 2021);
MainStay CBRE Global Infrastructure Megatrends Fund: Trustee since December 2021, Advisory Board Member (June 2021 to December 2021);
Two Harbors Investment Corp.: Director since 2018; Rhode Island State Investment Commission: Member since 2017; and Blue Cross Blue Shield of Rhode Island: Director since 2019
|
| | Jacques P. Perold
1958 | MainStay VP Funds Trust: Trustee since January 2016, Advisory Board Member (June 2015 to December 2015) | Founder and Chief Executive Officer, CapShift Advisors LLC (since 2018); President, Fidelity Management & Research Company (2009 to 2014); President and Chief Investment Officer, Geode Capital Management, LLC (2001 to 2009) | 78 | MainStay Funds: Trustee since January 2016, Advisory Board Member (June 2015 to December 2015) (12 Funds);
MainStay Funds Trust: Trustee since January 2016, Advisory Board Member (June 2015 to December 2015) (33 Funds); MainStay MacKay DefinedTerm Municipal Opportunities Fund: Trustee since January 2016, Advisory Board Member (June 2015 to December 2015);
MainStay CBRE Global Infrastructure Megatrends Fund: Trustee since June 2021; Allstate Corporation: Director since 2015;
Partners in Health: Trustee since 2019; and
MSCI Inc.: Director since 2017 |
| | Richard S. Trutanic
1952 | MainStay VP Funds Trust: Trustee since 2007* | Chairman and Chief Executive Officer, Somerset & Company (financial advisory firm) since 2004; Managing Director, The Carlyle Group (private investment firm) (2002 to 2004); Senior Managing Director, Partner and Board Member, Groupe Arnault S.A. (private investment firm) (1999 to 2002)
| 78 | MainStay Funds: Trustee since 1994 (12 Funds);
MainStay Funds Trust: Trustee since 2007 (33 Funds)**;
MainStay MacKay DefinedTerm Municipal Opportunities Fund: Trustee since 2011; and
MainStay CBRE Global Infrastructure Megatrends Fund: Trustee since June 2021 |
| * | Includes prior service as a Director of MainStay VP Series Fund, Inc., the predecessor to MainStay VP Funds Trust. |
| ** | Includes prior service as a Director/Trustee of certain predecessor entities to MainStay Funds Trust. |
| 32 | MainStay VP CBRE Global Infrastructure Portfolio |
| | Name and
Year of Birth | Position(s) Held and
Length of Service | Principal Occupation(s)
During Past Five Years | |
| | | | | |
| | Kirk C. Lehneis
1974 | President, MainStay VP Funds Trust (since 2017) | Chief Operating Officer and Senior Managing Director (since 2016), New York Life Investment Management LLC and New York Life Investment Management Holdings LLC; Member of the Board of Managers (since 2017) and Senior Managing Director (since 2018), NYLIFE Distributors LLC; Chairman of the Board and Senior Managing Director, NYLIM Service Company LLC (since 2017); Trustee, President and Principal Executive Officer of IndexIQ Trust, IndexIQ ETF Trust and IndexIQ Active ETF Trust (since January 2018); President, MainStay CBRE Global Infrastructure Megatrends Fund (since 2021), MainStay MacKay DefinedTerm Municipal Opportunities Fund, MainStay Funds and MainStay Funds Trust (since 2017); Senior Managing Director, Global Product Development (from 2015-2016); Managing Director, Product Development (from 2010-2015), New York Life Investment Management LLC | |
| | Jack R. Benintende
1964 | Treasurer and Principal Financial and Accounting Officer, MainStay VP Funds Trust (since 2007)** | Managing Director, New York Life Investment Management LLC (since 2007); Treasurer and Principal Financial and Accounting Officer, MainStay CBRE Global Infrastructure Megatrends Fund (since 2021), MainStay MacKay DefinedTerm Municipal Opportunities Fund (since 2011), MainStay Funds Trust (since 2009) and MainStay Funds (since 2007); and Assistant Treasurer, New York Life Investment Management Holdings LLC (2008 to 2012) | |
| | J. Kevin Gao
1967 | Secretary and Chief Legal Officer, MainStay VP Funds Trust (since 2010)** | Managing Director and Associate General Counsel, New York Life Investment Management LLC (since 2010); Secretary and Chief Legal Officer, MainStay CBRE Global Infrastructure Megatrends Fund (since 2021), MainStay MacKay DefinedTerm Municipal Opportunities Fund (since 2011), MainStay Funds and MainStay Funds Trust (since 2010) | |
| | Scott T. Harrington
1959 | Vice President— Administration, MainStay VP Funds Trust (since 2005)** | Managing Director, New York Life Investment Management LLC (including predecessor advisory organizations) (since 2000); Member of the Board of Directors, New York Life Trust Company (since 2009); Vice President—Administration, MainStay CBRE Global Infrastructure Megatrends Fund (since 2021), MainStay MacKay DefinedTerm Municipal Opportunities Fund (since 2011), MainStay Funds Trust and MainStay Funds (since 2009) | |
| | Kevin M. Gleason
1967 | Vice President and Chief Compliance Officer, MainStay VP Funds Trust (since June 2022) | Vice President and Chief Compliance Officer, IndexIQ, IndexIQ ETF Trust and Index IQ Active ETF Trust (since June 2022); Vice President and Chief Compliance Officer, MainStay CBRE Global Infrastructure Megatrends Fund, MainStay MacKay DefinedTerm Municipal Opportunities Fund (since June 2022); MainStay Funds Trust and MainStay Funds (since June 2022); Senior Vice President, Voya Investment Management and Chief Compliance Officer, Voya Family of Funds (2012-2022) | |
| * | The officers listed above are considered to be “interested persons” of the MainStay Group of Funds, MainStay VP Funds Trust, MainStay CBRE Global Infrastructure Megatrends Fund and MainStay MacKay DefinedTerm Municipal Opportunities Fund within the meaning of the 1940 Act because of their affiliation with the MainStay Group of Funds, New York Life Insurance Company and/or its affiliates, including New York Life Investment Management LLC, NYLIM Service Company LLC, NYLIFE Securities LLC and/or NYLIFE Distributors LLC, as described in detail in the column captioned “Principal Occupation(s) During Past Five Years.” Officers are elected annually by the Board. |
| ** | Includes prior service as an Officer of MainStay VP Series Fund, Inc., the predecessor to MainStay VP Funds Trust. |
Officers of the Trust (Who are not Trustees)*
This page intentionally left blank.
MainStay VP Portfolios
MainStay VP offers a wide range of Portfolios. The full array of MainStay VP offerings is listed here, with information about the manager, subadvisors, legal counsel, and independent registered public accounting firm.
Equity
MainStay VP American Century Sustainable Equity Portfolio1
MainStay VP Candriam Emerging Markets Equity Portfolio
MainStay VP Epoch U.S. Equity Yield Portfolio
MainStay VP Fidelity Institutional AM® Utilities Portfolio†
MainStay VP MacKay International Equity Portfolio
MainStay VP Natural Resources Portfolio
MainStay VP S&P 500 Index Portfolio2
MainStay VP Small Cap Growth Portfolio
MainStay VP Wellington Growth Portfolio
MainStay VP Wellington Mid Cap Portfolio
MainStay VP Wellington Small Cap Portfolio
MainStay VP Wellington U.S. Equity Portfolio
MainStay VP Winslow Large Cap Growth Portfolio
Mixed Asset
MainStay VP Balanced Portfolio
MainStay VP Income Builder Portfolio
MainStay VP Janus Henderson Balanced Portfolio
MainStay VP MacKay Convertible Portfolio
Income
MainStay VP Bond Portfolio
MainStay VP Floating Rate Portfolio
MainStay VP Indexed Bond Portfolio
MainStay VP MacKay Government Portfolio
MainStay VP MacKay High Yield Corporate Bond Portfolio
MainStay VP MacKay Strategic Bond Portfolio
MainStay VP PIMCO Real Return Portfolio
Money Market
MainStay VP U.S. Government Money Market Portfolio
Alternative
MainStay VP CBRE Global Infrastructure Portfolio
MainStay VP IQ Hedge Multi-Strategy Portfolio
Asset Allocation
MainStay VP Conservative Allocation Portfolio
MainStay VP Equity Allocation Portfolio
MainStay VP Growth Allocation Portfolio
MainStay VP Moderate Allocation Portfolio
Manager
New York Life Investment Management LLC
New York, New York
Subadvisors
American Century Investment Management, Inc.
Kansas City, Missouri
Brown Advisory LLC
Baltimore, Maryland
Candriam*
Strassen, Luxembourg
CBRE Investment Management Listed Real Assets LLC
Radnor, Pennsylvania
Epoch Investment Partners, Inc.
New York, New York
FIAM LLC
Smithfield, Rhode Island
IndexIQ Advisors LLC*
New York, New York
Janus Henderson Investors US LLC
Denver, Colorado
MacKay Shields LLC*
New York, New York
Newton Investment Management North America, LLC
Boston, Massachusetts
NYL Investors LLC*
New York, New York
Pacific Investment Management Company LLC
Newport Beach, California
Segall Bryant & Hamill, LLC
Chicago, Illinois
Wellington Management Company LLP
Boston, Massachusetts
Winslow Capital Management, LLC
Minneapolis, Minnesota
Legal Counsel
Dechert LLP
Washington, District of Columbia
Independent Registered Public Accounting Firm
PricewaterhouseCoopers LLP
New York, New York
Distributor
NYLIFE Distributors LLC*
Jersey City, New Jersey
Custodian
JPMorgan Chase Bank, N.A.
New York, New York
Some Portfolios may not be available in all products.
† Fidelity Institutional AM is a registered trade mark of FMR LLC. Used with permission.
* An affiliate of New York Life Investment Management LLC.
| 1. | Prior to May 1, 2022, the Portfolio's name was MainStay VP T. Rowe Price Equity Income Portfolio. |
| 2. | Prior to May 1, 2022, the Portfolio's name was MainStay VP MacKay S&P 500 Index Portfolio. |
Not part of the Annual Report
2022 Annual Report
This report is for the general information of New York Life Variable Annuities and NYLIAC Variable Universal Life Insurance Products policyowners. It must be preceded or accompanied by the appropriate product(s) and funds prospectuses if it is given to anyone who is not an owner of a New York Life variable annuity policy or a NYLIAC Variable Universal Life Insurance Product. This report does not offer for sale or solicit orders to purchase securities.
The performance data quoted in this report represents past performance. Past performance is no guarantee of future results. Due to market volatility and other factors, current performance may be lower or higher than the figures shown. The most recent month-end performance summary for your variable annuity or variable life policy is available by calling 800-598-2019 and is updated periodically on newyorklife.com.
The New York Life Variable Annuities and NYLIAC Variable Universal Life Insurance Products are issued by New York Life Insurance and Annuity Corporation (a Delaware Corporation) and distributed by NYLIFE Distributors LLC (Member FINRA/SIPC).
New York Life Insurance Company
New York Life Insurance and Annuity
Corporation (NYLIAC) (A Delaware Corporation)
51 Madison Avenue, Room 551
New York, NY 10010
newyorklife.com
newyorklifeinvestments.com
NYLIFE Distributors LLC, 30 Hudson Street, Jersey City, NJ 07302
New York Life Investment Management LLC is the investment manager to the MainStay VP Funds Trust
©2023 by NYLIFE Distributors LLC. All rights reserved.
You may obtain copies of the Prospectus and the Statement of Additional Information free of charge, upon request, by calling toll-free 800-598-2019 or writing to New York Life Insurance and Annuity Corporation, 51 Madison Avenue, New York, NY 10010.
| Not FDIC Insured | No Bank Guarantee | May Lose Value |
(NYLIAC) NI514
MainStay VP Fidelity Institutional AM® Utilities Portfolio*
Message from the President and Annual Report
December 31, 2022
Sign up for e-delivery of your shareholder reports. For full details on e-delivery, including who can participate and what you can receive via e-delivery,
please log in to newyorklifeinvestments.com/accounts.
| Not FDIC/NCUA Insured | Not a Deposit | May Lose Value | No Bank Guarantee | Not Insured by Any Government Agency |
* Fidelity Institutional AM is a registered trade mark of FMR LLC. Used with permission.
This page intentionally left blank
Message from the President
The 12-month reporting period ended December 31, 2022, proved exceptionally challenging for investors as both stock and bond markets suffered steep declines. A variety of economic and geopolitical forces drove the market’s losses, all centered around rising inflation and monetary efforts to rein it in.
Inflationary alarms began to sound well before the reporting period began. In late 2021, after nearly two years of accommodative policies designed to encourage economic growth in the face of the COVID-19 pandemic, the U.S. Federal Reserve (the “Fed”) warned of the increasing need to tighten monetary policy. Nevertheless, the pace and persistence of inflation in early 2022 caught most market participants—the Fed included—off guard. Russia’s invasion of Ukraine in February exacerbated global inflationary pressures while increasing investor uncertainty. Domestic supply shortages, international trade imbalances and rising inflation caused U.S. GDP (gross domestic product) to contract in the first and second quarters of the year, although employment and consumer spending proved resilient. Prices for petroleum surged to multi-year highs, while many key agricultural chemicals and industrial metals soared as well. Accelerating inflationary forces prompted the Fed to implement its most aggressive series of interest rate hikes since the 1980s, with a 0.25% increase in March followed by six further rate increases totaling 4.25%. International central banks generally followed suit and raised rates by varying degrees in efforts to curb local inflation, although most increases remained significantly more modest than those in the United States. Relatively high U.S. interest rates and an international risk averse sentiment pushed U.S. dollar values higher compared to most other currencies, with negative impacts on global prices for food, fuel and other key U.S.-dollar-denominated products.
The effects of these interrelated challenges were felt throughout U.S. and international financial markets. The S&P 500® Index, a widely regarded benchmark of market performance, declined by more than 18% during the reporting period. Although the energy sector generated strong gains, bolstered by elevated oil and gas prices, most other industry segments recorded losses. The more cyclical and growth-oriented sectors of consumer discretionary, information technology and real estate delivered the weakest returns, while the traditionally defensive and value-oriented
consumer staples, utilities and health care sectors outperformed. On average, international developed-country equity markets mildly outperformed their U.S. counterparts, while emerging markets lagged slightly. Fixed-income markets proved unusually volatile, with bond prices trending sharply lower as yields rose along with interest rates. Short-term yields rose faster than long-term yields, producing a yield curve inversion from July through the end of the reporting period as long-term rates remained below short-term rates. While floating-rate instruments, which feature variable interest rates that allow investors to benefit from a rising rate environment, provided a degree of insulation from inflation-driven trends, they were not immune to the market’s widespread declines.
Although, according to the most recent estimates, the annualized inflation rate in the United States has declined from a peak of 9.1% in July 2022 to 6.5% in December, the Fed remains focused on achieving more substantial and lasting reductions, aiming for a target rate of 2%. As a result, further rate hikes and additional market volatility are potential headwinds in the coming months. The question remains as to whether the Fed and other central banks will manage a so-called “soft landing,” curbing inflation while avoiding a persistent economic slowdown. If they prove successful, we believe that the increasingly attractive valuations we have observed in both equity and bond markets should eventually translate into sustainable improvements in the investment environment.
Whatever actions the Fed takes and however financial markets react, as a MainStay VP investor you can depend on us to continue managing our portfolios with the insight, expertise and level of service that have long defined New York Life Investments. Thank you for trusting us to help you meet your investment needs.
Sincerely,
Kirk C. Lehneis
President
The opinions expressed are as of the date of this report and are subject to change. There is no guarantee that any forecast made will come to pass. This material does not constitute investment advice and is not intended as an endorsement of any specific investment. Past performance is no guarantee of future results.
Not part of the Annual Report
Investors should refer to the Portfolio’s Summary Prospectus and/or Prospectus and consider the Portfolio’s investment objectives, strategies, risks, charges and expenses carefully before investing. The Summary Prospectus and/or Prospectus contain this and other information about the Portfolio. You may obtain copies of the Portfolio’s Summary Prospectus, Prospectus and Statement of Additional Information, which includes information about the MainStay VP Funds Trust's Trustees, free of charge, upon request, by calling toll-free 800-598-2019, by writing to New York Life Insurance and Annuity Corporation, 51 Madison Avenue, Room 251, New York, New York 10010 or by sending an email to MainStayShareholdersServices@nylim.com. These documents are also available at newyorklifeinvestments.com/investment-products/vp. Please read the Portfolio's Summary Prospectus and/or Prospectus carefully before investing. MainStay VP Funds Trust portfolios are separate account options which are purchased through a variable insurance or variable annuity contract.
Investment and Performance Comparison (Unaudited)
Performance data quoted represents past performance. Past performance is no guarantee of future results. Because of market volatility and other factors, current performance may be lower or higher than the figures shown. Investment return and principal value will fluctuate, and as a result, when shares are redeemed, they may be worth more or less than their original cost. The performance table and graph do not reflect any deduction of sales charges, mortality and expense charges, contract charges or administrative charges. Please refer to the Performance Summary appropriate for your policy. For performance information current to the most recent month-end, please call 800-598-2019 or visit www.newyorklife.com.
Performance figures may reflect certain fee waivers and/or expense limitations, without which total returns may have been different. For information on current fee waivers and/or expense limitations (if any), please refer to the Notes to Financial Statements.
| Average Annual Total Returns for the Year-Ended December 31, 2022 |
| Class | Inception
Date1 | One
Year | Five
Years | Ten
Years | Gross
Expense
Ratio2 |
| Initial Class Shares | 2/17/2012 | 5.57% | 8.91% | 8.56% | 0.66% |
| Service Class Shares | 2/17/2012 | 5.31 | 8.63 | 8.29 | 0.91 |
| 1. | The Portfolio replaced its subadvisor and modified its principal investment strategies and changed its classification from a diversified fund to a non-diversified fund as of November 30, 2018. Therefore, the performance information shown in this report prior to November 30, 2018 reflects the Portfolio’s prior subadvisor, principal investment strategies and diversification status. |
| 2. | The gross expense ratios presented reflect the Portfolio’s “Total Annual Portfolio Operating Expenses” from the most recent Prospectus, as supplemented, and may differ from other expense ratios disclosed in this report. |
| Benchmark Performance* | One
Year | Five
Years | Ten
Years |
| MSCI USA IMI Utilities 25/50 Index (Gross)1 | 1.24% | 9.06% | 11.03% |
| Morningstar Utilities Category Average2 | -0.52 | 7.90 | 8.82 |
| * | Returns for indices reflect no deductions for fees, expenses or taxes, except for foreign withholding taxes where applicable. Results assume reinvestment of all dividends and capital gains. An investment cannot be made directly in an index. |
| 1. | The MSCI USA IMI Utilities 25/50 Index (Gross) is the Portfolio's primary benchmark. The MSCI USA IMI Utilities 25/50 Index (Gross) is a modified market capitalization-weighted index of stocks designed to measure the performance of utilities companies in the MSCI U.S. Investable Market 2500 Index. |
| 2. | The Morningstar Utilities Category Average is representative of funds that seek capital appreciation by investing primarily in equity securities of U.S. or non-U.S. public utilities including electric, gas, and telephone-service providers. Results are based on average total returns of similar funds with all dividends and capital gain distributions reinvested. |
Cost in Dollars of a $1,000 Investment in MainStay VP Fidelity Institutional AM® Utilities Portfolio (Unaudited)
The example below is intended to describe the fees and expenses borne by shareholders during the six-month period from July 1, 2022 to December 31, 2022, and the impact of those costs on your investment.
Example
As a shareholder of the Portfolio you incur two types of costs: (1) transaction costs, including exchange fees and sales charges (loads) on purchases (as applicable), and (2) ongoing costs, including management fees, distribution and/or service (12b-1) fees and other Portfolio expenses (as applicable). This example is intended to help you understand your ongoing costs (in dollars) of investing in the Portfolio and to compare these costs with the ongoing costs of investing in other mutual funds. The example is based on an investment of $1,000 made at the beginning of the six-month period and held for the entire period from July 1, 2022 to December 31, 2022. Shares are only sold in connection with variable life and annuity contracts and the example does not reflect any contract level or transactional fees or expenses. If these costs had been included, your costs would have been higher.
This example illustrates your Portfolio’s ongoing costs in two ways:
Actual Expenses
The second and third data columns in the table below provide information about actual account values and actual expenses. You may use the information in these columns, together with the amount you invested, to estimate the expenses that you paid during the six months ended
December 31, 2022. Simply divide your account value by $1,000 (for example, an $8,600 account value divided by $1,000 = 8.6), then multiply the result by the number under the heading entitled “Expenses Paid During Period” to estimate the expenses you paid on your account during this period.
Hypothetical Example for Comparison Purposes
The fourth and fifth data columns in the table below provide information about hypothetical account values and hypothetical expenses based on the Portfolio’s actual expense ratio and an assumed rate of return of 5% per year before expenses, which is not the Portfolio’s actual return. The hypothetical account values and expenses may not be used to estimate the actual ending account balances or expenses you paid for the six-month period shown. You may use this information to compare the ongoing costs of investing in the Portfolio with the ongoing costs of investing in other mutual funds. To do so, compare this 5% hypothetical example with the 5% hypothetical examples that appear in the shareholder reports of the other mutual funds.
Please note that the expenses shown in the table are meant to highlight your ongoing costs only and do not reflect any transactional costs, such as exchange fees or sales charges (loads). Therefore, the fourth and fifth data columns of the table are useful in comparing ongoing costs only and will not help you determine the relative total costs of owning different funds. In addition, if these transactional costs were included, your costs would have been higher.
| Share Class | Beginning
Account
Value
7/1/22 | Ending Account
Value (Based
on Actual
Returns and
Expenses)
12/31/22 | Expenses
Paid
During
Period1 | Ending Account
Value (Based
on Hypothetical
5% Annualized
Return and
Actual Expenses)
12/31/22 | Expenses
Paid
During
Period1 | Net Expense
Ratio
During
Period2 |
| Initial Class Shares | $1,000.00 | $1,066.50 | $3.44 | $1,021.88 | $3.36 | 0.66% |
| Service Class Shares | $1,000.00 | $1,065.10 | $4.74 | $1,020.62 | $4.63 | 0.91% |
| 1. | Expenses are equal to the Portfolio’s annualized expense ratio of each class multiplied by the average account value over the period, divided by 365 and multiplied by 184 (to reflect the six-month period). The table above represents the actual expenses incurred during the six-month period. In addition to the fees and expenses which the Portfolio bears directly, it also indirectly bears a pro rata share of the fees and expenses of the underlying funds in which it invests. Such indirect expenses are not included in the above-reported expense figures. |
| 2. | Expenses are equal to the Portfolio's annualized expense ratio to reflect the six-month period. |
| 6 | MainStay VP Fidelity Institutional AM® Utilities Portfolio |
Industry Composition as of December 31, 2022 (Unaudited)
| Electric Utilities | 74.2% |
| Multi–Utilities | 16.4 |
| Independent Power and Renewable Electricity Producers | 7.3 |
| Electrical Equipment | 0.1 |
| Short–Term Investments | 1.9% |
| Other Assets, Less Liabilities | 0.1 |
| | 100.0% |
See Portfolio of Investments beginning on page 10 for specific holdings within these categories. The Portfolio's holdings are subject to change.
Top Ten Holdings and/or Issuers Held as of December 31, 2022 (excluding short-term investments) (Unaudited)
| 1. | NextEra Energy, Inc. |
| 2. | Southern Co. (The) |
| 3. | Constellation Energy Corp. |
| 4. | Exelon Corp. |
| 5. | PG&E Corp. |
| 6. | FirstEnergy Corp. |
| 7. | Sempra Energy |
| 8. | Dominion Energy, Inc. |
| 9. | Edison International |
| 10. | PPL Corp. |
Portfolio Management Discussion and Analysis (Unaudited)
Answers to the questions reflect the views of portfolio manager Douglas Simmons of FIAM LLC (“FIAM”) the Portfolio’s Subadvisor.
How did MainStay VP Fidelity Institutional AM® Utilities Portfolio1 perform relative to its benchmark and peers during the 12 months ended December 31, 2022?
For the 12 months ended December 31, 2022, MainStay VP Fidelity Institutional AM® Utilities Portfolio returned 5.57% for Initial Class shares and 5.31% for Service Class shares. Over the same period, both share classes outperformed the 1.24% return of the MSCI USA IMI Utilities 25/50 Index (Gross) (“the Index”), which is the Portfolio’s benchmark. For the 12 months ended December 31, 2022, both share classes also outperformed the −0.52% return of the Morningstar Utilities Category Average.2
What factors affected the Portfolio’s relative performance during the reporting period?
The Portfolio outperformed the Index primarily due to favorable security selection and sector allocation, most notably in the electric utilities subsector. Security selection in the renewable energy subsector detracted modestly.
Which subsectors were the strongest positive contributors to the Portfolio’s relative performance, and which subsectors were particularly weak?
The strongest positive contributions to the Portfolio’s relative performance from a subsector standpoint came from an overweight allocation to electric utilities, which is the largest segment of the Index. (Contributions take weightings and total returns into account.) The next two strongest contributors included a zero allocation to water utilities, and underweight allocation to multi-utilities.
The most significant detractor from the Portfolio’s relative performance was an overweight position in renewable energy. Underweight exposure to gas utilities and an out-of-Index telecommunication services allocation also detracted from relative performance.
During the reporting period, which individual stocks made the strongest positive contributions to the Portfolio’s absolute performance and which stocks detracted the most?
On an absolute return basis, the three largest positive contributors to the Portfolio’s overall performance were Constellation Energy, PG&E and Sempra Energy. Constellation Energy, the largest U.S. owner of nuclear power plants, benefited from higher commodity prices in the form of higher power prices. The company was also positioned to be a significant beneficiary of the tax subsidies in the Inflation Reduction Act of 2022. Shares in PG&E, a California electric utility, were bolstered by multiple events, including being added back into the S&P 500® Index, and the company’s receipt of a federal grant to keep a nuclear plant online. Sempra's reliable
dividend appeared attractive to many investors as they looked for stocks of companies that could potentially ride out the uptick in market volatility. Sempra's solid regulated businesses in Texas and California drove most of the company's revenue, while allowing management to invest in non-regulated areas of the market, including multiple liquified natural gas export and import terminals, gas pipelines, and other power-generating assets.
Conversely, the three most significant detractors from absolute performance during the reporting period were Sunnova Energy, Brookfield Renewable and Nextera Energy Partners. Shares of these firms declined during the year as the renewable energy industry fell out of favor.
Did the Portfolio make any significant purchases or sales during the reporting period?
The Portfolio initiated a position in electric utility PPL, which sold the U.K. part of its business during the reporting period, becoming a fully, U.S.-based company. PPL’s management has plans to grow earnings over the next few years. The Portfolio also initiated a position in Fluence Energy, a renewable energy storage company. Following the passage of the Inflation Reduction Act, we believe that demand for the company’s services will continue to increase.
The Portfolio closed its position in NRG Energy after the firm revised its 2023 outlook lower, given increases in coal costs and supply chain issues. The Portfolio also closed its position in CenterPoint Energy after valuations became less attractive.
How did the Portfolio’s sector weightings change during the reporting period?
The most notable change in the Portfolio’s subsector positioning involved increased exposure to electric utilities, ending the reporting period with approximately 13% greater exposure to the subsector than represented in the Index. The Portfolio’s overweight position was expressed through increasing exposure to Southern, Constellation Energy, and PG&E. The Portfolio also added to its existing position in NextEra Energy. Conversely, the Portfolio reduced its exposure to multi-utilities, ending the reporting period with nearly 10% less exposure to the subsector than the Index. Several positions in the subsector were trimmed during the reporting period, including Sempra Energy, Dominion Energy, and CenterPoint Energy.
How was the Portfolio positioned at the end of the reporting period?
As of December 31, 2022, the Portfolio’s most overweight positions relative to the Index were in electric utilities and independent power producers & energy traders. As of the same
| 1. | Fidelity Institutional AM is a registered trademark of FMR LLC. Used with permission. |
| 2. | See page 5 for more information on benchmark and peer group returns. |
| 8 | MainStay VP Fidelity Institutional AM® Utilities Portfolio |
date, the Portfolio’s most significant underweight positions were in multi-utilities, gas utilities and water utilities.
The opinions expressed are those of the portfolio manager as of the date of this report and are subject to change. There is no guarantee that any forecasts will come to pass. This material does not constitute investment advice and is not intended as an endorsement of any specific investment.
Not all MainStay VP Portfolios and/or share classes are available under all policies.
Portfolio of Investments December 31, 2022†
| | Shares | Value |
| Common Stocks 98.0% |
| Electric Utilities 74.2% |
| Avangrid, Inc. | 309,473 | $ 13,301,149 |
| Constellation Energy Corp. | 890,219 | 76,745,780 |
| Duke Energy Corp. | 297,313 | 30,620,266 |
| Edison International | 722,337 | 45,955,080 |
| Entergy Corp. | 286,212 | 32,198,850 |
| Eversource Energy | 199,906 | 16,760,119 |
| Exelon Corp. | 1,576,398 | 68,147,685 |
| FirstEnergy Corp. | 1,248,081 | 52,344,517 |
| NextEra Energy, Inc. | 1,877,002 | 156,917,367 |
| OGE Energy Corp. | 290,300 | 11,481,365 |
| PG&E Corp. (a) | 4,163,399 | 67,696,868 |
| Pinnacle West Capital Corp. | 100,489 | 7,641,184 |
| PPL Corp. | 1,479,917 | 43,243,175 |
| Southern Co. (The) | 1,739,064 | 124,186,560 |
| Xcel Energy, Inc. | 534,400 | 37,466,784 |
| | | 784,706,749 |
| Electrical Equipment 0.1% |
| Fluence Energy, Inc. (a)(b) | 39,466 | 676,842 |
| Independent Power and Renewable Electricity Producers 7.3% |
| AES Corp. (The) | 1,193,579 | 34,327,332 |
| Clearway Energy, Inc., Class A | 84,500 | 2,528,240 |
| Energy Harbor Corp. (a) | 90,800 | 7,173,200 |
| NextEra Energy Partners LP (b) | 225,791 | 15,825,691 |
| Sunnova Energy International, Inc. (a) | 162,985 | 2,935,360 |
| Vistra Corp. | 615,930 | 14,289,576 |
| | | 77,079,399 |
| Multi-Utilities 16.4% |
| Consolidated Edison, Inc. | 69,000 | 6,576,390 |
| Dominion Energy, Inc. | 753,343 | 46,194,993 |
| NiSource, Inc. | 1,241,984 | 34,055,201 |
| Public Service Enterprise Group, Inc. | 587,324 | 35,985,342 |
| Sempra Energy | 328,543 | 50,773,035 |
| | | 173,584,961 |
Total Common Stocks
(Cost $922,087,077) | | 1,036,047,951 |
| | Shares | | Value |
| Short-Term Investments 1.9% |
| Affiliated Investment Company 1.9% |
| MainStay U.S. Government Liquidity Fund, 3.602% (c) | 19,414,261 | | $ 19,414,261 |
| Unaffiliated Investment Company 0.0% ‡ |
| Invesco Government and Agency Portfolio, 4.301% (c)(d) | 196,000 | | 196,000 |
Total Short-Term Investments
(Cost $19,610,261) | | | 19,610,261 |
Total Investments
(Cost $941,697,338) | 99.9% | | 1,055,658,212 |
| Other Assets, Less Liabilities | 0.1 | | 1,467,740 |
| Net Assets | 100.0% | | $ 1,057,125,952 |
| † | Percentages indicated are based on Portfolio net assets. |
| ‡ | Less than one-tenth of a percent. |
| (a) | Non-income producing security. |
| (b) | All or a portion of this security was held on loan. As of December 31, 2022, the aggregate market value of securities on loan was $3,407,389; the total market value of collateral held by the Portfolio was $3,512,184. The market value of the collateral held included non-cash collateral in the form of U.S. Treasury securities with a value of $3,316,184. The Portfolio received cash collateral with a value of $196,000. (See Note 2(H)) |
| (c) | Current yield as of December 31, 2022. |
| (d) | Represents a security purchased with cash collateral received for securities on loan. |
The notes to the financial statements are an integral part of, and should be read in conjunction with, the financial statements.
| 10 | MainStay VP Fidelity Institutional AM® Utilities Portfolio |
Investments in Affiliates (in 000's)
Investments in issuers considered to be affiliate(s) of the Portfolio during the year ended December 31, 2022 for purposes of Section 2(a)(3) of the Investment Company Act of 1940, as amended, were as follows:
| Affiliated Investment Companies | Value,
Beginning
of Year | Purchases
at Cost | Proceeds
from
Sales | Net
Realized
Gain/(Loss)
on Sales | Change in
Unrealized
Appreciation/
(Depreciation) | Value,
End of
Year | Dividend
Income | Other
Distributions | Shares
End of
Year |
| MainStay U.S. Government Liquidity Fund | $ — | $ 298,260 | $ (278,846) | $ — | $ — | $ 19,414 | $ 181 | $ — | 19,414 |
The following is a summary of the fair valuations according to the inputs used as of December 31, 2022, for valuing the Portfolio’s assets:
| Description | Quoted
Prices in
Active
Markets for
Identical
Assets
(Level 1) | | Significant
Other
Observable
Inputs
(Level 2) | | Significant
Unobservable
Inputs
(Level 3) | | Total |
| Asset Valuation Inputs | | | | | | | |
| Investments in Securities (a) | | | | | | | |
| Common Stocks | $ 1,028,874,751 | | $ 7,173,200 | | $ — | | $ 1,036,047,951 |
| Short-Term Investments | | | | | | | |
| Affiliated Investment Company | 19,414,261 | | — | | — | | 19,414,261 |
| Unaffiliated Investment Company | 196,000 | | — | | — | | 196,000 |
| Total Short-Term Investments | 19,610,261 | | — | | — | | 19,610,261 |
| Total Investments in Securities | $ 1,048,485,012 | | $ 7,173,200 | | $ — | | $ 1,055,658,212 |
| (a) | For a complete listing of investments and their industries, see the Portfolio of Investments. |
The notes to the financial statements are an integral part of, and should be read in conjunction with, the financial statements.
11
Statement of Assets and Liabilities as of December 31, 2022
| Assets |
Investment in unaffiliated securities, at value
(identified cost $922,283,077) including securities on loan of $3,407,389 | $1,036,243,951 |
Investment in affiliated investment companies, at value
(identified cost $19,414,261) | 19,414,261 |
| Receivables: | |
| Dividends | 2,024,490 |
| Investment securities sold | 1,038,531 |
| Portfolio shares sold | 301,386 |
| Securities lending | 501 |
| Other assets | 5,352 |
| Total assets | 1,059,028,472 |
| Liabilities |
| Cash collateral received for securities on loan | 196,000 |
| Due to custodian | 31,100 |
| Payables: | |
| Portfolio shares redeemed | 827,453 |
| Manager (See Note 3) | 577,424 |
| NYLIFE Distributors (See Note 3) | 183,183 |
| Shareholder communication | 38,645 |
| Professional fees | 34,058 |
| Custodian | 3,464 |
| Accrued expenses | 11,193 |
| Total liabilities | 1,902,520 |
| Net assets | $1,057,125,952 |
| Composition of Net Assets |
| Shares of beneficial interest outstanding (par value of $.001 per share) unlimited number of shares authorized | $ 80,363 |
| Additional paid-in-capital | 792,521,052 |
| | 792,601,415 |
| Total distributable earnings (loss) | 264,524,537 |
| Net assets | $1,057,125,952 |
| Initial Class | |
| Net assets applicable to outstanding shares | $202,092,411 |
| Shares of beneficial interest outstanding | 15,306,283 |
| Net asset value per share outstanding | $ 13.20 |
| Service Class | |
| Net assets applicable to outstanding shares | $855,033,541 |
| Shares of beneficial interest outstanding | 65,056,222 |
| Net asset value per share outstanding | $ 13.14 |
The notes to the financial statements are an integral part of, and should be read in conjunction with, the financial statements.
| 12 | MainStay VP Fidelity Institutional AM® Utilities Portfolio |
Statement of Operations for the year ended December 31, 2022
| Investment Income (Loss) |
| Income | |
| Dividends-unaffiliated | $ 23,177,270 |
| Dividends-affiliated | 181,499 |
| Securities lending, net | 16,702 |
| Total income | 23,375,471 |
| Expenses | |
| Manager (See Note 3) | 6,983,551 |
| Distribution/Service—Service Class (See Note 3) | 2,234,795 |
| Professional fees | 118,814 |
| Shareholder communication | 53,452 |
| Custodian | 32,507 |
| Trustees | 20,522 |
| Miscellaneous | 38,726 |
| Total expenses | 9,482,367 |
| Net investment income (loss) | 13,893,104 |
| Realized and Unrealized Gain (Loss) |
| Net realized gain (loss) on: | |
| Unaffiliated investment transactions | 143,420,752 |
| Foreign currency transactions | (47) |
| Net realized gain (loss) | 143,420,705 |
| Net change in unrealized appreciation (depreciation) on: | |
| Unaffiliated investments | (99,732,431) |
| Translation of other assets and liabilities in foreign currencies | (17,719) |
| Net change in unrealized appreciation (depreciation) | (99,750,150) |
| Net realized and unrealized gain (loss) | 43,670,555 |
| Net increase (decrease) in net assets resulting from operations | $ 57,563,659 |
The notes to the financial statements are an integral part of, and should be read in conjunction with, the financial statements.
13
Statements of Changes in Net Assets
for the years ended December 31, 2022 and December 31, 2021
| | 2022 | 2021 |
| Increase (Decrease) in Net Assets |
| Operations: | | |
| Net investment income (loss) | $ 13,893,104 | $ 24,342,977 |
| Net realized gain (loss) | 143,420,705 | 72,745,772 |
| Net change in unrealized appreciation (depreciation) | (99,750,150) | 81,835,697 |
| Net increase (decrease) in net assets resulting from operations | 57,563,659 | 178,924,446 |
| Distributions to shareholders: | | |
| Initial Class | (13,874,720) | (11,646,224) |
| Service Class | (59,581,954) | (54,685,087) |
| Total distributions to shareholders | (73,456,674) | (66,331,311) |
| Capital share transactions: | | |
| Net proceeds from sales of shares | 83,467,996 | 102,621,118 |
| Net asset value of shares issued to shareholders in reinvestment of distributions | 73,456,674 | 66,331,311 |
| Cost of shares redeemed | (278,193,216) | (176,726,990) |
| Increase (decrease) in net assets derived from capital share transactions | (121,268,546) | (7,774,561) |
| Net increase (decrease) in net assets | (137,161,561) | 104,818,574 |
| Net Assets |
| Beginning of year | 1,194,287,513 | 1,089,468,939 |
| End of year | $1,057,125,952 | $1,194,287,513 |
The notes to the financial statements are an integral part of, and should be read in conjunction with, the financial statements.
| 14 | MainStay VP Fidelity Institutional AM® Utilities Portfolio |
Financial Highlights selected per share data and ratios
| | Year Ended December 31, |
| Initial Class | 2022 | | 2021 | | 2020 | | 2019 | | 2018 |
| Net asset value at beginning of year | $ 13.58 | | $ 12.35 | | $ 13.49 | | $ 11.68 | | $ 11.75 |
| Net investment income (loss) (a) | 0.20 | | 0.31 | | 0.25 | | 0.31 | | 0.28 |
| Net realized and unrealized gain (loss) | 0.43 | | 1.73 | | (0.34) | | 2.39 | | (0.18) |
| Total from investment operations | 0.63 | | 2.04 | | (0.09) | | 2.70 | | 0.10 |
| Less distributions: | | | | | | | | | |
| From net investment income | (0.30) | | (0.28) | | (0.33) | | (0.34) | | (0.15) |
| From net realized gain on investments | (0.71) | | (0.53) | | (0.72) | | (0.55) | | (0.02) |
| Total distributions | (1.01) | | (0.81) | | (1.05) | | (0.89) | | (0.17) |
| Net asset value at end of year | $ 13.20 | | $ 13.58 | | $ 12.35 | | $ 13.49 | | $ 11.68 |
| Total investment return (b) | 5.57% | | 17.24% | | (0.38)% | | 23.26% | | 0.80% |
| Ratios (to average net assets)/Supplemental Data: | | | | | | | | | |
| Net investment income (loss) | 1.46% | | 2.41% | | 2.06% | | 2.41% | | 2.31% |
| Net expenses (c) | 0.66% | | 0.66% | | 0.67% | | 0.68% | | 0.76% |
| Portfolio turnover rate | 53% | | 34% | | 62% | | 47% | | 84% |
| Net assets at end of year (in 000's) | $ 202,092 | | $ 215,594 | | $ 135,814 | | $ 97,503 | | $ 81,716 |
| (a) | Per share data based on average shares outstanding during the year. |
| (b) | Total return does not reflect any deduction of sales charges, mortality and expense charges, contract charges or administrative charges. For periods of less than one year, total return is not annualized. |
| (c) | In addition to the fees and expenses which the Portfolio bears directly, it also indirectly bears a pro-rata share of the fees and expenses of the underlying funds in which it invests. Such indirect expenses are not included in the above expense ratios. |
| | Year Ended December 31, |
| Service Class | 2022 | | 2021 | | 2020 | | 2019 | | 2018 |
| Net asset value at beginning of year | $ 13.51 | | $ 12.29 | | $ 13.43 | | $ 11.63 | | $ 11.69 |
| Net investment income (loss) (a) | 0.17 | | 0.27 | | 0.22 | | 0.28 | | 0.25 |
| Net realized and unrealized gain (loss) | 0.43 | | 1.72 | | (0.35) | | 2.37 | | (0.18) |
| Total from investment operations | 0.60 | | 1.99 | | (0.13) | | 2.65 | | 0.07 |
| Less distributions: | | | | | | | | | |
| From net investment income | (0.26) | | (0.24) | | (0.29) | | (0.30) | | (0.11) |
| From net realized gain on investments | (0.71) | | (0.53) | | (0.72) | | (0.55) | | (0.02) |
| Total distributions | (0.97) | | (0.77) | | (1.01) | | (0.85) | | (0.13) |
| Net asset value at end of year | $ 13.14 | | $ 13.51 | | $ 12.29 | | $ 13.43 | | $ 11.63 |
| Total investment return (b) | 5.31% | | 16.95% | | (0.63)% | | 22.95% | | 0.55% |
| Ratios (to average net assets)/Supplemental Data: | | | | | | | | | |
| Net investment income (loss) | 1.22% | | 2.14% | | 1.80% | | 2.15% | | 2.08% |
| Net expenses (c) | 0.91% | | 0.91% | | 0.92% | | 0.93% | | 1.01% |
| Portfolio turnover rate | 53% | | 34% | | 62% | | 47% | | 84% |
| Net assets at end of year (in 000's) | $ 855,034 | | $ 978,694 | | $ 953,655 | | $ 1,121,657 | | $ 1,066,963 |
| (a) | Per share data based on average shares outstanding during the year. |
| (b) | Total return does not reflect any deduction of sales charges, mortality and expense charges, contract charges or administrative charges. For periods of less than one year, total return is not annualized. |
| (c) | In addition to the fees and expenses which the Portfolio bears directly, it also indirectly bears a pro-rata share of the fees and expenses of the underlying funds in which it invests. Such indirect expenses are not included in the above expense ratios. |
The notes to the financial statements are an integral part of, and should be read in conjunction with, the financial statements.
15
Notes to Financial Statements
Note 1–Organization and Business
MainStay VP Funds Trust (the “Fund”) was organized as a Delaware statutory trust on February 1, 2011. The Fund is registered under the Investment Company Act of 1940, as amended (the “1940 Act”), as an open-end management investment company. The Fund is comprised of thirty-one separate series (collectively referred to as the “Portfolios”). These financial statements and notes relate to the MainStay VP Fidelity Institutional AM® Utilities Portfolio (the "Portfolio"), a "non-diversified” portfolio, as that term is defined in the 1940 Act, as interpreted or modified by regulatory authorities having jurisdiction, from time to time.
Shares of the Portfolio are currently offered to certain separate accounts to fund variable annuity policies and variable universal life insurance policies issued by New York Life Insurance and Annuity Corporation (“NYLIAC”), a wholly-owned subsidiary of New York Life Insurance Company (“New York Life”) and may also be offered to fund variable annuity policies and variable universal life insurance policies issued by other insurance companies. NYLIAC allocates shares of the Portfolio to, among others, certain NYLIAC separate accounts. Shares of the Portfolio are also offered to the MainStay VP Conservative Allocation Portfolio, MainStay VP Moderate Allocation Portfolio, MainStay VP Growth Allocation Portfolio and MainStay VP Equity Allocation Portfolio, which operate as “funds-of-funds," and other variable insurance funds.
The following table lists the Portfolio's share classes that have been registered and commenced operations:
| Class | Commenced Operations |
| Initial Class | February 17, 2012 |
| Service Class | February 17, 2012 |
Shares of the Portfolio are offered and are redeemed at a price equal to their respective net asset value (“NAV”) per share. No sales or redemption charge is applicable to the purchase or redemption of the Portfolio's shares. Under the terms of the Fund’s multiple class plan, adopted pursuant to Rule 18f-3 under the 1940 Act, the classes differ in that, among other things, Service Class shares of the Portfolio pay a combined distribution and service fee of 0.25% of average daily net assets attributable to Service Class shares of the Portfolio to the Distributor (as defined in Note 3(B)) pursuant to a plan adopted in accordance with Rule 12b-1 under the 1940 Act. Contract owners of variable annuity contracts purchased after June 2, 2003, are permitted to invest only in the Service Class shares.
The Portfolio's investment objective is to seek total return.
Note 2–Significant Accounting Policies
The Portfolio is an investment company and accordingly follows the investment company accounting and reporting guidance of the Financial Accounting Standards Board (“FASB”) Accounting Standards Codification Topic 946 Financial Services—Investment Companies. The Portfolio prepares its financial statements in accordance with generally accepted
accounting principles (“GAAP”) in the United States of America and follows the significant accounting policies described below.
(A) Securities Valuation. Investments are usually valued as of the close of regular trading on the New York Stock Exchange (the "Exchange") (usually 4:00 p.m. Eastern time) on each day the Portfolio is open for business ("valuation date").
Effective September 8, 2022, and pursuant to Rule 2a-5 under the 1940 Act, the Board of Trustees of the Fund (the "Board") designated New York Life Investment Management LLC (“New York Life Investments” or the "Manager") as its Valuation Designee (the "Valuation Designee"). The Valuation Designee is responsible for performing fair valuations relating to all investments in the Portfolio’s portfolio for which market quotations are not readily available; periodically assessing and managing material valuation risks; establishing and applying fair value methodologies; testing fair valuation methodologies; evaluating and overseeing pricing services; ensuring appropriate segregation of valuation and portfolio management functions; providing quarterly, annual and prompt reporting to the Board, as appropriate; identifying potential conflicts of interest; and maintaining appropriate records. The Valuation Designee has established a valuation committee ("Valuation Committee") to assist in carrying out the Valuation Designee’s responsibilities and establish prices of securities for which market quotations are not readily available. The Portfolio’s and the Valuation Designee's policies and procedures ("Valuation Procedures") govern the Valuation Designee’s selection and application of methodologies for determining and calculating the fair value of Portfolio investments. The Valuation Designee may value the Portfolio's portfolio securities for which market quotations are not readily available and other Portfolio assets utilizing inputs from pricing services and other third-party sources (together, “Pricing Sources”). The Valuation Committee meets (in person, via electronic mail or via teleconference) on an ad-hoc basis to determine fair valuations and on a quarterly basis to review fair value events with respect to certain securities for which market quotations are not readily available, including valuation risks and back-testing results, and preview reports to the Board.
The Valuation Committee establishes prices of securities for which market quotations are not readily available based on such methodologies and measurements on a regular basis after considering information that is reasonably available and deemed relevant by the Valuation Committee. The Board shall oversee the Valuation Designee and review fair valuation materials on a prompt, quarterly and annual basis and approve proposed revisions to the Valuation Procedures.
Investments for which market quotations are not readily available are valued at fair value as determined in good faith pursuant to the Valuation Procedures. A market quotation is readily available only when that quotation is a quoted price (unadjusted) in active markets for identical investments that the Portfolio can access at the measurement date, provided that a quotation will not be readily available if it is not reliable. "Fair value" is defined as the price the Portfolio would reasonably expect to receive upon selling an asset or liability in an orderly transaction to an independent buyer in the principal or most advantageous market for the
| 16 | MainStay VP Fidelity Institutional AM® Utilities Portfolio |
asset or liability. Fair value measurements are determined within a framework that establishes a three-tier hierarchy that maximizes the use of observable market data and minimizes the use of unobservable inputs to establish a classification of fair value measurements for disclosure purposes. "Inputs" refer broadly to the assumptions that market participants would use in pricing the asset or liability, including assumptions about risk, such as the risk inherent in a particular valuation technique used to measure fair value using a pricing model and/or the risk inherent in the inputs for the valuation technique. Inputs may be observable or unobservable. Observable inputs reflect the assumptions market participants would use in pricing the asset or liability based on market data obtained from sources independent of the Portfolio. Unobservable inputs reflect the Portfolio’s own assumptions about the assumptions market participants would use in pricing the asset or liability based on the information available. The inputs or methodology used for valuing assets or liabilities may not be an indication of the risks associated with investing in those assets or liabilities. The three-tier hierarchy of inputs is summarized below.
| • | Level 1—quoted prices (unadjusted) in active markets for an identical asset or liability |
| • | Level 2—other significant observable inputs (including quoted prices for a similar asset or liability in active markets, interest rates and yield curves, prepayment speeds, credit risk, etc.) |
| • | Level 3—significant unobservable inputs (including the Portfolio's own assumptions about the assumptions that market participants would use in measuring fair value of an asset or liability) |
The level of an asset or liability within the fair value hierarchy is based on the lowest level of an input, both individually and in the aggregate, that is significant to the fair value measurement. The aggregate value by input level of the Portfolio’s assets and liabilities as of December 31, 2022, is included at the end of the Portfolio of Investments.
The Portfolio may use third-party vendor evaluations, whose prices may be derived from one or more of the following standard inputs, among others:
| • Broker/dealer quotes | • Benchmark securities |
| • Two-sided markets | • Reference data (corporate actions or material event notices) |
| • Bids/offers | • Monthly payment information |
| • Industry and economic events | • Reported trades |
An asset or liability for which a market quotation is not readily available is valued by methods deemed reasonable in good faith by the Valuation Committee, following the Valuation Procedures to represent fair value. Under these procedures, the Valuation Designee generally uses a market-based approach which may use related or comparable assets or liabilities, recent transactions, market multiples, book values and other relevant information. The Valuation Designee may also use an income-based valuation approach in which the anticipated future cash flows of the asset or liability are discounted to calculate fair value.
Discounts may also be applied due to the nature and/or duration of any restrictions on the disposition of the asset or liability. Fair value represents a good faith approximation of the value of a security. Fair value determinations involve the consideration of a number of subjective factors, an analysis of applicable facts and circumstances and the exercise of judgment. As a result, it is possible that the fair value for a security determined in good faith in accordance with the Valuation Procedures may differ from valuations for the same security determined for other funds using their own valuation procedures. Although the Valuation Procedures are designed to value a security at the price the Portfolio may reasonably expect to receive upon the security's sale in an orderly transaction, there can be no assurance that any fair value determination thereunder would, in fact, approximate the amount that the Portfolio would actually realize upon the sale of the security or the price at which the security would trade if a reliable market price were readily available. During the year ended December 31, 2022, there were no material changes to the fair value methodologies.
Securities which may be valued in this manner include, but are not limited to: (i) a security for which trading has been halted or suspended or otherwise does not have a readily available market quotation on a given day; (ii) a debt security that has recently gone into default and for which there is not a current market quotation; (iii) a security of an issuer that has entered into a restructuring; (iv) a security that has been delisted from a national exchange; (v) a security subject to trading collars for which no or limited trading takes place; and (vi) a security whose principal market has been temporarily closed at a time when, under normal conditions, it would be open. Securities valued in this manner are generally categorized as Level 2 or 3 in the hierarchy.
Equity securities are valued at the last quoted sales prices as of the close of regular trading on the relevant exchange on each valuation date. Securities that are not traded on the valuation date are valued at the mean of the last quoted bid and ask prices. Prices are normally taken from the principal market in which each security trades. These securities are generally categorized as Level 1 in the hierarchy.
Investments in mutual funds, including money market funds, are valued at their respective NAVs at the close of business each day on the valuation date. These securities are generally categorized as Level 1 in the hierarchy.
Temporary cash investments acquired in excess of 60 days to maturity at the time of purchase are valued using the latest bid prices or using valuations based on a matrix system (which considers such factors as security prices, yields, maturities and ratings), both as furnished by independent pricing services. Temporary cash investments that mature in 60 days or less at the time of purchase ("Short-Term Investments") are valued using the amortized cost method of valuation, unless the use of such method would be inappropriate. The amortized cost method involves valuing a security at its cost on the date of purchase and thereafter assuming a constant amortization to maturity of the difference between such cost and the value on maturity date. Amortized cost approximates the current fair value of a security. Securities valued using the amortized
Notes to Financial Statements (continued)
cost method are not valued using quoted prices in an active market and are generally categorized as Level 2 in the hierarchy.
The information above is not intended to reflect an exhaustive list of the methodologies that may be used to value portfolio investments. The Valuation Procedures permit the use of a variety of valuation methodologies in connection with valuing portfolio investments. The methodology used for a specific type of investment may vary based on the market data available or other considerations. The methodologies summarized above may not represent the specific means by which portfolio investments are valued on any particular business day.
(B) Income Taxes. The Portfolio's policy is to comply with the requirements of the Internal Revenue Code of 1986, as amended (the “Internal Revenue Code”), applicable to regulated investment companies and to distribute all of its taxable income to the shareholders of the Portfolio within the allowable time limits.
The Manager evaluates the Portfolio’s tax positions to determine if the tax positions taken meet the minimum recognition threshold in connection with accounting for uncertainties in income tax positions taken or expected to be taken for the purposes of measuring and recognizing tax liabilities in the financial statements. Recognition of tax benefits of an uncertain tax position is permitted only to the extent the position is “more likely than not” to be sustained assuming examination by taxing authorities. The Manager analyzed the Portfolio's tax positions taken on federal, state and local income tax returns for all open tax years (for up to three tax years) and has concluded that no provisions for federal, state and local income tax are required in the Portfolio's financial statements. The Portfolio's federal, state and local income tax and federal excise tax returns for tax years for which the applicable statutes of limitations have not expired are subject to examination by the Internal Revenue Service and state and local departments of revenue.
(C) Dividends and Distributions to Shareholders. Dividends and distributions are recorded on the ex-dividend date. The Portfolio intends to declare and pay dividends from net investment income and distributions from net realized capital and currency gains, if any, at least annually. All dividends and distributions are reinvested at NAV in the same class of shares of the Portfolio. Dividends and distributions to shareholders are determined in accordance with federal income tax regulations and may differ from determinations using GAAP.
(D) Security Transactions and Investment Income. The Portfolio records security transactions on the trade date. Realized gains and losses on security transactions are determined using the identified cost method. Dividend income is recognized on the ex-dividend date, net of any foreign tax withheld at the source, and interest income is accrued as earned using the effective interest rate method. Distributions received from real estate investment trusts may be classified as dividends, capital gains and/or return of capital.
Investment income and realized and unrealized gains and losses on investments of the Portfolio are allocated pro rata to the separate classes
of shares based upon their relative net assets on the date the income is earned or realized and unrealized gains and losses are incurred.
(E) Expenses. Expenses of the Fund are allocated to the individual Portfolios in proportion to the net assets of the respective Portfolios when the expenses are incurred, except where direct allocations of expenses can be made. Expenses (other than fees incurred under the distribution and service plans, further discussed in Note 3(B), which are charged directly to the Service Class shares) are allocated to separate classes of shares pro rata based upon their relative net assets on the date the expenses are incurred. The expenses borne by the Portfolio, including those of related parties to the Portfolio, are shown in the Statement of Operations.
Additionally, the Portfolio may invest in mutual funds, which are subject to management fees and other fees that may cause the costs of investing in mutual funds to be greater than the costs of owning the underlying securities directly. These indirect expenses of mutual funds are not included in the amounts shown as expenses in the Statement of Operations or in the expense ratios included in the Financial Highlights.
(F) Use of Estimates. In preparing financial statements in conformity with GAAP, the Manager makes estimates and assumptions that affect the reported amounts and disclosures in the financial statements. Actual results could differ from those estimates and assumptions.
(G) Foreign Currency Transactions. The Portfolio's books and records are maintained in U.S. dollars. Prices of securities denominated in foreign currency amounts are translated into U.S. dollars at the mean between the buying and selling rates last quoted by any major U.S. bank at the following dates:
(i) market value of investment securities, other assets and liabilities— at the valuation date; and
(ii) purchases and sales of investment securities, income and expenses—at the date of such transactions.
The assets and liabilities that are denominated in foreign currency amounts are presented at the exchange rates and market values at the close of the period. The realized and unrealized changes in net assets arising from fluctuations in exchange rates and market prices of securities are not separately presented.
Net realized gain (loss) on foreign currency transactions represents net currency gains or losses realized as a result of differences between the amounts of securities sale proceeds or purchase cost, dividends, interest and withholding taxes as recorded on the Portfolio's books, and the U.S. dollar equivalent amount actually received or paid. Net currency gains or losses from valuing such foreign currency denominated assets and liabilities, other than investments at valuation date exchange rates, are reflected in unrealized foreign exchange gains or losses.
(H) Securities Lending. In order to realize additional income, the Portfolio may engage in securities lending, subject to the limitations set forth in the 1940 Act and relevant guidance by the staff of the Securities
| 18 | MainStay VP Fidelity Institutional AM® Utilities Portfolio |
and Exchange Commission (“SEC”). If the Portfolio engages in securities lending, the Portfolio will lend through its custodian, JPMorgan Chase Bank, N.A., ("JPMorgan"), acting as securities lending agent on behalf of the Portfolio. Under the current arrangement, JPMorgan will manage the Portfolio's collateral in accordance with the securities lending agency agreement between the Portfolio and JPMorgan, and indemnify the Portfolio against counterparty risk. The loans will be collateralized by cash (which may be invested in a money market fund) and/or non-cash collateral (which may include U.S. Treasury securities and/or U.S. government agency securities issued or guaranteed by the United States government or its agencies or instrumentalities) at least equal at all times to the market value of the securities loaned. Non-cash collateral held at year end is segregated and cannot be transferred by the Portfolio. The Portfolio bears the risk of delay in recovery of, or loss of rights in, the securities loaned. The Portfolio may also record a realized gain or loss on securities deemed sold due to a borrower’s inability to return securities on loan. The Portfolio bears the risk of any loss on investment of cash collateral. The Portfolio will receive compensation for lending its securities in the form of fees or it will retain a portion of interest earned on the investment of any cash collateral. The Portfolio will also continue to receive interest and dividends on the securities loaned and any gain or loss in the market price of the securities loaned that may occur during the term of the loan will be for the account of the Portfolio. Income earned from securities lending activities, if any, is reflected in the Statement of Operations. Securities on loan as of December 31, 2022, are shown in the Portfolio of Investments.
(I) Foreign Securities Risk. The Portfolio may invest in foreign securities, which carry certain risks that are in addition to the usual risks inherent in domestic securities. These risks include those resulting from currency fluctuations, future adverse political or economic developments and possible imposition of currency exchange blockages or other foreign governmental laws or restrictions. These risks are likely to be greater in emerging markets than in developed markets. The ability of issuers of debt securities held by the Portfolio to meet their obligations may be affected by, among other things, economic or political developments in a specific country, industry or region.
(J) Indemnifications. Under the Fund’s organizational documents, its officers and trustees are indemnified against certain liabilities that may arise out of performance of their duties to the Fund. Additionally, in the normal course of business, the Portfolio enters into contracts with third-party service providers that contain a variety of representations and warranties and that may provide general indemnifications. The Portfolio's maximum exposure under these arrangements is unknown, as this would involve future claims that may be made against the Portfolio that have not yet occurred. The Manager believes that the risk of loss in connection with these potential indemnification obligations is remote. However, there can be no assurance that material liabilities related to such obligations will not arise in the future, which could adversely impact the Portfolio.
Note 3–Fees and Related Party Transactions
(A) Manager and Subadvisor. New York Life Investments, a registered investment adviser and an indirect, wholly-owned subsidiary of New York Life, serves as the Portfolio’s Manager pursuant to an Amended and Restated Management Agreement (“Management Agreement”). The Manager provides offices, conducts clerical, recordkeeping and bookkeeping services, and keeps most of the financial and accounting records required to be maintained by the Portfolio. Except for the portion of salaries and expenses that are the responsibility of the Portfolio, the Manager pays the salaries and expenses of all personnel affiliated with the Portfolio and certain operational expenses of the Portfolio. During a portion of the year ended December 31, 2022, the Portfolio reimbursed New York Life Investments in an amount equal to the portion of the compensation of the Chief Compliance Officer attributable to the Portfolio. FIAM LLC (“FIAM or the “Subadvisor”) a registered investment adviser, serves as Subadvisor to the Portfolio and is responsible for the day-to-day portfolio management of the Portfolio. Pursuant to the terms of a Subadvisory Agreement between New York Life Investments and FIAM, New York Life Investments pays for the services of the Subadvisor.
Pursuant to the Management Agreement, the Fund pays the Manager, on behalf of the Portfolio, a monthly fee for the services performed and the facilities furnished at an annual rate of the Portfolio's average daily net assets as follows: 0.64% up to $1 billion; 0.61% from $1 billion to $3 billion; and 0.60% in excess of $3 billion. During the year ended December 31, 2022, the effective management fee rate was 0.64%.
During the year ended December 31, 2022, New York Life Investments earned fees from the Portfolio in the amount of $6,983,551 and paid the Subadvisor in the amount of $2,750,386.
JPMorgan provides sub-administration and sub-accounting services to the Portfolio pursuant to an agreement with New York Life Investments. These services include calculating the daily NAVs of the Portfolio, maintaining the general ledger and sub-ledger accounts for the calculation of the Portfolio's NAVs, and assisting New York Life Investments in conducting various aspects of the Portfolio's administrative operations. For providing these services to the Portfolio, JPMorgan is compensated by New York Life Investments.
Pursuant to an agreement between the Fund and New York Life Investments, New York Life Investments is responsible for providing or procuring certain regulatory reporting services for the Portfolio. The Portfolio will reimburse New York Life Investments for the actual costs incurred by New York Life Investments in connection with providing or procuring these services for the Portfolio.
(B) Distribution and Service Fees. The Fund, on behalf of the Portfolio, has entered into a distribution agreement with NYLIFE Distributors LLC (the “Distributor”), an affiliate of New York Life Investments. The Portfolio has adopted a distribution plan (the “Plan”) in accordance with the provisions of Rule 12b-1 under the 1940 Act. Under the Plan, the Distributor has agreed to provide, through its affiliates or independent third parties, various distribution-related, shareholder and
Notes to Financial Statements (continued)
administrative support services to the Service Class shareholders. For its services, the Distributor is entitled to a combined distribution and service fee accrued daily and paid monthly at an annual rate of 0.25% of the average daily net assets attributable to the Service Class shares of the Portfolio.
Note 4-Federal Income Tax
As of December 31, 2022, the cost and unrealized appreciation (depreciation) of the Portfolio’s investment portfolio, including applicable derivative contracts and other financial instruments, as determined on a federal income tax basis, were as follows:
| | Federal Tax
Cost | Gross
Unrealized
Appreciation | Gross
Unrealized
(Depreciation) | Net
Unrealized
Appreciation/
(Depreciation) |
| Investments in Securities | $944,992,092 | $123,923,794 | $(13,257,674) | $110,666,120 |
As of December 31, 2022, the components of accumulated gain (loss) on a tax basis were as follows:
Ordinary
Income | Accumulated
Capital
and Other
Gain (Loss) | Other
Temporary
Differences | Unrealized
Appreciation
(Depreciation) | Total
Accumulated
Gain (Loss) |
| $26,478,200 | $127,401,743 | $— | $110,644,594 | $264,524,537 |
The difference between book-basis and tax-basis unrealized appreciation (depreciation) is primarily due to wash sale adjustments.
The following table discloses the current year reclassifications between total distributable earnings (loss) and additional paid-in capital arising from permanent differences; net assets as of December 31, 2022 were not affected.
| | Total
Distributable
Earnings (Loss) | Additional
Paid-In
Capital |
| | $(409,810) | $409,810 |
The reclassifications for the Portfolio are primarily due to equalization.
During the years ended December 31, 2022 and December 31, 2021, the tax character of distributions paid as reflected in the Statements of Changes in Net Assets was as follows:
| | 2022 | 2021 |
| Distributions paid from: | | |
| Ordinary Income | $23,960,588 | $21,083,694 |
| Long-Term Capital Gains | 49,496,086 | 45,247,617 |
| Total | $73,456,674 | $66,331,311 |
Note 5–Custodian
JPMorgan is the custodian of cash and securities held by the Portfolio. Custodial fees are charged to the Portfolio based on the Portfolio's net assets and/or the market value of securities held by the Portfolio and the number of certain transactions incurred by the Portfolio.
Note 6–Line of Credit
The Portfolio and certain other funds managed by New York Life Investments maintain a line of credit with a syndicate of banks in order to secure a source of funds for temporary purposes to meet unanticipated or excessive redemption requests.
Effective July 26, 2022, under the credit agreement (the “Credit Agreement”), the aggregate commitment amount is $600,000,000 with an additional uncommitted amount of $100,000,000. The commitment fee is an annual rate of 0.15% of the average commitment amount payable quarterly, regardless of usage, to JPMorgan, who serves as the agent to the syndicate. The commitment fee is allocated among the Portfolio and certain other funds managed by New York Life Investments based upon their respective net assets and other factors. Interest on any revolving credit loan is charged based upon the Federal Funds Rate, Daily Simple Secured Overnight Financing Rate ("SOFR") + 0.10%, or the Overnight Bank Funding Rate, whichever is higher. The Credit Agreement expires on July 25, 2023, although the Portfolio, certain other funds managed by New York Life Investments and the syndicate of banks may renew the Credit Agreement for an additional year on the same or different terms or enter into a credit agreement with a different syndicate of banks. Prior to July 26, 2022, the aggregate commitment amount and the commitment fee were the same as those under the current Credit Agreement. During the year ended December 31, 2022, there were no borrowings made or outstanding with respect to the Portfolio under the Credit Agreement.
Note 7–Interfund Lending Program
Pursuant to an exemptive order issued by the SEC, the Portfolio, along with certain other funds managed by New York Life Investments, may participate in an interfund lending program. The interfund lending program provides an alternative credit facility that permits the Portfolio and certain other funds managed by New York Life Investments to lend or borrow money for temporary purposes directly to or from one another, subject to the conditions of the exemptive order. During the year ended December 31, 2022, there were no interfund loans made or outstanding with respect to the Portfolio.
Note 8–Purchases and Sales of Securities (in 000’s)
During the year ended December 31, 2022, purchases and sales of securities, other than short-term securities, were $579,780 and $770,708, respectively.
The Portfolio may purchase securities from or sell securities to other portfolios managed by the Subadvisor. These interportfolio transactions
| 20 | MainStay VP Fidelity Institutional AM® Utilities Portfolio |
are primarily used for cash management purposes and are made pursuant to Rule 17a-7 under the 1940 Act. The Rule 17a-7 transactions during the year ended December 31, 2022, were as follows:
Purchases
(000's) | Sales
(000's) | Realized
Gain / (Loss)
(000's) |
| $9,620 | $11,521 | $2,770 |
Note 9–Capital Share Transactions
Transactions in capital shares for the years ended December 31, 2022 and December 31, 2021, were as follows:
| Initial Class | Shares | Amount |
| Year ended December 31, 2022: | | |
| Shares sold | 1,583,682 | $ 20,686,389 |
| Shares issued to shareholders in reinvestment of distributions | 1,176,971 | 13,874,720 |
| Shares redeemed | (3,335,783) | (45,895,265) |
| Net increase (decrease) | (575,130) | $ (11,334,156) |
| Year ended December 31, 2021: | | |
| Shares sold | 5,619,410 | $ 71,207,565 |
| Shares issued to shareholders in reinvestment of distributions | 956,844 | 11,646,224 |
| Shares redeemed | (1,694,431) | (21,841,993) |
| Net increase (decrease) | 4,881,823 | $ 61,011,796 |
| |
| Service Class | Shares | Amount |
| Year ended December 31, 2022: | | |
| Shares sold | 4,652,743 | $ 62,781,607 |
| Shares issued to shareholders in reinvestment of distributions | 5,074,648 | 59,581,954 |
| Shares redeemed | (17,109,749) | (232,297,951) |
| Net increase (decrease) | (7,382,358) | $(109,934,390) |
| Year ended December 31, 2021: | | |
| Shares sold | 2,489,554 | $ 31,413,553 |
| Shares issued to shareholders in reinvestment of distributions | 4,511,710 | 54,685,087 |
| Shares redeemed | (12,158,673) | (154,884,997) |
| Net increase (decrease) | (5,157,409) | $ (68,786,357) |
Note 10–Other Matters
As of the date of this report, interest rates in the United States and many parts of the world, including certain European countries, are ascending from historically low levels. Thus, the Portfolio currently faces a heightened level of risk associated with rising interest rates. This could be driven by a variety of factors, including but not limited to central bank monetary policies, changing inflation or real growth rates, general economic conditions, increasing bond issuances or reduced market demand for low yielding investments.
An outbreak of COVID-19, first detected in December 2019, has developed into a global pandemic and has resulted in travel restrictions,
closure of international borders, certain businesses and securities markets, restrictions on securities trading activities, prolonged quarantines, supply chain disruptions, and lower consumer demand, as well as general concern and uncertainty. In 2022, many countries lifted some or all restrictions related to COVID-19. However, the continued impact of COVID-19 and related variants is uncertain and could further adversely affect the global economy, national economies, individual issuers and capital markets in unforeseeable ways and result in a substantial and extended economic downturn. Developments that disrupt global economies and financial markets, such as COVID-19, may magnify factors that affect the Portfolio's performance.
Note 11–Subsequent Events
In connection with the preparation of the financial statements of the Portfolio as of and for the year ended December 31, 2022, events and transactions subsequent to December 31, 2022, through the date the financial statements were issued have been evaluated by the Manager for possible adjustment and/or disclosure. No subsequent events requiring financial statement adjustment or disclosure have been identified.
Report of Independent Registered Public Accounting Firm
To the Board of Trustees of MainStay VP Funds Trust and Shareholders of
MainStay VP Fidelity Institutional AM® Utilities Portfolio
Opinion on the Financial Statements
We have audited the accompanying statement of assets and liabilities, including the portfolio of investments, of MainStay VP Fidelity Institutional AM® Utilities Portfolio (one of the portfolios constituting MainStay VP Funds Trust, referred to hereafter as the “Portfolio”) as of December 31, 2022, the related statement of operations for the year ended December 31, 2022, the statements of changes in net assets for each of the two years in the period ended December 31, 2022, including the related notes, and the financial highlights for each of the five years in the period ended December 31, 2022 (collectively referred to as the “financial statements”). In our opinion, the financial statements present fairly, in all material respects, the financial position of the Portfolio as of December 31, 2022, the results of its operations for the year then ended, the changes in its net assets for each of the two years in the period ended December 31, 2022 and the financial highlights for each of the five years in the period ended December 31, 2022 in conformity with accounting principles generally accepted in the United States of America.
Basis for Opinion
These financial statements are the responsibility of the Portfolio’s management. Our responsibility is to express an opinion on the Portfolio’s financial statements based on our audits. We are a public accounting firm registered with the Public Company Accounting Oversight Board (United States) (PCAOB) and are required to be independent with respect to the Portfolio in accordance with the U.S. federal securities laws and the applicable rules and regulations of the Securities and Exchange Commission and the PCAOB.
We conducted our audits of these financial statements in accordance with the standards of the PCAOB. Those standards require that we plan and perform the audit to obtain reasonable assurance about whether the financial statements are free of material misstatement, whether due to error or fraud.
Our audits included performing procedures to assess the risks of material misstatement of the financial statements, whether due to error or fraud, and performing procedures that respond to those risks. Such procedures included examining, on a test basis, evidence regarding the amounts and disclosures in the financial statements. Our audits also included evaluating the accounting principles used and significant estimates made by management, as well as evaluating the overall presentation of the financial statements. Our procedures included confirmation of securities owned as of December 31, 2022 by correspondence with the custodian, transfer agents and brokers. We believe that our audits provide a reasonable basis for our opinion.
/s/PricewaterhouseCoopers LLP
New York, New York
February 24, 2023
We have served as the auditor of one or more investment companies in the MainStay group of funds since 1984.
| 22 | MainStay VP Fidelity Institutional AM® Utilities Portfolio |
Board Consideration and Approval of Management Agreement and Subadvisory Agreement (Unaudited)
The continuation of the Management Agreement with respect to the MainStay VP Fidelity Institutional AM® Utilities Portfolio (“Portfolio”) and New York Life Investment Management LLC (“New York Life Investments”) and the Subadvisory Agreement between New York Life Investments and FIAM LLC (“FIAM”) with respect to the Portfolio (together, “Advisory Agreements”) is subject to annual review and approval by the Board of Trustees of MainStay VP Funds Trust (“Board” of the “Trust”) in accordance with Section 15 of the Investment Company Act of 1940, as amended (“1940 Act”). At its December 6–7, 2022 meeting, the Board, which is comprised solely of Trustees who are not an “interested person” (as such term is defined in the 1940 Act) of the Trust (“Independent Trustees”), unanimously approved the continuation of each of the Advisory Agreements for a one-year period.
In reaching the decision to approve the continuation of each of the Advisory Agreements, the Board considered information and materials furnished by New York Life Investments and FIAM in connection with an annual contract review process undertaken by the Board that took place at meetings of the Board and its Contracts Committee during October 2022 through December 2022, including information and materials furnished by New York Life Investments and FIAM in response to requests prepared on behalf of the Board, and in consultation with the Board, by independent legal counsel to the Independent Trustees, which encompassed a variety of topics, including those summarized below. Information and materials requested by and furnished to the Board for consideration in connection with the contract review process included, among other items, reports on the Portfolio and “peer funds” prepared by Institutional Shareholder Services Inc. (“ISS”), an independent third-party service provider engaged by the Board to report objectively on the Portfolio’s investment performance, management fee and total expenses. The Board also considered information on the fees charged to other investment advisory clients of New York Life Investments and/or FIAM that follow investment strategies similar to those of the Portfolio, if any, and, when applicable, the rationale for any differences in the Portfolio’s management and subadvisory fees and the fees charged to those other investment advisory clients. In addition, the Board considered information regarding the legal standards and fiduciary obligations applicable to its consideration of the continuation of each of the Advisory Agreements. The contract review process, including the structure and format for information and materials provided to the Board, has been developed in consultation with the Board. The Independent Trustees also met in executive sessions with their independent legal counsel and, for portions thereof, with senior management of New York Life Investments.
The Board’s deliberations with respect to the continuation of each of the Advisory Agreements reflect a year-long process, and the Board also took into account information furnished to the Board and its Committees throughout the year, as deemed relevant and appropriate by the Trustees, including, among other items, reports on investment performance of the Portfolio and investment-related matters for the Portfolio as well as presentations from New York Life Investments and, generally annually, FIAM personnel. In addition, the Board took into account other information received from New York Life Investments throughout the year, including,
among other items, periodic reports on legal and compliance matters, risk management, portfolio turnover, brokerage commissions and non-advisory services provided to the Portfolio by New York Life Investments, as deemed relevant and appropriate by the Trustees.
In addition to information provided to the Board throughout the year, the Board received information in connection with its June 2022 meeting provided specifically in response to requests prepared on behalf of the Board, and in consultation with the Board, by independent legal counsel to the Independent Trustees regarding the Portfolio’s distribution arrangements. In addition, the Board received information regarding the Portfolio’s asset levels, share purchase and redemption activity and the payment of Rule 12b-1 and/or other fees by the applicable share classes of the Portfolio, among other information.
In considering the continuation of each of the Advisory Agreements, the Trustees reviewed and evaluated the information and factors they believed to reasonably be necessary and appropriate in light of legal advice furnished to them by independent legal counsel to the Independent Trustees and through the exercise of their own business judgment. Although individual Trustees may have weighed certain factors or information differently and the Board did not consider any single factor or information controlling in reaching its decision, the factors considered by the Board are summarized in more detail below and include, among other factors: (i) the nature, extent and quality of the services provided to the Portfolio by New York Life Investments and FIAM; (ii) the qualifications of the portfolio manager of the Portfolio and the historical investment performance of the Portfolio, New York Life Investments and FIAM; (iii) the costs of the services provided, and profits realized, by New York Life Investments and FIAM with respect to their relationships with the Portfolio; (iv) the extent to which economies of scale have been realized or may be realized if the Portfolio grows and the extent to which any economies of scale have been shared, have benefited or may benefit the Portfolio’s shareholders; and (v) the reasonableness of the Portfolio’s management and subadvisory fees and total ordinary operating expenses. Although the Board recognized that comparisons between the Portfolio’s fees and expenses and those of other funds are imprecise given different terms of agreements, variations in fund strategies and other factors, the Board considered the reasonableness of the Portfolio’s management fee and total ordinary operating expenses as compared to the peer funds identified by ISS. Throughout their considerations, the Trustees acknowledged the commitment of New York Life Investments and its affiliates to serve the MainStay Group of Funds, as well as their capacity, experience, resources, financial stability and reputations. The Trustees also acknowledged the entrepreneurial and other risks assumed by New York Life Investments in sponsoring and managing the Portfolio. With respect to the Subadvisory Agreement, the Board took into account New York Life Investments’ recommendation to approve the continuation of the Subadvisory Agreement.
The Trustees noted that, throughout the year, the Trustees are afforded an opportunity to ask questions of, and request additional information or materials from, New York Life Investments and FIAM. The Board’s decision with respect to each of the Advisory Agreements may have also
Board Consideration and Approval of Management Agreement and Subadvisory Agreement (Unaudited) (continued)
been based, in part, on the Board’s knowledge of New York Life Investments and FIAM resulting from, among other things, the Board’s consideration of each of the Advisory Agreements in prior years, the advisory agreements for other funds in the MainStay Group of Funds, the Board’s review throughout the year of the performance and operations of other funds in the MainStay Group of Funds and each Trustee’s business judgment and industry experience. In addition to considering the above-referenced factors, the Board observed that in the marketplace, notably under variable life insurance policies and variable annuity contracts for which the Portfolio serves as an investment option, there are a range of investment options available to investors and that the Portfolio’s shareholders, having had the opportunity to consider other investment options, have chosen to invest in the Portfolio.
The factors that figured prominently in the Board’s decision to approve the continuation of each of the Advisory Agreements during its December 6–7, 2022 meeting are summarized in more detail below.
Nature, Extent and Quality of Services Provided by New York Life Investments and FIAM
The Board examined the nature, extent and quality of the services that New York Life Investments provides to the Portfolio. The Board evaluated New York Life Investments’ experience and capabilities in serving as manager of the Portfolio and considered that the Portfolio operates in a “manager-of-managers” structure. The Board also considered New York Life Investments’ responsibilities and services provided pursuant to this structure, including overseeing the services provided by FIAM, evaluating the performance of FIAM, making recommendations to the Board as to whether the Subadvisory Agreement should be renewed, modified or terminated and periodically reporting to the Board regarding the results of New York Life Investments’ evaluation and monitoring functions. The Board noted that New York Life Investments manages other mutual funds, serves a variety of other investment advisory clients, including other pooled investment vehicles, and has experience overseeing mutual fund service providers, including subadvisors. The Board considered the experience of senior personnel at New York Life Investments providing management and administrative and other non-advisory services to the Portfolio. The Board observed that New York Life Investments devotes significant resources and time to providing management and administrative and other non-advisory services to the Portfolio, including New York Life Investments’ oversight and due diligence reviews of FIAM and ongoing analysis of, and interactions with, FIAM with respect to, among other things, the Portfolio’s investment performance and risks as well as FIAM’s investment capabilities and subadvisory services with respect to the Portfolio.
The Board also considered the range of services that New York Life Investments provides to the Portfolio under the terms of the Management Agreement, including: (i) fund accounting and ongoing supervisory services provided by New York Life Investments’ Fund Administration and Accounting Group; (ii) investment supervisory and analytical services provided by New York Life Investments’ Investment Consulting Group; (iii) compliance services provided by the Trust’s Chief Compliance Officer as
well as New York Life Investments’ compliance department, including supervision and implementation of the Portfolio’s compliance program; (iv) legal services provided by New York Life Investments’ Office of the General Counsel; and (v) risk management monitoring and analysis by compliance and investment personnel. In addition, the Board considered New York Life Investments’ willingness to invest in personnel and other resources, such as cyber security, information security and business continuity planning, designed to benefit the Portfolio and noted that New York Life Investments is responsible for compensating the Trust’s officers, except for a portion of the salary of the Trust’s Chief Compliance Officer. The Board recognized that New York Life Investments provides certain other non-advisory services to the Portfolio and has provided an increasingly broad array of non-advisory services to the MainStay Group of Funds as a result of regulatory and other developments, including in connection with the implementation of the MainStay Group of Funds’ derivatives risk management program and policies and procedures adopted pursuant to Rule 18f-4 under the 1940 Act.
The Board also examined the range, and the nature, extent and quality, of the investment advisory services that FIAM provides to the Portfolio and considered the terms of each of the Advisory Agreements. The Board evaluated FIAM’s experience and performance in serving as subadvisor to the Portfolio and advising other portfolios and FIAM’s track record and experience in providing investment advisory services, the experience of investment advisory, senior management and administrative personnel at FIAM. The Board considered New York Life Investments’ and FIAM’s overall resources, legal and compliance environment, capabilities, reputation, financial condition and history. In addition to information provided in connection with quarterly meetings with the Trust’s Chief Compliance Officer, the Board considered information regarding the compliance policies and procedures of New York Life Investments and FIAM and acknowledged their commitment to further developing and strengthening compliance programs relating to the Portfolio. The Board also considered FIAM’s ability to recruit and retain qualified investment professionals and willingness to invest in personnel and other resources to service and support the Portfolio. In this regard, the Board considered the qualifications and experience of the Portfolio’s portfolio manager, the number of accounts managed by the portfolio manager and the method for compensating the portfolio manager.
In addition, the Board considered information provided by New York Life Investments and FIAM regarding the operations of their respective business continuity plans in response to the COVID-19 pandemic and the continued remote work environment.
Based on these considerations, among others, the Board concluded that the Portfolio would likely continue to benefit from the nature, extent and quality of these services.
Investment Performance
In evaluating the Portfolio’s investment performance, the Board considered investment performance results over various periods in light of the Portfolio’s investment objective, strategies and risks. The Board
| 24 | MainStay VP Fidelity Institutional AM® Utilities Portfolio |
considered investment reports on, and analysis of, the Portfolio’s performance provided to the Board throughout the year. These reports include, among other items, information on the Portfolio’s gross and net returns, the Portfolio’s investment performance compared to a relevant investment category and the Portfolio’s benchmark, the Portfolio’s risk-adjusted investment performance and the Portfolio’s investment performance as compared to peer funds, as appropriate, as well as portfolio attribution information and commentary on the effect of market conditions. The Board also considered information provided by ISS showing the investment performance of the Portfolio as compared to peer funds. In addition, the Board reviewed the methodology used by ISS to construct the group of peer funds for comparative purposes.
The Board also took into account its discussions with senior management at New York Life Investments concerning the Portfolio’s investment performance over various periods as well as discussions between the Portfolio’s portfolio management team and the members of the Board’s Investment Committee, which generally occur on an annual basis. In addition, the Board considered any specific actions that New York Life Investments or FIAM had taken, or had agreed to take, to seek to enhance Portfolio investment performance and the results of those actions.
Based on these considerations, among others, the Board concluded that its review of the Portfolio’s investment performance and related information supported a determination to approve the continuation of each of the Advisory Agreements.
Costs of the Services Provided, and Profits and Other Benefits Realized, by New York Life Investments and FIAM
The Board considered the costs of the services provided under each of the Advisory Agreements. The Board also considered the profits realized by New York Life Investments and its affiliates and FIAM due to their relationships with the Portfolio as well as by New York Life Investments and its affiliates due to their relationships with the MainStay Group of Funds. The Board considered information from New York Life Investments that FIAM’s subadvisory fee reflected an arm’s-length negotiation and that this fee is paid by New York Life Investments, not the Portfolio, and the relevance of FIAM’s profitability was considered by the Trustees in that context. On this basis, the Board primarily considered the costs and profitability for New York Life Investments and its affiliates with respect to the Portfolio.
In addition, the Board acknowledged the difficulty in obtaining reliable comparative data about mutual fund managers’ profitability because such information generally is not publicly available and may be impacted by numerous factors, including the structure of a fund manager’s organization, the types of funds it manages, the methodology used to allocate certain fixed costs to specific funds and the manager’s capital structure and costs of capital.
In evaluating the costs of the services provided by New York Life Investments and FIAM and profits realized by New York Life Investments and its affiliates and FIAM, the Board considered, among other factors,
New York Life Investments’ and its affiliates’ and FIAM’s continuing investments in, or willingness to invest in, personnel and other resources to support and further enhance the management of the Portfolio, and that New York Life Investments is responsible for paying the subadvisory fee for the Portfolio. The Board also considered the financial resources of New York Life Investments and FIAM and acknowledged that New York Life Investments and FIAM must be in a position to recruit and retain experienced professional personnel and to maintain a strong financial position for New York Life Investments and FIAM to continue to provide high-quality services to the Portfolio. The Board recognized that the Portfolio benefits from the allocation of certain fixed costs among the funds in the MainStay Group of Funds, among other expected benefits resulting from its relationship with New York Life Investments.
The Board considered information regarding New York Life Investments’ methodology for calculating profitability and allocating costs provided by New York Life Investments in connection with the fund profitability analysis presented to the Board. The Board noted it had previously engaged an independent consultant to review the methods used to allocate costs among the funds in the MainStay Group of Funds. The Board also noted that the independent consultant had concluded that New York Life Investments’ methods for allocating costs and procedures for estimating overall profitability of the relationship with the funds in the MainStay Group of Funds are reasonable and that New York Life Investments continued to use the same method of calculating profit and allocating costs since the independent consultant’s review. The Board recognized the difficulty in calculating and evaluating a manager’s profitability with respect to the Portfolio and considered that other profitability methodologies may also be reasonable.
The Board also considered certain fall-out benefits that may be realized by New York Life Investments and its affiliates due to their relationships with the Portfolio, including reputational and other indirect benefits. The Board recognized, for example, the benefits to FIAM from legally permitted “soft-dollar” arrangements by which brokers provide research and other services to FIAM in exchange for commissions paid by the Portfolio with respect to trades in the Portfolio’s portfolio securities. In this regard, the Board also requested and considered information from New York Life Investments concerning other material business relationships between FIAM and its affiliates and New York Life Investments and its affiliates. In addition, the Board considered its review of the management agreement for a money market fund advised by New York Life Investments and an affiliated subadvisor that serves as an investment option for the Portfolio, including the potential rationale for and costs associated with investments in this money market fund by the Portfolio, if any, and considered information from New York Life Investments that the nature and type of specific investment advisory services provided to this money market fund are distinct from, or in addition to, the investment advisory services provided to the Portfolio. In addition, the Board considered the potential dividend received tax deduction for insurance company affiliates of New York Life Investments from the Portfolio’s securities lending activity.
Board Consideration and Approval of Management Agreement and Subadvisory Agreement (Unaudited) (continued)
The Board noted that the Portfolio serves as an investment option primarily under variable contracts issued by affiliates of New York Life Investments that would receive fees under those contracts. The Board observed that, in addition to fees earned by New York Life Investments under the Management Agreement for managing the Portfolio, New York Life Investments’ affiliates also earn revenues from serving the Portfolio in various other capacities, including as the Portfolio’s distributor. The Board considered information about these other revenues and their impact on the profitability of the relationship with the Portfolio to New York Life Investments and its affiliates. The Board noted that, although it assessed the overall profitability of the relationship with the Portfolio to New York Life Investments and its affiliates as part of the contract review process, when considering the reasonableness of the fee paid to New York Life Investments under the Management Agreement, the Board considered the profitability of New York Life Investments’ relationship with the Portfolio on a pre-tax basis and without regard to distribution expenses incurred by New York Life Investments from its own resources.
After evaluating the information deemed relevant by the Trustees, the Board concluded that any profits realized by New York Life Investments and its affiliates due to their relationships with the Portfolio were not excessive, other benefits that may accrue to New York Life Investments and its affiliates are reasonable and benefits that may accrue to FIAM and its affiliates are consistent with those expected for a subadvisor to a mutual fund. With respect to FIAM, the Board considered that any profits realized by FIAM due to its relationship with the Portfolio are the result of arm’s-length negotiations between New York Life Investments and FIAM acknowledging that any such profits are based on the subadvisory fee paid to FIAM by New York Life Investments, not the Portfolio.
Management and Subadvisory Fees and Total Ordinary Operating Expenses
The Board evaluated the reasonableness of the fee paid under each of the Advisory Agreements and the Portfolio’s total ordinary operating expenses. The Board primarily considered the reasonableness of the management fee paid by the Portfolio to New York Life Investments because the subadvisory fee paid to FIAM is paid by New York Life Investments, not the Portfolio. The Board also considered the reasonableness of the subadvisory fee paid by New York Life Investments and the amount of the management fee retained by New York Life Investments.
In assessing the reasonableness of the Portfolio’s fees and expenses, the Board primarily considered comparative data provided by ISS on the fees and expenses charged by similar mutual funds managed by other investment advisers. The Board reviewed the methodology used by ISS to construct the group of peer funds for comparative purposes. In addition, the Board considered information provided by New York Life Investments and FIAM on fees charged to other investment advisory clients, including institutional separate accounts and/or other funds that follow investment strategies similar to those of the Portfolio, if any. The Board considered the contractual management fee schedules of the Portfolio as compared to those of such other investment advisory clients, taking into account the
rationale for any differences in fee schedules. The Board also took into account information provided by New York Life Investments about the more extensive scope of services provided to registered investment companies, such as the Portfolio, as compared with other investment advisory clients. Additionally, the Board considered the impact of contractual breakpoints on the Portfolio’s net management fee and expenses. The Board also considered that in proposing fees for the Portfolio, New York Life Investments considers the competitive marketplace for mutual funds.
Based on the factors outlined above, among other considerations, the Board concluded that the Portfolio’s management fee and total ordinary operating expenses are within a range that is competitive and support a conclusion that these fees and expenses are reasonable.
Economies of Scale
The Board considered information regarding economies of scale, including whether economies of scale may exist for the Portfolio and whether the Portfolio’s expense structure permits any economies of scale to be appropriately shared with the Portfolio’s beneficial shareholders. The Board also considered a report from New York Life Investments, previously prepared at the request of the Board, that addressed economies of scale, including with respect to the mutual fund business generally, and the various ways in which the benefits of economies of scale may be shared with the funds in the MainStay Group of Funds. Although the Board recognized the difficulty of determining economies of scale with precision, the Board acknowledged that economies of scale may be shared with the Portfolio in a number of ways, including, for example, through the imposition of fee breakpoints, initially setting management fee rates at scale or making additional investments to enhance the services provided to the Portfolio. The Board reviewed information from New York Life Investments showing how the Portfolio’s management fee schedule compared to fee schedules of other funds and accounts managed by New York Life Investments. The Board also reviewed information from ISS showing how the Portfolio’s management fee schedule compared with fees paid for similar services by peer funds at varying asset levels.
Based on this information, the Board concluded that economies of scale are appropriately reflected for the benefit of the Portfolio’s beneficial shareholders through the Portfolio’s expense structure and other methods to share benefits from economies of scale.
Conclusion
On the basis of the information and factors summarized above, among other information and factors deemed relevant by the Trustees, and the evaluation thereof, the Board unanimously voted to approve the continuation of each of the Advisory Agreements.
| 26 | MainStay VP Fidelity Institutional AM® Utilities Portfolio |
Proxy Voting Policies and Procedures and Proxy Voting Record
The Portfolio is required to file with the SEC its proxy voting record for the 12-month period ending June 30 on Form N-PX. A description of the policies and procedures that are used to vote proxies relating to portfolio securities of the Portfolio is available free of charge upon request by calling 800-598-2019 or visiting the SEC's website at www.sec.gov. The most recent Form N-PX or proxy voting record is available free of charge upon request by calling 800-598-2019; visiting https://www.newyorklifeinvestments.com/investment-products/vp; or visiting the SEC’s website at www.sec.gov.
Shareholder Reports and Quarterly Portfolio Disclosure
The Portfolio is required to file its complete schedule of portfolio holdings with the SEC 60 days after its first and third fiscal quarter on Form N-PORT. The Portfolio's holdings report is available free of charge upon request by calling 800-598-2019 or by visiting the SEC’s website at www.sec.gov.
Board of Trustees and Officers (Unaudited)
The Trustees and officers of the Portfolio are listed below. The Board oversees the MainStay Group of Funds (which consists of MainStay Funds and MainStay Funds Trust), MainStay VP Funds Trust, MainStay MacKay DefinedTerm Municipal Opportunities Fund, MainStay CBRE Global Infrastructure Megatrends Fund, the Manager and the Subadvisors, and elects the officers of the Portfolios who are responsible for the day-to-day operations of the Portfolio. Information pertaining to the Trustees and officers is set forth below. Each Trustee serves until his or her successor
is elected and qualified or until his or her resignation, death or removal. Under the Board’s retirement policy, unless an exception is made, a Trustee must tender his or her resignation by the end of the calendar year during which he or she reaches the age of 75. The business address of each Trustee and officer listed below is 51 Madison Avenue, New York, New York 10010. None of the Trustees are “interested persons” (as defined by the 1940 Act and rules adopted by the SEC thereunder) of the Portfolio (“Independent Trustees”).
| | Name and
Year of Birth | Term of Office,
Position(s) Held and
Length of Service | Principal Occupation(s)
During Past Five Years | Number of
Portfolios in
Fund Complex
Overseen by
Trustee | Other Directorships
Held by Trustee |
| | | | | | |
| | David H. Chow
1957 | MainStay VP Funds Trust: Trustee since January 2016, Advisory Board Member (June 2015 to December 2015) | Founder and CEO, DanCourt Management, LLC since 1999 | 78 | MainStay Funds: Trustee since January 2016, Advisory Board Member (June 2015 to December 2015) (12 Funds);
MainStay Funds Trust: Trustee since January 2016, Advisory Board Member (June 2015 to December 2015) (33 Funds);
MainStay MacKay DefinedTerm Municipal Opportunities Fund: Trustee since January 2016, Advisory Board Member (June 2015 to December 2015);
MainStay CBRE Global Infrastructure Megatrends Fund: Trustee since June 2021;VanEck Vectors Group of Exchange-Traded Funds: Independent Chairman of the Board of Trustees since 2008 and Trustee since 2006 (57 portfolios); and Berea College of Kentucky: Trustee since 2009, Chair of the Committee since 2018 |
| | Susan B. Kerley
1951 | MainStay VP Funds Trust: Chairman since 2017 and Trustee since 2007* | President, Strategic Management Advisors LLC since 1990 | 78 | MainStay Funds: Chairman since 2017 and Trustee since 2007 (12 Funds); MainStay Funds Trust: Chairman since 2017 and Trustee since 1990 (33 Funds)**;
MainStay MacKay DefinedTerm Municipal Opportunities Fund: Chairman since 2017 and Trustee since 2011; MainStay CBRE Global Infrastructure Megatrends Fund: Trustee since June 2021; and Legg Mason Partners Funds: Trustee since 1991 (45 portfolios) |
| | Alan R. Latshaw
1951 | MainStay VP Funds Trust: Trustee since 2007* | Retired; Partner, Ernst & Young LLP (2002 to 2003); Partner, Arthur Andersen LLP (1989 to 2002); Consultant to the MainStay Funds Audit and Compliance Committee (2004 to 2006) | 78 | MainStay Funds: Trustee since 2006 (12 Funds);
MainStay Funds Trust: Trustee since 2007 (33 Funds)**;
MainStay MacKay DefinedTerm Municipal Opportunities Fund: Trustee since 2011; and
MainStay CBRE Global Infrastructure Megatrends Fund: Trustee since June 2021 |
| 28 | MainStay VP Fidelity Institutional AM® Utilities Portfolio |
| | Name and
Year of Birth | Term of Office,
Position(s) Held and
Length of Service | Principal Occupation(s)
During Past Five Years | Number of
Portfolios in
Fund Complex
Overseen by
Trustee | Other Directorships
Held by Trustee |
| | | | | | |
| | Karen Hammond
1956 | MainStay VP Funds Trust: Trustee since December 2021, Advisory Board Member (June 2021 to December 2021)
| Retired, Managing Director, Devonshire Investors (2007 to 2013); Senior Vice President, Fidelity Management & Research Co. (2005 to 2007); Senior Vice President and Corporate Treasurer, FMR Corp. (2003 to 2005); Chief Operating Officer, Fidelity Investments Japan (2001 to 2003) | 78 | MainStay Funds: Trustee since December 2021, Advisory Board Member (June 2021 to December 2021) (12 Funds);
MainStay Funds Trust: Trustee since December 2021, Advisory Board Member (June 2021 to December 2021) (33 Funds);
MainStay MacKay DefinedTerm Municipal Opportunities Fund: Trustee since December 2021, Advisory Board Member (June 2021 to December 2021);
MainStay CBRE Global Infrastructure Megatrends Fund: Trustee since December 2021, Advisory Board Member (June 2021 to December 2021);
Two Harbors Investment Corp.: Director since 2018; Rhode Island State Investment Commission: Member since 2017; and Blue Cross Blue Shield of Rhode Island: Director since 2019
|
| | Jacques P. Perold
1958 | MainStay VP Funds Trust: Trustee since January 2016, Advisory Board Member (June 2015 to December 2015) | Founder and Chief Executive Officer, CapShift Advisors LLC (since 2018); President, Fidelity Management & Research Company (2009 to 2014); President and Chief Investment Officer, Geode Capital Management, LLC (2001 to 2009) | 78 | MainStay Funds: Trustee since January 2016, Advisory Board Member (June 2015 to December 2015) (12 Funds);
MainStay Funds Trust: Trustee since January 2016, Advisory Board Member (June 2015 to December 2015) (33 Funds); MainStay MacKay DefinedTerm Municipal Opportunities Fund: Trustee since January 2016, Advisory Board Member (June 2015 to December 2015);
MainStay CBRE Global Infrastructure Megatrends Fund: Trustee since June 2021; Allstate Corporation: Director since 2015;
Partners in Health: Trustee since 2019; and
MSCI Inc.: Director since 2017 |
| | Richard S. Trutanic
1952 | MainStay VP Funds Trust: Trustee since 2007* | Chairman and Chief Executive Officer, Somerset & Company (financial advisory firm) since 2004; Managing Director, The Carlyle Group (private investment firm) (2002 to 2004); Senior Managing Director, Partner and Board Member, Groupe Arnault S.A. (private investment firm) (1999 to 2002)
| 78 | MainStay Funds: Trustee since 1994 (12 Funds);
MainStay Funds Trust: Trustee since 2007 (33 Funds)**;
MainStay MacKay DefinedTerm Municipal Opportunities Fund: Trustee since 2011; and
MainStay CBRE Global Infrastructure Megatrends Fund: Trustee since June 2021 |
| * | Includes prior service as a Director of MainStay VP Series Fund, Inc., the predecessor to MainStay VP Funds Trust. |
| ** | Includes prior service as a Director/Trustee of certain predecessor entities to MainStay Funds Trust. |
Board of Trustees and Officers (Unaudited) (continued)
| | Name and
Year of Birth | Position(s) Held and
Length of Service | Principal Occupation(s)
During Past Five Years | |
| | | | | |
| | Kirk C. Lehneis
1974 | President, MainStay VP Funds Trust (since 2017) | Chief Operating Officer and Senior Managing Director (since 2016), New York Life Investment Management LLC and New York Life Investment Management Holdings LLC; Member of the Board of Managers (since 2017) and Senior Managing Director (since 2018), NYLIFE Distributors LLC; Chairman of the Board and Senior Managing Director, NYLIM Service Company LLC (since 2017); Trustee, President and Principal Executive Officer of IndexIQ Trust, IndexIQ ETF Trust and IndexIQ Active ETF Trust (since January 2018); President, MainStay CBRE Global Infrastructure Megatrends Fund (since 2021), MainStay MacKay DefinedTerm Municipal Opportunities Fund, MainStay Funds and MainStay Funds Trust (since 2017); Senior Managing Director, Global Product Development (from 2015-2016); Managing Director, Product Development (from 2010-2015), New York Life Investment Management LLC | |
| | Jack R. Benintende
1964 | Treasurer and Principal Financial and Accounting Officer, MainStay VP Funds Trust (since 2007)** | Managing Director, New York Life Investment Management LLC (since 2007); Treasurer and Principal Financial and Accounting Officer, MainStay CBRE Global Infrastructure Megatrends Fund (since 2021), MainStay MacKay DefinedTerm Municipal Opportunities Fund (since 2011), MainStay Funds Trust (since 2009) and MainStay Funds (since 2007); and Assistant Treasurer, New York Life Investment Management Holdings LLC (2008 to 2012) | |
| | J. Kevin Gao
1967 | Secretary and Chief Legal Officer, MainStay VP Funds Trust (since 2010)** | Managing Director and Associate General Counsel, New York Life Investment Management LLC (since 2010); Secretary and Chief Legal Officer, MainStay CBRE Global Infrastructure Megatrends Fund (since 2021), MainStay MacKay DefinedTerm Municipal Opportunities Fund (since 2011), MainStay Funds and MainStay Funds Trust (since 2010) | |
| | Scott T. Harrington
1959 | Vice President— Administration, MainStay VP Funds Trust (since 2005)** | Managing Director, New York Life Investment Management LLC (including predecessor advisory organizations) (since 2000); Member of the Board of Directors, New York Life Trust Company (since 2009); Vice President—Administration, MainStay CBRE Global Infrastructure Megatrends Fund (since 2021), MainStay MacKay DefinedTerm Municipal Opportunities Fund (since 2011), MainStay Funds Trust and MainStay Funds (since 2009) | |
| | Kevin M. Gleason
1967 | Vice President and Chief Compliance Officer, MainStay VP Funds Trust (since June 2022) | Vice President and Chief Compliance Officer, IndexIQ, IndexIQ ETF Trust and Index IQ Active ETF Trust (since June 2022); Vice President and Chief Compliance Officer, MainStay CBRE Global Infrastructure Megatrends Fund, MainStay MacKay DefinedTerm Municipal Opportunities Fund (since June 2022); MainStay Funds Trust and MainStay Funds (since June 2022); Senior Vice President, Voya Investment Management and Chief Compliance Officer, Voya Family of Funds (2012-2022) | |
| * | The officers listed above are considered to be “interested persons” of the MainStay Group of Funds, MainStay VP Funds Trust, MainStay CBRE Global Infrastructure Megatrends Fund and MainStay MacKay DefinedTerm Municipal Opportunities Fund within the meaning of the 1940 Act because of their affiliation with the MainStay Group of Funds, New York Life Insurance Company and/or its affiliates, including New York Life Investment Management LLC, NYLIM Service Company LLC, NYLIFE Securities LLC and/or NYLIFE Distributors LLC, as described in detail in the column captioned “Principal Occupation(s) During Past Five Years.” Officers are elected annually by the Board. |
| ** | Includes prior service as an Officer of MainStay VP Series Fund, Inc., the predecessor to MainStay VP Funds Trust. |
Officers of the Trust (Who are not Trustees)*
| 30 | MainStay VP Fidelity Institutional AM® Utilities Portfolio |
MainStay VP Portfolios
MainStay VP offers a wide range of Portfolios. The full array of MainStay VP offerings is listed here, with information about the manager, subadvisors, legal counsel, and independent registered public accounting firm.
Equity
MainStay VP American Century Sustainable Equity Portfolio1
MainStay VP Candriam Emerging Markets Equity Portfolio
MainStay VP Epoch U.S. Equity Yield Portfolio
MainStay VP Fidelity Institutional AM® Utilities Portfolio†
MainStay VP MacKay International Equity Portfolio
MainStay VP Natural Resources Portfolio
MainStay VP S&P 500 Index Portfolio2
MainStay VP Small Cap Growth Portfolio
MainStay VP Wellington Growth Portfolio
MainStay VP Wellington Mid Cap Portfolio
MainStay VP Wellington Small Cap Portfolio
MainStay VP Wellington U.S. Equity Portfolio
MainStay VP Winslow Large Cap Growth Portfolio
Mixed Asset
MainStay VP Balanced Portfolio
MainStay VP Income Builder Portfolio
MainStay VP Janus Henderson Balanced Portfolio
MainStay VP MacKay Convertible Portfolio
Income
MainStay VP Bond Portfolio
MainStay VP Floating Rate Portfolio
MainStay VP Indexed Bond Portfolio
MainStay VP MacKay Government Portfolio
MainStay VP MacKay High Yield Corporate Bond Portfolio
MainStay VP MacKay Strategic Bond Portfolio
MainStay VP PIMCO Real Return Portfolio
Money Market
MainStay VP U.S. Government Money Market Portfolio
Alternative
MainStay VP CBRE Global Infrastructure Portfolio
MainStay VP IQ Hedge Multi-Strategy Portfolio
Asset Allocation
MainStay VP Conservative Allocation Portfolio
MainStay VP Equity Allocation Portfolio
MainStay VP Growth Allocation Portfolio
MainStay VP Moderate Allocation Portfolio
Manager
New York Life Investment Management LLC
New York, New York
Subadvisors
American Century Investment Management, Inc.
Kansas City, Missouri
Brown Advisory LLC
Baltimore, Maryland
Candriam*
Strassen, Luxembourg
CBRE Investment Management Listed Real Assets LLC
Radnor, Pennsylvania
Epoch Investment Partners, Inc.
New York, New York
FIAM LLC
Smithfield, Rhode Island
IndexIQ Advisors LLC*
New York, New York
Janus Henderson Investors US LLC
Denver, Colorado
MacKay Shields LLC*
New York, New York
Newton Investment Management North America, LLC
Boston, Massachusetts
NYL Investors LLC*
New York, New York
Pacific Investment Management Company LLC
Newport Beach, California
Segall Bryant & Hamill, LLC
Chicago, Illinois
Wellington Management Company LLP
Boston, Massachusetts
Winslow Capital Management, LLC
Minneapolis, Minnesota
Legal Counsel
Dechert LLP
Washington, District of Columbia
Independent Registered Public Accounting Firm
PricewaterhouseCoopers LLP
New York, New York
Distributor
NYLIFE Distributors LLC*
Jersey City, New Jersey
Custodian
JPMorgan Chase Bank, N.A.
New York, New York
Some Portfolios may not be available in all products.
† Fidelity Institutional AM is a registered trade mark of FMR LLC. Used with permission.
* An affiliate of New York Life Investment Management LLC.
| 1. | Prior to May 1, 2022, the Portfolio's name was MainStay VP T. Rowe Price Equity Income Portfolio. |
| 2. | Prior to May 1, 2022, the Portfolio's name was MainStay VP MacKay S&P 500 Index Portfolio. |
Not part of the Annual Report
2022 Annual Report
This report is for the general information of New York Life Variable Annuities and NYLIAC Variable Universal Life Insurance Products policyowners. It must be preceded or accompanied by the appropriate product(s) and funds prospectuses if it is given to anyone who is not an owner of a New York Life variable annuity policy or a NYLIAC Variable Universal Life Insurance Product. This report does not offer for sale or solicit orders to purchase securities.
The performance data quoted in this report represents past performance. Past performance is no guarantee of future results. Due to market volatility and other factors, current performance may be lower or higher than the figures shown. The most recent month-end performance summary for your variable annuity or variable life policy is available by calling 800-598-2019 and is updated periodically on newyorklife.com.
The New York Life Variable Annuities and NYLIAC Variable Universal Life Insurance Products are issued by New York Life Insurance and Annuity Corporation (a Delaware Corporation) and distributed by NYLIFE Distributors LLC (Member FINRA/SIPC).
New York Life Insurance Company
New York Life Insurance and Annuity
Corporation (NYLIAC) (A Delaware Corporation)
51 Madison Avenue, Room 551
New York, NY 10010
newyorklife.com
newyorklifeinvestments.com
NYLIFE Distributors LLC, 30 Hudson Street, Jersey City, NJ 07302
New York Life Investment Management LLC is the investment manager to the MainStay VP Funds Trust
©2023 by NYLIFE Distributors LLC. All rights reserved.
You may obtain copies of the Prospectus and the Statement of Additional Information free of charge, upon request, by calling toll-free 800-598-2019 or writing to New York Life Insurance and Annuity Corporation, 51 Madison Avenue, New York, NY 10010.
| Not FDIC Insured | No Bank Guarantee | May Lose Value |
(NYLIAC) NI526
MainStay VP Wellington Small Cap Portfolio
Message from the President and Annual Report
December 31, 2022
Sign up for e-delivery of your shareholder reports. For full details on e-delivery, including who can participate and what you can receive via e-delivery,
please log in to newyorklifeinvestments.com/accounts.
| Not FDIC/NCUA Insured | Not a Deposit | May Lose Value | No Bank Guarantee | Not Insured by Any Government Agency |
This page intentionally left blank
Message from the President
The 12-month reporting period ended December 31, 2022, proved exceptionally challenging for investors as both stock and bond markets suffered steep declines. A variety of economic and geopolitical forces drove the market’s losses, all centered around rising inflation and monetary efforts to rein it in.
Inflationary alarms began to sound well before the reporting period began. In late 2021, after nearly two years of accommodative policies designed to encourage economic growth in the face of the COVID-19 pandemic, the U.S. Federal Reserve (the “Fed”) warned of the increasing need to tighten monetary policy. Nevertheless, the pace and persistence of inflation in early 2022 caught most market participants—the Fed included—off guard. Russia’s invasion of Ukraine in February exacerbated global inflationary pressures while increasing investor uncertainty. Domestic supply shortages, international trade imbalances and rising inflation caused U.S. GDP (gross domestic product) to contract in the first and second quarters of the year, although employment and consumer spending proved resilient. Prices for petroleum surged to multi-year highs, while many key agricultural chemicals and industrial metals soared as well. Accelerating inflationary forces prompted the Fed to implement its most aggressive series of interest rate hikes since the 1980s, with a 0.25% increase in March followed by six further rate increases totaling 4.25%. International central banks generally followed suit and raised rates by varying degrees in efforts to curb local inflation, although most increases remained significantly more modest than those in the United States. Relatively high U.S. interest rates and an international risk averse sentiment pushed U.S. dollar values higher compared to most other currencies, with negative impacts on global prices for food, fuel and other key U.S.-dollar-denominated products.
The effects of these interrelated challenges were felt throughout U.S. and international financial markets. The S&P 500® Index, a widely regarded benchmark of market performance, declined by more than 18% during the reporting period. Although the energy sector generated strong gains, bolstered by elevated oil and gas prices, most other industry segments recorded losses. The more cyclical and growth-oriented sectors of consumer discretionary, information technology and real estate delivered the weakest returns, while the traditionally defensive and value-oriented
consumer staples, utilities and health care sectors outperformed. On average, international developed-country equity markets mildly outperformed their U.S. counterparts, while emerging markets lagged slightly. Fixed-income markets proved unusually volatile, with bond prices trending sharply lower as yields rose along with interest rates. Short-term yields rose faster than long-term yields, producing a yield curve inversion from July through the end of the reporting period as long-term rates remained below short-term rates. While floating-rate instruments, which feature variable interest rates that allow investors to benefit from a rising rate environment, provided a degree of insulation from inflation-driven trends, they were not immune to the market’s widespread declines.
Although, according to the most recent estimates, the annualized inflation rate in the United States has declined from a peak of 9.1% in July 2022 to 6.5% in December, the Fed remains focused on achieving more substantial and lasting reductions, aiming for a target rate of 2%. As a result, further rate hikes and additional market volatility are potential headwinds in the coming months. The question remains as to whether the Fed and other central banks will manage a so-called “soft landing,” curbing inflation while avoiding a persistent economic slowdown. If they prove successful, we believe that the increasingly attractive valuations we have observed in both equity and bond markets should eventually translate into sustainable improvements in the investment environment.
Whatever actions the Fed takes and however financial markets react, as a MainStay VP investor you can depend on us to continue managing our portfolios with the insight, expertise and level of service that have long defined New York Life Investments. Thank you for trusting us to help you meet your investment needs.
Sincerely,
Kirk C. Lehneis
President
The opinions expressed are as of the date of this report and are subject to change. There is no guarantee that any forecast made will come to pass. This material does not constitute investment advice and is not intended as an endorsement of any specific investment. Past performance is no guarantee of future results.
Not part of the Annual Report
Investors should refer to the Portfolio’s Summary Prospectus and/or Prospectus and consider the Portfolio’s investment objectives, strategies, risks, charges and expenses carefully before investing. The Summary Prospectus and/or Prospectus contain this and other information about the Portfolio. You may obtain copies of the Portfolio’s Summary Prospectus, Prospectus and Statement of Additional Information, which includes information about the MainStay VP Funds Trust's Trustees, free of charge, upon request, by calling toll-free 800-598-2019, by writing to New York Life Insurance and Annuity Corporation, 51 Madison Avenue, Room 251, New York, New York 10010 or by sending an email to MainStayShareholdersServices@nylim.com. These documents are also available at newyorklifeinvestments.com/investment-products/vp. Please read the Portfolio's Summary Prospectus and/or Prospectus carefully before investing. MainStay VP Funds Trust portfolios are separate account options which are purchased through a variable insurance or variable annuity contract.
Investment and Performance Comparison (Unaudited)
Performance data quoted represents past performance. Past performance is no guarantee of future results. Because of market volatility and other factors, current performance may be lower or higher than the figures shown. Investment return and principal value will fluctuate, and as a result, when shares are redeemed, they may be worth more or less than their original cost. The performance table and graph do not reflect any deduction of sales charges, mortality and expense charges, contract charges or administrative charges. Please refer to the Performance Summary appropriate for your policy. For performance information current to the most recent month-end, please call 800-598-2019 or visit www.newyorklife.com.
Performance figures may reflect certain fee waivers and/or expense limitations, without which total returns may have been different. For information on current fee waivers and/or expense limitations (if any), please refer to the Notes to Financial Statements.
| Average Annual Total Returns for the Year-Ended December 31, 2022 |
| Class | Inception
Date1, 2 | One
Year | Five
Years | Since
Inception | Gross
Expense
Ratio3 |
| Initial Class Shares | 5/2/2016 | -20.83% | 0.59% | 5.15% | 0.86% |
| Service Class Shares | 5/2/2016 | -21.03 | 0.34 | 4.89 | 1.11 |
| 1. | Effective January 1, 2018, due to an organizational restructuring, all investment personnel of Cornerstone Capital Management Holdings LLC, a former subadvisor, transitioned to MacKay Shields LLC, a former subadvisor. |
| 2. | Effective May 1, 2021, the Portfolio replaced its subadvisor and modified its principal investment strategies. The past performance in the graph and table prior to that date reflects the Portfolio's prior subadvisors and principal investment strategies. |
| 3. | The gross expense ratios presented reflect the Portfolio’s “Total Annual Portfolio Operating Expenses” from the most recent Prospectus and may differ from other expense ratios disclosed in this report. |
| Benchmark Performance* | One
Year | Five
Years | Since
Inception |
| Russell 2000® Index1 | -20.44% | 4.13% | 8.16% |
| Morningstar Small Blend Category Average2 | -16.35 | 4.33 | 7.59 |
| * | Returns for indices reflect no deductions for fees, expenses or taxes, except for foreign withholding taxes where applicable. Results assume reinvestment of all dividends and capital gains. An investment cannot be made directly in an index. |
| 1. | The Russell 2000® Index is the Portfolio’s primary broad-based securities market index for comparison purposes. The Russell 2000® Index measures the performance of the small-cap segment of the U.S. equity universe. It is a subset of the Russell 3000® Index and includes approximately 2,000 of the smallest securities based on a combination of their market cap and current index membership. |
| 2. | The Morningstar Small Blend Category Average is representative of funds that favor U.S. firms at the smaller end of the market-capitalization range. Some aim to own an array of value and growth stocks while others employ a discipline that leads to holdings with valuations and growth rates close to the small-cap averages. Stocks in the bottom 10% of the capitalization of the U.S. equity market are defined as small cap. The blend style is assigned to portfolios where neither growth nor value characteristics predominate. Results are based on average total returns of similar funds with all dividends and capital gain distributions reinvested. |
Cost in Dollars of a $1,000 Investment in MainStay VP Wellington Small Cap Portfolio (Unaudited)
The example below is intended to describe the fees and expenses borne by shareholders during the six-month period from July 1, 2022 to December 31, 2022, and the impact of those costs on your investment.
Example
As a shareholder of the Portfolio you incur two types of costs: (1) transaction costs, including exchange fees and sales charges (loads) on purchases (as applicable), and (2) ongoing costs, including management fees, distribution and/or service (12b-1) fees and other Portfolio expenses (as applicable). This example is intended to help you understand your ongoing costs (in dollars) of investing in the Portfolio and to compare these costs with the ongoing costs of investing in other mutual funds. The example is based on an investment of $1,000 made at the beginning of the six-month period and held for the entire period from July 1, 2022 to December 31, 2022. Shares are only sold in connection with variable life and annuity contracts and the example does not reflect any contract level or transactional fees or expenses. If these costs had been included, your costs would have been higher.
This example illustrates your Portfolio’s ongoing costs in two ways:
Actual Expenses
The second and third data columns in the table below provide information about actual account values and actual expenses. You may use the information in these columns, together with the amount you invested, to estimate the expenses that you paid during the six months ended
December 31, 2022. Simply divide your account value by $1,000 (for example, an $8,600 account value divided by $1,000 = 8.6), then multiply the result by the number under the heading entitled “Expenses Paid During Period” to estimate the expenses you paid on your account during this period.
Hypothetical Example for Comparison Purposes
The fourth and fifth data columns in the table below provide information about hypothetical account values and hypothetical expenses based on the Portfolio’s actual expense ratio and an assumed rate of return of 5% per year before expenses, which is not the Portfolio’s actual return. The hypothetical account values and expenses may not be used to estimate the actual ending account balances or expenses you paid for the six-month period shown. You may use this information to compare the ongoing costs of investing in the Portfolio with the ongoing costs of investing in other mutual funds. To do so, compare this 5% hypothetical example with the 5% hypothetical examples that appear in the shareholder reports of the other mutual funds.
Please note that the expenses shown in the table are meant to highlight your ongoing costs only and do not reflect any transactional costs, such as exchange fees or sales charges (loads). Therefore, the fourth and fifth data columns of the table are useful in comparing ongoing costs only and will not help you determine the relative total costs of owning different funds. In addition, if these transactional costs were included, your costs would have been higher.
| Share Class | Beginning
Account
Value
7/1/22 | Ending Account
Value (Based
on Actual
Returns and
Expenses)
12/31/22 | Expenses
Paid
During
Period1 | Ending Account
Value (Based
on Hypothetical
5% Annualized
Return and
Actual Expenses)
12/31/22 | Expenses
Paid
During
Period1 | Net Expense
Ratio
During
Period2 |
| Initial Class Shares | $1,000.00 | $1,033.70 | $3.79 | $1,021.47 | $3.77 | 0.74% |
| Service Class Shares | $1,000.00 | $1,032.40 | $5.07 | $1,020.21 | $5.04 | 0.99% |
| 1. | Expenses are equal to the Portfolio’s annualized expense ratio of each class multiplied by the average account value over the period, divided by 365 and multiplied by 184 (to reflect the six-month period). The table above represents the actual expenses incurred during the six-month period. In addition to the fees and expenses which the Portfolio bears directly, it also indirectly bears a pro rata share of the fees and expenses of the underlying funds in which it invests. Such indirect expenses are not included in the above-reported expense figures. |
| 2. | Expenses are equal to the Portfolio's annualized expense ratio to reflect the six-month period. |
| 6 | MainStay VP Wellington Small Cap Portfolio |
Industry Composition as of December 31, 2022 (Unaudited)
| Banks | 9.6% |
| Software | 5.8 |
| Biotechnology | 5.3 |
| Trading Companies & Distributors | 4.6 |
| Energy Equipment & Services | 4.3 |
| Health Care Equipment & Supplies | 4.2 |
| Thrifts & Mortgage Finance | 3.4 |
| Consumer Finance | 3.3 |
| Commercial Services & Supplies | 3.1 |
| Chemicals | 3.1 |
| Insurance | 2.6 |
| Equity Real Estate Investment Trusts | 2.5 |
| Oil, Gas & Consumable Fuels | 2.4 |
| Hotels, Restaurants & Leisure | 2.3 |
| Health Care Providers & Services | 2.3 |
| Semiconductors & Semiconductor Equipment | 2.2 |
| Metals & Mining | 2.2 |
| IT Services | 2.1 |
| Textiles, Apparel & Luxury Goods | 2.1 |
| Personal Products | 2.0 |
| Exchange–Traded Funds | 1.9 |
| Construction & Engineering | 1.8 |
| Auto Components | 1.8 |
| Pharmaceuticals | 1.7 |
| Household Durables | 1.7 |
| Diversified Consumer Services | 1.5 |
| Professional Services | 1.5% |
| Machinery | 1.4 |
| Building Products | 1.4 |
| Media | 1.3 |
| Electronic Equipment, Instruments & Components | 1.2 |
| Specialty Retail | 1.2 |
| Electrical Equipment | 1.2 |
| Capital Markets | 1.1 |
| Real Estate Management & Development | 1.0 |
| Gas Utilities | 1.0 |
| Marine | 0.9 |
| Communications Equipment | 0.8 |
| Mortgage Real Estate Investment Trusts | 0.8 |
| Road & Rail | 0.6 |
| Household Products | 0.6 |
| Electric Utilities | 0.6 |
| Food Products | 0.6 |
| Aerospace & Defense | 0.5 |
| Leisure Products | 0.5 |
| Health Care Technology | 0.4 |
| Interactive Media & Services | 0.4 |
| Beverages | 0.4 |
| Short–Term Investments | 2.9 |
| Other Assets, Less Liabilities | –2.1 |
| | 100.0% |
See Portfolio of Investments beginning on page 10 for specific holdings within these categories. The Portfolio's holdings are subject to change.
Top Ten Holdings and/or Issuers Held as of December 31, 2022 (excluding short-term investments) (Unaudited)
| 1. | Monro, Inc. |
| 2. | Federal Agricultural Mortgage Corp., Class C |
| 3. | Skyline Champion Corp. |
| 4. | PRA Group, Inc. |
| 5. | elf Beauty, Inc. |
| 6. | Inspire Medical Systems, Inc. |
| 7. | Kemper Corp. |
| 8. | iShares Russell 2000 ETF |
| 9. | New Jersey Resources Corp. |
| 10. | Livent Corp. |
Portfolio Management Discussion and Analysis (Unaudited)
Answers to the questions reflect the views of portfolio managers Gregg R. Thomas, CFA, and Roberto J. Isch, CFA, of Wellington Management Company LLP (“Wellington”), the Portfolio’s Subadvisor.
How did MainStay VP Wellington Small Cap Portfolio perform relative to its benchmark and peers during the 12 months ended December 31, 2022?
For the 12 months ended December 31, 2022, MainStay VP Wellington Small Cap Portfolio returned −20.83% for Initial Class shares and −21.03% for Service Class shares. Over the same period, both share classes underperformed the −20.44% return of the Russell 2000® Index (“the Index”), which is the Portfolio’s benchmark, and the −16.35% return of the Morningstar Small Blend Category Average.1
What factors affected the Portfolio’s relative performance during the reporting period?
During the reporting period, the Portfolio underperformed the Index primarily due to sector allocation, a result of the Portfolio’s bottom-up stock selection process. Security selection made a positive contribution to relative returns. (Contributions take weightings and total returns into account.)
During the reporting period, how was the Portfolio’s performance materially affected by investments in derivatives?
The Portfolio used Russell 2000® Index futures during the reporting period to equitize cash2. These futures positions did not materially impact the Portfolio’s performance.
Which sectors were the strongest positive contributors to the Portfolio’s relative performance, and which sectors were particularly weak?
The Portfolio’s top performing sector relative to the Index during the reporting period was industrials, followed by consumer discretionary and communication services. The positive relative performance of all three sectors was driven by both security selection and sector allocation. During the same period, the sector that detracted most from relative performance was energy, followed by real estate and materials. Security selection undermined performance for all three sectors, while underweight exposure to energy stocks further detracted from relative performance.
During the reporting period, which individual stocks made the strongest positive contributions to the Portfolio’s absolute performance and which stocks detracted the most?
The strongest positive contributions to the Portfolio’s absolute performance came from holdings in cosmetics company e.l.f. Beauty, clinical stage biopharmaceutical developer Myovant Sciences and pharmaceutical company Lantheus Holdings.
Shares of e.l.f Beauty rose after the company reported strong results for multiple quarters during 2022. Management also raised its 2023 sales guidance. Myovant Sciences shares gained ground after the company announced solid earnings results earlier in the year, followed by strongly positive market reaction to news that the company was being acquired. Lantheus Holdings shares rose after the company reported 2021 earnings that beat consensus estimates, driven by a successful launch of Pylarify, a PET imaging agent for prostate cancer. The company also reported strong results throughout the reporting period.
The most significant detractors from the Portfolio’s absolute performance were holdings in protein engineering company Codexis, human interface semiconductor maker Synaptics and cybersecurity company Rapid7. Codexis shares lost ground when the company reported net losses in earnings for multiple quarters. Synaptics shares declined along with most other growth-oriented semiconductor stocks. Rapid7 shares fell after the company reported disappointing earnings results and delivered lower-than-expected guidance for full year 2022.
Did the Portfolio make any significant purchases or sales during the reporting period?
The Portfolio increased its positions in auto repair and tire store chain Monro, and health care company Pacira BioSciences. Monro exhibited an attractive valuation and high-quality fundamentals. Pacira BioSciences, which specializes in non-opioid pain management, exhibited attractive long-term growth prospects and high-quality fundamentals.
During the same period, we reduced the Portfolio’s exposure to semiconductor maker Tower Semiconductor and eliminated the position in Myovant Sciences, described above. While Tower Semiconductor continued to demonstrate high-quality fundamentals, other companies offered more compelling long-term growth potential. The Portfolio exited its position in Myovant Sciences following strong price appreciation after it was announced that the company would be acquired.
How did the Portfolio’s sector weightings change during the reporting period?
The most notable increases in absolute sector exposures were to energy and consumer staples, reducing the level of the Portfolio’s underweight positions in both sectors. Notable reductions in the Portfolio’s absolute sector exposures included information technology, shifting from an overweight position to a modestly underweight position, and industrials, trimming an overweight position.
| 1. | See page 5 for more information on benchmark and peer group returns. |
| 2. | To equitize cash, an investment manager purchases stock index futures, forwards or stock options contracts from a cash or liquid asset position, thus producing a return that is linked to equity performance. |
| 8 | MainStay VP Wellington Small Cap Portfolio |
How was the Portfolio positioned at the end of the reporting period?
As of December 31, 2022, the Portfolio held its most overweight positions relative to the Index in the financials and industrials sectors, and its most underweight positions in health care and real estate.
The opinions expressed are those of the portfolio managers as of the date of this report and are subject to change. There is no guarantee that any forecasts will come to pass. This material does not constitute investment advice and is not intended as an endorsement of any specific investment.
Not all MainStay VP Portfolios and/or share classes are available under all policies.
Portfolio of Investments December 31, 2022†
| | Shares | Value |
| Common Stocks 97.2% |
| Aerospace & Defense 0.5% |
| Spirit AeroSystems Holdings, Inc., Class A | 65,391 | $ 1,935,574 |
| Auto Components 1.8% |
| Dana, Inc. | 182,116 | 2,755,415 |
| Gentherm, Inc. (a) | 41,310 | 2,697,130 |
| Visteon Corp. (a) | 11,579 | 1,514,881 |
| | | 6,967,426 |
| Banks 9.6% |
| Ameris Bancorp | 47,320 | 2,230,665 |
| Bank OZK | 43,774 | 1,753,586 |
| Banner Corp. | 27,210 | 1,719,672 |
| Berkshire Hills Bancorp, Inc. | 69,232 | 2,070,037 |
| Cadence Bank | 146,425 | 3,610,841 |
| First Hawaiian, Inc. | 74,249 | 1,933,444 |
| First Interstate BancSystem, Inc., Class A | 61,905 | 2,392,628 |
| FNB Corp. | 167,544 | 2,186,449 |
| Home BancShares, Inc. | 112,310 | 2,559,545 |
| OFG Bancorp | 77,153 | 2,126,337 |
| Old National Bancorp | 149,472 | 2,687,507 |
| Pacific Premier Bancorp, Inc. | 68,847 | 2,172,811 |
| Sandy Spring Bancorp, Inc. | 56,213 | 1,980,384 |
| Stellar Bancorp, Inc. (b) | 78,472 | 2,311,785 |
| Synovus Financial Corp. | 50,282 | 1,888,089 |
| United Community Banks, Inc. | 69,723 | 2,356,637 |
| Veritex Holdings, Inc. | 71,811 | 2,016,453 |
| | | 37,996,870 |
| Beverages 0.4% |
| Celsius Holdings, Inc. (a) | 14,266 | 1,484,235 |
| Biotechnology 5.3% |
| ACADIA Pharmaceuticals, Inc. (a) | 113,727 | 1,810,534 |
| Ascendis Pharma A/S, ADR (a) | 4,448 | 543,234 |
| Blueprint Medicines Corp. (a) | 16,740 | 733,379 |
| Celldex Therapeutics, Inc. (a) | 80,211 | 3,575,004 |
| Cytokinetics, Inc. (a)(b) | 62,299 | 2,854,540 |
| Immunocore Holdings plc, ADR (a) | 12,501 | 713,432 |
| Intellia Therapeutics, Inc. (a) | 15,439 | 538,667 |
| Karuna Therapeutics, Inc. (a) | 5,200 | 1,021,800 |
| Kymera Therapeutics, Inc. (a) | 70,891 | 1,769,439 |
| Merus NV (a) | 132,911 | 2,056,133 |
| Prothena Corp. plc (a) | 10,489 | 631,962 |
| PTC Therapeutics, Inc. (a) | 22,046 | 841,496 |
| REVOLUTION Medicines, Inc. (a) | 22,917 | 545,883 |
| Rocket Pharmaceuticals, Inc. (a) | 24,789 | 485,121 |
| Sage Therapeutics, Inc. (a) | 44,710 | 1,705,240 |
| | Shares | Value |
| |
| Biotechnology (continued) |
| Syndax Pharmaceuticals, Inc. (a) | 24,747 | $ 629,811 |
| Vaxcyte, Inc. (a) | 8,685 | 416,446 |
| | | 20,872,121 |
| Building Products 1.4% |
| Apogee Enterprises, Inc. | 49,459 | 2,198,947 |
| AZEK Co., Inc. (The) (a) | 32,641 | 663,265 |
| Insteel Industries, Inc. | 50,233 | 1,382,412 |
| Zurn Elkay Water Solutions Corp. | 57,493 | 1,215,977 |
| | | 5,460,601 |
| Capital Markets 1.1% |
| Greenhill & Co., Inc. | 244,896 | 2,510,184 |
| Hamilton Lane, Inc., Class A | 29,809 | 1,904,199 |
| | | 4,414,383 |
| Chemicals 3.1% |
| Cabot Corp. | 34,631 | 2,314,736 |
| Livent Corp. (a) | 193,700 | 3,848,819 |
| Mativ Holdings, Inc. | 98,007 | 2,048,346 |
| Minerals Technologies, Inc. | 27,459 | 1,667,311 |
| Quaker Chemical Corp. | 14,941 | 2,493,653 |
| | | 12,372,865 |
| Commercial Services & Supplies 3.1% |
| BrightView Holdings, Inc. (a) | 166,250 | 1,145,462 |
| Casella Waste Systems, Inc., Class A (a) | 23,349 | 1,851,809 |
| CoreCivic, Inc. (a) | 143,048 | 1,653,635 |
| Deluxe Corp. | 65,113 | 1,105,619 |
| Interface, Inc. | 241,708 | 2,385,658 |
| Loomis AB | 80,229 | 2,197,695 |
| MillerKnoll, Inc. | 96,865 | 2,035,134 |
| | | 12,375,012 |
| Communications Equipment 0.8% |
| Calix, Inc. (a) | 44,311 | 3,032,202 |
| Construction & Engineering 1.8% |
| Ameresco, Inc., Class A (a) | 22,363 | 1,277,822 |
| Badger Infrastructure Solutions Ltd. | 113,073 | 2,226,386 |
| Fluor Corp. (a) | 100,081 | 3,468,807 |
| | | 6,973,015 |
| Consumer Finance 3.3% |
| Bread Financial Holdings, Inc. | 42,726 | 1,609,061 |
| Enova International, Inc. (a) | 91,275 | 3,502,222 |
| Navient Corp. | 107,542 | 1,769,066 |
| PRA Group, Inc. (a) | 124,515 | 4,206,117 |
The notes to the financial statements are an integral part of, and should be read in conjunction with, the financial statements.
| 10 | MainStay VP Wellington Small Cap Portfolio |
| | Shares | Value |
| Common Stocks (continued) |
| Consumer Finance (continued) |
| PROG Holdings, Inc. (a) | 112,341 | $ 1,897,439 |
| | | 12,983,905 |
| Diversified Consumer Services 1.5% |
| Adtalem Global Education, Inc. (a) | 57,815 | 2,052,433 |
| Chegg, Inc. (a) | 91,603 | 2,314,808 |
| H&R Block, Inc. | 48,132 | 1,757,299 |
| | | 6,124,540 |
| Electric Utilities 0.6% |
| Portland General Electric Co. | 45,551 | 2,231,999 |
| Electrical Equipment 1.2% |
| Acuity Brands, Inc. | 15,841 | 2,623,428 |
| EnerSys | 30,016 | 2,216,381 |
| | | 4,839,809 |
| Electronic Equipment, Instruments & Components 1.2% |
| FARO Technologies, Inc. (a) | 89,903 | 2,644,047 |
| Novanta, Inc. (a) | 17,121 | 2,326,230 |
| | | 4,970,277 |
| Energy Equipment & Services 4.2% |
| Cactus, Inc., Class A | 49,423 | 2,484,000 |
| ChampionX Corp. | 68,047 | 1,972,682 |
| DMC Global, Inc. (a) | 120,442 | 2,341,392 |
| Liberty Energy, Inc., Class A | 169,554 | 2,714,560 |
| Nabors Industries Ltd. (a) | 17,726 | 2,745,226 |
| Patterson-UTI Energy, Inc. | 138,540 | 2,333,014 |
| TechnipFMC plc (a) | 177,885 | 2,168,418 |
| | | 16,759,292 |
| Equity Real Estate Investment Trusts 2.5% |
| CareTrust REIT, Inc. | 127,040 | 2,360,403 |
| Pebblebrook Hotel Trust (b) | 133,916 | 1,793,135 |
| Piedmont Office Realty Trust, Inc., Class A | 221,993 | 2,035,676 |
| Ryman Hospitality Properties, Inc. | 25,636 | 2,096,512 |
| Uniti Group, Inc. | 324,636 | 1,795,237 |
| | | 10,080,963 |
| Food Products 0.6% |
| Calavo Growers, Inc. | 74,739 | 2,197,327 |
| Gas Utilities 1.0% |
| New Jersey Resources Corp. | 80,309 | 3,984,933 |
| | Shares | Value |
| |
| Health Care Equipment & Supplies 4.2% |
| Artivion, Inc. (a) | 160,520 | $ 1,945,503 |
| Globus Medical, Inc., Class A (a) | 21,503 | 1,597,028 |
| Inari Medical, Inc. (a) | 24,706 | 1,570,313 |
| Inspire Medical Systems, Inc. (a) | 16,520 | 4,161,058 |
| Lantheus Holdings, Inc. (a) | 43,516 | 2,217,575 |
| NuVasive, Inc. (a) | 45,335 | 1,869,615 |
| Shockwave Medical, Inc. (a) | 7,274 | 1,495,607 |
| SI-BONE, Inc. (a) | 135,711 | 1,845,670 |
| | | 16,702,369 |
| Health Care Providers & Services 2.3% |
| Acadia Healthcare Co., Inc. (a) | 28,685 | 2,361,349 |
| AMN Healthcare Services, Inc. (a) | 26,650 | 2,740,153 |
| Cross Country Healthcare, Inc. (a) | 67,772 | 1,800,702 |
| Premier, Inc., Class A | 63,137 | 2,208,532 |
| | | 9,110,736 |
| Health Care Technology 0.4% |
| NextGen Healthcare, Inc. (a) | 93,475 | 1,755,461 |
| Hotels, Restaurants & Leisure 2.3% |
| Cracker Barrel Old Country Store, Inc. (b) | 22,033 | 2,087,406 |
| Hilton Grand Vacations, Inc. (a) | 72,525 | 2,795,114 |
| Texas Roadhouse, Inc. | 23,239 | 2,113,587 |
| Wingstop, Inc. | 16,628 | 2,288,345 |
| | | 9,284,452 |
| Household Durables 1.7% |
| Helen of Troy Ltd. (a) | 20,499 | 2,273,544 |
| Skyline Champion Corp. (a) | 88,130 | 4,539,576 |
| | | 6,813,120 |
| Household Products 0.6% |
| Energizer Holdings, Inc. | 67,362 | 2,259,995 |
| Insurance 2.6% |
| Kemper Corp. | 83,732 | 4,119,615 |
| Lancashire Holdings Ltd. | 300,743 | 2,348,922 |
| ProAssurance Corp. | 95,728 | 1,672,368 |
| SiriusPoint Ltd. (a) | 362,863 | 2,140,892 |
| | | 10,281,797 |
| Interactive Media & Services 0.4% |
| Ziff Davis, Inc. (a) | 19,582 | 1,548,936 |
| IT Services 2.1% |
| ExlService Holdings, Inc. (a) | 15,088 | 2,556,360 |
| I3 Verticals, Inc., Class A (a) | 108,797 | 2,648,119 |
The notes to the financial statements are an integral part of, and should be read in conjunction with, the financial statements.
11
Portfolio of Investments December 31, 2022† (continued)
| | Shares | Value |
| Common Stocks (continued) |
| IT Services (continued) |
| Perficient, Inc. (a) | 11,076 | $ 773,437 |
| Verra Mobility Corp. (a) | 184,203 | 2,547,527 |
| | | 8,525,443 |
| Leisure Products 0.5% |
| Sturm Ruger & Co., Inc. | 37,953 | 1,921,181 |
| Machinery 1.4% |
| Kennametal, Inc. | 90,838 | 2,185,562 |
| Middleby Corp. (The) (a) | 9,911 | 1,327,083 |
| REV Group, Inc. | 155,584 | 1,963,470 |
| | | 5,476,115 |
| Marine 0.9% |
| Kirby Corp. (a) | 54,255 | 3,491,309 |
| Media 1.3% |
| Criteo SA, Sponsored ADR (a) | 56,726 | 1,478,279 |
| Magnite, Inc. (a) | 344,240 | 3,645,502 |
| | | 5,123,781 |
| Metals & Mining 2.2% |
| Carpenter Technology Corp. | 68,364 | 2,525,366 |
| Compass Minerals International, Inc. | 44,596 | 1,828,436 |
| Materion Corp. | 28,740 | 2,515,037 |
| MP Materials Corp. (a) | 68,963 | 1,674,422 |
| | | 8,543,261 |
| Mortgage Real Estate Investment Trusts 0.8% |
| Hannon Armstrong Sustainable Infrastructure Capital, Inc. (b) | 46,343 | 1,343,020 |
| Rithm Capital Corp. | 204,422 | 1,670,128 |
| | | 3,013,148 |
| Oil, Gas & Consumable Fuels 2.4% |
| Chord Energy Corp. | 21,628 | 2,958,927 |
| PBF Energy, Inc., Class A | 58,740 | 2,395,417 |
| SM Energy Co. | 51,650 | 1,798,969 |
| Viper Energy Partners LP | 72,426 | 2,302,423 |
| | | 9,455,736 |
| Personal Products 2.0% |
| Edgewell Personal Care Co. (b) | 53,485 | 2,061,312 |
| elf Beauty, Inc. (a) | 75,777 | 4,190,468 |
| Medifast, Inc. | 14,309 | 1,650,543 |
| | | 7,902,323 |
| | Shares | Value |
| |
| Pharmaceuticals 1.7% |
| Aclaris Therapeutics, Inc. (a) | 119,798 | $ 1,886,819 |
| Arvinas, Inc. (a) | 30,930 | 1,058,115 |
| Intra-Cellular Therapies, Inc. (a) | 16,022 | 847,884 |
| Pacira BioSciences, Inc. (a) | 67,054 | 2,588,955 |
| Revance Therapeutics, Inc. (a) | 21,087 | 389,266 |
| Verona Pharma plc, ADR (a) | 2,400 | 62,712 |
| | | 6,833,751 |
| Professional Services 1.5% |
| Insperity, Inc. | 30,456 | 3,459,802 |
| TriNet Group, Inc. (a) | 37,538 | 2,545,076 |
| | | 6,004,878 |
| Real Estate Management & Development 1.0% |
| Marcus & Millichap, Inc. | 68,723 | 2,367,507 |
| Tricon Residential, Inc. | 231,055 | 1,781,434 |
| | | 4,148,941 |
| Road & Rail 0.6% |
| Heartland Express, Inc. | 165,178 | 2,533,831 |
| Semiconductors & Semiconductor Equipment 2.2% |
| Ichor Holdings Ltd. (a) | 63,913 | 1,714,147 |
| MKS Instruments, Inc. | 11,094 | 939,995 |
| Silicon Motion Technology Corp., ADR | 27,540 | 1,789,825 |
| Synaptics, Inc. (a) | 18,294 | 1,740,857 |
| Tower Semiconductor Ltd. (a) | 62,713 | 2,709,201 |
| | | 8,894,025 |
| Software 5.8% |
| Adeia, Inc. | 224,927 | 2,132,308 |
| Agilysys, Inc. (a) | 47,658 | 3,771,654 |
| Box, Inc., Class A (a) | 84,398 | 2,627,310 |
| Consensus Cloud Solutions, Inc. (a) | 51,227 | 2,753,964 |
| Five9, Inc. (a) | 26,756 | 1,815,662 |
| InterDigital, Inc. | 43,091 | 2,132,143 |
| Jamf Holding Corp. (a) | 86,364 | 1,839,553 |
| Manhattan Associates, Inc. (a) | 11,821 | 1,435,069 |
| RingCentral, Inc., Class A (a) | 43,425 | 1,537,245 |
| SolarWinds Corp. (a) | 136,809 | 1,280,532 |
| Xperi, Inc. (a)(c) | 203,976 | 1,756,233 |
| | | 23,081,673 |
| Specialty Retail 1.2% |
| Monro, Inc. | 107,114 | 4,841,553 |
| Textiles, Apparel & Luxury Goods 2.1% |
| Carter's, Inc. | 23,167 | 1,728,490 |
| Crocs, Inc. (a) | 19,902 | 2,157,974 |
The notes to the financial statements are an integral part of, and should be read in conjunction with, the financial statements.
| 12 | MainStay VP Wellington Small Cap Portfolio |
| | Shares | Value |
| Common Stocks (continued) |
| Textiles, Apparel & Luxury Goods (continued) |
| Kontoor Brands, Inc. | 53,959 | $ 2,157,820 |
| Steven Madden Ltd. | 66,480 | 2,124,701 |
| | | 8,168,985 |
| Thrifts & Mortgage Finance 3.4% |
| Federal Agricultural Mortgage Corp., Class C | 41,294 | 4,654,247 |
| MGIC Investment Corp. | 169,765 | 2,206,945 |
| NMI Holdings, Inc., Class A (a) | 114,019 | 2,382,997 |
| Radian Group, Inc. | 125,898 | 2,400,875 |
| WSFS Financial Corp. | 38,709 | 1,755,066 |
| | | 13,400,130 |
| Trading Companies & Distributors 4.6% |
| Air Lease Corp. | 52,468 | 2,015,820 |
| Applied Industrial Technologies, Inc. | 27,228 | 3,431,545 |
| Boise Cascade Co. | 44,982 | 3,088,914 |
| McGrath RentCorp | 21,566 | 2,129,427 |
| MRC Global, Inc. (a) | 298,777 | 3,459,838 |
| Rush Enterprises, Inc., Class A | 25,828 | 1,350,288 |
| WESCO International, Inc. (a) | 22,658 | 2,836,781 |
| | | 18,312,613 |
Total Common Stocks
(Cost $429,757,621) | | 385,486,892 |
| Exchange-Traded Funds 1.9% |
| iShares Russell 2000 ETF (b) | 22,867 | 3,987,090 |
| iShares Russell 2000 Growth ETF (b) | 6,619 | 1,419,908 |
| iShares Russell 2000 Value ETF (b) | 13,453 | 1,865,528 |
Total Exchange-Traded Funds
(Cost $7,563,101) | | 7,272,526 |
| |
| | Number of
Warrants | |
| Warrants 0.1% |
| Energy Equipment & Services 0.1% |
| Nabors Industries Ltd. | | |
| Expires 6/11/26 (a) | 10,100 | 332,290 |
Total Warrants
(Cost $0) | | 332,290 |
| |
| | Shares | | Value |
| Short-Term Investments 2.9% |
| Affiliated Investment Company 0.9% |
| MainStay U.S. Government Liquidity Fund, 3.602% (d) | 3,650,718 | | $ 3,650,718 |
| Unaffiliated Investment Company 2.0% |
| Invesco Government and Agency Portfolio, 4.301% (d)(e) | 7,901,883 | | 7,901,883 |
Total Short-Term Investments
(Cost $11,552,601) | | | 11,552,601 |
Total Investments
(Cost $448,873,323) | 102.1% | | 404,644,309 |
| Other Assets, Less Liabilities | (2.1) | | (8,149,703) |
| Net Assets | 100.0% | | $ 396,494,606 |
| † | Percentages indicated are based on Portfolio net assets. |
| (a) | Non-income producing security. |
| (b) | All or a portion of this security was held on loan. As of December 31, 2022, the aggregate market value of securities on loan was $9,591,490; the total market value of collateral held by the Portfolio was $9,853,947. The market value of the collateral held included non-cash collateral in the form of U.S. Treasury securities with a value of $1,952,064. The Portfolio received cash collateral with a value of $7,901,883. (See Note 2(I)) |
| (c) | Illiquid security—As of December 31, 2022, the total market value deemed illiquid under procedures approved by the Board of Trustees was $1,756,233, which represented 0.4% of the Portfolio’s net assets. (Unaudited) |
| (d) | Current yield as of December 31, 2022. |
| (e) | Represents a security purchased with cash collateral received for securities on loan. |
The notes to the financial statements are an integral part of, and should be read in conjunction with, the financial statements.
13
Portfolio of Investments December 31, 2022† (continued)
Investments in Affiliates (in 000's)
Investments in issuers considered to be affiliate(s) of the Portfolio during the year ended December 31, 2022 for purposes of Section 2(a)(3) of the Investment Company Act of 1940, as amended, were as follows:
| Affiliated Investment Companies | Value,
Beginning
of Year | Purchases
at Cost | Proceeds
from
Sales | Net
Realized
Gain/(Loss)
on Sales | Change in
Unrealized
Appreciation/
(Depreciation) | Value,
End of
Year | Dividend
Income | Other
Distributions | Shares
End of
Year |
| MainStay U.S. Government Liquidity Fund | $ — | $ 114,254 | $ (110,603) | $ — | $ — | $ 3,651 | $ 101 | $ — | 3,651 |
Futures Contracts
As of December 31, 2022, the Portfolio held the following futures contracts1:
| Type | Number of
Contracts | Expiration
Date | Value at
Trade Date | Current
Notional
Amount | Unrealized
Appreciation
(Depreciation)2 |
| Long Contracts | | | | | |
| Russell 2000 E-Mini Index | 25 | March 2023 | $ 2,292,525 | $ 2,213,625 | $ (78,900) |
| 1. | As of December 31, 2022, cash in the amount of $159,500 was on deposit with a broker or futures commission merchant for futures transactions. |
| 2. | Represents the difference between the value of the contracts at the time they were opened and the value as of December 31, 2022. |
| Abbreviation(s): |
| ADR—American Depositary Receipt |
| ETF—Exchange-Traded Fund |
| REIT—Real Estate Investment Trust |
The following is a summary of the fair valuations according to the inputs used as of December 31, 2022, for valuing the Portfolio’s assets and liabilities:
| Description | Quoted
Prices in
Active
Markets for
Identical
Assets
(Level 1) | | Significant
Other
Observable
Inputs
(Level 2) | | Significant
Unobservable
Inputs
(Level 3) | | Total |
| Asset Valuation Inputs | | | | | | | |
| Investments in Securities (a) | | | | | | | |
| Common Stocks | | | | | | | |
| Commercial Services & Supplies | $ 10,177,317 | | $ 2,197,695 | | $ — | | $ 12,375,012 |
| Insurance | 7,932,875 | | 2,348,922 | | — | | 10,281,797 |
| All Other Industries | 362,830,083 | | — | | — | | 362,830,083 |
| Total Common Stocks | 380,940,275 | | 4,546,617 | | — | | 385,486,892 |
| Exchange-Traded Funds | 7,272,526 | | — | | — | | 7,272,526 |
| Warrants | 332,290 | | — | | — | | 332,290 |
| Short-Term Investments | | | | | | | |
| Affiliated Investment Company | 3,650,718 | | — | | — | | 3,650,718 |
| Unaffiliated Investment Company | 7,901,883 | | — | | — | | 7,901,883 |
| Total Short-Term Investments | 11,552,601 | | — | | — | | 11,552,601 |
| Total Investments in Securities | $ 400,097,692 | | $ 4,546,617 | | $ — | | $ 404,644,309 |
| Liability Valuation Inputs | | | | | | | |
| Other Financial Instruments | | | | | | | |
| Futures Contracts (b) | $ (78,900) | | $ — | | $ — | | $ (78,900) |
| (a) | For a complete listing of investments and their industries, see the Portfolio of Investments. |
| (b) | The value listed for these securities reflects unrealized appreciation (depreciation) as shown on the Portfolio of Investments. |
The notes to the financial statements are an integral part of, and should be read in conjunction with, the financial statements.
| 14 | MainStay VP Wellington Small Cap Portfolio |
Statement of Assets and Liabilities as of December 31, 2022
| Assets |
Investment in unaffiliated securities, at value
(identified cost $445,222,605) including securities on loan of $9,591,490 | $400,993,591 |
Investment in affiliated investment companies, at value
(identified cost $3,650,718) | 3,650,718 |
| Cash collateral on deposit at broker for futures contracts | 159,500 |
| Receivables: | |
| Dividends | 603,501 |
| Investment securities sold | 268,809 |
| Portfolio shares sold | 28,680 |
| Securities lending | 2,281 |
| Other assets | 2,388 |
| Total assets | 405,709,468 |
| Liabilities |
| Cash collateral received for securities on loan | 7,901,883 |
| Payables: | |
| Investment securities purchased | 822,031 |
| Manager (See Note 3) | 244,468 |
| Shareholder communication | 87,397 |
| Portfolio shares redeemed | 61,227 |
| NYLIFE Distributors (See Note 3) | 48,858 |
| Professional fees | 27,915 |
| Variation margin on futures contracts | 7,708 |
| Custodian | 5,552 |
| Accrued expenses | 7,823 |
| Total liabilities | 9,214,862 |
| Net assets | $396,494,606 |
| Composition of Net Assets |
| Shares of beneficial interest outstanding (par value of $.001 per share) unlimited number of shares authorized | $ 51,948 |
| Additional paid-in-capital | 487,238,851 |
| | 487,290,799 |
| Total distributable earnings (loss) | (90,796,193) |
| Net assets | $396,494,606 |
| Initial Class | |
| Net assets applicable to outstanding shares | $172,629,031 |
| Shares of beneficial interest outstanding | 22,455,830 |
| Net asset value per share outstanding | $ 7.69 |
| Service Class | |
| Net assets applicable to outstanding shares | $223,865,575 |
| Shares of beneficial interest outstanding | 29,491,693 |
| Net asset value per share outstanding | $ 7.59 |
The notes to the financial statements are an integral part of, and should be read in conjunction with, the financial statements.
15
Statement of Operations for the year ended December 31, 2022
| Investment Income (Loss) |
| Income | |
| Dividends-unaffiliated (net of foreign tax withholding of $31,619) | $ 6,032,079 |
| Dividends-affiliated | 101,121 |
| Securities lending, net | 78,551 |
| Total income | 6,211,751 |
| Expenses | |
| Manager (See Note 3) | 3,468,340 |
| Distribution/Service—Service Class (See Note 3) | 636,465 |
| Shareholder communication | 93,640 |
| Professional fees | 76,725 |
| Custodian | 14,960 |
| Trustees | 8,917 |
| Miscellaneous | 15,210 |
| Total expenses before waiver/reimbursement | 4,314,257 |
| Expense waiver/reimbursement from Manager (See Note 3) | (469,574) |
| Net expenses | 3,844,683 |
| Net investment income (loss) | 2,367,068 |
| Realized and Unrealized Gain (Loss) |
| Net realized gain (loss) on: | |
| Unaffiliated investment transactions | (45,828,599) |
| Futures transactions | (1,970,259) |
| Foreign currency transactions | 29,980 |
| Net realized gain (loss) | (47,768,878) |
| Net change in unrealized appreciation (depreciation) on: | |
| Unaffiliated investments | (61,995,844) |
| Futures contracts | (68,431) |
| Translation of other assets and liabilities in foreign currencies | (9,335) |
| Net change in unrealized appreciation (depreciation) | (62,073,610) |
| Net realized and unrealized gain (loss) | (109,842,488) |
| Net increase (decrease) in net assets resulting from operations | $(107,475,420) |
The notes to the financial statements are an integral part of, and should be read in conjunction with, the financial statements.
| 16 | MainStay VP Wellington Small Cap Portfolio |
Statements of Changes in Net Assets
for the years ended December 31, 2022 and December 31, 2021
| | 2022 | 2021 |
| Increase (Decrease) in Net Assets |
| Operations: | | |
| Net investment income (loss) | $ 2,367,068 | $ 3,974,275 |
| Net realized gain (loss) | (47,768,878) | 153,598,829 |
| Net change in unrealized appreciation (depreciation) | (62,073,610) | (69,630,017) |
| Net increase (decrease) in net assets resulting from operations | (107,475,420) | 87,943,087 |
| Distributions to shareholders: | | |
| Initial Class | (49,470,351) | (775,143) |
| Service Class | (66,408,806) | (592,973) |
| Total distributions to shareholders | (115,879,157) | (1,368,116) |
| Capital share transactions: | | |
| Net proceeds from sales of shares | 42,762,495 | 46,281,087 |
| Net asset value of shares issued to shareholders in reinvestment of distributions | 115,879,157 | 1,368,116 |
| Cost of shares redeemed | (57,789,013) | (117,292,808) |
| Increase (decrease) in net assets derived from capital share transactions | 100,852,639 | (69,643,605) |
| Net increase (decrease) in net assets | (122,501,938) | 16,931,366 |
| Net Assets |
| Beginning of year | 518,996,544 | 502,065,178 |
| End of year | $ 396,494,606 | $ 518,996,544 |
The notes to the financial statements are an integral part of, and should be read in conjunction with, the financial statements.
17
Financial Highlights selected per share data and ratios
| | Year Ended December 31, |
| Initial Class | 2022 | | 2021 | | 2020 | | 2019 | | 2018 |
| Net asset value at beginning of year | $ 13.79 | | $ 11.73 | | $ 10.65 | | $ 9.82 | | $ 13.16 |
| Net investment income (loss) (a) | 0.07 | | 0.16 | | 0.04 | | 0.05 | | 0.04 |
| Net realized and unrealized gain (loss) | (3.05) | | 1.95 | | 1.05 | | 1.61 | | (1.71) |
| Total from investment operations | (2.98) | | 2.11 | | 1.09 | | 1.66 | | (1.67) |
| Less distributions: | | | | | | | | | |
| From net investment income | (0.13) | | (0.05) | | (0.01) | | (0.02) | | — |
| From net realized gain on investments | (2.99) | | — | | — | | (0.81) | | (1.67) |
| Total distributions | (3.12) | | (0.05) | | (0.01) | | (0.83) | | (1.67) |
| Net asset value at end of year | $ 7.69 | | $ 13.79 | | $ 11.73 | | $ 10.65 | | $ 9.82 |
| Total investment return (b) | (20.83)% | | 18.03% | | 10.22% | | 17.82% | | (15.11)% |
| Ratios (to average net assets)/Supplemental Data: | | | | | | | | | |
| Net investment income (loss) | 0.70% | | 0.93% | | 0.42% | | 0.48% | | 0.33% |
| Net expenses (c) | 0.74% | | 0.74% | | 0.75% | | 0.82% | | 0.90% |
| Expenses (before waiver/reimbursement) (c) | 0.85% | | 0.86% | | 0.86% | | 0.86% | | 0.90% |
| Portfolio turnover rate | 71% | | 83% | | 225% | | 257% | | 161% |
| Net assets at end of year (in 000's) | $ 172,629 | | $ 206,410 | | $ 197,586 | | $ 198,292 | | $ 123,857 |
| (a) | Per share data based on average shares outstanding during the year. |
| (b) | Total return does not reflect any deduction of sales charges, mortality and expense charges, contract charges or administrative charges. For periods of less than one year, total return is not annualized. |
| (c) | In addition to the fees and expenses which the Portfolio bears directly, it also indirectly bears a pro-rata share of the fees and expenses of the underlying funds in which it invests. Such indirect expenses are not included in the above expense ratios. |
| | Year Ended December 31, |
| Service Class | 2022 | | 2021 | | 2020 | | 2019 | | 2018 |
| Net asset value at beginning of year | $ 13.65 | | $ 11.61 | | $ 10.56 | | $ 9.76 | | $ 13.11 |
| Net investment income (loss) (a) | 0.05 | | 0.12 | | 0.02 | | 0.02 | | 0.01 |
| Net realized and unrealized gain (loss) | (3.02) | | 1.95 | | 1.03 | | 1.59 | | (1.69) |
| Total from investment operations | (2.97) | | 2.07 | | 1.05 | | 1.61 | | (1.68) |
| Less distributions: | | | | | | | | | |
| From net investment income | (0.10) | | (0.03) | | — | | (0.00)‡ | | — |
| From net realized gain on investments | (2.99) | | — | | — | | (0.81) | | (1.67) |
| Total distributions | (3.09) | | (0.03) | | — | | (0.81) | | (1.67) |
| Net asset value at end of year | $ 7.59 | | $ 13.65 | | $ 11.61 | | $ 10.56 | | $ 9.76 |
| Total investment return (b) | (21.03)% | | 17.73% | | 9.94%(c) | | 17.53% | | (15.32)% |
| Ratios (to average net assets)/Supplemental Data: | | | | | | | | | |
| Net investment income (loss) | 0.44% | | 0.66% | | 0.17% | | 0.22% | | 0.09% |
| Net expenses (d) | 0.99% | | 0.99% | | 1.00% | | 1.07% | | 1.15% |
| Expenses (before waiver/reimbursement) (d) | 1.10% | | 1.11% | | 1.11% | | 1.12% | | 1.15% |
| Portfolio turnover rate | 71% | | 83% | | 225% | | 257% | | 161% |
| Net assets at end of year (in 000's) | $ 223,866 | | $ 312,587 | | $ 304,479 | | $ 317,216 | | $ 136,965 |
| ‡ | Less than one cent per share. |
| (a) | Per share data based on average shares outstanding during the year. |
| (b) | Total return does not reflect any deduction of sales charges, mortality and expense charges, contract charges or administrative charges. For periods of less than one year, total return is not annualized. |
| (c) | Total investment return may reflect adjustments to conform to generally accepted accounting principles. |
| (d) | In addition to the fees and expenses which the Portfolio bears directly, it also indirectly bears a pro-rata share of the fees and expenses of the underlying funds in which it invests. Such indirect expenses are not included in the above expense ratios. |
The notes to the financial statements are an integral part of, and should be read in conjunction with, the financial statements.
| 18 | MainStay VP Wellington Small Cap Portfolio |
Notes to Financial Statements
Note 1–Organization and Business
MainStay VP Funds Trust (the “Fund”) was organized as a Delaware statutory trust on February 1, 2011. The Fund is registered under the Investment Company Act of 1940, as amended (the “1940 Act”), as an open-end management investment company. The Fund is comprised of thirty-one separate series (collectively referred to as the “Portfolios”). These financial statements and notes relate to the MainStay VP Wellington Small Cap Portfolio (the "Portfolio"), a "diversified” portfolio, as that term is defined in the 1940 Act, as interpreted or modified by regulatory authorities having jurisdiction, from time to time.
Shares of the Portfolio are currently offered to certain separate accounts to fund variable annuity policies and variable universal life insurance policies issued by New York Life Insurance and Annuity Corporation (“NYLIAC”), a wholly-owned subsidiary of New York Life Insurance Company (“New York Life”) and may also be offered to fund variable annuity policies and variable universal life insurance policies issued by other insurance companies. NYLIAC allocates shares of the Portfolio to, among others, certain NYLIAC separate accounts. Shares of the Portfolio are also offered to the MainStay VP Conservative Allocation Portfolio, MainStay VP Moderate Allocation Portfolio, MainStay VP Growth Allocation Portfolio and MainStay VP Equity Allocation Portfolio, which operate as “funds-of-funds," and other variable insurance funds.
The following table lists the Portfolio's share classes that have been registered and commenced operations:
| Class | Commenced Operations |
| Initial Class | May 2, 2016 |
| Service Class | May 2, 2016 |
Shares of the Portfolio are offered and are redeemed at a price equal to their respective net asset value (“NAV”) per share. No sales or redemption charge is applicable to the purchase or redemption of the Portfolio's shares. Under the terms of the Fund’s multiple class plan, adopted pursuant to Rule 18f-3 under the 1940 Act, the classes differ in that, among other things, Service Class shares of the Portfolio pay a combined distribution and service fee of 0.25% of average daily net assets attributable to Service Class shares of the Portfolio to the Distributor (as defined in Note 3(B)) pursuant to a plan adopted in accordance with Rule 12b-1 under the 1940 Act. Contract owners of variable annuity contracts purchased after June 2, 2003, are permitted to invest only in the Service Class shares.
The Portfolio's investment objective is to seek long-term growth of capital.
Note 2–Significant Accounting Policies
The Portfolio is an investment company and accordingly follows the investment company accounting and reporting guidance of the Financial Accounting Standards Board (“FASB”) Accounting Standards Codification Topic 946 Financial Services—Investment Companies. The Portfolio prepares its financial statements in accordance with generally accepted
accounting principles (“GAAP”) in the United States of America and follows the significant accounting policies described below.
(A) Securities Valuation. Investments are usually valued as of the close of regular trading on the New York Stock Exchange (the "Exchange") (usually 4:00 p.m. Eastern time) on each day the Portfolio is open for business ("valuation date").
Effective September 8, 2022, and pursuant to Rule 2a-5 under the 1940 Act, the Board of Trustees of the Fund (the "Board") designated New York Life Investment Management LLC (“New York Life Investments” or the "Manager") as its Valuation Designee (the "Valuation Designee"). The Valuation Designee is responsible for performing fair valuations relating to all investments in the Portfolio’s portfolio for which market quotations are not readily available; periodically assessing and managing material valuation risks; establishing and applying fair value methodologies; testing fair valuation methodologies; evaluating and overseeing pricing services; ensuring appropriate segregation of valuation and portfolio management functions; providing quarterly, annual and prompt reporting to the Board, as appropriate; identifying potential conflicts of interest; and maintaining appropriate records. The Valuation Designee has established a valuation committee ("Valuation Committee") to assist in carrying out the Valuation Designee’s responsibilities and establish prices of securities for which market quotations are not readily available. The Portfolio’s and the Valuation Designee's policies and procedures ("Valuation Procedures") govern the Valuation Designee’s selection and application of methodologies for determining and calculating the fair value of Portfolio investments. The Valuation Designee may value the Portfolio's portfolio securities for which market quotations are not readily available and other Portfolio assets utilizing inputs from pricing services and other third-party sources (together, “Pricing Sources”). The Valuation Committee meets (in person, via electronic mail or via teleconference) on an ad-hoc basis to determine fair valuations and on a quarterly basis to review fair value events with respect to certain securities for which market quotations are not readily available, including valuation risks and back-testing results, and preview reports to the Board.
The Valuation Committee establishes prices of securities for which market quotations are not readily available based on such methodologies and measurements on a regular basis after considering information that is reasonably available and deemed relevant by the Valuation Committee. The Board shall oversee the Valuation Designee and review fair valuation materials on a prompt, quarterly and annual basis and approve proposed revisions to the Valuation Procedures.
Investments for which market quotations are not readily available are valued at fair value as determined in good faith pursuant to the Valuation Procedures. A market quotation is readily available only when that quotation is a quoted price (unadjusted) in active markets for identical investments that the Portfolio can access at the measurement date, provided that a quotation will not be readily available if it is not reliable. "Fair value" is defined as the price the Portfolio would reasonably expect to receive upon selling an asset or liability in an orderly transaction to an independent buyer in the principal or most advantageous market for the
Notes to Financial Statements (continued)
asset or liability. Fair value measurements are determined within a framework that establishes a three-tier hierarchy that maximizes the use of observable market data and minimizes the use of unobservable inputs to establish a classification of fair value measurements for disclosure purposes. "Inputs" refer broadly to the assumptions that market participants would use in pricing the asset or liability, including assumptions about risk, such as the risk inherent in a particular valuation technique used to measure fair value using a pricing model and/or the risk inherent in the inputs for the valuation technique. Inputs may be observable or unobservable. Observable inputs reflect the assumptions market participants would use in pricing the asset or liability based on market data obtained from sources independent of the Portfolio. Unobservable inputs reflect the Portfolio’s own assumptions about the assumptions market participants would use in pricing the asset or liability based on the information available. The inputs or methodology used for valuing assets or liabilities may not be an indication of the risks associated with investing in those assets or liabilities. The three-tier hierarchy of inputs is summarized below.
| • | Level 1—quoted prices (unadjusted) in active markets for an identical asset or liability |
| • | Level 2—other significant observable inputs (including quoted prices for a similar asset or liability in active markets, interest rates and yield curves, prepayment speeds, credit risk, etc.) |
| • | Level 3—significant unobservable inputs (including the Portfolio's own assumptions about the assumptions that market participants would use in measuring fair value of an asset or liability) |
The level of an asset or liability within the fair value hierarchy is based on the lowest level of an input, both individually and in the aggregate, that is significant to the fair value measurement. The aggregate value by input level of the Portfolio’s assets and liabilities as of December 31, 2022, is included at the end of the Portfolio of Investments.
The Portfolio may use third-party vendor evaluations, whose prices may be derived from one or more of the following standard inputs, among others:
| • Broker/dealer quotes | • Benchmark securities |
| • Two-sided markets | • Reference data (corporate actions or material event notices) |
| • Bids/offers | • Monthly payment information |
| • Industry and economic events | • Reported trades |
An asset or liability for which a market quotation is not readily available is valued by methods deemed reasonable in good faith by the Valuation Committee, following the Valuation Procedures to represent fair value. Under these procedures, the Valuation Designee generally uses a market-based approach which may use related or comparable assets or liabilities, recent transactions, market multiples, book values and other relevant information. The Valuation Designee may also use an income-based valuation approach in which the anticipated future cash flows of the asset or liability are discounted to calculate fair value.
Discounts may also be applied due to the nature and/or duration of any restrictions on the disposition of the asset or liability. Fair value represents a good faith approximation of the value of a security. Fair value determinations involve the consideration of a number of subjective factors, an analysis of applicable facts and circumstances and the exercise of judgment. As a result, it is possible that the fair value for a security determined in good faith in accordance with the Valuation Procedures may differ from valuations for the same security determined for other funds using their own valuation procedures. Although the Valuation Procedures are designed to value a security at the price the Portfolio may reasonably expect to receive upon the security's sale in an orderly transaction, there can be no assurance that any fair value determination thereunder would, in fact, approximate the amount that the Portfolio would actually realize upon the sale of the security or the price at which the security would trade if a reliable market price were readily available. During the year ended December 31, 2022, there were no material changes to the fair value methodologies.
Securities which may be valued in this manner include, but are not limited to: (i) a security for which trading has been halted or suspended or otherwise does not have a readily available market quotation on a given day; (ii) a debt security that has recently gone into default and for which there is not a current market quotation; (iii) a security of an issuer that has entered into a restructuring; (iv) a security that has been delisted from a national exchange; (v) a security subject to trading collars for which no or limited trading takes place; and (vi) a security whose principal market has been temporarily closed at a time when, under normal conditions, it would be open. Securities valued in this manner are generally categorized as Level 2 or 3 in the hierarchy.
Equity securities, including exchange-traded funds ("ETFs"), are valued at the last quoted sales prices as of the close of regular trading on the relevant exchange on each valuation date. Securities that are not traded on the valuation date are valued at the mean of the last quoted bid and ask prices. Prices are normally taken from the principal market in which each security trades. These securities are generally categorized as Level 1 in the hierarchy.
Investments in mutual funds, including money market funds, are valued at their respective NAVs at the close of business each day on the valuation date. These securities are generally categorized as Level 1 in the hierarchy.
Futures contracts are valued at the last posted settlement price on the market where such futures are primarily traded. These securities are generally categorized as Level 1 in the hierarchy.
Temporary cash investments acquired in excess of 60 days to maturity at the time of purchase are valued using the latest bid prices or using valuations based on a matrix system (which considers such factors as security prices, yields, maturities and ratings), both as furnished by independent pricing services. Temporary cash investments that mature in 60 days or less at the time of purchase ("Short-Term Investments") are valued using the amortized cost method of valuation, unless the use of such method would be inappropriate. The amortized cost method involves
| 20 | MainStay VP Wellington Small Cap Portfolio |
valuing a security at its cost on the date of purchase and thereafter assuming a constant amortization to maturity of the difference between such cost and the value on maturity date. Amortized cost approximates the current fair value of a security. Securities valued using the amortized cost method are not valued using quoted prices in an active market and are generally categorized as Level 2 in the hierarchy.
The information above is not intended to reflect an exhaustive list of the methodologies that may be used to value portfolio investments. The Valuation Procedures permit the use of a variety of valuation methodologies in connection with valuing portfolio investments. The methodology used for a specific type of investment may vary based on the market data available or other considerations. The methodologies summarized above may not represent the specific means by which portfolio investments are valued on any particular business day.
A portfolio investment may be classified as an illiquid investment under the Portfolio's written liquidity risk management program and related procedures (“Liquidity Program”). Illiquidity of an investment might prevent the sale of such investment at a time when the Manager or the Subadvisor might wish to sell, and these investments could have the effect of decreasing the overall level of the Portfolio's liquidity. Further, the lack of an established secondary market may make it more difficult to value illiquid investments, requiring the Portfolio to rely on judgments that may be somewhat subjective in measuring value, which could vary materially from the amount that the Portfolio could realize upon disposition. Difficulty in selling illiquid investments may result in a loss or may be costly to the Portfolio. An illiquid investment is any investment that the Manager or Subadvisor reasonably expects cannot be sold or disposed of in current market conditions in seven calendar days or less without the sale or disposition significantly changing the market value of the investment. The liquidity classification of each investment will be made using information obtained after reasonable inquiry and taking into account, among other things, relevant market, trading and investment-specific considerations in accordance with the Liquidity Program. Illiquid investments are often fair valued in accordance with the Portfolio's procedures described above. The liquidity of the Portfolio's investments was determined as of December 31, 2022, and can change at any time. Illiquid investments as of December 31, 2022, are shown in the Portfolio of Investments.
(B) Income Taxes. The Portfolio's policy is to comply with the requirements of the Internal Revenue Code of 1986, as amended (the “Internal Revenue Code”), applicable to regulated investment companies and to distribute all of its taxable income to the shareholders of the Portfolio within the allowable time limits.
The Manager evaluates the Portfolio’s tax positions to determine if the tax positions taken meet the minimum recognition threshold in connection with accounting for uncertainties in income tax positions taken or expected to be taken for the purposes of measuring and recognizing tax liabilities in the financial statements. Recognition of tax benefits of an uncertain tax position is permitted only to the extent the position is “more likely than not” to be sustained assuming examination by taxing
authorities. The Manager analyzed the Portfolio's tax positions taken on federal, state and local income tax returns for all open tax years (for up to three tax years) and has concluded that no provisions for federal, state and local income tax are required in the Portfolio's financial statements. The Portfolio's federal, state and local income tax and federal excise tax returns for tax years for which the applicable statutes of limitations have not expired are subject to examination by the Internal Revenue Service and state and local departments of revenue.
(C) Dividends and Distributions to Shareholders. Dividends and distributions are recorded on the ex-dividend date. The Portfolio intends to declare and pay dividends from net investment income and distributions from net realized capital and currency gains, if any, at least annually. All dividends and distributions are reinvested at NAV in the same class of shares of the Portfolio. Dividends and distributions to shareholders are determined in accordance with federal income tax regulations and may differ from determinations using GAAP.
(D) Security Transactions and Investment Income. The Portfolio records security transactions on the trade date. Realized gains and losses on security transactions are determined using the identified cost method. Dividend income is recognized on the ex-dividend date, net of any foreign tax withheld at the source, and interest income is accrued as earned using the effective interest rate method. Distributions received from real estate investment trusts may be classified as dividends, capital gains and/or return of capital.
Investment income and realized and unrealized gains and losses on investments of the Portfolio are allocated pro rata to the separate classes of shares based upon their relative net assets on the date the income is earned or realized and unrealized gains and losses are incurred.
(E) Expenses. Expenses of the Fund are allocated to the individual Portfolios in proportion to the net assets of the respective Portfolios when the expenses are incurred, except where direct allocations of expenses can be made. Expenses (other than fees incurred under the distribution and service plans, further discussed in Note 3(B), which are charged directly to the Service Class shares) are allocated to separate classes of shares pro rata based upon their relative net assets on the date the expenses are incurred. The expenses borne by the Portfolio, including those of related parties to the Portfolio, are shown in the Statement of Operations.
Additionally, the Portfolio may invest in ETFs and mutual funds, which are subject to management fees and other fees that may cause the costs of investing in ETFs and mutual funds to be greater than the costs of owning the underlying securities directly. These indirect expenses of ETFs and mutual funds are not included in the amounts shown as expenses in the Statement of Operations or in the expense ratios included in the Financial Highlights.
(F) Use of Estimates. In preparing financial statements in conformity with GAAP, the Manager makes estimates and assumptions that affect the reported amounts and disclosures in the financial statements. Actual results could differ from those estimates and assumptions.
Notes to Financial Statements (continued)
(G) Futures Contracts. A futures contract is an agreement to purchase or sell a specified quantity of an underlying instrument at a specified future date and price, or to make or receive a cash payment based on the value of a financial instrument (e.g., foreign currency, interest rate, security or securities index). The Portfolio is subject to risks such as market price risk, leverage risk, liquidity risk, counterparty risk, operational risk, legal risk and/or interest rate risk in the normal course of investing in these contracts. Upon entering into a futures contract, the Portfolio is required to pledge to the broker or futures commission merchant an amount of cash and/or U.S. government securities equal to a certain percentage of the collateral amount, known as the “initial margin.” During the period the futures contract is open, changes in the value of the contract are recognized as unrealized appreciation or depreciation by marking to market such contract on a daily basis to reflect the market value of the contract at the end of each day’s trading. The Portfolio agrees to receive from or pay to the broker or futures commission merchant an amount of cash equal to the daily fluctuation in the value of the contract. Such receipts or payments are known as “variation margin.” When the futures contract is closed, the Portfolio records a realized gain or loss equal to the difference between the proceeds from (or cost of) the closing transaction and the Portfolio's basis in the contract.
The use of futures contracts involves, to varying degrees, elements of market risk in excess of the amount recognized in the Statement of Assets and Liabilities. The contract or notional amounts and variation margin reflect the extent of the Portfolio's involvement in open futures positions. There are several risks associated with the use of futures contracts as hedging techniques. There can be no assurance that a liquid market will exist at the time when the Portfolio seeks to close out a futures contract. If no liquid market exists, the Portfolio would remain obligated to meet margin requirements until the position is closed. Futures contracts may involve a small initial investment relative to the risk assumed, which could result in losses greater than if the Portfolio did not invest in futures contracts. Futures contracts may be more volatile than direct investments in the instrument underlying the futures and may not correlate to the underlying instrument, causing a given hedge not to achieve its objectives. The Portfolio's activities in futures contracts have minimal counterparty risk as they are conducted through regulated exchanges that guarantee the futures against default by the counterparty. In the event of a bankruptcy or insolvency of a futures commission merchant that holds margin on behalf of the Portfolio, the Portfolio may not be entitled to the return of the entire margin owed to the Portfolio, potentially resulting in a loss. The Portfolio may invest in futures contracts to seek enhanced returns or to reduce the risk of loss by hedging certain of its holdings. The Portfolio's investment in futures contracts and other derivatives may increase the volatility of the Portfolio's NAVs and may result in a loss to the Portfolio. Open futures contracts as of December 31, 2022, are shown in the Portfolio of Investments.
(H) Foreign Currency Transactions. The Portfolio's books and records are maintained in U.S. dollars. Prices of securities denominated in foreign currency amounts are translated into U.S. dollars at the mean
between the buying and selling rates last quoted by any major U.S. bank at the following dates:
(i) market value of investment securities, other assets and liabilities— at the valuation date; and
(ii) purchases and sales of investment securities, income and expenses—at the date of such transactions.
The assets and liabilities that are denominated in foreign currency amounts are presented at the exchange rates and market values at the close of the period. The realized and unrealized changes in net assets arising from fluctuations in exchange rates and market prices of securities are not separately presented.
Net realized gain (loss) on foreign currency transactions represents net currency gains or losses realized as a result of differences between the amounts of securities sale proceeds or purchase cost, dividends, interest and withholding taxes as recorded on the Portfolio's books, and the U.S. dollar equivalent amount actually received or paid. Net currency gains or losses from valuing such foreign currency denominated assets and liabilities, other than investments at valuation date exchange rates, are reflected in unrealized foreign exchange gains or losses.
(I) Securities Lending. In order to realize additional income, the Portfolio may engage in securities lending, subject to the limitations set forth in the 1940 Act and relevant guidance by the staff of the Securities and Exchange Commission (“SEC”). If the Portfolio engages in securities lending, the Portfolio will lend through its custodian, JPMorgan Chase Bank, N.A., ("JPMorgan"), acting as securities lending agent on behalf of the Portfolio. Under the current arrangement, JPMorgan will manage the Portfolio's collateral in accordance with the securities lending agency agreement between the Portfolio and JPMorgan, and indemnify the Portfolio against counterparty risk. The loans will be collateralized by cash (which may be invested in a money market fund) and/or non-cash collateral (which may include U.S. Treasury securities and/or U.S. government agency securities issued or guaranteed by the United States government or its agencies or instrumentalities) at least equal at all times to the market value of the securities loaned. Non-cash collateral held at year end is segregated and cannot be transferred by the Portfolio. The Portfolio bears the risk of delay in recovery of, or loss of rights in, the securities loaned. The Portfolio may also record a realized gain or loss on securities deemed sold due to a borrower’s inability to return securities on loan. The Portfolio bears the risk of any loss on investment of cash collateral. The Portfolio will receive compensation for lending its securities in the form of fees or it will retain a portion of interest earned on the investment of any cash collateral. The Portfolio will also continue to receive interest and dividends on the securities loaned and any gain or loss in the market price of the securities loaned that may occur during the term of the loan will be for the account of the Portfolio. Income earned from securities lending activities, if any, is reflected in the Statement of Operations. Securities on loan as of December 31, 2022, are shown in the Portfolio of Investments.
| 22 | MainStay VP Wellington Small Cap Portfolio |
(J) Rights and Warrants. Rights are certificates that permit the holder to purchase a certain number of shares, or a fractional share, of a new stock from the issuer at a specific price. Warrants are instruments that entitle the holder to buy an equity security at a specific price for a specific period of time. These investments can provide a greater potential for profit or loss than an equivalent investment in the underlying security. Prices of these investments do not necessarily move in tandem with the prices of the underlying securities.
There is risk involved in the purchase of rights and warrants in that these investments are speculative investments. The Portfolio could also lose the entire value of its investment in warrants if such warrants are not exercised by the date of its expiration. The Portfolio is exposed to risk until the sale or exercise of each right or warrant is completed. Rights and Warrants as of December 31, 2022 are shown in the Portfolio of Investments.
(K) Indemnifications. Under the Fund’s organizational documents, its officers and trustees are indemnified against certain liabilities that may arise out of performance of their duties to the Fund. Additionally, in the normal course of business, the Portfolio enters into contracts with third-party service providers that contain a variety of representations and warranties and that may provide general indemnifications. The Portfolio's maximum exposure under these arrangements is unknown, as this would involve future claims that may be made against the Portfolio that have not yet occurred. The Manager believes that the risk of loss in connection with these potential indemnification obligations is remote. However, there can be no assurance that material liabilities related to such obligations will not arise in the future, which could adversely impact the Portfolio.
(L) Quantitative Disclosure of Derivative Holdings. The following tables show additional disclosures related to the Portfolio's derivative and hedging activities, including how such activities are accounted for and their effect on the Portfolio's financial positions, performance and cash flows.
The Portfolio entered into futures contracts to manage its exposure to the securities markets or to movements in interest rates and currency values.
Fair value of derivative instruments as of December 31, 2022:
| Liability Derivatives | Equity
Contracts
Risk | Total |
| Futures Contracts - Net Assets—Net unrealized depreciation on futures contracts (a) | $(78,900) | $(78,900) |
| Total Fair Value | $(78,900) | $(78,900) |
| (a) | Includes cumulative appreciation (depreciation) of futures contracts as reported in the Portfolio of Investments. Only current day’s variation margin is reported within the Statement of Assets and Liabilities. |
The effect of derivative instruments on the Statement of Operations for the year ended December 31, 2022:
| Net Realized Gain (Loss) from: | Equity
Contracts
Risk | Total |
| Futures Contracts | $(1,970,259) | $(1,970,259) |
| Total Net Realized Gain (Loss) | $(1,970,259) | $(1,970,259) |
| Net Change in Unrealized Appreciation (Depreciation) | Equity
Contracts
Risk | Total |
| Futures Contracts | $(68,431) | $(68,431) |
| Total Net Change in Unrealized Appreciation (Depreciation) | $(68,431) | $(68,431) |
| Average Notional Amount | Total |
| Futures Contracts Long | $5,172,124 |
Note 3–Fees and Related Party Transactions
(A) Manager and Subadvisor. New York Life Investments, a registered investment adviser and an indirect, wholly-owned subsidiary of New York Life, serves as the Portfolio's Manager, pursuant to an Amended and Restated Management Agreement ("Management Agreement"). The Manager provides offices, conducts clerical, recordkeeping and bookkeeping services and keeps most of the financial and accounting records required to be maintained by the Portfolio. Except for the portion of salaries and expenses that are the responsibility of the Portfolio, the Manager pays the salaries and expenses of all personnel affiliated with the Portfolio and certain operational expenses of the Portfolio. During a portion of the year ended December 31, 2022, the Portfolio reimbursed New York Life Investments in an amount equal to the portion of the compensation of the Chief Compliance Officer attributable to the Portfolio. Wellington Management Company LLP ("Wellington" or the "Subadvisor"), a registered investment adviser, serves as the Subadvisor to the Portfolio and is responsible for the day-to-day portfolio management of the Portfolio. Pursuant to the terms of a Subadvisory Agreement between New York Life Investments and Wellington, New York Life Investments pays for the services of the Subadvisor.
Pursuant to the Management Agreement, the Fund pays the Manager, on behalf of the Portfolio, a monthly fee for the services performed and the facilities furnished at an annual rate of the Portfolio's average daily net assets as follows: 0.80% up to $1 billion; 0.775% from $1 billion to $2 billion; and 0.75% in excess of $2 billion. During the year ended December 31, 2022, the effective management fee rate was 0.80% (exclusive of any applicable waivers/reimbursements).
New York Life Investments has contractually agreed to waive fees and/or reimburse expenses so that Total Annual Portfolio Operating Expenses (excluding taxes, interest, litigation, extraordinary expenses, brokerage and other transaction expenses relating to the purchase or sale of
Notes to Financial Statements (continued)
portfolio investments and acquired (underlying) portfolio/fund fees and expenses) of Initial Class shares do not exceed 0.74% of the Portfolio's average daily net assets of its average daily net assets. New York Life Investments will apply an equivalent waiver or reimbursement to Service Class shares. This agreement will remain in effect until May 1, 2023, and shall renew automatically for one-year terms unless New York Life Investments provides written notice of termination prior to the start of the next term or upon approval of the Board.
During the year ended December 31, 2022, New York Life Investments earned fees from the Portfolio in the amount of $3,468,340 and waived fees and/or reimbursed expenses in the amount of $469,574 and paid the Subadvisor fees in the amount of $1,479,507.
JPMorgan provides sub-administration and sub-accounting services to the Portfolio pursuant to an agreement with New York Life Investments. These services include calculating the daily NAVs of the Portfolio, maintaining the general ledger and sub-ledger accounts for the calculation of the Portfolio's NAVs, and assisting New York Life Investments in conducting various aspects of the Portfolio's administrative operations. For providing these services to the Portfolio, JPMorgan is compensated by New York Life Investments.
Pursuant to an agreement between the Fund and New York Life Investments, New York Life Investments is responsible for providing or procuring certain regulatory reporting services for the Portfolio. The Portfolio will reimburse New York Life Investments for the actual costs incurred by New York Life Investments in connection with providing or procuring these services for the Portfolio.
(B) Distribution and Service Fees. The Fund, on behalf of the Portfolio, has entered into a distribution agreement with NYLIFE Distributors LLC (the “Distributor”), an affiliate of New York Life Investments. The Portfolio has adopted a distribution plan (the “Plan”) in accordance with the provisions of Rule 12b-1 under the 1940 Act. Under the Plan, the Distributor has agreed to provide, through its affiliates or independent third parties, various distribution-related, shareholder and administrative support services to the Service Class shareholders. For its services, the Distributor is entitled to a combined distribution and service fee accrued daily and paid monthly at an annual rate of 0.25% of the average daily net assets attributable to the Service Class shares of the Portfolio.
Note 4-Federal Income Tax
As of December 31, 2022, the cost and unrealized appreciation (depreciation) of the Portfolio’s investment portfolio, including applicable derivative contracts and other financial instruments, as determined on a federal income tax basis, were as follows:
| | Federal Tax
Cost | Gross
Unrealized
Appreciation | Gross
Unrealized
(Depreciation) | Net
Unrealized
Appreciation/
(Depreciation) |
| Investments in Securities | $452,876,688 | $23,280,986 | $(71,513,365) | $(48,232,379) |
As of December 31, 2022, the components of accumulated gain (loss) on a tax basis were as follows:
Ordinary
Income | Accumulated
Capital
and Other
Gain (Loss) | Other
Temporary
Differences | Unrealized
Appreciation
(Depreciation) | Total
Accumulated
Gain (Loss) |
| $2,542,653 | $(45,284,168) | $177,700 | $(48,232,378) | $(90,796,193) |
The difference between book-basis and tax-basis unrealized appreciation (depreciation) is primarily due to wash sale adjustments, Passive Foreign Investment Company adjustments and mark to market of futures contracts. The other temporary differences are primarily due to deferred dividends from real estate investment trusts ("REITs").
As of December 31, 2022, for federal income tax purposes, capital loss carryforwards of $45,284,168, as shown in the table below, were available to the extent provided by the regulations to offset future realized gains of the Portfolio. Accordingly, no capital gains distributions are expected to be paid to shareholders until net gains have been realized in excess of such amounts.
Capital Loss
Available Through | Short-Term
Capital Loss
Amounts (000’s) | Long-Term
Capital Loss
Amounts (000’s) |
| Unlimited | $33,618 | $11,666 |
During the years ended December 31, 2022 and December 31, 2021, the tax character of distributions paid as reflected in the Statements of Changes in Net Assets was as follows:
| | 2022 | 2021 |
| Distributions paid from: | | |
| Ordinary Income | $ 88,089,468 | $1,368,116 |
| Long-Term Capital Gains | 27,789,689 | — |
| Total | $115,879,157 | $1,368,116 |
Note 5–Custodian
JPMorgan is the custodian of cash and securities held by the Portfolio. Custodial fees are charged to the Portfolio based on the Portfolio's net assets and/or the market value of securities held by the Portfolio and the number of certain transactions incurred by the Portfolio.
| 24 | MainStay VP Wellington Small Cap Portfolio |
Note 6–Line of Credit
The Portfolio and certain other funds managed by New York Life Investments maintain a line of credit with a syndicate of banks in order to secure a source of funds for temporary purposes to meet unanticipated or excessive redemption requests.
Effective July 26, 2022, under the credit agreement (the “Credit Agreement”), the aggregate commitment amount is $600,000,000 with an additional uncommitted amount of $100,000,000. The commitment fee is an annual rate of 0.15% of the average commitment amount payable quarterly, regardless of usage, to JPMorgan, who serves as the agent to the syndicate. The commitment fee is allocated among the Portfolio and certain other funds managed by New York Life Investments based upon their respective net assets and other factors. Interest on any revolving credit loan is charged based upon the Federal Funds Rate, Daily Simple Secured Overnight Financing Rate ("SOFR") + 0.10%, or the Overnight Bank Funding Rate, whichever is higher. The Credit Agreement expires on July 25, 2023, although the Portfolio, certain other funds managed by New York Life Investments and the syndicate of banks may renew the Credit Agreement for an additional year on the same or different terms or enter into a credit agreement with a different syndicate of banks. Prior to July 26, 2022, the aggregate commitment amount and the commitment fee were the same as those under the current Credit Agreement. During the year ended December 31, 2022, there were no borrowings made or outstanding with respect to the Portfolio under the Credit Agreement.
Note 7–Interfund Lending Program
Pursuant to an exemptive order issued by the SEC, the Portfolio, along with certain other funds managed by New York Life Investments, may participate in an interfund lending program. The interfund lending program provides an alternative credit facility that permits the Portfolio and certain other funds managed by New York Life Investments to lend or borrow money for temporary purposes directly to or from one another, subject to the conditions of the exemptive order. During the year ended December 31, 2022, there were no interfund loans made or outstanding with respect to the Portfolio.
Note 8–Purchases and Sales of Securities (in 000’s)
During the year ended December 31, 2022, purchases and sales of securities, other than short-term securities, were $302,530 and $309,284, respectively.
The Portfolio may purchase securities from or sell securities to other portfolios managed by the Subadvisor. These interportfolio transactions are primarily used for cash management purposes and are made
pursuant to Rule 17a-7 under the 1940 Act. The Rule 17a-7 transactions during the year ended December 31, 2022, were as follows:
Purchases
(000's) | Sales
(000's) | Realized
Gain / (Loss)
(000's) |
| $52 | $1,635 | $(237) |
Note 9–Capital Share Transactions
Transactions in capital shares for the years ended December 31, 2022 and December 31, 2021, were as follows:
| Initial Class | Shares | Amount |
| Year ended December 31, 2022: | | |
| Shares sold | 2,446,048 | $ 27,488,637 |
| Shares issued to shareholders in reinvestment of distributions | 6,649,151 | 49,470,351 |
| Shares redeemed | (1,607,897) | (17,992,442) |
| Net increase (decrease) | 7,487,302 | $ 58,966,546 |
| Year ended December 31, 2021: | | |
| Shares sold | 1,441,213 | $ 19,527,641 |
| Shares issued to shareholders in reinvestment of distributions | 57,939 | 775,143 |
| Shares redeemed | (3,382,279) | (45,833,212) |
| Net increase (decrease) | (1,883,127) | $(25,530,428) |
| |
| Service Class | Shares | Amount |
| Year ended December 31, 2022: | | |
| Shares sold | 1,368,591 | $ 15,273,858 |
| Shares issued to shareholders in reinvestment of distributions | 9,034,597 | 66,408,806 |
| Shares redeemed | (3,804,605) | (39,796,571) |
| Net increase (decrease) | 6,598,583 | $ 41,886,093 |
| Year ended December 31, 2021: | | |
| Shares sold | 2,018,860 | $ 26,753,446 |
| Shares issued to shareholders in reinvestment of distributions | 44,736 | 592,973 |
| Shares redeemed | (5,387,047) | (71,459,596) |
| Net increase (decrease) | (3,323,451) | $(44,113,177) |
Note 10–Other Matters
As of the date of this report, interest rates in the United States and many parts of the world, including certain European countries, are ascending from historically low levels. Thus, the Portfolio currently faces a heightened level of risk associated with rising interest rates. This could be driven by a variety of factors, including but not limited to central bank monetary policies, changing inflation or real growth rates, general economic conditions, increasing bond issuances or reduced market demand for low yielding investments.
An outbreak of COVID-19, first detected in December 2019, has developed into a global pandemic and has resulted in travel restrictions, closure of international borders, certain businesses and securities
Notes to Financial Statements (continued)
markets, restrictions on securities trading activities, prolonged quarantines, supply chain disruptions, and lower consumer demand, as well as general concern and uncertainty. In 2022, many countries lifted some or all restrictions related to COVID-19. However, the continued impact of COVID-19 and related variants is uncertain and could further adversely affect the global economy, national economies, individual issuers and capital markets in unforeseeable ways and result in a substantial and extended economic downturn. Developments that disrupt global economies and financial markets, such as COVID-19, may magnify factors that affect the Portfolio's performance.
Note 11–Subsequent Events
In connection with the preparation of the financial statements of the Portfolio as of and for the year ended December 31, 2022, events and transactions subsequent to December 31, 2022, through the date the financial statements were issued have been evaluated by the Manager for possible adjustment and/or disclosure. No subsequent events requiring financial statement adjustment or disclosure have been identified.
| 26 | MainStay VP Wellington Small Cap Portfolio |
Report of Independent Registered Public Accounting Firm
To the Board of Trustees of MainStay VP Funds Trust and Shareholders of
MainStay VP Wellington Small Cap Portfolio
Opinion on the Financial Statements
We have audited the accompanying statement of assets and liabilities, including the portfolio of investments, of MainStay VP Wellington Small Cap Portfolio (one of the portfolios constituting MainStay VP Funds Trust, referred to hereafter as the “Portfolio”) as of December 31, 2022, the related statement of operations for the year ended December 31, 2022, the statements of changes in net assets for each of the two years in the period ended December 31, 2022, including the related notes, and the financial highlights for each of the five years in the period ended December 31, 2022 (collectively referred to as the “financial statements”). In our opinion, the financial statements present fairly, in all material respects, the financial position of the Portfolio as of December 31, 2022, the results of its operations for the year then ended, the changes in its net assets for each of the two years in the period ended December 31, 2022 and the financial highlights for each of the five years in the period ended December 31, 2022 in conformity with accounting principles generally accepted in the United States of America.
Basis for Opinion
These financial statements are the responsibility of the Portfolio’s management. Our responsibility is to express an opinion on the Portfolio’s financial statements based on our audits. We are a public accounting firm registered with the Public Company Accounting Oversight Board (United States) (PCAOB) and are required to be independent with respect to the Portfolio in accordance with the U.S. federal securities laws and the applicable rules and regulations of the Securities and Exchange Commission and the PCAOB.
We conducted our audits of these financial statements in accordance with the standards of the PCAOB. Those standards require that we plan and perform the audit to obtain reasonable assurance about whether the financial statements are free of material misstatement, whether due to error or fraud.
Our audits included performing procedures to assess the risks of material misstatement of the financial statements, whether due to error or fraud, and performing procedures that respond to those risks. Such procedures included examining, on a test basis, evidence regarding the amounts and disclosures in the financial statements. Our audits also included evaluating the accounting principles used and significant estimates made by management, as well as evaluating the overall presentation of the financial statements. Our procedures included confirmation of securities owned as of December 31, 2022 by correspondence with the custodian, transfer agents and brokers; when replies were not received from brokers, we performed other auditing procedures. We believe that our audits provide a reasonable basis for our opinion.
/s/PricewaterhouseCoopers LLP
New York, New York
February 24, 2023
We have served as the auditor of one or more investment companies in the MainStay group of funds since 1984.
Board Consideration and Approval of Management Agreement and Subadvisory Agreement (Unaudited)
The continuation of the Management Agreement with respect to the MainStay VP Wellington Small Cap Portfolio (“Portfolio”) and New York Life Investment Management LLC (“New York Life Investments”) and the Subadvisory Agreement between New York Life Investments and Wellington Management Company LLP (“WMC”) with respect to the Portfolio (together, “Advisory Agreements”) is subject to annual review and approval by the Board of Trustees of MainStay VP Funds Trust (“Board” of the “Trust”) in accordance with Section 15 of the Investment Company Act of 1940, as amended (“1940 Act”). At its December 6–7, 2022 meeting, the Board, which is comprised solely of Trustees who are not an “interested person” (as such term is defined in the 1940 Act) of the Trust (“Independent Trustees”), unanimously approved the continuation of each of the Advisory Agreements for a one-year period.
In reaching the decision to approve the continuation of each of the Advisory Agreements, the Board considered information and materials furnished by New York Life Investments and WMC in connection with an annual contract review process undertaken by the Board that took place at meetings of the Board and its Contracts Committee during October 2022 through December 2022, including information and materials furnished by New York Life Investments and WMC in response to requests prepared on behalf of the Board, and in consultation with the Board, by independent legal counsel to the Independent Trustees, which encompassed a variety of topics, including those summarized below. Information and materials requested by and furnished to the Board for consideration in connection with the contract review process included, among other items, reports on the Portfolio and “peer funds” prepared by Institutional Shareholder Services Inc. (“ISS”), an independent third-party service provider engaged by the Board to report objectively on the Portfolio’s investment performance, management fee and total expenses. The Board also considered information on the fees charged to other investment advisory clients of New York Life Investments and/or WMC that follow investment strategies similar to those of the Portfolio, if any, and, when applicable, the rationale for any differences in the Portfolio’s management and subadvisory fees and the fees charged to those other investment advisory clients. In addition, the Board considered information regarding the legal standards and fiduciary obligations applicable to its consideration of the continuation of each of the Advisory Agreements. The contract review process, including the structure and format for information and materials provided to the Board, has been developed in consultation with the Board. The Independent Trustees also met in executive sessions with their independent legal counsel and, for portions thereof, with senior management of New York Life Investments.
The Board’s deliberations with respect to the continuation of each of the Advisory Agreements reflect a year-long process, and the Board also took into account information furnished to the Board and its Committees throughout the year, as deemed relevant and appropriate by the Trustees, including, among other items, reports on investment performance of the Portfolio and investment-related matters for the Portfolio as well as presentations from New York Life Investments and, generally annually, WMC personnel. In addition, the Board took into account other information received from New York Life Investments throughout the year,
including, among other items, periodic reports on legal and compliance matters, risk management, portfolio turnover, brokerage commissions and non-advisory services provided to the Portfolio by New York Life Investments, as deemed relevant and appropriate by the Trustees.
In addition to information provided to the Board throughout the year, the Board received information in connection with its June 2022 meeting provided specifically in response to requests prepared on behalf of the Board, and in consultation with the Board, by independent legal counsel to the Independent Trustees regarding the Portfolio’s distribution arrangements. In addition, the Board received information regarding the Portfolio’s asset levels, share purchase and redemption activity and the payment of Rule 12b-1 and/or other fees by the applicable share classes of the Portfolio, among other information.
In considering the continuation of each of the Advisory Agreements, the Trustees reviewed and evaluated the information and factors they believed to reasonably be necessary and appropriate in light of legal advice furnished to them by independent legal counsel to the Independent Trustees and through the exercise of their own business judgment. Although individual Trustees may have weighed certain factors or information differently and the Board did not consider any single factor or information controlling in reaching its decision, the factors considered by the Board are summarized in more detail below and include, among other factors: (i) the nature, extent and quality of the services provided to the Portfolio by New York Life Investments and WMC; (ii) the qualifications of the portfolio managers of the Portfolio and the historical investment performance of the Portfolio, New York Life Investments and WMC; (iii) the costs of the services provided, and profits realized, by New York Life Investments and WMC with respect to their relationships with the Portfolio; (iv) the extent to which economies of scale have been realized or may be realized if the Portfolio grows and the extent to which any economies of scale have been shared, have benefited or may benefit the Portfolio’s shareholders; and (v) the reasonableness of the Portfolio’s management and subadvisory fees and total ordinary operating expenses. Although the Board recognized that comparisons between the Portfolio’s fees and expenses and those of other funds are imprecise given different terms of agreements, variations in fund strategies and other factors, the Board considered the reasonableness of the Portfolio’s management fee and total ordinary operating expenses as compared to the peer funds identified by ISS. Throughout their considerations, the Trustees acknowledged the commitment of New York Life Investments and its affiliates to serve the MainStay Group of Funds, as well as their capacity, experience, resources, financial stability and reputations. The Trustees also acknowledged the entrepreneurial and other risks assumed by New York Life Investments in sponsoring and managing the Portfolio. With respect to the Subadvisory Agreement, the Board took into account New York Life Investments’ recommendation to approve the continuation of the Subadvisory Agreement.
The Trustees noted that, throughout the year, the Trustees are afforded an opportunity to ask questions of, and request additional information or materials from, New York Life Investments and WMC. The Board’s decision with respect to each of the Advisory Agreements may have also
| 28 | MainStay VP Wellington Small Cap Portfolio |
been based, in part, on the Board’s knowledge of New York Life Investments and WMC resulting from, among other things, the Board’s consideration of each of the Advisory Agreements in prior years, the advisory agreements for other funds in the MainStay Group of Funds, the Board’s review throughout the year of the performance and operations of other funds in the MainStay Group of Funds and each Trustee’s business judgment and industry experience. In addition to considering the above-referenced factors, the Board observed that in the marketplace, notably under variable life insurance policies and variable annuity contracts for which the Portfolio serves as an investment option, there are a range of investment options available to investors and that the Portfolio’s shareholders, having had the opportunity to consider other investment options, have chosen to invest in the Portfolio.
The factors that figured prominently in the Board’s decision to approve the continuation of each of the Advisory Agreements during its December 6–7, 2022 meeting are summarized in more detail below.
Nature, Extent and Quality of Services Provided by New York Life Investments and WMC
The Board examined the nature, extent and quality of the services that New York Life Investments provides to the Portfolio. The Board evaluated New York Life Investments’ experience and capabilities in serving as manager of the Portfolio and considered that the Portfolio operates in a “manager-of-managers” structure. The Board also considered New York Life Investments’ responsibilities and services provided pursuant to this structure, including overseeing the services provided by WMC, evaluating the performance of WMC, making recommendations to the Board as to whether the Subadvisory Agreement should be renewed, modified or terminated and periodically reporting to the Board regarding the results of New York Life Investments’ evaluation and monitoring functions. The Board noted that New York Life Investments manages other mutual funds, serves a variety of other investment advisory clients, including other pooled investment vehicles, and has experience overseeing mutual fund service providers, including subadvisors. The Board considered the experience of senior personnel at New York Life Investments providing management and administrative and other non-advisory services to the Portfolio. The Board observed that New York Life Investments devotes significant resources and time to providing management and administrative and other non-advisory services to the Portfolio, including New York Life Investments’ oversight and due diligence reviews of WMC and ongoing analysis of, and interactions with, WMC with respect to, among other things, the Portfolio’s investment performance and risks as well as WMC’s investment capabilities and subadvisory services with respect to the Portfolio.
The Board also considered the range of services that New York Life Investments provides to the Portfolio under the terms of the Management Agreement, including: (i) fund accounting and ongoing supervisory services provided by New York Life Investments’ Fund Administration and Accounting Group; (ii) investment supervisory and analytical services provided by New York Life Investments’ Investment Consulting Group; (iii) compliance services provided by the Trust’s Chief Compliance Officer as
well as New York Life Investments’ compliance department, including supervision and implementation of the Portfolio’s compliance program; (iv) legal services provided by New York Life Investments’ Office of the General Counsel; and (v) risk management monitoring and analysis by compliance and investment personnel. In addition, the Board considered New York Life Investments’ willingness to invest in personnel and other resources, such as cyber security, information security and business continuity planning, designed to benefit the Portfolio and noted that New York Life Investments is responsible for compensating the Trust’s officers, except for a portion of the salary of the Trust’s Chief Compliance Officer. The Board recognized that New York Life Investments provides certain other non-advisory services to the Portfolio and has provided an increasingly broad array of non-advisory services to the MainStay Group of Funds as a result of regulatory and other developments, including in connection with the implementation of the MainStay Group of Funds’ derivatives risk management program and policies and procedures adopted pursuant to Rule 18f-4 under the 1940 Act.
The Board also examined the range, and the nature, extent and quality, of the investment advisory services that WMC provides to the Portfolio and considered the terms of each of the Advisory Agreements. The Board evaluated WMC’s experience and performance in serving as subadvisor to the Portfolio and advising other portfolios and WMC’s track record and experience in providing investment advisory services, the experience of investment advisory, senior management and administrative personnel at WMC. The Board considered New York Life Investments’ and WMC’s overall resources, legal and compliance environment, capabilities, reputation, financial condition and history. In addition to information provided in connection with quarterly meetings with the Trust’s Chief Compliance Officer, the Board considered information regarding the compliance policies and procedures of New York Life Investments and WMC and acknowledged their commitment to further developing and strengthening compliance programs relating to the Portfolio. The Board also considered WMC’s ability to recruit and retain qualified investment professionals and willingness to invest in personnel and other resources to service and support the Portfolio. In this regard, the Board considered the qualifications and experience of the Portfolio’s portfolio managers, the number of accounts managed by the portfolio managers and the method for compensating the portfolio managers.
In addition, the Board considered information provided by New York Life Investments and WMC regarding the operations of their respective business continuity plans in response to the COVID-19 pandemic and the continued remote work environment.
Based on these considerations, among others, the Board concluded that the Portfolio would likely continue to benefit from the nature, extent and quality of these services.
Investment Performance
In evaluating the Portfolio’s investment performance, the Board considered investment performance results over various periods in light of the Portfolio’s investment objective, strategies and risks. The Board
Board Consideration and Approval of Management Agreement and Subadvisory Agreement (Unaudited) (continued)
considered investment reports on, and analysis of, the Portfolio’s performance provided to the Board throughout the year. These reports include, among other items, information on the Portfolio’s gross and net returns, the Portfolio’s investment performance compared to a relevant investment category and the Portfolio’s benchmark, the Portfolio’s risk-adjusted investment performance and the Portfolio’s investment performance as compared to peer funds, as appropriate, as well as portfolio attribution information and commentary on the effect of market conditions. The Board also considered information provided by ISS showing the investment performance of the Portfolio as compared to peer funds. In addition, the Board reviewed the methodology used by ISS to construct the group of peer funds for comparative purposes.
The Board also took into account its discussions with senior management at New York Life Investments concerning the Portfolio’s investment performance over various periods as well as discussions between the Portfolio’s portfolio management team and the members of the Board’s Investment Committee, which generally occur on an annual basis. In addition, the Board considered any specific actions that New York Life Investments or WMC had taken, or had agreed to take, to seek to enhance Portfolio investment performance and the results of those actions. In considering the investment performance of the Portfolio, the Board noted that the Portfolio underperformed its peer funds for the one-, three- and five-year periods ended July 31, 2022. The Board considered its discussions with representatives from New York Life Investments and WMC regarding the Portfolio’s investment performance.
Based on these considerations, among others, the Board concluded that its review of the Portfolio’s investment performance and related information supported a determination to approve the continuation of each of the Advisory Agreements.
Costs of the Services Provided, and Profits and Other Benefits Realized, by New York Life Investments and WMC
The Board considered the costs of the services provided under each of the Advisory Agreements. The Board also considered the profits realized by New York Life Investments and its affiliates and WMC due to their relationships with the Portfolio as well as by New York Life Investments and its affiliates due to their relationships with the MainStay Group of Funds. The Board considered information from New York Life Investments that WMC’s subadvisory fee reflected an arm’s-length negotiation and that this fee is paid by New York Life Investments, not the Portfolio, and the relevance of WMC’s profitability was considered by the Trustees in that context. On this basis, the Board primarily considered the costs and profitability for New York Life Investments and its affiliates with respect to the Portfolio.
In addition, the Board acknowledged the difficulty in obtaining reliable comparative data about mutual fund managers’ profitability because such information generally is not publicly available and may be impacted by numerous factors, including the structure of a fund manager’s
organization, the types of funds it manages, the methodology used to allocate certain fixed costs to specific funds and the manager’s capital structure and costs of capital.
In evaluating the costs of the services provided by New York Life Investments and WMC and profits realized by New York Life Investments and its affiliates and WMC, the Board considered, among other factors, New York Life Investments’ and its affiliates’ and WMC’s continuing investments in, or willingness to invest in, personnel and other resources to support and further enhance the management of the Portfolio, and that New York Life Investments is responsible for paying the subadvisory fee for the Portfolio. The Board also considered the financial resources of New York Life Investments and WMC and acknowledged that New York Life Investments and WMC must be in a position to recruit and retain experienced professional personnel and to maintain a strong financial position for New York Life Investments and WMC to continue to provide high-quality services to the Portfolio. The Board recognized that the Portfolio benefits from the allocation of certain fixed costs among the funds in the MainStay Group of Funds, among other expected benefits resulting from its relationship with New York Life Investments.
The Board considered information regarding New York Life Investments’ methodology for calculating profitability and allocating costs provided by New York Life Investments in connection with the fund profitability analysis presented to the Board. The Board noted it had previously engaged an independent consultant to review the methods used to allocate costs among the funds in the MainStay Group of Funds. The Board also noted that the independent consultant had concluded that New York Life Investments’ methods for allocating costs and procedures for estimating overall profitability of the relationship with the funds in the MainStay Group of Funds are reasonable and that New York Life Investments continued to use the same method of calculating profit and allocating costs since the independent consultant’s review. The Board recognized the difficulty in calculating and evaluating a manager’s profitability with respect to the Portfolio and considered that other profitability methodologies may also be reasonable.
The Board also considered certain fall-out benefits that may be realized by New York Life Investments and its affiliates due to their relationships with the Portfolio, including reputational and other indirect benefits. The Board recognized, for example, the benefits to WMC from legally permitted “soft-dollar” arrangements by which brokers provide research and other services to WMC in exchange for commissions paid by the Portfolio with respect to trades in the Portfolio’s portfolio securities. In this regard, the Board also requested and considered information from New York Life Investments concerning other material business relationships between WMC and its affiliates and New York Life Investments and its affiliates and considered the existence of a strategic partnership between New York Life Investments and WMC that relates to certain current and future products and represents a potential conflict of interest associated with New York Life Investments’ recommendation to approve the Subadvisory Agreement. In addition, the Board considered its review of the management agreement for a money market fund advised by New York Life Investments and an affiliated subadvisor that serves as an
| 30 | MainStay VP Wellington Small Cap Portfolio |
investment option for the Portfolio, including the potential rationale for and costs associated with investments in this money market fund by the Portfolio, if any, and considered information from New York Life Investments that the nature and type of specific investment advisory services provided to this money market fund are distinct from, or in addition to, the investment advisory services provided to the Portfolio. In addition, the Board considered the potential dividend received tax deduction for insurance company affiliates of New York Life Investments from the Portfolio’s securities lending activity.
The Board noted that the Portfolio serves as an investment option primarily under variable contracts issued by affiliates of New York Life Investments that would receive fees under those contracts. The Board observed that, in addition to fees earned by New York Life Investments under the Management Agreement for managing the Portfolio, New York Life Investments’ affiliates also earn revenues from serving the Portfolio in various other capacities, including as the Portfolio’s distributor. The Board considered information about these other revenues and their impact on the profitability of the relationship with the Portfolio to New York Life Investments and its affiliates. The Board noted that, although it assessed the overall profitability of the relationship with the Portfolio to New York Life Investments and its affiliates as part of the contract review process, when considering the reasonableness of the fee paid to New York Life Investments under the Management Agreement, the Board considered the profitability of New York Life Investments’ relationship with the Portfolio on a pre-tax basis and without regard to distribution expenses incurred by New York Life Investments from its own resources.
After evaluating the information deemed relevant by the Trustees, the Board concluded that any profits realized by New York Life Investments and its affiliates due to their relationships with the Portfolio were not excessive, other benefits that may accrue to New York Life Investments and its affiliates are reasonable and benefits that may accrue to WMC and its affiliates are consistent with those expected for a subadvisor to a mutual fund. With respect to WMC, the Board considered that any profits realized by WMC due to its relationship with the Portfolio are the result of arm’s-length negotiations between New York Life Investments and WMC, acknowledging that any such profits are based on the subadvisory fee paid to WMC by New York Life Investments, not the Portfolio.
Management and Subadvisory Fees and Total Ordinary Operating Expenses
The Board evaluated the reasonableness of the fee paid under each of the Advisory Agreements and the Portfolio’s total ordinary operating expenses. The Board primarily considered the reasonableness of the management fee paid by the Portfolio to New York Life Investments because the subadvisory fee paid to WMC is paid by New York Life Investments, not the Portfolio. The Board also considered the reasonableness of the subadvisory fee paid by New York Life Investments and the amount of the management fee retained by New York Life Investments.
In assessing the reasonableness of the Portfolio’s fees and expenses, the Board primarily considered comparative data provided by ISS on the fees and expenses charged by similar mutual funds managed by other investment advisers. The Board reviewed the methodology used by ISS to construct the group of peer funds for comparative purposes. In addition, the Board considered information provided by New York Life Investments and WMC on fees charged to other investment advisory clients, including institutional separate accounts and/or other funds that follow investment strategies similar to those of the Portfolio, if any. The Board considered the contractual management fee schedules of the Portfolio as compared to those of such other investment advisory clients, taking into account the rationale for any differences in fee schedules. The Board also took into account information provided by New York Life Investments about the more extensive scope of services provided to registered investment companies, such as the Portfolio, as compared with other investment advisory clients. Additionally, the Board considered the impact of contractual breakpoints and expense limitation arrangements on the Portfolio’s net management fee and expenses. The Board also considered that in proposing fees for the Portfolio, New York Life Investments considers the competitive marketplace for mutual funds.
Based on the factors outlined above, among other considerations, the Board concluded that the Portfolio’s management fee and total ordinary operating expenses are within a range that is competitive and support a conclusion that these fees and expenses are reasonable.
Economies of Scale
The Board considered information regarding economies of scale, including whether economies of scale may exist for the Portfolio and whether the Portfolio’s expense structure permits any economies of scale to be appropriately shared with the Portfolio’s beneficial shareholders. The Board also considered a report from New York Life Investments, previously prepared at the request of the Board, that addressed economies of scale, including with respect to the mutual fund business generally, and the various ways in which the benefits of economies of scale may be shared with the funds in the MainStay Group of Funds. Although the Board recognized the difficulty of determining economies of scale with precision, the Board acknowledged that economies of scale may be shared with the Portfolio in a number of ways, including, for example, through the imposition of fee breakpoints, initially setting management fee rates at scale or making additional investments to enhance the services provided to the Portfolio. The Board reviewed information from New York Life Investments showing how the Portfolio’s management fee schedule compared to fee schedules of other funds and accounts managed by New York Life Investments. The Board also reviewed information from ISS showing how the Portfolio’s management fee schedule compared with fees paid for similar services by peer funds at varying asset levels.
Based on this information, the Board concluded that economies of scale are appropriately reflected for the benefit of the Portfolio’s beneficial shareholders through the Portfolio’s expense structure and other methods to share benefits from economies of scale.
Board Consideration and Approval of Management Agreement and Subadvisory Agreement (Unaudited) (continued)
Conclusion
On the basis of the information and factors summarized above, among other information and factors deemed relevant by the Trustees, and the evaluation thereof, the Board unanimously voted to approve the continuation of each of the Advisory Agreements.
| 32 | MainStay VP Wellington Small Cap Portfolio |
Proxy Voting Policies and Procedures and Proxy Voting Record
The Portfolio is required to file with the SEC its proxy voting record for the 12-month period ending June 30 on Form N-PX. A description of the policies and procedures that are used to vote proxies relating to portfolio securities of the Portfolio is available free of charge upon request by calling 800-598-2019 or visiting the SEC's website at www.sec.gov. The most recent Form N-PX or proxy voting record is available free of charge upon request by calling 800-598-2019; visiting https://www.newyorklifeinvestments.com/investment-products/vp; or visiting the SEC’s website at www.sec.gov.
Shareholder Reports and Quarterly Portfolio Disclosure
The Portfolio is required to file its complete schedule of portfolio holdings with the SEC 60 days after its first and third fiscal quarter on Form N-PORT. The Portfolio's holdings report is available free of charge upon request by calling 800-598-2019 or by visiting the SEC’s website at www.sec.gov.
Board of Trustees and Officers (Unaudited)
The Trustees and officers of the Portfolio are listed below. The Board oversees the MainStay Group of Funds (which consists of MainStay Funds and MainStay Funds Trust), MainStay VP Funds Trust, MainStay MacKay DefinedTerm Municipal Opportunities Fund, MainStay CBRE Global Infrastructure Megatrends Fund, the Manager and the Subadvisors, and elects the officers of the Portfolios who are responsible for the day-to-day operations of the Portfolio. Information pertaining to the Trustees and officers is set forth below. Each Trustee serves until his or her successor
is elected and qualified or until his or her resignation, death or removal. Under the Board’s retirement policy, unless an exception is made, a Trustee must tender his or her resignation by the end of the calendar year during which he or she reaches the age of 75. The business address of each Trustee and officer listed below is 51 Madison Avenue, New York, New York 10010. None of the Trustees are “interested persons” (as defined by the 1940 Act and rules adopted by the SEC thereunder) of the Portfolio (“Independent Trustees”).
| | Name and
Year of Birth | Term of Office,
Position(s) Held and
Length of Service | Principal Occupation(s)
During Past Five Years | Number of
Portfolios in
Fund Complex
Overseen by
Trustee | Other Directorships
Held by Trustee |
| | | | | | |
| | David H. Chow
1957 | MainStay VP Funds Trust: Trustee since January 2016, Advisory Board Member (June 2015 to December 2015) | Founder and CEO, DanCourt Management, LLC since 1999 | 78 | MainStay Funds: Trustee since January 2016, Advisory Board Member (June 2015 to December 2015) (12 Funds);
MainStay Funds Trust: Trustee since January 2016, Advisory Board Member (June 2015 to December 2015) (33 Funds);
MainStay MacKay DefinedTerm Municipal Opportunities Fund: Trustee since January 2016, Advisory Board Member (June 2015 to December 2015);
MainStay CBRE Global Infrastructure Megatrends Fund: Trustee since June 2021;VanEck Vectors Group of Exchange-Traded Funds: Independent Chairman of the Board of Trustees since 2008 and Trustee since 2006 (57 portfolios); and Berea College of Kentucky: Trustee since 2009, Chair of the Committee since 2018 |
| | Susan B. Kerley
1951 | MainStay VP Funds Trust: Chairman since 2017 and Trustee since 2007* | President, Strategic Management Advisors LLC since 1990 | 78 | MainStay Funds: Chairman since 2017 and Trustee since 2007 (12 Funds); MainStay Funds Trust: Chairman since 2017 and Trustee since 1990 (33 Funds)**;
MainStay MacKay DefinedTerm Municipal Opportunities Fund: Chairman since 2017 and Trustee since 2011; MainStay CBRE Global Infrastructure Megatrends Fund: Trustee since June 2021; and Legg Mason Partners Funds: Trustee since 1991 (45 portfolios) |
| | Alan R. Latshaw
1951 | MainStay VP Funds Trust: Trustee since 2007* | Retired; Partner, Ernst & Young LLP (2002 to 2003); Partner, Arthur Andersen LLP (1989 to 2002); Consultant to the MainStay Funds Audit and Compliance Committee (2004 to 2006) | 78 | MainStay Funds: Trustee since 2006 (12 Funds);
MainStay Funds Trust: Trustee since 2007 (33 Funds)**;
MainStay MacKay DefinedTerm Municipal Opportunities Fund: Trustee since 2011; and
MainStay CBRE Global Infrastructure Megatrends Fund: Trustee since June 2021 |
| 34 | MainStay VP Wellington Small Cap Portfolio |
| | Name and
Year of Birth | Term of Office,
Position(s) Held and
Length of Service | Principal Occupation(s)
During Past Five Years | Number of
Portfolios in
Fund Complex
Overseen by
Trustee | Other Directorships
Held by Trustee |
| | | | | | |
| | Karen Hammond
1956 | MainStay VP Funds Trust: Trustee since December 2021, Advisory Board Member (June 2021 to December 2021)
| Retired, Managing Director, Devonshire Investors (2007 to 2013); Senior Vice President, Fidelity Management & Research Co. (2005 to 2007); Senior Vice President and Corporate Treasurer, FMR Corp. (2003 to 2005); Chief Operating Officer, Fidelity Investments Japan (2001 to 2003) | 78 | MainStay Funds: Trustee since December 2021, Advisory Board Member (June 2021 to December 2021) (12 Funds);
MainStay Funds Trust: Trustee since December 2021, Advisory Board Member (June 2021 to December 2021) (33 Funds);
MainStay MacKay DefinedTerm Municipal Opportunities Fund: Trustee since December 2021, Advisory Board Member (June 2021 to December 2021);
MainStay CBRE Global Infrastructure Megatrends Fund: Trustee since December 2021, Advisory Board Member (June 2021 to December 2021);
Two Harbors Investment Corp.: Director since 2018; Rhode Island State Investment Commission: Member since 2017; and Blue Cross Blue Shield of Rhode Island: Director since 2019
|
| | Jacques P. Perold
1958 | MainStay VP Funds Trust: Trustee since January 2016, Advisory Board Member (June 2015 to December 2015) | Founder and Chief Executive Officer, CapShift Advisors LLC (since 2018); President, Fidelity Management & Research Company (2009 to 2014); President and Chief Investment Officer, Geode Capital Management, LLC (2001 to 2009) | 78 | MainStay Funds: Trustee since January 2016, Advisory Board Member (June 2015 to December 2015) (12 Funds);
MainStay Funds Trust: Trustee since January 2016, Advisory Board Member (June 2015 to December 2015) (33 Funds); MainStay MacKay DefinedTerm Municipal Opportunities Fund: Trustee since January 2016, Advisory Board Member (June 2015 to December 2015);
MainStay CBRE Global Infrastructure Megatrends Fund: Trustee since June 2021; Allstate Corporation: Director since 2015;
Partners in Health: Trustee since 2019; and
MSCI Inc.: Director since 2017 |
| | Richard S. Trutanic
1952 | MainStay VP Funds Trust: Trustee since 2007* | Chairman and Chief Executive Officer, Somerset & Company (financial advisory firm) since 2004; Managing Director, The Carlyle Group (private investment firm) (2002 to 2004); Senior Managing Director, Partner and Board Member, Groupe Arnault S.A. (private investment firm) (1999 to 2002)
| 78 | MainStay Funds: Trustee since 1994 (12 Funds);
MainStay Funds Trust: Trustee since 2007 (33 Funds)**;
MainStay MacKay DefinedTerm Municipal Opportunities Fund: Trustee since 2011; and
MainStay CBRE Global Infrastructure Megatrends Fund: Trustee since June 2021 |
| * | Includes prior service as a Director of MainStay VP Series Fund, Inc., the predecessor to MainStay VP Funds Trust. |
| ** | Includes prior service as a Director/Trustee of certain predecessor entities to MainStay Funds Trust. |
Board of Trustees and Officers (Unaudited) (continued)
| | Name and
Year of Birth | Position(s) Held and
Length of Service | Principal Occupation(s)
During Past Five Years | |
| | | | | |
| | Kirk C. Lehneis
1974 | President, MainStay VP Funds Trust (since 2017) | Chief Operating Officer and Senior Managing Director (since 2016), New York Life Investment Management LLC and New York Life Investment Management Holdings LLC; Member of the Board of Managers (since 2017) and Senior Managing Director (since 2018), NYLIFE Distributors LLC; Chairman of the Board and Senior Managing Director, NYLIM Service Company LLC (since 2017); Trustee, President and Principal Executive Officer of IndexIQ Trust, IndexIQ ETF Trust and IndexIQ Active ETF Trust (since January 2018); President, MainStay CBRE Global Infrastructure Megatrends Fund (since 2021), MainStay MacKay DefinedTerm Municipal Opportunities Fund, MainStay Funds and MainStay Funds Trust (since 2017); Senior Managing Director, Global Product Development (from 2015-2016); Managing Director, Product Development (from 2010-2015), New York Life Investment Management LLC | |
| | Jack R. Benintende
1964 | Treasurer and Principal Financial and Accounting Officer, MainStay VP Funds Trust (since 2007)** | Managing Director, New York Life Investment Management LLC (since 2007); Treasurer and Principal Financial and Accounting Officer, MainStay CBRE Global Infrastructure Megatrends Fund (since 2021), MainStay MacKay DefinedTerm Municipal Opportunities Fund (since 2011), MainStay Funds Trust (since 2009) and MainStay Funds (since 2007); and Assistant Treasurer, New York Life Investment Management Holdings LLC (2008 to 2012) | |
| | J. Kevin Gao
1967 | Secretary and Chief Legal Officer, MainStay VP Funds Trust (since 2010)** | Managing Director and Associate General Counsel, New York Life Investment Management LLC (since 2010); Secretary and Chief Legal Officer, MainStay CBRE Global Infrastructure Megatrends Fund (since 2021), MainStay MacKay DefinedTerm Municipal Opportunities Fund (since 2011), MainStay Funds and MainStay Funds Trust (since 2010) | |
| | Scott T. Harrington
1959 | Vice President— Administration, MainStay VP Funds Trust (since 2005)** | Managing Director, New York Life Investment Management LLC (including predecessor advisory organizations) (since 2000); Member of the Board of Directors, New York Life Trust Company (since 2009); Vice President—Administration, MainStay CBRE Global Infrastructure Megatrends Fund (since 2021), MainStay MacKay DefinedTerm Municipal Opportunities Fund (since 2011), MainStay Funds Trust and MainStay Funds (since 2009) | |
| | Kevin M. Gleason
1967 | Vice President and Chief Compliance Officer, MainStay VP Funds Trust (since June 2022) | Vice President and Chief Compliance Officer, IndexIQ, IndexIQ ETF Trust and Index IQ Active ETF Trust (since June 2022); Vice President and Chief Compliance Officer, MainStay CBRE Global Infrastructure Megatrends Fund, MainStay MacKay DefinedTerm Municipal Opportunities Fund (since June 2022); MainStay Funds Trust and MainStay Funds (since June 2022); Senior Vice President, Voya Investment Management and Chief Compliance Officer, Voya Family of Funds (2012-2022) | |
| * | The officers listed above are considered to be “interested persons” of the MainStay Group of Funds, MainStay VP Funds Trust, MainStay CBRE Global Infrastructure Megatrends Fund and MainStay MacKay DefinedTerm Municipal Opportunities Fund within the meaning of the 1940 Act because of their affiliation with the MainStay Group of Funds, New York Life Insurance Company and/or its affiliates, including New York Life Investment Management LLC, NYLIM Service Company LLC, NYLIFE Securities LLC and/or NYLIFE Distributors LLC, as described in detail in the column captioned “Principal Occupation(s) During Past Five Years.” Officers are elected annually by the Board. |
| ** | Includes prior service as an Officer of MainStay VP Series Fund, Inc., the predecessor to MainStay VP Funds Trust. |
Officers of the Trust (Who are not Trustees)*
| 36 | MainStay VP Wellington Small Cap Portfolio |
This page intentionally left blank
This page intentionally left blank.
MainStay VP Portfolios
MainStay VP offers a wide range of Portfolios. The full array of MainStay VP offerings is listed here, with information about the manager, subadvisors, legal counsel, and independent registered public accounting firm.
Equity
MainStay VP American Century Sustainable Equity Portfolio1
MainStay VP Candriam Emerging Markets Equity Portfolio
MainStay VP Epoch U.S. Equity Yield Portfolio
MainStay VP Fidelity Institutional AM® Utilities Portfolio†
MainStay VP MacKay International Equity Portfolio
MainStay VP Natural Resources Portfolio
MainStay VP S&P 500 Index Portfolio2
MainStay VP Small Cap Growth Portfolio
MainStay VP Wellington Growth Portfolio
MainStay VP Wellington Mid Cap Portfolio
MainStay VP Wellington Small Cap Portfolio
MainStay VP Wellington U.S. Equity Portfolio
MainStay VP Winslow Large Cap Growth Portfolio
Mixed Asset
MainStay VP Balanced Portfolio
MainStay VP Income Builder Portfolio
MainStay VP Janus Henderson Balanced Portfolio
MainStay VP MacKay Convertible Portfolio
Income
MainStay VP Bond Portfolio
MainStay VP Floating Rate Portfolio
MainStay VP Indexed Bond Portfolio
MainStay VP MacKay Government Portfolio
MainStay VP MacKay High Yield Corporate Bond Portfolio
MainStay VP MacKay Strategic Bond Portfolio
MainStay VP PIMCO Real Return Portfolio
Money Market
MainStay VP U.S. Government Money Market Portfolio
Alternative
MainStay VP CBRE Global Infrastructure Portfolio
MainStay VP IQ Hedge Multi-Strategy Portfolio
Asset Allocation
MainStay VP Conservative Allocation Portfolio
MainStay VP Equity Allocation Portfolio
MainStay VP Growth Allocation Portfolio
MainStay VP Moderate Allocation Portfolio
Manager
New York Life Investment Management LLC
New York, New York
Subadvisors
American Century Investment Management, Inc.
Kansas City, Missouri
Brown Advisory LLC
Baltimore, Maryland
Candriam*
Strassen, Luxembourg
CBRE Investment Management Listed Real Assets LLC
Radnor, Pennsylvania
Epoch Investment Partners, Inc.
New York, New York
FIAM LLC
Smithfield, Rhode Island
IndexIQ Advisors LLC*
New York, New York
Janus Henderson Investors US LLC
Denver, Colorado
MacKay Shields LLC*
New York, New York
Newton Investment Management North America, LLC
Boston, Massachusetts
NYL Investors LLC*
New York, New York
Pacific Investment Management Company LLC
Newport Beach, California
Segall Bryant & Hamill, LLC
Chicago, Illinois
Wellington Management Company LLP
Boston, Massachusetts
Winslow Capital Management, LLC
Minneapolis, Minnesota
Legal Counsel
Dechert LLP
Washington, District of Columbia
Independent Registered Public Accounting Firm
PricewaterhouseCoopers LLP
New York, New York
Distributor
NYLIFE Distributors LLC*
Jersey City, New Jersey
Custodian
JPMorgan Chase Bank, N.A.
New York, New York
Some Portfolios may not be available in all products.
† Fidelity Institutional AM is a registered trade mark of FMR LLC. Used with permission.
* An affiliate of New York Life Investment Management LLC.
| 1. | Prior to May 1, 2022, the Portfolio's name was MainStay VP T. Rowe Price Equity Income Portfolio. |
| 2. | Prior to May 1, 2022, the Portfolio's name was MainStay VP MacKay S&P 500 Index Portfolio. |
Not part of the Annual Report
2022 Annual Report
This report is for the general information of New York Life Variable Annuities and NYLIAC Variable Universal Life Insurance Products policyowners. It must be preceded or accompanied by the appropriate product(s) and funds prospectuses if it is given to anyone who is not an owner of a New York Life variable annuity policy or a NYLIAC Variable Universal Life Insurance Product. This report does not offer for sale or solicit orders to purchase securities.
The performance data quoted in this report represents past performance. Past performance is no guarantee of future results. Due to market volatility and other factors, current performance may be lower or higher than the figures shown. The most recent month-end performance summary for your variable annuity or variable life policy is available by calling 800-598-2019 and is updated periodically on newyorklife.com.
The New York Life Variable Annuities and NYLIAC Variable Universal Life Insurance Products are issued by New York Life Insurance and Annuity Corporation (a Delaware Corporation) and distributed by NYLIFE Distributors LLC (Member FINRA/SIPC).
New York Life Insurance Company
New York Life Insurance and Annuity
Corporation (NYLIAC) (A Delaware Corporation)
51 Madison Avenue, Room 551
New York, NY 10010
newyorklife.com
newyorklifeinvestments.com
NYLIFE Distributors LLC, 30 Hudson Street, Jersey City, NJ 07302
New York Life Investment Management LLC is the investment manager to the MainStay VP Funds Trust
©2023 by NYLIFE Distributors LLC. All rights reserved.
You may obtain copies of the Prospectus and the Statement of Additional Information free of charge, upon request, by calling toll-free 800-598-2019 or writing to New York Life Insurance and Annuity Corporation, 51 Madison Avenue, New York, NY 10010.
| Not FDIC Insured | No Bank Guarantee | May Lose Value |
(NYLIAC) NI530
MainStay VP Candriam Emerging Markets Equity Portfolio
Message from the President and Annual Report
December 31, 2022
Sign up for e-delivery of your shareholder reports. For full details on e-delivery, including who can participate and what you can receive via e-delivery,
please log in to newyorklifeinvestments.com/accounts.
| Not FDIC/NCUA Insured | Not a Deposit | May Lose Value | No Bank Guarantee | Not Insured by Any Government Agency |
This page intentionally left blank
Message from the President
The 12-month reporting period ended December 31, 2022, proved exceptionally challenging for investors as both stock and bond markets suffered steep declines. A variety of economic and geopolitical forces drove the market’s losses, all centered around rising inflation and monetary efforts to rein it in.
Inflationary alarms began to sound well before the reporting period began. In late 2021, after nearly two years of accommodative policies designed to encourage economic growth in the face of the COVID-19 pandemic, the U.S. Federal Reserve (the “Fed”) warned of the increasing need to tighten monetary policy. Nevertheless, the pace and persistence of inflation in early 2022 caught most market participants—the Fed included—off guard. Russia’s invasion of Ukraine in February exacerbated global inflationary pressures while increasing investor uncertainty. Domestic supply shortages, international trade imbalances and rising inflation caused U.S. GDP (gross domestic product) to contract in the first and second quarters of the year, although employment and consumer spending proved resilient. Prices for petroleum surged to multi-year highs, while many key agricultural chemicals and industrial metals soared as well. Accelerating inflationary forces prompted the Fed to implement its most aggressive series of interest rate hikes since the 1980s, with a 0.25% increase in March followed by six further rate increases totaling 4.25%. International central banks generally followed suit and raised rates by varying degrees in efforts to curb local inflation, although most increases remained significantly more modest than those in the United States. Relatively high U.S. interest rates and an international risk averse sentiment pushed U.S. dollar values higher compared to most other currencies, with negative impacts on global prices for food, fuel and other key U.S.-dollar-denominated products.
The effects of these interrelated challenges were felt throughout U.S. and international financial markets. The S&P 500® Index, a widely regarded benchmark of market performance, declined by more than 18% during the reporting period. Although the energy sector generated strong gains, bolstered by elevated oil and gas prices, most other industry segments recorded losses. The more cyclical and growth-oriented sectors of consumer discretionary, information technology and real estate delivered the weakest returns, while the traditionally defensive and value-oriented
consumer staples, utilities and health care sectors outperformed. On average, international developed-country equity markets mildly outperformed their U.S. counterparts, while emerging markets lagged slightly. Fixed-income markets proved unusually volatile, with bond prices trending sharply lower as yields rose along with interest rates. Short-term yields rose faster than long-term yields, producing a yield curve inversion from July through the end of the reporting period as long-term rates remained below short-term rates. While floating-rate instruments, which feature variable interest rates that allow investors to benefit from a rising rate environment, provided a degree of insulation from inflation-driven trends, they were not immune to the market’s widespread declines.
Although, according to the most recent estimates, the annualized inflation rate in the United States has declined from a peak of 9.1% in July 2022 to 6.5% in December, the Fed remains focused on achieving more substantial and lasting reductions, aiming for a target rate of 2%. As a result, further rate hikes and additional market volatility are potential headwinds in the coming months. The question remains as to whether the Fed and other central banks will manage a so-called “soft landing,” curbing inflation while avoiding a persistent economic slowdown. If they prove successful, we believe that the increasingly attractive valuations we have observed in both equity and bond markets should eventually translate into sustainable improvements in the investment environment.
Whatever actions the Fed takes and however financial markets react, as a MainStay VP investor you can depend on us to continue managing our portfolios with the insight, expertise and level of service that have long defined New York Life Investments. Thank you for trusting us to help you meet your investment needs.
Sincerely,
Kirk C. Lehneis
President
The opinions expressed are as of the date of this report and are subject to change. There is no guarantee that any forecast made will come to pass. This material does not constitute investment advice and is not intended as an endorsement of any specific investment. Past performance is no guarantee of future results.
Not part of the Annual Report
Investors should refer to the Portfolio’s Summary Prospectus and/or Prospectus and consider the Portfolio’s investment objectives, strategies, risks, charges and expenses carefully before investing. The Summary Prospectus and/or Prospectus contain this and other information about the Portfolio. You may obtain copies of the Portfolio’s Summary Prospectus, Prospectus and Statement of Additional Information, which includes information about the MainStay VP Funds Trust's Trustees, free of charge, upon request, by calling toll-free 800-598-2019, by writing to New York Life Insurance and Annuity Corporation, 51 Madison Avenue, Room 251, New York, New York 10010 or by sending an email to MainStayShareholdersServices@nylim.com. These documents are also available at newyorklifeinvestments.com/investment-products/vp. Please read the Portfolio's Summary Prospectus and/or Prospectus carefully before investing. MainStay VP Funds Trust portfolios are separate account options which are purchased through a variable insurance or variable annuity contract.
Investment and Performance Comparison (Unaudited)
Performance data quoted represents past performance. Past performance is no guarantee of future results. Because of market volatility and other factors, current performance may be lower or higher than the figures shown. Investment return and principal value will fluctuate, and as a result, when shares are redeemed, they may be worth more or less than their original cost. The performance table and graph do not reflect any deduction of sales charges, mortality and expense charges, contract charges or administrative charges. Please refer to the Performance Summary appropriate for your policy. For performance information current to the most recent month-end, please call 800-598-2019 or visit www.newyorklife.com.
Performance figures may reflect certain fee waivers and/or expense limitations, without which total returns may have been different. For information on current fee waivers and/or expense limitations (if any), please refer to the Notes to Financial Statements.
| Average Annual Total Returns for the Year-Ended December 31, 2022 |
| Class | Inception
Date1, 2, 3 | One
Year | Five
Years | Ten
Years | Gross
Expense
Ratio4 |
| Initial Class Shares | 2/17/2012 | -28.72% | -3.48% | -1.17% | 1.14% |
| Service Class Shares | 2/17/2012 | -28.89 | -3.72 | -1.42 | 1.39 |
| 1. | Effective January 13, 2015, the Portfolio changed its subadvisors and revised its principal investment strategies. The performance in the graph and table prior to that date reflects the Portfolio’s prior subadvisors and principal investment strategies. |
| 2. | Effective January 1, 2018, due to an organizational restructuring whereby all investment personnel of Cornerstone Capital Management Holdings LLC, the former subadvisor, transitioned to MacKay Shields LLC. |
| 3. | Effective May 1, 2021, the Portfolio replaced one of its subadvisors and modified its principal investment strategies. The past performance in the graph and table prior to that date reflects the Portfolio's prior subadvisor and principal investment strategies. |
| 4. | The gross expense ratios presented reflect the Portfolio’s “Total Annual Portfolio Operating Expenses” from the most recent Prospectus and may differ from other expense ratios disclosed in this report. |
| Benchmark Performance* | One
Year | Five
Years | Ten
Years |
| MSCI Emerging Markets Index (Net)1 | -20.09% | -1.40% | 1.44% |
| Morningstar Diversified Emerging Markets Category Average2 | -21.03 | -1.52 | 1.14 |
| * | Returns for indices reflect no deductions for fees, expenses or taxes, except for foreign withholding taxes where applicable. Results assume reinvestment of all dividends and capital gains. An investment cannot be made directly in an index. |
| 1. | The MSCI Emerging Markets Index (Net) is the Portfolio's primary benchmark. The MSCI Emerging Markets Index (Net) is a broad-based benchmark that is a free float-adjusted market capitalization index that is designed to measure equity market performance in the global emerging markets. |
| 2. | The Morningstar Diversified Emerging Markets Category Average is representative of funds that tend to divide their assets among 20 or more nations, although they tend to focus on the emerging markets of Asia and Latin America rather than on those of the Middle East, Africa, or Europe. These funds invest predominantly in emerging market equities, but some funds also invest in both equities and fixed income investments from emerging markets. Results are based on average total returns of similar funds with all dividends and capital gain distributions reinvested. |
Cost in Dollars of a $1,000 Investment in MainStay VP Candriam Emerging Markets Equity Portfolio (Unaudited)
The example below is intended to describe the fees and expenses borne by shareholders during the six-month period from July 1, 2022 to December 31, 2022, and the impact of those costs on your investment.
Example
As a shareholder of the Portfolio you incur two types of costs: (1) transaction costs, including exchange fees and sales charges (loads) on purchases (as applicable), and (2) ongoing costs, including management fees, distribution and/or service (12b-1) fees and other Portfolio expenses (as applicable). This example is intended to help you understand your ongoing costs (in dollars) of investing in the Portfolio and to compare these costs with the ongoing costs of investing in other mutual funds. The example is based on an investment of $1,000 made at the beginning of the six-month period and held for the entire period from July 1, 2022 to December 31, 2022. Shares are only sold in connection with variable life and annuity contracts and the example does not reflect any contract level or transactional fees or expenses. If these costs had been included, your costs would have been higher.
This example illustrates your Portfolio’s ongoing costs in two ways:
Actual Expenses
The second and third data columns in the table below provide information about actual account values and actual expenses. You may use the information in these columns, together with the amount you invested, to estimate the expenses that you paid during the six months ended
December 31, 2022. Simply divide your account value by $1,000 (for example, an $8,600 account value divided by $1,000 = 8.6), then multiply the result by the number under the heading entitled “Expenses Paid During Period” to estimate the expenses you paid on your account during this period.
Hypothetical Example for Comparison Purposes
The fourth and fifth data columns in the table below provide information about hypothetical account values and hypothetical expenses based on the Portfolio’s actual expense ratio and an assumed rate of return of 5% per year before expenses, which is not the Portfolio’s actual return. The hypothetical account values and expenses may not be used to estimate the actual ending account balances or expenses you paid for the six-month period shown. You may use this information to compare the ongoing costs of investing in the Portfolio with the ongoing costs of investing in other mutual funds. To do so, compare this 5% hypothetical example with the 5% hypothetical examples that appear in the shareholder reports of the other mutual funds.
Please note that the expenses shown in the table are meant to highlight your ongoing costs only and do not reflect any transactional costs, such as exchange fees or sales charges (loads). Therefore, the fourth and fifth data columns of the table are useful in comparing ongoing costs only and will not help you determine the relative total costs of owning different funds. In addition, if these transactional costs were included, your costs would have been higher.
| Share Class | Beginning
Account
Value
7/1/22 | Ending Account
Value (Based
on Actual
Returns and
Expenses)
12/31/22 | Expenses
Paid
During
Period1 | Ending Account
Value (Based
on Hypothetical
5% Annualized
Return and
Actual Expenses)
12/31/22 | Expenses
Paid
During
Period1 | Net Expense
Ratio
During
Period2 |
| Initial Class Shares | $1,000.00 | $908.00 | $5.67 | $1,019.26 | $6.01 | 1.18% |
| Service Class Shares | $1,000.00 | $906.90 | $6.87 | $1,018.00 | $7.27 | 1.43% |
| 1. | Expenses are equal to the Portfolio’s annualized expense ratio of each class multiplied by the average account value over the period, divided by 365 and multiplied by 184 (to reflect the six-month period). The table above represents the actual expenses incurred during the six-month period. In addition to the fees and expenses which the Portfolio bears directly, it also indirectly bears a pro rata share of the fees and expenses of the underlying funds in which it invests. Such indirect expenses are not included in the above-reported expense figures. |
| 2. | Expenses are equal to the Portfolio's annualized expense ratio to reflect the six-month period. |
| 6 | MainStay VP Candriam Emerging Markets Equity Portfolio |
Country Composition as of December 31, 2022 (Unaudited)
| China | 34.2% |
| India | 15.8 |
| Taiwan | 11.5 |
| Republic of Korea | 10.8 |
| Brazil | 8.1 |
| Thailand | 4.4 |
| Mexico | 4.0 |
| Indonesia | 3.5 |
| South Africa | 2.7 |
| Poland | 1.1 |
| Turkey | 0.7% |
| Peru | 0.6 |
| Chile | 0.5 |
| United States | 0.4 |
| Russia | 0.0‡ |
| Greece | 0.0‡ |
| Hong Kong | 0.0‡ |
| Other Assets, Less Liabilities | 1.7 |
| | 100.0% |
| ‡ | Less than one–tenth of a percent. |
See Portfolio of Investments beginning on page 10 for specific holdings within these categories. The Portfolio's holdings are subject to change.
Top Ten Holdings and/or Issuers Held as of December 31, 2022 (excluding short-term investments) (Unaudited)
| 1. | Taiwan Semiconductor Manufacturing Co. Ltd. |
| 2. | Tencent Holdings Ltd. |
| 3. | Alibaba Group Holding Ltd. |
| 4. | Meituan |
| 5. | Ping An Insurance Group Co. of China Ltd., Class H |
| 6. | JD.com, Inc., Class A |
| 7. | Samsung Electronics Co. Ltd. |
| 8. | Samsung SDI Co. Ltd. |
| 9. | Reliance Industries Ltd. |
| 10. | HDFC Bank Ltd. |
Portfolio Management Discussion and Analysis (Unaudited)
Questions answered by Paulo Salazar, Philip Screve and Lamine Saidi of Candriam, the Portfolio’s Subadvisor.
How did MainStay VP Candriam Emerging Markets Equity Portfolio perform relative to its benchmark and peers during the 12 months ended December 31, 2022?
For the 12 months ended December 31, 2022, MainStay VP Candriam Emerging Markets Equity Portfolio returned −28.72% for Initial Class shares and −28.89% for Service Class shares. Over the same period, both share classes underperformed the −20.09% return of the MSCI Emerging Markets Index (Net) (“the Index”), which is the Portfolio’s benchmark, and the −21.03% return of the Morningstar Diversified Emerging Markets Category Average.1
What factors affected the Portfolio’s relative performance during the reporting period?
A combination of factors undermined the Portfolio’s performance relative to the Index. These included relative underperformance of growth as investment style, an increase in market volatility with no clear leadership in any sector or country, and an unanticipated reopening in China towards the end of the year where lower quality and higher volatility stocks led the market recovery.
For most of 2022, China remained a volatile market, with restrictions related to the country’s zero-COVID-19 policy disrupting operations and depressing consumer confidence. As a result, Portfolio holdings in several areas—including green energy, electric vehicles (“EV”) and consumption— detracted from relative returns despite strong fundamentals. Semiconductor holdings also negatively affected relative performance as the industry faced an acute chip shortage, which later evolved into an impending inventory correction. Additional semiconductor industry headwinds included the supply-chain disruptions in China and U.S. export controls on cutting-edge chips and advanced equipment. We responded by reducing the Portfolio’s semiconductor position and concentrating the remaining exposure on market leader Taiwan Semiconductor Manufacturing Company (“TSMC”) over other, higher beta2 plays.
More broadly, in terms of positioning, the Portfolio followed a balanced allocation approach with a preference of higher quality and low volatility stocks, especially in terms of Chinese exposure. This approach reflected lingering uncertainties regarding heightened geopolitical tensions arising from the ongoing Russia-Ukraine war, rising interest rates, a slowing growth outlook for developing markets and a strengthening U.S. dollar. Defensive positioning, such as limited exposure to Russia, helped constrain risks on many occasions. However, in November, China implemented an abrupt change in policy, shifting from its zero-COVID-19 stance toward reopening, and ending its regime of
regulatory tightening. These changes led to a sharp rebound in the riskier parts of the market, including Chinese ADRs (American depositary receipts) and China’s real estate and property sector, areas in which the strategy held no exposure. In the wake of these changes, the strategy selectively added exposure to reopening beneficiaries, including Chinese ADRs.
Which sectors were the strongest positive contributors to the Portfolio’s relative performance, and which sectors were particularly weak?
All sectors in the Index posted negative total returns during the reporting period. The strongest positive contribution to the Portfolio’s relative performance came from the energy sector, primarily driven by stock selection. (Contributions take weightings and total returns into account.) Conversely, the most significant detractors from relative performance were the information technology, materials and consumer discretionary sectors. In information technology, underperformance was driven largely by stock selection. In materials and consumer discretionary, a combination of adverse stock selection and sector allocation effect detracted.
During the reporting period, which individual stocks made the strongest positive contributions to the Portfolio’s absolute performance and which stocks detracted the most?
The strongest positive contributions to the Portfolio’s absolute performance came from holdings in Chilean lithium and fertilizer producer Sociedad Quimica Y Minera, Brazilian insurance company BB Seguridade Participacoes and Brazilian energy company Petro Rio. Shares in Sociedad Quimica Y Minera rose as the company’s profits increased following a sharp boost in fertilizer and lithium prices. BB Seguridade Participacoes shares gained ground in the wake of a strong, post-pandemic insurance industry recovery amid an environment of improving margins and rising interest rates. Petro Rio benefited from elevated energy prices and better-than-expected volume growth.
The most substantial detractors from the Portfolio’s absolute performance were Chinese EV manufacturer Nio, Chinese online brokerage company East Money Information and leading EV automaker BYD. Nio shares declined when shipments were disrupted due to pandemic-related lockdowns in China. Shares in East Money, a fast-growing online broker focusing on the domestic Chinese market, corrected as new regulations capping brokerage margins undermined the company’s outlook. BYD continued to post strong growth in EV volumes, but the share
| 1. | See page 5 for more information on benchmark and peer group returns. |
| 2. | Beta is a measure of volatility in relation to the market as a whole. A beta higher than 1 indicates that a security or portfolio will tend to exhibit higher volatility than the market. A beta lower than 1 indicates that a security or portfolio will tend to exhibit lower volatility than the market. |
| 8 | MainStay VP Candriam Emerging Markets Equity Portfolio |
price dropped when strategic shareholder Berkshire Hathaway decided to reduce exposure to the name.
Did the Portfolio make any significant purchases or sales during the reporting period?
The most significant purchases during the reporting period included shares in global semiconductor manufacturing company TSMC and Chinese insurance leader Ping An Insurance Group. As described above, the Portfolio’s increased position in TSMC primarily resulted from a strategic shift out of other, more commoditized semiconductor names. While the semiconductor industry has witnessed increasing demand challenges, we believe TSMC’s business prospects should prove relatively resilient due to the company’s focus on leading-edge products. The Portfolio purchased a position in Ping An Insurance to increase exposure to China’s reopening and recovery, following the move away from its zero-Covid-19 policy in late November.
During the same period, the Portfolio’s most significant sales included shares in Korea-based global memory semiconductor and consumer electronics company Samsung Electronics, and Taiwanese semiconductor company Mediatek. We reduced the Portfolio’s exposure to Samsung as the company lagged in meeting our corporate governance standards. We closed the Portfolio’s position in Mediatek due to concerns of a slowdown in demand for the company’s 5G semiconductor products.
How did the Portfolio’s sector weightings change during the reporting period?
The Portfolio increased its weighting relative to the Index in the consumer discretionary sector, primarily toward the end of the reporting period, to benefit from China reopening and recovery prospects. The Portfolio also added to its exposure in industrials and consumer staples. In the case of consumer staples, most of the increased positions were among food retailers due to their relative resilience in an inflationary environment.
During the same period, the Portfolio decreased its sector exposure in both information technology and financials, bringing information technology from a considerably overweight position relative to the Index to a near market neutral, and reducing financials from an overweight position to a slightly underweight position.
How was the Portfolio positioned at the end of the reporting period?
As of December 31, 2022, the Portfolio maintained generally balanced positioning, with slightly overweight exposure to the
consumer discretionary and industrial sectors. The overweight in consumer discretionary reflected our expectation of a gradual recovery in emerging markets, driven primarily by China. The overweight in industrials was primarily driven by thematic exposure to areas such as clean energy, automation and EVs, that we believe could benefit from sustained demand and increasing capital expenditure allocations in an environment of supply-chain diversification.
In our opinion, other factors that undermined emerging markets performance during the reporting period, including the strengthening U.S. dollar, may recede as inflationary pressures begin to subside. At the same time, we remain mindful that global liquidity has trended lower recently, and that global central banks may disappoint markets on pivot expectation. We continue to maintain the Portfolio’s balanced positioning, while selectively increasing exposure to China and slightly trimming holdings in India, Southeast Asia and Brazil. More broadly, however, the Portfolio’s strategy remains unchanged, focused on reasonably priced, sustainable emerging markets growth companies positioned to benefit from thematic tailwinds in several growth clusters.
The opinions expressed are those of the portfolio managers as of the date of this report and are subject to change. There is no guarantee that any forecasts will come to pass. This material does not constitute investment advice and is not intended as an endorsement of any specific investment.
Not all MainStay VP Portfolios and/or share classes are available under all policies.
Portfolio of Investments December 31, 2022†
| | Shares | Value |
| Common Stocks 97.3% |
| Brazil 7.1% |
| Arezzo Industria e Comercio SA (Textiles, Apparel & Luxury Goods) | 64,000 | $ 948,740 |
| B3 SA - Brasil Bolsa Balcao (Capital Markets) | 480,000 | 1,200,287 |
| BB Seguridade Participacoes SA (Insurance) | 352,000 | 2,235,097 |
| Hypera SA (Pharmaceuticals) (a) | 188,000 | 1,610,152 |
| Localiza Rent a Car SA (Road & Rail) | 134,000 | 1,349,523 |
| MercadoLibre, Inc. (Internet & Direct Marketing Retail) (a) | 3,740 | 3,164,938 |
| Petro Rio SA (Oil, Gas & Consumable Fuels) (a) | 374,000 | 2,647,481 |
| SLC Agricola SA (Food Products) | 48,000 | 426,352 |
| WEG SA (Electrical Equipment) | 378,000 | 2,753,099 |
| | | 16,335,669 |
| Chile 0.5% |
| Sociedad Quimica y Minera de Chile SA, Sponsored ADR (Chemicals) | 13,800 | 1,101,792 |
| China 34.2% |
| Aier Eye Hospital Group Co. Ltd., Class A (Health Care Providers & Services) | 310,080 | 1,386,421 |
| Airtac International Group (Machinery) | 37,000 | 1,119,885 |
| Alibaba Group Holding Ltd. (Internet & Direct Marketing Retail) (a) | 744,000 | 8,214,627 |
| Asia Cement China Holdings Corp. (Construction Materials) | 15,500 | 7,273 |
| Bank of Jiangsu Co. Ltd., Class A (Banks) | 2,700,000 | 2,832,076 |
| Beijing United Information Technology Co. Ltd., Class A (Trading Companies & Distributors) | 42,118 | 535,224 |
| BYD Co. Ltd., Class H (Automobiles) | 108,000 | 2,655,863 |
| BYD Electronic International Co. Ltd. (Communications Equipment) | 570,000 | 1,833,498 |
| China Tourism Group Duty Free Corp. Ltd., Class H (Specialty Retail) (a)(b) | 82,000 | 2,416,722 |
| Contemporary Amperex Technology Co. Ltd., Class A (Electrical Equipment) | 24,992 | 1,415,084 |
| CSPC Pharmaceutical Group Ltd. (Pharmaceuticals) | 840,000 | 882,640 |
| Ganfeng Lithium Group Co. Ltd., Class H (Metals & Mining) (b)(c) | 174,000 | 1,299,988 |
| Ginlong Technologies Co. Ltd., Class A (Electrical Equipment) (a) | 13,980 | 362,278 |
| Jafron Biomedical Co. Ltd., Class A (Health Care Equipment & Supplies) | 92,920 | 413,990 |
| | Shares | Value |
| |
| China (continued) |
| JD Health International, Inc. (Internet & Direct Marketing Retail) (a)(b) | 306,000 | $ 2,798,442 |
| JD.com, Inc., Class A (Internet & Direct Marketing Retail) | 182,000 | 5,116,083 |
| Jiumaojiu International Holdings Ltd. (Hotels, Restaurants & Leisure) (b) | 1,100,000 | 2,901,993 |
| Li Ning Co. Ltd. (Textiles, Apparel & Luxury Goods) | 92,000 | 789,475 |
| LONGi Green Energy Technology Co. Ltd., Class A (Semiconductors & Semiconductor Equipment) | 91,992 | 559,488 |
| Longshine Technology Group Co. Ltd., Class A (Software) | 307,991 | 972,206 |
| Meituan (Internet & Direct Marketing Retail) (a)(b) | 282,000 | 6,235,409 |
| Ming Yang Smart Energy Group Ltd., Class A (Electrical Equipment) | 443,975 | 1,614,125 |
| NARI Technology Co. Ltd., Class A (Electrical Equipment) | 360,997 | 1,262,518 |
| NetEase, Inc. (Entertainment) | 90,000 | 1,311,889 |
| Ningbo Deye Technology Co. Ltd., Class A (Machinery) | 13,992 | 666,847 |
| Ningbo Orient Wires & Cables Co. Ltd., Class A (Electrical Equipment) | 93,993 | 917,488 |
| Nongfu Spring Co. Ltd., Class H (Beverages) (b) | 340,000 | 1,921,332 |
| Pinduoduo, Inc., ADR (Internet & Direct Marketing Retail) (a) | 16,000 | 1,304,800 |
| Ping An Insurance Group Co. of China Ltd., Class H (Insurance) | 800,000 | 5,280,153 |
| Proya Cosmetics Co. Ltd., Class A (Personal Products) | 68,961 | 1,661,777 |
| Shanghai Baosight Software Co. Ltd., Class A (Software) | 166,480 | 1,073,089 |
| Shenzhen Inovance Technology Co. Ltd., Class A (Machinery) | 216,000 | 2,160,295 |
| Tencent Holdings Ltd. (Interactive Media & Services) | 236,000 | 10,030,521 |
| Unigroup Guoxin Microelectronics Co. Ltd., Class A (Semiconductors & Semiconductor Equipment) | 33,944 | 643,876 |
| Yadea Group Holdings Ltd. (Automobiles) (b) | 1,320,000 | 2,198,539 |
| Zhejiang Jiuzhou Pharmaceutical Co. Ltd., Class A (Pharmaceuticals) | 181,964 | 1,107,937 |
| Zijin Mining Group Co. Ltd., Class H (Metals & Mining) | 380,000 | 511,424 |
| | | 78,415,275 |
The notes to the financial statements are an integral part of, and should be read in conjunction with, the financial statements.
| 10 | MainStay VP Candriam Emerging Markets Equity Portfolio |
| | Shares | Value |
| Common Stocks (continued) |
| Greece 0.0% ‡ |
| FF Group (Textiles, Apparel & Luxury Goods) (a)(d)(e) | 19,000 | $ — |
| Hong Kong 0.0% ‡ |
| China Lumena New Materials Corp. (Chemicals) (a)(d)(e) | 6,500 | — |
| India 15.8% |
| ABB India Ltd. (Electrical Equipment) | 54,000 | 1,751,552 |
| Apollo Hospitals Enterprise Ltd. (Health Care Providers & Services) | 22,000 | 1,187,628 |
| Asian Paints Ltd. (Chemicals) | 61,000 | 2,277,303 |
| Axis Bank Ltd. (Banks) | 314,000 | 3,529,314 |
| Bajaj Finance Ltd. (Consumer Finance) | 29,000 | 2,295,262 |
| Bharti Airtel Ltd. (Wireless Telecommunication Services) | 380,000 | 3,693,892 |
| Eicher Motors Ltd. (Automobiles) | 62,000 | 2,409,898 |
| HDFC Bank Ltd. (Banks) | 204,000 | 4,015,806 |
| ICICI Bank Ltd. (Banks) | 190,000 | 2,036,515 |
| Infosys Ltd. (IT Services) | 184,000 | 3,333,366 |
| Jubilant Foodworks Ltd. (Hotels, Restaurants & Leisure) | 152,000 | 935,497 |
| Reliance Industries Ltd. (Oil, Gas & Consumable Fuels) | 132,000 | 4,049,249 |
| SBI Cards & Payment Services Ltd. (Consumer Finance) | 148,000 | 1,420,054 |
| Torrent Pharmaceuticals Ltd. (Pharmaceuticals) | 58,000 | 1,084,415 |
| Varun Beverages Ltd. (Beverages) | 136,000 | 2,165,324 |
| | | 36,185,075 |
| Indonesia 3.5% |
| Aneka Tambang Tbk. (Metals & Mining) | 8,700,000 | 1,109,574 |
| Bank Central Asia Tbk. PT (Banks) | 6,800,000 | 3,728,101 |
| Merdeka Copper Gold Tbk. PT (Metals & Mining) (a) | 3,200,000 | 847,067 |
| Sumber Alfaria Trijaya Tbk. PT (Food & Staples Retailing) | 8,600,000 | 1,464,010 |
| Telkom Indonesia Persero Tbk. PT (Diversified Telecommunication Services) | 3,500,000 | 843,184 |
| | | 7,991,936 |
| Mexico 4.0% |
| America Movil SAB de CV (Wireless Telecommunication Services) | 2,780,000 | 2,522,279 |
| Gruma SAB de CV, Class B (Food Products) | 124,000 | 1,659,188 |
| | Shares | Value |
| |
| Mexico (continued) |
| Grupo Aeroportuario del Pacifico SAB de CV, Class B (Transportation Infrastructure) | 136,000 | $ 1,948,241 |
| Grupo Financiero Banorte SAB de CV, Class O (Banks) | 420,000 | 3,015,534 |
| | | 9,145,242 |
| Peru 0.6% |
| Credicorp Ltd. (Banks) | 9,800 | 1,329,468 |
| Poland 1.1% |
| Dino Polska SA (Food & Staples Retailing) (a)(b) | 31,000 | 2,658,158 |
| Republic of Korea 10.8% |
| Coupang, Inc. (Internet & Direct Marketing Retail) (a) | 90,000 | 1,323,900 |
| KakaoBank Corp. (Banks) (a) | 45,000 | 876,887 |
| KB Financial Group, Inc. (Banks) | 59,000 | 2,247,249 |
| L&F Co. Ltd. (Electronic Equipment, Instruments & Components) (a) | 12,400 | 1,720,191 |
| LG Chem Ltd. (Chemicals) (a) | 3,900 | 1,865,645 |
| Samsung Biologics Co. Ltd. (Life Sciences Tools & Services) (a)(b) | 5,700 | 3,676,568 |
| Samsung Electronics Co. Ltd. (Technology Hardware, Storage & Peripherals) | 110,000 | 4,850,789 |
| Samsung Engineering Co. Ltd. (Construction & Engineering) (a) | 106,000 | 1,877,215 |
| Samsung SDI Co. Ltd. (Electronic Equipment, Instruments & Components) | 9,000 | 4,240,831 |
| SK Hynix, Inc. (Semiconductors & Semiconductor Equipment) | 34,000 | 2,046,524 |
| | | 24,725,799 |
| Russia 0.0% ‡ |
| Magnit PJSC (Food & Staples Retailing) (a)(d)(e) | 22,529 | — |
| South Africa 2.7% |
| Capitec Bank Holdings Ltd. (Banks) | 10,600 | 1,159,481 |
| FirstRand Ltd. (Diversified Financial Services) | 490,000 | 1,789,707 |
| Gold Fields Ltd. (Metals & Mining) | 107,000 | 1,107,422 |
| Shoprite Holdings Ltd. (Food & Staples Retailing) | 160,000 | 2,128,593 |
| | | 6,185,203 |
The notes to the financial statements are an integral part of, and should be read in conjunction with, the financial statements.
11
Portfolio of Investments December 31, 2022† (continued)
| | Shares | Value |
| Common Stocks (continued) |
| Taiwan 11.5% |
| Accton Technology Corp. (Communications Equipment) | 236,000 | $ 1,798,637 |
| Alchip Technologies Ltd. (Semiconductors & Semiconductor Equipment) | 39,000 | 998,375 |
| Chailease Holding Co. Ltd. (Diversified Financial Services) | 482,200 | 3,401,404 |
| Delta Electronics, Inc. (Electronic Equipment, Instruments & Components) | 304,000 | 2,832,004 |
| E Ink Holdings, Inc. (Electronic Equipment, Instruments & Components) | 174,000 | 910,552 |
| E.Sun Financial Holding Co. Ltd. (Banks) | 140,351 | 109,787 |
| Taiwan Semiconductor Manufacturing Co. Ltd. (Semiconductors & Semiconductor Equipment) | 994,000 | 14,487,200 |
| Voltronic Power Technology Corp. (Electrical Equipment) | 35,000 | 1,756,256 |
| | | 26,294,215 |
| Thailand 4.4% |
| Airports of Thailand PCL, NVDR (Transportation Infrastructure) (a) | 620,000 | 1,342,591 |
| Bangkok Dusit Medical Services PCL, NVDR (Health Care Providers & Services) | 2,500,000 | 2,093,658 |
| CP ALL PCL, NVDR (Food & Staples Retailing) | 1,080,000 | 2,128,931 |
| Energy Absolute PCL, NVDR (Independent Power and Renewable Electricity Producers) | 980,000 | 2,737,618 |
| Kasikornbank PCL, NVDR (Banks) | 400,000 | 1,698,783 |
| | | 10,001,581 |
| Turkey 0.7% |
| BIM Birlesik Magazalar A/S (Food & Staples Retailing) | 220,000 | 1,610,525 |
| United States 0.4% |
| Globant SA (IT Services) (a) | 6,100 | 1,025,776 |
Total Common Stocks
(Cost $243,431,269) | | 223,005,714 |
| | Shares | | Value |
| Preferred Stock 1.0% |
| Brazil 1.0% |
| Itau Unibanco Holding SA (Banks) (a) | 464,000 | | $ 2,203,667 |
Total Preferred Stock
(Cost $2,194,153) | | | 2,203,667 |
| |
| | Number of
Rights | | |
| Rights 0.0% ‡ |
| Brazil 0.0% ‡ |
| Localiza Rent a Car SA (Road & Rail) | | | |
| Expires 1/31/23 (a) | 585 | | 1,192 |
Total Rights
(Cost $0) | | | 1,192 |
Total Investments
(Cost $245,625,422) | 98.3% | | 225,210,573 |
| Other Assets, Less Liabilities | 1.7 | | 3,890,392 |
| Net Assets | 100.0% | | $ 229,100,965 |
| † | Percentages indicated are based on Portfolio net assets. |
| ‡ | Less than one-tenth of a percent. |
| (a) | Non-income producing security. |
| (b) | May be sold to institutional investors only under Rule 144A or securities offered pursuant to Section 4(a)(2) of the Securities Act of 1933, as amended. |
| (c) | All or a portion of this security was held on loan. As of December 31, 2022, the aggregate market value of securities on loan was $40,516. The market value of the collateral held included non-cash collateral in the form of U.S. Treasury securities with a value of $45,897. (See Note 2(J)) |
| (d) | Illiquid security—As of December 31, 2022, the total market value deemed illiquid under procedures approved by the Board of Trustees was $0, which represented less than one-tenth of a percent of the Portfolio’s net assets. (Unaudited) |
| (e) | Security in which significant unobservable inputs (Level 3) were used in determining fair value. |
| Abbreviation(s): |
| ADR—American Depositary Receipt |
| NVDR—Non-Voting Depositary Receipt |
| PCL—Provision for Credit Losses |
The notes to the financial statements are an integral part of, and should be read in conjunction with, the financial statements.
| 12 | MainStay VP Candriam Emerging Markets Equity Portfolio |
The following is a summary of the fair valuations according to the inputs used as of December 31, 2022, for valuing the Portfolio’s assets:
| Description | Quoted
Prices in
Active
Markets for
Identical
Assets
(Level 1) | | Significant
Other
Observable
Inputs
(Level 2) | | Significant
Unobservable
Inputs
(Level 3) | | Total |
| Asset Valuation Inputs | | | | | | | |
| Investments in Securities (a) | | | | | | | |
| Common Stocks | | | | | | | |
| Brazil | $ 3,164,938 | | $ 13,170,731 | | $ — | | $ 16,335,669 |
| China | 1,304,800 | | 77,110,475 | | — | | 78,415,275 |
| India | — | | 36,185,075 | | — | | 36,185,075 |
| Indonesia | — | | 7,991,936 | | — | | 7,991,936 |
| Poland | — | | 2,658,158 | | — | | 2,658,158 |
| Republic of Korea | 1,323,900 | | 23,401,899 | | — | | 24,725,799 |
| South Africa | — | | 6,185,203 | | — | | 6,185,203 |
| Taiwan | — | | 26,294,215 | | — | | 26,294,215 |
| Thailand | — | | 10,001,581 | | — | | 10,001,581 |
| Turkey | — | | 1,610,525 | | — | | 1,610,525 |
| All Other Countries | 12,602,278 | | — | | — | | 12,602,278 |
| Total Common Stocks | 18,395,916 | | 204,609,798 | | — | | 223,005,714 |
| Preferred Stock | — | | 2,203,667 | | — | | 2,203,667 |
| Rights | — | | 1,192 | | — | | 1,192 |
| Total Investments in Securities | $ 18,395,916 | | $ 206,814,657 | | $ — | | $ 225,210,573 |
| (a) | For a complete listing of investments and their industries, see the Portfolio of Investments. |
The notes to the financial statements are an integral part of, and should be read in conjunction with, the financial statements.
13
Portfolio of Investments December 31, 2022† (continued)
The table below sets forth the diversification of the Portfolio’s investments by industry.
Industry Diversification
| | Value | | Percent † |
| Automobiles | $ 7,264,300 | | 3.2% |
| Banks | 28,782,668 | | 12.6 |
| Beverages | 4,086,656 | | 1.8 |
| Capital Markets | 1,200,287 | | 0.5 |
| Chemicals | 5,244,740 | | 2.3 |
| Communications Equipment | 3,632,135 | | 1.6 |
| Construction & Engineering | 1,877,215 | | 0.8 |
| Construction Materials | 7,273 | | 0.0‡ |
| Consumer Finance | 3,715,316 | | 1.6 |
| Diversified Financial Services | 5,191,111 | | 2.3 |
| Diversified Telecommunication Services | 843,184 | | 0.4 |
| Electrical Equipment | 11,832,400 | | 5.2 |
| Electronic Equipment, Instruments & Components | 9,703,578 | | 4.2 |
| Entertainment | 1,311,889 | | 0.6 |
| Food & Staples Retailing | 9,990,217 | | 4.4 |
| Food Products | 2,085,540 | | 0.9 |
| Health Care Equipment & Supplies | 413,990 | | 0.2 |
| Health Care Providers & Services | 4,667,707 | | 2.0 |
| Hotels, Restaurants & Leisure | 3,837,490 | | 1.7 |
| Independent Power and Renewable Electricity Producers | 2,737,618 | | 1.2 |
| Insurance | 7,515,250 | | 3.3 |
| Interactive Media & Services | 10,030,521 | | 4.4 |
| Internet & Direct Marketing Retail | 28,158,199 | | 12.3 |
| IT Services | 4,359,142 | | 1.9 |
| Life Sciences Tools & Services | 3,676,568 | | 1.6 |
| Machinery | 3,947,027 | | 1.7 |
| Metals & Mining | 4,875,475 | | 2.1 |
| Oil, Gas & Consumable Fuels | 6,696,730 | | 2.9 |
| Personal Products | 1,661,777 | | 0.7 |
| Pharmaceuticals | 4,685,144 | | 2.0 |
| Road & Rail | 1,350,715 | | 0.6 |
| Semiconductors & Semiconductor Equipment | 18,735,463 | | 8.2 |
| Software | 2,045,295 | | 0.9 |
| Specialty Retail | 2,416,722 | | 1.0 |
| Technology Hardware, Storage & Peripherals | 4,850,789 | | 2.1 |
| Textiles, Apparel & Luxury Goods | 1,738,215 | | 0.8 |
| Trading Companies & Distributors | 535,224 | | 0.2 |
| Transportation Infrastructure | 3,290,832 | | 1.4 |
| Wireless Telecommunication Services | 6,216,171 | | 2.7 |
| | Value | | Percent † |
| | 225,210,573 | | 98.3 |
| Other Assets, Less Liabilities | 3,890,392 | | 1.7 |
| Net Assets | $229,100,965 | | 100.0% |
| † | Percentages indicated are based on Portfolio net assets. |
| ‡ | Less than one-tenth of a percent. |
The notes to the financial statements are an integral part of, and should be read in conjunction with, the financial statements.
| 14 | MainStay VP Candriam Emerging Markets Equity Portfolio |
Statement of Assets and Liabilities as of December 31, 2022
| Assets |
Investment in securities, at value
(identified cost $245,625,422) including securities on loan of $40,516 | $225,210,573 |
| Cash | 4,137,015 |
Cash denominated in foreign currencies
(identified cost $212,267) | 212,624 |
| Receivables: | |
| Dividends | 364,174 |
| Portfolio shares sold | 1,821 |
| Securities lending | 1 |
| Other assets | 1,642 |
| Total assets | 229,927,850 |
| Liabilities |
| Payables: | |
| Foreign capital gains tax (See Note 2) | 449,247 |
| Manager (See Note 3) | 198,429 |
| Shareholder communication | 41,719 |
| Portfolio shares redeemed | 37,124 |
| Custodian | 36,837 |
| Professional fees | 35,485 |
| NYLIFE Distributors (See Note 3) | 15,390 |
| Accrued expenses | 12,654 |
| Total liabilities | 826,885 |
| Net assets | $229,100,965 |
| Composition of Net Assets |
| Shares of beneficial interest outstanding (par value of $.001 per share) unlimited number of shares authorized | $ 34,659 |
| Additional paid-in-capital | 293,345,862 |
| | 293,380,521 |
| Total distributable earnings (loss) | (64,279,556) |
| Net assets | $229,100,965 |
| Initial Class | |
| Net assets applicable to outstanding shares | $158,187,174 |
| Shares of beneficial interest outstanding | 23,950,353 |
| Net asset value per share outstanding | $ 6.60 |
| Service Class | |
| Net assets applicable to outstanding shares | $ 70,913,791 |
| Shares of beneficial interest outstanding | 10,708,848 |
| Net asset value per share outstanding | $ 6.62 |
The notes to the financial statements are an integral part of, and should be read in conjunction with, the financial statements.
15
Statement of Operations for the year ended December 31, 2022
| Investment Income (Loss) |
| Income | |
| Dividends (net of foreign tax withholding of $679,152) | $ 6,198,028 |
| Securities lending, net | 39,293 |
| Other | 10,730 |
| Total income | 6,248,051 |
| Expenses | |
| Manager (See Note 3) | 2,566,987 |
| Distribution/Service—Service Class (See Note 3) | 204,757 |
| Custodian | 199,464 |
| Professional fees | 129,955 |
| Shareholder communication | 35,666 |
| Trustees | 5,334 |
| Miscellaneous | 29,728 |
| Total expenses | 3,171,891 |
| Net investment income (loss) | 3,076,160 |
| Realized and Unrealized Gain (Loss) |
| Net realized gain (loss) on: | |
| Unaffiliated investment transactions(a) | (43,973,663) |
| Foreign currency transactions | (799,566) |
| Net realized gain (loss) | (44,773,229) |
| Net change in unrealized appreciation (depreciation) on: | |
| Unaffiliated investments(b) | (48,292,145) |
| Translation of other assets and liabilities in foreign currencies | (5,099) |
| Net change in unrealized appreciation (depreciation) | (48,297,244) |
| Net realized and unrealized gain (loss) | (93,070,473) |
| Net increase (decrease) in net assets resulting from operations | $(89,994,313) |
| (a) | Realized gain (loss) on security transactions recorded net of foreign capital gains tax in the amount of $(465,301). |
| (b) | Net change in unrealized appreciation (depreciation) on investments recorded net of foreign capital gains tax in the amount of $707,270. |
The notes to the financial statements are an integral part of, and should be read in conjunction with, the financial statements.
| 16 | MainStay VP Candriam Emerging Markets Equity Portfolio |
Statements of Changes in Net Assets
for the years ended December 31, 2022 and December 31, 2021
| | 2022 | 2021 |
| Increase (Decrease) in Net Assets |
| Operations: | | |
| Net investment income (loss) | $ 3,076,160 | $ 3,271,214 |
| Net realized gain (loss) | (44,773,229) | 64,476,023 |
| Net change in unrealized appreciation (depreciation) | (48,297,244) | (69,476,986) |
| Net increase (decrease) in net assets resulting from operations | (89,994,313) | (1,729,749) |
| Distributions to shareholders: | | |
| Initial Class | (25,368,728) | (2,442,858) |
| Service Class | (11,240,825) | (918,257) |
| Total distributions to shareholders | (36,609,553) | (3,361,115) |
| Capital share transactions: | | |
| Net proceeds from sales of shares | 25,988,468 | 9,154,592 |
| Net asset value of shares issued to shareholders in reinvestment of distributions | 36,609,553 | 3,361,115 |
| Cost of shares redeemed | (20,777,407) | (71,923,712) |
| Increase (decrease) in net assets derived from capital share transactions | 41,820,614 | (59,408,005) |
| Net increase (decrease) in net assets | (84,783,252) | (64,498,869) |
| Net Assets |
| Beginning of year | 313,884,217 | 378,383,086 |
| End of year | $229,100,965 | $313,884,217 |
The notes to the financial statements are an integral part of, and should be read in conjunction with, the financial statements.
17
Financial Highlights selected per share data and ratios
| | Year Ended December 31, |
| Initial Class | 2022 | | 2021 | | 2020 | | 2019 | | 2018 |
| Net asset value at beginning of year | $ 11.16 | | $ 11.51 | | $ 9.46 | | $ 7.99 | | $ 10.22 |
| Net investment income (loss) | 0.11 | | 0.12(a) | | 0.07(a) | | 0.19(a) | | 0.12(a) |
| Net realized and unrealized gain (loss) | (3.39) | | (0.34) | | 2.30 | | 1.41 | | (2.21) |
| Total from investment operations | (3.28) | | (0.22) | | 2.37 | | 1.60 | | (2.09) |
| Less distributions: | | | | | | | | | |
| From net investment income | (0.09) | | (0.13) | | (0.32) | | (0.13) | | (0.14) |
| From net realized gain on investments | (1.19) | | — | | — | | — | | — |
| Total distributions | (1.28) | | (0.13) | | (0.32) | | (0.13) | | (0.14) |
| Net asset value at end of year | $ 6.60 | | $ 11.16 | | $ 11.51 | | $ 9.46 | | $ 7.99 |
| Total investment return (b) | (28.72)% | | (2.00)% | | 25.71% | | 20.08% | | (20.55)% |
| Ratios (to average net assets)/Supplemental Data: | | | | | | | | | |
| Net investment income (loss) | 1.28% | | 1.02% | | 0.79% | | 2.18% | | 1.27% |
| Net expenses (c) | 1.16% | | 1.13% | | 1.18% | | 1.17% | | 1.16% |
| Expenses (before waiver/reimbursement) (c) | 1.16% | | 1.14% | | 1.18% | | 1.17% | | 1.16% |
| Portfolio turnover rate | 115% | | 63% | | 123% | | 121% | | 135% |
| Net assets at end of year (in 000's) | $ 158,187 | | $ 211,647 | | $ 257,933 | | $ 273,042 | | $ 371,834 |
| (a) | Per share data based on average shares outstanding during the year. |
| (b) | Total return does not reflect any deduction of sales charges, mortality and expense charges, contract charges or administrative charges. For periods of less than one year, total return is not annualized. |
| (c) | In addition to the fees and expenses which the Portfolio bears directly, it also indirectly bears a pro-rata share of the fees and expenses of the underlying funds in which it invests. Such indirect expenses are not included in the above expense ratios. |
| | Year Ended December 31, |
| Service Class | 2022 | | 2021 | | 2020 | | 2019 | | 2018 |
| Net asset value at beginning of year | $ 11.16 | | $ 11.52 | | $ 9.45 | | $ 7.98 | | $ 10.20 |
| Net investment income (loss) | 0.09 | | 0.09(a) | | 0.05(a) | | 0.17(a) | | 0.10(a) |
| Net realized and unrealized gain (loss) | (3.39) | | (0.35) | | 2.31 | | 1.40 | | (2.21) |
| Total from investment operations | (3.30) | | (0.26) | | 2.36 | | 1.57 | | (2.11) |
| Less distributions: | | | | | | | | | |
| From net investment income | (0.05) | | (0.10) | | (0.29) | | (0.10) | | (0.11) |
| From net realized gain on investments | (1.19) | | — | | — | | — | | — |
| Total distributions | (1.24) | | (0.10) | | (0.29) | | (0.10) | | (0.11) |
| Net asset value at end of year | $ 6.62 | | $ 11.16 | | $ 11.52 | | $ 9.45 | | $ 7.98 |
| Total investment return (b) | (28.89)% | | (2.25)% | | 25.40% | | 19.78% | | (20.74)% |
| Ratios (to average net assets)/Supplemental Data: | | | | | | | | | |
| Net investment income (loss) | 1.03% | | 0.78% | | 0.57% | | 2.00% | | 1.07% |
| Net expenses (c) | 1.41% | | 1.38% | | 1.43% | | 1.42% | | 1.41% |
| Expenses (before waiver/reimbursement) (c) | 1.41% | | 1.39% | | 1.43% | | 1.42% | | 1.41% |
| Portfolio turnover rate | 115% | | 63% | | 123% | | 121% | | 135% |
| Net assets at end of year (in 000's) | $ 70,914 | | $ 102,237 | | $ 120,450 | | $ 127,042 | | $ 131,498 |
| (a) | Per share data based on average shares outstanding during the year. |
| (b) | Total return does not reflect any deduction of sales charges, mortality and expense charges, contract charges or administrative charges. For periods of less than one year, total return is not annualized. |
| (c) | In addition to the fees and expenses which the Portfolio bears directly, it also indirectly bears a pro-rata share of the fees and expenses of the underlying funds in which it invests. Such indirect expenses are not included in the above expense ratios. |
The notes to the financial statements are an integral part of, and should be read in conjunction with, the financial statements.
| 18 | MainStay VP Candriam Emerging Markets Equity Portfolio |
Notes to Financial Statements
Note 1–Organization and Business
MainStay VP Funds Trust (the “Fund”) was organized as a Delaware statutory trust on February 1, 2011. The Fund is registered under the Investment Company Act of 1940, as amended (the “1940 Act”), as an open-end management investment company. The Fund is comprised of thirty-one separate series (collectively referred to as the “Portfolios”). These financial statements and notes relate to the MainStay VP Candriam Emerging Markets Equity Portfolio (the "Portfolio"), a "diversified” portfolio, as that term is defined in the 1940 Act, as interpreted or modified by regulatory authorities having jurisdiction, from time to time.
Shares of the Portfolio are currently offered to certain separate accounts to fund variable annuity policies and variable universal life insurance policies issued by New York Life Insurance and Annuity Corporation (“NYLIAC”), a wholly-owned subsidiary of New York Life Insurance Company (“New York Life”) and may also be offered to fund variable annuity policies and variable universal life insurance policies issued by other insurance companies. NYLIAC allocates shares of the Portfolio to, among others, certain NYLIAC separate accounts. Shares of the Portfolio are also offered to the MainStay VP Conservative Allocation Portfolio, MainStay VP Moderate Allocation Portfolio, MainStay VP Growth Allocation Portfolio and MainStay VP Equity Allocation Portfolio, which operate as “funds-of-funds," and other variable insurance funds.
The following table lists the Portfolio's share classes that have been registered and commenced operations:
| Class | Commenced Operations |
| Initial Class | February 17, 2012 |
| Service Class | February 17, 2012 |
Shares of the Portfolio are offered and are redeemed at a price equal to their respective net asset value (“NAV”) per share. No sales or redemption charge is applicable to the purchase or redemption of the Portfolio's shares. Under the terms of the Fund’s multiple class plan, adopted pursuant to Rule 18f-3 under the 1940 Act, the classes differ in that, among other things, Service Class shares of the Portfolio pay a combined distribution and service fee of 0.25% of average daily net assets attributable to Service Class shares of the Portfolio to the Distributor (as defined in Note 3(B)) pursuant to a plan adopted in accordance with Rule 12b-1 under the 1940 Act. Contract owners of variable annuity contracts purchased after June 2, 2003, are permitted to invest only in the Service Class shares.
The Portfolio's investment objective is to seek long-term capital appreciation.
Note 2–Significant Accounting Policies
The Portfolio is an investment company and accordingly follows the investment company accounting and reporting guidance of the Financial Accounting Standards Board (“FASB”) Accounting Standards Codification Topic 946 Financial Services—Investment Companies. The Portfolio prepares its financial statements in accordance with generally accepted
accounting principles (“GAAP”) in the United States of America and follows the significant accounting policies described below.
(A) Securities Valuation. Investments are usually valued as of the close of regular trading on the New York Stock Exchange (the "Exchange") (usually 4:00 p.m. Eastern time) on each day the Portfolio is open for business ("valuation date").
Effective September 8, 2022, and pursuant to Rule 2a-5 under the 1940 Act, the Board of Trustees of the Fund (the "Board") designated New York Life Investment Management LLC (“New York Life Investments” or the "Manager") as its Valuation Designee (the "Valuation Designee"). The Valuation Designee is responsible for performing fair valuations relating to all investments in the Portfolio’s portfolio for which market quotations are not readily available; periodically assessing and managing material valuation risks; establishing and applying fair value methodologies; testing fair valuation methodologies; evaluating and overseeing pricing services; ensuring appropriate segregation of valuation and portfolio management functions; providing quarterly, annual and prompt reporting to the Board, as appropriate; identifying potential conflicts of interest; and maintaining appropriate records. The Valuation Designee has established a valuation committee ("Valuation Committee") to assist in carrying out the Valuation Designee’s responsibilities and establish prices of securities for which market quotations are not readily available. The Portfolio’s and the Valuation Designee's policies and procedures ("Valuation Procedures") govern the Valuation Designee’s selection and application of methodologies for determining and calculating the fair value of Portfolio investments. The Valuation Designee may value the Portfolio's portfolio securities for which market quotations are not readily available and other Portfolio assets utilizing inputs from pricing services and other third-party sources (together, “Pricing Sources”). The Valuation Committee meets (in person, via electronic mail or via teleconference) on an ad-hoc basis to determine fair valuations and on a quarterly basis to review fair value events with respect to certain securities for which market quotations are not readily available, including valuation risks and back-testing results, and preview reports to the Board.
The Valuation Committee establishes prices of securities for which market quotations are not readily available based on such methodologies and measurements on a regular basis after considering information that is reasonably available and deemed relevant by the Valuation Committee. The Board shall oversee the Valuation Designee and review fair valuation materials on a prompt, quarterly and annual basis and approve proposed revisions to the Valuation Procedures.
Investments for which market quotations are not readily available are valued at fair value as determined in good faith pursuant to the Valuation Procedures. A market quotation is readily available only when that quotation is a quoted price (unadjusted) in active markets for identical investments that the Portfolio can access at the measurement date, provided that a quotation will not be readily available if it is not reliable. "Fair value" is defined as the price the Portfolio would reasonably expect to receive upon selling an asset or liability in an orderly transaction to an independent buyer in the principal or most advantageous market for the
Notes to Financial Statements (continued)
asset or liability. Fair value measurements are determined within a framework that establishes a three-tier hierarchy that maximizes the use of observable market data and minimizes the use of unobservable inputs to establish a classification of fair value measurements for disclosure purposes. "Inputs" refer broadly to the assumptions that market participants would use in pricing the asset or liability, including assumptions about risk, such as the risk inherent in a particular valuation technique used to measure fair value using a pricing model and/or the risk inherent in the inputs for the valuation technique. Inputs may be observable or unobservable. Observable inputs reflect the assumptions market participants would use in pricing the asset or liability based on market data obtained from sources independent of the Portfolio. Unobservable inputs reflect the Portfolio’s own assumptions about the assumptions market participants would use in pricing the asset or liability based on the information available. The inputs or methodology used for valuing assets or liabilities may not be an indication of the risks associated with investing in those assets or liabilities. The three-tier hierarchy of inputs is summarized below.
| • | Level 1—quoted prices (unadjusted) in active markets for an identical asset or liability |
| • | Level 2—other significant observable inputs (including quoted prices for a similar asset or liability in active markets, interest rates and yield curves, prepayment speeds, credit risk, etc.) |
| • | Level 3—significant unobservable inputs (including the Portfolio's own assumptions about the assumptions that market participants would use in measuring fair value of an asset or liability) |
The level of an asset or liability within the fair value hierarchy is based on the lowest level of an input, both individually and in the aggregate, that is significant to the fair value measurement. The aggregate value by input level of the Portfolio’s assets and liabilities as of December 31, 2022, is included at the end of the Portfolio of Investments.
The Portfolio may use third-party vendor evaluations, whose prices may be derived from one or more of the following standard inputs, among others:
| • Broker/dealer quotes | • Benchmark securities |
| • Two-sided markets | • Reference data (corporate actions or material event notices) |
| • Bids/offers | • Monthly payment information |
| • Industry and economic events | • Reported trades |
An asset or liability for which a market quotation is not readily available is valued by methods deemed reasonable in good faith by the Valuation Committee, following the Valuation Procedures to represent fair value. Under these procedures, the Valuation Designee generally uses a market-based approach which may use related or comparable assets or liabilities, recent transactions, market multiples, book values and other relevant information. The Valuation Designee may also use an income-based valuation approach in which the anticipated future cash flows of the asset or liability are discounted to calculate fair value.
Discounts may also be applied due to the nature and/or duration of any restrictions on the disposition of the asset or liability. Fair value represents a good faith approximation of the value of a security. Fair value determinations involve the consideration of a number of subjective factors, an analysis of applicable facts and circumstances and the exercise of judgment. As a result, it is possible that the fair value for a security determined in good faith in accordance with the Valuation Procedures may differ from valuations for the same security determined for other funds using their own valuation procedures. Although the Valuation Procedures are designed to value a security at the price the Portfolio may reasonably expect to receive upon the security's sale in an orderly transaction, there can be no assurance that any fair value determination thereunder would, in fact, approximate the amount that the Portfolio would actually realize upon the sale of the security or the price at which the security would trade if a reliable market price were readily available. During the year ended December 31, 2022, there were no material changes to the fair value methodologies.
Securities which may be valued in this manner include, but are not limited to: (i) a security for which trading has been halted or suspended or otherwise does not have a readily available market quotation on a given day; (ii) a debt security that has recently gone into default and for which there is not a current market quotation; (iii) a security of an issuer that has entered into a restructuring; (iv) a security that has been delisted from a national exchange; (v) a security subject to trading collars for which no or limited trading takes place; and (vi) a security whose principal market has been temporarily closed at a time when, under normal conditions, it would be open. Securities valued in this manner are generally categorized as Level 2 or 3 in the hierarchy.
Certain securities held by the Portfolio may principally trade in foreign markets. Events may occur between the time the foreign markets close and the time at which the Portfolio's NAVs are calculated. These events may include, but are not limited to, situations relating to a single issuer in a market sector, significant fluctuations in U.S. or foreign markets, natural disasters, armed conflicts, governmental actions or other developments not tied directly to the securities markets. Should the Valuation Designee conclude that such events may have affected the accuracy of the last price of such securities reported on the local foreign market, the Valuation Designee may, pursuant to the Valuation Procedures, adjust the value of the local price to reflect the estimated impact on the price of such securities as a result of such events. In this instance, securities are generally categorized as Level 3 in the hierarchy. Additionally, certain foreign equity securities are also fair valued whenever the movement of a particular index exceeds certain thresholds. In such cases, the securities are fair valued by applying factors provided by a third-party vendor in accordance with the Valuation Procedures and are generally categorized as Level 2 in the hierarchy. Securities that were fair valued in such a manner as of December 31, 2022, are shown in the Portfolio of Investments.
If the principal market of certain foreign equity securities is closed in observance of a local foreign holiday, these securities are valued using the last closing price of regular trading on the relevant exchange and fair
| 20 | MainStay VP Candriam Emerging Markets Equity Portfolio |
valued by applying factors provided by a third-party vendor in accordance with the Valuation Procedures. These securities are generally categorized as Level 2 in the hierarchy. Securities that were fair valued in such a manner as of December 31, 2022, are shown in the Portfolio of Investments.
Equity securities are valued at the last quoted sales prices as of the close of regular trading on the relevant exchange on each valuation date. Securities that are not traded on the valuation date are valued at the mean of the last quoted bid and ask prices. Prices are normally taken from the principal market in which each security trades. These securities are generally categorized as Level 1 in the hierarchy.
The information above is not intended to reflect an exhaustive list of the methodologies that may be used to value portfolio investments. The Valuation Procedures permit the use of a variety of valuation methodologies in connection with valuing portfolio investments. The methodology used for a specific type of investment may vary based on the market data available or other considerations. The methodologies summarized above may not represent the specific means by which portfolio investments are valued on any particular business day.
(B) Income Taxes. The Portfolio's policy is to comply with the requirements of the Internal Revenue Code of 1986, as amended (the “Internal Revenue Code”), applicable to regulated investment companies and to distribute all of its taxable income to the shareholders of the Portfolio within the allowable time limits.
The Manager evaluates the Portfolio’s tax positions to determine if the tax positions taken meet the minimum recognition threshold in connection with accounting for uncertainties in income tax positions taken or expected to be taken for the purposes of measuring and recognizing tax liabilities in the financial statements. Recognition of tax benefits of an uncertain tax position is permitted only to the extent the position is “more likely than not” to be sustained assuming examination by taxing authorities. The Manager analyzed the Portfolio's tax positions taken on federal, state and local income tax returns for all open tax years (for up to three tax years) and has concluded that no provisions for federal, state and local income tax are required in the Portfolio's financial statements. The Portfolio's federal, state and local income tax and federal excise tax returns for tax years for which the applicable statutes of limitations have not expired are subject to examination by the Internal Revenue Service and state and local departments of revenue.
(C) Foreign Taxes. The Portfolio may be subject to foreign taxes on income and other transaction-based taxes imposed by certain countries in which it invests. A portion of the taxes on gains on investments or currency purchases/repatriation may be reclaimable. The Portfolio will accrue such taxes and reclaims as applicable, based upon its current interpretation of tax rules and regulations that exist in the markets in which it invests.
The Portfolio may be subject to taxation on realized capital gains, repatriation proceeds and other transaction-based taxes imposed by certain countries in which it invests. The Portfolio will accrue such taxes
as applicable based upon its current interpretation of tax rules and regulations that exist in the market in which it invests. Capital gains taxes relating to positions still held are reflected as a liability in the Statement of Assets and Liabilities, as well as an adjustment to the Portfolio's net unrealized appreciation (depreciation). Taxes related to capital gains realized, if any, are reflected as part of net realized gain (loss) in the Statement of Operations. Changes in tax liabilities related to capital gains taxes on unrealized investment gains, if any, are reflected as part of the change in net unrealized appreciation (depreciation) on investments in the Statement of Operations. Transaction-based charges are generally assessed as a percentage of the transaction amount.
(D) Dividends and Distributions to Shareholders. Dividends and distributions are recorded on the ex-dividend date. The Portfolio intends to declare and pay dividends from net investment income and distributions from net realized capital and currency gains, if any, at least annually. All dividends and distributions are reinvested at NAV in the same class of shares of the Portfolio. Dividends and distributions to shareholders are determined in accordance with federal income tax regulations and may differ from determinations using GAAP.
(E) Security Transactions and Investment Income. The Portfolio records security transactions on the trade date. Realized gains and losses on security transactions are determined using the identified cost method. Dividend income is recognized on the ex-dividend date, net of any foreign tax withheld at the source, and interest income is accrued as earned using the effective interest rate method. Distributions received from real estate investment trusts may be classified as dividends, capital gains and/or return of capital.
Investment income and realized and unrealized gains and losses on investments of the Portfolio are allocated pro rata to the separate classes of shares based upon their relative net assets on the date the income is earned or realized and unrealized gains and losses are incurred.
(F) Expenses. Expenses of the Fund are allocated to the individual Portfolios in proportion to the net assets of the respective Portfolios when the expenses are incurred, except where direct allocations of expenses can be made. Expenses (other than fees incurred under the distribution and service plans, further discussed in Note 3(B), which are charged directly to the Service Class shares) are allocated to separate classes of shares pro rata based upon their relative net assets on the date the expenses are incurred. The expenses borne by the Portfolio, including those of related parties to the Portfolio, are shown in the Statement of Operations.
Additionally, the Portfolio may invest in mutual funds, which are subject to management fees and other fees that may cause the costs of investing in mutual funds to be greater than the costs of owning the underlying securities directly. These indirect expenses of mutual funds are not included in the amounts shown as expenses in the Statement of Operations or in the expense ratios included in the Financial Highlights.
Notes to Financial Statements (continued)
(G) Use of Estimates. In preparing financial statements in conformity with GAAP, the Manager makes estimates and assumptions that affect the reported amounts and disclosures in the financial statements. Actual results could differ from those estimates and assumptions.
(H) Foreign Currency Transactions. The Portfolio's books and records are maintained in U.S. dollars. Prices of securities denominated in foreign currency amounts are translated into U.S. dollars at the mean between the buying and selling rates last quoted by any major U.S. bank at the following dates:
(i) market value of investment securities, other assets and liabilities— at the valuation date; and
(ii) purchases and sales of investment securities, income and expenses—at the date of such transactions.
The assets and liabilities that are denominated in foreign currency amounts are presented at the exchange rates and market values at the close of the period. The realized and unrealized changes in net assets arising from fluctuations in exchange rates and market prices of securities are not separately presented.
Net realized gain (loss) on foreign currency transactions represents net currency gains or losses realized as a result of differences between the amounts of securities sale proceeds or purchase cost, dividends, interest and withholding taxes as recorded on the Portfolio's books, and the U.S. dollar equivalent amount actually received or paid. Net currency gains or losses from valuing such foreign currency denominated assets and liabilities, other than investments at valuation date exchange rates, are reflected in unrealized foreign exchange gains or losses.
(I) Securities Sold Short. During the period a short position is open, depending on the nature and type of security, a short position is reflected as a liability and is marked to market in accordance with the valuation methodologies previously detailed (See Note 2(A)). Liabilities for securities sold short are closed out by purchasing the applicable securities for delivery to the counterparty broker. A gain, limited to the price at which the Portfolio sold the security short, or a loss, unlimited as to dollar amount, will be recognized upon termination of a short sale if the market price on the date the short position is closed out is less or greater, respectively, than the proceeds originally received. Any such gain or loss may be offset, completely or in part, by the change in the value of the hedged investments. Interest on short positions held is accrued daily, while dividends declared on short positions existing on the record date are recorded on the ex-dividend date as a dividend expense in the Statement of Operations. Broker fees and other expenses related to securities sold short are disclosed in the Statement of Operations. Short sales involve risk of loss in excess of the related amounts reflected in the Statement of Assets and Liabilities. As of December 31, 2022, the Portfolio did not enter into any securities sold short.
(J) Securities Lending. In order to realize additional income, the Portfolio may engage in securities lending, subject to the limitations set forth in the 1940 Act and relevant guidance by the staff of the Securities
and Exchange Commission (“SEC”). If the Portfolio engages in securities lending, the Portfolio will lend through its custodian, JPMorgan Chase Bank, N.A., ("JPMorgan"), acting as securities lending agent on behalf of the Portfolio. Under the current arrangement, JPMorgan will manage the Portfolio's collateral in accordance with the securities lending agency agreement between the Portfolio and JPMorgan, and indemnify the Portfolio against counterparty risk. The loans will be collateralized by cash (which may be invested in a money market fund) and/or non-cash collateral (which may include U.S. Treasury securities and/or U.S. government agency securities issued or guaranteed by the United States government or its agencies or instrumentalities) at least equal at all times to the market value of the securities loaned. Non-cash collateral held at year end is segregated and cannot be transferred by the Portfolio. The Portfolio bears the risk of delay in recovery of, or loss of rights in, the securities loaned. The Portfolio may also record a realized gain or loss on securities deemed sold due to a borrower’s inability to return securities on loan. The Portfolio bears the risk of any loss on investment of cash collateral. The Portfolio will receive compensation for lending its securities in the form of fees or it will retain a portion of interest earned on the investment of any cash collateral. The Portfolio will also continue to receive interest and dividends on the securities loaned and any gain or loss in the market price of the securities loaned that may occur during the term of the loan will be for the account of the Portfolio. Income earned from securities lending activities, if any, is reflected in the Statement of Operations. Securities on loan as of December 31, 2022, are shown in the Portfolio of Investments.
(K) Rights and Warrants. Rights are certificates that permit the holder to purchase a certain number of shares, or a fractional share, of a new stock from the issuer at a specific price. Warrants are instruments that entitle the holder to buy an equity security at a specific price for a specific period of time. These investments can provide a greater potential for profit or loss than an equivalent investment in the underlying security. Prices of these investments do not necessarily move in tandem with the prices of the underlying securities.
There is risk involved in the purchase of rights and warrants in that these investments are speculative investments. The Portfolio could also lose the entire value of its investment in warrants if such warrants are not exercised by the date of its expiration. The Portfolio is exposed to risk until the sale or exercise of each right or warrant is completed. Rights and Warrants as of December 31, 2022 are shown in the Portfolio of Investments.
(L) Foreign Securities Risk. The Portfolio may invest in foreign securities, which carry certain risks that are in addition to the usual risks inherent in domestic securities. These risks include those resulting from currency fluctuations, future adverse political or economic developments and possible imposition of currency exchange blockages or other foreign governmental laws or restrictions. These risks are likely to be greater in emerging markets than in developed markets. The ability of issuers of debt securities held by the Portfolio to meet their obligations may be affected by, among other things, economic or political developments in a
| 22 | MainStay VP Candriam Emerging Markets Equity Portfolio |
specific country, industry or region. For example, the Portfolio has significant investments in the Asia-Pacific region. The development and stability of the Asia-Pacific region can be adversely affected by, among other regional and global developments, trade barriers, exchange controls and other measures imposed or negotiated by the countries with which they trade. Some Asia-Pacific countries can be characterized as emerging markets or newly industrialized and may experience more volatile economic cycles and less liquid markets than developed countries.
(M) Indemnifications. Under the Fund’s organizational documents, its officers and trustees are indemnified against certain liabilities that may arise out of performance of their duties to the Fund. Additionally, in the normal course of business, the Portfolio enters into contracts with third-party service providers that contain a variety of representations and warranties and that may provide general indemnifications. The Portfolio's maximum exposure under these arrangements is unknown, as this would involve future claims that may be made against the Portfolio that have not yet occurred. The Manager believes that the risk of loss in connection with these potential indemnification obligations is remote. However, there can be no assurance that material liabilities related to such obligations will not arise in the future, which could adversely impact the Portfolio.
Note 3–Fees and Related Party Transactions
(A) Manager and Subadvisor. New York Life Investments, a registered investment adviser and an indirect, wholly-owned subsidiary of New York Life, serves as the Portfolio's Manager, pursuant to an Amended and Restated Management Agreement (“Management Agreement”). The Manager provides offices, conducts clerical, recordkeeping and bookkeeping services and keeps most of the financial and accounting records required to be maintained by the Portfolio. Except for the portion of salaries and expenses that are the responsibility of the Portfolio, the Manager pays the salaries and expenses of all personnel affiliated with the Portfolio and certain operational expenses of the Portfolio. During a portion of the year ended December 31, 2022, the Portfolio reimbursed New York Life Investments in an amount equal to the portion of the compensation of the Chief Compliance Officer attributable to the Portfolio. Candriam (the "Subadvisor"), a registered investment adviser and an indirect, wholly-owned subsidiary of New York Life, serves as the Subadvisor to the Portfolio and is responsible for the day-to-day portfolio management of the Portfolio. Pursuant to the terms of an Amended and Restated Subadvisory Agreement between New York Life Investments and Candriam, New York Life Investments pays for the services of the Subadvisor.
Pursuant to the Management Agreement, the Fund pays the Manager, on behalf of the Portfolio, a monthly fee for the services performed and the facilities furnished at an annual rate of the Portfolio's average daily net assets as follows: 1.00% up to $1 billion; and 0.975% in excess of $1 billion. During the year ended December 31, 2022, the effective management fee rate was 1.00%.
During the year ended December 31, 2022, New York Life Investments earned fees from the Portfolio in the amount of $2,566,987 and paid the Subadvisor fees of $1,283,493.
JPMorgan provides sub-administration and sub-accounting services to the Portfolio pursuant to an agreement with New York Life Investments. These services include calculating the daily NAVs of the Portfolio, maintaining the general ledger and sub-ledger accounts for the calculation of the Portfolio's NAVs, and assisting New York Life Investments in conducting various aspects of the Portfolio's administrative operations. For providing these services to the Portfolio, JPMorgan is compensated by New York Life Investments.
Pursuant to an agreement between the Fund and New York Life Investments, New York Life Investments is responsible for providing or procuring certain regulatory reporting services for the Portfolio. The Portfolio will reimburse New York Life Investments for the actual costs incurred by New York Life Investments in connection with providing or procuring these services for the Portfolio.
(B) Distribution and Service Fees. The Fund, on behalf of the Portfolio, has entered into a distribution agreement with NYLIFE Distributors LLC (the “Distributor”), an affiliate of New York Life Investments. The Portfolio has adopted a distribution plan (the “Plan”) in accordance with the provisions of Rule 12b-1 under the 1940 Act. Under the Plan, the Distributor has agreed to provide, through its affiliates or independent third parties, various distribution-related, shareholder and administrative support services to the Service Class shareholders. For its services, the Distributor is entitled to a combined distribution and service fee accrued daily and paid monthly at an annual rate of 0.25% of the average daily net assets attributable to the Service Class shares of the Portfolio.
Note 4-Federal Income Tax
As of December 31, 2022, the cost and unrealized appreciation (depreciation) of the Portfolio’s investment portfolio, including applicable derivative contracts and other financial instruments, as determined on a federal income tax basis, were as follows:
| | Federal Tax
Cost | Gross
Unrealized
Appreciation | Gross
Unrealized
(Depreciation) | Net
Unrealized
Appreciation/
(Depreciation) |
| Investments in Securities | $249,888,413 | $9,950,680 | $(34,628,520) | $(24,677,840) |
As of December 31, 2022, the components of accumulated gain (loss) on a tax basis were as follows:
Ordinary
Income | Accumulated
Capital
and Other
Gain (Loss) | Other
Temporary
Differences | Unrealized
Appreciation
(Depreciation) | Total
Accumulated
Gain (Loss) |
| $3,602,062 | $(42,748,843) | $— | $(25,132,775) | $(64,279,556) |
Notes to Financial Statements (continued)
The difference between book-basis and tax-basis unrealized appreciation (depreciation) is primarily due to wash sale adjustments and Passive Foreign Investment Company (“PFIC”) adjustments.
As of December 31, 2022, for federal income tax purposes, capital loss carryforwards of $42,748,843, as shown in the table below, were available to the extent provided by the regulations to offset future realized gains of the Portfolio. Accordingly, no capital gains distributions are expected to be paid to shareholders until net gains have been realized in excess of such amounts.
Capital Loss
Available Through | Short-Term
Capital Loss
Amounts (000’s) | Long-Term
Capital Loss
Amounts (000’s) |
| Unlimited | $42,749 | $— |
During the years ended December 31, 2022 and December 31, 2021, the tax character of distributions paid as reflected in the Statements of Changes in Net Assets was as follows:
| | 2022 | 2021 |
| Distributions paid from: | | |
| Ordinary Income | $ 2,194,677 | $3,361,115 |
| Long-Term Capital Gains | 34,414,876 | — |
| Total | $36,609,553 | $3,361,115 |
Note 5–Custodian
JPMorgan is the custodian of cash and securities held by the Portfolio. Custodial fees are charged to the Portfolio based on the Portfolio's net assets and/or the market value of securities held by the Portfolio and the number of certain transactions incurred by the Portfolio.
Note 6–Line of Credit
The Portfolio and certain other funds managed by New York Life Investments maintain a line of credit with a syndicate of banks in order to secure a source of funds for temporary purposes to meet unanticipated or excessive redemption requests.
Effective July 26, 2022, under the credit agreement (the “Credit Agreement”), the aggregate commitment amount is $600,000,000 with an additional uncommitted amount of $100,000,000. The commitment fee is an annual rate of 0.15% of the average commitment amount payable quarterly, regardless of usage, to JPMorgan, who serves as the agent to the syndicate. The commitment fee is allocated among the Portfolio and certain other funds managed by New York Life Investments based upon their respective net assets and other factors. Interest on any revolving credit loan is charged based upon the Federal Funds Rate, Daily Simple Secured Overnight Financing Rate ("SOFR") + 0.10%, or the Overnight Bank Funding Rate, whichever is higher. The Credit Agreement expires on July 25, 2023, although the Portfolio, certain other funds managed by New York Life Investments and the syndicate of banks may renew the Credit Agreement for an additional year on the same or different terms or enter into a credit agreement with a different syndicate of banks. Prior to July 26, 2022, the aggregate commitment amount and
the commitment fee were the same as those under the current Credit Agreement. During the year ended December 31, 2022, there were no borrowings made or outstanding with respect to the Portfolio under the Credit Agreement.
Note 7–Interfund Lending Program
Pursuant to an exemptive order issued by the SEC, the Portfolio, along with certain other funds managed by New York Life Investments, may participate in an interfund lending program. The interfund lending program provides an alternative credit facility that permits the Portfolio and certain other funds managed by New York Life Investments to lend or borrow money for temporary purposes directly to or from one another, subject to the conditions of the exemptive order. During the year ended December 31, 2022, there were no interfund loans made or outstanding with respect to the Portfolio.
Note 8–Purchases and Sales of Securities (in 000’s)
During the year ended December 31, 2022, purchases and sales of securities, other than short-term securities, were $305,076 and $288,775, respectively.
Note 9–Capital Share Transactions
Transactions in capital shares for the years ended December 31, 2022 and December 31, 2021, were as follows:
| Initial Class | Shares | Amount |
| Year ended December 31, 2022: | | |
| Shares sold | 1,945,628 | $ 16,657,111 |
| Shares issued to shareholders in reinvestment of distributions | 4,039,028 | 25,368,728 |
| Shares redeemed | (1,007,338) | (9,209,477) |
| Net increase (decrease) | 4,977,318 | $ 32,816,362 |
| Year ended December 31, 2021: | | |
| Shares sold | 315,010 | $ 3,698,083 |
| Shares issued to shareholders in reinvestment of distributions | 214,431 | 2,442,858 |
| Shares redeemed | (3,958,545) | (49,469,268) |
| Net increase (decrease) | (3,429,104) | $(43,328,327) |
| |
| 24 | MainStay VP Candriam Emerging Markets Equity Portfolio |
| Service Class | Shares | Amount |
| Year ended December 31, 2022: | | |
| Shares sold | 1,068,938 | $ 9,331,357 |
| Shares issued to shareholders in reinvestment of distributions | 1,784,088 | 11,240,825 |
| Shares redeemed | (1,305,553) | (11,567,930) |
| Net increase (decrease) | 1,547,473 | $ 9,004,252 |
| Year ended December 31, 2021: | | |
| Shares sold | 467,105 | $ 5,456,509 |
| Shares issued to shareholders in reinvestment of distributions | 80,524 | 918,257 |
| Shares redeemed | (1,844,742) | (22,454,444) |
| Net increase (decrease) | (1,297,113) | $(16,079,678) |
Note 10–Other Matters
As of the date of this report, interest rates in the United States and many parts of the world, including certain European countries, are ascending from historically low levels. Thus, the Portfolio currently faces a heightened level of risk associated with rising interest rates. This could be driven by a variety of factors, including but not limited to central bank monetary policies, changing inflation or real growth rates, general economic conditions, increasing bond issuances or reduced market demand for low yielding investments.
An outbreak of COVID-19, first detected in December 2019, has developed into a global pandemic and has resulted in travel restrictions, closure of international borders, certain businesses and securities markets, restrictions on securities trading activities, prolonged quarantines, supply chain disruptions, and lower consumer demand, as well as general concern and uncertainty. In 2022, many countries lifted some or all restrictions related to COVID-19. However, the continued impact of COVID-19 and related variants is uncertain and could further adversely affect the global economy, national economies, individual issuers and capital markets in unforeseeable ways and result in a substantial and extended economic downturn. Developments that disrupt global economies and financial markets, such as COVID-19, may magnify factors that affect the Portfolio's performance.
Note 11–Subsequent Events
In connection with the preparation of the financial statements of the Portfolio as of and for the year ended December 31, 2022, events and transactions subsequent to December 31, 2022, through the date the financial statements were issued have been evaluated by the Manager for possible adjustment and/or disclosure. No subsequent events requiring financial statement adjustment or disclosure have been identified.
Report of Independent Registered Public Accounting Firm
To the Board of Trustees of MainStay VP Funds Trust and Shareholders of
MainStay VP Candriam Emerging Markets Equity Portfolio
Opinion on the Financial Statements
We have audited the accompanying statement of assets and liabilities, including the portfolio of investments, of MainStay VP Candriam Emerging Markets Equity Portfolio (one of the portfolios constituting MainStay VP Funds Trust, referred to hereafter as the “Portfolio”) as of December 31, 2022, the related statement of operations for the year ended December 31, 2022, the statements of changes in net assets for each of the two years in the period ended December 31, 2022, including the related notes, and the financial highlights for each of the five years in the period ended December 31, 2022 (collectively referred to as the “financial statements”). In our opinion, the financial statements present fairly, in all material respects, the financial position of the Portfolio as of December 31, 2022, the results of its operations for the year then ended, the changes in its net assets for each of the two years in the period ended December 31, 2022 and the financial highlights for each of the five years in the period ended December 31, 2022 in conformity with accounting principles generally accepted in the United States of America.
Basis for Opinion
These financial statements are the responsibility of the Portfolio’s management. Our responsibility is to express an opinion on the Portfolio’s financial statements based on our audits. We are a public accounting firm registered with the Public Company Accounting Oversight Board (United States) (PCAOB) and are required to be independent with respect to the Portfolio in accordance with the U.S. federal securities laws and the applicable rules and regulations of the Securities and Exchange Commission and the PCAOB.
We conducted our audits of these financial statements in accordance with the standards of the PCAOB. Those standards require that we plan and perform the audit to obtain reasonable assurance about whether the financial statements are free of material misstatement, whether due to error or fraud.
Our audits included performing procedures to assess the risks of material misstatement of the financial statements, whether due to error or fraud, and performing procedures that respond to those risks. Such procedures included examining, on a test basis, evidence regarding the amounts and disclosures in the financial statements. Our audits also included evaluating the accounting principles used and significant estimates made by management, as well as evaluating the overall presentation of the financial statements. Our procedures included confirmation of securities owned as of December 31, 2022 by correspondence with the custodian. We believe that our audits provide a reasonable basis for our opinion.
/s/PricewaterhouseCoopers LLP
New York, New York
February 24, 2023
We have served as the auditor of one or more investment companies in the MainStay group of funds since 1984.
| 26 | MainStay VP Candriam Emerging Markets Equity Portfolio |
Board Consideration and Approval of Management Agreement and Subadvisory Agreement (Unaudited)
The continuation of the Management Agreement with respect to the MainStay VP Candriam Emerging Markets Equity Portfolio (“Portfolio”) and New York Life Investment Management LLC (“New York Life Investments”) and the Subadvisory Agreement between New York Life Investments and Candriam with respect to the Portfolio (together, “Advisory Agreements”) is subject to annual review and approval by the Board of Trustees of MainStay VP Funds Trust (“Board” of the “Trust”) in accordance with Section 15 of the Investment Company Act of 1940, as amended (“1940 Act”). At its December 6–7, 2022 meeting, the Board, which is comprised solely of Trustees who are not an “interested person” (as such term is defined in the 1940 Act) of the Trust (“Independent Trustees”), unanimously approved the continuation of each of the Advisory Agreements for a one-year period.
In reaching the decision to approve the continuation of each of the Advisory Agreements, the Board considered information and materials furnished by New York Life Investments and Candriam in connection with an annual contract review process undertaken by the Board that took place at meetings of the Board and its Contracts Committee during October 2022 through December 2022, including information and materials furnished by New York Life Investments and Candriam in response to requests prepared on behalf of the Board, and in consultation with the Board, by independent legal counsel to the Independent Trustees, which encompassed a variety of topics, including those summarized below. Information and materials requested by and furnished to the Board for consideration in connection with the contract review process included, among other items, reports on the Portfolio and “peer funds” prepared by Institutional Shareholder Services Inc. (“ISS”), an independent third-party service provider engaged by the Board to report objectively on the Portfolio’s investment performance, management fee and total expenses. The Board also considered information on the fees charged to other investment advisory clients of New York Life Investments and/or Candriam that follow investment strategies similar to those of the Portfolio, if any, and, when applicable, the rationale for any differences in the Portfolio’s management and subadvisory fees and the fees charged to those other investment advisory clients. In addition, the Board considered information regarding the legal standards and fiduciary obligations applicable to its consideration of the continuation of each of the Advisory Agreements. The contract review process, including the structure and format for information and materials provided to the Board, has been developed in consultation with the Board. The Independent Trustees also met in executive sessions with their independent legal counsel and, for portions thereof, with senior management of New York Life Investments.
The Board’s deliberations with respect to the continuation of each of the Advisory Agreements reflect a year-long process, and the Board also took into account information furnished to the Board and its Committees throughout the year, as deemed relevant and appropriate by the Trustees, including, among other items, reports on investment performance of the Portfolio and investment-related matters for the Portfolio as well as presentations from New York Life Investments and, generally annually, Candriam personnel. In addition, the Board took into account other information received from New York Life Investments throughout the year,
including, among other items, periodic reports on legal and compliance matters, risk management, portfolio turnover, brokerage commissions and non-advisory services provided to the Portfolio by New York Life Investments, as deemed relevant and appropriate by the Trustees.
In addition to information provided to the Board throughout the year, the Board received information in connection with its June 2022 meeting provided specifically in response to requests prepared on behalf of the Board, and in consultation with the Board, by independent legal counsel to the Independent Trustees regarding the Portfolio’s distribution arrangements. In addition, the Board received information regarding the Portfolio’s asset levels, share purchase and redemption activity and the payment of Rule 12b-1 and/or other fees by the applicable share classes of the Portfolio, among other information.
In considering the continuation of each of the Advisory Agreements, the Trustees reviewed and evaluated the information and factors they believed to reasonably be necessary and appropriate in light of legal advice furnished to them by independent legal counsel to the Independent Trustees and through the exercise of their own business judgment. Although individual Trustees may have weighed certain factors or information differently and the Board did not consider any single factor or information controlling in reaching its decision, the factors considered by the Board are summarized in more detail below and include, among other factors: (i) the nature, extent and quality of the services provided to the Portfolio by New York Life Investments and Candriam; (ii) the qualifications of the portfolio managers of the Portfolio and the historical investment performance of the Portfolio, New York Life Investments and Candriam; (iii) the costs of the services provided, and profits realized, by New York Life Investments and Candriam with respect to their relationships with the Portfolio; (iv) the extent to which economies of scale have been realized or may be realized if the Portfolio grows and the extent to which any economies of scale have been shared, have benefited or may benefit the Portfolio’s shareholders; and (v) the reasonableness of the Portfolio’s management and subadvisory fees and total ordinary operating expenses. Although the Board recognized that comparisons between the Portfolio’s fees and expenses and those of other funds are imprecise given different terms of agreements, variations in fund strategies and other factors, the Board considered the reasonableness of the Portfolio’s management fee and total ordinary operating expenses as compared to the peer funds identified by ISS. Throughout their considerations, the Trustees acknowledged the commitment of New York Life Investments and its affiliates to serve the MainStay Group of Funds, as well as their capacity, experience, resources, financial stability and reputations. The Trustees also acknowledged the entrepreneurial and other risks assumed by New York Life Investments in sponsoring and managing the Portfolio. With respect to the Subadvisory Agreement, the Board took into account New York Life Investments’ recommendation to approve the continuation of the Subadvisory Agreement.
The Trustees noted that, throughout the year, the Trustees are afforded an opportunity to ask questions of, and request additional information or materials from, New York Life Investments and Candriam. The Board’s decision with respect to each of the Advisory Agreements may have also
Board Consideration and Approval of Management Agreement and Subadvisory Agreement (Unaudited) (continued)
been based, in part, on the Board’s knowledge of New York Life Investments and Candriam resulting from, among other things, the Board’s consideration of each of the Advisory Agreements in prior years, the advisory agreements for other funds in the MainStay Group of Funds, the Board’s review throughout the year of the performance and operations of other funds in the MainStay Group of Funds and each Trustee’s business judgment and industry experience. In addition to considering the above-referenced factors, the Board observed that in the marketplace, notably under variable life insurance policies and variable annuity contracts for which the Portfolio serves as an investment option, there are a range of investment options available to investors and that the Portfolio’s shareholders, having had the opportunity to consider other investment options, have chosen to invest in the Portfolio.
The factors that figured prominently in the Board’s decision to approve the continuation of each of the Advisory Agreements during its December 6–7, 2022 meeting are summarized in more detail below.
Nature, Extent and Quality of Services Provided by New York Life Investments and Candriam
The Board examined the nature, extent and quality of the services that New York Life Investments provides to the Portfolio. The Board evaluated New York Life Investments’ experience and capabilities in serving as manager of the Portfolio and considered that the Portfolio operates in a “manager-of-managers” structure. The Board also considered New York Life Investments’ responsibilities and services provided pursuant to this structure, including overseeing the services provided by Candriam, evaluating the performance of Candriam, making recommendations to the Board as to whether the Subadvisory Agreement should be renewed, modified or terminated and periodically reporting to the Board regarding the results of New York Life Investments’ evaluation and monitoring functions. The Board noted that New York Life Investments manages other mutual funds, serves a variety of other investment advisory clients, including other pooled investment vehicles, and has experience overseeing mutual fund service providers, including subadvisors. The Board considered the experience of senior personnel at New York Life Investments providing management and administrative and other non-advisory services to the Portfolio. The Board observed that New York Life Investments devotes significant resources and time to providing management and administrative and other non-advisory services to the Portfolio, including New York Life Investments’ oversight and due diligence reviews of Candriam and ongoing analysis of, and interactions with, Candriam with respect to, among other things, the Portfolio’s investment performance and risks as well as Candriam’s investment capabilities and subadvisory services with respect to the Portfolio.
The Board also considered the range of services that New York Life Investments provides to the Portfolio under the terms of the Management Agreement, including: (i) fund accounting and ongoing supervisory services provided by New York Life Investments’ Fund Administration and Accounting Group; (ii) investment supervisory and analytical services provided by New York Life Investments’ Investment Consulting Group; (iii) compliance services provided by the Trust’s Chief Compliance Officer as
well as New York Life Investments’ compliance department, including supervision and implementation of the Portfolio’s compliance program; (iv) legal services provided by New York Life Investments’ Office of the General Counsel; and (v) risk management monitoring and analysis by compliance and investment personnel. In addition, the Board considered New York Life Investments’ willingness to invest in personnel and other resources, such as cyber security, information security and business continuity planning, designed to benefit the Portfolio and noted that New York Life Investments is responsible for compensating the Trust’s officers, except for a portion of the salary of the Trust’s Chief Compliance Officer. The Board recognized that New York Life Investments provides certain other non-advisory services to the Portfolio and has provided an increasingly broad array of non-advisory services to the MainStay Group of Funds as a result of regulatory and other developments, including in connection with the implementation of the MainStay Group of Funds’ derivatives risk management program and policies and procedures adopted pursuant to Rule 18f-4 under the 1940 Act.
The Board also examined the range, and the nature, extent and quality, of the investment advisory services that Candriam provides to the Portfolio and considered the terms of each of the Advisory Agreements. The Board evaluated Candriam’s experience and performance in serving as subadvisor to the Portfolio and advising other portfolios and Candriam’s track record and experience in providing investment advisory services, the experience of investment advisory, senior management and administrative personnel at Candriam. The Board considered New York Life Investments’ and Candriam’s overall resources, legal and compliance environment, capabilities, reputation, financial condition and history. In addition to information provided in connection with quarterly meetings with the Trust’s Chief Compliance Officer, the Board considered information regarding the compliance policies and procedures of New York Life Investments and Candriam and acknowledged their commitment to further developing and strengthening compliance programs relating to the Portfolio. The Board also considered Candriam’s ability to recruit and retain qualified investment professionals and willingness to invest in personnel and other resources to service and support the Portfolio. In this regard, the Board considered the qualifications and experience of the Portfolio’s portfolio managers, the number of accounts managed by the portfolio managers and the method for compensating the portfolio managers.
In addition, the Board considered information provided by New York Life Investments and Candriam regarding the operations of their respective business continuity plans in response to the COVID-19 pandemic and the continued remote work environment.
Based on these considerations, among others, the Board concluded that the Portfolio would likely continue to benefit from the nature, extent and quality of these services.
| 28 | MainStay VP Candriam Emerging Markets Equity Portfolio |
Investment Performance
In evaluating the Portfolio’s investment performance, the Board considered investment performance results over various periods in light of the Portfolio’s investment objective, strategies and risks. The Board considered investment reports on, and analysis of, the Portfolio’s performance provided to the Board throughout the year. These reports include, among other items, information on the Portfolio’s gross and net returns, the Portfolio’s investment performance compared to a relevant investment category and the Portfolio’s benchmark, the Portfolio’s risk-adjusted investment performance and the Portfolio’s investment performance as compared to peer funds, as appropriate, as well as portfolio attribution information and commentary on the effect of market conditions. The Board also considered information provided by ISS showing the investment performance of the Portfolio as compared to peer funds. In addition, the Board reviewed the methodology used by ISS to construct the group of peer funds for comparative purposes.
The Board also took into account its discussions with senior management at New York Life Investments concerning the Portfolio’s investment performance over various periods as well as discussions between the Portfolio’s portfolio management team and the members of the Board’s Investment Committee, which generally occur on an annual basis. In addition, the Board considered any specific actions that New York Life Investments or Candriam had taken, or had agreed to take, to seek to enhance Portfolio investment performance and the results of those actions. In considering the investment performance of the Portfolio, the Board noted that the Portfolio underperformed its peer funds for the one-, five- and ten-year periods ended July 31, 2022, and performed in line with its peer funds for the three-year period ended July 31, 2022. The Board considered its discussions with representatives from New York Life Investments and Candriam regarding the Portfolio’s investment performance.
Based on these considerations, among others, the Board concluded that its review of the Portfolio’s investment performance and related information supported a determination to approve the continuation of each of the Advisory Agreements.
Costs of the Services Provided, and Profits and Other Benefits Realized, by New York Life Investments and Candriam
The Board considered the costs of the services provided under each of the Advisory Agreements. The Board also considered the profits realized by New York Life Investments and its affiliates, including Candriam, due to their relationships with the Portfolio as well as the MainStay Group of Funds. Because Candriam is an affiliate of New York Life Investments whose subadvisory fee is paid by New York Life Investments, not the Portfolio, the Board considered cost and profitability information for New York Life Investments and Candriam in the aggregate.
In addition, the Board acknowledged the difficulty in obtaining reliable comparative data about mutual fund managers’ profitability because such information generally is not publicly available and may be impacted by
numerous factors, including the structure of a fund manager’s organization, the types of funds it manages, the methodology used to allocate certain fixed costs to specific funds and the manager’s capital structure and costs of capital.
In evaluating the costs of the services provided by New York Life Investments and Candriam and profits realized by New York Life Investments and its affiliates, including Candriam, the Board considered, among other factors, New York Life Investments’ and its affiliates’, including Candriam’s, continuing investments in, or willingness to invest in, personnel and other resources to support and further enhance the management of the Portfolio, and that New York Life Investments is responsible for paying the subadvisory fee for the Portfolio. The Board also considered the financial resources of New York Life Investments and Candriam and acknowledged that New York Life Investments and Candriam must be in a position to recruit and retain experienced professional personnel and to maintain a strong financial position for New York Life Investments and Candriam to continue to provide high-quality services to the Portfolio. The Board recognized that the Portfolio benefits from the allocation of certain fixed costs among the funds in the MainStay Group of Funds, among other expected benefits resulting from its relationship with New York Life Investments.
The Board considered information regarding New York Life Investments’ methodology for calculating profitability and allocating costs provided by New York Life Investments in connection with the fund profitability analysis presented to the Board. The Board noted it had previously engaged an independent consultant to review the methods used to allocate costs among the funds in the MainStay Group of Funds. The Board also noted that the independent consultant had concluded that New York Life Investments’ methods for allocating costs and procedures for estimating overall profitability of the relationship with the funds in the MainStay Group of Funds are reasonable and that New York Life Investments continued to use the same method of calculating profit and allocating costs since the independent consultant’s review. The Board recognized the difficulty in calculating and evaluating a manager’s profitability with respect to the Portfolio and considered that other profitability methodologies may also be reasonable.
The Board also considered certain fall-out benefits that may be realized by New York Life Investments and its affiliates due to their relationships with the Portfolio, including reputational and other indirect benefits. In addition, the Board considered its review of the management agreement for a money market fund advised by New York Life Investments and an affiliated subadvisor that serves as an investment option for the Portfolio, including the potential rationale for and costs associated with investments in this money market fund by the Portfolio, if any, and considered information from New York Life Investments that the nature and type of specific investment advisory services provided to this money market fund are distinct from, or in addition to, the investment advisory services provided to the Portfolio. In addition, the Board considered the potential dividend received tax deduction for insurance company affiliates of New York Life Investments from the Portfolio’s securities lending activity.
Board Consideration and Approval of Management Agreement and Subadvisory Agreement (Unaudited) (continued)
The Board noted that the Portfolio serves as an investment option primarily under variable contracts issued by affiliates of New York Life Investments that would receive fees under those contracts. The Board observed that, in addition to fees earned by New York Life Investments under the Management Agreement for managing the Portfolio, New York Life Investments’ affiliates also earn revenues from serving the Portfolio in various other capacities, including as the Portfolio’s distributor. The Board considered information about these other revenues and their impact on the profitability of the relationship with the Portfolio to New York Life Investments and its affiliates. The Board noted that, although it assessed the overall profitability of the relationship with the Portfolio to New York Life Investments and its affiliates as part of the contract review process, when considering the reasonableness of the fee paid to New York Life Investments under the Management Agreement, the Board considered the profitability of New York Life Investments’ relationship with the Portfolio on a pre-tax basis and without regard to distribution expenses incurred by New York Life Investments from its own resources.
After evaluating the information deemed relevant by the Trustees, the Board concluded that any profits realized by New York Life Investments and its affiliates, including Candriam, due to their relationships with the Portfolio were not excessive and other benefits that may accrue to New York Life Investments and its affiliates, including Candriam, are reasonable.
Management and Subadvisory Fees and Total Ordinary Operating Expenses
The Board evaluated the reasonableness of the fee paid under each of the Advisory Agreements and the Portfolio’s total ordinary operating expenses. The Board primarily considered the reasonableness of the management fee paid by the Portfolio to New York Life Investments because the subadvisory fee paid to Candriam is paid by New York Life Investments, not the Portfolio. The Board also considered the reasonableness of the subadvisory fee paid by New York Life Investments and the amount of the management fee retained by New York Life Investments.
In assessing the reasonableness of the Portfolio’s fees and expenses, the Board primarily considered comparative data provided by ISS on the fees and expenses charged by similar mutual funds managed by other investment advisers. The Board reviewed the methodology used by ISS to construct the group of peer funds for comparative purposes. In addition, the Board considered information provided by New York Life Investments and Candriam on fees charged to other investment advisory clients, including institutional separate accounts and/or other funds that follow investment strategies similar to those of the Portfolio, if any. The Board considered the contractual management fee schedules of the Portfolio as compared to those of such other investment advisory clients, taking into account the rationale for any differences in fee schedules. The Board also took into account information provided by New York Life Investments about the more extensive scope of services provided to registered investment companies, such as the Portfolio, as compared with other investment advisory clients. Additionally, the Board considered the impact
of contractual breakpoints on the Portfolio’s net management fee and expenses. The Board also considered that in proposing fees for the Portfolio, New York Life Investments considers the competitive marketplace for mutual funds.
Based on the factors outlined above, among other considerations, the Board concluded that the Portfolio’s management fee and total ordinary operating expenses are within a range that is competitive and support a conclusion that these fees and expenses are reasonable.
Economies of Scale
The Board considered information regarding economies of scale, including whether economies of scale may exist for the Portfolio and whether the Portfolio’s expense structure permits any economies of scale to be appropriately shared with the Portfolio’s beneficial shareholders. The Board also considered a report from New York Life Investments, previously prepared at the request of the Board, that addressed economies of scale, including with respect to the mutual fund business generally, and the various ways in which the benefits of economies of scale may be shared with the funds in the MainStay Group of Funds. Although the Board recognized the difficulty of determining economies of scale with precision, the Board acknowledged that economies of scale may be shared with the Portfolio in a number of ways, including, for example, through the imposition of fee breakpoints, initially setting management fee rates at scale or making additional investments to enhance the services provided to the Portfolio. The Board reviewed information from New York Life Investments showing how the Portfolio’s management fee schedule compared to fee schedules of other funds and accounts managed by New York Life Investments. The Board also reviewed information from ISS showing how the Portfolio’s management fee schedule compared with fees paid for similar services by peer funds at varying asset levels.
Based on this information, the Board concluded that economies of scale are appropriately reflected for the benefit of the Portfolio’s beneficial shareholders through the Portfolio’s expense structure and other methods to share benefits from economies of scale.
Conclusion
On the basis of the information and factors summarized above, among other information and factors deemed relevant by the Trustees, and the evaluation thereof, the Board unanimously voted to approve the continuation of each of the Advisory Agreements.
| 30 | MainStay VP Candriam Emerging Markets Equity Portfolio |
Proxy Voting Policies and Procedures and Proxy Voting Record
The Portfolio is required to file with the SEC its proxy voting record for the 12-month period ending June 30 on Form N-PX. A description of the policies and procedures that are used to vote proxies relating to portfolio securities of the Portfolio is available free of charge upon request by calling 800-598-2019 or visiting the SEC's website at www.sec.gov. The most recent Form N-PX or proxy voting record is available free of charge upon request by calling 800-598-2019; visiting https://www.newyorklifeinvestments.com/investment-products/vp; or visiting the SEC’s website at www.sec.gov.
Shareholder Reports and Quarterly Portfolio Disclosure
The Portfolio is required to file its complete schedule of portfolio holdings with the SEC 60 days after its first and third fiscal quarter on Form N-PORT. The Portfolio's holdings report is available free of charge upon request by calling 800-598-2019 or by visiting the SEC’s website at www.sec.gov.
Board of Trustees and Officers (Unaudited)
The Trustees and officers of the Portfolio are listed below. The Board oversees the MainStay Group of Funds (which consists of MainStay Funds and MainStay Funds Trust), MainStay VP Funds Trust, MainStay MacKay DefinedTerm Municipal Opportunities Fund, MainStay CBRE Global Infrastructure Megatrends Fund, the Manager and the Subadvisors, and elects the officers of the Portfolios who are responsible for the day-to-day operations of the Portfolio. Information pertaining to the Trustees and officers is set forth below. Each Trustee serves until his or her successor
is elected and qualified or until his or her resignation, death or removal. Under the Board’s retirement policy, unless an exception is made, a Trustee must tender his or her resignation by the end of the calendar year during which he or she reaches the age of 75. The business address of each Trustee and officer listed below is 51 Madison Avenue, New York, New York 10010. None of the Trustees are “interested persons” (as defined by the 1940 Act and rules adopted by the SEC thereunder) of the Portfolio (“Independent Trustees”).
| | Name and
Year of Birth | Term of Office,
Position(s) Held and
Length of Service | Principal Occupation(s)
During Past Five Years | Number of
Portfolios in
Fund Complex
Overseen by
Trustee | Other Directorships
Held by Trustee |
| | | | | | |
| | David H. Chow
1957 | MainStay VP Funds Trust: Trustee since January 2016, Advisory Board Member (June 2015 to December 2015) | Founder and CEO, DanCourt Management, LLC since 1999 | 78 | MainStay Funds: Trustee since January 2016, Advisory Board Member (June 2015 to December 2015) (12 Funds);
MainStay Funds Trust: Trustee since January 2016, Advisory Board Member (June 2015 to December 2015) (33 Funds);
MainStay MacKay DefinedTerm Municipal Opportunities Fund: Trustee since January 2016, Advisory Board Member (June 2015 to December 2015);
MainStay CBRE Global Infrastructure Megatrends Fund: Trustee since June 2021;VanEck Vectors Group of Exchange-Traded Funds: Independent Chairman of the Board of Trustees since 2008 and Trustee since 2006 (57 portfolios); and Berea College of Kentucky: Trustee since 2009, Chair of the Committee since 2018 |
| | Susan B. Kerley
1951 | MainStay VP Funds Trust: Chairman since 2017 and Trustee since 2007* | President, Strategic Management Advisors LLC since 1990 | 78 | MainStay Funds: Chairman since 2017 and Trustee since 2007 (12 Funds); MainStay Funds Trust: Chairman since 2017 and Trustee since 1990 (33 Funds)**;
MainStay MacKay DefinedTerm Municipal Opportunities Fund: Chairman since 2017 and Trustee since 2011; MainStay CBRE Global Infrastructure Megatrends Fund: Trustee since June 2021; and Legg Mason Partners Funds: Trustee since 1991 (45 portfolios) |
| | Alan R. Latshaw
1951 | MainStay VP Funds Trust: Trustee since 2007* | Retired; Partner, Ernst & Young LLP (2002 to 2003); Partner, Arthur Andersen LLP (1989 to 2002); Consultant to the MainStay Funds Audit and Compliance Committee (2004 to 2006) | 78 | MainStay Funds: Trustee since 2006 (12 Funds);
MainStay Funds Trust: Trustee since 2007 (33 Funds)**;
MainStay MacKay DefinedTerm Municipal Opportunities Fund: Trustee since 2011; and
MainStay CBRE Global Infrastructure Megatrends Fund: Trustee since June 2021 |
| 32 | MainStay VP Candriam Emerging Markets Equity Portfolio |
| | Name and
Year of Birth | Term of Office,
Position(s) Held and
Length of Service | Principal Occupation(s)
During Past Five Years | Number of
Portfolios in
Fund Complex
Overseen by
Trustee | Other Directorships
Held by Trustee |
| | | | | | |
| | Karen Hammond
1956 | MainStay VP Funds Trust: Trustee since December 2021, Advisory Board Member (June 2021 to December 2021)
| Retired, Managing Director, Devonshire Investors (2007 to 2013); Senior Vice President, Fidelity Management & Research Co. (2005 to 2007); Senior Vice President and Corporate Treasurer, FMR Corp. (2003 to 2005); Chief Operating Officer, Fidelity Investments Japan (2001 to 2003) | 78 | MainStay Funds: Trustee since December 2021, Advisory Board Member (June 2021 to December 2021) (12 Funds);
MainStay Funds Trust: Trustee since December 2021, Advisory Board Member (June 2021 to December 2021) (33 Funds);
MainStay MacKay DefinedTerm Municipal Opportunities Fund: Trustee since December 2021, Advisory Board Member (June 2021 to December 2021);
MainStay CBRE Global Infrastructure Megatrends Fund: Trustee since December 2021, Advisory Board Member (June 2021 to December 2021);
Two Harbors Investment Corp.: Director since 2018; Rhode Island State Investment Commission: Member since 2017; and Blue Cross Blue Shield of Rhode Island: Director since 2019
|
| | Jacques P. Perold
1958 | MainStay VP Funds Trust: Trustee since January 2016, Advisory Board Member (June 2015 to December 2015) | Founder and Chief Executive Officer, CapShift Advisors LLC (since 2018); President, Fidelity Management & Research Company (2009 to 2014); President and Chief Investment Officer, Geode Capital Management, LLC (2001 to 2009) | 78 | MainStay Funds: Trustee since January 2016, Advisory Board Member (June 2015 to December 2015) (12 Funds);
MainStay Funds Trust: Trustee since January 2016, Advisory Board Member (June 2015 to December 2015) (33 Funds); MainStay MacKay DefinedTerm Municipal Opportunities Fund: Trustee since January 2016, Advisory Board Member (June 2015 to December 2015);
MainStay CBRE Global Infrastructure Megatrends Fund: Trustee since June 2021; Allstate Corporation: Director since 2015;
Partners in Health: Trustee since 2019; and
MSCI Inc.: Director since 2017 |
| | Richard S. Trutanic
1952 | MainStay VP Funds Trust: Trustee since 2007* | Chairman and Chief Executive Officer, Somerset & Company (financial advisory firm) since 2004; Managing Director, The Carlyle Group (private investment firm) (2002 to 2004); Senior Managing Director, Partner and Board Member, Groupe Arnault S.A. (private investment firm) (1999 to 2002)
| 78 | MainStay Funds: Trustee since 1994 (12 Funds);
MainStay Funds Trust: Trustee since 2007 (33 Funds)**;
MainStay MacKay DefinedTerm Municipal Opportunities Fund: Trustee since 2011; and
MainStay CBRE Global Infrastructure Megatrends Fund: Trustee since June 2021 |
| * | Includes prior service as a Director of MainStay VP Series Fund, Inc., the predecessor to MainStay VP Funds Trust. |
| ** | Includes prior service as a Director/Trustee of certain predecessor entities to MainStay Funds Trust. |
Board of Trustees and Officers (Unaudited) (continued)
| | Name and
Year of Birth | Position(s) Held and
Length of Service | Principal Occupation(s)
During Past Five Years | |
| | | | | |
| | Kirk C. Lehneis
1974 | President, MainStay VP Funds Trust (since 2017) | Chief Operating Officer and Senior Managing Director (since 2016), New York Life Investment Management LLC and New York Life Investment Management Holdings LLC; Member of the Board of Managers (since 2017) and Senior Managing Director (since 2018), NYLIFE Distributors LLC; Chairman of the Board and Senior Managing Director, NYLIM Service Company LLC (since 2017); Trustee, President and Principal Executive Officer of IndexIQ Trust, IndexIQ ETF Trust and IndexIQ Active ETF Trust (since January 2018); President, MainStay CBRE Global Infrastructure Megatrends Fund (since 2021), MainStay MacKay DefinedTerm Municipal Opportunities Fund, MainStay Funds and MainStay Funds Trust (since 2017); Senior Managing Director, Global Product Development (from 2015-2016); Managing Director, Product Development (from 2010-2015), New York Life Investment Management LLC | |
| | Jack R. Benintende
1964 | Treasurer and Principal Financial and Accounting Officer, MainStay VP Funds Trust (since 2007)** | Managing Director, New York Life Investment Management LLC (since 2007); Treasurer and Principal Financial and Accounting Officer, MainStay CBRE Global Infrastructure Megatrends Fund (since 2021), MainStay MacKay DefinedTerm Municipal Opportunities Fund (since 2011), MainStay Funds Trust (since 2009) and MainStay Funds (since 2007); and Assistant Treasurer, New York Life Investment Management Holdings LLC (2008 to 2012) | |
| | J. Kevin Gao
1967 | Secretary and Chief Legal Officer, MainStay VP Funds Trust (since 2010)** | Managing Director and Associate General Counsel, New York Life Investment Management LLC (since 2010); Secretary and Chief Legal Officer, MainStay CBRE Global Infrastructure Megatrends Fund (since 2021), MainStay MacKay DefinedTerm Municipal Opportunities Fund (since 2011), MainStay Funds and MainStay Funds Trust (since 2010) | |
| | Scott T. Harrington
1959 | Vice President— Administration, MainStay VP Funds Trust (since 2005)** | Managing Director, New York Life Investment Management LLC (including predecessor advisory organizations) (since 2000); Member of the Board of Directors, New York Life Trust Company (since 2009); Vice President—Administration, MainStay CBRE Global Infrastructure Megatrends Fund (since 2021), MainStay MacKay DefinedTerm Municipal Opportunities Fund (since 2011), MainStay Funds Trust and MainStay Funds (since 2009) | |
| | Kevin M. Gleason
1967 | Vice President and Chief Compliance Officer, MainStay VP Funds Trust (since June 2022) | Vice President and Chief Compliance Officer, IndexIQ, IndexIQ ETF Trust and Index IQ Active ETF Trust (since June 2022); Vice President and Chief Compliance Officer, MainStay CBRE Global Infrastructure Megatrends Fund, MainStay MacKay DefinedTerm Municipal Opportunities Fund (since June 2022); MainStay Funds Trust and MainStay Funds (since June 2022); Senior Vice President, Voya Investment Management and Chief Compliance Officer, Voya Family of Funds (2012-2022) | |
| * | The officers listed above are considered to be “interested persons” of the MainStay Group of Funds, MainStay VP Funds Trust, MainStay CBRE Global Infrastructure Megatrends Fund and MainStay MacKay DefinedTerm Municipal Opportunities Fund within the meaning of the 1940 Act because of their affiliation with the MainStay Group of Funds, New York Life Insurance Company and/or its affiliates, including New York Life Investment Management LLC, NYLIM Service Company LLC, NYLIFE Securities LLC and/or NYLIFE Distributors LLC, as described in detail in the column captioned “Principal Occupation(s) During Past Five Years.” Officers are elected annually by the Board. |
| ** | Includes prior service as an Officer of MainStay VP Series Fund, Inc., the predecessor to MainStay VP Funds Trust. |
Officers of the Trust (Who are not Trustees)*
| 34 | MainStay VP Candriam Emerging Markets Equity Portfolio |
MainStay VP Portfolios
MainStay VP offers a wide range of Portfolios. The full array of MainStay VP offerings is listed here, with information about the manager, subadvisors, legal counsel, and independent registered public accounting firm.
Equity
MainStay VP American Century Sustainable Equity Portfolio1
MainStay VP Candriam Emerging Markets Equity Portfolio
MainStay VP Epoch U.S. Equity Yield Portfolio
MainStay VP Fidelity Institutional AM® Utilities Portfolio†
MainStay VP MacKay International Equity Portfolio
MainStay VP Natural Resources Portfolio
MainStay VP S&P 500 Index Portfolio2
MainStay VP Small Cap Growth Portfolio
MainStay VP Wellington Growth Portfolio
MainStay VP Wellington Mid Cap Portfolio
MainStay VP Wellington Small Cap Portfolio
MainStay VP Wellington U.S. Equity Portfolio
MainStay VP Winslow Large Cap Growth Portfolio
Mixed Asset
MainStay VP Balanced Portfolio
MainStay VP Income Builder Portfolio
MainStay VP Janus Henderson Balanced Portfolio
MainStay VP MacKay Convertible Portfolio
Income
MainStay VP Bond Portfolio
MainStay VP Floating Rate Portfolio
MainStay VP Indexed Bond Portfolio
MainStay VP MacKay Government Portfolio
MainStay VP MacKay High Yield Corporate Bond Portfolio
MainStay VP MacKay Strategic Bond Portfolio
MainStay VP PIMCO Real Return Portfolio
Money Market
MainStay VP U.S. Government Money Market Portfolio
Alternative
MainStay VP CBRE Global Infrastructure Portfolio
MainStay VP IQ Hedge Multi-Strategy Portfolio
Asset Allocation
MainStay VP Conservative Allocation Portfolio
MainStay VP Equity Allocation Portfolio
MainStay VP Growth Allocation Portfolio
MainStay VP Moderate Allocation Portfolio
Manager
New York Life Investment Management LLC
New York, New York
Subadvisors
American Century Investment Management, Inc.
Kansas City, Missouri
Brown Advisory LLC
Baltimore, Maryland
Candriam*
Strassen, Luxembourg
CBRE Investment Management Listed Real Assets LLC
Radnor, Pennsylvania
Epoch Investment Partners, Inc.
New York, New York
FIAM LLC
Smithfield, Rhode Island
IndexIQ Advisors LLC*
New York, New York
Janus Henderson Investors US LLC
Denver, Colorado
MacKay Shields LLC*
New York, New York
Newton Investment Management North America, LLC
Boston, Massachusetts
NYL Investors LLC*
New York, New York
Pacific Investment Management Company LLC
Newport Beach, California
Segall Bryant & Hamill, LLC
Chicago, Illinois
Wellington Management Company LLP
Boston, Massachusetts
Winslow Capital Management, LLC
Minneapolis, Minnesota
Legal Counsel
Dechert LLP
Washington, District of Columbia
Independent Registered Public Accounting Firm
PricewaterhouseCoopers LLP
New York, New York
Distributor
NYLIFE Distributors LLC*
Jersey City, New Jersey
Custodian
JPMorgan Chase Bank, N.A.
New York, New York
Some Portfolios may not be available in all products.
† Fidelity Institutional AM is a registered trade mark of FMR LLC. Used with permission.
* An affiliate of New York Life Investment Management LLC.
| 1. | Prior to May 1, 2022, the Portfolio's name was MainStay VP T. Rowe Price Equity Income Portfolio. |
| 2. | Prior to May 1, 2022, the Portfolio's name was MainStay VP MacKay S&P 500 Index Portfolio. |
Not part of the Annual Report
2022 Annual Report
This report is for the general information of New York Life Variable Annuities and NYLIAC Variable Universal Life Insurance Products policyowners. It must be preceded or accompanied by the appropriate product(s) and funds prospectuses if it is given to anyone who is not an owner of a New York Life variable annuity policy or a NYLIAC Variable Universal Life Insurance Product. This report does not offer for sale or solicit orders to purchase securities.
The performance data quoted in this report represents past performance. Past performance is no guarantee of future results. Due to market volatility and other factors, current performance may be lower or higher than the figures shown. The most recent month-end performance summary for your variable annuity or variable life policy is available by calling 800-598-2019 and is updated periodically on newyorklife.com.
The New York Life Variable Annuities and NYLIAC Variable Universal Life Insurance Products are issued by New York Life Insurance and Annuity Corporation (a Delaware Corporation) and distributed by NYLIFE Distributors LLC (Member FINRA/SIPC).
New York Life Insurance Company
New York Life Insurance and Annuity
Corporation (NYLIAC) (A Delaware Corporation)
51 Madison Avenue, Room 551
New York, NY 10010
newyorklife.com
newyorklifeinvestments.com
NYLIFE Distributors LLC, 30 Hudson Street, Jersey City, NJ 07302
New York Life Investment Management LLC is the investment manager to the MainStay VP Funds Trust
©2023 by NYLIFE Distributors LLC. All rights reserved.
You may obtain copies of the Prospectus and the Statement of Additional Information free of charge, upon request, by calling toll-free 800-598-2019 or writing to New York Life Insurance and Annuity Corporation, 51 Madison Avenue, New York, NY 10010.
| Not FDIC Insured | No Bank Guarantee | May Lose Value |
(NYLIAC) NI516
MainStay VP IQ Hedge Multi-Strategy Portfolio
Message from the President and Annual Report
December 31, 2022
Sign up for e-delivery of your shareholder reports. For full details on e-delivery, including who can participate and what you can receive via e-delivery,
please log in to newyorklifeinvestments.com/accounts.
| Not FDIC/NCUA Insured | Not a Deposit | May Lose Value | No Bank Guarantee | Not Insured by Any Government Agency |
This page intentionally left blank
Message from the President
The 12-month reporting period ended December 31, 2022, proved exceptionally challenging for investors as both stock and bond markets suffered steep declines. A variety of economic and geopolitical forces drove the market’s losses, all centered around rising inflation and monetary efforts to rein it in.
Inflationary alarms began to sound well before the reporting period began. In late 2021, after nearly two years of accommodative policies designed to encourage economic growth in the face of the COVID-19 pandemic, the U.S. Federal Reserve (the “Fed”) warned of the increasing need to tighten monetary policy. Nevertheless, the pace and persistence of inflation in early 2022 caught most market participants—the Fed included—off guard. Russia’s invasion of Ukraine in February exacerbated global inflationary pressures while increasing investor uncertainty. Domestic supply shortages, international trade imbalances and rising inflation caused U.S. GDP (gross domestic product) to contract in the first and second quarters of the year, although employment and consumer spending proved resilient. Prices for petroleum surged to multi-year highs, while many key agricultural chemicals and industrial metals soared as well. Accelerating inflationary forces prompted the Fed to implement its most aggressive series of interest rate hikes since the 1980s, with a 0.25% increase in March followed by six further rate increases totaling 4.25%. International central banks generally followed suit and raised rates by varying degrees in efforts to curb local inflation, although most increases remained significantly more modest than those in the United States. Relatively high U.S. interest rates and an international risk averse sentiment pushed U.S. dollar values higher compared to most other currencies, with negative impacts on global prices for food, fuel and other key U.S.-dollar-denominated products.
The effects of these interrelated challenges were felt throughout U.S. and international financial markets. The S&P 500® Index, a widely regarded benchmark of market performance, declined by more than 18% during the reporting period. Although the energy sector generated strong gains, bolstered by elevated oil and gas prices, most other industry segments recorded losses. The more cyclical and growth-oriented sectors of consumer discretionary, information technology and real estate delivered the weakest returns, while the traditionally defensive and value-oriented
consumer staples, utilities and health care sectors outperformed. On average, international developed-country equity markets mildly outperformed their U.S. counterparts, while emerging markets lagged slightly. Fixed-income markets proved unusually volatile, with bond prices trending sharply lower as yields rose along with interest rates. Short-term yields rose faster than long-term yields, producing a yield curve inversion from July through the end of the reporting period as long-term rates remained below short-term rates. While floating-rate instruments, which feature variable interest rates that allow investors to benefit from a rising rate environment, provided a degree of insulation from inflation-driven trends, they were not immune to the market’s widespread declines.
Although, according to the most recent estimates, the annualized inflation rate in the United States has declined from a peak of 9.1% in July 2022 to 6.5% in December, the Fed remains focused on achieving more substantial and lasting reductions, aiming for a target rate of 2%. As a result, further rate hikes and additional market volatility are potential headwinds in the coming months. The question remains as to whether the Fed and other central banks will manage a so-called “soft landing,” curbing inflation while avoiding a persistent economic slowdown. If they prove successful, we believe that the increasingly attractive valuations we have observed in both equity and bond markets should eventually translate into sustainable improvements in the investment environment.
Whatever actions the Fed takes and however financial markets react, as a MainStay VP investor you can depend on us to continue managing our portfolios with the insight, expertise and level of service that have long defined New York Life Investments. Thank you for trusting us to help you meet your investment needs.
Sincerely,
Kirk C. Lehneis
President
The opinions expressed are as of the date of this report and are subject to change. There is no guarantee that any forecast made will come to pass. This material does not constitute investment advice and is not intended as an endorsement of any specific investment. Past performance is no guarantee of future results.
Not part of the Annual Report
Investors should refer to the Portfolio’s Summary Prospectus and/or Prospectus and consider the Portfolio’s investment objectives, strategies, risks, charges and expenses carefully before investing. The Summary Prospectus and/or Prospectus contain this and other information about the Portfolio. You may obtain copies of the Portfolio’s Summary Prospectus, Prospectus and Statement of Additional Information, which includes information about the MainStay VP Funds Trust's Trustees, free of charge, upon request, by calling toll-free 800-598-2019, by writing to New York Life Insurance and Annuity Corporation, 51 Madison Avenue, Room 251, New York, New York 10010 or by sending an email to MainStayShareholdersServices@nylim.com. These documents are also available at newyorklifeinvestments.com/investment-products/vp. Please read the Portfolio's Summary Prospectus and/or Prospectus carefully before investing. MainStay VP Funds Trust portfolios are separate account options which are purchased through a variable insurance or variable annuity contract.
Investment and Performance Comparison (Unaudited)
Performance data quoted represents past performance. Past performance is no guarantee of future results. Because of market volatility and other factors, current performance may be lower or higher than the figures shown. Investment return and principal value will fluctuate, and as a result, when shares are redeemed, they may be worth more or less than their original cost. The performance table and graph do not reflect any deduction of sales charges, mortality and expense charges, contract charges or administrative charges. Please refer to the Performance Summary appropriate for your policy. For performance information current to the most recent month-end, please call 800-598-2019 or visit www.newyorklife.com.
Performance figures may reflect certain fee waivers and/or expense limitations, without which total returns may have been different. For information on current fee waivers and/or expense limitations (if any), please refer to the Notes to Financial Statements.
| Average Annual Total Returns for the Year-Ended December 31, 2022 |
| Class | Inception
Date1 | One
Year | Five
Years | Since
Inception | Gross
Expense
Ratio2 |
| Initial Class Shares | 5/1/2013 | -8.48% | -0.64% | -1.39% | 1.07% |
| Service Class Shares | 5/1/2013 | -8.70 | -0.88 | -1.60 | 1.32 |
| 1. | Effective November 30, 2018, the Portfolio’s predecessor fund, MainStay VP Absolute Return Multi-Strategy Portfolio (the “VP ARMS Portfolio”), was reorganized into the Portfolio. The Portfolio assumed the VP ARMS Portfolio’s historical performance and accounting information. Therefore, the performance information prior to November 30, 2018, shown in this report is that of the VP ARMS Portfolio, which had a different investment objective and different principal investment strategies and subadvisors. Past performance may have been different if the Portfolio’s current subadvisor, investment objective or principal investment strategies had been in place during the periods. |
| 2. | The gross expense ratios presented reflect the Portfolio’s “Total Annual Portfolio Operating Expenses” from the most recent Prospectus, as supplemented, and may differ from other expense ratios disclosed in this report. |
| Benchmark Performance* | One
Year | Five
Years | Since
Inception |
| S&P Balanced Equity and Bond Conservative Index1 | -15.81% | 2.29% | 3.46% |
| Barclay Fund of Funds Index2 | -8.48 | 1.37 | 2.00 |
| IQ Hedge Multi-Strategy Index3 | -7.89 | 0.76 | 2.02 |
| Morningstar Multistrategy Category Average4 | -3.01 | 1.56 | 2.10 |
| * | Returns for indices reflect no deductions for fees, expenses or taxes, except for foreign withholding taxes where applicable. Results assume reinvestment of all dividends and capital gains. An investment cannot be made directly in an index. |
| 1. | The Portfolio has selected the S&P Balanced Equity and Bond Conservative Index as its primary benchmark. The S&P Balanced Equity and Bond Conservative Index consists of a position in the S&P 500 Total Return Index (25%) and a position in the S&P U.S. Treasury Bond 7-10 Year Index (75%). |
| 2. | The Portfolio has selected the Barclay Fund of Funds Index as its secondary benchmark. The Barclay Fund of Funds Index is a measure of the average return of all reporting funds in the Barclay database. |
| 3. | The IQ Hedge Multi-Strategy Index seeks to replicate the risk-adjusted return characteristics of the collective hedge funds using various hedge fund investment styles, including long/short equity, global macro, market neutral, event-driven, fixed income arbitrage and emerging markets. |
| 4. | The Morningstar Multistrategy Category Average is representative of funds that have a majority of their assets exposed to alternative strategies. Funds in this category include both funds with static allocations to alternative strategies and funds tactically allocating among alternative strategies and asset classes. Results are based on average total returns of similar funds with all dividends and capital gain distributions reinvested. |
Cost in Dollars of a $1,000 Investment in MainStay VP IQ Hedge Multi-Strategy Portfolio (Unaudited)
The example below is intended to describe the fees and expenses borne by shareholders during the six-month period from July 1, 2022 to December 31, 2022, and the impact of those costs on your investment.
Example
As a shareholder of the Portfolio you incur two types of costs: (1) transaction costs, including exchange fees and sales charges (loads) on purchases (as applicable), and (2) ongoing costs, including management fees, distribution and/or service (12b-1) fees and other Portfolio expenses (as applicable). This example is intended to help you understand your ongoing costs (in dollars) of investing in the Portfolio and to compare these costs with the ongoing costs of investing in other mutual funds. The example is based on an investment of $1,000 made at the beginning of the six-month period and held for the entire period from July 1, 2022 to December 31, 2022. Shares are only sold in connection with variable life and annuity contracts and the example does not reflect any contract level or transactional fees or expenses. If these costs had been included, your costs would have been higher.
This example illustrates your Portfolio’s ongoing costs in two ways:
Actual Expenses
The second and third data columns in the table below provide information about actual account values and actual expenses. You may use the information in these columns, together with the amount you invested, to estimate the expenses that you paid during the six months ended
December 31, 2022. Simply divide your account value by $1,000 (for example, an $8,600 account value divided by $1,000 = 8.6), then multiply the result by the number under the heading entitled “Expenses Paid During Period” to estimate the expenses you paid on your account during this period.
Hypothetical Example for Comparison Purposes
The fourth and fifth data columns in the table below provide information about hypothetical account values and hypothetical expenses based on the Portfolio’s actual expense ratio and an assumed rate of return of 5% per year before expenses, which is not the Portfolio’s actual return. The hypothetical account values and expenses may not be used to estimate the actual ending account balances or expenses you paid for the six-month period shown. You may use this information to compare the ongoing costs of investing in the Portfolio with the ongoing costs of investing in other mutual funds. To do so, compare this 5% hypothetical example with the 5% hypothetical examples that appear in the shareholder reports of the other mutual funds.
Please note that the expenses shown in the table are meant to highlight your ongoing costs only and do not reflect any transactional costs, such as exchange fees or sales charges (loads). Therefore, the fourth and fifth data columns of the table are useful in comparing ongoing costs only and will not help you determine the relative total costs of owning different funds. In addition, if these transactional costs were included, your costs would have been higher.
| Share Class | Beginning
Account
Value
7/1/22 | Ending Account
Value (Based
on Actual
Returns and
Expenses)
12/31/22 | Expenses
Paid
During
Period1 | Ending Account
Value (Based
on Hypothetical
5% Annualized
Return and
Actual Expenses)
12/31/22 | Expenses
Paid
During
Period1 | Net Expense
Ratio
During
Period2 |
| Initial Class Shares | $1,000.00 | $1,011.30 | $3.55 | $1,021.68 | $3.57 | 0.70% |
| Service Class Shares | $1,000.00 | $1,010.00 | $4.81 | $1,020.42 | $4.84 | 0.95% |
| 1. | Expenses are equal to the Portfolio’s annualized expense ratio of each class multiplied by the average account value over the period, divided by 365 and multiplied by 184 (to reflect the six-month period). The table above represents the actual expenses incurred during the six-month period. In addition to the fees and expenses which the Portfolio bears directly, it also indirectly bears a pro rata share of the fees and expenses of the underlying funds in which it invests. Such indirect expenses are not included in the above-reported expense figures. |
| 2. | Expenses are equal to the Portfolio's annualized expense ratio to reflect the six-month period. |
| 6 | MainStay VP IQ Hedge Multi-Strategy Portfolio |
Portfolio Composition as of December 31, 2022 (Unaudited)
| Unaffiliated Investment Company (a) | 22.6% |
| Investment Grade Corporate Bond Funds | 18.3 |
| Bank Loan Funds | 9.5 |
| Convertible Bond Funds | 9.0 |
| Emerging Equity Funds | 8.4 |
| U.S. Ultra Short Term Bond Funds | 8.3 |
| U.S. Medium Term Treasury Bond Funds | 7.2 |
| U.S. Large Cap Core Funds | 4.7 |
| High Yield Corporate Bond Funds | 4.2 |
| Floating Rate—Investment Grade Funds | 4.0 |
| International Equity Core Funds | 3.6 |
| Affiliated Investment Company | 3.4 |
| Gold Funds | 2.8 |
| U.S. Large Cap Growth Funds | 2.6 |
| Emerging Bonds—Local Currency Funds | 2.5 |
| Emerging Small Cap Equity Fund | 2.4% |
| U.S. Dollar Fund | 2.4 |
| U.S. Small Cap Growth Funds | 2.1 |
| Silver Funds | 1.3 |
| Europe Equity Funds | 0.9 |
| U.S. Momentum Fund | 0.9 |
| BRIC Equity Funds | 0.5 |
| U.S. REITS Funds | 0.4 |
| International Small Cap Equity Funds | 0.2 |
| Mortgage–Backed Security Funds | 0.2 |
| International Large Cap Growth Fund | 0.1 |
| Other Assets, Less Liabilities | –22.5 |
| | 100.0% |
| (a) | Represents a security purchased with cash collateral received for securities on loan. |
See Portfolio of Investments beginning on page 10 for specific holdings within these categories. The Portfolio's holdings are subject to change.
Top Ten Holdings and/or Issuers Held as of December 31, 2022 (excluding short-term investments) (Unaudited)
| 1. | Vanguard Short-Term Corporate Bond ETF |
| 2. | SPDR Bloomberg Convertible Securities ETF |
| 3. | iShares Trust iShares 1-5 Year Investment Grade Corporate Bond ETF |
| 4. | SPDR Blackstone Senior Loan ETF |
| 5. | Invesco Senior Loan ETF |
| 6. | IQ Ultra Short Duration ETF |
| 7. | iShares MSCI Emerging Markets Min Vol Factor ETF |
| 8. | Vanguard Intermediate-Term Treasury ETF |
| 9. | iShares Floating Rate Bond ETF |
| 10. | iShares Convertible Bond ETF |
Portfolio Management Discussion and Analysis (Unaudited)
Answers to the questions reflect the views of portfolio managers Greg Barrato and James Harrison of IndexIQ Advisors LLC, the Portfolio’s Subadvisor.
How did MainStay VP IQ Hedge Multi-Strategy Portfolio perform relative to its benchmarks and peers during the 12 months ended December 31, 2022?
For the 12 months ended December 31, 2022, MainStay VP IQ Hedge Multi-Strategy Portfolio returned −8.48% for Initial Class shares and −8.70% for Service Class shares. Over the same period, both share classes outperformed the −15.81% return for the S&P Balanced Equity and Bond Conservative Index, which is the Portfolio’s primary benchmark, and the Initial Class shares were in line with, while the Service Class shares slightly underperformed, the −8.48% return for the Barclay Fund of Funds Index, which is the Portfolio’s secondary benchmark. For the 12 months ended December 31, 2022, both share classes underperformed the −7.89% return of the IQ Hedge Multi-Strategy Index (“Underlying Index”) and the −3.01% return of the Morningstar Multistrategy Category Average.1
During the reporting period, were there any market events that materially impacted the Portfolio’s performance or liquidity?
Russia’s incursion into Ukraine, unsettlingly high inflation readings and unprecedented monetary policy tightening contributed to sharp volatility throughout the reporting period. While certainly not insulated from these challenges, the Portfolio’s diversified, rules-based approach led to more subdued volatility and more stable returns than the broad equity market.
What factors affected the Portfolio’s relative performance during the reporting period?
The Portfolio’s average asset allocation over the reporting period was 67.87% in fixed-income securities and 25.62% in equities, with the remainder in commodities, currencies, volatility and real estate. Although the Portfolio’s asset allocation mix was similar to the S&P Balanced Equity and Bond Conservative Index, which allocates 75% to U.S. Treasury bonds and 25% to U.S. equities, the Portfolio had a shorter duration profile as it was more exposed to short-term corporate bonds, floating-rate bonds and convertible securities among its fixed-income holdings. These shorter duration securities outperformed 7-to-10-year Treasury bonds included in the S&P Balanced Equity and Bond Conservative Index. Among its equity holdings, the Portfolio held exposure to energy, banks, industrials and health care, which outperformed
the broader U.S. equity market. Long positions in broad commodities, the U.S. dollar, global ex-U.S. real estate and short-term volatility also made positive contributions to excess returns. (Contributions take weightings and total returns into account.)
During the reporting period, how did the Portfolio’s performance correlate with traditional equity and fixed-income indices?
The Portfolio maintained a higher correlation to traditional equity indices and a lower correlation to investment-grade fixed-income indices. The Portfolio’s correlation to the S&P 500® Index2 was 90.3%. The Portfolio’s correlation to the Bloomberg U.S. Aggregate Bond Index3 was 45.3%.
During the reporting period, how did the Portfolio’s volatility compare to that of traditional fixed-income indices?
During the reporting period, the annualized daily volatility of the Portfolio was 7.16%, which was slightly higher as compared to the volatility of 6.23% for the Bloomberg U.S. Aggregate Bond Index.
During the reporting period, how did the Portfolio use derivatives and how was the Portfolio’s performance materially affected by investments in derivatives?
The Portfolio seeks to track, before fees and expenses, the performance of its Underlying Index, the IQ Hedge Multi-Strategy Index which includes both long and short. The Portfolio uses total return swaps to replicate long and short exposures in the Underlying Index. Derivatives were not used to gain leverage beyond that of the Underlying Index; rather, they were used exclusively to enable the Portfolio to track its Underlying Index.
How did you allocate the Portfolio’s assets among each of the strategies during the reporting period and why?
The Portfolio’s allocations are driven by the weightings of the component securities in the Underlying Index, which uses quantitative models to determine the weights across the various hedge fund investment styles represented in the Underlying Index, as well as the weights of the assets within these styles. During the
| 1. | See page 5 for more information on benchmark and peer group returns. |
| 2. | “S&P 500®” is a trademark of The McGraw-Hill Companies, Inc. The S&P 500® Index is widely regarded as the standard index for measuring large-cap U.S. stock market performance. Results assume reinvestment of all dividends and capital gains. An investment cannot be made directly in an index. |
| 3. | The Bloomberg U.S. Aggregate Bond Index is a broad-based benchmark that measures the investment grade, U.S. dollar-denominated, fixed-rate taxable bond market, including Treasuries, government-related and corporate securities, mortgage-backed securities (agency fixed-rate and hybrid adjustable rate mortgage passthroughs), asset-backed securities and commercial mortgage-backed securities. Results assume reinvestment of all dividends and capital gains. An investment cannot be made directly in an index. |
| 8 | MainStay VP IQ Hedge Multi-Strategy Portfolio |
reporting period, the Portfolio sought to replicate the weights and component securities in the Underlying Index.
How did the tactical allocation among the hedge fund investment styles affect the Portfolio’s performance during the reporting period?
The Portfolio allocates its assets among six underlying hedge fund investment styles: emerging markets, market neutral, long/short equity, event-driven, fixed-income arbitrage and global macro. During the reporting period, the Portfolio maintained gross exposure ranging from 100% to 120% due to periodic short allocations across its underlying investment styles.
The aggregate performance of the weighted Underlying Index versus an equal-weighted allocation of the same investment styles indicates that the Portfolio experienced a positive allocation effect attributable to weighting changes during the reporting period.
During the reporting period, how did each investment style either contribute to or detract from the Portfolio’s absolute performance?
During the reporting period, a negative exposure to the market-neutral investment style provided the strongest positive contribution to the Portfolio's absolute performance. (Contributions take weightings and total returns into account.) The Portfolio’s event-driven, emerging-market, long/short, global macro and fixed-income arbitrage investment styles each made negative contributions to absolute returns.
How did the Portfolio’s investment style weightings change during the reporting period?
The Portfolio’s allocation to its event-driven investment style remained at its maximum weight of 33.3% during the reporting period. In 2022, the Portfolio’s allocation to its long/short investment style averaged 14.65% in the first quarter, 18.02% in the second quarter, 10.04% in the third quarter and 10.22% in the fourth quarter. The Portfolio’s allocation to the fixed-income arbitrage investment style averaged 13.02% in the first quarter, 14.56% in the second quarter, 15.24% in the third quarter and 7.51% in the fourth quarter. The Portfolio’s allocation to its market neutral investment style remained steadily negative, averaging −16.67% in the first and second quarters, −16.44% in the third quarter and −16.66% in the fourth quarter. The Portfolio’s allocation to its emerging market investment style averaged 33.04% in the first quarter, 22.49% in the second quarter, 24.50% in the third quarter and 32.27% in the fourth quarter. The Portfolio’s allocation to its global macro investment style averaged
22.62% in the first quarter and 28.26% in the second quarter before reaching its 33.33% cap in the third and fourth quarters.
The opinions expressed are those of the portfolio managers as of the date of this report and are subject to change. There is no guarantee that any forecasts will come to pass. This material does not constitute investment advice and is not intended as an endorsement of any specific investment.
Not all MainStay VP Portfolios and/or share classes are available under all policies.
Portfolio of Investments December 31, 2022†
| | Shares | Value |
| Exchange-Traded Funds 93.4% |
| Bonds 66.6% |
| Affiliated Investment Company 3.4% |
| IQ Ultra Short Duration ETF (a) | 204,125 | $ 9,689,814 |
| Bank Loan Funds 9.5% |
| Invesco Senior Loan ETF (b) | 512,246 | 10,516,410 |
| SPDR Blackstone Senior Loan ETF (b) | 405,971 | 16,604,214 |
| | | 27,120,624 |
| Convertible Bond Funds 9.0% |
| iShares Convertible Bond ETF (b) | 109,451 | 7,603,561 |
| SPDR Bloomberg Convertible Securities ETF (b) | 280,482 | 18,046,213 |
| | | 25,649,774 |
| Emerging Bonds—Local Currency Funds 2.5% |
| SPDR Bloomberg Emerging Markets Local Bond ETF | 149,528 | 3,074,296 |
| VanEck J.P. Morgan EM Local Currency Bond ETF | 167,820 | 4,066,278 |
| | | 7,140,574 |
| Floating Rate—Investment Grade Funds 4.0% |
| iShares Floating Rate Bond ETF (b) | 166,807 | 8,395,396 |
| SPDR Bloomberg Investment Grade Floating Rate ETF | 95,168 | 2,892,156 |
| | | 11,287,552 |
| High Yield Corporate Bond Funds 4.2% |
| iShares iBoxx High Yield Corporate Bond ETF (b) | 93,587 | 6,890,811 |
| SPDR Bloomberg High Yield Bond ETF (b) | 40,612 | 3,655,080 |
| Xtrackers USD High Yield Corporate Bond ETF (b) | 45,824 | 1,544,727 |
| | | 12,090,618 |
| Investment Grade Corporate Bond Funds 18.3% |
| iShares Broad USD Investment Grade Corporate Bond ETF | 4,577 | 224,776 |
| iShares iBoxx $ Investment Grade Corporate Bond ETF | 10,676 | 1,125,571 |
| iShares Trust iShares 1-5 Year Investment Grade Corporate Bond ETF (b) | 354,261 | 17,649,283 |
| Vanguard Intermediate-Term Corporate Bond ETF | 15,897 | 1,232,177 |
| Vanguard Short-Term Corporate Bond ETF (c) | 428,791 | 32,240,795 |
| | | 52,472,602 |
| | Shares | Value |
| |
| Mortgage-Backed Security Funds 0.2% |
| iShares MBS ETF | 4,131 | $ 383,150 |
| SPDR Portfolio Mortgage-Backed Bond ETF | 2,947 | 63,950 |
| Vanguard Mortgage-Backed Securities ETF | 5,222 | 237,706 |
| | | 684,806 |
| U.S. Medium Term Treasury Bond Funds 7.2% |
| iShares 3-7 Year Treasury Bond ETF (b) | 64,553 | 7,416,494 |
| Schwab Intermediate-Term U.S. Treasury ETF | 98,708 | 4,859,395 |
| Vanguard Intermediate-Term Treasury ETF (b) | 144,424 | 8,445,915 |
| | | 20,721,804 |
| U.S. Ultra Short Term Bond Funds 8.3% |
| Goldman Sachs Access Treasury 0-1 Year ETF | 55,874 | 5,571,197 |
| Invesco Treasury Collateral ETF | 65,920 | 6,944,013 |
| iShares Short Treasury Bond ETF | 52,121 | 5,729,140 |
| SPDR Bloomberg 1-3 Month T-Bill ETF | 59,050 | 5,401,303 |
| | | 23,645,653 |
Total Bonds
(Cost $199,839,764) | | 190,503,821 |
| Equities 26.4% |
| BRIC Equity Funds 0.5% |
| iShares MSCI China ETF (b) | 28,028 | 1,331,330 |
| SPDR S&P China ETF | 2,561 | 200,680 |
| | | 1,532,010 |
| Emerging Equity Funds 8.4% |
| iShares Core MSCI Emerging Markets ETF | 151,263 | 7,063,982 |
| iShares MSCI Emerging Markets Min Vol Factor ETF | 159,456 | 8,459,141 |
| Schwab Emerging Markets Equity ETF | 39,268 | 929,474 |
| Vanguard FTSE Emerging Markets ETF | 194,773 | 7,592,251 |
| | | 24,044,848 |
| Emerging Small Cap Equity Fund 2.4% |
| SPDR S&P Emerging Markets SmallCap ETF (b) | 140,744 | 6,888,011 |
| Europe Equity Funds 0.9% |
| iShares Core MSCI Europe ETF (b) | 9,246 | 439,185 |
| JPMorgan BetaBuilders Europe ETF | 8,695 | 421,707 |
The notes to the financial statements are an integral part of, and should be read in conjunction with, the financial statements.
| 10 | MainStay VP IQ Hedge Multi-Strategy Portfolio |
| | Shares | Value |
| Equities (continued) |
| Europe Equity Funds (continued) |
| Vanguard FTSE Europe ETF (b) | 32,490 | $ 1,801,246 |
| | | 2,662,138 |
| International Equity Core Funds 3.6% |
| iShares Core MSCI EAFE ETF | 78,117 | 4,815,132 |
| Vanguard FTSE Developed Markets ETF | 128,653 | 5,399,566 |
| | | 10,214,698 |
| International Large Cap Growth Fund 0.1% |
| iShares MSCI EAFE Growth ETF | 2,085 | 174,640 |
| International Small Cap Equity Funds 0.2% |
| Schwab International Small-Cap Equity ETF | 4,161 | 130,947 |
| Vanguard FTSE All World ex-US Small-Cap ETF (b) | 2,850 | 293,008 |
| | | 423,955 |
| U.S. Large Cap Core Funds 4.7% |
| Energy Select Sector SPDR Fund | 28,012 | 2,450,210 |
| Financial Select Sector SPDR Fund | 81,880 | 2,800,296 |
| Health Care Select Sector SPDR Fund (b) | 20,708 | 2,813,182 |
| iShares MSCI USA Quality Factor ETF | 15,330 | 1,747,007 |
| Vanguard Energy ETF | 4,227 | 512,650 |
| Vanguard Financials ETF | 9,337 | 772,450 |
| Vanguard Health Care ETF (b) | 9,342 | 2,317,283 |
| | | 13,413,078 |
| U.S. Large Cap Growth Funds 2.6% |
| Schwab U.S. Large-Cap Growth ETF (b) | 17,984 | 999,191 |
| Vanguard Growth ETF (b) | 23,788 | 5,069,461 |
| Vanguard Mega Cap Growth ETF | 4,094 | 704,454 |
| Vanguard Russell 1000 Growth ETF | 11,780 | 649,314 |
| | | 7,422,420 |
| U.S. Momentum Fund 0.9% |
| iShares MSCI USA Momentum Factor ETF | 17,200 | 2,509,996 |
| U.S. Small Cap Growth Funds 2.1% |
| iShares Russell 2000 Growth ETF (b) | 11,165 | 2,395,116 |
| SPDR S&P 600 Small Cap Growth ETF (b) | 7,916 | 571,852 |
| Vanguard Small-Cap Growth ETF (b) | 15,789 | 3,166,326 |
| | | 6,133,294 |
Total Equities
(Cost $77,139,431) | | 75,419,088 |
| | Shares | Value |
| Real Estate 0.4% |
| U.S. REITS Funds 0.4% |
| Fidelity MSCI Real Estate Index ETF (b) | 1,964 | $ 48,727 |
| iShares Core U.S. REIT ETF | 1,259 | 62,258 |
| Vanguard Real Estate ETF (b) | 13,578 | 1,119,913 |
Toal Real Estate
(Cost $1,417,576) | | 1,230,898 |
Total Exchange-Traded Funds
(Cost $278,396,771) | | 267,153,807 |
| Exchange-Traded Vehicles 6.5% |
| Commodities 4.1% |
| Gold Funds 2.8% |
| abrdn Physical Gold Shares ETF (b)(d) | 31,801 | 555,563 |
| Graniteshares Gold Trust (d) | 11,562 | 208,694 |
| iShares Gold Trust (d) | 177,766 | 6,148,926 |
| SPDR Gold MiniShares Trust (d) | 33,208 | 1,201,798 |
| | | 8,114,981 |
| Silver Funds 1.3% |
| abrdn Physical Silver Shares ETF (b)(d) | 13,698 | 314,780 |
| iShares Silver Trust (d) | 149,019 | 3,281,398 |
| | | 3,596,178 |
Total Commodities
(Cost $11,362,260) | | 11,711,159 |
| Currency 2.4% |
| U.S. Dollar Fund 2.4% |
| Invesco DB U.S. Dollar Index Bullish Fund (b) | 247,938 | 6,895,156 |
Total Exchange-Traded Vehicles
(Cost $17,919,747) | | 18,606,315 |
| |
| Short-Term Investments 22.6% |
| Affiliated Investment Company 0.0% ‡ |
| MainStay U.S. Government Liquidity Fund, 3.60% (e) | 67,109 | 67,109 |
The notes to the financial statements are an integral part of, and should be read in conjunction with, the financial statements.
11
Portfolio of Investments December 31, 2022† (continued)
| | Shares | | Value |
| Short-Term Investments (continued) |
| Unaffiliated Investment Company 22.6% |
| Invesco Government and Agency Portfolio, 4.30% (e)(f) | 64,618,533 | | $ 64,618,533 |
Total Short-Term Investments
(Cost $64,685,642) | | | 64,685,642 |
Total Investments
(Cost $361,002,160) | 122.5% | | 350,445,764 |
| Other Assets, Less Liabilities | (22.5) | | (64,370,573) |
| Net Assets | 100.0% | | $ 286,075,191 |
| † | Percentages indicated are based on Portfolio net assets. |
| ‡ | Less than one-tenth of a percent. |
| (a) | As of December 31, 2022, the Portfolio's ownership exceeds 5% of the outstanding shares of the Underlying Portfolio's share class. |
| (b) | All or a portion of this security was held on loan. As of December 31, 2022, the aggregate market value of securities on loan was $66,360,442; the total market value of collateral held by the Portfolio was $68,299,241. The market value of the collateral held included non-cash collateral in the form of U.S. Treasury securities with a value of $3,680,708. The Portfolio received cash collateral with a value of $64,618,533. (See Note 2(I)) |
| (c) | Represents a security, or portion thereof, which was maintained at the broker as collateral for swaps contracts. |
| (d) | Non-income producing security. |
| (e) | Current yield as of December 31, 2022. |
| (f) | Represents a security purchased with cash collateral received for securities on loan. |
Investments in Affiliates (in 000's)
Investments in issuers considered to be affiliate(s) of the Portfolio during the year ended December 31, 2022 for purposes of Section 2(a)(3) of the Investment Company Act of 1940, as amended, were as follows:
| Affiliated Investment Companies | Value,
Beginning
of Year | Purchases
at Cost | Proceeds
from
Sales | Net
Realized
Gain/(Loss)
on Sales | Change in
Unrealized
Appreciation/
(Depreciation) | Value,
End of
Year | Dividend
Income | Other
Distributions | Shares
End of
Year |
| IQ Ultra Short Duration ETF | $ 23,656 | $ 12,741 | $ (26,030) | $ (1,091) | $ 414 | $ 9,690 | $ 466 | $ — | 204 |
| MainStay U.S. Government Liquidity Fund | 1,744 | 31,099 | (32,776) | — | — | 67 | 8 | — | 67 |
| | $ 25,400 | $ 43,840 | $ (58,806) | $ (1,091) | $ 414 | $ 9,757 | $ 474 | $ — | |
The notes to the financial statements are an integral part of, and should be read in conjunction with, the financial statements.
| 12 | MainStay VP IQ Hedge Multi-Strategy Portfolio |
Swap Contracts
Open OTC total return equity swap contracts as of December 31, 2022 were as follows1:
Swap
Counterparty | Reference Obligation | Floating Rate2 | Termination
Date(s) | Payment
Frequency
Paid/
Received | Notional
Amount
Long/
(Short)
(000)3 | Unrealized
Appreciation/
(Depreciation)4 |
| Bank of America Merrill Lynch | abrdn Physical Gold Shares ETF | Federal Funds Composite Interest Rate plus 0.50% | 3/2/23 | Overnight | 28 | $ — |
| Morgan Stanley & Co. | abrdn Physical Gold Shares ETF | Federal Fund Rate plus 0.50% | 9/16/24 | Monthly | 28 | — |
| Bank of America Merrill Lynch | abrdn Physical Silver Shares ETF | Federal Funds Composite Interest Rate plus 0.50% | 3/2/23 | Overnight | 16 | — |
| Morgan Stanley & Co. | abrdn Physical Silver Shares ETF | Federal Fund Rate plus 0.50% | 9/16/24 | Monthly | 16 | — |
| Bank of America Merrill Lynch | Consumer Discretionary Select Sector SPDR Fund | Federal Funds Composite Interest Rate | 3/2/23 | Overnight | (239) | — |
| Morgan Stanley & Co. | Consumer Discretionary Select Sector SPDR Fund | Federal Fund Rate minus 0.148% | 9/16/24 | Monthly | (239) | — |
| Bank of America Merrill Lynch | Energy Select Sector SPDR Fund | Federal Funds Composite Interest Rate plus 0.50% | 3/2/23 | Overnight | 123 | — |
| Morgan Stanley & Co. | Energy Select Sector SPDR Fund | Federal Fund Rate plus 0.50% | 9/16/24 | Monthly | 123 | — |
| Bank of America Merrill Lynch | Fidelity MSCI Real Estate Index ETF | Federal Funds Composite Interest Rate plus 0.50% | 3/2/23 | Overnight | 2 | — |
| Morgan Stanley & Co. | Fidelity MSCI Real Estate Index ETF | Federal Fund Rate plus 0.50% | 9/16/24 | Monthly | 2 | — |
| Bank of America Merrill Lynch | Financial Select Sector SPDR Fund | Federal Funds Composite Interest Rate plus 0.50% | 3/2/23 | Overnight | 140 | — |
| Morgan Stanley & Co. | Financial Select Sector SPDR Fund | Federal Fund Rate plus 0.50% | 9/16/24 | Monthly | 140 | — |
| Bank of America Merrill Lynch | FlexShares Global Upstream Natural Resources Index Fund | Federal Funds Composite Interest Rate | 3/2/23 | Overnight | (439) | — |
| Morgan Stanley & Co. | FlexShares Global Upstream Natural Resources Index Fund | Federal Fund Rate minus 0.35% | 9/16/24 | Monthly | (439) | — |
| Bank of America Merrill Lynch | Goldman Sachs Access Treasury 0-1 Year ETF | Federal Funds Composite Interest Rate plus 0.50% | 3/2/23 | Overnight | 279 | — |
| Morgan Stanley & Co. | Goldman Sachs Access Treasury 0-1 Year ETF | Federal Fund Rate plus 0.50% | 9/16/24 | Monthly | 279 | — |
| Bank of America Merrill Lynch | Graniteshares Gold Trust | Federal Funds Composite Interest Rate plus 0.50% | 3/2/23 | Overnight | 10 | — |
| Morgan Stanley & Co. | Graniteshares Gold Trust | Federal Fund Rate plus 0.50% | 9/16/24 | Monthly | 10 | — |
| Bank of America Merrill Lynch | Health Care Select Sector SPDR Fund | Federal Funds Composite Interest Rate plus 0.50% | 3/2/23 | Overnight | 141 | — |
| Morgan Stanley & Co. | Health Care Select Sector SPDR Fund | Federal Fund Rate plus 0.50% | 9/16/24 | Monthly | 141 | — |
| Bank of America Merrill Lynch | Industrial Select Sector SPDR Fund | Federal Funds Composite Interest Rate | 3/2/23 | Overnight | (253) | — |
| Morgan Stanley & Co. | Industrial Select Sector SPDR Fund | Federal Fund Rate minus 0.15% | 9/16/24 | Monthly | (253) | — |
| Bank of America Merrill Lynch | Invesco DB U.S. Dollar Index Bullish Fund | Federal Funds Composite Interest Rate plus 0.50% | 3/2/23 | Overnight | 346 | — |
| Morgan Stanley & Co. | Invesco DB U.S. Dollar Index Bullish Fund | Federal Fund Rate plus 0.50% | 9/16/24 | Monthly | 346 | — |
| Bank of America Merrill Lynch | Invesco Senior Loan ETF | Federal Funds Composite Interest Rate plus 0.50% | 3/2/23 | Overnight | 527 | — |
| Morgan Stanley & Co. | Invesco Senior Loan ETF | Federal Fund Rate plus 0.50% | 9/16/24 | Monthly | 527 | — |
| Bank of America Merrill Lynch | Invesco Treasury Collateral ETF | Federal Funds Composite Interest Rate plus 0.50% | 3/2/23 | Overnight | 348 | — |
| Morgan Stanley & Co. | Invesco Treasury Collateral ETF | Federal Fund Rate plus 0.50% | 9/16/24 | Monthly | 348 | — |
The notes to the financial statements are an integral part of, and should be read in conjunction with, the financial statements.
13
Portfolio of Investments December 31, 2022† (continued)
Swap
Counterparty | Reference Obligation | Floating Rate2 | Termination
Date(s) | Payment
Frequency
Paid/
Received | Notional
Amount
Long/
(Short)
(000)3 | Unrealized
Appreciation/
(Depreciation)4 |
| Bank of America Merrill Lynch | Invesco Variable Rate Preferred ETF | Federal Funds Composite Interest Rate | 3/2/23 | Overnight | (1,889) | $ — |
| Morgan Stanley & Co. | Invesco Variable Rate Preferred ETF | Federal Fund Rate minus 18.98% | 9/16/24 | Monthly | (1,889) | — |
| Bank of America Merrill Lynch | IQ Ultra Short Duration ETF | Federal Funds Composite Interest Rate plus 0.50% | 3/2/23 | Overnight | 486 | — |
| Morgan Stanley & Co. | IQ Ultra Short Duration ETF | Federal Fund Rate plus 0.50% | 9/16/24 | Monthly | 486 | — |
| Bank of America Merrill Lynch | iShares 0-5 Year High Yield Corporate Bond ETF | Federal Funds Composite Interest Rate | 3/2/23 | Overnight | (1,235) | — |
| Morgan Stanley & Co. | iShares 0-5 Year High Yield Corporate Bond ETF | Federal Fund Rate minus 3.33% | 9/16/24 | Monthly | (1,235) | — |
| Bank of America Merrill Lynch | iShares 20+ Year Treasury Bond ETF | Federal Funds Composite Interest Rate | 3/2/23 | Overnight | (213) | — |
| Morgan Stanley & Co. | iShares 20+ Year Treasury Bond ETF | Federal Fund Rate minus 0.35% | 9/16/24 | Monthly | (213) | — |
| Bank of America Merrill Lynch | iShares 3-7 Year Treasury Bond ETF | Federal Funds Composite Interest Rate plus 0.50% | 3/2/23 | Overnight | 372 | — |
| Morgan Stanley & Co. | iShares 3-7 Year Treasury Bond ETF | Federal Fund Rate plus 0.50% | 9/16/24 | Monthly | 372 | — |
| Bank of America Merrill Lynch | iShares Broad USD Investment Grade Corporate Bond ETF | Federal Funds Composite Interest Rate plus 0.50% | 3/2/23 | Overnight | 11 | — |
| Morgan Stanley & Co. | iShares Broad USD Investment Grade Corporate Bond ETF | Federal Fund Rate plus 0.50% | 9/16/24 | Monthly | 11 | — |
| Bank of America Merrill Lynch | iShares Convertible Bond ETF | Federal Funds Composite Interest Rate plus 0.50% | 3/2/23 | Overnight | 381 | — |
| Morgan Stanley & Co. | iShares Convertible Bond ETF | Federal Fund Rate plus 0.50% | 9/16/24 | Monthly | 381 | — |
| Bank of America Merrill Lynch | iShares Core MSCI EAFE ETF | Federal Funds Composite Interest Rate plus 0.50% | 3/2/23 | Overnight | 241 | — |
| Morgan Stanley & Co. | iShares Core MSCI EAFE ETF | Federal Fund Rate plus 0.50% | 9/16/24 | Monthly | 241 | — |
| Bank of America Merrill Lynch | iShares Core MSCI Emerging Markets ETF | Federal Funds Composite Interest Rate plus 0.50% | 3/2/23 | Overnight | 354 | — |
| Morgan Stanley & Co. | iShares Core MSCI Emerging Markets ETF | Federal Fund Rate plus 0.50% | 9/16/24 | Monthly | 354 | — |
| Bank of America Merrill Lynch | iShares Core MSCI Europe ETF | Federal Funds Composite Interest Rate plus 0.50% | 3/2/23 | Overnight | 22 | — |
| Morgan Stanley & Co. | iShares Core MSCI Europe ETF | Federal Fund Rate plus 0.50% | 9/16/24 | Monthly | 22 | — |
| Bank of America Merrill Lynch | iShares Core U.S. REIT ETF | Federal Funds Composite Interest Rate plus 0.50% | 3/2/23 | Overnight | 3 | — |
| Morgan Stanley & Co. | iShares Core U.S. REIT ETF | Federal Fund Rate plus 0.50% | 9/16/24 | Monthly | 3 | — |
| Bank of America Merrill Lynch | iShares Floating Rate Bond ETF | Federal Funds Composite Interest Rate plus 0.50% | 3/2/23 | Overnight | 421 | — |
| Morgan Stanley & Co. | iShares Floating Rate Bond ETF | Federal Fund Rate plus 0.50% | 9/16/24 | Monthly | 421 | — |
| Bank of America Merrill Lynch | iShares Gold Trust | Federal Funds Composite Interest Rate plus 0.50% | 3/2/23 | Overnight | 308 | — |
| Morgan Stanley & Co. | iShares Gold Trust | Federal Fund Rate plus 0.50% | 9/16/24 | Monthly | 308 | — |
| Bank of America Merrill Lynch | iShares iBoxx $ Investment Grade Corporate Bond ETF | Federal Funds Composite Interest Rate plus 0.50% | 3/2/23 | Overnight | 56 | — |
| Morgan Stanley & Co. | iShares iBoxx $ Investment Grade Corporate Bond ETF | Federal Fund Rate plus 0.50% | 9/16/24 | Monthly | 56 | — |
| Bank of America Merrill Lynch | iShares iBoxx High Yield Corporate Bond ETF | Federal Funds Composite Interest Rate plus 0.50% | 3/2/23 | Overnight | 345 | — |
The notes to the financial statements are an integral part of, and should be read in conjunction with, the financial statements.
| 14 | MainStay VP IQ Hedge Multi-Strategy Portfolio |
Swap
Counterparty | Reference Obligation | Floating Rate2 | Termination
Date(s) | Payment
Frequency
Paid/
Received | Notional
Amount
Long/
(Short)
(000)3 | Unrealized
Appreciation/
(Depreciation)4 |
| Morgan Stanley & Co. | iShares iBoxx High Yield Corporate Bond ETF | Federal Fund Rate plus 0.50% | 9/16/24 | Monthly | 345 | $ — |
| Bank of America Merrill Lynch | iShares J.P. Morgan USD Emerging Markets Bond ETF | Federal Funds Composite Interest Rate | 3/2/23 | Overnight | (1,535) | — |
| Morgan Stanley & Co. | iShares J.P. Morgan USD Emerging Markets Bond ETF | Federal Fund Rate minus 0.35% | 9/16/24 | Monthly | (1,535) | — |
| Bank of America Merrill Lynch | iShares MBS ETF | Federal Funds Composite Interest Rate plus 0.50% | 3/2/23 | Overnight | 19 | — |
| Morgan Stanley & Co. | iShares MBS ETF | Federal Fund Rate plus 0.50% | 9/16/24 | Monthly | 19 | — |
| Bank of America Merrill Lynch | iShares MSCI China ETF | Federal Funds Composite Interest Rate plus 0.50% | 3/2/23 | Overnight | 67 | — |
| Morgan Stanley & Co. | iShares MSCI China ETF | Federal Fund Rate plus 0.50% | 9/16/24 | Monthly | 67 | — |
| Bank of America Merrill Lynch | iShares MSCI EAFE Growth ETF | Federal Funds Composite Interest Rate plus 0.50% | 3/2/23 | Overnight | 9 | — |
| Morgan Stanley & Co. | iShares MSCI EAFE Growth ETF | Federal Fund Rate plus 0.50% | 9/16/24 | Monthly | 9 | — |
| Bank of America Merrill Lynch | iShares MSCI Emerging Markets Min Vol Factor ETF | Federal Funds Composite Interest Rate plus 0.50% | 3/2/23 | Overnight | 424 | — |
| Morgan Stanley & Co. | iShares MSCI Emerging Markets Min Vol Factor ETF | Federal Fund Rate plus 0.50% | 9/16/24 | Monthly | 424 | — |
| Bank of America Merrill Lynch | iShares MSCI Global Min Vol Factor ETF | Federal Funds Composite Interest Rate | 3/2/23 | Overnight | (1,820) | — |
| Morgan Stanley & Co. | iShares MSCI Global Min Vol Factor ETF | Federal Fund Rate minus 0.58% | 9/16/24 | Monthly | (1,820) | — |
| Bank of America Merrill Lynch | iShares MSCI Japan ETF | Federal Funds Composite Interest Rate | 3/2/23 | Overnight | (393) | — |
| Morgan Stanley & Co. | iShares MSCI Japan ETF | Federal Fund Rate minus 0.73% | 9/16/24 | Monthly | (393) | — |
| Bank of America Merrill Lynch | iShares MSCI USA Momentum Factor ETF | Federal Funds Composite Interest Rate plus 0.50% | 3/2/23 | Overnight | 126 | — |
| Morgan Stanley & Co. | iShares MSCI USA Momentum Factor ETF | Federal Fund Rate plus 0.50% | 9/16/24 | Monthly | 126 | — |
| Bank of America Merrill Lynch | iShares MSCI USA Quality Factor ETF | Federal Funds Composite Interest Rate plus 0.50% | 3/2/23 | Overnight | 88 | — |
| Morgan Stanley & Co. | iShares MSCI USA Quality Factor ETF | Federal Fund Rate plus 0.50% | 9/16/24 | Monthly | 88 | — |
| Bank of America Merrill Lynch | iShares Preferred & Income Securities ETF | Federal Funds Composite Interest Rate | 3/2/23 | Overnight | (1,007) | — |
| Morgan Stanley & Co. | iShares Preferred & Income Securities ETF | Federal Fund Rate minus 1.08% | 9/16/24 | Monthly | (1,007) | — |
| Bank of America Merrill Lynch | iShares Russell 2000 Growth ETF | Federal Funds Composite Interest Rate plus 0.50% | 3/2/23 | Overnight | 120 | — |
| Morgan Stanley & Co. | iShares Russell 2000 Growth ETF | Federal Fund Rate plus 0.50% | 9/16/24 | Monthly | 120 | — |
| Bank of America Merrill Lynch | iShares Russell 2000 Value ETF | Federal Funds Composite Interest Rate | 3/2/23 | Overnight | (91) | — |
| Morgan Stanley & Co. | iShares Russell 2000 Value ETF | Federal Fund Rate minus 0.68% | 9/16/24 | Monthly | (91) | — |
| Bank of America Merrill Lynch | iShares S&P Small-Cap 600 Value ETF | Federal Funds Composite Interest Rate | 3/2/23 | Overnight | (52) | — |
| Morgan Stanley & Co. | iShares S&P Small-Cap 600 Value ETF | Federal Fund Rate minus 2.98% | 9/16/24 | Monthly | (52) | — |
| Bank of America Merrill Lynch | iShares Short Treasury Bond ETF | Federal Funds Composite Interest Rate plus 0.50% | 3/2/23 | Overnight | 287 | — |
| Morgan Stanley & Co. | iShares Short Treasury Bond ETF | Federal Fund Rate plus 0.50% | 9/16/24 | Monthly | 287 | — |
The notes to the financial statements are an integral part of, and should be read in conjunction with, the financial statements.
15
Portfolio of Investments December 31, 2022† (continued)
Swap
Counterparty | Reference Obligation | Floating Rate2 | Termination
Date(s) | Payment
Frequency
Paid/
Received | Notional
Amount
Long/
(Short)
(000)3 | Unrealized
Appreciation/
(Depreciation)4 |
| Bank of America Merrill Lynch | iShares Silver Trust | Federal Funds Composite Interest Rate plus 0.50% | 3/2/23 | Overnight | 164 | $ — |
| Morgan Stanley & Co. | iShares Silver Trust | Federal Fund Rate plus 0.50% | 9/16/24 | Monthly | 164 | — |
| Bank of America Merrill Lynch | iShares TIPS Bond ETF | Federal Funds Composite Interest Rate | 3/2/23 | Overnight | (1,183) | — |
| Morgan Stanley & Co. | iShares TIPS Bond ETF | Federal Fund Rate minus 0.35% | 9/16/24 | Monthly | (1,183) | — |
| Bank of America Merrill Lynch | iShares Trust iShares 1-5 Year Investment Grade Corporate Bond ETF | Federal Funds Composite Interest Rate plus 0.50% | 3/2/23 | Overnight | 885 | — |
| Morgan Stanley & Co. | iShares Trust iShares 1-5 Year Investment Grade Corporate Bond ETF | Federal Fund Rate plus 0.50% | 9/16/24 | Monthly | 885 | — |
| Bank of America Merrill Lynch | iShares U.S. Industrials ETF | Federal Funds Composite Interest Rate | 3/2/23 | Overnight | (19) | — |
| Morgan Stanley & Co. | iShares U.S. Industrials ETF | Federal Fund Rate minus 7.83% | 9/16/24 | Monthly | (19) | — |
| Bank of America Merrill Lynch | JPMorgan BetaBuilders Europe ETF | Federal Funds Composite Interest Rate plus 0.50% | 3/2/23 | Overnight | 21 | — |
| Morgan Stanley & Co. | JPMorgan BetaBuilders Europe ETF | Federal Fund Rate plus 0.50% | 9/16/24 | Monthly | 21 | — |
| Bank of America Merrill Lynch | JPMorgan BetaBuilders Japan ETF | Federal Funds Composite Interest Rate | 3/2/23 | Overnight | (293) | — |
| Morgan Stanley & Co. | JPMorgan BetaBuilders Japan ETF | Federal Fund Rate minus 5.78% | 9/16/24 | Monthly | (293) | — |
| Bank of America Merrill Lynch | Schwab Emerging Markets Equity ETF | Federal Funds Composite Interest Rate plus 0.50% | 3/2/23 | Overnight | 47 | — |
| Morgan Stanley & Co. | Schwab Emerging Markets Equity ETF | Federal Fund Rate plus 0.50% | 9/16/24 | Monthly | 47 | — |
| Bank of America Merrill Lynch | Schwab Intermediate-Term U.S. Treasury ETF | Federal Funds Composite Interest Rate plus 0.50% | 3/2/23 | Overnight | 244 | — |
| Morgan Stanley & Co. | Schwab Intermediate-Term U.S. Treasury ETF | Federal Fund Rate plus 0.50% | 9/16/24 | Monthly | 244 | — |
| Bank of America Merrill Lynch | Schwab International Small-Cap Equity ETF | Federal Funds Composite Interest Rate plus 0.50% | 3/2/23 | Overnight | 7 | — |
| Morgan Stanley & Co. | Schwab International Small-Cap Equity ETF | Federal Fund Rate plus 0.50% | 9/16/24 | Monthly | 7 | — |
| Bank of America Merrill Lynch | Schwab U.S. Large-Cap Growth ETF | Federal Funds Composite Interest Rate plus 0.50% | 3/2/23 | Overnight | 50 | — |
| Morgan Stanley & Co. | Schwab U.S. Large-Cap Growth ETF | Federal Fund Rate plus 0.50% | 9/16/24 | Monthly | 50 | — |
| Bank of America Merrill Lynch | Schwab U.S. TIPS ETF | Federal Funds Composite Interest Rate | 3/2/23 | Overnight | (670) | — |
| Morgan Stanley & Co. | Schwab U.S. TIPS ETF | Federal Fund Rate minus 0.58% | 9/16/24 | Monthly | (670) | — |
| Bank of America Merrill Lynch | SPDR Blackstone Senior Loan ETF | Federal Funds Composite Interest Rate plus 0.50% | 3/2/23 | Overnight | 832 | — |
| Morgan Stanley & Co. | SPDR Blackstone Senior Loan ETF | Federal Fund Rate plus 0.50% | 9/16/24 | Monthly | 832 | — |
| Bank of America Merrill Lynch | SPDR Bloomberg 1-3 Month T-Bill ETF | Federal Funds Composite Interest Rate plus 0.50% | 3/2/23 | Overnight | 271 | — |
| Morgan Stanley & Co. | SPDR Bloomberg 1-3 Month T-Bill ETF | Federal Fund Rate plus 0.50% | 9/16/24 | Monthly | 271 | — |
| Bank of America Merrill Lynch | SPDR Bloomberg Convertible Securities ETF | Federal Funds Composite Interest Rate plus 0.50% | 3/2/23 | Overnight | 905 | — |
| Morgan Stanley & Co. | SPDR Bloomberg Convertible Securities ETF | Federal Fund Rate plus 0.50% | 9/16/24 | Monthly | 905 | — |
| Bank of America Merrill Lynch | SPDR Bloomberg Emerging Markets Local Bond ETF | Federal Funds Composite Interest Rate plus 0.50% | 3/2/23 | Overnight | 154 | — |
The notes to the financial statements are an integral part of, and should be read in conjunction with, the financial statements.
| 16 | MainStay VP IQ Hedge Multi-Strategy Portfolio |
Swap
Counterparty | Reference Obligation | Floating Rate2 | Termination
Date(s) | Payment
Frequency
Paid/
Received | Notional
Amount
Long/
(Short)
(000)3 | Unrealized
Appreciation/
(Depreciation)4 |
| Morgan Stanley & Co. | SPDR Bloomberg Emerging Markets Local Bond ETF | Federal Fund Rate plus 0.50% | 9/16/24 | Monthly | 154 | $ — |
| Bank of America Merrill Lynch | SPDR Bloomberg High Yield Bond ETF | Federal Funds Composite Interest Rate plus 0.50% | 3/2/23 | Overnight | 183 | — |
| Morgan Stanley & Co. | SPDR Bloomberg High Yield Bond ETF | Federal Fund Rate plus 0.50% | 9/16/24 | Monthly | 183 | — |
| Bank of America Merrill Lynch | SPDR Bloomberg Investment Grade Floating Rate ETF | Federal Funds Composite Interest Rate plus 0.50% | 3/2/23 | Overnight | 145 | — |
| Morgan Stanley & Co. | SPDR Bloomberg Investment Grade Floating Rate ETF | Federal Fund Rate plus 0.50% | 9/16/24 | Monthly | 145 | — |
| Bank of America Merrill Lynch | SPDR Bloomberg Short Term High Yield Bond ETF | Federal Funds Composite Interest Rate | 3/2/23 | Overnight | (614) | — |
| Morgan Stanley & Co. | SPDR Bloomberg Short Term High Yield Bond ETF | Federal Fund Rate minus 0.88% | 9/16/24 | Monthly | (614) | — |
| Bank of America Merrill Lynch | SPDR Dow Jones International Real Estate ETF | Federal Funds Composite Interest Rate | 3/2/23 | Overnight | (108) | — |
| Morgan Stanley & Co. | SPDR Dow Jones International Real Estate ETF | Federal Fund Rate minus 2.93% | 9/16/24 | Monthly | (108) | — |
| Bank of America Merrill Lynch | SPDR Gold MiniShares Trust | Federal Funds Composite Interest Rate plus 0.50% | 3/2/23 | Overnight | 60 | — |
| Morgan Stanley & Co. | SPDR Gold MiniShares Trust | Federal Fund Rate plus 0.50% | 9/16/24 | Monthly | 60 | — |
| Bank of America Merrill Lynch | SPDR Portfolio Long Term Treasury ETF | Federal Funds Composite Interest Rate | 3/2/23 | Overnight | (46) | — |
| Morgan Stanley & Co. | SPDR Portfolio Long Term Treasury ETF | Federal Fund Rate minus 0.35% | 9/16/24 | Monthly | (46) | — |
| Bank of America Merrill Lynch | SPDR Portfolio Mortgage-Backed Bond ETF | Federal Funds Composite Interest Rate plus 0.50% | 3/2/23 | Overnight | 3 | — |
| Morgan Stanley & Co. | SPDR Portfolio Mortgage-Backed Bond ETF | Federal Fund Rate plus 0.50% | 9/16/24 | Monthly | 3 | — |
| Bank of America Merrill Lynch | SPDR S&P 600 Small Cap Growth ETF | Federal Funds Composite Interest Rate plus 0.50% | 3/2/23 | Overnight | 29 | — |
| Morgan Stanley & Co. | SPDR S&P 600 Small Cap Growth ETF | Federal Fund Rate plus 0.50% | 9/16/24 | Monthly | 29 | — |
| Bank of America Merrill Lynch | SPDR S&P China ETF | Federal Funds Composite Interest Rate plus 0.50% | 3/2/23 | Overnight | 10 | — |
| Morgan Stanley & Co. | SPDR S&P China ETF | Federal Fund Rate plus 0.50% | 9/16/24 | Monthly | 10 | — |
| Bank of America Merrill Lynch | SPDR S&P Emerging Markets SmallCap ETF | Federal Funds Composite Interest Rate plus 0.50% | 3/2/23 | Overnight | 345 | — |
| Morgan Stanley & Co. | SPDR S&P Emerging Markets SmallCap ETF | Federal Fund Rate plus 0.50% | 9/16/24 | Monthly | 345 | — |
| Bank of America Merrill Lynch | SPDR S&P Global Natural Resources ETF | Federal Funds Composite Interest Rate | 3/2/23 | Overnight | (219) | — |
| Morgan Stanley & Co. | SPDR S&P Global Natural Resources ETF | Federal Fund Rate minus 1.08% | 9/16/24 | Monthly | (219) | — |
| Bank of America Merrill Lynch | Technology Select Sector SPDR Fund | Federal Funds Composite Interest Rate | 3/2/23 | Overnight | (231) | — |
| Morgan Stanley & Co. | Technology Select Sector SPDR Fund | Federal Fund Rate minus 0.15% | 9/16/24 | Monthly | (231) | — |
| Bank of America Merrill Lynch | VanEck J.P. Morgan EM Local Currency Bond ETF | Federal Funds Composite Interest Rate plus 0.50% | 3/2/23 | Overnight | 204 | — |
| Morgan Stanley & Co. | VanEck J.P. Morgan EM Local Currency Bond ETF | Federal Fund Rate plus 0.50% | 9/16/24 | Monthly | 204 | — |
| Bank of America Merrill Lynch | Vanguard Consumer Discretionary ETF | Federal Funds Composite Interest Rate | 3/2/23 | Overnight | (71) | — |
| Morgan Stanley & Co. | Vanguard Consumer Discretionary ETF | Federal Fund Rate minus 2.38% | 9/16/24 | Monthly | (71) | — |
The notes to the financial statements are an integral part of, and should be read in conjunction with, the financial statements.
17
Portfolio of Investments December 31, 2022† (continued)
Swap
Counterparty | Reference Obligation | Floating Rate2 | Termination
Date(s) | Payment
Frequency
Paid/
Received | Notional
Amount
Long/
(Short)
(000)3 | Unrealized
Appreciation/
(Depreciation)4 |
| Bank of America Merrill Lynch | Vanguard Emerging Markets Government Bond ETF | Federal Funds Composite Interest Rate | 3/2/23 | Overnight | (317) | $ — |
| Morgan Stanley & Co. | Vanguard Emerging Markets Government Bond ETF | Federal Fund Rate minus 1.08% | 9/16/24 | Monthly | (317) | — |
| Bank of America Merrill Lynch | Vanguard Energy ETF | Federal Funds Composite Interest Rate plus 0.50% | 3/2/23 | Overnight | 26 | — |
| Morgan Stanley & Co. | Vanguard Energy ETF | Federal Fund Rate plus 0.50% | 9/16/24 | Monthly | 26 | — |
| Bank of America Merrill Lynch | Vanguard Financials ETF | Federal Funds Composite Interest Rate plus 0.50% | 3/2/23 | Overnight | 39 | — |
| Morgan Stanley & Co. | Vanguard Financials ETF | Federal Fund Rate plus 0.50% | 9/16/24 | Monthly | 39 | — |
| Bank of America Merrill Lynch | Vanguard FTSE All World ex-US Small-Cap ETF | Federal Funds Composite Interest Rate plus 0.50% | 3/2/23 | Overnight | 15 | — |
| Morgan Stanley & Co. | Vanguard FTSE All World ex-US Small-Cap ETF | Federal Fund Rate plus 0.50% | 9/16/24 | Monthly | 15 | — |
| Bank of America Merrill Lynch | Vanguard FTSE Developed Markets ETF | Federal Funds Composite Interest Rate plus 0.50% | 3/2/23 | Overnight | 271 | — |
| Morgan Stanley & Co. | Vanguard FTSE Developed Markets ETF | Federal Fund Rate plus 0.50% | 9/16/24 | Monthly | 271 | — |
| Bank of America Merrill Lynch | Vanguard FTSE Emerging Markets ETF | Federal Funds Composite Interest Rate plus 0.50% | 3/2/23 | Overnight | 381 | — |
| Morgan Stanley & Co. | Vanguard FTSE Emerging Markets ETF | Federal Fund Rate plus 0.50% | 9/16/24 | Monthly | 381 | — |
| Bank of America Merrill Lynch | Vanguard FTSE Europe ETF | Federal Funds Composite Interest Rate plus 0.50% | 3/2/23 | Overnight | 90 | — |
| Morgan Stanley & Co. | Vanguard FTSE Europe ETF | Federal Fund Rate plus 0.50% | 9/16/24 | Monthly | 90 | — |
| Bank of America Merrill Lynch | Vanguard Global ex-U.S. Real Estate ETF | Federal Funds Composite Interest Rate | 3/2/23 | Overnight | (823) | — |
| Morgan Stanley & Co. | Vanguard Global ex-U.S. Real Estate ETF | Federal Fund Rate minus 0.35% | 9/16/24 | Monthly | (823) | — |
| Bank of America Merrill Lynch | Vanguard Growth ETF | Federal Funds Composite Interest Rate plus 0.50% | 3/2/23 | Overnight | 254 | — |
| Morgan Stanley & Co. | Vanguard Growth ETF | Federal Fund Rate plus 0.50% | 9/16/24 | Monthly | 254 | — |
| Bank of America Merrill Lynch | Vanguard Health Care ETF | Federal Funds Composite Interest Rate plus 0.50% | 3/2/23 | Overnight | 116 | — |
| Morgan Stanley & Co. | Vanguard Health Care ETF | Federal Fund Rate plus 0.50% | 9/16/24 | Monthly | 116 | — |
| Morgan Stanley & Co. | Vanguard Industrials ETF | Federal Fund Rate minus 4.73% | 9/16/24 | Monthly | (131) | — |
| Bank of America Merrill Lynch | Vanguard Information Technology ETF | Federal Funds Composite Interest Rate | 3/2/23 | Overnight | (90) | — |
| Morgan Stanley & Co. | Vanguard Information Technology ETF | Federal Fund Rate minus 0.78% | 9/16/24 | Monthly | (90) | — |
| Bank of America Merrill Lynch | Vanguard Intermediate-Term Corporate Bond ETF | Federal Funds Composite Interest Rate plus 0.50% | 3/2/23 | Overnight | 62 | — |
| Morgan Stanley & Co. | Vanguard Intermediate-Term Corporate Bond ETF | Federal Fund Rate plus 0.50% | 9/16/24 | Monthly | 62 | — |
| Bank of America Merrill Lynch | Vanguard Intermediate-Term Treasury ETF | Federal Funds Composite Interest Rate plus 0.50% | 3/2/23 | Overnight | 423 | — |
| Morgan Stanley & Co. | Vanguard Intermediate-Term Treasury ETF | Federal Fund Rate plus 0.50% | 9/16/24 | Monthly | 423 | — |
| Bank of America Merrill Lynch | Vanguard Long-Term Treasury ETF | Federal Funds Composite Interest Rate | 3/2/23 | Overnight | (29) | — |
| Morgan Stanley & Co. | Vanguard Long-Term Treasury ETF | Federal Fund Rate minus 1.78% | 9/16/24 | Monthly | (29) | — |
The notes to the financial statements are an integral part of, and should be read in conjunction with, the financial statements.
| 18 | MainStay VP IQ Hedge Multi-Strategy Portfolio |
Swap
Counterparty | Reference Obligation | Floating Rate2 | Termination
Date(s) | Payment
Frequency
Paid/
Received | Notional
Amount
Long/
(Short)
(000)3 | Unrealized
Appreciation/
(Depreciation)4 |
| Bank of America Merrill Lynch | Vanguard Mega Cap Growth ETF | Federal Funds Composite Interest Rate plus 0.50% | 3/2/23 | Overnight | 35 | $ — |
| Morgan Stanley & Co. | Vanguard Mega Cap Growth ETF | Federal Fund Rate plus 0.50% | 9/16/24 | Monthly | 35 | — |
| Bank of America Merrill Lynch | Vanguard Mortgage-Backed Securities ETF | Federal Funds Composite Interest Rate plus 0.50% | 3/2/23 | Overnight | 12 | — |
| Morgan Stanley & Co. | Vanguard Mortgage-Backed Securities ETF | Federal Fund Rate plus 0.50% | 9/16/24 | Monthly | 12 | — |
| Bank of America Merrill Lynch | Vanguard Real Estate ETF | Federal Funds Composite Interest Rate plus 0.50% | 3/2/23 | Overnight | 56 | — |
| Morgan Stanley & Co. | Vanguard Real Estate ETF | Federal Fund Rate plus 0.50% | 9/16/24 | Monthly | 56 | — |
| Bank of America Merrill Lynch | Vanguard Russell 1000 Growth ETF | Federal Funds Composite Interest Rate plus 0.50% | 3/2/23 | Overnight | 33 | — |
| Morgan Stanley & Co. | Vanguard Russell 1000 Growth ETF | Federal Fund Rate plus 0.50% | 9/16/24 | Monthly | 33 | — |
| Bank of America Merrill Lynch | Vanguard Short-Term Corporate Bond ETF | Federal Funds Composite Interest Rate plus 0.50% | 3/2/23 | Overnight | 1,616 | — |
| Morgan Stanley & Co. | Vanguard Short-Term Corporate Bond ETF | Federal Fund Rate plus 0.50% | 9/16/24 | Monthly | 1,616 | — |
| Bank of America Merrill Lynch | Vanguard Small-Cap Growth ETF | Federal Funds Composite Interest Rate plus 0.50% | 3/2/23 | Overnight | 159 | — |
| Morgan Stanley & Co. | Vanguard Small-Cap Growth ETF | Federal Fund Rate plus 0.50% | 9/16/24 | Monthly | 159 | — |
| Bank of America Merrill Lynch | Vanguard Small-Cap Value ETF | Federal Funds Composite Interest Rate | 3/2/23 | Overnight | (183) | — |
| Morgan Stanley & Co. | Vanguard Small-Cap Value ETF | Federal Fund Rate minus 0.78% | 9/16/24 | Monthly | (183) | — |
| Bank of America Merrill Lynch | Xtrackers USD High Yield Corporate Bond ETF | Federal Funds Composite Interest Rate plus 0.50% | 3/2/23 | Overnight | 77 | — |
| Morgan Stanley & Co. | Xtrackers USD High Yield Corporate Bond ETF | Federal Fund Rate plus 0.50% | 9/16/24 | Monthly | 77 | — |
| | | | | | | $ — |
| 1. | As of December 31, 2022, cash in the amount $280,188 was pledged to brokers for OTC swap contracts. |
| 2. | Portfolio pays or receives the floating rate and receives or pays the total return of the referenced entity. |
| 3. | Notional amounts reflected as a positive value indicate a long position held by the Portfolio or Index and a negative value indicates a short position. |
| 4. | Reflects the value at reset date as of December 31, 2022. |
| Abbreviation(s): |
| BRIC—Brazil, Russia, India and China |
| DB—Deutsche Bank |
| EAFE—Europe, Australasia and Far East |
| EM—Emerging Markets |
| ETF—Exchange-Traded Fund |
| FTSE—Financial Times Stock Exchange |
| MBS—Mortgage-Backed Security |
| MSCI—Morgan Stanley Capital International |
| REIT—Real Estate Investment Trust |
| SPDR—Standard & Poor’s Depositary Receipt |
The notes to the financial statements are an integral part of, and should be read in conjunction with, the financial statements.
19
Portfolio of Investments December 31, 2022† (continued)
| TIPS—Treasury Inflation-Protected Security |
| USD—United States Dollar |
The following is a summary of the fair valuations according to the inputs used as of December 31, 2022, for valuing the Portfolio’s assets:
| Description | Quoted
Prices in
Active
Markets for
Identical
Assets
(Level 1) | | Significant
Other
Observable
Inputs
(Level 2) | | Significant
Unobservable
Inputs
(Level 3) | | Total |
| Asset Valuation Inputs | | | | | | | |
| Investments in Securities (a) | | | | | | | |
| Exchange-Traded Funds | $ 267,153,807 | | $ — | | $ — | | $ 267,153,807 |
| Exchange-Traded Vehicles | 18,606,315 | | — | | — | | 18,606,315 |
| Short-Term Investments | | | | | | | |
| Affiliated Investment Company | 67,109 | | — | | — | | 67,109 |
| Unaffiliated Investment Company | 64,618,533 | | — | | — | | 64,618,533 |
| Total Short-Term Investments | 64,685,642 | | — | | — | | 64,685,642 |
| Total Investments in Securities | $ 350,445,764 | | $ — | | $ — | | $ 350,445,764 |
| (a) | For a complete listing of investments and their industries, see the Portfolio of Investments. |
The notes to the financial statements are an integral part of, and should be read in conjunction with, the financial statements.
| 20 | MainStay VP IQ Hedge Multi-Strategy Portfolio |
Statement of Assets and Liabilities as of December 31, 2022
| Assets |
Investment in unaffiliated securities, at value
(identified cost $351,122,866) including securities on loan of $66,360,442 | $340,688,841 |
Investment in affiliated investment companies, at value
(identified cost $9,879,294) | 9,756,923 |
| Cash | 4,403 |
Cash denominated in foreign currencies
(identified cost $4,579) | 4,505 |
| Cash collateral on deposit at broker for swap contracts | 280,188 |
| Receivables: | |
| Dividends and interest on OTC swaps contracts | 230,851 |
| Dividends | 89,793 |
| Securities lending | 69,364 |
| Portfolio shares sold | 40,087 |
| Other assets | 1,833 |
| Total assets | 351,166,788 |
| Liabilities |
| Cash collateral received for securities on loan | 64,618,533 |
| Payables: | |
| Portfolio shares redeemed | 166,510 |
| Manager (See Note 3) | 163,046 |
| NYLIFE Distributors (See Note 3) | 58,840 |
| Shareholder communication | 34,683 |
| Professional fees | 23,968 |
| Custodian | 11,569 |
| Transfer agent (See Note 3) | 1,151 |
| Accrued expenses | 13,297 |
| Total liabilities | 65,091,597 |
| Net assets | $286,075,191 |
| Composition of Net Assets |
| Shares of beneficial interest outstanding (par value of $.001 per share) unlimited number of shares authorized | $ 35,688 |
| Additional paid-in-capital | 370,357,657 |
| | 370,393,345 |
| Total distributable earnings (loss) | (84,318,154) |
| Net assets | $286,075,191 |
| Initial Class | |
| Net assets applicable to outstanding shares | $ 12,070,325 |
| Shares of beneficial interest outstanding | 1,500,953 |
| Net asset value per share outstanding | $ 8.04 |
| Service Class | |
| Net assets applicable to outstanding shares | $274,004,866 |
| Shares of beneficial interest outstanding | 34,187,513 |
| Net asset value per share outstanding | $ 8.01 |
The notes to the financial statements are an integral part of, and should be read in conjunction with, the financial statements.
21
Statement of Operations for the year ended December 31, 2022
| Investment Income (Loss) |
| Income | |
| Dividends-unaffiliated (net of foreign tax withholding of $17,158) | $ 7,327,069 |
| Securities lending, net | 1,049,738 |
| Dividends-affiliated | 473,681 |
| Total income | 8,850,488 |
| Expenses | |
| Manager (See Note 3) | 2,396,241 |
| Distribution/Service—Service Class (See Note 3) | 767,685 |
| Professional fees | 68,446 |
| Custodian | 65,692 |
| Shareholder communication | 24,103 |
| Trustees | 6,899 |
| Miscellaneous | 16,469 |
| Total expenses before waiver/reimbursement | 3,345,535 |
| Expense waiver/reimbursement from Manager (See Note 3) | (340,273) |
| Net expenses | 3,005,262 |
| Net investment income (loss) | 5,845,226 |
| Realized and Unrealized Gain (Loss) |
| Net realized gain (loss) on: | |
| Unaffiliated investment transactions | (29,321,428) |
| Affiliated investment company transactions | (1,090,615) |
| Swap transactions | 1,465,346 |
| Foreign currency transactions | 206 |
| Net realized gain (loss) | (28,946,491) |
| Net change in unrealized appreciation (depreciation) on: | |
| Unaffiliated investments | (8,808,137) |
| Affiliated investments | 413,616 |
| Translation of other assets and liabilities in foreign currencies | (3,375) |
| Net change in unrealized appreciation (depreciation) | (8,397,896) |
| Net realized and unrealized gain (loss) | (37,344,387) |
| Net increase (decrease) in net assets resulting from operations | $(31,499,161) |
The notes to the financial statements are an integral part of, and should be read in conjunction with, the financial statements.
| 22 | MainStay VP IQ Hedge Multi-Strategy Portfolio |
Statements of Changes in Net Assets
for the years ended December 31, 2022 and December 31, 2021
| | 2022 | 2021 |
| Increase (Decrease) in Net Assets |
| Operations: | | |
| Net investment income (loss) | $ 5,845,226 | $ 2,542,976 |
| Net realized gain (loss) | (28,946,491) | 17,921,112 |
| Net change in unrealized appreciation (depreciation) | (8,397,896) | (23,556,939) |
| Net increase (decrease) in net assets resulting from operations | (31,499,161) | (3,092,851) |
| Distributions to shareholders: | | |
| Initial Class | (245,307) | — |
| Service Class | (4,860,946) | — |
| Total distributions to shareholders | (5,106,253) | — |
| Capital share transactions: | | |
| Net proceeds from sales of shares | 7,315,445 | 22,487,176 |
| Net asset value of shares issued to shareholders in reinvestment of distributions | 5,106,253 | — |
| Cost of shares redeemed | (63,501,869) | (29,510,242) |
| Increase (decrease) in net assets derived from capital share transactions | (51,080,171) | (7,023,066) |
| Net increase (decrease) in net assets | (87,685,585) | (10,115,917) |
| Net Assets |
| Beginning of year | 373,760,776 | 383,876,693 |
| End of year | $286,075,191 | $373,760,776 |
The notes to the financial statements are an integral part of, and should be read in conjunction with, the financial statements.
23
Financial Highlights selected per share data and ratios
| | Year Ended December 31, |
| Initial Class | 2022 | | 2021 | | 2020 | | 2019 | | 2018 † |
| Net asset value at beginning of year | $ 8.97 | | $ 9.02 | | $ 8.74 | | $ 8.22 | | $ 8.92 |
| Net investment income (loss) (a) | 0.18 | | 0.09 | | 0.14 | | 0.20 | | (0.05) |
| Net realized and unrealized gain (loss) | (0.94) | | (0.14) | | 0.33 | | 0.49 | | (0.55) |
| Total from investment operations | (0.76) | | (0.05) | | 0.47 | | 0.69 | | (0.60) |
| Less distributions: | | | | | | | | | |
| From net investment income | (0.17) | | — | | (0.16) | | (0.16) | | (0.10) |
| Return of capital | — | | — | | (0.03) | | (0.01) | | — |
| Total distributions | (0.17) | | — | | (0.19) | | (0.17) | | (0.10) |
| Net asset value at end of year | $ 8.04 | | $ 8.97 | | $ 9.02 | | $ 8.74 | | $ 8.22 |
| Total investment return (b) | (8.48)% | | (0.55)%(c) | | 5.38% | | 8.47% | | (6.88)% |
| Ratios (to average net assets)/Supplemental Data: | | | | | | | | | |
| Net investment income (loss) | 2.12% | | 0.97% | | 1.56% | | 2.36% | | (0.53)% |
| Net expenses (d) | 0.70% | | 0.70% | | 0.70% | | 0.70% | | 1.43% |
| Expenses (before waiver/reimbursement) (d) | 0.81% | | 0.83% | | 1.00% | | 1.20% | | 2.96%(e) |
| Portfolio turnover rate | 139% | | 126% | | 179% | | 151% | | 450% |
| Net assets at end of year (in 000's) | $ 12,070 | | $ 13,499 | | $ 12,044 | | $ 10,749 | | $ 9,059 |
| † | Consolidated Financial Highlights for the period January 1, 2018 to November 30, 2018, which consolidates financial information of MainStay VP Multi-Strategy Cayman Fund Ltd., a wholly-owned subsidiary of the Portfolio prior to the reorganization. |
| (a) | Per share data based on average shares outstanding during the year. |
| (b) | Total return does not reflect any deduction of sales charges, mortality and expense charges, contract charges or administrative charges. For periods of less than one year, total return is not annualized. |
| (c) | Total investment return may reflect adjustments to conform to generally accepted accounting principles. |
| (d) | In addition to the fees and expenses which the Portfolio bears directly, it also indirectly bears a pro-rata share of the fees and expenses of the underlying funds in which it invests. Such indirect expenses are not included in the above expense ratios. |
| (e) | The expense ratios presented below show the impact of short sales expense: |
| Year Ended | | Net Expenses
(excluding short
sale expenses) | | Short Sales
Expenses |
| December 31, 2018 | | 1.43% | | 1.28% |
The notes to the financial statements are an integral part of, and should be read in conjunction with, the financial statements.
| 24 | MainStay VP IQ Hedge Multi-Strategy Portfolio |
Financial Highlights selected per share data and ratios
| | Year Ended December 31, |
| Service Class | 2022 | | 2021 | | 2020 | | 2019 | | 2018 † |
| Net asset value at beginning of year | $ 8.94 | | $ 9.01 | | $ 8.73 | | $ 8.18 | | $ 8.87 |
| Net investment income (loss) (a) | 0.15 | | 0.06 | | 0.11 | | 0.18 | | (0.00)‡ |
| Net realized and unrealized gain (loss) | (0.94) | | (0.13) | | 0.34 | | 0.49 | | (0.63) |
| Total from investment operations | (0.79) | | (0.07) | | 0.45 | | 0.67 | | (0.63) |
| Less distributions: | | | | | | | | | |
| From net investment income | (0.14) | | — | | (0.14) | | (0.12) | | (0.06) |
| Return of capital | — | | — | | (0.03) | | (0.00)‡ | | — |
| Total distributions | (0.14) | | — | | (0.17) | | (0.12) | | (0.06) |
| Net asset value at end of year | $ 8.01 | | $ 8.94 | | $ 9.01 | | $ 8.73 | | $ 8.18 |
| Total investment return (b) | (8.70)% | | (0.78)%(c) | | 5.14% | | 8.23% | | (7.14)% |
| Ratios (to average net assets)/Supplemental Data: | | | | | | | | | |
| Net investment income (loss) | 1.82% | | 0.65% | | 1.29% | | 2.09% | | 0.03% |
| Net expenses (d) | 0.95% | | 0.95% | | 0.95% | | 0.95% | | 1.60% |
| Expenses (before waiver/reimbursement) (d) | 1.06% | | 1.09% | | 1.25% | | 1.45% | | 2.84%(e) |
| Portfolio turnover rate | 139% | | 126% | | 179% | | 151% | | 450% |
| Net assets at end of year (in 000's) | $ 274,005 | | $ 360,262 | | $ 371,833 | | $ 389,101 | | $ 391,094 |
| † | Consolidated Financial Highlights for the period January 1, 2018 to November 30, 2018, which consolidates financial information of MainStay VP Multi-Strategy Cayman Fund Ltd., a wholly-owned subsidiary of the Portfolio prior to the reorganization. |
| ‡ | Less than one cent per share. |
| (a) | Per share data based on average shares outstanding during the year. |
| (b) | Total return does not reflect any deduction of sales charges, mortality and expense charges, contract charges or administrative charges. For periods of less than one year, total return is not annualized. |
| (c) | Total investment return may reflect adjustments to conform to generally accepted accounting principles. |
| (d) | In addition to the fees and expenses which the Portfolio bears directly, it also indirectly bears a pro-rata share of the fees and expenses of the underlying funds in which it invests. Such indirect expenses are not included in the above expense ratios. |
| (e) | The expense ratios presented below show the impact of short sales expense: |
| Year Ended | | Net Expenses
(excluding short
sale expenses) | | Short Sales
Expenses |
| December 31, 2018 | | 1.60% | | 0.99% |
The notes to the financial statements are an integral part of, and should be read in conjunction with, the financial statements.
25
Notes to Financial Statements
Note 1–Organization and Business
MainStay VP Funds Trust (the “Fund”) was organized as a Delaware statutory trust on February 1, 2011. The Fund is registered under the Investment Company Act of 1940, as amended (the “1940 Act”), as an open-end management investment company. The Fund is comprised of thirty-one separate series (collectively referred to as the “Portfolios”). These financial statements and notes relate to the MainStay VP IQ Hedge Multi-Strategy Portfolio (the "Portfolio"), a "diversified” portfolio, as that term is defined in the 1940 Act, as interpreted or modified by regulatory authorities having jurisdiction, from time to time.
Shares of the Portfolio are currently offered to certain separate accounts to fund variable annuity policies and variable universal life insurance policies issued by New York Life Insurance and Annuity Corporation (“NYLIAC”), a wholly-owned subsidiary of New York Life Insurance Company (“New York Life”) and may also be offered to fund variable annuity policies and variable universal life insurance policies issued by other insurance companies. NYLIAC allocates shares of the Portfolio to, among others, certain NYLIAC separate accounts. Shares of the Portfolio are also offered to the MainStay VP Conservative Allocation Portfolio, MainStay VP Moderate Allocation Portfolio, MainStay VP Growth Allocation Portfolio and MainStay VP Equity Allocation Portfolio, which operate as “funds-of-funds," and other variable insurance funds.
The following table lists the Portfolio's share classes that have been registered and commenced operations:
| Class | Commenced Operations |
| Initial Class | May 1, 2013 |
| Service Class | May 1, 2013 |
Shares of the Portfolio are offered and are redeemed at a price equal to their respective net asset value (“NAV”) per share. No sales or redemption charge is applicable to the purchase or redemption of the Portfolio's shares. Under the terms of the Fund’s multiple class plan, adopted pursuant to Rule 18f-3 under the 1940 Act, the classes differ in that, among other things, Service Class shares of the Portfolio pay a combined distribution and service fee of 0.25% of average daily net assets attributable to Service Class shares of the Portfolio to the Distributor (as defined in Note 3(B)) pursuant to a plan adopted in accordance with Rule 12b-1 under the 1940 Act. Contract owners of variable annuity contracts purchased after June 2, 2003, are permitted to invest only in the Service Class shares.
The Portfolio's investment objective is to seek investment returns that correspond (before fees and expenses) generally to the price and yield performance of its underlying index, the IQ Hedge Multi-Strategy Index. The IQ Hedge Multi-Strategy Index seeks to achieve performance similar to the overall hedge fund universe by replicating the “beta” portion of the hedge fund return characteristics (i.e., that portion of the returns that are non-idiosyncratic, or unrelated to manager skill) by using the following hedge fund investment styles: long/short equity; global macro; market neutral; event-driven; fixed-income arbitrage; and emerging markets.
The Portfolio is a “fund of funds” that seeks to achieve its investment objective by investing primarily in exchange-traded funds (“ETFs”), other exchange-traded vehicles issuing equity securities organized in the U.S., such as exchange-traded commodity pools (“ETVs”), and exchange-traded notes (“ETNs”) (such ETFs, ETVs and ETNs are referred to collectively as “exchange-traded products” or “ETPs”), but may also invest in one or more financial instruments, including but not limited to, futures contracts, reverse repurchase agreements, options, and swap agreements (collectively, “Financial Instruments”) in order to seek to achieve exposure to investment strategies and/or asset classes that are similar to those of the IQ Hedge Multi-Strategy Index.
Note 2–Significant Accounting Policies
The Portfolio is an investment company and accordingly follows the investment company accounting and reporting guidance of the Financial Accounting Standards Board (“FASB”) Accounting Standards Codification Topic 946 Financial Services—Investment Companies. The Portfolio prepares its financial statements in accordance with generally accepted accounting principles (“GAAP”) in the United States of America and follows the significant accounting policies described below.
(A) Securities Valuation. Investments are usually valued as of the close of regular trading on the New York Stock Exchange (the "Exchange") (usually 4:00 p.m. Eastern time) on each day the Portfolio is open for business ("valuation date").
Effective September 8, 2022, and pursuant to Rule 2a-5 under the 1940 Act, the Board of Trustees of the Fund (the "Board") designated New York Life Investment Management LLC (“New York Life Investments” or the "Manager") as its Valuation Designee (the "Valuation Designee"). The Valuation Designee is responsible for performing fair valuations relating to all investments in the Portfolio’s portfolio for which market quotations are not readily available; periodically assessing and managing material valuation risks; establishing and applying fair value methodologies; testing fair valuation methodologies; evaluating and overseeing pricing services; ensuring appropriate segregation of valuation and portfolio management functions; providing quarterly, annual and prompt reporting to the Board, as appropriate; identifying potential conflicts of interest; and maintaining appropriate records. The Valuation Designee has established a valuation committee ("Valuation Committee") to assist in carrying out the Valuation Designee’s responsibilities and establish prices of securities for which market quotations are not readily available. The Portfolio’s and the Valuation Designee's policies and procedures ("Valuation Procedures") govern the Valuation Designee’s selection and application of methodologies for determining and calculating the fair value of Portfolio investments. The Valuation Designee may value the Portfolio's portfolio securities for which market quotations are not readily available and other Portfolio assets utilizing inputs from pricing services and other third-party sources (together, “Pricing Sources”). The Valuation Committee meets (in person, via electronic mail or via teleconference) on an ad-hoc basis to determine fair valuations and on a quarterly basis to review fair value events with respect to certain securities for which market quotations are
| 26 | MainStay VP IQ Hedge Multi-Strategy Portfolio |
not readily available, including valuation risks and back-testing results, and preview reports to the Board.
The Valuation Committee establishes prices of securities for which market quotations are not readily available based on such methodologies and measurements on a regular basis after considering information that is reasonably available and deemed relevant by the Valuation Committee. The Board shall oversee the Valuation Designee and review fair valuation materials on a prompt, quarterly and annual basis and approve proposed revisions to the Valuation Procedures.
Investments for which market quotations are not readily available are valued at fair value as determined in good faith pursuant to the Valuation Procedures. A market quotation is readily available only when that quotation is a quoted price (unadjusted) in active markets for identical investments that the Portfolio can access at the measurement date, provided that a quotation will not be readily available if it is not reliable. "Fair value" is defined as the price the Portfolio would reasonably expect to receive upon selling an asset or liability in an orderly transaction to an independent buyer in the principal or most advantageous market for the asset or liability. Fair value measurements are determined within a framework that establishes a three-tier hierarchy that maximizes the use of observable market data and minimizes the use of unobservable inputs to establish a classification of fair value measurements for disclosure purposes. "Inputs" refer broadly to the assumptions that market participants would use in pricing the asset or liability, including assumptions about risk, such as the risk inherent in a particular valuation technique used to measure fair value using a pricing model and/or the risk inherent in the inputs for the valuation technique. Inputs may be observable or unobservable. Observable inputs reflect the assumptions market participants would use in pricing the asset or liability based on market data obtained from sources independent of the Portfolio. Unobservable inputs reflect the Portfolio’s own assumptions about the assumptions market participants would use in pricing the asset or liability based on the information available. The inputs or methodology used for valuing assets or liabilities may not be an indication of the risks associated with investing in those assets or liabilities. The three-tier hierarchy of inputs is summarized below.
| • | Level 1—quoted prices (unadjusted) in active markets for an identical asset or liability |
| • | Level 2—other significant observable inputs (including quoted prices for a similar asset or liability in active markets, interest rates and yield curves, prepayment speeds, credit risk, etc.) |
| • | Level 3—significant unobservable inputs (including the Portfolio's own assumptions about the assumptions that market participants would use in measuring fair value of an asset or liability) |
The level of an asset or liability within the fair value hierarchy is based on the lowest level of an input, both individually and in the aggregate, that is significant to the fair value measurement. The aggregate value by input level of the Portfolio’s assets and liabilities as of December 31, 2022, is included at the end of the Portfolio of Investments.
The Portfolio may use third-party vendor evaluations, whose prices may be derived from one or more of the following standard inputs, among others:
| • Benchmark yields | • Reported trades |
| • Broker/dealer quotes | • Issuer spreads |
| • Two-sided markets | • Benchmark securities |
| • Bids/offers | • Reference data (corporate actions or material event notices) |
| • Industry and economic events | • Comparable bonds |
| • Monthly payment information | |
An asset or liability for which a market quotation is not readily available is valued by methods deemed reasonable in good faith by the Valuation Committee, following the Valuation Procedures to represent fair value. Under these procedures, the Valuation Designee generally uses a market-based approach which may use related or comparable assets or liabilities, recent transactions, market multiples, book values and other relevant information. The Valuation Designee may also use an income-based valuation approach in which the anticipated future cash flows of the asset or liability are discounted to calculate fair value. Discounts may also be applied due to the nature and/or duration of any restrictions on the disposition of the asset or liability. Fair value represents a good faith approximation of the value of a security. Fair value determinations involve the consideration of a number of subjective factors, an analysis of applicable facts and circumstances and the exercise of judgment. As a result, it is possible that the fair value for a security determined in good faith in accordance with the Valuation Procedures may differ from valuations for the same security determined for other funds using their own valuation procedures. Although the Valuation Procedures are designed to value a security at the price the Portfolio may reasonably expect to receive upon the security's sale in an orderly transaction, there can be no assurance that any fair value determination thereunder would, in fact, approximate the amount that the Portfolio would actually realize upon the sale of the security or the price at which the security would trade if a reliable market price were readily available. During the year ended December 31, 2022, there were no material changes to the fair value methodologies.
Securities which may be valued in this manner include, but are not limited to: (i) a security for which trading has been halted or suspended or otherwise does not have a readily available market quotation on a given day; (ii) a debt security that has recently gone into default and for which there is not a current market quotation; (iii) a security of an issuer that has entered into a restructuring; (iv) a security that has been delisted from a national exchange; (v) a security subject to trading collars for which no or limited trading takes place; and (vi) a security whose principal market has been temporarily closed at a time when, under normal conditions, it would be open. Securities valued in this manner are generally categorized as Level 2 or 3 in the hierarchy.
ETFs are valued at the last quoted sales prices as of the close of regular trading on the relevant exchange on each valuation date. Securities that
Notes to Financial Statements (continued)
are not traded on the valuation date are valued at the mean of the last quoted bid and ask prices. Prices are normally taken from the principal market in which each security trades. These securities are generally categorized as Level 1 in the hierarchy.
Investments in mutual funds, including money market funds, are valued at their respective NAVs at the close of business each day on the valuation date. These securities are generally categorized as Level 1 in the hierarchy.
Swaps are marked to market daily based upon quotations from pricing agents, brokers or market makers. These securities are generally categorized as Level 2 in the hierarchy.
Total return swap contracts, which are arrangements to exchange a market-linked return for a periodic payment, are based on a notional principal amount. To the extent that the total return of the security, index or other financial measure underlying the transaction exceeds or falls short of the offsetting interest rate obligation, the Portfolio will receive a payment from or make a payment to the counterparty. Total return swap contracts are marked to market daily based upon quotations from market makers and these securities are generally categorized as Level 2 in the hierarchy.
Temporary cash investments acquired in excess of 60 days to maturity at the time of purchase are valued using the latest bid prices or using valuations based on a matrix system (which considers such factors as security prices, yields, maturities and ratings), both as furnished by independent pricing services. Temporary cash investments that mature in 60 days or less at the time of purchase ("Short-Term Investments") are valued using the amortized cost method of valuation, unless the use of such method would be inappropriate. The amortized cost method involves valuing a security at its cost on the date of purchase and thereafter assuming a constant amortization to maturity of the difference between such cost and the value on maturity date. Amortized cost approximates the current fair value of a security. Securities valued using the amortized cost method are not valued using quoted prices in an active market and are generally categorized as Level 2 in the hierarchy.
The information above is not intended to reflect an exhaustive list of the methodologies that may be used to value portfolio investments. The Valuation Procedures permit the use of a variety of valuation methodologies in connection with valuing portfolio investments. The methodology used for a specific type of investment may vary based on the market data available or other considerations. The methodologies summarized above may not represent the specific means by which portfolio investments are valued on any particular business day.
(B) Income Taxes. The Portfolio's policy is to comply with the requirements of the Internal Revenue Code of 1986, as amended (the “Internal Revenue Code”), applicable to regulated investment companies and to distribute all of its taxable income to the shareholders of the Portfolio within the allowable time limits.
The Manager evaluates the Portfolio’s tax positions to determine if the tax positions taken meet the minimum recognition threshold in connection with accounting for uncertainties in income tax positions taken or expected to be taken for the purposes of measuring and recognizing tax liabilities in the financial statements. Recognition of tax benefits of an uncertain tax position is permitted only to the extent the position is “more likely than not” to be sustained assuming examination by taxing authorities. The Manager analyzed the Portfolio's tax positions taken on federal, state and local income tax returns for all open tax years (for up to three tax years) and has concluded that no provisions for federal, state and local income tax are required in the Portfolio's financial statements. The Portfolio's federal, state and local income tax and federal excise tax returns for tax years for which the applicable statutes of limitations have not expired are subject to examination by the Internal Revenue Service and state and local departments of revenue.
(C) Dividends and Distributions to Shareholders. Dividends and distributions are recorded on the ex-dividend date. The Portfolio intends to declare and pay dividends from net investment income and distributions from net realized capital and currency gains, if any, at least annually. All dividends and distributions are reinvested at NAV in the same class of shares of the Portfolio. Dividends and distributions to shareholders are determined in accordance with federal income tax regulations and may differ from determinations using GAAP.
(D) Security Transactions and Investment Income. The Portfolio records security transactions on the trade date. Realized gains and losses on security transactions are determined using the identified cost method. Dividend income is recognized on the ex-dividend date, net of any foreign tax withheld at the source, and interest income is accrued as earned using the effective interest rate method. Distributions received from real estate investment trusts and the underlying funds held by the Portfolio may be classified as dividends, capital gains and/or return of capital.
Investment income and realized and unrealized gains and losses on investments of the Portfolio are allocated pro rata to the separate classes of shares based upon their relative net assets on the date the income is earned or realized and unrealized gains and losses are incurred.
(E) Expenses. Expenses of the Fund are allocated to the individual Portfolios in proportion to the net assets of the respective Portfolios when the expenses are incurred, except where direct allocations of expenses can be made. Expenses (other than fees incurred under the distribution and service plans, further discussed in Note 3(B), which are charged directly to the Service Class shares) are allocated to separate classes of shares pro rata based upon their relative net assets on the date the expenses are incurred. The expenses borne by the Portfolio, including those of related parties to the Portfolio, are shown in the Statement of Operations.
Additionally, the Portfolio may invest in ETPs and mutual funds, which are subject to management fees and other fees that may cause the costs of investing in ETPs and mutual funds to be greater than the costs of owning the underlying securities directly. These indirect expenses of ETPs and
| 28 | MainStay VP IQ Hedge Multi-Strategy Portfolio |
mutual funds are not included in the amounts shown as expenses in the Statement of Operations or in the expense ratios included in the Financial Highlights.
In addition, the Portfolio bears a pro rata share of the fees and expenses of the ETPs in which it invests. Because the ETPs have varied expense and fee levels and the Portfolio may own different proportions of the ETPs at different times, the amount of fees and expenses incurred indirectly by the Portfolio may vary.
(F) Use of Estimates. In preparing financial statements in conformity with GAAP, the Manager makes estimates and assumptions that affect the reported amounts and disclosures in the financial statements. Actual results could differ from those estimates and assumptions.
(G) Swap Contracts. The Portfolio may enter into credit default, interest rate, equity, index and currency exchange rate swap contracts (“swaps”). In a typical swap transaction, two parties agree to exchange the future returns (or differentials in rates of future returns) earned or realized at periodic intervals on a particular investment or instrument based on a notional principal amount. Generally, the Portfolio will enter into a swap on a net basis, which means that the two payment streams under the swap are netted, with the Portfolio receiving or paying (as the case may be) only the net amount of the two payment streams. Therefore, the Portfolio's current obligation under a swap generally will be equal to the net amount to be paid or received under the swap, based on the relative value of notional positions attributable to each counterparty to the swap. The payments may be adjusted for transaction costs, interest payments, the amount of interest paid on the investment or instrument or other factors. Collateral, in the form of cash or securities, may be required to be held in segregated accounts with the custodian bank or broker in accordance with the terms of the swap. Swap agreements are privately negotiated in the over the counter (“OTC”) market and may be executed in a multilateral or other trade facilities platform, such as a registered commodities exchange (“centrally cleared swaps”).
Certain standardized swaps, including certain credit default and interest rate swaps, are subject to mandatory clearing and exchange-trading, and more types of standardized swaps are expected to be subject to mandatory clearing and exchange-trading in the future. The counterparty risk for exchange-traded and cleared derivatives is expected to be generally lower than for uncleared derivatives, but cleared contracts are not risk-free. In a cleared derivative transaction, the Portfolio typically enters into the transaction with a financial institution counterparty, and performance of the transaction is effectively guaranteed by a central clearinghouse, thereby reducing or eliminating the Portfolio's exposure to the credit risk of its original counterparty. The Portfolio will be required to post specified levels of margin with the clearinghouse or at the instruction of the clearinghouse; the margin required by a clearinghouse may be greater than the margin the Portfolio would be required to post in an uncleared transaction. As of December 31, 2022, all swap positions outstanding are shown in the Portfolio of Investments.
Swaps are marked to market daily based upon quotations from pricing agents, brokers, or market makers and the change in value, if any, is recorded as unrealized appreciation or depreciation. Any payments made or received upon entering into a swap would be amortized or accreted over the life of the swap and recorded as a realized gain or loss. Early termination of a swap is recorded as a realized gain or loss. Daily changes in valuation of centrally cleared swaps, if any, are recorded as a receivable or payable for the change in value as appropriate on the Statement of Assets and Liabilities.
The Portfolio bears the risk of loss of the amount expected to be received under a swap in the event of the default or bankruptcy of the swap counterparty. The Portfolio may be able to eliminate its exposure under a swap either by assignment or other disposition, or by entering into an offsetting swap with the same party or a similar credit-worthy party. Swaps are not actively traded on financial markets. Entering into swaps involves elements of credit, market, leverage, liquidity, operational, counterparty and legal/documentation risk in excess of the amounts recognized on the Statement of Assets and Liabilities. Such risks involve the possibilities that there will be no liquid market for these swaps, that the counterparty to the swaps may default on its obligation to perform or disagree as to the meaning of the contractual terms in the swaps and that there may be unfavorable changes in interest rates, the price of the index or the security underlying these transactions, among other risks.
Equity Swaps (Total Return Swaps). Total return swap contracts are agreements between counterparties to exchange cash flow, one based on a market-linked return of an individual asset or group of assets (such as an index), and the other on a fixed or floating rate. As a total return swap, an equity swap may be structured in different ways. For example, when the Portfolio enters into a “long” equity swap, the counterparty may agree to pay the Portfolio the amount, if any, by which the notional amount of the equity swap would have increased in value had it been invested in a particular referenced security or securities, plus the dividends that would have been received on those securities. In return, the Portfolio will generally agree to pay the counterparty interest on the notional amount of the equity swap plus the amount, if any, by which that notional amount would have decreased in value had it been invested in such referenced security or securities, plus, in certain instances, commissions or trading spreads on the notional amounts. Therefore, the Portfolio's return on the equity swap generally should equal the gain or loss on the notional amount, plus dividends on the referenced security or securities less the interest paid by the Portfolio on the notional amount. Alternatively, when the Portfolio enters into a “short” equity swap, the counterparty will generally agree to pay the Portfolio the amount, if any, by which the notional amount of the equity swap would have decreased in value had the Portfolio sold a particular referenced security or securities short, less the dividend expense that the Portfolio would have incurred on the referenced security or securities, as adjusted for interest payments or other economic factors. In this situation, the Portfolio will generally be obligated to pay the amount, if any, by which the notional amount of the swap would have increased in value had it been invested directly in the referenced security or securities.
Notes to Financial Statements (continued)
Equity swaps generally do not involve the delivery of securities or other referenced assets. Accordingly, the risk of loss with respect to equity swaps is normally limited to the net amount of payments that the Portfolio is contractually obligated to make. If the other party to an equity swap defaults, the Portfolio's risk of loss consists of the net amount of payments that the Portfolio is contractually entitled to receive, if any. The Portfolio will segregate cash or liquid assets, enter into offsetting transactions or use other measures permitted by applicable law to “cover” the Portfolio's current obligations. The Portfolio and New York Life Investments, however, believe these transactions do not constitute senior securities under the 1940 Act and, accordingly, will not treat them as being subject to the Portfolio's borrowing restrictions.
Equity swaps are derivatives and their value can be very volatile. The Portfolio may engage in total return swaps to gain exposure to emerging markets securities, along with offsetting long total return swap positions to maintain appropriate currency balances and risk exposures across all swap positions. To the extent that the Manager , or the Subadvisor do not accurately analyze and predict future market trends, the values or assets or economic factors, the Portfolio may suffer a loss, which may be substantial. As of December 31, 2022, open swap agreements are shown in the Portfolio of Investments.
(H) Foreign Currency Transactions. The Portfolio's books and records are maintained in U.S. dollars. Prices of securities denominated in foreign currency amounts are translated into U.S. dollars at the mean between the buying and selling rates last quoted by any major U.S. bank at the following dates:
(i) market value of investment securities, other assets and liabilities— at the valuation date; and
(ii) purchases and sales of investment securities, income and expenses—at the date of such transactions.
The assets and liabilities that are denominated in foreign currency amounts are presented at the exchange rates and market values at the close of the period. The realized and unrealized changes in net assets arising from fluctuations in exchange rates and market prices of securities are not separately presented.
Net realized gain (loss) on foreign currency transactions represents net currency gains or losses realized as a result of differences between the amounts of securities sale proceeds or purchase cost, dividends, interest and withholding taxes as recorded on the Portfolio's books, and the U.S. dollar equivalent amount actually received or paid. Net currency gains or losses from valuing such foreign currency denominated assets and liabilities, other than investments at valuation date exchange rates, are reflected in unrealized foreign exchange gains or losses.
(I) Securities Lending. In order to realize additional income, the Portfolio may engage in securities lending, subject to the limitations set forth in the 1940 Act and relevant guidance by the staff of the Securities and Exchange Commission (“SEC”). If the Portfolio engages in securities lending, the Portfolio will lend through its custodian, JPMorgan Chase
Bank, N.A., ("JPMorgan"), acting as securities lending agent on behalf of the Portfolio. Under the current arrangement, JPMorgan will manage the Portfolio's collateral in accordance with the securities lending agency agreement between the Portfolio and JPMorgan, and indemnify the Portfolio against counterparty risk. The loans will be collateralized by cash (which may be invested in a money market fund) and/or non-cash collateral (which may include U.S. Treasury securities and/or U.S. government agency securities issued or guaranteed by the United States government or its agencies or instrumentalities) at least equal at all times to the market value of the securities loaned. Non-cash collateral held at year end is segregated and cannot be transferred by the Portfolio. The Portfolio bears the risk of delay in recovery of, or loss of rights in, the securities loaned. The Portfolio may also record a realized gain or loss on securities deemed sold due to a borrower’s inability to return securities on loan. The Portfolio bears the risk of any loss on investment of cash collateral. The Portfolio will receive compensation for lending its securities in the form of fees or it will retain a portion of interest earned on the investment of any cash collateral. The Portfolio will also continue to receive interest and dividends on the securities loaned and any gain or loss in the market price of the securities loaned that may occur during the term of the loan will be for the account of the Portfolio. Income earned from securities lending activities, if any, is reflected in the Statement of Operations. Securities on loan as of December 31, 2022, are shown in the Portfolio of Investments.
(J) Foreign Securities Risk. The Portfolio may invest in foreign securities, which carry certain risks that are in addition to the usual risks inherent in domestic securities. These risks include those resulting from currency fluctuations, future adverse political or economic developments and possible imposition of currency exchange blockages or other foreign governmental laws or restrictions. These risks are likely to be greater in emerging markets than in developed markets. The ability of issuers of debt securities held by the Portfolio to meet their obligations may be affected by, among other things, economic or political developments in a specific country, industry or region.
(K) Counterparty Credit Risk. In order to better define its contractual rights and to secure rights that will help the Portfolio mitigate its counterparty risk, the Portfolio may enter into an International Swaps and Derivatives Association, Inc. Master Agreement (“ISDA Master Agreement”) or similar agreement with its counterparties. An ISDA Master Agreement is a bilateral agreement between the Portfolio and a counterparty that governs certain OTC derivatives and typically contains collateral posting terms and netting provisions. Under an ISDA Master Agreement, the Portfolio may, under certain circumstances, offset with the counterparty certain derivative financial instruments’ payables and/ or receivables with collateral held and/or posted and create one single net payment. The provisions of the ISDA Master Agreement typically permit a single net payment in the event of default including the bankruptcy or insolvency of the counterparty. Bankruptcy or insolvency laws of a particular jurisdiction may restrict or prohibit the right of offset in bankruptcy, insolvency or other events. In addition, certain ISDA Master Agreements may contain provisions for early termination of OTC
| 30 | MainStay VP IQ Hedge Multi-Strategy Portfolio |
derivative transactions in the event the net assets of the Portfolio decline below specific levels or if the Portfolio fails to meet the terms of its ISDA Master Agreements. The result would cause the Portfolio to accelerate payment of any net liability owed to the counterparty.
For financial reporting purposes, the Portfolio does not offset derivative assets and derivative liabilities that are subject to netting arrangements, if any, in the Statement of Assets and Liabilities.
(L) LIBOR Replacement Risk. The Portfolio may invest in certain debt securities, derivatives or other financial instruments that utilize the London Interbank Offered Rate ("LIBOR"), as a “benchmark” or “reference rate” for various interest rate calculations. As of January 1, 2022, the United Kingdom Financial Conduct Authority, which regulates LIBOR, ceased its active encouragement of banks to provide the quotations needed to sustain most LIBOR rates due to the absence of an active market for interbank unsecured lending and other reasons. However, the United Kingdom Financial Conduct Authority, the LIBOR administrator and other regulators announced that the most widely used tenors of U.S. dollar LIBOR will continue until mid-2023. As a result, it is anticipated that the remaining LIBOR settings will be discontinued or will no longer be sufficiently robust to be representative of its underlying market around that time. Various financial industry groups will plan for that transition and certain regulators and industry groups have taken actions to establish alternative reference rates (e.g., the Secured Overnight Financing Rate, which measures the cost of overnight borrowings through repurchase agreement transactions collateralized with U.S. Treasury securities and is intended to replace U.S. dollar LIBOR with certain adjustments). However, there are challenges to converting certain contracts and transactions to a new benchmark and neither the full effects of the transition process nor its ultimate outcome is known.
The elimination of LIBOR or changes to other reference rates or any other changes or reforms to the determination or supervision of reference rates could have an adverse impact on the market for, or value of, any securities or payments linked to those reference rates, which may adversely affect the Portfolio's performance and/or net asset value. Uncertainty and risk also remain regarding the willingness and ability of issuers and lenders to include enhanced provisions in new and existing contracts or instruments. Consequently, the transition away from LIBOR to other reference rates may lead to increased volatility and illiquidity in markets that are tied to LIBOR, fluctuations in values of LIBOR-related investments or investments in issuers that utilize LIBOR, increased difficulty in borrowing or refinancing and diminished effectiveness of hedging strategies, adversely affecting the Portfolio's performance. Furthermore, the risks associated with the expected discontinuation of LIBOR and transition may be exacerbated if the work necessary to effect an orderly transition to an alternative reference rate is not completed in a timely manner. While the transition away from LIBOR has already begun with no material adverse effect to the Portfolio's performance, the transition is expected to last through mid-2023 for some LIBOR tenors. The usefulness of LIBOR as a benchmark could deteriorate anytime during this transition period.
(M) Indemnifications. Under the Fund’s organizational documents, its officers and trustees are indemnified against certain liabilities that may arise out of performance of their duties to the Fund. Additionally, in the normal course of business, the Portfolio enters into contracts with third-party service providers that contain a variety of representations and warranties and that may provide general indemnifications. The Portfolio's maximum exposure under these arrangements is unknown, as this would involve future claims that may be made against the Portfolio that have not yet occurred. The Manager believes that the risk of loss in connection with these potential indemnification obligations is remote. However, there can be no assurance that material liabilities related to such obligations will not arise in the future, which could adversely impact the Portfolio.
(N) Quantitative Disclosure of Derivative Holdings. The following tables show additional disclosures related to the Portfolio's derivative and hedging activities, including how such activities are accounted for and their effect on the Portfolio's financial positions, performance and cash flows.
The Portfolio utilizes a range of derivative instruments for a variety of different purposes. Total return swaps (“TRS”) are one form of derivative that is used. In some cases, TRS contracts are entered into so as to affect long and short exposure to individual securities or indices within a particular strategy. In other cases, TRS are used to gain exposure to the strategy itself, which may also use derivatives. For example, a TRS contract is used to generate the return available from a customized index comprised of a diversified basket of exchange-traded futures. Other examples of derivative positions into which the Portfolio may enter include interest rate swaps, credit default swaps and option contracts. These instruments are frequently used to obtain a desired return at a lower cost to the Portfolio than is available when investing directly in the underlying instrument or to hedge against credit and interest rate risks. The Portfolio may also enter into foreign currency forward contracts to gain exposure to a particular currency or to hedge against the risk of loss due to changing currency exchange rates. These derivatives are not accounted for as hedging instruments.
The effect of derivative instruments on the Statement of Operations for the year ended December 31, 2022:
| Net Realized Gain (Loss) from: | Equity
Contracts
Risk | Total |
| Swap Contracts | $1,465,346 | $1,465,346 |
| Total Net Realized Gain (Loss) | $1,465,346 | $1,465,346 |
| Average Notional Amount | Total |
| Swap Contracts Long | $ 31,489,464 |
| Swap Contracts Short | $(31,340,579) |
Notes to Financial Statements (continued)
Note 3–Fees and Related Party Transactions
(A) Manager and Subadvisor. New York Life Investments, a registered investment adviser and an indirect, wholly-owned subsidiary of New York Life, serves as the Portfolio’s Manager, pursuant to an Amended and Restated Management Agreement (“Management Agreement”). The Manager provides offices, conducts clerical, recordkeeping and bookkeeping services, and keeps most of the financial and accounting records required to be maintained by the Portfolio. Except for the portion of salaries and expenses that are the responsibility of the Portfolio, the Manager pays the salaries and expenses of all personnel affiliated with the Portfolio and certain operational expenses of the Portfolio. During a portion of the year ended December 31, 2022, the Portfolio reimbursed New York Life Investments in an amount equal to the portion of the compensation of the Chief Compliance Officer attributable to the Portfolio. IndexIQ Advisors LLC (“IndexIQ Advisors” or “Subadvisor”), a registered investment adviser and an affiliate of New York Life Investments, serves as the Subadvisor to the Portfolio and is responsible for the day-to-day portfolio management of the Portfolio. Pursuant to the terms of a Subadvisory Agreement between New York Life Investments and IndexIQ Advisors, New York Life Investments pays for the services of the Subadvisor.
Pursuant to the Management Agreement, the Fund pays the Manager, on behalf of the Portfolio, a monthly fee for the services performed and the facilities furnished at an annual rate of 0.75% of the Portfolio's average daily net assets.
New York Life Investments has contractually agreed to waive fees and/or reimburse expenses so that the Total Annual Portfolio Operating Expenses (excluding taxes, interest, litigation, extraordinary expenses, brokerage and other transaction expenses relating to the purchase or sale of portfolio investments, and acquired (underlying) portfolio/fund fees and expenses) of Initial Class shares and Service Class shares do not exceed 0.70% and 0.95%, respectively, of the Portfolio's average daily net assets. This agreement will remain in effect until May 1, 2023, and shall renew automatically for one-year terms unless New York Life Investments provides written notice of termination prior to the start of the next term or upon approval of the Board.
During the year ended December 31, 2022, New York Life Investments earned fees from the Portfolio in the amount of $2,396,241 and waived fees and/or reimbursed expenses in the amount of $340,273 and paid the Subadvisor fees of $1,028,041.
JPMorgan provides sub-administration and sub-accounting services to the Portfolio pursuant to an agreement with New York Life Investments. These services include calculating the daily NAVs of the Portfolio, maintaining the general ledger and sub-ledger accounts for the calculation of the Portfolio's NAVs, and assisting New York Life Investments in conducting various aspects of the Portfolio's administrative operations. For providing these services to the Portfolio, JPMorgan is compensated by New York Life Investments.
Pursuant to an agreement between the Fund and New York Life Investments, New York Life Investments is responsible for providing or procuring certain regulatory reporting services for the Portfolio. The Portfolio will reimburse New York Life Investments for the actual costs incurred by New York Life Investments in connection with providing or procuring these services for the Portfolio.
(B) Distribution and Service Fees. The Fund, on behalf of the Portfolio, has entered into a distribution agreement with NYLIFE Distributors LLC (the “Distributor”), an affiliate of New York Life Investments. The Portfolio has adopted a distribution plan (the “Plan”) in accordance with the provisions of Rule 12b-1 under the 1940 Act. Under the Plan, the Distributor has agreed to provide, through its affiliates or independent third parties, various distribution-related, shareholder and administrative support services to the Service Class shareholders. For its services, the Distributor is entitled to a combined distribution and service fee accrued daily and paid monthly at an annual rate of 0.25% of the average daily net assets attributable to the Service Class shares of the Portfolio.
(C) Capital. As of December 31, 2022, New York Life and its affiliates beneficially held shares of the Portfolio with the values and percentages of net assets as follows:
| Initial Class | $1,480,600 | 12.3% |
| Service Class | 24,835 | 0.0‡ |
| ‡ | Less than one-tenth of a percent. |
Note 4-Federal Income Tax
As of December 31, 2022, the cost and unrealized appreciation (depreciation) of the Portfolio’s investment portfolio, including applicable derivative contracts and other financial instruments, as determined on a federal income tax basis, were as follows:
| | Federal Tax
Cost | Gross
Unrealized
Appreciation | Gross
Unrealized
(Depreciation) | Net
Unrealized
Appreciation/
(Depreciation) |
| Investments in Securities | $370,970,863 | $3,019,750 | $(23,687,244) | $(20,667,494) |
As of December 31, 2022, the components of accumulated gain (loss) on a tax basis were as follows:
Ordinary
Income | Accumulated
Capital
and Other
Gain (Loss) | Other
Temporary
Differences | Unrealized
Appreciation
(Depreciation) | Total
Accumulated
Gain (Loss) |
| $1,428,298 | $(65,217,890) | $— | $(20,528,562) | $(84,318,154) |
The difference between book-basis and tax-basis unrealized appreciation (depreciation) is primarily due to wash sale adjustments, partnership adjustments and straddle loss deferral.
| 32 | MainStay VP IQ Hedge Multi-Strategy Portfolio |
The following table discloses the current year reclassifications between total distributable earnings (loss) and additional paid-in capital arising from permanent differences; net assets as of December 31, 2022 were not affected.
| | Total
Distributable
Earnings (Loss) | Additional
Paid-In
Capital |
| | $19,786 | $(19,786) |
The reclassifications for the Portfolio are primarily due to different book and tax treatment of reclassification of prior year net operating losses.
As of December 31, 2022, for federal income tax purposes, capital loss carryforwards of $65,075,495, as shown in the table below, were available to the extent provided by the regulations to offset future realized gains of the Portfolio. Accordingly, no capital gains distributions are expected to be paid to shareholders until net gains have been realized in excess of such amounts.
Capital Loss
Available Through | Short-Term
Capital Loss
Amounts (000’s) | Long-Term
Capital Loss
Amounts (000’s) |
| Unlimited | $59,425 | $5,651 |
During the years ended December 31, 2022 and December 31, 2021, the tax character of distributions paid as reflected in the Statements of Changes in Net Assets was as follows:
| | 2022 | 2021 |
| Distributions paid from: | | |
| Ordinary Income | $5,106,253 | $— |
Note 5–Custodian
JPMorgan is the custodian of cash and securities held by the Portfolio. Custodial fees are charged to the Portfolio based on the Portfolio's net assets and/or the market value of securities held by the Portfolio and the number of certain transactions incurred by the Portfolio.
Note 6–Line of Credit
The Portfolio and certain other funds managed by New York Life Investments maintain a line of credit with a syndicate of banks in order to secure a source of funds for temporary purposes to meet unanticipated or excessive redemption requests.
Effective July 26, 2022, under the credit agreement (the “Credit Agreement”), the aggregate commitment amount is $600,000,000 with an additional uncommitted amount of $100,000,000. The commitment fee is an annual rate of 0.15% of the average commitment amount payable quarterly, regardless of usage, to JPMorgan, who serves as the agent to the syndicate. The commitment fee is allocated among the Portfolio and certain other funds managed by New York Life Investments based upon their respective net assets and other factors. Interest on any revolving credit loan is charged based upon the Federal Funds Rate, Daily Simple Secured Overnight Financing Rate ("SOFR") + 0.10%, or the
Overnight Bank Funding Rate, whichever is higher. The Credit Agreement expires on July 25, 2023, although the Portfolio, certain other funds managed by New York Life Investments and the syndicate of banks may renew the Credit Agreement for an additional year on the same or different terms or enter into a credit agreement with a different syndicate of banks. Prior to July 26, 2022, the aggregate commitment amount and the commitment fee were the same as those under the current Credit Agreement. During the year ended December 31, 2022, there were no borrowings made or outstanding with respect to the Portfolio under the Credit Agreement.
Note 7–Interfund Lending Program
Pursuant to an exemptive order issued by the SEC, the Portfolio, along with certain other funds managed by New York Life Investments, may participate in an interfund lending program. The interfund lending program provides an alternative credit facility that permits the Portfolio and certain other funds managed by New York Life Investments to lend or borrow money for temporary purposes directly to or from one another, subject to the conditions of the exemptive order. During the year ended December 31, 2022, there were no interfund loans made or outstanding with respect to the Portfolio.
Note 8–Purchases and Sales of Securities (in 000’s)
During the year ended December 31, 2022, purchases and sales of securities, other than short-term securities, were $444,130 and $491,746, respectively.
Note 9–Capital Share Transactions
Transactions in capital shares for the years ended December 31, 2022 and December 31, 2021, were as follows:
| Initial Class | Shares | Amount |
| Year ended December 31, 2022: | | |
| Shares sold | 56,268 | $ 474,155 |
| Shares issued to shareholders in reinvestment of distributions | 30,435 | 245,307 |
| Shares redeemed | (90,997) | (758,670) |
| Net increase (decrease) | (4,294) | $ (39,208) |
| Year ended December 31, 2021: | | |
| Shares sold | 200,003 | $ 1,812,192 |
| Shares redeemed | (29,920) | (270,840) |
| Net increase (decrease) | 170,083 | $ 1,541,352 |
| |
Notes to Financial Statements (continued)
| Service Class | Shares | Amount |
| Year ended December 31, 2022: | | |
| Shares sold | 820,504 | $ 6,841,290 |
| Shares issued to shareholders in reinvestment of distributions | 605,130 | 4,860,946 |
| Shares redeemed | (7,550,160) | (62,743,199) |
| Net increase (decrease) | (6,124,526) | $(51,040,963) |
| Year ended December 31, 2021: | | |
| Shares sold | 2,287,759 | $ 20,674,984 |
| Shares redeemed | (3,237,618) | (29,239,402) |
| Net increase (decrease) | (949,859) | $ (8,564,418) |
Note 10–Other Matters
As of the date of this report, interest rates in the United States and many parts of the world, including certain European countries, are ascending from historically low levels. Thus, the Portfolio currently faces a heightened level of risk associated with rising interest rates. This could be driven by a variety of factors, including but not limited to central bank monetary policies, changing inflation or real growth rates, general economic conditions, increasing bond issuances or reduced market demand for low yielding investments.
An outbreak of COVID-19, first detected in December 2019, has developed into a global pandemic and has resulted in travel restrictions, closure of international borders, certain businesses and securities markets, restrictions on securities trading activities, prolonged quarantines, supply chain disruptions, and lower consumer demand, as well as general concern and uncertainty. In 2022, many countries lifted some or all restrictions related to COVID-19. However, the continued impact of COVID-19 and related variants is uncertain and could further adversely affect the global economy, national economies, individual issuers and capital markets in unforeseeable ways and result in a substantial and extended economic downturn. Developments that disrupt global economies and financial markets, such as COVID-19, may magnify factors that affect the Portfolio's performance.
Note 11–Subsequent Events
In connection with the preparation of the financial statements of the Portfolio as of and for the year ended December 31, 2022, events and transactions subsequent to December 31, 2022, through the date the financial statements were issued have been evaluated by the Manager for possible adjustment and/or disclosure. No subsequent events requiring financial statement adjustment or disclosure have been identified.
| 34 | MainStay VP IQ Hedge Multi-Strategy Portfolio |
Report of Independent Registered Public Accounting Firm
To the Board of Trustees of MainStay VP Funds Trust and Shareholders of
MainStay VP IQ Hedge Multi-Strategy Portfolio
Opinion on the Financial Statements
We have audited the accompanying statement of assets and liabilities, including the portfolio of investments, of MainStay VP IQ Hedge Multi-Strategy Portfolio (one of the portfolios constituting MainStay VP Funds Trust, referred to hereafter as the “Portfolio”) as of December 31, 2022, the related statement of operations for the year ended December 31, 2022, the statements of changes in net assets for each of the two years in the period ended December 31, 2022, including the related notes, and the financial highlights for each of the five years in the period ended December 31, 2022 (collectively referred to as the “financial statements”). In our opinion, the financial statements present fairly, in all material respects, the financial position of the Portfolio as of December 31, 2022, the results of its operations for the year then ended, the changes in its net assets for each of the two years in the period ended December 31, 2022 and the financial highlights for each of the five years in the period ended December 31, 2022 in conformity with accounting principles generally accepted in the United States of America.
Basis for Opinion
These financial statements are the responsibility of the Portfolio’s management. Our responsibility is to express an opinion on the Portfolio’s financial statements based on our audits. We are a public accounting firm registered with the Public Company Accounting Oversight Board (United States) (PCAOB) and are required to be independent with respect to the Portfolio in accordance with the U.S. federal securities laws and the applicable rules and regulations of the Securities and Exchange Commission and the PCAOB.
We conducted our audits of these financial statements in accordance with the standards of the PCAOB. Those standards require that we plan and perform the audit to obtain reasonable assurance about whether the financial statements are free of material misstatement, whether due to error or fraud.
Our audits included performing procedures to assess the risks of material misstatement of the financial statements, whether due to error or fraud, and performing procedures that respond to those risks. Such procedures included examining, on a test basis, evidence regarding the amounts and disclosures in the financial statements. Our audits also included evaluating the accounting principles used and significant estimates made by management, as well as evaluating the overall presentation of the financial statements. Our procedures included confirmation of securities owned as of December 31, 2022 by correspondence with the custodian, transfer agents and brokers. We believe that our audits provide a reasonable basis for our opinion.
/s/PricewaterhouseCoopers LLP
New York, New York
February 24, 2023
We have served as the auditor of one or more investment companies in the MainStay group of funds since 1984.
Board Consideration and Approval of Management Agreement and Subadvisory Agreement (Unaudited)
The continuation of the Management Agreement with respect to the MainStay VP IQ Hedge Multi-Strategy Portfolio (“Portfolio”) and New York Life Investment Management LLC (“New York Life Investments”) and the Subadvisory Agreement between New York Life Investments and IndexIQ Advisors LLC (“IndexIQ”) with respect to the Portfolio (together, “Advisory Agreements”) is subject to annual review and approval by the Board of Trustees of MainStay VP Funds Trust (“Board” of the “Trust”) in accordance with Section 15 of the Investment Company Act of 1940, as amended (“1940 Act”). At its December 6–7, 2022 meeting, the Board, which is comprised solely of Trustees who are not an “interested person” (as such term is defined in the 1940 Act) of the Trust (“Independent Trustees”), unanimously approved the continuation of each of the Advisory Agreements for a one-year period.
In reaching the decision to approve the continuation of each of the Advisory Agreements, the Board considered information and materials furnished by New York Life Investments and IndexIQ in connection with an annual contract review process undertaken by the Board that took place at meetings of the Board and its Contracts Committee during October 2022 through December 2022, including information and materials furnished by New York Life Investments and IndexIQ in response to requests prepared on behalf of the Board, and in consultation with the Board, by independent legal counsel to the Independent Trustees, which encompassed a variety of topics, including those summarized below. Information and materials requested by and furnished to the Board for consideration in connection with the contract review process included, among other items, reports on the Portfolio and “peer funds” prepared by Institutional Shareholder Services Inc. (“ISS”), an independent third-party service provider engaged by the Board to report objectively on the Portfolio’s investment performance, management fee and total expenses. The Board also considered information on the fees charged to other investment advisory clients of New York Life Investments and/or IndexIQ that follow investment strategies similar to those of the Portfolio, if any, and, when applicable, the rationale for any differences in the Portfolio’s management and subadvisory fees and the fees charged to those other investment advisory clients. In addition, the Board considered information regarding the legal standards and fiduciary obligations applicable to its consideration of the continuation of each of the Advisory Agreements. The contract review process, including the structure and format for information and materials provided to the Board, has been developed in consultation with the Board. The Independent Trustees also met in executive sessions with their independent legal counsel and, for portions thereof, with senior management of New York Life Investments.
The Board’s deliberations with respect to the continuation of each of the Advisory Agreements reflect a year-long process, and the Board also took into account information furnished to the Board and its Committees throughout the year, as deemed relevant and appropriate by the Trustees, including, among other items, reports on investment performance of the Portfolio and investment-related matters for the Portfolio as well as presentations from New York Life Investments and, generally annually, IndexIQ personnel. In addition, the Board took into account other information received from New York Life Investments throughout the year,
including, among other items, periodic reports on legal and compliance matters, risk management, portfolio turnover, brokerage commissions and non-advisory services provided to the Portfolio by New York Life Investments, as deemed relevant and appropriate by the Trustees.
In addition to information provided to the Board throughout the year, the Board received information in connection with its June 2022 meeting provided specifically in response to requests prepared on behalf of the Board, and in consultation with the Board, by independent legal counsel to the Independent Trustees regarding the Portfolio’s distribution arrangements. In addition, the Board received information regarding the Portfolio’s asset levels, share purchase and redemption activity and the payment of Rule 12b-1 and/or other fees by applicable share classes of the Portfolio, among other information.
In considering the continuation of each of the Advisory Agreements, the Trustees reviewed and evaluated the information and factors they believed to reasonably be necessary and appropriate in light of legal advice furnished to them by independent legal counsel to the Independent Trustees and through the exercise of their own business judgment. Although individual Trustees may have weighed certain factors or information differently and the Board did not consider any single factor or information controlling in reaching its decision, the factors considered by the Board are summarized in more detail below and include, among other factors: (i) the nature, extent and quality of the services provided to the Portfolio by New York Life Investments and IndexIQ; (ii) the qualifications of the portfolio managers of the Portfolio and the historical investment performance of the Portfolio, New York Life Investments and IndexIQ; (iii) the costs of the services provided, and profits realized, by New York Life Investments and IndexIQ with respect to their relationships with the Portfolio; (iv) the extent to which economies of scale have been realized or may be realized if the Portfolio grows and the extent to which any economies of scale have been shared, have benefited or may benefit the Portfolio’s shareholders; and (v) the reasonableness of the Portfolio’s management and subadvisory fees and total ordinary operating expenses. Although the Board recognized that comparisons between the Portfolio’s fees and expenses and those of other funds are imprecise given different terms of agreements, variations in fund strategies and other factors, the Board considered the reasonableness of the Portfolio’s management fee and total ordinary operating expenses as compared to the peer funds identified by ISS. Throughout their considerations, the Trustees acknowledged the commitment of New York Life Investments and its affiliates to serve the MainStay Group of Funds, as well as their capacity, experience, resources, financial stability and reputations. The Trustees also acknowledged the entrepreneurial and other risks assumed by New York Life Investments in sponsoring and managing the Portfolio. With respect to the Subadvisory Agreement, the Board took into account New York Life Investments’ recommendation to approve the continuation of the Subadvisory Agreement.
The Trustees noted that, throughout the year, the Trustees are afforded an opportunity to ask questions of, and request additional information or materials from, New York Life Investments and IndexIQ. The Board’s decision with respect to each of the Advisory Agreements may have also
| 36 | MainStay VP IQ Hedge Multi-Strategy Portfolio |
been based, in part, on the Board’s knowledge of New York Life Investments and IndexIQ resulting from, among other things, the Board’s consideration of each of the Advisory Agreements in prior years, the advisory agreements for other funds in the MainStay Group of Funds, the Board’s review throughout the year of the performance and operations of other funds in the MainStay Group of Funds and each Trustee’s business judgment and industry experience. In addition to considering the above-referenced factors, the Board observed that in the marketplace, notably under variable life insurance policies and variable annuity contracts for which the Portfolio serves as an investment option, there are a range of investment options available to investors and that the Portfolio’s shareholders, having had the opportunity to consider other investment options, have chosen to invest in the Portfolio.
The factors that figured prominently in the Board’s decision to approve the continuation of each of the Advisory Agreements during its December 6–7, 2022 meeting are summarized in more detail below.
Nature, Extent and Quality of Services Provided by New York Life Investments and IndexIQ
The Board examined the nature, extent and quality of the services that New York Life Investments provides to the Portfolio. The Board evaluated New York Life Investments’ experience and capabilities in serving as manager of the Portfolio and considered that the Portfolio operates in a “manager-of-managers” structure. The Board also considered New York Life Investments’ responsibilities and services provided pursuant to this structure, including overseeing the services provided by IndexIQ, evaluating the performance of IndexIQ, making recommendations to the Board as to whether the Subadvisory Agreement should be renewed, modified or terminated and periodically reporting to the Board regarding the results of New York Life Investments’ evaluation and monitoring functions. The Board noted that New York Life Investments manages other mutual funds, serves a variety of other investment advisory clients, including other pooled investment vehicles, and has experience overseeing mutual fund service providers, including subadvisors. The Board considered the experience of senior personnel at New York Life Investments providing management and administrative and other non-advisory services to the Portfolio. The Board observed that New York Life Investments devotes significant resources and time to providing management and administrative and other non-advisory services to the Portfolio, including New York Life Investments’ oversight and due diligence reviews of IndexIQ and ongoing analysis of, and interactions with, IndexIQ with respect to, among other things, the Portfolio’s investment performance and risks as well as IndexIQ’s investment capabilities and subadvisory services with respect to the Portfolio.
The Board also considered the range of services that New York Life Investments provides to the Portfolio under the terms of the Management Agreement, including: (i) fund accounting and ongoing supervisory services provided by New York Life Investments’ Fund Administration and Accounting Group; (ii) investment supervisory and analytical services provided by New York Life Investments’ Investment Consulting Group; (iii) compliance services provided by the Trust’s Chief Compliance Officer as
well as New York Life Investments’ compliance department, including supervision and implementation of the Portfolio’s compliance program; (iv) legal services provided by New York Life Investments’ Office of the General Counsel; and (v) risk management monitoring and analysis by compliance and investment personnel. In addition, the Board considered New York Life Investments’ willingness to invest in personnel and other resources, such as cyber security, information security and business continuity planning, designed to benefit the Portfolio and noted that New York Life Investments is responsible for compensating the Trust’s officers, except for a portion of the salary of the Trust’s Chief Compliance Officer. The Board recognized that New York Life Investments provides certain other non-advisory services to the Portfolio and has provided an increasingly broad array of non-advisory services to the MainStay Group of Funds as a result of regulatory and other developments, including in connection with the implementation of the MainStay Group of Funds’ derivatives risk management program and policies and procedures adopted pursuant to Rule 18f-4 under the 1940 Act.
The Board also examined the range, and the nature, extent and quality, of the investment advisory services that IndexIQ provides to the Portfolio and considered the terms of each of the Advisory Agreements. The Board evaluated IndexIQ’s experience and performance in serving as subadvisor to the Portfolio and advising other portfolios and IndexIQ’s track record and experience in providing investment advisory services, the experience of investment advisory, senior management and administrative personnel at IndexIQ. The Board considered New York Life Investments’ and IndexIQ’s overall resources, legal and compliance environment, capabilities, reputation, financial condition and history. In addition to information provided in connection with quarterly meetings with the Trust’s Chief Compliance Officer, the Board considered information regarding the compliance policies and procedures of New York Life Investments and IndexIQ and acknowledged their commitment to further developing and strengthening compliance programs relating to the Portfolio. The Board also considered IndexIQ’s ability to recruit and retain qualified investment professionals and willingness to invest in personnel and other resources to service and support the Portfolio. In this regard, the Board considered the qualifications and experience of the Portfolio’s portfolio managers, the number of accounts managed by the portfolio managers and the method for compensating the portfolio managers.
In addition, the Board considered information provided by New York Life Investments and IndexIQ regarding the operations of their respective business continuity plans in response to the COVID-19 pandemic and the continued remote work environment.
Based on these considerations, among others, the Board concluded that the Portfolio would likely continue to benefit from the nature, extent and quality of these services.
Investment Performance
In evaluating the Portfolio’s investment performance, the Board considered investment performance results over various periods in light of the Portfolio’s investment objective, strategies and risks. The Board
Board Consideration and Approval of Management Agreement and Subadvisory Agreement (Unaudited) (continued)
considered investment reports on, and analysis of, the Portfolio’s performance provided to the Board throughout the year. These reports include, among other items, information on the Portfolio’s gross and net returns, the Portfolio’s investment performance compared to a relevant investment category and the Portfolio’s benchmarks, the Portfolio’s risk-adjusted investment performance and the Portfolio’s investment performance as compared to peer funds, as appropriate, as well as portfolio attribution information and commentary on the effect of market conditions. The Board also considered information provided by ISS showing the investment performance of the Portfolio as compared to peer funds. In addition, the Board reviewed the methodology used by ISS to construct the group of peer funds for comparative purposes.
The Board also took into account its discussions with senior management at New York Life Investments concerning the Portfolio’s investment performance over various periods as well as discussions between the Portfolio’s portfolio management team and the members of the Board’s Investment Committee, which generally occur on an annual basis. In addition, the Board considered any specific actions that New York Life Investments or IndexIQ had taken, or had agreed to take, to seek to enhance Portfolio investment performance and the results of those actions. In considering the investment performance of the Portfolio, the Board noted that the Portfolio underperformed its peer funds for the one-, three- and five-year periods ended July 31, 2022. The Board considered its discussions with representatives from New York Life Investments and IndexIQ regarding the Portfolio’s investment performance.
Based on these considerations, among others, the Board concluded that its review of the Portfolio’s investment performance and related information supported a determination to approve the continuation of each of the Advisory Agreements.
Costs of the Services Provided, and Profits and Other Benefits Realized, by New York Life Investments and IndexIQ
The Board considered the costs of the services provided under each of the Advisory Agreements. The Board also considered the profits realized by New York Life Investments and its affiliates, including IndexIQ, due to their relationships with the Portfolio as well as the MainStay Group of Funds. Because IndexIQ is an affiliate of New York Life Investments whose subadvisory fee is paid by New York Life Investments, not the Portfolio, the Board considered cost and profitability information for New York Life Investments and IndexIQ in the aggregate.
In addition, the Board acknowledged the difficulty in obtaining reliable comparative data about mutual fund managers’ profitability because such information generally is not publicly available and may be impacted by numerous factors, including the structure of a fund manager’s organization, the types of funds it manages, the methodology used to allocate certain fixed costs to specific funds and the manager’s capital structure and costs of capital.
In evaluating the costs of the services provided by New York Life Investments and IndexIQ and profits realized by New York Life Investments and its affiliates, including IndexIQ, the Board considered,
among other factors, New York Life Investments’ and its affiliates’, including IndexIQ’s, continuing investments in, or willingness to invest in, personnel and other resources to support and further enhance the management of the Portfolio, and that New York Life Investments is responsible for paying the subadvisory fee for the Portfolio. The Board also considered the financial resources of New York Life Investments and IndexIQ and acknowledged that New York Life Investments and IndexIQ must be in a position to recruit and retain experienced professional personnel and to maintain a strong financial position for New York Life Investments and IndexIQ to continue to provide high-quality services to the Portfolio. The Board recognized that the Portfolio benefits from the allocation of certain fixed costs among the funds in the MainStay Group of Funds, among other expected benefits resulting from its relationship with New York Life Investments.
The Board considered information regarding New York Life Investments’ methodology for calculating profitability and allocating costs provided by New York Life Investments in connection with the fund profitability analysis presented to the Board. The Board noted it had previously engaged an independent consultant to review the methods used to allocate costs among the funds in the MainStay Group of Funds. The Board also noted that the independent consultant had concluded that New York Life Investments’ methods for allocating costs and procedures for estimating overall profitability of the relationship with the funds in the MainStay Group of Funds are reasonable and that New York Life Investments continued to use the same method of calculating profit and allocating costs since the independent consultant’s review. The Board recognized the difficulty in calculating and evaluating a manager’s profitability with respect to the Portfolio and considered that other profitability methodologies may also be reasonable.
The Board also considered certain fall-out benefits that may be realized by New York Life Investments and its affiliates due to their relationships with the Portfolio, including reputational and other indirect benefits. The Board recognized, for example, the benefits to IndexIQ from legally permitted “soft-dollar” arrangements by which brokers provide research and other services to IndexIQ in exchange for commissions paid by the Portfolio with respect to trades in the Portfolio’s portfolio securities. In addition, the Board considered its review of the management agreement for a money market fund advised by New York Life Investments and an affiliated subadvisor that serves as an investment option for the Portfolio, including the potential rationale for and costs associated with investments in this money market fund by the Portfolio, if any, and considered information from New York Life Investments that the nature and type of specific investment advisory services provided to this money market fund are distinct from, or in addition to, the investment advisory services provided to the Portfolio. In addition, the Board considered the potential dividend received tax deduction for insurance company affiliates of New York Life Investments from the Portfolio’s securities lending activity.
The Board noted that the Portfolio serves as an investment option primarily under variable contracts issued by affiliates of New York Life Investments that would receive fees under those contracts. The Board observed that, in addition to fees earned by New York Life Investments
| 38 | MainStay VP IQ Hedge Multi-Strategy Portfolio |
under the Management Agreement for managing the Portfolio, New York Life Investments’ affiliates also earn revenues from serving the Portfolio in various other capacities, including as the Portfolio’s distributor. The Board considered information about these other revenues and their impact on the profitability of the relationship with the Portfolio to New York Life Investments and its affiliates. The Board noted that, although it assessed the overall profitability of the relationship with the Portfolio to New York Life Investments and its affiliates as part of the contract review process, when considering the reasonableness of the fee paid to New York Life Investments under the Management Agreement, the Board considered the profitability of New York Life Investments’ relationship with the Portfolio on a pre-tax basis and without regard to distribution expenses incurred by New York Life Investments from its own resources.
After evaluating the information deemed relevant by the Trustees, the Board concluded that any profits realized by New York Life Investments and its affiliates, including IndexIQ, due to their relationships with the Portfolio were not excessive and other benefits that may accrue to New York Life Investments and its affiliates, including IndexIQ, are reasonable.
Management and Subadvisory Fees and Total Ordinary Operating Expenses
The Board evaluated the reasonableness of the fee paid under each of the Advisory Agreements and the Portfolio’s total ordinary operating expenses. The Board primarily considered the reasonableness of the management fee paid by the Portfolio to New York Life Investments because the subadvisory fee paid to IndexIQ is paid by New York Life Investments, not the Portfolio. The Board also considered the reasonableness of the subadvisory fee paid by New York Life Investments and the amount of the management fee retained by New York Life Investments.
In assessing the reasonableness of the Portfolio’s fees and expenses, the Board primarily considered comparative data provided by ISS on the fees and expenses charged by similar mutual funds managed by other investment advisers. The Board reviewed the methodology used by ISS to construct the group of peer funds for comparative purposes. In addition, the Board considered information provided by New York Life Investments and IndexIQ on fees charged to other investment advisory clients, including institutional separate accounts and/or other funds that follow investment strategies similar to those of the Portfolio, if any. The Board considered the contractual management fee schedules of the Portfolio as compared to those of such other investment advisory clients, taking into account the rationale for any differences in fee schedules. The Board also took into account information provided by New York Life Investments about the more extensive scope of services provided to registered investment companies, such as the Portfolio, as compared with other investment advisory clients. Additionally, the Board considered the impact of expense limitation arrangements on the Portfolio’s net management fee and expenses. The Board also considered that in proposing fees for the Portfolio, New York Life Investments considers the competitive marketplace for mutual funds.
Because the Portfolio invests primarily in ETFs, the Board also considered information provided by New York Life Investments regarding the fees and expenses associated with the Portfolio’s investments in ETFs, including New York Life Investments’ finding that the Portfolio’s fees and expenses do not duplicate the fees and expenses of the corresponding acquired ETF (when required by Rule 12d1-4 under the 1940 Act).
Based on the factors outlined above, among other considerations, the Board concluded that the Portfolio’s management fee and total ordinary operating expenses are within a range that is competitive and support a conclusion that these fees and expenses are reasonable.
Economies of Scale
The Board considered information regarding economies of scale, including whether economies of scale may exist for the Portfolio and whether the Portfolio’s expense structure permits any economies of scale to be appropriately shared with the Portfolio’s beneficial shareholders. The Board also considered a report from New York Life Investments, previously prepared at the request of the Board, that addressed economies of scale, including with respect to the mutual fund business generally, and the various ways in which the benefits of economies of scale may be shared with the funds in the MainStay Group of Funds. Although the Board recognized the difficulty of determining economies of scale with precision, the Board acknowledged that economies of scale may be shared with the Portfolio in a number of ways, including, for example, through the imposition of fee breakpoints, initially setting management fee rates at scale or making additional investments to enhance the services provided to the Portfolio. The Board reviewed information from New York Life Investments showing how the Portfolio’s management fee schedule compared to fee schedules of other funds and accounts managed by New York Life Investments. The Board also reviewed information from ISS showing how the Portfolio’s management fee schedule compared with fees paid for similar services by peer funds at varying asset levels.
Based on this information, the Board concluded that economies of scale are appropriately reflected for the benefit of the Portfolio’s beneficial shareholders through the Portfolio’s expense structure and other methods to share benefits from economies of scale.
Conclusion
On the basis of the information and factors summarized above, among other information and factors deemed relevant by the Trustees, and the evaluation thereof, the Board unanimously voted to approve the continuation of each of the Advisory Agreements.
Proxy Voting Policies and Procedures and Proxy Voting Record
The Portfolio is required to file with the SEC its proxy voting record for the 12-month period ending June 30 on Form N-PX. A description of the policies and procedures that are used to vote proxies relating to portfolio securities of the Portfolio is available free of charge upon request by calling 800-598-2019 or visiting the SEC's website at www.sec.gov. The most recent Form N-PX or proxy voting record is available free of charge upon request by calling 800-598-2019; visiting https://www.newyorklifeinvestments.com/investment-products/vp; or visiting the SEC’s website at www.sec.gov.
Shareholder Reports and Quarterly Portfolio Disclosure
The Portfolio is required to file its complete schedule of portfolio holdings with the SEC 60 days after its first and third fiscal quarter on Form N-PORT. The Portfolio's holdings report is available free of charge upon request by calling 800-598-2019 or by visiting the SEC’s website at www.sec.gov.
Board of Trustees and Officers (Unaudited)
The Trustees and officers of the Portfolio are listed below. The Board oversees the MainStay Group of Funds (which consists of MainStay Funds and MainStay Funds Trust), MainStay VP Funds Trust, MainStay MacKay DefinedTerm Municipal Opportunities Fund, MainStay CBRE Global Infrastructure Megatrends Fund, the Manager and the Subadvisors, and elects the officers of the Portfolios who are responsible for the day-to-day operations of the Portfolio. Information pertaining to the Trustees and officers is set forth below. Each Trustee serves until his or her successor
is elected and qualified or until his or her resignation, death or removal. Under the Board’s retirement policy, unless an exception is made, a Trustee must tender his or her resignation by the end of the calendar year during which he or she reaches the age of 75. The business address of each Trustee and officer listed below is 51 Madison Avenue, New York, New York 10010. None of the Trustees are “interested persons” (as defined by the 1940 Act and rules adopted by the SEC thereunder) of the Portfolio (“Independent Trustees”).
| | Name and
Year of Birth | Term of Office,
Position(s) Held and
Length of Service | Principal Occupation(s)
During Past Five Years | Number of
Portfolios in
Fund Complex
Overseen by
Trustee | Other Directorships
Held by Trustee |
| | | | | | |
| | David H. Chow
1957 | MainStay VP Funds Trust: Trustee since January 2016, Advisory Board Member (June 2015 to December 2015) | Founder and CEO, DanCourt Management, LLC since 1999 | 78 | MainStay Funds: Trustee since January 2016, Advisory Board Member (June 2015 to December 2015) (12 Funds);
MainStay Funds Trust: Trustee since January 2016, Advisory Board Member (June 2015 to December 2015) (33 Funds);
MainStay MacKay DefinedTerm Municipal Opportunities Fund: Trustee since January 2016, Advisory Board Member (June 2015 to December 2015);
MainStay CBRE Global Infrastructure Megatrends Fund: Trustee since June 2021;VanEck Vectors Group of Exchange-Traded Funds: Independent Chairman of the Board of Trustees since 2008 and Trustee since 2006 (57 portfolios); and Berea College of Kentucky: Trustee since 2009, Chair of the Committee since 2018 |
| | Susan B. Kerley
1951 | MainStay VP Funds Trust: Chairman since 2017 and Trustee since 2007* | President, Strategic Management Advisors LLC since 1990 | 78 | MainStay Funds: Chairman since 2017 and Trustee since 2007 (12 Funds); MainStay Funds Trust: Chairman since 2017 and Trustee since 1990 (33 Funds)**;
MainStay MacKay DefinedTerm Municipal Opportunities Fund: Chairman since 2017 and Trustee since 2011; MainStay CBRE Global Infrastructure Megatrends Fund: Trustee since June 2021; and Legg Mason Partners Funds: Trustee since 1991 (45 portfolios) |
| | Alan R. Latshaw
1951 | MainStay VP Funds Trust: Trustee since 2007* | Retired; Partner, Ernst & Young LLP (2002 to 2003); Partner, Arthur Andersen LLP (1989 to 2002); Consultant to the MainStay Funds Audit and Compliance Committee (2004 to 2006) | 78 | MainStay Funds: Trustee since 2006 (12 Funds);
MainStay Funds Trust: Trustee since 2007 (33 Funds)**;
MainStay MacKay DefinedTerm Municipal Opportunities Fund: Trustee since 2011; and
MainStay CBRE Global Infrastructure Megatrends Fund: Trustee since June 2021 |
Board of Trustees and Officers (Unaudited) (continued)
| | Name and
Year of Birth | Term of Office,
Position(s) Held and
Length of Service | Principal Occupation(s)
During Past Five Years | Number of
Portfolios in
Fund Complex
Overseen by
Trustee | Other Directorships
Held by Trustee |
| | | | | | |
| | Karen Hammond
1956 | MainStay VP Funds Trust: Trustee since December 2021, Advisory Board Member (June 2021 to December 2021)
| Retired, Managing Director, Devonshire Investors (2007 to 2013); Senior Vice President, Fidelity Management & Research Co. (2005 to 2007); Senior Vice President and Corporate Treasurer, FMR Corp. (2003 to 2005); Chief Operating Officer, Fidelity Investments Japan (2001 to 2003) | 78 | MainStay Funds: Trustee since December 2021, Advisory Board Member (June 2021 to December 2021) (12 Funds);
MainStay Funds Trust: Trustee since December 2021, Advisory Board Member (June 2021 to December 2021) (33 Funds);
MainStay MacKay DefinedTerm Municipal Opportunities Fund: Trustee since December 2021, Advisory Board Member (June 2021 to December 2021);
MainStay CBRE Global Infrastructure Megatrends Fund: Trustee since December 2021, Advisory Board Member (June 2021 to December 2021);
Two Harbors Investment Corp.: Director since 2018; Rhode Island State Investment Commission: Member since 2017; and Blue Cross Blue Shield of Rhode Island: Director since 2019
|
| | Jacques P. Perold
1958 | MainStay VP Funds Trust: Trustee since January 2016, Advisory Board Member (June 2015 to December 2015) | Founder and Chief Executive Officer, CapShift Advisors LLC (since 2018); President, Fidelity Management & Research Company (2009 to 2014); President and Chief Investment Officer, Geode Capital Management, LLC (2001 to 2009) | 78 | MainStay Funds: Trustee since January 2016, Advisory Board Member (June 2015 to December 2015) (12 Funds);
MainStay Funds Trust: Trustee since January 2016, Advisory Board Member (June 2015 to December 2015) (33 Funds); MainStay MacKay DefinedTerm Municipal Opportunities Fund: Trustee since January 2016, Advisory Board Member (June 2015 to December 2015);
MainStay CBRE Global Infrastructure Megatrends Fund: Trustee since June 2021; Allstate Corporation: Director since 2015;
Partners in Health: Trustee since 2019; and
MSCI Inc.: Director since 2017 |
| | Richard S. Trutanic
1952 | MainStay VP Funds Trust: Trustee since 2007* | Chairman and Chief Executive Officer, Somerset & Company (financial advisory firm) since 2004; Managing Director, The Carlyle Group (private investment firm) (2002 to 2004); Senior Managing Director, Partner and Board Member, Groupe Arnault S.A. (private investment firm) (1999 to 2002)
| 78 | MainStay Funds: Trustee since 1994 (12 Funds);
MainStay Funds Trust: Trustee since 2007 (33 Funds)**;
MainStay MacKay DefinedTerm Municipal Opportunities Fund: Trustee since 2011; and
MainStay CBRE Global Infrastructure Megatrends Fund: Trustee since June 2021 |
| * | Includes prior service as a Director of MainStay VP Series Fund, Inc., the predecessor to MainStay VP Funds Trust. |
| ** | Includes prior service as a Director/Trustee of certain predecessor entities to MainStay Funds Trust. |
| 42 | MainStay VP IQ Hedge Multi-Strategy Portfolio |
| | Name and
Year of Birth | Position(s) Held and
Length of Service | Principal Occupation(s)
During Past Five Years | |
| | | | | |
| | Kirk C. Lehneis
1974 | President, MainStay VP Funds Trust (since 2017) | Chief Operating Officer and Senior Managing Director (since 2016), New York Life Investment Management LLC and New York Life Investment Management Holdings LLC; Member of the Board of Managers (since 2017) and Senior Managing Director (since 2018), NYLIFE Distributors LLC; Chairman of the Board and Senior Managing Director, NYLIM Service Company LLC (since 2017); Trustee, President and Principal Executive Officer of IndexIQ Trust, IndexIQ ETF Trust and IndexIQ Active ETF Trust (since January 2018); President, MainStay CBRE Global Infrastructure Megatrends Fund (since 2021), MainStay MacKay DefinedTerm Municipal Opportunities Fund, MainStay Funds and MainStay Funds Trust (since 2017); Senior Managing Director, Global Product Development (from 2015-2016); Managing Director, Product Development (from 2010-2015), New York Life Investment Management LLC | |
| | Jack R. Benintende
1964 | Treasurer and Principal Financial and Accounting Officer, MainStay VP Funds Trust (since 2007)** | Managing Director, New York Life Investment Management LLC (since 2007); Treasurer and Principal Financial and Accounting Officer, MainStay CBRE Global Infrastructure Megatrends Fund (since 2021), MainStay MacKay DefinedTerm Municipal Opportunities Fund (since 2011), MainStay Funds Trust (since 2009) and MainStay Funds (since 2007); and Assistant Treasurer, New York Life Investment Management Holdings LLC (2008 to 2012) | |
| | J. Kevin Gao
1967 | Secretary and Chief Legal Officer, MainStay VP Funds Trust (since 2010)** | Managing Director and Associate General Counsel, New York Life Investment Management LLC (since 2010); Secretary and Chief Legal Officer, MainStay CBRE Global Infrastructure Megatrends Fund (since 2021), MainStay MacKay DefinedTerm Municipal Opportunities Fund (since 2011), MainStay Funds and MainStay Funds Trust (since 2010) | |
| | Scott T. Harrington
1959 | Vice President— Administration, MainStay VP Funds Trust (since 2005)** | Managing Director, New York Life Investment Management LLC (including predecessor advisory organizations) (since 2000); Member of the Board of Directors, New York Life Trust Company (since 2009); Vice President—Administration, MainStay CBRE Global Infrastructure Megatrends Fund (since 2021), MainStay MacKay DefinedTerm Municipal Opportunities Fund (since 2011), MainStay Funds Trust and MainStay Funds (since 2009) | |
| | Kevin M. Gleason
1967 | Vice President and Chief Compliance Officer, MainStay VP Funds Trust (since June 2022) | Vice President and Chief Compliance Officer, IndexIQ, IndexIQ ETF Trust and Index IQ Active ETF Trust (since June 2022); Vice President and Chief Compliance Officer, MainStay CBRE Global Infrastructure Megatrends Fund, MainStay MacKay DefinedTerm Municipal Opportunities Fund (since June 2022); MainStay Funds Trust and MainStay Funds (since June 2022); Senior Vice President, Voya Investment Management and Chief Compliance Officer, Voya Family of Funds (2012-2022) | |
| * | The officers listed above are considered to be “interested persons” of the MainStay Group of Funds, MainStay VP Funds Trust, MainStay CBRE Global Infrastructure Megatrends Fund and MainStay MacKay DefinedTerm Municipal Opportunities Fund within the meaning of the 1940 Act because of their affiliation with the MainStay Group of Funds, New York Life Insurance Company and/or its affiliates, including New York Life Investment Management LLC, NYLIM Service Company LLC, NYLIFE Securities LLC and/or NYLIFE Distributors LLC, as described in detail in the column captioned “Principal Occupation(s) During Past Five Years.” Officers are elected annually by the Board. |
| ** | Includes prior service as an Officer of MainStay VP Series Fund, Inc., the predecessor to MainStay VP Funds Trust. |
Officers of the Trust (Who are not Trustees)*
This page intentionally left blank.
This page intentionally left blank.
This page intentionally left blank.
MainStay VP Portfolios
MainStay VP offers a wide range of Portfolios. The full array of MainStay VP offerings is listed here, with information about the manager, subadvisors, legal counsel, and independent registered public accounting firm.
Equity
MainStay VP American Century Sustainable Equity Portfolio1
MainStay VP Candriam Emerging Markets Equity Portfolio
MainStay VP Epoch U.S. Equity Yield Portfolio
MainStay VP Fidelity Institutional AM® Utilities Portfolio†
MainStay VP MacKay International Equity Portfolio
MainStay VP Natural Resources Portfolio
MainStay VP S&P 500 Index Portfolio2
MainStay VP Small Cap Growth Portfolio
MainStay VP Wellington Growth Portfolio
MainStay VP Wellington Mid Cap Portfolio
MainStay VP Wellington Small Cap Portfolio
MainStay VP Wellington U.S. Equity Portfolio
MainStay VP Winslow Large Cap Growth Portfolio
Mixed Asset
MainStay VP Balanced Portfolio
MainStay VP Income Builder Portfolio
MainStay VP Janus Henderson Balanced Portfolio
MainStay VP MacKay Convertible Portfolio
Income
MainStay VP Bond Portfolio
MainStay VP Floating Rate Portfolio
MainStay VP Indexed Bond Portfolio
MainStay VP MacKay Government Portfolio
MainStay VP MacKay High Yield Corporate Bond Portfolio
MainStay VP MacKay Strategic Bond Portfolio
MainStay VP PIMCO Real Return Portfolio
Money Market
MainStay VP U.S. Government Money Market Portfolio
Alternative
MainStay VP CBRE Global Infrastructure Portfolio
MainStay VP IQ Hedge Multi-Strategy Portfolio
Asset Allocation
MainStay VP Conservative Allocation Portfolio
MainStay VP Equity Allocation Portfolio
MainStay VP Growth Allocation Portfolio
MainStay VP Moderate Allocation Portfolio
Manager
New York Life Investment Management LLC
New York, New York
Subadvisors
American Century Investment Management, Inc.
Kansas City, Missouri
Brown Advisory LLC
Baltimore, Maryland
Candriam*
Strassen, Luxembourg
CBRE Investment Management Listed Real Assets LLC
Radnor, Pennsylvania
Epoch Investment Partners, Inc.
New York, New York
FIAM LLC
Smithfield, Rhode Island
IndexIQ Advisors LLC*
New York, New York
Janus Henderson Investors US LLC
Denver, Colorado
MacKay Shields LLC*
New York, New York
Newton Investment Management North America, LLC
Boston, Massachusetts
NYL Investors LLC*
New York, New York
Pacific Investment Management Company LLC
Newport Beach, California
Segall Bryant & Hamill, LLC
Chicago, Illinois
Wellington Management Company LLP
Boston, Massachusetts
Winslow Capital Management, LLC
Minneapolis, Minnesota
Legal Counsel
Dechert LLP
Washington, District of Columbia
Independent Registered Public Accounting Firm
PricewaterhouseCoopers LLP
New York, New York
Distributor
NYLIFE Distributors LLC*
Jersey City, New Jersey
Custodian
JPMorgan Chase Bank, N.A.
New York, New York
Some Portfolios may not be available in all products.
† Fidelity Institutional AM is a registered trade mark of FMR LLC. Used with permission.
* An affiliate of New York Life Investment Management LLC.
| 1. | Prior to May 1, 2022, the Portfolio's name was MainStay VP T. Rowe Price Equity Income Portfolio. |
| 2. | Prior to May 1, 2022, the Portfolio's name was MainStay VP MacKay S&P 500 Index Portfolio. |
Not part of the Annual Report
2022 Annual Report
This report is for the general information of New York Life Variable Annuities and NYLIAC Variable Universal Life Insurance Products policyowners. It must be preceded or accompanied by the appropriate product(s) and funds prospectuses if it is given to anyone who is not an owner of a New York Life variable annuity policy or a NYLIAC Variable Universal Life Insurance Product. This report does not offer for sale or solicit orders to purchase securities.
The performance data quoted in this report represents past performance. Past performance is no guarantee of future results. Due to market volatility and other factors, current performance may be lower or higher than the figures shown. The most recent month-end performance summary for your variable annuity or variable life policy is available by calling 800-598-2019 and is updated periodically on newyorklife.com.
The New York Life Variable Annuities and NYLIAC Variable Universal Life Insurance Products are issued by New York Life Insurance and Annuity Corporation (a Delaware Corporation) and distributed by NYLIFE Distributors LLC (Member FINRA/SIPC).
New York Life Insurance Company
New York Life Insurance and Annuity
Corporation (NYLIAC) (A Delaware Corporation)
51 Madison Avenue, Room 551
New York, NY 10010
newyorklife.com
newyorklifeinvestments.com
NYLIFE Distributors LLC, 30 Hudson Street, Jersey City, NJ 07302
New York Life Investment Management LLC is the investment manager to the MainStay VP Funds Trust
©2023 by NYLIFE Distributors LLC. All rights reserved.
You may obtain copies of the Prospectus and the Statement of Additional Information free of charge, upon request, by calling toll-free 800-598-2019 or writing to New York Life Insurance and Annuity Corporation, 51 Madison Avenue, New York, NY 10010.
| Not FDIC Insured | No Bank Guarantee | May Lose Value |
(NYLIAC) NI506
MainStay VP Balanced Portfolio
Message from the President and Annual Report
December 31, 2022
Sign up for e-delivery of your shareholder reports. For full details on e-delivery, including who can participate and what you can receive via e-delivery,
please log in to newyorklifeinvestments.com/accounts.
| Not FDIC/NCUA Insured | Not a Deposit | May Lose Value | No Bank Guarantee | Not Insured by Any Government Agency |
This page intentionally left blank
Message from the President
The 12-month reporting period ended December 31, 2022, proved exceptionally challenging for investors as both stock and bond markets suffered steep declines. A variety of economic and geopolitical forces drove the market’s losses, all centered around rising inflation and monetary efforts to rein it in.
Inflationary alarms began to sound well before the reporting period began. In late 2021, after nearly two years of accommodative policies designed to encourage economic growth in the face of the COVID-19 pandemic, the U.S. Federal Reserve (the “Fed”) warned of the increasing need to tighten monetary policy. Nevertheless, the pace and persistence of inflation in early 2022 caught most market participants—the Fed included—off guard. Russia’s invasion of Ukraine in February exacerbated global inflationary pressures while increasing investor uncertainty. Domestic supply shortages, international trade imbalances and rising inflation caused U.S. GDP (gross domestic product) to contract in the first and second quarters of the year, although employment and consumer spending proved resilient. Prices for petroleum surged to multi-year highs, while many key agricultural chemicals and industrial metals soared as well. Accelerating inflationary forces prompted the Fed to implement its most aggressive series of interest rate hikes since the 1980s, with a 0.25% increase in March followed by six further rate increases totaling 4.25%. International central banks generally followed suit and raised rates by varying degrees in efforts to curb local inflation, although most increases remained significantly more modest than those in the United States. Relatively high U.S. interest rates and an international risk averse sentiment pushed U.S. dollar values higher compared to most other currencies, with negative impacts on global prices for food, fuel and other key U.S.-dollar-denominated products.
The effects of these interrelated challenges were felt throughout U.S. and international financial markets. The S&P 500® Index, a widely regarded benchmark of market performance, declined by more than 18% during the reporting period. Although the energy sector generated strong gains, bolstered by elevated oil and gas prices, most other industry segments recorded losses. The more cyclical and growth-oriented sectors of consumer discretionary, information technology and real estate delivered the weakest returns, while the traditionally defensive and value-oriented
consumer staples, utilities and health care sectors outperformed. On average, international developed-country equity markets mildly outperformed their U.S. counterparts, while emerging markets lagged slightly. Fixed-income markets proved unusually volatile, with bond prices trending sharply lower as yields rose along with interest rates. Short-term yields rose faster than long-term yields, producing a yield curve inversion from July through the end of the reporting period as long-term rates remained below short-term rates. While floating-rate instruments, which feature variable interest rates that allow investors to benefit from a rising rate environment, provided a degree of insulation from inflation-driven trends, they were not immune to the market’s widespread declines.
Although, according to the most recent estimates, the annualized inflation rate in the United States has declined from a peak of 9.1% in July 2022 to 6.5% in December, the Fed remains focused on achieving more substantial and lasting reductions, aiming for a target rate of 2%. As a result, further rate hikes and additional market volatility are potential headwinds in the coming months. The question remains as to whether the Fed and other central banks will manage a so-called “soft landing,” curbing inflation while avoiding a persistent economic slowdown. If they prove successful, we believe that the increasingly attractive valuations we have observed in both equity and bond markets should eventually translate into sustainable improvements in the investment environment.
Whatever actions the Fed takes and however financial markets react, as a MainStay VP investor you can depend on us to continue managing our portfolios with the insight, expertise and level of service that have long defined New York Life Investments. Thank you for trusting us to help you meet your investment needs.
Sincerely,
Kirk C. Lehneis
President
The opinions expressed are as of the date of this report and are subject to change. There is no guarantee that any forecast made will come to pass. This material does not constitute investment advice and is not intended as an endorsement of any specific investment. Past performance is no guarantee of future results.
Not part of the Annual Report
Investors should refer to the Portfolio’s Summary Prospectus and/or Prospectus and consider the Portfolio’s investment objectives, strategies, risks, charges and expenses carefully before investing. The Summary Prospectus and/or Prospectus contain this and other information about the Portfolio. You may obtain copies of the Portfolio’s Summary Prospectus, Prospectus and Statement of Additional Information, which includes information about the MainStay VP Funds Trust's Trustees, free of charge, upon request, by calling toll-free 800-598-2019, by writing to New York Life Insurance and Annuity Corporation, 51 Madison Avenue, Room 251, New York, New York 10010 or by sending an email to MainStayShareholdersServices@nylim.com. These documents are also available at newyorklifeinvestments.com/investment-products/vp. Please read the Portfolio's Summary Prospectus and/or Prospectus carefully before investing. MainStay VP Funds Trust portfolios are separate account options which are purchased through a variable insurance or variable annuity contract.
Investment and Performance Comparison (Unaudited)
Performance data quoted represents past performance. Past performance is no guarantee of future results. Because of market volatility and other factors, current performance may be lower or higher than the figures shown. Investment return and principal value will fluctuate, and as a result, when shares are redeemed, they may be worth more or less than their original cost. The performance table and graph do not reflect any deduction of sales charges, mortality and expense charges, contract charges or administrative charges. Please refer to the Performance Summary appropriate for your policy. For performance information current to the most recent month-end, please call 800-598-2019 or visit www.newyorklife.com.
Performance figures may reflect certain fee waivers and/or expense limitations, without which total returns may have been different. For information on current fee waivers and/or expense limitations (if any), please refer to the Notes to Financial Statements.
| Average Annual Total Returns for the Year-Ended December 31, 2022 |
| Class | Inception
Date1, 2 | One
Year | Five
Years | Ten
Years | Gross
Expense
Ratio3 |
| Initial Class Shares | 5/2/2005 | -5.74% | 5.23% | 7.50% | 0.71% |
| Service Class Shares | 5/2/2005 | -5.97 | 4.97 | 7.23 | 0.96 |
| 1. | The Portfolio’s equity subadvisor changed effective January 1, 2018, due to an organizational restructuring whereby all investment personnel of Cornerstone Capital Management Holdings LLC, the former subadvisor, transitioned to MacKay Shields LLC, a former subadvisor. The past performance in the graph and table prior to that date reflects the Portfolio’s prior subadvisor for the equity portion of the Portfolio. |
| 2. | Effective May 1, 2021, the Portfolio replaced the subadvisor to the equity portion of the Portfolio and modified the equity portion of the Portfolio's principal investment strategies. The past performance in the graph and table prior to that date reflects the Portfolio’s prior subadvisor and principal investment strategies for the equity portion of the Portfolio. |
| 3. | The gross expense ratios presented reflect the Portfolio’s “Total Annual Portfolio Operating Expenses” from the most recent Prospectus and may differ from other expense ratios disclosed in this report. |
| Benchmark Performance* | One
Year | Five
Years | Ten
Years |
| Russell 1000® Value Index1 | -7.54% | 6.67% | 10.29% |
| Bloomberg U.S. Intermediate Government/Credit Bond Index2 | -8.23 | 0.73 | 1.12 |
| Balanced Composite Index3 | -7.47 | 4.69 | 6.82 |
| Morningstar Allocation - 50% to 70% Equity Category Average4 | -13.84 | 4.13 | 6.01 |
| * | Returns for indices reflect no deductions for fees, expenses or taxes, except for foreign withholding taxes where applicable. Results assume reinvestment of all dividends and capital gains. An investment cannot be made directly in an index. |
| 1. | The Portfolio has selected the Russell 1000® Value Index as its primary benchmark. The Russell 1000® Value Index measures the performance of the large-cap value segment of the U.S. equity universe. It includes those Russell 1000® Index companies with lower price-to-book ratios and lower expected growth values. |
| 2. | The Portfolio has selected the Bloomberg U.S. Intermediate Government/Credit Bond Index as a secondary benchmark. The Bloomberg U.S. Intermediate Government/Credit Bond Index measures the performance of U.S. dollar-denominated U.S. treasuries, government-related and investment grade U.S. corporate securities that have a remaining maturity of greater than one year and less than ten years. |
| 3. | The Portfolio has selected the Balanced Composite Index as an additional benchmark. The Balanced Composite Index consists of the Russell 1000® Value Index and the Bloomberg U.S. Intermediate Government/Credit Bond Index weighted 60% and 40%, respectively. |
| 4. | The Morningstar Allocation – 50% to 70% Equity Category Average is representative of funds that seek to provide both income and capital appreciation by investing in multiple asset classes, including stocks, bonds, and cash. These funds are dominated by domestic holdings and have equity exposures between 50% and 70%. Results are based on average total returns of similar funds with all dividends and capital gain distributions reinvested. |
The footnotes on the preceding page are an integral part of the table and graph and should be carefully read in conjunction with them.
Cost in Dollars of a $1,000 Investment in MainStay VP Balanced Portfolio (Unaudited)
The example below is intended to describe the fees and expenses borne by shareholders during the six-month period from July 1, 2022 to December 31, 2022, and the impact of those costs on your investment.
Example
As a shareholder of the Portfolio you incur two types of costs: (1) transaction costs, including exchange fees and sales charges (loads) on purchases (as applicable), and (2) ongoing costs, including management fees, distribution and/or service (12b-1) fees and other Portfolio expenses (as applicable). This example is intended to help you understand your ongoing costs (in dollars) of investing in the Portfolio and to compare these costs with the ongoing costs of investing in other mutual funds. The example is based on an investment of $1,000 made at the beginning of the six-month period and held for the entire period from July 1, 2022 to December 31, 2022. Shares are only sold in connection with variable life and annuity contracts and the example does not reflect any contract level or transactional fees or expenses. If these costs had been included, your costs would have been higher.
This example illustrates your Portfolio’s ongoing costs in two ways:
Actual Expenses
The second and third data columns in the table below provide information about actual account values and actual expenses. You may use the information in these columns, together with the amount you invested, to estimate the expenses that you paid during the six months ended
December 31, 2022. Simply divide your account value by $1,000 (for example, an $8,600 account value divided by $1,000 = 8.6), then multiply the result by the number under the heading entitled “Expenses Paid During Period” to estimate the expenses you paid on your account during this period.
Hypothetical Example for Comparison Purposes
The fourth and fifth data columns in the table below provide information about hypothetical account values and hypothetical expenses based on the Portfolio’s actual expense ratio and an assumed rate of return of 5% per year before expenses, which is not the Portfolio’s actual return. The hypothetical account values and expenses may not be used to estimate the actual ending account balances or expenses you paid for the six-month period shown. You may use this information to compare the ongoing costs of investing in the Portfolio with the ongoing costs of investing in other mutual funds. To do so, compare this 5% hypothetical example with the 5% hypothetical examples that appear in the shareholder reports of the other mutual funds.
Please note that the expenses shown in the table are meant to highlight your ongoing costs only and do not reflect any transactional costs, such as exchange fees or sales charges (loads). Therefore, the fourth and fifth data columns of the table are useful in comparing ongoing costs only and will not help you determine the relative total costs of owning different funds. In addition, if these transactional costs were included, your costs would have been higher.
| Share Class | Beginning
Account
Value
7/1/22 | Ending Account
Value (Based
on Actual
Returns and
Expenses)
12/31/22 | Expenses
Paid
During
Period1 | Ending Account
Value (Based
on Hypothetical
5% Annualized
Return and
Actual Expenses)
12/31/22 | Expenses
Paid
During
Period1 | Net Expense
Ratio
During
Period2 |
| Initial Class Shares | $1,000.00 | $1,033.40 | $3.59 | $1,021.68 | $3.57 | 0.70% |
| Service Class Shares | $1,000.00 | $1,032.10 | $4.87 | $1,020.42 | $4.84 | 0.95% |
| 1. | Expenses are equal to the Portfolio’s annualized expense ratio of each class multiplied by the average account value over the period, divided by 365 and multiplied by 184 (to reflect the six-month period). The table above represents the actual expenses incurred during the six-month period. In addition to the fees and expenses which the Portfolio bears directly, it also indirectly bears a pro rata share of the fees and expenses of the underlying funds in which it invests. Such indirect expenses are not included in the above-reported expense figures. |
| 2. | Expenses are equal to the Portfolio's annualized expense ratio to reflect the six-month period. |
| 6 | MainStay VP Balanced Portfolio |
Portfolio Composition as of December 31, 2022 (Unaudited)
See Portfolio of Investments beginning on page 11 for specific holdings within these categories. The Portfolio's holdings are subject to change.
Top Ten Holdings and/or Issuers Held as of December 31, 2022 (excluding short-term investments) (Unaudited)
| 1. | U.S. Treasury Notes, 2.50%-4.50%, due 3/31/23–11/15/32 |
| 2. | iShares Russell 1000 Value ETF |
| 3. | JPMorgan Chase & Co. |
| 4. | iShares Intermediate Government/Credit Bond ETF |
| 5. | Pfizer, Inc. |
| 6. | Morgan Stanley |
| 7. | Cisco Systems, Inc. |
| 8. | ConocoPhillips |
| 9. | Merck & Co., Inc. |
| 10. | Alphabet, Inc. |
Portfolio Management Discussion and Analysis (Unaudited)
Answers to the questions reflect the views of portfolio managers Jae S. Yoon, CFA, and Jonathan Swaney of New York Life Investment Management LLC, the Portfolio’s Manager; Kenneth Sommer and AJ Rzad, CFA, of NYL Investors LLC, the Portfolio’s fixed-income Subadvisor; and Adam H. Illfelder, CFA, of Wellington Management Company LLP (“Wellington”), the Portfolio’s equity Subadvisor.
How did MainStay VP Balanced Portfolio perform relative to its benchmarks and peers during the 12 months ended December 31, 2022?
For the 12 months ended December 31, 2022, MainStay VP Balanced Portfolio returned −5.74% for Initial Class shares and −5.97% for Service Class shares. Over the same period, both share classes outperformed the −7.54% return of the Russell 1000® Value Index, which is the Portfolio’s primary benchmark, and the −8.23% return of the Bloomberg U.S. Intermediate Government/Credit Bond Index, which is a secondary benchmark of the Portfolio. For the 12 months ended December 31, 2022, both share classes also outperformed the −7.47% return of the Balanced Composite Index, which is an additional benchmark of the Portfolio, and the −13.84% return of the Morningstar Allocation—50% to 70% Equity Category Average.1
What factors affected the relative performance of the equity portion of the Portfolio during the reporting period?
The equity portion of the Portfolio outperformed the Russell 1000® Value Index primarily due to stock selection, driven by selection in the financials, health care and information technology sectors, although this was partially offset by weaker selection in energy and materials. Stock selection added to the Portfolio’s relative performance in seven of the eleven sectors in the Index for the reporting period. Style factors made a modestly positive contribution to relative performance given the Portfolio’s quality orientation. (Contributions take weightings and total returns into account.)
Which market segments were the strongest positive contributors to relative performance in the equity portion of the Portfolio, and which market segments detracted the most?
Financials made the largest contribution to results relative to the Russell 1000® Value Index over the reporting period, driven by strong stock selection and underweight exposure to the sector. Health care and industrials were top positive contributors as well. Conversely, energy detracted most significantly from relative results due to negative security selection and underweight sector exposure. Materials and communication services also notably detracted.
During the reporting period, which individual stocks made the strongest positive contributions to the Portfolio’s absolute performance and which stocks detracted the most?
The strongest positive contributors to the absolute performance of the equity portion of the Portfolio included holdings in oil & gas
exploration & production company ConocoPhillips and pharmaceutical companies Merck & Co. and Eli Lilly and Company. ConocoPhillips shares rose on strong oil prices, as the company holds significant positions in three unconventional, major, oil-rich plays: Eagle Ford shale, the Delaware Basin and Bakken shale. Merck shares appreciated on strong performances from cancer drug Keytruda, papillomavirus vaccine Gardasil and COVID-19 therapeutic Lagevrio. Merck also raised its guidance for 2022. Eli Lilly shares rose when the company reported notable pipeline achievements, including U.S. Food and Drug Administration approval for tirzepatide, a type 2 diabetes treatment. In addition, competing pharmaceutical companies reported breakthrough trial results for their Alzheimer’s drugs, fueling optimism over Eli Lilly’s drug donanemab, which also targets removal of the amyloid beta protein to slow disease progression. The Portfolio still held all three positions at the end of the reporting period.
The most significant detractors from the absolute performance of the equity portion of the Portfolio included social networking technology company Meta Platforms, Google’s parent company Alphabet and communications equipment company F5. Meta and Alphabet, along with other social media stocks, faced headwinds from a decline in digital advertising spending and a more stringent regulatory environment. Meta Platform's announced decision to maintain exceptionally high spending on the Metaverse, with an increase in forecasted operating losses in 2023, heightened concerns regarding the company’s capital discipline and governance oversight. Shares of F5 underperformed as the company faced headwinds from supply-chain challenges. The company also lowered its first-quarter 2023 earnings guidance.
Did the equity portion of the Portfolio make any significant purchases or sales during the reporting period?
Notable equity purchases during the reporting period included new positions in Coterra Energy, a U.S.-based diversified energy company created from a strategic merger between Cabot Oil & Gas and Cimarex Energy, and Qualcomm, a semiconductor company. We favor the 50/50 balance of Coterra’s oil & gas business given the more defensive “all-weather” profile it provides, even in more challenged markets. At normalized commodity prices, we believe the company stands to generate substantial cash flow, returning a significant amount to shareholders through a base dividend that translates to a yield in excess of the market, a variable dividend that adds to current income and share repurchases at an attractive price versus intrinsic value. We view Qualcomm as a high-quality company characterized by strong return on capital, a solid balance sheet
| 1. | See page 5 for more information on benchmark and peer group returns. |
| 8 | MainStay VP Balanced Portfolio |
and meaningful capital return potential. We believe the company has demonstrated a consistent growth profile and is positioned to see incremental contributions from the growing automotive and IoT (Internet of things) industries. The valuation appears attractive on several metrics, including our estimate of trough earnings, which should protect the downside, together with a sustainable dividend that yielded 2.4% as of the end of the reporting period.
We trimmed the Portfolio’s position in UnitedHealth Group, a managed health care and insurance company, after the stock rallied strongly on renewed COVID-19 concerns regarding the Omicron variants. The stock price also responded positively to better-than-expected first-quarter 2022 results and increased guidance from management. We reduced the Portfolio’s exposure to maintain active weight and relative risk in the position. We also eliminated the Portfolio’s position in Bank of America, an investment bank and financial services holding company, in favor of more attractive opportunities elsewhere.
How did sector weightings in the equity portion of the Portfolio change during the reporting period?
The most notable increases in sector exposures relative to the Russell 1000® Value Index were to consumer staples and, to a lesser extent, real estate. Notable reductions in relative sector exposure included health care and communication services.
How was the equity portion of the Portfolio positioned at the end of the reporting period?
As of December 31, 2022, the equity portion of the Portfolio held its most overweight positions relative to the Russell 1000® Value Index in the information technology, consumer discretionary and health care sectors. As of the same date, the Portfolio’s most significantly underweight equity positions were in communication services, materials and consumer staples.
What factors affected the relative performance of the fixed-income portion of the Portfolio during the reporting period?
The fixed-income portion of the Portfolio held overweight positions relative to the Bloomberg U.S. Intermediate Government/Credit Bond Index in asset-backed securities (ABS) and commercial mortgage-backed securities (CMBS) throughout the reporting
period. To facilitate these overweight positions, the Portfolio maintained an underweight position in the U.S. Treasury sector. The corporate sector was the worst performing sector during the reporting period, due to the Portfolio’s overweight positions relative to the Index in the financial and industrial subcomponents. Within the ABS sector, overweight position relative to the Index in AAA and AA collateralized loan obligations (CLOs) detracted from relative performance.2 Underweight positioning in the Treasury sector detracted slightly. Overweight positioning in U.S. government agencies also detracted from performance.
The best performing sector in the fixed-income portion of Portfolio was cash securities, with positioning, particularly in U.S. government agency discount notes, accretive to performance. An overweight position relative to the Bloomberg U.S. Intermediate Government/Credit Bond Index in the utility subcomponent of the corporate sector was also accretive to performance.
During the reporting period, how was the performance of the fixed-income portion of the Portfolio materially affected by investments in derivatives?
The fixed-income portion of the Portfolio’s use of derivatives was limited to interest rate derivatives used to keep the duration3 of the Portfolio in line with our target. These interest rate derivatives had a slightly negative impact on performance during the reporting period.
What was the duration strategy of the fixed-income portion of the Portfolio during the reporting period?
The fixed-income portion of the Portfolio maintained a duration relatively close to that of the Bloomberg U.S. Intermediate Government/Credit Bond Index. On two occasions, the duration of the Portfolio differed from that of the Index. During the first half of the reporting period, the Portfolio held a shorter duration in the 2-year part of the yield curve4 relative to the Index, while simultaneously holding a longer duration than the Index in the 10-year part of the curve. This strategy had a positive impact on performance. Toward the end of the reporting period, the Portfolio held a shorter duration in the 5-year part of the curve relative to the Index, while simultaneously holding a longer duration than the Index in the 30-year part of the curve. This strategy had a negative impact on performance. As of December 31, 2022, the
| 2. | An obligation rated ‘AAA’ has the highest rating assigned by Standard & Poor’s (“S&P”), and in the opinion of S&P, the obligor’s capacity to meet its financial commitment on the obligation is extremely strong. An obligation rated ‘AA’ by S&P is deemed by S&P to differ from the highest-rated obligations only to a small degree. In the opinion of S&P, the obligor's capacity to meet its financial commitment on the obligation is very strong. When applied to Portfolio holdings, ratings are based solely on the creditworthiness of the bonds in the Portfolio and are not meant to represent the security or safety of the Portfolio. |
| 3. | Duration is a measure of the price sensitivity of a fixed-income investment to changes in interest rates. Duration is expressed as a number of years and is considered a more accurate sensitivity gauge than average maturity. |
| 4. | The yield curve is a line that plots the yields of various securities of similar quality—typically U.S. Treasury issues—across a range of maturities. The U.S. Treasury yield curve serves as a benchmark for other debt and is used in economic forecasting. |
effective duration of the Portfolio was 3.86 years, compared to a duration of 3.86 years for the Index.
During the reporting period, which market segments made the strongest positive contributions to the performance of the fixed-income portion of the Portfolio and which market segments were particularly weak?
During the reporting period, the fixed-income portion of the Portfolio’s cash position made the strongest positive contribution to the fixed-income portion of the Portfolio’s absolute performance. Within the cash securities sector, the Portfolio’s allocation to Federal Home Loan Bank (FHLB) agency discount notes was most accretive to absolute performance. Conversely, the U.S. Treasury sector produced the weakest absolute performance. The second-largest detractor from absolute performance was positioning in the corporate sector. Within the corporate sector, the Portfolio’s allocation to industrials and financials detracted the most from absolute performance. Within the ABS sector, the Portfolio’s allocation to AAA and AA CLOs detracted slightly from absolute performance. Within the CMBS sector, the Portfolio’s allocation to the AAA non-agency subcomponent detracted from absolute performance. Within the interest rate complex, the Portfolio’s duration and curve positioning were accretive to absolute performance.
The issuers with the most positive absolute performance during the reporting period included HSBC Holdings, Oracle Corporation, American Campus Communities and Edison International. The issuers with the weakest absolute performance during the same period included Fresenius Medical Care, UBS Group, Tokyo Century and Prospect Capital Group.
Did the fixed-income portion of the Portfolio make any significant purchases or sales during the reporting period?
The largest purchases made by the fixed-income portion of the Portfolio during the reporting period included bonds issued by enterprise information software company Oracle, financial firm JPMorgan Chase & Co., diversified banking companies HSBC Holdings and Citigroup, and consumer electronics and services company Apple.
The most significant sales during the same period were bonds issued by real estate investment trust Highwoods Realty; machinery maker Emerson Electric; Fresenius Medical Care US Finance III, an entity of medical facilities company Fresenius Medical Care; packaging company WestRock; and Brighthouse
Financial Global Funding, an entity of insurer Brighthouse Financial.
During the reporting period, how did sector (or industry) weightings change in the fixed-income portion of the Portfolio?
During the first half of the reporting period, the fixed-income portion of the Portfolio reduced exposure within corporate credit. Amid significant rate volatility and further uncertainty across the inflation backdrop, we deemed the option-adjusted spreads5 (OAS) being offered on corporate bonds as too tight for the outstanding macro risks. We reduced the Portfolio’s allocation to ABS and CMBS in the first half of the reporting period to mitigate against further spread widening in these sectors, which did take place in the second half of 2022. During the second half of the reporting period, the Portfolio increased corporate credit after October’s Consumer Price Index (CPI) report showed a decline in inflationary pressures. We deemed this would likely create a tailwind for OAS performance in the asset class and chose to move the Portfolio’s allocation higher.
Conversely, as we reduced the spread-asset allocation within the Portfolio, we added to the U.S. Treasury sector. U.S. Treasury securities are generally seen as the safest asset class and serve as a “safe haven” for investors during times of market stress.
How was the fixed-income portion of the Portfolio positioned at the end of the reporting period?
As of December 31, 2022, the fixed-income portion of the Portfolio held overweight exposure relative to the Bloomberg U.S. Intermediate Government/Credit Bond Index in ABS, CMBS and U.S. Treasury securities. The largest overweight allocation within spread assets was to the ABS sector. As of the same date, the Portfolio held relatively underweight positions in the corporate sector. Within corporates, the Portfolio held underweight positions in the industrial, sovereign, supranational, foreign agency and foreign local government subcomponents. The Portfolio also held an underweight position in the U.S. government agency sector.
| 5. | The terms “spread” and “yield spread” may refer to the difference in yield between a security or type of security and comparable U.S. Treasury issues. The terms may also refer to the difference in yield between two specific securities or types of securities at a given time. |
The opinions expressed are those of the portfolio managers as of the date of this report and are subject to change. There is no guarantee that any forecasts will come to pass. This material does not constitute investment advice and is not intended as an endorsement of any specific investment.
Not all MainStay VP Portfolios and/or share classes are available under all policies.
| 10 | MainStay VP Balanced Portfolio |
Portfolio of Investments December 31, 2022†
| | Principal
Amount | Value |
| Long-Term Bonds 34.5% |
| Asset-Backed Securities 1.4% |
| Other Asset-Backed Securities 1.4% |
| AIG CLO LLC | |
| Series 2020-1A, Class AR | | |
| 5.239% (3 Month LIBOR + 1.16%), due 4/15/34 (a)(b) | $ 600,000 | $ 585,551 |
| Apidos CLO XXX | |
| Series XXXA, Class A2 | | |
| 5.794% (3 Month LIBOR + 1.60%), due 10/18/31 (a)(b) | 650,000 | 628,267 |
| ARES L CLO Ltd. | |
| Series 2018-50A, Class AR | | |
| 5.129% (3 Month LIBOR + 1.05%), due 1/15/32 (a)(b) | 700,000 | 685,971 |
| ARES XXXVIII CLO Ltd. | |
| Series 2015-38A, Class BR | | |
| 5.643% (3 Month LIBOR + 1.40%), due 4/20/30 (a)(b) | 400,000 | 382,334 |
| Carlyle Global Market Strategies CLO Ltd. | |
| Series 2013-3A, Class A2R | | |
| 5.479% (3 Month LIBOR + 1.40%), due 10/15/30 (a)(b) | 800,000 | 764,899 |
| Palmer Square CLO Ltd. | |
| Series 2015-2A, Class A2R2 | | |
| 5.793% (3 Month LIBOR + 1.55%), due 7/20/30 (a)(b) | 750,000 | 727,697 |
| Regatta XIV Funding Ltd. | |
| Series 2018-3A, Class A | | |
| 5.548% (3 Month LIBOR + 1.19%), due 10/25/31 (a)(b) | 600,000 | 588,439 |
| STORE Master Funding LLC | |
| Series 2021-1A, Class A1 | | |
| 2.12%, due 6/20/51 (a) | 241,922 | 200,684 |
| THL Credit Wind River CLO Ltd. | |
| Series 2017-4A, Class A | | |
| 5.825% (3 Month LIBOR + 1.15%), due 11/20/30 (a)(b) | 250,000 | 246,477 |
| Vantage Data Centers Issuer LLC | |
| Series 2020-1A, Class A2 | | |
| 1.645%, due 9/15/45 (a) | 725,000 | 639,395 |
Total Asset-Backed Securities
(Cost $5,711,065) | | 5,449,714 |
| Corporate Bonds 8.9% |
| Aerospace & Defense 0.1% |
| Boeing Co. (The) | | |
| 3.10%, due 5/1/26 | 120,000 | 112,916 |
| | Principal
Amount | Value |
| |
| Aerospace & Defense (continued) |
| Boeing Co. (The) (continued) | | |
| 3.25%, due 2/1/28 | $ 155,000 | $ ���140,761 |
| 5.15%, due 5/1/30 | 210,000 | 204,884 |
| | | 458,561 |
| Auto Manufacturers 0.1% |
| General Motors Financial Co., Inc. | | |
| 6.05%, due 10/10/25 | 505,000 | 513,657 |
| Banks 3.7% |
| Banco Santander SA | | |
| 5.294%, due 8/18/27 | 400,000 | 390,543 |
| Bank of America Corp. (c) | | |
| 1.922%, due 10/24/31 | 205,000 | 156,597 |
| 2.087%, due 6/14/29 | 675,000 | 568,009 |
| 4.571%, due 4/27/33 | 360,000 | 329,293 |
| Citigroup, Inc. (c) | | |
| 2.014%, due 1/25/26 | 733,000 | 679,320 |
| 5.61%, due 9/29/26 | 885,000 | 888,785 |
| 6.27%, due 11/17/33 | 125,000 | 128,955 |
| Citizens Bank NA | | |
| 6.064%, due 10/24/25 (c) | 320,000 | 323,603 |
| Fifth Third Bancorp | | |
| 6.361%, due 10/27/28 (c) | 300,000 | 308,668 |
| Goldman Sachs Group, Inc. (The) | | |
| 2.64%, due 2/24/28 (c) | 450,000 | 400,673 |
| 5.70%, due 11/1/24 | 710,000 | 718,450 |
| HSBC Holdings plc (c) | | |
| 7.336%, due 11/3/26 | 545,000 | 566,839 |
| 7.39%, due 11/3/28 | 395,000 | 415,125 |
| JPMorgan Chase & Co. (c) | | |
| 1.578%, due 4/22/27 | 790,000 | 694,143 |
| 2.963%, due 1/25/33 | 305,000 | 248,240 |
| 4.565%, due 6/14/30 | 440,000 | 413,980 |
| 4.912%, due 7/25/33 | 150,000 | 142,819 |
| 5.546%, due 12/15/25 | 595,000 | 595,011 |
| Lloyds Banking Group plc | | |
| 0.695% (1 Year Treasury Constant Maturity Rate + 0.55%), due 5/11/24 (b) | 430,000 | 421,709 |
| Mitsubishi UFJ Financial Group, Inc. | | |
| 5.354% (1 Year Treasury Constant Maturity Rate + 1.90%), due 9/13/28 (b) | 310,000 | 307,534 |
| Morgan Stanley (c) | | |
| 4.679%, due 7/17/26 | 1,150,000 | 1,130,284 |
| 5.297%, due 4/20/37 | 300,000 | 274,308 |
| 6.296%, due 10/18/28 | 270,000 | 278,722 |
The notes to the financial statements are an integral part of, and should be read in conjunction with, the financial statements.
11
Portfolio of Investments December 31, 2022† (continued)
| | Principal
Amount | Value |
| Corporate Bonds (continued) |
| Banks (continued) |
| Morgan Stanley (c) (continued) | | |
| 6.342%, due 10/18/33 | $ 80,000 | $ 83,824 |
| Nordea Bank Abp | | |
| 5.375%, due 9/22/27 (a) | 575,000 | 577,653 |
| PNC Financial Services Group, Inc. (The) | | |
| 6.037%, due 10/28/33 (c) | 315,000 | 327,946 |
| Royal Bank of Canada | | |
| 5.66%, due 10/25/24 | 625,000 | 632,155 |
| Santander Holdings USA, Inc. | | |
| 5.807%, due 9/9/26 (c) | 250,000 | 248,114 |
| Societe Generale SA | | |
| 1.792% (1 Year Treasury Constant Maturity Rate + 1.00%), due 6/9/27 (a)(b) | 350,000 | 301,144 |
| Standard Chartered plc (a)(b) | | |
| 7.767% (1 Year Treasury Constant Maturity Rate + 3.45%), due 11/16/28 | 275,000 | 291,335 |
| 7.776% (1 Year Treasury Constant Maturity Rate + 3.10%), due 11/16/25 | 200,000 | 205,980 |
| State Street Corp. | | |
| 4.164%, due 8/4/33 (c) | 165,000 | 152,416 |
| Swedbank AB | | |
| 5.337%, due 9/20/27 (a) | 515,000 | 510,746 |
| UBS Group AG | | |
| 1.364% (1 Year Treasury Constant Maturity Rate + 1.08%), due 1/30/27 (a)(b) | 225,000 | 197,044 |
| Wells Fargo & Co. | | |
| 4.54%, due 8/15/26 (c) | 490,000 | 480,180 |
| | | 14,390,147 |
| Beverages 0.0% ‡ |
| Keurig Dr Pepper, Inc. | | |
| 4.05%, due 4/15/32 | 90,000 | 81,869 |
| Biotechnology 0.2% |
| Amgen, Inc. | | |
| 4.05%, due 8/18/29 | 500,000 | 467,262 |
| 4.20%, due 3/1/33 | 130,000 | 120,267 |
| | | 587,529 |
| Commercial Services 0.1% |
| Global Payments, Inc. | | |
| 2.15%, due 1/15/27 | 325,000 | 283,514 |
| | Principal
Amount | Value |
| |
| Commercial Services (continued) |
| PayPal Holdings, Inc. | | |
| 3.90%, due 6/1/27 | $ 260,000 | $ 250,183 |
| | | 533,697 |
| Computers 0.2% |
| Apple, Inc. | | |
| 1.65%, due 5/11/30 | 361,000 | 294,845 |
| 1.70%, due 8/5/31 | 470,000 | 375,754 |
| | | 670,599 |
| Cosmetics & Personal Care 0.0% ‡ |
| Unilever Capital Corp. | | |
| 1.75%, due 8/12/31 | 220,000 | 172,859 |
| Diversified Financial Services 0.6% |
| AerCap Ireland Capital DAC | | |
| 3.00%, due 10/29/28 | 450,000 | 376,999 |
| Air Lease Corp. | | |
| 0.70%, due 2/15/24 | 550,000 | 519,527 |
| Blackstone Holdings Finance Co. LLC | | |
| 5.90%, due 11/3/27 (a) | 500,000 | 503,744 |
| Intercontinental Exchange, Inc. | | |
| 4.35%, due 6/15/29 | 590,000 | 570,435 |
| Thirax 1 LLC | | |
| 0.968%, due 1/14/33 | 194,153 | 159,684 |
| | | 2,130,389 |
| Electric 0.9% |
| AEP Texas, Inc. | | |
| 4.70%, due 5/15/32 | 140,000 | 134,098 |
| Appalachian Power Co. | | |
| Series BB | | |
| 4.50%, due 8/1/32 | 130,000 | 121,211 |
| Commonwealth Edison Co. | | |
| 3.10%, due 11/1/24 | 250,000 | 241,211 |
| Duke Energy Carolinas LLC | | |
| 2.85%, due 3/15/32 | 340,000 | 287,614 |
| Duke Energy Corp. | | |
| 4.30%, due 3/15/28 | 250,000 | 240,556 |
| 4.50%, due 8/15/32 | 130,000 | 121,771 |
| Enel Finance America LLC | | |
| 7.10%, due 10/14/27 (a) | 200,000 | 206,812 |
| Entergy Arkansas LLC | | |
| 3.70%, due 6/1/24 | 500,000 | 491,270 |
| Pacific Gas and Electric Co. | | |
| 5.45%, due 6/15/27 | 320,000 | 315,555 |
| Southern California Edison Co. | | |
| 5.95%, due 11/1/32 | 320,000 | 338,112 |
The notes to the financial statements are an integral part of, and should be read in conjunction with, the financial statements.
| 12 | MainStay VP Balanced Portfolio |
| | Principal
Amount | Value |
| Corporate Bonds (continued) |
| Electric (continued) |
| Southern Co. (The) | | |
| 5.15%, due 10/6/25 | $ 190,000 | $ 191,229 |
| 5.70%, due 10/15/32 | 90,000 | 92,067 |
| Virginia Electric and Power Co. | | |
| Series B | | |
| 3.75%, due 5/15/27 | 620,000 | 591,682 |
| | | 3,373,188 |
| Entertainment 0.0% ‡ |
| Warnermedia Holdings, Inc. | | |
| 4.054%, due 3/15/29 (a) | 192,000 | 166,104 |
| Environmental Control 0.1% |
| Waste Connections, Inc. | | |
| 2.60%, due 2/1/30 (d) | 380,000 | 324,002 |
| Food 0.1% |
| Kraft Heinz Foods Co. | | |
| 3.75%, due 4/1/30 | 105,000 | 95,618 |
| Nestle Holdings, Inc. | | |
| 4.25%, due 10/1/29 (a) | 370,000 | 360,564 |
| | | 456,182 |
| Gas 0.1% |
| CenterPoint Energy Resources Corp. | | |
| 4.40%, due 7/1/32 (d) | 335,000 | 321,174 |
| Healthcare-Products 0.0% ‡ |
| GE HealthCare Technologies, Inc. | | |
| 5.905%, due 11/22/32 (a) | 160,000 | 165,792 |
| Healthcare-Services 0.1% |
| HCA, Inc. | | |
| 3.625%, due 3/15/32 (a) | 305,000 | 258,077 |
| Insurance 0.1% |
| Corebridge Financial, Inc. | | |
| 3.85%, due 4/5/29 (a) | 275,000 | 250,472 |
| Principal Life Global Funding II | | |
| 1.25%, due 8/16/26 (a) | 350,000 | 303,466 |
| | | 553,938 |
| Internet 0.1% |
| Amazon.com, Inc. | | |
| 2.10%, due 5/12/31 | 355,000 | 289,911 |
| | Principal
Amount | Value |
| |
| Internet (continued) |
| Meta Platforms, Inc. | | |
| 3.85%, due 8/15/32 | $ 140,000 | $ 123,191 |
| | | 413,102 |
| Investment Companies 0.1% |
| Blackstone Private Credit Fund | | |
| 7.05%, due 9/29/25 (a) | 350,000 | 347,225 |
| Media 0.2% |
| Charter Communications Operating LLC | | |
| 2.25%, due 1/15/29 | 105,000 | 84,512 |
| 4.40%, due 4/1/33 | 360,000 | 308,037 |
| Paramount Global | | |
| 4.20%, due 5/19/32 | 385,000 | 315,111 |
| | | 707,660 |
| Oil & Gas 0.1% |
| Phillips 66 Co. | | |
| 3.15%, due 12/15/29 (a) | 455,000 | 396,929 |
| Pharmaceuticals 0.2% |
| AbbVie, Inc. | | |
| 2.95%, due 11/21/26 | 350,000 | 325,494 |
| CVS Health Corp. | | |
| 2.125%, due 9/15/31 | 195,000 | 154,610 |
| Merck & Co., Inc. | | |
| 2.15%, due 12/10/31 | 175,000 | 142,904 |
| | | 623,008 |
| Pipelines 0.3% |
| Energy Transfer LP | | |
| 3.75%, due 5/15/30 | 150,000 | 132,253 |
| 5.75%, due 2/15/33 | 165,000 | 161,430 |
| MPLX LP | | |
| 4.95%, due 9/1/32 | 82,000 | 76,890 |
| ONEOK, Inc. | | |
| 5.85%, due 1/15/26 | 485,000 | 490,808 |
| 6.10%, due 11/15/32 | 255,000 | 254,987 |
| | | 1,116,368 |
| Real Estate Investment Trusts 0.1% |
| CubeSmart LP | | |
| 2.25%, due 12/15/28 | 290,000 | 239,007 |
| Simon Property Group LP | | |
| 1.75%, due 2/1/28 | 375,000 | 319,132 |
| | | 558,139 |
The notes to the financial statements are an integral part of, and should be read in conjunction with, the financial statements.
13
Portfolio of Investments December 31, 2022† (continued)
| | Principal
Amount | Value |
| Corporate Bonds (continued) |
| Retail 0.2% |
| Home Depot, Inc. (The) | | |
| 3.25%, due 4/15/32 | $ 280,000 | $ 248,799 |
| Lowe's Cos., Inc. | | |
| 5.00%, due 4/15/33 | 170,000 | 165,956 |
| Walmart, Inc. | | |
| 5.25%, due 9/1/35 | 255,000 | 267,380 |
| | | 682,135 |
| Semiconductors 0.3% |
| Broadcom, Inc. | | |
| 4.30%, due 11/15/32 | 450,000 | 396,603 |
| NVIDIA Corp. | | |
| 1.55%, due 6/15/28 (d) | 122,000 | 104,172 |
| NXP BV | | |
| 4.30%, due 6/18/29 | 215,000 | 200,444 |
| QUALCOMM, Inc. | | |
| 2.15%, due 5/20/30 | 410,000 | 346,877 |
| Texas Instruments, Inc. | | |
| 3.65%, due 8/16/32 | 250,000 | 231,643 |
| | | 1,279,739 |
| Software 0.4% |
| Microsoft Corp. | | |
| 2.525%, due 6/1/50 | 180,000 | 118,449 |
| Oracle Corp. | | |
| 2.30%, due 3/25/28 | 180,000 | 155,911 |
| 2.875%, due 3/25/31 | 95,000 | 78,767 |
| 6.15%, due 11/9/29 | 1,020,000 | 1,058,725 |
| | | 1,411,852 |
| Telecommunications 0.4% |
| AT&T, Inc. | | |
| 4.35%, due 3/1/29 | 775,000 | 736,999 |
| T-Mobile US, Inc. | | |
| 2.625%, due 2/15/29 | 195,000 | 165,074 |
| 3.50%, due 4/15/31 | 350,000 | 302,330 |
| Verizon Communications, Inc. | | |
| 2.10%, due 3/22/28 | 300,000 | 260,364 |
| 3.376%, due 2/15/25 | 6,000 | 5,813 |
| 4.016%, due 12/3/29 | 122,000 | 113,954 |
| | | 1,584,534 |
| Transportation 0.1% |
| Union Pacific Corp. | | |
| 4.50%, due 1/20/33 (d) | 170,000 | 166,220 |
| | Principal
Amount | Value |
| |
| Transportation (continued) |
| United Parcel Service, Inc. | | |
| 4.45%, due 4/1/30 | $ 180,000 | $ 177,174 |
| | | 343,394 |
Total Corporate Bonds
(Cost $35,822,346) | | 34,621,849 |
| Mortgage-Backed Security 0.1% |
| Commercial Mortgage Loans (Collateralized Mortgage Obligation) 0.1% |
| Citigroup Commercial Mortgage Trust | |
| Series 2020-GC46, Class A5 | | |
| 2.717%, due 2/15/53 | 500,000 | 422,055 |
Total Mortgage-Backed Security
(Cost $514,123) | | 422,055 |
| U.S. Government & Federal Agencies 24.1% |
| Federal Home Loan Mortgage Corporation (Mortgage Pass-Through Securities) 0.6% |
| FFCB | | |
| 2.03%, due 1/21/28 | 850,000 | 770,295 |
| 4.37%, due 5/17/32 | 375,000 | 358,359 |
| FHLB | | |
| 4.00%, due 5/26/27 | 1,100,000 | 1,058,702 |
| | | 2,187,356 |
| United States Treasury Bonds 0.1% |
| U.S. Treasury Bonds | | |
| 4.00%, due 11/15/52 | 400,000 | 400,562 |
| United States Treasury Notes 23.4% |
| U.S. Treasury Notes | | |
| 2.50%, due 3/31/23 | 7,275,000 | 7,240,882 |
| 2.625%, due 12/31/23 (d) | 2,800,000 | 2,742,499 |
| 3.875%, due 11/30/27 | 15,293,800 | 15,210,162 |
| 3.875%, due 11/30/29 | 14,441,700 | 14,344,670 |
| 3.875%, due 12/31/29 | 350,000 | 348,250 |
| 4.00%, due 12/15/25 | 22,225,000 | 22,082,621 |
| 4.125%, due 11/15/32 | 9,045,000 | 9,230,140 |
| 4.50%, due 11/30/24 (d) | 19,805,000 | 19,805,773 |
| | | 91,004,997 |
Total U.S. Government & Federal Agencies
(Cost $94,148,143) | | 93,592,915 |
Total Long-Term Bonds
(Cost $136,195,677) | | 134,086,533 |
| |
The notes to the financial statements are an integral part of, and should be read in conjunction with, the financial statements.
| 14 | MainStay VP Balanced Portfolio |
| | Shares | Value |
| Common Stocks 55.3% |
| Aerospace & Defense 2.4% |
| General Dynamics Corp. | 11,634 | $ 2,886,512 |
| L3Harris Technologies, Inc. | 12,784 | 2,661,756 |
| Raytheon Technologies Corp. | 39,500 | 3,986,340 |
| | | 9,534,608 |
| Auto Components 0.7% |
| Gentex Corp. | 98,535 | 2,687,049 |
| Banks 4.0% |
| JPMorgan Chase & Co. | 54,638 | 7,326,956 |
| M&T Bank Corp. | 23,348 | 3,386,861 |
| PNC Financial Services Group, Inc. (The) | 16,393 | 2,589,110 |
| Truist Financial Corp. | 53,623 | 2,307,398 |
| | | 15,610,325 |
| Beverages 0.6% |
| Keurig Dr Pepper, Inc. | 70,257 | 2,505,365 |
| Building Products 1.6% |
| Fortune Brands Innovations, Inc. | 40,836 | 2,332,144 |
| Johnson Controls International plc | 62,986 | 4,031,104 |
| | | 6,363,248 |
| Capital Markets 3.6% |
| ARES Management Corp. | 43,318 | 2,964,684 |
| Blackstone, Inc. | 25,160 | 1,866,620 |
| LPL Financial Holdings, Inc. | 10,490 | 2,267,623 |
| Morgan Stanley | 54,684 | 4,649,234 |
| Raymond James Financial, Inc. | 22,830 | 2,439,386 |
| | | 14,187,547 |
| Chemicals 0.6% |
| Axalta Coating Systems Ltd. (e) | 93,727 | 2,387,227 |
| Communications Equipment 2.2% |
| Cisco Systems, Inc. | 116,083 | 5,530,194 |
| F5, Inc. (e) | 19,958 | 2,864,173 |
| | | 8,394,367 |
| Containers & Packaging 0.6% |
| Sealed Air Corp. | 46,693 | 2,329,047 |
| Distributors 0.6% |
| LKQ Corp. | 41,900 | 2,237,879 |
| | Shares | Value |
| |
| Diversified Consumer Services 0.6% |
| H&R Block, Inc. | 64,114 | $ 2,340,802 |
| Electric Utilities 1.6% |
| Duke Energy Corp. | 30,464 | 3,137,487 |
| Exelon Corp. | 71,417 | 3,087,357 |
| | | 6,224,844 |
| Electrical Equipment 0.8% |
| Emerson Electric Co. | 31,177 | 2,994,863 |
| Electronic Equipment, Instruments & Components 0.9% |
| Corning, Inc. | 106,388 | 3,398,033 |
| Entertainment 0.8% |
| Electronic Arts, Inc. | 23,939 | 2,924,867 |
| Equity Real Estate Investment Trusts 2.2% |
| Gaming and Leisure Properties, Inc. | 64,900 | 3,380,641 |
| Host Hotels & Resorts, Inc. | 134,601 | 2,160,346 |
| Welltower, Inc. | 48,153 | 3,156,429 |
| | | 8,697,416 |
| Food Products 1.7% |
| Archer-Daniels-Midland Co. | 31,720 | 2,945,202 |
| Mondelez International, Inc., Class A | 52,717 | 3,513,588 |
| | | 6,458,790 |
| Gas Utilities 0.7% |
| Atmos Energy Corp. | 24,481 | 2,743,586 |
| Health Care Equipment & Supplies 1.8% |
| Becton Dickinson and Co. | 13,755 | 3,497,896 |
| Boston Scientific Corp. (e) | 73,591 | 3,405,056 |
| | | 6,902,952 |
| Health Care Providers & Services 2.9% |
| Centene Corp. (e) | 45,619 | 3,741,214 |
| Elevance Health, Inc. | 8,285 | 4,249,956 |
| UnitedHealth Group, Inc. | 6,331 | 3,356,570 |
| | | 11,347,740 |
| Household Durables 0.6% |
| Lennar Corp., Class A | 27,903 | 2,525,222 |
| Insurance 3.5% |
| American International Group, Inc. | 50,230 | 3,176,545 |
| Chubb Ltd. | 18,110 | 3,995,066 |
The notes to the financial statements are an integral part of, and should be read in conjunction with, the financial statements.
15
Portfolio of Investments December 31, 2022† (continued)
| | Shares | Value |
| Common Stocks (continued) |
| Insurance (continued) |
| MetLife, Inc. | 58,193 | $ 4,211,427 |
| Progressive Corp. (The) | 16,956 | 2,199,363 |
| | | 13,582,401 |
| Interactive Media & Services 1.2% |
| Alphabet, Inc., Class C (e) | 54,434 | 4,829,929 |
| IT Services 1.3% |
| Amdocs Ltd. | 30,442 | 2,767,178 |
| Global Payments, Inc. | 22,238 | 2,208,678 |
| | | 4,975,856 |
| Machinery 0.7% |
| Middleby Corp. (The) (e) | 20,970 | 2,807,883 |
| Media 0.6% |
| Omnicom Group, Inc. | 29,955 | 2,443,429 |
| Multi-Utilities 0.8% |
| Sempra Energy | 20,678 | 3,195,578 |
| Oil, Gas & Consumable Fuels 4.0% |
| ConocoPhillips | 45,168 | 5,329,824 |
| Coterra Energy, Inc. | 127,700 | 3,137,589 |
| EOG Resources, Inc. | 28,424 | 3,681,477 |
| Phillips 66 | 32,690 | 3,402,375 |
| | | 15,551,265 |
| Personal Products 0.8% |
| Unilever plc, Sponsored ADR | 58,750 | 2,958,062 |
| Pharmaceuticals 5.4% |
| AstraZeneca plc, Sponsored ADR | 44,627 | 3,025,711 |
| Eli Lilly and Co. | 11,541 | 4,222,159 |
| Merck & Co., Inc. | 42,688 | 4,736,234 |
| Pfizer, Inc. | 135,101 | 6,922,575 |
| Roche Holding AG | 6,777 | 2,129,752 |
| | | 21,036,431 |
| Real Estate Management & Development 0.7% |
| CBRE Group, Inc., Class A (e) | 34,431 | 2,649,810 |
| Road & Rail 0.6% |
| Knight-Swift Transportation Holdings, Inc. | 43,267 | 2,267,623 |
| | Shares | | Value |
| |
| Semiconductors & Semiconductor Equipment 2.7% |
| Analog Devices, Inc. | 28,023 | | $ 4,596,613 |
| NXP Semiconductors NV | 15,723 | | 2,484,706 |
| QUALCOMM, Inc. | 30,126 | | 3,312,052 |
| | | | 10,393,371 |
| Specialty Retail 1.5% |
| Home Depot, Inc. (The) | 12,065 | | 3,810,851 |
| Victoria's Secret & Co. (e) | 52,022 | | 1,861,347 |
| | | | 5,672,198 |
Total Common Stocks
(Cost $199,951,463) | | | 215,159,613 |
| Exchange-Traded Funds 7.7% |
| iShares 5-10 Year Investment Grade Corporate Bond ETF | 47,273 | | 2,340,486 |
| iShares Intermediate Government/Credit Bond ETF | 90,601 | | 9,282,978 |
| iShares Russell 1000 Value ETF | 107,967 | | 16,373,197 |
| Vanguard Intermediate-Term Treasury ETF | 32,487 | | 1,899,840 |
Total Exchange-Traded Funds
(Cost $30,279,724) | | | 29,896,501 |
| Short-Term Investments 0.6% |
| Affiliated Investment Company 0.5% |
| MainStay U.S. Government Liquidity Fund, 3.602% (f) | 1,792,552 | | 1,792,552 |
| Unaffiliated Investment Company 0.1% |
| Invesco Government and Agency Portfolio, 4.301% (f)(g) | 573,209 | | 573,209 |
Total Short-Term Investments
(Cost $2,365,761) | | | 2,365,761 |
Total Investments
(Cost $368,792,625) | 98.1% | | 381,508,408 |
| Other Assets, Less Liabilities | 1.9 | | 7,344,356 |
| Net Assets | 100.0% | | $ 388,852,764 |
| † | Percentages indicated are based on Portfolio net assets. |
| ‡ | Less than one-tenth of a percent. |
| (a) | May be sold to institutional investors only under Rule 144A or securities offered pursuant to Section 4(a)(2) of the Securities Act of 1933, as amended. |
| (b) | Floating rate—Rate shown was the rate in effect as of December 31, 2022. |
The notes to the financial statements are an integral part of, and should be read in conjunction with, the financial statements.
| 16 | MainStay VP Balanced Portfolio |
| (c) | Fixed to floating rate—Rate shown was the rate in effect as of December 31, 2022. |
| (d) | All or a portion of this security was held on loan. As of December 31, 2022, the aggregate market value of securities on loan was $5,050,133; the total market value of collateral held by the Portfolio was $5,212,315. The market value of the collateral held included non-cash collateral in the form of U.S. Treasury securities with a value of $4,639,106. The Portfolio received cash collateral with a value of $573,209. (See Note 2(I)) |
| (e) | Non-income producing security. |
| (f) | Current yield as of December 31, 2022. |
| (g) | Represents a security purchased with cash collateral received for securities on loan. |
The notes to the financial statements are an integral part of, and should be read in conjunction with, the financial statements.
17
Portfolio of Investments December 31, 2022† (continued)
Investments in Affiliates (in 000's)
Investments in issuers considered to be affiliate(s) of the Portfolio during the year ended December 31, 2022 for purposes of Section 2(a)(3) of the Investment Company Act of 1940, as amended, were as follows:
| Affiliated Investment Companies | Value,
Beginning
of Year | Purchases
at Cost | Proceeds
from
Sales | Net
Realized
Gain/(Loss)
on Sales | Change in
Unrealized
Appreciation/
(Depreciation) | Value,
End of
Year | Dividend
Income | Other
Distributions | Shares
End of
Year |
| MainStay U.S. Government Liquidity Fund | $ 4,715 | $ 80,737 | $ (83,659) | $ — | $ — | $ 1,793 | $ 58 | $ — | 1,793 |
Futures Contracts
As of December 31, 2022, the Portfolio held the following futures contracts1:
| Type | Number of
Contracts | Expiration
Date | Value at
Trade Date | Current
Notional
Amount | Unrealized
Appreciation
(Depreciation)2 |
| Long Contracts | | | | | |
| U.S. Treasury 2 Year Notes | 28 | March 2023 | $ 5,744,311 | $ 5,742,188 | $ (2,123) |
| U.S. Treasury 5 Year Notes | 81 | March 2023 | 8,823,042 | 8,742,305 | (80,737) |
| U.S. Treasury 10 Year Notes | 13 | March 2023 | 1,473,992 | 1,459,859 | (14,133) |
| Total Long Contracts | | | | | (96,993) |
| Short Contracts | | | | | |
| U.S. Treasury 10 Year Ultra Bonds | (42) | March 2023 | (5,088,002) | (4,967,812) | 120,190 |
| U.S. Treasury Long Bonds | (6) | March 2023 | (758,870) | (752,063) | 6,807 |
| U.S. Treasury Ultra Bonds | (1) | March 2023 | (139,473) | (134,313) | 5,160 |
| Total Short Contracts | | | | | 132,157 |
| Net Unrealized Appreciation | | | | | $ 35,164 |
| 1. | As of December 31, 2022, cash in the amount of $60,485 was on deposit with a broker or futures commission merchant for futures transactions. |
| 2. | Represents the difference between the value of the contracts at the time they were opened and the value as of December 31, 2022. |
| Abbreviation(s): |
| ADR—American Depositary Receipt |
| CLO—Collateralized Loan Obligation |
| ETF—Exchange-Traded Fund |
| FFCB—Federal Farm Credit Bank |
| FHLB—Federal Home Loan Bank |
| LIBOR—London Interbank Offered Rate |
The notes to the financial statements are an integral part of, and should be read in conjunction with, the financial statements.
| 18 | MainStay VP Balanced Portfolio |
The following is a summary of the fair valuations according to the inputs used as of December 31, 2022, for valuing the Portfolio’s assets and liabilities:
| Description | Quoted
Prices in
Active
Markets for
Identical
Assets
(Level 1) | | Significant
Other
Observable
Inputs
(Level 2) | | Significant
Unobservable
Inputs
(Level 3) | | Total |
| Asset Valuation Inputs | | | | | | | |
| Investments in Securities (a) | | | | | | | |
| Long-Term Bonds | | | | | | | |
| Asset-Backed Securities | $ — | | $ 5,449,714 | | $ — | | $ 5,449,714 |
| Corporate Bonds | — | | 34,621,849 | | — | | 34,621,849 |
| Mortgage-Backed Security | — | | 422,055 | | — | | 422,055 |
| U.S. Government & Federal Agencies | — | | 93,592,915 | | — | | 93,592,915 |
| Total Long-Term Bonds | — | | 134,086,533 | | — | | 134,086,533 |
| Common Stocks | | | | | | | |
| Pharmaceuticals | 18,906,679 | | 2,129,752 | | — | | 21,036,431 |
| All Other Industries | 194,123,182 | | — | | — | | 194,123,182 |
| Total Common Stocks | 213,029,861 | | 2,129,752 | | — | | 215,159,613 |
| Exchange-Traded Funds | 29,896,501 | | — | | — | | 29,896,501 |
| Short-Term Investments | | | | | | | |
| Affiliated Investment Company | 1,792,552 | | — | | — | | 1,792,552 |
| Unaffiliated Investment Company | 573,209 | | — | | — | | 573,209 |
| Total Short-Term Investments | 2,365,761 | | — | | — | | 2,365,761 |
| Total Investments in Securities | 245,292,123 | | 136,216,285 | | — | | 381,508,408 |
| Other Financial Instruments | | | | | | | |
| Futures Contracts (b) | 132,157 | | — | | — | | 132,157 |
| Total Investments in Securities and Other Financial Instruments | $ 245,424,280 | | $ 136,216,285 | | $ — | | $ 381,640,565 |
| Liability Valuation Inputs | | | | | | | |
| Other Financial Instruments | | | | | | | |
| Futures Contracts (b) | $ (96,993) | | $ — | | $ — | | $ (96,993) |
| (a) | For a complete listing of investments and their industries, see the Portfolio of Investments. |
| (b) | The value listed for these securities reflects unrealized appreciation (depreciation) as shown on the Portfolio of Investments. |
The notes to the financial statements are an integral part of, and should be read in conjunction with, the financial statements.
19
Statement of Assets and Liabilities as of December 31, 2022
| Assets |
Investment in unaffiliated securities, at value
(identified cost $367,000,073) including securities on loan of $5,050,133 | $379,715,856 |
Investment in affiliated investment companies, at value
(identified cost $1,792,552) | 1,792,552 |
| Cash | 7,186,804 |
| Cash collateral on deposit at broker for futures contracts | 60,485 |
| Due from custodian | 180,058 |
| Receivables: | |
| Investment securities sold | 1,070,129 |
| Dividends and interest | 1,025,074 |
| Portfolio shares sold | 248,328 |
| Securities lending | 2,707 |
| Other assets | 1,817 |
| Total assets | 391,283,810 |
| Liabilities |
| Cash collateral received for securities on loan | 573,209 |
| Payables: | |
| Investment securities purchased | 1,345,147 |
| Manager (See Note 3) | 217,870 |
| Portfolio shares redeemed | 128,997 |
| NYLIFE Distributors (See Note 3) | 79,376 |
| Shareholder communication | 38,252 |
| Professional fees | 29,734 |
| Variation margin on futures contracts | 7,699 |
| Custodian | 6,875 |
| Accrued expenses | 3,887 |
| Total liabilities | 2,431,046 |
| Net assets | $388,852,764 |
| Composition of Net Assets |
| Shares of beneficial interest outstanding (par value of $.001 per share) unlimited number of shares authorized | $ 31,074 |
| Additional paid-in-capital | 382,099,036 |
| | 382,130,110 |
| Total distributable earnings (loss) | 6,722,654 |
| Net assets | $388,852,764 |
| Initial Class | |
| Net assets applicable to outstanding shares | $ 20,643,265 |
| Shares of beneficial interest outstanding | 1,627,749 |
| Net asset value per share outstanding | $ 12.68 |
| Service Class | |
| Net assets applicable to outstanding shares | $368,209,499 |
| Shares of beneficial interest outstanding | 29,445,888 |
| Net asset value per share outstanding | $ 12.50 |
The notes to the financial statements are an integral part of, and should be read in conjunction with, the financial statements.
| 20 | MainStay VP Balanced Portfolio |
Statement of Operations for the year ended December 31, 2022
| Investment Income (Loss) |
| Income | |
| Dividends-unaffiliated (net of foreign tax withholding of $13,626) | $ 5,893,216 |
| Interest | 3,663,483 |
| Securities lending, net | 88,932 |
| Dividends-affiliated | 58,387 |
| Total income | 9,704,018 |
| Expenses | |
| Manager (See Note 3) | 2,591,562 |
| Distribution/Service—Service Class (See Note 3) | 944,130 |
| Professional fees | 80,571 |
| Shareholder communication | 51,413 |
| Custodian | 39,515 |
| Trustees | 8,455 |
| Miscellaneous | 13,138 |
| Total expenses | 3,728,784 |
| Net investment income (loss) | 5,975,234 |
| Realized and Unrealized Gain (Loss) |
| Net realized gain (loss) on: | |
| Unaffiliated investment transactions | (11,704,249) |
| Futures transactions | (73,295) |
| Foreign currency transactions | 1,965 |
| Net realized gain (loss) | (11,775,579) |
| Net change in unrealized appreciation (depreciation) on: | |
| Unaffiliated investments | (19,487,314) |
| Futures contracts | 87,040 |
| Translation of other assets and liabilities in foreign currencies | 148 |
| Net change in unrealized appreciation (depreciation) | (19,400,126) |
| Net realized and unrealized gain (loss) | (31,175,705) |
| Net increase (decrease) in net assets resulting from operations | $(25,200,471) |
The notes to the financial statements are an integral part of, and should be read in conjunction with, the financial statements.
21
Statements of Changes in Net Assets
for the years ended December 31, 2022 and December 31, 2021
| | 2022 | 2021 |
| Increase (Decrease) in Net Assets |
| Operations: | | |
| Net investment income (loss) | $ 5,975,234 | $ 3,388,359 |
| Net realized gain (loss) | (11,775,579) | 77,713,221 |
| Net change in unrealized appreciation (depreciation) | (19,400,126) | (21,504,838) |
| Net increase (decrease) in net assets resulting from operations | (25,200,471) | 59,596,742 |
| Distributions to shareholders: | | |
| Initial Class | (3,971,697) | (670,643) |
| Service Class | (72,269,473) | (11,090,271) |
| Total distributions to shareholders | (76,241,170) | (11,760,914) |
| Capital share transactions: | | |
| Net proceeds from sales of shares | 76,410,539 | 58,759,681 |
| Net asset value of shares issued to shareholders in reinvestment of distributions | 76,241,170 | 11,760,914 |
| Cost of shares redeemed | (76,942,898) | (57,336,035) |
| Increase (decrease) in net assets derived from capital share transactions | 75,708,811 | 13,184,560 |
| Net increase (decrease) in net assets | (25,732,830) | 61,020,388 |
| Net Assets |
| Beginning of year | 414,585,594 | 353,565,206 |
| End of year | $388,852,764 | $414,585,594 |
The notes to the financial statements are an integral part of, and should be read in conjunction with, the financial statements.
| 22 | MainStay VP Balanced Portfolio |
Financial Highlights selected per share data and ratios
| | Year Ended December 31, |
| Initial Class | 2022 | | 2021 | | 2020 | | 2019 | | 2018 |
| Net asset value at beginning of year | $ 16.85 | | $ 14.83 | | $ 14.59 | | $ 13.23 | | $ 15.18 |
| Net investment income (loss) (a) | 0.26 | | 0.18 | | 0.21 | | 0.25 | | 0.28 |
| Net realized and unrealized gain (loss) | (1.38) | | 2.36 | | 0.88 | | 1.93 | | (1.31) |
| Total from investment operations | (1.12) | | 2.54 | | 1.09 | | 2.18 | | (1.03) |
| Less distributions: | | | | | | | | | |
| From net investment income | (0.17) | | (0.22) | | (0.30) | | (0.29) | | (0.25) |
| From net realized gain on investments | (2.88) | | (0.30) | | (0.55) | | (0.53) | | (0.67) |
| Total distributions | (3.05) | | (0.52) | | (0.85) | | (0.82) | | (0.92) |
| Net asset value at end of year | $ 12.68 | | $ 16.85 | | $ 14.83 | | $ 14.59 | | $ 13.23 |
| Total investment return (b) | (5.74)% | | 17.29% | | 7.90% | | 16.75% | | (7.36)% |
| Ratios (to average net assets)/Supplemental Data: | | | | | | | | | |
| Net investment income (loss) | 1.73% | | 1.11% | | 1.52% | | 1.75% | | 1.88% |
| Net expenses (c) | 0.70% | | 0.72% | | 0.76% | | 0.76% | | 0.74% |
| Portfolio turnover rate | 306% | | 195% | | 218% | | 186% | | 209% |
| Net assets at end of year (in 000's) | $ 20,643 | | $ 22,345 | | $ 18,533 | | $ 18,653 | | $ 16,084 |
| (a) | Per share data based on average shares outstanding during the year. |
| (b) | Total return does not reflect any deduction of sales charges, mortality and expense charges, contract charges or administrative charges. For periods of less than one year, total return is not annualized. |
| (c) | In addition to the fees and expenses which the Portfolio bears directly, it also indirectly bears a pro-rata share of the fees and expenses of the underlying funds in which it invests. Such indirect expenses are not included in the above expense ratios. |
| | Year Ended December 31, |
| Service Class | 2022 | | 2021 | | 2020 | | 2019 | | 2018 |
| Net asset value at beginning of year | $ 16.66 | | $ 14.67 | | $ 14.43 | | $ 13.09 | | $ 15.03 |
| Net investment income (loss) (a) | 0.22 | | 0.14 | | 0.17 | | 0.21 | | 0.24 |
| Net realized and unrealized gain (loss) | (1.37) | | 2.34 | | 0.88 | | 1.91 | | (1.30) |
| Total from investment operations | (1.15) | | 2.48 | | 1.05 | | 2.12 | | (1.06) |
| Less distributions: | | | | | | | | | |
| From net investment income | (0.13) | | (0.19) | | (0.26) | | (0.25) | | (0.21) |
| From net realized gain on investments | (2.88) | | (0.30) | | (0.55) | | (0.53) | | (0.67) |
| Total distributions | (3.01) | | (0.49) | | (0.81) | | (0.78) | | (0.88) |
| Net asset value at end of year | $ 12.50 | | $ 16.66 | | $ 14.67 | | $ 14.43 | | $ 13.09 |
| Total investment return (b) | (5.97)% | | 17.00% | | 7.63% | | 16.46% | | (7.59)% |
| Ratios (to average net assets)/Supplemental Data: | | | | | | | | | |
| Net investment income (loss) | 1.49% | | 0.86% | | 1.27% | | 1.50% | | 1.62% |
| Net expenses (c) | 0.95% | | 0.97% | | 1.01% | | 1.01% | | 0.99% |
| Portfolio turnover rate | 306% | | 195% | | 218% | | 186% | | 209% |
| Net assets at end of year (in 000's) | $ 368,209 | | $ 392,240 | | $ 335,032 | | $ 375,050 | | $ 352,496 |
| (a) | Per share data based on average shares outstanding during the year. |
| (b) | Total return does not reflect any deduction of sales charges, mortality and expense charges, contract charges or administrative charges. For periods of less than one year, total return is not annualized. |
| (c) | In addition to the fees and expenses which the Portfolio bears directly, it also indirectly bears a pro-rata share of the fees and expenses of the underlying funds in which it invests. Such indirect expenses are not included in the above expense ratios. |
The notes to the financial statements are an integral part of, and should be read in conjunction with, the financial statements.
23
Notes to Financial Statements
Note 1–Organization and Business
MainStay VP Funds Trust (the “Fund”) was organized as a Delaware statutory trust on February 1, 2011. The Fund is registered under the Investment Company Act of 1940, as amended (the “1940 Act”), as an open-end management investment company. The Fund is comprised of thirty-one separate series (collectively referred to as the “Portfolios”). These financial statements and notes relate to the MainStay VP Balanced Portfolio (the "Portfolio"), a "diversified” portfolio, as that term is defined in the 1940 Act, as interpreted or modified by regulatory authorities having jurisdiction, from time to time.
Shares of the Portfolio are currently offered to certain separate accounts to fund variable annuity policies and variable universal life insurance policies issued by New York Life Insurance and Annuity Corporation (“NYLIAC”), a wholly-owned subsidiary of New York Life Insurance Company (“New York Life”) and may also be offered to fund variable annuity policies and variable universal life insurance policies issued by other insurance companies. NYLIAC allocates shares of the Portfolio to, among others, certain NYLIAC separate accounts. Shares of the Portfolio are also offered to the MainStay VP Conservative Allocation Portfolio, MainStay VP Moderate Allocation Portfolio, MainStay VP Growth Allocation Portfolio and MainStay VP Equity Allocation Portfolio, which operate as “funds-of-funds," and other variable insurance funds.
The following table lists the Portfolio's share classes that have been registered and commenced operations:
| Class | Commenced Operations |
| Initial Class | May 2, 2005 |
| Service Class | May 2, 2005 |
Shares of the Portfolio are offered and are redeemed at a price equal to their respective net asset value (“NAV”) per share. No sales or redemption charge is applicable to the purchase or redemption of the Portfolio's shares. Under the terms of the Fund’s multiple class plan, adopted pursuant to Rule 18f-3 under the 1940 Act, the classes differ in that, among other things, Service Class shares of the Portfolio pay a combined distribution and service fee of 0.25% of average daily net assets attributable to Service Class shares of the Portfolio to the Distributor (as defined in Note 3(B)) pursuant to a plan adopted in accordance with Rule 12b-1 under the 1940 Act. Contract owners of variable annuity contracts purchased after June 2, 2003, are permitted to invest only in the Service Class shares.
The Portfolio's investment objective is to seek total return.
Note 2–Significant Accounting Policies
The Portfolio is an investment company and accordingly follows the investment company accounting and reporting guidance of the Financial Accounting Standards Board (“FASB”) Accounting Standards Codification Topic 946 Financial Services—Investment Companies. The Portfolio prepares its financial statements in accordance with generally accepted
accounting principles (“GAAP”) in the United States of America and follows the significant accounting policies described below.
(A) Securities Valuation. Investments are usually valued as of the close of regular trading on the New York Stock Exchange (the "Exchange") (usually 4:00 p.m. Eastern time) on each day the Portfolio is open for business ("valuation date").
Effective September 8, 2022, and pursuant to Rule 2a-5 under the 1940 Act, the Board of Trustees of the Fund (the "Board") designated New York Life Investment Management LLC (“New York Life Investments” or the "Manager") as its Valuation Designee (the "Valuation Designee"). The Valuation Designee is responsible for performing fair valuations relating to all investments in the Portfolio’s portfolio for which market quotations are not readily available; periodically assessing and managing material valuation risks; establishing and applying fair value methodologies; testing fair valuation methodologies; evaluating and overseeing pricing services; ensuring appropriate segregation of valuation and portfolio management functions; providing quarterly, annual and prompt reporting to the Board, as appropriate; identifying potential conflicts of interest; and maintaining appropriate records. The Valuation Designee has established a valuation committee ("Valuation Committee") to assist in carrying out the Valuation Designee’s responsibilities and establish prices of securities for which market quotations are not readily available. The Portfolio’s and the Valuation Designee's policies and procedures ("Valuation Procedures") govern the Valuation Designee’s selection and application of methodologies for determining and calculating the fair value of Portfolio investments. The Valuation Designee may value the Portfolio's portfolio securities for which market quotations are not readily available and other Portfolio assets utilizing inputs from pricing services and other third-party sources (together, “Pricing Sources”). The Valuation Committee meets (in person, via electronic mail or via teleconference) on an ad-hoc basis to determine fair valuations and on a quarterly basis to review fair value events with respect to certain securities for which market quotations are not readily available, including valuation risks and back-testing results, and preview reports to the Board.
The Valuation Committee establishes prices of securities for which market quotations are not readily available based on such methodologies and measurements on a regular basis after considering information that is reasonably available and deemed relevant by the Valuation Committee. The Board shall oversee the Valuation Designee and review fair valuation materials on a prompt, quarterly and annual basis and approve proposed revisions to the Valuation Procedures.
Investments for which market quotations are not readily available are valued at fair value as determined in good faith pursuant to the Valuation Procedures. A market quotation is readily available only when that quotation is a quoted price (unadjusted) in active markets for identical investments that the Portfolio can access at the measurement date, provided that a quotation will not be readily available if it is not reliable. "Fair value" is defined as the price the Portfolio would reasonably expect to receive upon selling an asset or liability in an orderly transaction to an independent buyer in the principal or most advantageous market for the
| 24 | MainStay VP Balanced Portfolio |
asset or liability. Fair value measurements are determined within a framework that establishes a three-tier hierarchy that maximizes the use of observable market data and minimizes the use of unobservable inputs to establish a classification of fair value measurements for disclosure purposes. "Inputs" refer broadly to the assumptions that market participants would use in pricing the asset or liability, including assumptions about risk, such as the risk inherent in a particular valuation technique used to measure fair value using a pricing model and/or the risk inherent in the inputs for the valuation technique. Inputs may be observable or unobservable. Observable inputs reflect the assumptions market participants would use in pricing the asset or liability based on market data obtained from sources independent of the Portfolio. Unobservable inputs reflect the Portfolio’s own assumptions about the assumptions market participants would use in pricing the asset or liability based on the information available. The inputs or methodology used for valuing assets or liabilities may not be an indication of the risks associated with investing in those assets or liabilities. The three-tier hierarchy of inputs is summarized below.
| • | Level 1—quoted prices (unadjusted) in active markets for an identical asset or liability |
| • | Level 2—other significant observable inputs (including quoted prices for a similar asset or liability in active markets, interest rates and yield curves, prepayment speeds, credit risk, etc.) |
| • | Level 3—significant unobservable inputs (including the Portfolio's own assumptions about the assumptions that market participants would use in measuring fair value of an asset or liability) |
The level of an asset or liability within the fair value hierarchy is based on the lowest level of an input, both individually and in the aggregate, that is significant to the fair value measurement. The aggregate value by input level of the Portfolio’s assets and liabilities as of December 31, 2022, is included at the end of the Portfolio of Investments.
The Portfolio may use third-party vendor evaluations, whose prices may be derived from one or more of the following standard inputs, among others:
| • Benchmark yields | • Reported trades |
| • Broker/dealer quotes | • Issuer spreads |
| • Two-sided markets | • Benchmark securities |
| • Bids/offers | • Reference data (corporate actions or material event notices) |
| • Industry and economic events | • Comparable bonds |
| • Monthly payment information | |
An asset or liability for which a market quotation is not readily available is valued by methods deemed reasonable in good faith by the Valuation Committee, following the Valuation Procedures to represent fair value. Under these procedures, the Valuation Designee generally uses a market-based approach which may use related or comparable assets or liabilities, recent transactions, market multiples, book values and other relevant information. The Valuation Designee may also use an
income-based valuation approach in which the anticipated future cash flows of the asset or liability are discounted to calculate fair value. Discounts may also be applied due to the nature and/or duration of any restrictions on the disposition of the asset or liability. Fair value represents a good faith approximation of the value of a security. Fair value determinations involve the consideration of a number of subjective factors, an analysis of applicable facts and circumstances and the exercise of judgment. As a result, it is possible that the fair value for a security determined in good faith in accordance with the Valuation Procedures may differ from valuations for the same security determined for other funds using their own valuation procedures. Although the Valuation Procedures are designed to value a security at the price the Portfolio may reasonably expect to receive upon the security's sale in an orderly transaction, there can be no assurance that any fair value determination thereunder would, in fact, approximate the amount that the Portfolio would actually realize upon the sale of the security or the price at which the security would trade if a reliable market price were readily available. During the year ended December 31, 2022, there were no material changes to the fair value methodologies.
Securities which may be valued in this manner include, but are not limited to: (i) a security for which trading has been halted or suspended or otherwise does not have a readily available market quotation on a given day; (ii) a debt security that has recently gone into default and for which there is not a current market quotation; (iii) a security of an issuer that has entered into a restructuring; (iv) a security that has been delisted from a national exchange; (v) a security subject to trading collars for which no or limited trading takes place; and (vi) a security whose principal market has been temporarily closed at a time when, under normal conditions, it would be open. Securities valued in this manner are generally categorized as Level 2 or 3 in the hierarchy.
Equity securities are valued at the last quoted sales prices as of the close of regular trading on the relevant exchange on each valuation date. Securities that are not traded on the valuation date are valued at the mean of the last quoted bid and ask prices. Prices are normally taken from the principal market in which each security trades. These securities are generally categorized as Level 1 in the hierarchy.
Exchange-traded funds (“ETFs”) are valued at the last quoted sales prices as of the close of regular trading on the relevant exchange on each valuation date. Securities that are not traded on the valuation date are valued at the mean of the last quoted bid and ask prices. Prices are normally taken from the principal market in which each security trades. These securities are generally categorized as Level 1 in the hierarchy.
Investments in mutual funds, including money market funds, are valued at their respective NAVs at the close of business each day on the valuation date. These securities are generally categorized as Level 1 in the hierarchy.
Futures contracts are valued at the last posted settlement price on the market where such futures are primarily traded. These securities are generally categorized as Level 1 in the hierarchy.
Notes to Financial Statements (continued)
Debt securities (other than convertible and municipal bonds) are valued at the evaluated bid prices (evaluated mean prices in the case of convertible and municipal bonds) supplied by a pricing agent or broker selected by the Valuation Designee, in consultation with the Subadvisors. The evaluations are market-based measurements processed through a pricing application and represents the pricing agent’s good faith determination as to what a holder may receive in an orderly transaction under market conditions. The rules-based logic utilizes valuation techniques that reflect participants’ assumptions and vary by asset class and per methodology, maximizing the use of relevant observable data including quoted prices for similar assets, benchmark yield curves and market corroborated inputs. The evaluated bid or mean prices are deemed by the Valuation Designee, in consultation with the Subadvisors, to be representative of market values at the regular close of trading of the Exchange on each valuation date. Debt securities purchased on a delayed delivery basis are marked to market daily until settlement at the forward settlement date. Debt securities, including corporate bonds, U.S. government and federal agency bonds, municipal bonds, foreign bonds, convertible bonds, asset-backed securities and mortgage-backed securities are generally categorized as Level 2 in the hierarchy.
Temporary cash investments acquired in excess of 60 days to maturity at the time of purchase are valued using the latest bid prices or using valuations based on a matrix system (which considers such factors as security prices, yields, maturities and ratings), both as furnished by independent pricing services. Temporary cash investments that mature in 60 days or less at the time of purchase ("Short-Term Investments") are valued using the amortized cost method of valuation, unless the use of such method would be inappropriate. The amortized cost method involves valuing a security at its cost on the date of purchase and thereafter assuming a constant amortization to maturity of the difference between such cost and the value on maturity date. Amortized cost approximates the current fair value of a security. Securities valued using the amortized cost method are not valued using quoted prices in an active market and are generally categorized as Level 2 in the hierarchy.
The information above is not intended to reflect an exhaustive list of the methodologies that may be used to value portfolio investments. The Valuation Procedures permit the use of a variety of valuation methodologies in connection with valuing portfolio investments. The methodology used for a specific type of investment may vary based on the market data available or other considerations. The methodologies summarized above may not represent the specific means by which portfolio investments are valued on any particular business day.
(B) Income Taxes. The Portfolio's policy is to comply with the requirements of the Internal Revenue Code of 1986, as amended (the “Internal Revenue Code”), applicable to regulated investment companies and to distribute all of its taxable income to the shareholders of the Portfolio within the allowable time limits.
The Manager evaluates the Portfolio’s tax positions to determine if the tax positions taken meet the minimum recognition threshold in connection with accounting for uncertainties in income tax positions taken or
expected to be taken for the purposes of measuring and recognizing tax liabilities in the financial statements. Recognition of tax benefits of an uncertain tax position is permitted only to the extent the position is “more likely than not” to be sustained assuming examination by taxing authorities. The Manager analyzed the Portfolio's tax positions taken on federal, state and local income tax returns for all open tax years (for up to three tax years) and has concluded that no provisions for federal, state and local income tax are required in the Portfolio's financial statements. The Portfolio's federal, state and local income tax and federal excise tax returns for tax years for which the applicable statutes of limitations have not expired are subject to examination by the Internal Revenue Service and state and local departments of revenue.
(C) Dividends and Distributions to Shareholders. Dividends and distributions are recorded on the ex-dividend date. The Portfolio intends to declare and pay dividends from net investment income and distributions from net realized capital and currency gains, if any, at least annually. All dividends and distributions are reinvested at NAV in the same class of shares of the Portfolio. Dividends and distributions to shareholders are determined in accordance with federal income tax regulations and may differ from determinations using GAAP.
(D) Security Transactions and Investment Income. The Portfolio records security transactions on the trade date. Realized gains and losses on security transactions are determined using the identified cost method. Dividend income is recognized on the ex-dividend date, net of any foreign tax withheld at the source, and interest income is accrued as earned using the effective interest rate method. Distributions received from real estate investment trusts may be classified as dividends, capital gains and/or return of capital. Discounts and premiums on securities purchased for the Portfolio are accreted and amortized, respectively, on the effective interest rate method.
Investment income and realized and unrealized gains and losses on investments of the Portfolio are allocated pro rata to the separate classes of shares based upon their relative net assets on the date the income is earned or realized and unrealized gains and losses are incurred.
The Portfolio may place a debt security on non-accrual status and reduce related interest income by ceasing current accruals and writing off all or a portion of any interest receivables when the collection of all or a portion of such interest has become doubtful. A debt security is removed from non-accrual status when the issuer resumes interest payments or when collectability of interest is reasonably assured.
(E) Expenses. Expenses of the Fund are allocated to the individual Portfolios in proportion to the net assets of the respective Portfolios when the expenses are incurred, except where direct allocations of expenses can be made. Expenses (other than fees incurred under the distribution and service plans, further discussed in Note 3(B), which are charged directly to the Service Class shares) are allocated to separate classes of shares pro rata based upon their relative net assets on the date the
| 26 | MainStay VP Balanced Portfolio |
expenses are incurred. The expenses borne by the Portfolio, including those of related parties to the Portfolio, are shown in the Statement of Operations.
Additionally, the Portfolio may invest in ETFs and mutual funds, which are subject to management fees and other fees that may cause the costs of investing in ETFs and mutual funds to be greater than the costs of owning the underlying securities directly. These indirect expenses of ETFs and mutual funds are not included in the amounts shown as expenses in the Statement of Operations or in the expense ratios included in the Financial Highlights.
(F) Use of Estimates. In preparing financial statements in conformity with GAAP, the Manager makes estimates and assumptions that affect the reported amounts and disclosures in the financial statements. Actual results could differ from those estimates and assumptions.
(G) Futures Contracts. A futures contract is an agreement to purchase or sell a specified quantity of an underlying instrument at a specified future date and price, or to make or receive a cash payment based on the value of a financial instrument (e.g., foreign currency, interest rate, security or securities index). The Portfolio is subject to risks such as market price risk, leverage risk, liquidity risk, counterparty risk, operational risk, legal risk and/or interest rate risk in the normal course of investing in these contracts. Upon entering into a futures contract, the Portfolio is required to pledge to the broker or futures commission merchant an amount of cash and/or U.S. government securities equal to a certain percentage of the collateral amount, known as the “initial margin.” During the period the futures contract is open, changes in the value of the contract are recognized as unrealized appreciation or depreciation by marking to market such contract on a daily basis to reflect the market value of the contract at the end of each day’s trading. The Portfolio agrees to receive from or pay to the broker or futures commission merchant an amount of cash equal to the daily fluctuation in the value of the contract. Such receipts or payments are known as “variation margin.” When the futures contract is closed, the Portfolio records a realized gain or loss equal to the difference between the proceeds from (or cost of) the closing transaction and the Portfolio's basis in the contract.
The use of futures contracts involves, to varying degrees, elements of market risk in excess of the amount recognized in the Statement of Assets and Liabilities. The contract or notional amounts and variation margin reflect the extent of the Portfolio's involvement in open futures positions. There are several risks associated with the use of futures contracts as hedging techniques. There can be no assurance that a liquid market will exist at the time when the Portfolio seeks to close out a futures contract. If no liquid market exists, the Portfolio would remain obligated to meet margin requirements until the position is closed. Futures contracts may involve a small initial investment relative to the risk assumed, which could result in losses greater than if the Portfolio did not invest in futures contracts. Futures contracts may be more volatile than direct investments in the instrument underlying the futures and may not correlate to the underlying instrument, causing a given hedge not to
achieve its objectives. The Portfolio's activities in futures contracts have minimal counterparty risk as they are conducted through regulated exchanges that guarantee the futures against default by the counterparty. In the event of a bankruptcy or insolvency of a futures commission merchant that holds margin on behalf of the Portfolio, the Portfolio may not be entitled to the return of the entire margin owed to the Portfolio, potentially resulting in a loss. The Portfolio may invest in futures contracts to seek enhanced returns or to reduce the risk of loss by hedging certain of its holdings. The Portfolio's investment in futures contracts and other derivatives may increase the volatility of the Portfolio's NAVs and may result in a loss to the Portfolio. Open futures contracts as of December 31, 2022, are shown in the Portfolio of Investments.
(H) Foreign Currency Transactions. The Portfolio's books and records are maintained in U.S. dollars. Prices of securities denominated in foreign currency amounts are translated into U.S. dollars at the mean between the buying and selling rates last quoted by any major U.S. bank at the following dates:
(i) market value of investment securities, other assets and liabilities— at the valuation date; and
(ii) purchases and sales of investment securities, income and expenses—at the date of such transactions.
The assets and liabilities that are denominated in foreign currency amounts are presented at the exchange rates and market values at the close of the period. The realized and unrealized changes in net assets arising from fluctuations in exchange rates and market prices of securities are not separately presented.
Net realized gain (loss) on foreign currency transactions represents net currency gains or losses realized as a result of differences between the amounts of securities sale proceeds or purchase cost, dividends, interest and withholding taxes as recorded on the Portfolio's books, and the U.S. dollar equivalent amount actually received or paid. Net currency gains or losses from valuing such foreign currency denominated assets and liabilities, other than investments at valuation date exchange rates, are reflected in unrealized foreign exchange gains or losses.
(I) Securities Lending. In order to realize additional income, the Portfolio may engage in securities lending, subject to the limitations set forth in the 1940 Act and relevant guidance by the staff of the Securities and Exchange Commission (“SEC”). If the Portfolio engages in securities lending, the Portfolio will lend through its custodian, JPMorgan Chase Bank, N.A., ("JPMorgan"), acting as securities lending agent on behalf of the Portfolio. Under the current arrangement, JPMorgan will manage the Portfolio's collateral in accordance with the securities lending agency agreement between the Portfolio and JPMorgan, and indemnify the Portfolio against counterparty risk. The loans will be collateralized by cash (which may be invested in a money market fund) and/or non-cash collateral (which may include U.S. Treasury securities and/or U.S. government agency securities issued or guaranteed by the United States government or its agencies or instrumentalities) at least equal at all times to the market value of the securities loaned. Non-cash collateral held at
Notes to Financial Statements (continued)
year end is segregated and cannot be transferred by the Portfolio. The Portfolio bears the risk of delay in recovery of, or loss of rights in, the securities loaned. The Portfolio may also record a realized gain or loss on securities deemed sold due to a borrower’s inability to return securities on loan. The Portfolio bears the risk of any loss on investment of cash collateral. The Portfolio will receive compensation for lending its securities in the form of fees or it will retain a portion of interest earned on the investment of any cash collateral. The Portfolio will also continue to receive interest and dividends on the securities loaned and any gain or loss in the market price of the securities loaned that may occur during the term of the loan will be for the account of the Portfolio. Income earned from securities lending activities, if any, is reflected in the Statement of Operations. Securities on loan as of December 31, 2022, are shown in the Portfolio of Investments.
(J) Debt Securities Risk. The ability of issuers of debt securities held by the Portfolio to meet their obligations may be affected by, among other things, economic or political developments in a specific country, industry or region. Debt securities are also subject to the risks associated with changes in interest rates.
Investments in the Portfolio are not guaranteed, even though some of the Portfolio’s underlying investments are guaranteed by the U.S. government or its agencies or instrumentalities. The principal risk of mortgage-related and asset-backed securities is that the underlying debt may be prepaid ahead of schedule, if interest rates fall, thereby reducing the value of the Portfolio’s investment. If interest rates rise, less of the debt may be prepaid and the Portfolio may lose money because the Portfolio may be unable to invest in higher yielding assets. The Portfolio is subject to interest-rate risk and can lose principal value when interest rates rise. Bonds are also subject to credit risk, in which the bond issuer may fail to pay interest and principal in a timely manner.
The Portfolio may invest in foreign debt securities, which carry certain risks that are in addition to the usual risks inherent in domestic instruments. These risks include those resulting from currency fluctuations, future adverse political or economic developments and possible imposition of currency exchange blockages or other foreign governmental laws or restrictions. These risks are likely to be greater in emerging markets than in developed markets.
(K) LIBOR Replacement Risk. The Portfolio may invest in certain debt securities, derivatives or other financial instruments that utilize the London Interbank Offered Rate ("LIBOR"), as a “benchmark” or “reference rate” for various interest rate calculations. As of January 1, 2022, the United Kingdom Financial Conduct Authority, which regulates LIBOR, ceased its active encouragement of banks to provide the quotations needed to sustain most LIBOR rates due to the absence of an active market for interbank unsecured lending and other reasons. However, the United Kingdom Financial Conduct Authority, the LIBOR administrator and other regulators announced that the most widely used tenors of U.S. dollar LIBOR will continue until mid-2023. As a result, it is anticipated that the remaining LIBOR settings will be discontinued or will no longer be sufficiently robust to be representative of its underlying
market around that time. Various financial industry groups will plan for that transition and certain regulators and industry groups have taken actions to establish alternative reference rates (e.g., the Secured Overnight Financing Rate, which measures the cost of overnight borrowings through repurchase agreement transactions collateralized with U.S. Treasury securities and is intended to replace U.S. dollar LIBOR with certain adjustments). However, there are challenges to converting certain contracts and transactions to a new benchmark and neither the full effects of the transition process nor its ultimate outcome is known.
The elimination of LIBOR or changes to other reference rates or any other changes or reforms to the determination or supervision of reference rates could have an adverse impact on the market for, or value of, any securities or payments linked to those reference rates, which may adversely affect the Portfolio's performance and/or net asset value. Uncertainty and risk also remain regarding the willingness and ability of issuers and lenders to include enhanced provisions in new and existing contracts or instruments. Consequently, the transition away from LIBOR to other reference rates may lead to increased volatility and illiquidity in markets that are tied to LIBOR, fluctuations in values of LIBOR-related investments or investments in issuers that utilize LIBOR, increased difficulty in borrowing or refinancing and diminished effectiveness of hedging strategies, adversely affecting the Portfolio's performance. Furthermore, the risks associated with the expected discontinuation of LIBOR and transition may be exacerbated if the work necessary to effect an orderly transition to an alternative reference rate is not completed in a timely manner. While the transition away from LIBOR has already begun with no material adverse effect to the Portfolio's performance, the transition is expected to last through mid-2023 for some LIBOR tenors. The usefulness of LIBOR as a benchmark could deteriorate anytime during this transition period.
(L) Indemnifications. Under the Fund’s organizational documents, its officers and trustees are indemnified against certain liabilities that may arise out of performance of their duties to the Fund. Additionally, in the normal course of business, the Portfolio enters into contracts with third-party service providers that contain a variety of representations and warranties and that may provide general indemnifications. The Portfolio's maximum exposure under these arrangements is unknown, as this would involve future claims that may be made against the Portfolio that have not yet occurred. The Manager believes that the risk of loss in connection with these potential indemnification obligations is remote. However, there can be no assurance that material liabilities related to such obligations will not arise in the future, which could adversely impact the Portfolio.
(M) Quantitative Disclosure of Derivative Holdings. The following tables show additional disclosures related to the Portfolio's derivative and hedging activities, including how such activities are accounted for and their effect on the Portfolio's financial positions, performance and cash flows.
The Portfolio entered into futures contracts in order to hedge against anticipated changes in interest rates that might otherwise have an
| 28 | MainStay VP Balanced Portfolio |
adverse effect upon the value of the Portfolio’s securities as well as to help manage the duration and yield curve positioning of the portfolio.
Fair value of derivative instruments as of December 31, 2022:
| Asset Derivatives | Interest
Rate
Contracts
Risk | Total |
| Futures Contracts - Net Assets—Net unrealized appreciation on futures contracts (a) | $132,157 | $132,157 |
| Total Fair Value | $132,157 | $132,157 |
| (a) | Includes cumulative appreciation (depreciation) of futures contracts as reported in the Portfolio of Investments. Only current day’s variation margin is reported within the Statement of Assets and Liabilities. |
| Liability Derivatives | Interest
Rate
Contracts
Risk | Total |
| Futures Contracts - Net Assets—Net unrealized depreciation on futures contracts (a) | $(96,993) | $(96,993) |
| Total Fair Value | $(96,993) | $(96,993) |
| (a) | Includes cumulative appreciation (depreciation) of futures contracts as reported in the Portfolio of Investments. Only current day’s variation margin is reported within the Statement of Assets and Liabilities. |
The effect of derivative instruments on the Statement of Operations for the year ended December 31, 2022:
| Net Realized Gain (Loss) from: | Interest
Rate
Contracts
Risk | Total |
| Futures Contracts | $(73,295) | $(73,295) |
| Total Net Realized Gain (Loss) | $(73,295) | $(73,295) |
| Net Change in Unrealized Appreciation (Depreciation) | Interest
Rate
Contracts
Risk | Total |
| Futures Contracts | $87,040 | $87,040 |
| Total Net Change in Unrealized Appreciation (Depreciation) | $87,040 | $87,040 |
| Average Notional Amount | Total |
| Futures Contracts Long | $11,509,591 |
| Futures Contracts Short | $ (9,384,305) |
Note 3–Fees and Related Party Transactions
(A) Manager and Subadvisors. New York Life Investments, a registered investment adviser and an indirect, wholly-owned subsidiary of New York Life, serves as the Portfolio’s Manager, pursuant to an Amended and Restated Management Agreement (“Management Agreement”). The Manager provides offices, conducts clerical, recordkeeping and
bookkeeping services and keeps most of the financial and accounting records required to be maintained by the Portfolio. Except for the portion of salaries and expenses that are the responsibility of the Portfolio, the Manager pays the salaries and expenses of all personnel affiliated with the Portfolio and certain operational expenses of the Portfolio. During a portion of the six-month period ended December 31, 2022, the Portfolio reimbursed New York Life Investments in an amount equal to the portion of the compensation of the Chief Compliance Officer attributable to the Portfolio. Wellington Management Company LLP (“Wellington” or the "Subadvisor”), a registered investment adviser, serves as the Subadvisor to the Portfolio and is responsible for the day-to-day portfolio management of the equity portion of the Portfolio, pursuant to the terms of a Subadvisory Agreement (a “Subadvisory Agreement”) between New York Life Investments and Wellington. NYL Investors LLC (“NYL Investors” or the “Subadvisor,” and, together with Wellington, the “Subadvisors”), a registered investment adviser and a direct, wholly-owned subsidiary of New York Life, serves as the Subadvisor to the Portfolio and is responsible for the day-to-day portfolio management of the fixed-income portion of the Portfolio, pursuant to the terms of a Subadvisory Agreement between New York Life Investments and NYL Investors. New York Life Investments pays for the services of the Subadvisors.
Pursuant to the Management Agreement, the Fund pays the Manager, on behalf of the Portfolio, a monthly fee for the services performed and the facilities furnished at an annual rate of the Portfolio's average daily net assets as follows: 0.65% up to $1 billion; 0.625% from $1 billion to $2 billion; and 0.60% in excess of $2 billion. During the year ended December 31, 2022, the effective management fee rate was 0.65%.
During the year ended December 31, 2022, New York Life Investments earned fees from the Portfolio in the amount of $2,591,562 and paid Wellington and NYL Investors fees of $673,679 and $409,028, respectively.
JPMorgan Chase Bank, N.A. ("JPMorgan") provides sub-administration and sub-accounting services to the Portfolio pursuant to an agreement with New York Life Investments. These services include calculating the daily NAVs of the Portfolio, maintaining the general ledger and sub-ledger accounts for the calculation of the Portfolio's NAVs, and assisting New York Life Investments in conducting various aspects of the Portfolio's administrative operations. For providing these services to the Portfolio, JPMorgan is compensated by New York Life Investments.
Pursuant to an agreement between the Fund and New York Life Investments, New York Life Investments is responsible for providing or procuring certain regulatory reporting services for the Portfolio. The Portfolio will reimburse New York Life Investments for the actual costs incurred by New York Life Investments in connection with providing or procuring these services for the Portfolio.
(B) Distribution and Service Fees. The Fund, on behalf of the Portfolio, has entered into a distribution agreement with NYLIFE Distributors LLC (the “Distributor”), an affiliate of New York Life Investments. The Portfolio has adopted a distribution plan (the “Plan”) in
Notes to Financial Statements (continued)
accordance with the provisions of Rule 12b-1 under the 1940 Act. Under the Plan, the Distributor has agreed to provide, through its affiliates or independent third parties, various distribution-related, shareholder and administrative support services to the Service Class shareholders. For its services, the Distributor is entitled to a combined distribution and service fee accrued daily and paid monthly at an annual rate of 0.25% of the average daily net assets attributable to the Service Class shares of the Portfolio.
Note 4-Federal Income Tax
As of December 31, 2022, the cost and unrealized appreciation (depreciation) of the Portfolio’s investment portfolio, including applicable derivative contracts and other financial instruments, as determined on a federal income tax basis, were as follows:
| | Federal Tax
Cost | Gross
Unrealized
Appreciation | Gross
Unrealized
(Depreciation) | Net
Unrealized
Appreciation/
(Depreciation) |
| Investments in Securities | $370,634,875 | $26,583,849 | $(15,711,227) | $10,872,622 |
As of December 31, 2022, the components of accumulated gain (loss) on a tax basis were as follows:
Ordinary
Income | Accumulated
Capital
and Other
Gain (Loss) | Other
Temporary
Differences | Unrealized
Appreciation
(Depreciation) | Total
Accumulated
Gain (Loss) |
| $6,218,123 | $(10,364,199) | $(12) | $10,868,742 | $6,722,654 |
The difference between book-basis and tax-basis unrealized appreciation (depreciation) is primarily due to wash sale adjustments, cumulative bond amortization, and mark to market of futures contracts.
As of December 31, 2022, for federal income tax purposes, capital loss carryforwards of $10,363,288, as shown in the table below, were available to the extent provided by the regulations to offset future realized gains of the Portfolio. Accordingly, no capital gains distributions are expected to be paid to shareholders until net gains have been realized in excess of such amounts.
Capital Loss
Available Through | Short-Term
Capital Loss
Amounts (000’s) | Long-Term
Capital Loss
Amounts (000’s) |
| Unlimited | $4,880 | $5,483 |
During the years ended December 31, 2022 and December 31, 2021, the tax character of distributions paid as reflected in the Statements of Changes in Net Assets was as follows:
| | 2022 | 2021 |
| Distributions paid from: | | |
| Ordinary Income | $41,144,789 | $ 7,812,426 |
| Long-Term Capital Gains | 35,096,381 | 3,948,488 |
| Total | $76,241,170 | $11,760,914 |
Note 5–Custodian
JPMorgan is the custodian of cash and securities held by the Portfolio. Custodial fees are charged to the Portfolio based on the Portfolio's net assets and/or the market value of securities held by the Portfolio and the number of certain transactions incurred by the Portfolio.
Note 6–Line of Credit
The Portfolio and certain other funds managed by New York Life Investments maintain a line of credit with a syndicate of banks in order to secure a source of funds for temporary purposes to meet unanticipated or excessive redemption requests.
Effective July 26, 2022, under the credit agreement (the “Credit Agreement”), the aggregate commitment amount is $600,000,000 with an additional uncommitted amount of $100,000,000. The commitment fee is an annual rate of 0.15% of the average commitment amount payable quarterly, regardless of usage, to JPMorgan, who serves as the agent to the syndicate. The commitment fee is allocated among the Portfolio and certain other funds managed by New York Life Investments based upon their respective net assets and other factors. Interest on any revolving credit loan is charged based upon the Federal Funds Rate, Daily Simple Secured Overnight Financing Rate ("SOFR") + 0.10%, or the Overnight Bank Funding Rate, whichever is higher. The Credit Agreement expires on July 25, 2023, although the Portfolio, certain other funds managed by New York Life Investments and the syndicate of banks may renew the Credit Agreement for an additional year on the same or different terms or enter into a credit agreement with a different syndicate of banks. Prior to July 26, 2022, the aggregate commitment amount and the commitment fee were the same as those under the current Credit Agreement. During the year ended December 31, 2022, there were no borrowings made or outstanding with respect to the Portfolio under the Credit Agreement.
Note 7–Interfund Lending Program
Pursuant to an exemptive order issued by the SEC, the Portfolio, along with certain other funds managed by New York Life Investments, may participate in an interfund lending program. The interfund lending program provides an alternative credit facility that permits the Portfolio and certain other funds managed by New York Life Investments to lend or borrow money for temporary purposes directly to or from one another, subject to the conditions of the exemptive order. During the year ended December 31, 2022, there were no interfund loans made or outstanding with respect to the Portfolio.
Note 8–Purchases and Sales of Securities (in 000’s)
During the year ended December 31, 2022, purchases and sales of U.S. government securities were $747,133 and $706,169, respectively. Purchases and sales of securities, other than U.S. government securities and short-term securities, were $432,986 and $476,104, respectively.
| 30 | MainStay VP Balanced Portfolio |
The Portfolio may purchase securities from or sell securities to other portfolios managed by the Subadvisor. These interportfolio transactions are primarily used for cash management purposes and are made pursuant to Rule 17a-7 under the 1940 Act. During the year ended December 31, 2022, such purchases were $172.
Note 9–Capital Share Transactions
Transactions in capital shares for the years ended December 31, 2022 and December 31, 2021, were as follows:
| Initial Class | Shares | Amount |
| Year ended December 31, 2022: | | |
| Shares sold | 94,334 | $ 1,437,172 |
| Shares issued to shareholders in reinvestment of distributions | 328,574 | 3,971,697 |
| Shares redeemed | (121,498) | (1,842,599) |
| Net increase (decrease) | 301,410 | $ 3,566,270 |
| Year ended December 31, 2021: | | |
| Shares sold | 120,400 | $ 1,937,700 |
| Shares issued to shareholders in reinvestment of distributions | 41,246 | 670,643 |
| Shares redeemed | (85,289) | (1,376,746) |
| Net increase (decrease) | 76,357 | $ 1,231,597 |
| |
| Service Class | Shares | Amount |
| Year ended December 31, 2022: | | |
| Shares sold | 4,898,185 | $ 74,973,367 |
| Shares issued to shareholders in reinvestment of distributions | 6,060,333 | 72,269,473 |
| Shares redeemed | (5,061,179) | (75,100,299) |
| Net increase (decrease) | 5,897,339 | $ 72,142,541 |
| Year ended December 31, 2021: | | |
| Shares sold | 3,506,546 | $ 56,821,981 |
| Shares issued to shareholders in reinvestment of distributions | 689,492 | 11,090,271 |
| Shares redeemed | (3,488,227) | (55,959,289) |
| Net increase (decrease) | 707,811 | $ 11,952,963 |
Note 10–Other Matters
As of the date of this report, interest rates in the United States and many parts of the world, including certain European countries, are ascending from historically low levels. Thus, the Portfolio currently faces a heightened level of risk associated with rising interest rates. This could be driven by a variety of factors, including but not limited to central bank monetary policies, changing inflation or real growth rates, general economic conditions, increasing bond issuances or reduced market demand for low yielding investments.
An outbreak of COVID-19, first detected in December 2019, has developed into a global pandemic and has resulted in travel restrictions, closure of international borders, certain businesses and securities markets, restrictions on securities trading activities, prolonged
quarantines, supply chain disruptions, and lower consumer demand, as well as general concern and uncertainty. In 2022, many countries lifted some or all restrictions related to COVID-19. However, the continued impact of COVID-19 and related variants is uncertain and could further adversely affect the global economy, national economies, individual issuers and capital markets in unforeseeable ways and result in a substantial and extended economic downturn. Developments that disrupt global economies and financial markets, such as COVID-19, may magnify factors that affect the Portfolio's performance.
Note 11–Subsequent Events
In connection with the preparation of the financial statements of the Portfolio as of and for the year ended December 31, 2022, events and transactions subsequent to December 31, 2022, through the date the financial statements were issued have been evaluated by the Manager for possible adjustment and/or disclosure. No subsequent events requiring financial statement adjustment or disclosure have been identified.
Report of Independent Registered Public Accounting Firm
To the Board of Trustees of MainStay VP Funds Trust and Shareholders of
MainStay VP Balanced Portfolio
Opinion on the Financial Statements
We have audited the accompanying statement of assets and liabilities, including the portfolio of investments, of MainStay VP Balanced Portfolio (one of the portfolios constituting MainStay VP Funds Trust, referred to hereafter as the “Portfolio”) as of December 31, 2022, the related statement of operations for the year ended December 31, 2022, the statements of changes in net assets for each of the two years in the period ended December 31, 2022, including the related notes, and the financial highlights for each of the five years in the period ended December 31, 2022 (collectively referred to as the “financial statements”). In our opinion, the financial statements present fairly, in all material respects, the financial position of the Portfolio as of December 31, 2022, the results of its operations for the year then ended, the changes in its net assets for each of the two years in the period ended December 31, 2022 and the financial highlights for each of the five years in the period ended December 31, 2022 in conformity with accounting principles generally accepted in the United States of America.
Basis for Opinion
These financial statements are the responsibility of the Portfolio’s management. Our responsibility is to express an opinion on the Portfolio’s financial statements based on our audits. We are a public accounting firm registered with the Public Company Accounting Oversight Board (United States) (PCAOB) and are required to be independent with respect to the Portfolio in accordance with the U.S. federal securities laws and the applicable rules and regulations of the Securities and Exchange Commission and the PCAOB.
We conducted our audits of these financial statements in accordance with the standards of the PCAOB. Those standards require that we plan and perform the audit to obtain reasonable assurance about whether the financial statements are free of material misstatement, whether due to error or fraud.
Our audits included performing procedures to assess the risks of material misstatement of the financial statements, whether due to error or fraud, and performing procedures that respond to those risks. Such procedures included examining, on a test basis, evidence regarding the amounts and disclosures in the financial statements. Our audits also included evaluating the accounting principles used and significant estimates made by management, as well as evaluating the overall presentation of the financial statements. Our procedures included confirmation of securities owned as of December 31, 2022 by correspondence with the custodian, transfer agents, and brokers; when replies were not received from brokers, we performed other auditing procedures. We believe that our audits provide a reasonable basis for our opinion.
/s/PricewaterhouseCoopers LLP
New York, New York
February 24, 2023
We have served as the auditor of one or more investment companies in the MainStay group of funds since 1984.
| 32 | MainStay VP Balanced Portfolio |
Board Consideration and Approval of Management Agreement and Subadvisory Agreements (Unaudited)
The continuation of the Management Agreement with respect to the MainStay VP Balanced Portfolio (“Portfolio”) and New York Life Investment Management LLC (“New York Life Investments”) and the Subadvisory Agreements between New York Life Investments and each of NYL Investors LLC (“NYL Investors”) and Wellington Management Company LLP (“WMC”) with respect to the Portfolio (together, “Advisory Agreements”) is subject to annual review and approval by the Board of Trustees of MainStay VP Funds Trust (“Board” of the “Trust”) in accordance with Section 15 of the Investment Company Act of 1940, as amended (“1940 Act”). At its December 6–7, 2022 meeting, the Board, which is comprised solely of Trustees who are not an “interested person” (as such term is defined in the 1940 Act) of the Trust (“Independent Trustees”), unanimously approved the continuation of each of the Advisory Agreements for a one-year period.
In reaching the decision to approve the continuation of each of the Advisory Agreements, the Board considered information and materials furnished by New York Life Investments, NYL Investors and WMC in connection with an annual contract review process undertaken by the Board that took place at meetings of the Board and its Contracts Committee during October 2022 through December 2022, including information and materials furnished by New York Life Investments, NYL Investors and WMC in response to requests prepared on behalf of the Board, and in consultation with the Board, by independent legal counsel to the Independent Trustees, which encompassed a variety of topics, including those summarized below. Information and materials requested by and furnished to the Board for consideration in connection with the contract review process included, among other items, reports on the Portfolio and “peer funds” prepared by Institutional Shareholder Services Inc. (“ISS”), an independent third-party service provider engaged by the Board to report objectively on the Portfolio’s investment performance, management fee and total expenses. The Board also considered information on the fees charged to other investment advisory clients of New York Life Investments, NYL Investors and/or WMC that follow investment strategies similar to those of the Portfolio, if any, and, when applicable, the rationale for any differences in the Portfolio’s management and subadvisory fees and the fees charged to those other investment advisory clients. In addition, the Board considered information regarding the legal standards and fiduciary obligations applicable to its consideration of the continuation of each of the Advisory Agreements. The contract review process, including the structure and format for information and materials provided to the Board, has been developed in consultation with the Board. The Independent Trustees also met in executive sessions with their independent legal counsel and, for portions thereof, with senior management of New York Life Investments.
The Board’s deliberations with respect to the continuation of each of the Advisory Agreements reflect a year-long process, and the Board also took into account information furnished to the Board and its Committees throughout the year, as deemed relevant and appropriate by the Trustees, including, among other items, reports on investment performance of the Portfolio and investment-related matters for the Portfolio as well as presentations from New York Life Investments and, generally annually,
NYL Investors and WMC personnel. In addition, the Board took into account other information received from New York Life Investments throughout the year, including, among other items, periodic reports on legal and compliance matters, risk management, portfolio turnover, brokerage commissions and non-advisory services provided to the Portfolio by New York Life Investments, as deemed relevant and appropriate by the Trustees.
In addition to information provided to the Board throughout the year, the Board received information in connection with its June 2022 meeting provided specifically in response to requests prepared on behalf of the Board, and in consultation with the Board, by independent legal counsel to the Independent Trustees regarding the Portfolio’s distribution arrangements. In addition, the Board received information regarding the Portfolio’s asset levels, share purchase and redemption activity and the payment of Rule 12b-1 and/or other fees by applicable share classes of the Portfolio, among other information.
In considering the continuation of each of the Advisory Agreements, the Trustees reviewed and evaluated the information and factors they believed to reasonably be necessary and appropriate in light of legal advice furnished to them by independent legal counsel to the Independent Trustees and through the exercise of their own business judgment. Although individual Trustees may have weighed certain factors or information differently and the Board did not consider any single factor or information controlling in reaching its decision, the factors considered by the Board are summarized in more detail below and include, among other factors: (i) the nature, extent and quality of the services provided to the Portfolio by New York Life Investments, NYL Investors and WMC; (ii) the qualifications of the portfolio managers of the Portfolio and the historical investment performance of the Portfolio, New York Life Investments, NYL Investors and WMC; (iii) the costs of the services provided, and profits realized, by New York Life Investments, NYL Investors and WMC with respect to their relationships with the Portfolio; (iv) the extent to which economies of scale have been realized or may be realized if the Portfolio grows and the extent to which any economies of scale have been shared, have benefited or may benefit the Portfolio’s shareholders; and (v) the reasonableness of the Portfolio’s management and subadvisory fees and total ordinary operating expenses. Although the Board recognized that comparisons between the Portfolio’s fees and expenses and those of other funds are imprecise given different terms of agreements, variations in fund strategies and other factors, the Board considered the reasonableness of the Portfolio’s management fee and total ordinary operating expenses as compared to the peer funds identified by ISS. Throughout their considerations, the Trustees acknowledged the commitment of New York Life Investments and its affiliates to serve the MainStay Group of Funds, as well as their capacity, experience, resources, financial stability and reputations. The Trustees also acknowledged the entrepreneurial and other risks assumed by New York Life Investments in sponsoring and managing the Portfolio. With respect to the Subadvisory Agreements, the Board took into account New York Life Investments’ recommendation to approve the continuation of the Subadvisory Agreements.
Board Consideration and Approval of Management Agreement and Subadvisory Agreements (Unaudited) (continued)
The Trustees noted that, throughout the year, the Trustees are afforded an opportunity to ask questions of, and request additional information or materials from, New York Life Investments, NYL Investors and WMC. The Board’s decision with respect to each of the Advisory Agreements may have also been based, in part, on the Board’s knowledge of New York Life Investments, NYL Investors and WMC resulting from, among other things, the Board’s consideration of each of the Advisory Agreements in prior years, the advisory agreements for other funds in the MainStay Group of Funds, the Board’s review throughout the year of the performance and operations of other funds in the MainStay Group of Funds and each Trustee’s business judgment and industry experience. In addition to considering the above-referenced factors, the Board observed that in the marketplace, notably under variable life insurance policies and variable annuity contracts for which the Portfolio serves as an investment option, there are a range of investment options available to investors and that the Portfolio’s shareholders, having had the opportunity to consider other investment options, have chosen to invest in the Portfolio.
The factors that figured prominently in the Board’s decision to approve the continuation of each of the Advisory Agreements during its December 6–7, 2022 meeting are summarized in more detail below.
Nature, Extent and Quality of Services Provided by New York Life Investments, NYL Investors and WMC
The Board examined the nature, extent and quality of the services that New York Life Investments provides to the Portfolio. The Board evaluated New York Life Investments’ experience and capabilities in serving as manager of the Portfolio and considered that the Portfolio operates in a “manager-of-managers” structure. The Board also considered New York Life Investments’ responsibilities and services provided pursuant to this structure, including overseeing the services provided by NYL Investors and WMC, evaluating the performance of NYL Investors and WMC, making recommendations to the Board as to whether the Subadvisory Agreements should be renewed, modified or terminated and periodically reporting to the Board regarding the results of New York Life Investments’ evaluation and monitoring functions. The Board noted that New York Life Investments manages other mutual funds, serves a variety of other investment advisory clients, including other pooled investment vehicles, and has experience overseeing mutual fund service providers, including subadvisors. The Board considered the experience of senior personnel at New York Life Investments providing management and administrative and other non-advisory services to the Portfolio. The Board observed that New York Life Investments devotes significant resources and time to providing management and administrative and other non-advisory services to the Portfolio, including New York Life Investments’ oversight and due diligence reviews of NYL Investors and WMC and ongoing analysis of, and interactions with, NYL Investors and WMC with respect to, among other things, the Portfolio’s investment performance and risks as well as NYL Investors’ and WMC’s investment capabilities and subadvisory services with respect to the Portfolio.
The Board also considered the range of services that New York Life Investments provides to the Portfolio under the terms of the Management Agreement, including: (i) fund accounting and ongoing supervisory services provided by New York Life Investments’ Fund Administration and Accounting Group; (ii) investment supervisory and analytical services provided by New York Life Investments’ Investment Consulting Group; (iii) compliance services provided by the Trust’s Chief Compliance Officer as well as New York Life Investments’ compliance department, including supervision and implementation of the Portfolio’s compliance program; (iv) legal services provided by New York Life Investments’ Office of the General Counsel; and (v) risk management monitoring and analysis by compliance and investment personnel. In addition, the Board considered New York Life Investments’ willingness to invest in personnel and other resources, such as cyber security, information security and business continuity planning, designed to benefit the Portfolio and noted that New York Life Investments is responsible for compensating the Trust’s officers, except for a portion of the salary of the Trust’s Chief Compliance Officer. The Board recognized that New York Life Investments provides certain other non-advisory services to the Portfolio and has provided an increasingly broad array of non-advisory services to the MainStay Group of Funds as a result of regulatory and other developments, including in connection with the implementation of the MainStay Group of Funds’ derivatives risk management program and policies and procedures adopted pursuant to Rule 18f-4 under the 1940 Act.
The Board also examined the range, and the nature, extent and quality, of the investment advisory services that NYL Investors and WMC provide to the Portfolio and considered the terms of each of the Advisory Agreements. The Board evaluated NYL Investors’ and WMC’s experience and performance in serving as subadvisors to the Portfolio and advising other portfolios and NYL Investors’ and WMC’s track record and experience in providing investment advisory services, the experience of investment advisory, senior management and administrative personnel at NYL Investors and WMC. The Board considered New York Life Investments’, NYL Investors’ and WMC’s overall resources, legal and compliance environment, capabilities, reputation, financial condition and history. In addition to information provided in connection with quarterly meetings with the Trust’s Chief Compliance Officer, the Board considered information regarding the compliance policies and procedures of New York Life Investments, NYL Investors and WMC and acknowledged their commitment to further developing and strengthening compliance programs relating to the Portfolio. The Board also considered NYL Investors’ and WMC’s ability to recruit and retain qualified investment professionals and willingness to invest in personnel and other resources to service and support the Portfolio. In this regard, the Board considered the qualifications and experience of the Portfolio’s portfolio managers, the number of accounts managed by the portfolio managers and the method for compensating the portfolio managers.
In addition, the Board considered information provided by New York Life Investments, NYL Investors and WMC regarding the operations of their respective business continuity plans in response to the COVID-19 pandemic and the continued remote work environment.
| 34 | MainStay VP Balanced Portfolio |
Based on these considerations, among others, the Board concluded that the Portfolio would likely continue to benefit from the nature, extent and quality of these services.
Investment Performance
In evaluating the Portfolio’s investment performance, the Board considered investment performance results over various periods in light of the Portfolio’s investment objective, strategies and risks. The Board considered investment reports on, and analysis of, the Portfolio’s performance provided to the Board throughout the year. These reports include, among other items, information on the Portfolio’s gross and net returns, the Portfolio’s investment performance compared to a relevant investment category and the Portfolio’s benchmarks, the Portfolio’s risk-adjusted investment performance and the Portfolio’s investment performance as compared to peer funds, as appropriate, as well as portfolio attribution information and commentary on the effect of market conditions. The Board also considered information provided by ISS showing the investment performance of the Portfolio as compared to peer funds. In addition, the Board reviewed the methodology used by ISS to construct the group of peer funds for comparative purposes.
The Board also took into account its discussions with senior management at New York Life Investments concerning the Portfolio’s investment performance over various periods as well as discussions between the Portfolio’s portfolio management team and the members of the Board’s Investment Committee, which generally occur on an annual basis. In addition, the Board considered any specific actions that New York Life Investments, NYL Investors or WMC had taken, or had agreed to take, to seek to enhance Portfolio investment performance and the results of those actions.
Based on these considerations, among others, the Board concluded that its review of the Portfolio’s investment performance and related information supported a determination to approve the continuation of each of the Advisory Agreements.
Costs of the Services Provided, and Profits and Other Benefits Realized, by New York Life Investments, NYL Investors and WMC
The Board considered the costs of the services provided under each of the Advisory Agreements. The Board also considered the profits realized by New York Life Investments and its affiliates, including NYL Investors, and WMC due to their relationships with the Portfolio as well as by New York Life Investments and its affiliates, including NYL Investors, due to their relationships with the MainStay Group of Funds. Because NYL Investors is an affiliate of New York Life Investments whose subadvisory fee is paid by New York Life Investments, not the Portfolio, the Board considered cost and profitability information for New York Life Investments and NYL Investors in the aggregate. The Board considered information from New York Life Investments that WMC’s subadvisory fee reflected an arm’s-length negotiation and that this fee is paid by New York Life Investments, not the Portfolio, and the relevance of WMC’s profitability
was considered by the Trustees in that context. On this basis, the Board primarily considered the costs and profitability for New York Life Investments and its affiliates with respect to the Portfolio.
In addition, the Board acknowledged the difficulty in obtaining reliable comparative data about mutual fund managers’ profitability because such information generally is not publicly available and may be impacted by numerous factors, including the structure of a fund manager’s organization, the types of funds it manages, the methodology used to allocate certain fixed costs to specific funds and the manager’s capital structure and costs of capital.
In evaluating the costs of the services provided by New York Life Investments, NYL Investors and WMC and profits realized by New York Life Investments and its affiliates, including NYL Investors, and WMC, the Board considered, among other factors, New York Life Investments’ and its affiliates’, including NYL Investors’, and WMC’s continuing investments in, or willingness to invest in, personnel and other resources to support and further enhance the management of the Portfolio, and that New York Life Investments is responsible for paying the subadvisory fees for the Portfolio. The Board also considered the financial resources of New York Life Investments, NYL Investors and WMC and acknowledged that New York Life Investments, NYL Investors and WMC must be in a position to recruit and retain experienced professional personnel and to maintain a strong financial position for New York Life Investments, NYL Investors and WMC to continue to provide high-quality services to the Portfolio. The Board recognized that the Portfolio benefits from the allocation of certain fixed costs among the funds in the MainStay Group of Funds, among other expected benefits resulting from its relationship with New York Life Investments.
The Board considered information regarding New York Life Investments’ methodology for calculating profitability and allocating costs provided by New York Life Investments in connection with the fund profitability analysis presented to the Board. The Board noted it had previously engaged an independent consultant to review the methods used to allocate costs among the funds in the MainStay Group of Funds. The Board also noted that the independent consultant had concluded that New York Life Investments’ methods for allocating costs and procedures for estimating overall profitability of the relationship with the funds in the MainStay Group of Funds are reasonable and that New York Life Investments continued to use the same method of calculating profit and allocating costs since the independent consultant’s review. The Board recognized the difficulty in calculating and evaluating a manager’s profitability with respect to the Portfolio and considered that other profitability methodologies may also be reasonable.
The Board also considered certain fall-out benefits that may be realized by New York Life Investments and its affiliates due to their relationships with the Portfolio, including reputational and other indirect benefits. The Board recognized, for example, the benefits to WMC from legally permitted “soft-dollar” arrangements by which brokers provide research and other services to WMC in exchange for commissions paid by the Portfolio with respect to trades in the Portfolio’s portfolio securities. In this
Board Consideration and Approval of Management Agreement and Subadvisory Agreements (Unaudited) (continued)
regard, the Board also requested and considered information from New York Life Investments concerning other material business relationships between WMC and its affiliates and New York Life Investments and its affiliates and considered the existence of a strategic partnership between New York Life Investments and WMC that relates to certain current and future products and represents a potential conflict of interest associated with New York Life Investments’ recommendation to approve the Subadvisory Agreement. In addition, the Board considered its review of the management agreement for a money market fund advised by New York Life Investments and an affiliated subadvisor that serves as an investment option for the Portfolio, including the potential rationale for and costs associated with investments in this money market fund by the Portfolio, if any, and considered information from New York Life Investments that the nature and type of specific investment advisory services provided to this money market fund are distinct from, or in addition to, the investment advisory services provided to the Portfolio. In addition, the Board considered the potential dividend received tax deduction for insurance company affiliates of New York Life Investments from the Portfolio’s securities lending activity.
The Board noted that the Portfolio serves as an investment option primarily under variable contracts issued by affiliates of New York Life Investments that would receive fees under those contracts. The Board observed that, in addition to fees earned by New York Life Investments under the Management Agreement for managing the Portfolio, New York Life Investments’ affiliates also earn revenues from serving the Portfolio in various other capacities, including as the Portfolio’s distributor. The Board considered information about these other revenues and their impact on the profitability of the relationship with the Portfolio to New York Life Investments and its affiliates. The Board noted that, although it assessed the overall profitability of the relationship with the Portfolio to New York Life Investments and its affiliates as part of the contract review process, when considering the reasonableness of the fee paid to New York Life Investments under the Management Agreement, the Board considered the profitability of New York Life Investments’ relationship with the Portfolio on a pre-tax basis and without regard to distribution expenses incurred by New York Life Investments from its own resources.
After evaluating the information deemed relevant by the Trustees, the Board concluded that any profits realized by New York Life Investments and its affiliates, including NYL Investors, due to their relationships with the Portfolio were not excessive and other benefits that may accrue to New York Life Investments and its affiliates, including NYL Investors, are reasonable and benefits that may accrue to WMC and its affiliates are consistent with those expected for a subadvisor to a mutual fund. With respect to WMC, the Board considered that any profits realized by WMC due to its relationship with the Portfolio are the result of arm’s-length negotiations between New York Life Investments and WMC, acknowledging that any such profits are based on the subadvisory fee paid to WMC by New York Life Investments, not the Portfolio.
Management and Subadvisory Fees and Total Ordinary Operating Expenses
The Board evaluated the reasonableness of the fee paid under each of the Advisory Agreements and the Portfolio’s total ordinary operating expenses. The Board primarily considered the reasonableness of the management fee paid by the Portfolio to New York Life Investments because the subadvisory fees paid to NYL Investors and WMC are paid by New York Life Investments, not the Portfolio. The Board also considered the reasonableness of the subadvisory fees paid by New York Life Investments and the amount of the management fee retained by New York Life Investments.
In assessing the reasonableness of the Portfolio’s fees and expenses, the Board primarily considered comparative data provided by ISS on the fees and expenses charged by similar mutual funds managed by other investment advisers. The Board reviewed the methodology used by ISS to construct the group of peer funds for comparative purposes. In addition, the Board considered information provided by New York Life Investments, NYL Investors and WMC on fees charged to other investment advisory clients, including institutional separate accounts and/or other funds that follow investment strategies similar to those of the Portfolio, if any. The Board considered the contractual management fee schedules of the Portfolio as compared to those of such other investment advisory clients, taking into account the rationale for any differences in fee schedules. The Board also took into account information provided by New York Life Investments about the more extensive scope of services provided to registered investment companies, such as the Portfolio, as compared with other investment advisory clients. Additionally, the Board considered the impact of contractual breakpoints on the Portfolio’s net management fee and expenses. The Board also considered that in proposing fees for the Portfolio, New York Life Investments considers the competitive marketplace for mutual funds.
Based on the factors outlined above, among other considerations, the Board concluded that the Portfolio’s management fee and total ordinary operating expenses are within a range that is competitive and support a conclusion that these fees and expenses are reasonable.
Economies of Scale
The Board considered information regarding economies of scale, including whether economies of scale may exist for the Portfolio and whether the Portfolio’s expense structure permits any economies of scale to be appropriately shared with the Portfolio’s beneficial shareholders. The Board also considered a report from New York Life Investments, previously prepared at the request of the Board, that addressed economies of scale, including with respect to the mutual fund business generally, and the various ways in which the benefits of economies of scale may be shared with the funds in the MainStay Group of Funds. Although the Board recognized the difficulty of determining economies of scale with precision, the Board acknowledged that economies of scale may be shared with the Portfolio in a number of ways, including, for example, through the imposition of fee breakpoints, initially setting
| 36 | MainStay VP Balanced Portfolio |
management fee rates at scale or making additional investments to enhance the services provided to the Portfolio. The Board reviewed information from New York Life Investments showing how the Portfolio’s management fee schedule compared to fee schedules of other funds and accounts managed by New York Life Investments. The Board also reviewed information from ISS showing how the Portfolio’s management fee schedule compared with fees paid for similar services by peer funds at varying asset levels.
Based on this information, the Board concluded that economies of scale are appropriately reflected for the benefit of the Portfolio’s beneficial shareholders through the Portfolio’s expense structure and other methods to share benefits from economies of scale.
Conclusion
On the basis of the information and factors summarized above, among other information and factors deemed relevant by the Trustees, and the evaluation thereof, the Board unanimously voted to approve the continuation of each of the Advisory Agreements.
Proxy Voting Policies and Procedures and Proxy Voting Record
The Portfolio is required to file with the SEC its proxy voting record for the 12-month period ending June 30 on Form N-PX. A description of the policies and procedures that are used to vote proxies relating to portfolio securities of the Portfolio is available free of charge upon request by calling 800-598-2019 or visiting the SEC's website at www.sec.gov. The most recent Form N-PX or proxy voting record is available free of charge upon request by calling 800-598-2019; visiting https://www.newyorklifeinvestments.com/investment-products/vp; or visiting the SEC’s website at www.sec.gov.
Shareholder Reports and Quarterly Portfolio Disclosure
The Portfolio is required to file its complete schedule of portfolio holdings with the SEC 60 days after its first and third fiscal quarter on Form N-PORT. The Portfolio's holdings report is available free of charge upon request by calling 800-598-2019 or by visiting the SEC’s website at www.sec.gov.
| 38 | MainStay VP Balanced Portfolio |
Board of Trustees and Officers (Unaudited)
The Trustees and officers of the Portfolio are listed below. The Board oversees the MainStay Group of Funds (which consists of MainStay Funds and MainStay Funds Trust), MainStay VP Funds Trust, MainStay MacKay DefinedTerm Municipal Opportunities Fund, MainStay CBRE Global Infrastructure Megatrends Fund, the Manager and the Subadvisors, and elects the officers of the Portfolios who are responsible for the day-to-day operations of the Portfolio. Information pertaining to the Trustees and officers is set forth below. Each Trustee serves until his or her successor
is elected and qualified or until his or her resignation, death or removal. Under the Board’s retirement policy, unless an exception is made, a Trustee must tender his or her resignation by the end of the calendar year during which he or she reaches the age of 75. The business address of each Trustee and officer listed below is 51 Madison Avenue, New York, New York 10010. None of the Trustees are “interested persons” (as defined by the 1940 Act and rules adopted by the SEC thereunder) of the Portfolio (“Independent Trustees”).
| | Name and
Year of Birth | Term of Office,
Position(s) Held and
Length of Service | Principal Occupation(s)
During Past Five Years | Number of
Portfolios in
Fund Complex
Overseen by
Trustee | Other Directorships
Held by Trustee |
| | | | | | |
| | David H. Chow
1957 | MainStay VP Funds Trust: Trustee since January 2016, Advisory Board Member (June 2015 to December 2015) | Founder and CEO, DanCourt Management, LLC since 1999 | 78 | MainStay Funds: Trustee since January 2016, Advisory Board Member (June 2015 to December 2015) (12 Funds);
MainStay Funds Trust: Trustee since January 2016, Advisory Board Member (June 2015 to December 2015) (33 Funds);
MainStay MacKay DefinedTerm Municipal Opportunities Fund: Trustee since January 2016, Advisory Board Member (June 2015 to December 2015);
MainStay CBRE Global Infrastructure Megatrends Fund: Trustee since June 2021;VanEck Vectors Group of Exchange-Traded Funds: Independent Chairman of the Board of Trustees since 2008 and Trustee since 2006 (57 portfolios); and Berea College of Kentucky: Trustee since 2009, Chair of the Committee since 2018 |
| | Susan B. Kerley
1951 | MainStay VP Funds Trust: Chairman since 2017 and Trustee since 2007* | President, Strategic Management Advisors LLC since 1990 | 78 | MainStay Funds: Chairman since 2017 and Trustee since 2007 (12 Funds); MainStay Funds Trust: Chairman since 2017 and Trustee since 1990 (33 Funds)**;
MainStay MacKay DefinedTerm Municipal Opportunities Fund: Chairman since 2017 and Trustee since 2011; MainStay CBRE Global Infrastructure Megatrends Fund: Trustee since June 2021; and Legg Mason Partners Funds: Trustee since 1991 (45 portfolios) |
| | Alan R. Latshaw
1951 | MainStay VP Funds Trust: Trustee since 2007* | Retired; Partner, Ernst & Young LLP (2002 to 2003); Partner, Arthur Andersen LLP (1989 to 2002); Consultant to the MainStay Funds Audit and Compliance Committee (2004 to 2006) | 78 | MainStay Funds: Trustee since 2006 (12 Funds);
MainStay Funds Trust: Trustee since 2007 (33 Funds)**;
MainStay MacKay DefinedTerm Municipal Opportunities Fund: Trustee since 2011; and
MainStay CBRE Global Infrastructure Megatrends Fund: Trustee since June 2021 |
Board of Trustees and Officers (Unaudited) (continued)
| | Name and
Year of Birth | Term of Office,
Position(s) Held and
Length of Service | Principal Occupation(s)
During Past Five Years | Number of
Portfolios in
Fund Complex
Overseen by
Trustee | Other Directorships
Held by Trustee |
| | | | | | |
| | Karen Hammond
1956 | MainStay VP Funds Trust: Trustee since December 2021, Advisory Board Member (June 2021 to December 2021)
| Retired, Managing Director, Devonshire Investors (2007 to 2013); Senior Vice President, Fidelity Management & Research Co. (2005 to 2007); Senior Vice President and Corporate Treasurer, FMR Corp. (2003 to 2005); Chief Operating Officer, Fidelity Investments Japan (2001 to 2003) | 78 | MainStay Funds: Trustee since December 2021, Advisory Board Member (June 2021 to December 2021) (12 Funds);
MainStay Funds Trust: Trustee since December 2021, Advisory Board Member (June 2021 to December 2021) (33 Funds);
MainStay MacKay DefinedTerm Municipal Opportunities Fund: Trustee since December 2021, Advisory Board Member (June 2021 to December 2021);
MainStay CBRE Global Infrastructure Megatrends Fund: Trustee since December 2021, Advisory Board Member (June 2021 to December 2021);
Two Harbors Investment Corp.: Director since 2018; Rhode Island State Investment Commission: Member since 2017; and Blue Cross Blue Shield of Rhode Island: Director since 2019
|
| | Jacques P. Perold
1958 | MainStay VP Funds Trust: Trustee since January 2016, Advisory Board Member (June 2015 to December 2015) | Founder and Chief Executive Officer, CapShift Advisors LLC (since 2018); President, Fidelity Management & Research Company (2009 to 2014); President and Chief Investment Officer, Geode Capital Management, LLC (2001 to 2009) | 78 | MainStay Funds: Trustee since January 2016, Advisory Board Member (June 2015 to December 2015) (12 Funds);
MainStay Funds Trust: Trustee since January 2016, Advisory Board Member (June 2015 to December 2015) (33 Funds); MainStay MacKay DefinedTerm Municipal Opportunities Fund: Trustee since January 2016, Advisory Board Member (June 2015 to December 2015);
MainStay CBRE Global Infrastructure Megatrends Fund: Trustee since June 2021; Allstate Corporation: Director since 2015;
Partners in Health: Trustee since 2019; and
MSCI Inc.: Director since 2017 |
| | Richard S. Trutanic
1952 | MainStay VP Funds Trust: Trustee since 2007* | Chairman and Chief Executive Officer, Somerset & Company (financial advisory firm) since 2004; Managing Director, The Carlyle Group (private investment firm) (2002 to 2004); Senior Managing Director, Partner and Board Member, Groupe Arnault S.A. (private investment firm) (1999 to 2002)
| 78 | MainStay Funds: Trustee since 1994 (12 Funds);
MainStay Funds Trust: Trustee since 2007 (33 Funds)**;
MainStay MacKay DefinedTerm Municipal Opportunities Fund: Trustee since 2011; and
MainStay CBRE Global Infrastructure Megatrends Fund: Trustee since June 2021 |
| * | Includes prior service as a Director of MainStay VP Series Fund, Inc., the predecessor to MainStay VP Funds Trust. |
| ** | Includes prior service as a Director/Trustee of certain predecessor entities to MainStay Funds Trust. |
| 40 | MainStay VP Balanced Portfolio |
| | Name and
Year of Birth | Position(s) Held and
Length of Service | Principal Occupation(s)
During Past Five Years | |
| | | | | |
| | Kirk C. Lehneis
1974 | President, MainStay VP Funds Trust (since 2017) | Chief Operating Officer and Senior Managing Director (since 2016), New York Life Investment Management LLC and New York Life Investment Management Holdings LLC; Member of the Board of Managers (since 2017) and Senior Managing Director (since 2018), NYLIFE Distributors LLC; Chairman of the Board and Senior Managing Director, NYLIM Service Company LLC (since 2017); Trustee, President and Principal Executive Officer of IndexIQ Trust, IndexIQ ETF Trust and IndexIQ Active ETF Trust (since January 2018); President, MainStay CBRE Global Infrastructure Megatrends Fund (since 2021), MainStay MacKay DefinedTerm Municipal Opportunities Fund, MainStay Funds and MainStay Funds Trust (since 2017); Senior Managing Director, Global Product Development (from 2015-2016); Managing Director, Product Development (from 2010-2015), New York Life Investment Management LLC | |
| | Jack R. Benintende
1964 | Treasurer and Principal Financial and Accounting Officer, MainStay VP Funds Trust (since 2007)** | Managing Director, New York Life Investment Management LLC (since 2007); Treasurer and Principal Financial and Accounting Officer, MainStay CBRE Global Infrastructure Megatrends Fund (since 2021), MainStay MacKay DefinedTerm Municipal Opportunities Fund (since 2011), MainStay Funds Trust (since 2009) and MainStay Funds (since 2007); and Assistant Treasurer, New York Life Investment Management Holdings LLC (2008 to 2012) | |
| | J. Kevin Gao
1967 | Secretary and Chief Legal Officer, MainStay VP Funds Trust (since 2010)** | Managing Director and Associate General Counsel, New York Life Investment Management LLC (since 2010); Secretary and Chief Legal Officer, MainStay CBRE Global Infrastructure Megatrends Fund (since 2021), MainStay MacKay DefinedTerm Municipal Opportunities Fund (since 2011), MainStay Funds and MainStay Funds Trust (since 2010) | |
| | Scott T. Harrington
1959 | Vice President— Administration, MainStay VP Funds Trust (since 2005)** | Managing Director, New York Life Investment Management LLC (including predecessor advisory organizations) (since 2000); Member of the Board of Directors, New York Life Trust Company (since 2009); Vice President—Administration, MainStay CBRE Global Infrastructure Megatrends Fund (since 2021), MainStay MacKay DefinedTerm Municipal Opportunities Fund (since 2011), MainStay Funds Trust and MainStay Funds (since 2009) | |
| | Kevin M. Gleason
1967 | Vice President and Chief Compliance Officer, MainStay VP Funds Trust (since June 2022) | Vice President and Chief Compliance Officer, IndexIQ, IndexIQ ETF Trust and Index IQ Active ETF Trust (since June 2022); Vice President and Chief Compliance Officer, MainStay CBRE Global Infrastructure Megatrends Fund, MainStay MacKay DefinedTerm Municipal Opportunities Fund (since June 2022); MainStay Funds Trust and MainStay Funds (since June 2022); Senior Vice President, Voya Investment Management and Chief Compliance Officer, Voya Family of Funds (2012-2022) | |
| * | The officers listed above are considered to be “interested persons” of the MainStay Group of Funds, MainStay VP Funds Trust, MainStay CBRE Global Infrastructure Megatrends Fund and MainStay MacKay DefinedTerm Municipal Opportunities Fund within the meaning of the 1940 Act because of their affiliation with the MainStay Group of Funds, New York Life Insurance Company and/or its affiliates, including New York Life Investment Management LLC, NYLIM Service Company LLC, NYLIFE Securities LLC and/or NYLIFE Distributors LLC, as described in detail in the column captioned “Principal Occupation(s) During Past Five Years.” Officers are elected annually by the Board. |
| ** | Includes prior service as an Officer of MainStay VP Series Fund, Inc., the predecessor to MainStay VP Funds Trust. |
Officers of the Trust (Who are not Trustees)*
This page intentionally left blank
MainStay VP Portfolios
MainStay VP offers a wide range of Portfolios. The full array of MainStay VP offerings is listed here, with information about the manager, subadvisors, legal counsel, and independent registered public accounting firm.
Equity
MainStay VP American Century Sustainable Equity Portfolio1
MainStay VP Candriam Emerging Markets Equity Portfolio
MainStay VP Epoch U.S. Equity Yield Portfolio
MainStay VP Fidelity Institutional AM® Utilities Portfolio†
MainStay VP MacKay International Equity Portfolio
MainStay VP Natural Resources Portfolio
MainStay VP S&P 500 Index Portfolio2
MainStay VP Small Cap Growth Portfolio
MainStay VP Wellington Growth Portfolio
MainStay VP Wellington Mid Cap Portfolio
MainStay VP Wellington Small Cap Portfolio
MainStay VP Wellington U.S. Equity Portfolio
MainStay VP Winslow Large Cap Growth Portfolio
Mixed Asset
MainStay VP Balanced Portfolio
MainStay VP Income Builder Portfolio
MainStay VP Janus Henderson Balanced Portfolio
MainStay VP MacKay Convertible Portfolio
Income
MainStay VP Bond Portfolio
MainStay VP Floating Rate Portfolio
MainStay VP Indexed Bond Portfolio
MainStay VP MacKay Government Portfolio
MainStay VP MacKay High Yield Corporate Bond Portfolio
MainStay VP MacKay Strategic Bond Portfolio
MainStay VP PIMCO Real Return Portfolio
Money Market
MainStay VP U.S. Government Money Market Portfolio
Alternative
MainStay VP CBRE Global Infrastructure Portfolio
MainStay VP IQ Hedge Multi-Strategy Portfolio
Asset Allocation
MainStay VP Conservative Allocation Portfolio
MainStay VP Equity Allocation Portfolio
MainStay VP Growth Allocation Portfolio
MainStay VP Moderate Allocation Portfolio
Manager
New York Life Investment Management LLC
New York, New York
Subadvisors
American Century Investment Management, Inc.
Kansas City, Missouri
Brown Advisory LLC
Baltimore, Maryland
Candriam*
Strassen, Luxembourg
CBRE Investment Management Listed Real Assets LLC
Radnor, Pennsylvania
Epoch Investment Partners, Inc.
New York, New York
FIAM LLC
Smithfield, Rhode Island
IndexIQ Advisors LLC*
New York, New York
Janus Henderson Investors US LLC
Denver, Colorado
MacKay Shields LLC*
New York, New York
Newton Investment Management North America, LLC
Boston, Massachusetts
NYL Investors LLC*
New York, New York
Pacific Investment Management Company LLC
Newport Beach, California
Segall Bryant & Hamill, LLC
Chicago, Illinois
Wellington Management Company LLP
Boston, Massachusetts
Winslow Capital Management, LLC
Minneapolis, Minnesota
Legal Counsel
Dechert LLP
Washington, District of Columbia
Independent Registered Public Accounting Firm
PricewaterhouseCoopers LLP
New York, New York
Distributor
NYLIFE Distributors LLC*
Jersey City, New Jersey
Custodian
JPMorgan Chase Bank, N.A.
New York, New York
Some Portfolios may not be available in all products.
† Fidelity Institutional AM is a registered trade mark of FMR LLC. Used with permission.
* An affiliate of New York Life Investment Management LLC.
| 1. | Prior to May 1, 2022, the Portfolio's name was MainStay VP T. Rowe Price Equity Income Portfolio. |
| 2. | Prior to May 1, 2022, the Portfolio's name was MainStay VP MacKay S&P 500 Index Portfolio. |
Not part of the Annual Report
2022 Annual Report
This report is for the general information of New York Life Variable Annuities and NYLIAC Variable Universal Life Insurance Products policyowners. It must be preceded or accompanied by the appropriate product(s) and funds prospectuses if it is given to anyone who is not an owner of a New York Life variable annuity policy or a NYLIAC Variable Universal Life Insurance Product. This report does not offer for sale or solicit orders to purchase securities.
The performance data quoted in this report represents past performance. Past performance is no guarantee of future results. Due to market volatility and other factors, current performance may be lower or higher than the figures shown. The most recent month-end performance summary for your variable annuity or variable life policy is available by calling 800-598-2019 and is updated periodically on newyorklife.com.
The New York Life Variable Annuities and NYLIAC Variable Universal Life Insurance Products are issued by New York Life Insurance and Annuity Corporation (a Delaware Corporation) and distributed by NYLIFE Distributors LLC (Member FINRA/SIPC).
New York Life Insurance Company
New York Life Insurance and Annuity
Corporation (NYLIAC) (A Delaware Corporation)
51 Madison Avenue, Room 551
New York, NY 10010
newyorklife.com
newyorklifeinvestments.com
NYLIFE Distributors LLC, 30 Hudson Street, Jersey City, NJ 07302
New York Life Investment Management LLC is the investment manager to the MainStay VP Funds Trust
©2023 by NYLIFE Distributors LLC. All rights reserved.
You may obtain copies of the Prospectus and the Statement of Additional Information free of charge, upon request, by calling toll-free 800-598-2019 or writing to New York Life Insurance and Annuity Corporation, 51 Madison Avenue, New York, NY 10010.
| Not FDIC Insured | No Bank Guarantee | May Lose Value |
(NYLIAC) NI508
MainStay VP Bond Portfolio
Message from the President and Annual Report
December 31, 2022
Sign up for e-delivery of your shareholder reports. For full details on e-delivery, including who can participate and what you can receive via e-delivery,
please log in to newyorklifeinvestments.com/accounts.
| Not FDIC/NCUA Insured | Not a Deposit | May Lose Value | No Bank Guarantee | Not Insured by Any Government Agency |
This page intentionally left blank
Message from the President
The 12-month reporting period ended December 31, 2022, proved exceptionally challenging for investors as both stock and bond markets suffered steep declines. A variety of economic and geopolitical forces drove the market’s losses, all centered around rising inflation and monetary efforts to rein it in.
Inflationary alarms began to sound well before the reporting period began. In late 2021, after nearly two years of accommodative policies designed to encourage economic growth in the face of the COVID-19 pandemic, the U.S. Federal Reserve (the “Fed”) warned of the increasing need to tighten monetary policy. Nevertheless, the pace and persistence of inflation in early 2022 caught most market participants—the Fed included—off guard. Russia’s invasion of Ukraine in February exacerbated global inflationary pressures while increasing investor uncertainty. Domestic supply shortages, international trade imbalances and rising inflation caused U.S. GDP (gross domestic product) to contract in the first and second quarters of the year, although employment and consumer spending proved resilient. Prices for petroleum surged to multi-year highs, while many key agricultural chemicals and industrial metals soared as well. Accelerating inflationary forces prompted the Fed to implement its most aggressive series of interest rate hikes since the 1980s, with a 0.25% increase in March followed by six further rate increases totaling 4.25%. International central banks generally followed suit and raised rates by varying degrees in efforts to curb local inflation, although most increases remained significantly more modest than those in the United States. Relatively high U.S. interest rates and an international risk averse sentiment pushed U.S. dollar values higher compared to most other currencies, with negative impacts on global prices for food, fuel and other key U.S.-dollar-denominated products.
The effects of these interrelated challenges were felt throughout U.S. and international financial markets. The S&P 500® Index, a widely regarded benchmark of market performance, declined by more than 18% during the reporting period. Although the energy sector generated strong gains, bolstered by elevated oil and gas prices, most other industry segments recorded losses. The more cyclical and growth-oriented sectors of consumer discretionary, information technology and real estate delivered the weakest returns, while the traditionally defensive and value-oriented
consumer staples, utilities and health care sectors outperformed. On average, international developed-country equity markets mildly outperformed their U.S. counterparts, while emerging markets lagged slightly. Fixed-income markets proved unusually volatile, with bond prices trending sharply lower as yields rose along with interest rates. Short-term yields rose faster than long-term yields, producing a yield curve inversion from July through the end of the reporting period as long-term rates remained below short-term rates. While floating-rate instruments, which feature variable interest rates that allow investors to benefit from a rising rate environment, provided a degree of insulation from inflation-driven trends, they were not immune to the market’s widespread declines.
Although, according to the most recent estimates, the annualized inflation rate in the United States has declined from a peak of 9.1% in July 2022 to 6.5% in December, the Fed remains focused on achieving more substantial and lasting reductions, aiming for a target rate of 2%. As a result, further rate hikes and additional market volatility are potential headwinds in the coming months. The question remains as to whether the Fed and other central banks will manage a so-called “soft landing,” curbing inflation while avoiding a persistent economic slowdown. If they prove successful, we believe that the increasingly attractive valuations we have observed in both equity and bond markets should eventually translate into sustainable improvements in the investment environment.
Whatever actions the Fed takes and however financial markets react, as a MainStay VP investor you can depend on us to continue managing our portfolios with the insight, expertise and level of service that have long defined New York Life Investments. Thank you for trusting us to help you meet your investment needs.
Sincerely,
Kirk C. Lehneis
President
The opinions expressed are as of the date of this report and are subject to change. There is no guarantee that any forecast made will come to pass. This material does not constitute investment advice and is not intended as an endorsement of any specific investment. Past performance is no guarantee of future results.
Not part of the Annual Report
Investors should refer to the Portfolio’s Summary Prospectus and/or Prospectus and consider the Portfolio’s investment objectives, strategies, risks, charges and expenses carefully before investing. The Summary Prospectus and/or Prospectus contain this and other information about the Portfolio. You may obtain copies of the Portfolio’s Summary Prospectus, Prospectus and Statement of Additional Information, which includes information about the MainStay VP Funds Trust's Trustees, free of charge, upon request, by calling toll-free 800-598-2019, by writing to New York Life Insurance and Annuity Corporation, 51 Madison Avenue, Room 251, New York, New York 10010 or by sending an email to MainStayShareholdersServices@nylim.com. These documents are also available at newyorklifeinvestments.com/investment-products/vp. Please read the Portfolio's Summary Prospectus and/or Prospectus carefully before investing. MainStay VP Funds Trust portfolios are separate account options which are purchased through a variable insurance or variable annuity contract.
Investment and Performance Comparison (Unaudited)
Performance data quoted represents past performance. Past performance is no guarantee of future results. Because of market volatility and other factors, current performance may be lower or higher than the figures shown. Investment return and principal value will fluctuate, and as a result, when shares are redeemed, they may be worth more or less than their original cost. The performance table and graph do not reflect any deduction of sales charges, mortality and expense charges, contract charges or administrative charges. Please refer to the Performance Summary appropriate for your policy. For performance information current to the most recent month-end, please call 800-598-2019 or visit www.newyorklife.com.
Performance figures may reflect certain fee waivers and/or expense limitations, without which total returns may have been different. For information on current fee waivers and/or expense limitations (if any), please refer to the Notes to Financial Statements.
| Average Annual Total Returns for the Year-Ended December 31, 2022 |
| Class | Inception
Date | One
Year | Five
Years | Ten
Years | Gross
Expense
Ratio1 |
| Initial Class Shares | 1/23/1984 | -14.47% | -0.33% | 0.97% | 0.53% |
| Service Class Shares | 6/4/2003 | -14.68 | -0.58 | 0.72 | 0.78 |
| 1. | The gross expense ratios presented reflect the Portfolio’s “Total Annual Portfolio Operating Expenses” from the most recent Prospectus and may differ from other expense ratios disclosed in this report. |
| Benchmark Performance* | One
Year | Five
Years | Ten
Years |
| Bloomberg U.S. Aggregate Bond Index1 | -13.01% | 0.02% | 1.06% |
| Morningstar Intermediate Core Bond Category Average2 | -13.34 | -0.23 | 0.91 |
| * | Returns for indices reflect no deductions for fees, expenses or taxes, except for foreign withholding taxes where applicable. Results assume reinvestment of all dividends and capital gains. An investment cannot be made directly in an index. |
| 1. | The Bloomberg U.S. Aggregate Bond Index is the Portfolio's primary benchmark. The Bloomberg U.S. Aggregate Bond Index is a broad-based benchmark that measures the investment grade, U.S. dollar-denominated, fixed-rate taxable bond market, including Treasuries, government-related and corporate securities, mortgage-backed securities (agency fixed-rate and hybrid adjustable-rate mortgage pass-throughs), asset-backed securities and commercial mortgage-backed securities. |
| 2. | The Morningstar Intermediate Core Bond Category Average is representative of funds that invest primarily in investment-grade U.S. fixed-income issues including government, corporate, and securitized debt, and hold less than 5% in below-investment-grade exposures. Their durations (a measure of interest-rate sensitivity) typically range between 75% and 125% of the three-year average of the effective duration of the Morningstar Core Bond Index. Results are based on average total returns of similar funds with all dividends and capital gain distributions reinvested. |
Cost in Dollars of a $1,000 Investment in MainStay VP Bond Portfolio (Unaudited)
The example below is intended to describe the fees and expenses borne by shareholders during the six-month period from July 1, 2022 to December 31, 2022, and the impact of those costs on your investment.
Example
As a shareholder of the Portfolio you incur two types of costs: (1) transaction costs, including exchange fees and sales charges (loads) on purchases (as applicable), and (2) ongoing costs, including management fees, distribution and/or service (12b-1) fees and other Portfolio expenses (as applicable). This example is intended to help you understand your ongoing costs (in dollars) of investing in the Portfolio and to compare these costs with the ongoing costs of investing in other mutual funds. The example is based on an investment of $1,000 made at the beginning of the six-month period and held for the entire period from July 1, 2022 to December 31, 2022. Shares are only sold in connection with variable life and annuity contracts and the example does not reflect any contract level or transactional fees or expenses. If these costs had been included, your costs would have been higher.
This example illustrates your Portfolio’s ongoing costs in two ways:
Actual Expenses
The second and third data columns in the table below provide information about actual account values and actual expenses. You may use the information in these columns, together with the amount you invested, to estimate the expenses that you paid during the six months ended
December 31, 2022. Simply divide your account value by $1,000 (for example, an $8,600 account value divided by $1,000 = 8.6), then multiply the result by the number under the heading entitled “Expenses Paid During Period” to estimate the expenses you paid on your account during this period.
Hypothetical Example for Comparison Purposes
The fourth and fifth data columns in the table below provide information about hypothetical account values and hypothetical expenses based on the Portfolio’s actual expense ratio and an assumed rate of return of 5% per year before expenses, which is not the Portfolio’s actual return. The hypothetical account values and expenses may not be used to estimate the actual ending account balances or expenses you paid for the six-month period shown. You may use this information to compare the ongoing costs of investing in the Portfolio with the ongoing costs of investing in other mutual funds. To do so, compare this 5% hypothetical example with the 5% hypothetical examples that appear in the shareholder reports of the other mutual funds.
Please note that the expenses shown in the table are meant to highlight your ongoing costs only and do not reflect any transactional costs, such as exchange fees or sales charges (loads). Therefore, the fourth and fifth data columns of the table are useful in comparing ongoing costs only and will not help you determine the relative total costs of owning different funds. In addition, if these transactional costs were included, your costs would have been higher.
| Share Class | Beginning
Account
Value
7/1/22 | Ending Account
Value (Based
on Actual
Returns and
Expenses)
12/31/22 | Expenses
Paid
During
Period1 | Ending Account
Value (Based
on Hypothetical
5% Annualized
Return and
Actual Expenses)
12/31/22 | Expenses
Paid
During
Period1 | Net Expense
Ratio
During
Period2 |
| Initial Class Shares | $1,000.00 | $967.50 | $2.63 | $1,022.53 | $2.70 | 0.53% |
| Service Class Shares | $1,000.00 | $966.30 | $3.87 | $1,021.27 | $3.97 | 0.78% |
| 1. | Expenses are equal to the Portfolio’s annualized expense ratio of each class multiplied by the average account value over the period, divided by 365 and multiplied by 184 (to reflect the six-month period). The table above represents the actual expenses incurred during the six-month period. In addition to the fees and expenses which the Portfolio bears directly, it also indirectly bears a pro rata share of the fees and expenses of the underlying funds in which it invests. Such indirect expenses are not included in the above-reported expense figures. |
| 2. | Expenses are equal to the Portfolio's annualized expense ratio to reflect the six-month period. |
| 6 | MainStay VP Bond Portfolio |
Portfolio Composition as of December 31, 2022 (Unaudited)
See Portfolio of Investments beginning on page 10 for specific holdings within these categories. The Portfolio's holdings are subject to change.
Top Ten Holdings and/or Issuers Held as of December 31, 2022 (excluding short-term investments) (Unaudited)
| 1. | U.S. Treasury Notes, 3.875%-4.50%, due 11/30/24–11/15/32 |
| 2. | UMBS, 30 Year, 2.00%-7.50%, due 7/1/28–11/1/52 |
| 3. | UMBS Pool, 30 Year, 2.00%-5.50%, due 5/1/50–11/1/52 |
| 4. | GNMA II, Single Family, 30 Year, 2.00%-5.50%, due 8/20/48–1/15/53 |
| 5. | U.S. Treasury Bonds, 1.875%-4.00%, due 2/15/41–11/15/52 |
| 6. | UMBS, Single Family, 30 Year, 2.00%-4.50%, due 1/25/53 |
| 7. | JPMorgan Chase & Co., 1.578%-5.546%, due 12/15/25–7/25/33 |
| 8. | FHLMC, Multifamily Structured Pass-Through Certificates, 0.931%-3.71%, due 3/25/30–9/25/32 |
| 9. | UMBS, 20 Year, 2.00%-2.50%, due 2/1/42–5/1/42 |
| 10. | FHLB, 4.00%, due 5/26/27–4/21/32 |
Portfolio Management Discussion and Analysis (Unaudited)
Answers to the questions reflect the views of Kenneth Sommer and AJ Rzad, CFA, of NYL Investors LLC, the Portfolio’s Subadvisor.
How did MainStay VP Bond Portfolio perform relative to its benchmark and peers during the 12 months ended December 31, 2022?
For the 12 months ended December 31, 2022, MainStay VP Bond Portfolio returned −14.47% for Initial Class shares and −14.68% for Service Class shares. Over the same period, both share classes underperformed, the −13.01% return of the Bloomberg U.S. Aggregate Bond Index (“the Index”), which is the Portfolio’s benchmark. For the 12 months ended December 31, 2022, both share classes also underperformed the −13.34% return of the Morningstar Intermediate Core Bond Category Average.1
What factors affected the Portfolio’s relative performance during the reporting period?
The Portfolio held overweight positions relative to the Index in asset-backed securities (ABS) and commercial mortgage-backed securities (CMBS) throughout the reporting period. To facilitate the overweight positions, the Portfolio maintained an underweight position in the U.S. Treasury sector. The ABS sector detracted from performance during the reporting period. Within the floating rate subcomponent, relatively overweight exposure in AAA and AA collateralized loan obligations (CLO) detracted from performance.2 In addition, within the fixed-rate subcomponent, positioning in the equipment, specialty finance and student loan subsectors detracted from performance. Positioning in the CMBS and corporate sectors also detracted from the Portfolio’s relative performance, as did overweight exposure in U.S. government agencies. Conversely, the Portfolio’s overweight position relative to the Index in the utility subcomponent of the corporate sector was accretive to performance during the reporting period.
During the reporting period, how was the Portfolio’s performance materially affected by investments in derivatives?
The Portfolio’s use of derivatives was limited to interest rate derivatives used to keep the duration3 of the Portfolio in line with
our target. These interest rate derivatives had a slightly negative impact on the Portfolio's performance during the reporting period.
What was the Portfolio’s duration strategy during the reporting period?
The Portfolio maintained a duration relatively close to that of the Index. On two occasions the duration of the Portfolio differed significantly from that of the Index. During the first half of the reporting period, the Portfolio held a shorter duration in the 2-year part of the yield curve4 than the Index, while simultaneously holding a longer duration than the Index in the 10-year part of the curve. This strategy had a positive impact on performance. Toward the end of the reporting period, the Portfolio held a shorter duration in the 5-year part of the curve relative to the Index, while simultaneously holding a longer duration than the Index in the 30-year part of the curve. This strategy had a negative impact on performance. As of December 31, 2022, the effective duration of the Portfolio was 6.32 years compared to a duration of 6.32 years for the Index.
What specific factors, risks or market forces prompted significant decisions for the Portfolio during the reporting period?
The Portfolio reduced its exposure to corporate credit during the first half of the reporting period. Given significant rate volatility and further uncertainty across the inflation backdrop, we deemed the option-adjusted spreads5 (OAS) being offered on corporate bonds to be too tight for the outstanding macro risks. We reduced the Portfolio’s allocation to ABS and CLO in the first half of the reporting period to mitigate further spread6 widening in these sectors, which did take place in the second half of 2022. During the second half of the reporting period, the Portfolio increased corporate credit exposure after October’s Consumer Price Index (CPI) report showed a decline in inflationary pressures, as we deemed this would likely have a positive effect on OAS performance in the asset class. We increased the Portfolio’s
| 1. | See page 5 for more information on benchmark and peer group returns. |
| 2. | An obligation rated ‘AAA’ has the highest rating assigned by Standard & Poor’s (“S&P”), and in the opinion of S&P, the obligor’s capacity to meet its financial commitment on the obligation is extremely strong. An obligation rated ‘AA’ by S&P is deemed by S&P to differ from the highest-rated obligations only to a small degree. In the opinion of S&P, the obligor's capacity to meet its financial commitment on the obligation is very strong. When applied to Portfolio holdings, ratings are based solely on the creditworthiness of the bonds in the Portfolio and are not meant to represent the security or safety of the Portfolio. |
| 3. | Duration is a measure of the price sensitivity of a fixed-income investment to changes in interest rates. Duration is expressed as a number of years and is considered a more accurate sensitivity gauge than average maturity. |
| 4. | The yield curve is a line that plots the yields of various securities of similar quality—typically U.S. Treasury issues—across a range of maturities. The U.S. Treasury yield curve serves as a benchmark for other debt and is used in economic forecasting. |
| 5. | An option-adjusted spread is the measurement of the spread of a fixed-income security rate and the risk-free rate of return, which is then adjusted to take into account an embedded option. |
| 6. | The terms “spread” and “yield spread” may refer to the difference in yield between a security or type of security and comparable U.S. Treasury issues. The terms may also refer to the difference in yield between two specific securities or types of securities at a given time. |
| 8 | MainStay VP Bond Portfolio |
allocation to MBS in the second half of the reporting period, as the technical picture became much more favorable, and as the sector had massively underperformed credit on a year-to-date basis. Conversely, when we reduced the Portfolio’s spread-asset allocation, we increased exposure to the U.S. Treasury sector. U.S. Treasury securities are generally seen as the safest asset class and serve as a ‘haven’ for investors during times of market stress.
During the reporting period, which market segments were the strongest positive contributors to the Portfolio’s absolute performance and which market segments were particularly weak?
During the reporting period, cash securities made the strongest positive contribution to the Portfolio’s absolute performance. (Contributions take weightings and total returns into account.) In the cash securities sector, the Portfolio’s allocation to Federal Home Loan Bank (FHLB) agency discount notes was the most accretive to absolute performance.
During the same period, the corporate sector produced the weakest contribution to the Portfolio’s absolute performance. In the corporate sector, the Portfolio’s allocation to industrials and financials detracted the most. The MBS sector was the second most significant detractor, primarily due to positioning in the agency mortgage pass-through subcomponent. Positioning in the U.S. Treasury sector also detracted from absolute performance of the Portfolio.
Within the interest rate complex, the Portfolio’s duration and curve positioning were accretive to absolute performance.
Among individual issues, those producing the strongest absolute performance during the reporting period were issued by HSBC Holdings, Oracle, Southern, Exelon and Intercontinental Exchange. The bonds with the weakest absolute performance were issued by France, Societe Generale, American Homes 4 Rent, Carrier Global and Marubeni.
Did the Portfolio make any significant purchases or sales during the reporting period?
The Portfolio’s largest purchases during the reporting period included bonds issued by oil & gas midstream company ONEOK, diversified financial company JPMorgan Chase & Co., diversified bank Citigroup, capital markets company The Goldman Sachs Group and diversified bank Royal Bank of Canada.
The Portfolio’s most significant sales during the same period were bonds issued by oilfield services and equipment provider Schlumberger Holdings, real estate investment trust Highwoods
Realty, kidney dialysis services provider Fresenius Medical Care, retail real estate investment trust Realty Income and mining company Anglo American.
How did the Portfolio’s sector weightings change during the reporting period?
As described in greater detail above, during the first half of the reporting period, the Portfolio reduced its exposure to corporate credit, ABS and CLO. During the second half of the reporting period, the Portfolio increased its allocation to corporate credit and MBS. As we reduced the Portfolio’s spread-asset allocation, we increased the allocation to the U.S. Treasury sector.
How was the Portfolio positioned at the end of the reporting period?
As of December 31, 2022. the Portfolio held overweight exposure relative to the Index in ABS, CMBS and U.S. government agencies. The Portfolio’s largest overweight allocation among spread assets was to the ABS sector.
As of the same date, the Portfolio held a relatively underweight position in the U.S. Treasury and MBS sectors. Among corporates, the Portfolio held underweight positions in the industrial, sovereign, supranational, foreign agency, and foreign local government subcomponents.
The opinions expressed are those of the portfolio managers as of the date of this report and are subject to change. There is no guarantee that any forecasts will come to pass. This material does not constitute investment advice and is not intended as an endorsement of any specific investment.
Not all MainStay VP Portfolios and/or share classes are available under all policies.
Portfolio of Investments December 31, 2022†
| | Principal
Amount | Value |
| Long-Term Bonds 98.9% |
| Asset-Backed Securities 7.1% |
| Automobile Asset-Backed Security 0.4% |
| Hertz Vehicle Financing III LLC | |
| Series 2022-3A, Class B | | |
| 3.86%, due 3/25/25 (a) | $ 2,500,000 | $ 2,436,484 |
| Home Equity Asset-Backed Securities 0.1% |
| Chase Funding Trust | |
| Series 2002-2, Class 1A5 | | |
| 6.333%, due 4/25/32 (b) | 20,298 | 20,066 |
| J.P. Morgan Mortgage Acquisition Trust | |
| Series 2007-CH2, Class AF3 | | |
| 5.552%, due 10/25/30 (b) | 426,933 | 233,488 |
| Morgan Stanley Mortgage Loan Trust | |
| Series 2006-17XS, Class A3A | | |
| 6.151%, due 10/25/46 (b) | 789,616 | 237,374 |
| | | 490,928 |
| Other Asset-Backed Securities 6.6% |
| 522 Funding CLO Ltd. | |
| Series 2019-4A, Class BR | | |
| 5.843% (3 Month LIBOR + 1.60%), due 4/20/30 (a)(c) | 3,000,000 | 2,902,179 |
| ARES XXXVIII CLO Ltd. | |
| Series 2015-38A, Class BR | | |
| 5.643% (3 Month LIBOR + 1.40%), due 4/20/30 (a)(c) | 2,000,000 | 1,911,670 |
| CARS-DB5 LP | |
| Series 2021-1A, Class A3 | | |
| 1.92%, due 8/15/51 (a) | 2,496,354 | 2,141,793 |
| College Avenue Student Loans LLC (a) | |
| Series 2021-B, Class A2 | | |
| 1.76%, due 6/25/52 | 2,362,927 | 1,961,960 |
| Series 2021-C, Class A2 | | |
| 2.32%, due 7/26/55 | 2,676,995 | 2,286,199 |
| Cook Park CLO Ltd. | |
| Series 2018-1A, Class B | | |
| 5.479% (3 Month LIBOR + 1.40%), due 4/17/30 (a)(c) | 3,000,000 | 2,889,711 |
| Galaxy XXI CLO Ltd. | |
| Series 2015-21A, Class BR | | |
| 5.593% (3 Month LIBOR + 1.35%), due 4/20/31 (a)(c) | 1,500,000 | 1,435,338 |
| Grippen Park CLO Ltd. | |
| Series 2017-1A, Class B | | |
| 5.893% (3 Month LIBOR + 1.65%), due 1/20/30 (a)(c) | 750,000 | 733,720 |
| | Principal
Amount | Value |
| |
| Other Asset-Backed Securities (continued) |
| Lunar Structured Aircraft Portfolio Notes | |
| Series 2021-1, Class A | | |
| 2.636%, due 10/15/46 (a) | $ 2,447,836 | $ 1,962,088 |
| Marlin Receivables LLC | |
| Series 2022-1A, Class A2 | | |
| 4.53%, due 9/20/25 (a) | 2,400,000 | 2,363,434 |
| Neuberger Berman CLO XIV Ltd. | |
| Series 2013-14A, Class BR2 | | |
| 5.874% (3 Month LIBOR + 1.50%), due 1/28/30 (a)(c) | 1,000,000 | 968,879 |
| Neuberger Berman Loan Advisers CLO 24 Ltd. | |
| Series 2017-24A, Class BR | | |
| 5.727% (3 Month LIBOR + 1.50%), due 4/19/30 (a)(c) | 1,000,000 | 973,176 |
| Oak Street Investment Grade Net Lease Fund | |
| Series 2021-2A, Class A1 | | |
| 2.38%, due 11/20/51 (a) | 2,355,464 | 2,066,970 |
| Oaktree CLO Ltd. | |
| Series 2021-2A, Class A | | |
| 5.259% (3 Month LIBOR + 1.18%), due 1/15/35 (a)(c) | 3,000,000 | 2,914,104 |
| Palmer Square CLO Ltd. | |
| Series 2015-2A, Class A2R2 | | |
| 5.793% (3 Month LIBOR + 1.55%), due 7/20/30 (a)(c) | 2,000,000 | 1,940,526 |
| Regatta XIV Funding Ltd. | |
| Series 2018-3A, Class A | | |
| 5.548% (3 Month LIBOR + 1.19%), due 10/25/31 (a)(c) | 2,000,000 | 1,961,462 |
| SMB Private Education Loan Trust | |
| Series 2021-A, Class B | | |
| 2.31%, due 1/15/53 (a) | 4,250,000 | 3,708,273 |
| THL Credit Wind River CLO Ltd. | |
| Series 2017-4A, Class A | | |
| 5.825% (3 Month LIBOR + 1.15%), due 11/20/30 (a)(c) | 2,243,000 | 2,211,396 |
| TICP CLO XV Ltd. | |
| Series 2020-15A, Class A | | |
| 5.523% (3 Month LIBOR + 1.28%), due 4/20/33 (a)(c) | 2,000,000 | 1,969,496 |
| Voya CLO Ltd. (a)(c) | |
| Series 2019-1A, Class BR | | |
| 5.629% (3 Month LIBOR + 1.55%), due 4/15/31 | 2,000,000 | 1,908,440 |
| Series 2022-4A, Class A | | |
| 6.342% (3 Month SOFR + 2.15%), due 10/20/33 | 2,000,000 | 1,996,656 |
The notes to the financial statements are an integral part of, and should be read in conjunction with, the financial statements.
| 10 | MainStay VP Bond Portfolio |
| | Principal
Amount | Value |
| Asset-Backed Securities (continued) |
| Other Asset-Backed Securities (continued) |
| Voya CLO Ltd. (a)(c) (continued) | |
| Series 2022-4A, Class B | | |
| 7.492% (3 Month SOFR + 3.30%), due 10/20/33 | $ 2,000,000 | $ 1,976,376 |
| | | 45,183,846 |
Total Asset-Backed Securities
(Cost $51,947,144) | | 48,111,258 |
| Corporate Bonds 28.9% |
| Aerospace & Defense 0.9% |
| Boeing Co. (The) | | |
| 3.10%, due 5/1/26 | 1,925,000 | 1,811,357 |
| 3.25%, due 2/1/28 | 1,825,000 | 1,657,342 |
| 5.805%, due 5/1/50 | 575,000 | 533,126 |
| Lockheed Martin Corp. | | |
| 5.25%, due 1/15/33 | 2,060,000 | 2,123,912 |
| | | 6,125,737 |
| Auto Manufacturers 0.8% |
| Ford Motor Credit Co. LLC | | |
| 3.664%, due 9/8/24 | 1,800,000 | 1,714,968 |
| General Motors Co. | | |
| 5.60%, due 10/15/32 | 540,000 | 501,658 |
| General Motors Financial Co., Inc. | | |
| 6.05%, due 10/10/25 | 3,345,000 | 3,402,344 |
| | | 5,618,970 |
| Banks 9.7% |
| Banco Santander SA | | |
| 5.294%, due 8/18/27 | 2,200,000 | 2,147,984 |
| Bank of America Corp. (d) | | |
| 1.922%, due 10/24/31 | 2,392,000 | 1,827,220 |
| 2.087%, due 6/14/29 | 2,000,000 | 1,682,988 |
| 4.571%, due 4/27/33 | 1,785,000 | 1,632,744 |
| Citigroup, Inc. (d) | | |
| 5.61%, due 9/29/26 | 4,770,000 | 4,790,401 |
| 6.27%, due 11/17/33 | 2,235,000 | 2,305,720 |
| Citizens Bank NA | | |
| 6.064%, due 10/24/25 (d) | 1,750,000 | 1,769,702 |
| Cooperatieve Rabobank UA | | |
| 4.655% (1 Year Treasury Constant Maturity Rate + 1.75%), due 8/22/28 (a)(c) | 1,495,000 | 1,434,872 |
| Goldman Sachs Group, Inc. (The) | | |
| 2.65%, due 10/21/32 (d) | 375,000 | 296,089 |
| 4.223%, due 5/1/29 (d) | 2,910,000 | 2,711,008 |
| | Principal
Amount | Value |
| |
| Banks (continued) |
Goldman Sachs Group, Inc. (The)
(continued) | | |
| 5.70%, due 11/1/24 | $ 3,870,000 | $ 3,916,060 |
| HSBC Holdings plc (d) | | |
| 7.39%, due 11/3/28 | 2,415,000 | 2,538,045 |
| 8.113%, due 11/3/33 | 1,200,000 | 1,269,696 |
| JPMorgan Chase & Co. (d) | | |
| 1.578%, due 4/22/27 | 3,555,000 | 3,123,645 |
| 2.963%, due 1/25/33 | 2,110,000 | 1,717,334 |
| 4.565%, due 6/14/30 | 1,310,000 | 1,232,532 |
| 4.912%, due 7/25/33 | 820,000 | 780,744 |
| 5.546%, due 12/15/25 | 2,960,000 | 2,960,052 |
| Mitsubishi UFJ Financial Group, Inc. | | |
| 5.354% (1 Year Treasury Constant Maturity Rate + 1.90%), due 9/13/28 (c) | 2,490,000 | 2,470,194 |
| Morgan Stanley (d) | | |
| 4.679%, due 7/17/26 | 2,630,000 | 2,584,910 |
| 4.889%, due 7/20/33 | 1,185,000 | 1,113,333 |
| 5.297%, due 4/20/37 | 905,000 | 827,495 |
| 6.296%, due 10/18/28 | 1,450,000 | 1,496,842 |
| 6.342%, due 10/18/33 | 700,000 | 733,463 |
| Nordea Bank Abp | | |
| 5.375%, due 9/22/27 (a) | 3,085,000 | 3,099,232 |
| PNC Financial Services Group, Inc. (The) | | |
| 6.037%, due 10/28/33 (d) | 1,695,000 | 1,764,664 |
| Royal Bank of Canada | | |
| 5.66%, due 10/25/24 | 3,395,000 | 3,433,865 |
| Santander Holdings USA, Inc. | | |
| 5.807%, due 9/9/26 (d) | 1,380,000 | 1,369,588 |
| Standard Chartered plc | | |
| 7.776% (1 Year Treasury Constant Maturity Rate + 3.10%), due 11/16/25 (a)(c) | 2,100,000 | 2,162,785 |
| Swedbank AB | | |
| 5.337%, due 9/20/27 (a) | 2,770,000 | 2,747,119 |
| UBS Group AG | | |
| 1.364% (1 Year Treasury Constant Maturity Rate + 1.08%), due 1/30/27 (a)(c) | 1,415,000 | 1,239,188 |
| Wells Fargo & Co. | | |
| 4.54%, due 8/15/26 (d) | 2,780,000 | 2,724,287 |
| | | 65,903,801 |
| Beverages 0.5% |
| Anheuser-Busch InBev Worldwide, Inc. | | |
| 5.55%, due 1/23/49 | 1,795,000 | 1,774,533 |
The notes to the financial statements are an integral part of, and should be read in conjunction with, the financial statements.
11
Portfolio of Investments December 31, 2022† (continued)
| | Principal
Amount | Value |
| Corporate Bonds (continued) |
| Beverages (continued) |
| Keurig Dr Pepper, Inc. | | |
| 4.05%, due 4/15/32 | $ 485,000 | $ 441,181 |
| PepsiCo, Inc. | | |
| 2.625%, due 10/21/41 | 1,250,000 | 924,934 |
| | | 3,140,648 |
| Biotechnology 0.2% |
| Amgen, Inc. | | |
| 4.20%, due 3/1/33 | 880,000 | 814,113 |
| 4.875%, due 3/1/53 | 810,000 | 718,368 |
| | | 1,532,481 |
| Chemicals 0.1% |
| LYB International Finance III LLC | | |
| 1.25%, due 10/1/25 | 908,000 | 810,032 |
| Commercial Services 0.4% |
| Global Payments, Inc. | | |
| 2.15%, due 1/15/27 | 2,000,000 | 1,744,703 |
| PayPal Holdings, Inc. | | |
| 5.05%, due 6/1/52 | 370,000 | 335,028 |
| 5.25%, due 6/1/62 | 350,000 | 317,910 |
| | | 2,397,641 |
| Computers 0.3% |
| Apple, Inc. | | |
| 2.65%, due 2/8/51 | 2,975,000 | 1,961,945 |
| Cosmetics & Personal Care 0.1% |
| Unilever Capital Corp. | | |
| 1.75%, due 8/12/31 | 1,280,000 | 1,005,725 |
| Diversified Financial Services 1.6% |
| AerCap Ireland Capital DAC | | |
| 3.00%, due 10/29/28 | 1,670,000 | 1,399,085 |
| Air Lease Corp. | | |
| 0.70%, due 2/15/24 | 1,575,000 | 1,487,736 |
| 1.875%, due 8/15/26 | 2,125,000 | 1,845,642 |
| Blackstone Holdings Finance Co. LLC | | |
| 5.90%, due 11/3/27 (a) | 3,045,000 | 3,067,799 |
| Intercontinental Exchange, Inc. | | |
| 4.35%, due 6/15/29 | 1,650,000 | 1,595,286 |
| 5.20%, due 6/15/62 | 570,000 | 537,782 |
| Thirax 1 LLC | | |
| 0.968%, due 1/14/33 | 1,553,225 | 1,277,471 |
| | | 11,210,801 |
| | Principal
Amount | Value |
| |
| Electric 3.1% |
| AEP Texas, Inc. | | |
| 5.25%, due 5/15/52 | $ 60,000 | $ 57,376 |
| AEP Transmission Co. LLC | | |
| Series O | | |
| 4.50%, due 6/15/52 | 740,000 | 650,857 |
| Appalachian Power Co. | | |
| Series BB | | |
| 4.50%, due 8/1/32 | 820,000 | 764,560 |
| Dayton Power & Light Co. (The) | | |
| 3.95%, due 6/15/49 | 505,000 | 390,528 |
| Duke Energy Carolinas LLC | | |
| 2.85%, due 3/15/32 | 1,930,000 | 1,632,634 |
| Duke Energy Corp. | | |
| 4.30%, due 3/15/28 | 1,730,000 | 1,664,647 |
| 5.00%, due 8/15/52 | 370,000 | 328,325 |
| Enel Finance America LLC | | |
| 7.10%, due 10/14/27 (a) | 2,280,000 | 2,357,655 |
| Entergy Mississippi LLC | | |
| 3.85%, due 6/1/49 | 1,230,000 | 938,777 |
| Exelon Corp. | | |
| 4.10%, due 3/15/52 (a) | 585,000 | 467,452 |
| Georgia Power Co. | | |
| 4.30%, due 3/15/42 | 1,741,000 | 1,494,880 |
| NSTAR Electric Co. | | |
| 4.55%, due 6/1/52 | 1,080,000 | 971,930 |
| Pacific Gas and Electric Co. | | |
| 5.45%, due 6/15/27 | 2,120,000 | 2,090,551 |
| Southern California Edison Co. | | |
| 1.10%, due 4/1/24 | 1,213,000 | 1,152,063 |
| Series 20C | | |
| 1.20%, due 2/1/26 | 1,800,000 | 1,596,182 |
| 5.95%, due 11/1/32 | 2,205,000 | 2,329,801 |
| Southern Co. (The) | | |
| 5.15%, due 10/6/25 | 980,000 | 986,340 |
| 5.70%, due 10/15/32 | 470,000 | 480,794 |
| Virginia Electric and Power Co. | | |
| Series C | | |
| 4.625%, due 5/15/52 | 969,000 | 845,618 |
| | | 21,200,970 |
| Entertainment 0.2% |
| Warnermedia Holdings, Inc. (a) | | |
| 4.054%, due 3/15/29 | 540,000 | 467,166 |
| 5.05%, due 3/15/42 | 1,070,000 | 818,638 |
| 5.141%, due 3/15/52 | 565,000 | 410,736 |
| | | 1,696,540 |
The notes to the financial statements are an integral part of, and should be read in conjunction with, the financial statements.
| 12 | MainStay VP Bond Portfolio |
| | Principal
Amount | Value |
| Corporate Bonds (continued) |
| Environmental Control 0.2% |
| Waste Connections, Inc. | | |
| 2.60%, due 2/1/30 | $ 1,810,000 | $ 1,543,273 |
| Food 0.4% |
| Kraft Heinz Foods Co. | | |
| 4.875%, due 10/1/49 | 280,000 | 243,052 |
| Nestle Holdings, Inc. | | |
| 4.25%, due 10/1/29 (a) | 2,660,000 | 2,592,159 |
| | | 2,835,211 |
| Gas 0.3% |
| CenterPoint Energy Resources Corp. | | |
| 4.40%, due 7/1/32 | 1,550,000 | 1,486,030 |
| NiSource, Inc. | | |
| 5.65%, due 2/1/45 | 595,000 | 580,545 |
| | | 2,066,575 |
| Healthcare-Products 0.1% |
| Danaher Corp. | | |
| 2.80%, due 12/10/51 | 570,000 | 376,633 |
| GE HealthCare Technologies, Inc. | | |
| 6.377%, due 11/22/52 (a) | 460,000 | 488,572 |
| | | 865,205 |
| Healthcare-Services 0.2% |
| HCA, Inc. | | |
| 4.625%, due 3/15/52 (a) | 905,000 | 704,357 |
| UnitedHealth Group, Inc. | | |
| 6.05%, due 2/15/63 | 835,000 | 906,091 |
| | | 1,610,448 |
| Insurance 0.6% |
| Corebridge Financial, Inc. (a) | | |
| 3.85%, due 4/5/29 | 375,000 | 341,553 |
| 4.35%, due 4/5/42 | 195,000 | 159,968 |
| MetLife, Inc. | | |
| 5.00%, due 7/15/52 | 710,000 | 675,884 |
| 5.875%, due 2/6/41 | 660,000 | 677,888 |
| Principal Life Global Funding II | | |
| 1.25%, due 8/16/26 (a) | 2,250,000 | 1,950,851 |
| Prudential Financial, Inc. | | |
| 3.70%, due 3/13/51 | 240,000 | 183,137 |
| | | 3,989,281 |
| Internet 0.4% |
| Amazon.com, Inc. | | |
| 2.50%, due 6/3/50 | 1,250,000 | 787,764 |
| 3.10%, due 5/12/51 | 1,050,000 | 747,817 |
| | Principal
Amount | Value |
| |
| Internet (continued) |
| Amazon.com, Inc. (continued) | | |
| 3.95%, due 4/13/52 | $ 720,000 | $ 595,931 |
| Meta Platforms, Inc. | | |
| 4.45%, due 8/15/52 | 430,000 | 341,700 |
| | | 2,473,212 |
| Investment Companies 0.3% |
| Blackstone Private Credit Fund | | |
| 7.05%, due 9/29/25 (a) | 1,895,000 | 1,879,977 |
| Iron & Steel 0.2% |
| Nucor Corp. | | |
| 2.00%, due 6/1/25 | 1,575,000 | 1,465,753 |
| Media 0.7% |
| Charter Communications Operating LLC | | |
| 2.25%, due 1/15/29 | 910,000 | 732,438 |
| 4.908%, due 7/23/25 | 1,230,000 | 1,205,524 |
| 5.25%, due 4/1/53 | 1,355,000 | 1,045,847 |
| Comcast Corp. | | |
| 4.60%, due 10/15/38 | 750,000 | 692,879 |
| Paramount Global | | |
| 4.375%, due 3/15/43 | 1,665,000 | 1,146,529 |
| | | 4,823,217 |
| Oil & Gas 0.3% |
| Phillips 66 Co. | | |
| 3.15%, due 12/15/29 (a) | 2,430,000 | 2,119,863 |
| Packaging & Containers 0.3% |
| WRKCo, Inc. | | |
| 3.75%, due 3/15/25 | 1,825,000 | 1,765,010 |
| Pharmaceuticals 1.2% |
| AbbVie, Inc. | | |
| 2.95%, due 11/21/26 | 1,555,000 | 1,446,125 |
| 4.25%, due 11/21/49 | 560,000 | 464,736 |
| AstraZeneca plc | | |
| 1.375%, due 8/6/30 | 2,900,000 | 2,291,076 |
| Bristol-Myers Squibb Co. | | |
| 2.55%, due 11/13/50 | 1,250,000 | 782,967 |
| CVS Health Corp. | | |
| 5.05%, due 3/25/48 | 1,160,000 | 1,041,152 |
| Eli Lilly and Co. | | |
| 3.375%, due 3/15/29 | 2,600,000 | 2,432,978 |
| | | 8,459,034 |
The notes to the financial statements are an integral part of, and should be read in conjunction with, the financial statements.
13
Portfolio of Investments December 31, 2022† (continued)
| | Principal
Amount | Value |
| Corporate Bonds (continued) |
| Pipelines 1.2% |
| Energy Transfer LP | | |
| 5.00%, due 5/15/50 | $ 460,000 | $ 367,508 |
| 5.75%, due 2/15/33 | 1,245,000 | 1,218,058 |
| Kinder Morgan, Inc. | | |
| 5.45%, due 8/1/52 | 395,000 | 354,544 |
| MPLX LP | | |
| 4.95%, due 9/1/32 | 890,000 | 834,541 |
| ONEOK, Inc. | | |
| 5.20%, due 7/15/48 | 215,000 | 179,089 |
| 5.85%, due 1/15/26 | 3,270,000 | 3,309,162 |
| 6.10%, due 11/15/32 | 1,395,000 | 1,394,931 |
| TransCanada PipeLines Ltd. | | |
| 5.10%, due 3/15/49 | 625,000 | 566,617 |
| | | 8,224,450 |
| Real Estate Investment Trusts 0.4% |
| Alexandria Real Estate Equities, Inc. | | |
| 3.55%, due 3/15/52 | 1,050,000 | 748,252 |
| Simon Property Group LP | | |
| 1.75%, due 2/1/28 | 1,980,000 | 1,685,020 |
| | | 2,433,272 |
| Retail 0.5% |
| Home Depot, Inc. (The) | | |
| 4.95%, due 9/15/52 | 1,090,000 | 1,046,226 |
| Lowe's Cos., Inc. | | |
| 5.625%, due 4/15/53 | 635,000 | 607,882 |
| Walmart, Inc. | | |
| 5.25%, due 9/1/35 | 1,365,000 | 1,431,270 |
| | | 3,085,378 |
| Semiconductors 1.1% |
| Broadcom, Inc. | | |
| 4.30%, due 11/15/32 | 2,945,000 | 2,595,548 |
| NVIDIA Corp. | | |
| 1.55%, due 6/15/28 | 1,004,000 | 857,282 |
| NXP BV | | |
| 4.30%, due 6/18/29 | 1,215,000 | 1,132,743 |
| QUALCOMM, Inc. | | |
| 4.50%, due 5/20/52 | 750,000 | 656,824 |
| Texas Instruments, Inc. | | |
| 4.15%, due 5/15/48 | 2,300,000 | 2,035,294 |
| | | 7,277,691 |
| Software 0.9% |
| Microsoft Corp. | | |
| 2.525%, due 6/1/50 | 2,330,000 | 1,533,254 |
| | Principal
Amount | Value |
| |
| Software (continued) |
| Oracle Corp. | | |
| 2.30%, due 3/25/28 | $ 490,000 | $ 424,424 |
| 3.65%, due 3/25/41 | 1,080,000 | 797,249 |
| 3.95%, due 3/25/51 | 645,000 | 459,523 |
| 6.90%, due 11/9/52 | 1,540,000 | 1,647,530 |
| Salesforce, Inc. | | |
| 2.70%, due 7/15/41 | 1,660,000 | 1,184,783 |
| | | 6,046,763 |
| Telecommunications 1.1% |
| AT&T, Inc. | | |
| 3.50%, due 9/15/53 | 740,000 | 499,453 |
| 3.55%, due 9/15/55 | 1,012,000 | 675,250 |
| 4.35%, due 3/1/29 | 1,489,000 | 1,415,990 |
| T-Mobile US, Inc. | | |
| 2.625%, due 2/15/29 | 2,390,000 | 2,023,209 |
| 5.65%, due 1/15/53 | 335,000 | 324,243 |
| Verizon Communications, Inc. | | |
| 3.55%, due 3/22/51 | 1,260,000 | 897,565 |
| 4.50%, due 8/10/33 | 1,610,000 | 1,506,455 |
| | | 7,342,165 |
| Transportation 0.6% |
| Norfolk Southern Corp. | | |
| 5.64%, due 5/17/29 | 1,400,000 | 1,430,546 |
| Union Pacific Corp. | | |
| 4.50%, due 1/20/33 | 1,825,000 | 1,784,419 |
| United Parcel Service, Inc. | | |
| 5.30%, due 4/1/50 | 525,000 | 544,738 |
| | | 3,759,703 |
Total Corporate Bonds
(Cost $205,281,871) | | 196,670,772 |
| Foreign Government Bond 0.2% |
| Chile 0.2% |
| Banco del Estado de Chile | | |
| 2.704%, due 1/9/25 (a) | 1,275,000 | 1,201,525 |
Total Foreign Government Bond
(Cost $1,275,000) | | 1,201,525 |
| Mortgage-Backed Securities 7.7% |
| Agency (Collateralized Mortgage Obligations) 4.4% |
| FHLMC | |
| REMIC, Series 4682, Class KZ | | |
| 3.50%, due 9/15/46 | 2,734,811 | 2,501,206 |
The notes to the financial statements are an integral part of, and should be read in conjunction with, the financial statements.
| 14 | MainStay VP Bond Portfolio |
| | Principal
Amount | Value |
| Mortgage-Backed Securities (continued) |
| Agency (Collateralized Mortgage Obligations) (continued) |
| FHLMC, Multifamily Structured Pass-Through Certificates | |
| REMIC, Series K-150, Class A2 | | |
| 3.71%, due 9/25/32 (e) | $ 4,500,000 | $ 4,216,947 |
| GNMA II, Single Family, 30 Year (f) | |
| 2.00%, due 1/15/53 TBA | 5,000,000 | 4,189,176 |
| 2.50%, due 1/15/53 TBA | 3,050,000 | 2,642,392 |
| 5.50%, due 1/15/53 TBA | 1,250,000 | 1,256,989 |
| UMBS, Single Family, 30 Year (f) | |
| 2.00%, due 1/25/53 TBA | 3,000,000 | 2,440,381 |
| 2.50%, due 1/25/53 TBA | 3,050,000 | 2,581,869 |
| 4.00%, due 1/25/53 TBA | 5,600,000 | 5,250,896 |
| 4.50%, due 1/25/53 TBA | 4,700,000 | 4,522,605 |
| | | 29,602,461 |
| Commercial Mortgage Loans (Collateralized Mortgage Obligations) 3.0% |
| Aventura Mall Trust | |
| Series 2018-AVM, Class A | | |
| 4.112%, due 7/5/40 (a)(g) | 3,250,000 | 2,906,559 |
| CSMC OA LLC | |
| Series 2014-USA, Class A1 | | |
| 3.304%, due 9/15/37 (a) | 2,590,022 | 2,334,237 |
| CSMC Trust | |
| Series 2019-UVIL, Class A | | |
| 3.16%, due 12/15/41 (a) | 1,650,000 | 1,342,526 |
| FHLMC, Multifamily Structured Pass-Through Certificates (g)(h) | |
| REMIC, Series K119, Class X1 | | |
| 0.931%, due 9/25/30 | 54,721,198 | 2,958,129 |
| REMIC, Series K108, Class X1 | | |
| 1.691%, due 3/25/30 | 27,582,593 | 2,594,215 |
| Houston Galleria Mall Trust | |
| Series 2015-HGLR, Class A1A1 | | |
| 3.087%, due 3/5/37 (a) | 3,250,000 | 2,990,853 |
| Queens Center Mortgage Trust | |
| Series 2013-QCA, Class A | | |
| 3.275%, due 1/11/37 (a) | 3,000,000 | 2,769,182 |
| Wells Fargo Commercial Mortgage Trust | |
| Series 2018-AUS, Class A | | |
| 4.058%, due 8/17/36 (a)(g) | 3,000,000 | 2,660,792 |
| | | 20,556,493 |
| | Principal
Amount | Value |
| |
| Whole Loan (Collateralized Mortgage Obligation) 0.3% |
| GCAT Trust | |
| Series 2022-NQM3, Class A1 | | |
| 4.348%, due 4/25/67 (a)(e) | $ 2,385,224 | $ 2,280,447 |
Total Mortgage-Backed Securities
(Cost $55,889,086) | | 52,439,401 |
| Municipal Bonds 0.6% |
| Texas 0.6% |
San Antonio Water System
Revenue Bonds | | |
| Series B | | |
| 5.502%, due 5/15/29 | 2,000,000 | 2,055,592 |
Texas Transportation Commission State Highway Fund
Revenue Bonds, First Tier | | |
| Series B | | |
| 5.178%, due 4/1/30 | 2,150,000 | 2,192,994 |
Total Municipal Bonds
(Cost $4,526,260) | | 4,248,586 |
| U.S. Government & Federal Agencies 54.4% |
| Federal Home Loan Mortgage Corporation (Mortgage Pass-Through Securities) 9.1% |
| FFCB | | |
| 2.03%, due 1/21/28 | 3,800,000 | 3,443,670 |
| 4.37%, due 5/17/32 | 2,175,000 | 2,078,484 |
| FHLB | | |
| 4.00%, due 5/26/27 | 5,840,000 | 5,620,748 |
| 4.00%, due 4/21/32 | 1,775,000 | 1,647,750 |
| FHLMC | | |
| 4.00%, due 5/27/27 | 2,400,000 | 2,344,431 |
| FHLMC Gold Pools, 15 Year | | |
| 4.50%, due 4/1/23 | 134 | 134 |
| 5.00%, due 3/1/25 | 8,854 | 8,913 |
| FHLMC Gold Pools, 30 Year | | |
| 6.50%, due 11/1/35 | 2,276 | 2,334 |
| 6.50%, due 8/1/37 | 13,689 | 14,154 |
| Freddie Mac Pool, 30 Year | | |
| 5.50%, due 10/1/52 (i) | 2,983,012 | 3,035,893 |
| 5.50%, due 1/1/53 | 2,750,000 | 2,776,300 |
| Tennessee Valley Authority | | |
| 5.25%, due 9/15/39 | 2,000,000 | 2,080,889 |
| UMBS Pool, 20 Year | | |
| 3.50%, due 8/1/40 | 3,282,480 | 3,064,584 |
| UMBS Pool, 30 Year | | |
| 2.00%, due 8/1/50 | 3,473,772 | 2,841,483 |
The notes to the financial statements are an integral part of, and should be read in conjunction with, the financial statements.
15
Portfolio of Investments December 31, 2022† (continued)
| | Principal
Amount | Value |
| U.S. Government & Federal Agencies (continued) |
| Federal Home Loan Mortgage Corporation (Mortgage Pass-Through Securities) (continued) |
| UMBS Pool, 30 Year (continued) | | |
| 2.00%, due 11/1/50 | $ 2,812,445 | $ 2,322,479 |
| 2.50%, due 5/1/50 | 2,633,544 | 2,258,697 |
| 2.50%, due 10/1/50 | 2,573,382 | 2,212,756 |
| 2.50%, due 11/1/50 | 4,600,317 | 3,963,961 |
| 2.50%, due 11/1/50 | 2,858,517 | 2,468,987 |
| 2.50%, due 8/1/51 | 2,727,322 | 2,321,262 |
| 3.00%, due 1/1/52 | 1,822,031 | 1,615,290 |
| 3.50%, due 10/1/51 | 2,164,666 | 2,004,556 |
| 3.50%, due 11/1/51 | 3,591,829 | 3,270,071 |
| 3.50%, due 4/1/52 | 879,875 | 800,440 |
| 4.00%, due 9/1/52 | 1,937,454 | 1,829,368 |
| 5.00%, due 11/1/52 (i) | 4,828,650 | 4,766,726 |
| 5.50%, due 11/1/52 (i) | 3,193,419 | 3,208,768 |
| | | 62,003,128 |
| Federal National Mortgage Association (Mortgage Pass-Through Securities) 11.9% |
| FNMA, Other | | |
| 3.50%, due 8/1/56 | 1,380,375 | 1,262,639 |
| UMBS, 15 Year | | |
| 4.50%, due 5/1/24 | 38,654 | 38,544 |
| 5.00%, due 12/1/23 | 2,733 | 2,749 |
| 5.00%, due 12/1/23 | 2,536 | 2,550 |
| UMBS, 20 Year | | |
| 2.00%, due 5/1/42 | 2,403,320 | 2,025,849 |
| 2.50%, due 2/1/42 | 2,808,870 | 2,481,077 |
| 2.50%, due 4/1/42 | 4,779,692 | 4,183,087 |
| UMBS, 30 Year | | |
| 2.00%, due 8/1/50 | 3,776,989 | 3,100,853 |
| 2.00%, due 12/1/50 | 3,644,637 | 2,978,744 |
| 2.00%, due 3/1/51 | 3,967,101 | 3,273,115 |
| 2.00%, due 3/1/51 (i) | 3,773,236 | 3,081,484 |
| 2.50%, due 5/1/43 | 251,773 | 214,570 |
| 2.50%, due 3/1/47 | 4,317,008 | 3,708,111 |
| 2.50%, due 11/1/49 | 3,529,131 | 3,033,229 |
| 2.50%, due 8/1/50 | 3,128,096 | 2,697,293 |
| 2.50%, due 6/1/51 | 2,898,481 | 2,497,156 |
| 2.50%, due 10/1/51 | 3,998,860 | 3,414,613 |
| 2.50%, due 11/1/51 | 1,797,116 | 1,530,712 |
| 3.00%, due 7/1/50 | 2,374,829 | 2,116,309 |
| 3.00%, due 10/1/50 | 4,033,085 | 3,589,077 |
| 3.00%, due 6/1/51 | 3,150,313 | 2,845,294 |
| 3.00%, due 9/1/51 | 3,519,091 | 3,111,263 |
| 3.00%, due 12/1/51 | 2,783,287 | 2,476,142 |
| 3.00%, due 1/1/52 | 3,948,122 | 3,499,150 |
| | Principal
Amount | Value |
| |
| Federal National Mortgage Association (Mortgage Pass-Through Securities) (continued) |
| UMBS, 30 Year (continued) | | |
| 3.00%, due 2/1/52 | $ 2,351,984 | $ 2,067,890 |
| 3.00%, due 2/1/52 | 3,088,765 | 2,727,872 |
| 3.50%, due 5/1/50 | 4,705,111 | 4,329,772 |
| 4.00%, due 6/1/52 | 3,438,387 | 3,225,341 |
| 4.50%, due 5/1/50 | 2,153,224 | 2,097,475 |
| 4.50%, due 7/1/52 | 2,612,172 | 2,516,785 |
| 4.50%, due 7/1/52 | 2,697,773 | 2,600,095 |
| 5.00%, due 11/1/52 | 1,879,600 | 1,854,988 |
| 5.50%, due 11/1/52 | 1,989,902 | 1,999,848 |
| 6.50%, due 10/1/36 | 10,879 | 11,385 |
| 6.50%, due 10/1/36 | 11,268 | 11,545 |
| 6.50%, due 8/1/37 | 1,907 | 1,954 |
| 7.00%, due 9/1/37 | 26,602 | 27,796 |
| 7.00%, due 10/1/37 | 295 | 314 |
| 7.00%, due 11/1/37 | 3,847 | 4,022 |
| 7.50%, due 7/1/28 | 4,732 | 4,736 |
| | | 80,645,428 |
| Government National Mortgage Association (Mortgage Pass-Through Securities) 3.8% |
| GNMA I, Single Family, 30 Year | | |
| 4.00%, due 3/15/44 | 23,607 | 22,735 |
| 4.00%, due 7/15/44 | 137,654 | 131,953 |
| 4.00%, due 7/15/45 | 68,015 | 65,798 |
| 4.50%, due 6/15/39 | 340,618 | 338,936 |
| 4.50%, due 6/15/40 | 139,264 | 138,372 |
| GNMA II, 30 Year | | |
| 2.50%, due 4/20/51 | 5,294,099 | 4,536,413 |
| GNMA II, Single Family, 30 Year | | |
| 2.00%, due 6/20/51 | 5,646,063 | 4,752,271 |
| 3.00%, due 8/20/51 | 6,618,875 | 5,925,452 |
| 3.50%, due 2/20/50 | 3,545,415 | 3,289,860 |
| 3.50%, due 8/20/51 | 1,199,220 | 1,101,987 |
| 4.00%, due 4/20/52 | 2,382,993 | 2,255,139 |
| 4.50%, due 8/20/48 | 3,356,252 | 3,297,357 |
| | | 25,856,273 |
| United States Treasury Bonds 2.9% |
| U.S. Treasury Bonds | | |
| 1.875%, due 2/15/41 | 3,770,000 | 2,664,624 |
| 1.875%, due 11/15/51 | 4,540,000 | 2,875,452 |
| 2.375%, due 2/15/42 | 2,140,000 | 1,633,923 |
| 2.875%, due 5/15/52 | 3,660,000 | 2,932,575 |
| 3.25%, due 5/15/42 | 500,000 | 438,359 |
| 4.00%, due 11/15/52 | 9,080,000 | 9,092,769 |
| | | 19,637,702 |
The notes to the financial statements are an integral part of, and should be read in conjunction with, the financial statements.
| 16 | MainStay VP Bond Portfolio |
| | Principal
Amount | | Value |
| U.S. Government & Federal Agencies (continued) |
| United States Treasury Notes 26.7% |
| U.S. Treasury Notes | | | |
| 3.875%, due 11/30/27 | $ 36,675,000 | | $ 36,474,433 |
| 3.875%, due 11/30/29 | 47,275,000 | | 46,957,371 |
| 3.875%, due 12/31/29 | 2,250,000 | | 2,238,750 |
| 4.125%, due 11/15/32 | 34,295,000 | | 34,996,976 |
| 4.50%, due 11/30/24 | 61,210,000 | | 61,212,391 |
| | | | 181,879,921 |
Total U.S. Government & Federal Agencies
(Cost $383,731,319) | | | 370,022,452 |
Total Long-Term Bonds
(Cost $702,650,680) | | | 672,693,994 |
| |
| | Shares | | |
| Short-Term Investment 0.4% |
| Unaffiliated Investment Company 0.4% |
| JPMorgan U.S. Government Money Market Fund, IM Class, 4.111% (j) | 2,385,510 | | 2,385,510 |
Total Short-Term Investment
(Cost $2,385,510) | | | 2,385,510 |
Total Investments
(Cost $705,036,190) | 99.3% | | 675,079,504 |
| Other Assets, Less Liabilities | 0.7 | | 5,006,023 |
| Net Assets | 100.0% | | $ 680,085,527 |
| † | Percentages indicated are based on Portfolio net assets. |
| (a) | May be sold to institutional investors only under Rule 144A or securities offered pursuant to Section 4(a)(2) of the Securities Act of 1933, as amended. |
| (b) | Step coupon—Rate shown was the rate in effect as of December 31, 2022. |
| (c) | Floating rate—Rate shown was the rate in effect as of December 31, 2022. |
| (d) | Fixed to floating rate—Rate shown was the rate in effect as of December 31, 2022. |
| (e) | Coupon rate may change based on changes of the underlying collateral or prepayments of principal. Rate shown was the rate in effect as of December 31, 2022. |
| (f) | TBA—Security purchased on a forward commitment basis with an approximate principal amount and maturity date. The actual principal amount and maturity date will be determined upon settlement. As of December 31, 2022, the total net market value was $22,884,308, which represented 3.4% of the Portfolio’s net assets. All or a portion of this security is a part of a mortgage dollar roll agreement. |
| (g) | Collateral strip rate—A bond whose interest was based on the weighted net interest rate of the collateral. The coupon rate adjusts periodically based on a predetermined schedule. Rate shown was the rate in effect as of December 31, 2022. |
| (h) | Collateralized Mortgage Obligation Interest Only Strip—Pays a fixed or variable rate of interest based on mortgage loans or mortgage pass-through securities. The principal amount of the underlying pool represents the notional amount on which the current interest was calculated. The value of these stripped securities may be particularly sensitive to changes in prevailing interest rates and are typically more sensitive to changes in prepayment rates than traditional mortgage-backed securities. |
| (i) | Delayed delivery security. |
| (j) | Current yield as of December 31, 2022. |
Futures Contracts
As of December 31, 2022, the Portfolio held the following futures contracts1:
| Type | Number of
Contracts | Expiration
Date | Value at
Trade Date | Current
Notional
Amount | Unrealized
Appreciation
(Depreciation)2 |
| Long Contracts | | | | | |
| U.S. Treasury 5 Year Notes | 175 | March 2023 | $ 19,072,164 | $ 18,887,695 | $ (184,469) |
| U.S. Treasury Ultra Bonds | 295 | March 2023 | 40,890,047 | 39,622,188 | (1,267,859) |
| Total Long Contracts | | | | | (1,452,328) |
| Short Contracts | | | | | |
| U.S. Treasury 2 Year Notes | (48) | March 2023 | (9,845,079) | (9,843,750) | 1,329 |
| U.S. Treasury 10 Year Notes | (86) | March 2023 | (9,753,448) | (9,657,531) | 95,917 |
The notes to the financial statements are an integral part of, and should be read in conjunction with, the financial statements.
17
Portfolio of Investments December 31, 2022† (continued)
| Type | Number of
Contracts | Expiration
Date | Value at
Trade Date | Current
Notional
Amount | Unrealized
Appreciation
(Depreciation)2 |
| U.S. Treasury 10 Year Ultra Bonds | (247) | March 2023 | $ (29,873,859) | $ (29,215,469) | $ 658,390 |
| Total Short Contracts | | | | | 755,636 |
| Net Unrealized Depreciation | | | | | $ (696,692) |
| 1. | As of December 31, 2022, cash in the amount of $1,579,869 was on deposit with a broker or futures commission merchant for futures transactions. |
| 2. | Represents the difference between the value of the contracts at the time they were opened and the value as of December 31, 2022. |
| Abbreviation(s): |
| CLO—Collateralized Loan Obligation |
| FFCB—Federal Farm Credit Bank |
| FHLB—Federal Home Loan Bank |
| FHLMC—Federal Home Loan Mortgage Corp. |
| FNMA—Federal National Mortgage Association |
| GNMA—Government National Mortgage Association |
| LIBOR—London Interbank Offered Rate |
| REMIC—Real Estate Mortgage Investment Conduit |
| SOFR—Secured Overnight Financing Rate |
| TBA—To Be Announced |
| UMBS—Uniform Mortgage Backed Securities |
The notes to the financial statements are an integral part of, and should be read in conjunction with, the financial statements.
| 18 | MainStay VP Bond Portfolio |
The following is a summary of the fair valuations according to the inputs used as of December 31, 2022, for valuing the Portfolio’s assets and liabilities:
| Description | Quoted
Prices in
Active
Markets for
Identical
Assets
(Level 1) | | Significant
Other
Observable
Inputs
(Level 2) | | Significant
Unobservable
Inputs
(Level 3) | | Total |
| Asset Valuation Inputs | | | | | | | |
| Investments in Securities (a) | | | | | | | |
| Long-Term Bonds | | | | | | | |
| Asset-Backed Securities | $ — | | $ 48,111,258 | | $ — | | $ 48,111,258 |
| Corporate Bonds | — | | 196,670,772 | | — | | 196,670,772 |
| Foreign Government Bond | — | | 1,201,525 | | — | | 1,201,525 |
| Mortgage-Backed Securities | — | | 52,439,401 | | — | | 52,439,401 |
| Municipal Bonds | — | | 4,248,586 | | — | | 4,248,586 |
| U.S. Government & Federal Agencies | — | | 370,022,452 | | — | | 370,022,452 |
| Total Long-Term Bonds | — | | 672,693,994 | | — | | 672,693,994 |
| Short-Term Investment | | | | | | | |
| Unaffiliated Investment Company | 2,385,510 | | — | | — | | 2,385,510 |
| Total Investments in Securities | 2,385,510 | | 672,693,994 | | — | | 675,079,504 |
| Other Financial Instruments | | | | | | | |
| Futures Contracts (b) | 755,636 | | — | | — | | 755,636 |
| Total Investments in Securities and Other Financial Instruments | $ 3,141,146 | | $ 672,693,994 | | $ — | | $ 675,835,140 |
| Liability Valuation Inputs | | | | | | | |
| Other Financial Instruments | | | | | | | |
| Futures Contracts (b) | $ (1,452,328) | | $ — | | $ — | | $ (1,452,328) |
| (a) | For a complete listing of investments and their industries, see the Portfolio of Investments. |
| (b) | The value listed for these securities reflects unrealized appreciation (depreciation) as shown on the Portfolio of Investments. |
The notes to the financial statements are an integral part of, and should be read in conjunction with, the financial statements.
19
Statement of Assets and Liabilities as of December 31, 2022
| Assets |
Investment in securities, at value
(identified cost $705,036,190) | $ 675,079,504 |
| Cash | 28,280,617 |
| Cash collateral on deposit at broker for futures contracts | 1,579,869 |
| Receivables: | |
| Investment securities sold | 29,927,257 |
| Interest | 4,198,346 |
| Portfolio shares sold | 36,223 |
| Other assets | 97,522 |
| Total assets | 739,199,338 |
| Liabilities |
| Payables: | |
| Investment securities purchased | 58,379,711 |
| Manager (See Note 3) | 290,467 |
| Variation margin on futures contracts | 125,101 |
| Portfolio shares redeemed | 116,097 |
| NYLIFE Distributors (See Note 3) | 83,842 |
| Shareholder communication | 48,115 |
| Professional fees | 43,188 |
| Custodian | 12,107 |
| Accrued expenses | 15,183 |
| Total liabilities | 59,113,811 |
| Net assets | $ 680,085,527 |
| Composition of Net Assets |
| Shares of beneficial interest outstanding (par value of $.001 per share) unlimited number of shares authorized | $ 56,698 |
| Additional paid-in-capital | 793,494,650 |
| | 793,551,348 |
| Total distributable earnings (loss) | (113,465,821) |
| Net assets | $ 680,085,527 |
| Initial Class | |
| Net assets applicable to outstanding shares | $292,814,532 |
| Shares of beneficial interest outstanding | 24,247,420 |
| Net asset value per share outstanding | $ 12.08 |
| Service Class | |
| Net assets applicable to outstanding shares | $387,270,995 |
| Shares of beneficial interest outstanding | 32,451,058 |
| Net asset value per share outstanding | $ 11.93 |
The notes to the financial statements are an integral part of, and should be read in conjunction with, the financial statements.
| 20 | MainStay VP Bond Portfolio |
Statement of Operations for the year ended December 31, 2022
| Investment Income (Loss) |
| Income | |
| Interest | $ 22,153,199 |
| Dividends | 79,539 |
| Other | 414,664 |
| Total income | 22,647,402 |
| Expenses | |
| Manager (See Note 3) | 3,655,181 |
| Distribution/Service—Service Class (See Note 3) | 1,085,949 |
| Professional fees | 112,357 |
| Custodian | 69,966 |
| Shareholder communication | 46,344 |
| Trustees | 15,741 |
| Miscellaneous | 26,817 |
| Total expenses | 5,012,355 |
| Net investment income (loss) | 17,635,047 |
| Realized and Unrealized Gain (Loss) |
| Net realized gain (loss) on: | |
| Unaffiliated investment transactions | (85,098,825) |
| Futures transactions | (13,935,180) |
| Net realized gain (loss) | (99,034,005) |
| Net change in unrealized appreciation (depreciation) on: | |
| Unaffiliated investments | (41,928,282) |
| Futures contracts | (782,697) |
| Net change in unrealized appreciation (depreciation) | (42,710,979) |
| Net realized and unrealized gain (loss) | (141,744,984) |
| Net increase (decrease) in net assets resulting from operations | $(124,109,937) |
The notes to the financial statements are an integral part of, and should be read in conjunction with, the financial statements.
21
Statements of Changes in Net Assets
for the years ended December 31, 2022 and December 31, 2021
| | 2022 | 2021 |
| Increase (Decrease) in Net Assets |
| Operations: | | |
| Net investment income (loss) | $ 17,635,047 | $ 11,259,628 |
| Net realized gain (loss) | (99,034,005) | 410,682 |
| Net change in unrealized appreciation (depreciation) | (42,710,979) | (25,969,190) |
| Net increase (decrease) in net assets resulting from operations | (124,109,937) | (14,298,880) |
| Distributions to shareholders: | | |
| Initial Class | (5,913,796) | (17,030,411) |
| Service Class | (6,975,813) | (24,548,787) |
| Total distributions to shareholders | (12,889,609) | (41,579,198) |
| Capital share transactions: | | |
| Net proceeds from sales of shares | 90,735,240 | 203,534,486 |
| Net asset value of shares issued to shareholders in reinvestment of distributions | 12,889,609 | 41,579,198 |
| Cost of shares redeemed | (172,961,774) | (245,204,350) |
| Increase (decrease) in net assets derived from capital share transactions | (69,336,925) | (90,666) |
| Net increase (decrease) in net assets | (206,336,471) | (55,968,744) |
| Net Assets |
| Beginning of year | 886,421,998 | 942,390,742 |
| End of year | $ 680,085,527 | $ 886,421,998 |
The notes to the financial statements are an integral part of, and should be read in conjunction with, the financial statements.
| 22 | MainStay VP Bond Portfolio |
Financial Highlights selected per share data and ratios
| | Year Ended December 31, |
| Initial Class | 2022 | | 2021 | | 2020 | | 2019 | | 2018 |
| Net asset value at beginning of year | $ 14.43 | | $ 15.37 | | $ 14.57 | | $ 13.72 | | $ 14.31 |
| Net investment income (loss) (a) | 0.33 | | 0.21 | | 0.28 | | 0.37 | | 0.38 |
| Net realized and unrealized gain (loss) | (2.42) | | (0.42) | | 0.87 | | 0.88 | | (0.53) |
| Total from investment operations | (2.09) | | (0.21) | | 1.15 | | 1.25 | | (0.15) |
| Less distributions: | | | | | | | | | |
| From net investment income | (0.26) | | (0.27) | | (0.31) | | (0.40) | | (0.40) |
| From net realized gain on investments | — | | (0.46) | | (0.04) | | — | | (0.04) |
| Total distributions | (0.26) | | (0.73) | | (0.35) | | (0.40) | | (0.44) |
| Net asset value at end of year | $ 12.08 | | $ 14.43 | | $ 15.37 | | $ 14.57 | | $ 13.72 |
| Total investment return (b) | (14.47)% | | (1.37)% | | 7.94% | | 9.12% | | (1.00)% |
| Ratios (to average net assets)/Supplemental Data: | | | | | | | | | |
| Net investment income (loss) | 2.53% | | 1.39% | | 1.83% | | 2.60% | | 2.76% |
| Net expenses (c) | 0.53% | | 0.52% | | 0.53% | | 0.54% | | 0.53% |
| Portfolio turnover rate (d) | 474% | | 326% | | 255% | | 204% | | 148% |
| Net assets at end of year (in 000's) | $ 292,815 | | $ 366,020 | | $ 412,053 | | $ 341,408 | | $ 307,682 |
| (a) | Per share data based on average shares outstanding during the year. |
| (b) | Total return does not reflect any deduction of sales charges, mortality and expense charges, contract charges or administrative charges. For periods of less than one year, total return is not annualized. |
| (c) | In addition to the fees and expenses which the Portfolio bears directly, it also indirectly bears a pro-rata share of the fees and expenses of the underlying funds in which it invests. Such indirect expenses are not included in the above expense ratios. |
| (d) | The portfolio turnover rates not including mortgage dollar rolls were 438%, 194%, 241%, 197%, and 133% for the years ended December 31, 2022, 2021, 2020, 2019 and 2018, respectively. |
| | Year Ended December 31, |
| Service Class | 2022 | | 2021 | | 2020 | | 2019 | | 2018 |
| Net asset value at beginning of year | $ 14.25 | | $ 15.19 | | $ 14.41 | | $ 13.58 | | $ 14.16 |
| Net investment income (loss) (a) | 0.29 | | 0.17 | | 0.24 | | 0.33 | | 0.35 |
| Net realized and unrealized gain (loss) | (2.39) | | (0.41) | | 0.86 | | 0.87 | | (0.53) |
| Total from investment operations | (2.10) | | (0.24) | | 1.10 | | 1.20 | | (0.18) |
| Less distributions: | | | | | | | | | |
| From net investment income | (0.22) | | (0.24) | | (0.28) | | (0.37) | | (0.36) |
| From net realized gain on investments | — | | (0.46) | | (0.04) | | — | | (0.04) |
| Total distributions | (0.22) | | (0.70) | | (0.32) | | (0.37) | | (0.40) |
| Net asset value at end of year | $ 11.93 | | $ 14.25 | | $ 15.19 | | $ 14.41 | | $ 13.58 |
| Total investment return (b) | (14.68)% | | (1.62)% | | 7.67% | | 8.85% | | (1.25)% |
| Ratios (to average net assets)/Supplemental Data: | | | | | | | | | |
| Net investment income (loss) | 2.26% | | 1.14% | | 1.57% | | 2.34% | | 2.53% |
| Net expenses (c) | 0.78% | | 0.77% | | 0.78% | | 0.79% | | 0.78% |
| Portfolio turnover rate (d) | 474% | | 326% | | 255% | | 204% | | 148% |
| Net assets at end of year (in 000's) | $ 387,271 | | $ 520,402 | | $ 530,338 | | $ 427,338 | | $ 323,100 |
| (a) | Per share data based on average shares outstanding during the year. |
| (b) | Total return does not reflect any deduction of sales charges, mortality and expense charges, contract charges or administrative charges. For periods of less than one year, total return is not annualized. |
| (c) | In addition to the fees and expenses which the Portfolio bears directly, it also indirectly bears a pro-rata share of the fees and expenses of the underlying funds in which it invests. Such indirect expenses are not included in the above expense ratios. |
| (d) | The portfolio turnover rates not including mortgage dollar rolls were 438%, 194%, 241%, 197%, and 133% for the years ended December 31, 2022, 2021, 2020, 2019 and 2018, respectively. |
The notes to the financial statements are an integral part of, and should be read in conjunction with, the financial statements.
23
Notes to Financial Statements
Note 1–Organization and Business
MainStay VP Funds Trust (the “Fund”) was organized as a Delaware statutory trust on February 1, 2011. The Fund is registered under the Investment Company Act of 1940, as amended (the “1940 Act”), as an open-end management investment company. The Fund is comprised of thirty-one separate series (collectively referred to as the “Portfolios”). These financial statements and notes relate to the MainStay VP Bond Portfolio (the "Portfolio"), a "diversified” portfolio, as that term is defined in the 1940 Act, as interpreted or modified by regulatory authorities having jurisdiction, from time to time.
Shares of the Portfolio are currently offered to certain separate accounts to fund variable annuity policies and variable universal life insurance policies issued by New York Life Insurance and Annuity Corporation (“NYLIAC”), a wholly-owned subsidiary of New York Life Insurance Company (“New York Life”) and may also be offered to fund variable annuity policies and variable universal life insurance policies issued by other insurance companies. NYLIAC allocates shares of the Portfolio to, among others, certain NYLIAC separate accounts. Shares of the Portfolio are also offered to the MainStay VP Conservative Allocation Portfolio, MainStay VP Moderate Allocation Portfolio, MainStay VP Growth Allocation Portfolio and MainStay VP Equity Allocation Portfolio, which operate as “funds-of-funds," and other variable insurance funds.
The following table lists the Portfolio's share classes that have been registered and commenced operations:
| Class | Commenced Operations |
| Initial Class | January 23, 1984 |
| Service Class | June 4, 2003 |
Shares of the Portfolio are offered and are redeemed at a price equal to their respective net asset value (“NAV”) per share. No sales or redemption charge is applicable to the purchase or redemption of the Portfolio's shares. Under the terms of the Fund’s multiple class plan, adopted pursuant to Rule 18f-3 under the 1940 Act, the classes differ in that, among other things, Service Class shares of the Portfolio pay a combined distribution and service fee of 0.25% of average daily net assets attributable to Service Class shares of the Portfolio to the Distributor (as defined in Note 3(B)) pursuant to a plan adopted in accordance with Rule 12b-1 under the 1940 Act. Contract owners of variable annuity contracts purchased after June 2, 2003, are permitted to invest only in the Service Class shares.
The Portfolio's investment objective is to seek total return.
Note 2–Significant Accounting Policies
The Portfolio is an investment company and accordingly follows the investment company accounting and reporting guidance of the Financial Accounting Standards Board (“FASB”) Accounting Standards Codification Topic 946 Financial Services—Investment Companies. The Portfolio prepares its financial statements in accordance with generally accepted
accounting principles (“GAAP”) in the United States of America and follows the significant accounting policies described below.
(A) Securities Valuation. Investments are usually valued as of the close of regular trading on the New York Stock Exchange (the "Exchange") (usually 4:00 p.m. Eastern time) on each day the Portfolio is open for business ("valuation date").
Effective September 8, 2022, and pursuant to Rule 2a-5 under the 1940 Act, the Board of Trustees of the Fund (the "Board") designated New York Life Investment Management LLC (“New York Life Investments” or the "Manager") as its Valuation Designee (the "Valuation Designee"). The Valuation Designee is responsible for performing fair valuations relating to all investments in the Portfolio’s portfolio for which market quotations are not readily available; periodically assessing and managing material valuation risks; establishing and applying fair value methodologies; testing fair valuation methodologies; evaluating and overseeing pricing services; ensuring appropriate segregation of valuation and portfolio management functions; providing quarterly, annual and prompt reporting to the Board, as appropriate; identifying potential conflicts of interest; and maintaining appropriate records. The Valuation Designee has established a valuation committee ("Valuation Committee") to assist in carrying out the Valuation Designee’s responsibilities and establish prices of securities for which market quotations are not readily available. The Portfolio’s and the Valuation Designee's policies and procedures ("Valuation Procedures") govern the Valuation Designee’s selection and application of methodologies for determining and calculating the fair value of Portfolio investments. The Valuation Designee may value the Portfolio's portfolio securities for which market quotations are not readily available and other Portfolio assets utilizing inputs from pricing services and other third-party sources (together, “Pricing Sources”). The Valuation Committee meets (in person, via electronic mail or via teleconference) on an ad-hoc basis to determine fair valuations and on a quarterly basis to review fair value events with respect to certain securities for which market quotations are not readily available, including valuation risks and back-testing results, and preview reports to the Board.
The Valuation Committee establishes prices of securities for which market quotations are not readily available based on such methodologies and measurements on a regular basis after considering information that is reasonably available and deemed relevant by the Valuation Committee. The Board shall oversee the Valuation Designee and review fair valuation materials on a prompt, quarterly and annual basis and approve proposed revisions to the Valuation Procedures.
Investments for which market quotations are not readily available are valued at fair value as determined in good faith pursuant to the Valuation Procedures. A market quotation is readily available only when that quotation is a quoted price (unadjusted) in active markets for identical investments that the Portfolio can access at the measurement date, provided that a quotation will not be readily available if it is not reliable. "Fair value" is defined as the price the Portfolio would reasonably expect to receive upon selling an asset or liability in an orderly transaction to an independent buyer in the principal or most advantageous market for the
| 24 | MainStay VP Bond Portfolio |
asset or liability. Fair value measurements are determined within a framework that establishes a three-tier hierarchy that maximizes the use of observable market data and minimizes the use of unobservable inputs to establish a classification of fair value measurements for disclosure purposes. "Inputs" refer broadly to the assumptions that market participants would use in pricing the asset or liability, including assumptions about risk, such as the risk inherent in a particular valuation technique used to measure fair value using a pricing model and/or the risk inherent in the inputs for the valuation technique. Inputs may be observable or unobservable. Observable inputs reflect the assumptions market participants would use in pricing the asset or liability based on market data obtained from sources independent of the Portfolio. Unobservable inputs reflect the Portfolio’s own assumptions about the assumptions market participants would use in pricing the asset or liability based on the information available. The inputs or methodology used for valuing assets or liabilities may not be an indication of the risks associated with investing in those assets or liabilities. The three-tier hierarchy of inputs is summarized below.
| • | Level 1—quoted prices (unadjusted) in active markets for an identical asset or liability |
| • | Level 2—other significant observable inputs (including quoted prices for a similar asset or liability in active markets, interest rates and yield curves, prepayment speeds, credit risk, etc.) |
| • | Level 3—significant unobservable inputs (including the Portfolio's own assumptions about the assumptions that market participants would use in measuring fair value of an asset or liability) |
The level of an asset or liability within the fair value hierarchy is based on the lowest level of an input, both individually and in the aggregate, that is significant to the fair value measurement. The aggregate value by input level of the Portfolio’s assets and liabilities as of December 31, 2022, is included at the end of the Portfolio of Investments.
The Portfolio may use third-party vendor evaluations, whose prices may be derived from one or more of the following standard inputs, among others:
| • Benchmark yields | • Reported trades |
| • Broker/dealer quotes | • Issuer spreads |
| • Two-sided markets | • Benchmark securities |
| • Bids/offers | • Reference data (corporate actions or material event notices) |
| • Industry and economic events | • Comparable bonds |
| • Monthly payment information | |
An asset or liability for which a market quotation is not readily available is valued by methods deemed reasonable in good faith by the Valuation Committee, following the Valuation Procedures to represent fair value. Under these procedures, the Valuation Designee generally uses a market-based approach which may use related or comparable assets or liabilities, recent transactions, market multiples, book values and other relevant information. The Valuation Designee may also use an
income-based valuation approach in which the anticipated future cash flows of the asset or liability are discounted to calculate fair value. Discounts may also be applied due to the nature and/or duration of any restrictions on the disposition of the asset or liability. Fair value represents a good faith approximation of the value of a security. Fair value determinations involve the consideration of a number of subjective factors, an analysis of applicable facts and circumstances and the exercise of judgment. As a result, it is possible that the fair value for a security determined in good faith in accordance with the Valuation Procedures may differ from valuations for the same security determined for other funds using their own valuation procedures. Although the Valuation Procedures are designed to value a security at the price the Portfolio may reasonably expect to receive upon the security's sale in an orderly transaction, there can be no assurance that any fair value determination thereunder would, in fact, approximate the amount that the Portfolio would actually realize upon the sale of the security or the price at which the security would trade if a reliable market price were readily available. During the year ended December 31, 2022, there were no material changes to the fair value methodologies.
Securities which may be valued in this manner include, but are not limited to: (i) a security for which trading has been halted or suspended or otherwise does not have a readily available market quotation on a given day; (ii) a debt security that has recently gone into default and for which there is not a current market quotation; (iii) a security of an issuer that has entered into a restructuring; (iv) a security that has been delisted from a national exchange; (v) a security subject to trading collars for which no or limited trading takes place; and (vi) a security whose principal market has been temporarily closed at a time when, under normal conditions, it would be open. Securities valued in this manner are generally categorized as Level 2 or 3 in the hierarchy.
Investments in mutual funds, including money market funds, are valued at their respective NAVs at the close of business each day on the valuation date. These securities are generally categorized as Level 1 in the hierarchy.
Futures contracts are valued at the last posted settlement price on the market where such futures are primarily traded. These securities are generally categorized as Level 1 in the hierarchy.
Debt securities (other than convertible and municipal bonds) are valued at the evaluated bid prices (evaluated mean prices in the case of convertible and municipal bonds) supplied by a pricing agent or broker selected by the Valuation Designee, in consultation with the Subadvisor. The evaluations are market-based measurements processed through a pricing application and represents the pricing agent’s good faith determination as to what a holder may receive in an orderly transaction under market conditions. The rules-based logic utilizes valuation techniques that reflect participants’ assumptions and vary by asset class and per methodology, maximizing the use of relevant observable data including quoted prices for similar assets, benchmark yield curves and market corroborated inputs. The evaluated bid or mean prices are deemed by the Valuation Designee, in consultation with the Subadvisor, to be representative of
Notes to Financial Statements (continued)
market values at the regular close of trading of the Exchange on each valuation date. Debt securities purchased on a delayed delivery basis are marked to market daily until settlement at the forward settlement date. Debt securities, including corporate bonds, U.S. government and federal agency bonds, municipal bonds, foreign bonds, convertible bonds, asset-backed securities and mortgage-backed securities are generally categorized as Level 2 in the hierarchy.
Temporary cash investments acquired in excess of 60 days to maturity at the time of purchase are valued using the latest bid prices or using valuations based on a matrix system (which considers such factors as security prices, yields, maturities and ratings), both as furnished by independent pricing services. Temporary cash investments that mature in 60 days or less at the time of purchase ("Short-Term Investments") are valued using the amortized cost method of valuation, unless the use of such method would be inappropriate. The amortized cost method involves valuing a security at its cost on the date of purchase and thereafter assuming a constant amortization to maturity of the difference between such cost and the value on maturity date. Amortized cost approximates the current fair value of a security. Securities valued using the amortized cost method are not valued using quoted prices in an active market and are generally categorized as Level 2 in the hierarchy.
The information above is not intended to reflect an exhaustive list of the methodologies that may be used to value portfolio investments. The Valuation Procedures permit the use of a variety of valuation methodologies in connection with valuing portfolio investments. The methodology used for a specific type of investment may vary based on the market data available or other considerations. The methodologies summarized above may not represent the specific means by which portfolio investments are valued on any particular business day.
(B) Income Taxes. The Portfolio's policy is to comply with the requirements of the Internal Revenue Code of 1986, as amended (the “Internal Revenue Code”), applicable to regulated investment companies and to distribute all of its taxable income to the shareholders of the Portfolio within the allowable time limits.
The Manager evaluates the Portfolio’s tax positions to determine if the tax positions taken meet the minimum recognition threshold in connection with accounting for uncertainties in income tax positions taken or expected to be taken for the purposes of measuring and recognizing tax liabilities in the financial statements. Recognition of tax benefits of an uncertain tax position is permitted only to the extent the position is “more likely than not” to be sustained assuming examination by taxing authorities. The Manager analyzed the Portfolio's tax positions taken on federal, state and local income tax returns for all open tax years (for up to three tax years) and has concluded that no provisions for federal, state and local income tax are required in the Portfolio's financial statements. The Portfolio's federal, state and local income tax and federal excise tax returns for tax years for which the applicable statutes of limitations have not expired are subject to examination by the Internal Revenue Service and state and local departments of revenue.
(C) Dividends and Distributions to Shareholders. Dividends and distributions are recorded on the ex-dividend date. The Portfolio intends to declare and pay dividends from net investment income and distributions from net realized capital and currency gains, if any, at least annually. All dividends and distributions are reinvested at NAV in the same class of shares of the Portfolio. Dividends and distributions to shareholders are determined in accordance with federal income tax regulations and may differ from determinations using GAAP.
(D) Security Transactions and Investment Income. The Portfolio records security transactions on the trade date. Realized gains and losses on security transactions are determined using the identified cost method. Dividend income is recognized on the ex-dividend date, net of any foreign tax withheld at the source, and interest income is accrued as earned using the effective interest rate method and includes any realized gains and losses from repayments of principal on mortgage-backed securities. Discounts and premiums on securities purchased for the Portfolio are accreted and amortized, respectively, on the effective interest rate method.
Investment income and realized and unrealized gains and losses on investments of the Portfolio are allocated pro rata to the separate classes of shares based upon their relative net assets on the date the income is earned or realized and unrealized gains and losses are incurred.
The Portfolio may place a debt security on non-accrual status and reduce related interest income by ceasing current accruals and writing off all or a portion of any interest receivables when the collection of all or a portion of such interest has become doubtful. A debt security is removed from non-accrual status when the issuer resumes interest payments or when collectability of interest is reasonably assured.
(E) Expenses. Expenses of the Fund are allocated to the individual Portfolios in proportion to the net assets of the respective Portfolios when the expenses are incurred, except where direct allocations of expenses can be made. Expenses (other than fees incurred under the distribution and service plans, further discussed in Note 3(B), which are charged directly to the Service Class shares) are allocated to separate classes of shares pro rata based upon their relative net assets on the date the expenses are incurred. The expenses borne by the Portfolio, including those of related parties to the Portfolio, are shown in the Statement of Operations.
Additionally, the Portfolio may invest in mutual funds, which are subject to management fees and other fees that may cause the costs of investing in mutual funds to be greater than the costs of owning the underlying securities directly. These indirect expenses of mutual funds are not included in the amounts shown as expenses in the Statement of Operations or in the expense ratios included in the Financial Highlights.
(F) Use of Estimates. In preparing financial statements in conformity with GAAP, the Manager makes estimates and assumptions that affect the reported amounts and disclosures in the financial statements. Actual results could differ from those estimates and assumptions.
| 26 | MainStay VP Bond Portfolio |
(G) Futures Contracts. A futures contract is an agreement to purchase or sell a specified quantity of an underlying instrument at a specified future date and price, or to make or receive a cash payment based on the value of a financial instrument (e.g., foreign currency, interest rate, security or securities index). The Portfolio is subject to risks such as market price risk, leverage risk, liquidity risk, counterparty risk, operational risk, legal risk and/or interest rate risk in the normal course of investing in these contracts. Upon entering into a futures contract, the Portfolio is required to pledge to the broker or futures commission merchant an amount of cash and/or U.S. government securities equal to a certain percentage of the collateral amount, known as the “initial margin.” During the period the futures contract is open, changes in the value of the contract are recognized as unrealized appreciation or depreciation by marking to market such contract on a daily basis to reflect the market value of the contract at the end of each day’s trading. The Portfolio agrees to receive from or pay to the broker or futures commission merchant an amount of cash equal to the daily fluctuation in the value of the contract. Such receipts or payments are known as “variation margin.” When the futures contract is closed, the Portfolio records a realized gain or loss equal to the difference between the proceeds from (or cost of) the closing transaction and the Portfolio's basis in the contract.
The use of futures contracts involves, to varying degrees, elements of market risk in excess of the amount recognized in the Statement of Assets and Liabilities. The contract or notional amounts and variation margin reflect the extent of the Portfolio's involvement in open futures positions. There are several risks associated with the use of futures contracts as hedging techniques. There can be no assurance that a liquid market will exist at the time when the Portfolio seeks to close out a futures contract. If no liquid market exists, the Portfolio would remain obligated to meet margin requirements until the position is closed. Futures contracts may involve a small initial investment relative to the risk assumed, which could result in losses greater than if the Portfolio did not invest in futures contracts. Futures contracts may be more volatile than direct investments in the instrument underlying the futures and may not correlate to the underlying instrument, causing a given hedge not to achieve its objectives. The Portfolio's activities in futures contracts have minimal counterparty risk as they are conducted through regulated exchanges that guarantee the futures against default by the counterparty. In the event of a bankruptcy or insolvency of a futures commission merchant that holds margin on behalf of the Portfolio, the Portfolio may not be entitled to the return of the entire margin owed to the Portfolio, potentially resulting in a loss. The Portfolio may invest in futures contracts to seek enhanced returns or to reduce the risk of loss by hedging certain of its holdings. The Portfolio's investment in futures contracts and other derivatives may increase the volatility of the Portfolio's NAVs and may result in a loss to the Portfolio. Open futures contracts as of December 31, 2022, are shown in the Portfolio of Investments.
(H) Dollar Rolls. The Portfolio may enter into dollar roll transactions in which it sells mortgage-backed securities ("MBS") from its portfolio to a counterparty from whom it simultaneously agrees to buy a similar security
on a delayed delivery basis. The Portfolio generally transfers MBS where the MBS are "to be announced," therefore, the Portfolio accounts for these transactions as purchases and sales.
When accounted for as purchase and sales, the securities sold in connection with the dollar rolls are removed from the portfolio and a realized gain or loss is recognized. The securities the Portfolio has agreed to acquire are included at market value in the Portfolio of Investments and liabilities for such purchase commitments are included as payables for investments purchased. During the roll period, the Portfolio foregoes principal and interest paid on the securities. The Portfolio is compensated by the difference between the current sales price and the forward price for the future as well as by the earnings on the cash proceeds of the initial sale. Dollar rolls may be renewed without physical delivery of the securities subject to the contract. Dollar roll transactions involve certain risks, including the risk that the securities returned to the Portfolio at the end of the roll period, while substantially similar, could be inferior to what was initially sold to the counterparty.
(I) Delayed Delivery Transactions. The Portfolio may purchase or sell securities on a delayed delivery basis. These transactions involve a commitment by the Portfolio to purchase or sell securities for a predetermined price or yield, with payment and delivery taking place beyond the customary settlement period. When delayed delivery purchases are outstanding, the Portfolio will designate liquid assets in an amount sufficient to meet the purchase price. When purchasing a security on a delayed delivery basis, the Portfolio assumes the rights and risks of ownership of the security, including the risk of price and yield fluctuations, and takes such fluctuations into account when determining its NAV. The Portfolio may dispose of or renegotiate a delayed delivery transaction after it is entered into, and may sell delayed delivery securities before they are delivered, which may result in a realized gain or loss. When the Portfolio has sold a security it owns on a delayed delivery basis, the Portfolio does not participate in future gains and losses with respect to the security. Delayed delivery transactions as of December 31, 2022, are shown in the Portfolio of Investments.
(J) Debt Securities Risk. The ability of issuers of debt securities held by the Portfolio to meet their obligations may be affected by, among other things, economic or political developments in a specific country, industry or region. Debt securities are also subject to the risks associated with changes in interest rates.
Investments in the Portfolio are not guaranteed, even though some of the Portfolio’s underlying investments are guaranteed by the U.S. government or its agencies or instrumentalities. The principal risk of mortgage-related and asset-backed securities is that the underlying debt may be prepaid ahead of schedule, if interest rates fall, thereby reducing the value of the Portfolio’s investment. If interest rates rise, less of the debt may be prepaid and the Portfolio may lose money because the Portfolio may be unable to invest in higher yielding assets. The Portfolio is subject to interest-rate risk and can lose principal value when interest rates rise. Bonds are also subject to credit risk, in which the bond issuer may fail to pay interest and principal in a timely manner.
Notes to Financial Statements (continued)
The Portfolio may invest in foreign debt securities, which carry certain risks that are in addition to the usual risks inherent in domestic instruments. These risks include those resulting from currency fluctuations, future adverse political or economic developments and possible imposition of currency exchange blockages or other foreign governmental laws or restrictions. These risks are likely to be greater in emerging markets than in developed markets.
(K) LIBOR Replacement Risk. The Portfolio may invest in certain debt securities, derivatives or other financial instruments that utilize the London Interbank Offered Rate ("LIBOR"), as a “benchmark” or “reference rate” for various interest rate calculations. As of January 1, 2022, the United Kingdom Financial Conduct Authority, which regulates LIBOR, ceased its active encouragement of banks to provide the quotations needed to sustain most LIBOR rates due to the absence of an active market for interbank unsecured lending and other reasons. However, the United Kingdom Financial Conduct Authority, the LIBOR administrator and other regulators announced that the most widely used tenors of U.S. dollar LIBOR will continue until mid-2023. As a result, it is anticipated that the remaining LIBOR settings will be discontinued or will no longer be sufficiently robust to be representative of its underlying market around that time. Various financial industry groups will plan for that transition and certain regulators and industry groups have taken actions to establish alternative reference rates (e.g., the Secured Overnight Financing Rate, which measures the cost of overnight borrowings through repurchase agreement transactions collateralized with U.S. Treasury securities and is intended to replace U.S. dollar LIBOR with certain adjustments). However, there are challenges to converting certain contracts and transactions to a new benchmark and neither the full effects of the transition process nor its ultimate outcome is known.
The elimination of LIBOR or changes to other reference rates or any other changes or reforms to the determination or supervision of reference rates could have an adverse impact on the market for, or value of, any securities or payments linked to those reference rates, which may adversely affect the Portfolio's performance and/or net asset value. Uncertainty and risk also remain regarding the willingness and ability of issuers and lenders to include enhanced provisions in new and existing contracts or instruments. Consequently, the transition away from LIBOR to other reference rates may lead to increased volatility and illiquidity in markets that are tied to LIBOR, fluctuations in values of LIBOR-related investments or investments in issuers that utilize LIBOR, increased difficulty in borrowing or refinancing and diminished effectiveness of hedging strategies, adversely affecting the Portfolio's performance. Furthermore, the risks associated with the expected discontinuation of LIBOR and transition may be exacerbated if the work necessary to effect an orderly transition to an alternative reference rate is not completed in a timely manner. While the transition away from LIBOR has already begun with no material adverse effect to the Portfolio's performance, the transition is expected to last through mid-2023 for some LIBOR tenors. The usefulness of LIBOR as a benchmark could deteriorate anytime during this transition period.
(L) Indemnifications. Under the Fund’s organizational documents, its officers and trustees are indemnified against certain liabilities that may arise out of performance of their duties to the Fund. Additionally, in the normal course of business, the Portfolio enters into contracts with third-party service providers that contain a variety of representations and warranties and that may provide general indemnifications. The Portfolio's maximum exposure under these arrangements is unknown, as this would involve future claims that may be made against the Portfolio that have not yet occurred. The Manager believes that the risk of loss in connection with these potential indemnification obligations is remote. However, there can be no assurance that material liabilities related to such obligations will not arise in the future, which could adversely impact the Portfolio.
(M) Quantitative Disclosure of Derivative Holdings. The following tables show additional disclosures related to the Portfolio's derivative and hedging activities, including how such activities are accounted for and their effect on the Portfolio's financial positions, performance and cash flows.
The Portfolio entered into futures contracts in order to hedge against anticipated changes in interest rates that might otherwise have an adverse effect upon the value of the Portfolio's securities as well as help manage the duration and yield curve positioning of the portfolio. These derivatives are not accounted for as hedging instruments.
Fair value of derivative instruments as of December 31, 2022:
| Asset Derivatives | Interest
Rate
Contracts
Risk | Total |
| Futures Contracts - Net Assets—Net unrealized appreciation on futures contracts (a) | $755,636 | $755,636 |
| Total Fair Value | $755,636 | $755,636 |
| (a) | Includes cumulative appreciation (depreciation) of futures contracts as reported in the Portfolio of Investments. Only current day’s variation margin is reported within the Statement of Assets and Liabilities. |
| Liability Derivatives | Interest
Rate
Contracts
Risk | Total |
| Futures Contracts - Net Assets—Net unrealized depreciation on futures contracts (a) | $(1,452,328) | $(1,452,328) |
| Total Fair Value | $(1,452,328) | $(1,452,328) |
| (a) | Includes cumulative appreciation (depreciation) of futures contracts as reported in the Portfolio of Investments. Only current day’s variation margin is reported within the Statement of Assets and Liabilities. |
| 28 | MainStay VP Bond Portfolio |
The effect of derivative instruments on the Statement of Operations for the year ended December 31, 2022:
| Net Realized Gain (Loss) from: | Interest
Rate
Contracts
Risk | Total |
| Futures Contracts | $(13,935,180) | $(13,935,180) |
| Total Net Realized Gain (Loss) | $(13,935,180) | $(13,935,180) |
| Net Change in Unrealized Appreciation (Depreciation) | Interest
Rate
Contracts
Risk | Total |
| Futures Contracts | $(782,697) | $(782,697) |
| Total Net Change in Unrealized Appreciation (Depreciation) | $(782,697) | $(782,697) |
| Average Notional Amount | Total |
| Futures Contracts Long | $ 71,411,811 |
| Futures Contracts Short | $(58,497,903) |
Note 3–Fees and Related Party Transactions
(A) Manager and Subadvisor. New York Life Investments, a registered investment adviser and an indirect, wholly-owned subsidiary of New York Life, serves as the Portfolio's Manager pursuant to an Amended and Restated Management Agreement ("Management Agreement"). The Manager provides offices, conducts clerical, recordkeeping and bookkeeping services and keeps most of the financial and accounting records required to be maintained by the Portfolio. Except for the portion of salaries and expenses that are the responsibility of the Portfolio, the Manager pays the salaries and expenses of all personnel affiliated with the Portfolio and certain operational expenses of the Portfolio. During a portion of the year ended December 31, 2022, the Portfolio reimbursed New York Life Investments in an amount equal to the portion of the compensation of the Chief Compliance Officer attributable to the Portfolio. NYL Investors LLC ("NYL Investors" or ''Subadvisor''), a registered investment adviser and a direct, wholly-owned subsidiary of New York Life, serves as the Subadvisor to the Portfolio and is responsible for the day-to-day portfolio management of the Portfolio. Pursuant to the terms of a Subadvisory Agreement between New York Life Investments and NYL Investors, New York Life Investments pays for the services of the Subadvisor.
Pursuant to the Management Agreement, the Fund pays the Manager, on behalf of the Portfolio, a monthly fee for the services performed and the facilities furnished at an annual rate of the Portfolio's average daily net assets as follows: 0.50% up to $500 million; 0.475% from $500 million to $1 billion; 0.45% from $1 billion to $3 billion; and 0.44% in excess of $3 billion. During the year ended December 31, 2022, the effective management fee rate was 0.49%.
During the year ended December 31, 2022, New York Life Investments earned fees from the Portfolio in the amount of $3,655,181 and paid the Subadvisor fees of $1,827,591.
JPMorgan Chase Bank, N.A. ("JPMorgan") provides sub-administration and sub-accounting services to the Portfolio pursuant to an agreement with New York Life Investments. These services include calculating the daily NAVs of the Portfolio, maintaining the general ledger and sub-ledger accounts for the calculation of the Portfolio's NAVs, and assisting New York Life Investments in conducting various aspects of the Portfolio's administrative operations. For providing these services to the Portfolio, JPMorgan is compensated by New York Life Investments.
Pursuant to an agreement between the Fund and New York Life Investments, New York Life Investments is responsible for providing or procuring certain regulatory reporting services for the Portfolio. The Portfolio will reimburse New York Life Investments for the actual costs incurred by New York Life Investments in connection with providing or procuring these services for the Portfolio.
(B) Distribution and Service Fees. The Fund, on behalf of the Portfolio, has entered into a distribution agreement with NYLIFE Distributors LLC (the “Distributor”), an affiliate of New York Life Investments. The Portfolio has adopted a distribution plan (the “Plan”) in accordance with the provisions of Rule 12b-1 under the 1940 Act. Under the Plan, the Distributor has agreed to provide, through its affiliates or independent third parties, various distribution-related, shareholder and administrative support services to the Service Class shareholders. For its services, the Distributor is entitled to a combined distribution and service fee accrued daily and paid monthly at an annual rate of 0.25% of the average daily net assets attributable to the Service Class shares of the Portfolio.
Note 4-Federal Income Tax
As of December 31, 2022, the cost and unrealized appreciation (depreciation) of the Portfolio’s investment portfolio, including applicable derivative contracts and other financial instruments, as determined on a federal income tax basis, were as follows:
| | Federal Tax
Cost | Gross
Unrealized
Appreciation | Gross
Unrealized
(Depreciation) | Net
Unrealized
Appreciation/
(Depreciation) |
| Investments in Securities | $705,708,510 | $1,713,542 | $(32,345,350) | $(30,631,808) |
As of December 31, 2022, the components of accumulated gain (loss) on a tax basis were as follows:
Ordinary
Income | Accumulated
Capital
and Other
Gain (Loss) | Other
Temporary
Differences | Unrealized
Appreciation
(Depreciation) | Total
Accumulated
Gain (Loss) |
| $18,247,857 | $(101,084,672) | $— | $(30,629,006) | $(113,465,821) |
Notes to Financial Statements (continued)
The difference between book-basis and tax-basis unrealized appreciation (depreciation) is primarily due to mark to market of futures contracts, wash sale and cumulative bond amortization adjustments.
As of December 31, 2022, for federal income tax purposes, capital loss carryforwards of $101,081,870, as shown in the table below, were available to the extent provided by the regulations to offset future realized gains of the Portfolio. Accordingly, no capital gains distributions are expected to be paid to shareholders until net gains have been realized in excess of such amounts.
Capital Loss
Available Through | Short-Term
Capital Loss
Amounts (000’s) | Long-Term
Capital Loss
Amounts (000’s) |
| Unlimited | $54,126 | $46,956 |
During the years ended December 31, 2022 and December 31, 2021, the tax character of distributions paid as reflected in the Statements of Changes in Net Assets was as follows:
| | 2022 | 2021 |
| Distributions paid from: | | |
| Ordinary Income | $12,889,609 | $37,258,730 |
| Long-Term Capital Gains | — | 4,320,468 |
| Total | $12,889,609 | $41,579,198 |
Note 5–Custodian
JPMorgan is the custodian of cash and securities held by the Portfolio. Custodial fees are charged to the Portfolio based on the Portfolio's net assets and/or the market value of securities held by the Portfolio and the number of certain transactions incurred by the Portfolio.
Note 6–Line of Credit
The Portfolio and certain other funds managed by New York Life Investments maintain a line of credit with a syndicate of banks in order to secure a source of funds for temporary purposes to meet unanticipated or excessive redemption requests.
Effective July 26, 2022, under the credit agreement (the “Credit Agreement”), the aggregate commitment amount is $600,000,000 with an additional uncommitted amount of $100,000,000. The commitment fee is an annual rate of 0.15% of the average commitment amount payable quarterly, regardless of usage, to JPMorgan, who serves as the agent to the syndicate. The commitment fee is allocated among the Portfolio and certain other funds managed by New York Life Investments based upon their respective net assets and other factors. Interest on any revolving credit loan is charged based upon the Federal Funds Rate, Daily Simple Secured Overnight Financing Rate ("SOFR") + 0.10%, or the Overnight Bank Funding Rate, whichever is higher. The Credit Agreement expires on July 25, 2023, although the Portfolio, certain other funds managed by New York Life Investments and the syndicate of banks may renew the Credit Agreement for an additional year on the same or different terms or enter into a credit agreement with a different syndicate of banks. Prior to July 26, 2022, the aggregate commitment amount and
the commitment fee were the same as those under the current Credit Agreement. During the year ended December 31, 2022, there were no borrowings made or outstanding with respect to the Portfolio under the Credit Agreement.
Note 7–Interfund Lending Program
Pursuant to an exemptive order issued by the SEC, the Portfolio, along with certain other funds managed by New York Life Investments, may participate in an interfund lending program. The interfund lending program provides an alternative credit facility that permits the Portfolio and certain other funds managed by New York Life Investments to lend or borrow money for temporary purposes directly to or from one another, subject to the conditions of the exemptive order. During the year ended December 31, 2022, there were no interfund loans made or outstanding with respect to the Portfolio.
Note 8–Purchases and Sales of Securities (in 000’s)
During the year ended December 31, 2022, purchases and sales of U.S. government securities were $1,735,996 and $1,623,291, respectively. Purchases and sales of securities, other than U.S. government securities and short-term securities, were $1,742,956 and $1,926,790, respectively.
Note 9–Capital Share Transactions
Transactions in capital shares for the years ended December 31, 2022 and December 31, 2021, were as follows:
| Initial Class | Shares | Amount |
| Year ended December 31, 2022: | | |
| Shares sold | 5,245,388 | $ 67,757,317 |
| Shares issued to shareholders in reinvestment of distributions | 502,562 | 5,913,796 |
| Shares redeemed | (6,872,142) | (89,940,899) |
| Net increase (decrease) | (1,124,192) | $ (16,269,786) |
| Year ended December 31, 2021: | | |
| Shares sold | 9,136,685 | $ 137,110,246 |
| Shares issued to shareholders in reinvestment of distributions | 1,181,429 | 17,030,411 |
| Shares redeemed | (11,757,317) | (177,394,270) |
| Net increase (decrease) | (1,439,203) | $ (23,253,613) |
| |
| 30 | MainStay VP Bond Portfolio |
| Service Class | Shares | Amount |
| Year ended December 31, 2022: | | |
| Shares sold | 1,796,487 | $ 22,977,923 |
| Shares issued to shareholders in reinvestment of distributions | 599,549 | 6,975,813 |
| Shares redeemed | (6,472,414) | (83,020,875) |
| Net increase (decrease) | (4,076,378) | $ (53,067,139) |
| Year ended December 31, 2021: | | |
| Shares sold | 4,474,396 | $ 66,424,240 |
| Shares issued to shareholders in reinvestment of distributions | 1,723,447 | 24,548,787 |
| Shares redeemed | (4,585,159) | (67,810,080) |
| Net increase (decrease) | 1,612,684 | $ 23,162,947 |
Note 10–Other Matters
As of the date of this report, interest rates in the United States and many parts of the world, including certain European countries, are ascending from historically low levels. Thus, the Portfolio currently faces a heightened level of risk associated with rising interest rates. This could be driven by a variety of factors, including but not limited to central bank monetary policies, changing inflation or real growth rates, general economic conditions, increasing bond issuances or reduced market demand for low yielding investments.
An outbreak of COVID-19, first detected in December 2019, has developed into a global pandemic and has resulted in travel restrictions, closure of international borders, certain businesses and securities markets, restrictions on securities trading activities, prolonged quarantines, supply chain disruptions, and lower consumer demand, as well as general concern and uncertainty. In 2022, many countries lifted some or all restrictions related to COVID-19. However, the continued impact of COVID-19 and related variants is uncertain and could further adversely affect the global economy, national economies, individual issuers and capital markets in unforeseeable ways and result in a substantial and extended economic downturn. Developments that disrupt global economies and financial markets, such as COVID-19, may magnify factors that affect the Portfolio's performance.
Note 11–Subsequent Events
In connection with the preparation of the financial statements of the Portfolio as of and for the year ended December 31, 2022, events and transactions subsequent to December 31, 2022, through the date the financial statements were issued have been evaluated by the Manager for possible adjustment and/or disclosure. No subsequent events requiring financial statement adjustment or disclosure have been identified.
Report of Independent Registered Public Accounting Firm
To the Board of Trustees of MainStay VP Funds Trust and Shareholders of
MainStay VP Bond Portfolio
Opinion on the Financial Statements
We have audited the accompanying statement of assets and liabilities, including the portfolio of investments, of MainStay VP Bond Portfolio (one of the portfolios constituting MainStay VP Funds Trust, referred to hereafter as the “Portfolio”) as of December 31, 2022, the related statement of operations for the year ended December 31, 2022, the statements of changes in net assets for each of the two years in the period ended December 31, 2022, including the related notes, and the financial highlights for each of the five years in the period ended December 31, 2022 (collectively referred to as the “financial statements”). In our opinion, the financial statements present fairly, in all material respects, the financial position of the Portfolio as of December 31, 2022, the results of its operations for the year then ended, the changes in its net assets for each of the two years in the period ended December 31, 2022 and the financial highlights for each of the five years in the period ended December 31, 2022 in conformity with accounting principles generally accepted in the United States of America.
Basis for Opinion
These financial statements are the responsibility of the Portfolio’s management. Our responsibility is to express an opinion on the Portfolio’s financial statements based on our audits. We are a public accounting firm registered with the Public Company Accounting Oversight Board (United States) (PCAOB) and are required to be independent with respect to the Portfolio in accordance with the U.S. federal securities laws and the applicable rules and regulations of the Securities and Exchange Commission and the PCAOB.
We conducted our audits of these financial statements in accordance with the standards of the PCAOB. Those standards require that we plan and perform the audit to obtain reasonable assurance about whether the financial statements are free of material misstatement, whether due to error or fraud.
Our audits included performing procedures to assess the risks of material misstatement of the financial statements, whether due to error or fraud, and performing procedures that respond to those risks. Such procedures included examining, on a test basis, evidence regarding the amounts and disclosures in the financial statements. Our audits also included evaluating the accounting principles used and significant estimates made by management, as well as evaluating the overall presentation of the financial statements. Our procedures included confirmation of securities owned as of December 31, 2022 by correspondence with the custodian, transfer agent and brokers; when replies were not received from brokers, we performed other auditing procedures. We believe that our audits provide a reasonable basis for our opinion.
/s/PricewaterhouseCoopers LLP
New York, New York
February 24, 2023
We have served as the auditor of one or more investment companies in the MainStay group of funds since 1984.
| 32 | MainStay VP Bond Portfolio |
Board Consideration and Approval of Management Agreement and Subadvisory Agreement (Unaudited)
The continuation of the Management Agreement with respect to the MainStay VP Bond Portfolio (“Portfolio”) and New York Life Investment Management LLC (“New York Life Investments”) and the Subadvisory Agreement between New York Life Investments and NYL Investors LLC (“NYL Investors”) with respect to the Portfolio (together, “Advisory Agreements”) is subject to annual review and approval by the Board of Trustees of MainStay VP Funds Trust (“Board” of the “Trust”) in accordance with Section 15 of the Investment Company Act of 1940, as amended (“1940 Act”). At its December 6–7, 2022 meeting, the Board, which is comprised solely of Trustees who are not an “interested person” (as such term is defined in the 1940 Act) of the Trust (“Independent Trustees”), unanimously approved the continuation of each of the Advisory Agreements for a one-year period.
In reaching the decision to approve the continuation of each of the Advisory Agreements, the Board considered information and materials furnished by New York Life Investments and NYL Investors in connection with an annual contract review process undertaken by the Board that took place at meetings of the Board and its Contracts Committee during October 2022 through December 2022, including information and materials furnished by New York Life Investments and NYL Investors in response to requests prepared on behalf of the Board, and in consultation with the Board, by independent legal counsel to the Independent Trustees, which encompassed a variety of topics, including those summarized below. Information and materials requested by and furnished to the Board for consideration in connection with the contract review process included, among other items, reports on the Portfolio and “peer funds” prepared by Institutional Shareholder Services Inc. (“ISS”), an independent third-party service provider engaged by the Board to report objectively on the Portfolio’s investment performance, management fee and total expenses. The Board also considered information on the fees charged to other investment advisory clients of New York Life Investments and/or NYL Investors that follow investment strategies similar to those of the Portfolio, if any, and, when applicable, the rationale for any differences in the Portfolio’s management and subadvisory fees and the fees charged to those other investment advisory clients. In addition, the Board considered information regarding the legal standards and fiduciary obligations applicable to its consideration of the continuation of each of the Advisory Agreements. The contract review process, including the structure and format for information and materials provided to the Board, has been developed in consultation with the Board. The Independent Trustees also met in executive sessions with their independent legal counsel and, for portions thereof, with senior management of New York Life Investments.
The Board’s deliberations with respect to the continuation of each of the Advisory Agreements reflect a year-long process, and the Board also took into account information furnished to the Board and its Committees throughout the year, as deemed relevant and appropriate by the Trustees, including, among other items, reports on investment performance of the Portfolio and investment-related matters for the Portfolio as well as presentations from New York Life Investments and, generally annually, NYL Investors personnel. In addition, the Board took into account other
information received from New York Life Investments throughout the year, including, among other items, periodic reports on legal and compliance matters, risk management, portfolio turnover, brokerage commissions and non-advisory services provided to the Portfolio by New York Life Investments, as deemed relevant and appropriate by the Trustees.
In addition to information provided to the Board throughout the year, the Board received information in connection with its June 2022 meeting provided specifically in response to requests prepared on behalf of the Board, and in consultation with the Board, by independent legal counsel to the Independent Trustees regarding the Portfolio’s distribution arrangements. In addition, the Board received information regarding the Portfolio’s asset levels, share purchase and redemption activity and the payment of Rule 12b-1 and/or other fees by applicable share classes of the Portfolio, among other information.
In considering the continuation of each of the Advisory Agreements, the Trustees reviewed and evaluated the information and factors they believed to reasonably be necessary and appropriate in light of legal advice furnished to them by independent legal counsel to the Independent Trustees and through the exercise of their own business judgment. Although individual Trustees may have weighed certain factors or information differently and the Board did not consider any single factor or information controlling in reaching its decision, the factors considered by the Board are summarized in more detail below and include, among other factors: (i) the nature, extent and quality of the services provided to the Portfolio by New York Life Investments and NYL Investors; (ii) the qualifications of the portfolio managers of the Portfolio and the historical investment performance of the Portfolio, New York Life Investments and NYL Investors; (iii) the costs of the services provided, and profits realized, by New York Life Investments and NYL Investors with respect to their relationships with the Portfolio; (iv) the extent to which economies of scale have been realized or may be realized if the Portfolio grows and the extent to which any economies of scale have been shared, have benefited or may benefit the Portfolio’s shareholders; and (v) the reasonableness of the Portfolio’s management and subadvisory fees and total ordinary operating expenses. Although the Board recognized that comparisons between the Portfolio’s fees and expenses and those of other funds are imprecise given different terms of agreements, variations in fund strategies and other factors, the Board considered the reasonableness of the Portfolio’s management fee and total ordinary operating expenses as compared to the peer funds identified by ISS. Throughout their considerations, the Trustees acknowledged the commitment of New York Life Investments and its affiliates to serve the MainStay Group of Funds, as well as their capacity, experience, resources, financial stability and reputations. The Trustees also acknowledged the entrepreneurial and other risks assumed by New York Life Investments in sponsoring and managing the Portfolio. With respect to the Subadvisory Agreement, the Board took into account New York Life Investments’ recommendation to approve the continuation of the Subadvisory Agreement.
The Trustees noted that, throughout the year, the Trustees are afforded an opportunity to ask questions of, and request additional information or materials from, New York Life Investments and NYL Investors. The Board’s
Board Consideration and Approval of Management Agreement and Subadvisory Agreement (Unaudited) (continued)
decision with respect to each of the Advisory Agreements may have also been based, in part, on the Board’s knowledge of New York Life Investments and NYL Investors resulting from, among other things, the Board’s consideration of each of the Advisory Agreements in prior years, the advisory agreements for other funds in the MainStay Group of Funds, the Board’s review throughout the year of the performance and operations of other funds in the MainStay Group of Funds and each Trustee’s business judgment and industry experience. In addition to considering the above-referenced factors, the Board observed that in the marketplace, notably under variable life insurance policies and variable annuity contracts for which the Portfolio serves as an investment option, there are a range of investment options available to investors and that the Portfolio’s shareholders, having had the opportunity to consider other investment options, have chosen to invest in the Portfolio.
The factors that figured prominently in the Board’s decision to approve the continuation of each of the Advisory Agreements during its December 6–7, 2022 meeting are summarized in more detail below.
Nature, Extent and Quality of Services Provided by New York Life Investments and NYL Investors
The Board examined the nature, extent and quality of the services that New York Life Investments provides to the Portfolio. The Board evaluated New York Life Investments’ experience and capabilities in serving as manager of the Portfolio and considered that the Portfolio operates in a “manager-of-managers” structure. The Board also considered New York Life Investments’ responsibilities and services provided pursuant to this structure, including overseeing the services provided by NYL Investors, evaluating the performance of NYL Investors, making recommendations to the Board as to whether the Subadvisory Agreement should be renewed, modified or terminated and periodically reporting to the Board regarding the results of New York Life Investments’ evaluation and monitoring functions. The Board noted that New York Life Investments manages other mutual funds, serves a variety of other investment advisory clients, including other pooled investment vehicles, and has experience overseeing mutual fund service providers, including subadvisors. The Board considered the experience of senior personnel at New York Life Investments providing management and administrative and other non-advisory services to the Portfolio. The Board observed that New York Life Investments devotes significant resources and time to providing management and administrative and other non-advisory services to the Portfolio, including New York Life Investments’ oversight and due diligence reviews of NYL Investors and ongoing analysis of, and interactions with, NYL Investors with respect to, among other things, the Portfolio’s investment performance and risks as well as NYL Investors’ investment capabilities and subadvisory services with respect to the Portfolio.
The Board also considered the range of services that New York Life Investments provides to the Portfolio under the terms of the Management Agreement, including: (i) fund accounting and ongoing supervisory services provided by New York Life Investments’ Fund Administration and Accounting Group; (ii) investment supervisory and analytical services
provided by New York Life Investments’ Investment Consulting Group; (iii) compliance services provided by the Trust’s Chief Compliance Officer as well as New York Life Investments’ compliance department, including supervision and implementation of the Portfolio’s compliance program; (iv) legal services provided by New York Life Investments’ Office of the General Counsel; and (v) risk management monitoring and analysis by compliance and investment personnel. In addition, the Board considered New York Life Investments’ willingness to invest in personnel and other resources, such as cyber security, information security and business continuity planning, designed to benefit the Portfolio and noted that New York Life Investments is responsible for compensating the Trust’s officers, except for a portion of the salary of the Trust’s Chief Compliance Officer. The Board recognized that New York Life Investments provides certain other non-advisory services to the Portfolio and has provided an increasingly broad array of non-advisory services to the MainStay Group of Funds as a result of regulatory and other developments, including in connection with the implementation of the MainStay Group of Funds’ derivatives risk management program and policies and procedures adopted pursuant to Rule 18f-4 under the 1940 Act.
The Board also examined the range, and the nature, extent and quality, of the investment advisory services that NYL Investors provides to the Portfolio and considered the terms of each of the Advisory Agreements. The Board evaluated NYL Investors’ experience and performance in serving as subadvisor to the Portfolio and advising other portfolios and NYL Investors’ track record and experience in providing investment advisory services, the experience of investment advisory, senior management and administrative personnel at NYL Investors. The Board considered New York Life Investments’ and NYL Investors’ overall resources, legal and compliance environment, capabilities, reputation, financial condition and history. In addition to information provided in connection with quarterly meetings with the Trust’s Chief Compliance Officer, the Board considered information regarding the compliance policies and procedures of New York Life Investments and NYL Investors and acknowledged their commitment to further developing and strengthening compliance programs relating to the Portfolio. The Board also considered NYL Investors’ ability to recruit and retain qualified investment professionals and willingness to invest in personnel and other resources to service and support the Portfolio. In this regard, the Board considered the qualifications and experience of the Portfolio’s portfolio managers, the number of accounts managed by the portfolio managers and the method for compensating the portfolio managers.
In addition, the Board considered information provided by New York Life Investments and NYL Investors regarding the operations of their respective business continuity plans in response to the COVID-19 pandemic and the continued remote work environment.
Based on these considerations, among others, the Board concluded that the Portfolio would likely continue to benefit from the nature, extent and quality of these services.
| 34 | MainStay VP Bond Portfolio |
Investment Performance
In evaluating the Portfolio’s investment performance, the Board considered investment performance results over various periods in light of the Portfolio’s investment objective, strategies and risks. The Board considered investment reports on, and analysis of, the Portfolio’s performance provided to the Board throughout the year. These reports include, among other items, information on the Portfolio’s gross and net returns, the Portfolio’s investment performance compared to a relevant investment category and the Portfolio’s benchmark, the Portfolio’s risk-adjusted investment performance and the Portfolio’s investment performance as compared to peer funds, as appropriate, as well as portfolio attribution information and commentary on the effect of market conditions. The Board also considered information provided by ISS showing the investment performance of the Portfolio as compared to peer funds. In addition, the Board reviewed the methodology used by ISS to construct the group of peer funds for comparative purposes.
The Board also took into account its discussions with senior management at New York Life Investments concerning the Portfolio’s investment performance over various periods as well as discussions between the Portfolio’s portfolio management team and the members of the Board’s Investment Committee, which generally occur on an annual basis. In addition, the Board considered any specific actions that New York Life Investments or NYL Investors had taken, or had agreed to take, to seek to enhance Portfolio investment performance and the results of those actions. In considering the investment performance of the Portfolio, the Board noted that the Portfolio underperformed its peer funds for the one-, three- and five-year periods ended July 31, 2022, and performed in line with its peer funds for the ten-year period ended July 31, 2022. The Board considered its discussions with representatives from New York Life Investments and NYL Investors regarding the Portfolio’s investment performance.
Based on these considerations, among others, the Board concluded that its review of the Portfolio’s investment performance and related information supported a determination to approve the continuation of each of the Advisory Agreements.
Costs of the Services Provided, and Profits and Other Benefits Realized, by New York Life Investments and NYL Investors
The Board considered the costs of the services provided under each of the Advisory Agreements. The Board also considered the profits realized by New York Life Investments and its affiliates, including NYL Investors, due to their relationships with the Portfolio as well as the MainStay Group of Funds. Because NYL Investors is an affiliate of New York Life Investments whose subadvisory fee is paid by New York Life Investments, not the Portfolio, the Board considered cost and profitability information for New York Life Investments and NYL Investors in the aggregate.
In addition, the Board acknowledged the difficulty in obtaining reliable comparative data about mutual fund managers’ profitability because such information generally is not publicly available and may be impacted by
numerous factors, including the structure of a fund manager’s organization, the types of funds it manages, the methodology used to allocate certain fixed costs to specific funds and the manager’s capital structure and costs of capital.
In evaluating the costs of the services provided by New York Life Investments and NYL Investors and profits realized by New York Life Investments and its affiliates, including NYL Investors, the Board considered, among other factors, New York Life Investments’ and its affiliates’, including NYL Investors’, continuing investments in, or willingness to invest in, personnel and other resources to support and further enhance the management of the Portfolio, and that New York Life Investments is responsible for paying the subadvisory fee for the Portfolio. The Board also considered the financial resources of New York Life Investments and NYL Investors and acknowledged that New York Life Investments and NYL Investors must be in a position to recruit and retain experienced professional personnel and to maintain a strong financial position for New York Life Investments and NYL Investors to continue to provide high-quality services to the Portfolio. The Board recognized that the Portfolio benefits from the allocation of certain fixed costs among the funds in the MainStay Group of Funds, among other expected benefits resulting from its relationship with New York Life Investments.
The Board considered information regarding New York Life Investments’ methodology for calculating profitability and allocating costs provided by New York Life Investments in connection with the fund profitability analysis presented to the Board. The Board noted it had previously engaged an independent consultant to review the methods used to allocate costs among the funds in the MainStay Group of Funds. The Board also noted that the independent consultant had concluded that New York Life Investments’ methods for allocating costs and procedures for estimating overall profitability of the relationship with the funds in the MainStay Group of Funds are reasonable and that New York Life Investments continued to use the same method of calculating profit and allocating costs since the independent consultant’s review. The Board recognized the difficulty in calculating and evaluating a manager’s profitability with respect to the Portfolio and considered that other profitability methodologies may also be reasonable.
The Board also considered certain fall-out benefits that may be realized by New York Life Investments and its affiliates due to their relationships with the Portfolio, including reputational and other indirect benefits. In addition, the Board considered its review of the management agreement for a money market fund advised by New York Life Investments and an affiliated subadvisor that serves as an investment option for the Portfolio, including the potential rationale for and costs associated with investments in this money market fund by the Portfolio, if any, and considered information from New York Life Investments that the nature and type of specific investment advisory services provided to this money market fund are distinct from, or in addition to, the investment advisory services provided to the Portfolio. In addition, the Board considered the potential dividend received tax deduction for insurance company affiliates of New York Life Investments from the Portfolio’s securities lending activity.
Board Consideration and Approval of Management Agreement and Subadvisory Agreement (Unaudited) (continued)
The Board noted that the Portfolio serves as an investment option primarily under variable contracts issued by affiliates of New York Life Investments that would receive fees under those contracts. The Board observed that, in addition to fees earned by New York Life Investments under the Management Agreement for managing the Portfolio, New York Life Investments’ affiliates also earn revenues from serving the Portfolio in various other capacities, including as the Portfolio’s distributor. The Board considered information about these other revenues and their impact on the profitability of the relationship with the Portfolio to New York Life Investments and its affiliates. The Board noted that, although it assessed the overall profitability of the relationship with the Portfolio to New York Life Investments and its affiliates as part of the contract review process, when considering the reasonableness of the fee paid to New York Life Investments under the Management Agreement, the Board considered the profitability of New York Life Investments’ relationship with the Portfolio on a pre-tax basis and without regard to distribution expenses incurred by New York Life Investments from its own resources.
After evaluating the information deemed relevant by the Trustees, the Board concluded that any profits realized by New York Life Investments and its affiliates, including NYL Investors, due to their relationships with the Portfolio were not excessive and other benefits that may accrue to New York Life Investments and its affiliates, including NYL Investors, are reasonable.
Management and Subadvisory Fees and Total Ordinary Operating Expenses
The Board evaluated the reasonableness of the fee paid under each of the Advisory Agreements and the Portfolio’s total ordinary operating expenses. The Board primarily considered the reasonableness of the management fee paid by the Portfolio to New York Life Investments because the subadvisory fee paid to NYL Investors is paid by New York Life Investments, not the Portfolio. The Board also considered the reasonableness of the subadvisory fee paid by New York Life Investments and the amount of the management fee retained by New York Life Investments.
In assessing the reasonableness of the Portfolio’s fees and expenses, the Board primarily considered comparative data provided by ISS on the fees and expenses charged by similar mutual funds managed by other investment advisers. The Board reviewed the methodology used by ISS to construct the group of peer funds for comparative purposes. In addition, the Board considered information provided by New York Life Investments and NYL Investors on fees charged to other investment advisory clients, including institutional separate accounts and/or other funds that follow investment strategies similar to those of the Portfolio, if any. The Board considered the contractual management fee schedules of the Portfolio as compared to those of such other investment advisory clients, taking into account the rationale for any differences in fee schedules. The Board also took into account information provided by New York Life Investments about the more extensive scope of services provided to registered investment companies, such as the Portfolio, as compared with other investment advisory clients. Additionally, the Board considered the impact
of contractual breakpoints on the Portfolio’s net management fee and expenses. The Board also considered that in proposing fees for the Portfolio, New York Life Investments considers the competitive marketplace for mutual funds.
Based on the factors outlined above, among other considerations, the Board concluded that the Portfolio’s management fee and total ordinary operating expenses are within a range that is competitive and support a conclusion that these fees and expenses are reasonable.
Economies of Scale
The Board considered information regarding economies of scale, including whether economies of scale may exist for the Portfolio and whether the Portfolio’s expense structure permits any economies of scale to be appropriately shared with the Portfolio’s beneficial shareholders. The Board also considered a report from New York Life Investments, previously prepared at the request of the Board, that addressed economies of scale, including with respect to the mutual fund business generally, and the various ways in which the benefits of economies of scale may be shared with the funds in the MainStay Group of Funds. Although the Board recognized the difficulty of determining economies of scale with precision, the Board acknowledged that economies of scale may be shared with the Portfolio in a number of ways, including, for example, through the imposition of fee breakpoints, initially setting management fee rates at scale or making additional investments to enhance the services provided to the Portfolio. The Board reviewed information from New York Life Investments showing how the Portfolio’s management fee schedule compared to fee schedules of other funds and accounts managed by New York Life Investments. The Board also reviewed information from ISS showing how the Portfolio’s management fee schedule compared with fees paid for similar services by peer funds at varying asset levels.
Based on this information, the Board concluded that economies of scale are appropriately reflected for the benefit of the Portfolio’s beneficial shareholders through the Portfolio’s expense structure and other methods to share benefits from economies of scale.
Conclusion
On the basis of the information and factors summarized above, among other information and factors deemed relevant by the Trustees, and the evaluation thereof, the Board unanimously voted to approve the continuation of each of the Advisory Agreements.
| 36 | MainStay VP Bond Portfolio |
Proxy Voting Policies and Procedures and Proxy Voting Record
The Portfolio is required to file with the SEC its proxy voting record for the 12-month period ending June 30 on Form N-PX. A description of the policies and procedures that are used to vote proxies relating to portfolio securities of the Portfolio is available free of charge upon request by calling 800-598-2019 or visiting the SEC's website at www.sec.gov. The most recent Form N-PX or proxy voting record is available free of charge upon request by calling 800-598-2019; visiting https://www.newyorklifeinvestments.com/investment-products/vp; or visiting the SEC’s website at www.sec.gov.
Shareholder Reports and Quarterly Portfolio Disclosure
The Portfolio is required to file its complete schedule of portfolio holdings with the SEC 60 days after its first and third fiscal quarter on Form N-PORT. The Portfolio's holdings report is available free of charge upon request by calling 800-598-2019 or by visiting the SEC’s website at www.sec.gov .
Board of Trustees and Officers (Unaudited)
The Trustees and officers of the Portfolio are listed below. The Board oversees the MainStay Group of Funds (which consists of MainStay Funds and MainStay Funds Trust), MainStay VP Funds Trust, MainStay MacKay DefinedTerm Municipal Opportunities Fund, MainStay CBRE Global Infrastructure Megatrends Fund, the Manager and the Subadvisors, and elects the officers of the Portfolios who are responsible for the day-to-day operations of the Portfolio. Information pertaining to the Trustees and officers is set forth below. Each Trustee serves until his or her successor
is elected and qualified or until his or her resignation, death or removal. Under the Board’s retirement policy, unless an exception is made, a Trustee must tender his or her resignation by the end of the calendar year during which he or she reaches the age of 75. The business address of each Trustee and officer listed below is 51 Madison Avenue, New York, New York 10010. None of the Trustees are “interested persons” (as defined by the 1940 Act and rules adopted by the SEC thereunder) of the Portfolio (“Independent Trustees”).
| | Name and
Year of Birth | Term of Office,
Position(s) Held and
Length of Service | Principal Occupation(s)
During Past Five Years | Number of
Portfolios in
Fund Complex
Overseen by
Trustee | Other Directorships
Held by Trustee |
| | | | | | |
| | David H. Chow
1957 | MainStay VP Funds Trust: Trustee since January 2016, Advisory Board Member (June 2015 to December 2015) | Founder and CEO, DanCourt Management, LLC since 1999 | 78 | MainStay Funds: Trustee since January 2016, Advisory Board Member (June 2015 to December 2015) (12 Funds);
MainStay Funds Trust: Trustee since January 2016, Advisory Board Member (June 2015 to December 2015) (33 Funds);
MainStay MacKay DefinedTerm Municipal Opportunities Fund: Trustee since January 2016, Advisory Board Member (June 2015 to December 2015);
MainStay CBRE Global Infrastructure Megatrends Fund: Trustee since June 2021;VanEck Vectors Group of Exchange-Traded Funds: Independent Chairman of the Board of Trustees since 2008 and Trustee since 2006 (57 portfolios); and Berea College of Kentucky: Trustee since 2009, Chair of the Committee since 2018 |
| | Susan B. Kerley
1951 | MainStay VP Funds Trust: Chairman since 2017 and Trustee since 2007* | President, Strategic Management Advisors LLC since 1990 | 78 | MainStay Funds: Chairman since 2017 and Trustee since 2007 (12 Funds); MainStay Funds Trust: Chairman since 2017 and Trustee since 1990 (33 Funds)**;
MainStay MacKay DefinedTerm Municipal Opportunities Fund: Chairman since 2017 and Trustee since 2011; MainStay CBRE Global Infrastructure Megatrends Fund: Trustee since June 2021; and Legg Mason Partners Funds: Trustee since 1991 (45 portfolios) |
| | Alan R. Latshaw
1951 | MainStay VP Funds Trust: Trustee since 2007* | Retired; Partner, Ernst & Young LLP (2002 to 2003); Partner, Arthur Andersen LLP (1989 to 2002); Consultant to the MainStay Funds Audit and Compliance Committee (2004 to 2006) | 78 | MainStay Funds: Trustee since 2006 (12 Funds);
MainStay Funds Trust: Trustee since 2007 (33 Funds)**;
MainStay MacKay DefinedTerm Municipal Opportunities Fund: Trustee since 2011; and
MainStay CBRE Global Infrastructure Megatrends Fund: Trustee since June 2021 |
| 38 | MainStay VP Bond Portfolio |
| | Name and
Year of Birth | Term of Office,
Position(s) Held and
Length of Service | Principal Occupation(s)
During Past Five Years | Number of
Portfolios in
Fund Complex
Overseen by
Trustee | Other Directorships
Held by Trustee |
| | | | | | |
| | Karen Hammond
1956 | MainStay VP Funds Trust: Trustee since December 2021, Advisory Board Member (June 2021 to December 2021)
| Retired, Managing Director, Devonshire Investors (2007 to 2013); Senior Vice President, Fidelity Management & Research Co. (2005 to 2007); Senior Vice President and Corporate Treasurer, FMR Corp. (2003 to 2005); Chief Operating Officer, Fidelity Investments Japan (2001 to 2003) | 78 | MainStay Funds: Trustee since December 2021, Advisory Board Member (June 2021 to December 2021) (12 Funds);
MainStay Funds Trust: Trustee since December 2021, Advisory Board Member (June 2021 to December 2021) (33 Funds);
MainStay MacKay DefinedTerm Municipal Opportunities Fund: Trustee since December 2021, Advisory Board Member (June 2021 to December 2021);
MainStay CBRE Global Infrastructure Megatrends Fund: Trustee since December 2021, Advisory Board Member (June 2021 to December 2021);
Two Harbors Investment Corp.: Director since 2018; Rhode Island State Investment Commission: Member since 2017; and Blue Cross Blue Shield of Rhode Island: Director since 2019
|
| | Jacques P. Perold
1958 | MainStay VP Funds Trust: Trustee since January 2016, Advisory Board Member (June 2015 to December 2015) | Founder and Chief Executive Officer, CapShift Advisors LLC (since 2018); President, Fidelity Management & Research Company (2009 to 2014); President and Chief Investment Officer, Geode Capital Management, LLC (2001 to 2009) | 78 | MainStay Funds: Trustee since January 2016, Advisory Board Member (June 2015 to December 2015) (12 Funds);
MainStay Funds Trust: Trustee since January 2016, Advisory Board Member (June 2015 to December 2015) (33 Funds); MainStay MacKay DefinedTerm Municipal Opportunities Fund: Trustee since January 2016, Advisory Board Member (June 2015 to December 2015);
MainStay CBRE Global Infrastructure Megatrends Fund: Trustee since June 2021; Allstate Corporation: Director since 2015;
Partners in Health: Trustee since 2019; and
MSCI Inc.: Director since 2017 |
| | Richard S. Trutanic
1952 | MainStay VP Funds Trust: Trustee since 2007* | Chairman and Chief Executive Officer, Somerset & Company (financial advisory firm) since 2004; Managing Director, The Carlyle Group (private investment firm) (2002 to 2004); Senior Managing Director, Partner and Board Member, Groupe Arnault S.A. (private investment firm) (1999 to 2002)
| 78 | MainStay Funds: Trustee since 1994 (12 Funds);
MainStay Funds Trust: Trustee since 2007 (33 Funds)**;
MainStay MacKay DefinedTerm Municipal Opportunities Fund: Trustee since 2011; and
MainStay CBRE Global Infrastructure Megatrends Fund: Trustee since June 2021 |
| * | Includes prior service as a Director of MainStay VP Series Fund, Inc., the predecessor to MainStay VP Funds Trust. |
| ** | Includes prior service as a Director/Trustee of certain predecessor entities to MainStay Funds Trust. |
Board of Trustees and Officers (Unaudited) (continued)
| | Name and
Year of Birth | Position(s) Held and
Length of Service | Principal Occupation(s)
During Past Five Years | |
| | | | | |
| | Kirk C. Lehneis
1974 | President, MainStay VP Funds Trust (since 2017) | Chief Operating Officer and Senior Managing Director (since 2016), New York Life Investment Management LLC and New York Life Investment Management Holdings LLC; Member of the Board of Managers (since 2017) and Senior Managing Director (since 2018), NYLIFE Distributors LLC; Chairman of the Board and Senior Managing Director, NYLIM Service Company LLC (since 2017); Trustee, President and Principal Executive Officer of IndexIQ Trust, IndexIQ ETF Trust and IndexIQ Active ETF Trust (since January 2018); President, MainStay CBRE Global Infrastructure Megatrends Fund (since 2021), MainStay MacKay DefinedTerm Municipal Opportunities Fund, MainStay Funds and MainStay Funds Trust (since 2017); Senior Managing Director, Global Product Development (from 2015-2016); Managing Director, Product Development (from 2010-2015), New York Life Investment Management LLC | |
| | Jack R. Benintende
1964 | Treasurer and Principal Financial and Accounting Officer, MainStay VP Funds Trust (since 2007)** | Managing Director, New York Life Investment Management LLC (since 2007); Treasurer and Principal Financial and Accounting Officer, MainStay CBRE Global Infrastructure Megatrends Fund (since 2021), MainStay MacKay DefinedTerm Municipal Opportunities Fund (since 2011), MainStay Funds Trust (since 2009) and MainStay Funds (since 2007); and Assistant Treasurer, New York Life Investment Management Holdings LLC (2008 to 2012) | |
| | J. Kevin Gao
1967 | Secretary and Chief Legal Officer, MainStay VP Funds Trust (since 2010)** | Managing Director and Associate General Counsel, New York Life Investment Management LLC (since 2010); Secretary and Chief Legal Officer, MainStay CBRE Global Infrastructure Megatrends Fund (since 2021), MainStay MacKay DefinedTerm Municipal Opportunities Fund (since 2011), MainStay Funds and MainStay Funds Trust (since 2010) | |
| | Scott T. Harrington
1959 | Vice President— Administration, MainStay VP Funds Trust (since 2005)** | Managing Director, New York Life Investment Management LLC (including predecessor advisory organizations) (since 2000); Member of the Board of Directors, New York Life Trust Company (since 2009); Vice President—Administration, MainStay CBRE Global Infrastructure Megatrends Fund (since 2021), MainStay MacKay DefinedTerm Municipal Opportunities Fund (since 2011), MainStay Funds Trust and MainStay Funds (since 2009) | |
| | Kevin M. Gleason
1967 | Vice President and Chief Compliance Officer, MainStay VP Funds Trust (since June 2022) | Vice President and Chief Compliance Officer, IndexIQ, IndexIQ ETF Trust and Index IQ Active ETF Trust (since June 2022); Vice President and Chief Compliance Officer, MainStay CBRE Global Infrastructure Megatrends Fund, MainStay MacKay DefinedTerm Municipal Opportunities Fund (since June 2022); MainStay Funds Trust and MainStay Funds (since June 2022); Senior Vice President, Voya Investment Management and Chief Compliance Officer, Voya Family of Funds (2012-2022) | |
| * | The officers listed above are considered to be “interested persons” of the MainStay Group of Funds, MainStay VP Funds Trust, MainStay CBRE Global Infrastructure Megatrends Fund and MainStay MacKay DefinedTerm Municipal Opportunities Fund within the meaning of the 1940 Act because of their affiliation with the MainStay Group of Funds, New York Life Insurance Company and/or its affiliates, including New York Life Investment Management LLC, NYLIM Service Company LLC, NYLIFE Securities LLC and/or NYLIFE Distributors LLC, as described in detail in the column captioned “Principal Occupation(s) During Past Five Years.” Officers are elected annually by the Board. |
| ** | Includes prior service as an Officer of MainStay VP Series Fund, Inc., the predecessor to MainStay VP Funds Trust. |
Officers of the Trust (Who are not Trustees)*
| 40 | MainStay VP Bond Portfolio |
This page intentionally left blank
This page intentionally left blank.
MainStay VP Portfolios
MainStay VP offers a wide range of Portfolios. The full array of MainStay VP offerings is listed here, with information about the manager, subadvisors, legal counsel, and independent registered public accounting firm.
Equity
MainStay VP American Century Sustainable Equity Portfolio1
MainStay VP Candriam Emerging Markets Equity Portfolio
MainStay VP Epoch U.S. Equity Yield Portfolio
MainStay VP Fidelity Institutional AM® Utilities Portfolio†
MainStay VP MacKay International Equity Portfolio
MainStay VP Natural Resources Portfolio
MainStay VP S&P 500 Index Portfolio2
MainStay VP Small Cap Growth Portfolio
MainStay VP Wellington Growth Portfolio
MainStay VP Wellington Mid Cap Portfolio
MainStay VP Wellington Small Cap Portfolio
MainStay VP Wellington U.S. Equity Portfolio
MainStay VP Winslow Large Cap Growth Portfolio
Mixed Asset
MainStay VP Balanced Portfolio
MainStay VP Income Builder Portfolio
MainStay VP Janus Henderson Balanced Portfolio
MainStay VP MacKay Convertible Portfolio
Income
MainStay VP Bond Portfolio
MainStay VP Floating Rate Portfolio
MainStay VP Indexed Bond Portfolio
MainStay VP MacKay Government Portfolio
MainStay VP MacKay High Yield Corporate Bond Portfolio
MainStay VP MacKay Strategic Bond Portfolio
MainStay VP PIMCO Real Return Portfolio
Money Market
MainStay VP U.S. Government Money Market Portfolio
Alternative
MainStay VP CBRE Global Infrastructure Portfolio
MainStay VP IQ Hedge Multi-Strategy Portfolio
Asset Allocation
MainStay VP Conservative Allocation Portfolio
MainStay VP Equity Allocation Portfolio
MainStay VP Growth Allocation Portfolio
MainStay VP Moderate Allocation Portfolio
Manager
New York Life Investment Management LLC
New York, New York
Subadvisors
American Century Investment Management, Inc.
Kansas City, Missouri
Brown Advisory LLC
Baltimore, Maryland
Candriam*
Strassen, Luxembourg
CBRE Investment Management Listed Real Assets LLC
Radnor, Pennsylvania
Epoch Investment Partners, Inc.
New York, New York
FIAM LLC
Smithfield, Rhode Island
IndexIQ Advisors LLC*
New York, New York
Janus Henderson Investors US LLC
Denver, Colorado
MacKay Shields LLC*
New York, New York
Newton Investment Management North America, LLC
Boston, Massachusetts
NYL Investors LLC*
New York, New York
Pacific Investment Management Company LLC
Newport Beach, California
Segall Bryant & Hamill, LLC
Chicago, Illinois
Wellington Management Company LLP
Boston, Massachusetts
Winslow Capital Management, LLC
Minneapolis, Minnesota
Legal Counsel
Dechert LLP
Washington, District of Columbia
Independent Registered Public Accounting Firm
PricewaterhouseCoopers LLP
New York, New York
Distributor
NYLIFE Distributors LLC*
Jersey City, New Jersey
Custodian
JPMorgan Chase Bank, N.A.
New York, New York
Some Portfolios may not be available in all products.
† Fidelity Institutional AM is a registered trade mark of FMR LLC. Used with permission.
* An affiliate of New York Life Investment Management LLC.
| 1. | Prior to May 1, 2022, the Portfolio's name was MainStay VP T. Rowe Price Equity Income Portfolio. |
| 2. | Prior to May 1, 2022, the Portfolio's name was MainStay VP MacKay S&P 500 Index Portfolio. |
Not part of the Annual Report
2022 Annual Report
This report is for the general information of New York Life Variable Annuities and NYLIAC Variable Universal Life Insurance Products policyowners. It must be preceded or accompanied by the appropriate product(s) and funds prospectuses if it is given to anyone who is not an owner of a New York Life variable annuity policy or a NYLIAC Variable Universal Life Insurance Product. This report does not offer for sale or solicit orders to purchase securities.
The performance data quoted in this report represents past performance. Past performance is no guarantee of future results. Due to market volatility and other factors, current performance may be lower or higher than the figures shown. The most recent month-end performance summary for your variable annuity or variable life policy is available by calling 800-598-2019 and is updated periodically on newyorklife.com.
The New York Life Variable Annuities and NYLIAC Variable Universal Life Insurance Products are issued by New York Life Insurance and Annuity Corporation (a Delaware Corporation) and distributed by NYLIFE Distributors LLC (Member FINRA/SIPC).
New York Life Insurance Company
New York Life Insurance and Annuity
Corporation (NYLIAC) (A Delaware Corporation)
51 Madison Avenue, Room 551
New York, NY 10010
newyorklife.com
newyorklifeinvestments.com
NYLIFE Distributors LLC, 30 Hudson Street, Jersey City, NJ 07302
New York Life Investment Management LLC is the investment manager to the MainStay VP Funds Trust
©2023 by NYLIFE Distributors LLC. All rights reserved.
You may obtain copies of the Prospectus and the Statement of Additional Information free of charge, upon request, by calling toll-free 800-598-2019 or writing to New York Life Insurance and Annuity Corporation, 51 Madison Avenue, New York, NY 10010.
| Not FDIC Insured | No Bank Guarantee | May Lose Value |
(NYLIAC) NI509
MainStay VP MacKay Government Portfolio
Message from the President and Annual Report
December 31, 2022
Sign up for e-delivery of your shareholder reports. For full details on e-delivery, including who can participate and what you can receive via e-delivery,
please log in to newyorklifeinvestments.com/accounts.
| Not FDIC/NCUA Insured | Not a Deposit | May Lose Value | No Bank Guarantee | Not Insured by Any Government Agency |
This page intentionally left blank
Message from the President
The 12-month reporting period ended December 31, 2022, proved exceptionally challenging for investors as both stock and bond markets suffered steep declines. A variety of economic and geopolitical forces drove the market’s losses, all centered around rising inflation and monetary efforts to rein it in.
Inflationary alarms began to sound well before the reporting period began. In late 2021, after nearly two years of accommodative policies designed to encourage economic growth in the face of the COVID-19 pandemic, the U.S. Federal Reserve (the “Fed”) warned of the increasing need to tighten monetary policy. Nevertheless, the pace and persistence of inflation in early 2022 caught most market participants—the Fed included—off guard. Russia’s invasion of Ukraine in February exacerbated global inflationary pressures while increasing investor uncertainty. Domestic supply shortages, international trade imbalances and rising inflation caused U.S. GDP (gross domestic product) to contract in the first and second quarters of the year, although employment and consumer spending proved resilient. Prices for petroleum surged to multi-year highs, while many key agricultural chemicals and industrial metals soared as well. Accelerating inflationary forces prompted the Fed to implement its most aggressive series of interest rate hikes since the 1980s, with a 0.25% increase in March followed by six further rate increases totaling 4.25%. International central banks generally followed suit and raised rates by varying degrees in efforts to curb local inflation, although most increases remained significantly more modest than those in the United States. Relatively high U.S. interest rates and an international risk averse sentiment pushed U.S. dollar values higher compared to most other currencies, with negative impacts on global prices for food, fuel and other key U.S.-dollar-denominated products.
The effects of these interrelated challenges were felt throughout U.S. and international financial markets. The S&P 500® Index, a widely regarded benchmark of market performance, declined by more than 18% during the reporting period. Although the energy sector generated strong gains, bolstered by elevated oil and gas prices, most other industry segments recorded losses. The more cyclical and growth-oriented sectors of consumer discretionary, information technology and real estate delivered the weakest returns, while the traditionally defensive and value-oriented
consumer staples, utilities and health care sectors outperformed. On average, international developed-country equity markets mildly outperformed their U.S. counterparts, while emerging markets lagged slightly. Fixed-income markets proved unusually volatile, with bond prices trending sharply lower as yields rose along with interest rates. Short-term yields rose faster than long-term yields, producing a yield curve inversion from July through the end of the reporting period as long-term rates remained below short-term rates. While floating-rate instruments, which feature variable interest rates that allow investors to benefit from a rising rate environment, provided a degree of insulation from inflation-driven trends, they were not immune to the market’s widespread declines.
Although, according to the most recent estimates, the annualized inflation rate in the United States has declined from a peak of 9.1% in July 2022 to 6.5% in December, the Fed remains focused on achieving more substantial and lasting reductions, aiming for a target rate of 2%. As a result, further rate hikes and additional market volatility are potential headwinds in the coming months. The question remains as to whether the Fed and other central banks will manage a so-called “soft landing,” curbing inflation while avoiding a persistent economic slowdown. If they prove successful, we believe that the increasingly attractive valuations we have observed in both equity and bond markets should eventually translate into sustainable improvements in the investment environment.
Whatever actions the Fed takes and however financial markets react, as a MainStay VP investor you can depend on us to continue managing our portfolios with the insight, expertise and level of service that have long defined New York Life Investments. Thank you for trusting us to help you meet your investment needs.
Sincerely,
Kirk C. Lehneis
President
The opinions expressed are as of the date of this report and are subject to change. There is no guarantee that any forecast made will come to pass. This material does not constitute investment advice and is not intended as an endorsement of any specific investment. Past performance is no guarantee of future results.
Not part of the Annual Report
Investors should refer to the Portfolio’s Summary Prospectus and/or Prospectus and consider the Portfolio’s investment objectives, strategies, risks, charges and expenses carefully before investing. The Summary Prospectus and/or Prospectus contain this and other information about the Portfolio. You may obtain copies of the Portfolio’s Summary Prospectus, Prospectus and Statement of Additional Information, which includes information about the MainStay VP Funds Trust's Trustees, free of charge, upon request, by calling toll-free 800-598-2019, by writing to New York Life Insurance and Annuity Corporation, 51 Madison Avenue, Room 251, New York, New York 10010 or by sending an email to MainStayShareholdersServices@nylim.com. These documents are also available at newyorklifeinvestments.com/investment-products/vp. Please read the Portfolio's Summary Prospectus and/or Prospectus carefully before investing. MainStay VP Funds Trust portfolios are separate account options which are purchased through a variable insurance or variable annuity contract.
Investment and Performance Comparison (Unaudited)
Performance data quoted represents past performance. Past performance is no guarantee of future results. Because of market volatility and other factors, current performance may be lower or higher than the figures shown. Investment return and principal value will fluctuate, and as a result, when shares are redeemed, they may be worth more or less than their original cost. The performance table and graph do not reflect any deduction of sales charges, mortality and expense charges, contract charges or administrative charges. Please refer to the Performance Summary appropriate for your policy. For performance information current to the most recent month-end, please call 800-598-2019 or visit www.newyorklife.com.
Performance figures may reflect certain fee waivers and/or expense limitations, without which total returns may have been different. For information on current fee waivers and/or expense limitations (if any), please refer to the Notes to Financial Statements.
| Average Annual Total Returns for the Year-Ended December 31, 2022 |
| Class | Inception
Date | One
Year | Five
Years | Ten
Years | Gross
Expense
Ratio1 |
| Initial Class Shares | 1/29/1993 | -11.29% | -0.68% | 0.23% | 0.55% |
| Service Class Shares | 6/4/2003 | -11.51 | -0.93 | -0.02 | 0.80 |
| 1. | The gross expense ratios presented reflect the Portfolio’s “Total Annual Portfolio Operating Expenses” from the most recent Prospectus and may differ from other expense ratios disclosed in this report. |
| Benchmark Performance* | One
Year | Five
Years | Ten
Years |
| Bloomberg U.S. Government Bond Index1 | -12.32% | -0.06% | 0.60% |
| Morningstar Intermediate Government Category Average2 | -11.34 | -0.48 | 0.23 |
| * | Returns for indices reflect no deductions for fees, expenses or taxes, except for foreign withholding taxes where applicable. Results assume reinvestment of all dividends and capital gains. An investment cannot be made directly in an index. |
| 1. | The Bloomberg U.S. Government Bond Index is the Portfolio’s primary benchmark. The Bloomberg U.S. Government Bond Index is a broad-based benchmark that consists of publicly issued debt of the U.S. Treasury and government agencies. Results assume the reinvestment of all income and capital gains. An investment cannot be made directly in an index. |
| 2. | The Morningstar Intermediate Government Category Average is representative of funds that have at least 90% of their bond holdings in bonds backed by U.S. government or by U.S. government-linked agencies. These funds have durations between 3.5 and 6 years and/or average effective maturities between 4 and 10 years. Results are based on average total returns of similar funds with all dividends and capital gain distributions reinvested. |
Cost in Dollars of a $1,000 Investment in MainStay VP MacKay Government Portfolio (Unaudited)
The example below is intended to describe the fees and expenses borne by shareholders during the six-month period from July 1, 2022 to December 31, 2022, and the impact of those costs on your investment.
Example
As a shareholder of the Portfolio you incur two types of costs: (1) transaction costs, including exchange fees and sales charges (loads) on purchases (as applicable), and (2) ongoing costs, including management fees, distribution and/or service (12b-1) fees and other Portfolio expenses (as applicable). This example is intended to help you understand your ongoing costs (in dollars) of investing in the Portfolio and to compare these costs with the ongoing costs of investing in other mutual funds. The example is based on an investment of $1,000 made at the beginning of the six-month period and held for the entire period from July 1, 2022 to December 31, 2022. Shares are only sold in connection with variable life and annuity contracts and the example does not reflect any contract level or transactional fees or expenses. If these costs had been included, your costs would have been higher.
This example illustrates your Portfolio’s ongoing costs in two ways:
Actual Expenses
The second and third data columns in the table below provide information about actual account values and actual expenses. You may use the information in these columns, together with the amount you invested, to estimate the expenses that you paid during the six months ended
December 31, 2022. Simply divide your account value by $1,000 (for example, an $8,600 account value divided by $1,000 = 8.6), then multiply the result by the number under the heading entitled “Expenses Paid During Period” to estimate the expenses you paid on your account during this period.
Hypothetical Example for Comparison Purposes
The fourth and fifth data columns in the table below provide information about hypothetical account values and hypothetical expenses based on the Portfolio’s actual expense ratio and an assumed rate of return of 5% per year before expenses, which is not the Portfolio’s actual return. The hypothetical account values and expenses may not be used to estimate the actual ending account balances or expenses you paid for the six-month period shown. You may use this information to compare the ongoing costs of investing in the Portfolio with the ongoing costs of investing in other mutual funds. To do so, compare this 5% hypothetical example with the 5% hypothetical examples that appear in the shareholder reports of the other mutual funds.
Please note that the expenses shown in the table are meant to highlight your ongoing costs only and do not reflect any transactional costs, such as exchange fees or sales charges (loads). Therefore, the fourth and fifth data columns of the table are useful in comparing ongoing costs only and will not help you determine the relative total costs of owning different funds. In addition, if these transactional costs were included, your costs would have been higher.
| Share Class | Beginning
Account
Value
7/1/22 | Ending Account
Value (Based
on Actual
Returns and
Expenses)
12/31/22 | Expenses
Paid
During
Period1 | Ending Account
Value (Based
on Hypothetical
5% Annualized
Return and
Actual Expenses)
12/31/22 | Expenses
Paid
During
Period1 | Net Expense
Ratio
During
Period2 |
| Initial Class Shares | $1,000.00 | $961.00 | $2.77 | $1,022.38 | $2.85 | 0.56% |
| Service Class Shares | $1,000.00 | $959.80 | $4.00 | $1,021.12 | $4.13 | 0.81% |
| 1. | Expenses are equal to the Portfolio’s annualized expense ratio of each class multiplied by the average account value over the period, divided by 365 and multiplied by 184 (to reflect the six-month period). The table above represents the actual expenses incurred during the six-month period. In addition to the fees and expenses which the Portfolio bears directly, it also indirectly bears a pro rata share of the fees and expenses of the underlying funds in which it invests. Such indirect expenses are not included in the above-reported expense figures. |
| 2. | Expenses are equal to the Portfolio's annualized expense ratio to reflect the six-month period. |
| 6 | MainStay VP MacKay Government Portfolio |
Portfolio Composition as of December 31, 2022 (Unaudited)
See Portfolio of Investments beginning on page 10 for specific holdings within these categories. The Portfolio's holdings are subject to change.
Top Ten Holdings and/or Issuers Held as of December 31, 2022 (excluding short-term investments) (Unaudited)
| 1. | UMBS, 30 Year, 2.00%-6.50%, due 7/1/39–11/1/51 |
| 2. | U.S. Treasury Notes, 0.375%-3.00%, due 4/30/24–2/15/30 |
| 3. | UMBS Pool, 30 Year, 2.00%-4.50%, due 6/1/46–11/1/52 |
| 4. | FREMF Mortgage Trust, 3.455%-4.325%, due 8/25/46–2/25/52 |
| 5. | FNMA, (zero coupon)-3.50%, due 7/25/42–3/25/60 |
| 6. | GNMA, (zero coupon)-3.50%, due 6/16/37–2/20/52 |
| 7. | FHLMC Gold Pools, 30 Year, 2.50%-6.50%, due 4/1/37–3/1/49 |
| 8. | UMBS, 20 Year, 2.00%-3.00%, due 10/1/32–7/1/41 |
| 9. | FNMA, Other, 2.50%-6.50%, due 4/1/25–6/1/57 |
| 10. | U.S. Treasury Inflation Linked Notes, 0.125%, due 1/15/30–7/15/30 |
Portfolio Management Discussion and Analysis (Unaudited)
Answers to the questions reflect the views of portfolio managers, Steven H. Rich, Stephen R. Cianci, CFA, and Neil Moriarty III, of MacKay Shields LLC, the Portfolio’s Subadvisor.
How did MainStay VP MacKay Government Portfolio perform relative to its benchmark and peers during the 12 months ended December 31, 2022?
For the 12 months ended December 31, 2022, MainStay VP MacKay Government Portfolio returned −11.29% for Initial Class shares and −11.51% for Service Class shares. Over the same period, both share classes outperformed the −12.32% return of the Bloomberg U.S. Government Bond Index (“the Index”), which is the Portfolio’s benchmark. Over the same period, Initial Class shares outperformed, and Service Class shares underperformed, the −11.34% return of the Morningstar Intermediate Government Category Average.1
What factors affected the Portfolio’s relative performance during the reporting period?
Duration,2 yield-curve3 posture, sector weighting and issue selection were the four factors primarily affecting the Portfolio’s performance relative to the Index. The Portfolio outperformed the Index due to gains from its duration posture and its superior yield relative to the Index. The Portfolio’s relative performance also benefited from low turnover and low cash levels. By staying fully invested and minimizing cash, the Portfolio preserved yield. A portion of the gains were offset by yields of mortgage-backed securities (the Portfolio’s largest sector) rising faster than comparable-duration U.S. Treasury yields, which caused mortgage prices to fall faster than prices of comparable-duration Treasury securities (the Index’s largest sector). This effect weighed on the Portfolio’s performance relative to its Index because mortgage-backed securities are an off-Index position.
Duration and yield-curve posture: U.S. Treasury yields rose an average of 290 basis points across the yield curve. (A basis point is one one-hundredth of a percentage point.) The yield shift was not uniform along the curve, as yields rose more in shorter maturities and less in longer maturities. Much of the uneven shift along the yield curve was explained by the response of the Federal Reserve (the “Fed”) to inflation: shorter-maturity Treasury yields were more reactive to tighter monetary policy, while smaller increases in longer rates signaled confidence that the Fed’s actions would prove disinflationary. The relative performance of the Portfolio benefited from the backdrop of rising yields. The Portfolio’s shorter duration made it less sensitive than the Index, and longer-duration peers, to changes in Treasury yields.
Sector weighting: Residential mortgage-backed securities, some backed by single-family properties and others backed by multifamily properties, represented the Portfolio’s largest sector exposure. Our commitment to the mortgage sector imparted a
yield advantage over lower-yielding Treasury securities and agency debentures. The reporting period’s interest rate volatility, however, chipped away at the yield advantage of the single-family mortgage-backed securities. Securities backed by mortgages on multifamily properties, in contrast, were more volatility-resistant due to their prepayment protection.
What was the Portfolio’s duration strategy during the reporting period?
As U.S. Treasury yields and mortgage rates rose, the Portfolio’s duration extended. The Portfolio’s duration typically lengthens as Treasury yields rise because of its exposure to single-family residential mortgage-backed securities. Mortgage rates move directionally with Treasury rates. Higher mortgage rates inhibit refinancing opportunities and, in turn, slow prepayments. The Portfolio ended the reporting period with a duration of 5.5 years, 1.6 years longer than at the beginning of the reporting period.
The Index is composed primarily (97%) of U.S. Treasury securities. Higher yields had the opposite effect on the Index’s duration; its duration shortened from 7.0 years to 6.0 years, due to the positive convexity4 of Treasury securities and the absence of mortgages. As noted earlier, the Portfolio was advantaged by maintaining a shorter duration than the Index.
During the reporting period, which market segments were the strongest positive contributors to the Portfolio’s absolute performance and which market segments were particularly weak?
The Portfolio’s commitment to agency multifamily mortgage-backed securities made a positive contribution to absolute performance during the reporting period. (Contributions take weightings and total returns into account.) Agency multifamily mortgage-backed securities are backed by FNMA or FHMLC mortgages on larger, multifamily developments and apartment buildings. Multifamily mortgages are typically not freely prepayable, unlike single-family mortgages. Consequently, they amortize more slowly. Investors crossed over to multifamily from single family, attracted to the more stable cash-flow profiles offered by securities backed by mortgages on multifamily properties. Consequently, multifamily mortgage-backed securities outperformed comparable-duration single-family mortgage-backed passthroughs.
Collateralized-mortgage obligations (CMOs) outperformed comparable-duration single-family mortgage passthroughs. CMO cash-flow profiles are more stable than those of mortgage passthroughs. In turn, CMOs withstood the reporting period’s
| 1. | See page 5 for more information on benchmark and peer group returns. |
| 2. | Duration is a measure of the price sensitivity of a fixed-income investment to changes in interest rates. Duration is expressed as a number of years and is considered a more accurate sensitivity gauge than average maturity. |
| 3. | The yield curve is a line that plots the yields of various securities of similar quality—typically U.S. Treasury issues—across a range of maturities. The U.S. Treasury yield curve serves as a benchmark for other debt and is used in economic forecasting. |
| 4. | Convexity is a mathematical measure of the sensitivity of an interest-bearing bond to changes in interest rates. |
| 8 | MainStay VP MacKay Government Portfolio |
interest-rate volatility better than mortgage passthroughs. Within the CMO sector, the Portfolio’s interest-only structures performed especially well. Interest-only structures benefit from slower mortgage prepayment speeds. Slower speeds were a hallmark of the reporting period against the backdrop of higher mortgage rates.
The shorter durations of the Portfolio’s higher-coupon residential mortgage passthroughs dampened the negative price return from rising Treasury yields. Owing to this effect, higher-coupon passthroughs outperformed longer-duration, lower-coupon passthroughs.
Longer-duration U.S. Treasury securities were a weak contributor to the Portfolio’s absolute return as Treasury yields rose.
How did the Portfolio’s sector weightings change during the reporting period?
During the reporting period, we funded an increased allocation to CMOs with principal paydowns from mortgage-backed passthroughs. The trade expressed our preference for structured mortgage cash-flows.
We expanded the use of Treasury futures to control the Portfolio’s duration. The increased weighting proved useful in responding to the accelerated lengthening of single-family residential mortgage-backed durations as mortgage rates rose quickly during the reporting period.
Early in the reporting period, we sold the Portfolio’s remaining handful of corporate debentures.
All other sector exposures were stable during the reporting period.
How was the Portfolio positioned at the end of the reporting period?
Relative to the Index, the Portfolio ended the reporting period with underweight exposure to U.S. Treasury securities; equivalently weighted to agency debentures; and with overweight exposure to agency residential mortgage-backed securities (both single-family and multifamily) and taxable municipals. The Portfolio also held modestly overweight exposure to asset-backed securities and non-agency mortgage-backed securities. The Portfolio ended the reporting period with non-government exposure of approximately 5% of net assets, and with 0.4% of net assets in cash or cash equivalents.
The Portfolio benefits from the longer-term advantages of yield. The Portfolio primarily derives its superior yield from two sources: (a) the majority of its assets are invested in government-related securities that trade at a positive yield spread
to Treasury securities, and (b) the majority of the Portfolio’s assets are positioned in short- and intermediate-maturity securities that, under the current inverted structure of the Treasury yield curve, are higher yielding than longer-duration securities. As of December 31, 2022, the Portfolio held a 64-basis-point annualized yield advantage over the Index, compared with a 41-basis-point yield advantage at the beginning of the reporting period. The improved yield spread is explained by yields of mortgage-backed securities rising faster than comparable-duration Treasury yields over the prior twelve months.
The opinions expressed are those of the portfolio managers as of the date of this report and are subject to change. There is no guarantee that any forecasts will come to pass. This material does not constitute investment advice and is not intended as an endorsement of any specific investment.
Not all MainStay VP Portfolios and/or share classes are available under all policies.
Portfolio of Investments December 31, 2022†
| | Principal
Amount | Value |
| Long-Term Bonds 99.2% |
| Asset-Backed Securities 2.3% |
| Other Asset-Backed Securities 2.3% |
| FirstEnergy Ohio PIRB Special Purpose Trust | |
| Series 2013-1, Class A3 | | |
| 3.45%, due 1/15/36 | $ 440,179 | $ 403,253 |
| PSNH Funding LLC 3 | |
| Series 2018-1, Class A1 | | |
| 3.094%, due 2/1/26 | 114,326 | 113,199 |
| United States Small Business Administration | |
| Series 2012-20L, Class 1 | | |
| 1.93%, due 12/1/32 | 216,733 | 195,098 |
| Series 2014-20H, Class 1 | | |
| 2.88%, due 8/1/34 | 271,656 | 251,966 |
| Series 2015-20G, Class 1 | | |
| 2.88%, due 7/1/35 | 759,554 | 705,885 |
| Series 2014-20I, Class 1 | | |
| 2.92%, due 9/1/34 | 292,364 | 272,617 |
| Series 2014-20C, Class 1 | | |
| 3.21%, due 3/1/34 | 469,048 | 438,372 |
| Series 2018-20B, Class 1 | | |
| 3.22%, due 2/1/38 | 1,260,116 | 1,179,737 |
| Series 2018-20D, Class 1 | | |
| 3.31%, due 4/1/38 | 1,503,671 | 1,408,269 |
Total Asset-Backed Securities
(Cost $5,475,560) | | 4,968,396 |
| Corporate Bonds 1.5% |
| Electric 1.5% |
| Duke Energy Florida Project Finance LLC | | |
| Series 2026 | | |
| 2.538%, due 9/1/29 | 1,880,333 | 1,704,789 |
| PG&E Energy Recovery Funding LLC | | |
| Series A-1 | | |
| 1.46%, due 7/15/31 | 1,861,978 | 1,619,274 |
| | | 3,324,063 |
Total Corporate Bonds
(Cost $3,737,128) | | 3,324,063 |
| Mortgage-Backed Securities 22.6% |
| Agency (Collateralized Mortgage Obligations) 9.7% |
| FHLMC | |
| REMIC, Series 5038, Class SA | | |
| 0.172% (SOFR 30A + 4.10%), due 11/25/50 (a)(b) | 2,240,423 | 100,184 |
| | Principal
Amount | Value |
| |
| Agency (Collateralized Mortgage Obligations) (continued) |
| FHLMC (continued) | |
| REMIC, Series 5019, Class PL | | |
| 1.00%, due 10/25/50 | $ 627,390 | $ 467,269 |
| REMIC, Series 5057, Class SH | | |
| 1.822% (SOFR 30A + 5.75%), due 12/25/50 (a)(b) | 823,740 | 94,779 |
| REMIC, Series 5149, Class LI | | |
| 2.50%, due 10/25/51 (a) | 1,804,986 | 239,209 |
| REMIC, Series 4913, Class UA | | |
| 3.00%, due 3/15/49 | 307,893 | 277,674 |
| REMIC, Series 4908, Class BD | | |
| 3.00%, due 4/25/49 | 996,832 | 874,894 |
| REMIC, Series 5023, Class LI | | |
| 3.00%, due 10/25/50 (a) | 565,102 | 90,006 |
| REMIC, Series 5094, Class IP | | |
| 3.00%, due 4/25/51 (a) | 828,829 | 128,343 |
| REMIC, Series 5155, Class KI | | |
| 3.00%, due 10/25/51 (a) | 1,312,485 | 191,819 |
| REMIC, Series 5160 | | |
| 3.00%, due 10/25/51 (a) | 476,010 | 56,525 |
| REMIC, Series 4888, Class BA | | |
| 3.50%, due 9/15/48 | 131,797 | 124,280 |
| REMIC, Series 4877, Class AT | | |
| 3.50%, due 11/15/48 | 145,259 | 135,672 |
| REMIC, Series 4877, Class BE | | |
| 3.50%, due 11/15/48 | 218,647 | 203,899 |
| FNMA | |
| REMIC, Series 2022-3, Class YS | | |
| (zero coupon) (SOFR 30A + 2.55%), due 2/25/52 (a)(b) | 3,723,648 | 44,151 |
| REMIC, Series 2020-63, Class B | | |
| 1.25%, due 9/25/50 | 259,742 | 205,786 |
| REMIC, Series 2022-10, Class SA | | |
| 1.822% (SOFR 30A + 5.75%), due 2/25/52 (a)(b) | 1,140,755 | 145,264 |
| REMIC, Series 2012-124, Class PG | | |
| 2.00%, due 7/25/42 | 714,016 | 628,230 |
| REMIC, Series 2021-53, Class GI | | |
| 3.00%, due 7/25/48 (a) | 1,887,030 | 299,481 |
| REMIC, Series 2019-13, Class PE | | |
| 3.00%, due 3/25/49 | 213,056 | 190,801 |
| REMIC, Series 2019-58, Class LP | | |
| 3.00%, due 10/25/49 | 447,866 | 399,576 |
| REMIC, Series 2019-77, Class LZ | | |
| 3.00%, due 1/25/50 | 1,832,324 | 1,623,980 |
| REMIC, Series 2021-13, Class BI | | |
| 3.00%, due 2/25/50 (a) | 1,052,774 | 166,760 |
The notes to the financial statements are an integral part of, and should be read in conjunction with, the financial statements.
| 10 | MainStay VP MacKay Government Portfolio |
| | Principal
Amount | Value |
| Mortgage-Backed Securities (continued) |
| Agency (Collateralized Mortgage Obligations) (continued) |
| FNMA (continued) | |
| REMIC, Series 2021-85, Class BI | | |
| 3.00%, due 12/25/51 (a) | $ 1,508,149 | $ 234,214 |
| REMIC, Series 2020-10, Class LP | | |
| 3.50%, due 3/25/50 | 1,458,435 | 1,337,780 |
| REMIC, Series 2021-6, Class MC | | |
| 3.50%, due 6/25/50 | 1,364,063 | 1,266,280 |
| REMIC, Series 2021-6, Class ML | | |
| 3.50%, due 6/25/50 | 714,835 | 648,118 |
| REMIC, Series 2021-12, Class GC | | |
| 3.50%, due 7/25/50 | 1,086,940 | 1,000,676 |
| REMIC, Series 2020-10, Class DA | | |
| 3.50%, due 3/25/60 | 1,436,998 | 1,324,729 |
| FNMA, Strips (a) | |
| REMIC, Series 427, Class C77 | | |
| 2.50%, due 9/25/51 | 1,976,753 | 297,547 |
| REMIC, Series 360, Class 2 | | |
| 5.00%, due 8/25/35 | 40,498 | 7,236 |
| REMIC, Series 361, Class 2 | | |
| 6.00%, due 10/25/35 | 9,278 | 1,962 |
| GNMA | |
| REMIC, Series 2010-151, Class KO | | |
| (zero coupon), due 6/16/37 | 555,252 | 492,611 |
| REMIC, Series 2021-213, Class ES | | |
| (zero coupon) (SOFR 30A + 1.70%), due 12/20/51 (a)(b) | 5,718,249 | 10,980 |
| REMIC, Series 2021-78, Class LA | | |
| 1.00%, due 5/20/51 | 641,293 | 487,193 |
| REMIC, Series 2021-91, Class MF | | |
| 1.00%, due 5/20/51 | 326,423 | 247,701 |
| REMIC, Series 2021-105, Class DB | | |
| 1.00%, due 6/20/51 | 785,216 | 590,433 |
| REMIC, Series 2020-34, Class SC | | |
| 1.697% (1 Month LIBOR + 6.05%), due 3/20/50 (a)(b) | 1,009,449 | 100,978 |
| REMIC, Series 2020-146, Class SA | | |
| 1.947% (1 Month LIBOR + 6.30%), due 10/20/50 (a)(b) | 957,568 | 113,252 |
| REMIC, Series 2021-57, Class SD | | |
| 1.947% (1 Month LIBOR + 6.30%), due 3/20/51 (a)(b) | 1,347,264 | 159,412 |
| REMIC, Series 2021-57, Class AI | | |
| 2.00%, due 2/20/51 (a) | 2,569,122 | 268,104 |
| REMIC, Series 2021-57, Class IN | | |
| 2.00%, due 2/20/51 (a) | 435,194 | 50,590 |
| REMIC, Series 2014-63, Class PG | | |
| 2.50%, due 7/20/43 | 519,967 | 485,330 |
| | Principal
Amount | Value |
| |
| Agency (Collateralized Mortgage Obligations) (continued) |
| GNMA (continued) | |
| REMIC, Series 2021-25, Class LI | | |
| 2.50%, due 2/20/51 (a) | $ 2,385,736 | $ 300,986 |
| REMIC, Series 2021-105, Class IE | | |
| 2.50%, due 6/20/51 (a) | 722,929 | 85,722 |
| REMIC, Series 2021-188 | | |
| 2.50%, due 10/20/51 (a) | 1,499,336 | 239,947 |
| REMIC, Series 2019-3, Class A | | |
| 3.00%, due 4/20/48 | 87,322 | 83,562 |
| REMIC, Series 2019-59, Class KA | | |
| 3.00%, due 12/20/48 | 390,933 | 355,449 |
| REMIC, Series 2021-98, Class IN | | |
| 3.00%, due 6/20/51 (a) | 564,554 | 101,476 |
| REMIC, Series 2021-136, Class TI | | |
| 3.00%, due 8/20/51 (a) | 2,367,742 | 342,368 |
| REMIC, Series 2021-139, Class IA | | |
| 3.00%, due 8/20/51 (a) | 2,863,843 | 464,012 |
| REMIC, Series 2021-158, Class NI | | |
| 3.00%, due 9/20/51 (a) | 1,870,414 | 327,680 |
| REMIC, Series 2022-206, Class CN | | |
| 3.00%, due 2/20/52 | 1,230,000 | 1,067,700 |
| REMIC, Series 2021-175, Class DF | | |
| 3.50% (SOFR 30A + 0.25%), due 10/20/51 (b) | 1,919,824 | 1,698,042 |
| | | 20,880,652 |
| Commercial Mortgage Loans (Collateralized Mortgage Obligations) 12.3% |
| Arbor Multifamily Mortgage Securities Trust (c) | |
| Series 2021-MF3, Class A5 | | |
| 2.575%, due 10/15/54 | 3,000,000 | 2,430,475 |
| Series 2022-MF4, Class A5 | | |
| 3.293%, due 2/15/55 (d) | 2,000,000 | 1,721,595 |
| BXP Trust | |
| Series 2017-GM, Class A | | |
| 3.379%, due 6/13/39 (c) | 1,750,000 | 1,557,099 |
| FREMF Mortgage Trust (c)(d) | |
| REMIC, Series 2019-K103, Class B | | |
| 3.455%, due 12/25/51 | 2,144,000 | 1,839,498 |
| REMIC, Series 2013-K33, Class B | | |
| 3.495%, due 8/25/46 | 933,000 | 915,916 |
| REMIC, Series 2020-K104, Class C | | |
| 3.54%, due 2/25/52 | 1,200,000 | 1,007,716 |
| REMIC, Series 2016-K59, Class B | | |
| 3.579%, due 11/25/49 | 500,000 | 459,823 |
| REMIC, Series 2015-K49, Class C | | |
| 3.724%, due 10/25/48 | 500,000 | 467,323 |
The notes to the financial statements are an integral part of, and should be read in conjunction with, the financial statements.
11
Portfolio of Investments December 31, 2022† (continued)
| | Principal
Amount | Value |
| Mortgage-Backed Securities (continued) |
| Commercial Mortgage Loans (Collateralized Mortgage Obligations) (continued) |
| FREMF Mortgage Trust (c)(d) (continued) | |
| REMIC, Series 2016-K58, Class B | | |
| 3.738%, due 9/25/49 | $ 1,000,000 | $ 928,414 |
| REMIC, Series 2017-K71, Class B | | |
| 3.752%, due 11/25/50 | 1,935,000 | 1,751,249 |
| REMIC, Series 2014-K41, Class B | | |
| 3.833%, due 11/25/47 | 2,700,000 | 2,597,830 |
| REMIC, Series 2013-K35, Class B | | |
| 3.932%, due 12/25/46 | 1,925,000 | 1,897,677 |
| REMIC, Series 2016-K54, Class B | | |
| 4.053%, due 4/25/48 | 695,000 | 656,434 |
| REMIC, Series 2014-K40, Class B | | |
| 4.074%, due 11/25/47 | 1,645,000 | 1,595,398 |
| REMIC, Series 2018-K78, Class C | | |
| 4.129%, due 6/25/51 | 712,000 | 643,846 |
| REMIC, Series 2016-K55, Class B | | |
| 4.167%, due 4/25/49 | 1,570,000 | 1,486,304 |
| REMIC, Series 2014-K38, Class B | | |
| 4.221%, due 6/25/47 | 2,000,000 | 1,950,672 |
| REMIC, Series 2019-K87, Class C | | |
| 4.325%, due 1/25/51 | 1,500,000 | 1,345,967 |
| One Bryant Park Trust | |
| Series 2019-OBP, Class A | | |
| 2.516%, due 9/15/54 (c) | 1,265,000 | 1,035,609 |
| | | 26,288,845 |
| Whole Loan (Collateralized Mortgage Obligations) 0.6% |
| Citigroup Mortgage Loan Trust | |
| Series 2006-AR6, Class 1A1 | | |
| 3.79%, due 8/25/36 (d) | 51,190 | 44,499 |
| J.P. Morgan Mortgage Trust | |
| Series 2021-LTV2, Class A1 | | |
| 2.519%, due 5/25/52 (c)(e) | 1,337,488 | 1,071,188 |
| Seasoned Loans Structured Transaction | |
| Series 2019-1, Class A1 | | |
| 3.50%, due 5/25/29 | 243,596 | 231,975 |
| | | 1,347,662 |
Total Mortgage-Backed Securities
(Cost $55,398,605) | | 48,517,159 |
| | Principal
Amount | Value |
| Municipal Bonds 2.7% |
| New Jersey 1.1% |
New Jersey Turnpike Authority
Revenue Bonds | | |
| Series A | | |
| 7.102%, due 1/1/41 | $ 2,000,000 | $ 2,416,453 |
| New York 1.6% |
New York State Thruway Authority
Revenue Bonds | | |
| Series M | | |
| 2.90%, due 1/1/35 | 4,000,000 | 3,288,043 |
Total Municipal Bonds
(Cost $7,358,309) | | 5,704,496 |
| U.S. Government & Federal Agencies 70.1% |
| Federal Home Loan Mortgage Corporation (Mortgage Pass-Through Securities) 16.5% |
| FHLMC Gold Pools, 30 Year | | |
| 2.50%, due 8/1/46 | 576,826 | 497,830 |
| 3.00%, due 2/1/46 | 988,618 | 890,274 |
| 3.00%, due 4/1/47 | 1,072,085 | 959,992 |
| 3.50%, due 1/1/44 | 253,991 | 238,023 |
| 3.50%, due 1/1/48 | 981,474 | 910,483 |
| 4.00%, due 7/1/44 | 559,618 | 538,041 |
| 4.00%, due 12/1/46 | 380,896 | 365,520 |
| 4.00%, due 10/1/48 | 477,769 | 456,293 |
| 4.00%, due 3/1/49 | 185,889 | 176,910 |
| 4.50%, due 12/1/44 | 791,122 | 785,152 |
| 5.00%, due 11/1/41 | 601,219 | 614,677 |
| 6.50%, due 4/1/37 | 19,652 | 20,857 |
| FHLMC Gold Pools, Other | | |
| 4.50%, due 3/1/41 | 114,159 | 112,282 |
| Tennessee Valley Authority | | |
| 4.65%, due 6/15/35 | 4,395,000 | 4,340,782 |
| UMBS Pool, 15 Year | | |
| 2.00%, due 6/1/35 | 689,387 | 616,964 |
| 2.50%, due 9/1/34 | 226,501 | 208,693 |
| UMBS Pool, 30 Year | | |
| 2.00%, due 7/1/50 | 2,700,217 | 2,207,769 |
| 2.00%, due 7/1/50 | 867,247 | 709,082 |
| 2.00%, due 8/1/50 | 1,303,435 | 1,066,489 |
| 2.00%, due 8/1/50 | 19,228 | 15,856 |
| 2.00%, due 8/1/50 | 1,848,071 | 1,510,600 |
| 2.00%, due 9/1/50 | 886,841 | 725,736 |
| 2.00%, due 11/1/50 | 1,598,578 | 1,306,485 |
| 2.50%, due 3/1/50 | 910,025 | 777,697 |
The notes to the financial statements are an integral part of, and should be read in conjunction with, the financial statements.
| 12 | MainStay VP MacKay Government Portfolio |
| | Principal
Amount | Value |
| U.S. Government & Federal Agencies (continued) |
| Federal Home Loan Mortgage Corporation (Mortgage Pass-Through Securities) (continued) |
| UMBS Pool, 30 Year (continued) | | |
| 2.50%, due 7/1/50 | $ 1,541,993 | $ 1,314,586 |
| 2.50%, due 10/1/50 | 142,784 | 121,549 |
| 2.50%, due 11/1/50 | 1,440,146 | 1,228,037 |
| 2.50%, due 1/1/51 | 367,318 | 312,042 |
| 2.50%, due 2/1/51 | 2,158,555 | 1,843,129 |
| 2.50%, due 5/1/51 | 1,187,216 | 1,008,086 |
| 3.00%, due 6/1/46 | 517,229 | 463,790 |
| 3.00%, due 8/1/49 | 940,024 | 831,963 |
| 3.00%, due 9/1/49 | 160,596 | 141,862 |
| 3.00%, due 11/1/49 | 543,540 | 484,679 |
| 3.00%, due 1/1/52 | 3,567,732 | 3,133,446 |
| 3.00%, due 4/1/52 | 1,004,746 | 882,263 |
| 3.50%, due 1/1/50 | 939,257 | 861,987 |
| 3.50%, due 7/1/52 | 1,401,072 | 1,273,275 |
| 4.00%, due 5/1/52 | 964,638 | 904,881 |
| 4.50%, due 11/1/52 | 634,046 | 610,305 |
| | | 35,468,367 |
| Federal National Mortgage Association (Mortgage Pass-Through Securities) 30.8% |
| FNMA, Other | | |
| 2.50%, due 1/1/57 | 602,291 | 510,154 |
| 2.68%, due 5/1/25 | 1,978,393 | 1,887,201 |
| 2.73%, due 4/1/25 | 1,025,000 | 979,220 |
| 3.00%, due 9/1/46 | 420,158 | 372,041 |
| 3.00%, due 10/1/46 | 430,437 | 381,146 |
| 3.00%, due 10/1/48 | 8,964 | 7,812 |
| 3.00%, due 2/1/57 | 467,255 | 411,921 |
| 3.00%, due 6/1/57 | 539,135 | 474,620 |
| 6.00%, due 4/1/37 | 5,308 | 5,413 |
| 6.50%, due 8/1/47 | 8,174 | 8,414 |
| UMBS, 15 Year | | |
| 2.00%, due 6/1/35 | 1,248,234 | 1,113,424 |
| UMBS, 20 Year | | |
| 2.00%, due 5/1/41 | 2,129,505 | 1,813,554 |
| 2.50%, due 6/1/41 | 1,750,470 | 1,535,148 |
| 2.50%, due 7/1/41 | 1,842,302 | 1,615,748 |
| 3.00%, due 10/1/32 | 292,092 | 274,626 |
| UMBS, 30 Year | | |
| 2.00%, due 6/1/50 | 1,442,422 | 1,180,249 |
| 2.00%, due 10/1/50 | 1,704,165 | 1,392,607 |
| 2.00%, due 3/1/51 | 2,126,597 | 1,745,390 |
| 2.50%, due 1/1/47 | 1,535,098 | 1,323,471 |
| 2.50%, due 9/1/49 | 1,422,416 | 1,216,119 |
| 2.50%, due 3/1/50 | 416,633 | 357,057 |
| | Principal
Amount | Value |
| |
| Federal National Mortgage Association (Mortgage Pass-Through Securities) (continued) |
| UMBS, 30 Year (continued) | | |
| 2.50%, due 3/1/50 | $ 1,040,104 | $ 887,632 |
| 2.50%, due 3/1/50 | 987,312 | 842,578 |
| 2.50%, due 4/1/50 | 1,877,447 | 1,608,960 |
| 2.50%, due 5/1/50 | 3,173,301 | 2,706,828 |
| 2.50%, due 7/1/50 | 1,529,776 | 1,304,266 |
| 2.50%, due 8/1/50 | 1,887,828 | 1,613,593 |
| 2.50%, due 8/1/50 | 2,208,023 | 1,898,076 |
| 2.50%, due 9/1/50 | 2,307,525 | 1,983,778 |
| 2.50%, due 10/1/50 | 1,721,251 | 1,467,855 |
| 2.50%, due 11/1/50 | 2,378,111 | 2,055,358 |
| 2.50%, due 1/1/51 | 1,778,714 | 1,512,825 |
| 2.50%, due 4/1/51 | 1,453,999 | 1,248,530 |
| 3.00%, due 10/1/44 | 917,840 | 835,751 |
| 3.00%, due 3/1/47 | 510,339 | 457,578 |
| 3.00%, due 12/1/47 | 636,101 | 569,273 |
| 3.00%, due 10/1/49 | 587,222 | 518,822 |
| 3.00%, due 3/1/50 | 907,968 | 801,784 |
| 3.00%, due 3/1/50 | 977,756 | 863,305 |
| 3.00%, due 5/1/50 | 855,308 | 753,995 |
| 3.00%, due 7/1/50 | 1,524,532 | 1,345,085 |
| 3.00%, due 11/1/51 | 2,588,361 | 2,273,305 |
| 3.50%, due 5/1/43 | 1,116,777 | 1,050,324 |
| 3.50%, due 11/1/44 | 406,153 | 380,180 |
| 3.50%, due 3/1/45 | 457,956 | 426,979 |
| 3.50%, due 11/1/45 | 1,116,117 | 1,038,773 |
| 3.50%, due 8/1/46 | 300,375 | 279,030 |
| 3.50%, due 10/1/47 | 194,828 | 180,578 |
| 3.50%, due 2/1/48 | 105,276 | 97,307 |
| 3.50%, due 8/1/49 | 544,203 | 503,137 |
| 3.50%, due 9/1/50 | 1,837,452 | 1,716,470 |
| 4.00%, due 1/1/46 | 403,252 | 387,263 |
| 4.00%, due 9/1/47 | 155,484 | 148,422 |
| 4.00%, due 7/1/48 | 399,471 | 380,046 |
| 4.00%, due 8/1/48 | 2,026,798 | 1,932,537 |
| 4.00%, due 9/1/48 | 347,450 | 331,764 |
| 4.00%, due 4/1/49 | 101,839 | 96,988 |
| 4.00%, due 3/1/50 | 763,471 | 722,614 |
| 4.50%, due 2/1/41 | 1,367,451 | 1,355,073 |
| 4.50%, due 4/1/41 | 3,386,514 | 3,357,165 |
| 4.50%, due 8/1/42 | 541,203 | 536,512 |
| 4.50%, due 8/1/44 | 621,833 | 616,443 |
| 5.00%, due 9/1/41 | 1,184,571 | 1,199,525 |
| 5.00%, due 10/1/41 | 943,978 | 964,001 |
| 5.50%, due 7/1/41 | 1,765,746 | 1,823,019 |
The notes to the financial statements are an integral part of, and should be read in conjunction with, the financial statements.
13
Portfolio of Investments December 31, 2022† (continued)
| | Principal
Amount | Value |
| U.S. Government & Federal Agencies (continued) |
| Federal National Mortgage Association (Mortgage Pass-Through Securities) (continued) |
| UMBS, 30 Year (continued) | | |
| 6.00%, due 7/1/39 | $ 398,008 | $ 412,270 |
| 6.50%, due 10/1/39 | 73,563 | 76,611 |
| | | 66,167,543 |
| Government National Mortgage Association (Mortgage Pass-Through Securities) 0.7% |
| GNMA II, Other | | |
| 2.50%, due 1/20/50 | 267,858 | 226,809 |
| 2.50%, due 2/20/50 | 68,255 | 57,795 |
| 2.50%, due 4/20/50 | 90,187 | 76,366 |
| 2.50%, due 6/20/50 | 401,565 | 340,025 |
| GNMA II, Single Family, 30 Year | | |
| 4.00%, due 11/20/49 | 369,211 | 350,499 |
| 4.50%, due 7/20/49 | 300,873 | 294,727 |
| | | 1,346,221 |
| United States Treasury Bonds 1.7% |
| U.S. Treasury Bonds | | |
| 3.00%, due 5/15/45 | 2,790,000 | 2,298,481 |
| 4.375%, due 11/15/39 | 1,200,000 | 1,251,234 |
| | | 3,549,715 |
| United States Treasury Inflation - Indexed Notes 2.3% |
| U.S. Treasury Inflation Linked Notes (f) | | |
| 0.125%, due 1/15/30 | 3,208,491 | 2,881,937 |
| 0.125%, due 7/15/30 | 2,347,907 | 2,102,170 |
| | | 4,984,107 |
| United States Treasury Notes 18.1% |
| U.S. Treasury Notes | | |
| 0.375%, due 4/30/25 | 5,000,000 | 4,563,281 |
| 1.375%, due 10/31/28 | 5,400,000 | 4,661,086 |
| 1.50%, due 2/15/30 | 13,865,000 | 11,815,580 |
| 2.25%, due 4/30/24 | 3,150,000 | 3,050,086 |
| 2.375%, due 8/15/24 | 1,695,000 | 1,635,410 |
| 2.625%, due 1/31/26 | 5,900,000 | 5,637,265 |
| 3.00%, due 10/31/25 | 7,805,000 | 7,537,923 |
| | | 38,900,631 |
Total U.S. Government & Federal Agencies
(Cost $172,800,198) | | 150,416,584 |
Total Long-Term Bonds
(Cost $244,769,800) | | 212,930,698 |
| |
| | Shares | | Value |
| Short-Term Investment 0.4% |
| Affiliated Investment Company 0.4% |
| MainStay U.S. Government Liquidity Fund, 3.602% (g) | 844,323 | | $ 844,323 |
Total Short-Term Investment
(Cost $844,323) | | | 844,323 |
Total Investments
(Cost $245,614,123) | 99.6% | | 213,775,021 |
| Other Assets, Less Liabilities | 0.4 | | 918,362 |
| Net Assets | 100.0% | | $ 214,693,383 |
| † | Percentages indicated are based on Portfolio net assets. |
| (a) | Collateralized Mortgage Obligation Interest Only Strip—Pays a fixed or variable rate of interest based on mortgage loans or mortgage pass-through securities. The principal amount of the underlying pool represents the notional amount on which the current interest was calculated. The value of these stripped securities may be particularly sensitive to changes in prevailing interest rates and are typically more sensitive to changes in prepayment rates than traditional mortgage-backed securities. |
| (b) | Floating rate—Rate shown was the rate in effect as of December 31, 2022. |
| (c) | May be sold to institutional investors only under Rule 144A or securities offered pursuant to Section 4(a)(2) of the Securities Act of 1933, as amended. |
| (d) | Collateral strip rate—A bond whose interest was based on the weighted net interest rate of the collateral. The coupon rate adjusts periodically based on a predetermined schedule. Rate shown was the rate in effect as of December 31, 2022. |
| (e) | Coupon rate may change based on changes of the underlying collateral or prepayments of principal. Rate shown was the rate in effect as of December 31, 2022. |
| (f) | Treasury Inflation Protected Security—Pays a fixed rate of interest on a principal amount that is continuously adjusted for inflation based on the Consumer Price Index-Urban Consumers. |
| (g) | Current yield as of December 31, 2022. |
The notes to the financial statements are an integral part of, and should be read in conjunction with, the financial statements.
| 14 | MainStay VP MacKay Government Portfolio |
Investments in Affiliates (in 000's)
Investments in issuers considered to be affiliate(s) of the Portfolio during the year ended December 31, 2022 for purposes of Section 2(a)(3) of the Investment Company Act of 1940, as amended, were as follows:
| Affiliated Investment Companies | Value,
Beginning
of Year | Purchases
at Cost | Proceeds
from
Sales | Net
Realized
Gain/(Loss)
on Sales | Change in
Unrealized
Appreciation/
(Depreciation) | Value,
End of
Year | Dividend
Income | Other
Distributions | Shares
End of
Year |
| MainStay U.S. Government Liquidity Fund | $ 7,701 | $ 86,899 | $ (93,756) | $ — | $ — | $ 844 | $ 17 | $ — | 844 |
Futures Contracts
As of December 31, 2022, the Portfolio held the following futures contracts1:
| Type | Number of
Contracts | Expiration
Date | Value at
Trade Date | Current
Notional
Amount | Unrealized
Appreciation
(Depreciation)2 |
| Long Contracts | | | | | |
| U.S. Treasury 10 Year Notes | 19 | March 2023 | $ 2,139,474 | $ 2,133,641 | $ (5,833) |
| U.S. Treasury 10 Year Ultra Bonds | 46 | March 2023 | 5,449,278 | 5,440,937 | (8,341) |
| Net Unrealized Depreciation | | | | | $ (14,174) |
| 1. | As of December 31, 2022, cash in the amount of $179,800 was on deposit with a broker or futures commission merchant for futures transactions. |
| 2. | Represents the difference between the value of the contracts at the time they were opened and the value as of December 31, 2022. |
| Abbreviation(s): |
| FHLMC—Federal Home Loan Mortgage Corp. |
| FNMA—Federal National Mortgage Association |
| FREMF—Freddie Mac Multifamily |
| GNMA—Government National Mortgage Association |
| LIBOR—London Interbank Offered Rate |
| REMIC—Real Estate Mortgage Investment Conduit |
| SOFR—Secured Overnight Financing Rate |
| UMBS—Uniform Mortgage Backed Securities |
The notes to the financial statements are an integral part of, and should be read in conjunction with, the financial statements.
15
Portfolio of Investments December 31, 2022† (continued)
The following is a summary of the fair valuations according to the inputs used as of December 31, 2022, for valuing the Portfolio’s assets and liabilities:
| Description | Quoted
Prices in
Active
Markets for
Identical
Assets
(Level 1) | | Significant
Other
Observable
Inputs
(Level 2) | | Significant
Unobservable
Inputs
(Level 3) | | Total |
| Asset Valuation Inputs | | | | | | | |
| Investments in Securities (a) | | | | | | | |
| Long-Term Bonds | | | | | | | |
| Asset-Backed Securities | $ — | | $ 4,968,396 | | $ — | | $ 4,968,396 |
| Corporate Bonds | — | | 3,324,063 | | — | | 3,324,063 |
| Mortgage-Backed Securities | — | | 48,517,159 | | — | | 48,517,159 |
| Municipal Bonds | — | | 5,704,496 | | — | | 5,704,496 |
| U.S. Government & Federal Agencies | — | | 150,416,584 | | — | | 150,416,584 |
| Total Long-Term Bonds | — | | 212,930,698 | | — | | 212,930,698 |
| Short-Term Investment | | | | | | | |
| Affiliated Investment Company | 844,323 | | — | | — | | 844,323 |
| Total Investments in Securities | $ 844,323 | | $ 212,930,698 | | $ — | | $ 213,775,021 |
| Liability Valuation Inputs | | | | | | | |
| Other Financial Instruments | | | | | | | |
| Futures Contracts (b) | $ (14,174) | | $ — | | $ — | | $ (14,174) |
| (a) | For a complete listing of investments and their industries, see the Portfolio of Investments. |
| (b) | The value listed for these securities reflects unrealized appreciation (depreciation) as shown on the Portfolio of Investments. |
The notes to the financial statements are an integral part of, and should be read in conjunction with, the financial statements.
| 16 | MainStay VP MacKay Government Portfolio |
Statement of Assets and Liabilities as of December 31, 2022
| Assets |
Investment in unaffiliated securities, at value
(identified cost $244,769,800) | $212,930,698 |
Investment in affiliated investment companies, at value
(identified cost $844,323) | 844,323 |
| Cash collateral on deposit at broker for futures contracts | 179,800 |
| Receivables: | |
| Interest | 947,696 |
| Portfolio shares sold | 72,779 |
| Variation margin on futures contracts | 21,568 |
| Other assets | 1,737 |
| Total assets | 214,998,601 |
| Liabilities |
| Due to custodian | 28,961 |
| Payables: | |
| Manager (See Note 3) | 92,685 |
| Portfolio shares redeemed | 75,385 |
| NYLIFE Distributors (See Note 3) | 38,856 |
| Professional fees | 31,048 |
| Shareholder communication | 22,776 |
| Custodian | 6,574 |
| Accrued expenses | 8,933 |
| Total liabilities | 305,218 |
| Net assets | $214,693,383 |
| Composition of Net Assets |
| Shares of beneficial interest outstanding (par value of $.001 per share) unlimited number of shares authorized | $ 22,892 |
| Additional paid-in-capital | 248,653,267 |
| | 248,676,159 |
| Total distributable earnings (loss) | (33,982,776) |
| Net assets | $214,693,383 |
| Initial Class | |
| Net assets applicable to outstanding shares | $ 34,600,834 |
| Shares of beneficial interest outstanding | 3,662,123 |
| Net asset value per share outstanding | $ 9.45 |
| Service Class | |
| Net assets applicable to outstanding shares | $180,092,549 |
| Shares of beneficial interest outstanding | 19,229,857 |
| Net asset value per share outstanding | $ 9.37 |
The notes to the financial statements are an integral part of, and should be read in conjunction with, the financial statements.
17
Statement of Operations for the year ended December 31, 2022
| Investment Income (Loss) |
| Income | |
| Interest | $ 6,383,234 |
| Dividends-affiliated | 17,417 |
| Securities lending, net | 107 |
| Total income | 6,400,758 |
| Expenses | |
| Manager (See Note 3) | 1,272,747 |
| Distribution/Service—Service Class (See Note 3) | 505,321 |
| Professional fees | 70,660 |
| Custodian | 40,649 |
| Shareholder communication | 19,070 |
| Trustees | 5,085 |
| Miscellaneous | 11,796 |
| Total expenses | 1,925,328 |
| Net investment income (loss) | 4,475,430 |
| Realized and Unrealized Gain (Loss) |
| Net realized gain (loss) on: | |
| Unaffiliated investment transactions | (4,466,375) |
| Futures transactions | 309,292 |
| Net realized gain (loss) | (4,157,083) |
| Net change in unrealized appreciation (depreciation) on: | |
| Unaffiliated investments | (34,094,088) |
| Futures contracts | 38,339 |
| Net change in unrealized appreciation (depreciation) | (34,055,749) |
| Net realized and unrealized gain (loss) | (38,212,832) |
| Net increase (decrease) in net assets resulting from operations | $(33,737,402) |
The notes to the financial statements are an integral part of, and should be read in conjunction with, the financial statements.
| 18 | MainStay VP MacKay Government Portfolio |
Statements of Changes in Net Assets
for the years ended December 31, 2022 and December 31, 2021
| | 2022 | 2021 |
| Increase (Decrease) in Net Assets |
| Operations: | | |
| Net investment income (loss) | $ 4,475,430 | $ 3,512,295 |
| Net realized gain (loss) | (4,157,083) | 1,622,103 |
| Net change in unrealized appreciation (depreciation) | (34,055,749) | (11,221,883) |
| Net increase (decrease) in net assets resulting from operations | (33,737,402) | (6,087,485) |
| Distributions to shareholders: | | |
| Initial Class | (711,147) | (1,259,194) |
| Service Class | (3,018,585) | (3,271,917) |
| Total distributions to shareholders | (3,729,732) | (4,531,111) |
| Capital share transactions: | | |
| Net proceeds from sales of shares | 21,581,852 | 84,262,367 |
| Net asset value of shares issued to shareholders in reinvestment of distributions | 3,729,732 | 4,531,111 |
| Cost of shares redeemed | (96,041,715) | (144,292,025) |
| Increase (decrease) in net assets derived from capital share transactions | (70,730,131) | (55,498,547) |
| Net increase (decrease) in net assets | (108,197,265) | (66,117,143) |
| Net Assets |
| Beginning of year | 322,890,648 | 389,007,791 |
| End of year | $ 214,693,383 | $ 322,890,648 |
The notes to the financial statements are an integral part of, and should be read in conjunction with, the financial statements.
19
Financial Highlights selected per share data and ratios
| | Year Ended December 31, |
| Initial Class | 2022 | | 2021 | | 2020 | | 2019 | | 2018 |
| Net asset value at beginning of year | $ 10.87 | | $ 11.21 | | $ 10.84 | | $ 10.49 | | $ 10.78 |
| Net investment income (loss) (a) | 0.20 | | 0.13 | | 0.17 | | 0.25 | | 0.26 |
| Net realized and unrealized gain (loss) | (1.43) | | (0.30) | | 0.36 | | 0.32 | | (0.27) |
| Total from investment operations | (1.23) | | (0.17) | | 0.53 | | 0.57 | | (0.01) |
| Less distributions: | | | | | | | | | |
| From net investment income | (0.19) | | (0.17) | | (0.16) | | (0.22) | | (0.28) |
| Net asset value at end of year | $ 9.45 | | $ 10.87 | | $ 11.21 | | $ 10.84 | | $ 10.49 |
| Total investment return (b) | (11.29)% | | (1.50)% | | 4.97% | | 5.42% | | (0.06)% |
| Ratios (to average net assets)/Supplemental Data: | | | | | | | | | |
| Net investment income (loss) | 1.92% | | 1.15% | | 1.50% | | 2.35% | | 2.44% |
| Net expenses (c) | 0.56% | | 0.55% | | 0.56% | | 0.57% | | 0.57% |
| Portfolio turnover rate | 17%(d) | | 69%(d) | | 77%(d) | | 30% | | 92%(d) |
| Net assets at end of year (in 000's) | $ 34,601 | | $ 83,838 | | $ 107,954 | | $ 51,698 | | $ 52,552 |
| (a) | Per share data based on average shares outstanding during the year. |
| (b) | Total return does not reflect any deduction of sales charges, mortality and expense charges, contract charges or administrative charges. For periods of less than one year, total return is not annualized. |
| (c) | In addition to the fees and expenses which the Portfolio bears directly, it also indirectly bears a pro-rata share of the fees and expenses of the underlying funds in which it invests. Such indirect expenses are not included in the above expense ratios. |
| (d) | The portfolio turnover rates not including mortgage dollar rolls were 13%, 37%, 53% and 80% for the years ended December 31, 2022, 2021, 2020 and 2018, respectively. |
| | Year Ended December 31, |
| Service Class | 2022 | | 2021 | | 2020 | | 2019 | | 2018 |
| Net asset value at beginning of year | $ 10.77 | | $ 11.10 | | $ 10.74 | | $ 10.41 | | $ 10.69 |
| Net investment income (loss) (a) | 0.17 | | 0.10 | | 0.14 | | 0.22 | | 0.23 |
| Net realized and unrealized gain (loss) | (1.41) | | (0.29) | | 0.37 | | 0.31 | | (0.26) |
| Total from investment operations | (1.24) | | (0.19) | | 0.51 | | 0.53 | | (0.03) |
| Less distributions: | | | | | | | | | |
| From net investment income | (0.16) | | (0.14) | | (0.15) | | (0.20) | | (0.25) |
| Net asset value at end of year | $ 9.37 | | $ 10.77 | | $ 11.10 | | $ 10.74 | | $ 10.41 |
| Total investment return (b) | (11.51)% | | (1.74)% | | 4.70% | | 5.15% | | (0.31)% |
| Ratios (to average net assets)/Supplemental Data: | | | | | | | | | |
| Net investment income (loss) | 1.72% | | 0.94% | | 1.29% | | 2.09% | | 2.19% |
| Net expenses (c) | 0.81% | | 0.80% | | 0.80% | | 0.82% | | 0.82% |
| Portfolio turnover rate | 17%(d) | | 69%(d) | | 77%(d) | | 30% | | 92%(d) |
| Net assets at end of year (in 000's) | $ 180,093 | | $ 239,053 | | $ 281,054 | | $ 200,869 | | $ 159,575 |
| (a) | Per share data based on average shares outstanding during the year. |
| (b) | Total return does not reflect any deduction of sales charges, mortality and expense charges, contract charges or administrative charges. For periods of less than one year, total return is not annualized. |
| (c) | In addition to the fees and expenses which the Portfolio bears directly, it also indirectly bears a pro-rata share of the fees and expenses of the underlying funds in which it invests. Such indirect expenses are not included in the above expense ratios. |
| (d) | The portfolio turnover rates not including mortgage dollar rolls were 13%, 37%, 53% and 80% for the years ended December 31, 2022, 2021, 2020 and 2018, respectively. |
The notes to the financial statements are an integral part of, and should be read in conjunction with, the financial statements.
| 20 | MainStay VP MacKay Government Portfolio |
Notes to Financial Statements
Note 1–Organization and Business
MainStay VP Funds Trust (the “Fund”) was organized as a Delaware statutory trust on February 1, 2011. The Fund is registered under the Investment Company Act of 1940, as amended (the “1940 Act”), as an open-end management investment company. The Fund is comprised of thirty-one separate series (collectively referred to as the “Portfolios”). These financial statements and notes relate to the MainStay VP MacKay Government Portfolio (the "Portfolio"), a "diversified” portfolio, as that term is defined in the 1940 Act, as interpreted or modified by regulatory authorities having jurisdiction, from time to time.
Shares of the Portfolio are currently offered to certain separate accounts to fund variable annuity policies and variable universal life insurance policies issued by New York Life Insurance and Annuity Corporation (“NYLIAC”), a wholly-owned subsidiary of New York Life Insurance Company (“New York Life”) and may also be offered to fund variable annuity policies and variable universal life insurance policies issued by other insurance companies. NYLIAC allocates shares of the Portfolio to, among others, certain NYLIAC separate accounts. Shares of the Portfolio are also offered to the MainStay VP Conservative Allocation Portfolio, MainStay VP Moderate Allocation Portfolio, MainStay VP Growth Allocation Portfolio and MainStay VP Equity Allocation Portfolio, which operate as “funds-of-funds," and other variable insurance funds.
The following table lists the Portfolio's share classes that have been registered and commenced operations:
| Class | Commenced Operations |
| Initial Class | January 29, 1993 |
| Service Class | June 4, 2003 |
Shares of the Portfolio are offered and are redeemed at a price equal to their respective net asset value (“NAV”) per share. No sales or redemption charge is applicable to the purchase or redemption of the Portfolio's shares. Under the terms of the Fund’s multiple class plan, adopted pursuant to Rule 18f-3 under the 1940 Act, the classes differ in that, among other things, Service Class shares of the Portfolio pay a combined distribution and service fee of 0.25% of average daily net assets attributable to Service Class shares of the Portfolio to the Distributor (as defined in Note 3(B)) pursuant to a plan adopted in accordance with Rule 12b-1 under the 1940 Act. Contract owners of variable annuity contracts purchased after June 2, 2003, are permitted to invest only in the Service Class shares.
The Portfolio's investment objective is to seek current income.
Note 2–Significant Accounting Policies
The Portfolio is an investment company and accordingly follows the investment company accounting and reporting guidance of the Financial Accounting Standards Board (“FASB”) Accounting Standards Codification Topic 946 Financial Services—Investment Companies. The Portfolio prepares its financial statements in accordance with generally accepted
accounting principles (“GAAP”) in the United States of America and follows the significant accounting policies described below.
(A) Securities Valuation. Investments are usually valued as of the close of regular trading on the New York Stock Exchange (the "Exchange") (usually 4:00 p.m. Eastern time) on each day the Portfolio is open for business ("valuation date").
Effective September 8, 2022, and pursuant to Rule 2a-5 under the 1940 Act, the Board of Trustees of the Fund (the "Board") designated New York Life Investment Management LLC (“New York Life Investments” or the "Manager") as its Valuation Designee (the "Valuation Designee"). The Valuation Designee is responsible for performing fair valuations relating to all investments in the Portfolio’s portfolio for which market quotations are not readily available; periodically assessing and managing material valuation risks; establishing and applying fair value methodologies; testing fair valuation methodologies; evaluating and overseeing pricing services; ensuring appropriate segregation of valuation and portfolio management functions; providing quarterly, annual and prompt reporting to the Board, as appropriate; identifying potential conflicts of interest; and maintaining appropriate records. The Valuation Designee has established a valuation committee ("Valuation Committee") to assist in carrying out the Valuation Designee’s responsibilities and establish prices of securities for which market quotations are not readily available. The Portfolio’s and the Valuation Designee's policies and procedures ("Valuation Procedures") govern the Valuation Designee’s selection and application of methodologies for determining and calculating the fair value of Portfolio investments. The Valuation Designee may value the Portfolio's portfolio securities for which market quotations are not readily available and other Portfolio assets utilizing inputs from pricing services and other third-party sources (together, “Pricing Sources”). The Valuation Committee meets (in person, via electronic mail or via teleconference) on an ad-hoc basis to determine fair valuations and on a quarterly basis to review fair value events with respect to certain securities for which market quotations are not readily available, including valuation risks and back-testing results, and preview reports to the Board.
The Valuation Committee establishes prices of securities for which market quotations are not readily available based on such methodologies and measurements on a regular basis after considering information that is reasonably available and deemed relevant by the Valuation Committee. The Board shall oversee the Valuation Designee and review fair valuation materials on a prompt, quarterly and annual basis and approve proposed revisions to the Valuation Procedures.
Investments for which market quotations are not readily available are valued at fair value as determined in good faith pursuant to the Valuation Procedures. A market quotation is readily available only when that quotation is a quoted price (unadjusted) in active markets for identical investments that the Portfolio can access at the measurement date, provided that a quotation will not be readily available if it is not reliable. "Fair value" is defined as the price the Portfolio would reasonably expect to receive upon selling an asset or liability in an orderly transaction to an independent buyer in the principal or most advantageous market for the
Notes to Financial Statements (continued)
asset or liability. Fair value measurements are determined within a framework that establishes a three-tier hierarchy that maximizes the use of observable market data and minimizes the use of unobservable inputs to establish a classification of fair value measurements for disclosure purposes. "Inputs" refer broadly to the assumptions that market participants would use in pricing the asset or liability, including assumptions about risk, such as the risk inherent in a particular valuation technique used to measure fair value using a pricing model and/or the risk inherent in the inputs for the valuation technique. Inputs may be observable or unobservable. Observable inputs reflect the assumptions market participants would use in pricing the asset or liability based on market data obtained from sources independent of the Portfolio. Unobservable inputs reflect the Portfolio’s own assumptions about the assumptions market participants would use in pricing the asset or liability based on the information available. The inputs or methodology used for valuing assets or liabilities may not be an indication of the risks associated with investing in those assets or liabilities. The three-tier hierarchy of inputs is summarized below.
| • | Level 1—quoted prices (unadjusted) in active markets for an identical asset or liability |
| • | Level 2—other significant observable inputs (including quoted prices for a similar asset or liability in active markets, interest rates and yield curves, prepayment speeds, credit risk, etc.) |
| • | Level 3—significant unobservable inputs (including the Portfolio's own assumptions about the assumptions that market participants would use in measuring fair value of an asset or liability) |
The level of an asset or liability within the fair value hierarchy is based on the lowest level of an input, both individually and in the aggregate, that is significant to the fair value measurement. The aggregate value by input level of the Portfolio’s assets and liabilities as of December 31, 2022, is included at the end of the Portfolio of Investments.
The Portfolio may use third-party vendor evaluations, whose prices may be derived from one or more of the following standard inputs, among others:
| • Benchmark yields | • Reported trades |
| • Broker/dealer quotes | • Issuer spreads |
| • Two-sided markets | • Benchmark securities |
| • Bids/offers | • Reference data (corporate actions or material event notices) |
| • Industry and economic events | • Comparable bonds |
| • Monthly payment information | |
An asset or liability for which a market quotation is not readily available is valued by methods deemed reasonable in good faith by the Valuation Committee, following the Valuation Procedures to represent fair value. Under these procedures, the Valuation Designee generally uses a market-based approach which may use related or comparable assets or liabilities, recent transactions, market multiples, book values and other relevant information. The Valuation Designee may also use an
income-based valuation approach in which the anticipated future cash flows of the asset or liability are discounted to calculate fair value. Discounts may also be applied due to the nature and/or duration of any restrictions on the disposition of the asset or liability. Fair value represents a good faith approximation of the value of a security. Fair value determinations involve the consideration of a number of subjective factors, an analysis of applicable facts and circumstances and the exercise of judgment. As a result, it is possible that the fair value for a security determined in good faith in accordance with the Valuation Procedures may differ from valuations for the same security determined for other funds using their own valuation procedures. Although the Valuation Procedures are designed to value a security at the price the Portfolio may reasonably expect to receive upon the security's sale in an orderly transaction, there can be no assurance that any fair value determination thereunder would, in fact, approximate the amount that the Portfolio would actually realize upon the sale of the security or the price at which the security would trade if a reliable market price were readily available. During the year ended December 31, 2022, there were no material changes to the fair value methodologies.
Securities which may be valued in this manner include, but are not limited to: (i) a security for which trading has been halted or suspended or otherwise does not have a readily available market quotation on a given day; (ii) a debt security that has recently gone into default and for which there is not a current market quotation; (iii) a security of an issuer that has entered into a restructuring; (iv) a security that has been delisted from a national exchange; (v) a security subject to trading collars for which no or limited trading takes place; and (vi) a security whose principal market has been temporarily closed at a time when, under normal conditions, it would be open. Securities valued in this manner are generally categorized as Level 2 or 3 in the hierarchy.
Investments in mutual funds, including money market funds, are valued at their respective NAVs at the close of business each day on the valuation date. These securities are generally categorized as Level 1 in the hierarchy.
Futures contracts are valued at the last posted settlement price on the market where such futures are primarily traded. These securities are generally categorized as Level 1 in the hierarchy.
Debt securities (other than convertible and municipal bonds) are valued at the evaluated bid prices (evaluated mean prices in the case of convertible and municipal bonds) supplied by a pricing agent or broker selected by the Valuation Designee, in consultation with the Subadvisor. The evaluations are market-based measurements processed through a pricing application and represents the pricing agent’s good faith determination as to what a holder may receive in an orderly transaction under market conditions. The rules-based logic utilizes valuation techniques that reflect participants’ assumptions and vary by asset class and per methodology, maximizing the use of relevant observable data including quoted prices for similar assets, benchmark yield curves and market corroborated inputs. The evaluated bid or mean prices are deemed by the Valuation Designee, in consultation with the Subadvisor, to be representative of
| 22 | MainStay VP MacKay Government Portfolio |
market values at the regular close of trading of the Exchange on each valuation date. Debt securities purchased on a delayed delivery basis are marked to market daily until settlement at the forward settlement date. Debt securities, including corporate bonds, U.S. government and federal agency bonds, municipal bonds, foreign bonds, convertible bonds, asset-backed securities and mortgage-backed securities are generally categorized as Level 2 in the hierarchy.
Temporary cash investments acquired in excess of 60 days to maturity at the time of purchase are valued using the latest bid prices or using valuations based on a matrix system (which considers such factors as security prices, yields, maturities and ratings), both as furnished by independent pricing services. Temporary cash investments that mature in 60 days or less at the time of purchase ("Short-Term Investments") are valued using the amortized cost method of valuation, unless the use of such method would be inappropriate. The amortized cost method involves valuing a security at its cost on the date of purchase and thereafter assuming a constant amortization to maturity of the difference between such cost and the value on maturity date. Amortized cost approximates the current fair value of a security. Securities valued using the amortized cost method are not valued using quoted prices in an active market and are generally categorized as Level 2 in the hierarchy.
The information above is not intended to reflect an exhaustive list of the methodologies that may be used to value portfolio investments. The Valuation Procedures permit the use of a variety of valuation methodologies in connection with valuing portfolio investments. The methodology used for a specific type of investment may vary based on the market data available or other considerations. The methodologies summarized above may not represent the specific means by which portfolio investments are valued on any particular business day.
(B) Income Taxes. The Portfolio's policy is to comply with the requirements of the Internal Revenue Code of 1986, as amended (the “Internal Revenue Code”), applicable to regulated investment companies and to distribute all of its taxable income to the shareholders of the Portfolio within the allowable time limits.
The Manager evaluates the Portfolio’s tax positions to determine if the tax positions taken meet the minimum recognition threshold in connection with accounting for uncertainties in income tax positions taken or expected to be taken for the purposes of measuring and recognizing tax liabilities in the financial statements. Recognition of tax benefits of an uncertain tax position is permitted only to the extent the position is “more likely than not” to be sustained assuming examination by taxing authorities. The Manager analyzed the Portfolio's tax positions taken on federal, state and local income tax returns for all open tax years (for up to three tax years) and has concluded that no provisions for federal, state and local income tax are required in the Portfolio's financial statements. The Portfolio's federal, state and local income tax and federal excise tax returns for tax years for which the applicable statutes of limitations have not expired are subject to examination by the Internal Revenue Service and state and local departments of revenue.
(C) Dividends and Distributions to Shareholders. Dividends and distributions are recorded on the ex-dividend date. The Portfolio intends to declare and pay dividends from net investment income and distributions from net realized capital and currency gains, if any, at least annually. All dividends and distributions are reinvested at NAV in the same class of shares of the Portfolio. Dividends and distributions to shareholders are determined in accordance with federal income tax regulations and may differ from determinations using GAAP.
(D) Security Transactions and Investment Income. The Portfolio records security transactions on the trade date. Realized gains and losses on security transactions are determined using the identified cost method. Interest income is accrued as earned using the effective interest rate method and includes any realized gains and losses from repayments of principal on mortgage-backed securities. Discounts and premiums on securities purchased, other than temporary cash investments that mature in 60 days or less at the time of purchase, for the Portfolio are accreted and amortized, respectively, on the effective interest rate method.
Investment income and realized and unrealized gains and losses on investments of the Portfolio are allocated pro rata to the separate classes of shares based upon their relative net assets on the date the income is earned or realized and unrealized gains and losses are incurred.
The Portfolio may place a debt security on non-accrual status and reduce related interest income by ceasing current accruals and writing off all or a portion of any interest receivables when the collection of all or a portion of such interest has become doubtful. A debt security is removed from non-accrual status when the issuer resumes interest payments or when collectability of interest is reasonably assured.
(E) Expenses. Expenses of the Fund are allocated to the individual Portfolios in proportion to the net assets of the respective Portfolios when the expenses are incurred, except where direct allocations of expenses can be made. Expenses (other than fees incurred under the distribution and service plans, further discussed in Note 3(B), which are charged directly to the Service Class shares) are allocated to separate classes of shares pro rata based upon their relative net assets on the date the expenses are incurred. The expenses borne by the Portfolio, including those of related parties to the Portfolio, are shown in the Statement of Operations.
Additionally, the Portfolio may invest in mutual funds, which are subject to management fees and other fees that may cause the costs of investing in mutual funds to be greater than the costs of owning the underlying securities directly. These indirect expenses of mutual funds are not included in the amounts shown as expenses in the Statement of Operations or in the expense ratios included in the Financial Highlights.
(F) Use of Estimates. In preparing financial statements in conformity with GAAP, the Manager makes estimates and assumptions that affect the reported amounts and disclosures in the financial statements. Actual results could differ from those estimates and assumptions.
Notes to Financial Statements (continued)
(G) Futures Contracts. A futures contract is an agreement to purchase or sell a specified quantity of an underlying instrument at a specified future date and price, or to make or receive a cash payment based on the value of a financial instrument (e.g., foreign currency, interest rate, security or securities index). The Portfolio is subject to risks such as market price risk, leverage risk, liquidity risk, counterparty risk, operational risk, legal risk and/or interest rate risk in the normal course of investing in these contracts. Upon entering into a futures contract, the Portfolio is required to pledge to the broker or futures commission merchant an amount of cash and/or U.S. government securities equal to a certain percentage of the collateral amount, known as the “initial margin.” During the period the futures contract is open, changes in the value of the contract are recognized as unrealized appreciation or depreciation by marking to market such contract on a daily basis to reflect the market value of the contract at the end of each day’s trading. The Portfolio agrees to receive from or pay to the broker or futures commission merchant an amount of cash equal to the daily fluctuation in the value of the contract. Such receipts or payments are known as “variation margin.” When the futures contract is closed, the Portfolio records a realized gain or loss equal to the difference between the proceeds from (or cost of) the closing transaction and the Portfolio's basis in the contract.
The use of futures contracts involves, to varying degrees, elements of market risk in excess of the amount recognized in the Statement of Assets and Liabilities. The contract or notional amounts and variation margin reflect the extent of the Portfolio's involvement in open futures positions. There are several risks associated with the use of futures contracts as hedging techniques. There can be no assurance that a liquid market will exist at the time when the Portfolio seeks to close out a futures contract. If no liquid market exists, the Portfolio would remain obligated to meet margin requirements until the position is closed. Futures contracts may involve a small initial investment relative to the risk assumed, which could result in losses greater than if the Portfolio did not invest in futures contracts. Futures contracts may be more volatile than direct investments in the instrument underlying the futures and may not correlate to the underlying instrument, causing a given hedge not to achieve its objectives. The Portfolio's activities in futures contracts have minimal counterparty risk as they are conducted through regulated exchanges that guarantee the futures against default by the counterparty. In the event of a bankruptcy or insolvency of a futures commission merchant that holds margin on behalf of the Portfolio, the Portfolio may not be entitled to the return of the entire margin owed to the Portfolio, potentially resulting in a loss. The Portfolio may invest in futures contracts to seek enhanced returns or to reduce the risk of loss by hedging certain of its holdings. The Portfolio's investment in futures contracts and other derivatives may increase the volatility of the Portfolio's NAVs and may result in a loss to the Portfolio. Open futures contracts as of December 31, 2022, are shown in the Portfolio of Investments.
(H) Securities Lending. In order to realize additional income, the Portfolio may engage in securities lending, subject to the limitations set forth in the 1940 Act and relevant guidance by the staff of the Securities
and Exchange Commission (“SEC”). If the Portfolio engages in securities lending, the Portfolio will lend through its custodian, JPMorgan Chase Bank, N.A., ("JPMorgan"), acting as securities lending agent on behalf of the Portfolio. Under the current arrangement, JPMorgan will manage the Portfolio's collateral in accordance with the securities lending agency agreement between the Portfolio and JPMorgan, and indemnify the Portfolio against counterparty risk. The loans will be collateralized by cash (which may be invested in a money market fund) and/or non-cash collateral (which may include U.S. Treasury securities and/or U.S. government agency securities issued or guaranteed by the United States government or its agencies or instrumentalities) at least equal at all times to the market value of the securities loaned. Non-cash collateral held at year end is segregated and cannot be transferred by the Portfolio. The Portfolio bears the risk of delay in recovery of, or loss of rights in, the securities loaned. The Portfolio may also record a realized gain or loss on securities deemed sold due to a borrower’s inability to return securities on loan. The Portfolio bears the risk of any loss on investment of cash collateral. The Portfolio will receive compensation for lending its securities in the form of fees or it will retain a portion of interest earned on the investment of any cash collateral. The Portfolio will also continue to receive interest and dividends on the securities loaned and any gain or loss in the market price of the securities loaned that may occur during the term of the loan will be for the account of the Portfolio. Income earned from securities lending activities, if any, is reflected in the Statement of Operations. As of December 31, 2022, the Portfolio did not have any portfolio securities on loan.
(I) Dollar Rolls. The Portfolio may enter into dollar roll transactions in which it sells mortgage-backed securities ("MBS") from its portfolio to a counterparty from whom it simultaneously agrees to buy a similar security on a delayed delivery basis. The Portfolio generally transfers MBS where the MBS are "to be announced," therefore, the Portfolio accounts for these transactions as purchases and sales.
When accounted for as purchase and sales, the securities sold in connection with the dollar rolls are removed from the portfolio and a realized gain or loss is recognized. The securities the Portfolio has agreed to acquire are included at market value in the Portfolio of Investments and liabilities for such purchase commitments are included as payables for investments purchased. During the roll period, the Portfolio foregoes principal and interest paid on the securities. The Portfolio is compensated by the difference between the current sales price and the forward price for the future as well as by the earnings on the cash proceeds of the initial sale. Dollar rolls may be renewed without physical delivery of the securities subject to the contract. Dollar roll transactions involve certain risks, including the risk that the securities returned to the Portfolio at the end of the roll period, while substantially similar, could be inferior to what was initially sold to the counterparty.
(J) Debt Securities Risk. The ability of issuers of debt securities held by the Portfolio to meet their obligations may be affected by, among other things, economic or political developments in a specific country, industry
| 24 | MainStay VP MacKay Government Portfolio |
or region. Debt securities are also subject to the risks associated with changes in interest rates.
Investments in the Portfolio are not guaranteed, even though some of the Portfolio’s underlying investments are guaranteed by the U.S. government or its agencies or instrumentalities. The principal risk of mortgage-related and asset-backed securities is that the underlying debt may be prepaid ahead of schedule, if interest rates fall, thereby reducing the value of the Portfolio’s investment. If interest rates rise, less of the debt may be prepaid and the Portfolio may lose money because the Portfolio may be unable to invest in higher yielding assets. The Portfolio is subject to interest-rate risk and can lose principal value when interest rates rise. Bonds are also subject to credit risk, in which the bond issuer may fail to pay interest and principal in a timely manner.
(K) LIBOR Replacement Risk. The Portfolio may invest in certain debt securities, derivatives or other financial instruments that utilize the London Interbank Offered Rate ("LIBOR"), as a “benchmark” or “reference rate” for various interest rate calculations. As of January 1, 2022, the United Kingdom Financial Conduct Authority, which regulates LIBOR, ceased its active encouragement of banks to provide the quotations needed to sustain most LIBOR rates due to the absence of an active market for interbank unsecured lending and other reasons. However, the United Kingdom Financial Conduct Authority, the LIBOR administrator and other regulators announced that the most widely used tenors of U.S. dollar LIBOR will continue until mid-2023. As a result, it is anticipated that the remaining LIBOR settings will be discontinued or will no longer be sufficiently robust to be representative of its underlying market around that time. Various financial industry groups will plan for that transition and certain regulators and industry groups have taken actions to establish alternative reference rates (e.g., the Secured Overnight Financing Rate, which measures the cost of overnight borrowings through repurchase agreement transactions collateralized with U.S. Treasury securities and is intended to replace U.S. dollar LIBOR with certain adjustments). However, there are challenges to converting certain contracts and transactions to a new benchmark and neither the full effects of the transition process nor its ultimate outcome is known.
The elimination of LIBOR or changes to other reference rates or any other changes or reforms to the determination or supervision of reference rates could have an adverse impact on the market for, or value of, any securities or payments linked to those reference rates, which may adversely affect the Portfolio's performance and/or net asset value. Uncertainty and risk also remain regarding the willingness and ability of issuers and lenders to include enhanced provisions in new and existing contracts or instruments. Consequently, the transition away from LIBOR to other reference rates may lead to increased volatility and illiquidity in markets that are tied to LIBOR, fluctuations in values of LIBOR-related investments or investments in issuers that utilize LIBOR, increased difficulty in borrowing or refinancing and diminished effectiveness of hedging strategies, adversely affecting the Portfolio's performance. Furthermore, the risks associated with the expected discontinuation of LIBOR and transition may be exacerbated if the work necessary to effect
an orderly transition to an alternative reference rate is not completed in a timely manner. While the transition away from LIBOR has already begun with no material adverse effect to the Portfolio's performance, the transition is expected to last through mid-2023 for some LIBOR tenors. The usefulness of LIBOR as a benchmark could deteriorate anytime during this transition period.
(L) Indemnifications. Under the Fund’s organizational documents, its officers and trustees are indemnified against certain liabilities that may arise out of performance of their duties to the Fund. Additionally, in the normal course of business, the Portfolio enters into contracts with third-party service providers that contain a variety of representations and warranties and that may provide general indemnifications. The Portfolio's maximum exposure under these arrangements is unknown, as this would involve future claims that may be made against the Portfolio that have not yet occurred. The Manager believes that the risk of loss in connection with these potential indemnification obligations is remote. However, there can be no assurance that material liabilities related to such obligations will not arise in the future, which could adversely impact the Portfolio.
(M) Quantitative Disclosure of Derivative Holdings. The following tables show additional disclosures related to the Portfolio's derivative and hedging activities, including how such activities are accounted for and their effect on the Portfolio's financial positions, performance and cash flows.
The Portfolio entered into futures contracts to help manage the duration and yield curve positioning of the portfolio while minimizing the exposure to wider bid/ask spreads in traditional bonds. These derivatives are not accounted for as hedging instruments.
Fair value of derivative instruments as of December 31, 2022:
| Liability Derivatives | Interest
Rate
Contracts
Risk | Total |
| Futures Contracts - Net Assets—Net unrealized depreciation on futures contracts (a) | $(14,174) | $(14,174) |
| Total Fair Value | $(14,174) | $(14,174) |
| (a) | Includes cumulative appreciation (depreciation) of futures contracts as reported in the Portfolio of Investments. Only current day’s variation margin is reported within the Statement of Assets and Liabilities. |
The effect of derivative instruments on the Statement of Operations for the year ended December 31, 2022:
| Net Realized Gain (Loss) from: | Interest
Rate
Contracts
Risk | Total |
| Futures Contracts | $309,292 | $309,292 |
| Total Net Realized Gain (Loss) | $309,292 | $309,292 |
Notes to Financial Statements (continued)
| Net Change in Unrealized Appreciation (Depreciation) | Interest
Rate
Contracts
Risk | Total |
| Futures Contracts | $38,339 | $38,339 |
| Total Net Change in Unrealized Appreciation (Depreciation) | $38,339 | $38,339 |
| Average Notional Amount | Total |
| Futures Contracts Long | $ 14,074,482 |
| Futures Contracts Short | $(13,234,589) |
Note 3–Fees and Related Party Transactions
(A) Manager and Subadvisor. New York Life Investments, a registered investment adviser and an indirect, wholly-owned subsidiary of New York Life, serves as the Portfolio's Manager, pursuant to an Amended and Restated Management Agreement ("Management Agreement"). The Manager provides offices, conducts clerical, recordkeeping and bookkeeping services and keeps most of the financial and accounting records required to be maintained by the Portfolio. Except for the portion of salaries and expenses that are the responsibility of the Portfolio, the Manager pays the salaries and expenses of all personnel affiliated with the Portfolio and certain operational expenses of the Portfolio. During a portion of the year ended December 31, 2022, the Portfolio reimbursed New York Life Investments in an amount equal to the portion of the compensation of the Chief Compliance Officer attributable to the Portfolio. MacKay Shields LLC ("MacKay Shields" or the "Subadvisor"), a registered investment adviser and an indirect, wholly-owned subsidiary of New York Life, serves as the Subadvisor to the Portfolio and is responsible for the day-to-day portfolio management of the Portfolio. Pursuant to the terms of an Amended and Restated Subadvisory Agreement between New York Life Investments and MacKay Shields, New York Life Investments pays for the services of the Subadvisor.
Pursuant to the Management Agreement, the Fund pays the Manager, on behalf of the Portfolio, a monthly fee for the services performed and the facilities furnished at an annual rate of the Portfolio's average daily net assets as follows: 0.50% up to $500 million; 0.475% from $500 million to $1 billion; and 0.45% in excess of $1 billion. During the year ended December 31, 2022, the effective management fee rate was 0.50%.
During the year ended December 31, 2022, New York Life Investments earned fees from the Portfolio in the amount of $1,272,747 and paid the Subadvisor in the amount of $636,373.
JPMorgan provides sub-administration and sub-accounting services to the Portfolio pursuant to an agreement with New York Life Investments. These services include calculating the daily NAVs of the Portfolio, maintaining the general ledger and sub-ledger accounts for the calculation of the Portfolio's NAVs, and assisting New York Life Investments in conducting various aspects of the Portfolio's administrative operations. For providing these services to the Portfolio, JPMorgan is compensated by New York Life Investments.
Pursuant to an agreement between the Fund and New York Life Investments, New York Life Investments is responsible for providing or procuring certain regulatory reporting services for the Portfolio. The Portfolio will reimburse New York Life Investments for the actual costs incurred by New York Life Investments in connection with providing or procuring these services for the Portfolio.
(B) Distribution and Service Fees. The Fund, on behalf of the Portfolio, has entered into a distribution agreement with NYLIFE Distributors LLC (the “Distributor”), an affiliate of New York Life Investments. The Portfolio has adopted a distribution plan (the “Plan”) in accordance with the provisions of Rule 12b-1 under the 1940 Act. Under the Plan, the Distributor has agreed to provide, through its affiliates or independent third parties, various distribution-related, shareholder and administrative support services to the Service Class shareholders. For its services, the Distributor is entitled to a combined distribution and service fee accrued daily and paid monthly at an annual rate of 0.25% of the average daily net assets attributable to the Service Class shares of the Portfolio.
Note 4-Federal Income Tax
As of December 31, 2022, the cost and unrealized appreciation (depreciation) of the Portfolio’s investment portfolio, including applicable derivative contracts and other financial instruments, as determined on a federal income tax basis, were as follows:
| | Federal Tax
Cost | Gross
Unrealized
Appreciation | Gross
Unrealized
(Depreciation) | Net
Unrealized
Appreciation/
(Depreciation) |
| Investments in Securities | $245,713,551 | $434,659 | $(32,373,190) | $(31,938,531) |
As of December 31, 2022, the components of accumulated gain (loss) on a tax basis were as follows:
Ordinary
Income | Accumulated
Capital
and Other
Gain (Loss) | Other
Temporary
Differences | Unrealized
Appreciation
(Depreciation) | Total
Accumulated
Gain (Loss) |
| $4,504,146 | $(6,548,391) | $— | $(31,938,531) | $(33,982,776) |
The difference between book-basis and tax-basis unrealized appreciation (depreciation) is primarily due to cumulative bond amortization discount, wash sale adjustments and mark to market of futures contracts.
As of December 31, 2022, for federal income tax purposes, capital loss carryforwards of $6,548,391, as shown in the table below, were available to the extent provided by the regulations to offset future realized gains of the Portfolio. Accordingly, no capital gains distributions are expected to be
| 26 | MainStay VP MacKay Government Portfolio |
paid to shareholders until net gains have been realized in excess of such amounts.
Capital Loss
Available Through | Short-Term
Capital Loss
Amounts (000’s) | Long-Term
Capital Loss
Amounts (000’s) |
| Unlimited | $1,811 | $4,737 |
During the years ended December 31, 2022 and December 31, 2021, the tax character of distributions paid as reflected in the Statements of Changes in Net Assets was as follows:
| | 2022 | 2021 |
| Distributions paid from: | | |
| Ordinary Income | $3,729,732 | $4,531,111 |
Note 5–Custodian
JPMorgan is the custodian of cash and securities held by the Portfolio. Custodial fees are charged to the Portfolio based on the Portfolio's net assets and/or the market value of securities held by the Portfolio and the number of certain transactions incurred by the Portfolio.
Note 6–Line of Credit
The Portfolio and certain other funds managed by New York Life Investments maintain a line of credit with a syndicate of banks in order to secure a source of funds for temporary purposes to meet unanticipated or excessive redemption requests.
Effective July 26, 2022, under the credit agreement (the “Credit Agreement”), the aggregate commitment amount is $600,000,000 with an additional uncommitted amount of $100,000,000. The commitment fee is an annual rate of 0.15% of the average commitment amount payable quarterly, regardless of usage, to JPMorgan, who serves as the agent to the syndicate. The commitment fee is allocated among the Portfolio and certain other funds managed by New York Life Investments based upon their respective net assets and other factors. Interest on any revolving credit loan is charged based upon the Federal Funds Rate, Daily Simple Secured Overnight Financing Rate ("SOFR") + 0.10%, or the Overnight Bank Funding Rate, whichever is higher. The Credit Agreement expires on July 25, 2023, although the Portfolio, certain other funds managed by New York Life Investments and the syndicate of banks may renew the Credit Agreement for an additional year on the same or different terms or enter into a credit agreement with a different syndicate of banks. Prior to July 26, 2022, the aggregate commitment amount and the commitment fee were the same as those under the current Credit Agreement. During the year ended December 31, 2022, there were no borrowings made or outstanding with respect to the Portfolio under the Credit Agreement.
Note 7–Interfund Lending Program
Pursuant to an exemptive order issued by the SEC, the Portfolio, along with certain other funds managed by New York Life Investments, may participate in an interfund lending program. The interfund lending program provides an alternative credit facility that permits the Portfolio and certain other funds managed by New York Life Investments to lend or borrow money for temporary purposes directly to or from one another, subject to the conditions of the exemptive order. During the year ended December 31, 2022, there were no interfund loans made or outstanding with respect to the Portfolio.
Note 8–Purchases and Sales of Securities (in 000’s)
During the year ended December 31, 2022, purchases and sales of U.S. government securities were $8,543 and $21,626, respectively. Purchases and sales of securities, other than U.S. government securities and short-term securities, were $35,878 and $88,972, respectively.
Note 9–Capital Share Transactions
Transactions in capital shares for the years ended December 31, 2022 and December 31, 2021, were as follows:
| Initial Class | Shares | Amount |
| Year ended December 31, 2022: | | |
| Shares sold | 633,685 | $ 6,612,982 |
| Shares issued to shareholders in reinvestment of distributions | 77,120 | 711,147 |
| Shares redeemed | (4,760,615) | (47,828,335) |
| Net increase (decrease) | (4,049,810) | $(40,504,206) |
| Year ended December 31, 2021: | | |
| Shares sold | 4,793,173 | $ 53,204,116 |
| Shares issued to shareholders in reinvestment of distributions | 115,356 | 1,259,194 |
| Shares redeemed | (6,824,773) | (75,876,782) |
| Net increase (decrease) | (1,916,244) | $(21,413,472) |
| |
| Service Class | Shares | Amount |
| Year ended December 31, 2022: | | |
| Shares sold | 1,512,996 | $ 14,968,870 |
| Shares issued to shareholders in reinvestment of distributions | 330,073 | 3,018,585 |
| Shares redeemed | (4,818,836) | (48,213,380) |
| Net increase (decrease) | (2,975,767) | $(30,225,925) |
| Year ended December 31, 2021: | | |
| Shares sold | 2,828,368 | $ 31,058,251 |
| Shares issued to shareholders in reinvestment of distributions | 302,513 | 3,271,917 |
| Shares redeemed | (6,238,804) | (68,415,243) |
| Net increase (decrease) | (3,107,923) | $(34,085,075) |
Notes to Financial Statements (continued)
Note 10–Other Matters
As of the date of this report, interest rates in the United States and many parts of the world, including certain European countries, are ascending from historically low levels. Thus, the Portfolio currently faces a heightened level of risk associated with rising interest rates. This could be driven by a variety of factors, including but not limited to central bank monetary policies, changing inflation or real growth rates, general economic conditions, increasing bond issuances or reduced market demand for low yielding investments.
An outbreak of COVID-19, first detected in December 2019, has developed into a global pandemic and has resulted in travel restrictions, closure of international borders, certain businesses and securities markets, restrictions on securities trading activities, prolonged quarantines, supply chain disruptions, and lower consumer demand, as well as general concern and uncertainty. In 2022, many countries lifted some or all restrictions related to COVID-19. However, the continued impact of COVID-19 and related variants is uncertain and could further adversely affect the global economy, national economies, individual issuers and capital markets in unforeseeable ways and result in a substantial and extended economic downturn. Developments that disrupt global economies and financial markets, such as COVID-19, may magnify factors that affect the Portfolio's performance.
Note 11–Subsequent Events
In connection with the preparation of the financial statements of the Portfolio as of and for the year ended December 31, 2022, events and transactions subsequent to December 31, 2022, through the date the financial statements were issued have been evaluated by the Manager for possible adjustment and/or disclosure. No subsequent events requiring financial statement adjustment or disclosure have been identified.
| 28 | MainStay VP MacKay Government Portfolio |
Report of Independent Registered Public Accounting Firm
To the Board of Trustees of MainStay VP Funds Trust and Shareholders of
MainStay VP MacKay Government Portfolio
Opinion on the Financial Statements
We have audited the accompanying statement of assets and liabilities, including the portfolio of investments, of MainStay VP MacKay Government Portfolio (one of the portfolios constituting MainStay VP Funds Trust, referred to hereafter as the “Portfolio”) as of December 31, 2022, the related statement of operations for the year ended December 31, 2022, the statements of changes in net assets for each of the two years in the period ended December 31, 2022, including the related notes, and the financial highlights for each of the five years in the period ended December 31, 2022 (collectively referred to as the “financial statements”). In our opinion, the financial statements present fairly, in all material respects, the financial position of the Portfolio as of December 31, 2022, the results of its operations for the year then ended, the changes in its net assets for each of the two years in the period ended December 31, 2022 and the financial highlights for each of the five years in the period ended December 31, 2022 in conformity with accounting principles generally accepted in the United States of America.
Basis for Opinion
These financial statements are the responsibility of the Portfolio’s management. Our responsibility is to express an opinion on the Portfolio’s financial statements based on our audits. We are a public accounting firm registered with the Public Company Accounting Oversight Board (United States) (PCAOB) and are required to be independent with respect to the Portfolio in accordance with the U.S. federal securities laws and the applicable rules and regulations of the Securities and Exchange Commission and the PCAOB.
We conducted our audits of these financial statements in accordance with the standards of the PCAOB. Those standards require that we plan and perform the audit to obtain reasonable assurance about whether the financial statements are free of material misstatement, whether due to error or fraud.
Our audits included performing procedures to assess the risks of material misstatement of the financial statements, whether due to error or fraud, and performing procedures that respond to those risks. Such procedures included examining, on a test basis, evidence regarding the amounts and disclosures in the financial statements. Our audits also included evaluating the accounting principles used and significant estimates made by management, as well as evaluating the overall presentation of the financial statements. Our procedures included confirmation of securities owned as of December 31, 2022 by correspondence with the custodian, transfer agent and broker. We believe that our audits provide a reasonable basis for our opinion.
/s/PricewaterhouseCoopers LLP
New York, New York
February 24, 2023
We have served as the auditor of one or more investment companies in the MainStay group of funds since 1984.
Board Consideration and Approval of Management Agreement and Subadvisory Agreement (Unaudited)
The continuation of the Management Agreement with respect to the MainStay VP MacKay Government Portfolio (“Portfolio”) and New York Life Investment Management LLC (“New York Life Investments”) and the Subadvisory Agreement between New York Life Investments and MacKay Shields LLC (“MacKay”) with respect to the Portfolio (together, “Advisory Agreements”) is subject to annual review and approval by the Board of Trustees of MainStay VP Funds Trust (“Board” of the “Trust”) in accordance with Section 15 of the Investment Company Act of 1940, as amended (“1940 Act”). At its December 6–7, 2022 meeting, the Board, which is comprised solely of Trustees who are not an “interested person” (as such term is defined in the 1940 Act) of the Trust (“Independent Trustees”), unanimously approved the continuation of each of the Advisory Agreements for a one-year period.
In reaching the decision to approve the continuation of each of the Advisory Agreements, the Board considered information and materials furnished by New York Life Investments and MacKay in connection with an annual contract review process undertaken by the Board that took place at meetings of the Board and its Contracts Committee during October 2022 through December 2022, including information and materials furnished by New York Life Investments and MacKay in response to requests prepared on behalf of the Board, and in consultation with the Board, by independent legal counsel to the Independent Trustees, which encompassed a variety of topics, including those summarized below. Information and materials requested by and furnished to the Board for consideration in connection with the contract review process included, among other items, reports on the Portfolio and “peer funds” prepared by Institutional Shareholder Services Inc. (“ISS”), an independent third-party service provider engaged by the Board to report objectively on the Portfolio’s investment performance, management fee and total expenses. The Board also considered information on the fees charged to other investment advisory clients of New York Life Investments and/or MacKay that follow investment strategies similar to those of the Portfolio, if any, and, when applicable, the rationale for any differences in the Portfolio’s management and subadvisory fees and the fees charged to those other investment advisory clients. In addition, the Board considered information regarding the legal standards and fiduciary obligations applicable to its consideration of the continuation of each of the Advisory Agreements. The contract review process, including the structure and format for information and materials provided to the Board, has been developed in consultation with the Board. The Independent Trustees also met in executive sessions with their independent legal counsel and, for portions thereof, with senior management of New York Life Investments.
The Board’s deliberations with respect to the continuation of each of the Advisory Agreements reflect a year-long process, and the Board also took into account information furnished to the Board and its Committees throughout the year, as deemed relevant and appropriate by the Trustees, including, among other items, reports on investment performance of the Portfolio and investment-related matters for the Portfolio as well as presentations from New York Life Investments and, generally annually, MacKay personnel. In addition, the Board took into account other information received from New York Life Investments throughout the year,
including, among other items, periodic reports on legal and compliance matters, risk management, portfolio turnover, brokerage commissions and non-advisory services provided to the Portfolio by New York Life Investments, as deemed relevant and appropriate by the Trustees.
In addition to information provided to the Board throughout the year, the Board received information in connection with its June 2022 meeting provided specifically in response to requests prepared on behalf of the Board, and in consultation with the Board, by independent legal counsel to the Independent Trustees regarding the Portfolio’s distribution arrangements. In addition, the Board received information regarding the Portfolio’s asset levels, share purchase and redemption activity and the payment of Rule 12b-1 and/or other fees by the applicable share classes of the Portfolio, among other information.
In considering the continuation of each of the Advisory Agreements, the Trustees reviewed and evaluated the information and factors they believed to reasonably be necessary and appropriate in light of legal advice furnished to them by independent legal counsel to the Independent Trustees and through the exercise of their own business judgment. Although individual Trustees may have weighed certain factors or information differently and the Board did not consider any single factor or information controlling in reaching its decision, the factors considered by the Board are summarized in more detail below and include, among other factors: (i) the nature, extent and quality of the services provided to the Portfolio by New York Life Investments and MacKay; (ii) the qualifications of the portfolio managers of the Portfolio and the historical investment performance of the Portfolio, New York Life Investments and MacKay; (iii) the costs of the services provided, and profits realized, by New York Life Investments and MacKay with respect to their relationships with the Portfolio; (iv) the extent to which economies of scale have been realized or may be realized if the Portfolio grows and the extent to which any economies of scale have been shared, have benefited or may benefit the Portfolio’s shareholders; and (v) the reasonableness of the Portfolio’s management and subadvisory fees and total ordinary operating expenses. Although the Board recognized that comparisons between the Portfolio’s fees and expenses and those of other funds are imprecise given different terms of agreements, variations in fund strategies and other factors, the Board considered the reasonableness of the Portfolio’s management fee and total ordinary operating expenses as compared to the peer funds identified by ISS. Throughout their considerations, the Trustees acknowledged the commitment of New York Life Investments and its affiliates to serve the MainStay Group of Funds, as well as their capacity, experience, resources, financial stability and reputations. The Trustees also acknowledged the entrepreneurial and other risks assumed by New York Life Investments in sponsoring and managing the Portfolio. With respect to the Subadvisory Agreement, the Board took into account New York Life Investments’ recommendation to approve the continuation of the Subadvisory Agreement.
The Trustees noted that, throughout the year, the Trustees are afforded an opportunity to ask questions of, and request additional information or materials from, New York Life Investments and MacKay. The Board’s decision with respect to each of the Advisory Agreements may have also
| 30 | MainStay VP MacKay Government Portfolio |
been based, in part, on the Board’s knowledge of New York Life Investments and MacKay resulting from, among other things, the Board’s consideration of each of the Advisory Agreements in prior years, the advisory agreements for other funds in the MainStay Group of Funds, the Board’s review throughout the year of the performance and operations of other funds in the MainStay Group of Funds and each Trustee’s business judgment and industry experience. In addition to considering the above-referenced factors, the Board observed that in the marketplace, notably under variable life insurance policies and variable annuity contracts for which the Portfolio serves as an investment option, there are a range of investment options available to investors and that the Portfolio’s shareholders, having had the opportunity to consider other investment options, have chosen to invest in the Portfolio.
The factors that figured prominently in the Board’s decision to approve the continuation of each of the Advisory Agreements during its December 6–7, 2022 meeting are summarized in more detail below.
Nature, Extent and Quality of Services Provided by New York Life Investments and MacKay
The Board examined the nature, extent and quality of the services that New York Life Investments provides to the Portfolio. The Board evaluated New York Life Investments’ experience and capabilities in serving as manager of the Portfolio and considered that the Portfolio operates in a “manager-of-managers” structure. The Board also considered New York Life Investments’ responsibilities and services provided pursuant to this structure, including overseeing the services provided by MacKay, evaluating the performance of MacKay, making recommendations to the Board as to whether the Subadvisory Agreement should be renewed, modified or terminated and periodically reporting to the Board regarding the results of New York Life Investments’ evaluation and monitoring functions. The Board noted that New York Life Investments manages other mutual funds, serves a variety of other investment advisory clients, including other pooled investment vehicles, and has experience overseeing mutual fund service providers, including subadvisors. The Board considered the experience of senior personnel at New York Life Investments providing management and administrative and other non-advisory services to the Portfolio. The Board observed that New York Life Investments devotes significant resources and time to providing management and administrative and other non-advisory services to the Portfolio, including New York Life Investments’ oversight and due diligence reviews of MacKay and ongoing analysis of, and interactions with, MacKay with respect to, among other things, the Portfolio’s investment performance and risks as well as MacKay’s investment capabilities and subadvisory services with respect to the Portfolio.
The Board also considered the range of services that New York Life Investments provides to the Portfolio under the terms of the Management Agreement, including: (i) fund accounting and ongoing supervisory services provided by New York Life Investments’ Fund Administration and Accounting Group; (ii) investment supervisory and analytical services provided by New York Life Investments’ Investment Consulting Group; (iii) compliance services provided by the Trust’s Chief Compliance Officer as
well as New York Life Investments’ compliance department, including supervision and implementation of the Portfolio’s compliance program; (iv) legal services provided by New York Life Investments’ Office of the General Counsel; and (v) risk management monitoring and analysis by compliance and investment personnel. In addition, the Board considered New York Life Investments’ willingness to invest in personnel and other resources, such as cyber security, information security and business continuity planning, designed to benefit the Portfolio and noted that New York Life Investments is responsible for compensating the Trust’s officers, except for a portion of the salary of the Trust’s Chief Compliance Officer. The Board recognized that New York Life Investments provides certain other non-advisory services to the Portfolio and has provided an increasingly broad array of non-advisory services to the MainStay Group of Funds as a result of regulatory and other developments, including in connection with the implementation of the MainStay Group of Funds’ derivatives risk management program and policies and procedures adopted pursuant to Rule 18f-4 under the 1940 Act.
The Board also examined the range, and the nature, extent and quality, of the investment advisory services that MacKay provides to the Portfolio and considered the terms of each of the Advisory Agreements. The Board evaluated MacKay’s experience and performance in serving as subadvisor to the Portfolio and advising other portfolios and MacKay’s track record and experience in providing investment advisory services, the experience of investment advisory, senior management and administrative personnel at MacKay. The Board considered New York Life Investments’ and MacKay’s overall resources, legal and compliance environment, capabilities, reputation, financial condition and history. In addition to information provided in connection with quarterly meetings with the Trust’s Chief Compliance Officer, the Board considered information regarding the compliance policies and procedures of New York Life Investments and MacKay and acknowledged their commitment to further developing and strengthening compliance programs relating to the Portfolio. The Board also considered MacKay’s ability to recruit and retain qualified investment professionals and willingness to invest in personnel and other resources to service and support the Portfolio. In this regard, the Board considered the qualifications and experience of the Portfolio’s portfolio managers, the number of accounts managed by the portfolio managers and the method for compensating the portfolio managers.
In addition, the Board considered information provided by New York Life Investments and MacKay regarding the operations of their respective business continuity plans in response to the COVID-19 pandemic and the continued remote work environment.
Based on these considerations, among others, the Board concluded that the Portfolio would likely continue to benefit from the nature, extent and quality of these services.
Investment Performance
In evaluating the Portfolio’s investment performance, the Board considered investment performance results over various periods in light of the Portfolio’s investment objective, strategies and risks. The Board
Board Consideration and Approval of Management Agreement and Subadvisory Agreement (Unaudited) (continued)
considered investment reports on, and analysis of, the Portfolio’s performance provided to the Board throughout the year. These reports include, among other items, information on the Portfolio’s gross and net returns, the Portfolio’s investment performance compared to a relevant investment category and the Portfolio’s benchmark, the Portfolio’s risk-adjusted investment performance and the Portfolio’s investment performance as compared to peer funds, as appropriate, as well as portfolio attribution information and commentary on the effect of market conditions. The Board also considered information provided by ISS showing the investment performance of the Portfolio as compared to peer funds. In addition, the Board reviewed the methodology used by ISS to construct the group of peer funds for comparative purposes.
The Board also took into account its discussions with senior management at New York Life Investments concerning the Portfolio’s investment performance over various periods as well as discussions between the Portfolio’s portfolio management team and the members of the Board’s Investment Committee, which generally occur on an annual basis. In addition, the Board considered any specific actions that New York Life Investments or MacKay had taken, or had agreed to take, to seek to enhance Portfolio investment performance and the results of those actions.
Based on these considerations, among others, the Board concluded that its review of the Portfolio’s investment performance and related information supported a determination to approve the continuation of each of the Advisory Agreements.
Costs of the Services Provided, and Profits and Other Benefits Realized, by New York Life Investments and MacKay
The Board considered the costs of the services provided under each of the Advisory Agreements. The Board also considered the profits realized by New York Life Investments and its affiliates, including MacKay, due to their relationships with the Portfolio as well as the MainStay Group of Funds. Because MacKay is an affiliate of New York Life Investments whose subadvisory fee is paid by New York Life Investments, not the Portfolio, the Board considered cost and profitability information for New York Life Investments and MacKay in the aggregate.
In addition, the Board acknowledged the difficulty in obtaining reliable comparative data about mutual fund managers’ profitability because such information generally is not publicly available and may be impacted by numerous factors, including the structure of a fund manager’s organization, the types of funds it manages, the methodology used to allocate certain fixed costs to specific funds and the manager’s capital structure and costs of capital.
In evaluating the costs of the services provided by New York Life Investments and MacKay and profits realized by New York Life Investments and its affiliates, including MacKay, the Board considered, among other factors, New York Life Investments’ and its affiliates’, including MacKay’s, continuing investments in, or willingness to invest in, personnel and other resources to support and further enhance the management of the Portfolio, and that New York Life Investments is
responsible for paying the subadvisory fee for the Portfolio. The Board also considered the financial resources of New York Life Investments and MacKay and acknowledged that New York Life Investments and MacKay must be in a position to recruit and retain experienced professional personnel and to maintain a strong financial position for New York Life Investments and MacKay to continue to provide high-quality services to the Portfolio. The Board recognized that the Portfolio benefits from the allocation of certain fixed costs among the funds in the MainStay Group of Funds, among other expected benefits resulting from its relationship with New York Life Investments.
The Board considered information regarding New York Life Investments’ methodology for calculating profitability and allocating costs provided by New York Life Investments in connection with the fund profitability analysis presented to the Board. The Board noted it had previously engaged an independent consultant to review the methods used to allocate costs among the funds in the MainStay Group of Funds. The Board also noted that the independent consultant had concluded that New York Life Investments’ methods for allocating costs and procedures for estimating overall profitability of the relationship with the funds in the MainStay Group of Funds are reasonable and that New York Life Investments continued to use the same method of calculating profit and allocating costs since the independent consultant’s review. The Board recognized the difficulty in calculating and evaluating a manager’s profitability with respect to the Portfolio and considered that other profitability methodologies may also be reasonable.
The Board also considered certain fall-out benefits that may be realized by New York Life Investments and its affiliates due to their relationships with the Portfolio, including reputational and other indirect benefits. The Board recognized, for example, the benefits to MacKay from legally permitted “soft-dollar” arrangements by which brokers provide research and other services to MacKay in exchange for commissions paid by the Portfolio with respect to trades in the Portfolio’s portfolio securities. In addition, the Board considered its review of the management agreement for a money market fund advised by New York Life Investments and an affiliated subadvisor that serves as an investment option for the Portfolio, including the potential rationale for and costs associated with investments in this money market fund by the Portfolio, if any, and considered information from New York Life Investments that the nature and type of specific investment advisory services provided to this money market fund are distinct from, or in addition to, the investment advisory services provided to the Portfolio. In addition, the Board considered the potential dividend received tax deduction for insurance company affiliates of New York Life Investments from the Portfolio’s securities lending activity.
The Board noted that the Portfolio serves as an investment option primarily under variable contracts issued by affiliates of New York Life Investments that would receive fees under those contracts. The Board observed that, in addition to fees earned by New York Life Investments under the Management Agreement for managing the Portfolio, New York Life Investments’ affiliates also earn revenues from serving the Portfolio in various other capacities, including as the Portfolio’s distributor. The Board considered information about these other revenues and their impact on
| 32 | MainStay VP MacKay Government Portfolio |
the profitability of the relationship with the Portfolio to New York Life Investments and its affiliates. The Board noted that, although it assessed the overall profitability of the relationship with the Portfolio to New York Life Investments and its affiliates as part of the contract review process, when considering the reasonableness of the fee paid to New York Life Investments under the Management Agreement, the Board considered the profitability of New York Life Investments’ relationship with the Portfolio on a pre-tax basis and without regard to distribution expenses incurred by New York Life Investments from its own resources.
After evaluating the information deemed relevant by the Trustees, the Board concluded that any profits realized by New York Life Investments and its affiliates, including MacKay, due to their relationships with the Portfolio were not excessive and other benefits that may accrue to New York Life Investments and its affiliates, including MacKay, are reasonable.
Management and Subadvisory Fees and Total Ordinary Operating Expenses
The Board evaluated the reasonableness of the fee paid under each of the Advisory Agreements and the Portfolio’s total ordinary operating expenses. The Board primarily considered the reasonableness of the management fee paid by the Portfolio to New York Life Investments because the subadvisory fee paid to MacKay is paid by New York Life Investments, not the Portfolio. The Board also considered the reasonableness of the subadvisory fee paid by New York Life Investments and the amount of the management fee retained by New York Life Investments.
In assessing the reasonableness of the Portfolio’s fees and expenses, the Board primarily considered comparative data provided by ISS on the fees and expenses charged by similar mutual funds managed by other investment advisers. The Board reviewed the methodology used by ISS to construct the group of peer funds for comparative purposes. In addition, the Board considered information provided by New York Life Investments and MacKay on fees charged to other investment advisory clients, including institutional separate accounts and/or other funds that follow investment strategies similar to those of the Portfolio, if any. The Board considered the contractual management fee schedules of the Portfolio as compared to those of such other investment advisory clients, taking into account the rationale for any differences in fee schedules. The Board also took into account information provided by New York Life Investments about the more extensive scope of services provided to registered investment companies, such as the Portfolio, as compared with other investment advisory clients. Additionally, the Board considered the impact of contractual breakpoints on the Portfolio’s net management fee and expenses. The Board also considered that in proposing fees for the Portfolio, New York Life Investments considers the competitive marketplace for mutual funds.
Based on the factors outlined above, among other considerations, the Board concluded that the Portfolio’s management fee and total ordinary operating expenses are within a range that is competitive and support a conclusion that these fees and expenses are reasonable.
Economies of Scale
The Board considered information regarding economies of scale, including whether economies of scale may exist for the Portfolio and whether the Portfolio’s expense structure permits any economies of scale to be appropriately shared with the Portfolio’s beneficial shareholders. The Board also considered a report from New York Life Investments, previously prepared at the request of the Board, that addressed economies of scale, including with respect to the mutual fund business generally, and the various ways in which the benefits of economies of scale may be shared with the funds in the MainStay Group of Funds. Although the Board recognized the difficulty of determining economies of scale with precision, the Board acknowledged that economies of scale may be shared with the Portfolio in a number of ways, including, for example, through the imposition of fee breakpoints, initially setting management fee rates at scale or making additional investments to enhance the services provided to the Portfolio. The Board reviewed information from New York Life Investments showing how the Portfolio’s management fee schedule compared to fee schedules of other funds and accounts managed by New York Life Investments. The Board also reviewed information from ISS showing how the Portfolio’s management fee schedule compared with fees paid for similar services by peer funds at varying asset levels.
Based on this information, the Board concluded that economies of scale are appropriately reflected for the benefit of the Portfolio’s beneficial shareholders through the Portfolio’s expense structure and other methods to share benefits from economies of scale.
Conclusion
On the basis of the information and factors summarized above, among other information and factors deemed relevant by the Trustees, and the evaluation thereof, the Board unanimously voted to approve the continuation of each of the Advisory Agreements.
Proxy Voting Policies and Procedures and Proxy Voting Record
The Portfolio is required to file with the SEC its proxy voting record for the 12-month period ending June 30 on Form N-PX. A description of the policies and procedures that are used to vote proxies relating to portfolio securities of the Portfolio is available free of charge upon request by calling 800-598-2019 or visiting the SEC's website at www.sec.gov. The most recent Form N-PX or proxy voting record is available free of charge upon request by calling 800-598-2019; visiting https://www.newyorklifeinvestments.com/investment-products/vp; or visiting the SEC’s website at www.sec.gov.
Shareholder Reports and Quarterly Portfolio Disclosure
The Portfolio is required to file its complete schedule of portfolio holdings with the SEC 60 days after its first and third fiscal quarter on Form N-PORT. The Portfolio's holdings report is available free of charge upon request by calling 800-598-2019 or by visiting the SEC’s website at www.sec.gov.
| 34 | MainStay VP MacKay Government Portfolio |
Board of Trustees and Officers (Unaudited)
The Trustees and officers of the Portfolio are listed below. The Board oversees the MainStay Group of Funds (which consists of MainStay Funds and MainStay Funds Trust), MainStay VP Funds Trust, MainStay MacKay DefinedTerm Municipal Opportunities Fund, MainStay CBRE Global Infrastructure Megatrends Fund, the Manager and the Subadvisors, and elects the officers of the Portfolios who are responsible for the day-to-day operations of the Portfolio. Information pertaining to the Trustees and officers is set forth below. Each Trustee serves until his or her successor
is elected and qualified or until his or her resignation, death or removal. Under the Board’s retirement policy, unless an exception is made, a Trustee must tender his or her resignation by the end of the calendar year during which he or she reaches the age of 75. The business address of each Trustee and officer listed below is 51 Madison Avenue, New York, New York 10010. None of the Trustees are “interested persons” (as defined by the 1940 Act and rules adopted by the SEC thereunder) of the Portfolio (“Independent Trustees”).
| | Name and
Year of Birth | Term of Office,
Position(s) Held and
Length of Service | Principal Occupation(s)
During Past Five Years | Number of
Portfolios in
Fund Complex
Overseen by
Trustee | Other Directorships
Held by Trustee |
| | | | | | |
| | David H. Chow
1957 | MainStay VP Funds Trust: Trustee since January 2016, Advisory Board Member (June 2015 to December 2015) | Founder and CEO, DanCourt Management, LLC since 1999 | 78 | MainStay Funds: Trustee since January 2016, Advisory Board Member (June 2015 to December 2015) (12 Funds);
MainStay Funds Trust: Trustee since January 2016, Advisory Board Member (June 2015 to December 2015) (33 Funds);
MainStay MacKay DefinedTerm Municipal Opportunities Fund: Trustee since January 2016, Advisory Board Member (June 2015 to December 2015);
MainStay CBRE Global Infrastructure Megatrends Fund: Trustee since June 2021;VanEck Vectors Group of Exchange-Traded Funds: Independent Chairman of the Board of Trustees since 2008 and Trustee since 2006 (57 portfolios); and Berea College of Kentucky: Trustee since 2009, Chair of the Committee since 2018 |
| | Susan B. Kerley
1951 | MainStay VP Funds Trust: Chairman since 2017 and Trustee since 2007* | President, Strategic Management Advisors LLC since 1990 | 78 | MainStay Funds: Chairman since 2017 and Trustee since 2007 (12 Funds); MainStay Funds Trust: Chairman since 2017 and Trustee since 1990 (33 Funds)**;
MainStay MacKay DefinedTerm Municipal Opportunities Fund: Chairman since 2017 and Trustee since 2011; MainStay CBRE Global Infrastructure Megatrends Fund: Trustee since June 2021; and Legg Mason Partners Funds: Trustee since 1991 (45 portfolios) |
| | Alan R. Latshaw
1951 | MainStay VP Funds Trust: Trustee since 2007* | Retired; Partner, Ernst & Young LLP (2002 to 2003); Partner, Arthur Andersen LLP (1989 to 2002); Consultant to the MainStay Funds Audit and Compliance Committee (2004 to 2006) | 78 | MainStay Funds: Trustee since 2006 (12 Funds);
MainStay Funds Trust: Trustee since 2007 (33 Funds)**;
MainStay MacKay DefinedTerm Municipal Opportunities Fund: Trustee since 2011; and
MainStay CBRE Global Infrastructure Megatrends Fund: Trustee since June 2021 |
Board of Trustees and Officers (Unaudited) (continued)
| | Name and
Year of Birth | Term of Office,
Position(s) Held and
Length of Service | Principal Occupation(s)
During Past Five Years | Number of
Portfolios in
Fund Complex
Overseen by
Trustee | Other Directorships
Held by Trustee |
| | | | | | |
| | Karen Hammond
1956 | MainStay VP Funds Trust: Trustee since December 2021, Advisory Board Member (June 2021 to December 2021)
| Retired, Managing Director, Devonshire Investors (2007 to 2013); Senior Vice President, Fidelity Management & Research Co. (2005 to 2007); Senior Vice President and Corporate Treasurer, FMR Corp. (2003 to 2005); Chief Operating Officer, Fidelity Investments Japan (2001 to 2003) | 78 | MainStay Funds: Trustee since December 2021, Advisory Board Member (June 2021 to December 2021) (12 Funds);
MainStay Funds Trust: Trustee since December 2021, Advisory Board Member (June 2021 to December 2021) (33 Funds);
MainStay MacKay DefinedTerm Municipal Opportunities Fund: Trustee since December 2021, Advisory Board Member (June 2021 to December 2021);
MainStay CBRE Global Infrastructure Megatrends Fund: Trustee since December 2021, Advisory Board Member (June 2021 to December 2021);
Two Harbors Investment Corp.: Director since 2018; Rhode Island State Investment Commission: Member since 2017; and Blue Cross Blue Shield of Rhode Island: Director since 2019
|
| | Jacques P. Perold
1958 | MainStay VP Funds Trust: Trustee since January 2016, Advisory Board Member (June 2015 to December 2015) | Founder and Chief Executive Officer, CapShift Advisors LLC (since 2018); President, Fidelity Management & Research Company (2009 to 2014); President and Chief Investment Officer, Geode Capital Management, LLC (2001 to 2009) | 78 | MainStay Funds: Trustee since January 2016, Advisory Board Member (June 2015 to December 2015) (12 Funds);
MainStay Funds Trust: Trustee since January 2016, Advisory Board Member (June 2015 to December 2015) (33 Funds); MainStay MacKay DefinedTerm Municipal Opportunities Fund: Trustee since January 2016, Advisory Board Member (June 2015 to December 2015);
MainStay CBRE Global Infrastructure Megatrends Fund: Trustee since June 2021; Allstate Corporation: Director since 2015;
Partners in Health: Trustee since 2019; and
MSCI Inc.: Director since 2017 |
| | Richard S. Trutanic
1952 | MainStay VP Funds Trust: Trustee since 2007* | Chairman and Chief Executive Officer, Somerset & Company (financial advisory firm) since 2004; Managing Director, The Carlyle Group (private investment firm) (2002 to 2004); Senior Managing Director, Partner and Board Member, Groupe Arnault S.A. (private investment firm) (1999 to 2002)
| 78 | MainStay Funds: Trustee since 1994 (12 Funds);
MainStay Funds Trust: Trustee since 2007 (33 Funds)**;
MainStay MacKay DefinedTerm Municipal Opportunities Fund: Trustee since 2011; and
MainStay CBRE Global Infrastructure Megatrends Fund: Trustee since June 2021 |
| * | Includes prior service as a Director of MainStay VP Series Fund, Inc., the predecessor to MainStay VP Funds Trust. |
| ** | Includes prior service as a Director/Trustee of certain predecessor entities to MainStay Funds Trust. |
| 36 | MainStay VP MacKay Government Portfolio |
| | Name and
Year of Birth | Position(s) Held and
Length of Service | Principal Occupation(s)
During Past Five Years | |
| | | | | |
| | Kirk C. Lehneis
1974 | President, MainStay VP Funds Trust (since 2017) | Chief Operating Officer and Senior Managing Director (since 2016), New York Life Investment Management LLC and New York Life Investment Management Holdings LLC; Member of the Board of Managers (since 2017) and Senior Managing Director (since 2018), NYLIFE Distributors LLC; Chairman of the Board and Senior Managing Director, NYLIM Service Company LLC (since 2017); Trustee, President and Principal Executive Officer of IndexIQ Trust, IndexIQ ETF Trust and IndexIQ Active ETF Trust (since January 2018); President, MainStay CBRE Global Infrastructure Megatrends Fund (since 2021), MainStay MacKay DefinedTerm Municipal Opportunities Fund, MainStay Funds and MainStay Funds Trust (since 2017); Senior Managing Director, Global Product Development (from 2015-2016); Managing Director, Product Development (from 2010-2015), New York Life Investment Management LLC | |
| | Jack R. Benintende
1964 | Treasurer and Principal Financial and Accounting Officer, MainStay VP Funds Trust (since 2007)** | Managing Director, New York Life Investment Management LLC (since 2007); Treasurer and Principal Financial and Accounting Officer, MainStay CBRE Global Infrastructure Megatrends Fund (since 2021), MainStay MacKay DefinedTerm Municipal Opportunities Fund (since 2011), MainStay Funds Trust (since 2009) and MainStay Funds (since 2007); and Assistant Treasurer, New York Life Investment Management Holdings LLC (2008 to 2012) | |
| | J. Kevin Gao
1967 | Secretary and Chief Legal Officer, MainStay VP Funds Trust (since 2010)** | Managing Director and Associate General Counsel, New York Life Investment Management LLC (since 2010); Secretary and Chief Legal Officer, MainStay CBRE Global Infrastructure Megatrends Fund (since 2021), MainStay MacKay DefinedTerm Municipal Opportunities Fund (since 2011), MainStay Funds and MainStay Funds Trust (since 2010) | |
| | Scott T. Harrington
1959 | Vice President— Administration, MainStay VP Funds Trust (since 2005)** | Managing Director, New York Life Investment Management LLC (including predecessor advisory organizations) (since 2000); Member of the Board of Directors, New York Life Trust Company (since 2009); Vice President—Administration, MainStay CBRE Global Infrastructure Megatrends Fund (since 2021), MainStay MacKay DefinedTerm Municipal Opportunities Fund (since 2011), MainStay Funds Trust and MainStay Funds (since 2009) | |
| | Kevin M. Gleason
1967 | Vice President and Chief Compliance Officer, MainStay VP Funds Trust (since June 2022) | Vice President and Chief Compliance Officer, IndexIQ, IndexIQ ETF Trust and Index IQ Active ETF Trust (since June 2022); Vice President and Chief Compliance Officer, MainStay CBRE Global Infrastructure Megatrends Fund, MainStay MacKay DefinedTerm Municipal Opportunities Fund (since June 2022); MainStay Funds Trust and MainStay Funds (since June 2022); Senior Vice President, Voya Investment Management and Chief Compliance Officer, Voya Family of Funds (2012-2022) | |
| * | The officers listed above are considered to be “interested persons” of the MainStay Group of Funds, MainStay VP Funds Trust, MainStay CBRE Global Infrastructure Megatrends Fund and MainStay MacKay DefinedTerm Municipal Opportunities Fund within the meaning of the 1940 Act because of their affiliation with the MainStay Group of Funds, New York Life Insurance Company and/or its affiliates, including New York Life Investment Management LLC, NYLIM Service Company LLC, NYLIFE Securities LLC and/or NYLIFE Distributors LLC, as described in detail in the column captioned “Principal Occupation(s) During Past Five Years.” Officers are elected annually by the Board. |
| ** | Includes prior service as an Officer of MainStay VP Series Fund, Inc., the predecessor to MainStay VP Funds Trust. |
Officers of the Trust (Who are not Trustees)*
This page intentionally left blank
MainStay VP Portfolios
MainStay VP offers a wide range of Portfolios. The full array of MainStay VP offerings is listed here, with information about the manager, subadvisors, legal counsel, and independent registered public accounting firm.
Equity
MainStay VP American Century Sustainable Equity Portfolio1
MainStay VP Candriam Emerging Markets Equity Portfolio
MainStay VP Epoch U.S. Equity Yield Portfolio
MainStay VP Fidelity Institutional AM® Utilities Portfolio†
MainStay VP MacKay International Equity Portfolio
MainStay VP Natural Resources Portfolio
MainStay VP S&P 500 Index Portfolio2
MainStay VP Small Cap Growth Portfolio
MainStay VP Wellington Growth Portfolio
MainStay VP Wellington Mid Cap Portfolio
MainStay VP Wellington Small Cap Portfolio
MainStay VP Wellington U.S. Equity Portfolio
MainStay VP Winslow Large Cap Growth Portfolio
Mixed Asset
MainStay VP Balanced Portfolio
MainStay VP Income Builder Portfolio
MainStay VP Janus Henderson Balanced Portfolio
MainStay VP MacKay Convertible Portfolio
Income
MainStay VP Bond Portfolio
MainStay VP Floating Rate Portfolio
MainStay VP Indexed Bond Portfolio
MainStay VP MacKay Government Portfolio
MainStay VP MacKay High Yield Corporate Bond Portfolio
MainStay VP MacKay Strategic Bond Portfolio
MainStay VP PIMCO Real Return Portfolio
Money Market
MainStay VP U.S. Government Money Market Portfolio
Alternative
MainStay VP CBRE Global Infrastructure Portfolio
MainStay VP IQ Hedge Multi-Strategy Portfolio
Asset Allocation
MainStay VP Conservative Allocation Portfolio
MainStay VP Equity Allocation Portfolio
MainStay VP Growth Allocation Portfolio
MainStay VP Moderate Allocation Portfolio
Manager
New York Life Investment Management LLC
New York, New York
Subadvisors
American Century Investment Management, Inc.
Kansas City, Missouri
Brown Advisory LLC
Baltimore, Maryland
Candriam*
Strassen, Luxembourg
CBRE Investment Management Listed Real Assets LLC
Radnor, Pennsylvania
Epoch Investment Partners, Inc.
New York, New York
FIAM LLC
Smithfield, Rhode Island
IndexIQ Advisors LLC*
New York, New York
Janus Henderson Investors US LLC
Denver, Colorado
MacKay Shields LLC*
New York, New York
Newton Investment Management North America, LLC
Boston, Massachusetts
NYL Investors LLC*
New York, New York
Pacific Investment Management Company LLC
Newport Beach, California
Segall Bryant & Hamill, LLC
Chicago, Illinois
Wellington Management Company LLP
Boston, Massachusetts
Winslow Capital Management, LLC
Minneapolis, Minnesota
Legal Counsel
Dechert LLP
Washington, District of Columbia
Independent Registered Public Accounting Firm
PricewaterhouseCoopers LLP
New York, New York
Distributor
NYLIFE Distributors LLC*
Jersey City, New Jersey
Custodian
JPMorgan Chase Bank, N.A.
New York, New York
Some Portfolios may not be available in all products.
† Fidelity Institutional AM is a registered trade mark of FMR LLC. Used with permission.
* An affiliate of New York Life Investment Management LLC.
| 1. | Prior to May 1, 2022, the Portfolio's name was MainStay VP T. Rowe Price Equity Income Portfolio. |
| 2. | Prior to May 1, 2022, the Portfolio's name was MainStay VP MacKay S&P 500 Index Portfolio. |
Not part of the Annual Report
2022 Annual Report
This report is for the general information of New York Life Variable Annuities and NYLIAC Variable Universal Life Insurance Products policyowners. It must be preceded or accompanied by the appropriate product(s) and funds prospectuses if it is given to anyone who is not an owner of a New York Life variable annuity policy or a NYLIAC Variable Universal Life Insurance Product. This report does not offer for sale or solicit orders to purchase securities.
The performance data quoted in this report represents past performance. Past performance is no guarantee of future results. Due to market volatility and other factors, current performance may be lower or higher than the figures shown. The most recent month-end performance summary for your variable annuity or variable life policy is available by calling 800-598-2019 and is updated periodically on newyorklife.com.
The New York Life Variable Annuities and NYLIAC Variable Universal Life Insurance Products are issued by New York Life Insurance and Annuity Corporation (a Delaware Corporation) and distributed by NYLIFE Distributors LLC (Member FINRA/SIPC).
New York Life Insurance Company
New York Life Insurance and Annuity
Corporation (NYLIAC) (A Delaware Corporation)
51 Madison Avenue, Room 551
New York, NY 10010
newyorklife.com
newyorklifeinvestments.com
NYLIFE Distributors LLC, 30 Hudson Street, Jersey City, NJ 07302
New York Life Investment Management LLC is the investment manager to the MainStay VP Funds Trust
©2023 by NYLIFE Distributors LLC. All rights reserved.
You may obtain copies of the Prospectus and the Statement of Additional Information free of charge, upon request, by calling toll-free 800-598-2019 or writing to New York Life Insurance and Annuity Corporation, 51 Madison Avenue, New York, NY 10010.
| Not FDIC Insured | No Bank Guarantee | May Lose Value |
(NYLIAC) NI519
MainStay VP Indexed Bond Portfolio
Message from the President and Annual Report
December 31, 2022
Sign up for e-delivery of your shareholder reports. For full details on e-delivery, including who can participate and what you can receive via e-delivery,
please log in to newyorklifeinvestments.com/accounts.
| Not FDIC/NCUA Insured | Not a Deposit | May Lose Value | No Bank Guarantee | Not Insured by Any Government Agency |
This page intentionally left blank
Message from the President
The 12-month reporting period ended December 31, 2022, proved exceptionally challenging for investors as both stock and bond markets suffered steep declines. A variety of economic and geopolitical forces drove the market’s losses, all centered around rising inflation and monetary efforts to rein it in.
Inflationary alarms began to sound well before the reporting period began. In late 2021, after nearly two years of accommodative policies designed to encourage economic growth in the face of the COVID-19 pandemic, the U.S. Federal Reserve (the “Fed”) warned of the increasing need to tighten monetary policy. Nevertheless, the pace and persistence of inflation in early 2022 caught most market participants—the Fed included—off guard. Russia’s invasion of Ukraine in February exacerbated global inflationary pressures while increasing investor uncertainty. Domestic supply shortages, international trade imbalances and rising inflation caused U.S. GDP (gross domestic product) to contract in the first and second quarters of the year, although employment and consumer spending proved resilient. Prices for petroleum surged to multi-year highs, while many key agricultural chemicals and industrial metals soared as well. Accelerating inflationary forces prompted the Fed to implement its most aggressive series of interest rate hikes since the 1980s, with a 0.25% increase in March followed by six further rate increases totaling 4.25%. International central banks generally followed suit and raised rates by varying degrees in efforts to curb local inflation, although most increases remained significantly more modest than those in the United States. Relatively high U.S. interest rates and an international risk averse sentiment pushed U.S. dollar values higher compared to most other currencies, with negative impacts on global prices for food, fuel and other key U.S.-dollar-denominated products.
The effects of these interrelated challenges were felt throughout U.S. and international financial markets. The S&P 500® Index, a widely regarded benchmark of market performance, declined by more than 18% during the reporting period. Although the energy sector generated strong gains, bolstered by elevated oil and gas prices, most other industry segments recorded losses. The more cyclical and growth-oriented sectors of consumer discretionary, information technology and real estate delivered the weakest returns, while the traditionally defensive and value-oriented
consumer staples, utilities and health care sectors outperformed. On average, international developed-country equity markets mildly outperformed their U.S. counterparts, while emerging markets lagged slightly. Fixed-income markets proved unusually volatile, with bond prices trending sharply lower as yields rose along with interest rates. Short-term yields rose faster than long-term yields, producing a yield curve inversion from July through the end of the reporting period as long-term rates remained below short-term rates. While floating-rate instruments, which feature variable interest rates that allow investors to benefit from a rising rate environment, provided a degree of insulation from inflation-driven trends, they were not immune to the market’s widespread declines.
Although, according to the most recent estimates, the annualized inflation rate in the United States has declined from a peak of 9.1% in July 2022 to 6.5% in December, the Fed remains focused on achieving more substantial and lasting reductions, aiming for a target rate of 2%. As a result, further rate hikes and additional market volatility are potential headwinds in the coming months. The question remains as to whether the Fed and other central banks will manage a so-called “soft landing,” curbing inflation while avoiding a persistent economic slowdown. If they prove successful, we believe that the increasingly attractive valuations we have observed in both equity and bond markets should eventually translate into sustainable improvements in the investment environment.
Whatever actions the Fed takes and however financial markets react, as a MainStay VP investor you can depend on us to continue managing our portfolios with the insight, expertise and level of service that have long defined New York Life Investments. Thank you for trusting us to help you meet your investment needs.
Sincerely,
Kirk C. Lehneis
President
The opinions expressed are as of the date of this report and are subject to change. There is no guarantee that any forecast made will come to pass. This material does not constitute investment advice and is not intended as an endorsement of any specific investment. Past performance is no guarantee of future results.
Not part of the Annual Report
Investors should refer to the Portfolio’s Summary Prospectus and/or Prospectus and consider the Portfolio’s investment objectives, strategies, risks, charges and expenses carefully before investing. The Summary Prospectus and/or Prospectus contain this and other information about the Portfolio. You may obtain copies of the Portfolio’s Summary Prospectus, Prospectus and Statement of Additional Information, which includes information about the MainStay VP Funds Trust's Trustees, free of charge, upon request, by calling toll-free 800-598-2019, by writing to New York Life Insurance and Annuity Corporation, 51 Madison Avenue, Room 251, New York, New York 10010 or by sending an email to MainStayShareholdersServices@nylim.com. These documents are also available at newyorklifeinvestments.com/investment-products/vp. Please read the Portfolio's Summary Prospectus and/or Prospectus carefully before investing. MainStay VP Funds Trust portfolios are separate account options which are purchased through a variable insurance or variable annuity contract.
Investment and Performance Comparison (Unaudited)
Performance data quoted represents past performance. Past performance is no guarantee of future results. Because of market volatility and other factors, current performance may be lower or higher than the figures shown. Investment return and principal value will fluctuate, and as a result, when shares are redeemed, they may be worth more or less than their original cost. The performance table and graph do not reflect any deduction of sales charges, mortality and expense charges, contract charges or administrative charges. Please refer to the Performance Summary appropriate for your policy. For performance information current to the most recent month-end, please call 800-598-2019 or visit www.newyorklife.com.
Performance figures may reflect certain fee waivers and/or expense limitations, without which total returns may have been different. For information on current fee waivers and/or expense limitations (if any), please refer to the Notes to Financial Statements.
| Average Annual Total Returns for the Year-Ended December 31, 2022 |
| Class | Inception
Date | One
Year | Five
Years | Since
Inception | Gross
Expense
Ratio1 |
| Initial Class Shares | 5/1/2017 | -13.34% | -0.37% | -0.08% | 0.31% |
| 1. | The gross expense ratios presented reflect the Portfolio’s “Total Annual Portfolio Operating Expenses” from the most recent Prospectus and may differ from other expense ratios disclosed in this report. |
| Benchmark Performance* | One
Year | Five
Years | Since
Inception |
| Bloomberg U.S. Aggregate Bond Index1 | -13.01% | 0.02% | 0.36% |
| Morningstar Intermediate Core Bond Category Average2 | -13.34 | -0.23 | 0.12 |
| * | Returns for indices reflect no deductions for fees, expenses or taxes, except for foreign withholding taxes where applicable. Results assume reinvestment of all dividends and capital gains. An investment cannot be made directly in an index. |
| 1. | The Bloomberg U.S. Aggregate Bond Index is the Portfolio's primary benchmark. The Bloomberg U.S. Aggregate Bond Index is a broad-based benchmark that measures the investment grade, U.S. dollar-denominated, fixed-rate taxable bond market, including Treasuries, government-related and corporate securities, mortgage-backed securities (agency fixed-rate and hybrid adjustable-rate mortgage pass-throughs), asset-backed securities and commercial mortgage-backed securities. |
| 2. | The Morningstar Intermediate Core Bond Category Average is representative of funds that invest primarily in investment-grade U.S. fixed-income issues including government, corporate, and securitized debt, and hold less than 5% in below-investment-grade exposures. Their durations (a measure of interest-rate sensitivity) typically range between 75% and 125% of the three-year average of the effective duration of the Morningstar Core Bond Index. Results are based on average total returns of similar funds with all dividends and capital gain distributions reinvested. |
Cost in Dollars of a $1,000 Investment in MainStay VP Indexed Bond Portfolio (Unaudited)
The example below is intended to describe the fees and expenses borne by shareholders during the six-month period from July 1, 2022 to December 31, 2022, and the impact of those costs on your investment.
Example
As a shareholder of the Portfolio you incur two types of costs: (1) transaction costs, including exchange fees and sales charges (loads) on purchases (as applicable), and (2) ongoing costs, including management fees and other Portfolio expenses (as applicable). This example is intended to help you understand your ongoing costs (in dollars) of investing in the Portfolio and to compare these costs with the ongoing costs of investing in other mutual funds. The example is based on an investment of $1,000 made at the beginning of the six-month period and held for the entire period from July 1, 2022 to December 31, 2022. Shares are only sold in connection with variable life and annuity contracts and the example does not reflect any contract level or transactional fees or expenses. If these costs had been included, your costs would have been higher.
This example illustrates your Portfolio’s ongoing costs in two ways:
Actual Expenses
The second and third data columns in the table below provide information about actual account values and actual expenses. You may use the information in these columns, together with the amount you invested, to estimate the expenses that you paid during the six months ended
December 31, 2022. Simply divide your account value by $1,000 (for example, an $8,600 account value divided by $1,000 = 8.6), then multiply the result by the number under the heading entitled “Expenses Paid During Period” to estimate the expenses you paid on your account during this period.
Hypothetical Example for Comparison Purposes
The fourth and fifth data columns in the table below provide information about hypothetical account values and hypothetical expenses based on the Portfolio’s actual expense ratio and an assumed rate of return of 5% per year before expenses, which is not the Portfolio’s actual return. The hypothetical account values and expenses may not be used to estimate the actual ending account balances or expenses you paid for the six-month period shown. You may use this information to compare the ongoing costs of investing in the Portfolio with the ongoing costs of investing in other mutual funds. To do so, compare this 5% hypothetical example with the 5% hypothetical examples that appear in the shareholder reports of the other mutual funds.
Please note that the expenses shown in the table are meant to highlight your ongoing costs only and do not reflect any transactional costs, such as exchange fees or sales charges (loads). Therefore, the fourth and fifth data columns of the table are useful in comparing ongoing costs only and will not help you determine the relative total costs of owning different funds. In addition, if these transactional costs were included, your costs would have been higher.
| Share Class | Beginning
Account
Value
7/1/22 | Ending Account
Value (Based
on Actual
Returns and
Expenses)
12/31/22 | Expenses
Paid
During
Period1 | Ending Account
Value (Based
on Hypothetical
5% Annualized
Return and
Actual Expenses)
12/31/22 | Expenses
Paid
During
Period1 | Net Expense
Ratio
During
Period2 |
| Initial Class Shares | $1,000.00 | $965.60 | $1.54 | $1,023.64 | $1.58 | 0.31% |
| 1. | Expenses are equal to the Portfolio’s annualized expense ratio of each class multiplied by the average account value over the period, divided by 365 and multiplied by 184 (to reflect the six-month period). The table above represents the actual expenses incurred during the six-month period. In addition to the fees and expenses which the Portfolio bears directly, it also indirectly bears a pro rata share of the fees and expenses of the underlying funds in which it invests. Such indirect expenses are not included in the above-reported expense figures. |
| 2. | Expenses are equal to the Portfolio's annualized expense ratio to reflect the six-month period. |
| 6 | MainStay VP Indexed Bond Portfolio |
Portfolio Composition as of December 31, 2022 (Unaudited)
See Portfolio of Investments beginning on page 9 for specific holdings within these categories. The Portfolio's holdings are subject to change.
Top Ten Holdings and/or Issuers Held as of December 31, 2022 (excluding short-term investments) (Unaudited)
| 1. | U.S. Treasury Notes, 0.125%-4.50%, due 3/31/23–11/15/32 |
| 2. | UMBS, 30 Year, 2.00%-5.50%, due 6/1/36–11/1/52 |
| 3. | GNMA II, Single Family, 30 Year, 2.00%-5.00%, due 11/20/42–9/20/51 |
| 4. | U.S. Treasury Bonds, 1.875%-4.00%, due 11/15/46–11/15/52 |
| 5. | UMBS Pool, 30 Year, 2.00%-4.50%, due 1/1/49–7/1/52 |
| 6. | UMBS, 15 Year, 1.50%-4.00%, due 5/1/24–9/1/36 |
| 7. | iShares iBoxx $ Investment Grade Corporate Bond ETF |
| 8. | FHLMC Gold Pools, 30 Year, 3.00%-5.50%, due 7/1/38–1/1/49 |
| 9. | UMBS, Single Family, 30 Year, 2.00%-5.00%, due 1/25/53 |
| 10. | FFCB, 0.68%-5.95%, due 10/19/26–10/17/30 |
Portfolio Management Discussion and Analysis (Unaudited)
Answers to the questions reflect the views of portfolio managers Kenneth Sommer and AJ Rzad, CFA, of NYL Investors LLC, the Portfolio’s Subadvisor.
How did MainStay VP Indexed Bond Portfolio perform relative to its benchmark and peers during the 12 months ended December 31, 2022?
For the 12 months ended December 31, 2022, MainStay VP Indexed Bond Portfolio returned −13.34% for Initial Class shares. Over the same period, Initial Class shares underperformed the −13.01% return of the Bloomberg U.S. Aggregate Bond Index (“the Index”), which is the Portfolio’s primary benchmark. Although the Portfolio seeks investment results that correspond to the total return performance of fixed-income securities in the aggregate, as represented by the Portfolio’s benchmark, the Portfolio’s performance will typically lag that of the Index because the Portfolio incurs fees and expenses that the Index does not. For the 12 months ended December 31, 2022, Initial Class shares matched the −13.34% return of the Morningstar Intermediate Core Bond Category Average.1
During the reporting period, how was the Portfolio’s performance materially affected by investments in derivatives?
U.S. Treasury futures were used to maintain a duration2 equal to that of the Index and did not materially affect the performance of the Portfolio. Treasury futures were also used to reduce variations between the Portfolio and the Index. These trades reduced tracking error for the Portfolio.
During the reporting period, which credit-rating categories were strong performers and which credit rating categories were weak?
All the investment-grade rating categories produced negative excess returns in 2022, underperforming matched duration Treasury securities. Credits rated BBB generated the most negative excess return, followed by credits rated A.3 Credits rated AAA outperformed credits rated AA.4
What was the Portfolio’s duration strategy during the reporting period?
The Portfolio employs a passive strategy that attempts to replicate the duration of the Index. The Portfolio’s duration strategy had a neutral impact on performance during the reporting period. As of December 31, 2022, the Portfolio’s duration was 6.32 years, which was the same as the duration of 6.32 years for the Index.
Which market segments made the strongest contributions to the Portfolio’s performance, and which market segments detracted the most?
During the reporting period, all broad sectors in the Index produced negative total returns. The U.S. government agency sector made the strongest positive contribution to performance. (Contributions take weightings and total returns into account.) The commercial mortgage-backed securities sector provided the next-highest contribution to performance, followed by the U.S. Treasury sector.
The corporate and mortgage-backed sectors detracted the most from the Portfolio’s total return during the reporting period. Within the corporate sector, the industrials and financials subsectors were the weakest performers. In the noncorporate sector, the sovereign subsector detracted the most from the Portfolio’s total return.
| 1. | See page 5 for more information on benchmark and peer group returns. |
| 2. | Duration is a measure of the price sensitivity of a fixed-income investment to changes in interest rates. Duration is expressed as a number of years and is considered a more accurate sensitivity gauge than average maturity. |
| 3. | An obligation rated ‘A’ by Standard and Poor's ("S&P") is deemed by S&P to be somewhat more susceptible to the adverse effects of changes in circumstances and economic conditions than obligations in higher-rated categories. In the opinion of S&P, however, the obligor's capacity to meet its financial commitment on the obligation is still strong. An obligation rated ‘BBB’ by S&P is deemed by S&P to exhibit adequate protection parameters. In the opinion of S&P, however, adverse economic conditions or changing circumstances are more likely to lead to a weakened capacity of the obligor to meet its financial commitment on the obligation. When applied to Portfolio holdings, ratings are based solely on the creditworthiness of the bonds in the Portfolio and are not meant to represent the security or safety of the Portfolio. |
| 4. | An obligation rated ‘AAA’ has the highest rating assigned by S&P, and in the opinion of S&P, the obligor’s capacity to meet its financial commitment on the obligation is extremely strong. An obligation rated ‘AA’ by S&P is deemed by S&P to differ from the highest-rated obligations only to a small degree. In the opinion of S&P, the obligor's capacity to meet its financial commitment on the obligation is very strong. When applied to Portfolio holdings, ratings are based solely on the creditworthiness of the bonds in the Portfolio and are not meant to represent the security or safety of the Portfolio. |
The opinions expressed are those of the portfolio managers as of the date of this report and are subject to change. There is no guarantee that any forecasts will come to pass. This material does not constitute investment advice and is not intended as an endorsement of any specific investment.
Not all MainStay VP Portfolios and/or share classes are available under all policies.
| 8 | MainStay VP Indexed Bond Portfolio |
Portfolio of Investments December 31, 2022†
| | Principal
Amount | Value |
| Long-Term Bonds 96.6% |
| Corporate Bonds 20.6% |
| Aerospace & Defense 0.6% |
| Boeing Co. (The) | | |
| 3.25%, due 3/1/28 | $ 585,000 | $ 522,898 |
| 5.15%, due 5/1/30 | 250,000 | 243,910 |
| Lockheed Martin Corp. | | |
| 4.30%, due 6/15/62 | 135,000 | 113,402 |
| Northrop Grumman Systems Corp. | | |
| 7.75%, due 2/15/31 | 275,000 | 313,044 |
| Raytheon Technologies Corp. | | |
| 3.125%, due 7/1/50 | 105,000 | 73,503 |
| 3.50%, due 3/15/27 | 275,000 | 261,887 |
| | | 1,528,644 |
| Apparel 0.0% ‡ |
| NIKE, Inc. | | |
| 3.625%, due 5/1/43 | 95,000 | 78,706 |
| Auto Manufacturers 0.2% |
| General Motors Co. | | |
| 5.40%, due 4/1/48 | 81,000 | 66,203 |
| General Motors Financial Co., Inc. | | |
| 2.40%, due 10/15/28 | 250,000 | 207,302 |
| 3.10%, due 1/12/32 | 167,000 | 130,851 |
| 4.35%, due 1/17/27 | 130,000 | 123,525 |
| | | 527,881 |
| Banks 4.8% |
| Bank of America Corp. | | |
| 2.972%, due 7/21/52 (a) | 525,000 | 327,922 |
| 3.248%, due 10/21/27 | 505,000 | 466,276 |
| 3.419%, due 12/20/28 (a) | 1,550,000 | 1,403,571 |
| 3.846% (5 Year Treasury Constant Maturity Rate + 2.00%), due 3/8/37 (b) | 230,000 | 190,454 |
| Barclays plc | | |
| 5.25%, due 8/17/45 | 270,000 | 241,251 |
| Citigroup, Inc. | | |
| 2.561%, due 5/1/32 (a) | 260,000 | 205,261 |
| 4.45%, due 9/29/27 | 1,085,000 | 1,034,448 |
| 4.65%, due 7/30/45 | 180,000 | 154,373 |
| Cooperatieve Rabobank UA | | |
| 5.25%, due 5/24/41 | 215,000 | 215,140 |
| Credit Suisse Group AG | | |
| 2.593%, due 9/11/25 (a)(c) | 500,000 | 442,030 |
| Fifth Third Bancorp | | |
| 4.337%, due 4/25/33 (a) | 200,000 | 182,732 |
| | Principal
Amount | Value |
| |
| Banks (continued) |
| Goldman Sachs Group, Inc. (The) | | |
| 2.64%, due 2/24/28 (a) | $ 715,000 | $ 636,626 |
| 4.80%, due 7/8/44 | 420,000 | 371,330 |
| HSBC Holdings plc (a) | | |
| 7.336%, due 11/3/26 | 575,000 | 598,041 |
| 7.39%, due 11/3/28 | 305,000 | 320,540 |
| JPMorgan Chase & Co. (a) | | |
| 1.578%, due 4/22/27 | 870,000 | 764,436 |
| 4.26%, due 2/22/48 | 605,000 | 494,736 |
| 4.912%, due 7/25/33 | 305,000 | 290,399 |
| Lloyds Banking Group plc | | |
| 3.75%, due 1/11/27 | 1,265,000 | 1,176,712 |
| Mitsubishi UFJ Financial Group, Inc. | | |
| 3.455%, due 3/2/23 | 10,000 | 9,979 |
| Morgan Stanley (a) | | |
| 5.297%, due 4/20/37 | 145,000 | 132,582 |
| 6.138%, due 10/16/26 | 5,000 | 5,107 |
| 6.296%, due 10/18/28 | 1,270,000 | 1,311,027 |
| 6.342%, due 10/18/33 | 375,000 | 392,927 |
| State Street Corp. | | |
| 5.82%, due 11/4/28 (a) | 810,000 | 836,467 |
| Wells Fargo & Co. | | |
| 3.00%, due 4/22/26 | 525,000 | 491,038 |
| 4.75%, due 12/7/46 | 605,000 | 506,655 |
| | | 13,202,060 |
| Beverages 0.4% |
| Anheuser-Busch InBev Worldwide, Inc. | | |
| 5.55%, due 1/23/49 | 525,000 | 519,014 |
| Coca-Cola Co. (The) | | |
| 2.60%, due 6/1/50 | 260,000 | 172,216 |
| Constellation Brands, Inc. | | |
| 3.60%, due 2/15/28 | 130,000 | 120,473 |
| Keurig Dr Pepper, Inc. | | |
| 4.985%, due 5/25/38 | 95,000 | 88,705 |
| Molson Coors Beverage Co. | | |
| 4.20%, due 7/15/46 | 95,000 | 73,660 |
| PepsiCo, Inc. | | |
| 2.75%, due 3/1/23 | 5,000 | 4,988 |
| 3.625%, due 3/19/50 | 30,000 | 24,497 |
| | | 1,003,553 |
| Biotechnology 0.1% |
| Amgen, Inc. | | |
| 3.375%, due 2/21/50 | 205,000 | 142,506 |
| Gilead Sciences, Inc. | | |
| 4.60%, due 9/1/35 | 215,000 | 204,214 |
| | | 346,720 |
The notes to the financial statements are an integral part of, and should be read in conjunction with, the financial statements.
9
Portfolio of Investments December 31, 2022† (continued)
| | Principal
Amount | Value |
| Corporate Bonds (continued) |
| Building Materials 0.0% ‡ |
| Johnson Controls International plc | | |
| 6.00%, due 1/15/36 | $ 80,000 | $ 83,035 |
| Chemicals 0.8% |
| Dow Chemical Co. (The) | | |
| 2.10%, due 11/15/30 | 145,000 | 116,519 |
| 3.60%, due 11/15/50 | 65,000 | 46,443 |
| DuPont de Nemours, Inc. | | |
| 4.493%, due 11/15/25 | 470,000 | 462,175 |
| Ecolab, Inc. | | |
| 2.70%, due 11/1/26 | 275,000 | 255,199 |
| LYB International Finance II BV | | |
| 3.50%, due 3/2/27 | 275,000 | 254,516 |
| LYB International Finance III LLC | | |
| 3.625%, due 4/1/51 | 50,000 | 33,454 |
| Mosaic Co. (The) | | |
| 4.05%, due 11/15/27 | 505,000 | 475,498 |
| Nutrien Ltd. | | |
| 5.875%, due 12/1/36 | 275,000 | 279,815 |
| Sherwin-Williams Co. (The) | | |
| 3.95%, due 1/15/26 | 320,000 | 310,884 |
| | | 2,234,503 |
| Commercial Services 0.0% ‡ |
| PayPal Holdings, Inc. | | |
| 5.05%, due 6/1/52 | 95,000 | 86,021 |
| Computers 0.6% |
| Apple, Inc. | | |
| 4.50%, due 2/23/36 | 660,000 | 654,737 |
| Dell International LLC | | |
| 3.45%, due 12/15/51 (c) | 95,000 | 58,140 |
| 6.02%, due 6/15/26 | 395,000 | 402,962 |
| HP, Inc. | | |
| 6.00%, due 9/15/41 | 40,000 | 38,378 |
| International Business Machines Corp. | | |
| 3.50%, due 5/15/29 | 465,000 | 427,447 |
| | | 1,581,664 |
| Cosmetics & Personal Care 0.1% |
| Procter & Gamble Co. (The) | | |
| 2.70%, due 2/2/26 | 275,000 | 260,531 |
| Unilever Capital Corp. | | |
| 3.10%, due 7/30/25 | 100,000 | 95,977 |
| | | 356,508 |
| | Principal
Amount | Value |
| |
| Diversified Financial Services 0.2% |
| AerCap Ireland Capital DAC | | |
| 3.85%, due 10/29/41 | $ 150,000 | $ 106,046 |
| Capital One Financial Corp. | | |
| 5.268%, due 5/10/33 (a) | 155,000 | 143,983 |
| Nomura Holdings, Inc. | | |
| 2.999%, due 1/22/32 | 200,000 | 156,911 |
| Visa, Inc. | | |
| 4.30%, due 12/14/45 | 210,000 | 191,701 |
| | | 598,641 |
| Electric 1.7% |
| AEP Texas, Inc. | | |
| 5.25%, due 5/15/52 | 95,000 | 90,846 |
| CenterPoint Energy Houston Electric LLC | | |
| Series AC | | |
| 4.25%, due 2/1/49 | 315,000 | 273,855 |
| Commonwealth Edison Co. | | |
| 3.65%, due 6/15/46 | 195,000 | 148,108 |
| Consolidated Edison Co. of New York, Inc. | | |
| Series 06-A | | |
| 5.85%, due 3/15/36 | 410,000 | 414,400 |
| DTE Electric Co. | | |
| 3.375%, due 3/1/25 | 215,000 | 208,468 |
| Duke Energy Carolinas LLC | | |
| 3.875%, due 3/15/46 | 365,000 | 287,019 |
| Duke Energy Corp. | | |
| 4.50%, due 8/15/32 | 95,000 | 88,987 |
| 5.00%, due 8/15/52 | 95,000 | 84,300 |
| Entergy Louisiana LLC | | |
| 4.20%, due 4/1/50 | 365,000 | 296,415 |
| Florida Power & Light Co. | | |
| 3.80%, due 12/15/42 | 175,000 | 144,548 |
| MidAmerican Energy Co. | | |
| 3.95%, due 8/1/47 | 400,000 | 325,627 |
| Ohio Power Co. | | |
| Series G | | |
| 6.60%, due 2/15/33 | 200,000 | 210,571 |
| PPL Electric Utilities Corp. | | |
| 3.95%, due 6/1/47 | 130,000 | 105,189 |
| Public Service Electric and Gas Co. | | |
| 2.70%, due 5/1/50 | 235,000 | 151,791 |
| Sempra Energy | | |
| 3.80%, due 2/1/38 | 275,000 | 225,512 |
| Southern California Edison Co. | | |
| Series C | | |
| 4.125%, due 3/1/48 | 275,000 | 219,443 |
| Southern Co. (The) | | |
| 4.40%, due 7/1/46 | 350,000 | 291,896 |
The notes to the financial statements are an integral part of, and should be read in conjunction with, the financial statements.
| 10 | MainStay VP Indexed Bond Portfolio |
| | Principal
Amount | Value |
| Corporate Bonds (continued) |
| Electric (continued) |
| Virginia Electric and Power Co. | | |
| 4.00%, due 1/15/43 | $ 410,000 | $ 331,527 |
| Xcel Energy, Inc. | | |
| 3.30%, due 6/1/25 | 885,000 | 849,428 |
| | | 4,747,930 |
| Entertainment 0.1% |
| Warnermedia Holdings, Inc. | | |
| 5.141%, due 3/15/52 (c) | 218,000 | 158,479 |
| Environmental Control 0.2% |
| Republic Services, Inc. | | |
| 3.20%, due 3/15/25 | 320,000 | 306,837 |
| Waste Management, Inc. | | |
| 3.15%, due 11/15/27 | 320,000 | 298,499 |
| | | 605,336 |
| Food 0.3% |
| General Mills, Inc. | | |
| 4.20%, due 4/17/28 | 95,000 | 91,801 |
| Kraft Heinz Foods Co. | | |
| 4.375%, due 6/1/46 | 230,000 | 186,899 |
| Kroger Co. (The) | | |
| 2.20%, due 5/1/30 | 230,000 | 186,637 |
| Sysco Corp. | | |
| 3.25%, due 7/15/27 | 320,000 | 295,767 |
| Tyson Foods, Inc. | | |
| 5.10%, due 9/28/48 | 155,000 | 142,998 |
| | | 904,102 |
| Forest Products & Paper 0.2% |
| Fibria Overseas Finance Ltd. | | |
| 5.50%, due 1/17/27 | 505,000 | 506,702 |
| Gas 0.1% |
| NiSource, Inc. | | |
| 3.49%, due 5/15/27 | 275,000 | 259,023 |
| Healthcare-Products 0.4% |
| Abbott Laboratories | | |
| 3.75%, due 11/30/26 | 185,000 | 180,103 |
| 4.90%, due 11/30/46 | 290,000 | 282,731 |
| Boston Scientific Corp. | | |
| 4.70%, due 3/1/49 | 80,000 | 71,568 |
| Medtronic, Inc. | | |
| 4.625%, due 3/15/45 | 209,000 | 194,641 |
| | Principal
Amount | Value |
| |
| Healthcare-Products (continued) |
| Stryker Corp. | | |
| 3.65%, due 3/7/28 | $ 275,000 | $ 261,240 |
| | | 990,283 |
| Healthcare-Services 0.5% |
| Aetna, Inc. | | |
| 6.625%, due 6/15/36 | 275,000 | 292,129 |
| Elevance Health, Inc. | | |
| 4.375%, due 12/1/47 | 320,000 | 273,372 |
| HCA, Inc. (c) | | |
| 3.625%, due 3/15/32 | 85,000 | 71,923 |
| 4.625%, due 3/15/52 | 170,000 | 132,310 |
| Laboratory Corp. of America Holdings | | |
| 3.60%, due 2/1/25 | 320,000 | 309,893 |
| UnitedHealth Group, Inc. | | |
| 4.25%, due 4/15/47 | 315,000 | 270,769 |
| | | 1,350,396 |
| Home Builders 0.1% |
| PulteGroup, Inc. | | |
| 5.50%, due 3/1/26 | 220,000 | 220,782 |
| Household Products & Wares 0.2% |
| Clorox Co. (The) | | |
| 3.90%, due 5/15/28 | 275,000 | 262,084 |
| Kimberly-Clark Corp. | | |
| 2.75%, due 2/15/26 | 275,000 | 259,114 |
| | | 521,198 |
| Insurance 0.8% |
| Allstate Corp. (The) | | |
| 5.35%, due 6/1/33 | 275,000 | 274,040 |
| American International Group, Inc. | | |
| 6.25%, due 5/1/36 | 350,000 | 368,862 |
| Berkshire Hathaway Finance Corp. | | |
| 4.30%, due 5/15/43 | 425,000 | 380,990 |
| MetLife, Inc. | | |
| 3.60%, due 11/13/25 | 815,000 | 791,891 |
| Prudential Financial, Inc. | | |
| 3.70%, due 3/13/51 | 135,000 | 103,014 |
| 3.935%, due 12/7/49 | 155,000 | 120,710 |
| | | 2,039,507 |
| Internet 0.2% |
| Alibaba Group Holding Ltd. | | |
| 2.70%, due 2/9/41 | 200,000 | 127,528 |
| Amazon.com, Inc. | | |
| 3.875%, due 8/22/37 | 535,000 | 473,967 |
| | | 601,495 |
The notes to the financial statements are an integral part of, and should be read in conjunction with, the financial statements.
11
Portfolio of Investments December 31, 2022† (continued)
| | Principal
Amount | Value |
| Corporate Bonds (continued) |
| Machinery—Construction & Mining 0.1% |
| Caterpillar, Inc. | | |
| 5.30%, due 9/15/35 | $ 325,000 | $ 331,863 |
| Machinery-Diversified 0.1% |
| Deere & Co. | | |
| 3.90%, due 6/9/42 | 180,000 | 159,200 |
| Media 0.7% |
| Charter Communications Operating LLC | | |
| 4.908%, due 7/23/25 | 445,000 | 436,145 |
| 5.75%, due 4/1/48 | 420,000 | 343,850 |
| Comcast Corp. | | |
| 3.40%, due 7/15/46 | 795,000 | 582,250 |
| Discovery Communications LLC | | |
| 3.95%, due 3/20/28 | 121,000 | 107,398 |
| Fox Corp. | | |
| 5.576%, due 1/25/49 | 86,000 | 76,728 |
| Paramount Global | | |
| 4.95%, due 1/15/31 | 352,000 | 312,829 |
| Walt Disney Co. (The) | | |
| 3.60%, due 1/13/51 | 204,000 | 155,333 |
| | | 2,014,533 |
| Mining 0.1% |
| Barrick North America Finance LLC | | |
| 5.70%, due 5/30/41 | 130,000 | 130,564 |
| BHP Billiton Finance USA Ltd. | | |
| 3.85%, due 9/30/23 | 5,000 | 4,959 |
| Newmont Corp. | | |
| 2.25%, due 10/1/30 | 125,000 | 100,467 |
| 2.60%, due 7/15/32 | 105,000 | 83,592 |
| | | 319,582 |
| Miscellaneous—Manufacturing 0.2% |
| 3M Co. | | |
| 4.00%, due 9/14/48 | 135,000 | 106,123 |
| Eaton Corp. | | |
| 4.00%, due 11/2/32 | 275,000 | 253,221 |
| General Electric Co. | | |
| 4.125%, due 10/9/42 | 99,000 | 78,420 |
| Parker-Hannifin Corp. | | |
| 4.20%, due 11/21/34 | 95,000 | 85,584 |
| | | 523,348 |
| Oil & Gas 0.6% |
| BP Capital Markets America, Inc. | | |
| 3.001%, due 3/17/52 | 115,000 | 75,805 |
| | Principal
Amount | Value |
| |
| Oil & Gas (continued) |
BP Capital Markets America, Inc.
(continued) | | |
| 3.588%, due 4/14/27 | $ 315,000 | $ 300,039 |
| Canadian Natural Resources Ltd. | | |
| 6.25%, due 3/15/38 | 130,000 | 128,612 |
| ConocoPhillips Co. | | |
| 5.95%, due 3/15/46 | 200,000 | 213,396 |
| EOG Resources, Inc. | | |
| 3.90%, due 4/1/35 | 215,000 | 191,786 |
| Exxon Mobil Corp. | | |
| 4.114%, due 3/1/46 | 215,000 | 182,903 |
| Hess Corp. | | |
| 7.125%, due 3/15/33 | 130,000 | 140,017 |
| Phillips 66 Co. | | |
| 4.68%, due 2/15/45 (c) | 260,000 | 225,334 |
| Shell International Finance BV | | |
| 3.75%, due 9/12/46 | 325,000 | 254,511 |
| | | 1,712,403 |
| Oil & Gas Services 0.0% ‡ |
| Halliburton Co. | | |
| 3.80%, due 11/15/25 | 12,000 | 11,672 |
| Pharmaceuticals 1.1% |
| AbbVie, Inc. | | |
| 3.80%, due 3/15/25 | 185,000 | 180,303 |
| 4.70%, due 5/14/45 | 345,000 | 306,430 |
| Allergan Funding SCS | | |
| 3.80%, due 3/15/25 | 50,000 | 47,459 |
| 4.75%, due 3/15/45 | 25,000 | 19,159 |
| AstraZeneca plc | | |
| 6.45%, due 9/15/37 | 250,000 | 281,817 |
| Bristol-Myers Squibb Co. | | |
| 3.70%, due 3/15/52 | 75,000 | 58,339 |
| Cigna Corp. | | |
| 4.90%, due 12/15/48 | 185,000 | 166,687 |
| CVS Health Corp. | | |
| 1.875%, due 2/28/31 | 10,000 | 7,844 |
| 5.05%, due 3/25/48 | 340,000 | 305,165 |
| Eli Lilly and Co. | | |
| 3.95%, due 3/15/49 | 155,000 | 137,514 |
| GlaxoSmithKline Capital, Inc. | | |
| 3.875%, due 5/15/28 | 320,000 | 306,820 |
| Johnson & Johnson | | |
| 4.95%, due 5/15/33 | 315,000 | 327,844 |
| Merck & Co., Inc. | | |
| 3.70%, due 2/10/45 | 275,000 | 226,176 |
The notes to the financial statements are an integral part of, and should be read in conjunction with, the financial statements.
| 12 | MainStay VP Indexed Bond Portfolio |
| | Principal
Amount | Value |
| Corporate Bonds (continued) |
| Pharmaceuticals (continued) |
| Mylan, Inc. | | |
| 4.20%, due 11/29/23 | $ 80,000 | $ 79,178 |
| 5.20%, due 4/15/48 | 95,000 | 70,745 |
| Pfizer, Inc. | | |
| 4.00%, due 12/15/36 | 395,000 | 360,227 |
| | | 2,881,707 |
| Pipelines 0.9% |
| Enbridge, Inc. | | |
| 4.50%, due 6/10/44 | 275,000 | 228,645 |
| Energy Transfer LP | | |
| 5.00%, due 5/15/50 | 200,000 | 159,786 |
| Enterprise Products Operating LLC | | |
| 3.70%, due 2/15/26 | 500,000 | 481,892 |
| 4.80%, due 2/1/49 | 260,000 | 221,550 |
| Kinder Morgan, Inc. | | |
| 4.30%, due 6/1/25 | 590,000 | 578,604 |
| 4.80%, due 2/1/33 | 240,000 | 222,508 |
| 5.45%, due 8/1/52 | 115,000 | 103,222 |
| MPLX LP | | |
| 4.95%, due 3/14/52 | 145,000 | 118,442 |
| ONEOK, Inc. | | |
| 5.20%, due 7/15/48 | 85,000 | 70,803 |
| TransCanada PipeLines Ltd. | | |
| 4.875%, due 1/15/26 | 10,000 | 9,937 |
| 4.875%, due 5/15/48 | 150,000 | 130,984 |
| Williams Cos., Inc. (The) | | |
| 3.50%, due 10/15/51 | 65,000 | 44,236 |
| | | 2,370,609 |
| Real Estate Investment Trusts 0.4% |
| American Tower Corp. | | |
| 2.30%, due 9/15/31 | 145,000 | 112,718 |
| AvalonBay Communities, Inc. | | |
| 2.90%, due 10/15/26 | 215,000 | 196,960 |
| Crown Castle, Inc. | | |
| 3.25%, due 1/15/51 | 95,000 | 61,767 |
| ERP Operating LP | | |
| 3.25%, due 8/1/27 | 275,000 | 251,831 |
| Realty Income Corp. | | |
| 4.65%, due 3/15/47 | 155,000 | 136,397 |
| Simon Property Group LP | | |
| 4.25%, due 11/30/46 | 260,000 | 207,628 |
| | | 967,301 |
| Retail 0.4% |
| Home Depot, Inc. (The) | | |
| 2.375%, due 3/15/51 | 365,000 | 217,747 |
| | Principal
Amount | Value |
| |
| Retail (continued) |
| Lowe's Cos., Inc. | | |
| 4.05%, due 5/3/47 | $ 185,000 | $ 144,693 |
| McDonald's Corp. | | |
| 4.20%, due 4/1/50 | 85,000 | 70,719 |
| Starbucks Corp. | | |
| 3.00%, due 2/14/32 | 260,000 | 221,679 |
| Target Corp. | | |
| 2.35%, due 2/15/30 | 185,000 | 157,036 |
| Walmart, Inc. | | |
| 4.30%, due 4/22/44 | 340,000 | 309,506 |
| | | 1,121,380 |
| Semiconductors 0.7% |
| Applied Materials, Inc. | | |
| 5.10%, due 10/1/35 | 275,000 | 278,261 |
| Broadcom, Inc. | | |
| 4.926%, due 5/15/37 (c) | 410,000 | 357,670 |
| Intel Corp. | | |
| 2.00%, due 8/12/31 | 338,000 | 267,695 |
| 4.75%, due 3/25/50 | 112,000 | 97,204 |
| KLA Corp. | | |
| 4.95%, due 7/15/52 | 105,000 | 97,519 |
| NVIDIA Corp. | | |
| 1.55%, due 6/15/28 | 460,000 | 392,779 |
| 2.00%, due 6/15/31 | 220,000 | 176,203 |
| NXP BV | | |
| 5.00%, due 1/15/33 | 75,000 | 70,829 |
| QUALCOMM, Inc. | | |
| 4.65%, due 5/20/35 | 115,000 | 111,665 |
| | | 1,849,825 |
| Software 1.1% |
| Fidelity National Information Services, Inc. | | |
| 5.625%, due 7/15/52 | 75,000 | 68,806 |
| Fiserv, Inc. | | |
| 4.40%, due 7/1/49 | 105,000 | 85,186 |
| Microsoft Corp. | | |
| 2.921%, due 3/17/52 | 290,000 | 205,175 |
| 3.30%, due 2/6/27 | 240,000 | 231,284 |
| Oracle Corp. | | |
| 2.95%, due 5/15/25 | 2,100,000 | 1,992,392 |
| 4.00%, due 7/15/46 | 70,000 | 51,012 |
| 5.375%, due 7/15/40 | 210,000 | 192,705 |
| Salesforce, Inc. | | |
| 1.95%, due 7/15/31 | 250,000 | 199,317 |
| 3.05%, due 7/15/61 | 65,000 | 41,273 |
| | | 3,067,150 |
The notes to the financial statements are an integral part of, and should be read in conjunction with, the financial statements.
13
Portfolio of Investments December 31, 2022† (continued)
| | Principal
Amount | Value |
| Corporate Bonds (continued) |
| Telecommunications 0.9% |
| AT&T, Inc. | | |
| 2.55%, due 12/1/33 | $ 507,000 | $ 389,635 |
| 3.50%, due 9/15/53 | 217,000 | 146,461 |
| 3.55%, due 9/15/55 | 261,000 | 174,151 |
| Corning, Inc. | | |
| 5.45%, due 11/15/79 | 30,000 | 25,892 |
| Deutsche Telekom International Finance BV | | |
| 8.75%, due 6/15/30 (d) | 275,000 | 324,296 |
| Telefonica Emisiones SA | | |
| 4.895%, due 3/6/48 | 150,000 | 115,280 |
| T-Mobile US, Inc. | | |
| 3.40%, due 10/15/52 | 113,000 | 75,930 |
| 3.875%, due 4/15/30 | 430,000 | 389,500 |
| Verizon Communications, Inc. | | |
| 2.355%, due 3/15/32 | 128,000 | 101,466 |
| 3.00%, due 11/20/60 | 104,000 | 61,924 |
| 5.50%, due 3/16/47 | 470,000 | 453,929 |
| Vodafone Group plc | | |
| 4.25%, due 9/17/50 | 190,000 | 144,889 |
| | | 2,403,353 |
| Transportation 0.7% |
| Burlington Northern Santa Fe LLC | | |
| 3.25%, due 6/15/27 | 751,000 | 709,835 |
| Canadian National Railway Co. | | |
| 6.25%, due 8/1/34 | 275,000 | 299,458 |
| CSX Corp. | | |
| 3.35%, due 9/15/49 | 155,000 | 111,516 |
| FedEx Corp. | | |
| 2.40%, due 5/15/31 | 75,000 | 60,655 |
| 5.25%, due 5/15/50 | 75,000 | 68,287 |
| Norfolk Southern Corp. | | |
| 3.942%, due 11/1/47 | 156,000 | 124,851 |
| Union Pacific Corp. | | |
| 2.80%, due 2/14/32 | 180,000 | 155,392 |
| 3.50%, due 2/14/53 | 75,000 | 56,315 |
| 3.85%, due 2/14/72 | 40,000 | 29,410 |
| United Parcel Service, Inc. | | |
| 3.40%, due 11/15/46 | 505,000 | 390,051 |
| | | 2,005,770 |
Total Corporate Bonds
(Cost $66,304,374) | | 56,272,865 |
| | Principal
Amount | Value |
| Foreign Government Bonds 2.8% |
| Canada 0.7% |
| Province of Ontario Canada | | |
| 2.50%, due 4/27/26 | $ 1,205,000 | $ 1,129,230 |
| Province of Quebec Canada | | |
| 2.50%, due 4/20/26 | 820,000 | 770,731 |
| | | 1,899,961 |
| Japan 0.2% |
| Japan Bank for International Cooperation | | |
| 2.875%, due 6/1/27 | 576,000 | 535,965 |
| Luxembourg 0.2% |
| European Investment Bank | | |
| 2.375%, due 5/24/27 | 545,000 | 506,055 |
| Mexico 1.0% |
| Mexico Government Bond | | |
| 4.125%, due 1/21/26 | 2,585,000 | 2,520,438 |
| 4.875%, due 5/19/33 | 360,000 | 330,459 |
| | | 2,850,897 |
| Norway 0.2% |
| Equinor ASA | | |
| 5.10%, due 8/17/40 | 405,000 | 397,706 |
| Panama 0.3% |
| Panama Government Bond | | |
| 3.75%, due 3/16/25 | 750,000 | 724,801 |
| Philippines 0.2% |
| Philippines Government Bond | | |
| 5.00%, due 1/13/37 | 600,000 | 580,598 |
Total Foreign Government Bonds
(Cost $8,249,678) | | 7,495,983 |
| Mortgage-Backed Securities 2.8% |
| Agency (Collateralized Mortgage Obligations) 2.0% |
| FHLMC, Multifamily Structured Pass-Through Certificates | |
| REMIC, Series K094, Class A2 | | |
| 2.903%, due 6/25/29 | 2,000,000 | 1,822,970 |
| UMBS, Single Family, 30 Year (e) | |
| 2.00%, due 1/25/53 TBA | 2,750,000 | 2,237,016 |
| 4.50%, due 1/25/53 TBA | 1,150,000 | 1,106,595 |
| 5.00%, due 1/25/53 TBA | 500,000 | 492,611 |
| | | 5,659,192 |
The notes to the financial statements are an integral part of, and should be read in conjunction with, the financial statements.
| 14 | MainStay VP Indexed Bond Portfolio |
| | Principal
Amount | Value |
| Mortgage-Backed Securities (continued) |
| Commercial Mortgage Loans (Collateralized Mortgage Obligations) 0.8% |
| CFCRE Commercial Mortgage Trust | |
| Series 2016-C6, Class A3 | | |
| 3.217%, due 11/10/49 (f) | $ 300,000 | $ 274,568 |
| Series 2017-C8, Class A3 | | |
| 3.305%, due 6/15/50 | 163,342 | 149,399 |
| Citigroup Commercial Mortgage Trust | |
| Series 2017-P8, Class A4 | | |
| 3.465%, due 9/15/50 | 300,000 | 276,362 |
| Series 2015-GC35, Class A4 | | |
| 3.818%, due 11/10/48 | 300,000 | 285,577 |
| CSAIL Commercial Mortgage Trust | |
| Series 2017-CX9, Class A5 | | |
| 3.446%, due 9/15/50 | 300,000 | 276,388 |
| GS Mortgage Securities Trust | |
| Series 2016-GS3, Class A4 | | |
| 2.85%, due 10/10/49 | 300,000 | 273,684 |
| Series 2014-GC22, Class A5 | | |
| 3.862%, due 6/10/47 | 300,000 | 290,930 |
| Wells Fargo Commercial Mortgage Trust | |
| Series 2015-SG1, Class A4 | | |
| 3.789%, due 9/15/48 | 291,173 | 277,930 |
| | | 2,104,838 |
Total Mortgage-Backed Securities
(Cost $8,393,531) | | 7,764,030 |
| U.S. Government & Federal Agencies 70.4% |
| Federal Home Loan Mortgage Corporation (Mortgage Pass-Through Securities) 7.5% |
| FFCB | | |
| 0.68%, due 1/13/27 | 1,125,000 | 973,460 |
| 5.30%, due 10/19/26 | 1,500,000 | 1,497,729 |
| 5.95%, due 10/17/30 | 800,000 | 797,428 |
| FHLB | | |
| 5.40%, due 11/1/24 | 1,500,000 | 1,500,000 |
| FHLMC Gold Pools, 15 Year | | |
| 2.50%, due 10/1/31 | 33,731 | 31,574 |
| 2.50%, due 2/1/32 | 150,631 | 140,722 |
| 2.50%, due 2/1/33 | 139,007 | 130,126 |
| 2.50%, due 4/1/33 | 203,967 | 188,912 |
| 2.50%, due 6/1/33 | 28,382 | 26,288 |
| 2.50%, due 7/1/33 | 57,344 | 53,672 |
| 3.00%, due 9/1/27 | 68,344 | 65,989 |
| 3.00%, due 4/1/32 | 89,179 | 84,961 |
| 3.00%, due 6/1/32 | 23,057 | 21,932 |
| 3.00%, due 9/1/32 | 11,220 | 10,690 |
| | Principal
Amount | Value |
| |
| Federal Home Loan Mortgage Corporation (Mortgage Pass-Through Securities) (continued) |
| FHLMC Gold Pools, 15 Year (continued) | | |
| 3.00%, due 10/1/32 | $ 49,748 | $ 47,394 |
| 3.00%, due 5/1/33 | 61,099 | 57,456 |
| 3.00%, due 9/1/33 | 46,264 | 43,508 |
| 3.50%, due 12/1/25 | 12,745 | 12,465 |
| 3.50%, due 5/1/33 | 50,736 | 48,845 |
| 3.50%, due 9/1/33 | 14,878 | 14,323 |
| FHLMC Gold Pools, 20 Year | | |
| 3.00%, due 9/1/36 | 80,044 | 74,339 |
| 3.00%, due 11/1/37 | 41,321 | 38,373 |
| 3.00%, due 12/1/37 | 71,309 | 66,223 |
| 3.50%, due 2/1/37 | 74,772 | 71,557 |
| 3.50%, due 1/1/38 | 73,306 | 70,153 |
| 4.50%, due 5/1/38 | 39,472 | 38,916 |
| 5.50%, due 1/1/29 | 8,462 | 8,493 |
| FHLMC Gold Pools, 30 Year | | |
| 3.00%, due 9/1/46 | 347,218 | 311,225 |
| 3.00%, due 12/1/46 | 23,556 | 21,035 |
| 3.00%, due 2/1/47 | 30,291 | 27,103 |
| 3.00%, due 3/1/47 | 135,940 | 121,592 |
| 3.00%, due 4/1/47 | 38,395 | 34,295 |
| 3.00%, due 1/1/48 | 247,322 | 220,370 |
| 3.00%, due 2/1/48 | 146,248 | 130,214 |
| 3.00%, due 3/1/48 | 132,136 | 117,692 |
| 3.00%, due 4/1/48 | 478,459 | 424,496 |
| 3.00%, due 6/1/48 | 244,073 | 217,215 |
| 3.50%, due 6/1/43 | 105,555 | 98,838 |
| 3.50%, due 9/1/44 | 82,815 | 77,384 |
| 3.50%, due 8/1/45 | 126,225 | 117,475 |
| 3.50%, due 8/1/46 | 169,396 | 158,519 |
| 3.50%, due 8/1/47 | 15,693 | 14,554 |
| 3.50%, due 9/1/47 | 38,699 | 35,437 |
| 3.50%, due 11/1/47 | 86,736 | 80,462 |
| 3.50%, due 12/1/47 | 180,366 | 167,340 |
| 3.50%, due 1/1/48 | 17,617 | 16,260 |
| 3.50%, due 3/1/48 | 253,451 | 235,066 |
| 3.50%, due 5/1/48 | 79,862 | 74,069 |
| 3.50%, due 6/1/48 | 58,239 | 54,015 |
| 3.50%, due 8/1/48 | 122,059 | 113,192 |
| 3.50%, due 9/1/48 | 100,088 | 92,631 |
| 3.50%, due 11/1/48 | 35,903 | 33,199 |
| 3.50%, due 12/1/48 | 98,428 | 91,258 |
| 4.00%, due 4/1/46 | 149,162 | 142,972 |
| 4.00%, due 5/1/46 | 47,052 | 45,110 |
| 4.00%, due 4/1/47 | 35,152 | 33,628 |
| 4.00%, due 6/1/47 | 86,226 | 82,470 |
| 4.00%, due 8/1/47 | 168,797 | 160,085 |
The notes to the financial statements are an integral part of, and should be read in conjunction with, the financial statements.
15
Portfolio of Investments December 31, 2022† (continued)
| | Principal
Amount | Value |
| U.S. Government & Federal Agencies (continued) |
| Federal Home Loan Mortgage Corporation (Mortgage Pass-Through Securities) (continued) |
| FHLMC Gold Pools, 30 Year (continued) | | |
| 4.00%, due 10/1/47 | $ 41,010 | $ 38,893 |
| 4.00%, due 12/1/47 | 108,061 | 103,202 |
| 4.00%, due 1/1/48 | 33,512 | 32,141 |
| 4.00%, due 5/1/48 | 45,959 | 43,986 |
| 4.00%, due 9/1/48 | 168,141 | 160,164 |
| 4.00%, due 12/1/48 | 91,968 | 87,791 |
| 4.50%, due 9/1/46 | 9,323 | 9,169 |
| 4.50%, due 9/1/46 | 28,032 | 27,513 |
| 4.50%, due 10/1/46 | 69,219 | 68,075 |
| 4.50%, due 2/1/47 | 14,435 | 14,194 |
| 4.50%, due 11/1/47 | 18,284 | 17,967 |
| 4.50%, due 2/1/48 | 35,299 | 34,671 |
| 4.50%, due 4/1/48 | 42,100 | 41,337 |
| 4.50%, due 6/1/48 | 23,087 | 22,673 |
| 4.50%, due 7/1/48 | 87,485 | 85,749 |
| 4.50%, due 8/1/48 | 86,040 | 84,281 |
| 5.00%, due 9/1/38 | 34,379 | 35,085 |
| 5.00%, due 11/1/41 | 46,623 | 47,265 |
| 5.00%, due 3/1/47 | 102,602 | 102,769 |
| 5.00%, due 9/1/48 | 146,157 | 145,121 |
| 5.00%, due 1/1/49 | 56,967 | 57,161 |
| 5.50%, due 7/1/38 | 58,175 | 59,795 |
| UMBS Pool, 20 Year | | |
| 2.00%, due 1/1/41 | 2,206,004 | 1,873,232 |
| UMBS Pool, 30 Year | | |
| 2.00%, due 11/1/50 | 2,336,318 | 1,909,979 |
| 2.50%, due 5/1/50 | 2,138,200 | 1,830,437 |
| 2.50%, due 5/1/50 | 1,645,965 | 1,411,686 |
| 2.50%, due 10/1/50 | 1,470,504 | 1,264,432 |
| 4.00%, due 7/1/52 | 1,173,302 | 1,100,964 |
| 4.50%, due 1/1/49 | 113,463 | 111,047 |
| | | 20,485,508 |
| Federal National Mortgage Association (Mortgage Pass-Through Securities) 14.6% |
| UMBS, 10 Year | | |
| 3.00%, due 4/1/25 | 13,442 | 13,157 |
| UMBS, 15 Year | | |
| 1.50%, due 3/1/36 | 1,290,324 | 1,123,844 |
| 1.50%, due 7/1/36 | 1,873,028 | 1,622,637 |
| 2.00%, due 9/1/36 | 2,641,881 | 2,356,739 |
| 2.50%, due 10/1/27 | 81,083 | 76,063 |
| 2.50%, due 4/1/30 | 69,142 | 65,849 |
| 2.50%, due 10/1/31 | 104,764 | 97,966 |
| 2.50%, due 2/1/32 | 120,639 | 112,804 |
| | Principal
Amount | Value |
| |
| Federal National Mortgage Association (Mortgage Pass-Through Securities) (continued) |
| UMBS, 15 Year (continued) | | |
| 2.50%, due 2/1/32 | $ 130,463 | $ 121,985 |
| 2.50%, due 8/1/32 | 357,019 | 333,775 |
| 2.50%, due 3/1/33 | 152,006 | 140,607 |
| 2.50%, due 6/1/33 | 96,751 | 90,464 |
| 3.00%, due 11/1/31 | 82,888 | 79,292 |
| 3.00%, due 1/1/32 | 89,770 | 85,423 |
| 3.00%, due 6/1/32 | 61,609 | 58,631 |
| 3.00%, due 1/1/33 | 103,945 | 98,907 |
| 3.00%, due 2/1/33 | 127,071 | 119,316 |
| 3.00%, due 4/1/33 | 115,075 | 108,094 |
| 3.00%, due 5/1/33 | 165,428 | 157,413 |
| 3.00%, due 9/1/33 | 21,929 | 20,595 |
| 3.50%, due 5/1/26 | 15,420 | 15,038 |
| 3.50%, due 11/1/31 | 19,519 | 19,070 |
| 3.50%, due 5/1/33 | 41,987 | 40,377 |
| 3.50%, due 6/1/33 | 65,195 | 62,696 |
| 3.50%, due 7/1/33 | 31,550 | 30,340 |
| 3.50%, due 9/1/33 | 39,561 | 38,043 |
| 4.00%, due 5/1/24 | 12,945 | 12,638 |
| 4.00%, due 11/1/29 | 48,528 | 47,361 |
| UMBS, 20 Year | | |
| 3.00%, due 2/1/37 | 118,870 | 110,275 |
| 3.00%, due 1/1/38 | 229,796 | 213,180 |
| 4.00%, due 2/1/37 | 19,840 | 19,103 |
| 4.00%, due 8/1/38 | 121,643 | 116,223 |
| 5.00%, due 8/1/31 | 34,061 | 33,866 |
| 5.50%, due 8/1/27 | 28,811 | 28,888 |
| UMBS, 30 Year | | |
| 2.00%, due 8/1/50 | 1,651,560 | 1,350,194 |
| 2.00%, due 8/1/50 | 1,815,860 | 1,490,795 |
| 2.00%, due 9/1/50 | 2,153,720 | 1,762,251 |
| 2.00%, due 2/1/51 | 1,718,382 | 1,403,363 |
| 2.00%, due 3/1/51 | 1,889,096 | 1,558,626 |
| 2.00%, due 3/1/51 (g) | 3,353,988 | 2,739,097 |
| 2.00%, due 5/1/51 | 2,098,254 | 1,712,886 |
| 2.50%, due 4/1/46 | 25,690 | 22,149 |
| 2.50%, due 10/1/46 | 113,517 | 97,868 |
| 2.50%, due 11/1/50 | 1,791,521 | 1,524,090 |
| 2.50%, due 6/1/51 | 3,434,087 | 2,909,304 |
| 2.50%, due 6/1/51 | 2,301,735 | 1,983,036 |
| 2.50%, due 4/1/52 | 941,455 | 815,038 |
| 3.00%, due 9/1/42 | 478,596 | 435,471 |
| 3.00%, due 3/1/43 | 1,397,821 | 1,270,931 |
| 3.00%, due 12/1/43 | 560,916 | 509,462 |
| 3.00%, due 10/1/44 | 365,971 | 333,026 |
| 3.00%, due 10/1/46 | 52,147 | 46,578 |
The notes to the financial statements are an integral part of, and should be read in conjunction with, the financial statements.
| 16 | MainStay VP Indexed Bond Portfolio |
| | Principal
Amount | Value |
| U.S. Government & Federal Agencies (continued) |
| Federal National Mortgage Association (Mortgage Pass-Through Securities) (continued) |
| UMBS, 30 Year (continued) | | |
| 3.00%, due 12/1/46 | $ 608,816 | $ 546,791 |
| 3.00%, due 2/1/47 | 96,728 | 86,429 |
| 3.00%, due 8/1/47 | 506,318 | 453,506 |
| 3.00%, due 11/1/47 | 83,008 | 73,946 |
| 3.00%, due 6/1/48 | 50,475 | 44,818 |
| 3.00%, due 10/1/50 | 1,052,109 | 936,281 |
| 3.00%, due 11/1/52 | 1,747,211 | 1,533,981 |
| 3.50%, due 5/1/45 | 435,457 | 406,044 |
| 3.50%, due 9/1/45 | 29,302 | 27,237 |
| 3.50%, due 12/1/45 | 76,238 | 70,836 |
| 3.50%, due 12/1/45 | 207,574 | 194,309 |
| 3.50%, due 1/1/46 | 145,128 | 135,332 |
| 3.50%, due 1/1/46 | 117,701 | 108,394 |
| 3.50%, due 4/1/46 | 51,824 | 48,125 |
| 3.50%, due 9/1/46 | 261,830 | 243,089 |
| 3.50%, due 10/1/46 | 115,850 | 107,484 |
| 3.50%, due 10/1/46 | 42,517 | 39,424 |
| 3.50%, due 1/1/47 | 89,050 | 82,955 |
| 3.50%, due 7/1/47 | 18,976 | 17,598 |
| 3.50%, due 7/1/47 | 109,868 | 102,732 |
| 3.50%, due 10/1/47 | 66,648 | 61,781 |
| 3.50%, due 11/1/47 | 219,365 | 202,959 |
| 3.50%, due 11/1/47 | 93,042 | 85,867 |
| 3.50%, due 11/1/47 | 253,849 | 234,957 |
| 3.50%, due 12/1/47 | 18,172 | 16,807 |
| 3.50%, due 8/1/48 | 116,653 | 107,754 |
| 3.50%, due 9/1/48 | 146,742 | 135,719 |
| 3.50%, due 2/1/49 | 279,214 | 257,894 |
| 3.50%, due 6/1/49 | 3,220 | 2,962 |
| 3.50%, due 10/1/52 | 644,250 | 585,486 |
| 4.00%, due 8/1/44 | 123,853 | 118,757 |
| 4.00%, due 2/1/45 | 98,467 | 94,317 |
| 4.00%, due 9/1/45 | 19,428 | 18,609 |
| 4.00%, due 5/1/46 | 82,939 | 79,409 |
| 4.00%, due 9/1/46 | 33,869 | 32,441 |
| 4.00%, due 9/1/46 | 40,680 | 38,894 |
| 4.00%, due 2/1/47 | 17,676 | 16,930 |
| 4.00%, due 4/1/47 | 7,046 | 6,731 |
| 4.00%, due 5/1/47 | 52,503 | 50,234 |
| 4.00%, due 5/1/47 | 41,957 | 40,101 |
| 4.00%, due 6/1/47 | 162,916 | 156,218 |
| 4.00%, due 10/1/47 | 17,540 | 16,765 |
| 4.00%, due 11/1/47 | 17,106 | 16,355 |
| 4.00%, due 12/1/47 | 39,630 | 37,688 |
| 4.00%, due 1/1/48 | 95,449 | 91,129 |
| | Principal
Amount | Value |
| |
| Federal National Mortgage Association (Mortgage Pass-Through Securities) (continued) |
| UMBS, 30 Year (continued) | | |
| 4.00%, due 1/1/48 | $ 17,956 | $ 17,129 |
| 4.00%, due 1/1/48 | 103,799 | 98,784 |
| 4.00%, due 2/1/48 | 51,103 | 48,411 |
| 4.00%, due 6/1/48 | 215,975 | 205,930 |
| 4.00%, due 7/1/48 | 122,048 | 116,372 |
| 4.00%, due 7/1/48 | 40,589 | 38,661 |
| 4.00%, due 7/1/48 | 201,018 | 191,548 |
| 4.00%, due 8/1/48 | 31,496 | 29,949 |
| 4.00%, due 9/1/48 | 125,090 | 119,273 |
| 4.00%, due 9/1/48 | 30,455 | 29,018 |
| 4.00%, due 10/1/48 | 21,382 | 20,388 |
| 4.00%, due 11/1/48 | 54,386 | 51,857 |
| 4.00%, due 1/1/49 | 43,927 | 41,816 |
| 4.50%, due 7/1/46 | 18,617 | 18,289 |
| 4.50%, due 12/1/46 | 27,353 | 26,870 |
| 4.50%, due 4/1/47 | 256,620 | 250,568 |
| 4.50%, due 5/1/47 | 6,964 | 6,837 |
| 4.50%, due 7/1/47 | 115,446 | 112,446 |
| 4.50%, due 7/1/47 | 28,804 | 28,287 |
| 4.50%, due 8/1/47 | 2,092 | 2,045 |
| 4.50%, due 2/1/48 | 114,245 | 111,650 |
| 4.50%, due 4/1/48 | 17,142 | 16,795 |
| 4.50%, due 4/1/48 | 9,694 | 9,496 |
| 4.50%, due 4/1/48 | 33,339 | 32,697 |
| 4.50%, due 5/1/48 | 64,682 | 63,371 |
| 4.50%, due 6/1/48 | 39,219 | 38,461 |
| 4.50%, due 8/1/48 | 70,436 | 68,773 |
| 4.50%, due 10/1/48 | 24,352 | 23,851 |
| 4.50%, due 9/1/49 | 326,426 | 318,833 |
| 5.00%, due 6/1/39 | 81,498 | 83,162 |
| 5.00%, due 6/1/40 | 19,180 | 19,422 |
| 5.00%, due 7/1/47 | 35,976 | 35,915 |
| 5.00%, due 1/1/48 | 55,601 | 55,593 |
| 5.00%, due 4/1/48 | 27,389 | 27,417 |
| 5.00%, due 5/1/48 | 39,355 | 39,218 |
| 5.00%, due 9/1/48 | 29,341 | 29,445 |
| 5.50%, due 6/1/36 | 26,362 | 27,137 |
| 5.50%, due 5/1/44 | 54,329 | 56,136 |
| 5.50%, due 9/1/48 | 78,852 | 79,897 |
| | | 39,992,646 |
| Government National Mortgage Association (Mortgage Pass-Through Securities) 5.7% |
| GNMA I, Single Family, 30 Year | | |
| 3.00%, due 6/15/45 | 13,964 | 12,731 |
| 3.00%, due 10/15/45 | 8,595 | 7,867 |
The notes to the financial statements are an integral part of, and should be read in conjunction with, the financial statements.
17
Portfolio of Investments December 31, 2022† (continued)
| | Principal
Amount | Value |
| U.S. Government & Federal Agencies (continued) |
| Government National Mortgage Association (Mortgage Pass-Through Securities) (continued) |
GNMA I, Single Family, 30 Year
(continued) | | |
| 3.00%, due 5/15/48 | $ 60,726 | $ 54,175 |
| 3.50%, due 3/15/45 | 6,708 | 6,308 |
| 3.50%, due 4/15/45 | 14,486 | 13,623 |
| 3.50%, due 5/15/48 | 26,371 | 24,252 |
| 4.00%, due 8/15/46 | 27,731 | 26,854 |
| 4.00%, due 11/15/47 | 55,621 | 53,097 |
| 4.00%, due 7/15/49 | 58,395 | 55,664 |
| 4.50%, due 8/15/46 | 49,756 | 49,206 |
| 4.50%, due 2/15/47 | 2,872 | 2,831 |
| 4.50%, due 4/15/47 | 22,493 | 22,417 |
| 4.50%, due 8/15/47 | 90,644 | 90,619 |
| 4.50%, due 8/15/47 | 124,965 | 124,486 |
| 5.00%, due 4/15/47 | 21,279 | 21,473 |
| 5.00%, due 12/15/47 | 18,694 | 18,698 |
| GNMA II, Single Family, 30 Year | | |
| 2.00%, due 6/20/51 | 4,935,078 | 4,153,836 |
| 2.50%, due 4/20/47 | 27,737 | 24,449 |
| 2.50%, due 5/20/51 | 5,053,676 | 4,393,804 |
| 3.00%, due 11/20/45 | 270,587 | 246,163 |
| 3.00%, due 8/20/46 | 90,347 | 81,683 |
| 3.00%, due 9/20/46 | 48,321 | 43,737 |
| 3.00%, due 10/20/46 | 303,498 | 274,526 |
| 3.00%, due 1/20/47 | 352,247 | 316,876 |
| 3.00%, due 5/20/47 | 61,855 | 55,768 |
| 3.00%, due 12/20/47 | 183,316 | 165,073 |
| 3.00%, due 2/20/48 | 201,497 | 181,457 |
| 3.00%, due 3/20/48 | 237,816 | 214,174 |
| 3.00%, due 9/20/51 | 1,470,994 | 1,316,017 |
| 3.50%, due 11/20/42 | 109,625 | 101,452 |
| 3.50%, due 9/20/44 | 151,449 | 141,564 |
| 3.50%, due 11/20/45 | 168,714 | 157,008 |
| 3.50%, due 7/20/46 | 17,431 | 16,257 |
| 3.50%, due 10/20/46 | 18,557 | 17,306 |
| 3.50%, due 11/20/46 | 226,595 | 210,895 |
| 3.50%, due 1/20/47 | 255,895 | 238,941 |
| 3.50%, due 5/20/47 | 185,745 | 173,734 |
| 3.50%, due 9/20/47 | 184,448 | 172,704 |
| 3.50%, due 10/20/47 | 331,773 | 309,192 |
| 3.50%, due 12/20/47 | 164,652 | 153,555 |
| 3.50%, due 7/20/48 | 90,044 | 83,859 |
| 3.50%, due 10/20/48 | 93,925 | 87,519 |
| 4.00%, due 12/20/46 | 15,599 | 14,996 |
| 4.00%, due 1/20/47 | 117,413 | 112,781 |
| 4.00%, due 2/20/47 | 28,257 | 27,100 |
| | Principal
Amount | Value |
| |
| Government National Mortgage Association (Mortgage Pass-Through Securities) (continued) |
GNMA II, Single Family, 30 Year
(continued) | | |
| 4.00%, due 3/20/47 | $ 20,904 | $ 20,064 |
| 4.00%, due 4/20/47 | 44,802 | 42,989 |
| 4.00%, due 5/20/47 | 37,759 | 36,250 |
| 4.00%, due 7/20/47 | 14,874 | 14,280 |
| 4.00%, due 11/20/47 | 184,625 | 177,258 |
| 4.00%, due 12/20/47 | 40,444 | 38,831 |
| 4.00%, due 4/20/48 | 137,552 | 132,031 |
| 4.00%, due 5/20/48 | 61,431 | 58,873 |
| 4.00%, due 6/20/48 | 25,568 | 24,420 |
| 4.00%, due 8/20/48 | 173,499 | 166,268 |
| 4.00%, due 9/20/48 | 93,038 | 88,791 |
| 4.00%, due 3/20/49 | 23,579 | 22,537 |
| 4.50%, due 8/20/46 | 53,676 | 53,968 |
| 4.50%, due 4/20/47 | 42,591 | 42,193 |
| 4.50%, due 11/20/47 | 39,171 | 38,578 |
| 4.50%, due 1/20/48 | 91,387 | 89,974 |
| 4.50%, due 3/20/48 | 38,463 | 37,875 |
| 4.50%, due 5/20/48 | 31,568 | 31,060 |
| 4.50%, due 6/20/48 | 51,583 | 50,723 |
| 4.50%, due 8/20/48 | 101,445 | 99,665 |
| 5.00%, due 8/20/45 | 67,005 | 68,078 |
| 5.00%, due 11/20/46 | 42,807 | 43,537 |
| 5.00%, due 11/20/47 | 39,039 | 39,306 |
| 5.00%, due 3/20/48 | 22,765 | 22,979 |
| 5.00%, due 6/20/48 | 47,886 | 47,782 |
| | | 15,559,037 |
| United States Treasury Bonds 4.0% |
| U.S. Treasury Bonds | | |
| 1.875%, due 11/15/51 | 460,000 | 291,345 |
| 2.75%, due 8/15/47 | 235,000 | 183,346 |
| 2.75%, due 11/15/47 | 300,000 | 234,012 |
| 2.875%, due 11/15/46 | 140,000 | 112,181 |
| 2.875%, due 5/15/49 | 250,000 | 201,162 |
| 3.00%, due 2/15/47 | 815,000 | 667,122 |
| 3.00%, due 5/15/47 | 575,000 | 470,377 |
| 3.00%, due 2/15/48 | 1,950,000 | 1,598,314 |
| 3.00%, due 8/15/48 | 715,000 | 587,138 |
| 3.00%, due 2/15/49 | 845,000 | 695,871 |
| 3.00%, due 8/15/52 | 1,130,000 | 931,014 |
| 3.125%, due 5/15/48 | 1,525,000 | 1,281,655 |
| 3.375%, due 11/15/48 | 550,000 | 485,160 |
| 4.00%, due 11/15/52 | 3,075,000 | 3,079,324 |
| | | 10,818,021 |
The notes to the financial statements are an integral part of, and should be read in conjunction with, the financial statements.
| 18 | MainStay VP Indexed Bond Portfolio |
| | Principal
Amount | Value |
| U.S. Government & Federal Agencies (continued) |
| United States Treasury Notes 38.6% |
| U.S. Treasury Notes | | |
| 0.125%, due 8/31/23 | $ 3,500,000 | $ 3,394,316 |
| 0.125%, due 9/15/23 | 750,000 | 726,475 |
| 0.125%, due 10/15/23 | 6,250,000 | 6,029,541 |
| 0.125%, due 1/15/24 | 700,000 | 667,440 |
| 0.125%, due 2/15/24 | 400,000 | 380,047 |
| 0.25%, due 11/15/23 | 3,000,000 | 2,884,688 |
| 0.25%, due 3/15/24 | 1,400,000 | 1,327,211 |
| 0.25%, due 5/15/24 | 1,300,000 | 1,223,574 |
| 0.25%, due 6/15/24 | 300,000 | 281,555 |
| 0.25%, due 5/31/25 | 1,850,000 | 1,679,453 |
| 0.25%, due 6/30/25 | 200,000 | 181,180 |
| 0.25%, due 8/31/25 | 150,000 | 134,883 |
| 0.375%, due 10/31/23 | 1,500,000 | 1,446,504 |
| 0.375%, due 4/15/24 | 1,000,000 | 946,250 |
| 0.375%, due 7/15/24 | 400,000 | 374,703 |
| 0.375%, due 8/15/24 | 1,250,000 | 1,167,773 |
| 0.375%, due 7/31/27 | 975,000 | 827,150 |
| 0.50%, due 11/30/23 | 500,000 | 481,055 |
| 0.50%, due 8/31/27 | 800,000 | 680,844 |
| 0.625%, due 12/31/27 | 450,000 | 381,217 |
| 0.875%, due 1/31/24 | 1,825,000 | 1,751,073 |
| 1.00%, due 7/31/28 | 525,000 | 446,271 |
| 1.125%, due 2/29/28 | 400,000 | 346,328 |
| 1.125%, due 8/31/28 | 1,330,000 | 1,135,591 |
| 1.25%, due 3/31/28 | 200,000 | 173,828 |
| 1.25%, due 4/30/28 | 475,000 | 412,155 |
| 1.25%, due 5/31/28 | 3,900,000 | 3,376,547 |
| 1.25%, due 6/30/28 | 1,200,000 | 1,037,578 |
| 1.25%, due 9/30/28 | 485,000 | 416,532 |
| 1.50%, due 2/29/24 | 1,650,000 | 1,590,445 |
| 1.50%, due 1/31/27 | 325,000 | 293,427 |
| 1.75%, due 6/30/24 | 2,875,000 | 2,755,059 |
| 1.75%, due 7/31/24 | 2,100,000 | 2,008,699 |
| 1.875%, due 8/31/24 | 650,000 | 621,715 |
| 1.875%, due 2/28/27 | 475,000 | 435,033 |
| 1.875%, due 2/28/29 | 1,710,000 | 1,514,352 |
| 2.00%, due 4/30/24 | 4,035,000 | 3,893,145 |
| 2.00%, due 5/31/24 | 1,400,000 | 1,348,867 |
| 2.125%, due 7/31/24 | 150,000 | 144,275 |
| 2.25%, due 3/31/24 | 1,000,000 | 970,234 |
| 2.375%, due 3/31/29 | 1,550,000 | 1,409,410 |
| 2.375%, due 5/15/29 | 825,000 | 749,977 |
| 2.50%, due 3/31/23 | 100,000 | 99,531 |
| 2.50%, due 4/30/24 | 300,000 | 291,469 |
| 2.50%, due 5/31/24 | 200,000 | 194,039 |
| 2.50%, due 3/31/27 | 300,000 | 281,520 |
| | Principal
Amount | Value |
| |
| United States Treasury Notes (continued) |
| U.S. Treasury Notes (continued) | | |
| 2.625%, due 12/31/23 | $ 150,000 | $ 146,920 |
| 2.625%, due 4/15/25 | 500,000 | 481,211 |
| 2.625%, due 5/31/27 | 1,350,000 | 1,272,533 |
| 2.625%, due 7/31/29 | 700,000 | 644,574 |
| 2.75%, due 7/31/23 | 275,000 | 272,014 |
| 2.75%, due 5/15/25 | 500,000 | 482,148 |
| 2.75%, due 6/30/25 | 275,000 | 264,924 |
| 2.75%, due 7/31/27 | 775,000 | 733,253 |
| 2.75%, due 5/31/29 | 675,000 | 627,117 |
| 2.875%, due 9/30/23 | 2,875,000 | 2,839,287 |
| 2.875%, due 10/31/23 | 2,300,000 | 2,265,590 |
| 2.875%, due 11/30/23 | 600,000 | 590,203 |
| 2.875%, due 5/31/25 | 300,000 | 290,027 |
| 2.875%, due 6/15/25 | 750,000 | 724,893 |
| 2.875%, due 4/30/29 | 400,000 | 374,625 |
| 3.00%, due 7/31/24 | 1,500,000 | 1,463,086 |
| 3.125%, due 8/15/25 | 3,175,000 | 3,082,479 |
| 3.125%, due 8/31/29 | 1,915,000 | 1,817,978 |
| 3.25%, due 8/31/24 | 1,600,000 | 1,566,625 |
| 3.25%, due 6/30/27 | 1,000,000 | 966,914 |
| 3.25%, due 6/30/29 | 1,275,000 | 1,220,115 |
| 3.50%, due 9/15/25 | 1,575,000 | 1,543,500 |
| 3.875%, due 11/30/27 | 75,000 | 74,590 |
| 3.875%, due 9/30/29 | 2,325,000 | 2,308,562 |
| 3.875%, due 11/30/29 | 3,425,000 | 3,401,988 |
| 3.875%, due 12/31/29 | 900,000 | 895,500 |
| 4.00%, due 12/15/25 | 3,000,000 | 2,980,781 |
| 4.00%, due 10/31/29 | 1,520,000 | 1,520,475 |
| 4.125%, due 10/31/27 | 960,000 | 963,525 |
| 4.125%, due 11/15/32 | 2,290,000 | 2,336,873 |
| 4.25%, due 9/30/24 | 3,125,000 | 3,109,009 |
| 4.25%, due 10/15/25 | 5,300,000 | 5,295,859 |
| 4.375%, due 10/31/24 | 1,200,000 | 1,196,578 |
| 4.50%, due 11/30/24 | 2,000,000 | 2,000,078 |
| 4.50%, due 11/15/25 | 3,000,000 | 3,018,047 |
| | | 105,684,840 |
Total U.S. Government & Federal Agencies
(Cost $204,737,421) | | 192,540,052 |
Total Long-Term Bonds
(Cost $287,685,004) | | 264,072,930 |
| |
The notes to the financial statements are an integral part of, and should be read in conjunction with, the financial statements.
19
Portfolio of Investments December 31, 2022† (continued)
| | Shares | | Value |
| Exchange-Traded Fund 2.3% |
| iShares iBoxx $ Investment Grade Corporate Bond ETF | 59,881 | | $ 6,313,254 |
Total Exchange-Traded Fund
(Cost $6,032,777) | | | 6,313,254 |
Total Investments
(Cost $293,717,781) | 98.9% | | 270,386,184 |
| Other Assets, Less Liabilities | 1.1 | | 3,028,718 |
| Net Assets | 100.0% | | $ 273,414,902 |
| † | Percentages indicated are based on Portfolio net assets. |
| ‡ | Less than one-tenth of a percent. |
| (a) | Fixed to floating rate—Rate shown was the rate in effect as of December 31, 2022. |
| (b) | Floating rate—Rate shown was the rate in effect as of December 31, 2022. |
| (c) | May be sold to institutional investors only under Rule 144A or securities offered pursuant to Section 4(a)(2) of the Securities Act of 1933, as amended. |
| (d) | Step coupon—Rate shown was the rate in effect as of December 31, 2022. |
| (e) | TBA—Security purchased on a forward commitment basis with an approximate principal amount and maturity date. The actual principal amount and maturity date will be determined upon settlement. As of December 31, 2022, the total net market value was $3,836,222, which represented 1.4% of the Portfolio’s net assets. All or a portion of this security is a part of a mortgage dollar roll agreement. |
| (f) | Coupon rate may change based on changes of the underlying collateral or prepayments of principal. Rate shown was the rate in effect as of December 31, 2022. |
| (g) | Delayed delivery security. |
Futures Contracts
As of December 31, 2022, the Portfolio held the following futures contracts1:
| Type | Number of
Contracts | Expiration
Date | Value at
Trade Date | Current
Notional
Amount | Unrealized
Appreciation
(Depreciation)2 |
| Long Contracts | | | | | |
| U.S. Treasury 5 Year Notes | 42 | March 2023 | $ 4,540,905 | $ 4,533,047 | $ (7,858) |
| U.S. Treasury 10 Year Notes | 48 | March 2023 | 5,417,018 | 5,390,250 | (26,768) |
| U.S. Treasury 10 Year Ultra Bonds | 27 | March 2023 | 3,215,350 | 3,193,594 | (21,756) |
| U.S. Treasury Long Bonds | 106 | March 2023 | 13,405,880 | 13,286,437 | (119,443) |
| U.S. Treasury Ultra Bonds | 2 | March 2023 | 276,504 | 268,625 | (7,879) |
| Total Long Contracts | | | | | (183,704) |
The notes to the financial statements are an integral part of, and should be read in conjunction with, the financial statements.
| 20 | MainStay VP Indexed Bond Portfolio |
| Type | Number of
Contracts | Expiration
Date | Value at
Trade Date | Current
Notional
Amount | Unrealized
Appreciation
(Depreciation)2 |
| Short Contracts | | | | | |
| U.S. Treasury 2 Year Notes | (39) | March 2023 | $ (7,989,148) | $ (7,998,047) | $ (8,899) |
| Net Unrealized Depreciation | | | | | $ (192,603) |
| 1. | As of December 31, 2022, cash in the amount of $711,524 was on deposit with a broker or futures commission merchant for futures transactions. |
| 2. | Represents the difference between the value of the contracts at the time they were opened and the value as of December 31, 2022. |
| Abbreviation(s): |
| ETF—Exchange-Traded Fund |
| FFCB—Federal Farm Credit Bank |
| FHLB—Federal Home Loan Bank |
| FHLMC—Federal Home Loan Mortgage Corp. |
| GNMA—Government National Mortgage Association |
| REMIC—Real Estate Mortgage Investment Conduit |
| TBA—To Be Announced |
| UMBS—Uniform Mortgage Backed Securities |
The following is a summary of the fair valuations according to the inputs used as of December 31, 2022, for valuing the Portfolio’s assets and liabilities:
| Description | Quoted
Prices in
Active
Markets for
Identical
Assets
(Level 1) | | Significant
Other
Observable
Inputs
(Level 2) | | Significant
Unobservable
Inputs
(Level 3) | | Total |
| Asset Valuation Inputs | | | | | | | |
| Investments in Securities (a) | | | | | | | |
| Long-Term Bonds | | | | | | | |
| Corporate Bonds | $ — | | $ 56,272,865 | | $ — | | $ 56,272,865 |
| Foreign Government Bonds | — | | 7,495,983 | | — | | 7,495,983 |
| Mortgage-Backed Securities | — | | 7,764,030 | | — | | 7,764,030 |
| U.S. Government & Federal Agencies | — | | 192,540,052 | | — | | 192,540,052 |
| Total Long-Term Bonds | — | | 264,072,930 | | — | | 264,072,930 |
| Exchange-Traded Fund | 6,313,254 | | — | | — | | 6,313,254 |
| Total Investments in Securities | $ 6,313,254 | | $ 264,072,930 | | $ — | | $ 270,386,184 |
| Liability Valuation Inputs | | | | | | | |
| Other Financial Instruments | | | | | | | |
| Futures Contracts (b) | $ (192,603) | | $ — | | $ — | | $ (192,603) |
| (a) | For a complete listing of investments and their industries, see the Portfolio of Investments. |
| (b) | The value listed for these securities reflects unrealized appreciation (depreciation) as shown on the Portfolio of Investments. |
The notes to the financial statements are an integral part of, and should be read in conjunction with, the financial statements.
21
Statement of Assets and Liabilities as of December 31, 2022
| Assets |
Investment in securities, at value
(identified cost $293,717,781) | $270,386,184 |
| Cash | 7,671,875 |
| Cash collateral on deposit at broker for futures contracts | 711,524 |
| Receivables: | |
| Investment securities sold | 4,945,910 |
| Interest | 1,622,282 |
| Other assets | 36,483 |
| Total assets | 285,374,258 |
| Liabilities |
| Payables: | |
| Investment securities purchased | 11,739,228 |
| Shareholder communication | 62,132 |
| Manager (See Note 3) | 59,854 |
| Professional fees | 38,488 |
| Variation margin on futures contracts | 21,564 |
| Custodian | 9,870 |
| Trustees | 276 |
| Accrued expenses | 27,944 |
| Total liabilities | 11,959,356 |
| Net assets | $273,414,902 |
| Composition of Net Assets |
| Shares of beneficial interest outstanding (par value of $.001 per share) unlimited number of shares authorized | $ 32,125 |
| Additional paid-in-capital | 311,678,955 |
| | 311,711,080 |
| Total distributable earnings (loss) | (38,296,178) |
| Net assets | $273,414,902 |
| Initial Class | |
| Net assets applicable to outstanding shares | $273,414,902 |
| Shares of beneficial interest outstanding | 32,124,729 |
| Net asset value per share outstanding | $ 8.51 |
The notes to the financial statements are an integral part of, and should be read in conjunction with, the financial statements.
| 22 | MainStay VP Indexed Bond Portfolio |
Statement of Operations for the year ended December 31, 2022
| Investment Income (Loss) |
| Income | |
| Interest | $ 6,705,911 |
| Dividends | 87,704 |
| Other | 131,535 |
| Total income | 6,925,150 |
| Expenses | |
| Manager (See Note 3) | 726,282 |
| Professional fees | 72,561 |
| Custodian | 64,028 |
| Shareholder communication | 38,439 |
| Trustees | 3,914 |
| Miscellaneous | 22,276 |
| Total expenses | 927,500 |
| Net investment income (loss) | 5,997,650 |
| Realized and Unrealized Gain (Loss) |
| Net realized gain (loss) on: | |
| Unaffiliated investment transactions | (12,271,129) |
| Futures transactions | (5,760,427) |
| Net realized gain (loss) | (18,031,556) |
| Net change in unrealized appreciation (depreciation) on: | |
| Unaffiliated investments | (30,703,444) |
| Futures contracts | (373,793) |
| Net change in unrealized appreciation (depreciation) | (31,077,237) |
| Net realized and unrealized gain (loss) | (49,108,793) |
| Net increase (decrease) in net assets resulting from operations | $(43,111,143) |
The notes to the financial statements are an integral part of, and should be read in conjunction with, the financial statements.
23
Statements of Changes in Net Assets
for the years ended December 31, 2022 and December 31, 2021
| | 2022 | 2021 |
| Increase (Decrease) in Net Assets |
| Operations: | | |
| Net investment income (loss) | $ 5,997,650 | $ 6,750,436 |
| Net realized gain (loss) | (18,031,556) | 4,013,523 |
| Net change in unrealized appreciation (depreciation) | (31,077,237) | (25,022,938) |
| Net increase (decrease) in net assets resulting from operations | (43,111,143) | (14,258,979) |
| Distributions to shareholders: | | |
| Initial Class | (11,493,602) | (30,024,681) |
| Capital share transactions: | | |
| Net proceeds from sales of shares | 66,908,730 | 12,804,844 |
| Net asset value of shares issued to shareholders in reinvestment of distributions | 11,493,602 | 30,024,681 |
| Cost of shares redeemed | (180,601,111) | (325,959,338) |
| Increase (decrease) in net assets derived from capital share transactions | (102,198,779) | (283,129,813) |
| Net increase (decrease) in net assets | (156,803,524) | (327,413,473) |
| Net Assets |
| Beginning of year | 430,218,426 | 757,631,899 |
| End of year | $ 273,414,902 | $ 430,218,426 |
The notes to the financial statements are an integral part of, and should be read in conjunction with, the financial statements.
| 24 | MainStay VP Indexed Bond Portfolio |
Financial Highlights selected per share data and ratios
| | Year Ended December 31, |
| Initial Class | 2022 | | 2021 | | 2020 | | 2019 | | 2018 |
| Net asset value at beginning of year | $ 10.30 | | $ 11.25 | | $ 10.62 | | $ 9.80 | | $ 10.04 |
| Net investment income (loss) (a) | 0.19 | | 0.14 | | 0.18 | | 0.27 | | 0.26 |
| Net realized and unrealized gain (loss) | (1.58) | | (0.36) | | 0.60 | | 0.55 | | (0.33) |
| Total from investment operations | (1.39) | | (0.22) | | 0.78 | | 0.82 | | (0.07) |
| Less distributions: | | | | | | | | | |
| From net investment income | (0.28) | | (0.31) | | (0.13) | | — | | (0.17) |
| From net realized gain on investments | (0.12) | | (0.42) | | (0.02) | | — | | — |
| Total distributions | (0.40) | | (0.73) | | (0.15) | | — | | (0.17) |
| Net asset value at end of year | $ 8.51 | | $ 10.30 | | $ 11.25 | | $ 10.62 | | $ 9.80 |
| Total investment return (b) | (13.34)% | | (1.95)% | | 7.40% | | 8.37%(c) | | (0.67)% |
| Ratios (to average net assets)/Supplemental Data: | | | | | | | | | |
| Net investment income (loss) | 2.06% | | 1.26% | | 1.59% | | 2.66% | | 2.67% |
| Net expenses (d) | 0.32% | | 0.30% | | 0.29% | | 0.30% | | 0.31% |
| Portfolio turnover rate (e) | 182% | | 239% | | 191% | | 65% | | 143% |
| Net assets at end of year (in 000's) | $ 273,415 | | $ 430,218 | | $ 757,632 | | $ 422,163 | | $ 362,545 |
| (a) | Per share data based on average shares outstanding during the year. |
| (b) | Total return does not reflect any deduction of sales charges, mortality and expense charges, contract charges or administrative charges. For periods of less than one year, total return is not annualized. |
| (c) | Total investment return may reflect adjustments to conform to generally accepted accounting principles. |
| (d) | In addition to the fees and expenses which the Portfolio bears directly, it also indirectly bears a pro-rata share of the fees and expenses of the underlying funds in which it invests. Such indirect expenses are not included in the above expense ratios. |
| (e) | The portfolio turnover rate not including mortgage dollar rolls were 146%, 55%, 138%, 57% and 104% for the years ended December 31, 2022, 2021, 2020, 2019 and 2018, respectively. |
The notes to the financial statements are an integral part of, and should be read in conjunction with, the financial statements.
25
Notes to Financial Statements
Note 1–Organization and Business
MainStay VP Funds Trust (the “Fund”) was organized as a Delaware statutory trust on February 1, 2011. The Fund is registered under the Investment Company Act of 1940, as amended (the “1940 Act”), as an open-end management investment company. The Fund is comprised of thirty-one separate series (collectively referred to as the “Portfolios”). These financial statements and notes relate to the MainStay VP Indexed Bond Portfolio (the "Portfolio"), a "diversified” portfolio, as that term is defined in the 1940 Act, as interpreted or modified by regulatory authorities having jurisdiction, from time to time.
Shares of the Portfolio are currently offered to certain separate accounts to fund variable annuity policies and variable universal life insurance policies issued by New York Life Insurance and Annuity Corporation (“NYLIAC”), a wholly-owned subsidiary of New York Life Insurance Company (“New York Life”) and may also be offered to fund variable annuity policies and variable universal life insurance policies issued by other insurance companies. NYLIAC allocates shares of the Portfolio to, among others, certain NYLIAC separate accounts. Shares of the Portfolio are also offered to the MainStay VP Conservative Allocation Portfolio, MainStay VP Moderate Allocation Portfolio, MainStay VP Growth Allocation Portfolio and MainStay VP Equity Allocation Portfolio, which operate as “funds-of-funds," and other variable insurance funds.
The following table lists the Portfolio's share class that has been registered and commenced operations:
| Class | Commenced Operations |
| Initial Class | May 1, 2017 |
Shares of the Portfolio are offered and are redeemed at a price equal to their respective net asset value (“NAV”) per share. No sales or redemption charge is applicable to the purchase or redemption of the Portfolio's shares.
The Portfolio's investment objective is to seek investment results that correspond to the total return performance of fixed-income securities in the aggregate, as represented by the Portfolio's primary benchmark index.
Note 2–Significant Accounting Policies
The Portfolio is an investment company and accordingly follows the investment company accounting and reporting guidance of the Financial Accounting Standards Board (“FASB”) Accounting Standards Codification Topic 946 Financial Services—Investment Companies. The Portfolio prepares its financial statements in accordance with generally accepted accounting principles (“GAAP”) in the United States of America and follows the significant accounting policies described below.
(A) Securities Valuation. Investments are usually valued as of the close of regular trading on the New York Stock Exchange (the "Exchange") (usually 4:00 p.m. Eastern time) on each day the Portfolio is open for business ("valuation date").
Effective September 8, 2022, and pursuant to Rule 2a-5 under the 1940 Act, the Board of Trustees of the Fund (the "Board") designated New York Life Investment Management LLC (“New York Life Investments” or the "Manager") as its Valuation Designee (the "Valuation Designee"). The Valuation Designee is responsible for performing fair valuations relating to all investments in the Portfolio’s portfolio for which market quotations are not readily available; periodically assessing and managing material valuation risks; establishing and applying fair value methodologies; testing fair valuation methodologies; evaluating and overseeing pricing services; ensuring appropriate segregation of valuation and portfolio management functions; providing quarterly, annual and prompt reporting to the Board, as appropriate; identifying potential conflicts of interest; and maintaining appropriate records. The Valuation Designee has established a valuation committee ("Valuation Committee") to assist in carrying out the Valuation Designee’s responsibilities and establish prices of securities for which market quotations are not readily available. The Portfolio’s and the Valuation Designee's policies and procedures ("Valuation Procedures") govern the Valuation Designee’s selection and application of methodologies for determining and calculating the fair value of Portfolio investments. The Valuation Designee may value the Portfolio's portfolio securities for which market quotations are not readily available and other Portfolio assets utilizing inputs from pricing services and other third-party sources (together, “Pricing Sources”). The Valuation Committee meets (in person, via electronic mail or via teleconference) on an ad-hoc basis to determine fair valuations and on a quarterly basis to review fair value events with respect to certain securities for which market quotations are not readily available, including valuation risks and back-testing results, and preview reports to the Board.
The Valuation Committee establishes prices of securities for which market quotations are not readily available based on such methodologies and measurements on a regular basis after considering information that is reasonably available and deemed relevant by the Valuation Committee. The Board shall oversee the Valuation Designee and review fair valuation materials on a prompt, quarterly and annual basis and approve proposed revisions to the Valuation Procedures.
Investments for which market quotations are not readily available are valued at fair value as determined in good faith pursuant to the Valuation Procedures. A market quotation is readily available only when that quotation is a quoted price (unadjusted) in active markets for identical investments that the Portfolio can access at the measurement date, provided that a quotation will not be readily available if it is not reliable. "Fair value" is defined as the price the Portfolio would reasonably expect to receive upon selling an asset or liability in an orderly transaction to an independent buyer in the principal or most advantageous market for the asset or liability. Fair value measurements are determined within a framework that establishes a three-tier hierarchy that maximizes the use of observable market data and minimizes the use of unobservable inputs to establish a classification of fair value measurements for disclosure purposes. "Inputs" refer broadly to the assumptions that market participants would use in pricing the asset or liability, including assumptions about risk, such as the risk inherent in a particular valuation
| 26 | MainStay VP Indexed Bond Portfolio |
technique used to measure fair value using a pricing model and/or the risk inherent in the inputs for the valuation technique. Inputs may be observable or unobservable. Observable inputs reflect the assumptions market participants would use in pricing the asset or liability based on market data obtained from sources independent of the Portfolio. Unobservable inputs reflect the Portfolio’s own assumptions about the assumptions market participants would use in pricing the asset or liability based on the information available. The inputs or methodology used for valuing assets or liabilities may not be an indication of the risks associated with investing in those assets or liabilities. The three-tier hierarchy of inputs is summarized below.
| • | Level 1—quoted prices (unadjusted) in active markets for an identical asset or liability |
| • | Level 2—other significant observable inputs (including quoted prices for a similar asset or liability in active markets, interest rates and yield curves, prepayment speeds, credit risk, etc.) |
| • | Level 3—significant unobservable inputs (including the Portfolio's own assumptions about the assumptions that market participants would use in measuring fair value of an asset or liability) |
The level of an asset or liability within the fair value hierarchy is based on the lowest level of an input, both individually and in the aggregate, that is significant to the fair value measurement. The aggregate value by input level of the Portfolio’s assets and liabilities as of December 31, 2022, is included at the end of the Portfolio of Investments.
The Portfolio may use third-party vendor evaluations, whose prices may be derived from one or more of the following standard inputs, among others:
| • Benchmark yields | • Reported trades |
| • Broker/dealer quotes | • Issuer spreads |
| • Two-sided markets | • Benchmark securities |
| • Bids/offers | • Reference data (corporate actions or material event notices) |
| • Industry and economic events | • Comparable bonds |
| • Monthly payment information | |
An asset or liability for which a market quotation is not readily available is valued by methods deemed reasonable in good faith by the Valuation Committee, following the Valuation Procedures to represent fair value. Under these procedures, the Valuation Designee generally uses a market-based approach which may use related or comparable assets or liabilities, recent transactions, market multiples, book values and other relevant information. The Valuation Designee may also use an income-based valuation approach in which the anticipated future cash flows of the asset or liability are discounted to calculate fair value. Discounts may also be applied due to the nature and/or duration of any restrictions on the disposition of the asset or liability. Fair value represents a good faith approximation of the value of a security. Fair value determinations involve the consideration of a number of subjective factors, an analysis of applicable facts and circumstances and the
exercise of judgment. As a result, it is possible that the fair value for a security determined in good faith in accordance with the Valuation Procedures may differ from valuations for the same security determined for other funds using their own valuation procedures. Although the Valuation Procedures are designed to value a security at the price the Portfolio may reasonably expect to receive upon the security's sale in an orderly transaction, there can be no assurance that any fair value determination thereunder would, in fact, approximate the amount that the Portfolio would actually realize upon the sale of the security or the price at which the security would trade if a reliable market price were readily available. During the year ended December 31, 2022, there were no material changes to the fair value methodologies.
Securities which may be valued in this manner include, but are not limited to: (i) a security for which trading has been halted or suspended or otherwise does not have a readily available market quotation on a given day; (ii) a debt security that has recently gone into default and for which there is not a current market quotation; (iii) a security of an issuer that has entered into a restructuring; (iv) a security that has been delisted from a national exchange; (v) a security subject to trading collars for which no or limited trading takes place; and (vi) a security whose principal market has been temporarily closed at a time when, under normal conditions, it would be open. Securities valued in this manner are generally categorized as Level 2 or 3 in the hierarchy.
Exchange-traded funds (“ETFs”) are valued at the last quoted sales prices as of the close of regular trading on the relevant exchange on each valuation date. Securities that are not traded on the valuation date are valued at the mean of the last quoted bid and ask prices. Prices are normally taken from the principal market in which each security trades. These securities are generally categorized as Level 1 in the hierarchy.
Futures contracts are valued at the last posted settlement price on the market where such futures are primarily traded. These securities are generally categorized as Level 1 in the hierarchy.
Debt securities (other than convertible and municipal bonds) are valued at the evaluated bid prices (evaluated mean prices in the case of convertible and municipal bonds) supplied by a pricing agent or broker selected by the Valuation Designee, in consultation with the Subadvisor. The evaluations are market-based measurements processed through a pricing application and represents the pricing agent’s good faith determination as to what a holder may receive in an orderly transaction under market conditions. The rules-based logic utilizes valuation techniques that reflect participants’ assumptions and vary by asset class and per methodology, maximizing the use of relevant observable data including quoted prices for similar assets, benchmark yield curves and market corroborated inputs. The evaluated bid or mean prices are deemed by the Valuation Designee, in consultation with the Subadvisor, to be representative of market values at the regular close of trading of the Exchange on each valuation date. Debt securities purchased on a delayed delivery basis are marked to market daily until settlement at the forward settlement date. Debt securities, including corporate bonds, U.S. government and federal agency bonds, municipal bonds, foreign bonds, convertible bonds,
Notes to Financial Statements (continued)
asset-backed securities and mortgage-backed securities are generally categorized as Level 2 in the hierarchy.
The information above is not intended to reflect an exhaustive list of the methodologies that may be used to value portfolio investments. The Valuation Procedures permit the use of a variety of valuation methodologies in connection with valuing portfolio investments. The methodology used for a specific type of investment may vary based on the market data available or other considerations. The methodologies summarized above may not represent the specific means by which portfolio investments are valued on any particular business day.
(B) Income Taxes. The Portfolio's policy is to comply with the requirements of the Internal Revenue Code of 1986, as amended (the “Internal Revenue Code”), applicable to regulated investment companies and to distribute all of its taxable income to the shareholders of the Portfolio within the allowable time limits.
The Manager evaluates the Portfolio’s tax positions to determine if the tax positions taken meet the minimum recognition threshold in connection with accounting for uncertainties in income tax positions taken or expected to be taken for the purposes of measuring and recognizing tax liabilities in the financial statements. Recognition of tax benefits of an uncertain tax position is permitted only to the extent the position is “more likely than not” to be sustained assuming examination by taxing authorities. The Manager analyzed the Portfolio's tax positions taken on federal, state and local income tax returns for all open tax years (for up to three tax years) and has concluded that no provisions for federal, state and local income tax are required in the Portfolio's financial statements. The Portfolio's federal, state and local income tax and federal excise tax returns for tax years for which the applicable statutes of limitations have not expired are subject to examination by the Internal Revenue Service and state and local departments of revenue.
(C) Dividends and Distributions to Shareholders. Dividends and distributions are recorded on the ex-dividend date. The Portfolio intends to declare and pay dividends from net investment income and distributions from net realized capital and currency gains, if any, at least annually. All dividends and distributions are reinvested at NAV in the same class of shares of the Portfolio. Dividends and distributions to shareholders are determined in accordance with federal income tax regulations and may differ from determinations using GAAP.
(D) Security Transactions and Investment Income. The Portfolio records security transactions on the trade date. Realized gains and losses on security transactions are determined using the identified cost method. Dividend income is recognized on the ex-dividend date, net of any foreign tax withheld at the source, and interest income is accrued as earned using the effective interest rate method. Discounts and premiums on securities purchased, other than temporary cash investments that mature in 60 days or less at the time of purchase, for the Portfolio are accreted and amortized, respectively, on the effective interest rate method.
The Portfolio may place a debt security on non-accrual status and reduce related interest income by ceasing current accruals and writing off all or a
portion of any interest receivables when the collection of all or a portion of such interest has become doubtful. A debt security is removed from non-accrual status when the issuer resumes interest payments or when collectability of interest is reasonably assured.
(E) Expenses. Expenses of the Fund are allocated to the individual Portfolios in proportion to the net assets of the respective Portfolios when the expenses are incurred, except where direct allocations of expenses can be made. The expenses borne by the Portfolio, including those of related parties to the Portfolio, are shown in the Statement of Operations.
(F) Use of Estimates. In preparing financial statements in conformity with GAAP, the Manager makes estimates and assumptions that affect the reported amounts and disclosures in the financial statements. Actual results could differ from those estimates and assumptions.
(G) Futures Contracts. A futures contract is an agreement to purchase or sell a specified quantity of an underlying instrument at a specified future date and price, or to make or receive a cash payment based on the value of a financial instrument (e.g., foreign currency, interest rate, security or securities index). The Portfolio is subject to risks such as market price risk, leverage risk, liquidity risk, counterparty risk, operational risk, legal risk and/or interest rate risk in the normal course of investing in these contracts. Upon entering into a futures contract, the Portfolio is required to pledge to the broker or futures commission merchant an amount of cash and/or U.S. government securities equal to a certain percentage of the collateral amount, known as the “initial margin.” During the period the futures contract is open, changes in the value of the contract are recognized as unrealized appreciation or depreciation by marking to market such contract on a daily basis to reflect the market value of the contract at the end of each day’s trading. The Portfolio agrees to receive from or pay to the broker or futures commission merchant an amount of cash equal to the daily fluctuation in the value of the contract. Such receipts or payments are known as “variation margin.” When the futures contract is closed, the Portfolio records a realized gain or loss equal to the difference between the proceeds from (or cost of) the closing transaction and the Portfolio's basis in the contract.
The use of futures contracts involves, to varying degrees, elements of market risk in excess of the amount recognized in the Statement of Assets and Liabilities. The contract or notional amounts and variation margin reflect the extent of the Portfolio's involvement in open futures positions. There are several risks associated with the use of futures contracts as hedging techniques. There can be no assurance that a liquid market will exist at the time when the Portfolio seeks to close out a futures contract. If no liquid market exists, the Portfolio would remain obligated to meet margin requirements until the position is closed. Futures contracts may involve a small initial investment relative to the risk assumed, which could result in losses greater than if the Portfolio did not invest in futures contracts. Futures contracts may be more volatile than direct investments in the instrument underlying the futures and may not correlate to the underlying instrument, causing a given hedge not to achieve its objectives. The Portfolio's activities in futures contracts have
| 28 | MainStay VP Indexed Bond Portfolio |
minimal counterparty risk as they are conducted through regulated exchanges that guarantee the futures against default by the counterparty. In the event of a bankruptcy or insolvency of a futures commission merchant that holds margin on behalf of the Portfolio, the Portfolio may not be entitled to the return of the entire margin owed to the Portfolio, potentially resulting in a loss. The Portfolio may invest in futures contracts to seek enhanced returns or to reduce the risk of loss by hedging certain of its holdings. The Portfolio's investment in futures contracts and other derivatives may increase the volatility of the Portfolio's NAVs and may result in a loss to the Portfolio. Open futures contracts as of December 31, 2022, are shown in the Portfolio of Investments.
(H) Securities Lending. In order to realize additional income, the Portfolio may engage in securities lending, subject to the limitations set forth in the 1940 Act and relevant guidance by the staff of the Securities and Exchange Commission (“SEC”). If the Portfolio engages in securities lending, the Portfolio will lend through its custodian, JPMorgan Chase Bank, N.A., ("JPMorgan"), acting as securities lending agent on behalf of the Portfolio. Under the current arrangement, JPMorgan will manage the Portfolio's collateral in accordance with the securities lending agency agreement between the Portfolio and JPMorgan, and indemnify the Portfolio against counterparty risk. The loans will be collateralized by cash (which may be invested in a money market fund) and/or non-cash collateral (which may include U.S. Treasury securities and/or U.S. government agency securities issued or guaranteed by the United States government or its agencies or instrumentalities) at least equal at all times to the market value of the securities loaned. Non-cash collateral held at year end is segregated and cannot be transferred by the Portfolio. The Portfolio bears the risk of delay in recovery of, or loss of rights in, the securities loaned. The Portfolio may also record a realized gain or loss on securities deemed sold due to a borrower’s inability to return securities on loan. The Portfolio bears the risk of any loss on investment of cash collateral. The Portfolio will receive compensation for lending its securities in the form of fees or it will retain a portion of interest earned on the investment of any cash collateral. The Portfolio will also continue to receive interest and dividends on the securities loaned and any gain or loss in the market price of the securities loaned that may occur during the term of the loan will be for the account of the Portfolio. Income earned from securities lending activities, if any, is reflected in the Statement of Operations. As of December 31, 2022, the Portfolio did not have any portfolio securities on loan.
(I) Dollar Rolls. The Portfolio may enter into dollar roll transactions in which it sells mortgage-backed securities ("MBS") from its portfolio to a counterparty from whom it simultaneously agrees to buy a similar security on a delayed delivery basis. The Portfolio generally transfers MBS where the MBS are "to be announced," therefore, the Portfolio accounts for these transactions as purchases and sales.
When accounted for as purchase and sales, the securities sold in connection with the dollar rolls are removed from the portfolio and a realized gain or loss is recognized. The securities the Portfolio has agreed to acquire are included at market value in the Portfolio of Investments and
liabilities for such purchase commitments are included as payables for investments purchased. During the roll period, the Portfolio foregoes principal and interest paid on the securities. The Portfolio is compensated by the difference between the current sales price and the forward price for the future as well as by the earnings on the cash proceeds of the initial sale. Dollar rolls may be renewed without physical delivery of the securities subject to the contract. Dollar roll transactions involve certain risks, including the risk that the securities returned to the Portfolio at the end of the roll period, while substantially similar, could be inferior to what was initially sold to the counterparty.
(J) Delayed Delivery Transactions. The Portfolio may purchase or sell securities on a delayed delivery basis. These transactions involve a commitment by the Portfolio to purchase or sell securities for a predetermined price or yield, with payment and delivery taking place beyond the customary settlement period. When delayed delivery purchases are outstanding, the Portfolio will designate liquid assets in an amount sufficient to meet the purchase price. When purchasing a security on a delayed delivery basis, the Portfolio assumes the rights and risks of ownership of the security, including the risk of price and yield fluctuations, and takes such fluctuations into account when determining its NAV. The Portfolio may dispose of or renegotiate a delayed delivery transaction after it is entered into, and may sell delayed delivery securities before they are delivered, which may result in a realized gain or loss. When the Portfolio has sold a security it owns on a delayed delivery basis, the Portfolio does not participate in future gains and losses with respect to the security. Delayed delivery transactions as of December 31, 2022, are shown in the Portfolio of Investments.
(K) Debt Securities Risk. The ability of issuers of debt securities held by the Portfolio to meet their obligations may be affected by, among other things, economic or political developments in a specific country, industry or region. Debt securities are also subject to the risks associated with changes in interest rates.
Investments in the Portfolio are not guaranteed, even though some of the Portfolio’s underlying investments are guaranteed by the U.S. government or its agencies or instrumentalities. The principal risk of mortgage-related and asset-backed securities is that the underlying debt may be prepaid ahead of schedule, if interest rates fall, thereby reducing the value of the Portfolio’s investment. If interest rates rise, less of the debt may be prepaid and the Portfolio may lose money because the Portfolio may be unable to invest in higher yielding assets. The Portfolio is subject to interest-rate risk and can lose principal value when interest rates rise. Bonds are also subject to credit risk, in which the bond issuer may fail to pay interest and principal in a timely manner.
The Portfolio may invest in foreign debt securities, which carry certain risks that are in addition to the usual risks inherent in domestic instruments. These risks include those resulting from currency fluctuations, future adverse political or economic developments and possible imposition of currency exchange blockages or other foreign governmental laws or restrictions. These risks are likely to be greater in emerging markets than in developed markets.
Notes to Financial Statements (continued)
(L) LIBOR Replacement Risk. The Portfolio may invest in certain debt securities, derivatives or other financial instruments that utilize the London Interbank Offered Rate ("LIBOR"), as a “benchmark” or “reference rate” for various interest rate calculations. As of January 1, 2022, the United Kingdom Financial Conduct Authority, which regulates LIBOR, ceased its active encouragement of banks to provide the quotations needed to sustain most LIBOR rates due to the absence of an active market for interbank unsecured lending and other reasons. However, the United Kingdom Financial Conduct Authority, the LIBOR administrator and other regulators announced that the most widely used tenors of U.S. dollar LIBOR will continue until mid-2023. As a result, it is anticipated that the remaining LIBOR settings will be discontinued or will no longer be sufficiently robust to be representative of its underlying market around that time. Various financial industry groups will plan for that transition and certain regulators and industry groups have taken actions to establish alternative reference rates (e.g., the Secured Overnight Financing Rate, which measures the cost of overnight borrowings through repurchase agreement transactions collateralized with U.S. Treasury securities and is intended to replace U.S. dollar LIBOR with certain adjustments). However, there are challenges to converting certain contracts and transactions to a new benchmark and neither the full effects of the transition process nor its ultimate outcome is known.
The elimination of LIBOR or changes to other reference rates or any other changes or reforms to the determination or supervision of reference rates could have an adverse impact on the market for, or value of, any securities or payments linked to those reference rates, which may adversely affect the Portfolio's performance and/or net asset value. Uncertainty and risk also remain regarding the willingness and ability of issuers and lenders to include enhanced provisions in new and existing contracts or instruments. Consequently, the transition away from LIBOR to other reference rates may lead to increased volatility and illiquidity in markets that are tied to LIBOR, fluctuations in values of LIBOR-related investments or investments in issuers that utilize LIBOR, increased difficulty in borrowing or refinancing and diminished effectiveness of hedging strategies, adversely affecting the Portfolio's performance. Furthermore, the risks associated with the expected discontinuation of LIBOR and transition may be exacerbated if the work necessary to effect an orderly transition to an alternative reference rate is not completed in a timely manner. While the transition away from LIBOR has already begun with no material adverse effect to the Portfolio's performance, the transition is expected to last through mid-2023 for some LIBOR tenors. The usefulness of LIBOR as a benchmark could deteriorate anytime during this transition period.
(M) Indemnifications. Under the Fund’s organizational documents, its officers and trustees are indemnified against certain liabilities that may arise out of performance of their duties to the Fund. Additionally, in the normal course of business, the Portfolio enters into contracts with third-party service providers that contain a variety of representations and warranties and that may provide general indemnifications. The Portfolio's maximum exposure under these arrangements is unknown, as this would involve future claims that may be made against the Portfolio that have not
yet occurred. The Manager believes that the risk of loss in connection with these potential indemnification obligations is remote. However, there can be no assurance that material liabilities related to such obligations will not arise in the future, which could adversely impact the Portfolio.
(N) Quantitative Disclosure of Derivative Holdings. The following tables show additional disclosures related to the Portfolio's derivative and hedging activities, including how such activities are accounted for and their effect on the Portfolio's financial positions, performance and cash flows.
The Portfolio entered into futures contracts in order to hedge against anticipated changes in interest rates that might otherwise have an adverse effect upon the value of the Portfolio’s securities as well as help manage the duration and yield curve of the portfolio. These derivatives are not accounted for as hedging instruments.
Fair value of derivative instruments as of December 31, 2022:
| Liability Derivatives | Interest
Rate
Contracts
Risk | Total |
| Futures Contracts - Net Assets—Net unrealized depreciation on futures contracts (a) | $(192,603) | $(192,603) |
| Total Fair Value | $(192,603) | $(192,603) |
| (a) | Includes cumulative appreciation (depreciation) of futures contracts as reported in the Portfolio of Investments. Only current day’s variation margin is reported within the Statement of Assets and Liabilities. |
The effect of derivative instruments on the Statement of Operations for the year ended December 31, 2022:
| Net Realized Gain (Loss) from: | Interest
Rate
Contracts
Risk | Total |
| Futures Contracts | $(5,760,427) | $(5,760,427) |
| Total Net Realized Gain (Loss) | $(5,760,427) | $(5,760,427) |
| Net Change in Unrealized Appreciation (Depreciation) | Interest
Rate
Contracts
Risk | Total |
| Futures Contracts | $(373,793) | $(373,793) |
| Total Net Change in Unrealized Appreciation (Depreciation) | $(373,793) | $(373,793) |
| Average Notional Amount | Total |
| Futures Contracts Long | $ 31,369,708 |
| Futures Contracts Short | $(17,045,111) |
| 30 | MainStay VP Indexed Bond Portfolio |
Note 3–Fees and Related Party Transactions
(A) Manager and Subadvisor. New York Life Investments, a registered investment adviser and an indirect, wholly-owned subsidiary of New York Life, serves as the Portfolio's Manager pursuant to an Amended and Restated Management Agreement ("Management Agreement"). The Manager provides offices, conducts clerical, recordkeeping and bookkeeping services and keeps most of the financial and accounting records required to be maintained by the Portfolio. Except for the portion of salaries and expenses that are the responsibility of the Portfolio, the Manager pays the salaries and expenses of all personnel affiliated with the Portfolio and certain operational expenses of the Portfolio. During a portion of the year ended December 31, 2022, the Portfolio reimbursed New York Life Investments in an amount equal to the portion of the compensation of the Chief Compliance Officer attributable to the Portfolio. NYL Investors LLC ("NYL Investors" or ''Subadvisor''), a registered investment adviser and a direct, wholly-owned subsidiary of New York Life, serves as the Subadvisor to the Portfolio and is responsible for the day-to-day portfolio management of the Portfolio. Pursuant to the terms of a Subadvisory Agreement between New York Life Investments and NYL Investors, New York Life Investments pays for the services of the Subadvisor.
Pursuant to the Management Agreement, the Fund pays the Manager, on behalf of the Portfolio, a monthly fee for the services performed and the facilities furnished at an annual rate of the Portfolio's average daily net assets as follows: 0.25% up to $1 billion; and 0.20% in excess of $1 billion. During the year ended December 31, 2022, the effective management fee rate was 0.25% (exclusive of any applicable waivers/reimbursements).
New York Life Investments has contractually agreed to waive fees and/or reimburse expenses so that the Total Annual Portfolio Operating Expenses (excluding taxes, interest, litigation, extraordinary expenses, brokerage and other transaction expenses relating to the purchase or sale of portfolio investments and acquired (underlying) portfolio/fund fees and expenses) of Initial Class shares do not exceed 0.375% of the Portfolio's average daily net assets. This agreement will remain in effect until May 1, 2023, and shall renew automatically for one-year terms unless New York Life Investments provides written notice of termination prior to the start of the next term or upon approval of the Board.
During the year ended December 31, 2022, New York Life Investments earned fees from the Portfolio in the amount of $726,282 and paid the Subadvisor fees of $363,141.
JPMorgan provides sub-administration and sub-accounting services to the Portfolio pursuant to an agreement with New York Life Investments. These services include calculating the daily NAVs of the Portfolio, maintaining the general ledger and sub-ledger accounts for the calculation of the Portfolio's NAVs, and assisting New York Life Investments in conducting various aspects of the Portfolio's administrative operations. For providing these services to the Portfolio, JPMorgan is compensated by New York Life Investments.
Pursuant to an agreement between the Fund and New York Life Investments, New York Life Investments is responsible for providing or procuring certain regulatory reporting services for the Portfolio. The Portfolio will reimburse New York Life Investments for the actual costs incurred by New York Life Investments in connection with providing or procuring these services for the Portfolio.
Note 4-Federal Income Tax
As of December 31, 2022, the cost and unrealized appreciation (depreciation) of the Portfolio’s investment portfolio, including applicable derivative contracts and other financial instruments, as determined on a federal income tax basis, were as follows:
| | Federal Tax
Cost | Gross
Unrealized
Appreciation | Gross
Unrealized
(Depreciation) | Net
Unrealized
Appreciation/
(Depreciation) |
| Investments in Securities | $294,352,687 | $826,428 | $(24,855,988) | $(24,029,560) |
As of December 31, 2022, the components of accumulated gain (loss) on a tax basis were as follows:
Ordinary
Income | Accumulated
Capital
and Other
Gain (Loss) | Other
Temporary
Differences | Unrealized
Appreciation
(Depreciation) | Total
Accumulated
Gain (Loss) |
| $6,208,535 | $(20,538,210) | $— | $(23,966,503) | $(38,296,178) |
The difference between book-basis and tax-basis unrealized appreciation (depreciation) is primarily due to cumulative bond amortization discount, straddle loss deferral, wash sale adjustments and mark to market of futures contracts.
As of December 31, 2022, for federal income tax purposes, capital loss carryforwards of $20,475,153, as shown in the table below, were available to the extent provided by the regulations to offset future realized gains of the Portfolio. Accordingly, no capital gains distributions are expected to be paid to shareholders until net gains have been realized in excess of such amounts.
Capital Loss
Available Through | Short-Term
Capital Loss
Amounts (000’s) | Long-Term
Capital Loss
Amounts (000’s) |
| Unlimited | $8,597 | $11,878 |
During the years ended December 31, 2022 and December 31, 2021, the tax character of distributions paid as reflected in the Statements of Changes in Net Assets was as follows:
| | 2022 | 2021 |
| Distributions paid from: | | |
| Ordinary Income | $ 7,933,251 | $26,326,732 |
| Long-Term Capital Gains | 3,560,351 | 3,697,949 |
| Total | $11,493,602 | $30,024,681 |
Notes to Financial Statements (continued)
Note 5–Custodian
JPMorgan is the custodian of cash and securities held by the Portfolio. Custodial fees are charged to the Portfolio based on the Portfolio's net assets and/or the market value of securities held by the Portfolio and the number of certain transactions incurred by the Portfolio.
Note 6–Line of Credit
The Portfolio and certain other funds managed by New York Life Investments maintain a line of credit with a syndicate of banks in order to secure a source of funds for temporary purposes to meet unanticipated or excessive redemption requests.
Effective July 26, 2022, under the credit agreement (the “Credit Agreement”), the aggregate commitment amount is $600,000,000 with an additional uncommitted amount of $100,000,000. The commitment fee is an annual rate of 0.15% of the average commitment amount payable quarterly, regardless of usage, to JPMorgan, who serves as the agent to the syndicate. The commitment fee is allocated among the Portfolio and certain other funds managed by New York Life Investments based upon their respective net assets and other factors. Interest on any revolving credit loan is charged based upon the Federal Funds Rate, Daily Simple Secured Overnight Financing Rate ("SOFR") + 0.10%, or the Overnight Bank Funding Rate, whichever is higher. The Credit Agreement expires on July 25, 2023, although the Portfolio, certain other funds managed by New York Life Investments and the syndicate of banks may renew the Credit Agreement for an additional year on the same or different terms or enter into a credit agreement with a different syndicate of banks. Prior to July 26, 2022, the aggregate commitment amount and the commitment fee were the same as those under the current Credit Agreement. During the year ended December 31, 2022, there were no borrowings made or outstanding with respect to the Portfolio under the Credit Agreement.
Note 7–Interfund Lending Program
Pursuant to an exemptive order issued by the SEC, the Portfolio, along with certain other funds managed by New York Life Investments, may participate in an interfund lending program. The interfund lending program provides an alternative credit facility that permits the Portfolio and certain other funds managed by New York Life Investments to lend or borrow money for temporary purposes directly to or from one another, subject to the conditions of the exemptive order. During the year ended December 31, 2022, there were no interfund loans made or outstanding with respect to the Portfolio.
Note 8–Purchases and Sales of Securities (in 000’s)
During the year ended December 31, 2022, purchases and sales of U.S. government securities were $200,608 and $226,130, respectively. Purchases and sales of securities, other than U.S. government securities and short-term securities, were $331,620 and $420,153, respectively.
Note 9–Capital Share Transactions
Transactions in capital shares for the years ended December 31, 2022 and December 31, 2021, were as follows:
| Initial Class | Shares | Amount |
| Year ended December 31, 2022: | | |
| Shares sold | 7,946,321 | $ 66,908,730 |
| Shares issued to shareholders in reinvestment of distributions | 1,386,074 | 11,493,602 |
| Shares redeemed | (18,986,252) | (180,601,111) |
| Net increase (decrease) | (9,653,857) | $(102,198,779) |
| Year ended December 31, 2021: | | |
| Shares sold | 1,164,451 | $ 12,804,844 |
| Shares issued to shareholders in reinvestment of distributions | 2,919,695 | 30,024,681 |
| Shares redeemed | (29,666,867) | (325,959,338) |
| Net increase (decrease) | (25,582,721) | $(283,129,813) |
Note 10–Other Matters
As of the date of this report, interest rates in the United States and many parts of the world, including certain European countries, are ascending from historically low levels. Thus, the Portfolio currently faces a heightened level of risk associated with rising interest rates. This could be driven by a variety of factors, including but not limited to central bank monetary policies, changing inflation or real growth rates, general economic conditions, increasing bond issuances or reduced market demand for low yielding investments.
An outbreak of COVID-19, first detected in December 2019, has developed into a global pandemic and has resulted in travel restrictions, closure of international borders, certain businesses and securities markets, restrictions on securities trading activities, prolonged quarantines, supply chain disruptions, and lower consumer demand, as well as general concern and uncertainty. In 2022, many countries lifted some or all restrictions related to COVID-19. However, the continued impact of COVID-19 and related variants is uncertain and could further adversely affect the global economy, national economies, individual issuers and capital markets in unforeseeable ways and result in a substantial and extended economic downturn. Developments that disrupt global economies and financial markets, such as COVID-19, may magnify factors that affect the Portfolio's performance.
Note 11–Subsequent Events
In connection with the preparation of the financial statements of the Portfolio as of and for the year ended December 31, 2022, events and transactions subsequent to December 31, 2022, through the date the financial statements were issued have been evaluated by the Manager for possible adjustment and/or disclosure. No subsequent events requiring financial statement adjustment or disclosure have been identified.
| 32 | MainStay VP Indexed Bond Portfolio |
Report of Independent Registered Public Accounting Firm
To the Board of Trustees of MainStay VP Funds Trust and Shareholders of
MainStay VP Indexed Bond Portfolio
Opinion on the Financial Statements
We have audited the accompanying statement of assets and liabilities, including the portfolio of investments, of MainStay VP Indexed Bond Portfolio (one of the portfolios constituting MainStay VP Funds Trust, referred to hereafter as the “Portfolio”) as of December 31, 2022, the related statement of operations for the year ended December 31, 2022, the statements of changes in net assets for each of the two years in the period ended December 31, 2022, including the related notes, and the financial highlights for each of the five years in the period ended December 31, 2022 (collectively referred to as the “financial statements”). In our opinion, the financial statements present fairly, in all material respects, the financial position of the Portfolio as of December 31, 2022, the results of its operations for the year then ended, the changes in its net assets for each of the two years in the period ended December 31, 2022 and the financial highlights for each of the five years in the period ended December 31, 2022 in conformity with accounting principles generally accepted in the United States of America.
Basis for Opinion
These financial statements are the responsibility of the Portfolio’s management. Our responsibility is to express an opinion on the Portfolio’s financial statements based on our audits. We are a public accounting firm registered with the Public Company Accounting Oversight Board (United States) (PCAOB) and are required to be independent with respect to the Portfolio in accordance with the U.S. federal securities laws and the applicable rules and regulations of the Securities and Exchange Commission and the PCAOB.
We conducted our audits of these financial statements in accordance with the standards of the PCAOB. Those standards require that we plan and perform the audit to obtain reasonable assurance about whether the financial statements are free of material misstatement, whether due to error or fraud.
Our audits included performing procedures to assess the risks of material misstatement of the financial statements, whether due to error or fraud, and performing procedures that respond to those risks. Such procedures included examining, on a test basis, evidence regarding the amounts and disclosures in the financial statements. Our audits also included evaluating the accounting principles used and significant estimates made by management, as well as evaluating the overall presentation of the financial statements. Our procedures included confirmation of securities owned as of December 31, 2022 by correspondence with the custodian and brokers; when replies were not received from brokers, we performed other auditing procedures. We believe that our audits provide a reasonable basis for our opinion.
/s/PricewaterhouseCoopers LLP
New York, New York
February 24, 2023
We have served as the auditor of one or more investment companies in the MainStay group of funds since 1984.
Board Consideration and Approval of Management Agreement and Subadvisory Agreement (Unaudited)
The continuation of the Management Agreement with respect to the MainStay VP Indexed Bond Portfolio (“Portfolio”) and New York Life Investment Management LLC (“New York Life Investments”) and the Subadvisory Agreement between New York Life Investments and NYL Investors LLC (“NYL Investors”) with respect to the Portfolio (together, “Advisory Agreements”) is subject to annual review and approval by the Board of Trustees of MainStay VP Funds Trust (“Board” of the “Trust”) in accordance with Section 15 of the Investment Company Act of 1940, as amended (“1940 Act”). At its December 6–7, 2022 meeting, the Board, which is comprised solely of Trustees who are not an “interested person” (as such term is defined in the 1940 Act) of the Trust (“Independent Trustees”), unanimously approved the continuation of each of the Advisory Agreements for a one-year period.
In reaching the decision to approve the continuation of each of the Advisory Agreements, the Board considered information and materials furnished by New York Life Investments and NYL Investors in connection with an annual contract review process undertaken by the Board that took place at meetings of the Board and its Contracts Committee during October 2022 through December 2022, including information and materials furnished by New York Life Investments and NYL Investors in response to requests prepared on behalf of the Board, and in consultation with the Board, by independent legal counsel to the Independent Trustees, which encompassed a variety of topics, including those summarized below. Information and materials requested by and furnished to the Board for consideration in connection with the contract review process included, among other items, reports on the Portfolio and “peer funds” prepared by Institutional Shareholder Services Inc. (“ISS”), an independent third-party service provider engaged by the Board to report objectively on the Portfolio’s investment performance, management fee and total expenses. The Board also considered information on the fees charged to other investment advisory clients of New York Life Investments and/or NYL Investors that follow investment strategies similar to those of the Portfolio, if any, and, when applicable, the rationale for any differences in the Portfolio’s management and subadvisory fees and the fees charged to those other investment advisory clients. In addition, the Board considered information regarding the legal standards and fiduciary obligations applicable to its consideration of the continuation of each of the Advisory Agreements. The contract review process, including the structure and format for information and materials provided to the Board, has been developed in consultation with the Board. The Independent Trustees also met in executive sessions with their independent legal counsel and, for portions thereof, with senior management of New York Life Investments.
The Board’s deliberations with respect to the continuation of each of the Advisory Agreements reflect a year-long process, and the Board also took into account information furnished to the Board and its Committees throughout the year, as deemed relevant and appropriate by the Trustees, including, among other items, reports on investment performance of the Portfolio and investment-related matters for the Portfolio as well as presentations from New York Life Investments and, generally annually, NYL Investors personnel. In addition, the Board took into account other
information received from New York Life Investments throughout the year, including, among other items, periodic reports on legal and compliance matters, risk management, portfolio turnover, brokerage commissions and non-advisory services provided to the Portfolio by New York Life Investments, as deemed relevant and appropriate by the Trustees.
In addition to information provided to the Board throughout the year, the Board received information in connection with its June 2022 meeting provided specifically in response to requests prepared on behalf of the Board, and in consultation with the Board, by independent legal counsel to the Independent Trustees regarding the Portfolio’s distribution arrangements. In addition, the Board received information regarding the Portfolio’s asset levels, share purchase and redemption activity and the payment of Rule 12b-1 and/or other fees by the share class of the Portfolio, among other information.
In considering the continuation of each of the Advisory Agreements, the Trustees reviewed and evaluated the information and factors they believed to reasonably be necessary and appropriate in light of legal advice furnished to them by independent legal counsel to the Independent Trustees and through the exercise of their own business judgment. Although individual Trustees may have weighed certain factors or information differently and the Board did not consider any single factor or information controlling in reaching its decision, the factors considered by the Board are summarized in more detail below and include, among other factors: (i) the nature, extent and quality of the services provided to the Portfolio by New York Life Investments and NYL Investors; (ii) the qualifications of the portfolio managers of the Portfolio and the historical investment performance of the Portfolio, New York Life Investments and NYL Investors; (iii) the costs of the services provided, and profits realized, by New York Life Investments and NYL Investors with respect to their relationships with the Portfolio; (iv) the extent to which economies of scale have been realized or may be realized if the Portfolio grows and the extent to which any economies of scale have been shared, have benefited or may benefit the Portfolio’s shareholders; and (v) the reasonableness of the Portfolio’s management and subadvisory fees and total ordinary operating expenses. Although the Board recognized that comparisons between the Portfolio’s fees and expenses and those of other funds are imprecise given different terms of agreements, variations in fund strategies and other factors, the Board considered the reasonableness of the Portfolio’s management fee and total ordinary operating expenses as compared to the peer funds identified by ISS. Throughout their considerations, the Trustees acknowledged the commitment of New York Life Investments and its affiliates to serve the MainStay Group of Funds, as well as their capacity, experience, resources, financial stability and reputations. The Trustees also acknowledged the entrepreneurial and other risks assumed by New York Life Investments in sponsoring and managing the Portfolio. With respect to the Subadvisory Agreement, the Board took into account New York Life Investments’ recommendation to approve the continuation of the Subadvisory Agreement.
The Trustees noted that, throughout the year, the Trustees are afforded an opportunity to ask questions of, and request additional information or materials from, New York Life Investments and NYL Investors. The Board’s
| 34 | MainStay VP Indexed Bond Portfolio |
decision with respect to each of the Advisory Agreements may have also been based, in part, on the Board’s knowledge of New York Life Investments and NYL Investors resulting from, among other things, the Board’s consideration of each of the Advisory Agreements in prior years, the advisory agreements for other funds in the MainStay Group of Funds, the Board’s review throughout the year of the performance and operations of other funds in the MainStay Group of Funds and each Trustee’s business judgment and industry experience. In addition to considering the above-referenced factors, the Board observed that in the marketplace, notably under variable life insurance policies and variable annuity contracts for which the Portfolio serves as an investment option, there are a range of investment options available to investors and that the Portfolio’s shareholders, having had the opportunity to consider other investment options, have chosen to invest in the Portfolio.
The factors that figured prominently in the Board’s decision to approve the continuation of each of the Advisory Agreements during its December 6–7, 2022 meeting are summarized in more detail below.
Nature, Extent and Quality of Services Provided by New York Life Investments and NYL Investors
The Board examined the nature, extent and quality of the services that New York Life Investments provides to the Portfolio. The Board evaluated New York Life Investments’ experience and capabilities in serving as manager of the Portfolio and considered that the Portfolio operates in a “manager-of-managers” structure. The Board also considered New York Life Investments’ responsibilities and services provided pursuant to this structure, including overseeing the services provided by NYL Investors, evaluating the performance of NYL Investors, making recommendations to the Board as to whether the Subadvisory Agreement should be renewed, modified or terminated and periodically reporting to the Board regarding the results of New York Life Investments’ evaluation and monitoring functions. The Board noted that New York Life Investments manages other mutual funds, serves a variety of other investment advisory clients, including other pooled investment vehicles, and has experience overseeing mutual fund service providers, including subadvisors. The Board considered the experience of senior personnel at New York Life Investments providing management and administrative and other non-advisory services to the Portfolio. The Board observed that New York Life Investments devotes significant resources and time to providing management and administrative and other non-advisory services to the Portfolio, including New York Life Investments’ oversight and due diligence reviews of NYL Investors and ongoing analysis of, and interactions with, NYL Investors with respect to, among other things, the Portfolio’s investment performance and risks as well as NYL Investors’ investment capabilities and subadvisory services with respect to the Portfolio.
The Board also considered the range of services that New York Life Investments provides to the Portfolio under the terms of the Management Agreement, including: (i) fund accounting and ongoing supervisory services provided by New York Life Investments’ Fund Administration and Accounting Group; (ii) investment supervisory and analytical services
provided by New York Life Investments’ Investment Consulting Group; (iii) compliance services provided by the Trust’s Chief Compliance Officer as well as New York Life Investments’ compliance department, including supervision and implementation of the Portfolio’s compliance program; (iv) legal services provided by New York Life Investments’ Office of the General Counsel; and (v) risk management monitoring and analysis by compliance and investment personnel. In addition, the Board considered New York Life Investments’ willingness to invest in personnel and other resources, such as cyber security, information security and business continuity planning, designed to benefit the Portfolio and noted that New York Life Investments is responsible for compensating the Trust’s officers, except for a portion of the salary of the Trust’s Chief Compliance Officer. The Board recognized that New York Life Investments provides certain other non-advisory services to the Portfolio and has provided an increasingly broad array of non-advisory services to the MainStay Group of Funds as a result of regulatory and other developments, including in connection with the implementation of the MainStay Group of Funds’ derivatives risk management program and policies and procedures adopted pursuant to Rule 18f-4 under the 1940 Act.
The Board also examined the range, and the nature, extent and quality, of the investment advisory services that NYL Investors provides to the Portfolio and considered the terms of each of the Advisory Agreements. The Board evaluated NYL Investors’ experience and performance in serving as subadvisor to the Portfolio and advising other portfolios and NYL Investors’ track record and experience in providing investment advisory services, the experience of investment advisory, senior management and administrative personnel at NYL Investors. The Board considered New York Life Investments’ and NYL Investors’ overall resources, legal and compliance environment, capabilities, reputation, financial condition and history. In addition to information provided in connection with quarterly meetings with the Trust’s Chief Compliance Officer, the Board considered information regarding the compliance policies and procedures of New York Life Investments and NYL Investors and acknowledged their commitment to further developing and strengthening compliance programs relating to the Portfolio. The Board also considered NYL Investors’ ability to recruit and retain qualified investment professionals and willingness to invest in personnel and other resources to service and support the Portfolio. In this regard, the Board considered the qualifications and experience of the Portfolio’s portfolio managers, the number of accounts managed by the portfolio managers and the method for compensating the portfolio managers.
In addition, the Board considered information provided by New York Life Investments and NYL Investors regarding the operations of their respective business continuity plans in response to the COVID-19 pandemic and the continued remote work environment.
Based on these considerations, among others, the Board concluded that the Portfolio would likely continue to benefit from the nature, extent and quality of these services.
Board Consideration and Approval of Management Agreement and Subadvisory Agreement (Unaudited) (continued)
Investment Performance
In evaluating the Portfolio’s investment performance, the Board considered investment performance results over various periods in light of the Portfolio’s investment objective, strategies and risks. The Board considered investment reports on, and analysis of, the Portfolio’s performance provided to the Board throughout the year. These reports include, among other items, information on the Portfolio’s gross and net returns, the Portfolio’s investment performance compared to a relevant investment category and the Portfolio’s benchmark, the Portfolio’s risk-adjusted investment performance and the Portfolio’s investment performance as compared to peer funds, as appropriate, as well as portfolio attribution information and commentary on the effect of market conditions. The Board also considered information provided by ISS showing the investment performance of the Portfolio as compared to peer funds. In addition, the Board reviewed the methodology used by ISS to construct the group of peer funds for comparative purposes.
The Board also took into account its discussions with senior management at New York Life Investments concerning the Portfolio’s investment performance over various periods as well as discussions between the Portfolio’s portfolio management team and the members of the Board’s Investment Committee, which generally occur on an annual basis. In addition, the Board considered any specific actions that New York Life Investments or NYL Investors had taken, or had agreed to take, to seek to enhance Portfolio investment performance and the results of those actions.
Based on these considerations, among others, the Board concluded that its review of the Portfolio’s investment performance and related information supported a determination to approve the continuation of each of the Advisory Agreements.
Costs of the Services Provided, and Profits and Other Benefits Realized, by New York Life Investments and NYL Investors
The Board considered the costs of the services provided under each of the Advisory Agreements. The Board also considered the profits realized by New York Life Investments and its affiliates, including NYL Investors, due to their relationships with the Portfolio as well as the MainStay Group of Funds. Because NYL Investors is an affiliate of New York Life Investments whose subadvisory fee is paid by New York Life Investments, not the Portfolio, the Board considered cost and profitability information for New York Life Investments and NYL Investors in the aggregate.
In addition, the Board acknowledged the difficulty in obtaining reliable comparative data about mutual fund managers’ profitability because such information generally is not publicly available and may be impacted by numerous factors, including the structure of a fund manager’s organization, the types of funds it manages, the methodology used to allocate certain fixed costs to specific funds and the manager’s capital structure and costs of capital.
In evaluating the costs of the services provided by New York Life Investments and NYL Investors and profits realized by New York Life Investments and its affiliates, including NYL Investors, the Board considered, among other factors, New York Life Investments’ and its affiliates’, including NYL Investors’, continuing investments in, or willingness to invest in, personnel and other resources to support and further enhance the management of the Portfolio, and that New York Life Investments is responsible for paying the subadvisory fee for the Portfolio. The Board also considered the financial resources of New York Life Investments and NYL Investors and acknowledged that New York Life Investments and NYL Investors must be in a position to recruit and retain experienced professional personnel and to maintain a strong financial position for New York Life Investments and NYL Investors to continue to provide high-quality services to the Portfolio. The Board recognized that the Portfolio benefits from the allocation of certain fixed costs among the funds in the MainStay Group of Funds, among other expected benefits resulting from its relationship with New York Life Investments.
The Board considered information regarding New York Life Investments’ methodology for calculating profitability and allocating costs provided by New York Life Investments in connection with the fund profitability analysis presented to the Board. The Board noted it had previously engaged an independent consultant to review the methods used to allocate costs among the funds in the MainStay Group of Funds. The Board also noted that the independent consultant had concluded that New York Life Investments’ methods for allocating costs and procedures for estimating overall profitability of the relationship with the funds in the MainStay Group of Funds are reasonable and that New York Life Investments continued to use the same method of calculating profit and allocating costs since the independent consultant’s review. The Board recognized the difficulty in calculating and evaluating a manager’s profitability with respect to the Portfolio and considered that other profitability methodologies may also be reasonable.
The Board also considered certain fall-out benefits that may be realized by New York Life Investments and its affiliates due to their relationships with the Portfolio, including reputational and other indirect benefits. In addition, the Board considered its review of the management agreement for a money market fund advised by New York Life Investments and an affiliated subadvisor that serves as an investment option for the Portfolio, including the potential rationale for and costs associated with investments in this money market fund by the Portfolio, if any, and considered information from New York Life Investments that the nature and type of specific investment advisory services provided to this money market fund are distinct from, or in addition to, the investment advisory services provided to the Portfolio. In addition, the Board considered the potential dividend received tax deduction for insurance company affiliates of New York Life Investments from the Portfolio’s securities lending activity.
The Board noted that the Portfolio serves as an investment option primarily under variable contracts issued by affiliates of New York Life Investments that would receive fees under those contracts. The Board observed that, in addition to fees earned by New York Life Investments under the Management Agreement for managing the Portfolio, New York
| 36 | MainStay VP Indexed Bond Portfolio |
Life Investments’ affiliates also earn revenues from serving the Portfolio in various other capacities, including as the Portfolio’s distributor. The Board considered information about these other revenues and their impact on the profitability of the relationship with the Portfolio to New York Life Investments and its affiliates. The Board noted that, although it assessed the overall profitability of the relationship with the Portfolio to New York Life Investments and its affiliates as part of the contract review process, when considering the reasonableness of the fee paid to New York Life Investments under the Management Agreement, the Board considered the profitability of New York Life Investments’ relationship with the Portfolio on a pre-tax basis and without regard to distribution expenses incurred by New York Life Investments from its own resources.
After evaluating the information deemed relevant by the Trustees, the Board concluded that any profits realized by New York Life Investments and its affiliates, including NYL Investors, due to their relationships with the Portfolio were not excessive and other benefits that may accrue to New York Life Investments and its affiliates, including NYL Investors, are reasonable.
Management and Subadvisory Fees and Total Ordinary Operating Expenses
The Board evaluated the reasonableness of the fee paid under each of the Advisory Agreements and the Portfolio’s total ordinary operating expenses. The Board primarily considered the reasonableness of the management fee paid by the Portfolio to New York Life Investments because the subadvisory fee paid to NYL Investors is paid by New York Life Investments, not the Portfolio. The Board also considered the reasonableness of the subadvisory fee paid by New York Life Investments and the amount of the management fee retained by New York Life Investments.
In assessing the reasonableness of the Portfolio’s fees and expenses, the Board primarily considered comparative data provided by ISS on the fees and expenses charged by similar mutual funds managed by other investment advisers. The Board reviewed the methodology used by ISS to construct the group of peer funds for comparative purposes. In addition, the Board considered information provided by New York Life Investments and NYL Investors on fees charged to other investment advisory clients, including institutional separate accounts and/or other funds that follow investment strategies similar to those of the Portfolio, if any. The Board considered the contractual management fee schedules of the Portfolio as compared to those of such other investment advisory clients, taking into account the rationale for any differences in fee schedules. The Board also took into account information provided by New York Life Investments about the more extensive scope of services provided to registered investment companies, such as the Portfolio, as compared with other investment advisory clients. Additionally, the Board considered the impact of contractual breakpoints and expense limitation arrangements on the Portfolio’s net management fee and expenses. The Board also considered that in proposing fees for the Portfolio, New York Life Investments considers the competitive marketplace for mutual funds.
Based on the factors outlined above, among other considerations, the Board concluded that the Portfolio’s management fee and total ordinary operating expenses are within a range that is competitive and support a conclusion that these fees and expenses are reasonable.
Economies of Scale
The Board considered information regarding economies of scale, including whether economies of scale may exist for the Portfolio and whether the Portfolio’s expense structure permits any economies of scale to be appropriately shared with the Portfolio’s beneficial shareholders. The Board also considered a report from New York Life Investments, previously prepared at the request of the Board, that addressed economies of scale, including with respect to the mutual fund business generally, and the various ways in which the benefits of economies of scale may be shared with the funds in the MainStay Group of Funds. Although the Board recognized the difficulty of determining economies of scale with precision, the Board acknowledged that economies of scale may be shared with the Portfolio in a number of ways, including, for example, through the imposition of fee breakpoints, initially setting management fee rates at scale or making additional investments to enhance the services provided to the Portfolio. The Board reviewed information from New York Life Investments showing how the Portfolio’s management fee schedule compared to fee schedules of other funds and accounts managed by New York Life Investments. The Board also reviewed information from ISS showing how the Portfolio’s management fee schedule compared with fees paid for similar services by peer funds at varying asset levels.
Based on this information, the Board concluded that economies of scale are appropriately reflected for the benefit of the Portfolio’s beneficial shareholders through the Portfolio’s expense structure and other methods to share benefits from economies of scale.
Conclusion
On the basis of the information and factors summarized above, among other information and factors deemed relevant by the Trustees, and the evaluation thereof, the Board unanimously voted to approve the continuation of each of the Advisory Agreements.
Proxy Voting Policies and Procedures and Proxy Voting Record
The Portfolio is required to file with the SEC its proxy voting record for the 12-month period ending June 30 on Form N-PX. A description of the policies and procedures that are used to vote proxies relating to portfolio securities of the Portfolio is available free of charge upon request by calling 800-598-2019 or visiting the SEC's website at www.sec.gov. The most recent Form N-PX or proxy voting record is available free of charge upon request by calling 800-598-2019; visiting https://www.newyorklifeinvestments.com/investment-products/vp; or visiting the SEC’s website at www.sec.gov.
Shareholder Reports and Quarterly Portfolio Disclosure
The Portfolio is required to file its complete schedule of portfolio holdings with the SEC 60 days after its first and third fiscal quarter on Form N-PORT. The Portfolio's holdings report is available free of charge upon request by calling 800-598-2019 or by visiting the SEC’s website at www.sec.gov.
Board of Trustees and Officers (Unaudited)
The Trustees and officers of the Portfolio are listed below. The Board oversees the MainStay Group of Funds (which consists of MainStay Funds and MainStay Funds Trust), MainStay VP Funds Trust, MainStay MacKay DefinedTerm Municipal Opportunities Fund, MainStay CBRE Global Infrastructure Megatrends Fund, the Manager and the Subadvisors, and elects the officers of the Portfolios who are responsible for the day-to-day operations of the Portfolio. Information pertaining to the Trustees and officers is set forth below. Each Trustee serves until his or her successor
is elected and qualified or until his or her resignation, death or removal. Under the Board’s retirement policy, unless an exception is made, a Trustee must tender his or her resignation by the end of the calendar year during which he or she reaches the age of 75. The business address of each Trustee and officer listed below is 51 Madison Avenue, New York, New York 10010. None of the Trustees are “interested persons” (as defined by the 1940 Act and rules adopted by the SEC thereunder) of the Portfolio (“Independent Trustees”).
| | Name and
Year of Birth | Term of Office,
Position(s) Held and
Length of Service | Principal Occupation(s)
During Past Five Years | Number of
Portfolios in
Fund Complex
Overseen by
Trustee | Other Directorships
Held by Trustee |
| | | | | | |
| | David H. Chow
1957 | MainStay VP Funds Trust: Trustee since January 2016, Advisory Board Member (June 2015 to December 2015) | Founder and CEO, DanCourt Management, LLC since 1999 | 78 | MainStay Funds: Trustee since January 2016, Advisory Board Member (June 2015 to December 2015) (12 Funds);
MainStay Funds Trust: Trustee since January 2016, Advisory Board Member (June 2015 to December 2015) (33 Funds);
MainStay MacKay DefinedTerm Municipal Opportunities Fund: Trustee since January 2016, Advisory Board Member (June 2015 to December 2015);
MainStay CBRE Global Infrastructure Megatrends Fund: Trustee since June 2021;VanEck Vectors Group of Exchange-Traded Funds: Independent Chairman of the Board of Trustees since 2008 and Trustee since 2006 (57 portfolios); and Berea College of Kentucky: Trustee since 2009, Chair of the Committee since 2018 |
| | Susan B. Kerley
1951 | MainStay VP Funds Trust: Chairman since 2017 and Trustee since 2007* | President, Strategic Management Advisors LLC since 1990 | 78 | MainStay Funds: Chairman since 2017 and Trustee since 2007 (12 Funds); MainStay Funds Trust: Chairman since 2017 and Trustee since 1990 (33 Funds)**;
MainStay MacKay DefinedTerm Municipal Opportunities Fund: Chairman since 2017 and Trustee since 2011; MainStay CBRE Global Infrastructure Megatrends Fund: Trustee since June 2021; and Legg Mason Partners Funds: Trustee since 1991 (45 portfolios) |
| | Alan R. Latshaw
1951 | MainStay VP Funds Trust: Trustee since 2007* | Retired; Partner, Ernst & Young LLP (2002 to 2003); Partner, Arthur Andersen LLP (1989 to 2002); Consultant to the MainStay Funds Audit and Compliance Committee (2004 to 2006) | 78 | MainStay Funds: Trustee since 2006 (12 Funds);
MainStay Funds Trust: Trustee since 2007 (33 Funds)**;
MainStay MacKay DefinedTerm Municipal Opportunities Fund: Trustee since 2011; and
MainStay CBRE Global Infrastructure Megatrends Fund: Trustee since June 2021 |
Board of Trustees and Officers (Unaudited) (continued)
| | Name and
Year of Birth | Term of Office,
Position(s) Held and
Length of Service | Principal Occupation(s)
During Past Five Years | Number of
Portfolios in
Fund Complex
Overseen by
Trustee | Other Directorships
Held by Trustee |
| | | | | | |
| | Karen Hammond
1956 | MainStay VP Funds Trust: Trustee since December 2021, Advisory Board Member (June 2021 to December 2021)
| Retired, Managing Director, Devonshire Investors (2007 to 2013); Senior Vice President, Fidelity Management & Research Co. (2005 to 2007); Senior Vice President and Corporate Treasurer, FMR Corp. (2003 to 2005); Chief Operating Officer, Fidelity Investments Japan (2001 to 2003) | 78 | MainStay Funds: Trustee since December 2021, Advisory Board Member (June 2021 to December 2021) (12 Funds);
MainStay Funds Trust: Trustee since December 2021, Advisory Board Member (June 2021 to December 2021) (33 Funds);
MainStay MacKay DefinedTerm Municipal Opportunities Fund: Trustee since December 2021, Advisory Board Member (June 2021 to December 2021);
MainStay CBRE Global Infrastructure Megatrends Fund: Trustee since December 2021, Advisory Board Member (June 2021 to December 2021);
Two Harbors Investment Corp.: Director since 2018; Rhode Island State Investment Commission: Member since 2017; and Blue Cross Blue Shield of Rhode Island: Director since 2019
|
| | Jacques P. Perold
1958 | MainStay VP Funds Trust: Trustee since January 2016, Advisory Board Member (June 2015 to December 2015) | Founder and Chief Executive Officer, CapShift Advisors LLC (since 2018); President, Fidelity Management & Research Company (2009 to 2014); President and Chief Investment Officer, Geode Capital Management, LLC (2001 to 2009) | 78 | MainStay Funds: Trustee since January 2016, Advisory Board Member (June 2015 to December 2015) (12 Funds);
MainStay Funds Trust: Trustee since January 2016, Advisory Board Member (June 2015 to December 2015) (33 Funds); MainStay MacKay DefinedTerm Municipal Opportunities Fund: Trustee since January 2016, Advisory Board Member (June 2015 to December 2015);
MainStay CBRE Global Infrastructure Megatrends Fund: Trustee since June 2021; Allstate Corporation: Director since 2015;
Partners in Health: Trustee since 2019; and
MSCI Inc.: Director since 2017 |
| | Richard S. Trutanic
1952 | MainStay VP Funds Trust: Trustee since 2007* | Chairman and Chief Executive Officer, Somerset & Company (financial advisory firm) since 2004; Managing Director, The Carlyle Group (private investment firm) (2002 to 2004); Senior Managing Director, Partner and Board Member, Groupe Arnault S.A. (private investment firm) (1999 to 2002)
| 78 | MainStay Funds: Trustee since 1994 (12 Funds);
MainStay Funds Trust: Trustee since 2007 (33 Funds)**;
MainStay MacKay DefinedTerm Municipal Opportunities Fund: Trustee since 2011; and
MainStay CBRE Global Infrastructure Megatrends Fund: Trustee since June 2021 |
| * | Includes prior service as a Director of MainStay VP Series Fund, Inc., the predecessor to MainStay VP Funds Trust. |
| ** | Includes prior service as a Director/Trustee of certain predecessor entities to MainStay Funds Trust. |
| 40 | MainStay VP Indexed Bond Portfolio |
| | Name and
Year of Birth | Position(s) Held and
Length of Service | Principal Occupation(s)
During Past Five Years | |
| | | | | |
| | Kirk C. Lehneis
1974 | President, MainStay VP Funds Trust (since 2017) | Chief Operating Officer and Senior Managing Director (since 2016), New York Life Investment Management LLC and New York Life Investment Management Holdings LLC; Member of the Board of Managers (since 2017) and Senior Managing Director (since 2018), NYLIFE Distributors LLC; Chairman of the Board and Senior Managing Director, NYLIM Service Company LLC (since 2017); Trustee, President and Principal Executive Officer of IndexIQ Trust, IndexIQ ETF Trust and IndexIQ Active ETF Trust (since January 2018); President, MainStay CBRE Global Infrastructure Megatrends Fund (since 2021), MainStay MacKay DefinedTerm Municipal Opportunities Fund, MainStay Funds and MainStay Funds Trust (since 2017); Senior Managing Director, Global Product Development (from 2015-2016); Managing Director, Product Development (from 2010-2015), New York Life Investment Management LLC | |
| | Jack R. Benintende
1964 | Treasurer and Principal Financial and Accounting Officer, MainStay VP Funds Trust (since 2007)** | Managing Director, New York Life Investment Management LLC (since 2007); Treasurer and Principal Financial and Accounting Officer, MainStay CBRE Global Infrastructure Megatrends Fund (since 2021), MainStay MacKay DefinedTerm Municipal Opportunities Fund (since 2011), MainStay Funds Trust (since 2009) and MainStay Funds (since 2007); and Assistant Treasurer, New York Life Investment Management Holdings LLC (2008 to 2012) | |
| | J. Kevin Gao
1967 | Secretary and Chief Legal Officer, MainStay VP Funds Trust (since 2010)** | Managing Director and Associate General Counsel, New York Life Investment Management LLC (since 2010); Secretary and Chief Legal Officer, MainStay CBRE Global Infrastructure Megatrends Fund (since 2021), MainStay MacKay DefinedTerm Municipal Opportunities Fund (since 2011), MainStay Funds and MainStay Funds Trust (since 2010) | |
| | Scott T. Harrington
1959 | Vice President— Administration, MainStay VP Funds Trust (since 2005)** | Managing Director, New York Life Investment Management LLC (including predecessor advisory organizations) (since 2000); Member of the Board of Directors, New York Life Trust Company (since 2009); Vice President—Administration, MainStay CBRE Global Infrastructure Megatrends Fund (since 2021), MainStay MacKay DefinedTerm Municipal Opportunities Fund (since 2011), MainStay Funds Trust and MainStay Funds (since 2009) | |
| | Kevin M. Gleason
1967 | Vice President and Chief Compliance Officer, MainStay VP Funds Trust (since June 2022) | Vice President and Chief Compliance Officer, IndexIQ, IndexIQ ETF Trust and Index IQ Active ETF Trust (since June 2022); Vice President and Chief Compliance Officer, MainStay CBRE Global Infrastructure Megatrends Fund, MainStay MacKay DefinedTerm Municipal Opportunities Fund (since June 2022); MainStay Funds Trust and MainStay Funds (since June 2022); Senior Vice President, Voya Investment Management and Chief Compliance Officer, Voya Family of Funds (2012-2022) | |
| * | The officers listed above are considered to be “interested persons” of the MainStay Group of Funds, MainStay VP Funds Trust, MainStay CBRE Global Infrastructure Megatrends Fund and MainStay MacKay DefinedTerm Municipal Opportunities Fund within the meaning of the 1940 Act because of their affiliation with the MainStay Group of Funds, New York Life Insurance Company and/or its affiliates, including New York Life Investment Management LLC, NYLIM Service Company LLC, NYLIFE Securities LLC and/or NYLIFE Distributors LLC, as described in detail in the column captioned “Principal Occupation(s) During Past Five Years.” Officers are elected annually by the Board. |
| ** | Includes prior service as an Officer of MainStay VP Series Fund, Inc., the predecessor to MainStay VP Funds Trust. |
Officers of the Trust (Who are not Trustees)*
This page intentionally left blank
MainStay VP Portfolios
MainStay VP offers a wide range of Portfolios. The full array of MainStay VP offerings is listed here, with information about the manager, subadvisors, legal counsel, and independent registered public accounting firm.
Equity
MainStay VP American Century Sustainable Equity Portfolio1
MainStay VP Candriam Emerging Markets Equity Portfolio
MainStay VP Epoch U.S. Equity Yield Portfolio
MainStay VP Fidelity Institutional AM® Utilities Portfolio†
MainStay VP MacKay International Equity Portfolio
MainStay VP Natural Resources Portfolio
MainStay VP S&P 500 Index Portfolio2
MainStay VP Small Cap Growth Portfolio
MainStay VP Wellington Growth Portfolio
MainStay VP Wellington Mid Cap Portfolio
MainStay VP Wellington Small Cap Portfolio
MainStay VP Wellington U.S. Equity Portfolio
MainStay VP Winslow Large Cap Growth Portfolio
Mixed Asset
MainStay VP Balanced Portfolio
MainStay VP Income Builder Portfolio
MainStay VP Janus Henderson Balanced Portfolio
MainStay VP MacKay Convertible Portfolio
Income
MainStay VP Bond Portfolio
MainStay VP Floating Rate Portfolio
MainStay VP Indexed Bond Portfolio
MainStay VP MacKay Government Portfolio
MainStay VP MacKay High Yield Corporate Bond Portfolio
MainStay VP MacKay Strategic Bond Portfolio
MainStay VP PIMCO Real Return Portfolio
Money Market
MainStay VP U.S. Government Money Market Portfolio
Alternative
MainStay VP CBRE Global Infrastructure Portfolio
MainStay VP IQ Hedge Multi-Strategy Portfolio
Asset Allocation
MainStay VP Conservative Allocation Portfolio
MainStay VP Equity Allocation Portfolio
MainStay VP Growth Allocation Portfolio
MainStay VP Moderate Allocation Portfolio
Manager
New York Life Investment Management LLC
New York, New York
Subadvisors
American Century Investment Management, Inc.
Kansas City, Missouri
Brown Advisory LLC
Baltimore, Maryland
Candriam*
Strassen, Luxembourg
CBRE Investment Management Listed Real Assets LLC
Radnor, Pennsylvania
Epoch Investment Partners, Inc.
New York, New York
FIAM LLC
Smithfield, Rhode Island
IndexIQ Advisors LLC*
New York, New York
Janus Henderson Investors US LLC
Denver, Colorado
MacKay Shields LLC*
New York, New York
Newton Investment Management North America, LLC
Boston, Massachusetts
NYL Investors LLC*
New York, New York
Pacific Investment Management Company LLC
Newport Beach, California
Segall Bryant & Hamill, LLC
Chicago, Illinois
Wellington Management Company LLP
Boston, Massachusetts
Winslow Capital Management, LLC
Minneapolis, Minnesota
Legal Counsel
Dechert LLP
Washington, District of Columbia
Independent Registered Public Accounting Firm
PricewaterhouseCoopers LLP
New York, New York
Distributor
NYLIFE Distributors LLC*
Jersey City, New Jersey
Custodian
JPMorgan Chase Bank, N.A.
New York, New York
Some Portfolios may not be available in all products.
† Fidelity Institutional AM is a registered trade mark of FMR LLC. Used with permission.
* An affiliate of New York Life Investment Management LLC.
| 1. | Prior to May 1, 2022, the Portfolio's name was MainStay VP T. Rowe Price Equity Income Portfolio. |
| 2. | Prior to May 1, 2022, the Portfolio's name was MainStay VP MacKay S&P 500 Index Portfolio. |
Not part of the Annual Report
2022 Annual Report
This report is for the general information of New York Life Variable Annuities and NYLIAC Variable Universal Life Insurance Products policyowners. It must be preceded or accompanied by the appropriate product(s) and funds prospectuses if it is given to anyone who is not an owner of a New York Life variable annuity policy or a NYLIAC Variable Universal Life Insurance Product. This report does not offer for sale or solicit orders to purchase securities.
The performance data quoted in this report represents past performance. Past performance is no guarantee of future results. Due to market volatility and other factors, current performance may be lower or higher than the figures shown. The most recent month-end performance summary for your variable annuity or variable life policy is available by calling 800-598-2019 and is updated periodically on newyorklife.com.
The New York Life Variable Annuities and NYLIAC Variable Universal Life Insurance Products are issued by New York Life Insurance and Annuity Corporation (a Delaware Corporation) and distributed by NYLIFE Distributors LLC (Member FINRA/SIPC).
New York Life Insurance Company
New York Life Insurance and Annuity
Corporation (NYLIAC) (A Delaware Corporation)
51 Madison Avenue, Room 551
New York, NY 10010
newyorklife.com
newyorklifeinvestments.com
NYLIFE Distributors LLC, 30 Hudson Street, Jersey City, NJ 07302
New York Life Investment Management LLC is the investment manager to the MainStay VP Funds Trust
©2023 by NYLIFE Distributors LLC. All rights reserved.
You may obtain copies of the Prospectus and the Statement of Additional Information free of charge, upon request, by calling toll-free 800-598-2019 or writing to New York Life Insurance and Annuity Corporation, 51 Madison Avenue, New York, NY 10010.
| Not FDIC Insured | No Bank Guarantee | May Lose Value |
(NYLIAC) NI555
MainStay VP Janus Henderson Balanced Portfolio
Message from the President and Annual Report
December 31, 2022
Sign up for e-delivery of your shareholder reports. For full details on e-delivery, including who can participate and what you can receive via e-delivery,
please log in to newyorklifeinvestments.com/accounts.
| Not FDIC/NCUA Insured | Not a Deposit | May Lose Value | No Bank Guarantee | Not Insured by Any Government Agency |
This page intentionally left blank
Message from the President
The 12-month reporting period ended December 31, 2022, proved exceptionally challenging for investors as both stock and bond markets suffered steep declines. A variety of economic and geopolitical forces drove the market’s losses, all centered around rising inflation and monetary efforts to rein it in.
Inflationary alarms began to sound well before the reporting period began. In late 2021, after nearly two years of accommodative policies designed to encourage economic growth in the face of the COVID-19 pandemic, the U.S. Federal Reserve (the “Fed”) warned of the increasing need to tighten monetary policy. Nevertheless, the pace and persistence of inflation in early 2022 caught most market participants—the Fed included—off guard. Russia’s invasion of Ukraine in February exacerbated global inflationary pressures while increasing investor uncertainty. Domestic supply shortages, international trade imbalances and rising inflation caused U.S. GDP (gross domestic product) to contract in the first and second quarters of the year, although employment and consumer spending proved resilient. Prices for petroleum surged to multi-year highs, while many key agricultural chemicals and industrial metals soared as well. Accelerating inflationary forces prompted the Fed to implement its most aggressive series of interest rate hikes since the 1980s, with a 0.25% increase in March followed by six further rate increases totaling 4.25%. International central banks generally followed suit and raised rates by varying degrees in efforts to curb local inflation, although most increases remained significantly more modest than those in the United States. Relatively high U.S. interest rates and an international risk averse sentiment pushed U.S. dollar values higher compared to most other currencies, with negative impacts on global prices for food, fuel and other key U.S.-dollar-denominated products.
The effects of these interrelated challenges were felt throughout U.S. and international financial markets. The S&P 500® Index, a widely regarded benchmark of market performance, declined by more than 18% during the reporting period. Although the energy sector generated strong gains, bolstered by elevated oil and gas prices, most other industry segments recorded losses. The more cyclical and growth-oriented sectors of consumer discretionary, information technology and real estate delivered the weakest returns, while the traditionally defensive and value-oriented
consumer staples, utilities and health care sectors outperformed. On average, international developed-country equity markets mildly outperformed their U.S. counterparts, while emerging markets lagged slightly. Fixed-income markets proved unusually volatile, with bond prices trending sharply lower as yields rose along with interest rates. Short-term yields rose faster than long-term yields, producing a yield curve inversion from July through the end of the reporting period as long-term rates remained below short-term rates. While floating-rate instruments, which feature variable interest rates that allow investors to benefit from a rising rate environment, provided a degree of insulation from inflation-driven trends, they were not immune to the market’s widespread declines.
Although, according to the most recent estimates, the annualized inflation rate in the United States has declined from a peak of 9.1% in July 2022 to 6.5% in December, the Fed remains focused on achieving more substantial and lasting reductions, aiming for a target rate of 2%. As a result, further rate hikes and additional market volatility are potential headwinds in the coming months. The question remains as to whether the Fed and other central banks will manage a so-called “soft landing,” curbing inflation while avoiding a persistent economic slowdown. If they prove successful, we believe that the increasingly attractive valuations we have observed in both equity and bond markets should eventually translate into sustainable improvements in the investment environment.
Whatever actions the Fed takes and however financial markets react, as a MainStay VP investor you can depend on us to continue managing our portfolios with the insight, expertise and level of service that have long defined New York Life Investments. Thank you for trusting us to help you meet your investment needs.
Sincerely,
Kirk C. Lehneis
President
The opinions expressed are as of the date of this report and are subject to change. There is no guarantee that any forecast made will come to pass. This material does not constitute investment advice and is not intended as an endorsement of any specific investment. Past performance is no guarantee of future results.
Not part of the Annual Report
Investors should refer to the Portfolio’s Summary Prospectus and/or Prospectus and consider the Portfolio’s investment objectives, strategies, risks, charges and expenses carefully before investing. The Summary Prospectus and/or Prospectus contain this and other information about the Portfolio. You may obtain copies of the Portfolio’s Summary Prospectus, Prospectus and Statement of Additional Information, which includes information about the MainStay VP Funds Trust's Trustees, free of charge, upon request, by calling toll-free 800-598-2019, by writing to New York Life Insurance and Annuity Corporation, 51 Madison Avenue, Room 251, New York, New York 10010 or by sending an email to MainStayShareholdersServices@nylim.com. These documents are also available at newyorklifeinvestments.com/investment-products/vp. Please read the Portfolio's Summary Prospectus and/or Prospectus carefully before investing. MainStay VP Funds Trust portfolios are separate account options which are purchased through a variable insurance or variable annuity contract.
Investment and Performance Comparison (Unaudited)
Performance data quoted represents past performance. Past performance is no guarantee of future results. Because of market volatility and other factors, current performance may be lower or higher than the figures shown. Investment return and principal value will fluctuate, and as a result, when shares are redeemed, they may be worth more or less than their original cost. The performance table and graph do not reflect any deduction of sales charges, mortality and expense charges, contract charges or administrative charges. Please refer to the Performance Summary appropriate for your policy. For performance information current to the most recent month-end, please call 800-598-2019 or visit www.newyorklife.com.
Performance figures may reflect certain fee waivers and/or expense limitations, without which total returns may have been different. For information on current fee waivers and/or expense limitations (if any), please refer to the Notes to Financial Statements.
| Average Annual Total Returns for the Year-Ended December 31, 2022 |
| Class | Inception
Date | One
Year | Five
Years | Ten
Years | Gross
Expense
Ratio1 |
| Initial Class Shares | 2/17/2012 | -16.39% | 6.72% | 8.48% | 0.57% |
| Service Class Shares | 2/17/2012 | -16.60 | 6.46 | 8.21 | 0.82 |
| 1. | The gross expense ratios presented reflect the Portfolio’s “Total Annual Portfolio Operating Expenses” from the most recent Prospectus and may differ from other expense ratios disclosed in this report. |
| Benchmark Performance* | One
Year | Five
Years | Ten
Years |
| S&P 500® Index1 | -18.11% | 9.42% | 12.56% |
| Bloomberg U.S. Aggregate Bond Index2 | -13.01 | 0.02 | 1.06 |
| Janus Balanced Composite Index3 | -15.52 | 5.49 | 7.51 |
| Morningstar Allocation - 50% to 70% Equity Category Average4 | -13.84 | 4.13 | 6.01 |
| * | Returns for indices reflect no deductions for fees, expenses or taxes, except for foreign withholding taxes where applicable. Results assume reinvestment of all dividends and capital gains. An investment cannot be made directly in an index. |
| 1. | The S&P 500® Index is the Portfolio's primary benchmark. S&P 500® is a trademark of The McGraw-Hill Companies, Inc. The S&P 500® Index is widely regarded as the standard index for measuring large-cap U.S. stock market performance. |
| 2. | The Portfolio has selected the Bloomberg U.S. Aggregate Bond Index as a secondary benchmark. The Bloomberg U.S. Aggregate Bond Index is a broad-based benchmark that measures performance of the investment-grade, U.S. dollar denominated, fixed-rate taxable bond market, including Treasurys, government-related and corporate securities, mortgage-backed securities (agency fixed-rate and hybrid adjustable-rate mortgage pass-throughs), asset-backed securities and commercial mortgage-backed securities. |
| 3. | The Portfolio has selected the Janus Balanced Composite Index as an additional benchmark. The Janus Balanced Composite Index consists of the S&P 500® Index (55% weighted) and the Bloomberg U.S. Aggregate Bond Index (45% weighted). |
| 4. | The Morningstar Allocation – 50% to 70% Equity Category Average is representative of funds that seek to provide both income and capital appreciation by investing in multiple asset classes, including stocks, bonds, and cash. These funds are dominated by domestic holdings and have equity exposures between 50% and 70%. Results are based on average total returns of similar funds with all dividends and capital gain distributions reinvested. |
Cost in Dollars of a $1,000 Investment in MainStay VP Janus Henderson Balanced Portfolio (Unaudited)
The example below is intended to describe the fees and expenses borne by shareholders during the six-month period from July 1, 2022 to December 31, 2022, and the impact of those costs on your investment.
Example
As a shareholder of the Portfolio you incur two types of costs: (1) transaction costs, including exchange fees and sales charges (loads) on purchases (as applicable), and (2) ongoing costs, including management fees, distribution and/or service (12b-1) fees and other Portfolio expenses (as applicable). This example is intended to help you understand your ongoing costs (in dollars) of investing in the Portfolio and to compare these costs with the ongoing costs of investing in other mutual funds. The example is based on an investment of $1,000 made at the beginning of the six-month period and held for the entire period from July 1, 2022 to December 31, 2022. Shares are only sold in connection with variable life and annuity contracts and the example does not reflect any contract level or transactional fees or expenses. If these costs had been included, your costs would have been higher.
This example illustrates your Portfolio’s ongoing costs in two ways:
Actual Expenses
The second and third data columns in the table below provide information about actual account values and actual expenses. You may use the information in these columns, together with the amount you invested, to estimate the expenses that you paid during the six months ended
December 31, 2022. Simply divide your account value by $1,000 (for example, an $8,600 account value divided by $1,000 = 8.6), then multiply the result by the number under the heading entitled “Expenses Paid During Period” to estimate the expenses you paid on your account during this period.
Hypothetical Example for Comparison Purposes
The fourth and fifth data columns in the table below provide information about hypothetical account values and hypothetical expenses based on the Portfolio’s actual expense ratio and an assumed rate of return of 5% per year before expenses, which is not the Portfolio’s actual return. The hypothetical account values and expenses may not be used to estimate the actual ending account balances or expenses you paid for the six-month period shown. You may use this information to compare the ongoing costs of investing in the Portfolio with the ongoing costs of investing in other mutual funds. To do so, compare this 5% hypothetical example with the 5% hypothetical examples that appear in the shareholder reports of the other mutual funds.
Please note that the expenses shown in the table are meant to highlight your ongoing costs only and do not reflect any transactional costs, such as exchange fees or sales charges (loads). Therefore, the fourth and fifth data columns of the table are useful in comparing ongoing costs only and will not help you determine the relative total costs of owning different funds. In addition, if these transactional costs were included, your costs would have been higher.
| Share Class | Beginning
Account
Value
7/1/22 | Ending Account
Value (Based
on Actual
Returns and
Expenses)
12/31/22 | Expenses
Paid
During
Period1 | Ending Account
Value (Based
on Hypothetical
5% Annualized
Return and
Actual Expenses)
12/31/22 | Expenses
Paid
During
Period1 | Net Expense
Ratio
During
Period2 |
| Initial Class Shares | $1,000.00 | $1,008.80 | $2.89 | $1,022.33 | $2.91 | 0.57% |
| Service Class Shares | $1,000.00 | $1,007.50 | $4.15 | $1,021.07 | $4.18 | 0.82% |
| 1. | Expenses are equal to the Portfolio’s annualized expense ratio of each class multiplied by the average account value over the period, divided by 365 and multiplied by 184 (to reflect the six-month period). The table above represents the actual expenses incurred during the six-month period. In addition to the fees and expenses which the Portfolio bears directly, it also indirectly bears a pro rata share of the fees and expenses of the underlying funds in which it invests. Such indirect expenses are not included in the above-reported expense figures. |
| 2. | Expenses are equal to the Portfolio's annualized expense ratio to reflect the six-month period. |
| 6 | MainStay VP Janus Henderson Balanced Portfolio |
Portfolio Composition as of December 31, 2022 (Unaudited)
See Portfolio of Investments beginning on page 11 for specific holdings within these categories. The Portfolio's holdings are subject to change.
Top Ten Holdings and/or Issuers Held as of December 31, 2022 (excluding short-term investments) (Unaudited)
| 1. | U.S. Treasury Notes, 0.875%-4.50%, due 9/30/24–11/15/32 |
| 2. | U.S. Treasury Bonds, 1.75%-4.00%, due 8/15/41–8/15/52 |
| 3. | UMBS, 30 Year, 2.50%-6.00%, due 2/1/37–12/1/52 |
| 4. | Microsoft Corp. |
| 5. | UMBS, Single Family, 30 Year, 2.50%-5.50%, due 1/25/53 |
| 6. | Apple, Inc. |
| 7. | UnitedHealth Group, Inc. |
| 8. | UMBS Pool, 30 Year, 2.50%-6.00%, due 4/1/40–11/1/52 |
| 9. | Mastercard, Inc., Class A |
| 10. | Alphabet, Inc., Class C |
Portfolio Management Discussion and Analysis (Unaudited)
Answers to the questions reflect the views of portfolio managers Michael Keough, Jeremiah Buckley, CFA, and Greg Wilensky, CFA, of Janus Henderson Investors US LLC (“Janus Henderson”) (formerly known as Janus Capital Management LLC), the Portfolio’s Subadvisor.
How did MainStay VP Janus Henderson Balanced Portfolio perform relative to its benchmarks and peers during the 12 months ended December 31, 2022?
For the 12 months ended December 31, 2022, MainStay VP Janus Henderson Balanced Portfolio returned −16.39% for Initial Class shares and −16.60% for Service Class shares. Over the same period, both share classes outperformed the −18.11% return of the S&P 500® Index, which is the Portfolio’s primary benchmark, and underperformed the −13.01% return of the Bloomberg U.S. Aggregate Bond Index, which is a secondary benchmark of the Portfolio. For the 12 months ended December 31, 2022, both share classes underperformed the −15.52% return of the Janus Balanced Composite Index, which is an additional benchmark of the Portfolio, and the −13.84% return of the Morningstar Allocation—50% to 70% Equity Category Average.1
During the reporting period, were there any market events that materially impacted the Portfolio’s performance or liquidity?
Volatility was prevalent across asset classes as the U.S. Federal Reserve (the “Fed”) sought to bring inflation back within its target range through aggressive tightening. Rate hikes and continued hawkish rhetoric had markets weighing the potential for recession versus a soft landing for the economy. Both rates and risk assets sold off during the reporting period, contributed to the Portfolio’s negative return.(Contributions take weightings and total returns into account.)
What factors affected the Portfolio’s performance relative to its primary prospectus benchmark during the reporting period?
The Portfolio outperformed the S& P 500® Index as the Portfolio’s dynamically adjusted allocation to fixed-income securities bolstered relative results at a time in which bonds, although negative, outperformed equities. The Portfolio underperformed the Janus Balanced Composite Index, a blended benchmark of the S&P 500® Index (55%) and the Bloomberg U.S. Aggregate Bond Index (45%), partly due to the Portfolio’s bias in favor of equities during the first half of the reporting period. The Portfolio shifted to a more cautious stance later in the reporting period.
During the reporting period, which sectors were the strongest positive contributors to relative performance in the equity portion of Portfolio and which sectors were particularly weak?
The consumer discretionary sector made the strongest positive contribution to the equity portion of the Portfolio relative to S&P 500® Index due to strong stock selection. Stock selection and
overweight allocation made industrials the second-strongest contributing sector held in the Portfolio's equity allocation. Stock selection made financials the third-strongest contributing sector held in the Portfolio's equity allocation.
The equity portion of Portfolio held materially underweight exposure to the strong-performing energy sector, which caused energy to be the weakest contributor relative to the S&P 500® Index. Stock selection and an overweight allocation caused information technology to be the second-weakest contributor, followed by materials, also based on stock selection and an underweight allocation. A zero-weight allocation to the utility sector also detracted from relative performance.
During the reporting period, which individual stocks made the strongest positive contributions to the absolute performance of the equity portion of the Portfolio and which individual stocks detracted the most?
Shares in pharmaceutical company Eli Lilly and Company made the strongest positive contribution to the absolute performance of the equity portion of the Portfolio. Due to their more defensive nature, health care names generally held up relatively well in prevailing negative market conditions. Additionally, Eli Lilly posted strong results, reporting success with its product portfolio and pipeline, including treatments for diabetes and a new therapy for obesity that demonstrated efficacy in clinical trials.
Pharmaceutical company Merck & Co was the second-strongest positive contributor to absolute performance, also aided by its more defensive nature. The company markets Keytruda, a leading checkpoint inhibitor for the treatment of certain cancers, including melanoma and non-small cell lung cancer. The market also rewarded the company’s acquisition of Acceleron Pharma, which should help bolster and diversify Merck’s pipeline, and its better-than-expected sales of Lagevrio, an oral antiviral treatment for COVID-19.
Insurance company Progressive was the third-strongest positive contributor to absolute performance. After facing inflation earlier than the rest of the economy, the insurance industry focused on raising prices, which improved the outlook for margins. Progressive also demonstrated better growth than its peers, aided by its direct-to-consumer relationships.
The weakest contribution to absolute performance came from holdings in software and cloud services company Microsoft, the largest position in the equity portion of the Portfolio. After being strongly rewarded during the pandemic, high-growth and richly valued stocks were hit particularly hard during the reporting period as investors assessed the impacts of higher interest rates. Shares in Microsoft declined along with those of many other growth-oriented technology names.
| 1. | See page 5 for more information on benchmark and peer group returns. |
| 8 | MainStay VP Janus Henderson Balanced Portfolio |
Technology conglomerate Alphabet, the parent company of Google, was the second-weakest contributor to absolute performance, with shares losing ground along with shares of many other growth-oriented technology companies. Alphabet was another of the largest positions in the equity portion of the Portfolio.
E-commerce company Amazon was the third-weakest contributor to absolute performance. During the reporting period, e-commerce spending, which spiked during the pandemic, matured to some extent. As demand for goods relative to services cooled, Amazon also dealt with higher labor costs and excess capacity in its infrastructure network, driving shares lower. In late October 2022, the company reported third-quarter earnings that broadly missed analysts’ consensus estimates. It also issued cautious guidance.
Did the equity portion of the Portfolio make any significant purchases or sales during the reporting period?
The equity portion of the Portfolio initiated a position in investment bank and financial services company JPMorgan Chase & Co. Banking stocks were weak during the reporting period based on concerns regarding capital requirements, the implications of a possible recession, and what that would mean for credit quality. Compared with other banks, JPMorgan also had more capital markets exposure, which caused additional weakness in the first half of the period. We believed the market was missing the benefits that the company could see from the growth in net interest income given the rise in rates. In our opinion, market conditions presented an attractive opportunity to buy a position in a high-quality bank that can gain market share and return capital to shareholders. The Portfolio also initiated a position in integrated oil and gas company Chevron. Significant earnings power and improved capital discipline made the energy sector, including Chevron, more attractive for the Portfolio; however, energy exposure remained selective.
The equity portion of the Portfolio exited its position in software company Adobe after reducing exposure throughout the reporting period. Concerns over the company’s valuation, coupled with increased competition, potential end-market weakness and the company’s $20 billion acquisition of Figma, contributed to the decision. The Portfolio also exited its position in cloud-based software company Salesforce. Concerns regarding the company’s valuation relative to its growth prospects, along with concerns related to its long-term asset allocation and capital allocation strategy, led to the sale.
How did sector weightings change in the equity portion of the Portfolio during the reporting period?
During the reporting period, the equity portion of the Portfolio increased its exposure to financials, industrials, health care and energy, while decreasing its exposure to information technology and communication services.
How was the equity portion of the Portfolio positioned at the end of the reporting period?
As of December 31, 2022, the largest overweight position in the equity portion of the Portfolio was in the consumer discretionary sector. The second largest overweight position was in industrials. The most significantly underweight positions as of the same date were in energy and real estate. As of December 31, 2022, the equity portion of the Portfolio did not hold stocks in the utilities sectors.
What was the duration2 strategy of the fixed-income portion of the Portfolio during the reporting period?
The fixed-income portion of the Portfolio entered 2022 with underweight exposure to duration relative to the Bloomberg U.S. Aggregate Bond Index based on the expectation that an improving job market and rising inflation would prompt the Fed to begin removing their highly accommodative monetary policy, resulting in an increase in interest rates and a flatter yield curve. Treasury rates did rise—sharply—and rode the proverbial rollercoaster during the reporting period. We actively managed the Portfolio’s duration amid the volatility but maintained, on average, lower duration than the Bloomberg U.S. Aggregate Bond Index, which strongly contributed to relative outperformance. By year-end, we had reduced the Portfolio’s Treasury curve flattened position; we ended the reporting period with marginally short duration versus the Bloomberg U.S. Aggregate Bond Index, with positioning that we believed would balance the opposing forces of high inflation and a hawkish Fed with the growing likelihood of a recession. As of December 31, 2022, the duration of the fixed-income portion of the Portfolio was 5.78 years, or approximately 95% that of the Bloomberg U.S. Aggregate Bond Index.
What specific factors, risks or market forces prompted significant decisions for the fixed-income portion of the Portfolio during the reporting period?
During 2022, as the possibility of an economic slowdown increased, we took steps to improve the overall credit quality of the fixed-income portion of the Portfolio. While out-of-Index exposure to corporate high-yield bonds was reduced to cycle lows, the sector detracted on an asset allocation basis. Security selection within investment-grade corporates further detracted,
| 2. | Duration is a measure of the price sensitivity of a fixed-income investment to changes in interest rates. Duration is expressed as a number of years and is considered a more accurate sensitivity gauge than average maturity. |
particularly among financials. Despite this relative underperformance, we continued to prefer financials over industrials within investment-grade corporates.
Early in the reporting period, we redeployed Portfolio assets to mortgage-backed securities (MBS), as the asset class came under excessive pressure from high interest-rate volatility and concerns about future excess supply due to the Fed’s looming quantitative tightening program. Broad-based selling in the MBS market afforded the opportunity to purchase assets we believed would offer favorable risk-adjusted returns. Security selection within MBS enhanced the relative returns for the Portfolio’s fixed income allocation over the reporting period.
As we reduced the Portfolio’s exposure to corporates, we added to a growing overweight position in securitized sectors, believing spreads on securitized assets had widened to levels that better reflected the risk of an economic slowdown or recession. In contrast, corporate spreads continued to trade near their long-term averages and, in our opinion, were pricing in either a low probability of recession or an extremely shallow recession.
Overall spread risk positioning detracted as spreads widened over the reporting period, and the fixed-income portion of the Portfolio generally maintained more spread risk than the Bloomberg U.S. Aggregate Bond Index. However, the fixed-income portion of the Portfolio outperformed the Index due in large part to interest-rate risk positioning, as detailed above.
During the reporting period, which market segments made the strongest positive contributions to the performance of the fixed-income portion of the Portfolio and which market segments were particularly weak?
Strong security selection within MBS was among the top relative contributors to performance for the fixed-income portion of the Portfolio. Out-of-index exposures to Treasury Inflation-Protected Securities (TIPS) and bank loans were modest positive contributors, although the Portfolio exited both positions early in the reporting period.
The Portfolio’s overall spread risk positioning detracted on a relative basis as spreads widened, and the Portfolio generally maintained more spread risk than the Bloomberg U.S. Aggregate Bond Index. Though we reduced the Portfolio’s fixed income allocation to cycle lows, out-of-Index exposure to corporate high-yield bonds was among the largest detractors amid the reporting period’s volatility. Security selection within investment-grade corporates further detracted, particularly among financials holdings.
Did the fixed-income portion of the Portfolio make any significant purchases or sales during the reporting period?
As the year progressed and the possibility of an economic slowdown increased, we continued to improve the overall credit quality of the fixed income portion of the Portfolio. We materially reduced corporate credit exposure, particularly in high-yield and the lowest tier of investment-grade ratings. As we reduced corporate exposure, we added to securitized sectors, particularly within MBS, believing spreads on securitized assets had widened to levels that better reflected the risk of an economic slowdown or recession. In contrast, corporate spreads continue to trade near their long-term averages and, in our opinion, were pricing in either a low probability of recession or an extremely shallow recession.
During the reporting period, how did sector (or industry) weightings change in the fixed-income portion of the Portfolio?
Generally, we preferred financials over industrials within investment-grade corporates. On a corporate-industry basis, the fixed-income portion of the Portfolio ended the reporting period with a modestly higher allocation to banking and consumer products. The fixed income portion of the Portfolio reduced exposure to the technology and food & beverage industries.
How was the fixed-income portion of the Portfolio positioned at the end of the reporting period?
As of December 31, 2022, relative to the Bloomberg U.S. Aggregate Bond Index, the fixed-income portion of the Portfolio held underweight exposure to Treasury securities and corporate credit, and overweight exposure to MBS, asset-backed securities and commercial mortgage-backed securities. The fixed-income portion of the Portfolio held out-of-Index positions in high-yield corporate credit, collateralized mortgage obligations, collateralized loan obligations and cash. The fixed income portion of the Portfolio did not own government-related bonds.
The opinions expressed are those of the portfolio managers as of the date of this report and are subject to change. There is no guarantee that any forecasts will come to pass. This material does not constitute investment advice and is not intended as an endorsement of any specific investment.
Not all MainStay VP Portfolios and/or share classes are available under all policies.
| 10 | MainStay VP Janus Henderson Balanced Portfolio |
Portfolio of Investments December 31, 2022†
| | Principal
Amount | Value |
| Long-Term Bonds 43.2% |
| Asset-Backed Securities 3.0% |
| Automobile Asset-Backed Securities 0.7% |
| ACC Auto Trust | |
| Series 2022-A, Class A | | |
| 4.58%, due 7/15/26 (a) | $ 422,532 | $ 415,249 |
| ACM Auto Trust | |
| Series 2022-1A, Class A | | |
| 3.23%, due 4/20/29 (a) | 148,822 | 148,440 |
| Arivo Acceptance Auto Loan Receivables Trust | |
| Series 2022-1A, Class A | | |
| 3.93%, due 5/15/28 (a) | 390,346 | 379,019 |
| Carvana Auto Receivables Trust | |
| Series 2021-P4, Class A2 | | |
| 0.82%, due 4/10/25 | 305,415 | 302,422 |
| Exeter Automobile Receivables Trust | |
| Series 2021-1A, Class D | | |
| 1.08%, due 11/16/26 | 674,000 | 630,117 |
| Series 2019-1A, Class E | | |
| 5.20%, due 1/15/26 (a) | 485,000 | 480,854 |
| Foursight Capital Automobile Receivables Trust | |
| Series 2021-1, Class B | | |
| 0.87%, due 1/15/26 (a) | 424,000 | 416,690 |
| JPMorgan Chase Bank NA (a) | |
| Series 2021-1, Class B | | |
| 0.875%, due 9/25/28 | 188,414 | 182,134 |
| Series 2021-2, Class B | | |
| 0.889%, due 12/26/28 | 421,974 | 403,281 |
| LAD Auto Receivables Trust (a) | |
| Series 2021-1A, Class A | | |
| 1.30%, due 8/17/26 | 363,878 | 353,618 |
| Series 2022-1A, Class A | | |
| 5.21%, due 6/15/27 | 1,230,183 | 1,210,479 |
| Lendbuzz Securitization Trust | |
| Series 2022-1A, Class A | | |
| 4.22%, due 5/17/27 (a) | 995,766 | 952,972 |
| Santander Bank Auto Credit-Linked Notes (a) | |
| Series 2022-A, Class B | | |
| 5.281%, due 5/15/32 | 818,027 | 798,615 |
| Series 2022-B, Class A2 | | |
| 5.587%, due 8/16/32 | 321,713 | 320,576 |
| Santander Bank NA-SBCLN | |
| Series 2021-1A, Class B | | |
| 1.833%, due 12/15/31 (a) | 208,215 | 200,268 |
| Santander Drive Auto Receivables Trust | |
| Series 2020-3, Class D | | |
| 1.64%, due 11/16/26 | 1,630,000 | 1,562,704 |
| | Principal
Amount | Value |
| |
| Automobile Asset-Backed Securities (continued) |
| Tesla Auto Lease Trust (a) | |
| Series 2021-B, Class A3 | | |
| 0.60%, due 9/22/25 | $ 503,000 | $ 473,935 |
| Series 2021-B, Class B | | |
| 0.91%, due 9/22/25 | 258,000 | 240,694 |
| Tricolor Auto Securitization Trust | |
| Series 2022-1A, Class A | | |
| 3.30%, due 2/18/25 (a) | 120,653 | 119,347 |
| Westlake Automobile Receivables Trust | |
| Series 2020-1A, Class D | | |
| 2.80%, due 6/16/25 (a) | 741,000 | 727,259 |
| | | 10,318,673 |
| Credit Card Asset-Backed Security 0.1% |
| Mercury Financial Credit Card Master Trust | |
| Series 2021-1A, Class A | | |
| 1.54%, due 3/20/26 (a) | 842,000 | 803,314 |
| Other Asset-Backed Securities 2.2% |
| Affirm Asset Securitization Trust | |
| Series 2021-B, Class A | | |
| 1.03%, due 8/17/26 (a) | 721,000 | 683,804 |
| Aqua Finance Trust | |
| Series 2021-A, Class A | | |
| 1.54%, due 7/17/46 (a) | 321,779 | 294,206 |
| ARES LX CLO Ltd. | |
| Series 2021-60A, Class A | | |
| 5.314% (3 Month LIBOR + 1.12%), due 7/18/34 (a)(b) | 322,000 | 313,209 |
| Barings CLO Ltd. (a)(b) | |
| Series 2018-3A, Class A1 | | |
| 5.193% (3 Month LIBOR + 0.95%), due 7/20/29 | 584,073 | 579,467 |
| Series 2019-3A, Class A1R | | |
| 5.313% (3 Month LIBOR + 1.07%), due 4/20/31 | 1,338,000 | 1,318,960 |
| CBAM Ltd. (a)(b) | |
| Series 2019-11RA, Class A1 | | |
| 5.423% (3 Month LIBOR + 1.18%), due 1/20/35 | 1,569,000 | 1,527,484 |
| Series 2019-11RA, Class B | | |
| 5.993% (3 Month LIBOR + 1.75%), due 1/20/35 | 400,456 | 380,715 |
| Cedar Funding XI CLO Ltd. | |
| Series 2019-11A, Class A1R | | |
| 5.786% (3 Month LIBOR + 1.05%), due 5/29/32 (a)(b) | 508,000 | 498,163 |
The notes to the financial statements are an integral part of, and should be read in conjunction with, the financial statements.
11
Portfolio of Investments December 31, 2022† (continued)
| | Principal
Amount | Value |
| Asset-Backed Securities (continued) |
| Other Asset-Backed Securities (continued) |
| CF Hippolyta Issuer LLC (a) | |
| Series 2021-1A, Class A1 | | |
| 1.53%, due 3/15/61 | $ ��961,238 | $ 831,163 |
| Series 2021-1A, Class B1 | | |
| 1.98%, due 3/15/61 | 363,557 | 303,115 |
| Series 2022-1A, Class A1 | | |
| 5.97%, due 8/15/62 | 1,269,940 | 1,241,030 |
| Series 2022-1A, Class A2 | | |
| 6.11%, due 8/15/62 | 2,928,658 | 2,750,294 |
| CIFC Funding Ltd. (a)(b) | |
| Series 2021-4A, Class A | | |
| 5.129% (3 Month LIBOR + 1.05%), due 7/15/33 | 1,174,946 | 1,156,515 |
| Series 2018-3A, Class A | | |
| 5.294% (3 Month LIBOR + 1.10%), due 7/18/31 | 603,000 | 593,287 |
| Series 2021-7A, Class A1 | | |
| 5.455% (3 Month LIBOR + 1.13%), due 1/23/35 | 483,000 | 470,574 |
| Series 2021-7A, Class B | | |
| 5.925% (3 Month LIBOR + 1.60%), due 1/23/35 | 323,837 | 309,215 |
| Conn's Receivables Funding LLC | |
| Series 2021-A, Class A | | |
| 1.05%, due 5/15/26 (a) | 693 | 692 |
| Consumer Loan Underlying Bond CLUB Credit Trust | |
| Series 2019-P2, Class C | | |
| 4.41%, due 10/15/26 (a) | 253,758 | 252,281 |
| CP EF Asset Securitization I LLC | |
| Series 2022-1A, Class A | | |
| 5.96%, due 4/15/30 (a) | 516,435 | 508,007 |
| Diamond Infrastructure Funding LLC | |
| Series 2021-1A, Class A | | |
| 1.76%, due 4/15/49 (a) | 1,031,000 | 844,478 |
| Domino's Pizza Master Issuer LLC | |
| Series 2018-1A, Class A2I | | |
| 4.116%, due 7/25/48 (a) | 888,960 | 841,473 |
| Elmwood CLO II Ltd. | |
| Series 2019-2A, Class AR | | |
| 5.393% (3 Month LIBOR + 1.15%), due 4/20/34 (a)(b) | 485,000 | 473,527 |
| FREED ABS Trust | |
| Series 2022-3FP, Class A | | |
| 4.50%, due 8/20/29 (a) | 468,125 | 466,597 |
| | Principal
Amount | Value |
| |
| Other Asset-Backed Securities (continued) |
| HPS Loan Management Ltd. | |
| Series 2021-16A, Class B | | |
| 6.025% (3 Month LIBOR + 1.70%), due 1/23/35 (a)(b) | $ 310,367 | $ 295,008 |
| Libra Solutions LLC (a) | |
| Series 2022-1A, Class A | | |
| 4.75%, due 5/15/34 | 361,177 | 354,318 |
| Series 2022-2A, Class A | | |
| 6.85%, due 10/15/34 | 382,203 | 380,173 |
| LL ABS Trust | |
| Series 2022-2A, Class A | | |
| 6.63%, due 5/15/30 (a) | 382,145 | 380,747 |
| Logan CLO II Ltd. | |
| Series 2021-2A, Class A | | |
| 5.393% (3 Month LIBOR + 1.15%), due 1/20/35 (a)(b) | 761,109 | 739,210 |
| Madison Park Funding XXXV Ltd. | |
| Series 2019-35A, Class A1R | | |
| 5.233% (3 Month LIBOR + 0.99%), due 4/20/32 (a)(b) | 689,000 | 677,146 |
| New Economy Assets Phase 1 Sponsor LLC | |
| Series 2021-1, Class B1 | | |
| 2.41%, due 10/20/61 (a) | 514,000 | 422,259 |
| NRZ Excess Spread-Collateralized Notes (a) | |
| Series 2021-FHT1, Class A | | |
| 3.104%, due 7/25/26 | 605,546 | 528,491 |
| Series 2020-PLS1, Class A | | |
| 3.844%, due 12/25/25 | 238,257 | 217,132 |
| Oak Street Investment Grade Net Lease Fund | |
| Series 2020-1A, Class A1 | | |
| 1.85%, due 11/20/50 (a) | 807,554 | 716,730 |
| Octagon Investment Partners 48 Ltd. | |
| Series 2020-3A, Class AR | | |
| 5.393% (3 Month LIBOR + 1.15%), due 10/20/34 (a)(b) | 454,000 | 441,645 |
| Pagaya AI Debt Trust | |
| Series 2022-1, Class A | | |
| 2.03%, due 10/15/29 (a) | 513,539 | 493,095 |
| Regatta XXIII Funding Ltd. | |
| Series 2021-4A, Class B | | |
| 5.943% (3 Month LIBOR + 1.70%), due 1/20/35 (a)(b) | 343,955 | 327,745 |
| Sound Point CLO XXII Ltd. | |
| Series 2019-1A, Class AR | | |
| 5.323% (3 Month LIBOR + 1.08%), due 1/20/32 (a)(b) | 1,556,000 | 1,522,835 |
The notes to the financial statements are an integral part of, and should be read in conjunction with, the financial statements.
| 12 | MainStay VP Janus Henderson Balanced Portfolio |
| | Principal
Amount | Value |
| Asset-Backed Securities (continued) |
| Other Asset-Backed Securities (continued) |
| Theorem Funding Trust | |
| Series 2021-1A, Class A | | |
| 1.21%, due 12/15/27 (a) | $ 515,386 | $ 507,096 |
| THL Credit Wind River CLO Ltd. | |
| Series 2019-1A, Class AR | | |
| 5.403% (3 Month LIBOR + 1.16%), due 7/20/34 (a)(b) | 448,000 | 434,464 |
| Upstart Securitization Trust (a) | |
| Series 2021-4, Class A | | |
| 0.84%, due 9/20/31 | 326,741 | 316,293 |
| Series 2021-5, Class A | | |
| 1.31%, due 11/20/31 | 223,079 | 213,543 |
| Series 2022-1, Class A | | |
| 3.12%, due 3/20/32 | 970,609 | 935,291 |
| Series 2022-2, Class A | | |
| 4.37%, due 5/20/32 | 1,432,474 | 1,400,459 |
| Vantage Data Centers Issuer LLC | |
| Series 2020-1A, Class A2 | | |
| 1.645%, due 9/15/45 (a) | 1,091,000 | 962,179 |
| Vantage Data Centers LLC | |
| Series 2020-2A, Class A2 | | |
| 1.992%, due 9/15/45 (a) | 705,000 | 579,175 |
| VCAT LLC | |
| Series 2021-NPL1, Class A1 | | |
| 2.289%, due 12/26/50 (a)(c) | 174,606 | 164,821 |
| Westgate Resorts LLC | |
| Series 2022-1A, Class A | | |
| 1.788%, due 8/20/36 (a) | 298,682 | 281,456 |
| | | 29,929,567 |
Total Asset-Backed Securities
(Cost $42,900,065) | | 41,051,554 |
| Corporate Bonds 7.9% |
| Aerospace & Defense 0.0% ‡ |
| General Dynamics Corp. | | |
| 3.50%, due 4/1/27 | 456,000 | 435,659 |
| Banks 3.3% |
| Bank of America Corp. (d) | | |
| 2.087%, due 6/14/29 | 1,528,000 | 1,285,803 |
| 2.592%, due 4/29/31 | 1,551,000 | 1,263,190 |
| 3.705%, due 4/24/28 | 509,000 | 471,025 |
| 3.97%, due 3/5/29 | 670,000 | 618,226 |
| 4.376%, due 4/27/28 | 1,835,000 | 1,754,853 |
| | Principal
Amount | Value |
| |
| Banks (continued) |
| Bank of America Corp. (d) (continued) | | |
| Series U | | |
| 5.20%, due 6/1/23 (e) | $ 443,000 | $ 429,268 |
| 6.204%, due 11/10/28 | 1,776,000 | 1,833,670 |
| Series X | | |
| 6.25%, due 9/5/24 (e) | 1,172,000 | 1,125,543 |
| Bank of Montreal | | |
| 3.088% (5 Year Treasury Constant Maturity Rate + 1.40%), due 1/10/37 (b) | 3,042,000 | 2,300,068 |
| BNP Paribas SA (a)(d) | | |
| 2.591%, due 1/20/28 | 728,000 | 640,278 |
| 3.132%, due 1/20/33 (f) | 622,000 | 491,109 |
| Citigroup, Inc. (d) | | |
| 3.887%, due 1/10/28 | 2,060,000 | 1,925,004 |
| 4.412%, due 3/31/31 | 1,375,000 | 1,262,658 |
| Series D | | |
| 5.35%, due 5/15/23 (e) | 537,000 | 523,255 |
| Series P | | |
| 5.95%, due 5/15/25 (e) | 584,000 | 526,009 |
| Series M | | |
| 6.30%, due 5/15/24 (e) | 123,000 | 116,020 |
| Commonwealth Bank of Australia | | |
| 3.784%, due 3/14/32 (a) | 1,307,000 | 1,077,338 |
| First Republic Bank | | |
| 4.625%, due 2/13/47 | 391,000 | 303,416 |
| Goldman Sachs Group, Inc. (The) | | |
| 3.50%, due 4/1/25 | 2,399,000 | 2,306,980 |
| JPMorgan Chase & Co. (d) | | |
| 2.956%, due 5/13/31 | 1,316,000 | 1,084,326 |
| 2.963%, due 1/25/33 | 2,061,000 | 1,677,452 |
| 4.565%, due 6/14/30 | 1,056,000 | 993,553 |
| Series HH | | |
| 4.60%, due 2/1/25 (e) | 466,000 | 410,662 |
| Series FF | | |
| 5.00%, due 8/1/24 (e) | 441,000 | 403,484 |
| 5.717%, due 9/14/33 | 2,323,000 | 2,267,372 |
| Mitsubishi UFJ Financial Group, Inc. (b) | | |
| 4.788% (1 Year Treasury Constant Maturity Rate + 1.70%), due 7/18/25 | 931,000 | 921,720 |
| 5.017% (1 Year Treasury Constant Maturity Rate + 1.95%), due 7/20/28 | 1,562,000 | 1,524,707 |
| Morgan Stanley | | |
| 1.593%, due 5/4/27 (d) | 685,000 | 600,906 |
| 1.794%, due 2/13/32 (d) | 1,226,000 | 921,413 |
The notes to the financial statements are an integral part of, and should be read in conjunction with, the financial statements.
13
Portfolio of Investments December 31, 2022† (continued)
| | Principal
Amount | Value |
| Corporate Bonds (continued) |
| Banks (continued) |
| Morgan Stanley (continued) | | |
| 2.188%, due 4/28/26 (d) | $ 1,231,000 | $ 1,143,925 |
| 2.239%, due 7/21/32 (d) | 1,900,000 | 1,457,669 |
| 2.484%, due 9/16/36 (d) | 1,965,000 | 1,424,883 |
| 2.943%, due 1/21/33 (d) | 2,235,000 | 1,808,066 |
| 4.35%, due 9/8/26 | 898,000 | 871,278 |
| National Australia Bank Ltd. | | |
| 2.99%, due 5/21/31 (a) | 1,708,000 | 1,336,979 |
| Nordea Bank Abp | | |
| 5.375%, due 9/22/27 (a) | 1,834,000 | 1,842,461 |
| SVB Financial Group (b)(e) | | |
| Series C | | |
| 4.00% (5 Year Treasury Constant Maturity Rate + 3.202%), due 5/15/26 | 276,000 | 182,165 |
| 4.10% (10 Year Treasury Constant Maturity Rate + 3.064%), due 2/15/31 | 1,382,000 | 790,948 |
| Series D | | |
| 4.25% (5 Year Treasury Constant Maturity Rate + 3.074%), due 11/15/26 | 2,139,000 | 1,403,288 |
| U.S. Bancorp | | |
| 2.491% (5 Year Treasury Constant Maturity Rate + 0.95%), due 11/3/36 (b) | 1,471,000 | 1,119,389 |
| Westpac Banking Corp. | | |
| 2.668% (5 Year Treasury Constant Maturity Rate + 1.75%), due 11/15/35 (b) | 1,218,000 | 905,286 |
| | | 45,345,645 |
| Beverages 0.1% |
| Diageo Capital plc | | |
| 1.375%, due 9/29/25 | 461,000 | 422,692 |
| 2.00%, due 4/29/30 | 713,000 | 585,647 |
| | | 1,008,339 |
| Biotechnology 0.2% |
| CSL Finance plc (a) | | |
| 3.85%, due 4/27/27 | 364,000 | 348,213 |
| 4.05%, due 4/27/29 | 753,000 | 709,730 |
| Illumina, Inc. | | |
| 5.80%, due 12/12/25 | 707,000 | 711,804 |
| Royalty Pharma plc | | |
| 3.55%, due 9/2/50 | 899,000 | 574,509 |
| | | 2,344,256 |
| | Principal
Amount | Value |
| |
| Commercial Services 0.4% |
| CoStar Group, Inc. | | |
| 2.80%, due 7/15/30 (a) | $ 711,000 | $ 580,666 |
| Global Payments, Inc. | | |
| 2.15%, due 1/15/27 | 651,000 | 567,901 |
| 2.90%, due 11/15/31 | 977,000 | 770,431 |
| 4.80%, due 4/1/26 | 629,000 | 612,008 |
| 5.30%, due 8/15/29 | 1,189,000 | 1,149,490 |
| 5.40%, due 8/15/32 | 539,000 | 513,317 |
| GXO Logistics, Inc. | | |
| 1.65%, due 7/15/26 | 885,000 | 757,717 |
| 2.65%, due 7/15/31 | 135,000 | 99,677 |
| | | 5,051,207 |
| Cosmetics & Personal Care 0.1% |
| GSK Consumer Healthcare Capital US LLC | | |
| 3.375%, due 3/24/27 | 753,000 | 701,010 |
| 3.375%, due 3/24/29 | 480,000 | 431,633 |
| | | 1,132,643 |
| Diversified Financial Services 0.5% |
| AerCap Ireland Capital DAC | | |
| 3.00%, due 10/29/28 | 757,000 | 634,196 |
| 4.625%, due 10/15/27 | 1,147,000 | 1,065,291 |
| Air Lease Corp. | | |
| 1.875%, due 8/15/26 | 1,020,000 | 885,908 |
| 3.00%, due 2/1/30 | 515,000 | 429,496 |
| American Express Co. | | |
| 4.989%, due 5/26/33 (d) | 1,137,000 | 1,092,896 |
| Charles Schwab Corp. (The) | | |
| Series H | | |
| 4.00% (10 Year Treasury Constant Maturity Rate + 3.079%), due 12/1/30 (b)(e) | 661,000 | 527,115 |
| Rocket Mortgage LLC (a) | | |
| 2.875%, due 10/15/26 (f) | 741,000 | 635,157 |
| 3.625%, due 3/1/29 | 708,000 | 561,046 |
| 3.875%, due 3/1/31 | 729,000 | 556,428 |
| 4.00%, due 10/15/33 | 850,000 | 634,831 |
| | | 7,022,364 |
| Electric 0.2% |
| Duke Energy Corp. | | |
| 4.30%, due 3/15/28 | 920,000 | 885,246 |
| Duquesne Light Holdings, Inc. | | |
| 2.775%, due 1/7/32 (a) | 1,005,000 | 786,081 |
| NRG Energy, Inc. | | |
| 3.375%, due 2/15/29 (a) | 1,057,000 | 852,597 |
| | | 2,523,924 |
The notes to the financial statements are an integral part of, and should be read in conjunction with, the financial statements.
| 14 | MainStay VP Janus Henderson Balanced Portfolio |
| | Principal
Amount | Value |
| Corporate Bonds (continued) |
| Electronics 0.1% |
| Trimble, Inc. | | |
| 4.75%, due 12/1/24 | $ 1,238,000 | $ 1,223,793 |
| 4.90%, due 6/15/28 | 672,000 | 644,328 |
| | | 1,868,121 |
| Food 0.2% |
| JBS USA LUX SA (a) | | |
| 3.00%, due 5/15/32 (f) | 795,000 | 609,646 |
| 3.625%, due 1/15/32 | 551,000 | 446,310 |
| 5.50%, due 1/15/30 (f) | 1,130,000 | 1,075,218 |
| Mondelez International, Inc. | | |
| 2.75%, due 4/13/30 | 80,000 | 68,956 |
| | | 2,200,130 |
| Healthcare-Products 0.4% |
| GE HealthCare Technologies, Inc. (a) | | |
| 5.65%, due 11/15/27 | 1,359,000 | 1,374,901 |
| 5.857%, due 3/15/30 | 1,624,000 | 1,661,940 |
| 5.905%, due 11/22/32 | 2,337,000 | 2,421,595 |
| | | 5,458,436 |
| Healthcare-Services 0.5% |
| Centene Corp. | | |
| 2.45%, due 7/15/28 | 1,025,000 | 865,151 |
| 3.00%, due 10/15/30 | 1,079,000 | 884,509 |
| 4.25%, due 12/15/27 | 3,132,000 | 2,937,388 |
| HCA, Inc. | | |
| 5.375%, due 9/1/26 | 220,000 | 217,553 |
| 5.625%, due 9/1/28 | 310,000 | 308,243 |
| 5.875%, due 2/15/26 | 286,000 | 287,805 |
| 5.875%, due 2/1/29 | 459,000 | 457,566 |
| UnitedHealth Group, Inc. | | |
| 5.25%, due 2/15/28 | 598,000 | 611,294 |
| | | 6,569,509 |
| Insurance 0.4% |
| Athene Global Funding (a) | | |
| 2.646%, due 10/4/31 | 1,875,000 | 1,432,415 |
| 2.717%, due 1/7/29 | 1,235,000 | 1,019,803 |
| Brown & Brown, Inc. | | |
| 4.20%, due 3/17/32 | 369,000 | 319,909 |
| 4.95%, due 3/17/52 | 1,071,000 | 869,356 |
| Prudential Financial, Inc. | | |
| 3.70% (5 Year Treasury Constant Maturity Rate + 3.035%), due 10/1/50 (b) | 1,486,000 | 1,254,020 |
| | | 4,895,503 |
| | Principal
Amount | Value |
| |
| Investment Companies 0.1% |
| Ares Capital Corp. | | |
| 2.875%, due 6/15/27 | $ 970,000 | $ 822,097 |
| OWL Rock Core Income Corp. | | |
| 4.70%, due 2/8/27 | 163,000 | 146,978 |
| 7.75%, due 9/16/27 (a) | 973,000 | 969,852 |
| | | 1,938,927 |
| Iron & Steel 0.0% ‡ |
| Reliance Steel & Aluminum Co. | | |
| 4.50%, due 4/15/23 | 469,000 | 468,918 |
| Media 0.1% |
| Charter Communications Operating LLC | | |
| 6.484%, due 10/23/45 | 256,000 | 230,854 |
| Comcast Corp. | | |
| 3.75%, due 4/1/40 | 365,000 | 301,025 |
| Fox Corp. | | |
| 4.03%, due 1/25/24 | 429,000 | 424,025 |
| | | 955,904 |
| Oil & Gas 0.2% |
| EQT Corp. | | |
| 5.678%, due 10/1/25 | 1,066,000 | 1,060,819 |
| 5.70%, due 4/1/28 | 459,000 | 456,534 |
| Southwestern Energy Co. | | |
| 4.75%, due 2/1/32 | 716,000 | 611,886 |
| | | 2,129,239 |
| Pipelines 0.2% |
| Energy Transfer LP | | |
| 4.95%, due 6/15/28 | 116,000 | 112,170 |
| 5.55%, due 2/15/28 | 880,000 | 872,898 |
| 5.75%, due 2/15/33 | 880,000 | 860,957 |
| Hess Midstream Operations LP | | |
| 5.125%, due 6/15/28 (a) | 670,000 | 619,547 |
| | | 2,465,572 |
| Real Estate Investment Trusts 0.2% |
| Agree LP | | |
| 2.00%, due 6/15/28 | 684,000 | 560,081 |
| 2.60%, due 6/15/33 | 513,000 | 386,121 |
| 2.90%, due 10/1/30 | 473,000 | 383,975 |
| Equinix, Inc. | | |
| 2.15%, due 7/15/30 | 623,000 | 495,621 |
| GLP Capital LP | | |
| 5.30%, due 1/15/29 | 86,000 | 81,385 |
| 5.375%, due 4/15/26 | 381,000 | 373,787 |
The notes to the financial statements are an integral part of, and should be read in conjunction with, the financial statements.
15
Portfolio of Investments December 31, 2022† (continued)
| | Principal
Amount | Value |
| Corporate Bonds (continued) |
| Real Estate Investment Trusts (continued) |
| Sun Communities Operating LP | | |
| 2.70%, due 7/15/31 | $ 1,283,000 | $ 1,012,698 |
| | | 3,293,668 |
| Semiconductors 0.3% |
| Analog Devices, Inc. | | |
| 2.95%, due 4/1/25 | 676,000 | 650,173 |
| Marvell Technology, Inc. | | |
| 1.65%, due 4/15/26 | 793,000 | 700,387 |
| 4.875%, due 6/22/28 | 883,000 | 841,602 |
| Microchip Technology, Inc. | | |
| 2.67%, due 9/1/23 | 1,514,000 | 1,485,772 |
| TSMC Arizona Corp. | | |
| 3.875%, due 4/22/27 | 916,000 | 880,564 |
| | | 4,558,498 |
| Software 0.2% |
| MSCI, Inc. (a) | | |
| 3.625%, due 9/1/30 | 1,643,000 | 1,365,744 |
| 3.875%, due 2/15/31 | 1,122,000 | 932,859 |
| 4.00%, due 11/15/29 | 104,000 | 90,587 |
| Workday, Inc. | | |
| 3.50%, due 4/1/27 | 483,000 | 451,397 |
| | | 2,840,587 |
| Telecommunications 0.0% ‡ |
| AT&T, Inc. | | |
| 3.65%, due 9/15/59 | 105,000 | 70,280 |
| 3.80%, due 12/1/57 | 642,000 | 442,937 |
| | | 513,217 |
| Toys, Games & Hobbies 0.2% |
| Hasbro, Inc. | | |
| 3.90%, due 11/19/29 | 2,121,000 | 1,884,899 |
| 5.10%, due 5/15/44 | 614,000 | 522,697 |
| 6.35%, due 3/15/40 | 420,000 | 406,617 |
| | | 2,814,213 |
Total Corporate Bonds
(Cost $123,135,962) | | 107,834,479 |
| Mortgage-Backed Securities 10.2% |
| Agency (Collateralized Mortgage Obligations) 5.0% |
| FNMA | |
| REMIC, Series 2018-27, Class EA | | |
| 3.00%, due 5/25/48 | 559,229 | 502,243 |
| REMIC, Series 2019-71, Class P | | |
| 3.00%, due 11/25/49 | 779,345 | 700,001 |
| | Principal
Amount | Value |
| |
| Agency (Collateralized Mortgage Obligations) (continued) |
| GNMA II, Single Family, 30 Year (g) | |
| 2.50%, due 1/15/53 TBA | $ 8,640,010 | $ 7,485,342 |
| 3.50%, due 1/15/53 TBA | 3,490,939 | 3,206,830 |
| 4.00%, due 1/15/53 TBA | 4,948,685 | 4,681,938 |
| 4.50%, due 1/15/53 TBA | 4,824,848 | 4,679,681 |
| UMBS, Single Family, 15 Year (g) | |
| 2.00%, due 1/25/38 TBA | 2,603,869 | 2,315,437 |
| 2.50%, due 1/25/38 TBA | 1,116,310 | 1,021,287 |
| 3.00%, due 1/25/38 TBA | 404,515 | 378,846 |
| UMBS, Single Family, 30 Year (g) | |
| 2.50%, due 1/25/53 TBA | 250,518 | 212,067 |
| 3.00%, due 1/25/53 TBA | 6,989,873 | 6,132,700 |
| 3.50%, due 1/25/53 TBA | 16,382,155 | 14,879,956 |
| 4.00%, due 1/25/53 TBA | 2,450,000 | 2,297,267 |
| 4.50%, due 1/25/53 TBA | 2,557,749 | 2,461,210 |
| 5.00%, due 1/25/53 TBA | 9,986,395 | 9,838,810 |
| 5.50%, due 1/25/53 TBA | 7,861,942 | 7,881,334 |
| | | 68,674,949 |
| Commercial Mortgage Loans (Collateralized Mortgage Obligations) 2.5% |
| 280 Park Avenue Mortgage Trust | |
| Series 2017-280P, Class A | | |
| 5.117% (1 Month LIBOR + 0.88%), due 9/15/34 (a)(b) | 699,152 | 681,526 |
| BBCMS Mortgage Trust | |
| Series 2017-DELC, Class A | | |
| 5.293% (1 Month LIBOR + 0.975%), due 8/15/36 (a)(b) | 495,000 | 486,262 |
| BBCMS Trust | |
| Series 2015-SRCH, Class A2 | | |
| 4.197%, due 8/10/35 (a) | 875,000 | 813,722 |
| BPR Trust | |
| Series 2022-OANA, Class A | | |
| 6.234% (1 Month SOFR + 1.898%), due 4/15/37 (a)(b) | 1,896,000 | 1,850,491 |
| BX Commercial Mortgage Trust (a)(b) | |
| Series 2021-VINO, Class A | | |
| 4.97% (1 Month LIBOR + 0.652%), due 5/15/38 | 1,119,000 | 1,077,234 |
| Series 2021-VOLT, Class B | | |
| 5.268% (1 Month LIBOR + 0.95%), due 9/15/36 | 937,000 | 883,343 |
| Series 2019-XL, Class A | | |
| 5.37% (1 Month SOFR + 1.034%), due 10/15/36 | 1,332,207 | 1,315,782 |
The notes to the financial statements are an integral part of, and should be read in conjunction with, the financial statements.
| 16 | MainStay VP Janus Henderson Balanced Portfolio |
| | Principal
Amount | Value |
| Mortgage-Backed Securities (continued) |
| Commercial Mortgage Loans (Collateralized Mortgage Obligations) (continued) |
| BX Commercial Mortgage Trust (a)(b) (continued) | |
| Series 2020-VKNG, Class A | | |
| 5.38% (1 Month SOFR + 1.044%), due 10/15/37 | $ 183,076 | $ 178,650 |
| Series 2019-XL, Class B | | |
| 5.53% (1 Month SOFR + 1.194%), due 10/15/36 | 411,400 | 404,148 |
| Series 2021-VOLT, Class D | | |
| 5.968% (1 Month LIBOR + 1.65%), due 9/15/36 | 984,000 | 920,604 |
| BX Trust (a) | |
| Series 2019-OC11, Class B | | |
| 3.605%, due 12/9/41 | 284,000 | 232,831 |
| Series 2019-OC11, Class C | | |
| 3.856%, due 12/9/41 | 564,000 | 464,733 |
| Series 2022-FOX2, Class A2 | | |
| 5.085% (1 Month SOFR + 0.749%), due 4/15/39 (b) | 1,214,000 | 1,118,099 |
| Series 2021-LBA, Class AJV | | |
| 5.118% (1 Month LIBOR + 0.80%), due 2/15/36 (b) | 1,118,000 | 1,062,645 |
| Series 2021-LBA, Class AV | | |
| 5.118% (1 Month LIBOR + 0.80%), due 2/15/36 (b) | 1,122,000 | 1,066,447 |
| BXP Trust | |
| Series 2017-GM, Class A | | |
| 3.379%, due 6/13/39 (a) | 396,000 | 352,349 |
| Cold Storage Trust (a)(b) | |
| Series 2020-ICE5, Class A | | |
| 5.218% (1 Month LIBOR + 0.90%), due 11/15/37 | 1,480,384 | 1,439,494 |
| Series 2020-ICE5, Class B | | |
| 5.618% (1 Month LIBOR + 1.30%), due 11/15/37 | 657,621 | 636,568 |
| Series 2020-ICE5, Class C | | |
| 5.968% (1 Month LIBOR + 1.65%), due 11/15/37 | 660,569 | 639,008 |
| Credit Suisse Mortgage Capital Certificates (a)(b) | |
| Series 2019-ICE4, Class A | | |
| 5.298% (1 Month LIBOR + 0.98%), due 5/15/36 | 1,559,000 | 1,541,799 |
| Series 2019-ICE4, Class C | | |
| 5.748% (1 Month LIBOR + 1.43%), due 5/15/36 | 333,000 | 326,328 |
| | Principal
Amount | Value |
| |
| Commercial Mortgage Loans (Collateralized Mortgage Obligations) (continued) |
| CSMC Trust | |
| Series 2021-WEHO, Class A | | |
| 8.287% (1 Month LIBOR + 3.969%), due 4/15/23 (a)(b) | $ 725,331 | $ 692,624 |
| Extended Stay America Trust (a)(b) | |
| Series 2021-ESH, Class A | | |
| 5.398% (1 Month LIBOR + 1.08%), due 7/15/38 | 527,144 | 511,935 |
| Series 2021-ESH, Class B | | |
| 5.698% (1 Month LIBOR + 1.38%), due 7/15/38 | 339,715 | 326,505 |
| Great Wolf Trust (a)(b) | |
| Series 2019-WOLF, Class A | | |
| 5.352% (1 Month LIBOR + 1.034%), due 12/15/36 | 695,000 | 674,883 |
| Series 2019-WOLF, Class B | | |
| 5.652% (1 Month LIBOR + 1.334%), due 12/15/36 | 303,000 | 292,052 |
| Series 2019-WOLF, Class C | | |
| 5.951% (1 Month LIBOR + 1.633%), due 12/15/36 | 337,000 | 321,736 |
| J.P. Morgan Chase Commercial Mortgage Securities Trust (a) | |
| Series 2020-ACE, Class A | | |
| 3.287%, due 1/10/37 | 1,235,000 | 1,144,573 |
| Series 2020-ACE, Class B | | |
| 3.64%, due 1/10/37 | 840,000 | 760,919 |
| Life Mortgage Trust (a)(b) | |
| Series 2021-BMR, Class A | | |
| 5.018% (1 Month LIBOR + 0.70%), due 3/15/38 | 1,569,803 | 1,520,063 |
| Series 2021-BMR, Class C | | |
| 5.418% (1 Month LIBOR + 1.10%), due 3/15/38 | 908,264 | 863,247 |
| Series 2022-BMR2, Class A1 | | |
| 5.631% (1 Month SOFR + 1.295%), due 5/15/39 | 1,231,000 | 1,200,160 |
| Series 2022-BMR2, Class B | | |
| 6.13% (1 Month SOFR + 1.794%), due 5/15/39 | 357,000 | 345,821 |
| Med Trust (a)(b) | |
| Series 2021-MDLN, Class C | | |
| 6.118% (1 Month LIBOR + 1.80%), due 11/15/38 | 280,000 | 266,015 |
| Series 2021-MDLN, Class D | | |
| 6.318% (1 Month LIBOR + 2.00%), due 11/15/38 | 284,000 | 268,332 |
The notes to the financial statements are an integral part of, and should be read in conjunction with, the financial statements.
17
Portfolio of Investments December 31, 2022† (continued)
| | Principal
Amount | Value |
| Mortgage-Backed Securities (continued) |
| Commercial Mortgage Loans (Collateralized Mortgage Obligations) (continued) |
| Med Trust (a)(b) (continued) | |
| Series 2021-MDLN, Class E | | |
| 7.468% (1 Month LIBOR + 3.15%), due 11/15/38 | $ 1,262,000 | $ 1,170,233 |
| Series 2021-MDLN, Class F | | |
| 8.318% (1 Month LIBOR + 4.00%), due 11/15/38 | 794,000 | 730,295 |
| MHC Commercial Mortgage Trust (a)(b) | |
| Series 2021-MHC, Class A | | |
| 5.119% (1 Month LIBOR + 0.801%), due 4/15/38 | 1,662,744 | 1,612,557 |
| Series 2021-MHC, Class C | | |
| 5.669% (1 Month LIBOR + 1.351%), due 4/15/38 | 938,912 | 897,423 |
| SMRT | |
| Series 2022-MINI, Class A | | |
| 5.336% (1 Month SOFR + 1.00%), due 1/15/39 (a)(b) | 660,000 | 636,844 |
| SREIT Trust | |
| Series 2021-MFP, Class A | | |
| 5.049% (1 Month LIBOR + 0.731%), due 11/15/38 (a)(b) | 136,000 | 130,798 |
| TPI Re-REMIC Trust (a) | |
| Series 2022-FRR1, Class AK33 | | |
| (zero coupon), due 7/25/46 | 480,000 | 461,477 |
| Series 2022-FRR1, Class AK34 | | |
| (zero coupon), due 7/25/46 | 395,000 | 379,757 |
| Series 2022-FRR1, Class AK35 | | |
| (zero coupon), due 8/25/46 | 536,000 | 512,174 |
| VASA Trust | |
| Series 2021-VASA, Class A | | |
| 5.218% (1 Month LIBOR + 0.90%), due 7/15/39 (a)(b) | 525,000 | 484,124 |
| VMC Finance LLC | |
| Series 2021-HT1, Class A | | |
| 5.989% (1 Month LIBOR + 1.65%), due 1/18/37 (a)(b) | 595,954 | 576,362 |
| Wells Fargo Commercial Mortgage Trust | |
| Series 2021-SAVE, Class A | | |
| 5.468% (1 Month LIBOR + 1.15%), due 2/15/40 (a)(b) | 497,235 | 464,592 |
| | | 34,737,564 |
| | Principal
Amount | Value |
| |
| Whole Loan (Collateralized Mortgage Obligations) 2.7% |
| Angel Oak Mortgage Trust (a)(h) | |
| Series 2020-3, Class A2 | | |
| 2.41%, due 4/25/65 | $ 205,945 | $ 184,326 |
| Series 2019-5, Class A1 | | |
| 2.593%, due 10/25/49 | 99,500 | 94,411 |
| Series 2019-6, Class A1 | | |
| 2.62%, due 11/25/59 | 85,995 | 81,785 |
| Bayview MSR Opportunity Master Fund Trust (a) | |
| Series 2022-2, Class A1 | | |
| 3.00%, due 12/25/51 (h) | 1,840,203 | 1,533,767 |
| Series 2021-5, Class AF | | |
| 4.371% (SOFR 30A + 0.85%), due 11/25/51 (b) | 923,454 | 840,079 |
| Chase Mortgage Finance Corp. | |
| Series 2021-CL1, Class M1 | | |
| 5.128% (SOFR 30A + 1.20%), due 2/25/50 (a)(b) | 929,760 | 842,083 |
| CIM Trust | |
| Series 2021-NR1, Class A1 | | |
| 2.569%, due 7/25/55 (a)(c) | 516,176 | 489,977 |
| COLT Mortgage Loan Trust (a)(h) | |
| Series 2020-3, Class A1 | | |
| 1.506%, due 4/27/65 | 72,704 | 67,938 |
| Series 2020-2, Class A1 | | |
| 1.853%, due 3/25/65 | 20,215 | 19,768 |
| Connecticut Avenue Securities Trust (a)(b) | |
| Series 2021-R03, Class 1M2 | | |
| 5.578% (SOFR 30A + 1.65%), due 12/25/41 | 612,000 | 577,231 |
| Series 2022-R05, Class 2M1 | | |
| 5.828% (SOFR 30A + 1.90%), due 4/25/42 | 623,326 | 617,418 |
| Series 2022-R04, Class 1M1 | | |
| 5.928% (SOFR 30A + 2.00%), due 3/25/42 | 561,616 | 559,626 |
| Series 2022-R03, Class 1M1 | | |
| 6.028% (SOFR 30A + 2.10%), due 3/25/42 | 1,304,053 | 1,294,985 |
| Series 2022-R09, Class 2M1 | | |
| 6.444% (SOFR 30A + 2.50%), due 9/25/42 | 1,286,213 | 1,279,557 |
| Series 2022-R08, Class 1M1 | | |
| 6.478% (SOFR 30A + 2.55%), due 7/25/42 | 342,537 | 343,612 |
| Series 2019-R07, Class 1M2 | | |
| 6.489% (1 Month LIBOR + 2.10%), due 10/25/39 | 63,667 | 63,508 |
The notes to the financial statements are an integral part of, and should be read in conjunction with, the financial statements.
| 18 | MainStay VP Janus Henderson Balanced Portfolio |
| | Principal
Amount | Value |
| Mortgage-Backed Securities (continued) |
| Whole Loan (Collateralized Mortgage Obligations) (continued) |
| Connecticut Avenue Securities Trust (a)(b) (continued) | |
| Series 2019-R03, Class 1M2 | | |
| 6.539% (1 Month LIBOR + 2.15%), due 9/25/31 | $ 55,143 | $ 55,009 |
| Series 2022-R06, Class 1M1 | | |
| 6.678% (SOFR 30A + 2.75%), due 5/25/42 | 421,472 | 426,721 |
| Series 2019-R02, Class 1M2 | | |
| 6.689% (1 Month LIBOR + 2.30%), due 8/25/31 | 19,777 | 19,752 |
| Series 2018-R07, Class 1M2 | | |
| 6.789% (1 Month LIBOR + 2.40%), due 4/25/31 | 89,972 | 89,749 |
| Series 2022-R02, Class 2M2 | | |
| 6.928% (SOFR 30A + 3.00%), due 1/25/42 | 706,000 | 665,216 |
| Series 2022-R05, Class 2M2 | | |
| 6.928% (SOFR 30A + 3.00%), due 4/25/42 | 521,000 | 504,330 |
| FHLMC STACR REMIC Trust (a)(b) | |
| Series 2021-DNA7, Class M1 | | |
| 4.778% (SOFR 30A + 0.85%), due 11/25/41 | 755,702 | 742,646 |
| Series 2021-HQA4, Class M1 | | |
| 4.878% (SOFR 30A + 0.95%), due 12/25/41 | 1,326,295 | 1,258,414 |
| Series 2022-DNA2, Class M1A | | |
| 5.228% (SOFR 30A + 1.30%), due 2/25/42 | 292,974 | 288,123 |
| Series 2022-DNA3, Class M1A | | |
| 5.928% (SOFR 30A + 2.00%), due 4/25/42 | 273,365 | 271,999 |
| Series 2020-DNA6, Class M2 | | |
| 5.928% (SOFR 30A + 2.00%), due 12/25/50 | 889,236 | 883,075 |
| Series 2022-HQA1, Class M1A | | |
| 6.028% (SOFR 30A + 2.10%), due 3/25/42 | 575,127 | 567,771 |
| Series 2022-DNA6, Class M1A | | |
| 6.078% (SOFR 30A + 2.15%), due 9/25/42 | 223,727 | 223,864 |
| Series 2021-HQA1, Class M2 | | |
| 6.178% (SOFR 30A + 2.25%), due 8/25/33 | 1,395,000 | 1,313,856 |
| Series 2022-HQA3, Class M1A | | |
| 6.228% (SOFR 30A + 2.30%), due 8/25/42 | 390,634 | 390,183 |
| | Principal
Amount | Value |
| |
| Whole Loan (Collateralized Mortgage Obligations) (continued) |
| FHLMC STACR REMIC Trust (a)(b) (continued) | |
| Series 2022-DNA5, Class M1A | | |
| 6.878% (SOFR 30A + 2.95%), due 6/25/42 | $ 852,151 | $ 862,155 |
| Series 2020-HQA2, Class M2 | | |
| 7.489% (1 Month LIBOR + 3.10%), due 3/25/50 | 276,511 | 280,344 |
| Series 2020-HQA4, Class M2 | | |
| 7.539% (1 Month LIBOR + 3.15%), due 9/25/50 | 4,544 | 4,546 |
| FHLMC STACR Trust | |
| Series 2019-DNA4, Class M2 | | |
| 6.339% (1 Month LIBOR + 1.95%), due 10/25/49 (a)(b) | 20,855 | 20,855 |
| FHLMC Structured Agency Credit Risk Debt Notes (a)(b) | |
| Series 2021-DNA2, Class M2 | | |
| 6.228% (SOFR 30A + 2.30%), due 8/25/33 | 616,401 | 609,408 |
| Series 2020-HQA5, Class M2 | | |
| 6.528% (SOFR 30A + 2.60%), due 11/25/50 | 993,854 | 991,765 |
| Series 2022-HQA2, Class M1A | | |
| 6.578% (SOFR 30A + 2.65%), due 7/25/42 | 437,387 | 439,553 |
| Flagstar Mortgage Trust | |
| Series 2021-13IN, Class A2 | | |
| 3.00%, due 12/30/51 (a)(h) | 1,365,861 | 1,138,414 |
| FNMA (b) | |
| Series 2021-R02, Class 2M2 | | |
| 5.928% (SOFR 30A + 2.00%), due 11/25/41 (a) | 1,891,000 | 1,758,745 |
| Series 2015-C01, Class 1M2 | | |
| 8.689% (1 Month LIBOR + 4.30%), due 2/25/25 | 254,331 | 258,783 |
| Series 2014-C04, Class 1M2 | | |
| 9.289% (1 Month LIBOR + 4.90%), due 11/25/24 | 43,429 | 44,560 |
| Series 2015-C03, Class 1M2 | | |
| 9.389% (1 Month LIBOR + 5.00%), due 7/25/25 | 211,538 | 214,696 |
| GCAT Trust | |
| Series 2022-INV1, Class A1 | | |
| 3.00%, due 12/25/51 (a)(h) | 2,442,791 | 2,036,010 |
| Mello Mortgage Capital Acceptance (a) | |
| Series 2021-INV4, Class A3 | | |
| 2.50%, due 12/25/51 (h) | 418,161 | 335,656 |
| Series 2022-INV1, Class A2 | | |
| 3.00%, due 3/25/52 (h) | 1,653,764 | 1,378,374 |
The notes to the financial statements are an integral part of, and should be read in conjunction with, the financial statements.
19
Portfolio of Investments December 31, 2022† (continued)
| | Principal
Amount | Value |
| Mortgage-Backed Securities (continued) |
| Whole Loan (Collateralized Mortgage Obligations) (continued) |
| Mello Mortgage Capital Acceptance (a) (continued) | |
| Series 2021-INV2, Class A11 | | |
| 4.471% (SOFR 30A + 0.95%), due 8/25/51 (b) | $ 657,301 | $ 600,745 |
| Series 2021-INV3, Class A11 | | |
| 4.471% (SOFR 30A + 0.95%), due 10/25/51 (b) | 818,197 | 747,798 |
| New Residential Mortgage Loan Trust | |
| Series 2018-2A, Class A1 | | |
| 4.50%, due 2/25/58 (a)(h) | 146,211 | 140,387 |
| OBX Trust (a)(h) | |
| Series 2021-INV3, Class A3 | | |
| 2.50%, due 10/25/51 | 402,335 | 322,952 |
| Series 2022-INV1, Class A1 | | |
| 3.00%, due 12/25/51 | 1,853,763 | 1,547,386 |
| Series 2022-INV1, Class A18 | | |
| 3.00%, due 12/25/51 | 786,248 | 624,852 |
| Oceanview Mortgage Trust | |
| Series 2022-1, Class A1 | | |
| 3.00%, due 12/25/51 (a)(h) | 990,711 | 828,459 |
| PRPM LLC (a)(c) | |
| Series 2021-9, Class A1 | | |
| 2.363%, due 10/25/26 | 812,037 | 731,005 |
| Series 2021-10, Class A1 | | |
| 2.487%, due 10/25/26 | 937,365 | 866,717 |
| Series 2020-4, Class A1 | | |
| 2.951%, due 10/25/25 | 577,336 | 556,997 |
| Series 2022-2, Class A1 | | |
| 5.00%, due 3/25/27 | 1,436,920 | 1,358,865 |
| RCKT Mortgage Trust | |
| Series 2021-3, Class A21 | | |
| 4.321% (SOFR 30A + 0.80%), due 7/25/51 (a)(b) | 591,971 | 536,983 |
| Sequoia Mortgage Trust (a) | |
| Series 2013-5, Class A1 | | |
| 2.50%, due 5/25/43 (i) | 177,126 | 148,096 |
| Series 2020-2, Class A19 | | |
| 3.50%, due 3/25/50 (h) | 62,762 | 52,038 |
| Spruce Hill Mortgage Loan Trust (a)(h) | |
| Series 2020-SH1, Class A1 | | |
| 2.521%, due 1/28/50 | 8,647 | 8,539 |
| Series 2020-SH1, Class A2 | | |
| 2.624%, due 1/28/50 | 48,419 | 47,796 |
| UWM Mortgage Trust (a) | |
| Series 2021-INV4, Class A3 | | |
| 2.50%, due 12/25/51 (h) | 322,870 | 257,536 |
| | Principal
Amount | Value |
| |
| Whole Loan (Collateralized Mortgage Obligations) (continued) |
| UWM Mortgage Trust (a) (continued) | |
| Series 2021-INV1, Class A9 | | |
| 4.421% (SOFR 30A + 0.90%), due 8/25/51 (b) | $ 789,633 | $ 716,456 |
| | | 37,058,250 |
Total Mortgage-Backed Securities
(Cost $146,429,118) | | 140,470,763 |
| U.S. Government & Federal Agencies 22.1% |
| Federal Home Loan Mortgage Corporation (Mortgage Pass-Through Securities) 2.4% |
| FHLMC Gold Pools, Other | | |
| 3.00%, due 6/1/43 | 10,123 | 9,088 |
| 3.50%, due 7/1/42 | 23,176 | 21,648 |
| 3.50%, due 8/1/42 | 25,861 | 24,167 |
| 3.50%, due 8/1/42 | 23,708 | 22,145 |
| 3.50%, due 2/1/43 | 122,893 | 114,800 |
| 3.50%, due 2/1/44 | 176,604 | 164,938 |
| 3.50%, due 1/1/47 | 50,445 | 47,158 |
| 4.50%, due 5/1/44 | 330,681 | 324,522 |
| 4.50%, due 3/1/50 | 464,975 | 441,488 |
| UMBS Pool, 15 Year | | |
| 2.50%, due 12/1/33 | 842,621 | 787,893 |
| 2.50%, due 11/1/34 | 154,810 | 142,643 |
| 2.50%, due 11/1/34 | 211,646 | 194,854 |
| 3.00%, due 5/1/31 | 713,864 | 684,641 |
| 3.00%, due 9/1/32 | 160,864 | 153,069 |
| 3.00%, due 10/1/32 | 57,816 | 54,931 |
| 3.00%, due 1/1/33 | 97,842 | 93,111 |
| 3.00%, due 10/1/34 | 93,994 | 88,230 |
| 3.00%, due 10/1/34 | 205,186 | 192,558 |
| UMBS Pool, 30 Year | | |
| 2.50%, due 8/1/50 | 67,223 | 58,085 |
| 2.50%, due 8/1/50 | 23,950 | 20,721 |
| 2.50%, due 9/1/50 | 126,690 | 109,703 |
| 2.50%, due 6/1/51 | 1,245,910 | 1,072,840 |
| 2.50%, due 11/1/51 | 922,340 | 793,138 |
| 2.50%, due 1/1/52 | 158,109 | 135,567 |
| 2.50%, due 1/1/52 | 257,134 | 220,477 |
| 2.50%, due 2/1/52 | 371,662 | 317,868 |
| 2.50%, due 3/1/52 | 55,437 | 47,414 |
| 3.00%, due 1/1/45 | 103,693 | 93,434 |
| 3.00%, due 4/1/47 | 13,744 | 12,227 |
| 3.00%, due 8/1/49 | 56,111 | 49,664 |
| 3.00%, due 12/1/49 | 61,622 | 54,571 |
| 3.00%, due 12/1/49 | 134,904 | 119,411 |
| 3.00%, due 2/1/52 | 210,373 | 186,433 |
The notes to the financial statements are an integral part of, and should be read in conjunction with, the financial statements.
| 20 | MainStay VP Janus Henderson Balanced Portfolio |
| | Principal
Amount | Value |
| U.S. Government & Federal Agencies (continued) |
| Federal Home Loan Mortgage Corporation (Mortgage Pass-Through Securities) (continued) |
| UMBS Pool, 30 Year (continued) | | |
| 3.00%, due 2/1/52 | $ 158,942 | $ 141,062 |
| 3.00%, due 3/1/52 | 220,972 | 196,000 |
| 3.50%, due 12/1/44 | 352,534 | 329,805 |
| 3.50%, due 7/1/46 | 90,280 | 84,182 |
| 3.50%, due 9/1/47 | 213,623 | 197,966 |
| 3.50%, due 12/1/47 | 716,440 | 665,740 |
| 3.50%, due 2/1/48 | 161,271 | 149,909 |
| 3.50%, due 3/1/50 | 3,068 | 2,811 |
| 3.50%, due 4/1/52 | 77,976 | 71,974 |
| 3.50%, due 4/1/52 | 68,313 | 63,055 |
| 3.50%, due 4/1/52 | 244,834 | 225,657 |
| 3.50%, due 4/1/52 | 235,167 | 216,679 |
| 3.50%, due 6/1/52 | 1,044,493 | 959,407 |
| 3.50%, due 7/1/52 | 3,820,399 | 3,508,370 |
| 4.00%, due 3/1/47 | 26,902 | 25,768 |
| 4.00%, due 3/1/48 | 118,029 | 113,919 |
| 4.00%, due 4/1/48 | 1,968 | 1,877 |
| 4.00%, due 4/1/48 | 175,516 | 168,671 |
| 4.00%, due 5/1/48 | 370,226 | 353,066 |
| 4.00%, due 11/1/48 | 33,392 | 31,839 |
| 4.00%, due 12/1/48 | 412,358 | 391,194 |
| 4.00%, due 3/1/50 | 405,804 | 386,341 |
| 4.00%, due 6/1/50 | 651,187 | 621,730 |
| 4.00%, due 10/1/50 | 118,404 | 112,240 |
| 4.00%, due 7/1/52 | 355,134 | 333,289 |
| 4.00%, due 8/1/52 | 404,724 | 379,730 |
| 4.50%, due 3/1/48 | 128,594 | 125,635 |
| 4.50%, due 12/1/48 | 174,471 | 173,699 |
| 4.50%, due 6/1/49 | 25,911 | 25,425 |
| 4.50%, due 7/1/49 | 229,758 | 224,580 |
| 4.50%, due 7/1/49 | 39,436 | 38,512 |
| 4.50%, due 8/1/49 | 201,330 | 196,937 |
| 4.50%, due 1/1/50 | 38,763 | 37,820 |
| 4.50%, due 1/1/50 | 136,890 | 133,741 |
| 4.50%, due 9/1/50 | 1,192,840 | 1,165,342 |
| 4.50%, due 3/1/52 | 17,980 | 17,312 |
| 4.50%, due 8/1/52 | 877,368 | 844,932 |
| 4.50%, due 8/1/52 | 4,032,100 | 3,884,862 |
| 4.50%, due 8/1/52 | 1,715,654 | 1,657,781 |
| 4.50%, due 10/1/52 | 560,797 | 547,431 |
| 5.00%, due 9/1/48 | 8,510 | 8,469 |
| 5.00%, due 8/1/52 | 904,016 | 908,183 |
| 5.00%, due 10/1/52 | 22,529 | 22,439 |
| 5.00%, due 10/1/52 | 744,283 | 741,283 |
| 5.00%, due 10/1/52 | 1,146,969 | 1,139,878 |
| | Principal
Amount | Value |
| |
| Federal Home Loan Mortgage Corporation (Mortgage Pass-Through Securities) (continued) |
| UMBS Pool, 30 Year (continued) | | |
| 5.50%, due 9/1/52 | $ 588,334 | $ 596,628 |
| 5.50%, due 11/1/52 | 2,598,322 | 2,641,481 |
| 6.00%, due 4/1/40 | 367,222 | 384,073 |
| | | 32,102,161 |
| Federal National Mortgage Association (Mortgage Pass-Through Securities) 4.9% |
| FNMA, Other | | |
| 3.00%, due 2/1/43 | 13,694 | 12,231 |
| 3.00%, due 5/1/43 | 70,432 | 62,910 |
| 3.00%, due 2/1/57 | 829,054 | 729,788 |
| 3.00%, due 6/1/57 | 13,025 | 11,466 |
| 3.50%, due 8/1/56 | 992,414 | 906,710 |
| 4.50%, due 6/1/45 | 120,262 | 118,020 |
| 4.50%, due 7/1/50 | 1,022,808 | 972,450 |
| 5.00%, due 7/1/44 | 202,491 | 203,533 |
| UMBS, 15 Year | | |
| 2.50%, due 11/1/34 | 208,539 | 192,021 |
| 3.00%, due 10/1/34 | 86,947 | 81,588 |
| 3.00%, due 11/1/34 | 19,919 | 18,695 |
| 3.00%, due 12/1/34 | 20,886 | 19,602 |
| UMBS, 30 Year | | |
| 2.50%, due 8/1/50 | 137,342 | 118,372 |
| 2.50%, due 8/1/50 | 4,065,775 | 3,505,764 |
| 2.50%, due 1/1/52 | 815,241 | 697,246 |
| 2.50%, due 2/1/52 | 4,025,185 | 3,442,572 |
| 2.50%, due 3/1/52 | 596,165 | 510,518 |
| 2.50%, due 3/1/52 | 1,620,472 | 1,385,912 |
| 2.50%, due 3/1/52 | 46,423 | 39,805 |
| 2.50%, due 3/1/52 | 134,465 | 114,845 |
| 2.50%, due 3/1/52 | 113,661 | 97,210 |
| 2.50%, due 3/1/52 | 1,656,000 | 1,416,303 |
| 2.50%, due 3/1/52 | 143,682 | 122,885 |
| 3.00%, due 1/1/43 | 44,931 | 40,882 |
| 3.00%, due 1/1/46 | 2,098 | 1,881 |
| 3.00%, due 9/1/46 | 724,289 | 659,086 |
| 3.00%, due 2/1/47 | 5,853,945 | 5,326,942 |
| 3.00%, due 3/1/47 | 441,655 | 395,724 |
| 3.00%, due 8/1/49 | 165,258 | 146,299 |
| 3.00%, due 9/1/49 | 37,272 | 33,603 |
| 3.00%, due 12/1/51 | 7,261,286 | 6,411,315 |
| 3.00%, due 3/1/52 | 795,014 | 704,548 |
| 3.00%, due 4/1/52 | 672,501 | 596,158 |
| 3.00%, due 4/1/52 | 590,682 | 522,940 |
| 3.50%, due 12/1/45 | 82,306 | 76,597 |
| 3.50%, due 7/1/46 | 266,013 | 247,083 |
The notes to the financial statements are an integral part of, and should be read in conjunction with, the financial statements.
21
Portfolio of Investments December 31, 2022† (continued)
| | Principal
Amount | Value |
| U.S. Government & Federal Agencies (continued) |
| Federal National Mortgage Association (Mortgage Pass-Through Securities) (continued) |
| UMBS, 30 Year (continued) | | |
| 3.50%, due 3/1/47 | $ 72,085 | $ 66,992 |
| 3.50%, due 7/1/47 | 63,875 | 59,382 |
| 3.50%, due 8/1/47 | 85,002 | 78,838 |
| 3.50%, due 8/1/47 | 75,360 | 70,723 |
| 3.50%, due 12/1/47 | 21,965 | 20,603 |
| 3.50%, due 12/1/47 | 34,715 | 32,579 |
| 3.50%, due 1/1/48 | 205,629 | 192,069 |
| 3.50%, due 3/1/48 | 34,040 | 31,945 |
| 3.50%, due 7/1/48 | 1,631,777 | 1,514,968 |
| 3.50%, due 12/1/49 | 2,032,992 | 1,879,154 |
| 3.50%, due 3/1/52 | 1,131,165 | 1,039,263 |
| 3.50%, due 4/1/52 | 118,394 | 109,794 |
| 3.50%, due 4/1/52 | 325,992 | 300,899 |
| 3.50%, due 4/1/52 | 576,145 | 531,016 |
| 3.50%, due 4/1/52 | 94,771 | 87,446 |
| 3.50%, due 4/1/52 | 197,518 | 182,102 |
| 3.50%, due 4/1/52 | 434,580 | 400,529 |
| 3.50%, due 5/1/52 | 336,623 | 310,160 |
| 3.50%, due 5/1/52 | 527,242 | 484,180 |
| 3.50%, due 6/1/52 | 1,814,606 | 1,671,951 |
| 3.50%, due 6/1/52 | 1,050,842 | 969,631 |
| 3.50%, due 7/1/52 | 262,713 | 241,760 |
| 3.50%, due 7/1/52 | 2,347,517 | 2,155,778 |
| 3.50%, due 7/1/52 | 96,123 | 88,694 |
| 3.50%, due 8/1/52 | 173,692 | 159,838 |
| 3.50%, due 8/1/52 | 469,749 | 430,973 |
| 4.00%, due 10/1/47 | 258,470 | 246,691 |
| 4.00%, due 1/1/48 | 437,357 | 422,127 |
| 4.00%, due 1/1/48 | 761,147 | 731,464 |
| 4.00%, due 3/1/48 | 130,801 | 126,246 |
| 4.00%, due 7/1/48 | 318,411 | 302,927 |
| 4.00%, due 10/1/48 | 123,734 | 117,979 |
| 4.00%, due 11/1/48 | 370,011 | 352,445 |
| 4.00%, due 12/1/48 | 59,037 | 56,292 |
| 4.00%, due 2/1/49 | 110,814 | 105,661 |
| 4.00%, due 6/1/49 | 49,541 | 47,153 |
| 4.00%, due 11/1/49 | 799,501 | 758,948 |
| 4.00%, due 11/1/49 | 71,159 | 67,786 |
| 4.00%, due 3/1/50 | 241,125 | 228,894 |
| 4.00%, due 3/1/50 | 631,820 | 598,894 |
| 4.00%, due 3/1/50 | 1,164,831 | 1,110,698 |
| 4.00%, due 9/1/50 | 1,333,212 | 1,261,253 |
| 4.00%, due 10/1/50 | 1,281,860 | 1,217,522 |
| 4.00%, due 3/1/51 | 3,274,215 | 3,105,376 |
| 4.00%, due 3/1/51 | 31,009 | 29,474 |
| | Principal
Amount | Value |
| |
| Federal National Mortgage Association (Mortgage Pass-Through Securities) (continued) |
| UMBS, 30 Year (continued) | | |
| 4.00%, due 3/1/51 | $ 63,623 | $ 60,365 |
| 4.00%, due 10/1/51 | 458,329 | 435,727 |
| 4.00%, due 4/1/52 | 488,448 | 462,537 |
| 4.00%, due 6/1/52 | 369,644 | 347,155 |
| 4.00%, due 6/1/52 | 99,038 | 92,946 |
| 4.00%, due 7/1/52 | 158,003 | 148,283 |
| 4.50%, due 11/1/42 | 57,013 | 56,519 |
| 4.50%, due 10/1/44 | 175,205 | 172,970 |
| 4.50%, due 3/1/45 | 268,166 | 264,745 |
| 4.50%, due 2/1/46 | 291,481 | 288,954 |
| 4.50%, due 3/1/48 | 146,099 | 143,227 |
| 4.50%, due 6/1/48 | 275,573 | 269,361 |
| 4.50%, due 8/1/48 | 82,696 | 80,746 |
| 4.50%, due 6/1/49 | 25,943 | 25,368 |
| 4.50%, due 8/1/49 | 35,570 | 34,750 |
| 4.50%, due 1/1/50 | 635,909 | 623,512 |
| 4.50%, due 1/1/50 | 49,819 | 48,490 |
| 4.50%, due 10/1/50 | 790,992 | 773,680 |
| 4.50%, due 4/1/52 | 21,369 | 20,570 |
| 4.50%, due 4/1/52 | 41,806 | 40,449 |
| 4.50%, due 4/1/52 | 72,890 | 70,506 |
| 4.50%, due 4/1/52 | 94,709 | 91,662 |
| 4.50%, due 4/1/52 | 33,186 | 31,953 |
| 4.50%, due 4/1/52 | 37,940 | 36,530 |
| 4.50%, due 5/1/52 | 115,635 | 111,855 |
| 4.50%, due 7/1/52 | 470,174 | 452,830 |
| 4.50%, due 8/1/52 | 1,814,326 | 1,748,075 |
| 4.50%, due 11/1/52 | 1,066,281 | 1,040,032 |
| 4.50%, due 12/1/52 | 572,655 | 552,852 |
| 5.00%, due 5/1/48 | 109,539 | 109,500 |
| 5.00%, due 10/1/52 | 166,850 | 166,177 |
| 5.00%, due 10/1/52 | 373,247 | 371,742 |
| 5.00%, due 11/1/52 | 927,980 | 924,240 |
| 5.50%, due 9/1/52 | 2,303,255 | 2,314,769 |
| 5.50%, due 10/1/52 | 385,476 | 391,361 |
| 5.50%, due 11/1/52 | 842,172 | 856,438 |
| 6.00%, due 2/1/37 | 22,268 | 23,285 |
| | | 67,626,762 |
| Government National Mortgage Association (Mortgage Pass-Through Securities) 0.4% |
| GNMA I, 30 Year | | |
| 4.00%, due 1/15/45 | 412,652 | 399,709 |
| 4.50%, due 8/15/46 | 439,919 | 437,117 |
| GNMA I, Single Family, 30 Year | | |
| 4.00%, due 7/15/47 | 292,769 | 279,363 |
The notes to the financial statements are an integral part of, and should be read in conjunction with, the financial statements.
| 22 | MainStay VP Janus Henderson Balanced Portfolio |
| | Principal
Amount | Value |
| U.S. Government & Federal Agencies (continued) |
| Government National Mortgage Association (Mortgage Pass-Through Securities) (continued) |
GNMA I, Single Family, 30 Year
(continued) | | |
| 4.00%, due 8/15/47 | $ 33,614 | $ 32,739 |
| 4.00%, due 11/15/47 | 23,995 | 23,439 |
| 4.00%, due 12/15/47 | 68,162 | 65,513 |
| GNMA II, Single Family, 30 Year | | |
| 3.00%, due 7/20/51 | 1,413,284 | 1,264,696 |
| 3.00%, due 8/20/51 | 3,218,691 | 2,881,487 |
| 4.00%, due 8/20/47 | 20,484 | 19,566 |
| 4.00%, due 8/20/47 | 51,736 | 49,155 |
| 4.00%, due 8/20/47 | 16,389 | 15,635 |
| 4.00%, due 6/20/48 | 197,477 | 188,613 |
| 4.50%, due 2/20/48 | 41,676 | 41,033 |
| 4.50%, due 5/20/48 | 34,798 | 33,836 |
| 4.50%, due 5/20/48 | 92,571 | 90,264 |
| 5.00%, due 8/20/48 | 236,639 | 235,932 |
| | | 6,058,097 |
| United States Treasury Bonds 5.5% |
| U.S. Treasury Bonds | | |
| 1.75%, due 8/15/41 | 8,134,000 | 5,566,389 |
| 2.00%, due 11/15/41 | 6,166,000 | 4,402,668 |
| 2.375%, due 2/15/42 | 15,954,000 | 12,181,128 |
| 3.00%, due 8/15/52 | 32,713,000 | 26,952,445 |
| 4.00%, due 11/15/42 (f) | 26,321,000 | 25,769,904 |
| | | 74,872,534 |
| United States Treasury Notes 8.9% |
| U.S. Treasury Notes | | |
| 0.875%, due 6/30/26 | 6,560,000 | 5,866,075 |
| 1.125%, due 8/31/28 | 8,178,100 | 6,982,692 |
| 3.00%, due 7/15/25 | 2,161,000 | 2,093,131 |
| 3.875%, due 11/30/27 (f) | 32,639,600 | 32,461,102 |
| 3.875%, due 11/30/29 | 6,999,000 | 6,951,976 |
| 4.125%, due 9/30/27 | 11,805,500 | 11,849,771 |
| 4.125%, due 10/31/27 | 17,329,800 | 17,393,433 |
| 4.125%, due 11/15/32 | 30,070,000 | 30,685,495 |
| 4.25%, due 9/30/24 | 3,811,000 | 3,791,498 |
| | Principal
Amount | Value |
| |
| United States Treasury Notes (continued) |
| U.S. Treasury Notes (continued) | | |
| 4.25%, due 10/15/25 | $ 2,278,000 | $ 2,276,220 |
| 4.50%, due 11/15/25 | 1,702,000 | 1,712,239 |
| | | 122,063,632 |
Total U.S. Government & Federal Agencies
(Cost $317,892,834) | | 302,723,186 |
Total Long-Term Bonds
(Cost $630,357,979) | | 592,079,982 |
| |
| | Shares | |
| Common Stocks 56.4% |
| Aerospace & Defense 1.2% |
| General Dynamics Corp. | 45,706 | 11,340,116 |
| L3Harris Technologies, Inc. | 26,703 | 5,559,831 |
| | | 16,899,947 |
| Air Freight & Logistics 1.4% |
| United Parcel Service, Inc., Class B | 109,150 | 18,974,636 |
| Banks 2.3% |
| Bank of America Corp. | 474,072 | 15,701,264 |
| JPMorgan Chase & Co. | 114,317 | 15,329,910 |
| | | 31,031,174 |
| Beverages 1.3% |
| Constellation Brands, Inc., Class A | 24,696 | 5,723,298 |
| Monster Beverage Corp. (j) | 124,341 | 12,624,342 |
| | | 18,347,640 |
| Biotechnology 1.3% |
| AbbVie, Inc. | 113,574 | 18,354,694 |
| Building Products 0.4% |
| Trane Technologies plc | 34,427 | 5,786,834 |
| Capital Markets 2.7% |
| Charles Schwab Corp. (The) | 78,481 | 6,534,328 |
| CME Group, Inc. | 52,414 | 8,813,938 |
| Goldman Sachs Group, Inc. (The) | 21,532 | 7,393,658 |
| Morgan Stanley | 158,766 | 13,498,286 |
| | | 36,240,210 |
| Chemicals 0.9% |
| Corteva, Inc. | 122,408 | 7,195,142 |
The notes to the financial statements are an integral part of, and should be read in conjunction with, the financial statements.
23
Portfolio of Investments December 31, 2022† (continued)
| | Shares | Value |
| Common Stocks (continued) |
| Chemicals (continued) |
| Sherwin-Williams Co. (The) | 19,911 | $ 4,725,478 |
| | | 11,920,620 |
| Consumer Finance 1.0% |
| American Express Co. | 94,212 | 13,919,823 |
| Electrical Equipment 0.3% |
| Rockwell Automation, Inc. | 16,889 | 4,350,100 |
| Electronic Equipment, Instruments & Components 0.7% |
| Corning, Inc. | 85,781 | 2,739,845 |
| TE Connectivity Ltd. | 58,306 | 6,693,529 |
| | | 9,433,374 |
| Entertainment 0.8% |
| Walt Disney Co. (The) (j) | 119,754 | 10,404,227 |
| Food & Staples Retailing 1.2% |
| Costco Wholesale Corp. | 18,272 | 8,341,168 |
| Sysco Corp. | 112,025 | 8,564,311 |
| | | 16,905,479 |
| Food Products 0.6% |
| Hershey Co. (The) | 32,475 | 7,520,236 |
| Health Care Equipment & Supplies 2.1% |
| Abbott Laboratories | 109,080 | 11,975,893 |
| Edwards Lifesciences Corp. (j) | 44,095 | 3,289,928 |
| Intuitive Surgical, Inc. (j) | 15,994 | 4,244,008 |
| Medtronic plc | 42,721 | 3,320,276 |
| Stryker Corp. | 23,974 | 5,861,403 |
| | | 28,691,508 |
| Health Care Providers & Services 2.2% |
| UnitedHealth Group, Inc. | 57,436 | 30,451,418 |
| Hotels, Restaurants & Leisure 3.4% |
| Booking Holdings, Inc. (j) | 3,015 | 6,076,069 |
| Hilton Worldwide Holdings, Inc. | 94,102 | 11,890,729 |
| McDonald's Corp. | 63,319 | 16,686,456 |
| Starbucks Corp. | 115,492 | 11,456,806 |
| | | 46,110,060 |
| Household Products 0.9% |
| Procter & Gamble Co. (The) | 84,947 | 12,874,567 |
| | Shares | Value |
| |
| Industrial Conglomerates 0.8% |
| Honeywell International, Inc. | 51,811 | $ 11,103,097 |
| Insurance 1.4% |
| Progressive Corp. (The) | 150,253 | 19,489,317 |
| Interactive Media & Services 1.9% |
| Alphabet, Inc., Class C (j) | 295,503 | 26,219,981 |
| Internet & Direct Marketing Retail 0.8% |
| Amazon.com, Inc. (j) | 122,123 | 10,258,332 |
| IT Services 3.3% |
| Accenture plc, Class A | 46,122 | 12,307,195 |
| Cognizant Technology Solutions Corp., Class A | 90,102 | 5,152,933 |
| Mastercard, Inc., Class A | 81,401 | 28,305,570 |
| | | 45,765,698 |
| Leisure Products 0.3% |
| Hasbro, Inc. | 65,963 | 4,024,403 |
| Life Sciences Tools & Services 1.0% |
| Thermo Fisher Scientific, Inc. | 25,682 | 14,142,821 |
| Machinery 1.7% |
| Deere & Co. | 42,669 | 18,294,760 |
| Parker-Hannifin Corp. | 16,279 | 4,737,189 |
| | | 23,031,949 |
| Media 1.1% |
| Comcast Corp., Class A | 429,572 | 15,022,133 |
| Multiline Retail 0.9% |
| Dollar General Corp. | 51,521 | 12,687,046 |
| Oil, Gas & Consumable Fuels 1.2% |
| Chevron Corp. | 14,093 | 2,529,553 |
| ConocoPhillips | 121,123 | 14,292,514 |
| | | 16,822,067 |
| Personal Products 0.2% |
| Estee Lauder Cos., Inc. (The), Class A | 9,988 | 2,478,123 |
| Pharmaceuticals 3.1% |
| Eli Lilly and Co. | 54,749 | 20,029,374 |
| Merck & Co., Inc. | 145,867 | 16,183,944 |
The notes to the financial statements are an integral part of, and should be read in conjunction with, the financial statements.
| 24 | MainStay VP Janus Henderson Balanced Portfolio |
| | Shares | Value |
| Common Stocks (continued) |
| Pharmaceuticals (continued) |
| Zoetis, Inc. | 41,086 | $ 6,021,153 |
| | | 42,234,471 |
| Real Estate Management & Development 0.3% |
| CBRE Group, Inc., Class A (j) | 43,506 | 3,348,222 |
| Road & Rail 0.2% |
| Union Pacific Corp. | 14,678 | 3,039,373 |
| Semiconductors & Semiconductor Equipment 3.4% |
| Advanced Micro Devices, Inc. (j) | 75,205 | 4,871,028 |
| KLA Corp. | 14,689 | 5,538,194 |
| Lam Research Corp. | 34,350 | 14,437,305 |
| NVIDIA Corp. | 76,818 | 11,226,182 |
| Texas Instruments, Inc. | 61,440 | 10,151,117 |
| | | 46,223,826 |
| Software 4.4% |
| Cadence Design Systems, Inc. (j) | 17,769 | 2,854,412 |
| Microsoft Corp. | 238,453 | 57,185,799 |
| | | 60,040,211 |
| Specialty Retail 1.9% |
| Home Depot, Inc. (The) | 44,931 | 14,191,906 |
| TJX Cos., Inc. (The) | 143,764 | 11,443,614 |
| | | 25,635,520 |
| Technology Hardware, Storage & Peripherals 2.6% |
| Apple, Inc. | 277,647 | 36,074,675 |
| Textiles, Apparel & Luxury Goods 1.2% |
| NIKE, Inc., Class B | 134,681 | 15,759,024 |
Total Common Stocks
(Cost $569,020,353) | | 771,616,836 |
| Short-Term Investments 5.7% |
| Affiliated Investment Company 5.2% |
| MainStay U.S. Government Liquidity Fund, 3.602% (k)(l) | 71,692,700 | 71,692,700 |
| | Shares | | Value |
| |
| Unaffiliated Investment Company 0.5% |
| Invesco Government and Agency Portfolio, 4.301% (l)(m) | 6,410,291 | | $ 6,410,291 |
Total Short-Term Investments
(Cost $78,102,991) | | | 78,102,991 |
Total Investments
(Cost $1,277,481,323) | 105.3% | | 1,441,799,809 |
| Other Assets, Less Liabilities | (5.3) | | (71,999,019) |
| Net Assets | 100.0% | | $ 1,369,800,790 |
| † | Percentages indicated are based on Portfolio net assets. |
| ‡ | Less than one-tenth of a percent. |
| (a) | May be sold to institutional investors only under Rule 144A or securities offered pursuant to Section 4(a)(2) of the Securities Act of 1933, as amended. |
| (b) | Floating rate—Rate shown was the rate in effect as of December 31, 2022. |
| (c) | Step coupon—Rate shown was the rate in effect as of December 31, 2022. |
| (d) | Fixed to floating rate—Rate shown was the rate in effect as of December 31, 2022. |
| (e) | Security is perpetual and, thus, does not have a predetermined maturity date. The date shown, if applicable, reflects the next call date. |
| (f) | All or a portion of this security was held on loan. As of December 31, 2022, the aggregate market value of securities on loan was $32,007,638; the total market value of collateral held by the Portfolio was $33,055,203. The market value of the collateral held included non-cash collateral in the form of U.S. Treasury securities with a value of $26,644,912. The Portfolio received cash collateral with a value of $6,410,291. (See Note 2(G)) |
| (g) | TBA—Security purchased on a forward commitment basis with an approximate principal amount and maturity date. The actual principal amount and maturity date will be determined upon settlement. As of December 31, 2022, the total net market value was $67,472,705, which represented 4.9% of the Portfolio’s net assets. All or a portion of this security is a part of a mortgage dollar roll agreement. |
| (h) | Coupon rate may change based on changes of the underlying collateral or prepayments of principal. Rate shown was the rate in effect as of December 31, 2022. |
| (i) | Collateral strip rate—A bond whose interest was based on the weighted net interest rate of the collateral. The coupon rate adjusts periodically based on a predetermined schedule. Rate shown was the rate in effect as of December 31, 2022. |
| (j) | Non-income producing security. |
| (k) | As of December 31, 2022, the Portfolio's ownership exceeds 5% of the outstanding shares of the Underlying Portfolio's share class. |
| (l) | Current yield as of December 31, 2022. |
| (m) | Represents a security purchased with cash collateral received for securities on loan. |
The notes to the financial statements are an integral part of, and should be read in conjunction with, the financial statements.
25
Portfolio of Investments December 31, 2022† (continued)
Investments in Affiliates (in 000's)
Investments in issuers considered to be affiliate(s) of the Portfolio during the year ended December 31, 2022 for purposes of Section 2(a)(3) of the Investment Company Act of 1940, as amended, were as follows:
| Affiliated Investment Companies | Value,
Beginning
of Year | Purchases
at Cost | Proceeds
from
Sales | Net
Realized
Gain/(Loss)
on Sales | Change in
Unrealized
Appreciation/
(Depreciation) | Value,
End of
Year | Dividend
Income | Other
Distributions | Shares
End of
Year |
| MainStay U.S. Government Liquidity Fund | $ 63,091 | $ 447,669 | $ (439,067) | $ — | $ — | $ 71,693 | $ 1,046 | $ — | 71,693 |
| Abbreviation(s): |
| FHLMC—Federal Home Loan Mortgage Corp. |
| FNMA—Federal National Mortgage Association |
| GNMA—Government National Mortgage Association |
| LIBOR—London Interbank Offered Rate |
| REMIC—Real Estate Mortgage Investment Conduit |
| SOFR—Secured Overnight Financing Rate |
| TBA—To Be Announced |
| UMBS—Uniform Mortgage Backed Securities |
The following is a summary of the fair valuations according to the inputs used as of December 31, 2022, for valuing the Portfolio’s assets:
| Description | Quoted
Prices in
Active
Markets for
Identical
Assets
(Level 1) | | Significant
Other
Observable
Inputs
(Level 2) | | Significant
Unobservable
Inputs
(Level 3) | | Total |
| Asset Valuation Inputs | | | | | | | |
| Investments in Securities (a) | | | | | | | |
| Long-Term Bonds | | | | | | | |
| Asset-Backed Securities | $ — | | $ 41,051,554 | | $ — | | $ 41,051,554 |
| Corporate Bonds | — | | 107,834,479 | | — | | 107,834,479 |
| Mortgage-Backed Securities | — | | 140,470,763 | | — | | 140,470,763 |
| U.S. Government & Federal Agencies | — | | 302,723,186 | | — | | 302,723,186 |
| Total Long-Term Bonds | — | | 592,079,982 | | — | | 592,079,982 |
| Common Stocks | 771,616,836 | | — | | — | | 771,616,836 |
| Short-Term Investments | | | | | | | |
| Affiliated Investment Company | 71,692,700 | | — | | — | | 71,692,700 |
| Unaffiliated Investment Company | 6,410,291 | | — | | — | | 6,410,291 |
| Total Short-Term Investments | 78,102,991 | | — | | — | | 78,102,991 |
| Total Investments in Securities | $ 849,719,827 | | $ 592,079,982 | | $ — | | $ 1,441,799,809 |
| (a) | For a complete listing of investments and their industries, see the Portfolio of Investments. |
The notes to the financial statements are an integral part of, and should be read in conjunction with, the financial statements.
| 26 | MainStay VP Janus Henderson Balanced Portfolio |
Statement of Assets and Liabilities as of December 31, 2022
| Assets |
Investment in unaffiliated securities, at value
(identified cost $1,205,788,623) including securities on loan of $32,007,638 | $1,370,107,109 |
Investment in affiliated investment companies, at value
(identified cost $71,692,700) | 71,692,700 |
| Cash | 23,105 |
| Receivables: | |
| Dividends and interest | 4,094,418 |
| Portfolio shares sold | 357,291 |
| Securities lending | 50,964 |
| Other assets | 7,433 |
| Total assets | 1,446,333,020 |
| Liabilities |
| Cash collateral received for securities on loan | 6,410,291 |
| Payables: | |
| Investment securities purchased | 68,644,348 |
| Manager (See Note 3) | 643,945 |
| Portfolio shares redeemed | 486,449 |
| NYLIFE Distributors (See Note 3) | 220,928 |
| Shareholder communication | 52,414 |
| Professional fees | 47,504 |
| Custodian | 19,648 |
| Accrued expenses | 6,703 |
| Total liabilities | 76,532,230 |
| Net assets | $1,369,800,790 |
| Composition of Net Assets |
| Shares of beneficial interest outstanding (par value of $.001 per share) unlimited number of shares authorized | $ 106,427 |
| Additional paid-in-capital | 1,132,281,598 |
| | 1,132,388,025 |
| Total distributable earnings (loss) | 237,412,765 |
| Net assets | $1,369,800,790 |
| Initial Class | |
| Net assets applicable to outstanding shares | $ 348,494,778 |
| Shares of beneficial interest outstanding | 26,906,704 |
| Net asset value per share outstanding | $ 12.95 |
| Service Class | |
| Net assets applicable to outstanding shares | $1,021,306,012 |
| Shares of beneficial interest outstanding | 79,520,256 |
| Net asset value per share outstanding | $ 12.84 |
The notes to the financial statements are an integral part of, and should be read in conjunction with, the financial statements.
27
Statement of Operations for the year ended December 31, 2022
| Investment Income (Loss) |
| Income | |
| Interest | $ 17,042,974 |
| Dividends-unaffiliated | 11,239,330 |
| Dividends-affiliated | 1,045,697 |
| Securities lending, net | 123,201 |
| Total income | 29,451,202 |
| Expenses | |
| Manager (See Note 3) | 7,962,983 |
| Distribution/Service—Service Class (See Note 3) | 2,718,853 |
| Professional fees | 156,354 |
| Custodian | 129,705 |
| Shareholder communication | 80,905 |
| Trustees | 32,076 |
| Miscellaneous | 42,586 |
| Total expenses | 11,123,462 |
| Net investment income (loss) | 18,327,740 |
| Realized and Unrealized Gain (Loss) |
| Net realized gain (loss) on unaffiliated investments | 56,703,333 |
| Net change in unrealized appreciation (depreciation) on unaffiliated investments | (356,411,959) |
| Net realized and unrealized gain (loss) | (299,708,626) |
| Net increase (decrease) in net assets resulting from operations | $(281,380,886) |
The notes to the financial statements are an integral part of, and should be read in conjunction with, the financial statements.
| 28 | MainStay VP Janus Henderson Balanced Portfolio |
Statements of Changes in Net Assets
for the years ended December 31, 2022 and December 31, 2021
| | 2022 | 2021 |
| Increase (Decrease) in Net Assets |
| Operations: | | |
| Net investment income (loss) | $ 18,327,740 | $ 13,273,610 |
| Net realized gain (loss) | 56,703,333 | 105,512,557 |
| Net change in unrealized appreciation (depreciation) | (356,411,959) | 132,255,579 |
| Net increase (decrease) in net assets resulting from operations | (281,380,886) | 251,041,746 |
| Distributions to shareholders: | | |
| Initial Class | (30,995,228) | (19,693,563) |
| Service Class | (87,814,323) | (51,382,048) |
| Total distributions to shareholders | (118,809,551) | (71,075,611) |
| Capital share transactions: | | |
| Net proceeds from sales of shares | 160,730,282 | 200,068,355 |
| Net asset value of shares issued to shareholders in reinvestment of distributions | 118,809,551 | 71,075,611 |
| Cost of shares redeemed | (215,614,470) | (203,969,824) |
| Increase (decrease) in net assets derived from capital share transactions | 63,925,363 | 67,174,142 |
| Net increase (decrease) in net assets | (336,265,074) | 247,140,277 |
| Net Assets |
| Beginning of year | 1,706,065,864 | 1,458,925,587 |
| End of year | $1,369,800,790 | $1,706,065,864 |
The notes to the financial statements are an integral part of, and should be read in conjunction with, the financial statements.
29
Financial Highlights selected per share data and ratios
| | Year Ended December 31, |
| Initial Class | 2022 | | 2021 | | 2020 | | 2019 | | 2018 |
| Net asset value at beginning of year | $ 17.04 | | $ 15.21 | | $ 14.04 | | $ 12.31 | | $ 13.18 |
| Net investment income (loss) (a) | 0.21 | | 0.17 | | 0.22 | | 0.27 | | 0.26 |
| Net realized and unrealized gain (loss) | (3.06) | | 2.42 | | 1.74 | | 2.48 | | (0.14) |
| Total from investment operations | (2.85) | | 2.59 | | 1.96 | | 2.75 | | 0.12 |
| Less distributions: | | | | | | | | | |
| From net investment income | (0.17) | | (0.22) | | (0.27) | | (0.25) | | (0.25) |
| From net realized gain on investments | (1.07) | | (0.54) | | (0.52) | | (0.77) | | (0.74) |
| Total distributions | (1.24) | | (0.76) | | (0.79) | | (1.02) | | (0.99) |
| Net asset value at end of year | $ 12.95 | | $ 17.04 | | $ 15.21 | | $ 14.04 | | $ 12.31 |
| Total investment return (b) | (16.39)% | | 17.35% | | 14.32% | | 22.93% | | 0.42% |
| Ratios (to average net assets)/Supplemental Data: | | | | | | | | | |
| Net investment income (loss) | 1.43% | | 1.03% | | 1.57% | | 2.01% | | 1.93% |
| Net expenses (c) | 0.57% | | 0.57% | | 0.58% | | 0.58% | | 0.58% |
| Expenses (before waiver/reimbursement) (c) | 0.57% | | 0.57% | | 0.58% | | 0.58% | | 0.58%(d) |
| Portfolio turnover rate | 197% | | 103%(e) | | 106%(e) | | 98%(e) | | 132%(e) |
| Net assets at end of year (in 000's) | $ 348,495 | | $ 453,022 | | $ 416,712 | | $ 404,231 | | $ 371,106 |
| (a) | Per share data based on average shares outstanding during the year. |
| (b) | Total return does not reflect any deduction of sales charges, mortality and expense charges, contract charges or administrative charges. For periods of less than one year, total return is not annualized. |
| (c) | In addition to the fees and expenses which the Portfolio bears directly, it also indirectly bears a pro-rata share of the fees and expenses of the underlying funds in which it invests. Such indirect expenses are not included in the above expense ratios. |
| (d) | Expense waiver/reimbursement less than 0.01%. |
| (e) | The portfolio turnover rate not including mortgage dollar rolls were 60%, 95%, 93% and 103% for the years ended December 31, 2021, 2020, 2019 and 2018, respectively. |
| | Year Ended December 31, |
| Service Class | 2022 | | 2021 | | 2020 | | 2019 | | 2018 |
| Net asset value at beginning of year | $ 16.90 | | $ 15.10 | | $ 13.94 | | $ 12.24 | | $ 13.11 |
| Net investment income (loss) (a) | 0.17 | | 0.12 | | 0.18 | | 0.24 | | 0.22 |
| Net realized and unrealized gain (loss) | (3.03) | | 2.41 | | 1.74 | | 2.45 | | (0.13) |
| Total from investment operations | (2.86) | | 2.53 | | 1.92 | | 2.69 | | 0.09 |
| Less distributions: | | | | | | | | | |
| From net investment income | (0.13) | | (0.19) | | (0.24) | | (0.22) | | (0.22) |
| From net realized gain on investments | (1.07) | | (0.54) | | (0.52) | | (0.77) | | (0.74) |
| Total distributions | (1.20) | | (0.73) | | (0.76) | | (0.99) | | (0.96) |
| Net asset value at end of year | $ 12.84 | | $ 16.90 | | $ 15.10 | | $ 13.94 | | $ 12.24 |
| Total investment return (b) | (16.60)% | | 17.06% | | 14.03% | | 22.62% | | 0.17% |
| Ratios (to average net assets)/Supplemental Data: | | | | | | | | | |
| Net investment income (loss) | 1.18% | | 0.77% | | 1.31% | | 1.76% | | 1.69% |
| Net expenses (c) | 0.82% | | 0.82% | | 0.83% | | 0.83% | | 0.83% |
| Expenses (before waiver/reimbursement) (c) | 0.82% | | 0.82% | | 0.83% | | 0.83% | | 0.83%(d) |
| Portfolio turnover rate | 197% | | 103%(e) | | 106%(e) | | 98%(e) | | 132%(e) |
| Net assets at end of year (in 000's) | $ 1,021,306 | | $ 1,253,044 | | $ 1,042,214 | | $ 919,661 | | $ 748,653 |
| (a) | Per share data based on average shares outstanding during the year. |
| (b) | Total return does not reflect any deduction of sales charges, mortality and expense charges, contract charges or administrative charges. For periods of less than one year, total return is not annualized. |
| (c) | In addition to the fees and expenses which the Portfolio bears directly, it also indirectly bears a pro-rata share of the fees and expenses of the underlying funds in which it invests. Such indirect expenses are not included in the above expense ratios. |
| (d) | Expense waiver/reimbursement less than 0.01%. |
| (e) | The portfolio turnover rate not including mortgage dollar rolls were 60%, 95%, 93% and 103% for the years ended December 31, 2021, 2020, 2019 and 2018, respectively. |
The notes to the financial statements are an integral part of, and should be read in conjunction with, the financial statements.
| 30 | MainStay VP Janus Henderson Balanced Portfolio |
3.The terms “spread” and “yield spread” may refer to the difference in yield between a security or type of security and comparable U.S. Treasury issues. The terms may also refer to the difference in yield between two specific securities or types of securities at a given time.
Notes to Financial Statements
Note 1–Organization and Business
MainStay VP Funds Trust (the “Fund”) was organized as a Delaware statutory trust on February 1, 2011. The Fund is registered under the Investment Company Act of 1940, as amended (the “1940 Act”), as an open-end management investment company. The Fund is comprised of thirty-one separate series (collectively referred to as the “Portfolios”). These financial statements and notes relate to the MainStay VP Janus Henderson Balanced Portfolio (the "Portfolio"), a "diversified” portfolio, as that term is defined in the 1940 Act, as interpreted or modified by regulatory authorities having jurisdiction, from time to time.
Shares of the Portfolio are currently offered to certain separate accounts to fund variable annuity policies and variable universal life insurance policies issued by New York Life Insurance and Annuity Corporation (“NYLIAC”), a wholly-owned subsidiary of New York Life Insurance Company (“New York Life”) and may also be offered to fund variable annuity policies and variable universal life insurance policies issued by other insurance companies. NYLIAC allocates shares of the Portfolio to, among others, certain NYLIAC separate accounts. Shares of the Portfolio are also offered to the MainStay VP Conservative Allocation Portfolio, MainStay VP Moderate Allocation Portfolio, MainStay VP Growth Allocation Portfolio and MainStay VP Equity Allocation Portfolio, which operate as “funds-of-funds," and other variable insurance funds.
The following table lists the Portfolio's share classes that have been registered and commenced operations:
| Class | Commenced Operations |
| Initial Class | February 17, 2012 |
| Service Class | February 17, 2012 |
Shares of the Portfolio are offered and are redeemed at a price equal to their respective net asset value (“NAV”) per share. No sales or redemption charge is applicable to the purchase or redemption of the Portfolio's shares. Under the terms of the Fund’s multiple class plan, adopted pursuant to Rule 18f-3 under the 1940 Act, the classes differ in that, among other things, Service Class shares of the Portfolio pay a combined distribution and service fee of 0.25% of average daily net assets attributable to Service Class shares of the Portfolio to the Distributor (as defined in Note 3(B)) pursuant to a plan adopted in accordance with Rule 12b-1 under the 1940 Act. Contract owners of variable annuity contracts purchased after June 2, 2003, are permitted to invest only in the Service Class shares.
The Portfolio's investment objective is to seek long-term capital growth, consistent with preservation of capital and balanced by current income.
Note 2–Significant Accounting Policies
The Portfolio is an investment company and accordingly follows the investment company accounting and reporting guidance of the Financial Accounting Standards Board (“FASB”) Accounting Standards Codification Topic 946 Financial Services—Investment Companies. The Portfolio prepares its financial statements in accordance with generally accepted
accounting principles (“GAAP”) in the United States of America and follows the significant accounting policies described below.
(A) Securities Valuation. Investments are usually valued as of the close of regular trading on the New York Stock Exchange (the "Exchange") (usually 4:00 p.m. Eastern time) on each day the Portfolio is open for business ("valuation date").
Effective September 8, 2022, and pursuant to Rule 2a-5 under the 1940 Act, the Board of Trustees of the Fund (the "Board") designated New York Life Investment Management LLC (“New York Life Investments” or the "Manager") as its Valuation Designee (the "Valuation Designee"). The Valuation Designee is responsible for performing fair valuations relating to all investments in the Portfolio’s portfolio for which market quotations are not readily available; periodically assessing and managing material valuation risks; establishing and applying fair value methodologies; testing fair valuation methodologies; evaluating and overseeing pricing services; ensuring appropriate segregation of valuation and portfolio management functions; providing quarterly, annual and prompt reporting to the Board, as appropriate; identifying potential conflicts of interest; and maintaining appropriate records. The Valuation Designee has established a valuation committee ("Valuation Committee") to assist in carrying out the Valuation Designee’s responsibilities and establish prices of securities for which market quotations are not readily available. The Portfolio’s and the Valuation Designee's policies and procedures ("Valuation Procedures") govern the Valuation Designee’s selection and application of methodologies for determining and calculating the fair value of Portfolio investments. The Valuation Designee may value the Portfolio's portfolio securities for which market quotations are not readily available and other Portfolio assets utilizing inputs from pricing services and other third-party sources (together, “Pricing Sources”). The Valuation Committee meets (in person, via electronic mail or via teleconference) on an ad-hoc basis to determine fair valuations and on a quarterly basis to review fair value events with respect to certain securities for which market quotations are not readily available, including valuation risks and back-testing results, and preview reports to the Board.
The Valuation Committee establishes prices of securities for which market quotations are not readily available based on such methodologies and measurements on a regular basis after considering information that is reasonably available and deemed relevant by the Valuation Committee. The Board shall oversee the Valuation Designee and review fair valuation materials on a prompt, quarterly and annual basis and approve proposed revisions to the Valuation Procedures.
Investments for which market quotations are not readily available are valued at fair value as determined in good faith pursuant to the Valuation Procedures. A market quotation is readily available only when that quotation is a quoted price (unadjusted) in active markets for identical investments that the Portfolio can access at the measurement date, provided that a quotation will not be readily available if it is not reliable. "Fair value" is defined as the price the Portfolio would reasonably expect to receive upon selling an asset or liability in an orderly transaction to an independent buyer in the principal or most advantageous market for the
Notes to Financial Statements (continued)
asset or liability. Fair value measurements are determined within a framework that establishes a three-tier hierarchy that maximizes the use of observable market data and minimizes the use of unobservable inputs to establish a classification of fair value measurements for disclosure purposes. "Inputs" refer broadly to the assumptions that market participants would use in pricing the asset or liability, including assumptions about risk, such as the risk inherent in a particular valuation technique used to measure fair value using a pricing model and/or the risk inherent in the inputs for the valuation technique. Inputs may be observable or unobservable. Observable inputs reflect the assumptions market participants would use in pricing the asset or liability based on market data obtained from sources independent of the Portfolio. Unobservable inputs reflect the Portfolio’s own assumptions about the assumptions market participants would use in pricing the asset or liability based on the information available. The inputs or methodology used for valuing assets or liabilities may not be an indication of the risks associated with investing in those assets or liabilities. The three-tier hierarchy of inputs is summarized below.
| • | Level 1—quoted prices (unadjusted) in active markets for an identical asset or liability |
| • | Level 2—other significant observable inputs (including quoted prices for a similar asset or liability in active markets, interest rates and yield curves, prepayment speeds, credit risk, etc.) |
| • | Level 3—significant unobservable inputs (including the Portfolio's own assumptions about the assumptions that market participants would use in measuring fair value of an asset or liability) |
The level of an asset or liability within the fair value hierarchy is based on the lowest level of an input, both individually and in the aggregate, that is significant to the fair value measurement. The aggregate value by input level of the Portfolio’s assets and liabilities as of December 31, 2022, is included at the end of the Portfolio of Investments.
The Portfolio may use third-party vendor evaluations, whose prices may be derived from one or more of the following standard inputs, among others:
| • Benchmark yields | • Reported trades |
| • Broker/dealer quotes | • Issuer spreads |
| • Two-sided markets | • Benchmark securities |
| • Bids/offers | • Reference data (corporate actions or material event notices) |
| • Industry and economic events | • Comparable bonds |
| • Monthly payment information | |
An asset or liability for which a market quotation is not readily available is valued by methods deemed reasonable in good faith by the Valuation Committee, following the Valuation Procedures to represent fair value. Under these procedures, the Valuation Designee generally uses a market-based approach which may use related or comparable assets or liabilities, recent transactions, market multiples, book values and other relevant information. The Valuation Designee may also use an
income-based valuation approach in which the anticipated future cash flows of the asset or liability are discounted to calculate fair value. Discounts may also be applied due to the nature and/or duration of any restrictions on the disposition of the asset or liability. Fair value represents a good faith approximation of the value of a security. Fair value determinations involve the consideration of a number of subjective factors, an analysis of applicable facts and circumstances and the exercise of judgment. As a result, it is possible that the fair value for a security determined in good faith in accordance with the Valuation Procedures may differ from valuations for the same security determined for other funds using their own valuation procedures. Although the Valuation Procedures are designed to value a security at the price the Portfolio may reasonably expect to receive upon the security's sale in an orderly transaction, there can be no assurance that any fair value determination thereunder would, in fact, approximate the amount that the Portfolio would actually realize upon the sale of the security or the price at which the security would trade if a reliable market price were readily available. During the year ended December 31, 2022, there were no material changes to the fair value methodologies.
Securities which may be valued in this manner include, but are not limited to: (i) a security for which trading has been halted or suspended or otherwise does not have a readily available market quotation on a given day; (ii) a debt security that has recently gone into default and for which there is not a current market quotation; (iii) a security of an issuer that has entered into a restructuring; (iv) a security that has been delisted from a national exchange; (v) a security subject to trading collars for which no or limited trading takes place; and (vi) a security whose principal market has been temporarily closed at a time when, under normal conditions, it would be open. Securities valued in this manner are generally categorized as Level 2 or 3 in the hierarchy.
Equity securities are valued at the last quoted sales prices as of the close of regular trading on the relevant exchange on each valuation date. Securities that are not traded on the valuation date are valued at the mean of the last quoted bid and ask prices. Prices are normally taken from the principal market in which each security trades. These securities are generally categorized as Level 1 in the hierarchy.
Investments in mutual funds, including money market funds, are valued at their respective NAVs at the close of business each day on the valuation date. These securities are generally categorized as Level 1 in the hierarchy.
Debt securities (other than convertible and municipal bonds) are valued at the evaluated bid prices (evaluated mean prices in the case of convertible and municipal bonds) supplied by a pricing agent or broker selected by the Valuation Designee, in consultation with the Subadvisor. The evaluations are market-based measurements processed through a pricing application and represents the pricing agent’s good faith determination as to what a holder may receive in an orderly transaction under market conditions. The rules-based logic utilizes valuation techniques that reflect participants’ assumptions and vary by asset class and per methodology, maximizing the use of relevant observable data including quoted prices
| 32 | MainStay VP Janus Henderson Balanced Portfolio |
for similar assets, benchmark yield curves and market corroborated inputs. The evaluated bid or mean prices are deemed by the Valuation Designee, in consultation with the Subadvisor, to be representative of market values at the regular close of trading of the Exchange on each valuation date. Debt securities purchased on a delayed delivery basis are marked to market daily until settlement at the forward settlement date. Debt securities, including corporate bonds, U.S. government and federal agency bonds, municipal bonds, foreign bonds, convertible bonds, asset-backed securities and mortgage-backed securities are generally categorized as Level 2 in the hierarchy.
Temporary cash investments acquired in excess of 60 days to maturity at the time of purchase are valued using the latest bid prices or using valuations based on a matrix system (which considers such factors as security prices, yields, maturities and ratings), both as furnished by independent pricing services. Temporary cash investments that mature in 60 days or less at the time of purchase ("Short-Term Investments") are valued using the amortized cost method of valuation, unless the use of such method would be inappropriate. The amortized cost method involves valuing a security at its cost on the date of purchase and thereafter assuming a constant amortization to maturity of the difference between such cost and the value on maturity date. Amortized cost approximates the current fair value of a security. Securities valued using the amortized cost method are not valued using quoted prices in an active market and are generally categorized as Level 2 in the hierarchy.
The information above is not intended to reflect an exhaustive list of the methodologies that may be used to value portfolio investments. The Valuation Procedures permit the use of a variety of valuation methodologies in connection with valuing portfolio investments. The methodology used for a specific type of investment may vary based on the market data available or other considerations. The methodologies summarized above may not represent the specific means by which portfolio investments are valued on any particular business day.
(B) Income Taxes. The Portfolio's policy is to comply with the requirements of the Internal Revenue Code of 1986, as amended (the “Internal Revenue Code”), applicable to regulated investment companies and to distribute all of its taxable income to the shareholders of the Portfolio within the allowable time limits.
The Manager evaluates the Portfolio’s tax positions to determine if the tax positions taken meet the minimum recognition threshold in connection with accounting for uncertainties in income tax positions taken or expected to be taken for the purposes of measuring and recognizing tax liabilities in the financial statements. Recognition of tax benefits of an uncertain tax position is permitted only to the extent the position is “more likely than not” to be sustained assuming examination by taxing authorities. The Manager analyzed the Portfolio's tax positions taken on federal, state and local income tax returns for all open tax years (for up to three tax years) and has concluded that no provisions for federal, state and local income tax are required in the Portfolio's financial statements. The Portfolio's federal, state and local income tax and federal excise tax returns for tax years for which the applicable statutes of limitations have
not expired are subject to examination by the Internal Revenue Service and state and local departments of revenue.
(C) Dividends and Distributions to Shareholders. Dividends and distributions are recorded on the ex-dividend date. The Portfolio intends to declare and pay dividends from net investment income and distributions from net realized capital and currency gains, if any, at least annually. All dividends and distributions are reinvested at NAV in the same class of shares of the Portfolio. Dividends and distributions to shareholders are determined in accordance with federal income tax regulations and may differ from determinations using GAAP.
(D) Security Transactions and Investment Income. The Portfolio records security transactions on the trade date. Realized gains and losses on security transactions are determined using the identified cost method. Dividend income is recognized on the ex-dividend date, net of any foreign tax withheld at the source, and interest income is accrued as earned using the effective interest rate method and includes any realized gains and losses from repayments of principal on mortgage-backed securities. Distributions received from real estate investment trusts may be classified as dividends, capital gains and/or return of capital. Discounts and premiums on securities purchased for the Portfolio are accreted and amortized, respectively, on the effective interest rate method.
Investment income and realized and unrealized gains and losses on investments of the Portfolio are allocated pro rata to the separate classes of shares based upon their relative net assets on the date the income is earned or realized and unrealized gains and losses are incurred.
The Portfolio may place a debt security on non-accrual status and reduce related interest income by ceasing current accruals and writing off all or a portion of any interest receivables when the collection of all or a portion of such interest has become doubtful. A debt security is removed from non-accrual status when the issuer resumes interest payments or when collectability of interest is reasonably assured.
(E) Expenses. Expenses of the Fund are allocated to the individual Portfolios in proportion to the net assets of the respective Portfolios when the expenses are incurred, except where direct allocations of expenses can be made. Expenses (other than fees incurred under the distribution and service plans, further discussed in Note 3(B), which are charged directly to the Service Class shares) are allocated to separate classes of shares pro rata based upon their relative net assets on the date the expenses are incurred. The expenses borne by the Portfolio, including those of related parties to the Portfolio, are shown in the Statement of Operations.
Additionally, the Portfolio may invest in mutual funds, which are subject to management fees and other fees that may cause the costs of investing in mutual funds to be greater than the costs of owning the underlying securities directly. These indirect expenses of mutual funds are not included in the amounts shown as expenses in the Statement of Operations or in the expense ratios included in the Financial Highlights.
Notes to Financial Statements (continued)
(F) Use of Estimates. In preparing financial statements in conformity with GAAP, the Manager makes estimates and assumptions that affect the reported amounts and disclosures in the financial statements. Actual results could differ from those estimates and assumptions.
(G) Securities Lending. In order to realize additional income, the Portfolio may engage in securities lending, subject to the limitations set forth in the 1940 Act and relevant guidance by the staff of the Securities and Exchange Commission (“SEC”). If the Portfolio engages in securities lending, the Portfolio will lend through its custodian, JPMorgan Chase Bank, N.A., ("JPMorgan"), acting as securities lending agent on behalf of the Portfolio. Under the current arrangement, JPMorgan will manage the Portfolio's collateral in accordance with the securities lending agency agreement between the Portfolio and JPMorgan, and indemnify the Portfolio against counterparty risk. The loans will be collateralized by cash (which may be invested in a money market fund) and/or non-cash collateral (which may include U.S. Treasury securities and/or U.S. government agency securities issued or guaranteed by the United States government or its agencies or instrumentalities) at least equal at all times to the market value of the securities loaned. Non-cash collateral held at year end is segregated and cannot be transferred by the Portfolio. The Portfolio bears the risk of delay in recovery of, or loss of rights in, the securities loaned. The Portfolio may also record a realized gain or loss on securities deemed sold due to a borrower’s inability to return securities on loan. The Portfolio bears the risk of any loss on investment of cash collateral. The Portfolio will receive compensation for lending its securities in the form of fees or it will retain a portion of interest earned on the investment of any cash collateral. The Portfolio will also continue to receive interest and dividends on the securities loaned and any gain or loss in the market price of the securities loaned that may occur during the term of the loan will be for the account of the Portfolio. Income earned from securities lending activities, if any, is reflected in the Statement of Operations. Securities on loan as of December 31, 2022, are shown in the Portfolio of Investments.
(H) Dollar Rolls. The Portfolio may enter into dollar roll transactions in which it sells mortgage-backed securities ("MBS") from its portfolio to a counterparty from whom it simultaneously agrees to buy a similar security on a delayed delivery basis. The Portfolio generally transfers MBS where the MBS are "to be announced," therefore, the Portfolio accounts for these transactions as purchases and sales.
When accounted for as purchase and sales, the securities sold in connection with the dollar rolls are removed from the portfolio and a realized gain or loss is recognized. The securities the Portfolio has agreed to acquire are included at market value in the Portfolio of Investments and liabilities for such purchase commitments are included as payables for investments purchased. During the roll period, the Portfolio foregoes principal and interest paid on the securities. The Portfolio is compensated by the difference between the current sales price and the forward price for the future as well as by the earnings on the cash proceeds of the initial sale. Dollar rolls may be renewed without physical delivery of the securities subject to the contract. Dollar roll transactions involve certain
risks, including the risk that the securities returned to the Portfolio at the end of the roll period, while substantially similar, could be inferior to what was initially sold to the counterparty.
(I) Securities Risk. The ability of issuers of debt securities held by the Portfolio to meet their obligations may be affected by, among other things, economic or political developments in a specific country, industry or region. Debt securities are also subject to the risks associated with changes in interest rates.
The Portfolio may invest in high-yield debt securities (sometimes called “junk bonds”), which are generally considered speculative because they present a greater risk of loss, including default, than higher rated debt securities. These securities pay investors a premium—a higher interest rate or yield than investment grade debt securities—because of the increased risk of loss. These securities can also be subject to greater price volatility. In times of unusual or adverse market, economic or political conditions, these securities may experience higher than normal default rates.
Investments in the Portfolio are not guaranteed, even though some of the Portfolio’s underlying investments are guaranteed by the U.S. government or its agencies or instrumentalities. The principal risk of mortgage-related and asset-backed securities is that the underlying debt may be prepaid ahead of schedule, if interest rates fall, thereby reducing the value of the Portfolio’s investment. If interest rates rise, less of the debt may be prepaid and the Portfolio may lose money because the Portfolio may be unable to invest in higher yielding assets. The Portfolio is subject to interest-rate risk and can lose principal value when interest rates rise. Bonds are also subject to credit risk, in which the bond issuer may fail to pay interest and principal in a timely manner.
The Portfolio’s investments may include loans which are usually rated below investment grade and are generally considered speculative because they present a greater risk of loss, including default, than higher rated debt securities. These investments pay investors a higher interest rate than investment grade debt securities because of the increased risk of loss. Although certain loans are collateralized, there is no guarantee that the value of the collateral will be sufficient to repay the loan. In a recession or serious credit event, the value of these investments could decline significantly. As a result, the Portfolio’s NAVs could go down and you could lose money.
In addition, loans generally are subject to extended settlement periods that may be longer than seven days. As a result, the Portfolio may be adversely affected by selling other investments at an unfavorable time and/or under unfavorable conditions or engaging in borrowing transactions, such as borrowing against its credit facility, to raise cash to meet redemption obligations or pursue other investment opportunities.
In certain circumstances, loans may not be deemed to be securities. As a result, the Portfolio may not have the protection of anti-fraud provisions of the federal securities laws. In such cases, the Portfolio generally must rely on the contractual provisions in the loan agreement and common-law fraud protections under applicable state law.
| 34 | MainStay VP Janus Henderson Balanced Portfolio |
The Portfolio may invest in foreign securities, both debt and equity securities, which carry certain risks that are in addition to the usual risks inherent in domestic securities. These risks include those resulting from currency fluctuations, future adverse political or economic developments and possible imposition of currency exchange blockages or other foreign governmental laws or restrictions. These risks are likely to be greater in emerging markets than in developed markets. The ability of issuers of securities held by the Portfolio to meet their obligations may be affected by, among other things, economic or political developments in a specific country, industry or region.
(J) LIBOR Replacement Risk. The Portfolio may invest in certain debt securities, derivatives or other financial instruments that utilize the London Interbank Offered Rate ("LIBOR"), as a “benchmark” or “reference rate” for various interest rate calculations. As of January 1, 2022, the United Kingdom Financial Conduct Authority, which regulates LIBOR, ceased its active encouragement of banks to provide the quotations needed to sustain most LIBOR rates due to the absence of an active market for interbank unsecured lending and other reasons. However, the United Kingdom Financial Conduct Authority, the LIBOR administrator and other regulators announced that the most widely used tenors of U.S. dollar LIBOR will continue until mid-2023. As a result, it is anticipated that the remaining LIBOR settings will be discontinued or will no longer be sufficiently robust to be representative of its underlying market around that time. Various financial industry groups will plan for that transition and certain regulators and industry groups have taken actions to establish alternative reference rates (e.g., the Secured Overnight Financing Rate, which measures the cost of overnight borrowings through repurchase agreement transactions collateralized with U.S. Treasury securities and is intended to replace U.S. dollar LIBOR with certain adjustments). However, there are challenges to converting certain contracts and transactions to a new benchmark and neither the full effects of the transition process nor its ultimate outcome is known.
The elimination of LIBOR or changes to other reference rates or any other changes or reforms to the determination or supervision of reference rates could have an adverse impact on the market for, or value of, any securities or payments linked to those reference rates, which may adversely affect the Portfolio's performance and/or net asset value. Uncertainty and risk also remain regarding the willingness and ability of issuers and lenders to include enhanced provisions in new and existing contracts or instruments. Consequently, the transition away from LIBOR to other reference rates may lead to increased volatility and illiquidity in markets that are tied to LIBOR, fluctuations in values of LIBOR-related investments or investments in issuers that utilize LIBOR, increased difficulty in borrowing or refinancing and diminished effectiveness of hedging strategies, adversely affecting the Portfolio's performance. Furthermore, the risks associated with the expected discontinuation of LIBOR and transition may be exacerbated if the work necessary to effect an orderly transition to an alternative reference rate is not completed in a timely manner. While the transition away from LIBOR has already begun with no material adverse effect to the Portfolio's performance, the transition is expected to last through mid-2023 for some LIBOR tenors.
The usefulness of LIBOR as a benchmark could deteriorate anytime during this transition period.
(K) Indemnifications. Under the Fund’s organizational documents, its officers and trustees are indemnified against certain liabilities that may arise out of performance of their duties to the Fund. Additionally, in the normal course of business, the Portfolio enters into contracts with third-party service providers that contain a variety of representations and warranties and that may provide general indemnifications. The Portfolio's maximum exposure under these arrangements is unknown, as this would involve future claims that may be made against the Portfolio that have not yet occurred. The Manager believes that the risk of loss in connection with these potential indemnification obligations is remote. However, there can be no assurance that material liabilities related to such obligations will not arise in the future, which could adversely impact the Portfolio.
Note 3–Fees and Related Party Transactions
(A) Manager and Subadvisor. New York Life Investments, a registered investment adviser and an indirect, wholly-owned subsidiary of New York Life, serves as the Portfolio’s Manager pursuant to an Amended and Restated Management Agreement (“Management Agreement”). The Manager provides offices, conducts clerical, recordkeeping and bookkeeping services, and keeps most of the financial and accounting records required to be maintained by the Portfolio. Except for the portion of salaries and expenses that are the responsibility of the Portfolio, the Manager pays the salaries and expenses of all personnel affiliated with the Portfolio and certain operational expenses of the Portfolio. During a portion of the year ended December 31, 2022, the Portfolio reimbursed New York Life Investments in an amount equal to the portion of the compensation of the Chief Compliance Officer attributable to the Portfolio. Janus Henderson Investors US LLC (“Janus” or the “Subadvisor”), a registered investment adviser and wholly-owned subsidiary of Janus Henderson Group PLC, doing business as Janus Henderson Investors, serves as Subadvisor to the Portfolio and is responsible for the day-to-day portfolio management of the Portfolio. Pursuant to the terms of a Subadvisory Agreement between New York Life Investments and Janus, New York Life Investments pays for the services of the Subadvisor.
Pursuant to the Management Agreement, the Fund pays the Manager, on behalf of the Portfolio, a monthly fee for the services performed and the facilities furnished at an annual rate of the Portfolio's average daily net assets as follows: 0.55% up to $1 billion; 0.525% from $1 billion to $2 billion; and 0.515% in excess of $2 billion. During the year ended December 31, 2022, the effective management fee rate was 0.54%.
During the year ended December 31, 2022, New York Life Investments earned fees from the Portfolio in the amount of $7,962,983 and paid the Subadvisor fees of $3,722,822.
JPMorgan provides sub-administration and sub-accounting services to the Portfolio pursuant to an agreement with New York Life Investments. These services include calculating the daily NAVs of the Portfolio, maintaining the general ledger and sub-ledger accounts for the
Notes to Financial Statements (continued)
calculation of the Portfolio's NAVs, and assisting New York Life Investments in conducting various aspects of the Portfolio's administrative operations. For providing these services to the Portfolio, JPMorgan is compensated by New York Life Investments.
Pursuant to an agreement between the Fund and New York Life Investments, New York Life Investments is responsible for providing or procuring certain regulatory reporting services for the Portfolio. The Portfolio will reimburse New York Life Investments for the actual costs incurred by New York Life Investments in connection with providing or procuring these services for the Portfolio.
(B) Distribution and Service Fees. The Fund, on behalf of the Portfolio, has entered into a distribution agreement with NYLIFE Distributors LLC (the “Distributor”), an affiliate of New York Life Investments. The Portfolio has adopted a distribution plan (the “Plan”) in accordance with the provisions of Rule 12b-1 under the 1940 Act. Under the Plan, the Distributor has agreed to provide, through its affiliates or independent third parties, various distribution-related, shareholder and administrative support services to the Service Class shareholders. For its services, the Distributor is entitled to a combined distribution and service fee accrued daily and paid monthly at an annual rate of 0.25% of the average daily net assets attributable to the Service Class shares of the Portfolio.
Note 4-Federal Income Tax
As of December 31, 2022, the cost and unrealized appreciation (depreciation) of the Portfolio’s investment portfolio, including applicable derivative contracts and other financial instruments, as determined on a federal income tax basis, were as follows:
| | Federal Tax
Cost | Gross
Unrealized
Appreciation | Gross
Unrealized
(Depreciation) | Net
Unrealized
Appreciation/
(Depreciation) |
| Investments in Securities | $1,279,450,170 | $222,496,542 | $(60,146,903) | $162,349,639 |
As of December 31, 2022, the components of accumulated gain (loss) on a tax basis were as follows:
Ordinary
Income | Accumulated
Capital
and Other
Gain (Loss) | Other
Temporary
Differences | Unrealized
Appreciation
(Depreciation) | Total
Accumulated
Gain (Loss) |
| $18,438,809 | $56,624,317 | $— | $162,349,639 | $237,412,765 |
The difference between book-basis and tax-basis unrealized appreciation (depreciation) is primarily due to wash sale and cumulative bond amortization adjustments.
During the years ended December 31, 2022 and December 31, 2021, the tax character of distributions paid as reflected in the Statements of Changes in Net Assets was as follows:
| | 2022 | 2021 |
| Distributions paid from: | | |
| Ordinary Income | $ 19,906,699 | $34,359,548 |
| Long-Term Capital Gains | 98,902,852 | 36,716,063 |
| Total | $118,809,551 | $71,075,611 |
Note 5–Custodian
JPMorgan is the custodian of cash and securities held by the Portfolio. Custodial fees are charged to the Portfolio based on the Portfolio's net assets and/or the market value of securities held by the Portfolio and the number of certain transactions incurred by the Portfolio.
Note 6–Line of Credit
The Portfolio and certain other funds managed by New York Life Investments maintain a line of credit with a syndicate of banks in order to secure a source of funds for temporary purposes to meet unanticipated or excessive redemption requests.
Effective July 26, 2022, under the credit agreement (the “Credit Agreement”), the aggregate commitment amount is $600,000,000 with an additional uncommitted amount of $100,000,000. The commitment fee is an annual rate of 0.15% of the average commitment amount payable quarterly, regardless of usage, to JPMorgan, who serves as the agent to the syndicate. The commitment fee is allocated among the Portfolio and certain other funds managed by New York Life Investments based upon their respective net assets and other factors. Interest on any revolving credit loan is charged based upon the Federal Funds Rate, Daily Simple Secured Overnight Financing Rate ("SOFR") + 0.10%, or the Overnight Bank Funding Rate, whichever is higher. The Credit Agreement expires on July 25, 2023, although the Portfolio, certain other funds managed by New York Life Investments and the syndicate of banks may renew the Credit Agreement for an additional year on the same or different terms or enter into a credit agreement with a different syndicate of banks. Prior to July 26, 2022, the aggregate commitment amount and the commitment fee were the same as those under the current Credit Agreement. During the year ended December 31, 2022, there were no borrowings made or outstanding with respect to the Portfolio under the Credit Agreement.
Note 7–Interfund Lending Program
Pursuant to an exemptive order issued by the SEC, the Portfolio, along with certain other funds managed by New York Life Investments, may participate in an interfund lending program. The interfund lending program provides an alternative credit facility that permits the Portfolio and certain other funds managed by New York Life Investments to lend or borrow money for temporary purposes directly to or from one another, subject to the conditions of the exemptive order. During the year ended
| 36 | MainStay VP Janus Henderson Balanced Portfolio |
December 31, 2022, there were no interfund loans made or outstanding with respect to the Portfolio.
Note 8–Purchases and Sales of Securities (in 000’s)
During the year ended December 31, 2022, purchases and sales of U.S. government securities were $914,224 and $865,287, respectively. Purchases and sales of securities, other than U.S. government securities and short-term securities, were $1,969,628 and $2,046,395, respectively.
Note 9–Capital Share Transactions
Transactions in capital shares for the years ended December 31, 2022 and December 31, 2021, were as follows:
| Initial Class | Shares | Amount |
| Year ended December 31, 2022: | | |
| Shares sold | 486,758 | $ 7,148,243 |
| Shares issued to shareholders in reinvestment of distributions | 2,496,394 | 30,995,228 |
| Shares redeemed | (2,663,843) | (38,681,553) |
| Net increase (decrease) | 319,309 | $ (538,082) |
| Year ended December 31, 2021: | | |
| Shares sold | 572,943 | $ 9,276,043 |
| Shares issued to shareholders in reinvestment of distributions | 1,225,913 | 19,693,563 |
| Shares redeemed | (2,609,368) | (42,369,071) |
| Net increase (decrease) | (810,512) | $ (13,399,465) |
| |
| Service Class | Shares | Amount |
| Year ended December 31, 2022: | | |
| Shares sold | 10,549,192 | $ 153,582,039 |
| Shares issued to shareholders in reinvestment of distributions | 7,128,654 | 87,814,323 |
| Shares redeemed | (12,295,154) | (176,932,917) |
| Net increase (decrease) | 5,382,692 | $ 64,463,445 |
| Year ended December 31, 2021: | | |
| Shares sold | 11,911,903 | $ 190,792,312 |
| Shares issued to shareholders in reinvestment of distributions | 3,222,617 | 51,382,048 |
| Shares redeemed | (10,018,242) | (161,600,753) |
| Net increase (decrease) | 5,116,278 | $ 80,573,607 |
Note 10–Other Matters
As of the date of this report, interest rates in the United States and many parts of the world, including certain European countries, are ascending from historically low levels. Thus, the Portfolio currently faces a heightened level of risk associated with rising interest rates. This could be driven by a variety of factors, including but not limited to central bank monetary policies, changing inflation or real growth rates, general economic conditions, increasing bond issuances or reduced market demand for low yielding investments.
An outbreak of COVID-19, first detected in December 2019, has developed into a global pandemic and has resulted in travel restrictions, closure of international borders, certain businesses and securities markets, restrictions on securities trading activities, prolonged quarantines, supply chain disruptions, and lower consumer demand, as well as general concern and uncertainty. In 2022, many countries lifted some or all restrictions related to COVID-19. However, the continued impact of COVID-19 and related variants is uncertain and could further adversely affect the global economy, national economies, individual issuers and capital markets in unforeseeable ways and result in a substantial and extended economic downturn. Developments that disrupt global economies and financial markets, such as COVID-19, may magnify factors that affect the Portfolio's performance.
Note 11–Subsequent Events
In connection with the preparation of the financial statements of the Portfolio as of and for the year ended December 31, 2022, events and transactions subsequent to December 31, 2022, through the date the financial statements were issued have been evaluated by the Manager for possible adjustment and/or disclosure. No subsequent events requiring financial statement adjustment or disclosure have been identified.
Report of Independent Registered Public Accounting Firm
To the Board of Trustees of MainStay VP Funds Trust and Shareholders of
MainStay VP Janus Henderson Balanced Portfolio
Opinion on the Financial Statements
We have audited the accompanying statement of assets and liabilities, including the portfolio of investments, of MainStay VP Janus Henderson Balanced Portfolio (one of the portfolios constituting MainStay VP Funds Trust, referred to hereafter as the “Portfolio”) as of December 31, 2022, the related statement of operations for the year ended December 31, 2022, the statements of changes in net assets for each of the two years in the period ended December 31, 2022, including the related notes, and the financial highlights for each of the five years in the period ended December 31, 2022 (collectively referred to as the “financial statements”). In our opinion, the financial statements present fairly, in all material respects, the financial position of the Portfolio as of December 31, 2022, the results of its operations for the year then ended, the changes in its net assets for each of the two years in the period ended December 31, 2022 and the financial highlights for each of the five years in the period ended December 31, 2022 in conformity with accounting principles generally accepted in the United States of America.
Basis for Opinion
These financial statements are the responsibility of the Portfolio’s management. Our responsibility is to express an opinion on the Portfolio’s financial statements based on our audits. We are a public accounting firm registered with the Public Company Accounting Oversight Board (United States) (PCAOB) and are required to be independent with respect to the Portfolio in accordance with the U.S. federal securities laws and the applicable rules and regulations of the Securities and Exchange Commission and the PCAOB.
We conducted our audits of these financial statements in accordance with the standards of the PCAOB. Those standards require that we plan and perform the audit to obtain reasonable assurance about whether the financial statements are free of material misstatement, whether due to error or fraud.
Our audits included performing procedures to assess the risks of material misstatement of the financial statements, whether due to error or fraud, and performing procedures that respond to those risks. Such procedures included examining, on a test basis, evidence regarding the amounts and disclosures in the financial statements. Our audits also included evaluating the accounting principles used and significant estimates made by management, as well as evaluating the overall presentation of the financial statements. Our procedures included confirmation of securities owned as of December 31, 2022 by correspondence with the custodian, transfer agents and brokers; when replies were not received from brokers, we performed other auditing procedures. We believe that our audits provide a reasonable basis for our opinion.
/s/PricewaterhouseCoopers LLP
New York, New York
February 24, 2023
We have served as the auditor of one or more investment companies in the MainStay group of funds since 1984.
| 38 | MainStay VP Janus Henderson Balanced Portfolio |
Board Consideration and Approval of Management Agreement and Subadvisory Agreement (Unaudited)
The continuation of the Management Agreement with respect to the MainStay VP Janus Henderson Balanced Portfolio (“Portfolio”) and New York Life Investment Management LLC (“New York Life Investments”) and the Subadvisory Agreement between New York Life Investments and Janus Henderson Investors US LLC (“Janus”) with respect to the Portfolio (together, “Advisory Agreements”) is subject to annual review and approval by the Board of Trustees of MainStay VP Funds Trust (“Board” of the “Trust”) in accordance with Section 15 of the Investment Company Act of 1940, as amended (“1940 Act”). At its December 6–7, 2022 meeting, the Board, which is comprised solely of Trustees who are not an “interested person” (as such term is defined in the 1940 Act) of the Trust (“Independent Trustees”), unanimously approved the continuation of each of the Advisory Agreements for a one-year period.
In reaching the decision to approve the continuation of each of the Advisory Agreements, the Board considered information and materials furnished by New York Life Investments and Janus in connection with an annual contract review process undertaken by the Board that took place at meetings of the Board and its Contracts Committee during October 2022 through December 2022, including information and materials furnished by New York Life Investments and Janus in response to requests prepared on behalf of the Board, and in consultation with the Board, by independent legal counsel to the Independent Trustees, which encompassed a variety of topics, including those summarized below. Information and materials requested by and furnished to the Board for consideration in connection with the contract review process included, among other items, reports on the Portfolio and “peer funds” prepared by Institutional Shareholder Services Inc. (“ISS”), an independent third-party service provider engaged by the Board to report objectively on the Portfolio’s investment performance, management fee and total expenses. The Board also considered information on the fees charged to other investment advisory clients of New York Life Investments and/or Janus that follow investment strategies similar to those of the Portfolio, if any, and, when applicable, the rationale for any differences in the Portfolio’s management and subadvisory fees and the fees charged to those other investment advisory clients. In addition, the Board considered information regarding the legal standards and fiduciary obligations applicable to its consideration of the continuation of each of the Advisory Agreements. The contract review process, including the structure and format for information and materials provided to the Board, has been developed in consultation with the Board. The Independent Trustees also met in executive sessions with their independent legal counsel and, for portions thereof, with senior management of New York Life Investments.
The Board’s deliberations with respect to the continuation of each of the Advisory Agreements reflect a year-long process, and the Board also took into account information furnished to the Board and its Committees throughout the year, as deemed relevant and appropriate by the Trustees, including, among other items, reports on investment performance of the Portfolio and investment-related matters for the Portfolio as well as presentations from New York Life Investments and, generally annually, Janus personnel. In addition, the Board took into account other information received from New York Life Investments throughout the year,
including, among other items, periodic reports on legal and compliance matters, risk management, portfolio turnover, brokerage commissions and non-advisory services provided to the Portfolio by New York Life Investments, as deemed relevant and appropriate by the Trustees.
In addition to information provided to the Board throughout the year, the Board received information in connection with its June 2022 meeting provided specifically in response to requests prepared on behalf of the Board, and in consultation with the Board, by independent legal counsel to the Independent Trustees regarding the Portfolio’s distribution arrangements. In addition, the Board received information regarding the Portfolio’s asset levels, share purchase and redemption activity and the payment of Rule 12b-1 and/or other fees by applicable share classes of the Portfolio, among other information.
In considering the continuation of each of the Advisory Agreements, the Trustees reviewed and evaluated the information and factors they believed to reasonably be necessary and appropriate in light of legal advice furnished to them by independent legal counsel to the Independent Trustees and through the exercise of their own business judgment. Although individual Trustees may have weighed certain factors or information differently and the Board did not consider any single factor or information controlling in reaching its decision, the factors considered by the Board are summarized in more detail below and include, among other factors: (i) the nature, extent and quality of the services provided to the Portfolio by New York Life Investments and Janus; (ii) the qualifications of the portfolio managers of the Portfolio and the historical investment performance of the Portfolio, New York Life Investments and Janus; (iii) the costs of the services provided, and profits realized, by New York Life Investments and Janus with respect to their relationships with the Portfolio; (iv) the extent to which economies of scale have been realized or may be realized if the Portfolio grows and the extent to which any economies of scale have been shared, have benefited or may benefit the Portfolio’s shareholders; and (v) the reasonableness of the Portfolio’s management and subadvisory fees and total ordinary operating expenses. Although the Board recognized that comparisons between the Portfolio’s fees and expenses and those of other funds are imprecise given different terms of agreements, variations in fund strategies and other factors, the Board considered the reasonableness of the Portfolio’s management fee and total ordinary operating expenses as compared to the peer funds identified by ISS. Throughout their considerations, the Trustees acknowledged the commitment of New York Life Investments and its affiliates to serve the MainStay Group of Funds, as well as their capacity, experience, resources, financial stability and reputations. The Trustees also acknowledged the entrepreneurial and other risks assumed by New York Life Investments in sponsoring and managing the Portfolio. With respect to the Subadvisory Agreement, the Board took into account New York Life Investments’ recommendation to approve the continuation of the Subadvisory Agreement.
The Trustees noted that, throughout the year, the Trustees are afforded an opportunity to ask questions of, and request additional information or materials from, New York Life Investments and Janus. The Board’s decision with respect to each of the Advisory Agreements may have also
Board Consideration and Approval of Management Agreement and Subadvisory Agreement (Unaudited) (continued)
been based, in part, on the Board’s knowledge of New York Life Investments and Janus resulting from, among other things, the Board’s consideration of each of the Advisory Agreements in prior years, the advisory agreements for other funds in the MainStay Group of Funds, the Board’s review throughout the year of the performance and operations of other funds in the MainStay Group of Funds and each Trustee’s business judgment and industry experience. In addition to considering the above-referenced factors, the Board observed that in the marketplace, notably under variable life insurance policies and variable annuity contracts for which the Portfolio serves as an investment option, there are a range of investment options available to investors and that the Portfolio’s shareholders, having had the opportunity to consider other investment options, have chosen to invest in the Portfolio.
The factors that figured prominently in the Board’s decision to approve the continuation of each of the Advisory Agreements during its December 6–7, 2022 meeting are summarized in more detail below.
Nature, Extent and Quality of Services Provided by New York Life Investments and Janus
The Board examined the nature, extent and quality of the services that New York Life Investments provides to the Portfolio. The Board evaluated New York Life Investments’ experience and capabilities in serving as manager of the Portfolio and considered that the Portfolio operates in a “manager-of-managers” structure. The Board also considered New York Life Investments’ responsibilities and services provided pursuant to this structure, including overseeing the services provided by Janus, evaluating the performance of Janus, making recommendations to the Board as to whether the Subadvisory Agreement should be renewed, modified or terminated and periodically reporting to the Board regarding the results of New York Life Investments’ evaluation and monitoring functions. The Board noted that New York Life Investments manages other mutual funds, serves a variety of other investment advisory clients, including other pooled investment vehicles, and has experience overseeing mutual fund service providers, including subadvisors. The Board considered the experience of senior personnel at New York Life Investments providing management and administrative and other non-advisory services to the Portfolio. The Board observed that New York Life Investments devotes significant resources and time to providing management and administrative and other non-advisory services to the Portfolio, including New York Life Investments’ oversight and due diligence reviews of Janus and ongoing analysis of, and interactions with, Janus with respect to, among other things, the Portfolio’s investment performance and risks as well as Janus’ investment capabilities and subadvisory services with respect to the Portfolio.
The Board also considered the range of services that New York Life Investments provides to the Portfolio under the terms of the Management Agreement, including: (i) fund accounting and ongoing supervisory services provided by New York Life Investments’ Fund Administration and Accounting Group; (ii) investment supervisory and analytical services provided by New York Life Investments’ Investment Consulting Group; (iii) compliance services provided by the Trust’s Chief Compliance Officer as
well as New York Life Investments’ compliance department, including supervision and implementation of the Portfolio’s compliance program; (iv) legal services provided by New York Life Investments’ Office of the General Counsel; and (v) risk management monitoring and analysis by compliance and investment personnel. In addition, the Board considered New York Life Investments’ willingness to invest in personnel and other resources, such as cyber security, information security and business continuity planning, designed to benefit the Portfolio and noted that New York Life Investments is responsible for compensating the Trust’s officers, except for a portion of the salary of the Trust’s Chief Compliance Officer. The Board recognized that New York Life Investments provides certain other non-advisory services to the Portfolio and has provided an increasingly broad array of non-advisory services to the MainStay Group of Funds as a result of regulatory and other developments, including in connection with the implementation of the MainStay Group of Funds’ derivatives risk management program and policies and procedures adopted pursuant to Rule 18f-4 under the 1940 Act.
The Board also examined the range, and the nature, extent and quality, of the investment advisory services that Janus provides to the Portfolio and considered the terms of each of the Advisory Agreements. The Board evaluated Janus’ experience and performance in serving as subadvisor to the Portfolio and advising other portfolios and Janus’ track record and experience in providing investment advisory services, the experience of investment advisory, senior management and administrative personnel at Janus. The Board considered New York Life Investments’ and Janus’ overall resources, legal and compliance environment, capabilities, reputation, financial condition and history. In addition to information provided in connection with quarterly meetings with the Trust’s Chief Compliance Officer, the Board considered information regarding the compliance policies and procedures of New York Life Investments and Janus and acknowledged their commitment to further developing and strengthening compliance programs relating to the Portfolio. The Board also considered Janus’ ability to recruit and retain qualified investment professionals and willingness to invest in personnel and other resources to service and support the Portfolio. In this regard, the Board considered the qualifications and experience of the Portfolio’s portfolio managers, the number of accounts managed by the portfolio managers and the method for compensating the portfolio managers.
In addition, the Board considered information provided by New York Life Investments and Janus regarding the operations of their respective business continuity plans in response to the COVID-19 pandemic and the continued remote work environment.
Based on these considerations, among others, the Board concluded that the Portfolio would likely continue to benefit from the nature, extent and quality of these services.
Investment Performance
In evaluating the Portfolio’s investment performance, the Board considered investment performance results over various periods in light of the Portfolio’s investment objective, strategies and risks. The Board
| 40 | MainStay VP Janus Henderson Balanced Portfolio |
considered investment reports on, and analysis of, the Portfolio’s performance provided to the Board throughout the year. These reports include, among other items, information on the Portfolio’s gross and net returns, the Portfolio’s investment performance compared to a relevant investment category and the Portfolio’s benchmarks, the Portfolio’s risk-adjusted investment performance and the Portfolio’s investment performance as compared to peer funds, as appropriate, as well as portfolio attribution information and commentary on the effect of market conditions. The Board also considered information provided by ISS showing the investment performance of the Portfolio as compared to peer funds. In addition, the Board reviewed the methodology used by ISS to construct the group of peer funds for comparative purposes.
The Board also took into account its discussions with senior management at New York Life Investments concerning the Portfolio’s investment performance over various periods as well as discussions between the Portfolio’s portfolio management team and the members of the Board’s Investment Committee, which generally occur on an annual basis. In addition, the Board considered any specific actions that New York Life Investments or Janus had taken, or had agreed to take, to seek to enhance Portfolio investment performance and the results of those actions.
Based on these considerations, among others, the Board concluded that its review of the Portfolio’s investment performance and related information supported a determination to approve the continuation of each of the Advisory Agreements.
Costs of the Services Provided, and Profits and Other Benefits Realized, by New York Life Investments and Janus
The Board considered the costs of the services provided under each of the Advisory Agreements. The Board also considered the profits realized by New York Life Investments and its affiliates and Janus due to their relationships with the Portfolio as well as by New York Life Investments and its affiliates due to their relationships with the MainStay Group of Funds. The Board considered information from New York Life Investments that Janus’ subadvisory fee reflected an arm’s-length negotiation and that this fee is paid by New York Life Investments, not the Portfolio, and the relevance of Janus’ profitability was considered by the Trustees in that context. On this basis, the Board primarily considered the costs and profitability for New York Life Investments and its affiliates with respect to the Portfolio.
In addition, the Board acknowledged the difficulty in obtaining reliable comparative data about mutual fund managers’ profitability because such information generally is not publicly available and may be impacted by numerous factors, including the structure of a fund manager’s organization, the types of funds it manages, the methodology used to allocate certain fixed costs to specific funds and the manager’s capital structure and costs of capital.
In evaluating the costs of the services provided by New York Life Investments and Janus and profits realized by New York Life Investments and its affiliates and Janus, the Board considered, among other factors,
New York Life Investments’ and its affiliates’ and Janus’ continuing investments in, or willingness to invest in, personnel and other resources to support and further enhance the management of the Portfolio, and that New York Life Investments is responsible for paying the subadvisory fee for the Portfolio. The Board also considered the financial resources of New York Life Investments and Janus and acknowledged that New York Life Investments and Janus must be in a position to recruit and retain experienced professional personnel and to maintain a strong financial position for New York Life Investments and Janus to continue to provide high-quality services to the Portfolio. The Board recognized that the Portfolio benefits from the allocation of certain fixed costs among the funds in the MainStay Group of Funds, among other expected benefits resulting from its relationship with New York Life Investments.
The Board considered information regarding New York Life Investments’ methodology for calculating profitability and allocating costs provided by New York Life Investments in connection with the fund profitability analysis presented to the Board. The Board noted it had previously engaged an independent consultant to review the methods used to allocate costs among the funds in the MainStay Group of Funds. The Board also noted that the independent consultant had concluded that New York Life Investments’ methods for allocating costs and procedures for estimating overall profitability of the relationship with the funds in the MainStay Group of Funds are reasonable and that New York Life Investments continued to use the same method of calculating profit and allocating costs since the independent consultant’s review. The Board recognized the difficulty in calculating and evaluating a manager’s profitability with respect to the Portfolio and considered that other profitability methodologies may also be reasonable.
The Board also considered certain fall-out benefits that may be realized by New York Life Investments and its affiliates due to their relationships with the Portfolio, including reputational and other indirect benefits. The Board recognized, for example, the benefits to Janus from legally permitted “soft-dollar” arrangements by which brokers provide research and other services to Janus in exchange for commissions paid by the Portfolio with respect to trades in the Portfolio’s portfolio securities. In this regard, the Board also requested and considered information from New York Life Investments concerning other material business relationships between Janus and its affiliates and New York Life Investments and its affiliates. In addition, the Board considered its review of the management agreement for a money market fund advised by New York Life Investments and an affiliated subadvisor that serves as an investment option for the Portfolio, including the potential rationale for and costs associated with investments in this money market fund by the Portfolio, if any, and considered information from New York Life Investments that the nature and type of specific investment advisory services provided to this money market fund are distinct from, or in addition to, the investment advisory services provided to the Portfolio. In addition, the Board considered the potential dividend received tax deduction for insurance company affiliates of New York Life Investments from the Portfolio’s securities lending activity.
Board Consideration and Approval of Management Agreement and Subadvisory Agreement (Unaudited) (continued)
The Board noted that the Portfolio serves as an investment option primarily under variable contracts issued by affiliates of New York Life Investments that would receive fees under those contracts. The Board observed that, in addition to fees earned by New York Life Investments under the Management Agreement for managing the Portfolio, New York Life Investments’ affiliates also earn revenues from serving the Portfolio in various other capacities, including as the Portfolio’s distributor. The Board considered information about these other revenues and their impact on the profitability of the relationship with the Portfolio to New York Life Investments and its affiliates. The Board noted that, although it assessed the overall profitability of the relationship with the Portfolio to New York Life Investments and its affiliates as part of the contract review process, when considering the reasonableness of the fee paid to New York Life Investments under the Management Agreement, the Board considered the profitability of New York Life Investments’ relationship with the Portfolio on a pre-tax basis and without regard to distribution expenses incurred by New York Life Investments from its own resources.
After evaluating the information deemed relevant by the Trustees, the Board concluded that any profits realized by New York Life Investments and its affiliates due to their relationships with the Portfolio were not excessive, other benefits that may accrue to New York Life Investments and its affiliates are reasonable and benefits that may accrue to Janus and its affiliates are consistent with those expected for a subadvisor to a mutual fund. With respect to Janus, the Board considered that any profits realized by Janus due to its relationship with the Portfolio are the result of arm’s-length negotiations between New York Life Investments and Janus, acknowledging that any such profits are based on the subadvisory fee paid to Janus by New York Life Investments, not the Portfolio.
Management and Subadvisory Fees and Total Ordinary Operating Expenses
The Board evaluated the reasonableness of the fee paid under each of the Advisory Agreements and the Portfolio’s total ordinary operating expenses. The Board primarily considered the reasonableness of the management fee paid by the Portfolio to New York Life Investments because the subadvisory fee paid to Janus is paid by New York Life Investments, not the Portfolio. The Board also considered the reasonableness of the subadvisory fee paid by New York Life Investments and the amount of the management fee retained by New York Life Investments.
In assessing the reasonableness of the Portfolio’s fees and expenses, the Board primarily considered comparative data provided by ISS on the fees and expenses charged by similar mutual funds managed by other investment advisers. The Board reviewed the methodology used by ISS to construct the group of peer funds for comparative purposes. In addition, the Board considered information provided by New York Life Investments and Janus on fees charged to other investment advisory clients, including institutional separate accounts and/or other funds that follow investment strategies similar to those of the Portfolio, if any. The Board considered the contractual management fee schedules of the Portfolio as compared to those of such other investment advisory clients, taking into account the
rationale for any differences in fee schedules. The Board also took into account information provided by New York Life Investments about the more extensive scope of services provided to registered investment companies, such as the Portfolio, as compared with other investment advisory clients. Additionally, the Board considered the impact of contractual breakpoints on the Portfolio’s net management fee and expenses. The Board also considered that in proposing fees for the Portfolio, New York Life Investments considers the competitive marketplace for mutual funds.
Based on the factors outlined above, among other considerations, the Board concluded that the Portfolio’s management fee and total ordinary operating expenses are within a range that is competitive and support a conclusion that these fees and expenses are reasonable.
Economies of Scale
The Board considered information regarding economies of scale, including whether economies of scale may exist for the Portfolio and whether the Portfolio’s expense structure permits any economies of scale to be appropriately shared with the Portfolio’s beneficial shareholders. The Board also considered a report from New York Life Investments, previously prepared at the request of the Board, that addressed economies of scale, including with respect to the mutual fund business generally, and the various ways in which the benefits of economies of scale may be shared with the funds in the MainStay Group of Funds. Although the Board recognized the difficulty of determining economies of scale with precision, the Board acknowledged that economies of scale may be shared with the Portfolio in a number of ways, including, for example, through the imposition of fee breakpoints, initially setting management fee rates at scale or making additional investments to enhance the services provided to the Portfolio. The Board reviewed information from New York Life Investments showing how the Portfolio’s management fee schedule compared to fee schedules of other funds and accounts managed by New York Life Investments. The Board also reviewed information from ISS showing how the Portfolio’s management fee schedule compared with fees paid for similar services by peer funds at varying asset levels.
Based on this information, the Board concluded that economies of scale are appropriately reflected for the benefit of the Portfolio’s beneficial shareholders through the Portfolio’s expense structure and other methods to share benefits from economies of scale.
Conclusion
On the basis of the information and factors summarized above, among other information and factors deemed relevant by the Trustees, and the evaluation thereof, the Board unanimously voted to approve the continuation of each of the Advisory Agreements.
| 42 | MainStay VP Janus Henderson Balanced Portfolio |
Proxy Voting Policies and Procedures and Proxy Voting Record
The Portfolio is required to file with the SEC its proxy voting record for the 12-month period ending June 30 on Form N-PX. A description of the policies and procedures that are used to vote proxies relating to portfolio securities of the Portfolio is available free of charge upon request by calling 800-598-2019 or visiting the SEC's website at www.sec.gov. The most recent Form N-PX or proxy voting record is available free of charge upon request by calling 800-598-2019; visiting https://www.newyorklifeinvestments.com/investment-products/vp; or visiting the SEC’s website at www.sec.gov.
Shareholder Reports and Quarterly Portfolio Disclosure
The Portfolio is required to file its complete schedule of portfolio holdings with the SEC 60 days after its first and third fiscal quarter on Form N-PORT. The Portfolio's holdings report is available free of charge upon request by calling 800-598-2019 or by visiting the SEC’s website at www.sec.gov.
Board of Trustees and Officers (Unaudited)
The Trustees and officers of the Portfolio are listed below. The Board oversees the MainStay Group of Funds (which consists of MainStay Funds and MainStay Funds Trust), MainStay VP Funds Trust, MainStay MacKay DefinedTerm Municipal Opportunities Fund, MainStay CBRE Global Infrastructure Megatrends Fund, the Manager and the Subadvisors, and elects the officers of the Portfolios who are responsible for the day-to-day operations of the Portfolio. Information pertaining to the Trustees and officers is set forth below. Each Trustee serves until his or her successor
is elected and qualified or until his or her resignation, death or removal. Under the Board’s retirement policy, unless an exception is made, a Trustee must tender his or her resignation by the end of the calendar year during which he or she reaches the age of 75. The business address of each Trustee and officer listed below is 51 Madison Avenue, New York, New York 10010. None of the Trustees are “interested persons” (as defined by the 1940 Act and rules adopted by the SEC thereunder) of the Portfolio (“Independent Trustees”).
| | Name and
Year of Birth | Term of Office,
Position(s) Held and
Length of Service | Principal Occupation(s)
During Past Five Years | Number of
Portfolios in
Fund Complex
Overseen by
Trustee | Other Directorships
Held by Trustee |
| | | | | | |
| | David H. Chow
1957 | MainStay VP Funds Trust: Trustee since January 2016, Advisory Board Member (June 2015 to December 2015) | Founder and CEO, DanCourt Management, LLC since 1999 | 78 | MainStay Funds: Trustee since January 2016, Advisory Board Member (June 2015 to December 2015) (12 Funds);
MainStay Funds Trust: Trustee since January 2016, Advisory Board Member (June 2015 to December 2015) (33 Funds);
MainStay MacKay DefinedTerm Municipal Opportunities Fund: Trustee since January 2016, Advisory Board Member (June 2015 to December 2015);
MainStay CBRE Global Infrastructure Megatrends Fund: Trustee since June 2021;VanEck Vectors Group of Exchange-Traded Funds: Independent Chairman of the Board of Trustees since 2008 and Trustee since 2006 (57 portfolios); and Berea College of Kentucky: Trustee since 2009, Chair of the Committee since 2018 |
| | Susan B. Kerley
1951 | MainStay VP Funds Trust: Chairman since 2017 and Trustee since 2007* | President, Strategic Management Advisors LLC since 1990 | 78 | MainStay Funds: Chairman since 2017 and Trustee since 2007 (12 Funds); MainStay Funds Trust: Chairman since 2017 and Trustee since 1990 (33 Funds)**;
MainStay MacKay DefinedTerm Municipal Opportunities Fund: Chairman since 2017 and Trustee since 2011; MainStay CBRE Global Infrastructure Megatrends Fund: Trustee since June 2021; and Legg Mason Partners Funds: Trustee since 1991 (45 portfolios) |
| | Alan R. Latshaw
1951 | MainStay VP Funds Trust: Trustee since 2007* | Retired; Partner, Ernst & Young LLP (2002 to 2003); Partner, Arthur Andersen LLP (1989 to 2002); Consultant to the MainStay Funds Audit and Compliance Committee (2004 to 2006) | 78 | MainStay Funds: Trustee since 2006 (12 Funds);
MainStay Funds Trust: Trustee since 2007 (33 Funds)**;
MainStay MacKay DefinedTerm Municipal Opportunities Fund: Trustee since 2011; and
MainStay CBRE Global Infrastructure Megatrends Fund: Trustee since June 2021 |
| 44 | MainStay VP Janus Henderson Balanced Portfolio |
| | Name and
Year of Birth | Term of Office,
Position(s) Held and
Length of Service | Principal Occupation(s)
During Past Five Years | Number of
Portfolios in
Fund Complex
Overseen by
Trustee | Other Directorships
Held by Trustee |
| | | | | | |
| | Karen Hammond
1956 | MainStay VP Funds Trust: Trustee since December 2021, Advisory Board Member (June 2021 to December 2021)
| Retired, Managing Director, Devonshire Investors (2007 to 2013); Senior Vice President, Fidelity Management & Research Co. (2005 to 2007); Senior Vice President and Corporate Treasurer, FMR Corp. (2003 to 2005); Chief Operating Officer, Fidelity Investments Japan (2001 to 2003) | 78 | MainStay Funds: Trustee since December 2021, Advisory Board Member (June 2021 to December 2021) (12 Funds);
MainStay Funds Trust: Trustee since December 2021, Advisory Board Member (June 2021 to December 2021) (33 Funds);
MainStay MacKay DefinedTerm Municipal Opportunities Fund: Trustee since December 2021, Advisory Board Member (June 2021 to December 2021);
MainStay CBRE Global Infrastructure Megatrends Fund: Trustee since December 2021, Advisory Board Member (June 2021 to December 2021);
Two Harbors Investment Corp.: Director since 2018; Rhode Island State Investment Commission: Member since 2017; and Blue Cross Blue Shield of Rhode Island: Director since 2019
|
| | Jacques P. Perold
1958 | MainStay VP Funds Trust: Trustee since January 2016, Advisory Board Member (June 2015 to December 2015) | Founder and Chief Executive Officer, CapShift Advisors LLC (since 2018); President, Fidelity Management & Research Company (2009 to 2014); President and Chief Investment Officer, Geode Capital Management, LLC (2001 to 2009) | 78 | MainStay Funds: Trustee since January 2016, Advisory Board Member (June 2015 to December 2015) (12 Funds);
MainStay Funds Trust: Trustee since January 2016, Advisory Board Member (June 2015 to December 2015) (33 Funds); MainStay MacKay DefinedTerm Municipal Opportunities Fund: Trustee since January 2016, Advisory Board Member (June 2015 to December 2015);
MainStay CBRE Global Infrastructure Megatrends Fund: Trustee since June 2021; Allstate Corporation: Director since 2015;
Partners in Health: Trustee since 2019; and
MSCI Inc.: Director since 2017 |
| | Richard S. Trutanic
1952 | MainStay VP Funds Trust: Trustee since 2007* | Chairman and Chief Executive Officer, Somerset & Company (financial advisory firm) since 2004; Managing Director, The Carlyle Group (private investment firm) (2002 to 2004); Senior Managing Director, Partner and Board Member, Groupe Arnault S.A. (private investment firm) (1999 to 2002)
| 78 | MainStay Funds: Trustee since 1994 (12 Funds);
MainStay Funds Trust: Trustee since 2007 (33 Funds)**;
MainStay MacKay DefinedTerm Municipal Opportunities Fund: Trustee since 2011; and
MainStay CBRE Global Infrastructure Megatrends Fund: Trustee since June 2021 |
| * | Includes prior service as a Director of MainStay VP Series Fund, Inc., the predecessor to MainStay VP Funds Trust. |
| ** | Includes prior service as a Director/Trustee of certain predecessor entities to MainStay Funds Trust. |
Board of Trustees and Officers (Unaudited) (continued)
| | Name and
Year of Birth | Position(s) Held and
Length of Service | Principal Occupation(s)
During Past Five Years | |
| | | | | |
| | Kirk C. Lehneis
1974 | President, MainStay VP Funds Trust (since 2017) | Chief Operating Officer and Senior Managing Director (since 2016), New York Life Investment Management LLC and New York Life Investment Management Holdings LLC; Member of the Board of Managers (since 2017) and Senior Managing Director (since 2018), NYLIFE Distributors LLC; Chairman of the Board and Senior Managing Director, NYLIM Service Company LLC (since 2017); Trustee, President and Principal Executive Officer of IndexIQ Trust, IndexIQ ETF Trust and IndexIQ Active ETF Trust (since January 2018); President, MainStay CBRE Global Infrastructure Megatrends Fund (since 2021), MainStay MacKay DefinedTerm Municipal Opportunities Fund, MainStay Funds and MainStay Funds Trust (since 2017); Senior Managing Director, Global Product Development (from 2015-2016); Managing Director, Product Development (from 2010-2015), New York Life Investment Management LLC | |
| | Jack R. Benintende
1964 | Treasurer and Principal Financial and Accounting Officer, MainStay VP Funds Trust (since 2007)** | Managing Director, New York Life Investment Management LLC (since 2007); Treasurer and Principal Financial and Accounting Officer, MainStay CBRE Global Infrastructure Megatrends Fund (since 2021), MainStay MacKay DefinedTerm Municipal Opportunities Fund (since 2011), MainStay Funds Trust (since 2009) and MainStay Funds (since 2007); and Assistant Treasurer, New York Life Investment Management Holdings LLC (2008 to 2012) | |
| | J. Kevin Gao
1967 | Secretary and Chief Legal Officer, MainStay VP Funds Trust (since 2010)** | Managing Director and Associate General Counsel, New York Life Investment Management LLC (since 2010); Secretary and Chief Legal Officer, MainStay CBRE Global Infrastructure Megatrends Fund (since 2021), MainStay MacKay DefinedTerm Municipal Opportunities Fund (since 2011), MainStay Funds and MainStay Funds Trust (since 2010) | |
| | Scott T. Harrington
1959 | Vice President— Administration, MainStay VP Funds Trust (since 2005)** | Managing Director, New York Life Investment Management LLC (including predecessor advisory organizations) (since 2000); Member of the Board of Directors, New York Life Trust Company (since 2009); Vice President—Administration, MainStay CBRE Global Infrastructure Megatrends Fund (since 2021), MainStay MacKay DefinedTerm Municipal Opportunities Fund (since 2011), MainStay Funds Trust and MainStay Funds (since 2009) | |
| | Kevin M. Gleason
1967 | Vice President and Chief Compliance Officer, MainStay VP Funds Trust (since June 2022) | Vice President and Chief Compliance Officer, IndexIQ, IndexIQ ETF Trust and Index IQ Active ETF Trust (since June 2022); Vice President and Chief Compliance Officer, MainStay CBRE Global Infrastructure Megatrends Fund, MainStay MacKay DefinedTerm Municipal Opportunities Fund (since June 2022); MainStay Funds Trust and MainStay Funds (since June 2022); Senior Vice President, Voya Investment Management and Chief Compliance Officer, Voya Family of Funds (2012-2022) | |
| * | The officers listed above are considered to be “interested persons” of the MainStay Group of Funds, MainStay VP Funds Trust, MainStay CBRE Global Infrastructure Megatrends Fund and MainStay MacKay DefinedTerm Municipal Opportunities Fund within the meaning of the 1940 Act because of their affiliation with the MainStay Group of Funds, New York Life Insurance Company and/or its affiliates, including New York Life Investment Management LLC, NYLIM Service Company LLC, NYLIFE Securities LLC and/or NYLIFE Distributors LLC, as described in detail in the column captioned “Principal Occupation(s) During Past Five Years.” Officers are elected annually by the Board. |
| ** | Includes prior service as an Officer of MainStay VP Series Fund, Inc., the predecessor to MainStay VP Funds Trust. |
Officers of the Trust (Who are not Trustees)*
| 46 | MainStay VP Janus Henderson Balanced Portfolio |
MainStay VP Portfolios
MainStay VP offers a wide range of Portfolios. The full array of MainStay VP offerings is listed here, with information about the manager, subadvisors, legal counsel, and independent registered public accounting firm.
Equity
MainStay VP American Century Sustainable Equity Portfolio1
MainStay VP Candriam Emerging Markets Equity Portfolio
MainStay VP Epoch U.S. Equity Yield Portfolio
MainStay VP Fidelity Institutional AM® Utilities Portfolio†
MainStay VP MacKay International Equity Portfolio
MainStay VP Natural Resources Portfolio
MainStay VP S&P 500 Index Portfolio2
MainStay VP Small Cap Growth Portfolio
MainStay VP Wellington Growth Portfolio
MainStay VP Wellington Mid Cap Portfolio
MainStay VP Wellington Small Cap Portfolio
MainStay VP Wellington U.S. Equity Portfolio
MainStay VP Winslow Large Cap Growth Portfolio
Mixed Asset
MainStay VP Balanced Portfolio
MainStay VP Income Builder Portfolio
MainStay VP Janus Henderson Balanced Portfolio
MainStay VP MacKay Convertible Portfolio
Income
MainStay VP Bond Portfolio
MainStay VP Floating Rate Portfolio
MainStay VP Indexed Bond Portfolio
MainStay VP MacKay Government Portfolio
MainStay VP MacKay High Yield Corporate Bond Portfolio
MainStay VP MacKay Strategic Bond Portfolio
MainStay VP PIMCO Real Return Portfolio
Money Market
MainStay VP U.S. Government Money Market Portfolio
Alternative
MainStay VP CBRE Global Infrastructure Portfolio
MainStay VP IQ Hedge Multi-Strategy Portfolio
Asset Allocation
MainStay VP Conservative Allocation Portfolio
MainStay VP Equity Allocation Portfolio
MainStay VP Growth Allocation Portfolio
MainStay VP Moderate Allocation Portfolio
Manager
New York Life Investment Management LLC
New York, New York
Subadvisors
American Century Investment Management, Inc.
Kansas City, Missouri
Brown Advisory LLC
Baltimore, Maryland
Candriam*
Strassen, Luxembourg
CBRE Investment Management Listed Real Assets LLC
Radnor, Pennsylvania
Epoch Investment Partners, Inc.
New York, New York
FIAM LLC
Smithfield, Rhode Island
IndexIQ Advisors LLC*
New York, New York
Janus Henderson Investors US LLC
Denver, Colorado
MacKay Shields LLC*
New York, New York
Newton Investment Management North America, LLC
Boston, Massachusetts
NYL Investors LLC*
New York, New York
Pacific Investment Management Company LLC
Newport Beach, California
Segall Bryant & Hamill, LLC
Chicago, Illinois
Wellington Management Company LLP
Boston, Massachusetts
Winslow Capital Management, LLC
Minneapolis, Minnesota
Legal Counsel
Dechert LLP
Washington, District of Columbia
Independent Registered Public Accounting Firm
PricewaterhouseCoopers LLP
New York, New York
Distributor
NYLIFE Distributors LLC*
Jersey City, New Jersey
Custodian
JPMorgan Chase Bank, N.A.
New York, New York
Some Portfolios may not be available in all products.
† Fidelity Institutional AM is a registered trade mark of FMR LLC. Used with permission.
* An affiliate of New York Life Investment Management LLC.
| 1. | Prior to May 1, 2022, the Portfolio's name was MainStay VP T. Rowe Price Equity Income Portfolio. |
| 2. | Prior to May 1, 2022, the Portfolio's name was MainStay VP MacKay S&P 500 Index Portfolio. |
Not part of the Annual Report
2022 Annual Report
This report is for the general information of New York Life Variable Annuities and NYLIAC Variable Universal Life Insurance Products policyowners. It must be preceded or accompanied by the appropriate product(s) and funds prospectuses if it is given to anyone who is not an owner of a New York Life variable annuity policy or a NYLIAC Variable Universal Life Insurance Product. This report does not offer for sale or solicit orders to purchase securities.
The performance data quoted in this report represents past performance. Past performance is no guarantee of future results. Due to market volatility and other factors, current performance may be lower or higher than the figures shown. The most recent month-end performance summary for your variable annuity or variable life policy is available by calling 800-598-2019 and is updated periodically on newyorklife.com.
The New York Life Variable Annuities and NYLIAC Variable Universal Life Insurance Products are issued by New York Life Insurance and Annuity Corporation (a Delaware Corporation) and distributed by NYLIFE Distributors LLC (Member FINRA/SIPC).
New York Life Insurance Company
New York Life Insurance and Annuity
Corporation (NYLIAC) (A Delaware Corporation)
51 Madison Avenue, Room 551
New York, NY 10010
newyorklife.com
newyorklifeinvestments.com
NYLIFE Distributors LLC, 30 Hudson Street, Jersey City, NJ 07302
New York Life Investment Management LLC is the investment manager to the MainStay VP Funds Trust
©2023 by NYLIFE Distributors LLC. All rights reserved.
You may obtain copies of the Prospectus and the Statement of Additional Information free of charge, upon request, by calling toll-free 800-598-2019 or writing to New York Life Insurance and Annuity Corporation, 51 Madison Avenue, New York, NY 10010.
| Not FDIC Insured | No Bank Guarantee | May Lose Value |
(NYLIAC) NI524
MainStay VP Floating Rate Portfolio
Message from the President and Annual Report
December 31, 2022
Sign up for e-delivery of your shareholder reports. For full details on e-delivery, including who can participate and what you can receive via e-delivery,
please log in to newyorklifeinvestments.com/accounts.
| Not FDIC/NCUA Insured | Not a Deposit | May Lose Value | No Bank Guarantee | Not Insured by Any Government Agency |
This page intentionally left blank
Message from the President
The 12-month reporting period ended December 31, 2022, proved exceptionally challenging for investors as both stock and bond markets suffered steep declines. A variety of economic and geopolitical forces drove the market’s losses, all centered around rising inflation and monetary efforts to rein it in.
Inflationary alarms began to sound well before the reporting period began. In late 2021, after nearly two years of accommodative policies designed to encourage economic growth in the face of the COVID-19 pandemic, the U.S. Federal Reserve (the “Fed”) warned of the increasing need to tighten monetary policy. Nevertheless, the pace and persistence of inflation in early 2022 caught most market participants—the Fed included—off guard. Russia’s invasion of Ukraine in February exacerbated global inflationary pressures while increasing investor uncertainty. Domestic supply shortages, international trade imbalances and rising inflation caused U.S. GDP (gross domestic product) to contract in the first and second quarters of the year, although employment and consumer spending proved resilient. Prices for petroleum surged to multi-year highs, while many key agricultural chemicals and industrial metals soared as well. Accelerating inflationary forces prompted the Fed to implement its most aggressive series of interest rate hikes since the 1980s, with a 0.25% increase in March followed by six further rate increases totaling 4.25%. International central banks generally followed suit and raised rates by varying degrees in efforts to curb local inflation, although most increases remained significantly more modest than those in the United States. Relatively high U.S. interest rates and an international risk averse sentiment pushed U.S. dollar values higher compared to most other currencies, with negative impacts on global prices for food, fuel and other key U.S.-dollar-denominated products.
The effects of these interrelated challenges were felt throughout U.S. and international financial markets. The S&P 500® Index, a widely regarded benchmark of market performance, declined by more than 18% during the reporting period. Although the energy sector generated strong gains, bolstered by elevated oil and gas prices, most other industry segments recorded losses. The more cyclical and growth-oriented sectors of consumer discretionary, information technology and real estate delivered the weakest returns, while the traditionally defensive and value-oriented
consumer staples, utilities and health care sectors outperformed. On average, international developed-country equity markets mildly outperformed their U.S. counterparts, while emerging markets lagged slightly. Fixed-income markets proved unusually volatile, with bond prices trending sharply lower as yields rose along with interest rates. Short-term yields rose faster than long-term yields, producing a yield curve inversion from July through the end of the reporting period as long-term rates remained below short-term rates. While floating-rate instruments, which feature variable interest rates that allow investors to benefit from a rising rate environment, provided a degree of insulation from inflation-driven trends, they were not immune to the market’s widespread declines.
Although, according to the most recent estimates, the annualized inflation rate in the United States has declined from a peak of 9.1% in July 2022 to 6.5% in December, the Fed remains focused on achieving more substantial and lasting reductions, aiming for a target rate of 2%. As a result, further rate hikes and additional market volatility are potential headwinds in the coming months. The question remains as to whether the Fed and other central banks will manage a so-called “soft landing,” curbing inflation while avoiding a persistent economic slowdown. If they prove successful, we believe that the increasingly attractive valuations we have observed in both equity and bond markets should eventually translate into sustainable improvements in the investment environment.
Whatever actions the Fed takes and however financial markets react, as a MainStay VP investor you can depend on us to continue managing our portfolios with the insight, expertise and level of service that have long defined New York Life Investments. Thank you for trusting us to help you meet your investment needs.
Sincerely,
Kirk C. Lehneis
President
The opinions expressed are as of the date of this report and are subject to change. There is no guarantee that any forecast made will come to pass. This material does not constitute investment advice and is not intended as an endorsement of any specific investment. Past performance is no guarantee of future results.
Not part of the Annual Report
Investors should refer to the Portfolio’s Summary Prospectus and/or Prospectus and consider the Portfolio’s investment objectives, strategies, risks, charges and expenses carefully before investing. The Summary Prospectus and/or Prospectus contain this and other information about the Portfolio. You may obtain copies of the Portfolio’s Summary Prospectus, Prospectus and Statement of Additional Information, which includes information about the MainStay VP Funds Trust's Trustees, free of charge, upon request, by calling toll-free 800-598-2019, by writing to New York Life Insurance and Annuity Corporation, 51 Madison Avenue, Room 251, New York, New York 10010 or by sending an email to MainStayShareholdersServices@nylim.com. These documents are also available at newyorklifeinvestments.com/investment-products/vp. Please read the Portfolio's Summary Prospectus and/or Prospectus carefully before investing. MainStay VP Funds Trust portfolios are separate account options which are purchased through a variable insurance or variable annuity contract.
Investment and Performance Comparison (Unaudited)
Performance data quoted represents past performance. Past performance is no guarantee of future results. Because of market volatility and other factors, current performance may be lower or higher than the figures shown. Investment return and principal value will fluctuate, and as a result, when shares are redeemed, they may be worth more or less than their original cost. The performance table and graph do not reflect any deduction of sales charges, mortality and expense charges, contract charges or administrative charges. Please refer to the Performance Summary appropriate for your policy. For performance information current to the most recent month-end, please call 800-598-2019 or visit www.newyorklife.com.
Performance figures may reflect certain fee waivers and/or expense limitations, without which total returns may have been different. For information on current fee waivers and/or expense limitations (if any), please refer to the Notes to Financial Statements.
| Average Annual Total Returns for the Year-Ended December 31, 2022 |
| Class | Inception
Date | One
Year | Five
Years | Ten
Years | Gross
Expense
Ratio1 |
| Initial Class Shares | 5/2/2005 | -1.25% | 2.61% | 3.10% | 0.64% |
| Service Class Shares | 5/2/2005 | -1.49 | 2.35 | 2.84 | 0.89 |
| 1. | The gross expense ratios presented reflect the Portfolio’s “Total Annual Portfolio Operating Expenses” from the most recent Prospectus and may differ from other expense ratios disclosed in this report. |
| Benchmark Performance* | One
Year | Five
Years | Ten
Years |
| Morningstar LSTA US Leveraged Loan Index1 | -0.60% | 3.31% | 3.67% |
| Morningstar Bank Loan Category Average2 | -2.62 | 1.91 | 2.68 |
| * | Returns for indices reflect no deductions for fees, expenses or taxes, except for foreign withholding taxes where applicable. Results assume reinvestment of all dividends and capital gains. An investment cannot be made directly in an index. |
| 1. | The Morningstar LSTA US Leveraged Loan Index is the Portfolio's benchmark. The Morningstar LSTA US Leveraged Loan Index is a broad-based index designed to reflect the performance of U.S. dollar facilities in the leveraged loan market. |
| 2. | The Morningstar Bank Loan Category Average is representative of funds that invest in floating-rate bank loans instead of bonds. In exchange for their credit risk, these loans offer high interest payments that typically float above a common short-term benchmark. Results are based on average total returns of similar funds with all dividends and capital gain distributions reinvested. |
Cost in Dollars of a $1,000 Investment in MainStay VP Floating Rate Portfolio (Unaudited)
The example below is intended to describe the fees and expenses borne by shareholders during the six-month period from July 1, 2022 to December 31, 2022, and the impact of those costs on your investment.
Example
As a shareholder of the Portfolio you incur two types of costs: (1) transaction costs, including exchange fees and sales charges (loads) on purchases (as applicable), and (2) ongoing costs, including management fees, distribution and/or service (12b-1) fees and other Portfolio expenses (as applicable). This example is intended to help you understand your ongoing costs (in dollars) of investing in the Portfolio and to compare these costs with the ongoing costs of investing in other mutual funds. The example is based on an investment of $1,000 made at the beginning of the six-month period and held for the entire period from July 1, 2022 to December 31, 2022. Shares are only sold in connection with variable life and annuity contracts and the example does not reflect any contract level or transactional fees or expenses. If these costs had been included, your costs would have been higher.
This example illustrates your Portfolio’s ongoing costs in two ways:
Actual Expenses
The second and third data columns in the table below provide information about actual account values and actual expenses. You may use the information in these columns, together with the amount you invested, to estimate the expenses that you paid during the six months ended
December 31, 2022. Simply divide your account value by $1,000 (for example, an $8,600 account value divided by $1,000 = 8.6), then multiply the result by the number under the heading entitled “Expenses Paid During Period” to estimate the expenses you paid on your account during this period.
Hypothetical Example for Comparison Purposes
The fourth and fifth data columns in the table below provide information about hypothetical account values and hypothetical expenses based on the Portfolio’s actual expense ratio and an assumed rate of return of 5% per year before expenses, which is not the Portfolio’s actual return. The hypothetical account values and expenses may not be used to estimate the actual ending account balances or expenses you paid for the six-month period shown. You may use this information to compare the ongoing costs of investing in the Portfolio with the ongoing costs of investing in other mutual funds. To do so, compare this 5% hypothetical example with the 5% hypothetical examples that appear in the shareholder reports of the other mutual funds.
Please note that the expenses shown in the table are meant to highlight your ongoing costs only and do not reflect any transactional costs, such as exchange fees or sales charges (loads). Therefore, the fourth and fifth data columns of the table are useful in comparing ongoing costs only and will not help you determine the relative total costs of owning different funds. In addition, if these transactional costs were included, your costs would have been higher.
| Share Class | Beginning
Account
Value
7/1/22 | Ending Account
Value (Based
on Actual
Returns and
Expenses)
12/31/22 | Expenses
Paid
During
Period1 | Ending Account
Value (Based
on Hypothetical
5% Annualized
Return and
Actual Expenses)
12/31/22 | Expenses
Paid
During
Period1 | Net Expense
Ratio
During
Period2 |
| Initial Class Shares | $1,000.00 | $1,041.60 | $3.24 | $1,022.03 | $3.21 | 0.63% |
| Service Class Shares | $1,000.00 | $1,040.30 | $4.53 | $1,020.77 | $4.48 | 0.88% |
| 1. | Expenses are equal to the Portfolio’s annualized expense ratio of each class multiplied by the average account value over the period, divided by 365 and multiplied by 184 (to reflect the six-month period). The table above represents the actual expenses incurred during the six-month period. In addition to the fees and expenses which the Portfolio bears directly, it also indirectly bears a pro rata share of the fees and expenses of the underlying funds in which it invests. Such indirect expenses are not included in the above-reported expense figures. |
| 2. | Expenses are equal to the Portfolio's annualized expense ratio to reflect the six-month period. |
| 6 | MainStay VP Floating Rate Portfolio |
Industry Composition as of December 31, 2022 (Unaudited)
| Electronics | 6.8% |
| Finance | 6.3 |
| Healthcare, Education & Childcare | 5.1 |
| Chemicals, Plastics & Rubber | 5.0 |
| Services: Business | 4.5 |
| Hotels, Motels, Inns & Gaming | 3.9 |
| Insurance | 3.9 |
| Software | 3.8 |
| Telecommunications | 3.6 |
| Aerospace & Defense | 3.6 |
| Containers, Packaging & Glass | 2.9 |
| Utilities | 2.6 |
| Diversified/Conglomerate Manufacturing | 2.5 |
| Broadcasting & Entertainment | 2.3 |
| Manufacturing | 2.2 |
| Buildings & Real Estate | 2.1 |
| Media | 1.9 |
| Healthcare | 1.9 |
| High Tech Industries | 1.9 |
| Diversified/Conglomerate Service | 1.8 |
| Personal, Food & Miscellaneous Services | 1.7 |
| Beverage, Food & Tobacco | 1.7 |
| Oil & Gas | 1.6 |
| Automobile | 1.5 |
| Entertainment | 1.5 |
| Leisure, Amusement, Motion Pictures & Entertainment | 1.4 |
| Retail Store | 1.3 |
| Personal & Nondurable Consumer Products | 1.3 |
| Mining, Steel, Iron & Non–Precious Metals | 1.1 |
| Banking | 1.1 |
| Healthcare & Pharmaceuticals | 1.1 |
| Commercial Services | 1.0 |
| Diversified Financial Services | 1.0 |
| Retail | 0.8 |
| Personal & Nondurable Consumer Products (Manufacturing Only) | 0.7 |
| Machinery (Non–Agriculture, Non–Construct & Non–Electronic) | 0.7 |
| Printing & Publishing | 0.7 |
| Auto Manufacturers | 0.5 |
| Personal Transportation | 0.4% |
| Cargo Transport | 0.3 |
| Water | 0.3 |
| Packaging | 0.3 |
| Hotel, Gaming & Leisure | 0.3 |
| Environmental Control | 0.3 |
| Affiliated Investment Company | 0.2 |
| Ecological | 0.2 |
| Pharmaceuticals | 0.2 |
| Consumer Durables | 0.2 |
| Chemicals | 0.2 |
| Electric | 0.2 |
| Packaging & Containers | 0.2 |
| Animal Food | 0.1 |
| Energy (Electricity) | 0.1 |
| Capital Equipment | 0.1 |
| Food | 0.1 |
| Distribution & Wholesale | 0.1 |
| Real Estate Investment Trusts | 0.1 |
| Real Estate | 0.1 |
| Airlines | 0.1 |
| Internet | 0.1 |
| Home and Office Furnishings, Housewares & Durable Consumer Products | 0.0‡ |
| Healthcare–Services | 0.0‡ |
| Lodging | 0.0‡ |
| Iron & Steel | 0.0‡ |
| Machinery–Diversified | 0.0‡ |
| Building Materials | 0.0‡ |
| Oil & Gas Services | 0.0‡ |
| Healthcare–Products | 0.0‡ |
| Health Care Equipment & Supplies | 0.0‡ |
| Machinery | 0.0‡ |
| Independent Power and Renewable Electricity Producers | 0.0‡ |
| Auto Components | 0.0‡ |
| Capital Markets | 0.0‡ |
| Short–Term Investments | 6.4 |
| Other Assets, Less Liabilities | 0.1 |
| | 100.0% |
‡ Less than one-tenth of percent.
See Portfolio of Investments beginning on page 11 for specific holdings within these categories. The Portfolio's holdings are subject to change.
Top Ten Holdings and/or Issuers Held as of December 31, 2022 (excluding short-term investments) (Unaudited)
| 1. | Gen Digital, Inc., 6.423%-6.75%, due 9/30/27–9/12/29 |
| 2. | Sunshine Luxembourg VII SARL, 8.48%, due 10/1/26 |
| 3. | UKG, Inc., 6.998%-8.998%, due 5/4/26–5/3/27 |
| 4. | Peraton Corp., 8.134%, due 2/1/28 |
| 5. | Great Outdoors Group LLC, 8.134%, due 3/6/28 |
| 6. | Bombardier Recreational Products, Inc., 6.384%-7.898%, due 5/24/27–12/13/29 |
| 7. | IRB Holding Corp., 7.00%-7.317%, due 2/5/25–12/15/27 |
| 8. | Prime Security Services Borrower LLC, 6.25%-6.505%, due 9/23/26–1/15/28 |
| 9. | MH Sub I LLC, 8.134%, due 9/13/24 |
| 10. | Asurion LLC, 7.384%-9.634%, due 11/3/24–1/20/29 |
| 8 | MainStay VP Floating Rate Portfolio |
Portfolio Management Discussion and Analysis (Unaudited)
Answers to the questions reflect the views of portfolio managers Mark A. Campellone and Arthur S. Torrey of NYL Investors LLC, the Portfolio’s Subadvisor.
How did MainStay VP Floating Rate Portfolio perform relative to its benchmark and peers during the 12 months ended December 31, 2022?
For the 12 months ended December 31, 2022, MainStay VP Floating Rate Portfolio returned −1.25% for Initial Class shares and −1.49% for Service Class shares. Over the same period, both share classes underperformed the −0.60% return of the Morningstar LSTA US Leveraged Loan Index (“the Index”), which is the Portfolio’s benchmark. For the 12 months ended December 31, 2022, both share classes outperformed the −2.62% return of the Morningstar Bank Loan Category Average.1
Were there any changes to the Portfolio during the reporting period?
Effective June 7, 2022, Robert Dial no longer served as a portfolio manager for the Portfolio. For more information on this change, please refer to the supplement dated June 7, 2022.
During the reporting period, were there any market events that materially impacted the Portfolio’s performance or liquidity?
During the reporting period, the wider market in risk assets was the result of more heightened volatility due to concerns over rising interest rates, inflation and potential recessionary impact in the United States. Geopolitical risks in central Europe also played a factor. The market for floating-rate loans was insulated from—but not immune to—these broader performance trends, as floating rate securities generally outperformed other fixed-income assets during 2022, including investment grade, high yield and long-dated U.S. Treasury securities.
What factors affected the Portfolio’s performance relative to its primary prospectus benchmark during the reporting period?
The Portfolio has historically been focused on maintaining a larger position in higher rated credit loans rated BB, and a smaller position in lower-credit-quality loans rated CCC and below.2 Despite this positioning, the Portfolio underperformed the Index due to out-of-Index positions and overweight exposure to building
& developers and utilities during the first half of the reporting period, and due to overweight positions in healthcare equipment and specialty retail, and underweight positions in diversified telecom during the second half of the reporting period.
What was the Portfolio’s duration3 strategy during the reporting period?
Floating-rate loans are, by their nature, a low-duration asset. Loans earn a stated spread4over a floating reference rate, which is tied to the London InterBank Offered Rate (“LIBOR”)5or, in some instances, the Secured Overnight Financing Rate (“SOFR”).6 Issuers can generally borrow under a 30- to 90-day range with LIBOR or SOFR. The weighted-average time to interest rate reset on the Portfolio’s assets was generally less than 40 days during the reporting period.
During the reporting period, which market segments were the strongest positive contributors to the Portfolio’s absolute performance and which market segments were particularly weak?
Effective July 1, 2022, Morningstar LCD (formerly S&P Global Leveraged Commentary & Data) revised the industry classifications of the Index. As a result, comparisons of sector attribution are no longer possible between the period before the change and the period after the change.
From the beginning of the reporting period through June 30, 2022, the strongest contributions to the Portfolio’s relative performance were underweight positions in healthcare, business services and leisure. (Contributions take weightings and total returns into account.) Detracting from performance were off-Index positions, as well as the Portfolio’s overweight positions in building & developers, and utilities.
The strongest contributions to relative performance from July 1, 2022, through the end of the reporting period were underweight positions in entertainment and healthcare providers, and overweight positions in hotels, restaurants & leisure. The most significant detractors were overweight positions in healthcare equipment and specialty retail, and underweight positions in diversified telecom.
| 1. | See page 5 for more information on benchmark and peer group returns. |
| 2. | An obligation rated ‘BB’ by Standard & Poor’s (“S&P”) is deemed by S&P to be less vulnerable to nonpayment than other speculative issues. In the opinion of S&P, however, the obligor faces major ongoing uncertainties or exposure to adverse business, financial or economic conditions which could lead to the obligor’s inadequate capacity to meet its financial commitment on the obligation. An obligation rated ‘CCC’ by S&P is deemed by S&P to be currently vulnerable to nonpayment and is dependent upon favorable business, financial and economic conditions for the obligor to meet its financial commitment on the obligation. It is the opinion of S&P that in the event of adverse business, financial or economic conditions, the obligor is not likely to have the capacity to meet its financial commitment on the obligation. When applied to Portfolio holdings, ratings are based solely on the creditworthiness of the bonds in the Portfolio and are not meant to represent the security or safety of the Portfolio. |
| 3. | Duration is a measure of the price sensitivity of a fixed-income investment to changes in interest rates. Duration is expressed as a number of years and is considered a more accurate sensitivity gauge than average maturity. |
| 4. | The terms “spread” and “yield spread” may refer to the difference in yield between a security or type of security and comparable U.S. Treasury issues. The terms may also refer to the difference in yield between two specific securities or types of securities at a given time. |
| 5. | LIBOR is a composite of interest rates at which banks borrow from one another in the London market, and it is a widely used benchmark for short-term interest rates. |
| 6. | SOFR is a secured, interbank overnight interest rate established as an alternative to LIBOR. |
Did the Portfolio make any significant purchases or sales during the reporting period?
The Portfolio’s largest purchases during the reporting period included loans issued by NortonLifeLock and McAfee, reflecting our favorable view of the relative value, business prospects and management teams of these issuers. The largest sales during the same period were loans issued by City Brewing and Weight Watchers. The Portfolio sold its full positions in Weight Watchers and City Brewing loans due to concerns about both companies’ future performance.
How did the Portfolio’s sector weightings change during the reporting period?
As noted above, on July 1, 2022, Morningstar LCD revised industry classifications. From January 1, 2022, through June 30, 2022, we increased the Portfolio’s holdings in assets that fell outside standard industry classifications and also increased the Portfolio’s exposure to healthcare and air transport. Conversely, we reduced the Portfolio’s exposure to utilities and business equipment.
How was the Portfolio positioned at the end of the reporting period?
As of December 31, 2022, we remain cautiously optimistic about the performance of the floating-rate market. We have maintained the Portfolio’s largest overweight sector positions in hotels, restaurants & leisure, containers & packaging and electrical equipment, because we expect these sectors to continue to outperform in the current environment. The Portfolio also maintains its most significantly underweight sector positions in healthcare providers, diversified telecom and capital markets. We continue to look for opportunities to add exposure in these underweight sectors, subject to our underwriting criteria.
From a ratings perspective, the Portfolio has moved to a smaller overweight position in credit rated BB, while maintaining an overweight position in credit rated B. Going forward, we may look to increase the Portfolio’s BB exposure while maintaining its overweight exposure to credit rated B.
As of the end of the reporting period, we are also looking to maintain lower cash balances, with additional purchases subject to market conditions and flows into or out of the Portfolio.
The opinions expressed are those of the portfolio managers as of the date of this report and are subject to change. There is no guarantee that any forecasts will come to pass. This material does not constitute investment advice and is not intended as an endorsement of any specific investment.
Not all MainStay VP Portfolios and/or share classes are available under all policies.
| 10 | MainStay VP Floating Rate Portfolio |
Portfolio of Investments December 31, 2022†
| | Principal
Amount | Value |
| Long-Term Bonds 93.3% |
| Asset-Backed Securities 1.0% |
| Other Asset-Backed Securities 1.0% |
| Ballyrock CLO 21 Ltd. (a)(b) | |
| Series 2022-21A, Class A2A | | |
| 7.192% (3 Month SOFR + 2.80%), due 10/20/35 | $ 900,000 | $ 889,627 |
| Series 2022-21A, Class C | | |
| 9.712% (3 Month SOFR + 5.32%), due 10/20/35 | 1,000,000 | 989,491 |
| Danby Park CLO Ltd. (a)(b) | |
| Series 2022-1A, Class B | | |
| 7.048% (3 Month SOFR + 2.95%), due 10/21/35 | 1,000,000 | 981,822 |
| Series 2022-1A, Class D | | |
| 9.428% (3 Month SOFR + 5.33%), due 10/21/35 | 1,000,000 | 982,637 |
| Neuberger Berman Loan Advisers CLO 51 Ltd. (a)(b) | |
| Series 2022-51A, Class B | | |
| 6.249% (3 Month SOFR + 3.05%), due 10/23/35 | 750,000 | 747,608 |
| Series 2022-51A, Class D | | |
| 8.899% (3 Month SOFR + 5.70%), due 10/23/35 | 750,000 | 742,919 |
| Sixth Street CLO XXI Ltd. (a)(b) | |
| Series 2022-21A, Class B | | |
| 7.036% (3 Month SOFR + 3.00%), due 10/15/35 | 1,500,000 | 1,478,760 |
| Series 2022-21A, Class D | | |
| 9.136% (3 Month SOFR + 5.10%), due 10/15/35 | 1,071,000 | 1,045,406 |
Total Asset-Backed Securities
(Cost $7,948,827) | | 7,858,270 |
| Corporate Bonds 3.2% |
| Aerospace & Defense 0.2% |
| Howmet Aerospace, Inc. | | |
| 6.875%, due 5/1/25 | 200,000 | 205,234 |
| Spirit AeroSystems, Inc. (a) | | |
| 7.50%, due 4/15/25 | 900,000 | 889,344 |
| 9.375%, due 11/30/29 | 250,000 | 263,175 |
| | | 1,357,753 |
| Airlines 0.1% |
| United Airlines, Inc. (a) | | |
| 4.375%, due 4/15/26 | 200,000 | 185,385 |
| 4.625%, due 4/15/29 | 600,000 | 522,418 |
| | | 707,803 |
| | Principal
Amount | Value |
| |
| Auto Manufacturers 0.5% |
| Ford Motor Co. | | |
| 6.10%, due 8/19/32 | $ 2,100,000 | $ 1,939,051 |
| Ford Motor Credit Co. LLC | | |
| 7.35%, due 11/4/27 | 2,000,000 | 2,049,400 |
| | | 3,988,451 |
| Building Materials 0.0% ‡ |
| Koppers, Inc. | | |
| 6.00%, due 2/15/25 (a) | 500,000 | 475,000 |
| Chemicals 0.1% |
| ASP Unifrax Holdings, Inc. | | |
| 5.25%, due 9/30/28 (a) | 330,000 | 265,540 |
| SCIL IV LLC | | |
| 5.375%, due 11/1/26 (a) | 350,000 | 296,625 |
| WR Grace Holdings LLC | | |
| 5.625%, due 8/15/29 (a) | 300,000 | 242,181 |
| | | 804,346 |
| Commercial Services 0.3% |
| Herc Holdings, Inc. | | |
| 5.50%, due 7/15/27 (a) | 850,000 | 792,838 |
| PECF USS Intermediate Holding III Corp. | | |
| 8.00%, due 11/15/29 (a) | 80,000 | 51,975 |
| Prime Security Services Borrower LLC | | |
| 6.25%, due 1/15/28 (a) | 1,000,000 | 910,160 |
| Sotheby's/Bidfair Holdings, Inc. | | |
| 5.875%, due 6/1/29 (a) | 900,000 | 755,730 |
| | | 2,510,703 |
| Distribution & Wholesale 0.1% |
| IAA, Inc. | | |
| 5.50%, due 6/15/27 (a) | 500,000 | 487,807 |
| KAR Auction Services, Inc. | | |
| 5.125%, due 6/1/25 (a) | 350,000 | 341,929 |
| | | 829,736 |
| Electric 0.2% |
| Vistra Operations Co. LLC | | |
| 5.00%, due 7/31/27 (a) | 1,500,000 | 1,392,140 |
| Entertainment 0.1% |
| Scientific Games International, Inc. | | |
| 7.00%, due 5/15/28 (a) | 900,000 | 858,519 |
| Environmental Control 0.3% |
| GFL Environmental, Inc. (a) | | |
| 3.75%, due 8/1/25 | 1,000,000 | 945,000 |
The notes to the financial statements are an integral part of, and should be read in conjunction with, the financial statements.
11
Portfolio of Investments December 31, 2022† (continued)
| | Principal
Amount | Value |
| Corporate Bonds (continued) |
| Environmental Control (continued) |
| GFL Environmental, Inc. (a) (continued) | | |
| 4.25%, due 6/1/25 | $ 500,000 | $ 477,598 |
| 4.75%, due 6/15/29 | 1,000,000 | 875,250 |
| | | 2,297,848 |
| Food 0.1% |
| Post Holdings, Inc. | | |
| 5.50%, due 12/15/29 (a) | 240,000 | 217,180 |
| U.S. Foods, Inc. | | |
| 6.25%, due 4/15/25 (a) | 500,000 | 494,766 |
| | | 711,946 |
| Healthcare-Products 0.0% ‡ |
| Medline Borrower LP | | |
| 5.25%, due 10/1/29 (a) | 200,000 | 158,854 |
| Healthcare-Services 0.0% ‡ |
| Acadia Healthcare Co., Inc. | | |
| 5.00%, due 4/15/29 (a) | 120,000 | 110,364 |
| Team Health Holdings, Inc. | | |
| 6.375%, due 2/1/25 (a) | 500,000 | 288,120 |
| | | 398,484 |
| Internet 0.1% |
| Gen Digital, Inc. | | |
| 6.75%, due 9/30/27 (a) | 560,000 | 548,800 |
| Iron & Steel 0.0% ‡ |
| Carpenter Technology Corp. | | |
| 6.375%, due 7/15/28 | 310,000 | 294,819 |
| Lodging 0.0% ‡ |
| Boyd Gaming Corp. | | |
| 4.75%, due 12/1/27 | 400,000 | 372,552 |
| Machinery-Diversified 0.0% ‡ |
| GrafTech Finance, Inc. | | |
| 4.625%, due 12/15/28 (a) | 220,000 | 180,669 |
| Media 0.1% |
| Radiate Holdco LLC | | |
| 4.50%, due 9/15/26 (a) | 370,000 | 271,839 |
| Univision Communications, Inc. | | |
| 6.625%, due 6/1/27 (a) | 600,000 | 578,886 |
| | | 850,725 |
| | Principal
Amount | Value |
| |
| Oil & Gas Services 0.0% ‡ |
| USA Compression Partners LP | | |
| 6.875%, due 4/1/26 | $ 360,000 | $ 345,344 |
| Packaging & Containers 0.2% |
| Ardagh Metal Packaging Finance USA LLC | | |
| 4.00%, due 9/1/29 (a) | 400,000 | 317,011 |
| Ardagh Packaging Finance plc | | |
| 5.25%, due 4/30/25 (a) | 1,000,000 | 951,738 |
| Clydesdale Acquisition Holdings, Inc. | | |
| 8.75%, due 4/15/30 (a) | 100,000 | 85,597 |
| | | 1,354,346 |
| Pharmaceuticals 0.1% |
| Bausch Health Cos., Inc. | | |
| 5.50%, due 11/1/25 (a) | 300,000 | 254,855 |
| Organon & Co. | | |
| 5.125%, due 4/30/31 (a) | 600,000 | 519,528 |
| | | 774,383 |
| Real Estate 0.1% |
| Realogy Group LLC | | |
| 5.75%, due 1/15/29 (a) | 1,330,000 | 1,005,999 |
| Real Estate Investment Trusts 0.1% |
| Iron Mountain, Inc. | | |
| 5.00%, due 7/15/28 (a) | 350,000 | 314,363 |
| RHP Hotel Properties LP | | |
| 4.75%, due 10/15/27 | 300,000 | 271,504 |
| | | 585,867 |
| Retail 0.2% |
| 1011778 BC ULC | | |
| 4.00%, due 10/15/30 (a) | 1,040,000 | 842,202 |
| IRB Holding Corp. | | |
| 7.00%, due 6/15/25 (a) | 580,000 | 578,550 |
| LBM Acquisition LLC | | |
| 6.25%, due 1/15/29 (a) | 1,000,000 | 636,352 |
| | | 2,057,104 |
| Software 0.1% |
| Clarivate Science Holdings Corp. (a) | | |
| 3.875%, due 7/1/28 | 300,000 | 259,919 |
| 4.875%, due 7/1/29 | 300,000 | 255,105 |
| | | 515,024 |
| Telecommunications 0.2% |
| Frontier Communications Holdings LLC | | |
| 5.875%, due 10/15/27 (a) | 280,000 | 260,000 |
The notes to the financial statements are an integral part of, and should be read in conjunction with, the financial statements.
| 12 | MainStay VP Floating Rate Portfolio |
| | Principal
Amount | Value |
| Corporate Bonds (continued) |
| Telecommunications (continued) |
| GoTo Group, Inc. | | |
| 5.50%, due 9/1/27 (a) | $ 1,100,000 | $ 591,604 |
| Lumen Technologies, Inc. | | |
| 4.50%, due 1/15/29 (a) | 670,000 | 462,442 |
| Telesat Canada | | |
| 4.875%, due 6/1/27 (a) | 600,000 | 269,469 |
| | | 1,583,515 |
Total Corporate Bonds
(Cost $30,932,462) | | 26,960,730 |
| Loan Assignments 89.1% |
| Aerospace & Defense 3.4% |
| AI Convoy (Luxembourg) SARL | |
| USD Facility Term Loan B | |
| 8.174% (6 Month LIBOR + 3.50%), due 1/18/27 (b) | 848,443 | 834,232 |
| Amentum Government Services Holdings LLC (b) | |
| First Lien Tranche Term Loan 1 8.17% - 8.384% | |
| (1 Month LIBOR + 4.00%, 3 Month LIBOR + 4.00%), due 1/29/27 | 1,100,559 | 1,073,045 |
| First Lien Tranche Term Loan 3 7.558% - 8.764% | |
| (6 Month SOFR + 4.00%), due 2/15/29 | 2,819,167 | 2,739,291 |
| Arcline FM Holdings LLC | |
| First Lien Initial Term Loan | |
| 9.48% (3 Month LIBOR + 4.75%), due 6/23/28 (b) | 2,891,964 | 2,740,136 |
| Asplundh Tree Expert LLC | |
| Amendment No. 1 Term Loan | |
| 6.134% (1 Month LIBOR + 1.75%), due 9/7/27 (b) | 2,611,150 | 2,595,919 |
| Cobham Ultra SeniorCo. SARL | |
| USD Facility Term Loan B | |
| 7.063% (6 Month LIBOR + 3.75%), due 8/3/29 (b) | 997,500 | 968,198 |
| Dynasty Acquisition Co., Inc. (b) | |
| 2020 Term Loan B1 | |
| 7.923% (1 Month LIBOR + 3.50%), due 4/6/26 | 1,505,486 | 1,431,660 |
| 2020 Term Loan B2 | |
| 7.923% (1 Month LIBOR + 3.50%), due 4/6/26 | 809,401 | 769,710 |
| Kestrel Bidco, Inc. | |
| Term Loan | |
| 7.354% (1 Month LIBOR + 3.00%), due 12/11/26 (b) | 2,199,771 | 2,007,291 |
| | Principal
Amount | Value |
| |
| Aerospace & Defense (continued) |
| Russell Investments U.S. Institutional Holdco, Inc. | |
| 2025 Term Loan | |
| 7.884% (1 Month LIBOR + 3.50%), due 5/30/25 (b) | $ 4,331,087 | $ 4,161,906 |
| SkyMiles IP Ltd. | |
| Initial Term Loan | |
| 7.993% (3 Month LIBOR + 3.75%), due 10/20/27 (b) | 2,685,714 | 2,734,114 |
| TransDigm, Inc. (b) | |
| Tranche Refinancing Term Loan E | |
| 6.98% (3 Month LIBOR + 2.25%), due 5/30/25 | 953,025 | 941,807 |
| Tranche Refinancing Term Loan F | |
| 6.98% (3 Month LIBOR + 2.25%), due 12/9/25 | 2,548,073 | 2,511,811 |
| United AirLines, Inc. | |
| Term Loan B | |
| 8.108% (3 Month LIBOR + 3.75%), due 4/21/28 (b) | 2,751,000 | 2,707,443 |
| | | 28,216,563 |
| Animal Food 0.1% |
| Alltech, Inc. | |
| Term Loan B | |
| 8.384% (1 Month LIBOR + 4.00%), due 10/13/28 (b) | 528,000 | 491,700 |
| Automobile 1.5% |
| American Auto Auction Group LLC | |
| First Lien Tranche Term Loan B | |
| 9.58% (3 Month LIBOR + 5.00%), due 12/30/27 (b) | 1,485,000 | 1,150,875 |
| Autokiniton U.S. Holdings, Inc. | |
| Closing Date Term Loan B | |
| 8.792% (1 Month LIBOR + 4.50%), due 4/6/28 (b) | 3,014,100 | 2,908,606 |
| Belron Finance 2019 LLC | |
| Dollar Second Incremental Term Loan | |
| 6.688% (3 Month LIBOR + 2.25%), due 10/30/26 (b) | 1,212,500 | 1,204,922 |
| Belron Finance U.S. LLC | |
| First Incremental Term Loan | |
| 6.938% (3 Month LIBOR + 2.25%), due 11/13/25 (b) | 960,000 | 954,000 |
| Belron Group SA | |
| Dollar Third Incremental Term Loan | |
| 7.063% (3 Month LIBOR + 2.50%), due 4/13/28 (b) | 950,569 | 941,063 |
The notes to the financial statements are an integral part of, and should be read in conjunction with, the financial statements.
13
Portfolio of Investments December 31, 2022† (continued)
| | Principal
Amount | Value |
| Loan Assignments (continued) |
| Automobile (continued) |
| Chassix, Inc. | |
| Initial Term Loan | |
| 9.813% (2 Month LIBOR + 5.50%), due 11/15/23 (b) | $ 1,915,956 | $ 1,587,849 |
| Clarios Global LP | |
| First Lien Amendment No. 1 Dollar Term Loan | |
| 7.634% (1 Month LIBOR + 3.25%), due 4/30/26 (b) | 1,275,217 | 1,247,057 |
| Wand Newco 3, Inc. | |
| First Lien Tranche Term Loan B1 | |
| 7.384% (1 Month LIBOR + 3.00%), due 2/5/26 (b) | 2,613,229 | 2,472,768 |
| | | 12,467,140 |
| Banking 1.1% |
| Apollo Commercial Real Estate Finance, Inc. (b) | |
| Initial Term Loan | |
| 7.134% (1 Month LIBOR + 2.75%), due 5/15/26 | 1,447,500 | 1,382,362 |
| Term Loan B1 | |
| 7.889% (1 Month LIBOR + 3.50%), due 3/11/28 | 736,875 | 681,609 |
| Brookfield Property REIT, Inc. | |
| Initial Term Loan B | |
| 6.923% (1 Month LIBOR + 2.50%), due 8/27/25 (b) | 1,098,540 | 1,079,469 |
| Edelman Financial Engines Center LLC (The) | |
| First Lien 2021 Initial Term Loan | |
| 7.884% (1 Month LIBOR + 3.50%), due 4/7/28 (b) | 1,636,824 | 1,528,677 |
| Greenhill & Co., Inc. | |
| New Term Loan | |
| 7.634% (1 Month LIBOR + 3.25%), due 4/12/24 (b)(c) | 556,909 | 540,898 |
| Jane Street Group LLC | |
| Dollar Term Loan | |
| 7.134% (1 Month LIBOR + 2.75%), due 1/26/28 (b) | 3,758,692 | 3,640,188 |
| | | 8,853,203 |
| Beverage, Food & Tobacco 1.7% |
| 8th Avenue Food & Provisions, Inc. | |
| First Lien Term Loan | |
| 8.134% (1 Month LIBOR + 3.75%), due 10/1/25 (b) | 2,018,182 | 1,675,091 |
| | Principal
Amount | Value |
| |
| Beverage, Food & Tobacco (continued) |
| Arctic Glacier Group Holdings, Inc. | |
| Specified Refinancing Term Loan | |
| 8.23% (3 Month LIBOR + 3.50%), due 3/20/24 (b)(c) | $ 619,218 | $ 545,299 |
| CHG PPC Parent LLC | |
| First Lien 2021-1 U.S. Term Loan | |
| 7.438% (1 Month LIBOR + 3.00%), due 12/8/28 (b) | 1,310,100 | 1,264,246 |
| Froneri International Ltd. | |
| First Lien Facility Term Loan B2 | |
| 6.634% (1 Month LIBOR + 2.25%), due 1/29/27 (b) | 1,447,875 | 1,405,098 |
| H-Food Holdings LLC | |
| Initial Term Loan | |
| 8.071% (1 Month LIBOR + 3.688%), due 5/23/25 (b) | 3,229,887 | 2,858,899 |
| Naked Juice LLC (b) | |
| First Lien Initial Term Loan | |
| 7.93% (3 Month LIBOR + 3.25%), due 1/24/29 | 1,990,000 | 1,772,877 |
| Second Lien Initial Term Loan | |
| 10.68% (3 Month LIBOR + 6.00%), due 1/24/30 | 600,000 | 471,937 |
| Pegasus BidCo BV | |
| Initial Dollar Term Loan | |
| 8.515% (3 Month LIBOR + 4.25%), due 7/12/29 (b) | 1,600,000 | 1,542,000 |
| Sotheby's | |
| 2021 Second Refinancing Term Loan | |
| 8.579% (3 Month LIBOR + 4.50%), due 1/15/27 (b) | 2,262,519 | 2,202,185 |
| United Natural Foods, Inc. | |
| Initial Term Loan | |
| 7.688% (1 Month LIBOR + 3.25%), due 10/22/25 (b) | 899,998 | 896,435 |
| | | 14,634,067 |
| Broadcasting & Entertainment 2.3% |
| Altice France SA | |
| USD Incremental Term Loan B13 | |
| 8.65% (3 Month LIBOR + 4.00%), due 8/14/26 (b) | 1,200,000 | 1,116,000 |
| Charter Communications Operating LLC | |
| Term Loan B1 | |
| 6.14% (1 Month LIBOR + 1.75%), due 4/30/25 (b) | 2,775,974 | 2,755,540 |
The notes to the financial statements are an integral part of, and should be read in conjunction with, the financial statements.
| 14 | MainStay VP Floating Rate Portfolio |
| | Principal
Amount | Value |
| Loan Assignments (continued) |
| Broadcasting & Entertainment (continued) |
| Clear Channel Outdoor Holdings, Inc. | |
| Term Loan B | |
| 7.915% (3 Month LIBOR + 3.50%), due 8/21/26 (b) | $ 1,199,503 | $ 1,086,449 |
| CMG Media Corp. | |
| First Lien 2021 Term Loan B | |
| 8.23% (3 Month LIBOR + 3.50%), due 12/17/26 (b) | 3,251,150 | 3,036,922 |
| Gray Television, Inc. (b) | |
| Term Loan C | |
| 6.869% (1 Month LIBOR + 2.50%), due 1/2/26 | 2,506,446 | 2,436,624 |
| Term Loan D | |
| 7.369% (1 Month LIBOR + 3.00%), due 12/1/28 | 1,584,000 | 1,533,935 |
| Nexstar Media, Inc. | |
| Term Loan B4 | |
| 6.884% (1 Month LIBOR + 2.50%), due 9/18/26 (b) | 1,719,214 | 1,703,634 |
| Numericable U.S. LLC (b) | |
| USD Term Loan B11 | |
| 7.165% (3 Month LIBOR + 2.75%), due 7/31/25 | 1,861,032 | 1,758,676 |
| USD Term Loan B12 | |
| 7.767% (3 Month LIBOR + 3.688%), due 1/31/26 | 949,976 | 877,541 |
| Univision Communications, Inc. (b) | |
| First Lien 2017 Replacement Repriced Term Loan | |
| 7.134% (1 Month LIBOR + 2.75%), due 3/15/24 | 681,114 | 679,979 |
| First Lien Initial Term Loan | |
| 7.634% (1 Month LIBOR + 3.25%), due 1/31/29 | 2,064,400 | 1,999,887 |
| First Lien 2022 Incremental Term Loan | |
| 8.83% (3 Month SOFR + 4.25%), due 6/24/29 | 671,625 | 662,390 |
| | | 19,647,577 |
| Buildings & Real Estate 2.1% |
| Allspring Buyer LLC | |
| Initial Term Loan | |
| 7.75% (3 Month LIBOR + 3.00%), due 11/1/28 (b) | 1,584,798 | 1,558,385 |
| Beacon Roofing Supply, Inc. | |
| 2028 Term Loan | |
| 6.634% (1 Month LIBOR + 2.25%), due 5/19/28 (b) | 1,477,500 | 1,461,802 |
| | Principal
Amount | Value |
| |
| Buildings & Real Estate (continued) |
| Core & Main LP | |
| Tranche Term Loan B 6.889% - 7.416% | |
| (1 Month LIBOR + 2.50%, 3 Month LIBOR + 2.50%), due 7/27/28 (b) | $ 2,506,163 | $ 2,468,570 |
| Cornerstone Building Brands, Inc. (b) | |
| Tranche Term Loan B | |
| 7.568% (1 Month LIBOR + 3.25%), due 4/12/28 | 2,475,814 | 2,214,306 |
| Initial Term Loan | |
| 9.961% (1 Month LIBOR + 5.625%), due 8/1/28 | 1,200,000 | 1,125,000 |
| Cushman & Wakefield U.S. Borrower LLC | |
| Replacement Term Loan | |
| 7.134% (1 Month LIBOR + 2.75%), due 8/21/25 (b) | 2,883,493 | 2,812,608 |
| SRS Distribution, Inc. (b) | |
| 2021 Refinancing Term Loan | |
| 7.884% (1 Month LIBOR + 3.50%), due 6/2/28 | 2,054,000 | 1,953,354 |
| Term Loan | |
| 7.923% (1 Month LIBOR + 3.50%), due 6/2/28 | 595,500 | 567,710 |
| VC GB Holdings I Corp. | |
| First Lien Initial Term Loan | |
| 7.884% (1 Month LIBOR + 3.50%), due 7/21/28 (b) | 495,000 | 442,777 |
| Wilsonart LLC | |
| Tranche Term Loan E | |
| 7.98% (3 Month LIBOR + 3.25%), due 12/31/26 (b) | 2,894,615 | 2,749,282 |
| | | 17,353,794 |
| Capital Equipment 0.1% |
| AZZ, Inc. | |
| Initial Term Loan | |
| 8.673% (1 Month LIBOR + 4.25%), due 5/13/29 (b) | 795,000 | 793,211 |
| Cargo Transport 0.3% |
| Genesee & Wyoming, Inc. | |
| Initial Term Loan | |
| 6.73% (3 Month LIBOR + 2.00%), due 12/30/26 (b) | 2,441,073 | 2,424,984 |
The notes to the financial statements are an integral part of, and should be read in conjunction with, the financial statements.
15
Portfolio of Investments December 31, 2022† (continued)
| | Principal
Amount | Value |
| Loan Assignments (continued) |
| Chemicals 0.1% |
| LSF11 A5 Holdco LLC | |
| Term Loan | |
| 7.938% (1 Month LIBOR + 3.50%), due 10/15/28 (b) | $ 1,323,333 | $ 1,275,363 |
| Chemicals, Plastics & Rubber 5.0% |
| Aruba Investments Holdings LLC (b) | |
| First Lien Initial Dollar Term Loan | |
| 8.139% (1 Month LIBOR + 3.75%), due 11/24/27 | 524,027 | 507,870 |
| First Lien 2022 Incremental Term Loan | |
| 9.073% (1 Month LIBOR + 4.75%), due 11/24/27 (c)(d) | 1,500,000 | 1,453,750 |
| Avient Corp. | |
| Term Loan B6 | |
| 7.344% (3 Month LIBOR + 3.25%), due 8/29/29 (b) | 1,055,686 | 1,050,935 |
| Axalta Coating Systems Dutch Holding B BV | |
| Facility Dollar Term Loan B4 | |
| 7.506% (3 Month LIBOR + 3.00%), due 12/20/29 (b) | 2,500,000 | 2,500,000 |
| Bakelite UK Intermediate Ltd. | |
| Term Loan | |
| 8.73% (3 Month LIBOR + 4.00%), due 5/29/29 (b) | 1,791,000 | 1,658,914 |
| Clydesdale Acquisition Holdings, Inc. | |
| First Lien Term Loan B | |
| 8.598% (1 Month LIBOR + 3.925%), due 4/13/29 (b) | 2,985,000 | 2,838,332 |
| Diamond (BC) BV | |
| Amendment No. 3 Refinancing Term Loan | |
| 7.165% (3 Month LIBOR + 2.75%), due 9/29/28 (b) | 1,237,500 | 1,194,806 |
| Entegris, Inc. | |
| 2022 Tranche Term Loan B 7.323% - 7.58% | |
| (1 Month LIBOR + 3.00%, 3 Month LIBOR + 3.00%), due 7/6/29 (b) | 3,400,000 | 3,385,428 |
| Herens Holdco SARL | |
| USD Facility Term Loan B | |
| 8.73% (3 Month LIBOR + 4.00%), due 7/3/28 (b) | 1,923,148 | 1,762,565 |
| INEOS Styrolution Group GmbH | |
| 2026 Tranche Dollar Term Loan B | |
| 7.134% (1 Month LIBOR + 2.75%), due 1/29/26 (b) | 1,910,900 | 1,874,115 |
| | Principal
Amount | Value |
| |
| Chemicals, Plastics & Rubber (continued) |
| Ineos U.S. Finance LLC (b) | |
| 2028 Dollar Term Loan | |
| 6.923% (1 Month LIBOR + 2.50%), due 11/8/28 | $ 463,167 | $ 445,219 |
| 2027-II Dollar Term Loan | |
| 8.173% (1 Month LIBOR + 3.75%), due 11/8/27 | 1,422,721 | 1,399,602 |
| Innophos Holdings, Inc. | |
| Initial Term Loan | |
| 7.634% (1 Month LIBOR + 3.25%), due 2/5/27 (b) | 1,458,750 | 1,424,105 |
| Jazz Pharmaceuticals plc | |
| Initial Dollar Term Loan | |
| 7.884% (1 Month LIBOR + 3.50%), due 5/5/28 (b) | 2,664,677 | 2,638,401 |
| Nouryon Finance BV | |
| Initial Dollar Term Loan | |
| 7.165% (3 Month LIBOR + 2.75%), due 10/1/25 (b) | 2,430,105 | 2,392,438 |
| Olympus Water U.S. Holding Corp. | |
| Initial Dollar Term Loan | |
| 8.50% (3 Month LIBOR + 3.75%), due 11/9/28 (b) | 1,237,500 | 1,185,250 |
| Oxea Holding Vier GmbH | |
| Tranche Term Loan B2 | |
| 7.00% (3 Month LIBOR + 3.25%), due 10/14/24 (b) | 2,200,000 | 2,072,125 |
| PMHC II, Inc. | |
| Initial Term Loan | |
| 8.494% (3 Month LIBOR + 4.25%), due 4/23/29 (b) | 2,992,500 | 2,518,844 |
| SCIH Salt Holdings, Inc. | |
| First Lien Incremental Term Loan B1 | |
| 8.415% (3 Month LIBOR + 4.00%), due 3/16/27 (b) | 2,698,022 | 2,619,612 |
| Sparta U.S. Holdco LLC | |
| First Lien Initial Term Loan | |
| 7.619% (1 Month LIBOR + 3.25%), due 8/2/28 (b) | 891,000 | 866,498 |
| Tricorbraun Holdings, Inc. | |
| First Lien Closing Date Initial Term Loan | |
| 7.634% (1 Month LIBOR + 3.25%), due 3/3/28 (b) | 2,622,083 | 2,497,534 |
| Tronox Finance LLC | |
| First Lien Refinancing Term Loan | |
| 6.634% (1 Month LIBOR + 2.25%), due 3/10/28 (b) | 969,316 | 936,803 |
The notes to the financial statements are an integral part of, and should be read in conjunction with, the financial statements.
| 16 | MainStay VP Floating Rate Portfolio |
| | Principal
Amount | Value |
| Loan Assignments (continued) |
| Chemicals, Plastics & Rubber (continued) |
| Venator Finance SARL | |
| Initial Term Loan | |
| 7.73% (3 Month LIBOR + 3.00%), due 8/8/24 (b) | $ 1,407,854 | $ 1,010,135 |
| W. R. Grace Holdings LLC | |
| Initial Term Loan | |
| 8.50% (3 Month LIBOR + 3.75%), due 9/22/28 (b) | 1,485,000 | 1,454,372 |
| | | 41,687,653 |
| Commercial Services 0.7% |
| MHI Holdings LLC | |
| Initial Term Loan | |
| 9.384% (1 Month LIBOR + 5.00%), due 9/21/26 (b) | 1,591,886 | 1,567,014 |
| Prime Security Services Borrower LLC | |
| First Lien 2021 Refinancing Term Loan B1 | |
| 6.505% (3 Month LIBOR + 2.75%), due 9/23/26 (b) | 4,101,209 | 4,058,798 |
| | | 5,625,812 |
| Consumer Durables 0.2% |
| SWF Holdings I Corp. | |
| First Lien Initial Term Loan | |
| 8.753% (3 Month LIBOR + 4.00%), due 10/6/28 (b) | 2,089,500 | 1,705,032 |
| Containers, Packaging & Glass 2.9% |
| Alliance Laundry Systems LLC | |
| Initial Term Loan B | |
| 7.409% (3 Month LIBOR + 3.50%), due 10/8/27 (b) | 1,744,714 | 1,707,639 |
| Altium Packaging LLC | |
| First Lien 2021 Term Loan | |
| 7.134% (3 Month LIBOR + 2.75%), due 2/3/28 (b) | 3,052,021 | 2,949,562 |
| Anchor Glass Container Corp. | |
| First Lien July 2017 Additional Term Loan 6.534% - 7.48% | |
| (3 Month LIBOR + 2.75%), due 12/7/23 (b) | 2,061,500 | 1,488,003 |
| Berlin Packaging LLC (b) | |
| Tranche Initial Term Loan B4 7.62% - 7.98% | |
| (1 Month LIBOR + 3.25%, 3 Month LIBOR + 3.25%), due 3/11/28 | 1,965,005 | 1,865,526 |
| | Principal
Amount | Value |
| |
| Containers, Packaging & Glass (continued) |
| Berlin Packaging LLC (b) (continued) | |
| Tranche Term Loan B5 8.12% - 8.48% | |
| (1 Month LIBOR + 3.75%, 3 Month LIBOR + 3.75%), due 3/11/28 | $ 1,066,500 | $ 1,023,840 |
| Berry Global, Inc. | |
| Term Loan Z | |
| 6.024% (1 Month LIBOR + 1.75%), due 7/1/26 (b) | 1,936,339 | 1,919,396 |
| Charter Next Generation, Inc. | |
| First Lien 2021 Initial Term Loan | |
| 8.134% (1 Month LIBOR + 3.75%), due 12/1/27 (b) | 838,947 | 813,123 |
| Graham Packaging Co., Inc. | |
| 2021 Initial Term Loan | |
| 7.384% (1 Month LIBOR + 3.00%), due 8/4/27 (b) | 3,240,335 | 3,177,959 |
| Mauser Packaging Solutions Holding Co. | |
| Initial Term Loan 7.37% - 7.619% | |
| (1 Month LIBOR + 3.25%), due 4/3/24 (b) | 2,820,691 | 2,749,166 |
| Pactiv Evergreen, Inc. (b) | |
| Tranche U.S. Term Loan B2 7.321% - 7.634% | |
| (1 Month LIBOR + 3.25%), due 2/5/26 | 1,103,728 | 1,089,656 |
| Tranche U.S. Term Loan B3 | |
| 7.634% (1 Month LIBOR + 3.25%), due 9/24/28 | 493,750 | 486,961 |
| Pretium PKG Holdings, Inc. (b) | |
| First Lien Initial Term Loan 7.741% - 8.735% | |
| (3 Month LIBOR + 4.00%), due 10/2/28 | 1,702,800 | 1,347,645 |
| Second Lien Initial Term Loan 10.493% - 11.485% | |
| (3 Month LIBOR + 6.75%), due 10/1/29 | 750,000 | 452,344 |
| Reynolds Consumer Products LLC | |
| Initial Term Loan | |
| 6.134% (1 Month LIBOR + 1.75%), due 2/4/27 (b) | 1,276,932 | 1,265,049 |
| RLG Holdings LLC | |
| First Lien Closing Date Initial Term Loan | |
| 8.384% (1 Month LIBOR + 4.00%), due 7/7/28 (b) | 792,000 | 743,820 |
| Trident TPI Holdings, Inc. (b) | |
| Tranche Delayed Draw Term Loan B3 7.674% - 8.071% | |
| (1 Month LIBOR + 4.00%, 3 Month LIBOR + 4.00%), due 9/15/28 (c) | 63,522 | 60,891 |
The notes to the financial statements are an integral part of, and should be read in conjunction with, the financial statements.
17
Portfolio of Investments December 31, 2022† (continued)
| | Principal
Amount | Value |
| Loan Assignments (continued) |
| Containers, Packaging & Glass (continued) |
| Trident TPI Holdings, Inc. (b) (continued) | |
| Tranche Initial Term Loan B3 | |
| 7.674% (3 Month LIBOR + 4.00%), due 9/15/28 | $ 445,895 | $ 427,422 |
| Tranche Term Loan B1 | |
| 7.98% (3 Month LIBOR + 3.25%), due 10/17/24 | 709,333 | 699,801 |
| Tranche Initial Term Loan B4 | |
| 9.83% (3 Month LIBOR + 5.25%), due 9/15/28 | 400,000 | 384,333 |
| | | 24,652,136 |
| Diversified/Conglomerate Manufacturing 2.5% |
| Allied Universal Holdco LLC | |
| Initial U.S. Dollar Term Loan | |
| 8.173% (1 Month LIBOR + 3.75%), due 5/12/28 (b) | 4,261,848 | 4,037,568 |
| EWT Holdings III Corp. | |
| Initial Term Loan | |
| 6.688% (1 Month LIBOR + 2.25%), due 4/1/28 (b) | 1,723,750 | 1,695,739 |
| Filtration Group Corp. (b) | |
| Initial Dollar Term Loan | |
| 7.384% (1 Month LIBOR + 3.00%), due 3/31/25 | 1,739,065 | 1,718,143 |
| 2021 Incremental Term Loan | |
| 7.884% (1 Month LIBOR + 3.50%), due 10/21/28 | 790,000 | 774,341 |
| Gardner Denver, Inc. | |
| 2020 GDI Tranche Dollar Term Loan B2 | |
| 6.173% (1 Month LIBOR + 1.75%), due 3/1/27 (b) | 1,958,369 | 1,938,086 |
| GYP Holdings III Corp. | |
| First Lien 2021 Incremental Term Loan | |
| 6.938% (1 Month LIBOR + 2.50%), due 6/1/25 (b) | 1,374,019 | 1,371,157 |
| Ingersoll-Rand Services Co. | |
| 2020 Spinco Tranche Dollar Term Loan B1 | |
| 6.173% (1 Month LIBOR + 1.75%), due 3/1/27 (b) | 849,060 | 840,267 |
| Iron Mountain Information Management LLC | |
| Incremental Term Loan B | |
| 6.134% (1 Month LIBOR + 1.75%), due 1/2/26 (b) | 1,785,938 | 1,756,171 |
| | Principal
Amount | Value |
| |
| Diversified/Conglomerate Manufacturing (continued) |
| LTI Holdings, Inc. (b) | |
| First Lien Initial Term Loan | |
| 7.884% (1 Month LIBOR + 3.50%), due 9/6/25 | $ 1,052,001 | $ 1,004,990 |
| First Lien First Amendment Additional Term Loan | |
| 9.134% (1 Month LIBOR + 4.75%), due 7/24/26 | 993,682 | 944,826 |
| QUIKRETE Holdings, Inc. (b) | |
| First Lien Initial Term Loan | |
| 7.009% (1 Month LIBOR + 2.625%), due 2/1/27 | 2,266,689 | 2,239,615 |
| First Lien Fourth Amendment Term Loan B1 | |
| 7.384% (1 Month LIBOR + 3.00%), due 6/11/28 | 1,488,750 | 1,475,103 |
| Red Ventures LLC | |
| First Lien Term Loan B2 | |
| 6.884% (1 Month LIBOR + 2.50%), due 11/8/24 (b) | 536,218 | 532,196 |
| WP CPP Holdings LLC | |
| First Lien Initial Term Loan | |
| 8.17% (3 Month LIBOR + 3.75%), due 4/30/25 (b) | 980,444 | 851,585 |
| | | 21,179,787 |
| Diversified/Conglomerate Service 1.8% |
| Applied Systems, Inc. (b) | |
| First Lien 2026 Term Loan | |
| 9.08% (3 Month LIBOR + 4.50%), due 9/18/26 | 2,536,196 | 2,524,307 |
| Second Lien 2021 Term Loan | |
| 11.33% (1 Month LIBOR + 6.75%), due 9/17/27 | 445,140 | 441,245 |
| Blackhawk Network Holdings, Inc. | |
| First Lien Term Loan | |
| 7.077% (3 Month LIBOR + 3.00%), due 6/15/25 (b) | 1,937,005 | 1,882,930 |
| Brightview Landscapes LLC | |
| 2022 Initial Term Loan | |
| 7.573% (1 Month LIBOR + 3.25%), due 4/20/29 (b) | 1,078,032 | 1,036,258 |
| Element Materials Technology Group U.S. Holdings, Inc. (b) | |
| Initial USD Term Loan B | |
| 8.93% (3 Month LIBOR + 4.25%), due 6/22/29 | 478,947 | 462,184 |
| First Lien Delayed Draw Term Loan B | |
| 8.93% (3 Month LIBOR + 4.25%), due 6/22/29 | 221,053 | 213,316 |
The notes to the financial statements are an integral part of, and should be read in conjunction with, the financial statements.
| 18 | MainStay VP Floating Rate Portfolio |
| | Principal
Amount | Value |
| Loan Assignments (continued) |
| Diversified/Conglomerate Service (continued) |
| Genesys Cloud Services Holdings I LLC | |
| 2020 Initial Dollar Term Loan | |
| 8.384% (1 Month LIBOR + 4.00%), due 12/1/27 (b) | $ 1,411,740 | $ 1,352,447 |
| MKS Instruments, Inc. | |
| Initial Dollar Term Loan B | |
| 7.171% (1 Month LIBOR + 2.75%), due 8/17/29 (b) | 3,341,625 | 3,295,079 |
| TruGreen LP | |
| First Lien Second Refinancing Term Loan | |
| 8.384% (1 Month LIBOR + 4.00%), due 11/2/27 (b) | 2,678,663 | 2,357,223 |
| Verint Systems, Inc. | |
| Refinancing Term Loan | |
| 6.369% (1 Month LIBOR + 2.00%), due 6/28/24 (b) | 588,235 | 583,088 |
| Verscend Holding Corp. | |
| Term Loan B1 | |
| 8.384% (1 Month LIBOR + 4.00%), due 8/27/25 (b) | 1,041,244 | 1,033,435 |
| | | 15,181,512 |
| Ecological 0.2% |
| GFL Environmental, Inc. | |
| 2020 Refinancing Term Loan | |
| 7.415% (3 Month LIBOR + 3.00%), due 5/30/25 (b) | 2,011,118 | 2,009,861 |
| Electronics 6.8% |
| Camelot U.S. Acquisition 1 Co. (b) | |
| Initial Term Loan | |
| 7.384% (1 Month LIBOR + 3.00%), due 10/30/26 | 1,642,753 | 1,619,138 |
| Amendment No. 2 Incremental Term Loan | |
| 7.384% (1 Month LIBOR + 3.00%), due 10/30/26 | 1,096,406 | 1,078,590 |
| Castle U.S. Holding Corp. (b) | |
| Initial Dollar Term Loan | |
| 8.134% (1 Month LIBOR + 3.75%), due 1/29/27 | 1,410,951 | 863,032 |
| Dollar Term Loan B2 | |
| 8.384% (1 Month LIBOR + 4.00%), due 1/29/27 | 2,463,542 | 1,506,867 |
| Commscope, Inc. | |
| Initial Term Loan | |
| 7.634% (1 Month LIBOR + 3.25%), due 4/6/26 (b) | 4,171,131 | 3,922,165 |
| | Principal
Amount | Value |
| |
| Electronics (continued) |
| CoreLogic, Inc. | |
| First Lien Initial Term Loan | |
| 7.938% (1 Month LIBOR + 3.50%), due 6/2/28 (b) | $ 4,443,750 | $ 3,693,867 |
| DCert Buyer, Inc. | |
| First Lien Initial Term Loan | |
| 8.696% (6 Month LIBOR + 4.00%), due 10/16/26 (b) | 2,434,924 | 2,346,658 |
| Diebold Nixdorf, Inc. | |
| New Dollar Term Loan B | |
| 7.00% (1 Month LIBOR + 2.75%), due 11/6/23 (b) | 628,223 | 438,500 |
| ECi Macola/MAX Holding LLC | |
| First Lien Initial Term Loan | |
| 8.48% (3 Month LIBOR + 3.75%), due 11/9/27 (b) | 1,960,000 | 1,875,067 |
| Epicor Software Corp. | |
| Term Loan C | |
| 7.634% (1 Month LIBOR + 3.25%), due 7/30/27 (b) | 3,032,402 | 2,910,563 |
| Flexera Software LLC | |
| First Lien Term Loan B1 | |
| 8.14% (1 Month LIBOR + 3.75%), due 3/3/28 (b) | 2,356,569 | 2,250,523 |
| Gainwell Acquisition Corp. | |
| First Lien Term Loan B | |
| 8.73% (3 Month LIBOR + 4.00%), due 10/1/27 (b) | 515,789 | 486,776 |
| Generation Bridge LLC (b) | |
| Term Loan B | |
| 9.73% (3 Month LIBOR + 5.00%), due 12/1/28 | 1,393,469 | 1,381,625 |
| Term Loan C | |
| 9.73% (3 Month LIBOR + 5.00%), due 12/1/28 (c) | 30,612 | 30,352 |
| Go Daddy Operating Co. LLC | |
| Amendment No. 6 Term Loan | |
| 7.573% (1 Month LIBOR + 3.25%), due 11/9/29 (b) | 1,161,690 | 1,158,786 |
| Helios Software Holdings, Inc. | |
| 2021 Initial Dollar Term Loan | |
| 8.173% (1 Month LIBOR + 3.75%), due 3/11/28 (b) | 497,143 | 487,200 |
| Hyland Software, Inc. (b) | |
| First Lien 2018 Refinancing Term Loan | |
| 7.884% (1 Month LIBOR + 3.50%), due 7/1/24 | 3,517,809 | 3,463,786 |
The notes to the financial statements are an integral part of, and should be read in conjunction with, the financial statements.
19
Portfolio of Investments December 31, 2022† (continued)
| | Principal
Amount | Value |
| Loan Assignments (continued) |
| Electronics (continued) |
| Hyland Software, Inc. (b) (continued) | |
| Second Lien 2021 Refinancing Term Loan | |
| 10.634% (1 Month LIBOR + 6.25%), due 7/7/25 | $ 535,333 | $ 505,087 |
| ION Trading Finance Ltd. | |
| 2021 Initial Dollar Term Loan | |
| 9.48% (3 Month LIBOR + 4.75%), due 4/1/28 (b) | 985,000 | 931,528 |
| MA FinanceCo. LLC | |
| Tranche Term Loan B4 | |
| 8.973% (3 Month LIBOR + 4.25%), due 6/5/25 (b)(c)(d) | 480,609 | 479,407 |
| MH Sub I LLC (b) | |
| First Lien Amendment No. 2 Initial Term Loan | |
| 8.134% (1 Month LIBOR + 3.75%), due 9/13/24 | 2,977,309 | 2,886,501 |
| First Lien 2020 June New Term Loan | |
| 8.134% (1 Month LIBOR + 3.75%), due 9/13/24 | 2,060,044 | 1,997,507 |
| Misys Ltd. | |
| First Lien Dollar Term Loan | |
| 6.871% (3 Month LIBOR + 3.50%), due 6/13/24 (b) | 2,629,092 | 2,320,721 |
| Project Alpha Intermediate Holding, Inc. | |
| 2021 Refinancing Term Loan | |
| 8.39% (1 Month LIBOR + 4.00%), due 4/26/24 (b) | 1,985,606 | 1,933,484 |
| Proofpoint, Inc. | |
| First Lien Initial Term Loan | |
| 7.985% (3 Month LIBOR + 3.25%), due 8/31/28 (b) | 2,481,250 | 2,379,673 |
| Rocket Software, Inc. (b) | |
| First Lien Initial Term Loan | |
| 8.634% (1 Month LIBOR + 4.25%), due 11/28/25 | 866,250 | 831,239 |
| First Lien 2021 Dollar Term Loan | |
| 8.634% (1 Month LIBOR + 4.25%), due 11/28/25 | 1,477,500 | 1,419,455 |
| Seattle SpinCo, Inc. | |
| Initial Term Loan | |
| 7.134% (1 Month LIBOR + 2.75%), due 6/21/24 (b) | 947,620 | 940,512 |
| Sharp Midco LLC | |
| First Lien Initial Term Loan | |
| 8.73% (3 Month LIBOR + 4.00%), due 12/31/28 (b) | 1,786,500 | 1,688,243 |
| | Principal
Amount | Value |
| |
| Electronics (continued) |
| SS&C Technologies Holdings, Inc. (b) | |
| Term Loan B3 | |
| 6.134% (1 Month LIBOR + 1.75%), due 4/16/25 | $ 609,566 | $ 598,137 |
| Term Loan B4 | |
| 6.134% (1 Month LIBOR + 1.75%), due 4/16/25 | 495,562 | 486,270 |
| Term Loan B5 | |
| 6.134% (1 Month LIBOR + 1.75%), due 4/16/25 | 1,832,607 | 1,800,536 |
| Surf Holdings SARL | |
| First Lien Dollar Tranche Term Loan | |
| 8.235% (3 Month LIBOR + 3.50%), due 3/5/27 (b) | 2,005,370 | 1,941,628 |
| ThoughtWorks, Inc. | |
| Incremental Term Loan | |
| 6.884% (1 Month LIBOR + 2.50%), due 3/24/28 (b) | 337,752 | 333,952 |
| Vertiv Group Corp. | |
| Term Loan B | |
| 7.119% (1 Month LIBOR + 2.75%), due 3/2/27 (b) | 1,950,263 | 1,878,103 |
| VS Buyer LLC | |
| Initial Term Loan | |
| 7.384% (1 Month LIBOR + 3.00%), due 2/28/27 (b) | 972,500 | 943,325 |
| WEX, Inc. | |
| Term Loan B | |
| 6.634% (1 Month LIBOR + 2.25%), due 3/31/28 (b) | 982,500 | 975,592 |
| | | 56,784,395 |
| Energy (Electricity) 0.1% |
| Covanta Holding Corp. (b) | |
| Initial Term Loan B | |
| 6.823% (1 Month LIBOR + 2.50%), due 11/30/28 | 554,002 | 549,269 |
| Initial Term Loan C | |
| 6.823% (1 Month LIBOR + 2.50%), due 11/30/28 | 41,812 | 41,455 |
| | | 590,724 |
| Entertainment 1.4% |
| Alterra Mountain Co. | |
| Term Loan B2 | |
| 7.884% (1 Month LIBOR + 3.50%), due 8/17/28 (b) | 3,364,122 | 3,315,342 |
The notes to the financial statements are an integral part of, and should be read in conjunction with, the financial statements.
| 20 | MainStay VP Floating Rate Portfolio |
| | Principal
Amount | Value |
| Loan Assignments (continued) |
| Entertainment (continued) |
| Fertitta Entertainment LLC | |
| Initial Term Loan B | |
| 8.323% (1 Month LIBOR + 4.00%), due 1/27/29 (b) | $ 4,223,100 | $ 4,004,318 |
| Formula One Management Ltd. | |
| First Lien Facility Term Loan B | |
| 7.573% (1 Month LIBOR + 3.25%), due 1/15/30 (b) | 861,538 | 860,641 |
| J&J Ventures Gaming LLC | |
| Initial Term Loan | |
| 8.73% (3 Month LIBOR + 4.00%), due 4/26/28 (b) | 3,950,000 | 3,772,250 |
| | | 11,952,551 |
| Finance 6.3% |
| AAdvantage Loyality IP Ltd. | |
| Initial Term Loan | |
| 8.993% (3 Month LIBOR + 4.75%), due 4/20/28 (b) | 3,400,000 | 3,380,025 |
| Acuity Specialty Products, Inc. | |
| First Lien Initial Term Loan | |
| 8.58% (3 Month LIBOR + 4.00%), due 8/12/24 (b)(c) | 290,058 | 249,450 |
| Acuris Finance U.S., Inc. | |
| Initial Dollar Term Loan | |
| 8.73% (3 Month LIBOR + 4.00%), due 2/16/28 (b) | 2,269,531 | 2,224,141 |
| ADMI Corp. (b) | |
| Amendment No.4 Refinancing Term Loan | |
| 7.759% (1 Month LIBOR + 3.375%), due 12/23/27 | 1,473,750 | 1,334,481 |
| Amendment No. 5 Incremental Term Loan | |
| 8.134% (1 Month LIBOR + 3.75%), due 12/23/27 | 740,625 | 673,228 |
| Ahlstrom-Munksjo Holding 3 Oy | |
| USD Facility Term Loan B | |
| 8.48% (3 Month LIBOR + 3.75%), due 2/4/28 (b) | 786,105 | 746,799 |
| AlixPartners LLP | |
| Initial Dollar Term Loan | |
| 7.134% (1 Month LIBOR + 2.75%), due 2/4/28 (b) | 1,473,750 | 1,457,434 |
| Blackstone Mortgage Trust, Inc. | |
| Term Loan B4 | |
| 7.823% (1 Month LIBOR + 3.50%), due 5/9/29 (b) | 1,194,000 | 1,164,150 |
| | Principal
Amount | Value |
| |
| Finance (continued) |
| Blue Tree Holdings, Inc. | |
| Term Loan | |
| 7.23% (3 Month LIBOR + 2.50%), due 3/4/28 (b) | $ 491,250 | $ 475,898 |
| Boxer Parent Co., Inc. | |
| 2021 Replacement Dollar Term Loan | |
| 8.134% (1 Month LIBOR + 3.75%), due 10/2/25 (b) | 2,240,307 | 2,139,493 |
| Brand Industrial Services, Inc. | |
| Initial Term Loan 7.924% - 8.608% | |
| (3 Month LIBOR + 4.25%), due 6/21/24 (b) | 1,635,608 | 1,475,727 |
| Colouroz Investment 1 GmbH | |
| First Lien Initial Term Loan C | |
| 8.575% (0.75% PIK) (3 Month LIBOR + 4.25%), due 9/21/23 (b)(c)(e) | 197,370 | 142,764 |
| Colouroz Investment 2 LLC | |
| First Lien Initial Term Loan B2 8.266% - 8.575% | |
| (0.75% PIK) (2 Month LIBOR + 4.25%, 3 Month LIBOR + 4.25%), due 9/21/23 (b)(c)(e) | 1,197,126 | 865,917 |
| Covia Holdings LLC | |
| Initial Term Loan | |
| 7.748% (3 Month LIBOR + 4.00%), due 7/31/26 (b) | 709,736 | 684,389 |
| CPC Acquisition Corp. | |
| First Lien Initial Term Loan | |
| 8.48% (3 Month LIBOR + 3.75%), due 12/29/27 (b) | 1,965,000 | 1,414,800 |
| Deerfield Dakota Holding LLC | |
| First Lien Initial Dollar Term Loan | |
| 8.073% (1 Month LIBOR + 3.75%), due 4/9/27 (b) | 975,000 | 907,969 |
| Endurance International Group Holdings, Inc. | |
| Initial Term Loan | |
| 7.717% (1 Month LIBOR + 3.50%), due 2/10/28 (b) | 3,845,987 | 3,446,966 |
| LBM Acquisition LLC | |
| First Lien Initial Term Loan | |
| 7.121% (3 Month LIBOR + 3.75%), due 12/17/27 (b) | 840,989 | 725,937 |
| LSF11 Skyscraper Holdco SARL | |
| USD Facility Term Loan B3 | |
| 8.23% (3 Month LIBOR + 3.50%), due 9/29/27 (b) | 786,105 | 762,521 |
The notes to the financial statements are an integral part of, and should be read in conjunction with, the financial statements.
21
Portfolio of Investments December 31, 2022† (continued)
| | Principal
Amount | Value |
| Loan Assignments (continued) |
| Finance (continued) |
| Minimax Viking GmbH | |
| Facility Term Loan B1C | |
| 6.884% (1 Month LIBOR + 2.50%), due 7/31/25 (b) | $ 2,150,133 | $ 2,138,038 |
| ON Semiconductor Corp. | |
| 2019 New Replacement Term Loan B4 | |
| 6.423% (1 Month LIBOR + 2.00%), due 9/19/26 (b) | 328,756 | 328,228 |
| Onex TSG Intermediate Corp. | |
| Initial Term Loan | |
| 9.165% (3 Month LIBOR + 4.75%), due 2/28/28 (b) | 985,000 | 876,867 |
| Park River Holdings, Inc. | |
| First Lien Initial Term Loan | |
| 8.004% (3 Month LIBOR + 3.25%), due 12/28/27 (b) | 1,313,323 | 1,144,642 |
| Peraton Corp. | |
| First Lien Term Loan B | |
| 8.134% (1 Month LIBOR + 3.75%), due 2/1/28 (b) | 5,401,830 | 5,267,751 |
| Pluto Acquisition I, Inc. | |
| First Lien 2021 Term Loan | |
| 8.735% (3 Month LIBOR + 4.00%), due 6/22/26 (b) | 2,068,500 | 1,385,895 |
| PODS LLC | |
| Initial Term Loan | |
| 7.384% (1 Month LIBOR + 3.00%), due 3/31/28 (b) | 2,947,687 | 2,788,512 |
| Potters Industries LLC | |
| Initial Term Loan | |
| 8.73% (3 Month LIBOR + 4.00%), due 12/14/27 (b) | 786,000 | 763,730 |
| RealPage, Inc. | |
| First Lien Initial Term Loan | |
| 7.384% (1 Month LIBOR + 3.00%), due 4/24/28 (b) | 2,354,048 | 2,235,463 |
| RealTruck Group, Inc. | |
| Initial Term Loan | |
| 8.134% (1 Month LIBOR + 3.75%), due 1/31/28 (b) | 1,061,100 | 905,724 |
| Triton Water Holdings, Inc. | |
| First Lien Initial Term Loan | |
| 8.23% (3 Month LIBOR + 3.50%), due 3/31/28 (b) | 3,186,467 | 2,951,465 |
| | Principal
Amount | Value |
| |
| Finance (continued) |
| WCG Purchaser Corp. | |
| First Lien Initial Term Loan | |
| 8.384% (1 Month LIBOR + 4.00%), due 1/8/27 (b) | $ 2,238,068 | $ 2,036,642 |
| WildBrain Ltd. | |
| Initial Term Loan | |
| 8.688% (1 Month LIBOR + 4.25%), due 3/24/28 (b) | 3,581,212 | 3,258,903 |
| WIN Waste Innovations Holdings, Inc. | |
| Initial Term Loan | |
| 7.48% (3 Month LIBOR + 2.75%), due 3/24/28 (b) | 2,206,400 | 2,101,596 |
| | | 52,455,545 |
| Healthcare 1.9% |
| AHP Health Partners, Inc. | |
| Initial Term Loan | |
| 7.884% (1 Month LIBOR + 3.50%), due 8/24/28 (b) | 846,428 | 827,384 |
| Chariot Buyer LLC | |
| First Lien Initial Term Loan | |
| 7.634% (1 Month LIBOR + 3.25%), due 11/3/28 (b) | 4,752,000 | 4,479,748 |
| CHG Healthcare Services, Inc. | |
| First Lien Initial Term Loan | |
| 7.634% (1 Month LIBOR + 3.25%), due 9/29/28 (b) | 1,283,750 | 1,253,975 |
| ICU Medical, Inc. | |
| Tranche Term Loan B 6.405% - 7.23% | |
| (1 Month LIBOR + 2.25%, 3 Month LIBOR + 2.50%), due 1/8/29 (b) | 595,500 | 574,657 |
| LSCS Holdings, Inc. | |
| First Lien Initial Term Loan | |
| 8.884% (1 Month LIBOR + 4.50%), due 12/16/28 (b) | 693,000 | 658,350 |
| Medical Solutions Holdings, Inc. | |
| First Lien Initial Term Loan | |
| 7.884% (1 Month LIBOR + 3.50%), due 11/1/28 (b) | 510,820 | 477,617 |
| Medline Borrower LP | |
| Initial Dollar Term Loan | |
| 7.634% (1 Month LIBOR + 3.25%), due 10/23/28 (b) | 2,084,250 | 1,976,911 |
| U.S. Anesthesia Partners, Inc. | |
| First Lien Initial Term Loan | |
| 8.37% (1 Month LIBOR + 4.25%), due 10/1/28 (b) | 3,456,250 | 3,276,418 |
The notes to the financial statements are an integral part of, and should be read in conjunction with, the financial statements.
| 22 | MainStay VP Floating Rate Portfolio |
| | Principal
Amount | Value |
| Loan Assignments (continued) |
| Healthcare (continued) |
| WP CityMD Bidco LLC | |
| Second Amendment Refinancing Term Loan | |
| 7.634% (1 Month LIBOR + 3.25%), due 12/22/28 (b) | $ 2,150,417 | $ 2,145,041 |
| | | 15,670,101 |
| Healthcare & Pharmaceuticals 1.1% |
| Bausch & Lomb Corp. | |
| Initial Term Loan | |
| 7.842% (3 Month LIBOR + 3.25%), due 5/10/27 (b) | 1,990,000 | 1,884,695 |
| Bausch Health Cos., Inc. | |
| Second Amendment Term Loan | |
| 9.667% (1 Month LIBOR + 5.25%), due 2/1/27 (b) | 1,462,500 | 1,120,641 |
| Embecta Corp. | |
| First Lien Initial Term Loan | |
| 7.791% (6 Month LIBOR + 3.00%), due 3/30/29 (b) | 614,919 | 584,941 |
| Envision Healthcare Corp. (b) | |
| Third Out Term Loan | |
| 8.33% (3 Month LIBOR + 3.75%), due 3/31/27 | 502,860 | 100,572 |
| Second Out Term Loan | |
| 8.83% (3 Month LIBOR + 4.25%), due 3/31/27 | 1,069,305 | 331,485 |
| First Out Term Loan | |
| 12.605% (3 Month LIBOR + 7.875%), due 3/31/27 | 181,102 | 159,370 |
| Owens & Minor, Inc. | |
| Term Loan B1 7.831% - 8.173% | |
| (1 Month LIBOR + 3.75%, 6 Month LIBOR + 3.75%), due 3/29/29 (b) | 992,500 | 991,259 |
| Pediatric Associates Holding Co. LLC (b) | |
| Amendment No. 1 Incremental Term Loan | |
| 7.634% (1 Month LIBOR + 3.25%), due 12/29/28 | 1,379,053 | 1,304,928 |
| Amendment No. 1 Incremental Delayed Draw Term Loan | |
| 7.634% (1 Month LIBOR + 3.25%), due 12/29/28 (c) | 104,211 | 98,610 |
| Physician Partners LLC | |
| Initial Term Loan | |
| 8.423% (1 Month LIBOR + 4.00%), due 12/23/28 (b) | 1,116,563 | 1,062,596 |
| | Principal
Amount | Value |
| |
| Healthcare & Pharmaceuticals (continued) |
| Team Health Holdings, Inc. | |
| Extended Term Loan | |
| 9.573% (1 Month SOFR + 5.25%), due 3/2/27 (b) | $ 2,500,216 | $ 1,872,037 |
| | | 9,511,134 |
| Healthcare, Education & Childcare 5.1% |
| Agiliti Health, Inc. | |
| Initial Term Loan | |
| 6.875% (1 Month LIBOR + 2.75%), due 1/4/26 (b) | 866,250 | 846,759 |
| Akorn Operating Co. LLC | |
| Term Loan | |
| 11.243% (3 Month LIBOR + 7.50%), due 10/1/25 (b) | 27,337 | 23,236 |
| Alvogen Pharma U.S., Inc. | |
| January 2020 Term Loan | |
| 9.98% (3 Month LIBOR + 5.25%), due 12/31/23 (b) | 1,187,436 | 1,027,132 |
| Amneal Pharmaceuticals LLC | |
| Initial Term Loan 7.938% - 8.25% | |
| (1 Month LIBOR + 3.50%, 3 Month LIBOR + 3.50%), due 5/4/25 (b) | 3,110,726 | 2,780,212 |
| athenahealth Group, Inc. (b) | |
| Initial Term Loan | |
| 7.821% (1 Month LIBOR + 3.50%), due 2/15/29 | 4,253,986 | 3,830,361 |
| Initial Delayed Draw Term Loan | |
| 7.821% (1 Month LIBOR + 3.50%), due 2/15/29 | 181,159 | 163,119 |
| Auris Luxembourg III SARL | |
| Facility Term Loan B2 8.501% - 8.678% | |
| (6 Month LIBOR + 3.75%), due 2/27/26 (b) | 1,138,114 | 1,007,231 |
| Carestream Dental Technology Parent Ltd. (b) | |
| First Lien Initial Term Loan | |
| 7.634% (1 Month LIBOR + 3.25%), due 9/1/24 | 689,648 | 637,924 |
| First Lien Tranche Term Loan B | |
| 8.884% (1 Month LIBOR + 4.50%), due 9/1/24 | 229,335 | 215,861 |
| Carestream Health, Inc. | |
| Term Loan | |
| 12.18% (3 Month LIBOR + 7.50%), due 9/30/27 (b) | 1,775,752 | 1,340,693 |
The notes to the financial statements are an integral part of, and should be read in conjunction with, the financial statements.
23
Portfolio of Investments December 31, 2022† (continued)
| | Principal
Amount | Value |
| Loan Assignments (continued) |
| Healthcare, Education & Childcare (continued) |
| Ecovyst Catalyst Technologies LLC | |
| Initial Term Loan | |
| 6.915% (3 Month LIBOR + 2.50%), due 6/9/28 (b) | $ 1,773,000 | $ 1,742,712 |
| Elanco Animal Health, Inc. | |
| Term Loan | |
| 5.87% (1 Month LIBOR + 1.75%), due 8/1/27 (b) | 1,452,456 | 1,392,024 |
| eResearchTechnology, Inc. | |
| First Lien Initial Term Loan | |
| 8.884% (1 Month LIBOR + 4.50%), due 2/4/27 (b) | 1,955,894 | 1,725,261 |
| FC Compassus LLC | |
| Term Loan B1 | |
| 7.127% (3 Month LIBOR + 4.25%), due 12/31/26 (b)(c) | 2,035,617 | 1,867,679 |
| Grifols Worldwide Operations Ltd. | |
| Dollar Tranche Term Loan B | |
| 6.384% (1 Month LIBOR + 2.00%), due 11/15/27 (b) | 925,556 | 892,133 |
| Horizon Therapeutics USA, Inc. | |
| Incremental Term Loan B2 | |
| 6.188% (1 Month LIBOR + 1.75%), due 3/15/28 (b) | 655,000 | 654,345 |
| Insulet Corp. | |
| Term Loan B | |
| 7.688% (1 Month LIBOR + 3.25%), due 5/4/28 (b) | 1,379,000 | 1,358,315 |
| Journey Personal Care Corp. | |
| Initial Term Loan | |
| 8.98% (3 Month LIBOR + 4.25%), due 3/1/28 (b) | 985,000 | 705,506 |
| LifePoint Health, Inc. | |
| First Lien Term Loan B | |
| 8.165% (3 Month LIBOR + 3.75%), due 11/16/25 (b) | 3,376,733 | 3,175,818 |
| Mallinckrodt International Finance SA | |
| 2017 Replacement Term Loan | |
| 9.986% (3 Month LIBOR + 5.25%), due 9/30/27 (b) | 949,167 | 714,248 |
| National Mentor Holdings, Inc. (b) | |
| First Lien Initial Term Loan 8.14% - 8.48% | |
| (1 Month LIBOR + 3.75%, 3 Month LIBOR + 3.75%), due 3/2/28 | 1,550,424 | 1,074,961 |
| First Lien Initial Term Loan C | |
| 8.48% (3 Month LIBOR + 3.75%), due 3/2/28 | 49,563 | 34,364 |
| | Principal
Amount | Value |
| |
| Healthcare, Education & Childcare (continued) |
| Organon & Co. | |
| Dollar Term Loan | |
| 7.75% (3 Month LIBOR + 3.00%), due 6/2/28 (b) | $ 2,555,126 | $ 2,525,315 |
| Petco Health and Wellness Co., Inc. | |
| First Lien Initial Term Loan | |
| 8.092% (1 Month LIBOR + 3.25%), due 3/3/28 (b) | 1,965,000 | 1,904,686 |
| Raptor Acquisition Corp. | |
| First Lien Term Loan B | |
| 8.753% (3 Month LIBOR + 4.00%), due 11/1/26 (b) | 1,243,750 | 1,219,911 |
| Select Medical Corp. | |
| Tranche Term Loan B | |
| 6.89% (1 Month LIBOR + 2.50%), due 3/6/25 (b) | 3,048,392 | 2,984,564 |
| Sound Inpatient Physicians, Inc. | |
| First Lien Initial Term Loan | |
| 7.384% (1 Month LIBOR + 3.00%), due 6/27/25 (b)(c) | 477,500 | 386,775 |
| Sunshine Luxembourg VII SARL | |
| Facility Term Loan B3 | |
| 8.48% (3 Month LIBOR + 3.75%), due 10/1/26 (b) | 6,397,718 | 6,116,928 |
| | | 42,348,073 |
| High Tech Industries 1.9% |
| Altar BidCo, Inc. | |
| First Lien Initial Term Loan 5.50% - 7.993% | |
| (1 Year LIBOR + 3.10%), due 2/1/29 (b) | 1,865,625 | 1,779,340 |
| AP Gaming I LLC | |
| Term Loan B | |
| 8.73% (3 Month LIBOR + 4.00%), due 2/15/29 (b) | 2,894,792 | 2,735,578 |
| Central Parent, Inc. | |
| First Lien Initial Term Loan | |
| 9.08% (3 Month LIBOR + 4.50%), due 7/6/29 (b) | 1,000,000 | 990,469 |
| NAB Holdings LLC | |
| Initial Term Loan | |
| 7.73% (3 Month LIBOR + 3.00%), due 11/23/28 (b) | 1,782,000 | 1,729,654 |
| Open Text Corp. | |
| Term Loan B | |
| TBD, due 11/16/29 | 4,000,000 | 3,897,500 |
The notes to the financial statements are an integral part of, and should be read in conjunction with, the financial statements.
| 24 | MainStay VP Floating Rate Portfolio |
| | Principal
Amount | Value |
| Loan Assignments (continued) |
| High Tech Industries (continued) |
| Scientific Games Holdings LP | |
| First Lien Initial Dollar Term Loan | |
| 7.097% (3 Month LIBOR + 3.50%), due 4/4/29 (b) | $ 1,726,442 | $ 1,644,220 |
| Trans Union LLC | |
| 2021 Incremental Term Loan B6 | ��� |
| 6.634% (1 Month LIBOR + 2.25%), due 12/1/28 (b) | 3,273,062 | 3,235,729 |
| | | 16,012,490 |
| Home and Office Furnishings, Housewares & Durable Consumer Products 0.0% ‡ |
| Serta Simmons Bedding LLC | |
| First Lien Initial Term Loan 7.743% - 7.827% | |
| (3 Month LIBOR + 3.50%), due 11/8/23 (b) | 2,467,178 | 166,535 |
| Hotel, Gaming & Leisure 0.3% |
| Flutter Entertainment plc | |
| 2028 Third Amendment Term Loan B | |
| 8.092% (3 Month LIBOR + 3.25%), due 7/22/28 (b) | 2,154,012 | 2,140,819 |
| Hotels, Motels, Inns & Gaming 3.9% |
| Aimbridge Acquisition Co., Inc. | |
| First Lien 2019 Initial Term Loan | |
| 8.134% (1 Month LIBOR + 3.75%), due 2/2/26 (b) | 2,666,749 | 2,402,740 |
| Caesars Resort Collection LLC (b) | |
| Term Loan B | |
| 7.134% (1 Month LIBOR + 2.75%), due 12/23/24 | 1,798,068 | 1,792,450 |
| Term Loan B1 | |
| 7.884% (1 Month LIBOR + 3.50%), due 7/21/25 | 585,958 | 583,944 |
| Churchill Downs, Inc. | |
| Facility Term Loan B | |
| 6.39% (1 Month LIBOR + 2.00%), due 12/27/24 (b) | 1,907,179 | 1,902,411 |
| Entain plc (b) | |
| USD Facility Term Loan B | |
| 7.23% (3 Month LIBOR + 2.50%), due 3/29/27 | 1,266,429 | 1,256,535 |
| USD Facility Term Loan B2 | |
| 8.18% (3 Month LIBOR + 3.50%), due 10/31/29 | 1,600,000 | 1,590,667 |
| | Principal
Amount | Value |
| |
| Hotels, Motels, Inns & Gaming (continued) |
| Everi Holdings, Inc. | |
| Term Loan B | |
| 6.884% (1 Month LIBOR + 2.50%), due 8/3/28 (b) | $ 1,455,621 | $ 1,441,065 |
| Four Seasons Holdings, Inc. | |
| 2022 Refinancing Term Loan | |
| 7.673% (1 Month LIBOR + 3.25%), due 11/30/29 (b) | 1,427,861 | 1,427,068 |
| Golden Entertainment, Inc. | |
| First Lien Facility Term Loan B | |
| 7.39% (1 Month LIBOR + 3.00%), due 10/21/24 (b) | 1,191,710 | 1,181,580 |
| Hilton Worldwide Finance LLC | |
| Refinanced Term Loan B2 | |
| 6.173% (1 Month LIBOR + 1.75%), due 6/22/26 (b) | 235,804 | 234,831 |
| Oceankey U.S. II Corp. | |
| Initial Term Loan | |
| 7.884% (1 Month LIBOR + 3.50%), due 12/15/28 (b) | 992,500 | 903,175 |
| PCI Gaming Authority | |
| Facility Term Loan B | |
| 6.884% (1 Month LIBOR + 2.50%), due 5/29/26 (b) | 2,449,126 | 2,431,779 |
| Penn National Gaming, Inc. | |
| Facility Term Loan B | |
| 7.173% (1 Month LIBOR + 2.75%), due 5/3/29 (b) | 497,500 | 491,564 |
| Scientific Games International, Inc. | |
| Initial Term Loan B | |
| 7.417% (1 Month LIBOR + 3.00%), due 4/14/29 (b) | 3,731,250 | 3,673,725 |
| Station Casinos LLC | |
| Facility Term Loan B1 | |
| 6.64% (1 Month LIBOR + 2.25%), due 2/8/27 (b) | 1,614,694 | 1,575,672 |
| Travel + Leisure Co. | |
| Term Loan B | |
| 6.634% (1 Month LIBOR + 2.25%), due 5/30/25 (b) | 1,922,236 | 1,890,198 |
| UFC Holdings LLC | |
| First Lien Term Loan B3 | |
| 7.11% (3 Month LIBOR + 2.75%), due 4/29/26 (b) | 4,028,083 | 3,971,440 |
| Whatabrands LLC | |
| Initial Term Loan B | |
| 7.634% (1 Month LIBOR + 3.25%), due 8/3/28 (b) | 1,980,000 | 1,911,938 |
The notes to the financial statements are an integral part of, and should be read in conjunction with, the financial statements.
25
Portfolio of Investments December 31, 2022† (continued)
| | Principal
Amount | Value |
| Loan Assignments (continued) |
| Hotels, Motels, Inns & Gaming (continued) |
| Wyndham Hotels & Resorts, Inc. | |
| Term Loan B | |
| 6.134% (1 Month LIBOR + 1.75%), due 5/30/25 (b) | $ 1,792,903 | $ 1,789,541 |
| | | 32,452,323 |
| Insurance 3.9% |
| Acrisure LLC (b) | |
| First Lien 2020 Term Loan | |
| 7.884% (1 Month LIBOR + 3.50%), due 2/15/27 | 2,976,260 | 2,786,523 |
| First Lien 2021-2 Additional Term Loan | |
| 8.634% (1 Month LIBOR + 4.25%), due 2/15/27 | 1,039,500 | 1,004,417 |
| Alliant Holdings Intermediate LLC | |
| New Term Loan B4 | |
| 7.854% (1 Month LIBOR + 3.50%), due 11/5/27 (b) | 1,975,000 | 1,928,505 |
| AmWINS Group, Inc. | |
| Term Loan | |
| 6.634% (1 Month LIBOR + 2.25%), due 2/19/28 (b) | 1,960,017 | 1,920,817 |
| AssuredPartners, Inc. (b) | |
| 2020 February Refinancing Term Loan | |
| 7.884% (1 Month LIBOR + 3.50%), due 2/12/27 | 3,124,869 | 3,029,561 |
| 2022-2 Term Loan | |
| 8.573% (1 Month LIBOR + 4.25%), due 2/12/27 | 399,000 | 395,675 |
| Asurion LLC (b) | |
| New Term Loan B7 | |
| 7.384% (1 Month LIBOR + 3.00%), due 11/3/24 | 1,424,587 | 1,380,662 |
| New Term Loan B8 | |
| 7.634% (1 Month LIBOR + 3.25%), due 12/23/26 | 980,000 | 869,750 |
| New Term Loan B9 | |
| 7.634% (1 Month LIBOR + 3.25%), due 7/31/27 | 491,250 | 428,124 |
| Second Lien New Term Loan B3 | |
| 9.634% (1 Month LIBOR + 5.25%), due 1/31/28 | 300,000 | 232,200 |
| Second Lien New Term Loan B4 | |
| 9.634% (1 Month LIBOR + 5.25%), due 1/20/29 | 2,500,000 | 1,929,168 |
| | Principal
Amount | Value |
| |
| Insurance (continued) |
| Broadstreet Partners, Inc. (b) | |
| 2020 Initial Term Loan | |
| 7.384% (1 Month LIBOR + 3.00%), due 1/27/27 | $ 2,489,944 | $ 2,412,133 |
| Tranche Term Loan B2 | |
| 7.634% (1 Month LIBOR + 3.25%), due 1/27/27 | 691,250 | 670,080 |
| Hub International Ltd. (b) | |
| Initial Term Loan | |
| 7.327% (3 Month LIBOR + 3.00%), due 4/25/25 | 1,389,869 | 1,373,460 |
| Incremental Term Loan B3 | |
| 7.528% (3 Month LIBOR + 3.25%), due 4/25/25 | 2,957,267 | 2,927,695 |
| 2022 Incremental Term Loan | |
| 8.22% (3 Month LIBOR + 4.00%), due 11/10/29 | 360,000 | 355,629 |
| NFP Corp. | |
| Closing Date Term Loan | |
| 7.634% (1 Month LIBOR + 3.25%), due 2/15/27 (b) | 1,909,652 | 1,824,195 |
| Ryan Specialty Group LLC | |
| Initial Term Loan | |
| 7.423% (1 Month LIBOR + 3.00%), due 9/1/27 (b) | 977,500 | 969,354 |
| Sedgwick Claims Management Services, Inc. (b) | |
| Initial Term Loan | |
| 7.634% (1 Month LIBOR + 3.25%), due 12/31/25 | 2,894,843 | 2,813,168 |
| 2019 Term Loan | |
| 8.134% (1 Month LIBOR + 3.75%), due 9/3/26 | 965,000 | 945,355 |
| USI, Inc. | |
| Incremental Term Loan | |
| 8.33% (3 Month LIBOR + 3.75%), due 11/22/29 (b) | 2,842,875 | 2,810,182 |
| | | 33,006,653 |
| Leisure, Amusement, Motion Pictures & Entertainment 1.4% |
| Bombardier Recreational Products, Inc. (b) | |
| 2020 Replacement Term Loan | |
| 6.384% (1 Month LIBOR + 2.00%), due 5/24/27 | 2,258,784 | 2,177,608 |
| 2022-2 Incremental Term Loan | |
| 7.898% (1 Month SOFR + 3.50%), due 12/13/29 | 3,000,000 | 2,933,751 |
The notes to the financial statements are an integral part of, and should be read in conjunction with, the financial statements.
| 26 | MainStay VP Floating Rate Portfolio |
| | Principal
Amount | Value |
| Loan Assignments (continued) |
| Leisure, Amusement, Motion Pictures & Entertainment (continued) |
| Creative Artists Agency LLC | |
| Closing Date Term Loan | |
| 8.134% (1 Month LIBOR + 3.75%), due 11/27/26 (b) | $ 1,455,000 | $ 1,441,541 |
| Fitness International LLC (b) | |
| Term Loan A 6.744% - 7.049% | |
| (3 Month LIBOR + 2.50%), due 1/8/25 | 1,083,750 | 997,050 |
| Term Loan B | |
| 7.494% (3 Month LIBOR + 3.25%), due 4/18/25 | 270,764 | 248,652 |
| Lions Gate Capital Holdings LLC | |
| Term Loan B | |
| 6.634% (1 Month LIBOR + 2.25%), due 3/24/25 (b) | 1,003,250 | 957,268 |
| Marriott Ownership Resorts, Inc. | |
| 2019 Refinancing Term Loan | |
| 6.134% (1 Month LIBOR + 1.75%), due 8/29/25 (b) | 1,313,765 | 1,296,795 |
| William Morris Endeavor Entertainment LLC (IMG Worldwide Holdings LLC) | |
| First Lien Term Loan B1 | |
| 7.14% (1 Month LIBOR + 2.75%), due 5/18/25 (b) | 2,166,783 | 2,111,530 |
| | | 12,164,195 |
| Machinery (Non-Agriculture, Non-Construct & Non-Electronic) 0.7% |
| Advanced Drainage Systems, Inc. | |
| Initial Term Loan | |
| 6.474% (1 Month LIBOR + 2.25%), due 7/31/26 (b) | 459,643 | 459,643 |
| Columbus McKinnon Corp. | |
| Initial Term Loan | |
| 7.50% (3 Month LIBOR + 2.75%), due 5/14/28 (b) | 1,347,515 | 1,328,987 |
| CPM Holdings, Inc. (b) | |
| First Lien Initial Term Loan | |
| 7.869% (1 Month LIBOR + 3.50%), due 11/17/25 | 1,439,991 | 1,411,912 |
| Second Lien Initial Term Loan | |
| 12.619% (1 Month LIBOR + 8.25%), due 11/16/26 (c) | 797,980 | 776,035 |
| Husky Injection Molding Systems Ltd. | |
| Initial Term Loan | |
| 8.151% (3 Month LIBOR + 3.00%), due 3/28/25 (b) | 1,790,620 | 1,669,753 |
| | | 5,646,330 |
| | Principal
Amount | Value |
| |
| Manufacturing 2.2% |
| ASP Blade Holdings, Inc. | |
| Initial Term Loan | |
| 8.73% (3 Month LIBOR + 4.00%), due 10/13/28 (b) | $ 1,485,882 | $ 1,179,153 |
| Chart Industries, Inc. | |
| Term Loan B | |
| TBD, due 12/7/29 | 2,142,857 | 2,116,072 |
| Coherent Corp. | |
| Initial Term Loan B | |
| 7.134% (1 Month LIBOR + 2.75%), due 7/2/29 (b) | 2,694,018 | 2,663,710 |
| CP Atlas Buyer, Inc. | |
| Term Loan B | |
| 7.884% (1 Month LIBOR + 3.50%), due 11/23/27 (b) | 3,323,833 | 2,902,717 |
| CPG International LLC | |
| Closing Date Term Loan | |
| 6.923% (1 Month LIBOR + 2.50%), due 4/28/29 (b) | 1,246,875 | 1,209,858 |
| FCG Acquisitions, Inc. | |
| First Lien Initial Term Loan | |
| 8.48% (3 Month LIBOR + 3.75%), due 3/31/28 (b) | 985,017 | 934,945 |
| Idemia Group SAS | |
| USD Facility Term Loan B3 | |
| 9.23% (3 Month LIBOR + 4.50%), due 1/10/26 (b) | 1,062,240 | 1,026,389 |
| Madison IAQ LLC | |
| Term Loan | |
| 7.988% (3 Month LIBOR + 3.25%), due 6/21/28 (b) | 2,324,600 | 2,154,614 |
| Pro Mach Group, Inc. | |
| First Lien Closing Date Initial Term Loan | |
| 8.384% (1 Month LIBOR + 4.00%), due 8/31/28 (b) | 2,785,161 | 2,704,093 |
| Standard Industries, Inc. | |
| Initial Term Loan | |
| 6.425% (3 Month LIBOR + 2.25%), due 9/22/28 (b) | 1,053,418 | 1,039,080 |
| Zurn LLC | |
| First Lien Term Loan B | |
| 6.384% (1 Month LIBOR + 2.00%), due 10/4/28 (b) | 841,500 | 838,695 |
| | | 18,769,326 |
The notes to the financial statements are an integral part of, and should be read in conjunction with, the financial statements.
27
Portfolio of Investments December 31, 2022† (continued)
| | Principal
Amount | Value |
| Loan Assignments (continued) |
| Media 1.8% |
| Cogeco Communications Finance (USA) LP | |
| Amendment No. 5 Incremental Term Loan B | |
| 6.884% (1 Month LIBOR + 2.50%), due 9/1/28 (b) | $ 2,768,538 | $ 2,684,906 |
| Diamond Sports Group LLC | |
| Second Lien Term Loan | |
| 7.567% (1 Month LIBOR + 3.25%), due 8/24/26 (b) | 2,898,312 | 350,212 |
| Directv Financing LLC | |
| Closing Date Term Loan | |
| 9.384% (1 Month LIBOR + 5.00%), due 8/2/27 (b) | 3,727,500 | 3,615,094 |
| KKR Apple Bidco LLC (b) | |
| First Lien Initial Term Loan | |
| 7.134% (1 Month LIBOR + 2.75%), due 9/22/28 | 2,346,300 | 2,310,005 |
| First Lien Amendment No. 1 Term Loan | |
| 8.323% (1 Month LIBOR + 4.00%), due 9/22/28 | 750,000 | 747,187 |
| Mission Broadcasting, Inc. | |
| Term Loan B4 | |
| 6.869% (1 Month LIBOR + 2.50%), due 6/2/28 (b) | 592,500 | 586,871 |
| Radiate Holdco LLC | |
| Amendment No. 6 Term Loan | |
| 7.634% (1 Month LIBOR + 3.25%), due 9/25/26 (b) | 4,054,157 | 3,287,245 |
| Sinclair Television Group, Inc. | |
| Term Loan B4 | |
| 8.173% (1 Month LIBOR + 3.75%), due 4/21/29 (b) | 1,990,000 | 1,889,256 |
| | | 15,470,776 |
| Mining, Steel, Iron & Non-Precious Metals 1.1% |
| American Rock Salt Co. LLC | |
| First Lien Initial Term Loan | |
| 8.38% (1 Month LIBOR + 4.00%), due 6/9/28 (b) | 1,238,286 | 1,159,345 |
| Gates Global LLC (b) | |
| Initial Dollar Term Loan B3 | |
| 6.884% (1 Month LIBOR + 2.50%), due 3/31/27 | 2,899,361 | 2,833,762 |
| Initial Dollar Term Loan B4 | |
| 7.823% (1 Month LIBOR + 3.50%), due 11/16/29 | 1,995,000 | 1,977,544 |
| | Principal
Amount | Value |
| |
| Mining, Steel, Iron & Non-Precious Metals (continued) |
| Graftech International Ltd. | |
| Initial Term Loan | |
| 7.384% (1 Month LIBOR + 3.00%), due 2/12/25 (b) | $ 605,084 | $ 597,332 |
| MRC Global (U.S.), Inc. | |
| 2018 Refinancing Term Loan | |
| 7.384% (1 Month LIBOR + 3.00%), due 9/20/24 (b) | 1,046,126 | 1,028,691 |
| U.S. Silica Co. | |
| Term Loan | |
| 8.438% (1 Month LIBOR + 4.00%), due 5/1/25 (b) | 1,427,297 | 1,407,671 |
| | | 9,004,345 |
| Oil & Gas 1.6% |
| AL GCX Holdings LLC | |
| Initial Term Loan | |
| 7.565% (3 Month LIBOR + 3.75%), due 5/17/29 (b) | 498,750 | 493,555 |
| Buckeye Partners LP | |
| 2021 Tranche Term Loan B1 | |
| 6.634% (1 Month LIBOR + 2.25%), due 11/1/26 (b) | 1,337,394 | 1,328,426 |
| ChampionX Corp. | |
| Term Loan B1 | |
| 7.567% (1 Month LIBOR + 3.25%), due 6/7/29 (b) | 1,496,250 | 1,488,302 |
| DT Midstream, Inc. | |
| Initial Term Loan | |
| 6.438% (1 Month LIBOR + 2.00%), due 6/26/28 (b) | 319,462 | 319,551 |
| Fleet Midco I Ltd. | |
| Facility Term Loan B | |
| 7.928% (6 Month LIBOR + 3.00%), due 10/7/26 (b) | 1,209,375 | 1,197,281 |
| GIP III Stetson I LP | |
| Initial Term Loan | |
| 8.634% (1 Month LIBOR + 4.25%), due 7/18/25 (b)(c) | 1,372,298 | 1,347,426 |
| Keane Group Holdings LLC | |
| Initial Term Loan | |
| 7.938% (1 Month LIBOR + 3.50%), due 5/25/25 (b) | 955,000 | 926,947 |
| Medallion Midland Acquisition LLC | |
| Initial Term Loan | |
| 8.592% (3 Month LIBOR + 3.75%), due 10/18/28 (b) | 571,725 | 565,579 |
The notes to the financial statements are an integral part of, and should be read in conjunction with, the financial statements.
| 28 | MainStay VP Floating Rate Portfolio |
| | Principal
Amount | Value |
| Loan Assignments (continued) |
| Oil & Gas (continued) |
| Murphy Oil USA, Inc. | |
| Tranche Term Loan B | |
| 6.12% (1 Month LIBOR + 1.75%), due 1/31/28 (b) | $ 443,250 | $ 443,250 |
| NorthRiver Midstream Finance LP | |
| Initial Term Loan B | |
| 6.924% (3 Month LIBOR + 3.25%), due 10/1/25 (b) | 1,152,000 | 1,142,400 |
| Oryx Midstream Services Permian Basin LLC | |
| Initial Term Loan | |
| 7.924% (3 Month LIBOR + 3.25%), due 10/5/28 (b) | 980,522 | 967,346 |
| PES Holdings LLC | |
| Tranche Term Loan C (zero coupon) - 12.00% | |
| (3.00% PIK) (1 Month LIBOR + 4.50%), due 12/31/23 (b)(c)(e)(f)(g) | 1,143,629 | 28,591 |
| Prairie ECI Acquiror LP | |
| Initial Term Loan | |
| 9.134% (1 Month LIBOR + 4.75%), due 3/11/26 (b) | 1,185,525 | 1,151,256 |
| Traverse Midstream Partners LLC | |
| Advance Term Loan | |
| 8.80% (3 Month LIBOR + 4.25%), due 9/27/24 (b) | 1,089,286 | 1,085,201 |
| Veritas U.S., Inc. | |
| Dollar 2021 Term Loan B | |
| 9.73% (3 Month LIBOR + 5.00%), due 9/1/25 (b) | 1,181,910 | 833,246 |
| | | 13,318,357 |
| Packaging 0.3% |
| LABL, Inc. | |
| Initial Dollar Term Loan | |
| 9.384% (1 Month LIBOR + 5.00%), due 10/29/28 (b) | 1,485,000 | 1,407,037 |
| Plastipak Holdings, Inc. | |
| 2021 Tranche Term Loan B | |
| 6.938% (1 Month LIBOR + 2.50%), due 12/1/28 (b) | 960,588 | 947,781 |
| | | 2,354,818 |
| Personal & Nondurable Consumer Products 1.3% |
| ABG Intermediate Holdings 2 LLC | |
| First Lien Tranche Term Loan B1 | |
| 7.923% (1 Month LIBOR + 3.50%), due 12/21/28 (b) | 2,368,100 | 2,289,164 |
| | Principal
Amount | Value |
| |
| Personal & Nondurable Consumer Products (continued) |
| Foundation Building Materials, Inc. | |
| First Lien Initial Term Loan | |
| 7.665% (3 Month LIBOR + 3.25%), due 1/31/28 (b) | $ 738,750 | $ 696,272 |
| Hunter Douglas Holding BV | |
| Tranche Term Loan B1 | |
| 7.859% (3 Month SOFR + 3.50%), due 2/26/29 (b) | 2,985,000 | 2,618,591 |
| Leslie's Poolmart, Inc. | |
| Initial Term Loan | |
| 7.23% (3 Month LIBOR + 2.50%), due 3/9/28 (b) | 1,965,000 | 1,919,968 |
| Michaels Cos., Inc. (The) | |
| Term Loan B | |
| 8.98% (3 Month LIBOR + 4.25%), due 4/15/28 (b) | 3,152,000 | 2,715,448 |
| Prestige Brands, Inc. | |
| Term Loan B5 | |
| 6.384% (1 Month LIBOR + 2.00%), due 7/3/28 (b) | 660,000 | 656,700 |
| Spectrum Brands, Inc. | |
| 2021 Term Loan 6.42% - 6.74% | |
| (3 Month LIBOR + 2.00%), due 3/3/28 (b) | 98,250 | 96,285 |
| | | 10,992,428 |
| Personal & Nondurable Consumer Products (Manufacturing Only) 0.7% |
| American Builders & Contractors Supply Co., Inc. | |
| Restatement Effective Date Term Loan | |
| 6.384% (1 Month LIBOR + 2.00%), due 1/15/27 (b) | 1,683,352 | 1,664,415 |
| Hercules Achievement, Inc. | |
| First Lien Initial Term Loan | |
| 7.884% (1 Month LIBOR + 3.50%), due 12/16/24 (b) | 1,900,089 | 1,826,164 |
| SRAM LLC | |
| Initial Term Loan | |
| 7.134% (1 Month LIBOR + 2.75%), due 5/18/28 (b) | 2,195,455 | 2,132,335 |
| | | 5,622,914 |
| Personal Transportation 0.4% |
| First Student Bidco, Inc. (b) | |
| Initial Term Loan B | |
| 7.726% (3 Month LIBOR + 3.00%), due 7/21/28 | 245,697 | 221,311 |
| Initial Term Loan C | |
| 7.726% (3 Month LIBOR + 3.00%), due 7/21/28 | 90,622 | 81,628 |
The notes to the financial statements are an integral part of, and should be read in conjunction with, the financial statements.
29
Portfolio of Investments December 31, 2022† (continued)
| | Principal
Amount | Value |
| Loan Assignments (continued) |
| Personal Transportation (continued) |
| Uber Technologies, Inc. (b) | |
| 2021 Incremental Term Loan | |
| 8.235% (3 Month LIBOR + 3.50%), due 4/4/25 | $ 1,709,719 | $ 1,707,582 |
| 2021 Refinancing Term Loan | |
| 8.235% (3 Month LIBOR + 3.50%), due 2/25/27 | 981,675 | 978,871 |
| | | 2,989,392 |
| Personal, Food & Miscellaneous Services 1.7% |
| 1011778 B.C. Unlimited Liability Co. | |
| Term Loan B4 6.134% - 6.165% | |
| (1 Month LIBOR + 1.75%, 3 Month LIBOR + 1.75%), due 11/19/26 (b) | 2,121,119 | 2,080,353 |
| Aramark Intermediate HoldCo Corp. (b) | |
| U.S. Term Loan B3 | |
| 6.134% (1 Month LIBOR + 1.75%), due 3/11/25 | 2,182,663 | 2,160,836 |
| U.S. Term Loan B5 | |
| 6.884% (1 Month LIBOR + 2.50%), due 4/6/28 | 1,402,972 | 1,381,928 |
| Hayward Industries, Inc. | |
| First Lien Refinancing Term Loan | |
| 6.884% (1 Month LIBOR + 2.50%), due 5/30/28 (b) | 2,758,000 | 2,646,530 |
| Hillman Group, Inc. (The) (b) | |
| Initial Term Loan | |
| 7.139% (1 Month LIBOR + 2.75%), due 7/14/28 | 533,472 | 517,201 |
| Initial Delayed Draw Term Loan | |
| 7.139% (1 Month LIBOR + 2.75%), due 7/14/28 | 10,222 | 9,911 |
| IRB Holding Corp. (b) | |
| 2020 Replacement Term Loan B | |
| 7.134% (1 Month LIBOR + 2.75%), due 2/5/25 | 2,385,937 | 2,360,374 |
| 2022 Replacement Term Loan B | |
| 7.317% (1 Month LIBOR + 3.00%), due 12/15/27 | 2,131,213 | 2,062,613 |
| KFC Holding Co. | |
| 2021 Term Loan B | |
| 6.089% (1 Month LIBOR + 1.75%), due 3/15/28 (b) | 1,449,242 | 1,424,786 |
| | | 14,644,532 |
| | Principal
Amount | Value |
| |
| Pharmaceuticals 0.1% |
| Padagis LLC | |
| Term Loan B | |
| 8.491% (3 Month LIBOR + 4.75%), due 7/6/28 (b) | $ 1,129,412 | $ 988,235 |
| Printing & Publishing 0.7% |
| Getty Images, Inc. | |
| Initial Dollar Term Loan | �� |
| 8.938% (1 Month LIBOR + 4.50%), due 2/19/26 (b) | 1,005,342 | 997,802 |
| Severin Acquisition LLC | |
| First Lien Initial Term Loan | |
| 7.094% (3 Month LIBOR + 3.00%), due 8/1/25 (b) | 1,929,946 | 1,909,038 |
| Springer Nature Deutschland GmbH | |
| Initial Term Loan B18 | |
| 6.674% (3 Month LIBOR + 3.00%), due 8/14/26 (b) | 3,062,584 | 3,031,193 |
| | | 5,938,033 |
| Retail 0.6% |
| Great Outdoors Group LLC | |
| Term Loan B2 | |
| 8.134% (1 Month LIBOR + 3.75%), due 3/6/28 (b) | 5,339,450 | 5,126,983 |
| Retail Store 1.3% |
| BJ's Wholesale Club, Inc. | |
| First Lien Tranche Term Loan B | |
| 6.27% (1 Month LIBOR + 2.00%), due 2/3/24 (b) | 1,171,143 | 1,170,353 |
| EG Group Ltd. (b) | |
| USD Additional Facility Term Loan | |
| 8.73% (3 Month LIBOR + 4.00%), due 2/7/25 | 1,428,788 | 1,341,631 |
| USD Facility Term Loan B | |
| 9.151% (6 Month LIBOR + 4.00%), due 2/7/25 | 658,267 | 618,113 |
| Harbor Freight Tools USA, Inc. | |
| 2021 Initial Term Loan | |
| 7.134% (1 Month LIBOR + 2.75%), due 10/19/27 (b) | 3,804,621 | 3,622,117 |
| PetSmart LLC | |
| Initial Term Loan | |
| 8.13% (1 Month LIBOR + 3.75%), due 2/11/28 (b) | 1,382,500 | 1,352,258 |
The notes to the financial statements are an integral part of, and should be read in conjunction with, the financial statements.
| 30 | MainStay VP Floating Rate Portfolio |
| | Principal
Amount | Value |
| Loan Assignments (continued) |
| Retail Store (continued) |
| Rising Tide Holdings, Inc. | |
| First Lien Initial Term Loan | |
| 9.485% (3 Month LIBOR + 4.75%), due 6/1/28 (b) | $ 2,403,400 | $ 1,081,530 |
| White Cap Supply Holdings LLC | |
| Initial Closing Date Term Loan | |
| 8.073% (1 Month LIBOR + 3.75%), due 10/19/27 (b) | 1,962,650 | 1,894,230 |
| | | 11,080,232 |
| Services: Business 4.5% |
| Brown Group Holdings LLC (b) | |
| Incremental Facility Term Loan B2 7.844% - 8.134% | |
| (1 Month LIBOR + 3.75%, 3 Month LIBOR + 3.75%), due 7/2/29 | 166,250 | 165,508 |
| Initial Term Loan | |
| 6.884% (1 Month LIBOR + 2.50%), due 6/7/28 | 1,152,352 | 1,130,334 |
| Charlotte Buyer, Inc. | |
| First Lien Initial Term Loan B | |
| 9.533% (1 Month LIBOR + 5.25%), due 2/11/28 (b) | 800,000 | 756,334 |
| ConnectWise LLC | |
| Initial Term Loan | |
| 7.884% (1 Month LIBOR + 3.50%), due 9/29/28 (b) | 1,386,000 | 1,314,967 |
| Dun & Bradstreet Corp. (The) (b) | |
| 2022 Incremental Term Loan B2 | |
| 7.573% (1 Month LIBOR + 3.25%), due 1/18/29 | 297,750 | 292,043 |
| Initial Borrowing Term Loan | |
| 7.639% (1 Month LIBOR + 3.25%), due 2/6/26 | 2,814,681 | 2,783,016 |
| Electron Bidco, Inc. | |
| First Lien Initial Term Loan | |
| 7.384% (1 Month LIBOR + 3.00%), due 11/1/28 (b) | 3,644,142 | 3,542,791 |
| GIP II Blue Holding LP | |
| Initial Term Loan | |
| 9.23% (3 Month LIBOR + 4.50%), due 9/29/28 (b) | 2,271,120 | 2,247,191 |
| Hunter Holdco 3 Ltd. | |
| First Lien Initial Dollar Term Loan | |
| 8.98% (3 Month LIBOR + 4.25%), due 8/19/28 (b) | 3,033,000 | 2,964,757 |
| | Principal
Amount | Value |
| |
| Services: Business (continued) |
| ICON plc (b) | |
| Lux Term Loan | |
| 7.00% (3 Month LIBOR + 2.25%), due 7/3/28 | $ 1,524,594 | $ 1,518,402 |
| U.S. Term Loan | |
| 7.00% (3 Month LIBOR + 2.25%), due 7/3/28 | 379,854 | 378,311 |
| Indy U.S. Bidco LLC | |
| 2021 Refinancing Dollar Term Loan | |
| 8.134% (1 Month LIBOR + 3.75%), due 3/6/28 (b) | 1,473,844 | 1,269,962 |
| Intrado Corp. | |
| Initial Term Loan B | |
| 8.415% (3 Month LIBOR + 4.00%), due 10/10/24 (b) | 1,490,103 | 1,361,582 |
| Mercury Borrower, Inc. | |
| First Lien Initial Term Loan | |
| 8.25% (3 Month LIBOR + 3.50%), due 8/2/28 (b) | 4,758,045 | 4,526,090 |
| Mitchell International, Inc. (b) | |
| First Lien Initial Term Loan | |
| 8.415% (3 Month LIBOR + 3.75%), due 10/15/28 | 1,985,000 | 1,829,177 |
| Second Lien Initial Term Loan | |
| 11.235% (3 Month LIBOR + 6.50%), due 10/15/29 | 1,200,000 | 989,000 |
| MPH Acquisition Holdings LLC | |
| Initial Term Loan | |
| 8.985% (3 Month LIBOR + 4.25%), due 9/1/28 (b) | 2,468,750 | 2,094,838 |
| PECF USS Intermediate Holding III Corp. | |
| Initial Term Loan | |
| 8.634% (1 Month LIBOR + 4.25%), due 12/15/28 (b) | 3,477,437 | 2,889,170 |
| Phoenix Newco, Inc. | |
| First Lien Initial Term Loan | |
| 7.321% (3 Month LIBOR + 3.25%), due 11/15/28 (b) | 1,488,750 | 1,431,268 |
| Polaris Newco LLC | |
| First Lien Dollar Term Loan | |
| 8.73% (3 Month LIBOR + 4.00%), due 6/2/28 (b) | 2,962,500 | 2,696,933 |
| Project Boost Purchaser LLC | |
| 2021 Tranche Term Loan 2 | |
| 7.884% (1 Month LIBOR + 3.50%), due 5/30/26 (b) | 738,750 | 710,123 |
The notes to the financial statements are an integral part of, and should be read in conjunction with, the financial statements.
31
Portfolio of Investments December 31, 2022† (continued)
| | Principal
Amount | Value |
| Loan Assignments (continued) |
| Services: Business (continued) |
| Vizient, Inc. | |
| Term Loan B7 | |
| 6.671% (1 Month LIBOR + 2.25%), due 5/16/29 (b) | $ 746,250 | $ 744,540 |
| | | 37,636,337 |
| Software 3.7% |
| AppLovin Corp. | |
| Amendment No. 6 New Term Loan | |
| 9.50% (3 Month LIBOR + 2.00%), due 10/25/28 (b) | 1,191,000 | 1,128,473 |
| Cornerstone OnDemand, Inc. | |
| First Lien Initial Term Loan | |
| 8.134% (1 Month LIBOR + 3.75%), due 10/16/28 (b) | 1,860,937 | 1,655,071 |
| Gen Digital, Inc. | |
| Tranche Initial Term Loan B | |
| 6.423% (1 Month LIBOR + 2.00%), due 9/12/29 (b) | 7,000,000 | 6,868,750 |
| Informatica LLC | |
| Initial Term Loan | |
| 7.188% (1 Month LIBOR + 2.75%), due 10/27/28 (b) | 2,937,800 | 2,880,880 |
| Magenta Buyer LLC | |
| First Lien Initial Term Loan | |
| 9.17% (3 Month LIBOR + 4.75%), due 7/27/28 (b) | 693,000 | 589,916 |
| McAfee Corp. | |
| Tranche Term Loan B1 | |
| 7.974% (1 Month LIBOR + 3.75%), due 3/1/29 (b) | 4,975,000 | 4,620,531 |
| Mitnick Corp. Purchaser, Inc. | |
| Initial Term Loan | |
| 8.944% (3 Month LIBOR + 4.75%), due 5/2/29 (b) | 1,995,000 | 1,864,078 |
| Quest Software U.S. Holdins, Inc. | |
| First Lien Initial Term Loan | |
| 8.494% (3 Month LIBOR + 4.25%), due 2/1/29 (b) | 2,805,469 | 2,153,197 |
| Sophia LP | |
| First Lien Term Loan B | |
| 8.23% (3 Month LIBOR + 3.50%), due 10/7/27 (b) | 673,142 | 648,741 |
| Sovos Compliance LLC | |
| First Lien Initial Term Loan | |
| 8.884% (1 Month LIBOR + 4.50%), due 8/11/28 (b) | 495,368 | 454,748 |
| | Principal
Amount | Value |
| |
| Software (continued) |
| TIBCO Software, Inc. | |
| First Lien Dollar Term Loan B | |
| 9.18% (3 Month LIBOR + 4.50%), due 3/30/29 (b) | $ 1,600,000 | $ 1,425,333 |
| UKG, Inc. (b) | |
| First Lien 2021-2 Incremental Term Loan | |
| 6.998% (3 Month LIBOR + 3.25%), due 5/4/26 | 3,862,548 | 3,662,661 |
| First Lien Initial Term Loan | |
| 8.134% (1 Month LIBOR + 3.75%), due 5/4/26 | 1,693,125 | 1,627,820 |
| Second Lien 2021 Incremental Term Loan | |
| 8.998% (3 Month LIBOR + 5.25%), due 5/3/27 | 200,000 | 183,125 |
| Vision Solutions, Inc. | |
| First Lien Third Incremental Term Loan | |
| 8.358% (3 Month LIBOR + 4.00%), due 4/24/28 (b) | 1,645,833 | 1,361,927 |
| | | 31,125,251 |
| Telecommunications 3.4% |
| Avaya, Inc. | |
| Tranche Term Loan B2 | |
| 8.318% (1 Month LIBOR + 4.00%), due 12/15/27 (b) | 1,168,269 | 392,830 |
| Azalea TopCo, Inc. | |
| First Lien Initial Term Loan | |
| 7.884% (1 Month LIBOR + 3.50%), due 7/24/26 (b) | 2,418,750 | 2,213,156 |
| Cablevision Lightpath LLC | |
| Initial Term Loan | |
| 7.568% (1 Month LIBOR + 3.25%), due 11/30/27 (b) | 1,477,387 | 1,407,211 |
| Connect Finco SARL | |
| Amendement No.1 Refinancing Term Loan | |
| 7.58% (1 Month LIBOR + 3.50%), due 12/11/26 (b) | 3,919,697 | 3,864,578 |
| CSC Holdings LLC | |
| September 2019 Initial Term Loan | |
| 6.818% (1 Month LIBOR + 2.50%), due 4/15/27 (b) | 3,598,858 | 3,202,983 |
| Cyxtera DC Holdings, Inc. | |
| First Lien Initial Term Loan | |
| 7.36% (3 Month LIBOR + 3.00%), due 5/1/24 (b)(c) | 947,500 | 792,742 |
The notes to the financial statements are an integral part of, and should be read in conjunction with, the financial statements.
| 32 | MainStay VP Floating Rate Portfolio |
| | Principal
Amount | Value |
| Loan Assignments (continued) |
| Telecommunications (continued) |
| Frontier Communications Holdings LLC | |
| Term Loan B | |
| 8.50% (3 Month LIBOR + 3.75%), due 5/1/28 (b) | $ 2,112,375 | $ 2,010,278 |
| Gogo Intermediate Holdings LLC | |
| Initial Term Loan | |
| 8.165% (3 Month LIBOR + 3.75%), due 4/30/28 (b) | 2,957,469 | 2,927,894 |
| Intelsat Jackson Holdings SA | |
| Term Loan B | |
| 7.445% (6 Month LIBOR + 4.25%), due 2/1/29 (b) | 876,913 | 845,345 |
| Level 3 Financing, Inc. | |
| Tranche 2027 Term Loan B | |
| 6.134% (1 Month LIBOR + 1.75%), due 3/1/27 (b) | 1,162,434 | 1,111,940 |
| Lumen Technologies, Inc. | |
| Term Loan B | |
| 6.634% (1 Month LIBOR + 2.25%), due 3/15/27 (b) | 2,667,026 | 2,525,756 |
| Redstone HoldCo 2 LP | |
| First Lien Initial Term Loan | |
| 9.108% (3 Month LIBOR + 4.75%), due 4/27/28 (b) | 1,478,775 | 1,021,834 |
| SBA Senior Finance II LLC | |
| Initial Term Loan | |
| 6.14% (1 Month LIBOR + 1.75%), due 4/11/25 (b) | 1,753,052 | 1,745,852 |
| Telesat Canada | |
| Term Loan B5 | |
| 7.17% (3 Month LIBOR + 2.75%), due 12/7/26 (b) | 1,220,447 | 558,965 |
| Zayo Group Holdings, Inc. | |
| Initial Dollar Term Loan | |
| 7.384% (1 Month LIBOR + 3.00%), due 3/9/27 (b) | 4,348,136 | 3,504,476 |
| | | 28,125,840 |
| Utilities 2.6% |
| Astoria Energy LLC | |
| 2020 Advance Term Loan B | |
| 7.89% (1 Month LIBOR + 3.50%), due 12/10/27 (b) | 649,927 | 640,449 |
| Brookfield WEC Holdings, Inc. (b) | |
| First Lien 2021 Initial Term Loan | |
| 7.134% (1 Month LIBOR + 2.75%), due 8/1/25 | 2,883,613 | 2,838,196 |
| | Principal
Amount | Value |
| |
| Utilities (continued) |
| Brookfield WEC Holdings, Inc. (b) (continued) | |
| Initial Term Loan | |
| 8.073% (1 Month LIBOR + 3.75%), due 8/1/25 | $ 1,163,750 | $ 1,157,516 |
| Calpine Corp. | |
| 2019 Term Loan | |
| 6.39% (1 Month LIBOR + 2.00%), due 4/5/26 (b) | 3,039,750 | 2,992,634 |
| Constellation Renewables LLC | |
| Term Loan | |
| 7.24% (3 Month LIBOR + 2.50%), due 12/15/27 (b) | 1,392,014 | 1,376,850 |
| Edgewater Generation LLC | |
| Term Loan | |
| 8.134% (1 Month LIBOR + 3.75%), due 12/13/25 (b) | 3,062,968 | 2,898,760 |
| Granite Generation LLC | |
| Term Loan | |
| 8.134% (1 Month LIBOR + 3.75%), due 11/9/26 (b) | 3,012,500 | 2,919,772 |
| Hamilton Projects Acquiror LLC | |
| Term Loan | |
| 9.23% (3 Month LIBOR + 4.50%), due 6/17/27 (b) | 2,192,778 | 2,155,319 |
| PG&E Corp. | |
| Term Loan | |
| 7.438% (1 Month LIBOR + 3.00%), due 6/23/25 (b) | 1,706,250 | 1,688,761 |
| Vistra Operations Co. LLC | |
| 2018 Incremental Term Loan 6.089% - 6.134% | |
| (1 Month LIBOR + 1.75%), due 12/31/25 (b) | 3,082,137 | 3,052,015 |
| | | 21,720,272 |
| Water 0.3% |
| Osmosis Buyer Ltd. | |
| 2022 Refinanciang Term Loan B | |
| 7.967% (1 Month LIBOR + 3.75%), due 7/31/28 (b) | 2,388,000 | 2,238,750 |
Total Loan Assignments
(Cost $793,928,364) | | 746,248,084 |
Total Long-Term Bonds
(Cost $832,809,653) | | 781,067,084 |
| |
The notes to the financial statements are an integral part of, and should be read in conjunction with, the financial statements.
33
Portfolio of Investments December 31, 2022† (continued)
| | Shares | Value |
| Affiliated Investment Company 0.2% |
| Fixed Income Fund 0.2% | | |
| MainStay MacKay High Yield Corporate Bond Fund Class I | 436,571 | $ 2,142,121 |
Total Affiliated Investment Company
(Cost $2,445,688) | | 2,142,121 |
| Common Stocks 0.0% ‡ |
| Auto Components 0.0% ‡ |
| Millennium Corporate Trust (c)(d)(h) | 1,243 | — |
| Millennium Industries Corp. (c)(d)(h) | 1,324 | — |
| | | — |
| Health Care Equipment & Supplies 0.0% ‡ |
| Carestream Equity (c)(d)(h) | 3,656 | 77,873 |
| Independent Power and Renewable Electricity Producers 0.0% ‡ |
| Sempra Texas Holdings Corp. (c)(d)(h) | 94,456 | — |
| Machinery 0.0% ‡ |
| Ameriforge Group, Inc. (c)(d)(h) | 45,694 | 63,515 |
Total Common Stocks
(Cost $1,651,252) | | 141,388 |
| |
| | Number of
Rights | |
| Rights 0.0% ‡ |
| Independent Power and Renewable Electricity Producers 0.0% ‡ |
| Vistra Corp. | | |
| Expires 12/31/46 (c)(d)(h) | 57,684 | 68,644 |
Total Rights
(Cost $47,301) | | 68,644 |
| |
| | Number of
Warrants | |
| Warrants 0.0% ‡ |
| Capital Markets 0.0% ‡ |
| THAIHOT Investment Co. Ltd. | | |
| Expires 10/13/27 (c)(d)(h)(i) | 22 | 0 |
Total Warrants
(Cost $0) | | 0 |
| |
| | Principal
Amount | | Value |
| Short-Term Investments 6.4% |
| U.S. Treasury Debt 6.4% |
| U.S. Treasury Bills (j) | | | |
| 3.582%, due 1/3/23 | $ 29,687,000 | | $ 29,687,000 |
| 3.635%, due 1/24/23 | 9,309,000 | | 9,288,144 |
| 3.689%, due 1/17/23 | 6,541,000 | | 6,531,642 |
| 3.703%, due 1/10/23 | 7,859,000 | | 7,853,472 |
Total Short-Term Investments
(Cost $53,350,437) | | | 53,360,258 |
Total Investments
(Cost $890,304,331) | 99.9% | | 836,779,495 |
| Other Assets, Less Liabilities | 0.1 | | 618,822 |
| Net Assets | 100.0% | | $ 837,398,317 |
| † | Percentages indicated are based on Portfolio net assets. |
| ‡ | Less than one-tenth of a percent. |
| (a) | May be sold to institutional investors only under Rule 144A or securities offered pursuant to Section 4(a)(2) of the Securities Act of 1933, as amended. |
| (b) | Floating rate—Rate shown was the rate in effect as of December 31, 2022. |
| (c) | Illiquid security—As of December 31, 2022, the total market value deemed illiquid under procedures approved by the Board of Trustees was $9,876,618, which represented 1.2% of the Portfolio’s net assets. (Unaudited) |
| (d) | Security in which significant unobservable inputs (Level 3) were used in determining fair value. |
| (e) | PIK ("Payment-in-Kind")—issuer may pay interest or dividends with additional securities and/or in cash. |
| (f) | Issue in default. |
| (g) | Issue in non-accrual status. |
| (h) | Non-income producing security. |
| (i) | Less than $1. |
| (j) | Interest rate shown represents yield to maturity. |
The notes to the financial statements are an integral part of, and should be read in conjunction with, the financial statements.
| 34 | MainStay VP Floating Rate Portfolio |
Investments in Affiliates (in 000's)
Investments in issuers considered to be affiliate(s) of the Portfolio during the year ended December 31, 2022 for purposes of Section 2(a)(3) of the Investment Company Act of 1940, as amended, were as follows:
| Affiliated Investment Companies | Value,
Beginning
of Year | Purchases
at Cost | Proceeds
from
Sales | Net
Realized
Gain/(Loss)
on Sales | Change in
Unrealized
Appreciation/
(Depreciation) | Value,
End of
Year | Dividend
Income | Other
Distributions | Shares
End of
Year |
| MainStay MacKay High Yield Corporate Bond Fund Class I | $ 2,453 | $ — | $ — | $ — | $ (311) | $ 2,142 | $ 110 | $ — | 437 |
| Abbreviation(s): |
| CLO—Collateralized Loan Obligation |
| LIBOR—London Interbank Offered Rate |
| REIT—Real Estate Investment Trust |
| SOFR—Secured Overnight Financing Rate |
| TBD—To Be Determined |
| USD—United States Dollar |
The following is a summary of the fair valuations according to the inputs used as of December 31, 2022, for valuing the Portfolio’s assets:
| Description | Quoted
Prices in
Active
Markets for
Identical
Assets
(Level 1) | | Significant
Other
Observable
Inputs
(Level 2) | | Significant
Unobservable
Inputs
(Level 3) | | Total |
| Asset Valuation Inputs | | | | | | | |
| Investments in Securities (a) | | | | | | | |
| Long-Term Bonds | | | | | | | |
| Asset-Backed Securities | $ — | | $ 7,858,270 | | $ — | | $ 7,858,270 |
| Corporate Bonds | — | | 26,960,730 | | — | | 26,960,730 |
| Loan Assignments | — | | 744,314,927 | | 1,933,157 | | 746,248,084 |
| Total Long-Term Bonds | — | | 779,133,927 | | 1,933,157 | | 781,067,084 |
| Affiliated Investment Company | | | | | | | |
| Fixed Income Fund | 2,142,121 | | — | | — | | 2,142,121 |
| Common Stocks | — | | — | | 141,388 | | 141,388 |
| Rights | — | | — | | 68,644 | | 68,644 |
| Warrants (b) | — | | — | | 0 | | 0 |
| Short-Term Investments | | | | | | | |
| U.S. Treasury Debt | — | | 53,360,258 | | — | | 53,360,258 |
| Total Investments in Securities | $ 2,142,121 | | $ 832,494,185 | | $ 2,143,189 | | $ 836,779,495 |
| (a) | For a complete listing of investments and their industries, see the Portfolio of Investments. |
| (b) | Less than $1. |
The notes to the financial statements are an integral part of, and should be read in conjunction with, the financial statements.
35
Statement of Assets and Liabilities as of December 31, 2022
| Assets |
Investment in unaffiliated securities, at value
(identified cost $887,858,643) | $ 834,637,374 |
Investment in affiliated investment companies, at value
(identified cost $2,445,688) | 2,142,121 |
| Cash | 7,374,884 |
| Receivables: | |
| Interest | 3,163,374 |
| Portfolio shares sold | 707,931 |
| Investment securities sold | 82,534 |
| Other assets | 3,663 |
| Total assets | 848,111,881 |
| Liabilities |
| Unrealized depreciation on unfunded commitments (See Note 5) | 63,410 |
| Payables: | |
| Investment securities purchased | 9,663,785 |
| Manager (See Note 3) | 425,029 |
| Portfolio shares redeemed | 355,459 |
| NYLIFE Distributors (See Note 3) | 119,226 |
| Professional fees | 53,220 |
| Shareholder communication | 24,006 |
| Custodian | 4,429 |
| Accrued expenses | 5,000 |
| Total liabilities | 10,713,564 |
| Net assets | $ 837,398,317 |
| Composition of Net Assets |
| Shares of beneficial interest outstanding (par value of $.001 per share) unlimited number of shares authorized | $ 100,388 |
| Additional paid-in-capital | 938,323,170 |
| | 938,423,558 |
| Total distributable earnings (loss) | (101,025,241) |
| Net assets | $ 837,398,317 |
| Initial Class | |
| Net assets applicable to outstanding shares | $275,041,233 |
| Shares of beneficial interest outstanding | 32,989,269 |
| Net asset value per share outstanding | $ 8.34 |
| Service Class | |
| Net assets applicable to outstanding shares | $562,357,084 |
| Shares of beneficial interest outstanding | 67,398,491 |
| Net asset value per share outstanding | $ 8.34 |
The notes to the financial statements are an integral part of, and should be read in conjunction with, the financial statements.
| 36 | MainStay VP Floating Rate Portfolio |
Statement of Operations for the year ended December 31, 2022
| Investment Income (Loss) |
| Income | |
| Interest | $ 45,245,538 |
| Dividends-affiliated | 109,625 |
| Other | 446 |
| Total income | 45,355,609 |
| Expenses | |
| Manager (See Note 3) | 4,985,039 |
| Distribution/Service—Service Class (See Note 3) | 1,383,571 |
| Professional fees | 148,659 |
| Shareholder communication | 42,863 |
| Custodian | 30,099 |
| Trustees | 18,699 |
| Miscellaneous | 52,977 |
| Total expenses | 6,661,907 |
| Net investment income (loss) | 38,693,702 |
| Realized and Unrealized Gain (Loss) |
| Net realized gain (loss) on unaffiliated investments | (5,194,020) |
| Net change in unrealized appreciation (depreciation) on: | |
| Unaffiliated investments | (44,942,716) |
| Affiliated investments | (302,764) |
| Unfunded commitments | (67,546) |
| Net change in unrealized appreciation (depreciation) | (45,313,026) |
| Net realized and unrealized gain (loss) | (50,507,046) |
| Net increase (decrease) in net assets resulting from operations | $(11,813,344) |
The notes to the financial statements are an integral part of, and should be read in conjunction with, the financial statements.
37
Statements of Changes in Net Assets
for the years ended December 31, 2022 and December 31, 2021
| | 2022 | 2021 |
| Increase (Decrease) in Net Assets |
| Operations: | | |
| Net investment income (loss) | $ 38,693,702 | $ 22,927,243 |
| Net realized gain (loss) | (5,194,020) | (990,900) |
| Net change in unrealized appreciation (depreciation) | (45,313,026) | 3,758,344 |
| Net increase (decrease) in net assets resulting from operations | (11,813,344) | 25,694,687 |
| Distributions to shareholders: | | |
| Initial Class | (13,236,901) | (7,569,114) |
| Service Class | (25,226,121) | (15,125,910) |
| Total distributions to shareholders | (38,463,022) | (22,695,024) |
| Capital share transactions: | | |
| Net proceeds from sales of shares | 199,338,625 | 272,707,260 |
| Net asset value of shares issued to shareholders in reinvestment of distributions | 38,463,022 | 22,695,024 |
| Cost of shares redeemed | (183,816,446) | (103,761,021) |
| Increase (decrease) in net assets derived from capital share transactions | 53,985,201 | 191,641,263 |
| Net increase (decrease) in net assets | 3,708,835 | 194,640,926 |
| Net Assets |
| Beginning of year | 833,689,482 | 639,048,556 |
| End of year | $ 837,398,317 | $ 833,689,482 |
The notes to the financial statements are an integral part of, and should be read in conjunction with, the financial statements.
| 38 | MainStay VP Floating Rate Portfolio |
Financial Highlights selected per share data and ratios
| | Year Ended December 31, |
| Initial Class | 2022 | | 2021 | | 2020 | | 2019 | | 2018 |
| Net asset value at beginning of year | $ 8.86 | | $ 8.81 | | $ 8.93 | | $ 8.66 | | $ 9.08 |
| Net investment income (loss) (a) | 0.41 | | 0.28 | | 0.32 | | 0.44 | | 0.43 |
| Net realized and unrealized gain (loss) | (0.52) | | 0.05 | | (0.12) | | 0.27 | | (0.42) |
| Total from investment operations | (0.11) | | 0.33 | | 0.20 | | 0.71 | | 0.01 |
| Less distributions: | | | | | | | | | |
| From net investment income | (0.41) | | (0.28) | | (0.32) | | (0.44) | | (0.43) |
| Net asset value at end of year | $ 8.34 | | $ 8.86 | | $ 8.81 | | $ 8.93 | | $ 8.66 |
| Total investment return (b) | (1.25)% | | 3.76% | | 2.45% | | 8.48% | | (0.00)%‡(c) |
| Ratios (to average net assets)/Supplemental Data: | | | | | | | | | |
| Net investment income (loss) | 4.80% | | 3.23% | | 3.81% | | 4.98% | | 4.75% |
| Net expenses (d) | 0.64% | | 0.64% | | 0.65% | | 0.65% | | 0.65% |
| Portfolio turnover rate | 14% | | 29% | | 19% | | 35% | | 29% |
| Net assets at end of year (in 000's) | $ 275,041 | | $ 299,907 | | $ 142,403 | | $ 205,596 | | $ 187,285 |
| ‡ | Less than one-tenth of a percent. |
| (a) | Per share data based on average shares outstanding during the year. |
| (b) | Total return does not reflect any deduction of sales charges, mortality and expense charges, contract charges or administrative charges. For periods of less than one year, total return is not annualized. |
| (c) | Total investment return may reflect adjustments to conform to generally accepted accounting principles. |
| (d) | In addition to the fees and expenses which the Portfolio bears directly, it also indirectly bears a pro-rata share of the fees and expenses of the underlying funds in which it invests. Such indirect expenses are not included in the above expense ratios. |
| | Year Ended December 31, |
| Service Class | 2022 | | 2021 | | 2020 | | 2019 | | 2018 |
| Net asset value at beginning of year | $ 8.87 | | $ 8.82 | | $ 8.94 | | $ 8.67 | | $ 9.09 |
| Net investment income (loss) (a) | 0.39 | | 0.26 | | 0.30 | | 0.42 | | 0.41 |
| Net realized and unrealized gain (loss) | (0.53) | | 0.05 | | (0.12) | | 0.27 | | (0.42) |
| Total from investment operations | (0.14) | | 0.31 | | 0.18 | | 0.69 | | (0.01) |
| Less distributions: | | | | | | | | | |
| From net investment income | (0.39) | | (0.26) | | (0.30) | | (0.42) | | (0.41) |
| Net asset value at end of year | $ 8.34 | | $ 8.87 | | $ 8.82 | | $ 8.94 | | $ 8.67 |
| Total investment return (b) | (1.49)% | | 3.50% | | 2.20% | | 8.19% | | (0.25)%(c) |
| Ratios (to average net assets)/Supplemental Data: | | | | | | | | | |
| Net investment income (loss) | 4.59% | | 2.96% | | 3.50% | | 4.73% | | 4.52% |
| Net expenses (d) | 0.89% | | 0.89% | | 0.90% | | 0.90% | | 0.90% |
| Portfolio turnover rate | 14% | | 29% | | 19% | | 35% | | 29% |
| Net assets at end of year (in 000's) | $ 562,357 | | $ 533,782 | | $ 496,645 | | $ 579,419 | | $ 611,492 |
| (a) | Per share data based on average shares outstanding during the year. |
| (b) | Total return does not reflect any deduction of sales charges, mortality and expense charges, contract charges or administrative charges. For periods of less than one year, total return is not annualized. |
| (c) | Total investment return may reflect adjustments to conform to generally accepted accounting principles. |
| (d) | In addition to the fees and expenses which the Portfolio bears directly, it also indirectly bears a pro-rata share of the fees and expenses of the underlying funds in which it invests. Such indirect expenses are not included in the above expense ratios. |
The notes to the financial statements are an integral part of, and should be read in conjunction with, the financial statements.
39
7. An obligation rated ‘BBB’ by S& P is deemed by S&P to exhibit adequate protection parameters. In the opinion of S&P, however, adverse economic conditions or changing circumstances are more likely to lead to a weakened capacity of the obligor to meet its financial commitment on the obligation. When applied to Portfolio holdings, ratings are based solely on the creditworthiness of the bonds in the Portfolio and are not meant to represent the security or safety of the Portfolio.
8. An obligation rated ‘B’ by S& P is deemed by S&P to be more vulnerable to nonpayment than obligations rated ‘BB’, but in the opinion of S&P, the obligor currently has the capacity to meet its financial commitment on the obligation. It is the opinion of S&P that adverse business, financial, or economic conditions will likely impair the obligor's capacity or willingness to meet its financial commitment on the obligation. When applied to Portfolio holdings, ratings are based solely on the creditworthiness of the bonds in the Portfolio and are not meant to represent the security or safety of the Portfolio.
Notes to Financial Statements
Note 1–Organization and Business
MainStay VP Funds Trust (the “Fund”) was organized as a Delaware statutory trust on February 1, 2011. The Fund is registered under the Investment Company Act of 1940, as amended (the “1940 Act”), as an open-end management investment company. The Fund is comprised of thirty-one separate series (collectively referred to as the “Portfolios”). These financial statements and notes relate to the MainStay VP Floating Rate Portfolio (the "Portfolio"), a "non-diversified” portfolio, as that term is defined in the 1940 Act, as interpreted or modified by regulatory authorities having jurisdiction, from time to time. However, due to its principal investment strategies and investment processes, the Portfolio has historically operated as a "diversified" portfolio. Therefore, the Portfolio will not operate as "non-diversified" portfolio without first obtaining shareholder approval.
Shares of the Portfolio are currently offered to certain separate accounts to fund variable annuity policies and variable universal life insurance policies issued by New York Life Insurance and Annuity Corporation (“NYLIAC”), a wholly-owned subsidiary of New York Life Insurance Company (“New York Life”) and may also be offered to fund variable annuity policies and variable universal life insurance policies issued by other insurance companies. NYLIAC allocates shares of the Portfolio to, among others, certain NYLIAC separate accounts. Shares of the Portfolio are also offered to the MainStay VP Conservative Allocation Portfolio, MainStay VP Moderate Allocation Portfolio, MainStay VP Growth Allocation Portfolio and MainStay VP Equity Allocation Portfolio, which operate as “funds-of-funds," and other variable insurance funds.
The following table lists the Portfolio's share classes that have been registered and commenced operations:
| Class | Commenced Operations |
| Initial Class | May 2, 2005 |
| Service Class | May 2, 2005 |
Shares of the Portfolio are offered and are redeemed at a price equal to their respective net asset value (“NAV”) per share. No sales or redemption charge is applicable to the purchase or redemption of the Portfolio's shares. Under the terms of the Fund’s multiple class plan, adopted pursuant to Rule 18f-3 under the 1940 Act, the classes differ in that, among other things, Service Class shares of the Portfolio pay a combined distribution and service fee of 0.25% of average daily net assets attributable to Service Class shares of the Portfolio to the Distributor (as defined in Note 3(B)) pursuant to a plan adopted in accordance with Rule 12b-1 under the 1940 Act. Contract owners of variable annuity contracts purchased after June 2, 2003, are permitted to invest only in the Service Class shares.
The Portfolio's investment objective is to seek high current income.
Note 2–Significant Accounting Policies
The Portfolio is an investment company and accordingly follows the investment company accounting and reporting guidance of the Financial Accounting Standards Board (“FASB”) Accounting Standards Codification Topic 946 Financial Services—Investment Companies. The Portfolio prepares its financial statements in accordance with generally accepted accounting principles (“GAAP”) in the United States of America and follows the significant accounting policies described below.
(A) Securities Valuation. Investments are usually valued as of the close of regular trading on the New York Stock Exchange (the "Exchange") (usually 4:00 p.m. Eastern time) on each day the Portfolio is open for business ("valuation date").
Effective September 8, 2022, and pursuant to Rule 2a-5 under the 1940 Act, the Board of Trustees of the Fund (the "Board") designated New York Life Investment Management LLC (“New York Life Investments” or the "Manager") as its Valuation Designee (the "Valuation Designee"). The Valuation Designee is responsible for performing fair valuations relating to all investments in the Portfolio’s portfolio for which market quotations are not readily available; periodically assessing and managing material valuation risks; establishing and applying fair value methodologies; testing fair valuation methodologies; evaluating and overseeing pricing services; ensuring appropriate segregation of valuation and portfolio management functions; providing quarterly, annual and prompt reporting to the Board, as appropriate; identifying potential conflicts of interest; and maintaining appropriate records. The Valuation Designee has established a valuation committee ("Valuation Committee") to assist in carrying out the Valuation Designee’s responsibilities and establish prices of securities for which market quotations are not readily available. The Portfolio’s and the Valuation Designee's policies and procedures ("Valuation Procedures") govern the Valuation Designee’s selection and application of methodologies for determining and calculating the fair value of Portfolio investments. The Valuation Designee may value the Portfolio's portfolio securities for which market quotations are not readily available and other Portfolio assets utilizing inputs from pricing services and other third-party sources (together, “Pricing Sources”). The Valuation Committee meets (in person, via electronic mail or via teleconference) on an ad-hoc basis to determine fair valuations and on a quarterly basis to review fair value events with respect to certain securities for which market quotations are not readily available, including valuation risks and back-testing results, and preview reports to the Board.
The Valuation Committee establishes prices of securities for which market quotations are not readily available based on such methodologies and measurements on a regular basis after considering information that is reasonably available and deemed relevant by the Valuation Committee. The Board shall oversee the Valuation Designee and review fair valuation materials on a prompt, quarterly and annual basis and approve proposed revisions to the Valuation Procedures.
Investments for which market quotations are not readily available are valued at fair value as determined in good faith pursuant to the Valuation
| 40 | MainStay VP Floating Rate Portfolio |
Procedures. A market quotation is readily available only when that quotation is a quoted price (unadjusted) in active markets for identical investments that the Portfolio can access at the measurement date, provided that a quotation will not be readily available if it is not reliable. "Fair value" is defined as the price the Portfolio would reasonably expect to receive upon selling an asset or liability in an orderly transaction to an independent buyer in the principal or most advantageous market for the asset or liability. Fair value measurements are determined within a framework that establishes a three-tier hierarchy that maximizes the use of observable market data and minimizes the use of unobservable inputs to establish a classification of fair value measurements for disclosure purposes. "Inputs" refer broadly to the assumptions that market participants would use in pricing the asset or liability, including assumptions about risk, such as the risk inherent in a particular valuation technique used to measure fair value using a pricing model and/or the risk inherent in the inputs for the valuation technique. Inputs may be observable or unobservable. Observable inputs reflect the assumptions market participants would use in pricing the asset or liability based on market data obtained from sources independent of the Portfolio. Unobservable inputs reflect the Portfolio’s own assumptions about the assumptions market participants would use in pricing the asset or liability based on the information available. The inputs or methodology used for valuing assets or liabilities may not be an indication of the risks associated with investing in those assets or liabilities. The three-tier hierarchy of inputs is summarized below.
| • | Level 1—quoted prices (unadjusted) in active markets for an identical asset or liability |
| • | Level 2—other significant observable inputs (including quoted prices for a similar asset or liability in active markets, interest rates and yield curves, prepayment speeds, credit risk, etc.) |
| • | Level 3—significant unobservable inputs (including the Portfolio's own assumptions about the assumptions that market participants would use in measuring fair value of an asset or liability) |
The level of an asset or liability within the fair value hierarchy is based on the lowest level of an input, both individually and in the aggregate, that is significant to the fair value measurement. The aggregate value by input level of the Portfolio’s assets and liabilities as of December 31, 2022, is included at the end of the Portfolio of Investments.
The Portfolio may use third-party vendor evaluations, whose prices may be derived from one or more of the following standard inputs, among others:
| • Benchmark yields | • Reported trades |
| • Broker/dealer quotes | • Issuer spreads |
| • Two-sided markets | • Benchmark securities |
| • Bids/offers | • Reference data (corporate actions or material event notices) |
| • Industry and economic events | • Comparable bonds |
| • Monthly payment information | |
An asset or liability for which a market quotation is not readily available is valued by methods deemed reasonable in good faith by the Valuation Committee, following the Valuation Procedures to represent fair value. Under these procedures, the Valuation Designee generally uses a market-based approach which may use related or comparable assets or liabilities, recent transactions, market multiples, book values and other relevant information. The Valuation Designee may also use an income-based valuation approach in which the anticipated future cash flows of the asset or liability are discounted to calculate fair value. Discounts may also be applied due to the nature and/or duration of any restrictions on the disposition of the asset or liability. Fair value represents a good faith approximation of the value of a security. Fair value determinations involve the consideration of a number of subjective factors, an analysis of applicable facts and circumstances and the exercise of judgment. As a result, it is possible that the fair value for a security determined in good faith in accordance with the Valuation Procedures may differ from valuations for the same security determined for other funds using their own valuation procedures. Although the Valuation Procedures are designed to value a security at the price the Portfolio may reasonably expect to receive upon the security's sale in an orderly transaction, there can be no assurance that any fair value determination thereunder would, in fact, approximate the amount that the Portfolio would actually realize upon the sale of the security or the price at which the security would trade if a reliable market price were readily available. During the year ended December 31, 2022, there were no material changes to the fair value methodologies.
Securities which may be valued in this manner include, but are not limited to: (i) a security for which trading has been halted or suspended or otherwise does not have a readily available market quotation on a given day; (ii) a debt security that has recently gone into default and for which there is not a current market quotation; (iii) a security of an issuer that has entered into a restructuring; (iv) a security that has been delisted from a national exchange; (v) a security subject to trading collars for which no or limited trading takes place; and (vi) a security whose principal market has been temporarily closed at a time when, under normal conditions, it would be open. Securities valued in this manner are generally categorized as Level 2 or 3 in the hierarchy.
Equity securities, rights and warrants are valued at the last quoted sales prices as of the close of regular trading on the relevant exchange on each valuation date. Securities that are not traded on the valuation date are valued at the mean of the last quoted bid and ask prices. Prices are normally taken from the principal market in which each security trades. These securities are generally categorized as Level 1 in the hierarchy.
Investments in mutual funds, including money market funds, are valued at their respective NAVs at the close of business each day on the valuation date. These securities are generally categorized as Level 1 in the hierarchy.
Debt securities (other than convertible and municipal bonds) are valued at the evaluated bid prices (evaluated mean prices in the case of convertible and municipal bonds) supplied by a pricing agent or broker selected by
Notes to Financial Statements (continued)
the Valuation Designee, in consultation with the Subadvisor. The evaluations are market-based measurements processed through a pricing application and represents the pricing agent’s good faith determination as to what a holder may receive in an orderly transaction under market conditions. The rules-based logic utilizes valuation techniques that reflect participants’ assumptions and vary by asset class and per methodology, maximizing the use of relevant observable data including quoted prices for similar assets, benchmark yield curves and market corroborated inputs. The evaluated bid or mean prices are deemed by the Valuation Designee, in consultation with the Subadvisor, to be representative of market values at the regular close of trading of the Exchange on each valuation date. Debt securities purchased on a delayed delivery basis are marked to market daily until settlement at the forward settlement date. Debt securities, including corporate bonds, U.S. government and federal agency bonds, municipal bonds, foreign bonds, convertible bonds, asset-backed securities and mortgage-backed securities are generally categorized as Level 2 in the hierarchy.
Loan assignments, participations and commitments are valued at the average of bid quotations obtained from the engaged independent pricing service and are generally categorized as Level 2 in the hierarchy. Certain loan assignments, participations and commitments may be valued by utilizing significant unobservable inputs obtained from the pricing service and are generally categorized as Level 3 in the hierarchy. As of December 31, 2022, securities that were fair valued in such a manner are shown in the Portfolio of Investments.
Temporary cash investments acquired in excess of 60 days to maturity at the time of purchase are valued using the latest bid prices or using valuations based on a matrix system (which considers such factors as security prices, yields, maturities and ratings), both as furnished by independent pricing services. Temporary cash investments that mature in 60 days or less at the time of purchase ("Short-Term Investments") are valued using the amortized cost method of valuation, unless the use of such method would be inappropriate. The amortized cost method involves valuing a security at its cost on the date of purchase and thereafter assuming a constant amortization to maturity of the difference between such cost and the value on maturity date. Amortized cost approximates the current fair value of a security. Securities valued using the amortized cost method are not valued using quoted prices in an active market and are generally categorized as Level 2 in the hierarchy.
The information above is not intended to reflect an exhaustive list of the methodologies that may be used to value portfolio investments. The Valuation Procedures permit the use of a variety of valuation methodologies in connection with valuing portfolio investments. The methodology used for a specific type of investment may vary based on the market data available or other considerations. The methodologies summarized above may not represent the specific means by which portfolio investments are valued on any particular business day.
A portfolio investment may be classified as an illiquid investment under the Portfolio's written liquidity risk management program and related procedures (“Liquidity Program”). Illiquidity of an investment might
prevent the sale of such investment at a time when the Manager or the Subadvisor might wish to sell, and these investments could have the effect of decreasing the overall level of the Portfolio's liquidity. Further, the lack of an established secondary market may make it more difficult to value illiquid investments, requiring the Portfolio to rely on judgments that may be somewhat subjective in measuring value, which could vary materially from the amount that the Portfolio could realize upon disposition. Difficulty in selling illiquid investments may result in a loss or may be costly to the Portfolio. An illiquid investment is any investment that the Manager or Subadvisor reasonably expects cannot be sold or disposed of in current market conditions in seven calendar days or less without the sale or disposition significantly changing the market value of the investment. The liquidity classification of each investment will be made using information obtained after reasonable inquiry and taking into account, among other things, relevant market, trading and investment-specific considerations in accordance with the Liquidity Program. Illiquid investments are often fair valued in accordance with the Portfolio's procedures described above. The liquidity of the Portfolio's investments was determined as of December 31, 2022, and can change at any time. Illiquid investments as of December 31, 2022, are shown in the Portfolio of Investments.
(B) Income Taxes. The Portfolio's policy is to comply with the requirements of the Internal Revenue Code of 1986, as amended (the “Internal Revenue Code”), applicable to regulated investment companies and to distribute all of its taxable income to the shareholders of the Portfolio within the allowable time limits.
The Manager evaluates the Portfolio’s tax positions to determine if the tax positions taken meet the minimum recognition threshold in connection with accounting for uncertainties in income tax positions taken or expected to be taken for the purposes of measuring and recognizing tax liabilities in the financial statements. Recognition of tax benefits of an uncertain tax position is permitted only to the extent the position is “more likely than not” to be sustained assuming examination by taxing authorities. The Manager analyzed the Portfolio's tax positions taken on federal, state and local income tax returns for all open tax years (for up to three tax years) and has concluded that no provisions for federal, state and local income tax are required in the Portfolio's financial statements. The Portfolio's federal, state and local income tax and federal excise tax returns for tax years for which the applicable statutes of limitations have not expired are subject to examination by the Internal Revenue Service and state and local departments of revenue.
(C) Dividends and Distributions to Shareholders. Dividends and distributions are recorded on the ex-dividend date. The Portfolio intends to declare dividends from net investment income, if any, daily and intends to pay them at least monthly and distributions from net realized capital and currency gains, if any, at least annually. All dividends and distributions are reinvested at NAV in the same class of shares of the Portfolio. Dividends and distributions to shareholders are determined in accordance with federal income tax regulations and may differ from determinations using GAAP.
| 42 | MainStay VP Floating Rate Portfolio |
(D) Security Transactions and Investment Income. The Portfolio records security transactions on the trade date. Realized gains and losses on security transactions are determined using the identified cost method. Dividend income is recognized on the ex-dividend date, net of any foreign tax withheld at the source, and interest income is accrued as earned using the effective interest rate method. Distributions received from real estate investment trusts may be classified as dividends, capital gains and/or return of capital. Discounts and premiums on securities purchased for the Portfolio are accreted and amortized, respectively, on the effective interest rate method.
Investment income and realized and unrealized gains and losses on investments of the Portfolio are allocated pro rata to the separate classes of shares based upon their relative net assets on the date the income is earned or realized and unrealized gains and losses are incurred.
The Portfolio may place a debt security on non-accrual status and reduce related interest income by ceasing current accruals and writing off all or a portion of any interest receivables when the collection of all or a portion of such interest has become doubtful. A debt security is removed from non-accrual status when the issuer resumes interest payments or when collectability of interest is reasonably assured.
(E) Expenses. Expenses of the Fund are allocated to the individual Portfolios in proportion to the net assets of the respective Portfolios when the expenses are incurred, except where direct allocations of expenses can be made. Expenses (other than fees incurred under the distribution and service plans, further discussed in Note 3(B), which are charged directly to the Service Class shares) are allocated to separate classes of shares pro rata based upon their relative net assets on the date the expenses are incurred. The expenses borne by the Portfolio, including those of related parties to the Portfolio, are shown in the Statement of Operations.
Additionally, the Portfolio may invest in mutual funds, which are subject to management fees and other fees that may cause the costs of investing in mutual funds to be greater than the costs of owning the underlying securities directly. These indirect expenses of mutual funds are not included in the amounts shown as expenses in the Statement of Operations or in the expense ratios included in the Financial Highlights.
(F) Use of Estimates. In preparing financial statements in conformity with GAAP, the Manager makes estimates and assumptions that affect the reported amounts and disclosures in the financial statements. Actual results could differ from those estimates and assumptions.
(G) Loan Assignments, Participations and Commitments. The Portfolio may invest in loan assignments and participations ("loans"). Commitments are agreements to make money available to a borrower in a specified amount, at a specified rate and within a specified time. The Portfolio records an investment when the borrower withdraws money on a commitment or when a funded loan is purchased (trade date) and records interest as earned. These loans pay interest at rates that are periodically reset by reference to a base lending rate plus a spread. These base lending rates are generally the prime rate offered by a designated U.S.
bank, the London Interbank Offered Rate ("LIBOR") or an alternative reference rate.
The loans in which the Portfolio may invest are generally readily marketable, but may be subject to some restrictions on resale. For example, the Portfolio may be contractually obligated to receive approval from the agent bank and/or borrower prior to the sale of these investments. If the Portfolio purchases an assignment from a lender, the Portfolio will generally have direct contractual rights against the borrower in favor of the lender. If the Portfolio purchases a participation interest either from a lender or a participant, the Portfolio typically will have established a direct contractual relationship with the seller of the participation interest, but not with the borrower. Consequently, the Portfolio is subject to the credit risk of the lender or participant who sold the participation interest to the Portfolio, in addition to the usual credit risk of the borrower. In the event that the borrower, selling participant or intermediate participants become insolvent or enter into bankruptcy, the Portfolio may incur certain costs and delays in realizing payment, or may suffer a loss of principal and/or interest.
Unfunded commitments represent the remaining obligation of the Portfolio to the borrower. At any point in time, up to the maturity date of the issue, the borrower may demand the unfunded portion. Unfunded amounts, if any, are marked to market and any unrealized gains or losses are recorded in the Statement of Assets and Liabilities. As of December 31, 2022, the Portfolio held unfunded commitments. (See Note 5).
(H) Rights and Warrants. Rights are certificates that permit the holder to purchase a certain number of shares, or a fractional share, of a new stock from the issuer at a specific price. Warrants are instruments that entitle the holder to buy an equity security at a specific price for a specific period of time. These investments can provide a greater potential for profit or loss than an equivalent investment in the underlying security. Prices of these investments do not necessarily move in tandem with the prices of the underlying securities.
There is risk involved in the purchase of rights and warrants in that these investments are speculative investments. The Portfolio could also lose the entire value of its investment in warrants if such warrants are not exercised by the date of its expiration. The Portfolio is exposed to risk until the sale or exercise of each right or warrant is completed. Rights and Warrants as of December 31, 2022 are shown in the Portfolio of Investments.
(I) Debt Securities Risk. The ability of issuers of debt securities held by the Portfolio to meet their obligations may be affected by, among other things, economic or political developments in a specific country, industry or region. Debt securities are also subject to the risks associated with changes in interest rates.
The Portfolio’s principal investments include floating rate loans, which are usually rated below investment grade and are generally considered speculative because they present a greater risk of loss, including default, than higher rated debt securities. These investments pay investors a higher interest rate than investment grade debt securities because of the
Notes to Financial Statements (continued)
increased risk of loss. Although certain floating rate loans are collateralized, there is no guarantee that the value of the collateral will be sufficient to repay the loan. In a recession or serious credit event, the value of these investments could decline significantly. As a result, the Portfolio’s NAVs could decrease and you could lose money.
In addition, floating rate loans generally are subject to extended settlement periods that may be longer than seven days. As a result, the Portfolio may be adversely affected by selling other investments at an unfavorable time and/or under unfavorable conditions or engaging in borrowing transactions, such as borrowing against its credit facility, to raise cash to meet redemption obligations or pursue other investment opportunities.
In certain circumstances, floating rate loans may not be deemed to be securities. As a result, the Portfolio may not have the protection of the anti-fraud provisions of the federal securities laws. In such cases, the Portfolio generally must rely on the contractual provisions in the loan agreement and common-law fraud protections under applicable state law.
The Portfolio may invest in foreign debt securities, which carry certain risks that are in addition to the usual risks inherent in domestic debt securities. These risks include those resulting from currency fluctuations, future adverse political or economic developments and possible imposition of currency exchange blockages or other foreign governmental laws or restrictions. These risks are likely to be greater in emerging markets than in developed markets.
(J) LIBOR Replacement Risk. The Portfolio may invest in certain debt securities, derivatives or other financial instruments that utilize LIBOR, as a “benchmark” or “reference rate” for various interest rate calculations. As of January 1, 2022, the United Kingdom Financial Conduct Authority, which regulates LIBOR, ceased its active encouragement of banks to provide the quotations needed to sustain most LIBOR rates due to the absence of an active market for interbank unsecured lending and other reasons. However, the United Kingdom Financial Conduct Authority, the LIBOR administrator and other regulators announced that the most widely used tenors of U.S. dollar LIBOR will continue until mid-2023. As a result, it is anticipated that the remaining LIBOR settings will be discontinued or will no longer be sufficiently robust to be representative of its underlying market around that time. Various financial industry groups will plan for that transition and certain regulators and industry groups have taken actions to establish alternative reference rates (e.g., the Secured Overnight Financing Rate, which measures the cost of overnight borrowings through repurchase agreement transactions collateralized with U.S. Treasury securities and is intended to replace U.S. dollar LIBOR with certain adjustments). However, there are challenges to converting certain contracts and transactions to a new benchmark and neither the full effects of the transition process nor its ultimate outcome is known.
The elimination of LIBOR or changes to other reference rates or any other changes or reforms to the determination or supervision of reference rates could have an adverse impact on the market for, or value of, any
securities or payments linked to those reference rates, which may adversely affect the Portfolio's performance and/or net asset value. Uncertainty and risk also remain regarding the willingness and ability of issuers and lenders to include enhanced provisions in new and existing contracts or instruments. Consequently, the transition away from LIBOR to other reference rates may lead to increased volatility and illiquidity in markets that are tied to LIBOR, fluctuations in values of LIBOR-related investments or investments in issuers that utilize LIBOR, increased difficulty in borrowing or refinancing and diminished effectiveness of hedging strategies, adversely affecting the Portfolio's performance. Furthermore, the risks associated with the expected discontinuation of LIBOR and transition may be exacerbated if the work necessary to effect an orderly transition to an alternative reference rate is not completed in a timely manner. While the transition away from LIBOR has already begun with no material adverse effect to the Portfolio's performance, the transition is expected to last through mid-2023 for some LIBOR tenors. The usefulness of LIBOR as a benchmark could deteriorate anytime during this transition period.
(K) Indemnifications. Under the Fund’s organizational documents, its officers and trustees are indemnified against certain liabilities that may arise out of performance of their duties to the Fund. Additionally, in the normal course of business, the Portfolio enters into contracts with third-party service providers that contain a variety of representations and warranties and that may provide general indemnifications. The Portfolio's maximum exposure under these arrangements is unknown, as this would involve future claims that may be made against the Portfolio that have not yet occurred. The Manager believes that the risk of loss in connection with these potential indemnification obligations is remote. However, there can be no assurance that material liabilities related to such obligations will not arise in the future, which could adversely impact the Portfolio.
Note 3–Fees and Related Party Transactions
(A) Manager and Subadvisor. New York Life Investments, a registered investment adviser and an indirect, wholly-owned subsidiary of New York Life, serves as the Portfolio's Manager pursuant to an Amended and Restated Management Agreement ("Management Agreement"). The Manager provides offices, conducts clerical, recordkeeping and bookkeeping services and keeps most of the financial and accounting records required to be maintained by the Portfolio. Except for the portion of salaries and expenses that are the responsibility of the Portfolio, the Manager pays the salaries and expenses of all personnel affiliated with the Portfolio and certain operational expenses of the Portfolio. During a portion of the year ended December 31, 2022, the Portfolio reimbursed New York Life Investments in an amount equal to the portion of the compensation of the Chief Compliance Officer attributable to the Portfolio. NYL Investors LLC ("NYL Investors" or ''Subadvisor''), a registered investment adviser and a direct, wholly-owned subsidiary of New York Life, serves as the Subadvisor to the Portfolio and is responsible for the day-to-day portfolio management of the Portfolio. Pursuant to the terms
| 44 | MainStay VP Floating Rate Portfolio |
of a Subadvisory Agreement between New York Life Investments and NYL Investors, New York Life Investments pays for the services of the Subadvisor.
Pursuant to the Management Agreement, the Fund pays the Manager, on behalf of the Portfolio, a monthly fee for the services performed and the facilities furnished at an annual rate of the Portfolio's average daily net assets as follows: 0.60% up to $1 billion; 0.575% from $1 billion to $3 billion; and 0.565% in excess of $3 billion. During the year ended December 31, 2022, the effective management fee rate was 0.60%.
During the year ended December 31, 2022, New York Life Investments earned fees from the Portfolio in the amount of $4,985,039 and paid the Subadvisor fees of $2,492,539.
JPMorgan Chase Bank, N.A. ("JPMorgan") provides sub-administration and sub-accounting services to the Portfolio pursuant to an agreement with New York Life Investments. These services include calculating the daily NAVs of the Portfolio, maintaining the general ledger and sub-ledger accounts for the calculation of the Portfolio's NAVs, and assisting New York Life Investments in conducting various aspects of the Portfolio's administrative operations. For providing these services to the Portfolio, JPMorgan is compensated by New York Life Investments.
Pursuant to an agreement between the Fund and New York Life Investments, New York Life Investments is responsible for providing or procuring certain regulatory reporting services for the Portfolio. The Portfolio will reimburse New York Life Investments for the actual costs incurred by New York Life Investments in connection with providing or procuring these services for the Portfolio.
(B) Distribution and Service Fees. The Fund, on behalf of the Portfolio, has entered into a distribution agreement with NYLIFE Distributors LLC (the “Distributor”), an affiliate of New York Life Investments. The Portfolio has adopted a distribution plan (the “Plan”) in accordance with the provisions of Rule 12b-1 under the 1940 Act. Under the Plan, the Distributor has agreed to provide, through its affiliates or independent third parties, various distribution-related, shareholder and administrative support services to the Service Class shareholders. For its services, the Distributor is entitled to a combined distribution and service fee accrued daily and paid monthly at an annual rate of 0.25% of the average daily net assets attributable to the Service Class shares of the Portfolio.
Note 4-Federal Income Tax
As of December 31, 2022, the cost and unrealized appreciation (depreciation) of the Portfolio’s investment portfolio, including applicable derivative contracts and other financial instruments, as determined on a federal income tax basis, were as follows:
| | Federal Tax
Cost | Gross
Unrealized
Appreciation | Gross
Unrealized
(Depreciation) | Net
Unrealized
Appreciation/
(Depreciation) |
| Investments in Securities | $890,355,829 | $849,852 | $(54,426,186) | $(53,576,334) |
As of December 31, 2022, the components of accumulated gain (loss) on a tax basis were as follows:
Ordinary
Income | Accumulated
Capital
and Other
Gain (Loss) | Other
Temporary
Differences | Unrealized
Appreciation
(Depreciation) | Total
Accumulated
Gain (Loss) |
| $1,650,218 | $(48,495,087) | $(540,629) | $(53,639,743) | $(101,025,241) |
The difference between book-basis and tax-basis unrealized appreciation (depreciation) is primarily due to cumulative bond amortization. The other temporary difference is primarily due to interest accrual on defaulted securities.
The following table discloses the current year reclassifications between total distributable earnings (loss) and additional paid-in capital arising from permanent differences; net assets as of December 31, 2022 were not affected.
| | Total
Distributable
Earnings (Loss) | Additional
Paid-In
Capital |
| | $35,530 | $(35,530) |
The reclassifications for the Portfolio are primarily due to partnership adjustments.
As of December 31, 2022, for federal income tax purposes, capital loss carryforwards of $48,495,087, as shown in the table below, were available to the extent provided by the regulations to offset future realized gains of the Portfolio. Accordingly, no capital gains distributions are expected to be paid to shareholders until net gains have been realized in excess of such amounts.
Capital Loss
Available Through | Short-Term
Capital Loss
Amounts (000’s) | Long-Term
Capital Loss
Amounts (000’s) |
| Unlimited | $4,593 | $43,902 |
Notes to Financial Statements (continued)
During the years ended December 31, 2022 and December 31, 2021, the tax character of distributions paid as reflected in the Statements of Changes in Net Assets was as follows:
| | 2022 | 2021 |
| Distributions paid from: | | |
| Ordinary Income | $38,463,022 | $22,695,024 |
Note 5–Commitments and Contingencies
As of December 31, 2022, the Portfolio had unfunded commitments pursuant to the following loan agreements:
| Borrower | Unfunded
Commitments | Unrealized
Appreciation/
(Depreciation) |
athenahealth Group, Inc.,
Initial Delayed Draw Term Loan
3.50%, due 2/15/29 | $489,357 | $(54,121) |
Hillman Group, Inc. (The),
Initial Delayed Draw Term Loan
2.75%, due 7/14/28 | 115,413 | (3,631) |
Pediatric Associates Holding Co. LLC,
Amendment No. 1 Incremental Delayed Draw Term Loan
3.25%, due 12/29/28 | 99,605 | (5,658) |
| Total | $704,375 | $(63,410) |
Commitments are available until maturity date.
Note 6–Custodian
JPMorgan is the custodian of cash and securities held by the Portfolio. Custodial fees are charged to the Portfolio based on the Portfolio's net assets and/or the market value of securities held by the Portfolio and the number of certain transactions incurred by the Portfolio.
Note 7–Line of Credit
The Portfolio and certain other funds managed by New York Life Investments maintain a line of credit with a syndicate of banks in order to secure a source of funds for temporary purposes to meet unanticipated or excessive redemption requests.
Effective July 26, 2022, under the credit agreement (the “Credit Agreement”), the aggregate commitment amount is $600,000,000 with an additional uncommitted amount of $100,000,000. The commitment fee is an annual rate of 0.15% of the average commitment amount payable quarterly, regardless of usage, to JPMorgan, who serves as the agent to the syndicate. The commitment fee is allocated among the Portfolio and certain other funds managed by New York Life Investments based upon their respective net assets and other factors. Interest on any revolving credit loan is charged based upon the Federal Funds Rate, Daily Simple Secured Overnight Financing Rate ("SOFR") + 0.10%, or the Overnight Bank Funding Rate, whichever is higher. The Credit Agreement expires on July 25, 2023, although the Portfolio, certain other funds
managed by New York Life Investments and the syndicate of banks may renew the Credit Agreement for an additional year on the same or different terms or enter into a credit agreement with a different syndicate of banks. Prior to July 26, 2022, the aggregate commitment amount and the commitment fee were the same as those under the current Credit Agreement. During the year ended December 31, 2022, there were no borrowings made or outstanding with respect to the Portfolio under the Credit Agreement.
Note 8–Interfund Lending Program
Pursuant to an exemptive order issued by the SEC, the Portfolio, along with certain other funds managed by New York Life Investments, may participate in an interfund lending program. The interfund lending program provides an alternative credit facility that permits the Portfolio and certain other funds managed by New York Life Investments to lend or borrow money for temporary purposes directly to or from one another, subject to the conditions of the exemptive order. During the year ended December 31, 2022, there were no interfund loans made or outstanding with respect to the Portfolio.
Note 9–Purchases and Sales of Securities (in 000’s)
During the year ended December 31, 2022, purchases and sales of securities, other than short-term securities, were $135,953 and $112,527, respectively.
Note 10–Capital Share Transactions
Transactions in capital shares for the years ended December 31, 2022 and December 31, 2021, were as follows:
| Initial Class | Shares | Amount |
| Year ended December 31, 2022: | | |
| Shares sold | 4,045,382 | $ 33,987,205 |
| Shares issued to shareholders in reinvestment of distributions | 1,567,085 | 13,236,901 |
| Shares redeemed | (6,486,710) | (55,381,284) |
| Net increase (decrease) | (874,243) | $ (8,157,178) |
| Year ended December 31, 2021: | | |
| Shares sold | 19,774,894 | $ 175,476,548 |
| Shares issued to shareholders in reinvestment of distributions | 853,852 | 7,569,114 |
| Shares redeemed | (2,924,924) | (25,956,012) |
| Net increase (decrease) | 17,703,822 | $ 157,089,650 |
| |
| 46 | MainStay VP Floating Rate Portfolio |
| Service Class | Shares | Amount |
| Year ended December 31, 2022: | | |
| Shares sold | 19,272,966 | $ 165,351,420 |
| Shares issued to shareholders in reinvestment of distributions | 2,987,184 | 25,226,121 |
| Shares redeemed | (15,071,415) | (128,435,162) |
| Net increase (decrease) | 7,188,735 | $ 62,142,379 |
| Year ended December 31, 2021: | | |
| Shares sold | 10,956,996 | $ 97,230,712 |
| Shares issued to shareholders in reinvestment of distributions | 1,704,919 | 15,125,910 |
| Shares redeemed | (8,766,498) | (77,805,009) |
| Net increase (decrease) | 3,895,417 | $ 34,551,613 |
Note 11–Other Matters
As of the date of this report, interest rates in the United States and many parts of the world, including certain European countries, are ascending from historically low levels. Thus, the Portfolio currently faces a heightened level of risk associated with rising interest rates. This could be driven by a variety of factors, including but not limited to central bank monetary policies, changing inflation or real growth rates, general economic conditions, increasing bond issuances or reduced market demand for low yielding investments.
An outbreak of COVID-19, first detected in December 2019, has developed into a global pandemic and has resulted in travel restrictions, closure of international borders, certain businesses and securities markets, restrictions on securities trading activities, prolonged quarantines, supply chain disruptions, and lower consumer demand, as well as general concern and uncertainty. In 2022, many countries lifted some or all restrictions related to COVID-19. However, the continued impact of COVID-19 and related variants is uncertain and could further adversely affect the global economy, national economies, individual issuers and capital markets in unforeseeable ways and result in a substantial and extended economic downturn. Developments that disrupt global economies and financial markets, such as COVID-19, may magnify factors that affect the Portfolio's performance.
Note 12–Subsequent Events
In connection with the preparation of the financial statements of the Portfolio as of and for the year ended December 31, 2022, events and transactions subsequent to December 31, 2022, through the date the financial statements were issued have been evaluated by the Manager for possible adjustment and/or disclosure. No subsequent events requiring financial statement adjustment or disclosure have been identified.
Report of Independent Registered Public Accounting Firm
To the Board of Trustees of MainStay VP Funds Trust and Shareholders of
MainStay VP Floating Rate Portfolio
Opinion on the Financial Statements
We have audited the accompanying statement of assets and liabilities, including the portfolio of investments, of MainStay VP Floating Rate Portfolio (one of the portfolios constituting MainStay VP Funds Trust, referred to hereafter as the “Portfolio”) as of December 31, 2022, the related statement of operations for the year ended December 31, 2022, the statements of changes in net assets for each of the two years in the period ended December 31, 2022, including the related notes, and the financial highlights for each of the five years in the period ended December 31, 2022 (collectively referred to as the “financial statements”). In our opinion, the financial statements present fairly, in all material respects, the financial position of the Portfolio as of December 31, 2022, the results of its operations for the year then ended, the changes in its net assets for each of the two years in the period ended December 31, 2022 and the financial highlights for each of the five years in the period ended December 31, 2022 in conformity with accounting principles generally accepted in the United States of America.
Basis for Opinion
These financial statements are the responsibility of the Portfolio’s management. Our responsibility is to express an opinion on the Portfolio’s financial statements based on our audits. We are a public accounting firm registered with the Public Company Accounting Oversight Board (United States) (PCAOB) and are required to be independent with respect to the Portfolio in accordance with the U.S. federal securities laws and the applicable rules and regulations of the Securities and Exchange Commission and the PCAOB.
We conducted our audits of these financial statements in accordance with the standards of the PCAOB. Those standards require that we plan and perform the audit to obtain reasonable assurance about whether the financial statements are free of material misstatement, whether due to error or fraud.
Our audits included performing procedures to assess the risks of material misstatement of the financial statements, whether due to error or fraud, and performing procedures that respond to those risks. Such procedures included examining, on a test basis, evidence regarding the amounts and disclosures in the financial statements. Our audits also included evaluating the accounting principles used and significant estimates made by management, as well as evaluating the overall presentation of the financial statements. Our procedures included confirmation of securities owned as of December 31, 2022 by correspondence with the custodians, transfer agent, agent banks and brokers; when replies were not received from brokers, we performed other auditing procedures. We believe that our audits provide a reasonable basis for our opinion.
/s/PricewaterhouseCoopers LLP
New York, New York
February 24, 2023
We have served as the auditor of one or more investment companies in the MainStay group of funds since 1984.
| 48 | MainStay VP Floating Rate Portfolio |
Board Consideration and Approval of Management Agreement and Subadvisory Agreement (Unaudited)
The continuation of the Management Agreement with respect to the MainStay VP Floating Rate Portfolio (“Portfolio”) and New York Life Investment Management LLC (“New York Life Investments”) and the Subadvisory Agreement between New York Life Investments and NYL Investors LLC (“NYL Investors”) with respect to the Portfolio (together, “Advisory Agreements”) is subject to annual review and approval by the Board of Trustees of MainStay VP Funds Trust (“Board” of the “Trust”) in accordance with Section 15 of the Investment Company Act of 1940, as amended (“1940 Act”). At its December 6–7, 2022 meeting, the Board, which is comprised solely of Trustees who are not an “interested person” (as such term is defined in the 1940 Act) of the Trust (“Independent Trustees”), unanimously approved the continuation of each of the Advisory Agreements for a one-year period.
In reaching the decision to approve the continuation of each of the Advisory Agreements, the Board considered information and materials furnished by New York Life Investments and NYL Investors in connection with an annual contract review process undertaken by the Board that took place at meetings of the Board and its Contracts Committee during October 2022 through December 2022, including information and materials furnished by New York Life Investments and NYL Investors in response to requests prepared on behalf of the Board, and in consultation with the Board, by independent legal counsel to the Independent Trustees, which encompassed a variety of topics, including those summarized below. Information and materials requested by and furnished to the Board for consideration in connection with the contract review process included, among other items, reports on the Portfolio and “peer funds” prepared by Institutional Shareholder Services Inc. (“ISS”), an independent third-party service provider engaged by the Board to report objectively on the Portfolio’s investment performance, management fee and total expenses. The Board also considered information on the fees charged to other investment advisory clients of New York Life Investments and/or NYL Investors that follow investment strategies similar to those of the Portfolio, if any, and, when applicable, the rationale for any differences in the Portfolio’s management and subadvisory fees and the fees charged to those other investment advisory clients. In addition, the Board considered information regarding the legal standards and fiduciary obligations applicable to its consideration of the continuation of each of the Advisory Agreements. The contract review process, including the structure and format for information and materials provided to the Board, has been developed in consultation with the Board. The Independent Trustees also met in executive sessions with their independent legal counsel and, for portions thereof, with senior management of New York Life Investments.
The Board’s deliberations with respect to the continuation of each of the Advisory Agreements reflect a year-long process, and the Board also took into account information furnished to the Board and its Committees throughout the year, as deemed relevant and appropriate by the Trustees, including, among other items, reports on investment performance of the Portfolio and investment-related matters for the Portfolio as well as presentations from New York Life Investments and, generally annually, NYL Investors personnel. In addition, the Board took into account other
information received from New York Life Investments throughout the year, including, among other items, periodic reports on legal and compliance matters, risk management, portfolio turnover, brokerage commissions and non-advisory services provided to the Portfolio by New York Life Investments, as deemed relevant and appropriate by the Trustees.
In addition to information provided to the Board throughout the year, the Board received information in connection with its June 2022 meeting provided specifically in response to requests prepared on behalf of the Board, and in consultation with the Board, by independent legal counsel to the Independent Trustees regarding the Portfolio’s distribution arrangements. In addition, the Board received information regarding the Portfolio’s asset levels, share purchase and redemption activity and the payment of Rule 12b-1 and/or other fees by the applicable share classes of the Portfolio, among other information.
In considering the continuation of each of the Advisory Agreements, the Trustees reviewed and evaluated the information and factors they believed to reasonably be necessary and appropriate in light of legal advice furnished to them by independent legal counsel to the Independent Trustees and through the exercise of their own business judgment. Although individual Trustees may have weighed certain factors or information differently and the Board did not consider any single factor or information controlling in reaching its decision, the factors considered by the Board are summarized in more detail below and include, among other factors: (i) the nature, extent and quality of the services provided to the Portfolio by New York Life Investments and NYL Investors; (ii) the qualifications of the portfolio managers of the Portfolio and the historical investment performance of the Portfolio, New York Life Investments and NYL Investors; (iii) the costs of the services provided, and profits realized, by New York Life Investments and NYL Investors with respect to their relationships with the Portfolio; (iv) the extent to which economies of scale have been realized or may be realized if the Portfolio grows and the extent to which any economies of scale have been shared, have benefited or may benefit the Portfolio’s shareholders; and (v) the reasonableness of the Portfolio’s management and subadvisory fees and total ordinary operating expenses. Although the Board recognized that comparisons between the Portfolio’s fees and expenses and those of other funds are imprecise given different terms of agreements, variations in fund strategies and other factors, the Board considered the reasonableness of the Portfolio’s management fee and total ordinary operating expenses as compared to the peer funds identified by ISS. Throughout their considerations, the Trustees acknowledged the commitment of New York Life Investments and its affiliates to serve the MainStay Group of Funds, as well as their capacity, experience, resources, financial stability and reputations. The Trustees also acknowledged the entrepreneurial and other risks assumed by New York Life Investments in sponsoring and managing the Portfolio. With respect to the Subadvisory Agreement, the Board took into account New York Life Investments’ recommendation to approve the continuation of the Subadvisory Agreement.
The Trustees noted that, throughout the year, the Trustees are afforded an opportunity to ask questions of, and request additional information or materials from, New York Life Investments and NYL Investors. The Board’s
Board Consideration and Approval of Management Agreement and Subadvisory Agreement (Unaudited) (continued)
decision with respect to each of the Advisory Agreements may have also been based, in part, on the Board’s knowledge of New York Life Investments and NYL Investors resulting from, among other things, the Board’s consideration of each of the Advisory Agreements in prior years, the advisory agreements for other funds in the MainStay Group of Funds, the Board’s review throughout the year of the performance and operations of other funds in the MainStay Group of Funds and each Trustee’s business judgment and industry experience. In addition to considering the above-referenced factors, the Board observed that in the marketplace, notably under variable life insurance policies and variable annuity contracts for which the Portfolio serves as an investment option, there are a range of investment options available to investors and that the Portfolio’s shareholders, having had the opportunity to consider other investment options, have chosen to invest in the Portfolio.
The factors that figured prominently in the Board’s decision to approve the continuation of each of the Advisory Agreements during its December 6–7, 2022 meeting are summarized in more detail below.
Nature, Extent and Quality of Services Provided by New York Life Investments and NYL Investors
The Board examined the nature, extent and quality of the services that New York Life Investments provides to the Portfolio. The Board evaluated New York Life Investments’ experience and capabilities in serving as manager of the Portfolio and considered that the Portfolio operates in a “manager-of-managers” structure. The Board also considered New York Life Investments’ responsibilities and services provided pursuant to this structure, including overseeing the services provided by NYL Investors, evaluating the performance of NYL Investors, making recommendations to the Board as to whether the Subadvisory Agreement should be renewed, modified or terminated and periodically reporting to the Board regarding the results of New York Life Investments’ evaluation and monitoring functions. The Board noted that New York Life Investments manages other mutual funds, serves a variety of other investment advisory clients, including other pooled investment vehicles, and has experience overseeing mutual fund service providers, including subadvisors. The Board considered the experience of senior personnel at New York Life Investments providing management and administrative and other non-advisory services to the Portfolio. The Board observed that New York Life Investments devotes significant resources and time to providing management and administrative and other non-advisory services to the Portfolio, including New York Life Investments’ oversight and due diligence reviews of NYL Investors and ongoing analysis of, and interactions with, NYL Investors with respect to, among other things, the Portfolio’s investment performance and risks as well as NYL Investors’ investment capabilities and subadvisory services with respect to the Portfolio.
The Board also considered the range of services that New York Life Investments provides to the Portfolio under the terms of the Management Agreement, including: (i) fund accounting and ongoing supervisory services provided by New York Life Investments’ Fund Administration and Accounting Group; (ii) investment supervisory and analytical services
provided by New York Life Investments’ Investment Consulting Group; (iii) compliance services provided by the Trust’s Chief Compliance Officer as well as New York Life Investments’ compliance department, including supervision and implementation of the Portfolio’s compliance program; (iv) legal services provided by New York Life Investments’ Office of the General Counsel; and (v) risk management monitoring and analysis by compliance and investment personnel. In addition, the Board considered New York Life Investments’ willingness to invest in personnel and other resources, such as cyber security, information security and business continuity planning, designed to benefit the Portfolio and noted that New York Life Investments is responsible for compensating the Trust’s officers, except for a portion of the salary of the Trust’s Chief Compliance Officer. The Board recognized that New York Life Investments provides certain other non-advisory services to the Portfolio and has provided an increasingly broad array of non-advisory services to the MainStay Group of Funds as a result of regulatory and other developments, including in connection with the implementation of the MainStay Group of Funds’ derivatives risk management program and policies and procedures adopted pursuant to Rule 18f-4 under the 1940 Act.
The Board also examined the range, and the nature, extent and quality, of the investment advisory services that NYL Investors provides to the Portfolio and considered the terms of each of the Advisory Agreements. The Board evaluated NYL Investors’ experience and performance in serving as subadvisor to the Portfolio and advising other portfolios and NYL Investors’ track record and experience in providing investment advisory services, the experience of investment advisory, senior management and administrative personnel at NYL Investors. The Board considered New York Life Investments’ and NYL Investors’ overall resources, legal and compliance environment, capabilities, reputation, financial condition and history. In addition to information provided in connection with quarterly meetings with the Trust’s Chief Compliance Officer, the Board considered information regarding the compliance policies and procedures of New York Life Investments and NYL Investors and acknowledged their commitment to further developing and strengthening compliance programs relating to the Portfolio. The Board also considered NYL Investors’ ability to recruit and retain qualified investment professionals and willingness to invest in personnel and other resources to service and support the Portfolio. In this regard, the Board considered the qualifications and experience of the Portfolio’s portfolio managers, the number of accounts managed by the portfolio managers and the method for compensating the portfolio managers.
In addition, the Board considered information provided by New York Life Investments and NYL Investors regarding the operations of their respective business continuity plans in response to the COVID-19 pandemic and the continued remote work environment.
Based on these considerations, among others, the Board concluded that the Portfolio would likely continue to benefit from the nature, extent and quality of these services.
| 50 | MainStay VP Floating Rate Portfolio |
Investment Performance
In evaluating the Portfolio’s investment performance, the Board considered investment performance results over various periods in light of the Portfolio’s investment objective, strategies and risks. The Board considered investment reports on, and analysis of, the Portfolio’s performance provided to the Board throughout the year. These reports include, among other items, information on the Portfolio’s gross and net returns, the Portfolio’s investment performance compared to a relevant investment category and the Portfolio’s benchmark, the Portfolio’s risk-adjusted investment performance and the Portfolio’s investment performance as compared to peer funds, as appropriate, as well as portfolio attribution information and commentary on the effect of market conditions. The Board also considered information provided by ISS showing the investment performance of the Portfolio as compared to peer funds. In addition, the Board reviewed the methodology used by ISS to construct the group of peer funds for comparative purposes.
The Board also took into account its discussions with senior management at New York Life Investments concerning the Portfolio’s investment performance over various periods as well as discussions between the Portfolio’s portfolio management team and the members of the Board’s Investment Committee, which generally occur on an annual basis. In addition, the Board considered any specific actions that New York Life Investments or NYL Investors had taken, or had agreed to take, to seek to enhance Portfolio investment performance and the results of those actions.
Based on these considerations, among others, the Board concluded that its review of the Portfolio’s investment performance and related information supported a determination to approve the continuation of each of the Advisory Agreements.
Costs of the Services Provided, and Profits and Other Benefits Realized, by New York Life Investments and NYL Investors
The Board considered the costs of the services provided under each of the Advisory Agreements. The Board also considered the profits realized by New York Life Investments and its affiliates, including NYL Investors, due to their relationships with the Portfolio as well as the MainStay Group of Funds. Because NYL Investors is an affiliate of New York Life Investments whose subadvisory fee is paid by New York Life Investments, not the Portfolio, the Board considered cost and profitability information for New York Life Investments and NYL Investors in the aggregate.
In addition, the Board acknowledged the difficulty in obtaining reliable comparative data about mutual fund managers’ profitability because such information generally is not publicly available and may be impacted by numerous factors, including the structure of a fund manager’s organization, the types of funds it manages, the methodology used to allocate certain fixed costs to specific funds and the manager’s capital structure and costs of capital.
In evaluating the costs of the services provided by New York Life Investments and NYL Investors and profits realized by New York Life Investments and its affiliates, including NYL Investors, the Board considered, among other factors, New York Life Investments’ and its affiliates’, including NYL Investors’, continuing investments in, or willingness to invest in, personnel and other resources to support and further enhance the management of the Portfolio, and that New York Life Investments is responsible for paying the subadvisory fee for the Portfolio. The Board also considered the financial resources of New York Life Investments and NYL Investors and acknowledged that New York Life Investments and NYL Investors must be in a position to recruit and retain experienced professional personnel and to maintain a strong financial position for New York Life Investments and NYL Investors to continue to provide high-quality services to the Portfolio. The Board recognized that the Portfolio benefits from the allocation of certain fixed costs among the funds in the MainStay Group of Funds, among other expected benefits resulting from its relationship with New York Life Investments.
The Board considered information regarding New York Life Investments’ methodology for calculating profitability and allocating costs provided by New York Life Investments in connection with the fund profitability analysis presented to the Board. The Board noted it had previously engaged an independent consultant to review the methods used to allocate costs among the funds in the MainStay Group of Funds. The Board also noted that the independent consultant had concluded that New York Life Investments’ methods for allocating costs and procedures for estimating overall profitability of the relationship with the funds in the MainStay Group of Funds are reasonable and that New York Life Investments continued to use the same method of calculating profit and allocating costs since the independent consultant’s review. The Board recognized the difficulty in calculating and evaluating a manager’s profitability with respect to the Portfolio and considered that other profitability methodologies may also be reasonable.
The Board also considered certain fall-out benefits that may be realized by New York Life Investments and its affiliates due to their relationships with the Portfolio, including reputational and other indirect benefits. In addition, the Board considered its review of the management agreement for a money market fund advised by New York Life Investments and an affiliated subadvisor that serves as an investment option for the Portfolio, including the potential rationale for and costs associated with investments in this money market fund by the Portfolio, if any, and considered information from New York Life Investments that the nature and type of specific investment advisory services provided to this money market fund are distinct from, or in addition to, the investment advisory services provided to the Portfolio. In addition, the Board considered the potential dividend received tax deduction for insurance company affiliates of New York Life Investments from the Portfolio’s securities lending activity.
The Board noted that the Portfolio serves as an investment option primarily under variable contracts issued by affiliates of New York Life Investments that would receive fees under those contracts. The Board observed that, in addition to fees earned by New York Life Investments under the Management Agreement for managing the Portfolio, New York
Board Consideration and Approval of Management Agreement and Subadvisory Agreement (Unaudited) (continued)
Life Investments’ affiliates also earn revenues from serving the Portfolio in various other capacities, including as the Portfolio’s distributor. The Board considered information about these other revenues and their impact on the profitability of the relationship with the Portfolio to New York Life Investments and its affiliates. The Board noted that, although it assessed the overall profitability of the relationship with the Portfolio to New York Life Investments and its affiliates as part of the contract review process, when considering the reasonableness of the fee paid to New York Life Investments under the Management Agreement, the Board considered the profitability of New York Life Investments’ relationship with the Portfolio on a pre-tax basis and without regard to distribution expenses incurred by New York Life Investments from its own resources.
After evaluating the information deemed relevant by the Trustees, the Board concluded that any profits realized by New York Life Investments and its affiliates, including NYL Investors, due to their relationships with the Portfolio were not excessive and other benefits that may accrue to New York Life Investments and its affiliates, including NYL Investors, are reasonable.
Management and Subadvisory Fees and Total Ordinary Operating Expenses
The Board evaluated the reasonableness of the fee paid under each of the Advisory Agreements and the Portfolio’s total ordinary operating expenses. The Board primarily considered the reasonableness of the management fee paid by the Portfolio to New York Life Investments because the subadvisory fee paid to NYL Investors is paid by New York Life Investments, not the Portfolio. The Board also considered the reasonableness of the subadvisory fee paid by New York Life Investments and the amount of the management fee retained by New York Life Investments.
In assessing the reasonableness of the Portfolio’s fees and expenses, the Board primarily considered comparative data provided by ISS on the fees and expenses charged by similar mutual funds managed by other investment advisers. The Board reviewed the methodology used by ISS to construct the group of peer funds for comparative purposes. In addition, the Board considered information provided by New York Life Investments and NYL Investors on fees charged to other investment advisory clients, including institutional separate accounts and/or other funds that follow investment strategies similar to those of the Portfolio, if any. The Board considered the contractual management fee schedules of the Portfolio as compared to those of such other investment advisory clients, taking into account the rationale for any differences in fee schedules. The Board also took into account information provided by New York Life Investments about the more extensive scope of services provided to registered investment companies, such as the Portfolio, as compared with other investment advisory clients. Additionally, the Board considered the impact of contractual breakpoints on the Portfolio’s net management fee and expenses. The Board also considered that in proposing fees for the Portfolio, New York Life Investments considers the competitive marketplace for mutual funds.
Based on the factors outlined above, among other considerations, the Board concluded that the Portfolio’s management fee and total ordinary operating expenses are within a range that is competitive and support a conclusion that these fees and expenses are reasonable.
Economies of Scale
The Board considered information regarding economies of scale, including whether economies of scale may exist for the Portfolio and whether the Portfolio’s expense structure permits any economies of scale to be appropriately shared with the Portfolio’s beneficial shareholders. The Board also considered a report from New York Life Investments, previously prepared at the request of the Board, that addressed economies of scale, including with respect to the mutual fund business generally, and the various ways in which the benefits of economies of scale may be shared with the funds in the MainStay Group of Funds. Although the Board recognized the difficulty of determining economies of scale with precision, the Board acknowledged that economies of scale may be shared with the Portfolio in a number of ways, including, for example, through the imposition of fee breakpoints, initially setting management fee rates at scale or making additional investments to enhance the services provided to the Portfolio. The Board reviewed information from New York Life Investments showing how the Portfolio’s management fee schedule compared to fee schedules of other funds and accounts managed by New York Life Investments. The Board also reviewed information from ISS showing how the Portfolio’s management fee schedule compared with fees paid for similar services by peer funds at varying asset levels.
Based on this information, the Board concluded that economies of scale are appropriately reflected for the benefit of the Portfolio’s beneficial shareholders through the Portfolio’s expense structure and other methods to share benefits from economies of scale.
Conclusion
On the basis of the information and factors summarized above, among other information and factors deemed relevant by the Trustees, and the evaluation thereof, the Board unanimously voted to approve the continuation of each of the Advisory Agreements.
| 52 | MainStay VP Floating Rate Portfolio |
Proxy Voting Policies and Procedures and Proxy Voting Record
The Portfolio is required to file with the SEC its proxy voting record for the 12-month period ending June 30 on Form N-PX. A description of the policies and procedures that are used to vote proxies relating to portfolio securities of the Portfolio is available free of charge upon request by calling 800-598-2019 or visiting the SEC's website at www.sec.gov. The most recent Form N-PX or proxy voting record is available free of charge upon request by calling 800-598-2019; visiting https://www.newyorklifeinvestments.com/investment-products/vp; or visiting the SEC’s website at www.sec.gov.
Shareholder Reports and Quarterly Portfolio Disclosure
The Portfolio is required to file its complete schedule of portfolio holdings with the SEC 60 days after its first and third fiscal quarter on Form N-PORT. The Portfolio's holdings report is available free of charge upon request by calling 800-598-2019 or by visiting the SEC’s website at www.sec.gov.
Board of Trustees and Officers (Unaudited)
The Trustees and officers of the Portfolio are listed below. The Board oversees the MainStay Group of Funds (which consists of MainStay Funds and MainStay Funds Trust), MainStay VP Funds Trust, MainStay MacKay DefinedTerm Municipal Opportunities Fund, MainStay CBRE Global Infrastructure Megatrends Fund, the Manager and the Subadvisors, and elects the officers of the Portfolios who are responsible for the day-to-day operations of the Portfolio. Information pertaining to the Trustees and officers is set forth below. Each Trustee serves until his or her successor
is elected and qualified or until his or her resignation, death or removal. Under the Board’s retirement policy, unless an exception is made, a Trustee must tender his or her resignation by the end of the calendar year during which he or she reaches the age of 75. The business address of each Trustee and officer listed below is 51 Madison Avenue, New York, New York 10010. None of the Trustees are “interested persons” (as defined by the 1940 Act and rules adopted by the SEC thereunder) of the Portfolio (“Independent Trustees”).
| | Name and
Year of Birth | Term of Office,
Position(s) Held and
Length of Service | Principal Occupation(s)
During Past Five Years | Number of
Portfolios in
Fund Complex
Overseen by
Trustee | Other Directorships
Held by Trustee |
| | | | | | |
| | David H. Chow
1957 | MainStay VP Funds Trust: Trustee since January 2016, Advisory Board Member (June 2015 to December 2015) | Founder and CEO, DanCourt Management, LLC since 1999 | 78 | MainStay Funds: Trustee since January 2016, Advisory Board Member (June 2015 to December 2015) (12 Funds);
MainStay Funds Trust: Trustee since January 2016, Advisory Board Member (June 2015 to December 2015) (33 Funds);
MainStay MacKay DefinedTerm Municipal Opportunities Fund: Trustee since January 2016, Advisory Board Member (June 2015 to December 2015);
MainStay CBRE Global Infrastructure Megatrends Fund: Trustee since June 2021;VanEck Vectors Group of Exchange-Traded Funds: Independent Chairman of the Board of Trustees since 2008 and Trustee since 2006 (57 portfolios); and Berea College of Kentucky: Trustee since 2009, Chair of the Committee since 2018 |
| | Susan B. Kerley
1951 | MainStay VP Funds Trust: Chairman since 2017 and Trustee since 2007* | President, Strategic Management Advisors LLC since 1990 | 78 | MainStay Funds: Chairman since 2017 and Trustee since 2007 (12 Funds); MainStay Funds Trust: Chairman since 2017 and Trustee since 1990 (33 Funds)**;
MainStay MacKay DefinedTerm Municipal Opportunities Fund: Chairman since 2017 and Trustee since 2011; MainStay CBRE Global Infrastructure Megatrends Fund: Trustee since June 2021; and Legg Mason Partners Funds: Trustee since 1991 (45 portfolios) |
| | Alan R. Latshaw
1951 | MainStay VP Funds Trust: Trustee since 2007* | Retired; Partner, Ernst & Young LLP (2002 to 2003); Partner, Arthur Andersen LLP (1989 to 2002); Consultant to the MainStay Funds Audit and Compliance Committee (2004 to 2006) | 78 | MainStay Funds: Trustee since 2006 (12 Funds);
MainStay Funds Trust: Trustee since 2007 (33 Funds)**;
MainStay MacKay DefinedTerm Municipal Opportunities Fund: Trustee since 2011; and
MainStay CBRE Global Infrastructure Megatrends Fund: Trustee since June 2021 |
| 54 | MainStay VP Floating Rate Portfolio |
| | Name and
Year of Birth | Term of Office,
Position(s) Held and
Length of Service | Principal Occupation(s)
During Past Five Years | Number of
Portfolios in
Fund Complex
Overseen by
Trustee | Other Directorships
Held by Trustee |
| | | | | | |
| | Karen Hammond
1956 | MainStay VP Funds Trust: Trustee since December 2021, Advisory Board Member (June 2021 to December 2021)
| Retired, Managing Director, Devonshire Investors (2007 to 2013); Senior Vice President, Fidelity Management & Research Co. (2005 to 2007); Senior Vice President and Corporate Treasurer, FMR Corp. (2003 to 2005); Chief Operating Officer, Fidelity Investments Japan (2001 to 2003) | 78 | MainStay Funds: Trustee since December 2021, Advisory Board Member (June 2021 to December 2021) (12 Funds);
MainStay Funds Trust: Trustee since December 2021, Advisory Board Member (June 2021 to December 2021) (33 Funds);
MainStay MacKay DefinedTerm Municipal Opportunities Fund: Trustee since December 2021, Advisory Board Member (June 2021 to December 2021);
MainStay CBRE Global Infrastructure Megatrends Fund: Trustee since December 2021, Advisory Board Member (June 2021 to December 2021);
Two Harbors Investment Corp.: Director since 2018; Rhode Island State Investment Commission: Member since 2017; and Blue Cross Blue Shield of Rhode Island: Director since 2019
|
| | Jacques P. Perold
1958 | MainStay VP Funds Trust: Trustee since January 2016, Advisory Board Member (June 2015 to December 2015) | Founder and Chief Executive Officer, CapShift Advisors LLC (since 2018); President, Fidelity Management & Research Company (2009 to 2014); President and Chief Investment Officer, Geode Capital Management, LLC (2001 to 2009) | 78 | MainStay Funds: Trustee since January 2016, Advisory Board Member (June 2015 to December 2015) (12 Funds);
MainStay Funds Trust: Trustee since January 2016, Advisory Board Member (June 2015 to December 2015) (33 Funds); MainStay MacKay DefinedTerm Municipal Opportunities Fund: Trustee since January 2016, Advisory Board Member (June 2015 to December 2015);
MainStay CBRE Global Infrastructure Megatrends Fund: Trustee since June 2021; Allstate Corporation: Director since 2015;
Partners in Health: Trustee since 2019; and
MSCI Inc.: Director since 2017 |
| | Richard S. Trutanic
1952 | MainStay VP Funds Trust: Trustee since 2007* | Chairman and Chief Executive Officer, Somerset & Company (financial advisory firm) since 2004; Managing Director, The Carlyle Group (private investment firm) (2002 to 2004); Senior Managing Director, Partner and Board Member, Groupe Arnault S.A. (private investment firm) (1999 to 2002)
| 78 | MainStay Funds: Trustee since 1994 (12 Funds);
MainStay Funds Trust: Trustee since 2007 (33 Funds)**;
MainStay MacKay DefinedTerm Municipal Opportunities Fund: Trustee since 2011; and
MainStay CBRE Global Infrastructure Megatrends Fund: Trustee since June 2021 |
| * | Includes prior service as a Director of MainStay VP Series Fund, Inc., the predecessor to MainStay VP Funds Trust. |
| ** | Includes prior service as a Director/Trustee of certain predecessor entities to MainStay Funds Trust. |
Board of Trustees and Officers (Unaudited) (continued)
| | Name and
Year of Birth | Position(s) Held and
Length of Service | Principal Occupation(s)
During Past Five Years | |
| | | | | |
| | Kirk C. Lehneis
1974 | President, MainStay VP Funds Trust (since 2017) | Chief Operating Officer and Senior Managing Director (since 2016), New York Life Investment Management LLC and New York Life Investment Management Holdings LLC; Member of the Board of Managers (since 2017) and Senior Managing Director (since 2018), NYLIFE Distributors LLC; Chairman of the Board and Senior Managing Director, NYLIM Service Company LLC (since 2017); Trustee, President and Principal Executive Officer of IndexIQ Trust, IndexIQ ETF Trust and IndexIQ Active ETF Trust (since January 2018); President, MainStay CBRE Global Infrastructure Megatrends Fund (since 2021), MainStay MacKay DefinedTerm Municipal Opportunities Fund, MainStay Funds and MainStay Funds Trust (since 2017); Senior Managing Director, Global Product Development (from 2015-2016); Managing Director, Product Development (from 2010-2015), New York Life Investment Management LLC | |
| | Jack R. Benintende
1964 | Treasurer and Principal Financial and Accounting Officer, MainStay VP Funds Trust (since 2007)** | Managing Director, New York Life Investment Management LLC (since 2007); Treasurer and Principal Financial and Accounting Officer, MainStay CBRE Global Infrastructure Megatrends Fund (since 2021), MainStay MacKay DefinedTerm Municipal Opportunities Fund (since 2011), MainStay Funds Trust (since 2009) and MainStay Funds (since 2007); and Assistant Treasurer, New York Life Investment Management Holdings LLC (2008 to 2012) | |
| | J. Kevin Gao
1967 | Secretary and Chief Legal Officer, MainStay VP Funds Trust (since 2010)** | Managing Director and Associate General Counsel, New York Life Investment Management LLC (since 2010); Secretary and Chief Legal Officer, MainStay CBRE Global Infrastructure Megatrends Fund (since 2021), MainStay MacKay DefinedTerm Municipal Opportunities Fund (since 2011), MainStay Funds and MainStay Funds Trust (since 2010) | |
| | Scott T. Harrington
1959 | Vice President— Administration, MainStay VP Funds Trust (since 2005)** | Managing Director, New York Life Investment Management LLC (including predecessor advisory organizations) (since 2000); Member of the Board of Directors, New York Life Trust Company (since 2009); Vice President—Administration, MainStay CBRE Global Infrastructure Megatrends Fund (since 2021), MainStay MacKay DefinedTerm Municipal Opportunities Fund (since 2011), MainStay Funds Trust and MainStay Funds (since 2009) | |
| | Kevin M. Gleason
1967 | Vice President and Chief Compliance Officer, MainStay VP Funds Trust (since June 2022) | Vice President and Chief Compliance Officer, IndexIQ, IndexIQ ETF Trust and Index IQ Active ETF Trust (since June 2022); Vice President and Chief Compliance Officer, MainStay CBRE Global Infrastructure Megatrends Fund, MainStay MacKay DefinedTerm Municipal Opportunities Fund (since June 2022); MainStay Funds Trust and MainStay Funds (since June 2022); Senior Vice President, Voya Investment Management and Chief Compliance Officer, Voya Family of Funds (2012-2022) | |
| * | The officers listed above are considered to be “interested persons” of the MainStay Group of Funds, MainStay VP Funds Trust, MainStay CBRE Global Infrastructure Megatrends Fund and MainStay MacKay DefinedTerm Municipal Opportunities Fund within the meaning of the 1940 Act because of their affiliation with the MainStay Group of Funds, New York Life Insurance Company and/or its affiliates, including New York Life Investment Management LLC, NYLIM Service Company LLC, NYLIFE Securities LLC and/or NYLIFE Distributors LLC, as described in detail in the column captioned “Principal Occupation(s) During Past Five Years.” Officers are elected annually by the Board. |
| ** | Includes prior service as an Officer of MainStay VP Series Fund, Inc., the predecessor to MainStay VP Funds Trust. |
Officers of the Trust (Who are not Trustees)*
| 56 | MainStay VP Floating Rate Portfolio |
This page intentionally left blank.
This page intentionally left blank.
MainStay VP Portfolios
MainStay VP offers a wide range of Portfolios. The full array of MainStay VP offerings is listed here, with information about the manager, subadvisors, legal counsel, and independent registered public accounting firm.
Equity
MainStay VP American Century Sustainable Equity Portfolio1
MainStay VP Candriam Emerging Markets Equity Portfolio
MainStay VP Epoch U.S. Equity Yield Portfolio
MainStay VP Fidelity Institutional AM® Utilities Portfolio†
MainStay VP MacKay International Equity Portfolio
MainStay VP Natural Resources Portfolio
MainStay VP S&P 500 Index Portfolio2
MainStay VP Small Cap Growth Portfolio
MainStay VP Wellington Growth Portfolio
MainStay VP Wellington Mid Cap Portfolio
MainStay VP Wellington Small Cap Portfolio
MainStay VP Wellington U.S. Equity Portfolio
MainStay VP Winslow Large Cap Growth Portfolio
Mixed Asset
MainStay VP Balanced Portfolio
MainStay VP Income Builder Portfolio
MainStay VP Janus Henderson Balanced Portfolio
MainStay VP MacKay Convertible Portfolio
Income
MainStay VP Bond Portfolio
MainStay VP Floating Rate Portfolio
MainStay VP Indexed Bond Portfolio
MainStay VP MacKay Government Portfolio
MainStay VP MacKay High Yield Corporate Bond Portfolio
MainStay VP MacKay Strategic Bond Portfolio
MainStay VP PIMCO Real Return Portfolio
Money Market
MainStay VP U.S. Government Money Market Portfolio
Alternative
MainStay VP CBRE Global Infrastructure Portfolio
MainStay VP IQ Hedge Multi-Strategy Portfolio
Asset Allocation
MainStay VP Conservative Allocation Portfolio
MainStay VP Equity Allocation Portfolio
MainStay VP Growth Allocation Portfolio
MainStay VP Moderate Allocation Portfolio
Manager
New York Life Investment Management LLC
New York, New York
Subadvisors
American Century Investment Management, Inc.
Kansas City, Missouri
Brown Advisory LLC
Baltimore, Maryland
Candriam*
Strassen, Luxembourg
CBRE Investment Management Listed Real Assets LLC
Radnor, Pennsylvania
Epoch Investment Partners, Inc.
New York, New York
FIAM LLC
Smithfield, Rhode Island
IndexIQ Advisors LLC*
New York, New York
Janus Henderson Investors US LLC
Denver, Colorado
MacKay Shields LLC*
New York, New York
Newton Investment Management North America, LLC
Boston, Massachusetts
NYL Investors LLC*
New York, New York
Pacific Investment Management Company LLC
Newport Beach, California
Segall Bryant & Hamill, LLC
Chicago, Illinois
Wellington Management Company LLP
Boston, Massachusetts
Winslow Capital Management, LLC
Minneapolis, Minnesota
Legal Counsel
Dechert LLP
Washington, District of Columbia
Independent Registered Public Accounting Firm
PricewaterhouseCoopers LLP
New York, New York
Distributor
NYLIFE Distributors LLC*
Jersey City, New Jersey
Custodian
JPMorgan Chase Bank, N.A.
New York, New York
Some Portfolios may not be available in all products.
† Fidelity Institutional AM is a registered trade mark of FMR LLC. Used with permission.
* An affiliate of New York Life Investment Management LLC.
| 1. | Prior to May 1, 2022, the Portfolio's name was MainStay VP T. Rowe Price Equity Income Portfolio. |
| 2. | Prior to May 1, 2022, the Portfolio's name was MainStay VP MacKay S&P 500 Index Portfolio. |
Not part of the Annual Report
2022 Annual Report
This report is for the general information of New York Life Variable Annuities and NYLIAC Variable Universal Life Insurance Products policyowners. It must be preceded or accompanied by the appropriate product(s) and funds prospectuses if it is given to anyone who is not an owner of a New York Life variable annuity policy or a NYLIAC Variable Universal Life Insurance Product. This report does not offer for sale or solicit orders to purchase securities.
The performance data quoted in this report represents past performance. Past performance is no guarantee of future results. Due to market volatility and other factors, current performance may be lower or higher than the figures shown. The most recent month-end performance summary for your variable annuity or variable life policy is available by calling 800-598-2019 and is updated periodically on newyorklife.com.
The New York Life Variable Annuities and NYLIAC Variable Universal Life Insurance Products are issued by New York Life Insurance and Annuity Corporation (a Delaware Corporation) and distributed by NYLIFE Distributors LLC (Member FINRA/SIPC).
New York Life Insurance Company
New York Life Insurance and Annuity
Corporation (NYLIAC) (A Delaware Corporation)
51 Madison Avenue, Room 551
New York, NY 10010
newyorklife.com
newyorklifeinvestments.com
NYLIFE Distributors LLC, 30 Hudson Street, Jersey City, NJ 07302
New York Life Investment Management LLC is the investment manager to the MainStay VP Funds Trust
©2023 by NYLIFE Distributors LLC. All rights reserved.
You may obtain copies of the Prospectus and the Statement of Additional Information free of charge, upon request, by calling toll-free 800-598-2019 or writing to New York Life Insurance and Annuity Corporation, 51 Madison Avenue, New York, NY 10010.
| Not FDIC Insured | No Bank Guarantee | May Lose Value |
(NYLIAC) NI518
MainStay VP MacKay High Yield Corporate Bond Portfolio
Message from the President and Annual Report
December 31, 2022
Sign up for e-delivery of your shareholder reports. For full details on e-delivery, including who can participate and what you can receive via e-delivery,
please log in to newyorklifeinvestments.com/accounts.
| Not FDIC/NCUA Insured | Not a Deposit | May Lose Value | No Bank Guarantee | Not Insured by Any Government Agency |
This page intentionally left blank
Message from the President
The 12-month reporting period ended December 31, 2022, proved exceptionally challenging for investors as both stock and bond markets suffered steep declines. A variety of economic and geopolitical forces drove the market’s losses, all centered around rising inflation and monetary efforts to rein it in.
Inflationary alarms began to sound well before the reporting period began. In late 2021, after nearly two years of accommodative policies designed to encourage economic growth in the face of the COVID-19 pandemic, the U.S. Federal Reserve (the “Fed”) warned of the increasing need to tighten monetary policy. Nevertheless, the pace and persistence of inflation in early 2022 caught most market participants—the Fed included—off guard. Russia’s invasion of Ukraine in February exacerbated global inflationary pressures while increasing investor uncertainty. Domestic supply shortages, international trade imbalances and rising inflation caused U.S. GDP (gross domestic product) to contract in the first and second quarters of the year, although employment and consumer spending proved resilient. Prices for petroleum surged to multi-year highs, while many key agricultural chemicals and industrial metals soared as well. Accelerating inflationary forces prompted the Fed to implement its most aggressive series of interest rate hikes since the 1980s, with a 0.25% increase in March followed by six further rate increases totaling 4.25%. International central banks generally followed suit and raised rates by varying degrees in efforts to curb local inflation, although most increases remained significantly more modest than those in the United States. Relatively high U.S. interest rates and an international risk averse sentiment pushed U.S. dollar values higher compared to most other currencies, with negative impacts on global prices for food, fuel and other key U.S.-dollar-denominated products.
The effects of these interrelated challenges were felt throughout U.S. and international financial markets. The S&P 500® Index, a widely regarded benchmark of market performance, declined by more than 18% during the reporting period. Although the energy sector generated strong gains, bolstered by elevated oil and gas prices, most other industry segments recorded losses. The more cyclical and growth-oriented sectors of consumer discretionary, information technology and real estate delivered the weakest returns, while the traditionally defensive and value-oriented
consumer staples, utilities and health care sectors outperformed. On average, international developed-country equity markets mildly outperformed their U.S. counterparts, while emerging markets lagged slightly. Fixed-income markets proved unusually volatile, with bond prices trending sharply lower as yields rose along with interest rates. Short-term yields rose faster than long-term yields, producing a yield curve inversion from July through the end of the reporting period as long-term rates remained below short-term rates. While floating-rate instruments, which feature variable interest rates that allow investors to benefit from a rising rate environment, provided a degree of insulation from inflation-driven trends, they were not immune to the market’s widespread declines.
Although, according to the most recent estimates, the annualized inflation rate in the United States has declined from a peak of 9.1% in July 2022 to 6.5% in December, the Fed remains focused on achieving more substantial and lasting reductions, aiming for a target rate of 2%. As a result, further rate hikes and additional market volatility are potential headwinds in the coming months. The question remains as to whether the Fed and other central banks will manage a so-called “soft landing,” curbing inflation while avoiding a persistent economic slowdown. If they prove successful, we believe that the increasingly attractive valuations we have observed in both equity and bond markets should eventually translate into sustainable improvements in the investment environment.
Whatever actions the Fed takes and however financial markets react, as a MainStay VP investor you can depend on us to continue managing our portfolios with the insight, expertise and level of service that have long defined New York Life Investments. Thank you for trusting us to help you meet your investment needs.
Sincerely,
Kirk C. Lehneis
President
The opinions expressed are as of the date of this report and are subject to change. There is no guarantee that any forecast made will come to pass. This material does not constitute investment advice and is not intended as an endorsement of any specific investment. Past performance is no guarantee of future results.
Not part of the Annual Report
Investors should refer to the Portfolio’s Summary Prospectus and/or Prospectus and consider the Portfolio’s investment objectives, strategies, risks, charges and expenses carefully before investing. The Summary Prospectus and/or Prospectus contain this and other information about the Portfolio. You may obtain copies of the Portfolio’s Summary Prospectus, Prospectus and Statement of Additional Information, which includes information about the MainStay VP Funds Trust's Trustees, free of charge, upon request, by calling toll-free 800-598-2019, by writing to New York Life Insurance and Annuity Corporation, 51 Madison Avenue, Room 251, New York, New York 10010 or by sending an email to MainStayShareholdersServices@nylim.com. These documents are also available at newyorklifeinvestments.com/investment-products/vp. Please read the Portfolio's Summary Prospectus and/or Prospectus carefully before investing. MainStay VP Funds Trust portfolios are separate account options which are purchased through a variable insurance or variable annuity contract.
Investment and Performance Comparison (Unaudited)
Performance data quoted represents past performance. Past performance is no guarantee of future results. Because of market volatility and other factors, current performance may be lower or higher than the figures shown. Investment return and principal value will fluctuate, and as a result, when shares are redeemed, they may be worth more or less than their original cost. The performance table and graph do not reflect any deduction of sales charges, mortality and expense charges, contract charges or administrative charges. Please refer to the Performance Summary appropriate for your policy. For performance information current to the most recent month-end, please call 800-598-2019 or visit www.newyorklife.com.
Performance figures may reflect certain fee waivers and/or expense limitations, without which total returns may have been different. For information on current fee waivers and/or expense limitations (if any), please refer to the Notes to Financial Statements.
| Average Annual Total Returns for the Year-Ended December 31, 2022 |
| Class | Inception
Date | One
Year | Five
Years | Ten
Years | Gross
Expense
Ratio1 |
| Initial Class Shares | 5/1/1995 | -8.06% | 2.67% | 4.23% | 0.58% |
| Service Class Shares | 6/4/2003 | -8.29 | 2.41 | 3.97 | 0.83 |
| 1. | The gross expense ratios presented reflect the Portfolio’s “Total Annual Portfolio Operating Expenses” from the most recent Prospectus and may differ from other expense ratios disclosed in this report. |
| Benchmark Performance* | One
Year | Five
Years | Ten
Years |
| ICE BofA U.S. High Yield Constrained Index1 | -11.21% | 2.10% | 3.94% |
| Morningstar High Yield Bond Category Average2 | -10.37 | 1.46 | 2.99 |
| * | Returns for indices reflect no deductions for fees, expenses or taxes, except for foreign withholding taxes where applicable. Results assume reinvestment of all dividends and capital gains. An investment cannot be made directly in an index. |
| 1. | The ICE BofA U.S. High Yield Constrained Index is the Portfolio's primary broad-based securities market index for comparison purposes. The ICE BofA U.S. High Yield Constrained Index is a market value-weighted index of all domestic and Yankee high-yield bonds, including deferred interest bonds and payment-in-kind securities. Issuers included in the Index have maturities of one year or more and have a credit rating lower than BBB-/Baa3, but are not in default. No single issuer may constitute greater than 2% of the Index. |
| 2. | The Morningstar High Yield Bond Category Average is representative of funds that concentrate on lower-quality bonds, which are riskier than those of higher-quality companies. These portfolios primarily invest in U.S. high-income debt securities where at least 65% or more of bond assets are not rated or are rated by a major agency such as Standard & Poor’s or Moody’s at the level of BB and below. Results are based on average total returns of similar funds with all dividends and capital gain distributions reinvested. |
Cost in Dollars of a $1,000 Investment in MainStay VP MacKay High Yield Corporate Bond Portfolio (Unaudited)
The example below is intended to describe the fees and expenses borne by shareholders during the six-month period from July 1, 2022 to December 31, 2022, and the impact of those costs on your investment.
Example
As a shareholder of the Portfolio you incur two types of costs: (1) transaction costs, including exchange fees and sales charges (loads) on purchases (as applicable), and (2) ongoing costs, including management fees, distribution and/or service (12b-1) fees and other Portfolio expenses (as applicable). This example is intended to help you understand your ongoing costs (in dollars) of investing in the Portfolio and to compare these costs with the ongoing costs of investing in other mutual funds. The example is based on an investment of $1,000 made at the beginning of the six-month period and held for the entire period from July 1, 2022 to December 31, 2022. Shares are only sold in connection with variable life and annuity contracts and the example does not reflect any contract level or transactional fees or expenses. If these costs had been included, your costs would have been higher.
This example illustrates your Portfolio’s ongoing costs in two ways:
Actual Expenses
The second and third data columns in the table below provide information about actual account values and actual expenses. You may use the information in these columns, together with the amount you invested, to estimate the expenses that you paid during the six months ended
December 31, 2022. Simply divide your account value by $1,000 (for example, an $8,600 account value divided by $1,000 = 8.6), then multiply the result by the number under the heading entitled “Expenses Paid During Period” to estimate the expenses you paid on your account during this period.
Hypothetical Example for Comparison Purposes
The fourth and fifth data columns in the table below provide information about hypothetical account values and hypothetical expenses based on the Portfolio’s actual expense ratio and an assumed rate of return of 5% per year before expenses, which is not the Portfolio’s actual return. The hypothetical account values and expenses may not be used to estimate the actual ending account balances or expenses you paid for the six-month period shown. You may use this information to compare the ongoing costs of investing in the Portfolio with the ongoing costs of investing in other mutual funds. To do so, compare this 5% hypothetical example with the 5% hypothetical examples that appear in the shareholder reports of the other mutual funds.
Please note that the expenses shown in the table are meant to highlight your ongoing costs only and do not reflect any transactional costs, such as exchange fees or sales charges (loads). Therefore, the fourth and fifth data columns of the table are useful in comparing ongoing costs only and will not help you determine the relative total costs of owning different funds. In addition, if these transactional costs were included, your costs would have been higher.
| Share Class | Beginning
Account
Value
7/1/22 | Ending Account
Value (Based
on Actual
Returns and
Expenses)
12/31/22 | Expenses
Paid
During
Period1 | Ending Account
Value (Based
on Hypothetical
5% Annualized
Return and
Actual Expenses)
12/31/22 | Expenses
Paid
During
Period1 | Net Expense
Ratio
During
Period2 |
| Initial Class Shares | $1,000.00 | $1,034.80 | $2.97 | $1,022.28 | $2.96 | 0.58% |
| Service Class Shares | $1,000.00 | $1,033.50 | $4.25 | $1,021.02 | $4.23 | 0.83% |
| 1. | Expenses are equal to the Portfolio’s annualized expense ratio of each class multiplied by the average account value over the period, divided by 365 and multiplied by 184 (to reflect the six-month period). The table above represents the actual expenses incurred during the six-month period. In addition to the fees and expenses which the Portfolio bears directly, it also indirectly bears a pro rata share of the fees and expenses of the underlying funds in which it invests. Such indirect expenses are not included in the above-reported expense figures. |
| 2. | Expenses are equal to the Portfolio's annualized expense ratio to reflect the six-month period. |
| 6 | MainStay VP MacKay High Yield Corporate Bond Portfolio |
Portfolio Composition as of December 31, 2022 (Unaudited)
‡ Less than one-tenth of percent.
See Portfolio of Investments beginning on page 10 for specific holdings within these categories. The Portfolio's holdings are subject to change.
Top Ten Holdings and/or Issuers Held as of December 31, 2022 (excluding short-term investments) (Unaudited)
| 1. | CCO Holdings LLC, 4.25%-5.375%, due 5/1/27–1/15/34 |
| 2. | HCA, Inc., 5.375%-8.36%, due 4/15/24–11/6/33 |
| 3. | Carnival Corp., 4.00%-10.50%, due 2/1/26–5/1/29 |
| 4. | TransDigm, Inc., 4.625%-8.00%, due 12/15/25–5/1/29 |
| 5. | Yum! Brands, Inc., 3.625%-6.875%, due 1/15/30–11/15/37 |
| 6. | MSCI, Inc., 3.25%-4.00%, due 11/15/29–8/15/33 |
| 7. | Sprint Capital Corp., 6.875%, due 11/15/28 |
| 8. | VICI Properties LP, 3.875%-5.75%, due 5/1/24–2/15/29 |
| 9. | T-Mobile US, Inc., 2.875%-5.375%, due 4/15/27–4/15/31 |
| 10. | IHO Verwaltungs GmbH, 4.75%-6.375%, due 9/15/26–5/15/29 |
Portfolio Management Discussion and Analysis (Unaudited)
Answers to the questions reflect the views of portfolio manager Andrew Susser of MacKay Shields LLC, the Portfolio’s Subadvisor.
How did MainStay VP MacKay High Yield Corporate Bond Portfolio perform relative to its benchmark and peers during the 12 months ended December 31, 2022?
For the 12 months ended December 31, 2022, MainStay VP MacKay High Yield Corporate Bond Portfolio returned −8.06% for Initial Class shares and −8.29% for Service Class shares. Over the same period, both share classes outperformed the −11.21% return of the ICE BofA U.S. High Yield Constrained Index (“the Index”), which is the Portfolio’s benchmark, and the −10.37% return of the Morningstar High Yield Bond Category Average.1
What factors affected the Portfolio’s relative performance during the reporting period?
During the reporting period, the Portfolio outperformed the Index primarily due to positive security selection and an overweight position in the energy sector. In telecommunication services, security selection and underweight exposure were both beneficial. Security selection in the health care sector also made a positive contribution to relative returns. (Contributions take weightings and total returns into account.) The Portfolio largely avoided the bonds of Endo International and held underweight exposure to bonds of Bausch Health Companies, which benefited returns as their prices fell sharply. From a credit-quality perspective, the Portfolio’s underweight exposure to bonds rated CCC2bolstered relative performance, as these credits were the most vulnerable to a slowing economy. The Portfolio’s short duration profile relative to the Index also contributed positively as rates moved dramatically higher throughout the reporting period.
What was the Portfolio’s duration3 strategy during the reporting period?
The Portfolio’s duration is the result of our bottom-up fundamental analysis and is residual of the investment process. However, the Portfolio had a lower duration relative to the Index throughout the reporting period, which was beneficial to returns.
What specific factors, risks or market forces prompted significant decisions for the Portfolio during the reporting period?
Although markets were negatively impacted by the large move in interest rates coupled with recessionary fears, there were no material changes to the sector weightings in the Portfolio. We continued to favor higher-quality companies with good balance sheets and a duration below that of the Index.
During the reporting period, which market segments were the strongest positive contributors to the Portfolio’s absolute performance and which market segments were particularly weak?
Energy was the only sector posting a positive absolute rate of return during the reporting period. On an absolute basis, telecommunication services, utilities and basic industry declined the least. Within energy, returns benefited from security selection and overweight sector exposure. Bonds of exploration & production companies Gulfport Energy, Talos Energy and PetroQuest Energy were top contributors, as were bonds of energy services holding Forum Energy Technologies. Within telecom, security selection and underweight exposure to wireline contributed to returns. The average wireline holding in the Index was down approximately 15% for the year. The Portfolio did not own the bonds of Altice USA or Telecom Italia, which were two of the largest detractors within the Index. Health care positioning also proved beneficial. The Portfolio held underweight exposure to bonds of Bausch Health Companies and did not own the bonds of Endo International, which filed for bankruptcy protection during the reporting period. Within retail, underweight exposure to weak-performing specialty retailers (not owning bonds of Carvana and Bath and Body Works), contributed positively to returns. Security selection and underweight exposure to bonds rated CCC, as well as maintaining a shorter duration than the Index, further bolstered returns.
The leisure sector detracted most from absolute returns as a result of security selection, most notably due to holdings in the bonds of CWT and Carnival. Selection within capital goods also detracted, the bonds of Energy Technologies were the most significant detractor.
Did the Portfolio make any significant purchases or sales during the reporting period?
During the reporting period, we closed out the Portfolio’s positions in real estate investment trust (REIT) MGM Growth Properties, packaged food concern The Kraft Heinz Company and energy company Callon Petroleum. The Portfolio initiated a position in industrial company FTAI Aviation and added to its position in REIT VICI Properties.
How did the Portfolio’s sector weightings change during the reporting period?
During the reporting period, there were no material changes to the sector weightings in the Portfolio. On the margin, exposure to
| 1. | See page 5 for more information on benchmark and peer group returns. |
| 2. | An obligation rated ‘CCC’ by S&P is deemed by S&P to be currently vulnerable to nonpayment and is dependent upon favorable business, financial and economic conditions for the obligor to meet its financial commitment on the obligation. It is the opinion of S&P that in the event of adverse business, financial or economic conditions, the obligor is not likely to have the capacity to meet its financial commitment on the obligation. When applied to Portfolio holdings, ratings are based solely on the creditworthiness of the bonds in the Portfolio and are not meant to represent the security or safety of the Portfolio. |
| 3. | Duration is a measure of the price sensitivity of a fixed-income investment to changes in interest rates. Duration is expressed as a number of years and is considered a more accurate sensitivity gauge than average maturity. |
| 8 | MainStay VP MacKay High Yield Corporate Bond Portfolio |
health care, leisure and retail increased slightly, while exposure to media, telecommunications services and automotive decreased slightly.
How was the Portfolio positioned at the end of the reporting period?
As of December 31, 2022, the Portfolio held overweight positions relative to the Index in the energy, materials and health care sectors, and underweight positions in telecommunications services, information technology and financials.
The opinions expressed are those of the portfolio manager as of the date of this report and are subject to change. There is no guarantee that any forecasts will come to pass. This material does not constitute investment advice and is not intended as an endorsement of any specific investment.
Not all MainStay VP Portfolios and/or share classes are available under all policies.
Portfolio of Investments December 31, 2022†
| | Principal
Amount | Value |
| Long-Term Bonds 92.7% |
| Convertible Bonds 1.1% |
| Media 0.5% |
| DISH Network Corp. | | |
| 2.375%, due 3/15/24 | $ 8,030,000 | $ 7,265,142 |
| 3.375%, due 8/15/26 | 7,295,000 | 4,588,555 |
| | | 11,853,697 |
| Oil & Gas 0.2% |
| Gulfport Energy Operating Corp. | | |
| 10.00% (10.00% Cash or 15.00% PIK), due 12/29/49 (a)(b) | 1,095,000 | 5,539,550 |
| Oil & Gas Services 0.4% |
| Forum Energy Technologies, Inc. | | |
| 9.00% (6.25% Cash and 2.75% PIK), due 8/4/25 (b) | 9,247,866 | 9,930,355 |
Total Convertible Bonds
(Cost $24,929,242) | | 27,323,602 |
| Corporate Bonds 87.4% |
| Advertising 1.1% |
| Lamar Media Corp. | | |
| 3.625%, due 1/15/31 | 10,265,000 | 8,486,358 |
| 3.75%, due 2/15/28 | 6,320,000 | 5,657,073 |
| 4.00%, due 2/15/30 | 6,400,000 | 5,593,600 |
| 4.875%, due 1/15/29 | 2,570,000 | 2,359,714 |
| Outfront Media Capital LLC (c) | | |
| 4.25%, due 1/15/29 | 2,400,000 | 1,991,352 |
| 5.00%, due 8/15/27 | 6,070,000 | 5,464,496 |
| | | 29,552,593 |
| Aerospace & Defense 2.1% |
| F-Brasile SpA | | |
| Series XR | | |
| 7.375%, due 8/15/26 (c) | 5,587,000 | 4,567,373 |
| Rolls-Royce plc | | |
| 5.75%, due 10/15/27 (c) | 3,210,000 | 3,057,525 |
| TransDigm UK Holdings plc | | |
| 6.875%, due 5/15/26 | 7,637,000 | 7,457,635 |
| TransDigm, Inc. | | |
| 4.625%, due 1/15/29 | 7,985,000 | 7,020,971 |
| 4.875%, due 5/1/29 | 5,630,000 | 4,910,767 |
| 6.25%, due 3/15/26 (c) | 23,850,000 | 23,520,631 |
| 7.50%, due 3/15/27 | 2,780,000 | 2,750,552 |
| 8.00%, due 12/15/25 (c) | 2,500,000 | 2,536,975 |
| | | 55,822,429 |
| | Principal
Amount | Value |
| |
| Airlines 0.9% |
| American Airlines, Inc. (c) | | |
| 5.50%, due 4/20/26 | $ 3,560,000 | $ 3,423,462 |
| 5.75%, due 4/20/29 | 3,750,000 | 3,427,334 |
| Delta Air Lines, Inc. (c) | | |
| 4.50%, due 10/20/25 | 4,095,000 | 3,995,007 |
| 4.75%, due 10/20/28 | 5,450,000 | 5,122,854 |
| 7.00%, due 5/1/25 | 713,000 | 728,644 |
| Mileage Plus Holdings LLC | | |
| 6.50%, due 6/20/27 (c) | 5,112,329 | 5,082,687 |
| Spirit Loyalty Cayman Ltd. | | |
| 8.00%, due 9/20/25 (c) | 1,495,984 | 1,500,801 |
| | | 23,280,789 |
| Auto Manufacturers 1.7% |
| Ford Holdings LLC | | |
| 9.30%, due 3/1/30 | 8,454,000 | 9,489,615 |
| Ford Motor Co. | | |
| 6.10%, due 8/19/32 | 2,345,000 | 2,165,273 |
| Ford Motor Credit Co. LLC | | |
| 2.30%, due 2/10/25 | 2,020,000 | 1,844,018 |
| 2.90%, due 2/16/28 | 2,400,000 | 1,982,206 |
| 3.375%, due 11/13/25 | 4,000,000 | 3,616,051 |
| 4.00%, due 11/13/30 | 5,000,000 | 4,104,200 |
| 4.125%, due 8/17/27 | 1,000,000 | 895,000 |
| 4.271%, due 1/9/27 | 1,647,000 | 1,489,676 |
| 4.389%, due 1/8/26 | 750,000 | 698,595 |
| 5.125%, due 6/16/25 | 3,500,000 | 3,364,696 |
| JB Poindexter & Co., Inc. | | |
| 7.125%, due 4/15/26 (c) | 12,982,000 | 12,527,630 |
| PM General Purchaser LLC | | |
| 9.50%, due 10/1/28 (c) | 3,775,000 | 2,877,497 |
| | | 45,054,457 |
| Auto Parts & Equipment 1.7% |
| Adient Global Holdings Ltd. | | |
| 4.875%, due 8/15/26 (c) | 5,500,000 | 5,120,390 |
| Dealer Tire LLC | | |
| 8.00%, due 2/1/28 (c) | 5,540,000 | 4,874,499 |
| IHO Verwaltungs GmbH (b)(c) | | |
| 4.75% (4.75% Cash or 5.50% PIK), due 9/15/26 | 7,973,000 | 6,899,545 |
| 6.00% (6.00% Cash or 6.75% PIK), due 5/15/27 | 11,576,000 | 10,127,439 |
| 6.375% (6.375% Cash or 7.125% PIK), due 5/15/29 | 11,645,000 | 9,840,315 |
| Real Hero Merger Sub 2, Inc. | | |
| 6.25%, due 2/1/29 (c) | 11,800,000 | 8,088,900 |
| | | 44,951,088 |
The notes to the financial statements are an integral part of, and should be read in conjunction with, the financial statements.
| 10 | MainStay VP MacKay High Yield Corporate Bond Portfolio |
| | Principal
Amount | Value |
| Corporate Bonds (continued) |
| Beverages 0.1% |
| Primo Water Holdings, Inc. | | |
| 4.375%, due 4/30/29 (c) | $ 3,725,000 | $ 3,216,878 |
| Biotechnology 0.1% |
| Emergent BioSolutions, Inc. | | |
| 3.875%, due 8/15/28 (c) | 3,480,000 | 1,729,804 |
| Grifols Escrow Issuer SA | | |
| 4.75%, due 10/15/28 (c) | 2,000,000 | 1,726,940 |
| | | 3,456,744 |
| Building Materials 1.2% |
| Builders FirstSource, Inc. | | |
| 6.375%, due 6/15/32 (c) | 3,000,000 | 2,817,739 |
| James Hardie International Finance DAC | | |
| 5.00%, due 1/15/28 (c) | 8,011,000 | 7,350,092 |
| Koppers, Inc. | | |
| 6.00%, due 2/15/25 (c) | 6,805,000 | 6,464,750 |
| New Enterprise Stone & Lime Co., Inc. | | |
| 5.25%, due 7/15/28 (c) | 2,975,000 | 2,641,713 |
| PGT Innovations, Inc. | | |
| 4.375%, due 10/1/29 (c) | 3,995,000 | 3,344,784 |
| Summit Materials LLC (c) | | |
| 5.25%, due 1/15/29 | 4,380,000 | 4,077,889 |
| 6.50%, due 3/15/27 | 5,635,000 | 5,522,137 |
| | | 32,219,104 |
| Chemicals 2.4% |
| ASP Unifrax Holdings, Inc. (c) | | |
| 5.25%, due 9/30/28 | 5,260,000 | 4,232,547 |
| 7.50%, due 9/30/29 | 5,990,000 | 3,801,853 |
| Avient Corp. (c) | | |
| 5.75%, due 5/15/25 | 2,000,000 | 1,950,000 |
| 7.125%, due 8/1/30 | 3,405,000 | 3,328,496 |
| CVR Partners LP | | |
| 6.125%, due 6/15/28 (c) | 1,700,000 | 1,525,092 |
| GPD Cos., Inc. | | |
| 10.125%, due 4/1/26 (c) | 8,875,000 | 7,565,938 |
| Innophos Holdings, Inc. | | |
| 9.375%, due 2/15/28 (c) | 7,096,000 | 6,936,340 |
| Iris Holdings, Inc. | | |
| 8.75% (8.75% Cash or 9.50% PIK), due 2/15/26 (b)(c) | 5,605,000 | 4,792,275 |
| Mativ Holdings, Inc. | | |
| 6.875%, due 10/1/26 (c) | 3,000,000 | 2,647,500 |
| NOVA Chemicals Corp. (c) | | |
| 4.875%, due 6/1/24 | 2,635,000 | 2,549,353 |
| | Principal
Amount | Value |
| |
| Chemicals (continued) |
| NOVA Chemicals Corp. (c) (continued) | | |
| 5.25%, due 6/1/27 | $ 4,020,000 | $ 3,610,856 |
| Olympus Water US Holding Corp. | | |
| 7.125%, due 10/1/27 (c) | 1,955,000 | 1,862,138 |
| SCIH Salt Holdings, Inc. (c) | | |
| 4.875%, due 5/1/28 | 6,000,000 | 5,148,448 |
| 6.625%, due 5/1/29 | 7,300,000 | 5,880,000 |
| SCIL IV LLC | | |
| 5.375%, due 11/1/26 (c) | 3,300,000 | 2,796,750 |
| SK Invictus Intermediate II SARL | | |
| 5.00%, due 10/30/29 (c) | 7,470,000 | 6,125,400 |
| | | 64,752,986 |
| Coal 0.2% |
| Coronado Finance Pty. Ltd. | | |
| 10.75%, due 5/15/26 (c) | 2,430,000 | 2,484,675 |
| Warrior Met Coal, Inc. | | |
| 7.875%, due 12/1/28 (c) | 2,650,000 | 2,606,242 |
| | | 5,090,917 |
| Commercial Services 2.6% |
| AMN Healthcare, Inc. | | |
| 4.625%, due 10/1/27 (c) | 2,430,000 | 2,240,630 |
| Ashtead Capital, Inc. (c) | | |
| 4.00%, due 5/1/28 | 1,980,000 | 1,805,214 |
| 4.25%, due 11/1/29 | 3,545,000 | 3,177,502 |
| Gartner, Inc. | | |
| 3.75%, due 10/1/30 (c) | 4,635,000 | 3,995,219 |
| Graham Holdings Co. | | |
| 5.75%, due 6/1/26 (c) | 11,107,000 | 10,913,738 |
| HealthEquity, Inc. | | |
| 4.50%, due 10/1/29 (c) | 2,650,000 | 2,315,835 |
| Korn Ferry | | |
| 4.625%, due 12/15/27 (c) | 4,000,000 | 3,684,040 |
| MPH Acquisition Holdings LLC (c) | | |
| 5.50%, due 9/1/28 | 3,110,000 | 2,426,111 |
| 5.75%, due 11/1/28 | 4,350,000 | 2,892,803 |
| NESCO Holdings II, Inc. | | |
| 5.50%, due 4/15/29 (c) | 3,675,000 | 3,215,625 |
| Ritchie Bros Auctioneers, Inc. | | |
| 5.375%, due 1/15/25 (c) | 3,800,000 | 3,733,500 |
| Service Corp. International | | |
| 3.375%, due 8/15/30 | 2,902,000 | 2,359,056 |
| 4.00%, due 5/15/31 | 7,000,000 | 5,895,580 |
| United Rentals North America, Inc. | | |
| 3.75%, due 1/15/32 | 2,000,000 | 1,631,660 |
| 3.875%, due 2/15/31 | 3,500,000 | 2,934,015 |
| 4.875%, due 1/15/28 | 1,000,000 | 947,650 |
| 5.50%, due 5/15/27 | 500,000 | 493,600 |
The notes to the financial statements are an integral part of, and should be read in conjunction with, the financial statements.
11
Portfolio of Investments December 31, 2022† (continued)
| | Principal
Amount | Value |
| Corporate Bonds (continued) |
| Commercial Services (continued) |
| Williams Scotsman International, Inc. (c) | | |
| 4.625%, due 8/15/28 | $ 4,270,000 | $ 3,853,675 |
| 6.125%, due 6/15/25 | 4,705,000 | 4,657,950 |
| WW International, Inc. | | |
| 4.50%, due 4/15/29 (c) | 9,615,000 | 4,803,558 |
| | | 67,976,961 |
| Computers 0.2% |
| Condor Merger Sub, Inc. | | |
| 7.375%, due 2/15/30 (c) | 6,205,000 | 4,989,012 |
| Unisys Corp. | | |
| 6.875%, due 11/1/27 (c) | 1,730,000 | 1,327,861 |
| | | 6,316,873 |
| Cosmetics & Personal Care 0.4% |
| Edgewell Personal Care Co. (c) | | |
| 4.125%, due 4/1/29 | 6,780,000 | 5,779,805 |
| 5.50%, due 6/1/28 | 4,000,000 | 3,740,920 |
| | | 9,520,725 |
| Distribution & Wholesale 0.3% |
| G-III Apparel Group Ltd. | | |
| 7.875%, due 8/15/25 (c) | 6,175,000 | 5,759,432 |
| H&E Equipment Services, Inc. | | |
| 3.875%, due 12/15/28 (c) | 3,120,000 | 2,657,585 |
| | | 8,417,017 |
| Diversified Financial Services 2.0% |
| AG TTMT Escrow Issuer LLC | | |
| 8.625%, due 9/30/27 (c) | 5,515,000 | 5,542,575 |
| Credit Acceptance Corp. | | |
| 5.125%, due 12/31/24 (c) | 3,055,000 | 2,871,027 |
| 6.625%, due 3/15/26 | 9,465,000 | 8,969,389 |
| Enact Holdings, Inc. | | |
| 6.50%, due 8/15/25 (c) | 4,485,000 | 4,401,400 |
| Jefferies Finance LLC | | |
| 5.00%, due 8/15/28 (c) | 10,185,000 | 8,308,210 |
| LPL Holdings, Inc. (c) | | |
| 4.00%, due 3/15/29 | 7,570,000 | 6,586,657 |
| 4.375%, due 5/15/31 | 3,630,000 | 3,086,042 |
| 4.625%, due 11/15/27 | 3,865,000 | 3,610,224 |
| PennyMac Financial Services, Inc. (c) | | |
| 4.25%, due 2/15/29 | 3,000,000 | 2,339,726 |
| 5.75%, due 9/15/31 | 3,050,000 | 2,418,695 |
| PRA Group, Inc. | | |
| 7.375%, due 9/1/25 (c) | 3,700,000 | 3,594,550 |
| | Principal
Amount | Value |
| |
| Diversified Financial Services (continued) |
| StoneX Group, Inc. | | |
| 8.625%, due 6/15/25 (c) | $ 1,298,000 | $ 1,310,980 |
| | | 53,039,475 |
| Electric 1.9% |
| Clearway Energy Operating LLC | | |
| 4.75%, due 3/15/28 (c) | 4,050,000 | 3,737,930 |
| DPL, Inc. | | |
| 4.125%, due 7/1/25 | 5,815,000 | 5,466,098 |
| Keystone Power Pass-Through Holders LLC | | |
| 13.00% (1.00% Cash and 12.00% PIK), due 6/1/24 (a)(b)(c) | 2,299,367 | 1,379,620 |
| Leeward Renewable Energy Operations LLC | | |
| 4.25%, due 7/1/29 (c) | 4,650,000 | 3,962,464 |
| NextEra Energy Operating Partners LP | | |
| 3.875%, due 10/15/26 (c) | 4,500,000 | 4,117,589 |
| NRG Energy, Inc. | | |
| 6.625%, due 1/15/27 | 2,555,000 | 2,533,410 |
| Pattern Energy Operations LP | | |
| 4.50%, due 8/15/28 (c) | 4,205,000 | 3,770,348 |
| PG&E Corp. | | |
| 5.00%, due 7/1/28 | 5,185,000 | 4,733,089 |
| 5.25%, due 7/1/30 | 3,840,000 | 3,494,400 |
| TransAlta Corp. | | |
| 7.75%, due 11/15/29 | 2,915,000 | 2,977,035 |
| Vistra Corp. (c)(d)(e) | | |
| 7.00% (5 Year Treasury Constant Maturity Rate + 5.74%), due 12/15/26 | 3,350,000 | 3,048,276 |
| 8.00% (5 Year Treasury Constant Maturity Rate + 6.93%), due 10/15/26 | 7,800,000 | 7,449,521 |
| Vistra Operations Co. LLC | | |
| 5.00%, due 7/31/27 (c) | 3,300,000 | 3,062,709 |
| | | 49,732,489 |
| Electrical Components & Equipment 0.3% |
| WESCO Distribution, Inc. (c) | | |
| 7.125%, due 6/15/25 | 4,535,000 | 4,591,742 |
| 7.25%, due 6/15/28 | 2,500,000 | 2,532,435 |
| | | 7,124,177 |
| Engineering & Construction 0.5% |
| Great Lakes Dredge & Dock Corp. | | |
| 5.25%, due 6/1/29 (c) | 4,000,000 | 3,109,600 |
| Railworks Holdings LP | | |
| 8.25%, due 11/15/28 (c) | 2,800,000 | 2,590,000 |
The notes to the financial statements are an integral part of, and should be read in conjunction with, the financial statements.
| 12 | MainStay VP MacKay High Yield Corporate Bond Portfolio |
| | Principal
Amount | Value |
| Corporate Bonds (continued) |
| Engineering & Construction (continued) |
| TopBuild Corp. | | |
| 4.125%, due 2/15/32 (c) | $ 4,480,000 | $ 3,640,493 |
| Weekley Homes LLC | | |
| 4.875%, due 9/15/28 (c) | 5,800,000 | 4,873,396 |
| | | 14,213,489 |
| Entertainment 2.9% |
| Affinity Gaming | | |
| 6.875%, due 12/15/27 (c) | 3,939,000 | 3,339,638 |
| Allen Media LLC | | |
| 10.50%, due 2/15/28 (c) | 4,040,000 | 1,535,200 |
| Boyne USA, Inc. | | |
| 4.75%, due 5/15/29 (c) | 3,845,000 | 3,402,995 |
| CCM Merger, Inc. | | |
| 6.375%, due 5/1/26 (c) | 2,170,000 | 2,044,834 |
| CDI Escrow Issuer, Inc. | | |
| 5.75%, due 4/1/30 (c) | 6,190,000 | 5,548,896 |
| Churchill Downs, Inc. (c) | | |
| 4.75%, due 1/15/28 | 13,847,000 | 12,391,265 |
| 5.50%, due 4/1/27 | 9,256,000 | 8,770,570 |
| International Game Technology plc | | |
| 6.25%, due 1/15/27 (c) | 7,225,000 | 7,170,813 |
| Jacobs Entertainment, Inc. | | |
| 6.75%, due 2/15/29 (c) | 6,470,000 | 5,840,023 |
| Live Nation Entertainment, Inc. (c) | | |
| 3.75%, due 1/15/28 | 1,860,000 | 1,584,864 |
| 6.50%, due 5/15/27 | 6,435,000 | 6,296,971 |
| Merlin Entertainments Ltd. | | |
| 5.75%, due 6/15/26 (c) | 10,940,000 | 10,242,438 |
| Midwest Gaming Borrower LLC | | |
| 4.875%, due 5/1/29 (c) | 2,280,000 | 1,939,970 |
| Motion Bondco DAC | | |
| 6.625%, due 11/15/27 (c) | 4,500,000 | 3,867,966 |
| Vail Resorts, Inc. | | |
| 6.25%, due 5/15/25 (c) | 2,800,000 | 2,800,002 |
| | | 76,776,445 |
| Food 1.0% |
| B&G Foods, Inc. | | |
| 5.25%, due 4/1/25 | 4,142,000 | 3,632,152 |
| Lamb Weston Holdings, Inc. | | |
| 4.875%, due 5/15/28 (c) | 3,300,000 | 3,126,750 |
| Land O'Lakes Capital Trust I | | |
| 7.45%, due 3/15/28 (c) | 5,130,000 | 5,001,750 |
| Simmons Foods, Inc. | | |
| 4.625%, due 3/1/29 (c) | 6,200,000 | 5,047,126 |
| | Principal
Amount | Value |
| |
| Food (continued) |
| TreeHouse Foods, Inc. | | |
| 4.00%, due 9/1/28 | $ 3,000,000 | $ 2,550,000 |
| United Natural Foods, Inc. | | |
| 6.75%, due 10/15/28 (c) | 6,325,000 | 6,077,218 |
| | | 25,434,996 |
| Food Service 0.2% |
| Aramark Services, Inc. | | |
| 6.375%, due 5/1/25 (c) | 6,500,000 | 6,420,115 |
| Forest Products & Paper 1.1% |
| Glatfelter Corp. | | |
| 4.75%, due 11/15/29 (c) | 2,630,000 | 1,581,420 |
| Mercer International, Inc. | | |
| 5.125%, due 2/1/29 | 9,880,000 | 8,259,779 |
| 5.50%, due 1/15/26 | 1,000,000 | 947,189 |
| Smurfit Kappa Treasury Funding DAC | | |
| 7.50%, due 11/20/25 | 15,843,000 | 17,082,097 |
| | | 27,870,485 |
| Gas 0.5% |
| AmeriGas Partners LP | | |
| 5.625%, due 5/20/24 | 4,425,000 | 4,295,257 |
| 5.75%, due 5/20/27 | 2,485,000 | 2,309,476 |
| 5.875%, due 8/20/26 | 6,885,000 | 6,538,749 |
| | | 13,143,482 |
| Hand & Machine Tools 0.1% |
| Werner FinCo LP | | |
| 8.75%, due 7/15/25 (c) | 4,250,000 | 2,847,500 |
| Healthcare-Products 1.1% |
| Garden Spinco Corp. | | |
| 8.625%, due 7/20/30 (c) | 4,000,000 | 4,240,000 |
| Hologic, Inc. (c) | | |
| 3.25%, due 2/15/29 | 8,500,000 | 7,298,920 |
| 4.625%, due 2/1/28 | 2,000,000 | 1,884,590 |
| Teleflex, Inc. | | |
| 4.25%, due 6/1/28 (c) | 9,615,000 | 8,777,149 |
| 4.625%, due 11/15/27 | 3,500,000 | 3,335,815 |
| Varex Imaging Corp. | | |
| 7.875%, due 10/15/27 (c) | 4,092,000 | 4,064,051 |
| | | 29,600,525 |
| Healthcare-Services 4.4% |
| Acadia Healthcare Co., Inc. (c) | | |
| 5.00%, due 4/15/29 | 1,750,000 | 1,609,475 |
| 5.50%, due 7/1/28 | 1,500,000 | 1,422,750 |
The notes to the financial statements are an integral part of, and should be read in conjunction with, the financial statements.
13
Portfolio of Investments December 31, 2022† (continued)
| | Principal
Amount | Value |
| Corporate Bonds (continued) |
| Healthcare-Services (continued) |
| Catalent Pharma Solutions, Inc. (c) | | |
| 3.125%, due 2/15/29 | $ 6,995,000 | $ 5,569,594 |
| 3.50%, due 4/1/30 | 1,500,000 | 1,184,385 |
| 5.00%, due 7/15/27 | 5,180,000 | 4,820,084 |
| CHS/Community Health Systems, Inc. | | |
| 5.25%, due 5/15/30 (c) | 3,500,000 | 2,639,130 |
| DaVita, Inc. (c) | | |
| 3.75%, due 2/15/31 | 3,200,000 | 2,388,320 |
| 4.625%, due 6/1/30 | 4,600,000 | 3,700,363 |
| Encompass Health Corp. | | |
| 4.50%, due 2/1/28 | 5,500,000 | 4,996,200 |
| 4.625%, due 4/1/31 | 4,275,000 | 3,674,434 |
| 4.75%, due 2/1/30 | 7,650,000 | 6,717,787 |
| HCA, Inc. | | |
| 5.375%, due 2/1/25 | 6,530,000 | 6,522,094 |
| 5.625%, due 9/1/28 | 1,295,000 | 1,287,660 |
| 5.875%, due 2/15/26 | 8,000,000 | 8,050,482 |
| 7.50%, due 11/6/33 | 12,100,000 | 12,701,649 |
| 7.58%, due 9/15/25 | 3,507,000 | 3,632,931 |
| 7.69%, due 6/15/25 | 9,035,000 | 9,470,243 |
| 8.36%, due 4/15/24 | 4,450,000 | 4,577,275 |
| IQVIA, Inc. | | |
| 5.00%, due 10/15/26 (c) | 9,792,000 | 9,349,881 |
| LifePoint Health, Inc. | | |
| 5.375%, due 1/15/29 (c) | 4,900,000 | 2,768,990 |
| ModivCare Escrow Issuer, Inc. | | |
| 5.00%, due 10/1/29 (c) | 2,000,000 | 1,686,600 |
| ModivCare, Inc. | | |
| 5.875%, due 11/15/25 (c) | 3,850,000 | 3,616,407 |
| Molina Healthcare, Inc. | | |
| 3.875%, due 11/15/30 (c) | 4,480,000 | 3,796,530 |
| RegionalCare Hospital Partners Holdings, Inc. | | |
| 9.75%, due 12/1/26 (c) | 11,710,000 | 9,423,154 |
| Select Medical Corp. | | |
| 6.25%, due 8/15/26 (c) | 2,000,000 | 1,901,660 |
| | | 117,508,078 |
| Holding Companies-Diversified 0.3% |
| Stena International SA | | |
| 6.125%, due 2/1/25 (c) | 9,525,000 | 8,858,250 |
| Home Builders 2.0% |
| Adams Homes, Inc. | | |
| 7.50%, due 2/15/25 (c) | 6,315,000 | 5,367,324 |
| Brookfield Residential Properties, Inc. | | |
| 6.25%, due 9/15/27 (c) | 4,855,000 | 4,311,725 |
| | Principal
Amount | Value |
| |
| Home Builders (continued) |
| Century Communities, Inc. | | |
| 3.875%, due 8/15/29 (c) | $ 5,155,000 | $ 4,053,119 |
| 6.75%, due 6/1/27 | 6,775,000 | 6,464,056 |
| Installed Building Products, Inc. | | |
| 5.75%, due 2/1/28 (c) | 6,945,000 | 6,244,566 |
| M/I Homes, Inc. | | |
| 3.95%, due 2/15/30 | 2,100,000 | 1,695,621 |
| 4.95%, due 2/1/28 | 3,000,000 | 2,665,380 |
| Meritage Homes Corp. | | |
| 3.875%, due 4/15/29 (c) | 6,372,000 | 5,403,806 |
| Shea Homes LP | | |
| 4.75%, due 2/15/28 | 7,300,000 | 6,374,853 |
| 4.75%, due 4/1/29 | 2,748,000 | 2,308,320 |
| STL Holding Co. LLC | | |
| 7.50%, due 2/15/26 (c) | 2,700,000 | 2,376,000 |
| Winnebago Industries, Inc. | | |
| 6.25%, due 7/15/28 (c) | 5,885,000 | 5,488,934 |
| | | 52,753,704 |
| Household Products & Wares 0.3% |
| Central Garden & Pet Co. | | |
| 4.125%, due 10/15/30 | 2,020,000 | 1,659,235 |
| 4.125%, due 4/30/31 (c) | 4,323,000 | 3,578,688 |
| Spectrum Brands, Inc. | | |
| 5.75%, due 7/15/25 | 2,840,000 | 2,807,863 |
| | | 8,045,786 |
| Housewares 0.2% |
| Scotts Miracle-Gro Co. (The) | | |
| 4.00%, due 4/1/31 | 4,860,000 | 3,712,754 |
| 4.375%, due 2/1/32 | 3,235,000 | 2,438,219 |
| | | 6,150,973 |
| Insurance 1.1% |
| BroadStreet Partners, Inc. | | |
| 5.875%, due 4/15/29 (c) | 6,000,000 | 5,106,488 |
| Fairfax Financial Holdings Ltd. | | |
| 8.30%, due 4/15/26 | 4,273,000 | 4,550,880 |
| Fidelity & Guaranty Life Holdings, Inc. | | |
| 5.50%, due 5/1/25 (c) | 1,000,000 | 985,306 |
| MGIC Investment Corp. | | |
| 5.25%, due 8/15/28 | 6,708,000 | 6,185,347 |
| NMI Holdings, Inc. | | |
| 7.375%, due 6/1/25 (c) | 3,245,000 | 3,277,450 |
| Ryan Specialty Group LLC | | |
| 4.375%, due 2/1/30 (c) | 1,815,000 | 1,571,601 |
| USI, Inc. | | |
| 6.875%, due 5/1/25 (c) | 6,600,000 | 6,358,073 |
| | | 28,035,145 |
The notes to the financial statements are an integral part of, and should be read in conjunction with, the financial statements.
| 14 | MainStay VP MacKay High Yield Corporate Bond Portfolio |
| | Principal
Amount | Value |
| Corporate Bonds (continued) |
| Internet 2.2% |
| Cars.com, Inc. | | |
| 6.375%, due 11/1/28 (c) | $ 5,360,000 | $ 4,758,889 |
| Gen Digital, Inc. | | |
| 6.75%, due 9/30/27 (c) | 4,100,000 | 4,018,000 |
| Netflix, Inc. | | |
| 4.875%, due 4/15/28 | 1,692,000 | 1,633,772 |
| 5.375%, due 11/15/29 (c) | 2,500,000 | 2,425,000 |
| 5.75%, due 3/1/24 | 10,899,000 | 10,974,421 |
| 5.875%, due 2/15/25 | 1,510,000 | 1,529,026 |
| 5.875%, due 11/15/28 | 8,800,000 | 8,919,064 |
| Northwest Fiber LLC | | |
| 4.75%, due 4/30/27 (c) | 2,250,000 | 1,979,691 |
| Uber Technologies, Inc. (c) | | |
| 7.50%, due 5/15/25 | 2,400,000 | 2,398,252 |
| 7.50%, due 9/15/27 | 6,065,000 | 6,069,246 |
| VeriSign, Inc. | | |
| 4.75%, due 7/15/27 | 6,000,000 | 5,791,411 |
| 5.25%, due 4/1/25 | 9,025,000 | 9,001,424 |
| | | 59,498,196 |
| Investment Companies 1.6% |
| Compass Group Diversified Holdings LLC (c) | | |
| 5.00%, due 1/15/32 | 3,250,000 | 2,567,705 |
| 5.25%, due 4/15/29 | 9,375,000 | 8,023,041 |
| FS Energy and Power Fund | | |
| 7.50%, due 8/15/23 (c) | 23,640,000 | 23,640,000 |
| Icahn Enterprises LP | | |
| 5.25%, due 5/15/27 | 4,000,000 | 3,662,400 |
| 6.25%, due 5/15/26 | 4,000,000 | 3,843,584 |
| | | 41,736,730 |
| Iron & Steel 1.1% |
| Allegheny Ludlum LLC | | |
| 6.95%, due 12/15/25 | 7,400,000 | 7,326,000 |
| Big River Steel LLC | | |
| 6.625%, due 1/31/29 (c) | 6,800,000 | 6,478,535 |
| Mineral Resources Ltd. (c) | | |
| 8.125%, due 5/1/27 | 12,000,000 | 12,083,205 |
| 8.50%, due 5/1/30 | 3,375,000 | 3,420,663 |
| | | 29,308,403 |
| Leisure Time 2.0% |
| Carnival Corp. (c) | | |
| 4.00%, due 8/1/28 | 11,000,000 | 8,969,510 |
| 5.75%, due 3/1/27 | 19,065,000 | 13,613,173 |
| 6.00%, due 5/1/29 | 7,620,000 | 5,077,830 |
| 7.625%, due 3/1/26 | 3,390,000 | 2,686,896 |
| | Principal
Amount | Value |
| |
| Leisure Time (continued) |
| Carnival Corp. (c) (continued) | | |
| 9.875%, due 8/1/27 | $ 7,000,000 | $ 6,615,000 |
| 10.50%, due 2/1/26 | 7,040,000 | 7,073,510 |
| Carnival Holdings Bermuda Ltd. | | |
| 10.375%, due 5/1/28 (c) | 1,930,000 | 1,981,357 |
| Royal Caribbean Cruises Ltd. (c) | | |
| 5.375%, due 7/15/27 | 3,700,000 | 2,995,894 |
| 5.50%, due 4/1/28 | 5,500,000 | 4,389,248 |
| | | 53,402,418 |
| Lodging 1.9% |
| Boyd Gaming Corp. | | |
| 4.75%, due 12/1/27 | 11,630,000 | 10,831,949 |
| 4.75%, due 6/15/31 (c) | 13,995,000 | 12,175,650 |
| Hilton Domestic Operating Co., Inc. | | |
| 3.625%, due 2/15/32 (c) | 1,070,000 | 856,856 |
| 4.00%, due 5/1/31 (c) | 10,490,000 | 8,776,249 |
| 4.875%, due 1/15/30 | 7,825,000 | 7,091,093 |
| 5.75%, due 5/1/28 (c) | 2,200,000 | 2,134,000 |
| Hyatt Hotels Corp. | | |
| 6.00%, due 4/23/30 (f) | 1,000,000 | 978,225 |
| Marriott International, Inc. | | |
| Series GG | | |
| 3.50%, due 10/15/32 | 4,000,000 | 3,327,454 |
| Series FF | | |
| 4.625%, due 6/15/30 | 2,000,000 | 1,866,228 |
| Station Casinos LLC | | |
| 4.50%, due 2/15/28 (c) | 1,500,000 | 1,304,073 |
| | | 49,341,777 |
| Machinery—Construction & Mining 0.3% |
| Terex Corp. | | |
| 5.00%, due 5/15/29 (c) | 2,150,000 | 1,932,313 |
| Vertiv Group Corp. | | |
| 4.125%, due 11/15/28 (c) | 7,500,000 | 6,375,000 |
| | | 8,307,313 |
| Machinery-Diversified 0.6% |
| Briggs & Stratton Corp. Escrow Claim Shares | | |
| 6.875%, due 12/15/20 (g)(h)(i) | 5,030,000 | — |
| Chart Industries, Inc. | | |
| 7.50%, due 1/1/30 (c) | 3,000,000 | 3,015,870 |
| Stevens Holding Co., Inc. | | |
| 6.125%, due 10/1/26 (c) | 3,894,000 | 3,903,735 |
| TK Elevator Holdco GmbH | | |
| 7.625%, due 7/15/28 (c) | 2,148,000 | 1,753,871 |
The notes to the financial statements are an integral part of, and should be read in conjunction with, the financial statements.
15
Portfolio of Investments December 31, 2022† (continued)
| | Principal
Amount | Value |
| Corporate Bonds (continued) |
| Machinery-Diversified (continued) |
| TK Elevator U.S. Newco, Inc. | | |
| 5.25%, due 7/15/27 (c) | $ 7,690,000 | $ 6,825,183 |
| | | 15,498,659 |
| Media 6.5% |
| Block Communications, Inc. | | |
| 4.875%, due 3/1/28 (c) | 4,175,000 | 3,642,688 |
| Cable One, Inc. | | |
| 4.00%, due 11/15/30 (c) | 10,325,000 | 8,102,190 |
| CCO Holdings LLC | | |
| 4.25%, due 2/1/31 (c) | 12,120,000 | 9,721,634 |
| 4.25%, due 1/15/34 (c) | 7,265,000 | 5,361,897 |
| 4.50%, due 8/15/30 (c) | 13,555,000 | 11,198,531 |
| 4.50%, due 5/1/32 | 11,250,000 | 8,955,000 |
| 4.50%, due 6/1/33 (c) | 4,700,000 | 3,605,981 |
| 4.75%, due 3/1/30 (c) | 7,715,000 | 6,653,532 |
| 5.00%, due 2/1/28 (c) | 8,550,000 | 7,763,314 |
| 5.125%, due 5/1/27 (c) | 12,000,000 | 11,184,840 |
| 5.375%, due 6/1/29 (c) | 4,780,000 | 4,322,411 |
| CSC Holdings LLC (c) | | |
| 5.75%, due 1/15/30 | 6,705,000 | 3,781,553 |
| 6.50%, due 2/1/29 | 2,660,000 | 2,174,550 |
| Directv Financing LLC | | |
| 5.875%, due 8/15/27 (c) | 10,100,000 | 9,036,066 |
| DISH DBS Corp. | | |
| 5.125%, due 6/1/29 | 1,500,000 | 967,665 |
| 7.75%, due 7/1/26 | 8,000,000 | 6,451,120 |
| LCPR Senior Secured Financing DAC (c) | | |
| 5.125%, due 7/15/29 | 3,310,000 | 2,742,031 |
| 6.75%, due 10/15/27 | 13,596,000 | 12,712,260 |
| News Corp. (c) | | |
| 3.875%, due 5/15/29 | 10,470,000 | 9,081,573 |
| 5.125%, due 2/15/32 | 3,085,000 | 2,807,350 |
| Scripps Escrow II, Inc. | | |
| 3.875%, due 1/15/29 (c) | 4,805,000 | 3,856,012 |
| Sirius XM Radio, Inc. (c) | | |
| 3.125%, due 9/1/26 | 3,315,000 | 2,943,521 |
| 3.875%, due 9/1/31 | 3,000,000 | 2,340,508 |
| 4.00%, due 7/15/28 | 2,750,000 | 2,393,325 |
| Sterling Entertainment Enterprises LLC | | |
| 10.25%, due 1/15/25 (a)(g)(i) | 7,000,000 | 6,507,200 |
| Videotron Ltd. (c) | | |
| 5.125%, due 4/15/27 | 5,890,000 | 5,563,282 |
| 5.375%, due 6/15/24 | 9,580,000 | 9,460,250 |
| | Principal
Amount | Value |
| |
| Media (continued) |
| Virgin Media Finance plc | | |
| 5.00%, due 7/15/30 (c) | $ 3,490,000 | $ 2,799,189 |
| VZ Secured Financing BV | | |
| 5.00%, due 1/15/32 (c) | 6,285,000 | 5,107,326 |
| | | 171,236,799 |
| Metal Fabricate & Hardware 0.2% |
| Advanced Drainage Systems, Inc. (c) | | |
| 5.00%, due 9/30/27 | 2,275,000 | 2,121,438 |
| 6.375%, due 6/15/30 | 3,470,000 | 3,371,660 |
| Park-Ohio Industries, Inc. | | |
| 6.625%, due 4/15/27 | 1,200,000 | 815,208 |
| | | 6,308,306 |
| Mining 1.7% |
| Arconic Corp. | | |
| 6.00%, due 5/15/25 (c) | 2,200,000 | 2,162,812 |
| Century Aluminum Co. | | |
| 7.50%, due 4/1/28 (c) | 7,330,000 | 6,335,523 |
| Compass Minerals International, Inc. (c) | | |
| 4.875%, due 7/15/24 | 2,250,000 | 2,162,813 |
| 6.75%, due 12/1/27 | 7,990,000 | 7,670,400 |
| Constellium SE | | |
| 3.75%, due 4/15/29 (c) | 3,000,000 | 2,437,312 |
| First Quantum Minerals Ltd. | | |
| 6.875%, due 10/15/27 (c) | 1,800,000 | 1,688,802 |
| IAMGOLD Corp. | | |
| 5.75%, due 10/15/28 (c) | 9,305,000 | 7,224,778 |
| Novelis Corp. (c) | | |
| 3.25%, due 11/15/26 | 5,660,000 | 5,074,247 |
| 3.875%, due 8/15/31 | 5,300,000 | 4,326,880 |
| 4.75%, due 1/30/30 | 5,750,000 | 5,097,749 |
| | | 44,181,316 |
| Miscellaneous—Manufacturing 0.8% |
| Amsted Industries, Inc. (c) | | |
| 4.625%, due 5/15/30 | 2,615,000 | 2,229,288 |
| 5.625%, due 7/1/27 | 7,240,000 | 6,868,298 |
| EnPro Industries, Inc. | | |
| 5.75%, due 10/15/26 | 4,240,000 | 4,112,800 |
| Hillenbrand, Inc. | | |
| 5.75%, due 6/15/25 | 2,000,000 | 1,990,000 |
| LSB Industries, Inc. | | |
| 6.25%, due 10/15/28 (c) | 7,780,000 | 7,118,311 |
| | | 22,318,697 |
The notes to the financial statements are an integral part of, and should be read in conjunction with, the financial statements.
| 16 | MainStay VP MacKay High Yield Corporate Bond Portfolio |
| | Principal
Amount | Value |
| Corporate Bonds (continued) |
| Office Furnishings 0.1% |
| Interface, Inc. | | |
| 5.50%, due 12/1/28 (c) | $ 4,445,000 | $ 3,670,199 |
| Oil & Gas 6.2% |
| Ascent Resources Utica Holdings LLC (c) | | |
| 7.00%, due 11/1/26 | 3,400,000 | 3,298,066 |
| 9.00%, due 11/1/27 | 2,684,000 | 3,301,320 |
| California Resources Corp. | | |
| 7.125%, due 2/1/26 (c) | 3,500,000 | 3,363,640 |
| Civitas Resources, Inc. | | |
| 5.00%, due 10/15/26 (c) | 2,250,000 | 2,057,075 |
| Colgate Energy Partners III LLC | | |
| 7.75%, due 2/15/26 (c) | 5,640,000 | 5,471,024 |
| Comstock Resources, Inc. | | |
| 6.75%, due 3/1/29 (c) | 3,700,000 | 3,339,250 |
| Encino Acquisition Partners Holdings LLC | | |
| 8.50%, due 5/1/28 (c) | 10,805,000 | 9,875,662 |
| EQT Corp. | | |
| 6.125%, due 2/1/25 (f) | 4,500,000 | 4,510,575 |
| Gulfport Energy Corp. | | |
| 8.00%, due 5/17/26 | 368,464 | 359,252 |
| Gulfport Energy Operating Corp. | | |
| 8.00%, due 5/17/26 (c) | 8,284,024 | 8,076,923 |
| Gulfport Energy Operating Corp. Escrow Claim Shares (g)(h) | | |
| 6.00%, due 10/15/24 | 15,745,000 | — |
| 6.375%, due 5/15/25 | 8,000,000 | — |
| 6.375%, due 1/15/26 | 4,441,000 | — |
| Hilcorp Energy I LP (c) | | |
| 5.75%, due 2/1/29 | 1,610,000 | 1,433,007 |
| 6.00%, due 4/15/30 | 2,400,000 | 2,134,262 |
| 6.25%, due 4/15/32 | 2,455,000 | 2,118,458 |
| Laredo Petroleum, Inc. | | |
| 7.75%, due 7/31/29 (c) | 3,930,000 | 3,537,330 |
| Marathon Oil Corp. | | |
| 4.40%, due 7/15/27 | 3,000,000 | 2,864,917 |
| Matador Resources Co. | | |
| 5.875%, due 9/15/26 | 7,250,000 | 6,970,578 |
| Moss Creek Resources Holdings, Inc. | | |
| 7.50%, due 1/15/26 (c) | 4,065,000 | 3,664,923 |
| Occidental Petroleum Corp. | | |
| 5.55%, due 3/15/26 | 10,200,000 | 10,161,750 |
| 5.875%, due 9/1/25 | 1,500,000 | 1,494,568 |
| 6.375%, due 9/1/28 | 1,500,000 | 1,514,008 |
| | Principal
Amount | Value |
| |
| Oil & Gas (continued) |
Occidental Petroleum Corp.
(continued) | | |
| 6.45%, due 9/15/36 | $ 3,100,000 | $ 3,162,000 |
| 6.625%, due 9/1/30 | 1,940,000 | 2,004,757 |
| 7.50%, due 5/1/31 | 1,200,000 | 1,282,164 |
| Parkland Corp. (c) | | |
| 4.50%, due 10/1/29 | 5,000,000 | 4,166,332 |
| 4.625%, due 5/1/30 | 3,880,000 | 3,210,700 |
| 5.875%, due 7/15/27 | 3,130,000 | 2,971,935 |
| PDC Energy, Inc. | | |
| 6.125%, due 9/15/24 | 2,891,000 | 2,874,521 |
| Permian Resources Operating LLC (c) | | |
| 5.375%, due 1/15/26 | 5,700,000 | 5,188,623 |
| 6.875%, due 4/1/27 | 5,958,000 | 5,613,855 |
| Range Resources Corp. | | |
| 4.75%, due 2/15/30 (c) | 1,000,000 | 881,107 |
| 8.25%, due 1/15/29 | 1,615,000 | 1,664,169 |
| ROCC Holdings LLC | | |
| 9.25%, due 8/15/26 (c) | 3,000,000 | 2,986,802 |
| Rockcliff Energy II LLC | | |
| 5.50%, due 10/15/29 (c) | 9,125,000 | 8,348,919 |
| Southwestern Energy Co. | | |
| 5.375%, due 3/15/30 | 3,360,000 | 3,064,384 |
| 5.70%, due 1/23/25 (f) | 1,008,000 | 990,358 |
| 8.375%, due 9/15/28 | 1,600,000 | 1,649,505 |
| Sunoco LP | | |
| 4.50%, due 5/15/29 | 1,690,000 | 1,478,243 |
| 6.00%, due 4/15/27 | 2,000,000 | 1,969,397 |
| Talos Production, Inc. | | |
| 12.00%, due 1/15/26 | 19,985,000 | 21,017,525 |
| Transocean Pontus Ltd. | | |
| 6.125%, due 8/1/25 (c) | 2,447,200 | 2,397,677 |
| Transocean Poseidon Ltd. | | |
| 6.875%, due 2/1/27 (c) | 6,839,000 | 6,655,168 |
| Transocean Sentry Ltd. | | |
| 5.375%, due 5/15/23 (c) | 2,381,516 | 2,351,747 |
| | | 165,476,476 |
| Oil & Gas Services 1.0% |
| Bristow Group, Inc. | | |
| 6.875%, due 3/1/28 (c) | 8,135,000 | 7,486,924 |
| Nine Energy Service, Inc. | | |
| 8.75%, due 11/1/23 (c) | 10,177,000 | 9,973,460 |
| Weatherford International Ltd. (c) | | |
| 6.50%, due 9/15/28 | 4,495,000 | 4,406,448 |
| 8.625%, due 4/30/30 | 3,970,000 | 3,812,424 |
| | | 25,679,256 |
The notes to the financial statements are an integral part of, and should be read in conjunction with, the financial statements.
17
Portfolio of Investments December 31, 2022† (continued)
| | Principal
Amount | Value |
| Corporate Bonds (continued) |
| Packaging & Containers 0.3% |
| Cascades, Inc. (c) | | |
| 5.125%, due 1/15/26 | $ 2,810,000 | $ 2,556,429 |
| 5.375%, due 1/15/28 | 5,200,000 | 4,552,383 |
| | | 7,108,812 |
| Pharmaceuticals 2.4% |
| 1375209 BC Ltd. | | |
| 9.00%, due 1/30/28 (c) | 991,000 | 964,986 |
| 180 Medical, Inc. | | |
| 3.875%, due 10/15/29 (c) | 3,270,000 | 2,811,219 |
| Bausch Health Cos., Inc. (c) | | |
| 6.25%, due 2/15/29 | 600,000 | 288,863 |
| 7.00%, due 1/15/28 | 1,750,000 | 845,859 |
| 11.00%, due 9/30/28 | 4,000,000 | 3,119,378 |
| 14.00%, due 10/15/30 | 347,000 | 205,995 |
| BellRing Brands, Inc. | | |
| 7.00%, due 3/15/30 (c) | 5,300,000 | 5,099,925 |
| Jazz Securities DAC | | |
| 4.375%, due 1/15/29 (c) | 8,790,000 | 7,833,209 |
| Organon & Co. (c) | | |
| 4.125%, due 4/30/28 | 8,200,000 | 7,260,280 |
| 5.125%, due 4/30/31 | 6,500,000 | 5,628,222 |
| Owens & Minor, Inc. (c) | | |
| 4.50%, due 3/31/29 | 5,640,000 | 4,496,772 |
| 6.625%, due 4/1/30 | 6,065,000 | 5,212,261 |
| Par Pharmaceutical, Inc. | | |
| 7.50%, due 4/1/27 (c)(h)(j) | 10,311,000 | 7,836,099 |
| Prestige Brands, Inc. (c) | | |
| 3.75%, due 4/1/31 | 10,040,000 | 8,279,687 |
| 5.125%, due 1/15/28 | 4,895,000 | 4,595,092 |
| | | 64,477,847 |
| Pipelines 5.6% |
| ANR Pipeline Co. | | |
| 7.375%, due 2/15/24 | 395,000 | 395,427 |
| Antero Midstream Partners LP (c) | | |
| 5.375%, due 6/15/29 | 1,500,000 | 1,371,360 |
| 5.75%, due 1/15/28 | 1,565,000 | 1,451,710 |
| CNX Midstream Partners LP | | |
| 4.75%, due 4/15/30 (c) | 2,285,000 | 1,875,220 |
| Crestwood Midstream Partners LP | | |
| 8.00%, due 4/1/29 (c) | 2,150,000 | 2,139,433 |
| DT Midstream, Inc. (c) | | |
| 4.125%, due 6/15/29 | 1,355,000 | 1,164,094 |
| 4.375%, due 6/15/31 | 2,975,000 | 2,495,727 |
| Energy Transfer LP | | |
| 4.40%, due 3/15/27 | 4,788,000 | 4,548,241 |
| | Principal
Amount | Value |
| |
| Pipelines (continued) |
| EnLink Midstream LLC | | |
| 6.50%, due 9/1/30 (c) | $ 1,675,000 | $ 1,657,748 |
| EQM Midstream Partners LP | | |
| 4.50%, due 1/15/29 (c) | 1,880,000 | 1,579,063 |
| 4.75%, due 1/15/31 (c) | 2,700,000 | 2,207,250 |
| 5.50%, due 7/15/28 | 720,000 | 643,794 |
| 6.00%, due 7/1/25 (c) | 1,092,000 | 1,053,777 |
| 6.50%, due 7/1/27 (c) | 1,850,000 | 1,768,138 |
| 7.50%, due 6/1/30 (c) | 1,480,000 | 1,426,010 |
| FTAI Infra Escrow Holdings LLC | | |
| 10.50%, due 6/1/27 (c) | 5,600,000 | 5,626,544 |
| Genesis Energy LP | | |
| 5.625%, due 6/15/24 | 1,000,000 | 964,995 |
| 6.25%, due 5/15/26 | 3,596,000 | 3,290,220 |
| 6.50%, due 10/1/25 | 1,600,000 | 1,529,136 |
| 7.75%, due 2/1/28 | 1,700,000 | 1,564,816 |
| 8.00%, due 1/15/27 | 7,170,000 | 6,772,567 |
| Harvest Midstream I LP | | |
| 7.50%, due 9/1/28 (c) | 6,965,000 | 6,647,675 |
| Hess Midstream Operations LP (c) | | |
| 4.25%, due 2/15/30 | 2,000,000 | 1,709,842 |
| 5.625%, due 2/15/26 | 3,300,000 | 3,214,480 |
| Holly Energy Partners LP (c) | | |
| 5.00%, due 2/1/28 | 2,845,000 | 2,590,390 |
| 6.375%, due 4/15/27 | 1,565,000 | 1,537,600 |
| ITT Holdings LLC | | |
| 6.50%, due 8/1/29 (c) | 5,310,000 | 4,471,763 |
| MPLX LP | | |
| 4.875%, due 12/1/24 | 3,240,000 | 3,213,508 |
| 4.875%, due 6/1/25 | 6,708,000 | 6,605,179 |
| New Fortress Energy, Inc. | | |
| 6.50%, due 9/30/26 (c) | 5,060,000 | 4,699,222 |
| NGL Energy Operating LLC | | |
| 7.50%, due 2/1/26 (c) | 4,120,000 | 3,668,412 |
| NGPL PipeCo LLC | | |
| 4.875%, due 8/15/27 (c) | 4,280,000 | 4,064,940 |
| Northwest Pipeline LLC | | |
| 7.125%, due 12/1/25 | 2,195,000 | 2,267,326 |
| PBF Logistics LP | | |
| 6.875%, due 5/15/23 | 1,200,000 | 1,198,500 |
| Plains All American Pipeline LP | | |
| Series B | | |
| 8.716% (3 Month LIBOR + 4.11%), due 1/30/23 (d)(e) | 14,265,000 | 12,267,900 |
| Rockies Express Pipeline LLC (c) | | |
| 3.60%, due 5/15/25 | 2,000,000 | 1,888,580 |
| 4.80%, due 5/15/30 | 5,000,000 | 4,399,777 |
The notes to the financial statements are an integral part of, and should be read in conjunction with, the financial statements.
| 18 | MainStay VP MacKay High Yield Corporate Bond Portfolio |
| | Principal
Amount | Value |
| Corporate Bonds (continued) |
| Pipelines (continued) |
| Ruby Pipeline LLC | | |
| 8.00%, due 4/1/22 (c)(f)(h)(j) | $ 14,811,364 | $ 16,070,330 |
| Summit Midstream Holdings LLC | | |
| 8.50%, due 10/15/26 (c) | 8,215,000 | 7,824,130 |
| Tallgrass Energy Partners LP | | |
| 6.00%, due 3/1/27 (c) | 1,500,000 | 1,400,427 |
| TransMontaigne Partners LP | | |
| 6.125%, due 2/15/26 | 8,330,000 | 7,163,800 |
| Western Midstream Operating LP | | |
| 4.65%, due 7/1/26 | 2,000,000 | 1,898,120 |
| 5.50%, due 8/15/48 | 5,000,000 | 4,149,862 |
| | | 148,477,033 |
| Real Estate 0.7% |
| Howard Hughes Corp. (The) (c) | | |
| 4.125%, due 2/1/29 | 3,300,000 | 2,763,750 |
| 4.375%, due 2/1/31 | 2,500,000 | 2,022,672 |
| Newmark Group, Inc. | | |
| 6.125%, due 11/15/23 | 9,839,000 | 9,745,650 |
| Realogy Group LLC (c) | | |
| 5.25%, due 4/15/30 | 2,050,000 | 1,495,496 |
| 5.75%, due 1/15/29 | 2,750,000 | 2,080,072 |
| | | 18,107,640 |
| Real Estate Investment Trusts 2.3% |
| CTR Partnership LP | | |
| 3.875%, due 6/30/28 (c) | 3,680,000 | 3,109,698 |
| GLP Capital LP | | |
| 5.30%, due 1/15/29 | 5,700,000 | 5,394,138 |
| 5.375%, due 11/1/23 | 1,500,000 | 1,494,788 |
| 5.375%, due 4/15/26 | 1,506,000 | 1,477,487 |
| MPT Operating Partnership LP | | |
| 4.625%, due 8/1/29 | 1,500,000 | 1,143,877 |
| 5.00%, due 10/15/27 | 6,726,000 | 5,653,405 |
| RHP Hotel Properties LP | | |
| 4.50%, due 2/15/29 (c) | 2,600,000 | 2,242,743 |
| 4.75%, due 10/15/27 | 7,325,000 | 6,629,207 |
| SBA Communications Corp. | | |
| 3.875%, due 2/15/27 | 3,000,000 | 2,710,540 |
| VICI Properties LP (c) | | |
| 3.875%, due 2/15/29 | 5,000,000 | 4,382,171 |
| 4.625%, due 6/15/25 | 3,100,000 | 2,972,125 |
| 5.625%, due 5/1/24 | 17,820,000 | 17,646,433 |
| 5.75%, due 2/1/27 | 6,525,000 | 6,360,315 |
| | | 61,216,927 |
| | Principal
Amount | Value |
| |
| Retail 6.0% |
| 1011778 BC ULC (c) | | |
| 3.50%, due 2/15/29 | $ 4,355,000 | $ 3,735,780 |
| 3.875%, due 1/15/28 | 6,165,000 | 5,514,873 |
| 4.00%, due 10/15/30 | 14,205,000 | 11,503,351 |
| Asbury Automotive Group, Inc. | | |
| 4.50%, due 3/1/28 | 4,631,000 | 4,077,132 |
| 4.625%, due 11/15/29 (c) | 5,320,000 | 4,482,845 |
| 4.75%, due 3/1/30 | 5,212,000 | 4,359,065 |
| 5.00%, due 2/15/32 (c) | 2,800,000 | 2,303,560 |
| CEC Entertainment LLC | | |
| 6.75%, due 5/1/26 (c) | 4,700,000 | 4,371,000 |
| Dave & Buster's, Inc. | | |
| 7.625%, due 11/1/25 (c) | 3,005,000 | 3,020,025 |
| Group 1 Automotive, Inc. | | |
| 4.00%, due 8/15/28 (c) | 4,165,000 | 3,525,382 |
| Ken Garff Automotive LLC | | |
| 4.875%, due 9/15/28 (c) | 6,700,000 | 5,604,737 |
| KFC Holding Co. | | |
| 4.75%, due 6/1/27 (c) | 5,775,000 | 5,544,000 |
| LCM Investments Holdings II LLC | | |
| 4.875%, due 5/1/29 (c) | 13,030,000 | 10,434,275 |
| Lithia Motors, Inc. (c) | | |
| 4.375%, due 1/15/31 | 2,000,000 | 1,627,211 |
| 4.625%, due 12/15/27 | 700,000 | 631,358 |
| Murphy Oil USA, Inc. | | |
| 4.75%, due 9/15/29 | 3,000,000 | 2,745,090 |
| 5.625%, due 5/1/27 | 2,994,000 | 2,907,204 |
| NMG Holding Co., Inc. | | |
| 7.125%, due 4/1/26 (c) | 21,170,000 | 19,841,953 |
| Papa John's International, Inc. | | |
| 3.875%, due 9/15/29 (c) | 4,415,000 | 3,686,525 |
| Patrick Industries, Inc. (c) | | |
| 4.75%, due 5/1/29 | 2,295,000 | 1,904,850 |
| 7.50%, due 10/15/27 | 5,615,000 | 5,446,711 |
| Penske Automotive Group, Inc. | | |
| 3.50%, due 9/1/25 | 2,000,000 | 1,856,119 |
| PetSmart, Inc. | | |
| 7.75%, due 2/15/29 (c) | 4,005,000 | 3,761,466 |
| Sonic Automotive, Inc. (c) | | |
| 4.625%, due 11/15/29 | 4,510,000 | 3,611,192 |
| 4.875%, due 11/15/31 | 3,000,000 | 2,358,554 |
| TPro Acquisition Corp. | | |
| 11.00%, due 10/15/24 (c) | 1,500,000 | 1,487,603 |
| Ultra Resources, Inc. Escrow Claim Shares | | |
| 6.875%, due 4/15/22 (a)(g)(h) | 9,675,000 | — |
| Yum! Brands, Inc. | | |
| 3.625%, due 3/15/31 | 11,870,000 | 9,952,995 |
The notes to the financial statements are an integral part of, and should be read in conjunction with, the financial statements.
19
Portfolio of Investments December 31, 2022† (continued)
| | Principal
Amount | Value |
| Corporate Bonds (continued) |
| Retail (continued) |
| Yum! Brands, Inc. (continued) | | |
| 4.625%, due 1/31/32 | $ 10,950,000 | $ 9,678,998 |
| 4.75%, due 1/15/30 (c) | 10,432,000 | 9,571,360 |
| 5.375%, due 4/1/32 | 8,235,000 | 7,627,669 |
| 6.875%, due 11/15/37 | 2,000,000 | 2,028,300 |
| | | 159,201,183 |
| Software 4.1% |
| ACI Worldwide, Inc. | | |
| 5.75%, due 8/15/26 (c) | 4,405,000 | 4,267,344 |
| AthenaHealth Group, Inc. | | |
| 6.50%, due 2/15/30 (c) | 5,180,000 | 3,817,309 |
| Camelot Finance SA | | |
| 4.50%, due 11/1/26 (c) | 4,480,000 | 4,198,883 |
| Clarivate Science Holdings Corp. (c) | | |
| 3.875%, due 7/1/28 | 8,235,000 | 7,134,771 |
| 4.875%, due 7/1/29 | 12,695,000 | 10,795,193 |
| CWT Travel Group, Inc. | | |
| 8.50%, due 11/19/26 (c) | 2,297,916 | 1,941,969 |
| Fair Isaac Corp. | | |
| 5.25%, due 5/15/26 (c) | 3,219,000 | 3,151,176 |
| MSCI, Inc. (c) | | |
| 3.25%, due 8/15/33 | 6,350,000 | 4,903,841 |
| 3.625%, due 9/1/30 | 7,315,000 | 6,080,594 |
| 3.625%, due 11/1/31 | 6,000,000 | 4,961,880 |
| 3.875%, due 2/15/31 | 10,620,000 | 8,829,733 |
| 4.00%, due 11/15/29 | 9,500,000 | 8,274,831 |
| Open Text Corp. (c) | | |
| 3.875%, due 2/15/28 | 4,560,000 | 3,913,073 |
| 3.875%, due 12/1/29 | 4,430,000 | 3,562,553 |
| 6.90%, due 12/1/27 | 3,150,000 | 3,150,000 |
| Open Text Holdings, Inc. (c) | | |
| 4.125%, due 2/15/30 | 8,499,000 | 6,817,600 |
| 4.125%, due 12/1/31 | 4,425,000 | 3,439,532 |
| PTC, Inc. (c) | | |
| 3.625%, due 2/15/25 | 3,400,000 | 3,238,264 |
| 4.00%, due 2/15/28 | 9,236,000 | 8,312,704 |
| SS&C Technologies, Inc. | | |
| 5.50%, due 9/30/27 (c) | 5,885,000 | 5,510,691 |
| Veritas US, Inc. | | |
| 7.50%, due 9/1/25 (c) | 4,125,000 | 2,840,965 |
| | | 109,142,906 |
| Telecommunications 4.1% |
| Connect Finco SARL | | |
| 6.75%, due 10/1/26 (c) | 14,525,000 | 13,461,182 |
| | Principal
Amount | Value |
| |
| Telecommunications (continued) |
| Hughes Satellite Systems Corp. | | |
| 5.25%, due 8/1/26 | $ 3,000,000 | $ 2,877,600 |
| 6.625%, due 8/1/26 | 3,000,000 | 2,798,220 |
| Level 3 Financing, Inc. | | |
| 3.75%, due 7/15/29 (c) | 1,500,000 | 1,079,055 |
| Quebecor Media, Inc. | | |
| 5.75%, due 1/15/23 | 10,147,000 | 10,122,749 |
| Sprint Capital Corp. | | |
| 6.875%, due 11/15/28 | 31,815,000 | 33,022,061 |
| Sprint LLC | | |
| 7.875%, due 9/15/23 | 14,030,000 | 14,226,224 |
| T-Mobile US, Inc. | | |
| 2.875%, due 2/15/31 | 6,350,000 | 5,247,184 |
| 3.375%, due 4/15/29 | 3,000,000 | 2,642,308 |
| 3.50%, due 4/15/31 | 2,500,000 | 2,159,499 |
| 4.75%, due 2/1/28 | 11,450,000 | 11,132,695 |
| 5.375%, due 4/15/27 | 8,875,000 | 8,959,836 |
| | | 107,728,613 |
| Toys, Games & Hobbies 0.2% |
| Mattel, Inc. (c) | | |
| 3.375%, due 4/1/26 | 3,200,000 | 2,942,095 |
| 3.75%, due 4/1/29 | 3,000,000 | 2,634,975 |
| | | 5,577,070 |
| Transportation 0.6% |
| Seaspan Corp. | | |
| 5.50%, due 8/1/29 (c) | 5,075,000 | 3,845,835 |
| Watco Cos. LLC | | |
| 6.50%, due 6/15/27 (c) | 12,665,000 | 12,031,750 |
| | | 15,877,585 |
Total Corporate Bonds
(Cost $2,576,043,099) | | 2,320,064,836 |
| Loan Assignments 4.2% |
| Automobile 0.2% |
| Dealer Tire Financial LLC | |
| Term Loan B2 | |
| 8.823% (3 Month LIBOR + 4.50%), due 12/14/27 (d) | 4,000,000 | 3,945,000 |
| Beverage, Food & Tobacco 0.1% |
| United Natural Foods, Inc. | |
| Initial Term Loan | |
| 7.688% (1 Month LIBOR + 3.25%), due 10/22/25 (d) | 3,567,324 | 3,553,204 |
The notes to the financial statements are an integral part of, and should be read in conjunction with, the financial statements.
| 20 | MainStay VP MacKay High Yield Corporate Bond Portfolio |
| | Principal
Amount | Value |
| Loan Assignments (continued) |
| Chemicals, Plastics & Rubber 0.3% |
| Innophos Holdings, Inc. | |
| Initial Term Loan | |
| 7.634% (1 Month LIBOR + 3.25%), due 2/5/27 (d) | $ 1,847,750 | $ 1,803,866 |
| Jazz Pharmaceuticals plc | |
| Initial Dollar Term Loan | |
| 7.884% (1 Month LIBOR + 3.50%), due 5/5/28 (d) | 6,223,861 | 6,162,488 |
| | | 7,966,354 |
| Finance 0.5% |
| AAdvantage Loyality IP Ltd. | |
| Initial Term Loan | |
| 8.993% (3 Month LIBOR + 4.75%), due 4/20/28 (d) | 2,000,000 | 1,988,250 |
| RealTruck Group, Inc. | |
| Initial Term Loan | |
| 8.134% (1 Month LIBOR + 3.75%), due 1/31/28 (d) | 3,348,873 | 2,858,501 |
| Schweitzer-Mauduit International, Inc. | |
| Term Loan B | |
| 8.188% (1 Month LIBOR + 3.75%), due 4/20/28 (d) | 5,171,250 | 4,860,975 |
| Superannuation and Investments Finco Pty. Ltd. | |
| Initial U.S. Term Loan | |
| 8.134% (1 Month LIBOR + 3.75%), due 12/1/28 (d) | 2,673,000 | 2,620,876 |
| | | 12,328,602 |
| Healthcare, Education & Childcare 0.3% |
| LifePoint Health, Inc. | |
| First Lien Term Loan B | |
| 8.165% (3 Month LIBOR + 3.75%), due 11/16/25 (d) | 8,540,607 | 8,032,441 |
| High Tech Industries 0.2% |
| Open Text Corp. | |
| Term Loan B | |
| TBD, due 11/16/29 | 5,000,000 | 4,871,875 |
| Leisure, Amusement, Motion Pictures & Entertainment 0.1% |
| Carnival Corp. | |
| 2021 Incremental Advance Term Loan B | |
| 7.634% (1 Month LIBOR + 3.25%), due 10/18/28 (d) | 3,366,000 | 3,138,795 |
| | Principal
Amount | Value |
| |
| Manufacturing 0.1% |
| Adient U.S. LLC | |
| Term Loan B1 | |
| 7.634% (1 Month LIBOR + 3.25%), due 4/10/28 (d) | $ 3,743,000 | $ 3,692,312 |
| Media 0.3% |
| Directv Financing LLC | |
| Closing Date Term Loan | |
| 9.384% (1 Month LIBOR + 5.00%), due 8/2/27 (d) | 8,022,094 | 7,780,180 |
| Oil & Gas 0.5% |
| Ascent Resources Utica Holdings LLC | |
| Second Lien Term Loan | |
| 12.941% (3 Month LIBOR + 9.00%), due 11/1/25 (d) | 2,842,000 | 2,991,205 |
| PetroQuest Energy LLC (a)(g) | |
| Term Loan 11.571% - 11.884% | |
| (11.88% PIK) (1 Month LIBOR + 7.50%), due 11/8/23 (b)(d) | 6,322,638 | 5,690,375 |
| Term Loan | |
| 11.529% (1 Month LIBOR + 4.029%), due 1/1/28 (d) | 795,553 | 795,553 |
| 2020 Term Loan | |
| 11.62% (11.62% PIK), due 9/19/26 (b) | 610,918 | 610,918 |
| TransMontaigne Operating Co. LP | |
| Tranche Term Loan B 7.854% - 7.889% | |
| (1 Month LIBOR + 3.50%), due 11/17/28 (d) | 3,366,000 | 3,294,472 |
| | | 13,382,523 |
| Personal, Food & Miscellaneous Services 0.0% ‡ |
| WW International, Inc. | |
| Initial Term Loan | |
| 7.89% (1 Month LIBOR + 3.50%), due 4/13/28 (d) | 1,550,000 | 875,750 |
| Retail 0.8% |
| Great Outdoors Group LLC | |
| Term Loan B2 | |
| 8.134% (1 Month LIBOR + 3.75%), due 3/6/28 (d) | 21,577,396 | 20,718,788 |
The notes to the financial statements are an integral part of, and should be read in conjunction with, the financial statements.
21
Portfolio of Investments December 31, 2022† (continued)
| | Principal
Amount | Value |
| Loan Assignments (continued) |
| Services Business 0.1% |
| GIP II Blue Holding LP | |
| Initial Term Loan | |
| 9.23% (3 Month LIBOR + 4.50%), due 9/29/28 (d) | $ 3,455,346 | $ 3,418,941 |
| Software 0.2% |
| TIBCO Software, Inc. (d) | |
| First Lien Term Loan A | |
| 9.18% (3 Month SOFR + 4.50%), due 9/29/28 | 3,000,000 | 2,640,000 |
| First Lien Dollar Term Loan B | |
| 9.18% (3 Month SOFR + 4.50%), due 3/30/29 | 3,000,000 | 2,672,499 |
| | | 5,312,499 |
| Utilities 0.5% |
| PG&E Corp. | |
| Term Loan | |
| 7.438% (1 Month LIBOR + 3.00%), due 6/23/25 (d) | 13,162,500 | 13,027,584 |
Total Loan Assignments
(Cost $115,173,878) | | 112,044,848 |
Total Long-Term Bonds
(Cost $2,716,146,219) | | 2,459,433,286 |
| |
| | Shares | |
| Common Stocks 2.1% |
| Distributors 0.1% |
| ATD New Holdings, Inc. (k) | 44,740 | 3,131,800 |
| Electric Utilities 0.0% ‡ |
| Keycon Power Holdings LLC (a)(g)(k) | 11,280 | 113 |
| Electrical Equipment 0.0% ‡ |
| Energy Technologies, Inc. (a)(g)(k) | 4,822 | 964,400 |
| Hotels, Restaurants & Leisure 0.1% |
| Carlson Travel, Inc. (a)(i)(k) | 529,813 | 2,781,518 |
| Independent Power and Renewable Electricity Producers 0.4% |
| GenOn Energy, Inc. (i) | 115,826 | 11,003,470 |
| | Shares | | Value |
| |
| Oil, Gas & Consumable Fuels 1.5% |
| Chord Energy Corp. | 21,083 | | $ 2,884,365 |
| Gulfport Energy Corp. (k) | 323,995 | | 23,858,992 |
| PetroQuest Energy, Inc. (a)(g)(k) | 8,224,665 | | — |
| Talos Energy, Inc. (k) | 623,880 | | 11,778,855 |
| | | | 38,522,212 |
| Software 0.0% ‡ |
| ASG warrant Corp. (a)(g)(k) | 3,368 | | — |
Total Common Stocks
(Cost $92,126,389) | | | 56,403,513 |
| Preferred Stocks 0.3% |
| Electrical Equipment 0.3% |
| Energy Technologies Ltd. (a)(g)(k) | 10,741 | | 7,142,765 |
| Oil, Gas & Consumable Fuels 0.0% ‡ |
| Gulfport Energy Operating Corp., 10.00%(10.00% Cash or 15.00% PIK) (a)(b)(g)(i)(k) | 39 | | 177,569 |
Total Preferred Stocks
(Cost $10,336,701) | | | 7,320,334 |
| |
| | Number of
Warrants | | |
| Warrants 0.0% ‡ |
| Hotels, Restaurants & Leisure 0.0% ‡ |
| CWT Travel Holdings, Inc. (g)(k) | | | |
| Expires 11/19/26 | 44,246 | | 359 |
| Expires 11/19/28 | 46,574 | | 1,830 |
| | | | 2,189 |
| Oil, Gas & Consumable Fuels 0.0% ‡ |
| California Resources Corp. | | | |
| Expires 10/27/24 (k) | 9,742 | | 122,749 |
Total Warrants
(Cost $8,174,223) | | | 124,938 |
Total Investments
(Cost $2,826,783,532) | 95.1% | | 2,523,282,071 |
| Other Assets, Less Liabilities | 4.9 | | 131,272,870 |
| Net Assets | 100.0% | | $ 2,654,554,941 |
The notes to the financial statements are an integral part of, and should be read in conjunction with, the financial statements.
| 22 | MainStay VP MacKay High Yield Corporate Bond Portfolio |
| † | Percentages indicated are based on Portfolio net assets. |
| ‡ | Less than one-tenth of a percent. |
| (a) | Illiquid security—As of December 31, 2022, the total market value deemed illiquid under procedures approved by the Board of Trustees was $31,589,581, which represented 1.2% of the Portfolio’s net assets. (Unaudited) |
| (b) | PIK ("Payment-in-Kind")—issuer may pay interest or dividends with additional securities and/or in cash. |
| (c) | May be sold to institutional investors only under Rule 144A or securities offered pursuant to Section 4(a)(2) of the Securities Act of 1933, as amended. |
| (d) | Floating rate—Rate shown was the rate in effect as of December 31, 2022. |
| (e) | Security is perpetual and, thus, does not have a predetermined maturity date. The date shown, if applicable, reflects the next call date. |
| (f) | Step coupon—Rate shown was the rate in effect as of December 31, 2022. |
| (g) | Security in which significant unobservable inputs (Level 3) were used in determining fair value. |
| (h) | Issue in non-accrual status. |
| (i) | Restricted security. (See Note 5) |
| (j) | Issue in default. |
| (k) | Non-income producing security. |
| Abbreviation(s): |
| LIBOR—London Interbank Offered Rate |
| SOFR—Secured Overnight Financing Rate |
| TBD—To Be Determined |
The following is a summary of the fair valuations according to the inputs used as of December 31, 2022, for valuing the Portfolio’s assets:
| Description | Quoted
Prices in
Active
Markets for
Identical
Assets
(Level 1) | | Significant
Other
Observable
Inputs
(Level 2) | | Significant
Unobservable
Inputs
(Level 3) | | Total |
| Asset Valuation Inputs | | | | | | | |
| Investments in Securities (a) | | | | | | | |
| Long-Term Bonds | | | | | | | |
| Convertible Bonds | $ — | | $ 27,323,602 | | $ — | | $ 27,323,602 |
| Corporate Bonds | — | | 2,313,557,636 | | 6,507,200 | | 2,320,064,836 |
| Loan Assignments | — | | 104,948,002 | | 7,096,846 | | 112,044,848 |
| Total Long-Term Bonds | — | | 2,445,829,240 | | 13,604,046 | | 2,459,433,286 |
| Common Stocks | 38,522,212 | | 16,916,788 | | 964,513 | | 56,403,513 |
| Preferred Stocks | — | | — | | 7,320,334 | | 7,320,334 |
| Warrants | 122,749 | | — | | 2,189 | | 124,938 |
| Total Investments in Securities | $ 38,644,961 | | $ 2,462,746,028 | | $ 21,891,082 | | $ 2,523,282,071 |
| (a) | For a complete listing of investments and their industries, see the Portfolio of Investments. |
The notes to the financial statements are an integral part of, and should be read in conjunction with, the financial statements.
23
Statement of Assets and Liabilities as of December 31, 2022
| Assets |
Investment in securities, at value
(identified cost $2,826,783,532) | $2,523,282,071 |
| Cash | 96,911,596 |
| Receivables: | |
| Interest | 40,516,506 |
| Portfolio shares sold | 1,161,448 |
| Other assets | 351,033 |
| Total assets | 2,662,222,654 |
| Liabilities |
| Payables: | |
| Investment securities purchased | 4,850,000 |
| Manager (See Note���3) | 1,273,589 |
| Portfolio shares redeemed | 850,329 |
| NYLIFE Distributors (See Note 3) | 475,824 |
| Shareholder communication | 106,577 |
| Professional fees | 76,507 |
| Custodian | 12,147 |
| Accrued expenses | 22,740 |
| Total liabilities | 7,667,713 |
| Net assets | $2,654,554,941 |
| Composition of Net Assets |
| Shares of beneficial interest outstanding (par value of $.001 per share) unlimited number of shares authorized | $ 312,577 |
| Additional paid-in-capital | 2,955,900,503 |
| | 2,956,213,080 |
| Total distributable earnings (loss) | (301,658,139) |
| Net assets | $2,654,554,941 |
| Initial Class | |
| Net assets applicable to outstanding shares | $ 444,733,474 |
| Shares of beneficial interest outstanding | 51,605,454 |
| Net asset value per share outstanding | $ 8.62 |
| Service Class | |
| Net assets applicable to outstanding shares | $2,209,821,467 |
| Shares of beneficial interest outstanding | 260,971,724 |
| Net asset value per share outstanding | $ 8.47 |
The notes to the financial statements are an integral part of, and should be read in conjunction with, the financial statements.
| 24 | MainStay VP MacKay High Yield Corporate Bond Portfolio |
Statement of Operations for the year ended December 31, 2022
| Investment Income (Loss) |
| Income | |
| Interest | $ 166,256,702 |
| Dividends | 1,313,962 |
| Other | 1,650,680 |
| Total income | 169,221,344 |
| Expenses | |
| Manager (See Note 3) | 16,411,011 |
| Distribution/Service—Service Class (See Note 3) | 6,060,807 |
| Professional fees | 260,108 |
| Shareholder communication | 151,297 |
| Custodian | 74,228 |
| Trustees | 65,174 |
| Miscellaneous | 87,139 |
| Total expenses | 23,109,764 |
| Net investment income (loss) | 146,111,580 |
| Realized and Unrealized Gain (Loss) |
| Net realized gain (loss) on investments | (27,833,550) |
| Net change in unrealized appreciation (depreciation) on investments | (393,576,205) |
| Net realized and unrealized gain (loss) | (421,409,755) |
| Net increase (decrease) in net assets resulting from operations | $(275,298,175) |
The notes to the financial statements are an integral part of, and should be read in conjunction with, the financial statements.
25
Statements of Changes in Net Assets
for the years ended December 31, 2022 and December 31, 2021
| | 2022 | 2021 |
| Increase (Decrease) in Net Assets |
| Operations: | | |
| Net investment income (loss) | $ 146,111,580 | $ 144,628,313 |
| Net realized gain (loss) | (27,833,550) | 47,667,595 |
| Net change in unrealized appreciation (depreciation) | (393,576,205) | (27,683,811) |
| Net increase (decrease) in net assets resulting from operations | (275,298,175) | 164,612,097 |
| Distributions to shareholders: | | |
| Initial Class | (24,718,944) | (28,606,278) |
| Service Class | (121,925,643) | (127,887,903) |
| Total distributions to shareholders | (146,644,587) | (156,494,181) |
| Capital share transactions: | | |
| Net proceeds from sales of shares | 170,826,531 | 458,787,335 |
| Net asset value of shares issued to shareholders in reinvestment of distributions | 146,644,587 | 156,494,181 |
| Cost of shares redeemed | (612,645,987) | (327,535,675) |
| Increase (decrease) in net assets derived from capital share transactions | (295,174,869) | 287,745,841 |
| Net increase (decrease) in net assets | (717,117,631) | 295,863,757 |
| Net Assets |
| Beginning of year | 3,371,672,572 | 3,075,808,815 |
| End of year | $2,654,554,941 | $3,371,672,572 |
The notes to the financial statements are an integral part of, and should be read in conjunction with, the financial statements.
| 26 | MainStay VP MacKay High Yield Corporate Bond Portfolio |
Financial Highlights selected per share data and ratios
| | Year Ended December 31, |
| Initial Class | 2022 | | 2021 | | 2020 | | 2019 | | 2018 |
| Net asset value at beginning of year | $ 9.94 | | $ 9.89 | | $ 9.96 | | $ 9.32 | | $ 10.05 |
| Net investment income (loss) (a) | 0.47 | | 0.47 | | 0.54 | | 0.58 | | 0.55 |
| Net realized and unrealized gain (loss) | (1.29) | | 0.08 | | (0.04) | | 0.64 | | (0.68) |
| Total from investment operations | (0.82) | | 0.55 | | 0.50 | | 1.22 | | (0.13) |
| Less distributions: | | | | | | | | | |
| From net investment income | (0.50) | | (0.50) | | (0.57) | | (0.58) | | (0.60) |
| Net asset value at end of year | $ 8.62 | | $ 9.94 | | $ 9.89 | | $ 9.96 | | $ 9.32 |
| Total investment return (b) | (8.06)% | | 5.51% | | 5.40% | | 13.22% | | (1.46)% |
| Ratios (to average net assets)/Supplemental Data: | | | | | | | | | |
| Net investment income (loss) | 5.15% | | 4.66% | | 5.56% | | 5.84% | | 5.58% |
| Net expenses | 0.58% | | 0.58% | | 0.59%(c) | | 0.59%(c) | | 0.58%(c) |
| Portfolio turnover rate | 12% | | 35% | | 39% | | 28% | | 28% |
| Net assets at end of year (in 000's) | $ 444,733 | | $ 592,890 | | $ 461,075 | | $ 471,775 | | $ 458,129 |
| (a) | Per share data based on average shares outstanding during the year. |
| (b) | Total return does not reflect any deduction of sales charges, mortality and expense charges, contract charges or administrative charges. For periods of less than one year, total return is not annualized. |
| (c) | In addition to the fees and expenses which the Portfolio bears directly, it also indirectly bears a pro-rata share of the fees and expenses of the underlying funds in which it invests. Such indirect expenses are not included in the above expense ratios. |
| | Year Ended December 31, |
| Service Class | 2022 | | 2021 | | 2020 | | 2019 | | 2018 |
| Net asset value at beginning of year | $ 9.77 | | $ 9.74 | | $ 9.81 | | $ 9.19 | | $ 9.91 |
| Net investment income (loss) (a) | 0.44 | | 0.44 | | 0.50 | | 0.55 | | 0.52 |
| Net realized and unrealized gain (loss) | (1.26) | | 0.06 | | (0.02) | | 0.62 | | (0.66) |
| Total from investment operations | (0.82) | | 0.50 | | 0.48 | | 1.17 | | (0.14) |
| Less distributions: | | | | | | | | | |
| From net investment income | (0.48) | | (0.47) | | (0.55) | | (0.55) | | (0.58) |
| Net asset value at end of year | $ 8.47 | | $ 9.77 | | $ 9.74 | | $ 9.81 | | $ 9.19 |
| Total investment return (b) | (8.29)% | | 5.25% | | 5.14% | | 12.94% | | (1.71)% |
| Ratios (to average net assets)/Supplemental Data: | | | | | | | | | |
| Net investment income (loss) | 4.91% | | 4.43% | | 5.31% | | 5.60% | | 5.33% |
| Net expenses | 0.83% | | 0.83% | | 0.84%(c) | | 0.84%(c) | | 0.83%(c) |
| Portfolio turnover rate | 12% | | 35% | | 39% | | 28% | | 28% |
| Net assets at end of year (in 000's) | $ 2,209,821 | | $ 2,778,783 | | $ 2,614,734 | | $ 2,557,069 | | $ 2,298,144 |
| (a) | Per share data based on average shares outstanding during the year. |
| (b) | Total return does not reflect any deduction of sales charges, mortality and expense charges, contract charges or administrative charges. For periods of less than one year, total return is not annualized. |
| (c) | In addition to the fees and expenses which the Portfolio bears directly, it also indirectly bears a pro-rata share of the fees and expenses of the underlying funds in which it invests. Such indirect expenses are not included in the above expense ratios. |
The notes to the financial statements are an integral part of, and should be read in conjunction with, the financial statements.
27
Notes to Financial Statements
Note 1–Organization and Business
MainStay VP Funds Trust (the “Fund”) was organized as a Delaware statutory trust on February 1, 2011. The Fund is registered under the Investment Company Act of 1940, as amended (the “1940 Act”), as an open-end management investment company. The Fund is comprised of thirty-one separate series (collectively referred to as the “Portfolios”). These financial statements and notes relate to the MainStay VP MacKay High Yield Corporate Bond Portfolio (the "Portfolio"), a "diversified” portfolio, as that term is defined in the 1940 Act, as interpreted or modified by regulatory authorities having jurisdiction, from time to time.
Shares of the Portfolio are currently offered to certain separate accounts to fund variable annuity policies and variable universal life insurance policies issued by New York Life Insurance and Annuity Corporation (“NYLIAC”), a wholly-owned subsidiary of New York Life Insurance Company (“New York Life”) and may also be offered to fund variable annuity policies and variable universal life insurance policies issued by other insurance companies. NYLIAC allocates shares of the Portfolio to, among others, certain NYLIAC separate accounts. Shares of the Portfolio are also offered to the MainStay VP Conservative Allocation Portfolio, MainStay VP Moderate Allocation Portfolio, MainStay VP Growth Allocation Portfolio and MainStay VP Equity Allocation Portfolio, which operate as “funds-of-funds," and other variable insurance funds.
The following table lists the Portfolio's share classes that have been registered and commenced operations:
| Class | Commenced Operations |
| Initial Class | May 1, 1995 |
| Service Class | June 4, 2003 |
Shares of the Portfolio are offered and are redeemed at a price equal to their respective net asset value (“NAV”) per share. No sales or redemption charge is applicable to the purchase or redemption of the Portfolio's shares. Under the terms of the Fund’s multiple class plan, adopted pursuant to Rule 18f-3 under the 1940 Act, the classes differ in that, among other things, Service Class shares of the Portfolio pay a combined distribution and service fee of 0.25% of average daily net assets attributable to Service Class shares of the Portfolio to the Distributor (as defined in Note 3(B)) pursuant to a plan adopted in accordance with Rule 12b-1 under the 1940 Act. Contract owners of variable annuity contracts purchased after June 2, 2003, are permitted to invest only in the Service Class shares.
The Portfolio's investment objective is to seek maximum current income through investment in a diversified portfolio of high-yield debt securities. Capital appreciation is a secondary objective.
Note 2–Significant Accounting Policies
The Portfolio is an investment company and accordingly follows the investment company accounting and reporting guidance of the Financial Accounting Standards Board (“FASB”) Accounting Standards Codification Topic 946 Financial Services—Investment Companies. The Portfolio
prepares its financial statements in accordance with generally accepted accounting principles (“GAAP”) in the United States of America and follows the significant accounting policies described below.
(A) Securities Valuation. Investments are usually valued as of the close of regular trading on the New York Stock Exchange (the "Exchange") (usually 4:00 p.m. Eastern time) on each day the Portfolio is open for business ("valuation date").
Effective September 8, 2022, and pursuant to Rule 2a-5 under the 1940 Act, the Board of Trustees of the Fund (the "Board") designated New York Life Investment Management LLC (“New York Life Investments” or the "Manager") as its Valuation Designee (the "Valuation Designee"). The Valuation Designee is responsible for performing fair valuations relating to all investments in the Portfolio’s portfolio for which market quotations are not readily available; periodically assessing and managing material valuation risks; establishing and applying fair value methodologies; testing fair valuation methodologies; evaluating and overseeing pricing services; ensuring appropriate segregation of valuation and portfolio management functions; providing quarterly, annual and prompt reporting to the Board, as appropriate; identifying potential conflicts of interest; and maintaining appropriate records. The Valuation Designee has established a valuation committee ("Valuation Committee") to assist in carrying out the Valuation Designee’s responsibilities and establish prices of securities for which market quotations are not readily available. The Portfolio’s and the Valuation Designee's policies and procedures ("Valuation Procedures") govern the Valuation Designee’s selection and application of methodologies for determining and calculating the fair value of Portfolio investments. The Valuation Designee may value the Portfolio's portfolio securities for which market quotations are not readily available and other Portfolio assets utilizing inputs from pricing services and other third-party sources (together, “Pricing Sources”). The Valuation Committee meets (in person, via electronic mail or via teleconference) on an ad-hoc basis to determine fair valuations and on a quarterly basis to review fair value events with respect to certain securities for which market quotations are not readily available, including valuation risks and back-testing results, and preview reports to the Board.
The Valuation Committee establishes prices of securities for which market quotations are not readily available based on such methodologies and measurements on a regular basis after considering information that is reasonably available and deemed relevant by the Valuation Committee. The Board shall oversee the Valuation Designee and review fair valuation materials on a prompt, quarterly and annual basis and approve proposed revisions to the Valuation Procedures.
Investments for which market quotations are not readily available are valued at fair value as determined in good faith pursuant to the Valuation Procedures. A market quotation is readily available only when that quotation is a quoted price (unadjusted) in active markets for identical investments that the Portfolio can access at the measurement date, provided that a quotation will not be readily available if it is not reliable. "Fair value" is defined as the price the Portfolio would reasonably expect to receive upon selling an asset or liability in an orderly transaction to an
| 28 | MainStay VP MacKay High Yield Corporate Bond Portfolio |
independent buyer in the principal or most advantageous market for the asset or liability. Fair value measurements are determined within a framework that establishes a three-tier hierarchy that maximizes the use of observable market data and minimizes the use of unobservable inputs to establish a classification of fair value measurements for disclosure purposes. "Inputs" refer broadly to the assumptions that market participants would use in pricing the asset or liability, including assumptions about risk, such as the risk inherent in a particular valuation technique used to measure fair value using a pricing model and/or the risk inherent in the inputs for the valuation technique. Inputs may be observable or unobservable. Observable inputs reflect the assumptions market participants would use in pricing the asset or liability based on market data obtained from sources independent of the Portfolio. Unobservable inputs reflect the Portfolio’s own assumptions about the assumptions market participants would use in pricing the asset or liability based on the information available. The inputs or methodology used for valuing assets or liabilities may not be an indication of the risks associated with investing in those assets or liabilities. The three-tier hierarchy of inputs is summarized below.
| • | Level 1—quoted prices (unadjusted) in active markets for an identical asset or liability |
| • | Level 2—other significant observable inputs (including quoted prices for a similar asset or liability in active markets, interest rates and yield curves, prepayment speeds, credit risk, etc.) |
| • | Level 3—significant unobservable inputs (including the Portfolio's own assumptions about the assumptions that market participants would use in measuring fair value of an asset or liability) |
The level of an asset or liability within the fair value hierarchy is based on the lowest level of an input, both individually and in the aggregate, that is significant to the fair value measurement. The aggregate value by input level of the Portfolio’s assets and liabilities as of December 31, 2022, is included at the end of the Portfolio of Investments.
The Portfolio may use third-party vendor evaluations, whose prices may be derived from one or more of the following standard inputs, among others:
| • Benchmark yields | • Reported trades |
| • Broker/dealer quotes | • Issuer spreads |
| • Two-sided markets | • Benchmark securities |
| • Bids/offers | • Reference data (corporate actions or material event notices) |
| • Industry and economic events | • Comparable bonds |
| • Monthly payment information | |
An asset or liability for which a market quotation is not readily available is valued by methods deemed reasonable in good faith by the Valuation Committee, following the Valuation Procedures to represent fair value. Under these procedures, the Valuation Designee generally uses a market-based approach which may use related or comparable assets or liabilities, recent transactions, market multiples, book values and other
relevant information. The Valuation Designee may also use an income-based valuation approach in which the anticipated future cash flows of the asset or liability are discounted to calculate fair value. Discounts may also be applied due to the nature and/or duration of any restrictions on the disposition of the asset or liability. Fair value represents a good faith approximation of the value of a security. Fair value determinations involve the consideration of a number of subjective factors, an analysis of applicable facts and circumstances and the exercise of judgment. As a result, it is possible that the fair value for a security determined in good faith in accordance with the Valuation Procedures may differ from valuations for the same security determined for other funds using their own valuation procedures. Although the Valuation Procedures are designed to value a security at the price the Portfolio may reasonably expect to receive upon the security's sale in an orderly transaction, there can be no assurance that any fair value determination thereunder would, in fact, approximate the amount that the Portfolio would actually realize upon the sale of the security or the price at which the security would trade if a reliable market price were readily available. During the year ended December 31, 2022, there were no material changes to the fair value methodologies.
Securities which may be valued in this manner include, but are not limited to: (i) a security for which trading has been halted or suspended or otherwise does not have a readily available market quotation on a given day; (ii) a debt security that has recently gone into default and for which there is not a current market quotation; (iii) a security of an issuer that has entered into a restructuring; (iv) a security that has been delisted from a national exchange; (v) a security subject to trading collars for which no or limited trading takes place; and (vi) a security whose principal market has been temporarily closed at a time when, under normal conditions, it would be open. Securities valued in this manner are generally categorized as Level 2 or 3 in the hierarchy.
Equity securities are valued at the last quoted sales prices as of the close of regular trading on the relevant exchange on each valuation date. Securities that are not traded on the valuation date are valued at the mean of the last quoted bid and ask prices. Prices are normally taken from the principal market in which each security trades. These securities are generally categorized as Level 1 in the hierarchy.
Debt securities (other than convertible and municipal bonds) are valued at the evaluated bid prices (evaluated mean prices in the case of convertible and municipal bonds) supplied by a pricing agent or broker selected by the Valuation Designee, in consultation with the Subadvisor. The evaluations are market-based measurements processed through a pricing application and represents the pricing agent’s good faith determination as to what a holder may receive in an orderly transaction under market conditions. The rules-based logic utilizes valuation techniques that reflect participants’ assumptions and vary by asset class and per methodology, maximizing the use of relevant observable data including quoted prices for similar assets, benchmark yield curves and market corroborated inputs. The evaluated bid or mean prices are deemed by the Valuation Designee, in consultation with the Subadvisor, to be representative of market values at the regular close of trading of the Exchange on each
Notes to Financial Statements (continued)
valuation date. Debt securities purchased on a delayed delivery basis are marked to market daily until settlement at the forward settlement date. Debt securities, including corporate bonds, U.S. government and federal agency bonds, municipal bonds, foreign bonds, convertible bonds, asset-backed securities and mortgage-backed securities are generally categorized as Level 2 in the hierarchy.
Loan assignments, participations and commitments are valued at the average of bid quotations obtained from the engaged independent pricing service and are generally categorized as Level 2 in the hierarchy. Certain loan assignments, participations and commitments may be valued by utilizing significant unobservable inputs obtained from the pricing service and are generally categorized as Level 3 in the hierarchy. No securities held by the Portfolio as of December 31, 2022 were fair valued utilizing significant unobservable inputs obtained from the pricing service.
The information above is not intended to reflect an exhaustive list of the methodologies that may be used to value portfolio investments. The Valuation Procedures permit the use of a variety of valuation methodologies in connection with valuing portfolio investments. The methodology used for a specific type of investment may vary based on the market data available or other considerations. The methodologies summarized above may not represent the specific means by which portfolio investments are valued on any particular business day.
A portfolio investment may be classified as an illiquid investment under the Portfolio's written liquidity risk management program and related procedures (“Liquidity Program”). Illiquidity of an investment might prevent the sale of such investment at a time when the Manager or the Subadvisor might wish to sell, and these investments could have the effect of decreasing the overall level of the Portfolio's liquidity. Further, the lack of an established secondary market may make it more difficult to value illiquid investments, requiring the Portfolio to rely on judgments that may be somewhat subjective in measuring value, which could vary materially from the amount that the Portfolio could realize upon disposition. Difficulty in selling illiquid investments may result in a loss or may be costly to the Portfolio. An illiquid investment is any investment that the Manager or Subadvisor reasonably expects cannot be sold or disposed of in current market conditions in seven calendar days or less without the sale or disposition significantly changing the market value of the investment. The liquidity classification of each investment will be made using information obtained after reasonable inquiry and taking into account, among other things, relevant market, trading and investment-specific considerations in accordance with the Liquidity Program. Illiquid investments are often fair valued in accordance with the Portfolio's procedures described above. The liquidity of the Portfolio's investments was determined as of December 31, 2022, and can change at any time. Illiquid investments as of December 31, 2022, are shown in the Portfolio of Investments.
(B) Income Taxes. The Portfolio's policy is to comply with the requirements of the Internal Revenue Code of 1986, as amended (the “Internal Revenue Code”), applicable to regulated investment companies
and to distribute all of its taxable income to the shareholders of the Portfolio within the allowable time limits.
The Manager evaluates the Portfolio’s tax positions to determine if the tax positions taken meet the minimum recognition threshold in connection with accounting for uncertainties in income tax positions taken or expected to be taken for the purposes of measuring and recognizing tax liabilities in the financial statements. Recognition of tax benefits of an uncertain tax position is permitted only to the extent the position is “more likely than not” to be sustained assuming examination by taxing authorities. The Manager analyzed the Portfolio's tax positions taken on federal, state and local income tax returns for all open tax years (for up to three tax years) and has concluded that no provisions for federal, state and local income tax are required in the Portfolio's financial statements. The Portfolio's federal, state and local income tax and federal excise tax returns for tax years for which the applicable statutes of limitations have not expired are subject to examination by the Internal Revenue Service and state and local departments of revenue.
(C) Dividends and Distributions to Shareholders. Dividends and distributions are recorded on the ex-dividend date. The Portfolio intends to declare and pay dividends from net investment income and distributions from net realized capital and currency gains, if any, at least annually. All dividends and distributions are reinvested at NAV in the same class of shares of the Portfolio. Dividends and distributions to shareholders are determined in accordance with federal income tax regulations and may differ from determinations using GAAP.
(D) Security Transactions and Investment Income. The Portfolio records security transactions on the trade date. Realized gains and losses on security transactions are determined using the identified cost method. Dividend income is recognized on the ex-dividend date; and interest income is accrued as earned using the effective interest rate method. Discounts and premiums on securities purchased for the Portfolio are accreted and amortized, respectively, on the effective interest rate method. Income from payment-in-kind securities is accreted daily based on the effective interest method. Investment income and realized and unrealized gains and losses on investments of the Portfolio are allocated pro rata to the separate classes of shares based upon their relative net assets on the date the income is earned or realized and unrealized gains and losses are incurred.
Investment income and realized and unrealized gains and losses on investments of the Portfolio are allocated pro rata to the separate classes of shares based upon their relative net assets on the date the income is earned or realized and unrealized gains and losses are incurred.
The Portfolio may place a debt security on non-accrual status and reduce related interest income by ceasing current accruals and writing off all or a portion of any interest receivables when the collection of all or a portion of such interest has become doubtful. A debt security is removed from non-accrual status when the issuer resumes interest payments or when collectability of interest is reasonably assured.
| 30 | MainStay VP MacKay High Yield Corporate Bond Portfolio |
(E) Expenses. Expenses of the Fund are allocated to the individual Portfolios in proportion to the net assets of the respective Portfolios when the expenses are incurred, except where direct allocations of expenses can be made. Expenses (other than fees incurred under the distribution and service plans, further discussed in Note 3(B), which are charged directly to the Service Class shares) are allocated to separate classes of shares pro rata based upon their relative net assets on the date the expenses are incurred. The expenses borne by the Portfolio, including those of related parties to the Portfolio, are shown in the Statement of Operations.
(F) Use of Estimates. In preparing financial statements in conformity with GAAP, the Manager makes estimates and assumptions that affect the reported amounts and disclosures in the financial statements. Actual results could differ from those estimates and assumptions.
(G) Loan Assignments, Participations and Commitments. The Portfolio may invest in loan assignments and participations ("loans"). Commitments are agreements to make money available to a borrower in a specified amount, at a specified rate and within a specified time. The Portfolio records an investment when the borrower withdraws money on a commitment or when a funded loan is purchased (trade date) and records interest as earned. These loans pay interest at rates that are periodically reset by reference to a base lending rate plus a spread. These base lending rates are generally the prime rate offered by a designated U.S. bank, the London Interbank Offered Rate ("LIBOR") or an alternative reference rate.
The loans in which the Portfolio may invest are generally readily marketable, but may be subject to some restrictions on resale. For example, the Portfolio may be contractually obligated to receive approval from the agent bank and/or borrower prior to the sale of these investments. If the Portfolio purchases an assignment from a lender, the Portfolio will generally have direct contractual rights against the borrower in favor of the lender. If the Portfolio purchases a participation interest either from a lender or a participant, the Portfolio typically will have established a direct contractual relationship with the seller of the participation interest, but not with the borrower. Consequently, the Portfolio is subject to the credit risk of the lender or participant who sold the participation interest to the Portfolio, in addition to the usual credit risk of the borrower. In the event that the borrower, selling participant or intermediate participants become insolvent or enter into bankruptcy, the Portfolio may incur certain costs and delays in realizing payment, or may suffer a loss of principal and/or interest.
Unfunded commitments represent the remaining obligation of the Portfolio to the borrower. At any point in time, up to the maturity date of the issue, the borrower may demand the unfunded portion. Unfunded amounts, if any, are marked to market and any unrealized gains or losses are recorded in the Statement of Assets and Liabilities. As of December 31, 2022, the Portfolio did not hold any unfunded commitments.
(H) Rights and Warrants. Rights are certificates that permit the holder to purchase a certain number of shares, or a fractional share, of a new stock from the issuer at a specific price. Warrants are instruments that entitle the holder to buy an equity security at a specific price for a specific period of time. These investments can provide a greater potential for profit or loss than an equivalent investment in the underlying security. Prices of these investments do not necessarily move in tandem with the prices of the underlying securities.
There is risk involved in the purchase of rights and warrants in that these investments are speculative investments. The Portfolio could also lose the entire value of its investment in warrants if such warrants are not exercised by the date of its expiration. The Portfolio is exposed to risk until the sale or exercise of each right or warrant is completed. Warrants as of December 31, 2022 are shown in the Portfolio of Investments.
(I) Debt Securities Risk. The ability of issuers of debt securities held by the Portfolio to meet their obligations may be affected by, among other things, economic or political developments in a specific country, industry or region. Debt securities are also subject to the risks associated with changes in interest rates. The Portfolio primarily invests in high-yield debt securities (commonly referred to as “junk bonds”), which are considered speculative because they present a greater risk of loss, including default, than higher rated debt securities. These securities pay investors a premium—a higher interest rate or yield than investment grade debt securities—because of the increased risk of loss. These securities can also be subject to greater price volatility. In times of unusual or adverse market, economic or political conditions, these securities may experience higher than normal default rates.
The loans in which the Portfolio invests are usually rated below investment grade, or if unrated, determined by the Subadvisor to be of comparable quality (commonly referred to as “junk bonds”) and are generally considered speculative because they present a greater risk of loss, including default, than higher quality debt securities. Moreover, such securities may, under certain circumstances, be particularly susceptible to liquidity and valuation risks.
Although certain loans are collateralized, there is no guarantee that the value of the collateral will be sufficient to repay the loan. In a recession or serious credit event, the value of these investments could decline significantly. As a result, the Portfolio’s NAVs could go down and you could lose money.
In addition, loans generally are subject to extended settlement periods that may be longer than seven days. As a result, the Portfolio may be adversely affected by selling other investments at an unfavorable time and/or under unfavorable conditions or engaging in borrowing transactions, such as borrowing against its credit facility, to raise cash to meet redemption obligations or pursue other investment opportunities.
In certain circumstances, loans may not be deemed to be securities. As a result, the Portfolio may not have the protection of the anti-fraud provisions of the federal securities laws. In such cases, the Portfolio
Notes to Financial Statements (continued)
generally must rely on the contractual provisions in the loan agreement and common-law fraud protections under applicable state law.
(J) LIBOR Replacement Risk. The Portfolio may invest in certain debt securities, derivatives or other financial instruments that utilize LIBOR, as a “benchmark” or “reference rate” for various interest rate calculations. As of January 1, 2022, the United Kingdom Financial Conduct Authority, which regulates LIBOR, ceased its active encouragement of banks to provide the quotations needed to sustain most LIBOR rates due to the absence of an active market for interbank unsecured lending and other reasons. However, the United Kingdom Financial Conduct Authority, the LIBOR administrator and other regulators announced that the most widely used tenors of U.S. dollar LIBOR will continue until mid-2023. As a result, it is anticipated that the remaining LIBOR settings will be discontinued or will no longer be sufficiently robust to be representative of its underlying market around that time. Various financial industry groups will plan for that transition and certain regulators and industry groups have taken actions to establish alternative reference rates (e.g., the Secured Overnight Financing Rate, which measures the cost of overnight borrowings through repurchase agreement transactions collateralized with U.S. Treasury securities and is intended to replace U.S. dollar LIBOR with certain adjustments). However, there are challenges to converting certain contracts and transactions to a new benchmark and neither the full effects of the transition process nor its ultimate outcome is known.
The elimination of LIBOR or changes to other reference rates or any other changes or reforms to the determination or supervision of reference rates could have an adverse impact on the market for, or value of, any securities or payments linked to those reference rates, which may adversely affect the Portfolio's performance and/or net asset value. Uncertainty and risk also remain regarding the willingness and ability of issuers and lenders to include enhanced provisions in new and existing contracts or instruments. Consequently, the transition away from LIBOR to other reference rates may lead to increased volatility and illiquidity in markets that are tied to LIBOR, fluctuations in values of LIBOR-related investments or investments in issuers that utilize LIBOR, increased difficulty in borrowing or refinancing and diminished effectiveness of hedging strategies, adversely affecting the Portfolio's performance. Furthermore, the risks associated with the expected discontinuation of LIBOR and transition may be exacerbated if the work necessary to effect an orderly transition to an alternative reference rate is not completed in a timely manner. While the transition away from LIBOR has already begun with no material adverse effect to the Portfolio's performance, the transition is expected to last through mid-2023 for some LIBOR tenors. The usefulness of LIBOR as a benchmark could deteriorate anytime during this transition period.
(K) Indemnifications. Under the Fund’s organizational documents, its officers and trustees are indemnified against certain liabilities that may arise out of performance of their duties to the Fund. Additionally, in the normal course of business, the Portfolio enters into contracts with third-party service providers that contain a variety of representations and
warranties and that may provide general indemnifications. The Portfolio's maximum exposure under these arrangements is unknown, as this would involve future claims that may be made against the Portfolio that have not yet occurred. The Manager believes that the risk of loss in connection with these potential indemnification obligations is remote. However, there can be no assurance that material liabilities related to such obligations will not arise in the future, which could adversely impact the Portfolio.
Note 3–Fees and Related Party Transactions
(A) Manager and Subadvisor. New York Life Investments, a registered investment adviser and an indirect, wholly-owned subsidiary of New York Life, serves as the Portfolio's Manager, pursuant to an Amended and Restated Management Agreement ("Management Agreement"). The Manager provides offices, conducts clerical, recordkeeping and bookkeeping services and keeps most of the financial and accounting records required to be maintained by the Portfolio. Except for the portion of salaries and expenses that are the responsibility of the Portfolio, the Manager pays the salaries and expenses of all personnel affiliated with the Portfolio and certain operational expenses of the Portfolio. During a portion of the year ended December 31, 2022, the Portfolio reimbursed New York Life Investments in an amount equal to the portion of the compensation of the Chief Compliance Officer attributable to the Portfolio. MacKay Shields LLC ("MacKay Shields" or the "Subadvisor"), a registered investment adviser and an indirect, wholly-owned subsidiary of New York Life, serves as the Subadvisor to the Portfolio and is responsible for the day-to-day portfolio management of the Portfolio. Pursuant to the terms of an Amended and Restated Subadvisory Agreement between New York Life Investments and MacKay Shields, New York Life Investments pays for the services of the Subadvisor.
Pursuant to the Management Agreement, the Fund pays the Manager, on behalf of the Portfolio, a monthly fee for the services performed and the facilities furnished at an annual rate of the Portfolio's average daily net assets as follows: 0.57% up to $1 billion; 0.55% from $1 billion to $5 billion; and 0.525% in excess of $5 billion. During the year ended December 31, 2022, the effective management fee rate was 0.56%.
During the year ended December 31, 2022, New York Life Investments earned fees from the Portfolio in the amount of $16,411,011 and paid the Subadvisor fees of $8,205,506.
JPMorgan provides sub-administration and sub-accounting services to the Portfolio pursuant to an agreement with New York Life Investments. These services include calculating the daily NAVs of the Portfolio, maintaining the general ledger and sub-ledger accounts for the calculation of the Portfolio's NAVs, and assisting New York Life Investments in conducting various aspects of the Portfolio's administrative operations. For providing these services to the Portfolio, JPMorgan is compensated by New York Life Investments.
Pursuant to an agreement between the Fund and New York Life Investments, New York Life Investments is responsible for providing or procuring certain regulatory reporting services for the Portfolio. The
| 32 | MainStay VP MacKay High Yield Corporate Bond Portfolio |
Portfolio will reimburse New York Life Investments for the actual costs incurred by New York Life Investments in connection with providing or procuring these services for the Portfolio.
(B) Distribution and Service Fees. The Fund, on behalf of the Portfolio, has entered into a distribution agreement with NYLIFE Distributors LLC (the “Distributor”), an affiliate of New York Life Investments. The Portfolio has adopted a distribution plan (the “Plan”) in accordance with the provisions of Rule 12b-1 under the 1940 Act. Under the Plan, the Distributor has agreed to provide, through its affiliates or independent third parties, various distribution-related, shareholder and administrative support services to the Service Class shareholders. For its services, the Distributor is entitled to a combined distribution and service fee accrued daily and paid monthly at an annual rate of 0.25% of the average daily net assets attributable to the Service Class shares of the Portfolio.
Note 4-Federal Income Tax
As of December 31, 2022, the cost and unrealized appreciation (depreciation) of the Portfolio’s investment portfolio, including applicable derivative contracts and other financial instruments, as determined on a federal income tax basis, were as follows:
| | Federal Tax
Cost | Gross
Unrealized
Appreciation | Gross
Unrealized
(Depreciation) | Net
Unrealized
Appreciation/
(Depreciation) |
| Investments in Securities | $2,826,938,322 | $31,853,173 | $(335,509,424) | $(303,656,251) |
As of December 31, 2022, the components of accumulated gain (loss) on a tax basis were as follows:
Ordinary
Income | Accumulated
Capital
and Other
Gain (Loss) | Other
Temporary
Differences | Unrealized
Appreciation
(Depreciation) | Total
Accumulated
Gain (Loss) |
| $147,044,052 | $(143,538,507) | $(1,507,433) | $(303,656,251) | $(301,658,139) |
The difference between book-basis and tax-basis unrealized appreciation (depreciation) is primarily due to cumulative bond amortization and wash sale adjustments. The other temporary differences are primarily due to interest accrual on defaulted securities.
As of December 31, 2022, for federal income tax purposes, capital loss carryforwards of $143,538,507, as shown in the table below, were available to the extent provided by the regulations to offset future realized gains of the Portfolio. Accordingly, no capital gains distributions are expected to be paid to shareholders until net gains have been realized in excess of such amounts.
Capital Loss
Available Through | Short-Term
Capital Loss
Amounts (000’s) | Long-Term
Capital Loss
Amounts (000’s) |
| Unlimited | $10,623 | $132,916 |
During the years ended December 31, 2022 and December 31, 2021, the tax character of distributions paid as reflected in the Statements of Changes in Net Assets was as follows:
| | 2022 | 2021 |
| Distributions paid from: | | |
| Ordinary Income | $146,644,587 | $156,494,181 |
Note 5–Restricted Securities
Restricted securities are subject to legal or contractual restrictions on resale. Private placement securities are generally considered to be restricted except for those securities traded between qualified institutional investors under the provisions of Rule 144A of the Securities Act of 1933, as amended. Disposal of restricted securities may involve time consuming negotiations and expenses, and prompt sale at an acceptable price may be difficult to achieve.
Notes to Financial Statements (continued)
As of December 31, 2022, restricted securities held by the Portfolio were as follows:
| Security | Date(s) of
Acquisition | Principal
Amount/
Shares | Cost | 12/31/22
Value | Percent of
Net Assets |
| Briggs & Stratton Corp. Escrow Claim Shares |
Corporate Bond
6.875%, due 12/15/20 | 2/26/21 | $ 5,030,000 | $ 5,170,425 | $ — | 0.0%‡ |
| Carlson Travel, Inc. |
| Common Stock | 9/4/20-12/8/21 | 529,813 | 13,040,538 | 2,781,518 | 0.1 |
| GenOn Energy, Inc. |
| Common Stock | 12/14/18 | 115,826 | 12,970,154 | 11,003,470 | 0.4 |
| Gulfport Energy Operating Corp. |
| Preferred Stock | 8/4/21-12/16/21 | 39 | 39,000 | 177,569 | 0.0‡ |
| Sterling Entertainment Enterprises LLC |
Corporate Bond
10.25%, due 1/15/25 | 12/28/17 | $ 7,000,000 | 6,961,493 | 6,507,200 | 0.3 |
| Total | | | $ 38,181,610 | $ 20,469,757 | 0.8% |
| ‡ | Less than one-tenth of a percent. |
Note 6–Custodian
JPMorgan is the custodian of cash and securities held by the Portfolio. Custodial fees are charged to the Portfolio based on the Portfolio's net assets and/or the market value of securities held by the Portfolio and the number of certain transactions incurred by the Portfolio.
Note 7–Line of Credit
The Portfolio and certain other funds managed by New York Life Investments maintain a line of credit with a syndicate of banks in order to secure a source of funds for temporary purposes to meet unanticipated or excessive redemption requests.
Effective July 26, 2022, under the credit agreement (the “Credit Agreement”), the aggregate commitment amount is $600,000,000 with an additional uncommitted amount of $100,000,000. The commitment fee is an annual rate of 0.15% of the average commitment amount payable quarterly, regardless of usage, to JPMorgan, who serves as the agent to the syndicate. The commitment fee is allocated among the Portfolio and certain other funds managed by New York Life Investments based upon their respective net assets and other factors. Interest on any revolving credit loan is charged based upon the Federal Funds Rate, Daily Simple Secured Overnight Financing Rate ("SOFR") + 0.10%, or the Overnight Bank Funding Rate, whichever is higher. The Credit Agreement expires on July 25, 2023, although the Portfolio, certain other funds managed by New York Life Investments and the syndicate of banks may renew the Credit Agreement for an additional year on the same or different terms or enter into a credit agreement with a different syndicate of banks. Prior to July 26, 2022, the aggregate commitment amount and the commitment fee were the same as those under the current Credit Agreement. During the year ended December 31, 2022, there were no borrowings made or outstanding with respect to the Portfolio under the Credit Agreement.
Note 8–Interfund Lending Program
Pursuant to an exemptive order issued by the SEC, the Portfolio, along with certain other funds managed by New York Life Investments, may participate in an interfund lending program. The interfund lending program provides an alternative credit facility that permits the Portfolio and certain other funds managed by New York Life Investments to lend or borrow money for temporary purposes directly to or from one another, subject to the conditions of the exemptive order. During the year ended December 31, 2022, there were no interfund loans made or outstanding with respect to the Portfolio.
Note 9–Purchases and Sales of Securities (in 000’s)
During the year ended December 31, 2022, purchases and sales of securities, other than short-term securities, were $334,221 and $561,029, respectively.
The Portfolio may purchase securities from or sell securities to other portfolios managed by the Subadvisor. These interportfolio transactions are primarily used for cash management purposes and are made pursuant to Rule 17a-7 under the 1940 Act. During the year ended December 31, 2022, such purchases were $276.
Note 10–Capital Share Transactions
Transactions in capital shares for the years ended December 31, 2022 and December 31, 2021, were as follows:
| 34 | MainStay VP MacKay High Yield Corporate Bond Portfolio |
| Initial Class | Shares | Amount |
| Year ended December 31, 2022: | | |
| Shares sold | 7,121,288 | $ 65,542,215 |
| Shares issued to shareholders in reinvestment of distributions | 2,967,745 | 24,718,944 |
| Shares redeemed | (18,114,997) | (165,203,247) |
| Net increase (decrease) | (8,025,964) | $ (74,942,088) |
| Year ended December 31, 2021: | | |
| Shares sold | 17,398,461 | $ 178,553,730 |
| Shares issued to shareholders in reinvestment of distributions | 2,894,786 | 28,606,278 |
| Shares redeemed | (7,260,874) | (73,109,585) |
| Net increase (decrease) | 13,032,373 | $ 134,050,423 |
| |
| Service Class | Shares | Amount |
| Year ended December 31, 2022: | | |
| Shares sold | 11,574,208 | $ 105,284,316 |
| Shares issued to shareholders in reinvestment of distributions | 14,890,045 | 121,925,643 |
| Shares redeemed | (49,817,798) | (447,442,740) |
| Net increase (decrease) | (23,353,545) | $(220,232,781) |
| Year ended December 31, 2021: | | |
| Shares sold | 28,237,647 | $ 280,233,605 |
| Shares issued to shareholders in reinvestment of distributions | 13,158,275 | 127,887,903 |
| Shares redeemed | (25,632,161) | (254,426,090) |
| Net increase (decrease) | 15,763,761 | $ 153,695,418 |
Note 11–Other Matters
As of the date of this report, interest rates in the United States and many parts of the world, including certain European countries, are ascending from historically low levels. Thus, the Portfolio currently faces a heightened level of risk associated with rising interest rates. This could be driven by a variety of factors, including but not limited to central bank monetary policies, changing inflation or real growth rates, general economic conditions, increasing bond issuances or reduced market demand for low yielding investments.
An outbreak of COVID-19, first detected in December 2019, has developed into a global pandemic and has resulted in travel restrictions, closure of international borders, certain businesses and securities markets, restrictions on securities trading activities, prolonged quarantines, supply chain disruptions, and lower consumer demand, as well as general concern and uncertainty. In 2022, many countries lifted some or all restrictions related to COVID-19. However, the continued impact of COVID-19 and related variants is uncertain and could further adversely affect the global economy, national economies, individual issuers and capital markets in unforeseeable ways and result in a substantial and extended economic downturn. Developments that disrupt global economies and financial markets, such as COVID-19, may magnify factors that affect the Portfolio's performance.
Note 12–Subsequent Events
In connection with the preparation of the financial statements of the Portfolio as of and for the year ended December 31, 2022, events and transactions subsequent to December 31, 2022, through the date the financial statements were issued have been evaluated by the Manager for possible adjustment and/or disclosure. No subsequent events requiring financial statement adjustment or disclosure have been identified.
Report of Independent Registered Public Accounting Firm
To the Board of Trustees of MainStay VP Funds Trust and Shareholders of
MainStay VP MacKay High Yield Corporate Bond Portfolio
Opinion on the Financial Statements
We have audited the accompanying statement of assets and liabilities, including the portfolio of investments, of MainStay VP MacKay High Yield Corporate Bond Portfolio (one of the portfolios constituting MainStay VP Funds Trust, referred to hereafter as the “Portfolio”) as of December 31, 2022, the related statement of operations for the year ended December 31, 2022, the statements of changes in net assets for each of the two years in the period ended December 31, 2022, including the related notes, and the financial highlights for each of the five years in the period ended December 31, 2022 (collectively referred to as the “financial statements”). In our opinion, the financial statements present fairly, in all material respects, the financial position of the Portfolio as of December 31, 2022, the results of its operations for the year then ended, the changes in its net assets for each of the two years in the period ended December 31, 2022 and the financial highlights for each of the five years in the period ended December 31, 2022 in conformity with accounting principles generally accepted in the United States of America.
Basis for Opinion
These financial statements are the responsibility of the Portfolio’s management. Our responsibility is to express an opinion on the Portfolio’s financial statements based on our audits. We are a public accounting firm registered with the Public Company Accounting Oversight Board (United States) (PCAOB) and are required to be independent with respect to the Portfolio in accordance with the U.S. federal securities laws and the applicable rules and regulations of the Securities and Exchange Commission and the PCAOB.
We conducted our audits of these financial statements in accordance with the standards of the PCAOB. Those standards require that we plan and perform the audit to obtain reasonable assurance about whether the financial statements are free of material misstatement, whether due to error or fraud.
Our audits included performing procedures to assess the risks of material misstatement of the financial statements, whether due to error or fraud, and performing procedures that respond to those risks. Such procedures included examining, on a test basis, evidence regarding the amounts and disclosures in the financial statements. Our audits also included evaluating the accounting principles used and significant estimates made by management, as well as evaluating the overall presentation of the financial statements. Our procedures included confirmation of securities owned as of December 31, 2022 by correspondence with the custodians, agent banks and brokers; when replies were not received from brokers, we performed other auditing procedures. We believe that our audits provide a reasonable basis for our opinion.
/s/PricewaterhouseCoopers LLP
New York, New York
February 24, 2023
We have served as the auditor of one or more investment companies in the MainStay group of funds since 1984.
| 36 | MainStay VP MacKay High Yield Corporate Bond Portfolio |
Board Consideration and Approval of Management Agreement and Subadvisory Agreement (Unaudited)
The continuation of the Management Agreement with respect to the MainStay VP MacKay High Yield Corporate Bond Portfolio (“Portfolio”) and New York Life Investment Management LLC (“New York Life Investments”) and the Subadvisory Agreement between New York Life Investments and MacKay Shields LLC (“MacKay”) with respect to the Portfolio (together, “Advisory Agreements”) is subject to annual review and approval by the Board of Trustees of MainStay VP Funds Trust (“Board” of the “Trust”) in accordance with Section 15 of the Investment Company Act of 1940, as amended (“1940 Act”). At its December 6–7, 2022 meeting, the Board, which is comprised solely of Trustees who are not an “interested person” (as such term is defined in the 1940 Act) of the Trust (“Independent Trustees”), unanimously approved the continuation of each of the Advisory Agreements for a one-year period.
In reaching the decision to approve the continuation of each of the Advisory Agreements, the Board considered information and materials furnished by New York Life Investments and MacKay in connection with an annual contract review process undertaken by the Board that took place at meetings of the Board and its Contracts Committee during October 2022 through December 2022, including information and materials furnished by New York Life Investments and MacKay in response to requests prepared on behalf of the Board, and in consultation with the Board, by independent legal counsel to the Independent Trustees, which encompassed a variety of topics, including those summarized below. Information and materials requested by and furnished to the Board for consideration in connection with the contract review process included, among other items, reports on the Portfolio and “peer funds” prepared by Institutional Shareholder Services Inc. (“ISS”), an independent third-party service provider engaged by the Board to report objectively on the Portfolio’s investment performance, management fee and total expenses. The Board also considered information on the fees charged to other investment advisory clients of New York Life Investments and/or MacKay that follow investment strategies similar to those of the Portfolio, if any, and, when applicable, the rationale for any differences in the Portfolio’s management and subadvisory fees and the fees charged to those other investment advisory clients. In addition, the Board considered information regarding the legal standards and fiduciary obligations applicable to its consideration of the continuation of each of the Advisory Agreements. The contract review process, including the structure and format for information and materials provided to the Board, has been developed in consultation with the Board. The Independent Trustees also met in executive sessions with their independent legal counsel and, for portions thereof, with senior management of New York Life Investments.
The Board’s deliberations with respect to the continuation of each of the Advisory Agreements reflect a year-long process, and the Board also took into account information furnished to the Board and its Committees throughout the year, as deemed relevant and appropriate by the Trustees, including, among other items, reports on investment performance of the Portfolio and investment-related matters for the Portfolio as well as presentations from New York Life Investments and, generally annually, MacKay personnel. In addition, the Board took into account other information received from New York Life Investments throughout the year,
including, among other items, periodic reports on legal and compliance matters, risk management, portfolio turnover, brokerage commissions and non-advisory services provided to the Portfolio by New York Life Investments, as deemed relevant and appropriate by the Trustees.
In addition to information provided to the Board throughout the year, the Board received information in connection with its June 2022 meeting provided specifically in response to requests prepared on behalf of the Board, and in consultation with the Board, by independent legal counsel to the Independent Trustees regarding the Portfolio’s distribution arrangements. In addition, the Board received information regarding the Portfolio’s asset levels, share purchase and redemption activity and the payment of Rule 12b-1 and/or other fees by the applicable share classes of the Portfolio, among other information.
In considering the continuation of each of the Advisory Agreements, the Trustees reviewed and evaluated the information and factors they believed to reasonably be necessary and appropriate in light of legal advice furnished to them by independent legal counsel to the Independent Trustees and through the exercise of their own business judgment. Although individual Trustees may have weighed certain factors or information differently and the Board did not consider any single factor or information controlling in reaching its decision, the factors considered by the Board are summarized in more detail below and include, among other factors: (i) the nature, extent and quality of the services provided to the Portfolio by New York Life Investments and MacKay; (ii) the qualifications of the portfolio manager of the Portfolio and the historical investment performance of the Portfolio, New York Life Investments and MacKay; (iii) the costs of the services provided, and profits realized, by New York Life Investments and MacKay with respect to their relationships with the Portfolio; (iv) the extent to which economies of scale have been realized or may be realized if the Portfolio grows and the extent to which any economies of scale have been shared, have benefited or may benefit the Portfolio’s shareholders; and (v) the reasonableness of the Portfolio’s management and subadvisory fees and total ordinary operating expenses. Although the Board recognized that comparisons between the Portfolio’s fees and expenses and those of other funds are imprecise given different terms of agreements, variations in fund strategies and other factors, the Board considered the reasonableness of the Portfolio’s management fee and total ordinary operating expenses as compared to the peer funds identified by ISS. Throughout their considerations, the Trustees acknowledged the commitment of New York Life Investments and its affiliates to serve the MainStay Group of Funds, as well as their capacity, experience, resources, financial stability and reputations. The Trustees also acknowledged the entrepreneurial and other risks assumed by New York Life Investments in sponsoring and managing the Portfolio. With respect to the Subadvisory Agreement, the Board took into account New York Life Investments’ recommendation to approve the continuation of the Subadvisory Agreement.
The Trustees noted that, throughout the year, the Trustees are afforded an opportunity to ask questions of, and request additional information or materials from, New York Life Investments and MacKay. The Board’s decision with respect to each of the Advisory Agreements may have also
Board Consideration and Approval of Management Agreement and Subadvisory Agreement (Unaudited) (continued)
been based, in part, on the Board’s knowledge of New York Life Investments and MacKay resulting from, among other things, the Board’s consideration of each of the Advisory Agreements in prior years, the advisory agreements for other funds in the MainStay Group of Funds, the Board’s review throughout the year of the performance and operations of other funds in the MainStay Group of Funds and each Trustee’s business judgment and industry experience. In addition to considering the above-referenced factors, the Board observed that in the marketplace, notably under variable life insurance policies and variable annuity contracts for which the Portfolio serves as an investment option, there are a range of investment options available to investors and that the Portfolio’s shareholders, having had the opportunity to consider other investment options, have chosen to invest in the Portfolio.
The factors that figured prominently in the Board’s decision to approve the continuation of each of the Advisory Agreements during its December 6–7, 2022 meeting are summarized in more detail below.
Nature, Extent and Quality of Services Provided by New York Life Investments and MacKay
The Board examined the nature, extent and quality of the services that New York Life Investments provides to the Portfolio. The Board evaluated New York Life Investments’ experience and capabilities in serving as manager of the Portfolio and considered that the Portfolio operates in a “manager-of-managers” structure. The Board also considered New York Life Investments’ responsibilities and services provided pursuant to this structure, including overseeing the services provided by MacKay, evaluating the performance of MacKay, making recommendations to the Board as to whether the Subadvisory Agreement should be renewed, modified or terminated and periodically reporting to the Board regarding the results of New York Life Investments’ evaluation and monitoring functions. The Board noted that New York Life Investments manages other mutual funds, serves a variety of other investment advisory clients, including other pooled investment vehicles, and has experience overseeing mutual fund service providers, including subadvisors. The Board considered the experience of senior personnel at New York Life Investments providing management and administrative and other non-advisory services to the Portfolio. The Board observed that New York Life Investments devotes significant resources and time to providing management and administrative and other non-advisory services to the Portfolio, including New York Life Investments’ oversight and due diligence reviews of MacKay and ongoing analysis of, and interactions with, MacKay with respect to, among other things, the Portfolio’s investment performance and risks as well as MacKay’s investment capabilities and subadvisory services with respect to the Portfolio.
The Board also considered the range of services that New York Life Investments provides to the Portfolio under the terms of the Management Agreement, including: (i) fund accounting and ongoing supervisory services provided by New York Life Investments’ Fund Administration and Accounting Group; (ii) investment supervisory and analytical services provided by New York Life Investments’ Investment Consulting Group; (iii) compliance services provided by the Trust’s Chief Compliance Officer as
well as New York Life Investments’ compliance department, including supervision and implementation of the Portfolio’s compliance program; (iv) legal services provided by New York Life Investments’ Office of the General Counsel; and (v) risk management monitoring and analysis by compliance and investment personnel. In addition, the Board considered New York Life Investments’ willingness to invest in personnel and other resources, such as cyber security, information security and business continuity planning, designed to benefit the Portfolio and noted that New York Life Investments is responsible for compensating the Trust’s officers, except for a portion of the salary of the Trust’s Chief Compliance Officer. The Board recognized that New York Life Investments provides certain other non-advisory services to the Portfolio and has provided an increasingly broad array of non-advisory services to the MainStay Group of Funds as a result of regulatory and other developments, including in connection with the implementation of the MainStay Group of Funds’ derivatives risk management program and policies and procedures adopted pursuant to Rule 18f-4 under the 1940 Act.
The Board also examined the range, and the nature, extent and quality, of the investment advisory services that MacKay provides to the Portfolio and considered the terms of each of the Advisory Agreements. The Board evaluated MacKay’s experience and performance in serving as subadvisor to the Portfolio and advising other portfolios and MacKay’s track record and experience in providing investment advisory services, the experience of investment advisory, senior management and administrative personnel at MacKay. The Board considered New York Life Investments’ and MacKay’s overall resources, legal and compliance environment, capabilities, reputation, financial condition and history. In addition to information provided in connection with quarterly meetings with the Trust’s Chief Compliance Officer, the Board considered information regarding the compliance policies and procedures of New York Life Investments and MacKay and acknowledged their commitment to further developing and strengthening compliance programs relating to the Portfolio. The Board also considered MacKay’s ability to recruit and retain qualified investment professionals and willingness to invest in personnel and other resources to service and support the Portfolio. In this regard, the Board considered the qualifications and experience of the Portfolio’s portfolio manager, the number of accounts managed by the portfolio manager and the method for compensating the portfolio manager.
In addition, the Board considered information provided by New York Life Investments and MacKay regarding the operations of their respective business continuity plans in response to the COVID-19 pandemic and the continued remote work environment.
Based on these considerations, among others, the Board concluded that the Portfolio would likely continue to benefit from the nature, extent and quality of these services.
Investment Performance
In evaluating the Portfolio’s investment performance, the Board considered investment performance results over various periods in light of the Portfolio’s investment objective, strategies and risks. The Board
| 38 | MainStay VP MacKay High Yield Corporate Bond Portfolio |
considered investment reports on, and analysis of, the Portfolio’s performance provided to the Board throughout the year. These reports include, among other items, information on the Portfolio’s gross and net returns, the Portfolio’s investment performance compared to a relevant investment category and the Portfolio’s benchmark, the Portfolio’s risk-adjusted investment performance and the Portfolio’s investment performance as compared to peer funds, as appropriate, as well as portfolio attribution information and commentary on the effect of market conditions. The Board also considered information provided by ISS showing the investment performance of the Portfolio as compared to peer funds. In addition, the Board reviewed the methodology used by ISS to construct the group of peer funds for comparative purposes.
The Board also took into account its discussions with senior management at New York Life Investments concerning the Portfolio’s investment performance over various periods as well as discussions between the Portfolio’s portfolio management team and the members of the Board’s Investment Committee, which generally occur on an annual basis. In addition, the Board considered any specific actions that New York Life Investments or MacKay had taken, or had agreed to take, to seek to enhance Portfolio investment performance and the results of those actions.
Based on these considerations, among others, the Board concluded that its review of the Portfolio’s investment performance and related information supported a determination to approve the continuation of each of the Advisory Agreements.
Costs of the Services Provided, and Profits and Other Benefits Realized, by New York Life Investments and MacKay
The Board considered the costs of the services provided under each of the Advisory Agreements. The Board also considered the profits realized by New York Life Investments and its affiliates, including MacKay, due to their relationships with the Portfolio as well as the MainStay Group of Funds. Because MacKay is an affiliate of New York Life Investments whose subadvisory fee is paid by New York Life Investments, not the Portfolio, the Board considered cost and profitability information for New York Life Investments and MacKay in the aggregate.
In addition, the Board acknowledged the difficulty in obtaining reliable comparative data about mutual fund managers’ profitability because such information generally is not publicly available and may be impacted by numerous factors, including the structure of a fund manager’s organization, the types of funds it manages, the methodology used to allocate certain fixed costs to specific funds and the manager’s capital structure and costs of capital.
In evaluating the costs of the services provided by New York Life Investments and MacKay and profits realized by New York Life Investments and its affiliates, including MacKay, the Board considered, among other factors, New York Life Investments’ and its affiliates’, including MacKay’s, continuing investments in, or willingness to invest in, personnel and other resources to support and further enhance the management of the Portfolio, and that New York Life Investments is
responsible for paying the subadvisory fee for the Portfolio. The Board also considered the financial resources of New York Life Investments and MacKay and acknowledged that New York Life Investments and MacKay must be in a position to recruit and retain experienced professional personnel and to maintain a strong financial position for New York Life Investments and MacKay to continue to provide high-quality services to the Portfolio. The Board recognized that the Portfolio benefits from the allocation of certain fixed costs among the funds in the MainStay Group of Funds, among other expected benefits resulting from its relationship with New York Life Investments.
The Board considered information regarding New York Life Investments’ methodology for calculating profitability and allocating costs provided by New York Life Investments in connection with the fund profitability analysis presented to the Board. The Board noted it had previously engaged an independent consultant to review the methods used to allocate costs among the funds in the MainStay Group of Funds. The Board also noted that the independent consultant had concluded that New York Life Investments’ methods for allocating costs and procedures for estimating overall profitability of the relationship with the funds in the MainStay Group of Funds are reasonable and that New York Life Investments continued to use the same method of calculating profit and allocating costs since the independent consultant’s review. The Board recognized the difficulty in calculating and evaluating a manager’s profitability with respect to the Portfolio and considered that other profitability methodologies may also be reasonable.
The Board also considered certain fall-out benefits that may be realized by New York Life Investments and its affiliates due to their relationships with the Portfolio, including reputational and other indirect benefits. The Board recognized, for example, the benefits to MacKay from legally permitted “soft-dollar” arrangements by which brokers provide research and other services to MacKay in exchange for commissions paid by the Portfolio with respect to trades in the Portfolio’s portfolio securities. In addition, the Board considered its review of the management agreement for a money market fund advised by New York Life Investments and an affiliated subadvisor that serves as an investment option for the Portfolio, including the potential rationale for and costs associated with investments in this money market fund by the Portfolio, if any, and considered information from New York Life Investments that the nature and type of specific investment advisory services provided to this money market fund are distinct from, or in addition to, the investment advisory services provided to the Portfolio. In addition, the Board considered the potential dividend received tax deduction for insurance company affiliates of New York Life Investments from the Portfolio’s securities lending activity.
The Board noted that the Portfolio serves as an investment option primarily under variable contracts issued by affiliates of New York Life Investments that would receive fees under those contracts. The Board observed that, in addition to fees earned by New York Life Investments under the Management Agreement for managing the Portfolio, New York Life Investments’ affiliates also earn revenues from serving the Portfolio in various other capacities, including as the Portfolio’s distributor. The Board considered information about these other revenues and their impact on
Board Consideration and Approval of Management Agreement and Subadvisory Agreement (Unaudited) (continued)
the profitability of the relationship with the Portfolio to New York Life Investments and its affiliates. The Board noted that, although it assessed the overall profitability of the relationship with the Portfolio to New York Life Investments and its affiliates as part of the contract review process, when considering the reasonableness of the fee paid to New York Life Investments under the Management Agreement, the Board considered the profitability of New York Life Investments’ relationship with the Portfolio on a pre-tax basis and without regard to distribution expenses incurred by New York Life Investments from its own resources.
After evaluating the information deemed relevant by the Trustees, the Board concluded that any profits realized by New York Life Investments and its affiliates, including MacKay, due to their relationships with the Portfolio were not excessive and other benefits that may accrue to New York Life Investments and its affiliates, including MacKay, are reasonable.
Management and Subadvisory Fees and Total Ordinary Operating Expenses
The Board evaluated the reasonableness of the fee paid under each of the Advisory Agreements and the Portfolio’s total ordinary operating expenses. The Board primarily considered the reasonableness of the management fee paid by the Portfolio to New York Life Investments because the subadvisory fee paid to MacKay is paid by New York Life Investments, not the Portfolio. The Board also considered the reasonableness of the subadvisory fee paid by New York Life Investments and the amount of the management fee retained by New York Life Investments.
In assessing the reasonableness of the Portfolio’s fees and expenses, the Board primarily considered comparative data provided by ISS on the fees and expenses charged by similar mutual funds managed by other investment advisers. The Board reviewed the methodology used by ISS to construct the group of peer funds for comparative purposes. In addition, the Board considered information provided by New York Life Investments and MacKay on fees charged to other investment advisory clients, including institutional separate accounts and/or other funds that follow investment strategies similar to those of the Portfolio, if any. The Board considered the contractual management fee schedules of the Portfolio as compared to those of such other investment advisory clients, taking into account the rationale for any differences in fee schedules. The Board also took into account information provided by New York Life Investments about the more extensive scope of services provided to registered investment companies, such as the Portfolio, as compared with other investment advisory clients. Additionally, the Board considered the impact of contractual breakpoints on the Portfolio’s net management fee and expenses. The Board also considered that in proposing fees for the Portfolio, New York Life Investments considers the competitive marketplace for mutual funds.
Based on the factors outlined above, among other considerations, the Board concluded that the Portfolio’s management fee and total ordinary operating expenses are within a range that is competitive and support a conclusion that these fees and expenses are reasonable.
Economies of Scale
The Board considered information regarding economies of scale, including whether economies of scale may exist for the Portfolio and whether the Portfolio’s expense structure permits any economies of scale to be appropriately shared with the Portfolio’s beneficial shareholders. The Board also considered a report from New York Life Investments, previously prepared at the request of the Board, that addressed economies of scale, including with respect to the mutual fund business generally, and the various ways in which the benefits of economies of scale may be shared with the funds in the MainStay Group of Funds. Although the Board recognized the difficulty of determining economies of scale with precision, the Board acknowledged that economies of scale may be shared with the Portfolio in a number of ways, including, for example, through the imposition of fee breakpoints, initially setting management fee rates at scale or making additional investments to enhance the services provided to the Portfolio. The Board reviewed information from New York Life Investments showing how the Portfolio’s management fee schedule compared to fee schedules of other funds and accounts managed by New York Life Investments. The Board also reviewed information from ISS showing how the Portfolio’s management fee schedule compared with fees paid for similar services by peer funds at varying asset levels.
Based on this information, the Board concluded that economies of scale are appropriately reflected for the benefit of the Portfolio’s beneficial shareholders through the Portfolio’s expense structure and other methods to share benefits from economies of scale.
Conclusion
On the basis of the information and factors summarized above, among other information and factors deemed relevant by the Trustees, and the evaluation thereof, the Board unanimously voted to approve the continuation of each of the Advisory Agreements.
| 40 | MainStay VP MacKay High Yield Corporate Bond Portfolio |
Proxy Voting Policies and Procedures and Proxy Voting Record
The Portfolio is required to file with the SEC its proxy voting record for the 12-month period ending June 30 on Form N-PX. A description of the policies and procedures that are used to vote proxies relating to portfolio securities of the Portfolio is available free of charge upon request by calling 800-598-2019 or visiting the SEC's website at www.sec.gov. The most recent Form N-PX or proxy voting record is available free of charge upon request by calling 800-598-2019; visiting https://www.newyorklifeinvestments.com/investment-products/vp; or visiting the SEC’s website at www.sec.gov.
Shareholder Reports and Quarterly Portfolio Disclosure
The Portfolio is required to file its complete schedule of portfolio holdings with the SEC 60 days after its first and third fiscal quarter on Form N-PORT. The Portfolio's holdings report is available free of charge upon request by calling 800-598-2019 or by visiting the SEC’s website at www.sec.gov.
Board of Trustees and Officers (Unaudited)
The Trustees and officers of the Portfolio are listed below. The Board oversees the MainStay Group of Funds (which consists of MainStay Funds and MainStay Funds Trust), MainStay VP Funds Trust, MainStay MacKay DefinedTerm Municipal Opportunities Fund, MainStay CBRE Global Infrastructure Megatrends Fund, the Manager and the Subadvisors, and elects the officers of the Portfolios who are responsible for the day-to-day operations of the Portfolio. Information pertaining to the Trustees and officers is set forth below. Each Trustee serves until his or her successor
is elected and qualified or until his or her resignation, death or removal. Under the Board’s retirement policy, unless an exception is made, a Trustee must tender his or her resignation by the end of the calendar year during which he or she reaches the age of 75. The business address of each Trustee and officer listed below is 51 Madison Avenue, New York, New York 10010. None of the Trustees are “interested persons” (as defined by the 1940 Act and rules adopted by the SEC thereunder) of the Portfolio (“Independent Trustees”).
| | Name and
Year of Birth | Term of Office,
Position(s) Held and
Length of Service | Principal Occupation(s)
During Past Five Years | Number of
Portfolios in
Fund Complex
Overseen by
Trustee | Other Directorships
Held by Trustee |
| | | | | | |
| | David H. Chow
1957 | MainStay VP Funds Trust: Trustee since January 2016, Advisory Board Member (June 2015 to December 2015) | Founder and CEO, DanCourt Management, LLC since 1999 | 78 | MainStay Funds: Trustee since January 2016, Advisory Board Member (June 2015 to December 2015) (12 Funds);
MainStay Funds Trust: Trustee since January 2016, Advisory Board Member (June 2015 to December 2015) (33 Funds);
MainStay MacKay DefinedTerm Municipal Opportunities Fund: Trustee since January 2016, Advisory Board Member (June 2015 to December 2015);
MainStay CBRE Global Infrastructure Megatrends Fund: Trustee since June 2021;VanEck Vectors Group of Exchange-Traded Funds: Independent Chairman of the Board of Trustees since 2008 and Trustee since 2006 (57 portfolios); and Berea College of Kentucky: Trustee since 2009, Chair of the Committee since 2018 |
| | Susan B. Kerley
1951 | MainStay VP Funds Trust: Chairman since 2017 and Trustee since 2007* | President, Strategic Management Advisors LLC since 1990 | 78 | MainStay Funds: Chairman since 2017 and Trustee since 2007 (12 Funds); MainStay Funds Trust: Chairman since 2017 and Trustee since 1990 (33 Funds)**;
MainStay MacKay DefinedTerm Municipal Opportunities Fund: Chairman since 2017 and Trustee since 2011; MainStay CBRE Global Infrastructure Megatrends Fund: Trustee since June 2021; and Legg Mason Partners Funds: Trustee since 1991 (45 portfolios) |
| | Alan R. Latshaw
1951 | MainStay VP Funds Trust: Trustee since 2007* | Retired; Partner, Ernst & Young LLP (2002 to 2003); Partner, Arthur Andersen LLP (1989 to 2002); Consultant to the MainStay Funds Audit and Compliance Committee (2004 to 2006) | 78 | MainStay Funds: Trustee since 2006 (12 Funds);
MainStay Funds Trust: Trustee since 2007 (33 Funds)**;
MainStay MacKay DefinedTerm Municipal Opportunities Fund: Trustee since 2011; and
MainStay CBRE Global Infrastructure Megatrends Fund: Trustee since June 2021 |
| 42 | MainStay VP MacKay High Yield Corporate Bond Portfolio |
| | Name and
Year of Birth | Term of Office,
Position(s) Held and
Length of Service | Principal Occupation(s)
During Past Five Years | Number of
Portfolios in
Fund Complex
Overseen by
Trustee | Other Directorships
Held by Trustee |
| | | | | | |
| | Karen Hammond
1956 | MainStay VP Funds Trust: Trustee since December 2021, Advisory Board Member (June 2021 to December 2021)
| Retired, Managing Director, Devonshire Investors (2007 to 2013); Senior Vice President, Fidelity Management & Research Co. (2005 to 2007); Senior Vice President and Corporate Treasurer, FMR Corp. (2003 to 2005); Chief Operating Officer, Fidelity Investments Japan (2001 to 2003) | 78 | MainStay Funds: Trustee since December 2021, Advisory Board Member (June 2021 to December 2021) (12 Funds);
MainStay Funds Trust: Trustee since December 2021, Advisory Board Member (June 2021 to December 2021) (33 Funds);
MainStay MacKay DefinedTerm Municipal Opportunities Fund: Trustee since December 2021, Advisory Board Member (June 2021 to December 2021);
MainStay CBRE Global Infrastructure Megatrends Fund: Trustee since December 2021, Advisory Board Member (June 2021 to December 2021);
Two Harbors Investment Corp.: Director since 2018; Rhode Island State Investment Commission: Member since 2017; and Blue Cross Blue Shield of Rhode Island: Director since 2019
|
| | Jacques P. Perold
1958 | MainStay VP Funds Trust: Trustee since January 2016, Advisory Board Member (June 2015 to December 2015) | Founder and Chief Executive Officer, CapShift Advisors LLC (since 2018); President, Fidelity Management & Research Company (2009 to 2014); President and Chief Investment Officer, Geode Capital Management, LLC (2001 to 2009) | 78 | MainStay Funds: Trustee since January 2016, Advisory Board Member (June 2015 to December 2015) (12 Funds);
MainStay Funds Trust: Trustee since January 2016, Advisory Board Member (June 2015 to December 2015) (33 Funds); MainStay MacKay DefinedTerm Municipal Opportunities Fund: Trustee since January 2016, Advisory Board Member (June 2015 to December 2015);
MainStay CBRE Global Infrastructure Megatrends Fund: Trustee since June 2021; Allstate Corporation: Director since 2015;
Partners in Health: Trustee since 2019; and
MSCI Inc.: Director since 2017 |
| | Richard S. Trutanic
1952 | MainStay VP Funds Trust: Trustee since 2007* | Chairman and Chief Executive Officer, Somerset & Company (financial advisory firm) since 2004; Managing Director, The Carlyle Group (private investment firm) (2002 to 2004); Senior Managing Director, Partner and Board Member, Groupe Arnault S.A. (private investment firm) (1999 to 2002)
| 78 | MainStay Funds: Trustee since 1994 (12 Funds);
MainStay Funds Trust: Trustee since 2007 (33 Funds)**;
MainStay MacKay DefinedTerm Municipal Opportunities Fund: Trustee since 2011; and
MainStay CBRE Global Infrastructure Megatrends Fund: Trustee since June 2021 |
| * | Includes prior service as a Director of MainStay VP Series Fund, Inc., the predecessor to MainStay VP Funds Trust. |
| ** | Includes prior service as a Director/Trustee of certain predecessor entities to MainStay Funds Trust. |
Board of Trustees and Officers (Unaudited) (continued)
| | Name and
Year of Birth | Position(s) Held and
Length of Service | Principal Occupation(s)
During Past Five Years | |
| | | | | |
| | Kirk C. Lehneis
1974 | President, MainStay VP Funds Trust (since 2017) | Chief Operating Officer and Senior Managing Director (since 2016), New York Life Investment Management LLC and New York Life Investment Management Holdings LLC; Member of the Board of Managers (since 2017) and Senior Managing Director (since 2018), NYLIFE Distributors LLC; Chairman of the Board and Senior Managing Director, NYLIM Service Company LLC (since 2017); Trustee, President and Principal Executive Officer of IndexIQ Trust, IndexIQ ETF Trust and IndexIQ Active ETF Trust (since January 2018); President, MainStay CBRE Global Infrastructure Megatrends Fund (since 2021), MainStay MacKay DefinedTerm Municipal Opportunities Fund, MainStay Funds and MainStay Funds Trust (since 2017); Senior Managing Director, Global Product Development (from 2015-2016); Managing Director, Product Development (from 2010-2015), New York Life Investment Management LLC | |
| | Jack R. Benintende
1964 | Treasurer and Principal Financial and Accounting Officer, MainStay VP Funds Trust (since 2007)** | Managing Director, New York Life Investment Management LLC (since 2007); Treasurer and Principal Financial and Accounting Officer, MainStay CBRE Global Infrastructure Megatrends Fund (since 2021), MainStay MacKay DefinedTerm Municipal Opportunities Fund (since 2011), MainStay Funds Trust (since 2009) and MainStay Funds (since 2007); and Assistant Treasurer, New York Life Investment Management Holdings LLC (2008 to 2012) | |
| | J. Kevin Gao
1967 | Secretary and Chief Legal Officer, MainStay VP Funds Trust (since 2010)** | Managing Director and Associate General Counsel, New York Life Investment Management LLC (since 2010); Secretary and Chief Legal Officer, MainStay CBRE Global Infrastructure Megatrends Fund (since 2021), MainStay MacKay DefinedTerm Municipal Opportunities Fund (since 2011), MainStay Funds and MainStay Funds Trust (since 2010) | |
| | Scott T. Harrington
1959 | Vice President— Administration, MainStay VP Funds Trust (since 2005)** | Managing Director, New York Life Investment Management LLC (including predecessor advisory organizations) (since 2000); Member of the Board of Directors, New York Life Trust Company (since 2009); Vice President—Administration, MainStay CBRE Global Infrastructure Megatrends Fund (since 2021), MainStay MacKay DefinedTerm Municipal Opportunities Fund (since 2011), MainStay Funds Trust and MainStay Funds (since 2009) | |
| | Kevin M. Gleason
1967 | Vice President and Chief Compliance Officer, MainStay VP Funds Trust (since June 2022) | Vice President and Chief Compliance Officer, IndexIQ, IndexIQ ETF Trust and Index IQ Active ETF Trust (since June 2022); Vice President and Chief Compliance Officer, MainStay CBRE Global Infrastructure Megatrends Fund, MainStay MacKay DefinedTerm Municipal Opportunities Fund (since June 2022); MainStay Funds Trust and MainStay Funds (since June 2022); Senior Vice President, Voya Investment Management and Chief Compliance Officer, Voya Family of Funds (2012-2022) | |
| * | The officers listed above are considered to be “interested persons” of the MainStay Group of Funds, MainStay VP Funds Trust, MainStay CBRE Global Infrastructure Megatrends Fund and MainStay MacKay DefinedTerm Municipal Opportunities Fund within the meaning of the 1940 Act because of their affiliation with the MainStay Group of Funds, New York Life Insurance Company and/or its affiliates, including New York Life Investment Management LLC, NYLIM Service Company LLC, NYLIFE Securities LLC and/or NYLIFE Distributors LLC, as described in detail in the column captioned “Principal Occupation(s) During Past Five Years.” Officers are elected annually by the Board. |
| ** | Includes prior service as an Officer of MainStay VP Series Fund, Inc., the predecessor to MainStay VP Funds Trust. |
Officers of the Trust (Who are not Trustees)*
| 44 | MainStay VP MacKay High Yield Corporate Bond Portfolio |
This page intentionally left blank
This page intentionally left blank.
MainStay VP Portfolios
MainStay VP offers a wide range of Portfolios. The full array of MainStay VP offerings is listed here, with information about the manager, subadvisors, legal counsel, and independent registered public accounting firm.
Equity
MainStay VP American Century Sustainable Equity Portfolio1
MainStay VP Candriam Emerging Markets Equity Portfolio
MainStay VP Epoch U.S. Equity Yield Portfolio
MainStay VP Fidelity Institutional AM® Utilities Portfolio†
MainStay VP MacKay International Equity Portfolio
MainStay VP Natural Resources Portfolio
MainStay VP S&P 500 Index Portfolio2
MainStay VP Small Cap Growth Portfolio
MainStay VP Wellington Growth Portfolio
MainStay VP Wellington Mid Cap Portfolio
MainStay VP Wellington Small Cap Portfolio
MainStay VP Wellington U.S. Equity Portfolio
MainStay VP Winslow Large Cap Growth Portfolio
Mixed Asset
MainStay VP Balanced Portfolio
MainStay VP Income Builder Portfolio
MainStay VP Janus Henderson Balanced Portfolio
MainStay VP MacKay Convertible Portfolio
Income
MainStay VP Bond Portfolio
MainStay VP Floating Rate Portfolio
MainStay VP Indexed Bond Portfolio
MainStay VP MacKay Government Portfolio
MainStay VP MacKay High Yield Corporate Bond Portfolio
MainStay VP MacKay Strategic Bond Portfolio
MainStay VP PIMCO Real Return Portfolio
Money Market
MainStay VP U.S. Government Money Market Portfolio
Alternative
MainStay VP CBRE Global Infrastructure Portfolio
MainStay VP IQ Hedge Multi-Strategy Portfolio
Asset Allocation
MainStay VP Conservative Allocation Portfolio
MainStay VP Equity Allocation Portfolio
MainStay VP Growth Allocation Portfolio
MainStay VP Moderate Allocation Portfolio
Manager
New York Life Investment Management LLC
New York, New York
Subadvisors
American Century Investment Management, Inc.
Kansas City, Missouri
Brown Advisory LLC
Baltimore, Maryland
Candriam*
Strassen, Luxembourg
CBRE Investment Management Listed Real Assets LLC
Radnor, Pennsylvania
Epoch Investment Partners, Inc.
New York, New York
FIAM LLC
Smithfield, Rhode Island
IndexIQ Advisors LLC*
New York, New York
Janus Henderson Investors US LLC
Denver, Colorado
MacKay Shields LLC*
New York, New York
Newton Investment Management North America, LLC
Boston, Massachusetts
NYL Investors LLC*
New York, New York
Pacific Investment Management Company LLC
Newport Beach, California
Segall Bryant & Hamill, LLC
Chicago, Illinois
Wellington Management Company LLP
Boston, Massachusetts
Winslow Capital Management, LLC
Minneapolis, Minnesota
Legal Counsel
Dechert LLP
Washington, District of Columbia
Independent Registered Public Accounting Firm
PricewaterhouseCoopers LLP
New York, New York
Distributor
NYLIFE Distributors LLC*
Jersey City, New Jersey
Custodian
JPMorgan Chase Bank, N.A.
New York, New York
Some Portfolios may not be available in all products.
† Fidelity Institutional AM is a registered trade mark of FMR LLC. Used with permission.
* An affiliate of New York Life Investment Management LLC.
| 1. | Prior to May 1, 2022, the Portfolio's name was MainStay VP T. Rowe Price Equity Income Portfolio. |
| 2. | Prior to May 1, 2022, the Portfolio's name was MainStay VP MacKay S&P 500 Index Portfolio. |
Not part of the Annual Report
2022 Annual Report
This report is for the general information of New York Life Variable Annuities and NYLIAC Variable Universal Life Insurance Products policyowners. It must be preceded or accompanied by the appropriate product(s) and funds prospectuses if it is given to anyone who is not an owner of a New York Life variable annuity policy or a NYLIAC Variable Universal Life Insurance Product. This report does not offer for sale or solicit orders to purchase securities.
The performance data quoted in this report represents past performance. Past performance is no guarantee of future results. Due to market volatility and other factors, current performance may be lower or higher than the figures shown. The most recent month-end performance summary for your variable annuity or variable life policy is available by calling 800-598-2019 and is updated periodically on newyorklife.com.
The New York Life Variable Annuities and NYLIAC Variable Universal Life Insurance Products are issued by New York Life Insurance and Annuity Corporation (a Delaware Corporation) and distributed by NYLIFE Distributors LLC (Member FINRA/SIPC).
New York Life Insurance Company
New York Life Insurance and Annuity
Corporation (NYLIAC) (A Delaware Corporation)
51 Madison Avenue, Room 551
New York, NY 10010
newyorklife.com
newyorklifeinvestments.com
NYLIFE Distributors LLC, 30 Hudson Street, Jersey City, NJ 07302
New York Life Investment Management LLC is the investment manager to the MainStay VP Funds Trust
©2023 by NYLIFE Distributors LLC. All rights reserved.
You may obtain copies of the Prospectus and the Statement of Additional Information free of charge, upon request, by calling toll-free 800-598-2019 or writing to New York Life Insurance and Annuity Corporation, 51 Madison Avenue, New York, NY 10010.
| Not FDIC Insured | No Bank Guarantee | May Lose Value |
(NYLIAC) NI520
MainStay VP Income Builder Portfolio
Message from the President and Annual Report
December 31, 2022
Sign up for e-delivery of your shareholder reports. For full details on e-delivery, including who can participate and what you can receive via e-delivery,
please log in to newyorklifeinvestments.com/accounts.
| Not FDIC/NCUA Insured | Not a Deposit | May Lose Value | No Bank Guarantee | Not Insured by Any Government Agency |
This page intentionally left blank
Message from the President
The 12-month reporting period ended December 31, 2022, proved exceptionally challenging for investors as both stock and bond markets suffered steep declines. A variety of economic and geopolitical forces drove the market’s losses, all centered around rising inflation and monetary efforts to rein it in.
Inflationary alarms began to sound well before the reporting period began. In late 2021, after nearly two years of accommodative policies designed to encourage economic growth in the face of the COVID-19 pandemic, the U.S. Federal Reserve (the “Fed”) warned of the increasing need to tighten monetary policy. Nevertheless, the pace and persistence of inflation in early 2022 caught most market participants—the Fed included—off guard. Russia’s invasion of Ukraine in February exacerbated global inflationary pressures while increasing investor uncertainty. Domestic supply shortages, international trade imbalances and rising inflation caused U.S. GDP (gross domestic product) to contract in the first and second quarters of the year, although employment and consumer spending proved resilient. Prices for petroleum surged to multi-year highs, while many key agricultural chemicals and industrial metals soared as well. Accelerating inflationary forces prompted the Fed to implement its most aggressive series of interest rate hikes since the 1980s, with a 0.25% increase in March followed by six further rate increases totaling 4.25%. International central banks generally followed suit and raised rates by varying degrees in efforts to curb local inflation, although most increases remained significantly more modest than those in the United States. Relatively high U.S. interest rates and an international risk averse sentiment pushed U.S. dollar values higher compared to most other currencies, with negative impacts on global prices for food, fuel and other key U.S.-dollar-denominated products.
The effects of these interrelated challenges were felt throughout U.S. and international financial markets. The S&P 500® Index, a widely regarded benchmark of market performance, declined by more than 18% during the reporting period. Although the energy sector generated strong gains, bolstered by elevated oil and gas prices, most other industry segments recorded losses. The more cyclical and growth-oriented sectors of consumer discretionary, information technology and real estate delivered the weakest returns, while the traditionally defensive and value-oriented
consumer staples, utilities and health care sectors outperformed. On average, international developed-country equity markets mildly outperformed their U.S. counterparts, while emerging markets lagged slightly. Fixed-income markets proved unusually volatile, with bond prices trending sharply lower as yields rose along with interest rates. Short-term yields rose faster than long-term yields, producing a yield curve inversion from July through the end of the reporting period as long-term rates remained below short-term rates. While floating-rate instruments, which feature variable interest rates that allow investors to benefit from a rising rate environment, provided a degree of insulation from inflation-driven trends, they were not immune to the market’s widespread declines.
Although, according to the most recent estimates, the annualized inflation rate in the United States has declined from a peak of 9.1% in July 2022 to 6.5% in December, the Fed remains focused on achieving more substantial and lasting reductions, aiming for a target rate of 2%. As a result, further rate hikes and additional market volatility are potential headwinds in the coming months. The question remains as to whether the Fed and other central banks will manage a so-called “soft landing,” curbing inflation while avoiding a persistent economic slowdown. If they prove successful, we believe that the increasingly attractive valuations we have observed in both equity and bond markets should eventually translate into sustainable improvements in the investment environment.
Whatever actions the Fed takes and however financial markets react, as a MainStay VP investor you can depend on us to continue managing our portfolios with the insight, expertise and level of service that have long defined New York Life Investments. Thank you for trusting us to help you meet your investment needs.
Sincerely,
Kirk C. Lehneis
President
The opinions expressed are as of the date of this report and are subject to change. There is no guarantee that any forecast made will come to pass. This material does not constitute investment advice and is not intended as an endorsement of any specific investment. Past performance is no guarantee of future results.
Not part of the Annual Report
Investors should refer to the Portfolio’s Summary Prospectus and/or Prospectus and consider the Portfolio’s investment objectives, strategies, risks, charges and expenses carefully before investing. The Summary Prospectus and/or Prospectus contain this and other information about the Portfolio. You may obtain copies of the Portfolio’s Summary Prospectus, Prospectus and Statement of Additional Information, which includes information about the MainStay VP Funds Trust's Trustees, free of charge, upon request, by calling toll-free 800-598-2019, by writing to New York Life Insurance and Annuity Corporation, 51 Madison Avenue, Room 251, New York, New York 10010 or by sending an email to MainStayShareholdersServices@nylim.com. These documents are also available at newyorklifeinvestments.com/investment-products/vp. Please read the Portfolio's Summary Prospectus and/or Prospectus carefully before investing. MainStay VP Funds Trust portfolios are separate account options which are purchased through a variable insurance or variable annuity contract.
Investment and Performance Comparison (Unaudited)
Performance data quoted represents past performance. Past performance is no guarantee of future results. Because of market volatility and other factors, current performance may be lower or higher than the figures shown. Investment return and principal value will fluctuate, and as a result, when shares are redeemed, they may be worth more or less than their original cost. The performance table and graph do not reflect any deduction of sales charges, mortality and expense charges, contract charges or administrative charges. Please refer to the Performance Summary appropriate for your policy. For performance information current to the most recent month-end, please call 800-598-2019 or visit www.newyorklife.com.
Performance figures may reflect certain fee waivers and/or expense limitations, without which total returns may have been different. For information on current fee waivers and/or expense limitations (if any), please refer to the Notes to Financial Statements.
| Average Annual Total Returns for the Year-Ended December 31, 2022 |
| Class | Inception
Date | One
Year | Five
Years | Ten
Years | Gross
Expense
Ratio1 |
| Initial Class Shares | 1/29/1993 | -13.52% | 2.92% | 5.78% | 0.61% |
| Service Class Shares | 6/4/2003 | -13.73 | 2.67 | 5.52 | 0.86 |
| 1. | The gross expense ratios presented reflect the Portfolio’s “Total Annual Portfolio Operating Expenses” from the most recent Prospectus and may differ from other expense ratios disclosed in this report. |
| Benchmark Performance* | One
Year | Five
Years | Ten
Years |
| MSCI World Index (Net)1 | -18.14% | 6.14% | 8.85% |
| Bloomberg U.S. Aggregate Bond Index2 | -13.01 | 0.02 | 1.06 |
| Blended Benchmark Index3 | -15.85 | 4.01 | 5.92 |
| Morningstar World Allocation Category Average4 | -12.55 | 1.75 | 3.35 |
| * | Returns for indices reflect no deductions for fees, expenses or taxes, except for foreign withholding taxes where applicable. Results assume reinvestment of all dividends and capital gains. An investment cannot be made directly in an index. |
| 1. | The MSCI World Index (Net) is the Portfolio's primary broad-based securities market index for comparison purposes. The MSCI World Index (Net) is a free float-adjusted market capitalization weighted index that is designed to measure the equity market performance of developed markets. |
| 2. | The Portfolio has selected the Bloomberg U.S. Aggregate Bond Index as a secondary benchmark. The Bloomberg U.S. Aggregate Bond Index is a broad-based benchmark that measures performance of the investment grade, U.S. dollar-denominated, fixed-rate taxable bond market, including Treasurys, government-related and corporate securities, mortgage-backed securities (agency fixed-rate and hybrid adjustable rate mortgage pass-throughs), asset-backed securities, and commercial mortgage-backed securities. |
| 3. | The Portfolio has selected the Blended Benchmark Index as an additional benchmark. The Blended Benchmark Index consists of the MSCI World Index (Net) and the Bloomberg U.S. Aggregate Bond Index, weighted 60% and 40%, respectively. |
| 4. | The Morningstar World Allocation Category Average is representative of portfolios that seek to provide both capital appreciation and income by investing in three major areas: stocks, bonds, and cash. While these portfolios do explore the whole world, most of them focus on the U.S., Canada, Japan, and the larger markets in Europe. It is rare for such portfolios to invest more than 10% of their assets in emerging markets. These portfolios typically have at least 10% of assets in bonds, less than 70% of assets in stocks, and at least 40% of assets in non-U.S. stocks or bonds. Results are based on average total returns of similar funds with all dividends and capital gain distributions reinvested. |
Cost in Dollars of a $1,000 Investment in MainStay VP Income Builder Portfolio (Unaudited)
The example below is intended to describe the fees and expenses borne by shareholders during the six-month period from July 1, 2022 to December 31, 2022, and the impact of those costs on your investment.
Example
As a shareholder of the Portfolio you incur two types of costs: (1) transaction costs, including exchange fees and sales charges (loads) on purchases (as applicable), and (2) ongoing costs, including management fees, distribution and/or service (12b-1) fees and other Portfolio expenses (as applicable). This example is intended to help you understand your ongoing costs (in dollars) of investing in the Portfolio and to compare these costs with the ongoing costs of investing in other mutual funds. The example is based on an investment of $1,000 made at the beginning of the six-month period and held for the entire period from July 1, 2022 to December 31, 2022. Shares are only sold in connection with variable life and annuity contracts and the example does not reflect any contract level or transactional fees or expenses. If these costs had been included, your costs would have been higher.
This example illustrates your Portfolio’s ongoing costs in two ways:
Actual Expenses
The second and third data columns in the table below provide information about actual account values and actual expenses. You may use the information in these columns, together with the amount you invested, to estimate the expenses that you paid during the six months ended
December 31, 2022. Simply divide your account value by $1,000 (for example, an $8,600 account value divided by $1,000 = 8.6), then multiply the result by the number under the heading entitled “Expenses Paid During Period” to estimate the expenses you paid on your account during this period.
Hypothetical Example for Comparison Purposes
The fourth and fifth data columns in the table below provide information about hypothetical account values and hypothetical expenses based on the Portfolio’s actual expense ratio and an assumed rate of return of 5% per year before expenses, which is not the Portfolio’s actual return. The hypothetical account values and expenses may not be used to estimate the actual ending account balances or expenses you paid for the six-month period shown. You may use this information to compare the ongoing costs of investing in the Portfolio with the ongoing costs of investing in other mutual funds. To do so, compare this 5% hypothetical example with the 5% hypothetical examples that appear in the shareholder reports of the other mutual funds.
Please note that the expenses shown in the table are meant to highlight your ongoing costs only and do not reflect any transactional costs, such as exchange fees or sales charges (loads). Therefore, the fourth and fifth data columns of the table are useful in comparing ongoing costs only and will not help you determine the relative total costs of owning different funds. In addition, if these transactional costs were included, your costs would have been higher.
| Share Class | Beginning
Account
Value
7/1/22 | Ending Account
Value (Based
on Actual
Returns and
Expenses)
12/31/22 | Expenses
Paid
During
Period1 | Ending Account
Value (Based
on Hypothetical
5% Annualized
Return and
Actual Expenses)
12/31/22 | Expenses
Paid
During
Period1 | Net Expense
Ratio
During
Period2 |
| Initial Class Shares | $1,000.00 | $1,021.10 | $3.16 | $1,022.08 | $3.16 | 0.62% |
| Service Class Shares | $1,000.00 | $1,019.90 | $4.43 | $1,020.82 | $4.43 | 0.87% |
| 1. | Expenses are equal to the Portfolio’s annualized expense ratio of each class multiplied by the average account value over the period, divided by 365 and multiplied by 184 (to reflect the six-month period). The table above represents the actual expenses incurred during the six-month period. In addition to the fees and expenses which the Portfolio bears directly, it also indirectly bears a pro rata share of the fees and expenses of the underlying funds in which it invests. Such indirect expenses are not included in the above-reported expense figures. |
| 2. | Expenses are equal to the Portfolio's annualized expense ratio to reflect the six-month period. |
| 6 | MainStay VP Income Builder Portfolio |
Portfolio Composition as of December 31, 2022 (Unaudited)
See Portfolio of Investments beginning on page 12 for specific holdings within these categories. The Portfolio's holdings are subject to change.
Top Ten Holdings and/or Issuers Held as of December 31, 2022 (excluding short-term investments) (Unaudited)
| 1. | GNMA, (zero coupon)-4.00%, due 8/20/49–2/20/52 |
| 2. | U.S. Treasury Bonds, 4.00%, due 11/15/42–11/15/52 |
| 3. | UMBS, 30 Year, 2.50%-5.00%, due 8/1/48–11/1/52 |
| 4. | U.S. Treasury Notes, 4.00%-4.375%, due 10/31/24–11/15/32 |
| 5. | FHLMC STACR REMIC Trust, 5.778%-7.678%, due 8/25/33–12/25/50 |
| 6. | Bank of America Corp. |
| 7. | JPMorgan Chase & Co. |
| 8. | Broadcom, Inc. |
| 9. | FNMA, (zero coupon)-10.139%, due 7/25/29–3/25/60 |
| 10. | Analog Devices, Inc. |
Portfolio Management Discussion and Analysis (Unaudited)
Answers to the questions reflect the views of Jae S. Yoon, CFA, and Jonathan Swaney of New York Life Investment Management LLC, the Portfolio’s Manager; Stephen R. Cianci, CFA, and Neil Moriarty III of MacKay Shields LLC (“MacKay Shields”), the Subadvisor for the fixed-income portion of the Portfolio; and William W. Priest, CFA, Michael A. Welhoelter, CFA, John Tobin, PhD, CFA, and Kera Van Valen, CFA, of Epoch Investment Partners, Inc. (“Epoch”), the Subadvisor for the equity portion of the Portfolio.
How did MainStay VP Income Builder Portfolio perform relative to its benchmarks and peers during the 12 months ended December 31, 2022?
For the 12 months ended December 31, 2022, MainStay VP Income Builder Portfolio returned −13.52% for Initial Class shares and −13.73% for Service Class shares. Over the same period, both share classes outperformed the −18.14% return of the MSCI World Index (Net), which is the Portfolio’s primary benchmark; underperformed the −13.01% return of the Bloomberg U.S. Aggregate Bond Index, which is the Portfolio’s secondary benchmark; and outperformed the −15.85% return of the Blended Benchmark Index, which is an additional benchmark of the Portfolio. For the 12 months ended December 31, 2022, both share classes underperformed the −12.55% return of the Morningstar World Allocation Category Average.1
During the reporting period, were there any market events that materially impacted the Portfolio’s performance or liquidity?
For equity markets, 2022 was a period characterized by change and challenges. The reporting period saw markets primarily ruled by three major influences: inflation, monetary tightening and the war in Ukraine. As the once-in-a-generation pandemic that monopolized investors' focus for the previous two years finally began to fade from headlines, all eyes turned toward the impending economic aftershocks of COVID-19 lockdowns and global stimulus. Inflation—fueled by a rapid snapback in demand and fragmented global supply chains—proved far from "transitory," and as prices trended upward, the specter of looming rate hikes saw a start to the year permeated by risk-averse sentiment. Price multiples contracted rapidly as investors sought to better position themselves for monetary tightening, driving a broad rotation from growth to value that extended through 2022. Valuations for long-duration growth stocks, which had been the largest beneficiaries of the preceding decade of abundant liquidity, were especially challenged. We believe the Portfolio delivered very strong downside protection and performed in line with expectations, given the volatile and challenging market landscape.
From a fixed-income perspective, as most major central banks battled rising inflation through stepped-up policy rate increases, risk-free as well as risk assets both performed poorly. Widespread, substantial global monetary tightening occurred during the reporting period, with numerous central banks quickly tightening policies within a relatively short period of time.
What factors affected the relative performance of the equity portion of the Portfolio during the reporting period?
Against the market and economic backdrop described above, the Portfolio performed as designed by providing significant downside protection. Driven in part by the macro pressures present throughout, the reporting period saw strong investor preference for select factors, many of which had been largely out of favor for some time. The Portfolio's tilt toward dividend yield and value, as well as low beta2 and low exposure to volatility, provided tailwinds throughout a year of significant pressure on equity valuations.
During periods of increased volatility like 2022, the equity portion of the Portfolio is designed to withstand the fluctuations, as our focus on highly cash-generative businesses with shrewd management teams and strong financials tends to select companies that are naturally well suited to navigate market turmoil. While the Portfolio was not immune to the array of headwinds facing all equities, it proved immensely resilient relative to the broader market. Much of that resilience was derived from stock selection and a tendency to invest in industries that exhibit the cash flow growth profiles and shareholder yield characteristics that we prioritize.
Which market segments were the strongest positive contributors to relative performance in the equity portion of the Portfolio, and which market segments detracted the most?
During the reporting period, the information technology sector made the strongest contribution to returns relative to the MSCI World Index (Net), due to positive stock selection and an underweight sector allocation. (Contributions take weightings and total returns into account.) Stock selection and an underweight allocation in communication services and consumer discretionary also contributed positively. The only detracting sector was energy, due to stock selection.
During the reporting period, which individual stocks made the strongest positive contributions to absolute performance in the equity portion of the Portfolio and which stocks detracted the most?
The strongest positive contributor to the absolute performance of the equity portion of the Portfolio was U.S.-based pharmaceutical company Merck & Company, followed by France-based global energy company TotalEnergies and U.S.-based pharmaceutical firm Eli Lilly and Company.
| 1. | See page 5 for more information on benchmark and peer group returns. |
| 2. | Beta is a measure of volatility in relation to the market as a whole. A beta higher than 1 indicates that a security or portfolio will tend to exhibit higher volatility than the market. A beta lower than 1 indicates that a security or portfolio will tend to exhibit lower volatility than the market. |
| 8 | MainStay VP Income Builder Portfolio |
Merck shares trended higher during the reporting period supported by quarterly earnings that consistently exceeded market expectations, in addition to positive news flow. In particular, the company’s successful cancer drug, Keytruda, and its HPV vaccine, Gardasil, continued to generate strong top-line growth. Positive headlines included the European Union recommendation for approval of Lynparza (co-developed with AstraZeneca) for prostate cancer, a collaboration agreement with Moderna to explore mRNA technology in combination with Keytruda to develop personalized cancer vaccines, clinical collaboration agreements with IO Biotech and Portage Biotech, the bolt-on acquisition3 of Imago Biosciences, and a dividend increase. Merck pays an attractive and growing dividend, which is well-covered by free cash flow, and regularly repurchases shares.
TotalEnergies shares outperformed as energy demand continued to recover and commodity prices stayed at elevated levels, partly due to the prolonged war in Ukraine. Investors' concern about the company's exposure to Russia abated with the announcement of new projects and partnerships that should help offset declining contributions from Russian assets. At its September 2022 analyst day, TotalEnergies announced an increase in its distribution to shareholders with a special dividend of €1 per share in 2022. Shares gained further ground in early October, after the OPEC+ group of petroleum exporting nations decided to reduce supply by cutting production. A tight refining market also bolstered the share price throughout the year. Management remains focused on driving cash flow growth from liquified natural gas (LNG) and renewables. TotalEnergies' global scale, strong balance sheet, integrated business model, capital flexibility and cost discipline allow the company to pay a sustainable dividend through commodity price cycles and reward shareholders with buybacks using excess free cash flow.
Eli Lilly shares trended higher during the reporting period, reflecting positive drug pipeline developments. Most significantly, the company's new diabetes drug, tirzepatide, was approved by the U.S. Food and Drug Administration (the “FDA”) in May 2022. The drug, marketed under the name Mounjaro, soon showed signs of rapid acceptance in the marketplace. In October, the FDA granted fast-track designation for tirzepatide to treat obesity, an area with significant unmet need and a sizable commercial opportunity. Eli Lilly's Alzheimer's drug, Donanemab, is currently being reviewed by the FDA with a Priority Review designation. Eli Lilly closed out 2022 with a dividend increase in December. The company returns cash to shareholders through a growing dividend and regular share repurchases. The dividend is targeted to grow in line with earnings and is well covered by free cash flow.
The weakest contributors to the absolute performance of the equity portion of the Portfolio included positions in consumer
electronics and services company Apple, global software company Microsoft and semiconductor manufacturer Taiwan Semiconductor Manufacturing Company (TSMC).
Apple shares underperformed when COVID-19 lockdowns in China disrupted iPhone 14 supply, and as demand for the company’s product lineup appeared more tepid than originally forecast. Lead time appeared to decline while factory issues persisted, suggesting that the macro weakness was undermining the company’s sell-through rate. We believe the elimination of the China zero-COVID-19 policy late in 2022 should bolster demand, while a return to normal factory capacity should help normalize inventory of those items most in undersupply. Apple returns cash to shareholders through dividends and share repurchases.
Microsoft's shares came under pressure as investors shifted focus away from high-growth names amid rising interest rates, and from persistent concerns that the company’s end markets were slowing. Although the PC market declined, we believe Microsoft’s shift towards subscription revenues, in place of perpetual licenses, and the continued growth of its cloud business should support results better than in past economic downturns, even if the world slips into a recession. Management is dedicated to shareholder returns through continued improvements to its dividend and share repurchase plans.
TSMC shares underperformed amid a growing semiconductor oversupply in certain sectors, potentially leading to cancelation of some of the company’s productions slots. As of the end of the reporting period, the company was able to adapt to take advantage of available demand in the industry. As one of only two foundry providers able to deliver bleeding-edge capacity, we believe any order weakness is likely to prove temporary as inventories correct.
Worries that Taiwan could face an invasion from China weighed on shares as well, although, in our opinion, the strategic importance of Taiwan's semiconductor production to the West means that an invasion by China would be far more likely to prompt direct military intervention from the U.S. and allies. In our view this will weigh heavily on a decision by China to invade. The company paid a well-covered dividend during the reporting period.
Did the equity portion of the Portfolio make any significant purchases or sales during the reporting period?
During the reporting period, the equity portion of the Portfolio initiated multiple positions, including French construction and concession operator VINCI and Austrian bank BAWAG Group. VINCI’s concessions business consists of toll roads primarily located in France and a global airport portfolio. These areas operate under long-term concessions with persistent, regular
| 3. | A bolt-on acquisition is the acquisition of a smaller company, usually in the same line of business, that presents strategic value to the acquiring entity. The smaller company is generally merged into a division of the acquiring entity. |
price escalators. The company’s construction arm is the largest in Europe, providing the scale to compete for a myriad of complex projects, reduce key project risk and generate consistent returns. Growth is driven by population movement expansion and by VINCI’s ability to win additional public and private projects, increasingly including renewable energy projects. The company paid a well-covered dividend during the reporting period. A leading Austrian bank, BAWAG has established a low-cost deposit franchise in its home market and a growing international presence in Germany, Switzerland and the Netherlands. The company is well capitalized and maintains one of the best profitability track records among European financials. BAWAG pays an attractive, growing dividend and returns excess capital to shareholders through its recently renewed share repurchase program.
Notable sales during the reporting period included U.S.-based biopharmaceutical company Amgen and Japan-based diversified insurance and asset management company Tokio Marine.
Amgen’s portfolio of drugs addresses a variety of therapeutic areas, such as cancer, cardio-vascular disease, auto-immune disorders and bone health. Additionally, the company has a growing portfolio of biosimilar drugs that offer lower-cost treatment options for patients on biologics that have lost patent protection. The company pays a well-covered dividend, has historically bought back shares with excess free cash flow, and in the near term is expected to focus on debt reduction following its recently announced acquisition of Horizon Therapeutics. The shares appreciated materially over the course of 2022, compressing the dividend yield, which led us to sell the Portfolio’s position in pursuit of other opportunities. Tokio Marine is a diversified insurance and asset management company based in Japan. The largest insurer in Japan, Tokio Marine also maintains strong market positions in several markets outside Japan with dynamic growth prospects. While the company pays an attractive dividend, Tokio Marine's investment concentration in domestic equities exposes its capital base to a correction in Japanese equity prices, while the company's own strong share price performance has limited its prospective shareholder yield. We sold the Portfolio’s position in favor of other opportunities.
How did sector weightings in the equity portion of the Portfolio change during the reporting period?
During the reporting period, the most significant sector allocation changes to the equity portion of the Portfolio included decreased exposure to information technology and consumer discretionary and increased exposure to health care and communication
services. The most significant country allocation changes were increases in the United States and Canada, and reductions in Korea and Italy. The Portfolio’s sector and country allocations are a result of our bottom-up fundamental investment process and reflect the companies and securities that we confidently believe can collect and distribute sustainable, growing shareholder yield.
How was the equity portion of the Portfolio positioned at the end of the reporting period?
Relative to the MSCI World Index (Net), as of December 31, 2022, the most substantially overweight sector positions in the equity portion of the Portfolio were in utilities and consumer staples. As of the same date, the most substantially underweight sector positions relative to the Index were in consumer discretionary and information technology. The Portfolio's positioning in terms of sector allocations is an outcome of our bottom-up fundamental investment process and reflects where we are finding opportunities in which we are confident in our abilities to collect sustainable, growing shareholder yield.
What factors affected the relative performance of the fixed-income portion of the Portfolio during the reporting period?
During the reporting period, the large increase in interest rates drove the performance of the fixed-income portion of the Portfolio relative to the Bloomberg U.S. Aggregate Bond Index. Underweight exposure to agency mortgages contributed positively to relative returns. Conversely, overweight allocations to high-grade, high-yield corporates and emerging-market credit detracted from relative returns as spreads4 widened.
During the reporting period, how was the Portfolio’s performance materially affected by investments in derivatives?
The fixed-income portion of the Portfolio used U.S. Treasury futures to adjust duration5 and yield curve6 positioning. On a stand-alone, absolute basis, these positions detracted from overall returns.
What was the duration strategy of the fixed-income portion of the Portfolio during the reporting period?
The strategy was to keep duration neutral relative to the Bloomberg U.S. Aggregate Bond Index through the first half of the reporting period, and then add duration as yields rose. As of December 31, 2022, the Portfolio’s effective duration was 6.67 years, compared to 6.13 years for the Index.
| 4. | The terms “spread” and “yield spread” may refer to the difference in yield between a security or type of security and comparable U.S. Treasury issues. The terms may also refer to the difference in yield between two specific securities or types of securities at a given time. |
| 5. | Duration is a measure of the price sensitivity of a fixed-income investment to changes in interest rates. Duration is expressed as a number of years and is considered a more accurate sensitivity gauge than average maturity. |
| 6. | The yield curve is a line that plots the yields of various securities of similar quality—typically U.S. Treasury issues—across a range of maturities. The U.S. Treasury yield curve serves as a benchmark for other debt and is used in economic forecasting. |
| 10 | MainStay VP Income Builder Portfolio |
What specific factors, risks or market forces prompted significant decisions for the Portfolio during the reporting period?
During the reporting period, higher rates led to negative absolute performance across the market. Positive real yields and interest rates above the U.S. Federal Reserve’s “neutral” rate led us to extend the duration of the fixed-income portion of the Portfolio.
During the reporting period, which market segments were the strongest positive contributors to the absolute performance of the fixed-income portion of the Portfolio and which market segments were particularly weak?
During the reporting period, the Portfolio’s credit risk transfer expodure was a slight positive contributor to absolute performance. Conversely, both investment grade and high yield detracted from total returns. As mentioned above, spreads on these bonds widened, which weakened performance. Within corporate exposure, the banking, autos and midstream industries were among the most significant laggards.
Did the fixed-income portion of the Portfolio make any significant purchases or sales during the reporting period?
During the reporting period, the fixed-income portion of the Portfolio added a position in Starwood. During the same period, the Portfolio reduced its exposure to investment bank and financial services companies Bank of America and JP Morgan & Chase. In addition, the Portfolio sold its shares of Progress Residential Trust to provide liquidity to the Portfolio.
How did sector weightings change in the fixed-income portion of the Portfolio during the reporting period?
During the reporting period, the fixed-income portion of the Portfolio increased its exposure to agency mortgages and consumer asset-backed securities. During the same period, the fixed-income portion of the Portfolio trimmed its exposure to bank loans, emerging markets and investment-grade corporate bonds.
How was the fixed-income portion of the Portfolio positioned at the end of the reporting period?
As of December 31, 2022, the fixed-income portion of the Portfolio held overweight exposure relative to the Bloomberg U.S. Aggregate Bond Index in high-grade and high-yield corporate bonds, as well as securitized product. As of the same date, the fixed-income portion of the Portfolio held underweight exposure to U.S. Treasury securities and agency mortgages.
The opinions expressed are those of the portfolio managers as of the date of this report and are subject to change. There is no guarantee that any forecasts will come to pass. This material does not constitute investment advice and is not intended as an endorsement of any specific investment.
Not all MainStay VP Portfolios and/or share classes are available under all policies.
Portfolio of Investments December 31, 2022†
| | Principal
Amount | Value |
| Long-Term Bonds 43.5% |
| Asset-Backed Securities 4.3% |
| Automobile Asset-Backed Securities 1.3% |
| American Credit Acceptance Receivables Trust | | |
| Series 2021-3, Class D | | |
| 1.34%, due 11/15/27 (a) | $ 745,000 | $ 691,588 |
| Avis Budget Rental Car Funding AESOP LLC (a) | | |
| Series 2021-1A, Class A | | |
| 1.38%, due 8/20/27 | 1,000,000 | 870,656 |
| Series 2020-2A, Class A | | |
| 2.02%, due 2/20/27 | 360,000 | 326,243 |
| Carmax Auto Owner Trust | | |
| Series 2022-3, Class A3 | | |
| 3.97%, due 4/15/27 | 650,000 | 637,208 |
| Drive Auto Receivables Trust | | |
| Series 2021-2, Class D | | |
| 1.39%, due 3/15/29 | 800,000 | 737,147 |
| Enterprise Fleet Financing LLC | | |
| Series 2022-2, Class A3 | | |
| 4.79%, due 5/21/29 (a) | 385,000 | 377,567 |
| Flagship Credit Auto Trust | | |
| Series 2020-3, Class D | | |
| 2.50%, due 9/15/26 (a) | 280,000 | 256,841 |
| Ford Credit Auto Owner Trust | | |
| Series 2020-2, Class A | | |
| 1.06%, due 4/15/33 (a) | 645,000 | 577,540 |
| Ford Credit Floorplan Master Owner Trust | | |
| Series 2018-4, Class A | | |
| 4.06%, due 11/15/30 | 590,000 | 553,692 |
| Hertz Vehicle Financing III LP | | |
| Series 2021-2A, Class D | | |
| 4.34%, due 12/27/27 (a) | 1,295,000 | 1,078,077 |
| Hertz Vehicle Financing LLC | | |
| Series 2021-1A, Class B | | |
| 1.56%, due 12/26/25 (a) | 520,000 | 476,384 |
| JPMorgan Chase Bank NA | | |
| Series 2020-1, Class B | | |
| 0.991%, due 1/25/28 (a) | 111,114 | 109,420 |
| | | 6,692,363 |
| Home Equity Asset-Backed Securities 0.1% |
| Carrington Mortgage Loan Trust | | |
| Series 2007-HE1, Class A3 | | |
| 4.579% (1 Month LIBOR + 0.19%), due 6/25/37 (b) | 505,050 | 490,217 |
| | Principal
Amount | Value |
| |
| Home Equity Asset-Backed Securities (continued) |
| J.P. Morgan Mortgage Acquisition Trust | | |
| Series 2007-HE1, Class AF1 | | |
| 3.919% (1 Month LIBOR + 0.10%), due 3/25/47 (b) | $ 120,954 | $ 76,153 |
| Mastr Asset-Backed Securities Trust | | |
| Series 2006-HE4, Class A1 | | |
| 4.489% (1 Month LIBOR + 0.10%), due 11/25/36 (b) | 190,494 | 60,720 |
| | | 627,090 |
| Other Asset-Backed Securities 2.9% |
| American Airlines Pass-Through Trust | | |
| Series 2016-2, Class A | | |
| 3.65%, due 6/15/28 | 543,222 | 423,532 |
| Series 2019-1, Class B | | |
| 3.85%, due 2/15/28 | 426,254 | 358,218 |
| Series 2013-2, Class A | | |
| 4.95%, due 1/15/23 | 671,812 | 670,895 |
| AMSR Trust | | |
| Series 2020-SFR4, Class A | | |
| 1.355%, due 11/17/37 (a) | 1,110,000 | 993,288 |
| British Airways Pass-Through Trust | | |
| Series 2021-1, Class A | | |
| 2.90%, due 3/15/35 (United Kingdom) (a) | 826,658 | 672,922 |
| CF Hippolyta Issuer LLC (a) | | |
| Series 2021-1A, Class A1 | | |
| 1.53%, due 3/15/61 | 1,099,237 | 950,489 |
| Series 2020-1, Class A1 | | |
| 1.69%, due 7/15/60 | 504,108 | 449,962 |
| Series 2020-1, Class A2 | | |
| 1.99%, due 7/15/60 | 488,614 | 403,023 |
| Crown Castle Towers LLC | | |
| 4.241%, due 7/15/28 (a) | 990,000 | 899,203 |
| CVS Pass-Through Trust | | |
| 5.789%, due 1/10/26 (a) | 15,926 | 15,814 |
| DB Master Finance LLC (a) | | |
| Series 2021-1A, Class A23 | | |
| 2.791%, due 11/20/51 | 945,450 | 728,324 |
| Series 2019-1A, Class A23 | | |
| 4.352%, due 5/20/49 | 169,313 | 154,376 |
| FirstKey Homes Trust | | |
| Series 2020-SFR1, Class A | | |
| 1.339%, due 8/17/37 (a) | 1,040,254 | 929,609 |
| Home Partners of America Trust (a) | | |
| Series 2021-2, Class A | | |
| 1.901%, due 12/17/26 | 290,157 | 250,617 |
The notes to the financial statements are an integral part of, and should be read in conjunction with, the financial statements.
| 12 | MainStay VP Income Builder Portfolio |
| | Principal
Amount | Value |
| Asset-Backed Securities (continued) |
| Other Asset-Backed Securities (continued) |
Home Partners of America Trust (a)
(continued) | | |
| Series 2021-2, Class B | | |
| 2.302%, due 12/17/26 | $ 554,171 | $ 473,392 |
| MMAF Equipment Finance LLC | | |
| Series 2020-BA, Class A4 | | |
| 0.66%, due 11/15/27 (a) | 750,000 | 681,603 |
| Navient Private Education Refi Loan Trust (a) | | |
| Series 2021-BA, Class A | | |
| 0.94%, due 7/15/69 | 465,911 | 393,503 |
| Series 2020-EA, Class A | | |
| 1.69%, due 5/15/69 | 356,492 | 320,690 |
| Series 2021-EA, Class B | | |
| 2.03%, due 12/16/69 | 1,380,000 | 879,229 |
| New Economy Assets Phase 1 Sponsor LLC (a) | | |
| Series 2021-1, Class A1 | | |
| 1.91%, due 10/20/61 | 665,000 | 561,905 |
| Series 2021-1, Class B1 | | |
| 2.41%, due 10/20/61 | 645,000 | 529,877 |
| PFS Financing Corp. | | |
| Series 2022-D, Class A | | |
| 4.27%, due 8/15/27 (a) | 525,000 | 511,974 |
| Progress Residential (a) | | |
| Series 2021-SFR1, Class A | | |
| 1.052%, due 4/17/38 | 763,511 | 657,946 |
| Series 2021-SFR4, Class B | | |
| 1.808%, due 5/17/38 | 670,000 | 575,305 |
| Progress Residential Trust | | |
| Series 2020-SFR3, Class A | | |
| 1.294%, due 10/17/27 (a) | 663,096 | 587,252 |
| Sierra Timeshare Receivables Funding LLC | | |
| Series 2020-2A, Class A | | |
| 1.33%, due 7/20/37 (a) | 186,838 | 175,412 |
| Taco Bell Funding LLC | | |
| Series 2021-1A, Class A23 | | |
| 2.542%, due 8/25/51 (a) | 757,350 | 575,656 |
| U.S. Airways Pass-Through Trust | | |
| Series 2012-1, Class A | | |
| 5.90%, due 10/1/24 | 427,598 | 413,568 |
| | Principal
Amount | Value |
| |
| Other Asset-Backed Securities (continued) |
| United Airlines Pass-Through Trust | | |
| Series 2020-1, Class A | | |
| 5.875%, due 10/15/27 | $ 671,826 | $ 662,384 |
| | | 15,899,968 |
Total Asset-Backed Securities
(Cost $26,442,407) | | 23,219,421 |
| Corporate Bonds 19.5% |
| Aerospace & Defense 0.1% |
| Howmet Aerospace, Inc. | | |
| 3.00%, due 1/15/29 | 620,000 | 527,000 |
| Agriculture 0.2% |
| BAT Capital Corp. | | |
| 3.734%, due 9/25/40 (United Kingdom) | 905,000 | 614,515 |
| BAT International Finance plc | | |
| 4.448%, due 3/16/28 (United Kingdom) | 490,000 | 453,819 |
| | | 1,068,334 |
| Airlines 0.5% |
| American Airlines, Inc. (a) | | |
| 5.50%, due 4/20/26 | 600,000 | 576,988 |
| 5.75%, due 4/20/29 | 360,000 | 329,024 |
| Delta Air Lines, Inc. (a) | | |
| 4.50%, due 10/20/25 | 465,000 | 453,646 |
| 4.75%, due 10/20/28 | 900,000 | 845,976 |
| Mileage Plus Holdings LLC | | |
| 6.50%, due 6/20/27 (a) | 715,546 | 711,397 |
| | | 2,917,031 |
| Auto Manufacturers 0.9% |
| Ford Motor Credit Co. LLC | | |
| 2.30%, due 2/10/25 | 230,000 | 209,962 |
| 2.70%, due 8/10/26 | 595,000 | 516,698 |
| 4.125%, due 8/17/27 | 700,000 | 626,500 |
| General Motors Co. | | |
| 5.60%, due 10/15/32 | 225,000 | 209,024 |
| General Motors Financial Co., Inc. | | |
| 2.35%, due 1/8/31 | 344,000 | 259,381 |
| 2.70%, due 6/10/31 | 850,000 | 651,249 |
| 4.30%, due 4/6/29 | 470,000 | 420,982 |
| Nissan Motor Acceptance Co. LLC (a) | | |
| 1.125%, due 9/16/24 | 810,000 | 738,076 |
| 1.85%, due 9/16/26 | 1,350,000 | 1,127,032 |
The notes to the financial statements are an integral part of, and should be read in conjunction with, the financial statements.
13
Portfolio of Investments December 31, 2022† (continued)
| | Principal
Amount | Value |
| Corporate Bonds (continued) |
| Auto Manufacturers (continued) |
| Volkswagen Group of America Finance LLC | | |
| 4.60%, due 6/8/29 (Germany) (a) | $ 355,000 | $ 335,346 |
| | | 5,094,250 |
| Banks 7.4% |
| Banco Santander SA | | |
| 5.294%, due 8/18/27 (Spain) | 600,000 | 585,814 |
| Bank of America Corp. (c) | | |
| 2.087%, due 6/14/29 | 715,000 | 601,668 |
| 2.496%, due 2/13/31 | 650,000 | 528,315 |
| 2.572%, due 10/20/32 | 510,000 | 399,433 |
| 2.687%, due 4/22/32 | 465,000 | 372,179 |
| 3.384%, due 4/2/26 | 465,000 | 444,093 |
| 3.705%, due 4/24/28 | 555,000 | 513,593 |
| Series MM | | |
| 4.30%, due 1/28/25 (d) | 916,000 | 792,374 |
| Series DD | | |
| 6.30%, due 3/10/26 (d) | 735,000 | 729,542 |
| Barclays plc (United Kingdom) (b)(d) | | |
| 4.375% (5 Year Treasury Constant Maturity Rate + 3.41%), due 3/15/28 | 835,000 | 636,687 |
| 8.00% (5 Year Treasury Constant Maturity Rate + 5.431%), due 3/15/29 | 680,000 | 635,800 |
| BNP Paribas SA (France) (a) | | |
| 3.052%, due 1/13/31 (c) | 620,000 | 508,117 |
| 4.625% (5 Year Treasury Constant Maturity Rate + 3.196%), due 1/12/27 (b)(d) | 625,000 | 514,056 |
| 4.625% (5 Year Treasury Constant Maturity Rate + 3.34%), due 2/25/31 (b)(d) | 885,000 | 683,751 |
| 7.75% (5 Year Treasury Constant Maturity Rate + 4.899%), due 8/16/29 (b)(d) | 230,000 | 227,125 |
| BPCE SA | | |
| 2.045%, due 10/19/27 (France) (a)(c) | 530,000 | 456,830 |
| Citigroup, Inc. | | |
| 2.52%, due 11/3/32 (c) | 500,000 | 388,834 |
| 3.668%, due 7/24/28 (c) | 430,000 | 394,907 |
| 3.98%, due 3/20/30 (c) | 565,000 | 509,565 |
| | Principal
Amount | Value |
| |
| Banks (continued) |
| Citigroup, Inc. (continued) | | |
| Series Y | | |
| 4.15% (5 Year Treasury Constant Maturity Rate + 3.00%), due 11/15/26 (b)(d) | $ 840,000 | $ 685,800 |
| 5.30%, due 5/6/44 | 216,000 | 194,514 |
| 6.625%, due 6/15/32 | 190,000 | 200,081 |
| Citizens Bank NA | | |
| 6.064%, due 10/24/25 (c) | 475,000 | 480,348 |
| Citizens Financial Group, Inc. | | |
| 2.638%, due 9/30/32 | 1,035,000 | 768,231 |
| Credit Agricole SA | | |
| 4.75% (5 Year Treasury Constant Maturity Rate + 3.237%), due 3/23/29 (France) (a)(b)(d) | 1,000,000 | 801,418 |
| Credit Suisse Group AG (Switzerland) (a)(c) | | |
| 2.593%, due 9/11/25 | 635,000 | 561,378 |
| 3.091%, due 5/14/32 | 785,000 | 542,393 |
| 6.442%, due 8/11/28 | 495,000 | 450,795 |
| Deutsche Bank AG (Germany) | | |
| Series E | | |
| 0.962%, due 11/8/23 | 665,000 | 639,816 |
| 3.035%, due 5/28/32 (c) | 255,000 | 193,273 |
| 5.371%, due 9/9/27 | 410,000 | 410,914 |
| 5.54% (SOFR + 1.219%), due 11/16/27 (b) | 820,000 | 733,926 |
| First Horizon Bank | | |
| 5.75%, due 5/1/30 | 815,000 | 790,063 |
| First Horizon Corp. | | |
| 4.00%, due 5/26/25 | 775,000 | 753,009 |
| Freedom Mortgage Corp. | | |
| 7.625%, due 5/1/26 (a) | 355,000 | 296,115 |
| Goldman Sachs Group, Inc. (The) | | |
| 1.431%, due 3/9/27 (c) | 535,000 | 469,146 |
| 1.948%, due 10/21/27 (c) | 610,000 | 533,375 |
| 1.992%, due 1/27/32 (c) | 590,000 | 449,472 |
| 2.615%, due 4/22/32 (c) | 425,000 | 338,934 |
| 3.102%, due 2/24/33 (c) | 385,000 | 312,612 |
| 3.625%, due 1/22/23 | 1,330,000 | 1,328,883 |
| 5.776% (3 Month LIBOR + 1.17%), due 5/15/26 (b) | 815,000 | 809,263 |
| 6.75%, due 10/1/37 | 159,000 | 169,657 |
| HSBC Holdings plc | | |
| 3.973%, due 5/22/30 (United Kingdom) (c) | 970,000 | 849,026 |
| Intesa Sanpaolo SpA | | |
| 7.00%, due 11/21/25 (Italy) (a) | 200,000 | 203,974 |
The notes to the financial statements are an integral part of, and should be read in conjunction with, the financial statements.
| 14 | MainStay VP Income Builder Portfolio |
| | Principal
Amount | Value |
| Corporate Bonds (continued) |
| Banks (continued) |
| JPMorgan Chase & Co. | | |
| 2.182%, due 6/1/28 (c) | $ 835,000 | $ 730,110 |
| 4.323%, due 4/26/28 (c) | 905,000 | 864,263 |
| Series HH | | |
| 4.60%, due 2/1/25 (c)(d) | 659,000 | 580,744 |
| 5.497% (SOFR + 1.18%), due 2/24/28 (b) | 845,000 | 819,224 |
| Lloyds Banking Group plc (United Kingdom) | | |
| 4.582%, due 12/10/25 | 508,000 | 491,895 |
| 4.65%, due 3/24/26 | 1,075,000 | 1,029,345 |
| 4.976% (1 Year Treasury Constant Maturity Rate + 2.30%), due 8/11/33 (b) | 365,000 | 335,139 |
| Macquarie Group Ltd. | | |
| 2.871%, due 1/14/33 (Australia) (a)(c) | 820,000 | 629,090 |
| Mizuho Financial Group, Inc. | | |
| 3.261% (1 Year Treasury Constant Maturity Rate + 1.25%), due 5/22/30 (Japan) (b) | 345,000 | 298,471 |
| Morgan Stanley | | |
| 2.484%, due 9/16/36 (c) | 885,000 | 641,741 |
| 2.511%, due 10/20/32 (c) | 645,000 | 504,752 |
| 5.00%, due 11/24/25 | 780,000 | 777,649 |
| 6.25%, due 8/9/26 | 881,000 | 920,005 |
| NatWest Group plc | | |
| 3.073% (1 Year Treasury Constant Maturity Rate + 2.55%), due 5/22/28 (United Kingdom) (b) | 1,580,000 | 1,411,966 |
| Societe Generale SA (France) (a)(b) | | |
| 3.337% (1 Year Treasury Constant Maturity Rate + 1.60%), due 1/21/33 | 680,000 | 535,479 |
| 4.75% (5 Year Treasury Constant Maturity Rate + 3.931%), due 5/26/26 (d) | 395,000 | 334,801 |
| 5.375% (5 Year Treasury Constant Maturity Rate + 4.514%), due 11/18/30 (d) | 1,115,000 | 903,303 |
| Standard Chartered plc (United Kingdom) (a)(b) | | |
| 1.822% (1 Year Treasury Constant Maturity Rate + 0.95%), due 11/23/25 | 1,060,000 | 968,144 |
| | Principal
Amount | Value |
| |
| Banks (continued) |
| Standard Chartered plc (United Kingdom) (a)(b) (continued) | | |
| 4.75% (5 Year Treasury Constant Maturity Rate + 3.805%), due 1/14/31 (d) | $ 525,000 | $ 402,011 |
| SVB Financial Group | | |
| Series C | | |
| 4.00% (5 Year Treasury Constant Maturity Rate + 3.202%), due 5/15/26 (b)(d) | 770,000 | 508,215 |
| UBS Group AG (Switzerland) (a)(b) | | |
| 4.375% (5 Year Treasury Constant Maturity Rate + 3.313%), due 2/10/31 (d) | 1,005,000 | 763,557 |
| 4.751% (1 Year Treasury Constant Maturity Rate + 1.75%), due 5/12/28 | 410,000 | 392,360 |
| Wachovia Corp. | | |
| 5.50%, due 8/1/35 | 700,000 | 679,518 |
| Wells Fargo & Co. (c) | | |
| 2.879%, due 10/30/30 | 385,000 | 327,021 |
| 4.897%, due 7/25/33 | 390,000 | 370,318 |
| Westpac Banking Corp. | | |
| 3.02% (5 Year Treasury Constant Maturity Rate + 1.53%), due 11/18/36 (Australia) (b) | 533,000 | 396,268 |
| | | 40,504,488 |
| Beverages 0.1% |
| Anheuser-Busch Cos. LLC | | |
| 4.70%, due 2/1/36 (Belgium) | 475,000 | 448,610 |
| Chemicals 0.2% |
| Braskem Netherlands Finance BV | | |
| 4.50%, due 1/10/28 (Brazil) (a) | 745,000 | 668,049 |
| Huntsman International LLC | | |
| 4.50%, due 5/1/29 | 731,000 | 656,497 |
| | | 1,324,546 |
| Commercial Services 0.3% |
| Ashtead Capital, Inc. | | |
| 4.00%, due 5/1/28 (United Kingdom) (a) | 380,000 | 346,455 |
| California Institute of Technology | | |
| 3.65%, due 9/1/19 | 385,000 | 245,222 |
| Sodexo, Inc. | | |
| 2.718%, due 4/16/31 (France) (a) | 1,010,000 | 805,877 |
| | | 1,397,554 |
The notes to the financial statements are an integral part of, and should be read in conjunction with, the financial statements.
15
Portfolio of Investments December 31, 2022† (continued)
| | Principal
Amount | Value |
| Corporate Bonds (continued) |
| Computers 0.6% |
| Dell International LLC | | |
| 3.375%, due 12/15/41 (a) | $ 885,000 | $ 592,708 |
| 4.90%, due 10/1/26 | 680,000 | 669,323 |
| 5.30%, due 10/1/29 | 318,000 | 311,005 |
| 8.10%, due 7/15/36 | 527,000 | 590,566 |
| NCR Corp. | | |
| 5.00%, due 10/1/28 (a) | 991,000 | 844,861 |
| | | 3,008,463 |
| Diversified Financial Services 1.6% |
| AerCap Ireland Capital DAC | | |
| 2.45%, due 10/29/26 (Ireland) | 665,000 | 581,504 |
| Air Lease Corp. | | |
| 2.30%, due 2/1/25 | 820,000 | 763,444 |
| 2.75%, due 1/15/23 | 500,000 | 499,411 |
| 4.25%, due 9/15/24 | 420,000 | 410,927 |
| Aircastle Ltd. | | |
| 5.25% (5 Year Treasury Constant Maturity Rate + 4.41%), due 6/15/26 (a)(b)(d) | 745,000 | 573,650 |
| Ally Financial, Inc. | | |
| 3.875%, due 5/21/24 | 310,000 | 301,754 |
| Series C | | |
| 4.70% (7 Year Treasury Constant Maturity Rate + 3.481%), due 5/15/28 (b)(d) | 555,000 | 347,569 |
| 8.00%, due 11/1/31 | 640,000 | 660,702 |
| Aviation Capital Group LLC | | |
| 1.95%, due 1/30/26 (a) | 520,000 | 452,701 |
| Avolon Holdings Funding Ltd. (Ireland) (a) | | |
| 2.125%, due 2/21/26 | 645,000 | 555,136 |
| 2.875%, due 2/15/25 | 1,040,000 | 960,716 |
| Banco BTG Pactual SA (Brazil) (a) | | |
| 2.75%, due 1/11/26 | 1,130,000 | 1,026,887 |
| 4.50%, due 1/10/25 | 350,000 | 337,312 |
| Capital One Financial Corp. | | |
| 5.247%, due 7/26/30 (c) | 390,000 | 371,415 |
| Nomura Holdings, Inc. | | |
| 5.099%, due 7/3/25 (Japan) | 770,000 | 761,525 |
| OneMain Finance Corp. | | |
| 3.50%, due 1/15/27 | 375,000 | 310,489 |
| | | 8,915,142 |
| Electric 1.4% |
| AEP Texas, Inc. | | |
| 4.70%, due 5/15/32 | 475,000 | 454,976 |
| | Principal
Amount | Value |
| |
| Electric (continued) |
| Alabama Power Co. | | |
| 3.00%, due 3/15/52 | $ 335,000 | $ 221,150 |
| Arizona Public Service Co. | | |
| 2.20%, due 12/15/31 | 750,000 | 572,210 |
| Calpine Corp. | | |
| 5.125%, due 3/15/28 (a) | 535,000 | 477,377 |
| Duke Energy Ohio, Inc. | | |
| 4.30%, due 2/1/49 | 565,000 | 460,578 |
| Duquesne Light Holdings, Inc. | | |
| 3.616%, due 8/1/27 (a) | 865,000 | 777,931 |
| Edison International | | |
| Series B | | |
| 5.00% (5 Year Treasury Constant Maturity Rate + 3.901%), due 12/15/26 (b)(d) | 905,000 | 756,534 |
| Entergy Louisiana LLC | | |
| 4.00%, due 3/15/33 | 790,000 | 712,956 |
| Jersey Central Power & Light Co. | | |
| 2.75%, due 3/1/32 (a) | 700,000 | 565,275 |
| National Rural Utilities Cooperative Finance Corp. | | |
| 5.80%, due 1/15/33 | 460,000 | 480,099 |
| Nevada Power Co. | | |
| Series GG | | |
| 5.90%, due 5/1/53 | 230,000 | 245,128 |
| NSTAR Electric Co. | | |
| 4.95%, due 9/15/52 | 250,000 | 241,509 |
| Ohio Power Co. | | |
| Series R | | |
| 2.90%, due 10/1/51 | 420,000 | 273,260 |
| Southern California Edison Co. | | |
| Series E | | |
| 3.70%, due 8/1/25 | 330,000 | 319,269 |
| 4.00%, due 4/1/47 | 520,000 | 406,367 |
| Virginia Electric and Power Co. | | |
| 2.95%, due 11/15/51 | 435,000 | 285,846 |
| WEC Energy Group, Inc. | | |
| 6.719% (3 Month LIBOR + 2.113%), due 5/15/67 (b) | 480,000 | 401,539 |
| | | 7,652,004 |
| Entertainment 0.1% |
| Warnermedia Holdings, Inc. | | |
| 4.279%, due 3/15/32 (a) | 565,000 | 465,427 |
| Environmental Control 0.1% |
| Stericycle, Inc. | | |
| 3.875%, due 1/15/29 (a) | 120,000 | 104,700 |
The notes to the financial statements are an integral part of, and should be read in conjunction with, the financial statements.
| 16 | MainStay VP Income Builder Portfolio |
| | Principal
Amount | Value |
| Corporate Bonds (continued) |
| Environmental Control (continued) |
| Waste Connections, Inc. | | |
| 2.20%, due 1/15/32 | $ 235,000 | $ 186,427 |
| | | 291,127 |
| Food 0.2% |
| JBS USA LUX SA | | |
| 5.75%, due 4/1/33 (a) | 810,000 | 772,562 |
| Smithfield Foods, Inc. | | |
| 4.25%, due 2/1/27 (a) | 500,000 | 460,374 |
| | | 1,232,936 |
| Gas 0.3% |
| National Fuel Gas Co. | | |
| 2.95%, due 3/1/31 | 450,000 | 352,643 |
| Piedmont Natural Gas Co., Inc. | | |
| 5.05%, due 5/15/52 | 425,000 | 383,462 |
| Southern California Gas Co. | | |
| Series VV | | |
| 4.30%, due 1/15/49 | 325,000 | 267,448 |
| Southern Co. Gas Capital Corp. | | |
| Series 21A | | |
| 3.15%, due 9/30/51 | 830,000 | 537,248 |
| | | 1,540,801 |
| Healthcare-Products 0.1% |
| Abbott Laboratories | | |
| 3.40%, due 11/30/23 | 535,000 | 529,332 |
| Home Builders 0.1% |
| Thor Industries, Inc. | | |
| 4.00%, due 10/15/29 (a) | 375,000 | 294,444 |
| Insurance 0.9% |
| Athene Global Funding | | |
| 2.50%, due 3/24/28 (a) | 465,000 | 387,471 |
| Equitable Holdings, Inc. | | |
| 5.00%, due 4/20/48 | 830,000 | 726,732 |
| Peachtree Corners Funding Trust | | |
| 3.976%, due 2/15/25 (a) | 425,000 | 410,244 |
| Protective Life Corp. | | |
| 8.45%, due 10/15/39 | 725,000 | 852,581 |
| Reliance Standard Life Global Funding II | | |
| 2.50%, due 10/30/24 (a) | 950,000 | 898,187 |
| Voya Financial, Inc. | | |
| 3.65%, due 6/15/26 | 310,000 | 292,304 |
| | Principal
Amount | Value |
| |
| Insurance (continued) |
| Willis North America, Inc. | | |
| 2.95%, due 9/15/29 | $ 1,395,000 | $ 1,172,644 |
| 3.875%, due 9/15/49 | 185,000 | 131,252 |
| | | 4,871,415 |
| Internet 0.2% |
| Expedia Group, Inc. | | |
| 3.25%, due 2/15/30 | 795,000 | 674,395 |
| 3.80%, due 2/15/28 | 82,000 | 75,276 |
| 5.00%, due 2/15/26 | 22,000 | 21,709 |
| 6.25%, due 5/1/25 (a) | 88,000 | 88,746 |
| | | 860,126 |
| Lodging 0.2% |
| Las Vegas Sands Corp. | | |
| 3.20%, due 8/8/24 | 555,000 | 524,581 |
| Sands China Ltd. | | |
| 5.625%, due 8/8/25 (Macao) (e) | 460,000 | 439,775 |
| | | 964,356 |
| Media 0.2% |
| DISH DBS Corp. | | |
| 5.75%, due 12/1/28 (a) | 495,000 | 395,072 |
| Grupo Televisa SAB | | |
| 5.25%, due 5/24/49 (Mexico) | 355,000 | 313,439 |
| Time Warner Cable Enterprises LLC | | |
| 8.375%, due 3/15/23 | 355,000 | 357,217 |
| | | 1,065,728 |
| Mining 0.2% |
| Glencore Funding LLC | | |
| 1.625%, due 9/1/25 (Australia) (a) | 1,205,000 | 1,090,633 |
| Miscellaneous—Manufacturing 0.1% |
| Textron Financial Corp. | | |
| 6.341% (3 Month LIBOR + 1.735%), due 2/15/42 (a)(b) | 1,045,000 | 747,175 |
| Oil & Gas 0.1% |
| Gazprom PJSC Via Gaz Capital SA | | |
| 7.288%, due 8/16/37 (Russia) (a)(f) | 640,000 | 480,000 |
| Packaging & Containers 0.1% |
| Berry Global, Inc. | | |
| 4.875%, due 7/15/26 (a) | 84,000 | 80,871 |
| Owens-Brockway Glass Container, Inc. | | |
| 6.625%, due 5/13/27 (a) | 360,000 | 349,275 |
| | | 430,146 |
The notes to the financial statements are an integral part of, and should be read in conjunction with, the financial statements.
17
Portfolio of Investments December 31, 2022† (continued)
| | Principal
Amount | Value |
| Corporate Bonds (continued) |
| Pharmaceuticals 0.4% |
| Becton Dickinson and Co. | | |
| 4.669%, due 6/6/47 | $ 200,000 | $ 175,992 |
| CVS Health Corp. | | |
| 4.78%, due 3/25/38 | 400,000 | 364,374 |
| Teva Pharmaceutical Finance Netherlands III BV (Israel) | | |
| 3.15%, due 10/1/26 | 1,285,000 | 1,123,733 |
| 4.75%, due 5/9/27 | 545,000 | 492,625 |
| | | 2,156,724 |
| Pipelines 1.0% |
| Cheniere Corpus Christi Holdings LLC | | |
| 2.742%, due 12/31/39 | 670,000 | 518,087 |
| DT Midstream, Inc. | | |
| 4.30%, due 4/15/32 (a) | 570,000 | 500,771 |
| Energy Transfer LP | | |
| 4.95%, due 6/15/28 | 415,000 | 401,299 |
| 5.35%, due 5/15/45 | 415,000 | 351,935 |
| Enterprise Products Operating LLC | | |
| 3.95%, due 1/31/60 | 595,000 | 429,403 |
| 4.20%, due 1/31/50 | 160,000 | 125,803 |
| Flex Intermediate Holdco LLC | | |
| 3.363%, due 6/30/31 (a) | 865,000 | 675,063 |
| Hess Midstream Operations LP (a) | | |
| 4.25%, due 2/15/30 | 135,000 | 115,414 |
| 5.50%, due 10/15/30 | 485,000 | 443,705 |
| Holly Energy Partners LP | | |
| 6.375%, due 4/15/27 (a) | 145,000 | 142,461 |
| MPLX LP | | |
| 2.65%, due 8/15/30 | 730,000 | 591,590 |
| Targa Resources Corp. | | |
| 4.20%, due 2/1/33 | 335,000 | 288,222 |
| Transcontinental Gas Pipe Line Co. LLC | | |
| 4.60%, due 3/15/48 | 840,000 | 698,139 |
| Western Midstream Operating LP | | |
| 5.50%, due 2/1/50 (e) | 350,000 | 288,330 |
| | | 5,570,222 |
| Real Estate 0.1% |
| Realogy Group LLC | | |
| 5.75%, due 1/15/29 (a)(g) | 560,000 | 423,578 |
| Real Estate Investment Trusts 0.8% |
| American Tower Corp. | | |
| 3.375%, due 10/15/26 | 705,000 | 659,147 |
| 3.60%, due 1/15/28 | 375,000 | 344,655 |
| | Principal
Amount | Value |
| |
| Real Estate Investment Trusts (continued) |
| Digital Realty Trust LP | | |
| 3.70%, due 8/15/27 | $ 660,000 | $ 612,448 |
| GLP Capital LP | | |
| 3.35%, due 9/1/24 | 505,000 | 483,962 |
| Invitation Homes Operating Partnership LP | | |
| 2.00%, due 8/15/31 | 680,000 | 502,518 |
| Iron Mountain, Inc. | | |
| 5.25%, due 7/15/30 (a) | 545,000 | 473,605 |
| Office Properties Income Trust | | |
| 2.40%, due 2/1/27 | 565,000 | 412,795 |
| Starwood Property Trust, Inc. (a) | | |
| 3.75%, due 12/31/24 | 710,000 | 666,701 |
| 4.375%, due 1/15/27 | 415,000 | 363,156 |
| | | 4,518,987 |
| Retail 0.4% |
| AutoNation, Inc. | | |
| 4.75%, due 6/1/30 | 700,000 | 624,536 |
| Nordstrom, Inc. | | |
| 4.00%, due 3/15/27 | 102,000 | 84,925 |
| 4.25%, due 8/1/31 | 530,000 | 379,003 |
| QVC, Inc. | | |
| 4.375%, due 9/1/28 | 925,000 | 552,688 |
| Victoria's Secret & Co. | | |
| 4.625%, due 7/15/29 (a) | 472,000 | 370,567 |
| | | 2,011,719 |
| Software 0.0% ‡ |
| Fidelity National Information Services, Inc. | | |
| 5.10%, due 7/15/32 | 280,000 | 269,703 |
| Telecommunications 0.6% |
| Altice France SA | | |
| 5.125%, due 7/15/29 (France) (a) | 865,000 | 648,528 |
| AT&T, Inc. | | |
| 3.50%, due 9/15/53 | 795,000 | 536,574 |
| 3.65%, due 9/15/59 | 370,000 | 247,653 |
| Sprint Spectrum Co. LLC | | |
| 4.738%, due 3/20/25 (a) | 869,065 | 858,819 |
| T-Mobile US, Inc. | | |
| 2.625%, due 2/15/29 | 300,000 | 253,959 |
The notes to the financial statements are an integral part of, and should be read in conjunction with, the financial statements.
| 18 | MainStay VP Income Builder Portfolio |
| | Principal
Amount | Value |
| Corporate Bonds (continued) |
| Telecommunications (continued) |
| Verizon Communications, Inc. | | |
| 5.706% (3 Month LIBOR + 1.10%), due 5/15/25 (b) | $ 660,000 | $ 665,234 |
| | | 3,210,767 |
Total Corporate Bonds
(Cost $122,789,393) | | 105,882,768 |
| Foreign Government Bonds 0.6% |
| Brazil 0.0% ‡ |
| Brazil Government Bond | | |
| 3.75%, due 9/12/31 (g) | 175,000 | 146,960 |
| Chile 0.2% |
| Chile Government Bond | | |
| 2.55%, due 7/27/33 | 495,000 | 387,396 |
| Empresa Nacional del Petroleo | | |
| 3.45%, due 9/16/31 (a) | 980,000 | 823,922 |
| | | 1,211,318 |
| Colombia 0.1% |
| Colombia Government Bond | | |
| 3.25%, due 4/22/32 | 725,000 | 527,218 |
| 4.50%, due 1/28/26 | 235,000 | 220,876 |
| | | 748,094 |
| Mexico 0.3% |
| Comision Federal de Electricidad | | |
| 3.875%, due 7/26/33 (a) | 1,170,000 | 884,949 |
| Mexico Government Bond | | |
| 3.75%, due 4/19/71 | 800,000 | 496,782 |
| | | 1,381,731 |
Total Foreign Government Bonds
(Cost $4,563,207) | | 3,488,103 |
| Loan Assignments 0.1% |
| Diversified/Conglomerate Service 0.1% |
| TruGreen LP (b) | | |
| First Lien Second Refinancing Term Loan | | |
| 8.384% (1 Month LIBOR + 4.00%), due 11/2/27 | 315,337 | 277,496 |
| | Principal
Amount | Value |
| |
| Diversified/Conglomerate Service (continued) |
| TruGreen LP (b) (continued) | | |
| Second Lien Initial Term Loan | | |
| 12.915% (3 Month LIBOR + 8.50%), due 11/2/28 | $ 250,000 | $ 182,500 |
| | | 459,996 |
Total Loan Assignments
(Cost $559,162) | | 459,996 |
| Mortgage-Backed Securities 11.5% |
| Agency (Collateralized Mortgage Obligations) 4.5% |
| FHLMC | | |
| REMIC, Series 5021, Class SA | | |
| (zero coupon) (SOFR 30A + 3.55%), due 10/25/50 (b)(h) | 1,316,793 | 43,969 |
| REMIC, Series 5187, Class SA | | |
| (zero coupon) (SOFR 30A + 1.80%), due 1/25/52 (b)(h) | 1,013,219 | 3,206 |
| REMIC, Series 5200, Class SA | | |
| (zero coupon) (SOFR 30A + 3.50%), due 2/25/52 (b)(h) | 1,119,176 | 29,226 |
| REMIC, Series 4988, Class BA | | |
| 1.50%, due 6/25/50 | 208,554 | 159,928 |
| REMIC, Series 5038, Class KA | | |
| 1.50%, due 11/25/50 | 966,788 | 733,951 |
| REMIC, Series 4994, Class TS | | |
| 1.711% (1 Month LIBOR + 6.10%), due 7/25/50 (b)(h) | 914,052 | 100,788 |
| REMIC, Series 5070, Class PI | | |
| 3.00%, due 8/25/50 (h) | 727,162 | 117,699 |
| REMIC, Series 5011, Class MI | | |
| 3.00%, due 9/25/50 (h) | 730,895 | 118,029 |
| REMIC, Series 5023, Class LI | | |
| 3.00%, due 10/25/50 (h) | 628,722 | 100,139 |
| REMIC, Series 5094, Class IP | | |
| 3.00%, due 4/25/51 (h) | 881,453 | 136,492 |
| REMIC, Series 5160 | | |
| 3.00%, due 10/25/51 (h) | 737,602 | 87,588 |
| REMIC, Series 5040 | | |
| 3.50%, due 11/25/50 (h) | 535,270 | 89,702 |
| REMIC, Series 5200, Class FA | | |
| 4.00% (SOFR 30A + 0.50%), due 2/25/52 (b) | 611,315 | 552,496 |
| FHLMC, Strips | | |
| REMIC, Series 311 | | |
| (zero coupon), due 8/15/43 | 309,950 | 231,113 |
The notes to the financial statements are an integral part of, and should be read in conjunction with, the financial statements.
19
Portfolio of Investments December 31, 2022† (continued)
| | Principal
Amount | Value |
| Mortgage-Backed Securities (continued) |
| Agency (Collateralized Mortgage Obligations) (continued) |
| FHLMC, Strips (continued) | | |
| REMIC, Series 311, Class S1 | | |
| 1.632% (1 Month LIBOR + 5.95%), due 8/15/43 (b)(h) | $ 861,585 | $ 84,395 |
| FNMA | | |
| REMIC, Series 2022-5, Class SN | | |
| (zero coupon) (SOFR 30A + 1.80%), due 2/25/52 (b)(h) | 565,395 | 1,681 |
| REMIC, Series 2022-3, Class YS | | |
| (zero coupon) (SOFR 30A + 2.55%), due 2/25/52 (b)(h) | 4,165,043 | 49,385 |
| REMIC, Series 2020-47, Class BD | | |
| 1.50%, due 7/25/50 | 184,186 | 141,266 |
| REMIC, Series 2021-40, Class SI | | |
| 1.561% (1 Month LIBOR + 5.95%), due 9/25/47 (b)(h) | 1,098,811 | 104,623 |
| REMIC, Series 2016-57, Class SN | | |
| 1.661% (1 Month LIBOR + 6.05%), due 6/25/46 (b)(h) | 901,910 | 92,138 |
| REMIC, Series 2022-10, Class SA | | |
| 1.822% (SOFR 30A + 5.75%), due 2/25/52 (b)(h) | 680,229 | 86,621 |
| REMIC, Series 2021-3, Class TI | | |
| 2.50%, due 2/25/51 (h) | 955,499 | 155,084 |
| REMIC, Series 2021-12, Class JI | | |
| 2.50%, due 3/25/51 (h) | 581,507 | 88,107 |
| REMIC, Series 2021-10, Class LI | | |
| 2.50%, due 3/25/51 (h) | 397,769 | 60,191 |
| REMIC, Series 2021-34, Class MI | | |
| 2.50%, due 3/25/51 (h) | 1,719,144 | 219,998 |
| REMIC, Series 2021-54, Class HI | | |
| 2.50%, due 6/25/51 (h) | 276,443 | 34,543 |
| REMIC, Series 2013-77, Class CY | | |
| 3.00%, due 7/25/43 | 535,977 | 480,840 |
| REMIC, Series 2021-53, Class GI | | |
| 3.00%, due 7/25/48 (h) | 2,189,317 | 347,455 |
| REMIC, Series 2019-13, Class PE | | |
| 3.00%, due 3/25/49 | 316,901 | 283,798 |
| REMIC, Series 2021-85, Class BI | | |
| 3.00%, due 12/25/51 (h) | 1,590,841 | 247,056 |
| REMIC, Series 2021-12, Class GC | | |
| 3.50%, due 7/25/50 | 704,076 | 648,197 |
| REMIC, Series 2021-8, Class ID | | |
| 3.50%, due 3/25/51 (h) | 1,048,269 | 210,583 |
| REMIC, Series 2020-10, Class DA | | |
| 3.50%, due 3/25/60 | 624,441 | 575,655 |
| | Principal
Amount | Value |
| |
| Agency (Collateralized Mortgage Obligations) (continued) |
| FNMA, Strips | | |
| REMIC, Series 427, Class C77 | | |
| 2.50%, due 9/25/51 (h) | $ 2,169,486 | $ 326,557 |
| GNMA | | |
| REMIC, Series 2019-145, Class LS | | |
| (zero coupon) (1 Month LIBOR + 2.83%), due 11/20/49 (b)(h) | 729,553 | 8,191 |
| REMIC, Series 2019-136, Class YS | | |
| (zero coupon) (1 Month LIBOR + 2.83%), due 11/20/49 (b)(h) | 1,239,869 | 15,644 |
| REMIC, Series 2020-5, Class AS | | |
| (zero coupon) (1 Month LIBOR + 2.82%), due 1/20/50 (b)(h) | 652,099 | 4,389 |
| REMIC, Series 2020-1, Class YS | | |
| (zero coupon) (1 Month LIBOR + 2.83%), due 1/20/50 (b)(h) | 1,510,326 | 15,421 |
| REMIC, Series 2021-77, Class SN | | |
| (zero coupon) (1 Month LIBOR + 2.60%), due 5/20/51 (b)(h) | 3,100,646 | 21,263 |
| REMIC, Series 2021-97, Class SA | | |
| (zero coupon) (SOFR 30A + 2.60%), due 6/20/51 (b)(h) | 2,894,802 | 26,417 |
| REMIC, Series 2021-136, Class SB | | |
| (zero coupon) (SOFR 30A + 3.20%), due 8/20/51 (b)(h) | 4,879,939 | 111,364 |
| REMIC, Series 2021-158, Class SB | | |
| (zero coupon) (SOFR 30A + 3.70%), due 9/20/51 (b)(h) | 1,582,489 | 64,975 |
| REMIC, Series 2022-6, Class AS | | |
| (zero coupon) (SOFR 30A + 3.14%), due 1/20/52 (b)(h) | 307,831 | 3,722 |
| REMIC, Series 2022-19, Class SG | | |
| (zero coupon) (SOFR 30A + 2.45%), due 1/20/52 (b)(h) | 2,663,395 | 19,067 |
| REMIC, Series 2022-24, Class SC | | |
| (zero coupon) (SOFR 30A + 2.37%), due 2/20/52 (b)(h) | 13,411,042 | 99,851 |
| REMIC, Series 2020-97, Class HB | | |
| 1.00%, due 7/20/50 | 349,277 | 265,661 |
| REMIC, Series 2020-115, Class YA | | |
| 1.00%, due 8/20/50 | 734,554 | 559,970 |
| REMIC, Series 2020-129, Class AG | | |
| 1.00%, due 9/20/50 | 1,065,651 | 809,235 |
| REMIC, Series 2020-166, Class CA | | |
| 1.00%, due 11/20/50 | 730,529 | 545,089 |
| REMIC, Series 2021-105, Class DB | | |
| 1.00%, due 6/20/51 | 738,103 | 555,008 |
The notes to the financial statements are an integral part of, and should be read in conjunction with, the financial statements.
| 20 | MainStay VP Income Builder Portfolio |
| | Principal
Amount | Value |
| Mortgage-Backed Securities (continued) |
| Agency (Collateralized Mortgage Obligations) (continued) |
| GNMA (continued) | | |
| REMIC, Series 2020-34, Class SC | | |
| 1.697% (1 Month LIBOR + 6.05%), due 3/20/50 (b)(h) | $ 1,189,412 | $ 118,980 |
| REMIC, Series 2020-146, Class SA | | |
| 1.947% (1 Month LIBOR + 6.30%), due 10/20/50 (b)(h) | 1,110,488 | 131,338 |
| REMIC, Series 2021-179, Class SA | | |
| 1.947% (1 Month LIBOR + 6.30%), due 11/20/50 (b)(h) | 1,432,877 | 176,502 |
| REMIC, Series 2020-189, Class SU | | |
| 1.947% (1 Month LIBOR + 6.30%), due 12/20/50 (b)(h) | 337,098 | 40,851 |
| REMIC, Series 2021-57, Class SD | | |
| 1.947% (1 Month LIBOR + 6.30%), due 3/20/51 (b)(h) | 1,578,286 | 186,747 |
| REMIC, Series 2021-122, Class HS | | |
| 1.947% (1 Month LIBOR + 6.30%), due 7/20/51 (b)(h) | 1,146,296 | 147,145 |
| REMIC, Series 2021-41, Class FS | | |
| 2.00% (SOFR 30A + 0.20%), due 10/20/50 (b)(h) | 1,738,379 | 188,797 |
| REMIC, Series 2020-166, Class IC | | |
| 2.00%, due 11/20/50 (h) | 355,801 | 37,651 |
| REMIC, Series 2020-188 | | |
| 2.00%, due 12/20/50 (h) | 1,682,646 | 178,664 |
| REMIC, Series 2021-30, Class HI | | |
| 2.00%, due 2/20/51 (h) | 1,367,023 | 147,959 |
| REMIC, Series 2021-97, Class IN | | |
| 2.50%, due 8/20/49 (h) | 1,877,192 | 197,635 |
| REMIC, Series 2022-1, Class IA | | |
| 2.50%, due 6/20/50 (h) | 266,103 | 36,520 |
| REMIC, Series 2020-188, Class DI | | |
| 2.50%, due 12/20/50 (h) | 2,603,276 | 394,821 |
| REMIC, Series 2021-1, Class PI | | |
| 2.50%, due 12/20/50 (h) | 455,221 | 59,162 |
| REMIC, Series 2021-25, Class LI | | |
| 2.50%, due 2/20/51 (h) | 2,393,688 | 301,989 |
| REMIC, Series 2021-83, Class FM | | |
| 2.50% (SOFR 30A + 0.51%), due 5/20/51 (b) | 1,542,425 | 1,272,731 |
| REMIC, Series 2021-105, Class IE | | |
| 2.50%, due 6/20/51 (h) | 637,081 | 75,543 |
| REMIC, Series 2021-188 | | |
| 2.50%, due 10/20/51 (h) | 1,741,318 | 278,672 |
| REMIC, Series 2022-83 | | |
| 2.50%, due 11/20/51 (h) | 1,485,432 | 198,608 |
| | Principal
Amount | Value |
| |
| Agency (Collateralized Mortgage Obligations) (continued) |
| GNMA (continued) | | |
| REMIC, Series 2021-44, Class IQ | | |
| 3.00%, due 3/20/51 (h) | $ 1,567,900 | $ 226,583 |
| REMIC, Series 2021-97, Class FA | | |
| 3.00% (SOFR 30A + 0.40%), due 6/20/51 (b) | 425,339 | 363,234 |
| REMIC, Series 2021-98, Class IN | | |
| 3.00%, due 6/20/51 (h) | 669,269 | 120,298 |
| REMIC, Series 2021-98, Class KI | | |
| 3.00%, due 6/20/51 (h) | 1,756,528 | 263,413 |
| REMIC, Series 2022-189, Class AT | | |
| 3.00%, due 7/20/51 | 576,997 | 513,405 |
| REMIC, Series 2021-139, Class IA | | |
| 3.00%, due 8/20/51 (h) | 2,188,155 | 354,534 |
| REMIC, Series 2021-136, Class TI | | |
| 3.00%, due 8/20/51 (h) | 771,884 | 111,612 |
| REMIC, Series 2021-158, Class NI | | |
| 3.00%, due 9/20/51 (h) | 2,002,120 | 350,754 |
| REMIC, Series 2021-177, Class IM | | |
| 3.00%, due 10/20/51 (h) | 1,478,334 | 233,814 |
| REMIC, Series 2022-207, Class NA | | |
| 3.00%, due 1/20/52 | 2,310,000 | 2,009,332 |
| REMIC, Series 2022-206, Class CN | | |
| 3.00%, due 2/20/52 | 2,000,000 | 1,736,097 |
| REMIC, Series 2019-145, Class LF | | |
| 3.50% (1 Month LIBOR + 0.67%), due 11/20/49 (b) | 727,185 | 648,970 |
| REMIC, Series 2019-136, Class YF | | |
| 3.50% (1 Month LIBOR + 0.67%), due 11/20/49 (b) | 602,782 | 536,422 |
| REMIC, Series 2020-5, Class AF | | |
| 3.50% (1 Month LIBOR + 0.68%), due 1/20/50 (b) | 325,180 | 290,210 |
| REMIC, Series 2021-96, Class FG | | |
| 3.50% (SOFR 30A + 0.30%), due 6/20/51 (b) | 826,376 | 734,948 |
| REMIC, Series 2021-125, Class AF | | |
| 3.50% (SOFR 30A + 0.25%), due 7/20/51 (b) | 799,988 | 713,637 |
| REMIC, Series 2021-146, Class IN | | |
| 3.50%, due 8/20/51 (h) | 1,398,214 | 224,929 |
| REMIC, Series 2022-6, Class CF | | |
| 3.50% (SOFR 30A + 0.36%), due 1/20/52 (b) | 307,831 | 273,785 |
| REMIC, Series 2022-206, Class WN | | |
| 4.00%, due 10/20/49 | 555,000 | 514,332 |
| | | 24,258,390 |
The notes to the financial statements are an integral part of, and should be read in conjunction with, the financial statements.
21
Portfolio of Investments December 31, 2022† (continued)
| | Principal
Amount | Value |
| Mortgage-Backed Securities (continued) |
| Commercial Mortgage Loans (Collateralized Mortgage Obligations) 3.7% |
| Arbor Multifamily Mortgage Securities Trust (a) | | |
| Series 2021-MF2, Class AS | | |
| 2.70%, due 6/15/54 (i) | $ 750,000 | $ 592,990 |
| Series 2021-MF3, Class AS | | |
| 2.748%, due 10/15/54 | 930,000 | 728,091 |
| Series 2022-MF4, Class A5 | | |
| 3.293%, due 2/15/55 (j) | 415,000 | 357,231 |
| Bayview Commercial Asset Trust | | |
| Series 2006-4A, Class A1 | | |
| 4.734% (1 Month LIBOR + 0.345%), due 12/25/36 (a)(b) | 24,958 | 23,082 |
| Benchmark Mortgage Trust | | |
| Series 2020-B19, Class A2 | | |
| 1.691%, due 9/15/53 | 935,000 | 848,534 |
| BX Commercial Mortgage Trust (a) | | |
| Series 2020-VIV2, Class C | | |
| 3.542%, due 3/9/44 (j) | 1,265,000 | 988,691 |
| Series 2020-VIV3, Class B | | |
| 3.544%, due 3/9/44 (j) | 350,059 | 281,721 |
| Series 2020-VIVA, Class D | | |
| 3.549%, due 3/11/44 (j) | 355,000 | 265,887 |
| Series 2021-XL2, Class A | | |
| 5.006% (1 Month LIBOR + 0.689%), due 10/15/38 (b) | 551,396 | 529,959 |
| Series 2021-VOLT, Class C | | |
| 5.418% (1 Month LIBOR + 1.10%), due 9/15/36 (b) | 970,000 | 910,829 |
| Series 2021-ACNT, Class D | | |
| 6.168% (1 Month LIBOR + 1.85%), due 11/15/38 (b) | 1,075,000 | 1,015,692 |
| Series 2021-VOLT, Class E | | |
| 6.318% (1 Month LIBOR + 2.00%), due 9/15/36 (b) | 1,020,000 | 948,568 |
| BX Trust (a) | | |
| Series 2019-OC11, Class C | | |
| 3.856%, due 12/9/41 | 205,000 | 168,919 |
| Series 2019-OC11, Class D | | |
| 3.944%, due 12/9/41 (j) | 450,000 | 358,612 |
| Series 2021-LBA, Class AV | | |
| 5.118% (1 Month LIBOR + 0.80%), due 2/15/36 (b) | 820,000 | 779,400 |
| Series 2021-ARIA, Class E | | |
| 6.563% (1 Month LIBOR + 2.245%), due 10/15/36 (b) | 1,300,000 | 1,179,382 |
| | Principal
Amount | Value |
| |
| Commercial Mortgage Loans (Collateralized Mortgage Obligations) (continued) |
| BXHPP Trust (a)(b) | | |
| Series 2021-FILM, Class A | | |
| 4.968% (1 Month LIBOR + 0.65%), due 8/15/36 | $ 255,000 | $ 238,481 |
| Series 2021-FILM, Class B | | |
| 5.218% (1 Month LIBOR + 0.90%), due 8/15/36 | 535,000 | 485,951 |
| Extended Stay America Trust (a)(b) | | |
| Series 2021-ESH, Class C | | |
| 6.018% (1 Month LIBOR + 1.70%), due 7/15/38 | 951,787 | 913,585 |
| Series 2021-ESH, Class D | | |
| 6.568% (1 Month LIBOR + 2.25%), due 7/15/38 | 615,001 | 588,775 |
| FREMF Mortgage Trust (a)(j) | | |
| REMIC, Series 2019-K99, Class B | | |
| 3.645%, due 10/25/52 | 120,000 | 104,187 |
| REMIC, Series 2019-K98, Class C | | |
| 3.738%, due 10/25/52 | 335,000 | 283,005 |
| REMIC, Series 2017-K63, Class C | | |
| 3.877%, due 2/25/50 | 842,000 | 767,870 |
| REMIC, Series 2019-K94, Class B | | |
| 3.966%, due 7/25/52 | 830,000 | 735,450 |
| REMIC, Series 2018-K78, Class B | | |
| 4.129%, due 6/25/51 | 115,000 | 105,634 |
| REMIC, Series 2018-K81, Class B | | |
| 4.173%, due 9/25/51 | 110,000 | 100,397 |
| REMIC, Series 2018-K76, Class B | | |
| 4.208%, due 6/25/51 | 145,000 | 133,652 |
| REMIC, Series 2018-K79, Class B | | |
| 4.211%, due 7/25/51 | 105,000 | 96,245 |
| REMIC, Series 2018-K86, Class C | | |
| 4.294%, due 11/25/51 | 425,000 | 380,261 |
| Hudson Yards Mortgage Trust | | |
| Series 2019-30HY, Class A | | |
| 3.228%, due 7/10/39 (a) | 715,000 | 614,757 |
| Manhattan West Mortgage Trust | | |
| Series 2020-1MW, Class A | | |
| 2.13%, due 9/10/39 (a) | 1,120,000 | 956,266 |
| Morgan Stanley Bank of America Merrill Lynch Trust | | |
| Series 2016-C28, Class A4 | | |
| 3.544%, due 1/15/49 | 200,000 | 188,132 |
| Morgan Stanley Capital I Trust | | |
| Series 2015-UBS8, Class A4 | | |
| 3.809%, due 12/15/48 | 380,000 | 359,077 |
The notes to the financial statements are an integral part of, and should be read in conjunction with, the financial statements.
| 22 | MainStay VP Income Builder Portfolio |
| | Principal
Amount | Value |
| Mortgage-Backed Securities (continued) |
| Commercial Mortgage Loans (Collateralized Mortgage Obligations) (continued) |
| Multifamily Connecticut Avenue Securities Trust (a)(b) | | |
| Series 2019-01, Class M10 | | |
| 7.639% (1 Month LIBOR + 3.25%), due 10/25/49 | $ 862,170 | $ 809,478 |
| Series 2020-01, Class M10 | | |
| 8.139% (1 Month LIBOR + 3.75%), due 3/25/50 | 195,000 | 180,091 |
| One Bryant Park Trust | | |
| Series 2019-OBP, Class A | | |
| 2.516%, due 9/15/54 (a) | 1,945,000 | 1,592,300 |
| Wells Fargo Commercial Mortgage Trust | | |
| Series 2018-AUS, Class A | | |
| 4.058%, due 8/17/36 (a)(j) | 850,000 | 753,891 |
| | | 20,365,073 |
| Whole Loan (Collateralized Mortgage Obligations) 3.3% |
| CIM Trust | | |
| Series 2021-J2, Class AIOS | | |
| 0.21%, due 4/25/51 (a)(h)(i) | 18,872,350 | 189,154 |
| FHLMC STACR REMIC Trust (a)(b) | | |
| Series 2022-DNA1, Class M1B | | |
| 5.778% (SOFR 30A + 1.85%), due 1/25/42 | 990,000 | 939,383 |
| Series 2020-DNA6, Class M2 | | |
| 5.928% (SOFR 30A + 2.00%), due 12/25/50 | 1,140,939 | 1,133,034 |
| Series 2021-HQA3, Class M2 | | |
| 6.028% (SOFR 30A + 2.10%), due 9/25/41 | 715,000 | 629,361 |
| Series 2021-HQA1, Class M2 | | |
| 6.178% (SOFR 30A + 2.25%), due 8/25/33 | 1,040,000 | 979,506 |
| Series 2022-DNA3, Class M1B | | |
| 6.828% (SOFR 30A + 2.90%), due 4/25/42 | 996,000 | 984,180 |
| Series 2021-HQA1, Class B1 | | |
| 6.928% (SOFR 30A + 3.00%), due 8/25/33 | 1,295,000 | 1,094,220 |
| Series 2021-DNA5, Class B1 | | |
| 6.978% (SOFR 30A + 3.05%), due 1/25/34 | 1,730,000 | 1,579,955 |
| Series 2021-HQA2, Class B1 | | |
| 7.078% (SOFR 30A + 3.15%), due 12/25/33 | 430,000 | 368,169 |
| | Principal
Amount | Value |
| |
| Whole Loan (Collateralized Mortgage Obligations) (continued) |
FHLMC STACR REMIC Trust (a)(b)
(continued) | | |
| Series 2021-HQA3, Class B1 | | |
| 7.278% (SOFR 30A + 3.35%), due 9/25/41 | $ 1,470,000 | $ 1,255,553 |
| Series 2022-DNA2, Class M2 | | |
| 7.678% (SOFR 30A + 3.75%), due 2/25/42 | 770,000 | 724,142 |
| FHLMC STACR Trust (a)(b) | | |
| Series 2018-DNA2, Class B1 | | |
| 8.089% (1 Month LIBOR + 3.70%), due 12/25/30 | 725,000 | 726,127 |
| Series 2019-DNA2, Class B1 | | |
| 8.739% (1 Month LIBOR + 4.35%), due 3/25/49 | 765,000 | 786,780 |
| Series 2019-DNA1, Class B1 | | |
| 9.039% (1 Month LIBOR + 4.65%), due 1/25/49 | 875,000 | 912,430 |
| FHLMC Structured Agency Credit Risk Debt Notes | | |
| Series 2018-DNA1, Class B1 | | |
| 7.539% (1 Month LIBOR + 3.15%), due 7/25/30 (b) | 420,000 | 423,588 |
| Flagstar Mortgage Trust | | |
| Series 2021-6INV, Class A18 | | |
| 2.50%, due 8/25/51 (a)(i) | 430,314 | 331,426 |
| FNMA (b) | | |
| Series 2018-C01, Class 1B1 | | |
| 7.939% (1 Month LIBOR + 3.55%), due 7/25/30 | 1,135,000 | 1,154,842 |
| Series 2017-C05, Class 1B1 | | |
| 7.989% (1 Month LIBOR + 3.60%), due 1/25/30 | 975,000 | 986,514 |
| Series 2017-C01, Class 1B1 | | |
| 10.139% (1 Month LIBOR + 5.75%), due 7/25/29 | 240,000 | 261,639 |
| J.P. Morgan Mortgage Trust | | |
| Series 2021-LTV2, Class A1 | | |
| 2.519%, due 5/25/52 (a)(i) | 338,830 | 271,367 |
| New Residential Mortgage Loan Trust (a) | | |
| Series 2019-5A, Class B7 | | |
| 4.348%, due 8/25/59 (j) | 1,213,101 | 714,353 |
| Series 2019-2A, Class B6 | | |
| 4.885%, due 12/25/57 (i) | 461,610 | 291,458 |
| NewRez Warehouse Securitization Trust | | |
| Series 2021-1, Class A | | |
| 5.139% (1 Month LIBOR + 0.75%), due 5/25/55 (a)(b) | 335,000 | 329,667 |
The notes to the financial statements are an integral part of, and should be read in conjunction with, the financial statements.
23
Portfolio of Investments December 31, 2022† (continued)
| | Principal
Amount | Value |
| Mortgage-Backed Securities (continued) |
| Whole Loan (Collateralized Mortgage Obligations) (continued) |
| STACR Trust | | |
| Series 2018-HRP2, Class B1 | | |
| 8.589% (1 Month LIBOR + 4.20%), due 2/25/47 (a)(b) | $ 800,000 | $ 798,227 |
| | | 17,865,075 |
Total Mortgage-Backed Securities
(Cost $67,262,493) | | 62,488,538 |
| Municipal Bond 0.1% |
| California 0.1% |
| Regents of the University of California Medical Center, Pooled, Revenue Bonds | | |
| Series N | | |
| 3.006%, due 5/15/50 | 1,065,000 | 705,592 |
Total Municipal Bond
(Cost $1,065,000) | | 705,592 |
| U.S. Government & Federal Agencies 7.4% |
| Federal Home Loan Mortgage Corporation (Mortgage Pass-Through Securities) 0.5% |
| FHLMC Gold Pools, 30 Year | | |
| 3.50%, due 1/1/48 | 559,440 | 518,975 |
| UMBS Pool, 20 Year | | |
| 2.50%, due 4/1/42 | 405,899 | 352,973 |
| UMBS Pool, 30 Year | | |
| 3.50%, due 7/1/50 | 453,610 | 415,924 |
| 3.50%, due 7/1/52 | 1,273,255 | 1,157,117 |
| | | 2,444,989 |
| Federal National Mortgage Association (Mortgage Pass-Through Securities) 2.4% |
| FNMA, Other | | |
| 6.00%, due 4/1/37 | 4,761 | 4,855 |
| UMBS, 20 Year | | |
| 2.50%, due 4/1/42 | 424,915 | 369,509 |
| UMBS, 30 Year | | |
| 2.50%, due 8/1/50 | 65,436 | 55,930 |
| 3.00%, due 6/1/51 | 351,151 | 308,536 |
| 3.00%, due 11/1/51 | 735,591 | 646,055 |
| 3.00%, due 2/1/52 | 466,473 | 410,291 |
| 3.00%, due 3/1/52 | 621,936 | 546,136 |
| 3.00%, due 3/1/52 | 779,724 | 684,693 |
| 3.50%, due 9/1/52 | 1,063,176 | 966,112 |
| 4.00%, due 8/1/48 | 697,721 | 665,272 |
| | Principal
Amount | Value |
| |
| Federal National Mortgage Association (Mortgage Pass-Through Securities) (continued) |
| UMBS, 30 Year (continued) | | |
| 4.00%, due 2/1/49 | $ 119,746 | $ 114,178 |
| 4.00%, due 6/1/52 | 805,763 | 755,838 |
| 4.00%, due 6/1/52 | 1,235,535 | 1,159,133 |
| 4.00%, due 6/1/52 | 585,989 | 549,789 |
| 4.00%, due 7/1/52 | 1,383,547 | 1,298,249 |
| 5.00%, due 11/1/52 | 4,689,441 | 4,624,589 |
| | | 13,159,165 |
| United States Treasury Bonds 2.5% |
| U.S. Treasury Bonds | | |
| 4.00%, due 11/15/42 (g) | 11,615,000 | 11,371,811 |
| 4.00%, due 11/15/52 | 2,335,000 | 2,338,284 |
| | | 13,710,095 |
| United States Treasury Notes 2.0% |
| U.S. Treasury Notes | | |
| 4.00%, due 10/31/29 | 2,315,000 | 2,315,723 |
| 4.125%, due 10/31/27 | 2,655,000 | 2,664,749 |
| 4.125%, due 11/15/32 | 505,000 | 515,337 |
| 4.375%, due 10/31/24 | 5,600,000 | 5,584,031 |
| | | 11,079,840 |
Total U.S. Government & Federal Agencies
(Cost $41,668,870) | | 40,394,089 |
Total Long-Term Bonds
(Cost $264,350,532) | | 236,638,507 |
| |
| | Shares | |
| Common Stocks 52.9% |
| Aerospace & Defense 1.2% |
| BAE Systems plc (United Kingdom) | 175,575 | 1,814,601 |
| Lockheed Martin Corp. | 3,753 | 1,825,797 |
| Raytheon Technologies Corp. | 29,623 | 2,989,553 |
| | | 6,629,951 |
| Air Freight & Logistics 1.2% |
| Deutsche Post AG (Registered) (Germany) | 103,152 | 3,882,833 |
| United Parcel Service, Inc., Class B | 13,884 | 2,413,595 |
| | | 6,296,428 |
| Auto Components 0.6% |
| Bridgestone Corp. (Japan) (g) | 47,800 | 1,701,761 |
The notes to the financial statements are an integral part of, and should be read in conjunction with, the financial statements.
| 24 | MainStay VP Income Builder Portfolio |
| | Shares | Value |
| Common Stocks (continued) |
| Auto Components (continued) |
| Cie Generale des Etablissements Michelin SCA (France) | 57,600 | $ 1,601,678 |
| | | 3,303,439 |
| Automobiles 0.2% |
| Toyota Motor Corp. (Japan) | 98,700 | 1,348,947 |
| Banks 4.4% |
| Bank of America Corp. | 104,804 | 3,471,108 |
| BAWAG Group AG (Austria) (a)(k) | 45,896 | 2,440,323 |
| Columbia Banking System, Inc. | 80,522 | 2,426,128 |
| JPMorgan Chase & Co. | 29,795 | 3,995,509 |
| KeyCorp | 255,600 | 4,452,552 |
| PNC Financial Services Group, Inc. (The) | 10,772 | 1,701,330 |
| Royal Bank of Canada (Canada) | 15,331 | 1,441,386 |
| Truist Financial Corp. | 37,297 | 1,604,890 |
| U.S. Bancorp | 53,137 | 2,317,305 |
| | | 23,850,531 |
| Beverages 1.4% |
| Coca-Cola Co. (The) | 40,233 | 2,559,221 |
| Coca-Cola Europacific Partners plc (United Kingdom) | 91,953 | 5,086,840 |
| | | 7,646,061 |
| Biotechnology 0.6% |
| AbbVie, Inc. | 19,942 | 3,222,827 |
| Capital Markets 0.3% |
| Lazard Ltd., Class A | 42,424 | 1,470,840 |
| Chemicals 2.5% |
| Air Products and Chemicals, Inc. | 7,961 | 2,454,058 |
| BASF SE (Germany) | 31,006 | 1,539,268 |
| Dow, Inc. | 27,769 | 1,399,280 |
| Linde plc (United Kingdom) | 12,172 | 3,970,263 |
| LyondellBasell Industries NV, Class A | 19,401 | 1,610,865 |
| Nutrien Ltd. (Canada) (g) | 35,062 | 2,560,578 |
| | | 13,534,312 |
| Commercial Services & Supplies 0.0% ‡ |
| Quad/Graphics, Inc. (k) | 6 | 25 |
| Communications Equipment 0.9% |
| Cisco Systems, Inc. | 107,641 | 5,128,017 |
| | Shares | Value |
| |
| Construction & Engineering 0.3% |
| Vinci SA (France) | 18,490 | $ 1,846,690 |
| Diversified Telecommunication Services 2.1% |
| AT&T, Inc. | 99,855 | 1,838,330 |
| Deutsche Telekom AG (Registered) (Germany) | 243,959 | 4,866,123 |
| Orange SA (France) | 161,311 | 1,603,980 |
| TELUS Corp. (Canada) | 83,173 | 1,605,104 |
| Verizon Communications, Inc. | 40,162 | 1,582,383 |
| | | 11,495,920 |
| Electric Utilities 2.5% |
| American Electric Power Co., Inc. | 40,105 | 3,807,970 |
| Duke Energy Corp. | 14,791 | 1,523,325 |
| Entergy Corp. | 14,389 | 1,618,763 |
| Evergy, Inc. | 22,970 | 1,445,502 |
| Fortis, Inc. (Canada) | 39,896 | 1,596,429 |
| NextEra Energy, Inc. | 40,939 | 3,422,500 |
| | | 13,414,489 |
| Electrical Equipment 1.5% |
| Eaton Corp. plc | 18,021 | 2,828,396 |
| Emerson Electric Co. | 32,600 | 3,131,556 |
| Hubbell, Inc. | 8,295 | 1,946,671 |
| | | 7,906,623 |
| Entertainment 0.4% |
| Koei Tecmo Holdings Co. Ltd. (Japan) | 107,400 | 1,935,719 |
| Equity Real Estate Investment Trusts 1.3% |
| Iron Mountain, Inc. | 35,260 | 1,757,711 |
| Realty Income Corp. | 32,629 | 2,069,657 |
| Welltower, Inc. | 24,503 | 1,606,172 |
| WP Carey, Inc. | 20,574 | 1,607,858 |
| | | 7,041,398 |
| Food & Staples Retailing 0.8% |
| Walmart, Inc. | 31,791 | 4,507,646 |
| Food Products 0.9% |
| Danone SA (France) | 30,405 | 1,601,855 |
| Nestle SA (Registered) | 17,353 | 2,004,020 |
| Orkla ASA (Norway) | 204,533 | 1,477,737 |
| | | 5,083,612 |
| Gas Utilities 0.7% |
| China Resources Gas Group Ltd. (China) | 564,600 | 2,102,719 |
The notes to the financial statements are an integral part of, and should be read in conjunction with, the financial statements.
25
Portfolio of Investments December 31, 2022† (continued)
| | Shares | Value |
| Common Stocks (continued) |
| Gas Utilities (continued) |
| Snam SpA (Italy) | 356,625 | $ 1,731,487 |
| | | 3,834,206 |
| Health Care Equipment & Supplies 0.7% |
| Medtronic plc | 50,028 | 3,888,176 |
| Health Care Providers & Services 1.2% |
| CVS Health Corp. | 19,604 | 1,826,897 |
| UnitedHealth Group, Inc. | 8,661 | 4,591,889 |
| | | 6,418,786 |
| Hotels, Restaurants & Leisure 1.9% |
| McDonald's Corp. | 7,707 | 2,031,026 |
| Restaurant Brands International, Inc. (Canada) | 78,142 | 5,053,443 |
| Vail Resorts, Inc. | 12,990 | 3,096,166 |
| | | 10,180,635 |
| Household Durables 0.3% |
| Leggett & Platt, Inc. | 49,799 | 1,605,022 |
| Industrial Conglomerates 0.8% |
| Honeywell International, Inc. | 10,303 | 2,207,933 |
| Siemens AG (Registered) (Germany) | 17,374 | 2,411,384 |
| | | 4,619,317 |
| Insurance 3.2% |
| Allianz SE (Registered) (Germany) | 7,886 | 1,695,698 |
| Arthur J. Gallagher & Co. | 11,528 | 2,173,489 |
| AXA SA (France) | 107,458 | 2,994,935 |
| Manulife Financial Corp. (Canada) | 161,462 | 2,879,843 |
| MetLife, Inc. | 50,382 | 3,646,145 |
| Muenchener Rueckversicherungs-Gesellschaft AG (Registered) (Germany) | 6,297 | 2,047,557 |
| Travelers Cos., Inc. (The) | 10,849 | 2,034,079 |
| | | 17,471,746 |
| IT Services 1.1% |
| International Business Machines Corp. | 41,210 | 5,806,077 |
| Leisure Products 0.5% |
| Hasbro, Inc. | 42,285 | 2,579,808 |
| Machinery 0.6% |
| Cummins, Inc. | 13,938 | 3,377,038 |
| | Shares | Value |
| |
| Media 0.8% |
| Comcast Corp., Class A | 65,891 | $ 2,304,208 |
| Omnicom Group, Inc. | 22,380 | 1,825,537 |
| | | 4,129,745 |
| Multi-Utilities 0.5% |
| NiSource, Inc. | 53,636 | 1,470,699 |
| WEC Energy Group, Inc. | 16,324 | 1,530,538 |
| | | 3,001,237 |
| Oil, Gas & Consumable Fuels 2.6% |
| Chevron Corp. | 10,592 | 1,901,158 |
| Enbridge, Inc. (Canada) | 45,784 | 1,789,431 |
| Enterprise Products Partners LP | 87,999 | 2,122,536 |
| Magellan Midstream Partners LP | 31,850 | 1,599,188 |
| MPLX LP | 49,281 | 1,618,388 |
| TotalEnergies SE (France) | 83,320 | 5,200,433 |
| | | 14,231,134 |
| Personal Products 0.3% |
| Unilever plc (United Kingdom) | 34,110 | 1,720,815 |
| Pharmaceuticals 5.0% |
| AstraZeneca plc, Sponsored ADR (United Kingdom) | 67,137 | 4,551,888 |
| Bayer AG (Registered) (Germany) | 30,868 | 1,593,792 |
| Eli Lilly and Co. | 7,831 | 2,864,893 |
| GSK plc | 83,256 | 1,447,806 |
| Johnson & Johnson | 9,089 | 1,605,572 |
| Merck & Co., Inc. | 19,967 | 2,215,339 |
| Novartis AG (Registered) (Switzerland) | 52,184 | 4,726,895 |
| Novo Nordisk A/S, Class B (Denmark) | 14,571 | 1,972,913 |
| Pfizer, Inc. | 28,888 | 1,480,221 |
| Roche Holding AG | 5,075 | 1,594,879 |
| Sanofi (France) | 30,871 | 2,987,098 |
| | | 27,041,296 |
| Professional Services 0.3% |
| RELX plc (United Kingdom) | 54,063 | 1,490,791 |
| Semiconductors & Semiconductor Equipment 4.4% |
| Analog Devices, Inc. | 36,781 | 6,033,187 |
| Broadcom, Inc. | 12,127 | 6,780,570 |
| Intel Corp. | 61,889 | 1,635,726 |
| KLA Corp. | 10,613 | 4,001,419 |
| Taiwan Semiconductor Manufacturing Co. Ltd., Sponsored ADR (Taiwan) | 35,399 | 2,636,872 |
| Texas Instruments, Inc. | 16,955 | 2,801,305 |
| | | 23,889,079 |
The notes to the financial statements are an integral part of, and should be read in conjunction with, the financial statements.
| 26 | MainStay VP Income Builder Portfolio |
| | Shares | | Value |
| Common Stocks (continued) |
| Software 1.0% |
| Microsoft Corp. | 23,576 | | $ 5,653,996 |
| Specialty Retail 0.3% |
| Home Depot, Inc. (The) | 5,761 | | 1,819,670 |
| Technology Hardware, Storage & Peripherals 1.6% |
| Apple, Inc. | 37,463 | | 4,867,568 |
| NetApp, Inc. | 25,515 | | 1,532,431 |
| Samsung Electronics Co. Ltd., GDR (Republic of Korea) | 1,900 | | 2,110,832 |
| | | | 8,510,831 |
| Tobacco 1.4% |
| Altria Group, Inc. | 34,451 | | 1,574,755 |
| British American Tobacco plc (United Kingdom) | 104,060 | | 4,128,550 |
| Philip Morris International, Inc. | 20,552 | | 2,080,068 |
| | | | 7,783,373 |
| Trading Companies & Distributors 0.3% |
| MSC Industrial Direct Co., Inc., Class A | 20,115 | | 1,643,396 |
| Wireless Telecommunication Services 0.3% |
| SK Telecom Co. Ltd. (Republic of Korea) | 36,958 | | 1,382,696 |
Total Common Stocks
(Cost $275,730,350) | | | 287,742,345 |
| Short-Term Investments 1.1% |
| Affiliated Investment Company 1.1% |
| MainStay U.S. Government Liquidity Fund, 3.602% (l) | 6,070,353 | | 6,070,353 |
| Unaffiliated Investment Company 0.0% ‡ |
| Invesco Government and Agency Portfolio, 4.301% (l)(m) | 181,338 | | 181,338 |
Total Short-Term Investments
(Cost $6,251,691) | | | 6,251,691 |
Total Investments
(Cost $546,332,573) | 97.5% | | 530,632,543 |
| Other Assets, Less Liabilities | 2.5 | | 13,416,945 |
| Net Assets | 100.0% | | $ 544,049,488 |
| † | Percentages indicated are based on Portfolio net assets. |
| ‡ | Less than one-tenth of a percent. |
| (a) | May be sold to institutional investors only under Rule 144A or securities offered pursuant to Section 4(a)(2) of the Securities Act of 1933, as amended. |
| (b) | Floating rate—Rate shown was the rate in effect as of December 31, 2022. |
| (c) | Fixed to floating rate—Rate shown was the rate in effect as of December 31, 2022. |
| (d) | Security is perpetual and, thus, does not have a predetermined maturity date. The date shown, if applicable, reflects the next call date. |
| (e) | Step coupon—Rate shown was the rate in effect as of December 31, 2022. |
| (f) | Illiquid security—As of December 31, 2022, the total market value deemed illiquid under procedures approved by the Board of Trustees was $480,000, which represented 0.1% of the Portfolio’s net assets. (Unaudited) |
| (g) | All or a portion of this security was held on loan. As of December 31, 2022, the aggregate market value of securities on loan was $15,903,001; the total market value of collateral held by the Portfolio was $16,438,935. The market value of the collateral held included non-cash collateral in the form of U.S. Treasury securities with a value of $16,257,597. The Portfolio received cash collateral with a value of $181,338. (See Note 2(L)) |
| (h) | Collateralized Mortgage Obligation Interest Only Strip—Pays a fixed or variable rate of interest based on mortgage loans or mortgage pass-through securities. The principal amount of the underlying pool represents the notional amount on which the current interest was calculated. The value of these stripped securities may be particularly sensitive to changes in prevailing interest rates and are typically more sensitive to changes in prepayment rates than traditional mortgage-backed securities. |
| (i) | Coupon rate may change based on changes of the underlying collateral or prepayments of principal. Rate shown was the rate in effect as of December 31, 2022. |
| (j) | Collateral strip rate—A bond whose interest was based on the weighted net interest rate of the collateral. The coupon rate adjusts periodically based on a predetermined schedule. Rate shown was the rate in effect as of December 31, 2022. |
| (k) | Non-income producing security. |
| (l) | Current yield as of December 31, 2022. |
| (m) | Represents a security purchased with cash collateral received for securities on loan. |
The notes to the financial statements are an integral part of, and should be read in conjunction with, the financial statements.
27
Portfolio of Investments December 31, 2022† (continued)
Investments in Affiliates (in 000's)
Investments in issuers considered to be affiliate(s) of the Portfolio during the year ended December 31, 2022 for purposes of Section 2(a)(3) of the Investment Company Act of 1940, as amended, were as follows:
| Affiliated Investment Companies | Value,
Beginning
of Year | Purchases
at Cost | Proceeds
from
Sales | Net
Realized
Gain/(Loss)
on Sales | Change in
Unrealized
Appreciation/
(Depreciation) | Value,
End of
Year | Dividend
Income | Other
Distributions | Shares
End of
Year |
| MainStay U.S. Government Liquidity Fund | $ 28,679 | $ 284,109 | $ (306,718) | $ — | $ — | $ 6,070 | $ 89 | $ — | 6,070 |
Foreign Currency Forward Contracts
As of December 31, 2022, the Portfolio held the following foreign currency forward contracts1:
| Currency Purchased | Currency Sold | Counterparty | Settlement
Date | Unrealized
Appreciation
(Depreciation) |
| AUD | 9,875,000 | USD | 6,446,469 | JPMorgan Chase Bank N.A. | 2/6/23 | $ 286,554 |
| GBP | 133,000 | USD | 155,104 | JPMorgan Chase Bank N.A. | 2/6/23 | 5,836 |
| JPY | 1,106,651,000 | USD | 7,657,743 | JPMorgan Chase Bank N.A. | 2/6/23 | 813,114 |
| Total Unrealized Appreciation | 1,105,504 |
| USD | 7,727,636 | EUR | 7,602,147 | JPMorgan Chase Bank N.A. | 2/6/23 | (429,434) |
| Total Unrealized Depreciation | (429,434) |
| Net Unrealized Appreciation | $ 676,070 |
| 1. | Foreign Currency Forward Contracts are subject to limitations such that they cannot be “sold or repurchased,” although the Portfolio would be able to exit the transaction through other means, such as through the execution of an offsetting transaction. |
Futures Contracts
As of December 31, 2022, the Portfolio held the following futures contracts1:
| Type | Number of
Contracts | Expiration
Date | Value at
Trade Date | Current
Notional
Amount | Unrealized
Appreciation
(Depreciation)2 |
| Long Contracts | | | | | |
| Russell 2000 E-Mini Index | 188 | March 2023 | $ 17,243,513 | $ 16,646,460 | $ (597,053) |
| S&P 500 E-Mini Index | 94 | March 2023 | 18,919,590 | 18,146,700 | (772,890) |
| U.S. Treasury 2 Year Notes | 101 | March 2023 | 20,684,962 | 20,712,891 | 27,929 |
| U.S. Treasury 5 Year Notes | 122 | March 2023 | 13,166,479 | 13,167,422 | 943 |
| U.S. Treasury 10 Year Notes | 225 | March 2023 | 25,371,956 | 25,266,797 | (105,159) |
| U.S. Treasury 10 Year Ultra Bonds | 111 | March 2023 | 13,188,440 | 13,129,219 | (59,221) |
| U.S. Treasury Long Bonds | 16 | March 2023 | 2,017,287 | 2,005,500 | (11,787) |
| U.S. Treasury Ultra Bonds | 62 | March 2023 | 8,393,228 | 8,327,375 | (65,853) |
| XAE Energy Index | 161 | March 2023 | 14,275,594 | 14,818,440 | 542,846 |
| XAV Health Care Index | 86 | March 2023 | 12,205,952 | 11,887,780 | (318,172) |
| Yen Denominated Nikkei 225 Index | 126 | March 2023 | 13,262,075 | 12,353,741 | (908,334) |
| Total Long Contracts | | | | | (2,266,751) |
| Short Contracts | | | | | |
| Euro STOXX 50 Index | (629) | March 2023 | (27,113,800) | (25,484,899) | 1,628,901 |
| FTSE 100 Index | (19) | March 2023 | (1,730,421) | (1,714,944) | 15,477 |
| S&P E-Mini Commercial Service Equity Index | (76) | March 2023 | (4,995,213) | (4,807,000) | 188,213 |
| XAF Financial Index | (16) | March 2023 | (1,732,168) | (1,698,000) | 34,168 |
| XAI E-Mini Industrial Equity Index | (30) | March 2023 | (3,063,506) | (2,988,900) | 74,606 |
| Total Short Contracts | | | | | 1,941,365 |
| Net Unrealized Depreciation | | | | | $ (325,386) |
| 1. | As of December 31, 2022, cash in the amount of $8,572,012 was on deposit with a broker or futures commission merchant for futures transactions. |
| 2. | Represents the difference between the value of the contracts at the time they were opened and the value as of December 31, 2022. |
The notes to the financial statements are an integral part of, and should be read in conjunction with, the financial statements.
| 28 | MainStay VP Income Builder Portfolio |
| Abbreviation(s): |
| ADR—American Depositary Receipt |
| AUD—Australia Dollar |
| EUR—Euro |
| FHLMC—Federal Home Loan Mortgage Corp. |
| FNMA—Federal National Mortgage Association |
| FREMF—Freddie Mac Multifamily |
| FTSE—Financial Times Stock Exchange |
| GBP—British Pound Sterling |
| GDR—Global Depositary Receipt |
| GNMA—Government National Mortgage Association |
| JPY—Japanese Yen |
| LIBOR—London Interbank Offered Rate |
| REMIC—Real Estate Mortgage Investment Conduit |
| SOFR—Secured Overnight Financing Rate |
| UMBS—Uniform Mortgage Backed Securities |
| USD—United States Dollar |
The notes to the financial statements are an integral part of, and should be read in conjunction with, the financial statements.
29
Portfolio of Investments December 31, 2022† (continued)
The following is a summary of the fair valuations according to the inputs used as of December 31, 2022, for valuing the Portfolio’s assets and liabilities:
| Description | Quoted
Prices in
Active
Markets for
Identical
Assets
(Level 1) | | Significant
Other
Observable
Inputs
(Level 2) | | Significant
Unobservable
Inputs
(Level 3) | | Total |
| Asset Valuation Inputs | | | | | | | |
| Investments in Securities (a) | | | | | | | |
| Long-Term Bonds | | | | | | | |
| Asset-Backed Securities | $ — | | $ 23,219,421 | | $ — | | $ 23,219,421 |
| Corporate Bonds | — | | 105,882,768 | | — | | 105,882,768 |
| Foreign Government Bonds | — | | 3,488,103 | | — | | 3,488,103 |
| Loan Assignments | — | | 459,996 | | — | | 459,996 |
| Mortgage-Backed Securities | — | | 62,488,538 | | — | | 62,488,538 |
| Municipal Bond | — | | 705,592 | | — | | 705,592 |
| U.S. Government & Federal Agencies | — | | 40,394,089 | | — | | 40,394,089 |
| Total Long-Term Bonds | — | | 236,638,507 | | — | | 236,638,507 |
| Common Stocks | | | | | | | |
| Aerospace & Defense | 4,815,350 | | 1,814,601 | | — | | 6,629,951 |
| Air Freight & Logistics | 2,413,595 | | 3,882,833 | | — | | 6,296,428 |
| Auto Components | — | | 3,303,439 | | — | | 3,303,439 |
| Automobiles | — | | 1,348,947 | | — | | 1,348,947 |
| Banks | 21,410,208 | | 2,440,323 | | — | | 23,850,531 |
| Chemicals | 11,995,044 | | 1,539,268 | | — | | 13,534,312 |
| Construction & Engineering | — | | 1,846,690 | | — | | 1,846,690 |
| Diversified Telecommunication Services | 5,025,817 | | 6,470,103 | | — | | 11,495,920 |
| Entertainment | — | | 1,935,719 | | — | | 1,935,719 |
| Food Products | — | | 5,083,612 | | — | | 5,083,612 |
| Gas Utilities | — | | 3,834,206 | | — | | 3,834,206 |
| Industrial Conglomerates | 2,207,933 | | 2,411,384 | | — | | 4,619,317 |
| Insurance | 10,733,556 | | 6,738,190 | | — | | 17,471,746 |
| Oil, Gas & Consumable Fuels | 9,030,701 | | 5,200,433 | | — | | 14,231,134 |
| Personal Products | — | | 1,720,815 | | — | | 1,720,815 |
| Pharmaceuticals | 12,717,913 | | 14,323,383 | | — | | 27,041,296 |
| Professional Services | — | | 1,490,791 | | — | | 1,490,791 |
| Technology Hardware, Storage & Peripherals | 6,399,999 | | 2,110,832 | | — | | 8,510,831 |
| Tobacco | 3,654,823 | | 4,128,550 | | — | | 7,783,373 |
| Wireless Telecommunication Services | — | | 1,382,696 | | — | | 1,382,696 |
| All Other Industries | 124,330,591 | | — | | — | | 124,330,591 |
| Total Common Stocks | 214,735,530 | | 73,006,815 | | — | | 287,742,345 |
| Short-Term Investments | | | | | | | |
| Affiliated Investment Company | 6,070,353 | | — | | — | | 6,070,353 |
| Unaffiliated Investment Company | 181,338 | | — | | — | | 181,338 |
| Total Short-Term Investments | 6,251,691 | | — | | — | | 6,251,691 |
| Total Investments in Securities | 220,987,221 | | 309,645,322 | | — | | 530,632,543 |
| Other Financial Instruments (b) | | | | | | | |
| Foreign Currency Forward Contracts | — | | 1,105,504 | | — | | 1,105,504 |
| Futures Contracts | 2,513,083 | | — | | — | | 2,513,083 |
| Total Other Financial Instruments | 2,513,083 | | 1,105,504 | | — | | 3,618,587 |
| Total Investments in Securities and Other Financial Instruments | $ 223,500,304 | | $ 310,750,826 | | $ — | | $ 534,251,130 |
| Liability Valuation Inputs | | | | | | | |
| Other Financial Instruments (b) | | | | | | | |
| Foreign Currency Forward Contracts | $ — | | $ (429,434) | | $ — | | $ (429,434) |
| Futures Contracts | (2,838,469) | | — | | — | | (2,838,469) |
| Total Other Financial Instruments | $ (2,838,469) | | $ (429,434) | | $ — | | $ (3,267,903) |
| (a) | For a complete listing of investments and their industries, see the Portfolio of Investments. |
| (b) | The value listed for these securities reflects unrealized appreciation (depreciation) as shown on the Portfolio of Investments. |
The notes to the financial statements are an integral part of, and should be read in conjunction with, the financial statements.
| 30 | MainStay VP Income Builder Portfolio |
Statement of Assets and Liabilities as of December 31, 2022
| Assets |
Investment in unaffiliated securities, at value
(identified cost $540,262,220) including securities on loan of $15,903,001 | $524,562,190 |
Investment in affiliated investment companies, at value
(identified cost $6,070,353) | 6,070,353 |
| Cash | 31,764 |
Cash denominated in foreign currencies
(identified cost $27,279) | 27,468 |
| Cash collateral on deposit at broker for futures contracts | 8,572,012 |
| Receivables: | |
| Investment securities sold | 4,084,322 |
| Dividends and interest | 2,852,373 |
| Portfolio shares sold | 309,913 |
| Variation margin on futures contracts | 153,723 |
| Securities lending | 17,491 |
| Unrealized appreciation on foreign currency forward contracts | 1,105,504 |
| Other assets | 29,092 |
| Total assets | 547,816,205 |
| Liabilities |
| Cash collateral received for securities on loan | 181,338 |
| Payables: | |
| Investment securities purchased | 2,522,293 |
| Manager (See Note 3) | 268,455 |
| Portfolio shares redeemed | 179,091 |
| NYLIFE Distributors (See Note 3) | 83,612 |
| Professional fees | 45,564 |
| Shareholder communication | 31,894 |
| Custodian | 14,278 |
| Accrued expenses | 10,758 |
| Unrealized depreciation on foreign currency forward contracts | 429,434 |
| Total liabilities | 3,766,717 |
| Net assets | $544,049,488 |
| Composition of Net Assets |
| Shares of beneficial interest outstanding (par value of $.001 per share) unlimited number of shares authorized | $ 40,059 |
| Additional paid-in-capital | 595,893,888 |
| | 595,933,947 |
| Total distributable earnings (loss) | (51,884,459) |
| Net assets | $544,049,488 |
| Initial Class | |
| Net assets applicable to outstanding shares | $158,019,798 |
| Shares of beneficial interest outstanding | 11,546,170 |
| Net asset value per share outstanding | $ 13.69 |
| Service Class | |
| Net assets applicable to outstanding shares | $386,029,690 |
| Shares of beneficial interest outstanding | 28,512,529 |
| Net asset value per share outstanding | $ 13.54 |
The notes to the financial statements are an integral part of, and should be read in conjunction with, the financial statements.
31
Statement of Operations for the year ended December 31, 2022
| Investment Income (Loss) |
| Income | |
| Interest | $ 9,935,251 |
| Dividends-unaffiliated (net of foreign tax withholding of $584,624) | 9,561,748 |
| Dividends-affiliated | 88,829 |
| Securities lending, net | 67,390 |
| Total income | 19,653,218 |
| Expenses | |
| Manager (See Note 3) | 3,380,033 |
| Distribution/Service—Service Class (See Note 3) | 1,057,151 |
| Professional fees | 118,268 |
| Custodian | 76,391 |
| Shareholder communication | 34,101 |
| Trustees | 12,710 |
| Miscellaneous | 46,775 |
| Total expenses | 4,725,429 |
| Net investment income (loss) | 14,927,789 |
| Realized and Unrealized Gain (Loss) |
| Net realized gain (loss) on: | |
| Unaffiliated investment transactions | (2,392,752) |
| Futures transactions | (25,918,087) |
| Foreign currency transactions | (950,419) |
| Foreign currency forward transactions | (7,725,775) |
| Net realized gain (loss) | (36,987,033) |
| Net change in unrealized appreciation (depreciation) on: | |
| Unaffiliated investments | (70,885,059) |
| Futures contracts | (3,029,724) |
| Foreign currency forward contracts | 2,120,085 |
| Translation of other assets and liabilities in foreign currencies | (306,173) |
| Net change in unrealized appreciation (depreciation) | (72,100,871) |
| Net realized and unrealized gain (loss) | (109,087,904) |
| Net increase (decrease) in net assets resulting from operations | $ (94,160,115) |
The notes to the financial statements are an integral part of, and should be read in conjunction with, the financial statements.
| 32 | MainStay VP Income Builder Portfolio |
Statements of Changes in Net Assets
for the years ended December 31, 2022 and December 31, 2021
| | 2022 | 2021 |
| Increase (Decrease) in Net Assets |
| Operations: | | |
| Net investment income (loss) | $ 14,927,789 | $ 14,592,381 |
| Net realized gain (loss) | (36,987,033) | 56,653,743 |
| Net change in unrealized appreciation (depreciation) | (72,100,871) | (4,343,381) |
| Net increase (decrease) in net assets resulting from operations | (94,160,115) | 66,902,743 |
| Distributions to shareholders: | | |
| Initial Class | (18,520,336) | (10,040,167) |
| Service Class | (44,926,426) | (24,035,185) |
| | (63,446,762) | (34,075,352) |
| Distributions to shareholders from return of capital: | | |
| Initial Class | (1,897,990) | — |
| Service Class | (4,604,122) | — |
| | (6,502,112) | — |
| Total distributions to shareholders | (69,948,874) | (34,075,352) |
| Capital share transactions: | | |
| Net proceeds from sales of shares | 44,815,527 | 67,772,446 |
| Net asset value of shares issued to shareholders in reinvestment of distributions | 69,948,874 | 34,075,352 |
| Cost of shares redeemed | (105,661,713) | (100,759,606) |
| Increase (decrease) in net assets derived from capital share transactions | 9,102,688 | 1,088,192 |
| Net increase (decrease) in net assets | (155,006,301) | 33,915,583 |
| Net Assets |
| Beginning of year | 699,055,789 | 665,140,206 |
| End of year | $ 544,049,488 | $ 699,055,789 |
The notes to the financial statements are an integral part of, and should be read in conjunction with, the financial statements.
33
Financial Highlights selected per share data and ratios
| | Year Ended December 31, |
| Initial Class | 2022 | | 2021 | | 2020 | | 2019 | | 2018 |
| Net asset value at beginning of year | $ 18.23 | | $ 17.37 | | $ 17.14 | | $ 15.23 | | $ 17.29 |
| Net investment income (loss) (a) | 0.42 | | 0.42 | | 0.41 | | 0.49 | | 0.53 |
| Net realized and unrealized gain (loss) | (3.02) | | 1.37 | | 0.87 | | 2.22 | | (1.38) |
| Total from investment operations | (2.60) | | 1.79 | | 1.28 | | 2.71 | | (0.85) |
| Less distributions: | | | | | | | | | |
| From net investment income | (0.26) | | (0.39) | | (0.42) | | (0.68) | | (0.46) |
| From net realized gain on investments | (1.51) | | (0.54) | | (0.63) | | (0.12) | | (0.75) |
| Return of capital | (0.17) | | — | | — | | — | | — |
| Total distributions | (1.94) | | (0.93) | | (1.05) | | (0.80) | | (1.21) |
| Net asset value at end of year | $ 13.69 | | $ 18.23 | | $ 17.37 | | $ 17.14 | | $ 15.23 |
| Total investment return (b) | (13.52)% | | 10.52% | | 7.98% | | 18.07% | | (5.21)% |
| Ratios (to average net assets)/Supplemental Data: | | | | | | | | | |
| Net investment income (loss) | 2.70% | | 2.31% | | 2.50% | | 3.00% | | 3.18% |
| Net expenses (c) | 0.62% | | 0.61% | | 0.62% | | 0.63% | | 0.62% |
| Interest expense and fees | —% | | —% | | —% | | —% | | 0.00%(d) |
| Portfolio turnover rate | 58% | | 67%(e) | | 68%(e) | | 59%(e) | | 50%(e) |
| Net assets at end of year (in 000's) | $ 158,020 | | $ 198,243 | | $ 192,022 | | $ 193,252 | | $ 178,608 |
| (a) | Per share data based on average shares outstanding during the year. |
| (b) | Total return does not reflect any deduction of sales charges, mortality and expense charges, contract charges or administrative charges. For periods of less than one year, total return is not annualized. |
| (c) | In addition to the fees and expenses which the Portfolio bears directly, it also indirectly bears a pro-rata share of the fees and expenses of the underlying funds in which it invests. Such indirect expenses are not included in the above expense ratios. |
| (d) | Less than 0.01%. |
| (e) | The portfolio turnover rates not including mortgage dollar rolls were 67%, 67%, 52% and 39% for the years ended December 31, 2021, 2020, 2019 and 2018, respectively. |
| | Year Ended December 31, |
| Service Class | 2022 | | 2021 | | 2020 | | 2019 | | 2018 |
| Net asset value at beginning of year | $ 18.06 | | $ 17.22 | | $ 16.99 | | $ 15.11 | | $ 17.17 |
| Net investment income (loss) (a) | 0.38 | | 0.37 | | 0.37 | | 0.45 | | 0.48 |
| Net realized and unrealized gain (loss) | (3.00) | | 1.36 | | 0.86 | | 2.19 | | (1.37) |
| Total from investment operations | (2.62) | | 1.73 | | 1.23 | | 2.64 | | (0.89) |
| Less distributions: | | | | | | | | | |
| From net investment income | (0.22) | | (0.35) | | (0.37) | | (0.64) | | (0.42) |
| From net realized gain on investments | (1.51) | | (0.54) | | (0.63) | | (0.12) | | (0.75) |
| Return of capital | (0.17) | | — | | — | | — | | — |
| Total distributions | (1.90) | | (0.89) | | (1.00) | | (0.76) | | (1.17) |
| Net asset value at end of year | $ 13.54 | | $ 18.06 | | $ 17.22 | | $ 16.99 | | $ 15.11 |
| Total investment return (b) | (13.73)% | | 10.24% | | 7.71% | | 17.78% | | (5.45)% |
| Ratios (to average net assets)/Supplemental Data: | | | | | | | | | |
| Net investment income (loss) | 2.45% | | 2.06% | | 2.25% | | 2.74% | | 2.93% |
| Net expenses (c) | 0.87% | | 0.86% | | 0.87% | | 0.88% | | 0.87% |
| Interest expense and fees | —% | | —% | | —% | | —% | | 0.00%(d) |
| Portfolio turnover rate | 58% | | 67%(e) | | 68%(e) | | 59%(e) | | 50%(e) |
| Net assets at end of year (in 000's) | $ 386,030 | | $ 500,812 | | $ 473,118 | | $ 433,515 | | $ 360,874 |
| (a) | Per share data based on average shares outstanding during the year. |
| (b) | Total return does not reflect any deduction of sales charges, mortality and expense charges, contract charges or administrative charges. For periods of less than one year, total return is not annualized. |
| (c) | In addition to the fees and expenses which the Portfolio bears directly, it also indirectly bears a pro-rata share of the fees and expenses of the underlying funds in which it invests. Such indirect expenses are not included in the above expense ratios. |
| (d) | Less than 0.01%. |
| (e) | The portfolio turnover rates not including mortgage dollar rolls were 67%, 67%, 52% and 39% for the years ended December 31, 2021, 2020, 2019 and 2018, respectively. |
The notes to the financial statements are an integral part of, and should be read in conjunction with, the financial statements.
| 34 | MainStay VP Income Builder Portfolio |
Notes to Financial Statements
Note 1–Organization and Business
MainStay VP Funds Trust (the “Fund”) was organized as a Delaware statutory trust on February 1, 2011. The Fund is registered under the Investment Company Act of 1940, as amended (the “1940 Act”), as an open-end management investment company. The Fund is comprised of thirty-one separate series (collectively referred to as the “Portfolios”). These financial statements and notes relate to the MainStay VP Income Builder Portfolio (the "Portfolio"), a "diversified” portfolio, as that term is defined in the 1940 Act, as interpreted or modified by regulatory authorities having jurisdiction, from time to time.
Shares of the Portfolio are currently offered to certain separate accounts to fund variable annuity policies and variable universal life insurance policies issued by New York Life Insurance and Annuity Corporation (“NYLIAC”), a wholly-owned subsidiary of New York Life Insurance Company (“New York Life”) and may also be offered to fund variable annuity policies and variable universal life insurance policies issued by other insurance companies. NYLIAC allocates shares of the Portfolio to, among others, certain NYLIAC separate accounts. Shares of the Portfolio are also offered to the MainStay VP Conservative Allocation Portfolio, MainStay VP Moderate Allocation Portfolio, MainStay VP Growth Allocation Portfolio and MainStay VP Equity Allocation Portfolio, which operate as “funds-of-funds," and other variable insurance funds.
The following table lists the Portfolio's share classes that have been registered and commenced operations:
| Class | Commenced Operations |
| Initial Class | January 29, 1993 |
| Service Class | June 4, 2003 |
Shares of the Portfolio are offered and are redeemed at a price equal to their respective net asset value (“NAV”) per share. No sales or redemption charge is applicable to the purchase or redemption of the Portfolio's shares. Under the terms of the Fund’s multiple class plan, adopted pursuant to Rule 18f-3 under the 1940 Act, the classes differ in that, among other things, Service Class shares of the Portfolio pay a combined distribution and service fee of 0.25% of average daily net assets attributable to Service Class shares of the Portfolio to the Distributor (as defined in Note 3(B)) pursuant to a plan adopted in accordance with Rule 12b-1 under the 1940 Act. Contract owners of variable annuity contracts purchased after June 2, 2003, are permitted to invest only in the Service Class shares.
The Portfolio's investment objective is to seek current income consistent with reasonable opportunity for future growth of capital and income.
Note 2–Significant Accounting Policies
The Portfolio is an investment company and accordingly follows the investment company accounting and reporting guidance of the Financial Accounting Standards Board (“FASB”) Accounting Standards Codification Topic 946 Financial Services—Investment Companies. The Portfolio prepares its financial statements in accordance with generally accepted
accounting principles (“GAAP”) in the United States of America and follows the significant accounting policies described below.
(A) Securities Valuation. Investments are usually valued as of the close of regular trading on the New York Stock Exchange (the "Exchange") (usually 4:00 p.m. Eastern time) on each day the Portfolio is open for business ("valuation date").
Effective September 8, 2022, and pursuant to Rule 2a-5 under the 1940 Act, the Board of Trustees of the Fund (the "Board") designated New York Life Investment Management LLC (“New York Life Investments” or the "Manager") as its Valuation Designee (the "Valuation Designee"). The Valuation Designee is responsible for performing fair valuations relating to all investments in the Portfolio’s portfolio for which market quotations are not readily available; periodically assessing and managing material valuation risks; establishing and applying fair value methodologies; testing fair valuation methodologies; evaluating and overseeing pricing services; ensuring appropriate segregation of valuation and portfolio management functions; providing quarterly, annual and prompt reporting to the Board, as appropriate; identifying potential conflicts of interest; and maintaining appropriate records. The Valuation Designee has established a valuation committee ("Valuation Committee") to assist in carrying out the Valuation Designee’s responsibilities and establish prices of securities for which market quotations are not readily available. The Portfolio’s and the Valuation Designee's policies and procedures ("Valuation Procedures") govern the Valuation Designee’s selection and application of methodologies for determining and calculating the fair value of Portfolio investments. The Valuation Designee may value the Portfolio's portfolio securities for which market quotations are not readily available and other Portfolio assets utilizing inputs from pricing services and other third-party sources (together, “Pricing Sources”). The Valuation Committee meets (in person, via electronic mail or via teleconference) on an ad-hoc basis to determine fair valuations and on a quarterly basis to review fair value events with respect to certain securities for which market quotations are not readily available, including valuation risks and back-testing results, and preview reports to the Board.
The Valuation Committee establishes prices of securities for which market quotations are not readily available based on such methodologies and measurements on a regular basis after considering information that is reasonably available and deemed relevant by the Valuation Committee. The Board shall oversee the Valuation Designee and review fair valuation materials on a prompt, quarterly and annual basis and approve proposed revisions to the Valuation Procedures.
Investments for which market quotations are not readily available are valued at fair value as determined in good faith pursuant to the Valuation Procedures. A market quotation is readily available only when that quotation is a quoted price (unadjusted) in active markets for identical investments that the Portfolio can access at the measurement date, provided that a quotation will not be readily available if it is not reliable. "Fair value" is defined as the price the Portfolio would reasonably expect to receive upon selling an asset or liability in an orderly transaction to an independent buyer in the principal or most advantageous market for the
Notes to Financial Statements (continued)
asset or liability. Fair value measurements are determined within a framework that establishes a three-tier hierarchy that maximizes the use of observable market data and minimizes the use of unobservable inputs to establish a classification of fair value measurements for disclosure purposes. "Inputs" refer broadly to the assumptions that market participants would use in pricing the asset or liability, including assumptions about risk, such as the risk inherent in a particular valuation technique used to measure fair value using a pricing model and/or the risk inherent in the inputs for the valuation technique. Inputs may be observable or unobservable. Observable inputs reflect the assumptions market participants would use in pricing the asset or liability based on market data obtained from sources independent of the Portfolio. Unobservable inputs reflect the Portfolio’s own assumptions about the assumptions market participants would use in pricing the asset or liability based on the information available. The inputs or methodology used for valuing assets or liabilities may not be an indication of the risks associated with investing in those assets or liabilities. The three-tier hierarchy of inputs is summarized below.
| • | Level 1—quoted prices (unadjusted) in active markets for an identical asset or liability |
| • | Level 2—other significant observable inputs (including quoted prices for a similar asset or liability in active markets, interest rates and yield curves, prepayment speeds, credit risk, etc.) |
| • | Level 3—significant unobservable inputs (including the Portfolio's own assumptions about the assumptions that market participants would use in measuring fair value of an asset or liability) |
The level of an asset or liability within the fair value hierarchy is based on the lowest level of an input, both individually and in the aggregate, that is significant to the fair value measurement. The aggregate value by input level of the Portfolio’s assets and liabilities as of December 31, 2022, is included at the end of the Portfolio of Investments.
The Portfolio may use third-party vendor evaluations, whose prices may be derived from one or more of the following standard inputs, among others:
| • Benchmark yields | • Reported trades |
| • Broker/dealer quotes | • Issuer spreads |
| • Two-sided markets | • Benchmark securities |
| • Bids/offers | • Reference data (corporate actions or material event notices) |
| • Industry and economic events | • Comparable bonds |
| • Monthly payment information | |
An asset or liability for which a market quotation is not readily available is valued by methods deemed reasonable in good faith by the Valuation Committee, following the Valuation Procedures to represent fair value. Under these procedures, the Valuation Designee generally uses a market-based approach which may use related or comparable assets or liabilities, recent transactions, market multiples, book values and other relevant information. The Valuation Designee may also use an
income-based valuation approach in which the anticipated future cash flows of the asset or liability are discounted to calculate fair value. Discounts may also be applied due to the nature and/or duration of any restrictions on the disposition of the asset or liability. Fair value represents a good faith approximation of the value of a security. Fair value determinations involve the consideration of a number of subjective factors, an analysis of applicable facts and circumstances and the exercise of judgment. As a result, it is possible that the fair value for a security determined in good faith in accordance with the Valuation Procedures may differ from valuations for the same security determined for other funds using their own valuation procedures. Although the Valuation Procedures are designed to value a security at the price the Portfolio may reasonably expect to receive upon the security's sale in an orderly transaction, there can be no assurance that any fair value determination thereunder would, in fact, approximate the amount that the Portfolio would actually realize upon the sale of the security or the price at which the security would trade if a reliable market price were readily available. During the year ended December 31, 2022, there were no material changes to the fair value methodologies.
Securities which may be valued in this manner include, but are not limited to: (i) a security for which trading has been halted or suspended or otherwise does not have a readily available market quotation on a given day; (ii) a debt security that has recently gone into default and for which there is not a current market quotation; (iii) a security of an issuer that has entered into a restructuring; (iv) a security that has been delisted from a national exchange; (v) a security subject to trading collars for which no or limited trading takes place; and (vi) a security whose principal market has been temporarily closed at a time when, under normal conditions, it would be open. Securities valued in this manner are generally categorized as Level 2 or 3 in the hierarchy.
Certain securities held by the Portfolio may principally trade in foreign markets. Events may occur between the time the foreign markets close and the time at which the Portfolio's NAVs are calculated. These events may include, but are not limited to, situations relating to a single issuer in a market sector, significant fluctuations in U.S. or foreign markets, natural disasters, armed conflicts, governmental actions or other developments not tied directly to the securities markets. Should the Valuation Designee conclude that such events may have affected the accuracy of the last price of such securities reported on the local foreign market, the Valuation Designee may, pursuant to the Valuation Procedures, adjust the value of the local price to reflect the estimated impact on the price of such securities as a result of such events. In this instance, securities are generally categorized as Level 3 in the hierarchy. Additionally, certain foreign equity securities are also fair valued whenever the movement of a particular index exceeds certain thresholds. In such cases, the securities are fair valued by applying factors provided by a third-party vendor in accordance with the Valuation Procedures and are generally categorized as Level 2 in the hierarchy. Securities that were fair valued in such a manner as of December 31, 2022, are shown in the Portfolio of Investments.
| 36 | MainStay VP Income Builder Portfolio |
If the principal market of certain foreign equity securities is closed in observance of a local foreign holiday, these securities are valued using the last closing price of regular trading on the relevant exchange and fair valued by applying factors provided by a third-party vendor in accordance with the Valuation Procedures. These securities are generally categorized as Level 2 in the hierarchy. No securities held by the Portfolio as of December 31, 2022, were fair valued in such a manner.
Equity securities are valued at the last quoted sales prices as of the close of regular trading on the relevant exchange on each valuation date. Securities that are not traded on the valuation date are valued at the mean of the last quoted bid and ask prices. Prices are normally taken from the principal market in which each security trades. These securities are generally categorized as Level 1 in the hierarchy.
Investments in mutual funds, including money market funds, are valued at their respective NAVs at the close of business each day on the valuation date. These securities are generally categorized as Level 1 in the hierarchy.
Futures contracts are valued at the last posted settlement price on the market where such futures are primarily traded. These securities are generally categorized as Level 1 in the hierarchy.
Debt securities (other than convertible and municipal bonds) are valued at the evaluated bid prices (evaluated mean prices in the case of convertible and municipal bonds) supplied by a pricing agent or broker selected by the Valuation Designee, in consultation with the Subadvisors. The evaluations are market-based measurements processed through a pricing application and represents the pricing agent’s good faith determination as to what a holder may receive in an orderly transaction under market conditions. The rules-based logic utilizes valuation techniques that reflect participants’ assumptions and vary by asset class and per methodology, maximizing the use of relevant observable data including quoted prices for similar assets, benchmark yield curves and market corroborated inputs. The evaluated bid or mean prices are deemed by the Valuation Designee, in consultation with the Subadvisors, to be representative of market values at the regular close of trading of the Exchange on each valuation date. Debt securities purchased on a delayed delivery basis are marked to market daily until settlement at the forward settlement date. Debt securities, including corporate bonds, U.S. government and federal agency bonds, municipal bonds, foreign bonds, convertible bonds, asset-backed securities and mortgage-backed securities are generally categorized as Level 2 in the hierarchy.
Foreign currency forward contracts are valued at their fair market values measured on the basis of the mean between the last current bid and ask prices based on dealer or exchange quotations and are generally categorized as Level 2 in the hierarchy.
Loan assignments, participations and commitments are valued at the average of bid quotations obtained from the engaged independent pricing service and are generally categorized as Level 2 in the hierarchy. Certain loan assignments, participations and commitments may be valued by utilizing significant unobservable inputs obtained from the pricing service
and are generally categorized as Level 3 in the hierarchy. No securities held by the Portfolio as of December 31, 2022 were fair valued utilizing significant unobservable inputs obtained from the pricing service.
Temporary cash investments acquired in excess of 60 days to maturity at the time of purchase are valued using the latest bid prices or using valuations based on a matrix system (which considers such factors as security prices, yields, maturities and ratings), both as furnished by independent pricing services. Temporary cash investments that mature in 60 days or less at the time of purchase ("Short-Term Investments") are valued using the amortized cost method of valuation, unless the use of such method would be inappropriate. The amortized cost method involves valuing a security at its cost on the date of purchase and thereafter assuming a constant amortization to maturity of the difference between such cost and the value on maturity date. Amortized cost approximates the current fair value of a security. Securities valued using the amortized cost method are not valued using quoted prices in an active market and are generally categorized as Level 2 in the hierarchy.
The information above is not intended to reflect an exhaustive list of the methodologies that may be used to value portfolio investments. The Valuation Procedures permit the use of a variety of valuation methodologies in connection with valuing portfolio investments. The methodology used for a specific type of investment may vary based on the market data available or other considerations. The methodologies summarized above may not represent the specific means by which portfolio investments are valued on any particular business day.
A portfolio investment may be classified as an illiquid investment under the Portfolio's written liquidity risk management program and related procedures (“Liquidity Program”). Illiquidity of an investment might prevent the sale of such investment at a time when the Manager or the Subadvisors might wish to sell, and these investments could have the effect of decreasing the overall level of the Portfolio's liquidity. Further, the lack of an established secondary market may make it more difficult to value illiquid investments, requiring the Portfolio to rely on judgments that may be somewhat subjective in measuring value, which could vary materially from the amount that the Portfolio could realize upon disposition. Difficulty in selling illiquid investments may result in a loss or may be costly to the Portfolio. An illiquid investment is any investment that the Manager or Subadvisors reasonably expects cannot be sold or disposed of in current market conditions in seven calendar days or less without the sale or disposition significantly changing the market value of the investment. The liquidity classification of each investment will be made using information obtained after reasonable inquiry and taking into account, among other things, relevant market, trading and investment-specific considerations in accordance with the Liquidity Program. Illiquid investments are often fair valued in accordance with the Portfolio's procedures described above. The liquidity of the Portfolio's investments was determined as of December 31, 2022, and can change at any time. Illiquid investments as of December 31, 2022, are shown in the Portfolio of Investments.
Notes to Financial Statements (continued)
(B) Income Taxes. The Portfolio's policy is to comply with the requirements of the Internal Revenue Code of 1986, as amended (the “Internal Revenue Code”), applicable to regulated investment companies and to distribute all of its taxable income to the shareholders of the Portfolio within the allowable time limits.
The Manager evaluates the Portfolio’s tax positions to determine if the tax positions taken meet the minimum recognition threshold in connection with accounting for uncertainties in income tax positions taken or expected to be taken for the purposes of measuring and recognizing tax liabilities in the financial statements. Recognition of tax benefits of an uncertain tax position is permitted only to the extent the position is “more likely than not” to be sustained assuming examination by taxing authorities. The Manager analyzed the Portfolio's tax positions taken on federal, state and local income tax returns for all open tax years (for up to three tax years) and has concluded that no provisions for federal, state and local income tax are required in the Portfolio's financial statements. The Portfolio's federal, state and local income tax and federal excise tax returns for tax years for which the applicable statutes of limitations have not expired are subject to examination by the Internal Revenue Service and state and local departments of revenue.
(C) Foreign Taxes. The Portfolio may be subject to foreign taxes on income and other transaction-based taxes imposed by certain countries in which it invests. A portion of the taxes on gains on investments or currency purchases/repatriation may be reclaimable. The Portfolio will accrue such taxes and reclaims as applicable, based upon its current interpretation of tax rules and regulations that exist in the markets in which it invests.
The Portfolio may be subject to taxation on realized capital gains, repatriation proceeds and other transaction-based taxes imposed by certain countries in which it invests. The Portfolio will accrue such taxes as applicable based upon its current interpretation of tax rules and regulations that exist in the market in which it invests. Capital gains taxes relating to positions still held are reflected as a liability in the Statement of Assets and Liabilities, as well as an adjustment to the Portfolio's net unrealized appreciation (depreciation). Taxes related to capital gains realized, if any, are reflected as part of net realized gain (loss) in the Statement of Operations. Changes in tax liabilities related to capital gains taxes on unrealized investment gains, if any, are reflected as part of the change in net unrealized appreciation (depreciation) on investments in the Statement of Operations. Transaction-based charges are generally assessed as a percentage of the transaction amount.
(D) Dividends and Distributions to Shareholders. Dividends and distributions are recorded on the ex-dividend date. The Portfolio intends to declare and pay dividends from net investment income, if any, at least quarterly and distributions from net realized capital and currency gains, if any, at least annually. All dividends and distributions are reinvested at NAV in the same class of shares of the Portfolio. Dividends and distributions to shareholders are determined in accordance with federal income tax regulations and may differ from determinations using GAAP.
(E) Security Transactions and Investment Income. The Portfolio records security transactions on the trade date. Realized gains and losses on security transactions are determined using the identified cost method. Dividend income is recognized on the ex-dividend date, net of any foreign tax withheld at the source, and interest income is accrued as earned using the effective interest rate method and includes any realized gains and losses from repayments of principal on mortgage-backed securities. Distributions received from real estate investment trusts may be classified as dividends, capital gains and/or return of capital. Discounts and premiums on securities purchased for the Portfolio are accreted and amortized, respectively, on the effective interest rate method.
Investment income and realized and unrealized gains and losses on investments of the Portfolio are allocated pro rata to the separate classes of shares based upon their relative net assets on the date the income is earned or realized and unrealized gains and losses are incurred.
The Portfolio may place a debt security on non-accrual status and reduce related interest income by ceasing current accruals and writing off all or a portion of any interest receivables when the collection of all or a portion of such interest has become doubtful. A debt security is removed from non-accrual status when the issuer resumes interest payments or when collectability of interest is reasonably assured.
(F) Expenses. Expenses of the Fund are allocated to the individual Portfolios in proportion to the net assets of the respective Portfolios when the expenses are incurred, except where direct allocations of expenses can be made. Expenses (other than fees incurred under the distribution and service plans, further discussed in Note 3(B), which are charged directly to the Service Class shares) are allocated to separate classes of shares pro rata based upon their relative net assets on the date the expenses are incurred. The expenses borne by the Portfolio, including those of related parties to the Portfolio, are shown in the Statement of Operations.
Additionally, the Portfolio may invest in mutual funds, which are subject to management fees and other fees that may cause the costs of investing in mutual funds to be greater than the costs of owning the underlying securities directly. These indirect expenses of mutual funds are not included in the amounts shown as expenses in the Statement of Operations or in the expense ratios included in the Financial Highlights.
(G) Use of Estimates. In preparing financial statements in conformity with GAAP, the Manager makes estimates and assumptions that affect the reported amounts and disclosures in the financial statements. Actual results could differ from those estimates and assumptions.
(H) Futures Contracts. A futures contract is an agreement to purchase or sell a specified quantity of an underlying instrument at a specified future date and price, or to make or receive a cash payment based on the value of a financial instrument (e.g., foreign currency, interest rate, security or securities index). The Portfolio is subject to risks such as market price risk, leverage risk, liquidity risk, counterparty risk, operational risk, legal risk and/or interest rate risk in the normal course of investing in these contracts. Upon entering into a futures contract, the
| 38 | MainStay VP Income Builder Portfolio |
Portfolio is required to pledge to the broker or futures commission merchant an amount of cash and/or U.S. government securities equal to a certain percentage of the collateral amount, known as the “initial margin.” During the period the futures contract is open, changes in the value of the contract are recognized as unrealized appreciation or depreciation by marking to market such contract on a daily basis to reflect the market value of the contract at the end of each day’s trading. The Portfolio agrees to receive from or pay to the broker or futures commission merchant an amount of cash equal to the daily fluctuation in the value of the contract. Such receipts or payments are known as “variation margin.” When the futures contract is closed, the Portfolio records a realized gain or loss equal to the difference between the proceeds from (or cost of) the closing transaction and the Portfolio's basis in the contract.
The use of futures contracts involves, to varying degrees, elements of market risk in excess of the amount recognized in the Statement of Assets and Liabilities. The contract or notional amounts and variation margin reflect the extent of the Portfolio's involvement in open futures positions. There are several risks associated with the use of futures contracts as hedging techniques. There can be no assurance that a liquid market will exist at the time when the Portfolio seeks to close out a futures contract. If no liquid market exists, the Portfolio would remain obligated to meet margin requirements until the position is closed. Futures contracts may involve a small initial investment relative to the risk assumed, which could result in losses greater than if the Portfolio did not invest in futures contracts. Futures contracts may be more volatile than direct investments in the instrument underlying the futures and may not correlate to the underlying instrument, causing a given hedge not to achieve its objectives. The Portfolio's activities in futures contracts have minimal counterparty risk as they are conducted through regulated exchanges that guarantee the futures against default by the counterparty. In the event of a bankruptcy or insolvency of a futures commission merchant that holds margin on behalf of the Portfolio, the Portfolio may not be entitled to the return of the entire margin owed to the Portfolio, potentially resulting in a loss. The Portfolio may invest in futures contracts to seek enhanced returns or to reduce the risk of loss by hedging certain of its holdings. The Portfolio's investment in futures contracts and other derivatives may increase the volatility of the Portfolio's NAVs and may result in a loss to the Portfolio. Open futures contracts as of December 31, 2022, are shown in the Portfolio of Investments.
(I) Loan Assignments, Participations and Commitments. The Portfolio may invest in loan assignments and participations ("loans"). Commitments are agreements to make money available to a borrower in a specified amount, at a specified rate and within a specified time. The Portfolio records an investment when the borrower withdraws money on a commitment or when a funded loan is purchased (trade date) and records interest as earned. These loans pay interest at rates that are periodically reset by reference to a base lending rate plus a spread. These base lending rates are generally the prime rate offered by a designated U.S. bank, the London Interbank Offered Rate ("LIBOR") or an alternative reference rate.
The loans in which the Portfolio may invest are generally readily marketable, but may be subject to some restrictions on resale. For example, the Portfolio may be contractually obligated to receive approval from the agent bank and/or borrower prior to the sale of these investments. If the Portfolio purchases an assignment from a lender, the Portfolio will generally have direct contractual rights against the borrower in favor of the lender. If the Portfolio purchases a participation interest either from a lender or a participant, the Portfolio typically will have established a direct contractual relationship with the seller of the participation interest, but not with the borrower. Consequently, the Portfolio is subject to the credit risk of the lender or participant who sold the participation interest to the Portfolio, in addition to the usual credit risk of the borrower. In the event that the borrower, selling participant or intermediate participants become insolvent or enter into bankruptcy, the Portfolio may incur certain costs and delays in realizing payment, or may suffer a loss of principal and/or interest.
Unfunded commitments represent the remaining obligation of the Portfolio to the borrower. At any point in time, up to the maturity date of the issue, the borrower may demand the unfunded portion. Unfunded amounts, if any, are marked to market and any unrealized gains or losses are recorded in the Statement of Assets and Liabilities. As of December 31, 2022, the Portfolio did not hold any unfunded commitments.
(J) Foreign Currency Forward Contracts. The Portfolio may enter into foreign currency forward contracts, which are agreements to buy or sell foreign currencies on a specified future date at a specified rate. The Portfolio is subject to foreign currency exchange rate risk in the normal course of investing in these transactions. During the period the forward contract is open, changes in the value of the contract are recognized as unrealized appreciation or depreciation by marking to market such contract on a daily basis to reflect the market value of the contract at the end of each day’s trading. Cash movement occurs on the settlement date. When the forward contract is closed, the Portfolio records a realized gain or loss equal to the difference between the proceeds from (or cost of) the closing transaction and the Portfolio's basis in the contract. The Portfolio may purchase and sell foreign currency forward contracts for purposes of seeking to enhance portfolio returns and manage portfolio risk more efficiently. Foreign currency forward contracts may also be used to gain exposure to a particular currency or to hedge against the risk of loss due to changing currency exchange rates. Foreign currency forward contracts to purchase or sell a foreign currency may also be used in anticipation of future purchases or sales of securities denominated in foreign currency, even if the specific investments have not yet been selected.
The use of foreign currency forward contracts involves, to varying degrees, elements of risk in excess of the amount recognized in the Statement of Assets and Liabilities, including counterparty risk, market risk, leverage risk, operational risk, legal risk and liquidity risk. Counterparty risk is heightened for these instruments because foreign currency forward contracts are not exchange-traded and therefore no clearinghouse or exchange stands ready to meet the obligations under such contracts. Thus, the Portfolio faces the risk that its counterparties
Notes to Financial Statements (continued)
under such contracts may not perform their obligations. Market risk is the risk that the value of a foreign currency forward contract will depreciate due to unfavorable changes in exchange rates. Liquidity risk arises because the secondary market for foreign currency forward contracts may have less liquidity relative to markets for other securities and financial instruments. Liquidity risk also can arise when forward currency contracts create margin or settlement payment obligations for the Fund. Leverage risk is the risk that a foreign currency forward contract can magnify the Portfolio's gains and losses. Operational risk refers to risk related to potential operational issues (including documentation issues, settlement issues, systems failures, inadequate controls and human error), and legal risk refers to insufficient documentation, insufficient capacity or authority of the counterparty, or legality or enforceability of a foreign currency forward contract. Risks also arise from the possible movements in the foreign exchange rates underlying these instruments. While the Portfolio may enter into forward contracts to reduce currency exchange risks, changes in currency exchange rates may result in poorer overall performance for the Portfolio than if it had not engaged in such transactions. Exchange rate movements can be large, depending on the currency, and can last for extended periods of time, affecting the value of the Portfolio's assets. Moreover, there may be an imperfect correlation between the Portfolio's holdings of securities denominated in a particular currency and forward contracts entered into by the Portfolio. Such imperfect correlation may prevent the Portfolio from achieving the intended hedge or expose the Portfolio to the risk of currency exchange loss. The unrealized appreciation (depreciation) on forward contracts also reflects the Portfolio's exposure at the valuation date to credit loss in the event of a counterparty’s failure to perform its obligations. Open foreign currency forward contracts as of December 31, 2022, are shown in the Portfolio of Investments.
(K) Foreign Currency Transactions. The Portfolio's books and records are maintained in U.S. dollars. Prices of securities denominated in foreign currency amounts are translated into U.S. dollars at the mean between the buying and selling rates last quoted by any major U.S. bank at the following dates:
(i) market value of investment securities, other assets and liabilities— at the valuation date; and
(ii) purchases and sales of investment securities, income and expenses—at the date of such transactions.
The assets and liabilities that are denominated in foreign currency amounts are presented at the exchange rates and market values at the close of the period. The realized and unrealized changes in net assets arising from fluctuations in exchange rates and market prices of securities are not separately presented.
Net realized gain (loss) on foreign currency transactions represents net currency gains or losses realized as a result of differences between the amounts of securities sale proceeds or purchase cost, dividends, interest and withholding taxes as recorded on the Portfolio's books, and the U.S. dollar equivalent amount actually received or paid. Net currency gains or
losses from valuing such foreign currency denominated assets and liabilities, other than investments at valuation date exchange rates, are reflected in unrealized foreign exchange gains or losses.
(L) Securities Lending. In order to realize additional income, the Portfolio may engage in securities lending, subject to the limitations set forth in the 1940 Act and relevant guidance by the staff of the Securities and Exchange Commission (“SEC”). If the Portfolio engages in securities lending, the Portfolio will lend through its custodian, JPMorgan Chase Bank, N.A., ("JPMorgan"), acting as securities lending agent on behalf of the Portfolio. Under the current arrangement, JPMorgan will manage the Portfolio's collateral in accordance with the securities lending agency agreement between the Portfolio and JPMorgan, and indemnify the Portfolio against counterparty risk. The loans will be collateralized by cash (which may be invested in a money market fund) and/or non-cash collateral (which may include U.S. Treasury securities and/or U.S. government agency securities issued or guaranteed by the United States government or its agencies or instrumentalities) at least equal at all times to the market value of the securities loaned. Non-cash collateral held at year end is segregated and cannot be transferred by the Portfolio. The Portfolio bears the risk of delay in recovery of, or loss of rights in, the securities loaned. The Portfolio may also record a realized gain or loss on securities deemed sold due to a borrower’s inability to return securities on loan. The Portfolio bears the risk of any loss on investment of cash collateral. The Portfolio will receive compensation for lending its securities in the form of fees or it will retain a portion of interest earned on the investment of any cash collateral. The Portfolio will also continue to receive interest and dividends on the securities loaned and any gain or loss in the market price of the securities loaned that may occur during the term of the loan will be for the account of the Portfolio. Income earned from securities lending activities, if any, is reflected in the Statement of Operations. Securities on loan as of December 31, 2022, are shown in the Portfolio of Investments.
(M) Dollar Rolls. The Portfolio may enter into dollar roll transactions in which it sells mortgage-backed securities ("MBS") from its portfolio to a counterparty from whom it simultaneously agrees to buy a similar security on a delayed delivery basis. The Portfolio generally transfers MBS where the MBS are "to be announced," therefore, the Portfolio accounts for these transactions as purchases and sales.
When accounted for as purchase and sales, the securities sold in connection with the dollar rolls are removed from the portfolio and a realized gain or loss is recognized. The securities the Portfolio has agreed to acquire are included at market value in the Portfolio of Investments and liabilities for such purchase commitments are included as payables for investments purchased. During the roll period, the Portfolio foregoes principal and interest paid on the securities. The Portfolio is compensated by the difference between the current sales price and the forward price for the future as well as by the earnings on the cash proceeds of the initial sale. Dollar rolls may be renewed without physical delivery of the securities subject to the contract. Dollar roll transactions involve certain risks, including the risk that the securities returned to the Portfolio at the
| 40 | MainStay VP Income Builder Portfolio |
end of the roll period, while substantially similar, could be inferior to what was initially sold to the counterparty.
(N) Securities Risk. The ability of issuers of debt securities held by the Portfolio to meet their obligations may be affected by, among other things, economic or political developments in a specific country, industry or region. Debt securities are also subject to the risks associated with changes in interest rates.
The Portfolio may invest in high-yield debt securities (sometimes called “junk bonds”), which are generally considered speculative because they present a greater risk of loss, including default, than higher quality debt securities. These securities pay investors a premium—a higher interest rate or yield than investment grade debt securities—because of the increased risk of loss. These securities can also be subject to greater price volatility. In times of unusual or adverse market, economic or political conditions, these securities may experience higher than normal default rates.
The Portfolio may invest in foreign securities, which carry certain risks that are in addition to the usual risks inherent in domestic securities. These risks include those resulting from currency fluctuations, future adverse political or economic developments and possible imposition of currency exchange blockages or other foreign governmental laws or restrictions. These risks are likely to be greater in emerging markets than in developed markets. The ability of issuers of securities held by the Portfolio to meet their obligations may be affected by, among other things, economic or political developments in a specific country, industry or region.
The Portfolio may invest in loans which are usually rated below investment grade and are generally considered speculative because they present a greater risk of loss, including default, than higher rated debt securities. These investments pay investors a higher interest rate than investment grade debt securities because of the increased risk of loss. Although certain loans are collateralized, there is no guarantee that the value of the collateral will be sufficient to repay the loan. In a recession or serious credit event, the value of these investments could decline significantly. As a result, the Portfolio’s NAVs could go down and you could lose money.
In addition, loans generally are subject to extended settlement periods that may be longer than seven days. As a result, the Portfolio may be adversely affected by selling other investments at an unfavorable time and/or under unfavorable conditions or engaging in borrowing transactions, such as borrowing against its credit facility, to raise cash to meet redemption obligations or pursue other investment opportunities.
In certain circumstances, loans may not be deemed to be securities. As a result, the Portfolio may not have the protection of anti-fraud provisions of the federal securities laws. In such cases, the Portfolio generally must rely on the contractual provisions in the loan agreement and common-law fraud protections under applicable state law.
(O) Counterparty Credit Risk. In order to better define its contractual rights and to secure rights that will help the Portfolio mitigate its counterparty risk, the Portfolio may enter into an International Swaps and Derivatives Association, Inc. Master Agreement (“ISDA Master Agreement”) or similar agreement with its counterparties. An ISDA Master Agreement is a bilateral agreement between the Portfolio and a counterparty that governs certain OTC derivatives and typically contains collateral posting terms and netting provisions. Under an ISDA Master Agreement, the Portfolio may, under certain circumstances, offset with the counterparty certain derivative financial instruments’ payables and/ or receivables with collateral held and/or posted and create one single net payment. The provisions of the ISDA Master Agreement typically permit a single net payment in the event of default including the bankruptcy or insolvency of the counterparty. Bankruptcy or insolvency laws of a particular jurisdiction may restrict or prohibit the right of offset in bankruptcy, insolvency or other events. In addition, certain ISDA Master Agreements may contain provisions for early termination of OTC derivative transactions in the event the net assets of the Portfolio decline below specific levels or if the Portfolio fails to meet the terms of its ISDA Master Agreements. The result would cause the Portfolio to accelerate payment of any net liability owed to the counterparty.
For financial reporting purposes, the Portfolio does not offset derivative assets and derivative liabilities that are subject to netting arrangements, if any, in the Statement of Assets and Liabilities.
(P) LIBOR Replacement Risk. The Portfolio may invest in certain debt securities, derivatives or other financial instruments that utilize LIBOR, as a “benchmark” or “reference rate” for various interest rate calculations. As of January 1, 2022, the United Kingdom Financial Conduct Authority, which regulates LIBOR, ceased its active encouragement of banks to provide the quotations needed to sustain most LIBOR rates due to the absence of an active market for interbank unsecured lending and other reasons. However, the United Kingdom Financial Conduct Authority, the LIBOR administrator and other regulators announced that the most widely used tenors of U.S. dollar LIBOR will continue until mid-2023. As a result, it is anticipated that the remaining LIBOR settings will be discontinued or will no longer be sufficiently robust to be representative of its underlying market around that time. Various financial industry groups will plan for that transition and certain regulators and industry groups have taken actions to establish alternative reference rates (e.g., the Secured Overnight Financing Rate, which measures the cost of overnight borrowings through repurchase agreement transactions collateralized with U.S. Treasury securities and is intended to replace U.S. dollar LIBOR with certain adjustments). However, there are challenges to converting certain contracts and transactions to a new benchmark and neither the full effects of the transition process nor its ultimate outcome is known.
The elimination of LIBOR or changes to other reference rates or any other changes or reforms to the determination or supervision of reference rates could have an adverse impact on the market for, or value of, any securities or payments linked to those reference rates, which may
Notes to Financial Statements (continued)
adversely affect the Portfolio's performance and/or net asset value. Uncertainty and risk also remain regarding the willingness and ability of issuers and lenders to include enhanced provisions in new and existing contracts or instruments. Consequently, the transition away from LIBOR to other reference rates may lead to increased volatility and illiquidity in markets that are tied to LIBOR, fluctuations in values of LIBOR-related investments or investments in issuers that utilize LIBOR, increased difficulty in borrowing or refinancing and diminished effectiveness of hedging strategies, adversely affecting the Portfolio's performance. Furthermore, the risks associated with the expected discontinuation of LIBOR and transition may be exacerbated if the work necessary to effect an orderly transition to an alternative reference rate is not completed in a timely manner. While the transition away from LIBOR has already begun with no material adverse effect to the Portfolio's performance, the transition is expected to last through mid-2023 for some LIBOR tenors. The usefulness of LIBOR as a benchmark could deteriorate anytime during this transition period.
(Q) Indemnifications. Under the Fund’s organizational documents, its officers and trustees are indemnified against certain liabilities that may arise out of performance of their duties to the Fund. Additionally, in the normal course of business, the Portfolio enters into contracts with third-party service providers that contain a variety of representations and warranties and that may provide general indemnifications. The Portfolio's maximum exposure under these arrangements is unknown, as this would involve future claims that may be made against the Portfolio that have not yet occurred. The Manager believes that the risk of loss in connection with these potential indemnification obligations is remote. However, there can be no assurance that material liabilities related to such obligations will not arise in the future, which could adversely impact the Portfolio.
(R) Quantitative Disclosure of Derivative Holdings. The following tables show additional disclosures related to the Portfolio's derivative and hedging activities, including how such activities are accounted for and their effect on the Portfolio's financial positions, performance and cash flows.
The Portfolio entered into Treasury futures contracts in order to hedge against anticipated changes in interest rates that might otherwise have an adverse effect upon the value of the Portfolio’s securities. The Portfolio also entered into domestic and foreign equity index futures contracts to increase the equity sensitivity to the Portfolio.
The Portfolio entered into foreign currency forward contracts to gain exposure to a particular currency or to hedge against the risk of loss due to changing currency exchange rates. These derivatives are not accounted for as hedging instruments.
Fair value of derivative instruments as of December 31, 2022:
| Asset Derivatives | Foreign
Exchange
Contracts
Risk | Equity
Contracts
Risk | Interest
Rate
Contracts
Risk | Total |
| Futures Contracts - Net Assets—Net unrealized appreciation on futures contracts (a) | $ — | $2,484,211 | $28,872 | $2,513,083 |
| Forward Contracts - Unrealized appreciation on foreign currency forward contracts | 1,105,504 | — | — | 1,105,504 |
| Total Fair Value | $1,105,504 | $2,484,211 | $28,872 | $3,618,587 |
| (a) | Includes cumulative appreciation (depreciation) of futures contracts as reported in the Portfolio of Investments. Only current day’s variation margin is reported within the Statement of Assets and Liabilities. |
| Liability Derivatives | Foreign
Exchange
Contracts
Risk | Equity
Contracts
Risk | Interest
Rate
Contracts
Risk | Total |
| Futures Contracts - Net Assets—Net unrealized depreciation on futures contracts (a) | $ — | $(2,596,449) | $(242,020) | $(2,838,469) |
| Forward Contracts - Unrealized depreciation on foreign currency forward contracts | (429,434) | — | — | (429,434) |
| Total Fair Value | $(429,434) | $(2,596,449) | $(242,020) | $(3,267,903) |
| (a) | Includes cumulative appreciation (depreciation) of futures contracts as reported in the Portfolio of Investments. Only current day’s variation margin is reported within the Statement of Assets and Liabilities. |
| 42 | MainStay VP Income Builder Portfolio |
The effect of derivative instruments on the Statement of Operations for the year ended December 31, 2022:
| Net Realized Gain (Loss) from: | Foreign
Exchange
Contracts
Risk | Equity
Contracts
Risk | Interest
Rate
Contracts
Risk | Total |
| Futures Contracts | $ — | $(13,490,809) | $(12,427,278) | $(25,918,087) |
| Forward Contracts | (7,725,775) | — | — | (7,725,775) |
| Total Net Realized Gain (Loss) | $(7,725,775) | $(13,490,809) | $(12,427,278) | $(33,643,862) |
| Net Change in Unrealized Appreciation (Depreciation) | Foreign
Exchange
Contracts
Risk | Equity
Contracts
Risk | Interest
Rate
Contracts
Risk | Total |
| Futures Contracts | $ — | $(2,879,181) | $(150,543) | $(3,029,724) |
| Forward Contracts | 2,120,085 | — | — | 2,120,085 |
| Total Net Change in Unrealized Appreciation (Depreciation) | $2,120,085 | $(2,879,181) | $(150,543) | $ (909,639) |
| Average Notional Amount | Total |
| Futures Contracts Long | $185,496,536 |
| Futures Contracts Short | $ (22,219,096) |
| Forward Contracts Long | $ 46,494,105 |
| Forward Contracts Short (a) | $ (30,444,347) |
| (a) | Positions were open for nine months during the reporting period. |
Note 3–Fees and Related Party Transactions
(A) Manager and Subadvisors. New York Life Investments, a registered investment adviser and an indirect, wholly-owned subsidiary of New York Life, serves as the Portfolio's Manager, pursuant to an Amended and Restated Management Agreement ("Management Agreement"). The Manager provides offices, conducts clerical, recordkeeping and bookkeeping services and keeps most of the financial and accounting records required to be maintained by the Portfolio. Except for the portion of salaries and expenses that are the responsibility of the Portfolio, the Manager pays the salaries and expenses of all personnel affiliated with the Portfolio and certain operational expenses of the Portfolio. During a portion of the year ended December 31, 2022, the Portfolio reimbursed New York Life Investments in an amount equal to the portion of the compensation of the Chief Compliance Officer attributable to the Portfolio. Pursuant to the terms of an Amended and Restated Subadvisory
Agreement with New York Life Investments, MacKay Shields LLC ("MacKay Shields" or "Subadvisor"), a registered investment adviser and an indirect, wholly-owned subsidiary of New York Life, serves as a Subadvisor to the Portfolio and is responsible for the day-to-day portfolio management of the fixed-income portion of the Portfolio. Pursuant to the terms of an Amended and Restated Subadvisory Agreement with New York Life Investments, Epoch Investment Partners, Inc. (“Epoch” or “Subadvisor” and, together with MacKay Shields, the “Subadvisors”), a registered investment adviser, also serves as a Subadvisor to the Portfolio and is responsible for the day-to-day portfolio management of the equity portion of the Portfolio. Asset allocation decisions for the Portfolio are made by a committee chaired by New York Life Investments in collaboration with MacKay. New York Life Investments pays for the services of the Subadvisors.
Pursuant to the Management Agreement, the Fund pays the Manager, on behalf of the Portfolio, a monthly fee for the services performed and the facilities furnished at an annual rate of the Portfolio's average daily net assets as follows: 0.57% up to $1 billion; and 0.55% in excess of $1 billion. During the year ended December 31, 2022, the effective management fee rate was 0.57%.
During the year ended December 31, 2022, New York Life Investments earned fees from the Portfolio in the amount of $3,380,033 and paid MacKay Shields and Epoch fees of $795,392 and $894,624, respectively.
JPMorgan provides sub-administration and sub-accounting services to the Portfolio pursuant to an agreement with New York Life Investments. These services include calculating the daily NAVs of the Portfolio, maintaining the general ledger and sub-ledger accounts for the calculation of the Portfolio's NAVs, and assisting New York Life Investments in conducting various aspects of the Portfolio's administrative operations. For providing these services to the Portfolio, JPMorgan is compensated by New York Life Investments.
Pursuant to an agreement between the Fund and New York Life Investments, New York Life Investments is responsible for providing or procuring certain regulatory reporting services for the Portfolio. The Portfolio will reimburse New York Life Investments for the actual costs incurred by New York Life Investments in connection with providing or procuring these services for the Portfolio.
(B) Distribution and Service Fees. The Fund, on behalf of the Portfolio, has entered into a distribution agreement with NYLIFE Distributors LLC (the “Distributor”), an affiliate of New York Life Investments. The Portfolio has adopted a distribution plan (the “Plan”) in accordance with the provisions of Rule 12b-1 under the 1940 Act. Under the Plan, the Distributor has agreed to provide, through its affiliates or independent third parties, various distribution-related, shareholder and administrative support services to the Service Class shareholders. For its services, the Distributor is entitled to a combined distribution and service
Notes to Financial Statements (continued)
fee accrued daily and paid monthly at an annual rate of 0.25% of the average daily net assets attributable to the Service Class shares of the Portfolio.
Note 4-Federal Income Tax
As of December 31, 2022, the cost and unrealized appreciation (depreciation) of the Portfolio’s investment portfolio, including applicable derivative contracts and other financial instruments, as determined on a federal income tax basis, were as follows:
| | Federal Tax
Cost | Gross
Unrealized
Appreciation | Gross
Unrealized
(Depreciation) | Net
Unrealized
Appreciation/
(Depreciation) |
| Investments in Securities | $548,823,462 | $27,433,971 | $(46,392,858) | $(18,958,887) |
As of December 31, 2022, the components of accumulated gain (loss) on a tax basis were as follows:
Ordinary
Income | Accumulated
Capital
and Other
Gain (Loss) | Other
Temporary
Differences | Unrealized
Appreciation
(Depreciation) | Total
Accumulated
Gain (Loss) |
| $— | $(32,058,181) | $50,110 | $(19,876,388) | $(51,884,459) |
The difference between book-basis and tax-basis unrealized appreciation (depreciation) is primarily due to wash sale adjustments, mark to market on foreign currency forward contracts, mark to market of futures contracts, partnerships and cumulative bond amortization adjustments. The other temporary differences are primarily due to deferred dividends from real estate investment trusts.
As of December 31, 2022, for federal income tax purposes, capital loss carryforwards of $32,058,181, as shown in the table below, were available to the extent provided by the regulations to offset future realized gains of the Portfolio. Accordingly, no capital gains distributions are expected to be paid to shareholders until net gains have been realized in excess of such amounts.
Capital Loss
Available Through | Short-Term
Capital Loss
Amounts (000’s) | Long-Term
Capital Loss
Amounts (000’s) |
| Unlimited | $19,142 | $12,916 |
During the years ended December 31, 2022 and December 31, 2021, the tax character of distributions paid as reflected in the Statements of Changes in Net Assets was as follows:
| | 2022 | 2021 |
| Distributions paid from: | | |
| Ordinary Income | $16,814,864 | $24,793,365 |
| Long-Term Capital Gains | 46,631,898 | 9,281,987 |
| Return of Capital | 6,502,112 | — |
| Total | $69,948,874 | $34,075,352 |
Note 5–Custodian
JPMorgan is the custodian of cash and securities held by the Portfolio. Custodial fees are charged to the Portfolio based on the Portfolio's net assets and/or the market value of securities held by the Portfolio and the number of certain transactions incurred by the Portfolio.
Note 6–Line of Credit
The Portfolio and certain other funds managed by New York Life Investments maintain a line of credit with a syndicate of banks in order to secure a source of funds for temporary purposes to meet unanticipated or excessive redemption requests.
Effective July 26, 2022, under the credit agreement (the “Credit Agreement”), the aggregate commitment amount is $600,000,000 with an additional uncommitted amount of $100,000,000. The commitment fee is an annual rate of 0.15% of the average commitment amount payable quarterly, regardless of usage, to JPMorgan, who serves as the agent to the syndicate. The commitment fee is allocated among the Portfolio and certain other funds managed by New York Life Investments based upon their respective net assets and other factors. Interest on any revolving credit loan is charged based upon the Federal Funds Rate, Daily Simple Secured Overnight Financing Rate ("SOFR") + 0.10%, or the Overnight Bank Funding Rate, whichever is higher. The Credit Agreement expires on July 25, 2023, although the Portfolio, certain other funds managed by New York Life Investments and the syndicate of banks may renew the Credit Agreement for an additional year on the same or different terms or enter into a credit agreement with a different syndicate of banks. Prior to July 26, 2022, the aggregate commitment amount and the commitment fee were the same as those under the current Credit Agreement. During the year ended December 31, 2022, there were no borrowings made or outstanding with respect to the Portfolio under the Credit Agreement.
Note 7–Interfund Lending Program
Pursuant to an exemptive order issued by the SEC, the Portfolio, along with certain other funds managed by New York Life Investments, may participate in an interfund lending program. The interfund lending program provides an alternative credit facility that permits the Portfolio and certain other funds managed by New York Life Investments to lend or borrow money for temporary purposes directly to or from one another, subject to the conditions of the exemptive order. During the year ended December 31, 2022, there were no interfund loans made or outstanding with respect to the Portfolio.
Note 8–Purchases and Sales of Securities (in 000’s)
During the year ended December 31, 2022, purchases and sales of U.S. government securities were $118,320 and $116,696, respectively. Purchases and sales of securities, other than U.S. government securities and short-term securities, were $217,172 and $275,101, respectively.
| 44 | MainStay VP Income Builder Portfolio |
Note 9–Capital Share Transactions
Transactions in capital shares for the years ended December 31, 2022 and December 31, 2021, were as follows:
| Initial Class | Shares | Amount |
| Year ended December 31, 2022: | | |
| Shares sold | 219,018 | $ 3,428,090 |
| Shares issued to shareholders in reinvestment of distributions | 1,559,961 | 20,418,326 |
| Shares redeemed | (1,110,037) | (17,170,397) |
| Net increase (decrease) | 668,942 | $ 6,676,019 |
| Year ended December 31, 2021: | | |
| Shares sold | 295,188 | $ 5,323,316 |
| Shares issued to shareholders in reinvestment of distributions | 563,265 | 10,040,167 |
| Shares redeemed | (1,036,303) | (18,698,533) |
| Net increase (decrease) | (177,850) | $ (3,335,050) |
| |
| Service Class | Shares | Amount |
| Year ended December 31, 2022: | | |
| Shares sold | 2,643,387 | $ 41,387,437 |
| Shares issued to shareholders in reinvestment of distributions | 3,830,832 | 49,530,548 |
| Shares redeemed | (5,696,211) | (88,491,316) |
| Net increase (decrease) | 778,008 | $ 2,426,669 |
| Year ended December 31, 2021: | | |
| Shares sold | 3,492,661 | $ 62,449,130 |
| Shares issued to shareholders in reinvestment of distributions | 1,361,246 | 24,035,185 |
| Shares redeemed | (4,598,203) | (82,061,073) |
| Net increase (decrease) | 255,704 | $ 4,423,242 |
Note 10–Other Matters
As of the date of this report, interest rates in the United States and many parts of the world, including certain European countries, are ascending from historically low levels. Thus, the Portfolio currently faces a heightened level of risk associated with rising interest rates. This could be driven by a variety of factors, including but not limited to central bank monetary policies, changing inflation or real growth rates, general economic conditions, increasing bond issuances or reduced market demand for low yielding investments.
An outbreak of COVID-19, first detected in December 2019, has developed into a global pandemic and has resulted in travel restrictions, closure of international borders, certain businesses and securities markets, restrictions on securities trading activities, prolonged quarantines, supply chain disruptions, and lower consumer demand, as well as general concern and uncertainty. In 2022, many countries lifted some or all restrictions related to COVID-19. However, the continued impact of COVID-19 and related variants is uncertain and could further adversely affect the global economy, national economies, individual issuers and capital markets in unforeseeable ways and result in a
substantial and extended economic downturn. Developments that disrupt global economies and financial markets, such as COVID-19, may magnify factors that affect the Portfolio's performance.
Note 11–Subsequent Events
In connection with the preparation of the financial statements of the Portfolio as of and for the year ended December 31, 2022, events and transactions subsequent to December 31, 2022, through the date the financial statements were issued have been evaluated by the Manager for possible adjustment and/or disclosure. No subsequent events requiring financial statement adjustment or disclosure have been identified.
Report of Independent Registered Public Accounting Firm
To the Board of Trustees of MainStay VP Funds Trust and Shareholders of
MainStay VP Income Builder Portfolio
Opinion on the Financial Statements
We have audited the accompanying statement of assets and liabilities, including the portfolio of investments, of MainStay VP Income Builder Portfolio (one of the portfolios constituting MainStay VP Funds Trust, referred to hereafter as the “Portfolio”) as of December 31, 2022, the related statement of operations for the year ended December 31, 2022, the statements of changes in net assets for each of the two years in the period ended December 31, 2022, including the related notes, and the financial highlights for each of the five years in the period ended December 31, 2022 (collectively referred to as the “financial statements”). In our opinion, the financial statements present fairly, in all material respects, the financial position of the Portfolio as of December 31, 2022, the results of its operations for the year then ended, the changes in its net assets for each of the two years in the period ended December 31, 2022 and the financial highlights for each of the five years in the period ended December 31, 2022 in conformity with accounting principles generally accepted in the United States of America.
Basis for Opinion
These financial statements are the responsibility of the Portfolio’s management. Our responsibility is to express an opinion on the Portfolio’s financial statements based on our audits. We are a public accounting firm registered with the Public Company Accounting Oversight Board (United States) (PCAOB) and are required to be independent with respect to the Portfolio in accordance with the U.S. federal securities laws and the applicable rules and regulations of the Securities and Exchange Commission and the PCAOB.
We conducted our audits of these financial statements in accordance with the standards of the PCAOB. Those standards require that we plan and perform the audit to obtain reasonable assurance about whether the financial statements are free of material misstatement, whether due to error or fraud.
Our audits included performing procedures to assess the risks of material misstatement of the financial statements, whether due to error or fraud, and performing procedures that respond to those risks. Such procedures included examining, on a test basis, evidence regarding the amounts and disclosures in the financial statements. Our audits also included evaluating the accounting principles used and significant estimates made by management, as well as evaluating the overall presentation of the financial statements. Our procedures included confirmation of securities owned as of December 31, 2022 by correspondence with the custodian, transfer agents, agent banks and brokers; when replies were not received from brokers, we performed other auditing procedures. We believe that our audits provide a reasonable basis for our opinion.
/s/PricewaterhouseCoopers LLP
New York, New York
February 24, 2023
We have served as the auditor of one or more investment companies in the MainStay group of funds since 1984.
| 46 | MainStay VP Income Builder Portfolio |
Board Consideration and Approval of Management Agreement and Subadvisory Agreements (Unaudited)
The continuation of the Management Agreement with respect to the MainStay VP Income Builder Portfolio (“Portfolio”) and New York Life Investment Management LLC (“New York Life Investments”) and the Subadvisory Agreements between New York Life Investments and each of MacKay Shields LLC (“MacKay”) and Epoch Investment Partners, Inc. (“Epoch”) with respect to the Portfolio (together, “Advisory Agreements”) is subject to annual review and approval by the Board of Trustees of MainStay VP Funds Trust (“Board” of the “Trust”) in accordance with Section 15 of the Investment Company Act of 1940, as amended (“1940 Act”). At its December 6–7, 2022 meeting, the Board, which is comprised solely of Trustees who are not an “interested person” (as such term is defined in the 1940 Act) of the Trust (“Independent Trustees”), unanimously approved the continuation of each of the Advisory Agreements for a one-year period.
In reaching the decision to approve the continuation of each of the Advisory Agreements, the Board considered information and materials furnished by New York Life Investments, MacKay and Epoch in connection with an annual contract review process undertaken by the Board that took place at meetings of the Board and its Contracts Committee during October 2022 through December 2022, including information and materials furnished by New York Life Investments, MacKay and Epoch in response to requests prepared on behalf of the Board, and in consultation with the Board, by independent legal counsel to the Independent Trustees, which encompassed a variety of topics, including those summarized below. Information and materials requested by and furnished to the Board for consideration in connection with the contract review process included, among other items, reports on the Portfolio and “peer funds” prepared by Institutional Shareholder Services Inc. (“ISS”), an independent third-party service provider engaged by the Board to report objectively on the Portfolio’s investment performance, management fee and total expenses. The Board also considered information on the fees charged to other investment advisory clients of New York Life Investments, MacKay and/or Epoch that follow investment strategies similar to those of the Portfolio, if any, and, when applicable, the rationale for any differences in the Portfolio’s management and subadvisory fees and the fees charged to those other investment advisory clients. In addition, the Board considered information regarding the legal standards and fiduciary obligations applicable to its consideration of the continuation of each of the Advisory Agreements. The contract review process, including the structure and format for information and materials provided to the Board, has been developed in consultation with the Board. The Independent Trustees also met in executive sessions with their independent legal counsel and, for portions thereof, with senior management of New York Life Investments.
The Board’s deliberations with respect to the continuation of each of the Advisory Agreements reflect a year-long process, and the Board also took into account information furnished to the Board and its Committees throughout the year, as deemed relevant and appropriate by the Trustees, including, among other items, reports on investment performance of the Portfolio and investment-related matters for the Portfolio as well as presentations from New York Life Investments and, generally annually,
MacKay and Epoch personnel. In addition, the Board took into account other information received from New York Life Investments throughout the year, including, among other items, periodic reports on legal and compliance matters, risk management, portfolio turnover, brokerage commissions and non-advisory services provided to the Portfolio by New York Life Investments, as deemed relevant and appropriate by the Trustees.
In addition to information provided to the Board throughout the year, the Board received information in connection with its June 2022 meeting provided specifically in response to requests prepared on behalf of the Board, and in consultation with the Board, by independent legal counsel to the Independent Trustees regarding the Portfolio’s distribution arrangements. In addition, the Board received information regarding the Portfolio’s asset levels, share purchase and redemption activity and the payment of Rule 12b-1 and/or other fees by applicable share classes of the Portfolio, among other information.
In considering the continuation of each of the Advisory Agreements, the Trustees reviewed and evaluated the information and factors they believed to reasonably be necessary and appropriate in light of legal advice furnished to them by independent legal counsel to the Independent Trustees and through the exercise of their own business judgment. Although individual Trustees may have weighed certain factors or information differently and the Board did not consider any single factor or information controlling in reaching its decision, the factors considered by the Board are summarized in more detail below and include, among other factors: (i) the nature, extent and quality of the services provided to the Portfolio by New York Life Investments, MacKay and Epoch; (ii) the qualifications of the portfolio managers of the Portfolio and the historical investment performance of the Portfolio, New York Life Investments, MacKay and Epoch; (iii) the costs of the services provided, and profits realized, by New York Life Investments, MacKay and Epoch with respect to their relationships with the Portfolio; (iv) the extent to which economies of scale have been realized or may be realized if the Portfolio grows and the extent to which any economies of scale have been shared, have benefited or may benefit the Portfolio’s shareholders; and (v) the reasonableness of the Portfolio’s management and subadvisory fees and total ordinary operating expenses. Although the Board recognized that comparisons between the Portfolio’s fees and expenses and those of other funds are imprecise given different terms of agreements, variations in fund strategies and other factors, the Board considered the reasonableness of the Portfolio’s management fee and total ordinary operating expenses as compared to the peer funds identified by ISS. Throughout their considerations, the Trustees acknowledged the commitment of New York Life Investments and its affiliates to serve the MainStay Group of Funds, as well as their capacity, experience, resources, financial stability and reputations. The Trustees also acknowledged the entrepreneurial and other risks assumed by New York Life Investments in sponsoring and managing the Portfolio. With respect to the Subadvisory Agreements, the Board took into account New York Life Investments’ recommendation to approve the continuation of the Subadvisory Agreements.
Board Consideration and Approval of Management Agreement and Subadvisory Agreements (Unaudited) (continued)
The Trustees noted that, throughout the year, the Trustees are afforded an opportunity to ask questions of, and request additional information or materials from, New York Life Investments, MacKay and Epoch. The Board’s decision with respect to each of the Advisory Agreements may have also been based, in part, on the Board’s knowledge of New York Life Investments, MacKay and Epoch resulting from, among other things, the Board’s consideration of each of the Advisory Agreements in prior years, the advisory agreements for other funds in the MainStay Group of Funds, the Board’s review throughout the year of the performance and operations of other funds in the MainStay Group of Funds and each Trustee’s business judgment and industry experience. In addition to considering the above-referenced factors, the Board observed that in the marketplace, notably under variable life insurance policies and variable annuity contracts for which the Portfolio serves as an investment option, there are a range of investment options available to investors and that the Portfolio’s shareholders, having had the opportunity to consider other investment options, have chosen to invest in the Portfolio.
The factors that figured prominently in the Board’s decision to approve the continuation of each of the Advisory Agreements during its December 6–7, 2022 meeting are summarized in more detail below.
Nature, Extent and Quality of Services Provided by New York Life Investments, MacKay and Epoch
The Board examined the nature, extent and quality of the services that New York Life Investments provides to the Portfolio. The Board evaluated New York Life Investments’ experience and capabilities in serving as manager of the Portfolio and considered that the Portfolio operates in a “manager-of-managers” structure. The Board also considered New York Life Investments’ responsibilities and services provided pursuant to this structure, including overseeing the services provided by MacKay and Epoch, evaluating the performance of MacKay and Epoch, making recommendations to the Board as to whether the Subadvisory Agreements should be renewed, modified or terminated and periodically reporting to the Board regarding the results of New York Life Investments’ evaluation and monitoring functions. The Board noted that New York Life Investments manages other mutual funds, serves a variety of other investment advisory clients, including other pooled investment vehicles, and has experience overseeing mutual fund service providers, including subadvisors. The Board considered the experience of senior personnel at New York Life Investments providing management and administrative and other non-advisory services to the Portfolio. The Board observed that New York Life Investments devotes significant resources and time to providing management and administrative and other non-advisory services to the Portfolio, including New York Life Investments’ oversight and due diligence reviews of MacKay and Epoch and ongoing analysis of, and interactions with, MacKay and Epoch with respect to, among other things, the Portfolio’s investment performance and risks as well as MacKay’s and Epoch’s investment capabilities and subadvisory services with respect to the Portfolio.
The Board also considered the range of services that New York Life Investments provides to the Portfolio under the terms of the Management Agreement, including: (i) fund accounting and ongoing supervisory services provided by New York Life Investments’ Fund Administration and Accounting Group; (ii) investment supervisory and analytical services provided by New York Life Investments’ Investment Consulting Group; (iii) compliance services provided by the Trust’s Chief Compliance Officer as well as New York Life Investments’ compliance department, including supervision and implementation of the Portfolio’s compliance program; (iv) legal services provided by New York Life Investments’ Office of the General Counsel; and (v) risk management monitoring and analysis by compliance and investment personnel. In addition, the Board considered New York Life Investments’ willingness to invest in personnel and other resources, such as cyber security, information security and business continuity planning, designed to benefit the Portfolio and noted that New York Life Investments is responsible for compensating the Trust’s officers, except for a portion of the salary of the Trust’s Chief Compliance Officer. The Board recognized that New York Life Investments provides certain other non-advisory services to the Portfolio and has provided an increasingly broad array of non-advisory services to the MainStay Group of Funds as a result of regulatory and other developments, including in connection with the implementation of the MainStay Group of Funds’ derivatives risk management program and policies and procedures adopted pursuant to Rule 18f-4 under the 1940 Act.
The Board also examined the range, and the nature, extent and quality, of the investment advisory services that MacKay and Epoch provide to the Portfolio and considered the terms of each of the Advisory Agreements. The Board evaluated MacKay’s and Epoch’s experience and performance in serving as subadvisors to the Portfolio and advising other portfolios and MacKay’s and Epoch’s track record and experience in providing investment advisory services, the experience of investment advisory, senior management and administrative personnel at MacKay and Epoch. The Board considered New York Life Investments’, MacKay’s and Epoch’s overall resources, legal and compliance environment, capabilities, reputation, financial condition and history. In addition to information provided in connection with quarterly meetings with the Trust’s Chief Compliance Officer, the Board considered information regarding the compliance policies and procedures of New York Life Investments, MacKay and Epoch and acknowledged their commitment to further developing and strengthening compliance programs relating to the Portfolio. The Board also considered MacKay’s and Epoch’s ability to recruit and retain qualified investment professionals and willingness to invest in personnel and other resources to service and support the Portfolio. In this regard, the Board considered the qualifications and experience of the Portfolio’s portfolio managers, the number of accounts managed by the portfolio managers and the method for compensating the portfolio managers.
In addition, the Board considered information provided by New York Life Investments, MacKay and Epoch regarding the operations of their respective business continuity plans in response to the COVID-19 pandemic and the continued remote work environment.
| 48 | MainStay VP Income Builder Portfolio |
Based on these considerations, among others, the Board concluded that the Portfolio would likely continue to benefit from the nature, extent and quality of these services.
Investment Performance
In evaluating the Portfolio’s investment performance, the Board considered investment performance results over various periods in light of the Portfolio’s investment objective, strategies and risks. The Board considered investment reports on, and analysis of, the Portfolio’s performance provided to the Board throughout the year. These reports include, among other items, information on the Portfolio’s gross and net returns, the Portfolio’s investment performance compared to a relevant investment category and the Portfolio’s benchmarks, the Portfolio’s risk-adjusted investment performance and the Portfolio’s investment performance as compared to peer funds, as appropriate, as well as portfolio attribution information and commentary on the effect of market conditions. The Board also considered information provided by ISS showing the investment performance of the Portfolio as compared to peer funds. In addition, the Board reviewed the methodology used by ISS to construct the group of peer funds for comparative purposes.
The Board also took into account its discussions with senior management at New York Life Investments concerning the Portfolio’s investment performance over various periods as well as discussions between the Portfolio’s portfolio management team and the members of the Board’s Investment Committee, which generally occur on an annual basis. In addition, the Board considered any specific actions that New York Life Investments, MacKay or Epoch had taken, or had agreed to take, to seek to enhance Portfolio investment performance and the results of those actions.
Based on these considerations, among others, the Board concluded that its review of the Portfolio’s investment performance and related information supported a determination to approve the continuation of each of the Advisory Agreements.
Costs of the Services Provided, and Profits and Other Benefits Realized, by New York Life Investments, MacKay and Epoch
The Board considered the costs of the services provided under each of the Advisory Agreements. The Board also considered the profits realized by New York Life Investments and its affiliates, including MacKay, and Epoch due to their relationships with the Portfolio as well as by New York Life Investments and its affiliates, including MacKay, due to their relationships with the MainStay Group of Funds. Because MacKay is an affiliate of New York Life Investments whose subadvisory fee is paid by New York Life Investments, not the Portfolio, the Board considered cost and profitability information for New York Life Investments and MacKay in the aggregate. The Board considered information from New York Life Investments that Epoch’s subadvisory fee reflected an arm’s-length negotiation and that this fee is paid by New York Life Investments, not the Portfolio, and the relevance of Epoch’s profitability was considered by the
Trustees in that context. On this basis, the Board primarily considered the costs and profitability for New York Life Investments and its affiliates with respect to the Portfolio.
In addition, the Board acknowledged the difficulty in obtaining reliable comparative data about mutual fund managers’ profitability because such information generally is not publicly available and may be impacted by numerous factors, including the structure of a fund manager’s organization, the types of funds it manages, the methodology used to allocate certain fixed costs to specific funds and the manager’s capital structure and costs of capital.
In evaluating the costs of the services provided by New York Life Investments, MacKay and Epoch and profits realized by New York Life Investments and its affiliates, including MacKay, and Epoch, the Board considered, among other factors, New York Life Investments’ and its affiliates’, including MacKay’s, and Epoch’s continuing investments in, or willingness to invest in, personnel and other resources to support and further enhance the management of the Portfolio, and that New York Life Investments is responsible for paying the subadvisory fees for the Portfolio. The Board also considered the financial resources of New York Life Investments, MacKay and Epoch and acknowledged that New York Life Investments, MacKay and Epoch must be in a position to recruit and retain experienced professional personnel and to maintain a strong financial position for New York Life Investments, MacKay and Epoch to continue to provide high-quality services to the Portfolio. The Board recognized that the Portfolio benefits from the allocation of certain fixed costs among the funds in the MainStay Group of Funds, among other expected benefits resulting from its relationship with New York Life Investments.
The Board considered information regarding New York Life Investments’ methodology for calculating profitability and allocating costs provided by New York Life Investments in connection with the fund profitability analysis presented to the Board. The Board noted it had previously engaged an independent consultant to review the methods used to allocate costs among the funds in the MainStay Group of Funds. The Board also noted that the independent consultant had concluded that New York Life Investments’ methods for allocating costs and procedures for estimating overall profitability of the relationship with the funds in the MainStay Group of Funds are reasonable and that New York Life Investments continued to use the same method of calculating profit and allocating costs since the independent consultant’s review. The Board recognized the difficulty in calculating and evaluating a manager’s profitability with respect to the Portfolio and considered that other profitability methodologies may also be reasonable.
The Board also considered certain fall-out benefits that may be realized by New York Life Investments and its affiliates due to their relationships with the Portfolio, including reputational and other indirect benefits. The Board recognized, for example, the benefits to MacKay and Epoch from legally permitted “soft-dollar” arrangements by which brokers provide research and other services to MacKay and Epoch in exchange for commissions paid by the Portfolio with respect to trades in the Portfolio’s
Board Consideration and Approval of Management Agreement and Subadvisory Agreements (Unaudited) (continued)
portfolio securities. In this regard, the Board also requested and considered information from New York Life Investments concerning other material business relationships between Epoch and its affiliates and New York Life Investments and its affiliates and considered the existence of a strategic partnership between New York Life Investments and Epoch that relates to certain current and future products and represents a potential conflict of interest associated with New York Life Investments’ recommendation to approve the Subadvisory Agreement. In addition, the Board considered its review of the management agreement for a money market fund advised by New York Life Investments and an affiliated subadvisor that serves as an investment option for the Portfolio, including the potential rationale for and costs associated with investments in this money market fund by the Portfolio, if any, and considered information from New York Life Investments that the nature and type of specific investment advisory services provided to this money market fund are distinct from, or in addition to, the investment advisory services provided to the Portfolio. In addition, the Board considered the potential dividend received tax deduction for insurance company affiliates of New York Life Investments from the Portfolio’s securities lending activity.
The Board noted that the Portfolio serves as an investment option primarily under variable contracts issued by affiliates of New York Life Investments that would receive fees under those contracts. The Board observed that, in addition to fees earned by New York Life Investments under the Management Agreement for managing the Portfolio, New York Life Investments’ affiliates also earn revenues from serving the Portfolio in various other capacities, including as the Portfolio’s distributor. The Board considered information about these other revenues and their impact on the profitability of the relationship with the Portfolio to New York Life Investments and its affiliates. The Board noted that, although it assessed the overall profitability of the relationship with the Portfolio to New York Life Investments and its affiliates as part of the contract review process, when considering the reasonableness of the fee paid to New York Life Investments under the Management Agreement, the Board considered the profitability of New York Life Investments’ relationship with the Portfolio on a pre-tax basis and without regard to distribution expenses incurred by New York Life Investments from its own resources.
After evaluating the information deemed relevant by the Trustees, the Board concluded that any profits realized by New York Life Investments and its affiliates, including MacKay, due to their relationships with the Portfolio were not excessive and other benefits that may accrue to New York Life Investments and its affiliates, including MacKay, are reasonable and benefits that may accrue to Epoch and its affiliates are consistent with those expected for a subadvisor to a mutual fund. With respect to Epoch, the Board considered that any profits realized by Epoch due to its relationship with the Portfolio are the result of arm’s-length negotiations between New York Life Investments and Epoch, acknowledging that any such profits are based on the subadvisory fee paid to Epoch by New York Life Investments, not the Portfolio.
Management and Subadvisory Fees and Total Ordinary Operating Expenses
The Board evaluated the reasonableness of the fee paid under each of the Advisory Agreements and the Portfolio’s total ordinary operating expenses. The Board primarily considered the reasonableness of the management fee paid by the Portfolio to New York Life Investments because the subadvisory fees paid to MacKay and Epoch are paid by New York Life Investments, not the Portfolio. The Board also considered the reasonableness of the subadvisory fees paid by New York Life Investments and the amount of the management fee retained by New York Life Investments.
In assessing the reasonableness of the Portfolio’s fees and expenses, the Board primarily considered comparative data provided by ISS on the fees and expenses charged by similar mutual funds managed by other investment advisers. The Board reviewed the methodology used by ISS to construct the group of peer funds for comparative purposes. In addition, the Board considered information provided by New York Life Investments, MacKay and Epoch on fees charged to other investment advisory clients, including institutional separate accounts and/or other funds that follow investment strategies similar to those of the Portfolio, if any. The Board considered the contractual management fee schedules of the Portfolio as compared to those of such other investment advisory clients, taking into account the rationale for any differences in fee schedules. The Board also took into account information provided by New York Life Investments about the more extensive scope of services provided to registered investment companies, such as the Portfolio, as compared with other investment advisory clients. Additionally, the Board considered the impact of contractual breakpoints on the Portfolio’s net management fee and expenses. The Board also considered that in proposing fees for the Portfolio, New York Life Investments considers the competitive marketplace for mutual funds.
Based on the factors outlined above, among other considerations, the Board concluded that the Portfolio’s management fee and total ordinary operating expenses are within a range that is competitive and support a conclusion that these fees and expenses are reasonable.
Economies of Scale
The Board considered information regarding economies of scale, including whether economies of scale may exist for the Portfolio and whether the Portfolio’s expense structure permits any economies of scale to be appropriately shared with the Portfolio’s beneficial shareholders. The Board also considered a report from New York Life Investments, previously prepared at the request of the Board, that addressed economies of scale, including with respect to the mutual fund business generally, and the various ways in which the benefits of economies of scale may be shared with the funds in the MainStay Group of Funds. Although the Board recognized the difficulty of determining economies of scale with precision, the Board acknowledged that economies of scale may be shared with the Portfolio in a number of ways, including, for example, through the imposition of fee breakpoints, initially setting
| 50 | MainStay VP Income Builder Portfolio |
management fee rates at scale or making additional investments to enhance the services provided to the Portfolio. The Board reviewed information from New York Life Investments showing how the Portfolio’s management fee schedule compared to fee schedules of other funds and accounts managed by New York Life Investments. The Board also reviewed information from ISS showing how the Portfolio’s management fee schedule compared with fees paid for similar services by peer funds at varying asset levels.
Based on this information, the Board concluded that economies of scale are appropriately reflected for the benefit of the Portfolio’s beneficial shareholders through the Portfolio’s expense structure and other methods to share benefits from economies of scale.
Conclusion
On the basis of the information and factors summarized above, among other information and factors deemed relevant by the Trustees, and the evaluation thereof, the Board unanimously voted to approve the continuation of each of the Advisory Agreements.
Proxy Voting Policies and Procedures and Proxy Voting Record
The Portfolio is required to file with the SEC its proxy voting record for the 12-month period ending June 30 on Form N-PX. A description of the policies and procedures that are used to vote proxies relating to portfolio securities of the Portfolio is available free of charge upon request by calling 800-598-2019 or visiting the SEC's website at www.sec.gov. The most recent Form N-PX or proxy voting record is available free of charge upon request by calling 800-598-2019; visiting https://www.newyorklifeinvestments.com/investment-products/vp; or visiting the SEC’s website at www.sec.gov.
Shareholder Reports and Quarterly Portfolio Disclosure
The Portfolio is required to file its complete schedule of portfolio holdings with the SEC 60 days after its first and third fiscal quarter on Form N-PORT. The Portfolio's holdings report is available free of charge upon request by calling 800-598-2019 or by visiting the SEC’s website at www.sec.gov.
Board of Trustees and Officers (Unaudited)
The Trustees and officers of the Portfolio are listed below. The Board oversees the MainStay Group of Funds (which consists of MainStay Funds and MainStay Funds Trust), MainStay VP Funds Trust, MainStay MacKay DefinedTerm Municipal Opportunities Fund, MainStay CBRE Global Infrastructure Megatrends Fund, the Manager and the Subadvisors, and elects the officers of the Portfolios who are responsible for the day-to-day operations of the Portfolio. Information pertaining to the Trustees and officers is set forth below. Each Trustee serves until his or her successor
is elected and qualified or until his or her resignation, death or removal. Under the Board’s retirement policy, unless an exception is made, a Trustee must tender his or her resignation by the end of the calendar year during which he or she reaches the age of 75. The business address of each Trustee and officer listed below is 51 Madison Avenue, New York, New York 10010. None of the Trustees are “interested persons” (as defined by the 1940 Act and rules adopted by the SEC thereunder) of the Portfolio (“Independent Trustees”).
| | Name and
Year of Birth | Term of Office,
Position(s) Held and
Length of Service | Principal Occupation(s)
During Past Five Years | Number of
Portfolios in
Fund Complex
Overseen by
Trustee | Other Directorships
Held by Trustee |
| | | | | | |
| | David H. Chow
1957 | MainStay VP Funds Trust: Trustee since January 2016, Advisory Board Member (June 2015 to December 2015) | Founder and CEO, DanCourt Management, LLC since 1999 | 78 | MainStay Funds: Trustee since January 2016, Advisory Board Member (June 2015 to December 2015) (12 Funds);
MainStay Funds Trust: Trustee since January 2016, Advisory Board Member (June 2015 to December 2015) (33 Funds);
MainStay MacKay DefinedTerm Municipal Opportunities Fund: Trustee since January 2016, Advisory Board Member (June 2015 to December 2015);
MainStay CBRE Global Infrastructure Megatrends Fund: Trustee since June 2021;VanEck Vectors Group of Exchange-Traded Funds: Independent Chairman of the Board of Trustees since 2008 and Trustee since 2006 (57 portfolios); and Berea College of Kentucky: Trustee since 2009, Chair of the Committee since 2018 |
| | Susan B. Kerley
1951 | MainStay VP Funds Trust: Chairman since 2017 and Trustee since 2007* | President, Strategic Management Advisors LLC since 1990 | 78 | MainStay Funds: Chairman since 2017 and Trustee since 2007 (12 Funds); MainStay Funds Trust: Chairman since 2017 and Trustee since 1990 (33 Funds)**;
MainStay MacKay DefinedTerm Municipal Opportunities Fund: Chairman since 2017 and Trustee since 2011; MainStay CBRE Global Infrastructure Megatrends Fund: Trustee since June 2021; and Legg Mason Partners Funds: Trustee since 1991 (45 portfolios) |
| | Alan R. Latshaw
1951 | MainStay VP Funds Trust: Trustee since 2007* | Retired; Partner, Ernst & Young LLP (2002 to 2003); Partner, Arthur Andersen LLP (1989 to 2002); Consultant to the MainStay Funds Audit and Compliance Committee (2004 to 2006) | 78 | MainStay Funds: Trustee since 2006 (12 Funds);
MainStay Funds Trust: Trustee since 2007 (33 Funds)**;
MainStay MacKay DefinedTerm Municipal Opportunities Fund: Trustee since 2011; and
MainStay CBRE Global Infrastructure Megatrends Fund: Trustee since June 2021 |
Board of Trustees and Officers (Unaudited) (continued)
| | Name and
Year of Birth | Term of Office,
Position(s) Held and
Length of Service | Principal Occupation(s)
During Past Five Years | Number of
Portfolios in
Fund Complex
Overseen by
Trustee | Other Directorships
Held by Trustee |
| | | | | | |
| | Karen Hammond
1956 | MainStay VP Funds Trust: Trustee since December 2021, Advisory Board Member (June 2021 to December 2021)
| Retired, Managing Director, Devonshire Investors (2007 to 2013); Senior Vice President, Fidelity Management & Research Co. (2005 to 2007); Senior Vice President and Corporate Treasurer, FMR Corp. (2003 to 2005); Chief Operating Officer, Fidelity Investments Japan (2001 to 2003) | 78 | MainStay Funds: Trustee since December 2021, Advisory Board Member (June 2021 to December 2021) (12 Funds);
MainStay Funds Trust: Trustee since December 2021, Advisory Board Member (June 2021 to December 2021) (33 Funds);
MainStay MacKay DefinedTerm Municipal Opportunities Fund: Trustee since December 2021, Advisory Board Member (June 2021 to December 2021);
MainStay CBRE Global Infrastructure Megatrends Fund: Trustee since December 2021, Advisory Board Member (June 2021 to December 2021);
Two Harbors Investment Corp.: Director since 2018; Rhode Island State Investment Commission: Member since 2017; and Blue Cross Blue Shield of Rhode Island: Director since 2019
|
| | Jacques P. Perold
1958 | MainStay VP Funds Trust: Trustee since January 2016, Advisory Board Member (June 2015 to December 2015) | Founder and Chief Executive Officer, CapShift Advisors LLC (since 2018); President, Fidelity Management & Research Company (2009 to 2014); President and Chief Investment Officer, Geode Capital Management, LLC (2001 to 2009) | 78 | MainStay Funds: Trustee since January 2016, Advisory Board Member (June 2015 to December 2015) (12 Funds);
MainStay Funds Trust: Trustee since January 2016, Advisory Board Member (June 2015 to December 2015) (33 Funds); MainStay MacKay DefinedTerm Municipal Opportunities Fund: Trustee since January 2016, Advisory Board Member (June 2015 to December 2015);
MainStay CBRE Global Infrastructure Megatrends Fund: Trustee since June 2021; Allstate Corporation: Director since 2015;
Partners in Health: Trustee since 2019; and
MSCI Inc.: Director since 2017 |
| | Richard S. Trutanic
1952 | MainStay VP Funds Trust: Trustee since 2007* | Chairman and Chief Executive Officer, Somerset & Company (financial advisory firm) since 2004; Managing Director, The Carlyle Group (private investment firm) (2002 to 2004); Senior Managing Director, Partner and Board Member, Groupe Arnault S.A. (private investment firm) (1999 to 2002)
| 78 | MainStay Funds: Trustee since 1994 (12 Funds);
MainStay Funds Trust: Trustee since 2007 (33 Funds)**;
MainStay MacKay DefinedTerm Municipal Opportunities Fund: Trustee since 2011; and
MainStay CBRE Global Infrastructure Megatrends Fund: Trustee since June 2021 |
| * | Includes prior service as a Director of MainStay VP Series Fund, Inc., the predecessor to MainStay VP Funds Trust. |
| ** | Includes prior service as a Director/Trustee of certain predecessor entities to MainStay Funds Trust. |
| 54 | MainStay VP Income Builder Portfolio |
| | Name and
Year of Birth | Position(s) Held and
Length of Service | Principal Occupation(s)
During Past Five Years | |
| | | | | |
| | Kirk C. Lehneis
1974 | President, MainStay VP Funds Trust (since 2017) | Chief Operating Officer and Senior Managing Director (since 2016), New York Life Investment Management LLC and New York Life Investment Management Holdings LLC; Member of the Board of Managers (since 2017) and Senior Managing Director (since 2018), NYLIFE Distributors LLC; Chairman of the Board and Senior Managing Director, NYLIM Service Company LLC (since 2017); Trustee, President and Principal Executive Officer of IndexIQ Trust, IndexIQ ETF Trust and IndexIQ Active ETF Trust (since January 2018); President, MainStay CBRE Global Infrastructure Megatrends Fund (since 2021), MainStay MacKay DefinedTerm Municipal Opportunities Fund, MainStay Funds and MainStay Funds Trust (since 2017); Senior Managing Director, Global Product Development (from 2015-2016); Managing Director, Product Development (from 2010-2015), New York Life Investment Management LLC | |
| | Jack R. Benintende
1964 | Treasurer and Principal Financial and Accounting Officer, MainStay VP Funds Trust (since 2007)** | Managing Director, New York Life Investment Management LLC (since 2007); Treasurer and Principal Financial and Accounting Officer, MainStay CBRE Global Infrastructure Megatrends Fund (since 2021), MainStay MacKay DefinedTerm Municipal Opportunities Fund (since 2011), MainStay Funds Trust (since 2009) and MainStay Funds (since 2007); and Assistant Treasurer, New York Life Investment Management Holdings LLC (2008 to 2012) | |
| | J. Kevin Gao
1967 | Secretary and Chief Legal Officer, MainStay VP Funds Trust (since 2010)** | Managing Director and Associate General Counsel, New York Life Investment Management LLC (since 2010); Secretary and Chief Legal Officer, MainStay CBRE Global Infrastructure Megatrends Fund (since 2021), MainStay MacKay DefinedTerm Municipal Opportunities Fund (since 2011), MainStay Funds and MainStay Funds Trust (since 2010) | |
| | Scott T. Harrington
1959 | Vice President— Administration, MainStay VP Funds Trust (since 2005)** | Managing Director, New York Life Investment Management LLC (including predecessor advisory organizations) (since 2000); Member of the Board of Directors, New York Life Trust Company (since 2009); Vice President—Administration, MainStay CBRE Global Infrastructure Megatrends Fund (since 2021), MainStay MacKay DefinedTerm Municipal Opportunities Fund (since 2011), MainStay Funds Trust and MainStay Funds (since 2009) | |
| | Kevin M. Gleason
1967 | Vice President and Chief Compliance Officer, MainStay VP Funds Trust (since June 2022) | Vice President and Chief Compliance Officer, IndexIQ, IndexIQ ETF Trust and Index IQ Active ETF Trust (since June 2022); Vice President and Chief Compliance Officer, MainStay CBRE Global Infrastructure Megatrends Fund, MainStay MacKay DefinedTerm Municipal Opportunities Fund (since June 2022); MainStay Funds Trust and MainStay Funds (since June 2022); Senior Vice President, Voya Investment Management and Chief Compliance Officer, Voya Family of Funds (2012-2022) | |
| * | The officers listed above are considered to be “interested persons” of the MainStay Group of Funds, MainStay VP Funds Trust, MainStay CBRE Global Infrastructure Megatrends Fund and MainStay MacKay DefinedTerm Municipal Opportunities Fund within the meaning of the 1940 Act because of their affiliation with the MainStay Group of Funds, New York Life Insurance Company and/or its affiliates, including New York Life Investment Management LLC, NYLIM Service Company LLC, NYLIFE Securities LLC and/or NYLIFE Distributors LLC, as described in detail in the column captioned “Principal Occupation(s) During Past Five Years.” Officers are elected annually by the Board. |
| ** | Includes prior service as an Officer of MainStay VP Series Fund, Inc., the predecessor to MainStay VP Funds Trust. |
Officers of the Trust (Who are not Trustees)*
This page intentionally left blank.
This page intentionally left blank.
This page intentionally left blank.
MainStay VP Portfolios
MainStay VP offers a wide range of Portfolios. The full array of MainStay VP offerings is listed here, with information about the manager, subadvisors, legal counsel, and independent registered public accounting firm.
Equity
MainStay VP American Century Sustainable Equity Portfolio1
MainStay VP Candriam Emerging Markets Equity Portfolio
MainStay VP Epoch U.S. Equity Yield Portfolio
MainStay VP Fidelity Institutional AM® Utilities Portfolio†
MainStay VP MacKay International Equity Portfolio
MainStay VP Natural Resources Portfolio
MainStay VP S&P 500 Index Portfolio2
MainStay VP Small Cap Growth Portfolio
MainStay VP Wellington Growth Portfolio
MainStay VP Wellington Mid Cap Portfolio
MainStay VP Wellington Small Cap Portfolio
MainStay VP Wellington U.S. Equity Portfolio
MainStay VP Winslow Large Cap Growth Portfolio
Mixed Asset
MainStay VP Balanced Portfolio
MainStay VP Income Builder Portfolio
MainStay VP Janus Henderson Balanced Portfolio
MainStay VP MacKay Convertible Portfolio
Income
MainStay VP Bond Portfolio
MainStay VP Floating Rate Portfolio
MainStay VP Indexed Bond Portfolio
MainStay VP MacKay Government Portfolio
MainStay VP MacKay High Yield Corporate Bond Portfolio
MainStay VP MacKay Strategic Bond Portfolio
MainStay VP PIMCO Real Return Portfolio
Money Market
MainStay VP U.S. Government Money Market Portfolio
Alternative
MainStay VP CBRE Global Infrastructure Portfolio
MainStay VP IQ Hedge Multi-Strategy Portfolio
Asset Allocation
MainStay VP Conservative Allocation Portfolio
MainStay VP Equity Allocation Portfolio
MainStay VP Growth Allocation Portfolio
MainStay VP Moderate Allocation Portfolio
Manager
New York Life Investment Management LLC
New York, New York
Subadvisors
American Century Investment Management, Inc.
Kansas City, Missouri
Brown Advisory LLC
Baltimore, Maryland
Candriam*
Strassen, Luxembourg
CBRE Investment Management Listed Real Assets LLC
Radnor, Pennsylvania
Epoch Investment Partners, Inc.
New York, New York
FIAM LLC
Smithfield, Rhode Island
IndexIQ Advisors LLC*
New York, New York
Janus Henderson Investors US LLC
Denver, Colorado
MacKay Shields LLC*
New York, New York
Newton Investment Management North America, LLC
Boston, Massachusetts
NYL Investors LLC*
New York, New York
Pacific Investment Management Company LLC
Newport Beach, California
Segall Bryant & Hamill, LLC
Chicago, Illinois
Wellington Management Company LLP
Boston, Massachusetts
Winslow Capital Management, LLC
Minneapolis, Minnesota
Legal Counsel
Dechert LLP
Washington, District of Columbia
Independent Registered Public Accounting Firm
PricewaterhouseCoopers LLP
New York, New York
Distributor
NYLIFE Distributors LLC*
Jersey City, New Jersey
Custodian
JPMorgan Chase Bank, N.A.
New York, New York
Some Portfolios may not be available in all products.
† Fidelity Institutional AM is a registered trade mark of FMR LLC. Used with permission.
* An affiliate of New York Life Investment Management LLC.
| 1. | Prior to May 1, 2022, the Portfolio's name was MainStay VP T. Rowe Price Equity Income Portfolio. |
| 2. | Prior to May 1, 2022, the Portfolio's name was MainStay VP MacKay S&P 500 Index Portfolio. |
Not part of the Annual Report
2022 Annual Report
This report is for the general information of New York Life Variable Annuities and NYLIAC Variable Universal Life Insurance Products policyowners. It must be preceded or accompanied by the appropriate product(s) and funds prospectuses if it is given to anyone who is not an owner of a New York Life variable annuity policy or a NYLIAC Variable Universal Life Insurance Product. This report does not offer for sale or solicit orders to purchase securities.
The performance data quoted in this report represents past performance. Past performance is no guarantee of future results. Due to market volatility and other factors, current performance may be lower or higher than the figures shown. The most recent month-end performance summary for your variable annuity or variable life policy is available by calling 800-598-2019 and is updated periodically on newyorklife.com.
The New York Life Variable Annuities and NYLIAC Variable Universal Life Insurance Products are issued by New York Life Insurance and Annuity Corporation (a Delaware Corporation) and distributed by NYLIFE Distributors LLC (Member FINRA/SIPC).
New York Life Insurance Company
New York Life Insurance and Annuity
Corporation (NYLIAC) (A Delaware Corporation)
51 Madison Avenue, Room 551
New York, NY 10010
newyorklife.com
newyorklifeinvestments.com
NYLIFE Distributors LLC, 30 Hudson Street, Jersey City, NJ 07302
New York Life Investment Management LLC is the investment manager to the MainStay VP Funds Trust
©2023 by NYLIFE Distributors LLC. All rights reserved.
You may obtain copies of the Prospectus and the Statement of Additional Information free of charge, upon request, by calling toll-free 800-598-2019 or writing to New York Life Insurance and Annuity Corporation, 51 Madison Avenue, New York, NY 10010.
| Not FDIC Insured | No Bank Guarantee | May Lose Value |
(NYLIAC) NI522
MainStay VP MacKay Strategic Bond Portfolio
Message from the President and Annual Report
December 31, 2022
Sign up for e-delivery of your shareholder reports. For full details on e-delivery, including who can participate and what you can receive via e-delivery,
please log in to newyorklifeinvestments.com/accounts.
| Not FDIC/NCUA Insured | Not a Deposit | May Lose Value | No Bank Guarantee | Not Insured by Any Government Agency |
This page intentionally left blank
Message from the President
The 12-month reporting period ended December 31, 2022, proved exceptionally challenging for investors as both stock and bond markets suffered steep declines. A variety of economic and geopolitical forces drove the market’s losses, all centered around rising inflation and monetary efforts to rein it in.
Inflationary alarms began to sound well before the reporting period began. In late 2021, after nearly two years of accommodative policies designed to encourage economic growth in the face of the COVID-19 pandemic, the U.S. Federal Reserve (the “Fed”) warned of the increasing need to tighten monetary policy. Nevertheless, the pace and persistence of inflation in early 2022 caught most market participants—the Fed included—off guard. Russia’s invasion of Ukraine in February exacerbated global inflationary pressures while increasing investor uncertainty. Domestic supply shortages, international trade imbalances and rising inflation caused U.S. GDP (gross domestic product) to contract in the first and second quarters of the year, although employment and consumer spending proved resilient. Prices for petroleum surged to multi-year highs, while many key agricultural chemicals and industrial metals soared as well. Accelerating inflationary forces prompted the Fed to implement its most aggressive series of interest rate hikes since the 1980s, with a 0.25% increase in March followed by six further rate increases totaling 4.25%. International central banks generally followed suit and raised rates by varying degrees in efforts to curb local inflation, although most increases remained significantly more modest than those in the United States. Relatively high U.S. interest rates and an international risk averse sentiment pushed U.S. dollar values higher compared to most other currencies, with negative impacts on global prices for food, fuel and other key U.S.-dollar-denominated products.
The effects of these interrelated challenges were felt throughout U.S. and international financial markets. The S&P 500® Index, a widely regarded benchmark of market performance, declined by more than 18% during the reporting period. Although the energy sector generated strong gains, bolstered by elevated oil and gas prices, most other industry segments recorded losses. The more cyclical and growth-oriented sectors of consumer discretionary, information technology and real estate delivered the weakest returns, while the traditionally defensive and value-oriented
consumer staples, utilities and health care sectors outperformed. On average, international developed-country equity markets mildly outperformed their U.S. counterparts, while emerging markets lagged slightly. Fixed-income markets proved unusually volatile, with bond prices trending sharply lower as yields rose along with interest rates. Short-term yields rose faster than long-term yields, producing a yield curve inversion from July through the end of the reporting period as long-term rates remained below short-term rates. While floating-rate instruments, which feature variable interest rates that allow investors to benefit from a rising rate environment, provided a degree of insulation from inflation-driven trends, they were not immune to the market’s widespread declines.
Although, according to the most recent estimates, the annualized inflation rate in the United States has declined from a peak of 9.1% in July 2022 to 6.5% in December, the Fed remains focused on achieving more substantial and lasting reductions, aiming for a target rate of 2%. As a result, further rate hikes and additional market volatility are potential headwinds in the coming months. The question remains as to whether the Fed and other central banks will manage a so-called “soft landing,” curbing inflation while avoiding a persistent economic slowdown. If they prove successful, we believe that the increasingly attractive valuations we have observed in both equity and bond markets should eventually translate into sustainable improvements in the investment environment.
Whatever actions the Fed takes and however financial markets react, as a MainStay VP investor you can depend on us to continue managing our portfolios with the insight, expertise and level of service that have long defined New York Life Investments. Thank you for trusting us to help you meet your investment needs.
Sincerely,
Kirk C. Lehneis
President
The opinions expressed are as of the date of this report and are subject to change. There is no guarantee that any forecast made will come to pass. This material does not constitute investment advice and is not intended as an endorsement of any specific investment. Past performance is no guarantee of future results.
Not part of the Annual Report
Investors should refer to the Portfolio’s Summary Prospectus and/or Prospectus and consider the Portfolio’s investment objectives, strategies, risks, charges and expenses carefully before investing. The Summary Prospectus and/or Prospectus contain this and other information about the Portfolio. You may obtain copies of the Portfolio’s Summary Prospectus, Prospectus and Statement of Additional Information, which includes information about the MainStay VP Funds Trust's Trustees, free of charge, upon request, by calling toll-free 800-598-2019, by writing to New York Life Insurance and Annuity Corporation, 51 Madison Avenue, Room 251, New York, New York 10010 or by sending an email to MainStayShareholdersServices@nylim.com. These documents are also available at newyorklifeinvestments.com/investment-products/vp. Please read the Portfolio's Summary Prospectus and/or Prospectus carefully before investing. MainStay VP Funds Trust portfolios are separate account options which are purchased through a variable insurance or variable annuity contract.
Investment and Performance Comparison (Unaudited)
Performance data quoted represents past performance. Past performance is no guarantee of future results. Because of market volatility and other factors, current performance may be lower or higher than the figures shown. Investment return and principal value will fluctuate, and as a result, when shares are redeemed, they may be worth more or less than their original cost. The performance table and graph do not reflect any deduction of sales charges, mortality and expense charges, contract charges or administrative charges. Please refer to the Performance Summary appropriate for your policy. For performance information current to the most recent month-end, please call 800-598-2019 or visit www.newyorklife.com.
Performance figures may reflect certain fee waivers and/or expense limitations, without which total returns may have been different. For information on current fee waivers and/or expense limitations (if any), please refer to the Notes to Financial Statements.
| Average Annual Total Returns for the Year-Ended December 31, 2022 |
| Class | Inception
Date | One
Year | Five
Years | Ten
Years | Gross
Expense
Ratio1 |
| Initial Class Shares | 4/29/2011 | -7.24% | 1.20% | 2.17% | 0.62% |
| Service Class Shares | 4/29/2011 | -7.47 | 0.95 | 1.91 | 0.87 |
| 1. | The gross expense ratios presented reflect the Portfolio’s “Total Annual Portfolio Operating Expenses” from the most recent Prospectus and may differ from other expense ratios disclosed in this report. |
| Benchmark Performance* | One
Year | Five
Years | Ten
Years |
| Bloomberg U.S. Aggregate Bond Index1 | -13.01% | 0.02% | 1.06% |
| ICE BofA U.S. Dollar 3-Month Deposit Offered Rate Constant Maturity Index2 | 1.21 | 1.43 | 0.96 |
| Morningstar Nontraditional Bond Category Average3 | -6.38 | 0.69 | 1.21 |
| * | Returns for indices reflect no deductions for fees, expenses or taxes, except for foreign withholding taxes where applicable. Results assume reinvestment of all dividends and capital gains. An investment cannot be made directly in an index. |
| 1. | The Bloomberg U.S. Aggregate Bond Index is the Portfolio's primary benchmark. The Bloomberg U.S. Aggregate Bond Index is a broad-based benchmark that measures the investment grade, U.S. dollar-denominated, fixed-rate taxable bond market, including Treasuries, government-related and corporate securities, mortgage-backed securities (agency fixed-rate and hybrid adjustable-rate mortgage pass-throughs), asset-backed securities and commercial mortgage-backed securities. |
| 2. | The Portfolio has selected the ICE BofA U.S. Dollar 3-Month Deposit Offered Rate Constant Maturity Index as a secondary benchmark. The ICE BofA U.S. Dollar 3-Month Deposit Offered Rate Constant Maturity Index is unmanaged and tracks the performance of a synthetic asset paying a deposit offered rate to a stated maturity. The index is based on the assumed purchase at par of a synthetic instrument having exactly its stated maturity and with a coupon equal to that day’s fixing rate. That issue is assumed to be sold the following business day (priced at a yield equal to the current day fixing rate) and rolled into a new instrument. |
| 3. | The Portfolio has selected the Morningstar Nontraditional Bond Category Average as an additional benchmark. The Morningstar Nontraditional Bond Category Average contains funds that pursue strategies divergent in one or more ways from conventional practice in the broader bond-fund universe. Morningstar category averages are equal-weighted returns based on constituents of the category at the end of the period. |
Cost in Dollars of a $1,000 Investment in MainStay VP MacKay Strategic Bond Portfolio (Unaudited)
The example below is intended to describe the fees and expenses borne by shareholders during the six-month period from July 1, 2022 to December 31, 2022, and the impact of those costs on your investment.
Example
As a shareholder of the Portfolio you incur two types of costs: (1) transaction costs, including exchange fees and sales charges (loads) on purchases (as applicable), and (2) ongoing costs, including management fees, distribution and/or service (12b-1) fees and other Portfolio expenses (as applicable). This example is intended to help you understand your ongoing costs (in dollars) of investing in the Portfolio and to compare these costs with the ongoing costs of investing in other mutual funds. The example is based on an investment of $1,000 made at the beginning of the six-month period and held for the entire period from July 1, 2022 to December 31, 2022. Shares are only sold in connection with variable life and annuity contracts and the example does not reflect any contract level or transactional fees or expenses. If these costs had been included, your costs would have been higher.
This example illustrates your Portfolio’s ongoing costs in two ways:
Actual Expenses
The second and third data columns in the table below provide information about actual account values and actual expenses. You may use the information in these columns, together with the amount you invested, to estimate the expenses that you paid during the six months ended
December 31, 2022. Simply divide your account value by $1,000 (for example, an $8,600 account value divided by $1,000 = 8.6), then multiply the result by the number under the heading entitled “Expenses Paid During Period” to estimate the expenses you paid on your account during this period.
Hypothetical Example for Comparison Purposes
The fourth and fifth data columns in the table below provide information about hypothetical account values and hypothetical expenses based on the Portfolio’s actual expense ratio and an assumed rate of return of 5% per year before expenses, which is not the Portfolio’s actual return. The hypothetical account values and expenses may not be used to estimate the actual ending account balances or expenses you paid for the six-month period shown. You may use this information to compare the ongoing costs of investing in the Portfolio with the ongoing costs of investing in other mutual funds. To do so, compare this 5% hypothetical example with the 5% hypothetical examples that appear in the shareholder reports of the other mutual funds.
Please note that the expenses shown in the table are meant to highlight your ongoing costs only and do not reflect any transactional costs, such as exchange fees or sales charges (loads). Therefore, the fourth and fifth data columns of the table are useful in comparing ongoing costs only and will not help you determine the relative total costs of owning different funds. In addition, if these transactional costs were included, your costs would have been higher.
| Share Class | Beginning
Account
Value
7/1/22 | Ending Account
Value (Based
on Actual
Returns and
Expenses)
12/31/22 | Expenses
Paid
During
Period1 | Ending Account
Value (Based
on Hypothetical
5% Annualized
Return and
Actual Expenses)
12/31/22 | Expenses
Paid
During
Period1 | Net Expense
Ratio
During
Period2, 3 |
| Initial Class Shares | $1,000.00 | $1,008.20 | $3.09 | $1,022.13 | $3.11 | 0.61% |
| Service Class Shares | $1,000.00 | $1,006.90 | $4.35 | $1,020.87 | $4.38 | 0.86% |
| 1. | Expenses are equal to the Portfolio’s annualized expense ratio of each class multiplied by the average account value over the period, divided by 365 and multiplied by 184 (to reflect the six-month period). The table above represents the actual expenses incurred during the six-month period. In addition to the fees and expenses which the Portfolio bears directly, it also indirectly bears a pro rata share of the fees and expenses of the underlying funds in which it invests. Such indirect expenses are not included in the above-reported expense figures. |
| 2. | Expenses are equal to the Portfolio's annualized expense ratio to reflect the six-month period. |
| 3. | Expenses are inclusive of dividends and interest on investments sold short. |
| 6 | MainStay VP MacKay Strategic Bond Portfolio |
Portfolio Composition as of December 31, 2022 (Unaudited)
See Portfolio of Investments beginning on page 10 for specific holdings within these categories. The Portfolio's holdings are subject to change.
Top Ten Holdings and/or Issuers Held as of December 31, 2022 (excluding short-term investments) (Unaudited)
| 1. | GNMA, (zero coupon)-3.50%, due 8/20/49–2/20/52 |
| 2. | U.S. Treasury Notes, 4.00%-4.375%, due 10/31/24–11/15/32 |
| 3. | UMBS, 30 Year, 4.00%-5.00%, due 6/1/52–11/1/52 |
| 4. | FNMA, (zero coupon)-10.139%, due 7/25/29–3/25/60 |
| 5. | Bank of America Corp., 2.087%-8.57%, due 11/15/24–4/22/32 |
| 6. | Goldman Sachs Group, Inc. (The), 1.948%-6.75%, due 5/15/26–10/1/37 |
| 7. | Citigroup, Inc., 2.52%-6.30%, due 5/15/24–11/3/32 |
| 8. | CF Hippolyta Issuer LLC, 1.69%-2.28%, due 7/15/60–3/15/61 |
| 9. | Hertz Vehicle Financing III LP, 2.52%-4.34%, due 12/27/27 |
| 10. | FHLMC, (zero coupon)-4.00%, due 12/25/48–8/15/56 |
Portfolio Management Discussion and Analysis (Unaudited)
Answers to the questions reflect the views of portfolio managers Shu-Yang Tan, CFA, Matt Jacob, Stephen R. Cianci, CFA, Neil Moriarty, III, and Lesya Paisley, CFA of MacKay Shields LLC, the Portfolio’s Subadvisor.
How did MainStay VP MacKay Strategic Bond Portfolio perform relative to its benchmarks and peers during the 12 months ended December 31, 2022?
For the 12 months ended December 31, 2022, MainStay VP MacKay Strategic Bond Portfolio returned −7.24% for Initial Class shares and −7.47% for Service Class shares. Over the same period, both share classes outperformed the −13.01% return of the Bloomberg U.S. Aggregate Bond Index, which is the Portfolio’s primary benchmark, and underperformed the 1.21% return of the ICE BofA U.S. Dollar 3-Month Deposit Offered Rate Constant Maturity Index, which is the Portfolio’s secondary benchmark. For the 12 months ended December 31, 2022, both share classes underperformed the −6.38% return of the Morningstar Nontraditional Bond Category Average.1
During the reporting period, were there any market events that materially impacted the Portfolio’s performance or liquidity?
From a fixed-income perspective, as most major central banks battled rising inflation through stepped-up policy rate increases, risk-free as well as risk assets both performed poorly. Widespread, substantial global monetary tightening occurred during the reporting period, with numerous central banks quickly tightening policies within a relatively short period of time.
What factors affected the Portfolio’s relative performance during the reporting period?
During the reporting period, the Portfolio’s shorter duration2 posture made a positive contribution to returns relative to the Bloomberg U.S. Aggregate Bond Index, as did underweight exposure to investment-grade corporates. (Contributions take weightings and total returns into account.) Conversely, the Portfolio’s overweight allocations to high-yield corporates, preferred debt and emerging-market debt detracted from relative performance as spread3 widened.
During the reporting period, how was the Portfolio’s performance materially affected by investments in derivatives?
During the reporting period, the Portfolio used Treasury futures to hedge its duration. This position had a positive impact on returns as interest rates rose.
What was the Portfolio’s duration strategy during the reporting period?
The Portfolio does not track a fixed-income index and can demonstrate a low correlation to the Bloomberg U.S. Aggregate Bond Index. The average duration of the Portfolio will normally vary from 0 to 7 years. Duration positioning is based on what we believe to be most appropriate at a given point in the cycle. At the end of the reporting period, the Portfolio held a shorter duration relative to the Bloomberg U.S. Aggregate Bond Index. The Portfolio’s overall duration remained in the middle of its allowable range.
During the reporting period, we extended the Portfolio’s duration posture as interest rates rose. As of December 31, 2022, the effective duration for the Fund was 3.51 years relative to the 6.13 years for the Bloomberg U.S. Aggregate Bond Index.
What specific factors, risks or market forces prompted significant decisions for the Portfolio during the reporting period?
During the reporting period, higher rates led to negative absolute performance across the market. Positive real yields and interest rates above the U.S. Federal Reserve’s “neutral” rate led us to extend the duration of the Portfolio.
During the reporting period, which market segments were the strongest positive contributors to the Portfolio’s absolute performance and which market segments were particularly weak?
During the reporting period, the Portfolio’s credit risk transfer exposure was a slight positive contributor to absolute performance. Conversely, both investment grade and high yield detracted from total return. Within the Portfolio’s corporate exposure, the banking, retailers and midstream industries were among the most significant detractors.
Did the Portfolio make any significant purchases or sales during the reporting period?
During the reporting period, the Portfolio purchased credit risk transfer deals issued by Freddie Mac (the Federal Home Loan Mortgage Corporation) and Fannie Mae (the Federal National Mortgage Association) with the STACR and CAS labels/Hertz/Starwood. These purchases reflected our positive outlook on the housing market and the resiliency of the consumer.
| 1. | See page 5 for more information on benchmark and peer group returns. |
| 2. | Duration is a measure of the price sensitivity of a fixed-income investment to changes in interest rates. Duration is expressed as a number of years and is considered a more accurate sensitivity gauge than average maturity. |
| 3. | The terms “spread” and “yield spread” may refer to the difference in yield between a security or type of security and comparable U.S. Treasury issues. The terms may also refer to the difference in yield between two specific securities or types of securities at a given time. |
| 8 | MainStay VP MacKay Strategic Bond Portfolio |
In addition, we sold part of the Portfolio’s positions in Brazil and Dell, as well as its complete position in PFGC. Brazil spreads held up well during the risk-averse tone of the market, and we took the opportunity to lighten the Portfolio’s exposure. Liquidation of the Portfolio’s PFGC position was part of a risk reduction trade and a move from credits rated B to credits rated BB.4
How did the Portfolio’s sector weightings change during the reporting period?
During the reporting period, the Portfolio’s effective duration increased from 1.83 years to 3.51 years. In addition, the Portfolio increased its exposure to agency mortgages and consumer asset-backed securities. During the same period, the Portfolio trimmed its exposure to bank loans and emerging-market bonds.
How was the Portfolio positioned at the end of the reporting period?
As of December 31, 2022, relative to the Bloomberg U.S. Aggregate Bond Index, the Portfolio held overweight exposure to high-yield corporate bonds and securitized assets. As of the same date, the Portfolio held underweight exposure to U.S. Treasury securities and agency mortgages.
| 4. | An obligation rated ‘B’ by Standard & Poors ("S&P") is deemed by S&P to be more vulnerable to nonpayment than obligations rated ‘BB’, but in the opinion of S&P, the obligor currently has the capacity to meet its financial commitment on the obligation. It is the opinion of S&P that adverse business, financial, or economic conditions will likely impair the obligor's capacity or willingness to meet its financial commitment on the obligation. An obligation rated ‘BB’ by S&P is deemed by S&P to be less vulnerable to nonpayment than other speculative issues. In the opinion of S&P, however, the obligor faces major ongoing uncertainties or exposure to adverse business, financial or economic conditions which could lead to the obligor’s inadequate capacity to meet its financial commitment on the obligation. When applied to Portfolio holdings, ratings are based solely on the creditworthiness of the bonds in the Portfolio and are not meant to represent the security or safety of the Portfolio. |
The opinions expressed are those of the portfolio managers as of the date of this report and are subject to change. There is no guarantee that any forecasts will come to pass. This material does not constitute investment advice and is not intended as an endorsement of any specific investment.
Not all MainStay VP Portfolios and/or share classes are available under all policies.
Portfolio of Investments December 31, 2022†
| | Principal
Amount | Value |
| Long-Term Bonds 97.8% |
| Asset-Backed Securities 14.0% |
| Automobile Asset-Backed Securities 7.0% |
| American Credit Acceptance Receivables Trust (a) | |
| Series 2021-2, Class D | | |
| 1.34%, due 7/13/27 | $ 1,110,000 | $ 1,049,530 |
| Series 2021-4, Class D | | |
| 1.82%, due 2/14/28 | 1,955,000 | 1,791,036 |
| Series 2022-1, Class D | | |
| 2.46%, due 3/13/28 | 2,620,000 | 2,357,330 |
| Avis Budget Rental Car Funding AESOP LLC (a) | |
| Series 2021-1A, Class A | | |
| 1.38%, due 8/20/27 | 2,550,000 | 2,220,172 |
| Series 2020-2A, Class A | | |
| 2.02%, due 2/20/27 | 1,010,000 | 915,293 |
| CPS Auto Receivables Trust (a) | |
| Series 2021-A, Class E | | |
| 2.53%, due 3/15/28 | 2,100,000 | 1,929,038 |
| Series 2021-C, Class E | | |
| 3.21%, due 9/15/28 | 1,335,000 | 1,141,457 |
| Series 2020-C, Class E | | |
| 4.22%, due 5/17/27 | 855,000 | 814,583 |
| Series 2019-C, Class E | | |
| 4.30%, due 7/15/25 | 1,500,000 | 1,483,126 |
| Drive Auto Receivables Trust | |
| Series 2021-1, Class D | | |
| 1.45%, due 1/16/29 | 3,135,000 | 2,937,871 |
| Exeter Automobile Receivables Trust | |
| Series 2021-3A, Class E | | |
| 3.04%, due 12/15/28 (a) | 1,645,000 | 1,402,989 |
| Flagship Credit Auto Trust (a) | |
| Series 2021-4, Class C | | |
| 1.96%, due 12/15/27 | 1,340,000 | 1,225,073 |
| Series 2021-4, Class D | | |
| 2.26%, due 12/15/27 | 2,985,000 | 2,608,913 |
| Series 2020-1, Class E | | |
| 3.52%, due 6/15/27 | 2,460,000 | 2,208,590 |
| Series 2019-2, Class E | | |
| 4.52%, due 12/15/26 | 1,258,000 | 1,172,857 |
| Series 2020-3, Class E | | |
| 4.98%, due 12/15/27 | 1,295,000 | 1,131,842 |
| GLS Auto Receivables Issuer Trust (a) | |
| Series 2021-2A, Class D | | |
| 1.42%, due 4/15/27 | 1,370,000 | 1,242,888 |
| Series 2021-3A, Class D | | |
| 1.48%, due 7/15/27 | 3,630,000 | 3,246,173 |
| Series 2021-4A, Class D | | |
| 2.48%, due 10/15/27 | 2,285,000 | 2,018,608 |
| | Principal
Amount | Value |
| |
| Automobile Asset-Backed Securities (continued) |
| GLS Auto Receivables Issuer Trust (a) (continued) | |
| Series 2020-1A, Class C | | |
| 2.72%, due 11/17/25 | $ 2,565,000 | $ 2,527,320 |
| Series 2020-1A, Class D | | |
| 3.68%, due 11/16/26 | 1,430,000 | 1,371,385 |
| Hertz Vehicle Financing III LP (a) | |
| Series 2021-2A, Class C | | |
| 2.52%, due 12/27/27 | 5,027,000 | 4,145,169 |
| Series 2021-2A, Class D | | |
| 4.34%, due 12/27/27 | 4,289,000 | 3,570,557 |
| Hertz Vehicle Financing LLC | |
| Series 2021-1A, Class C | | |
| 2.05%, due 12/26/25 (a) | 1,155,000 | 1,040,430 |
| Santander Drive Auto Receivables Trust | |
| Series 2021-4, Class D | | |
| 1.67%, due 10/15/27 | 3,260,000 | 3,002,625 |
| Series 2022-2, Class B | | |
| 3.44%, due 9/15/27 | 2,300,000 | 2,222,233 |
| | | 50,777,088 |
| Credit Card Asset-Backed Security 0.1% |
| Golden Credit Card Trust | |
| Series 2021-1A, Class C | | |
| 1.74%, due 8/15/28 (a) | 540,000 | 470,426 |
| Home Equity Asset-Backed Securities 0.3% |
| Carrington Mortgage Loan Trust | |
| Series 2007-HE1, Class A3 | | |
| 4.579% (1 Month LIBOR + 0.19%), due 6/25/37 (b) | 1,316,737 | 1,278,066 |
| First NLC Trust | |
| Series 2007-1, Class A1 | | |
| 4.459% (1 Month LIBOR + 0.07%), due 8/25/37 (a)(b) | 54,604 | 25,409 |
| J.P. Morgan Mortgage Acquisition Trust | |
| Series 2007-HE1, Class AF1 | | |
| 3.919% (1 Month LIBOR + 0.10%), due 3/25/47 (b) | 19,041 | 11,988 |
| Mastr Asset-Backed Securities Trust | |
| Series 2006-HE4, Class A1 | | |
| 4.489% (1 Month LIBOR + 0.10%), due 11/25/36 (b) | 15,647 | 4,988 |
| Morgan Stanley ABS Capital I, Inc. Trust (b) | |
| Series 2007-HE4, Class A2A | | |
| 4.499% (1 Month LIBOR + 0.11%), due 2/25/37 | 16,625 | 5,497 |
The notes to the financial statements are an integral part of, and should be read in conjunction with, the financial statements.
| 10 | MainStay VP MacKay Strategic Bond Portfolio |
| | Principal
Amount | Value |
| Asset-Backed Securities (continued) |
| Home Equity Asset-Backed Securities (continued) |
| Morgan Stanley ABS Capital I, Inc. Trust (b) (continued) | |
| Series 2007-HE7, Class M1 | | |
| 6.389% (1 Month LIBOR + 2.00%), due 7/25/37 | $ 930,000 | $ 707,578 |
| | | 2,033,526 |
| Other Asset-Backed Securities 6.6% |
| American Airlines Pass-Through Trust | |
| Series 2016-2, Class A | | |
| 3.65%, due 6/15/28 | 1,441,158 | 1,123,621 |
| Series 2019-1, Class B | | |
| 3.85%, due 2/15/28 | 1,254,362 | 1,054,148 |
| Series 2021-1, Class B | | |
| 3.95%, due 7/11/30 | 1,500,000 | 1,190,157 |
| Series 2015-2, Class A | | |
| 4.00%, due 9/22/27 | 346,049 | 281,009 |
| Series 2013-2, Class A | | |
| 4.95%, due 1/15/23 | 1,728,668 | 1,726,307 |
| AMSR Trust (a) | |
| Series 2020-SFR4, Class A | | |
| 1.355%, due 11/17/37 | 2,995,000 | 2,680,087 |
| Series 2020-SFR5, Class A | | |
| 1.379%, due 11/17/37 | 840,000 | 748,374 |
| CF Hippolyta Issuer LLC (a) | |
| Series 2020-1, Class A1 | | |
| 1.69%, due 7/15/60 | 1,280,706 | 1,143,148 |
| Series 2021-1A, Class B1 | | |
| 1.98%, due 3/15/61 | 5,634,185 | 4,697,485 |
| Series 2020-1, Class A2 | | |
| 1.99%, due 7/15/60 | 1,230,418 | 1,014,886 |
| Series 2020-1, Class B1 | | |
| 2.28%, due 7/15/60 | 1,313,405 | 1,146,309 |
| Crown Castle Towers LLC | |
| 4.241%, due 7/15/28 (a) | 2,290,000 | 2,079,974 |
| DB Master Finance LLC (a) | |
| Series 2021-1A, Class A23 | | |
| 2.791%, due 11/20/51 | 2,415,600 | 1,860,848 |
| Series 2019-1A, Class A23 | | |
| 4.352%, due 5/20/49 | 1,499,625 | 1,367,334 |
| FirstKey Homes Trust (a) | |
| Series 2020-SFR1, Class A | | |
| 1.339%, due 8/17/37 | 4,552,350 | 4,068,148 |
| Series 2021-SFR2, Class B | | |
| 1.607%, due 9/17/38 | 840,000 | 707,489 |
| Series 2021-SFR1, Class B | | |
| 1.788%, due 8/17/38 | 3,755,000 | 3,216,412 |
| | Principal
Amount | Value |
| |
| Other Asset-Backed Securities (continued) |
| Home Partners of America Trust | |
| Series 2021-2, Class B | | |
| 2.302%, due 12/17/26 (a) | $ 2,352,795 | $ 2,009,841 |
| Navient Private Education Refi Loan Trust (a) | |
| Series 2021-EA, Class B | | |
| 2.03%, due 12/16/69 | 3,490,000 | 2,223,557 |
| Series 2020-GA, Class B | | |
| 2.50%, due 9/16/69 | 1,485,000 | 1,114,785 |
| Series 2020-HA, Class B | | |
| 2.78%, due 1/15/69 | 840,000 | 654,536 |
| New Economy Assets Phase 1 Sponsor LLC (a) | |
| Series 2021-1, Class A1 | | |
| 1.91%, due 10/20/61 | 1,835,000 | 1,550,519 |
| Series 2021-1, Class B1 | | |
| 2.41%, due 10/20/61 | 1,665,000 | 1,367,822 |
| PFS Financing Corp. | |
| Series 2022-D, Class B | | |
| 4.90%, due 8/15/27 (a) | 1,790,000 | 1,734,845 |
| Progress Residential | |
| Series 2021-SFR4, Class B | | |
| 1.808%, due 5/17/38 (a) | 2,085,000 | 1,790,315 |
| Progress Residential Trust | |
| Series 2020-SFR3, Class B | | |
| 1.495%, due 10/17/27 (a) | 1,680,000 | 1,484,117 |
| Taco Bell Funding LLC | |
| Series 2021-1A, Class A23 | | |
| 2.542%, due 8/25/51 (a) | 1,772,100 | 1,346,961 |
| U.S. Airways Pass-Through Trust | |
| Series 2012-1, Class A | | |
| 5.90%, due 10/1/24 | 743,941 | 719,532 |
| United Airlines Pass-Through Trust | |
| Series 2020-1, Class A | | |
| 5.875%, due 10/15/27 | 1,762,555 | 1,737,784 |
| | | 47,840,350 |
Total Asset-Backed Securities
(Cost $114,100,038) | | 101,121,390 |
| Corporate Bonds 42.4% |
| Aerospace & Defense 0.6% |
| Howmet Aerospace, Inc. | | |
| 3.00%, due 1/15/29 | 2,150,000 | 1,827,500 |
| L3Harris Technologies, Inc. | | |
| 4.40%, due 6/15/28 | 2,260,000 | 2,163,308 |
| | | 3,990,808 |
The notes to the financial statements are an integral part of, and should be read in conjunction with, the financial statements.
11
Portfolio of Investments December 31, 2022† (continued)
| | Principal
Amount | Value |
| Corporate Bonds (continued) |
| Agriculture 0.3% |
| BAT Capital Corp. | | |
| 3.734%, due 9/25/40 | $ 1,420,000 | $ 964,212 |
| BAT International Finance plc | | |
| 4.448%, due 3/16/28 | 1,360,000 | 1,259,579 |
| | | 2,223,791 |
| Airlines 1.3% |
| American Airlines, Inc. (a) | | |
| 5.50%, due 4/20/26 | 1,640,000 | 1,577,100 |
| 5.75%, due 4/20/29 | 3,255,000 | 2,974,926 |
| Delta Air Lines, Inc. (a) | | |
| 4.50%, due 10/20/25 | 1,185,000 | 1,156,064 |
| 4.75%, due 10/20/28 | 2,245,000 | 2,110,240 |
| Mileage Plus Holdings LLC | | |
| 6.50%, due 6/20/27 (a) | 1,845,119 | 1,834,421 |
| | | 9,652,751 |
| Auto Manufacturers 1.8% |
| Ford Motor Credit Co. LLC | | |
| 2.30%, due 2/10/25 | 1,085,000 | 990,475 |
| 4.125%, due 8/17/27 | 2,330,000 | 2,085,350 |
| 5.841% (3 Month LIBOR + 1.235%), due 2/15/23 (b) | 1,230,000 | 1,228,833 |
| General Motors Co. | | |
| 5.60%, due 10/15/32 | 685,000 | 636,363 |
| General Motors Financial Co., Inc. | | |
| 2.35%, due 1/8/31 | 908,000 | 684,645 |
| 2.70%, due 6/10/31 | 2,255,000 | 1,727,726 |
| 4.30%, due 4/6/29 | 1,400,000 | 1,253,988 |
| Nissan Motor Acceptance Co. LLC | | |
| 1.85%, due 9/16/26 (a) | 5,030,000 | 4,199,236 |
| | | 12,806,616 |
| Auto Parts & Equipment 0.4% |
| Dana, Inc. | | |
| 4.50%, due 2/15/32 | 3,885,000 | 3,106,618 |
| Banks 15.1% |
| Banco Santander SA | | |
| 4.175% (1 Year Treasury Constant Maturity Rate + 2.00%), due 3/24/28 (b) | 3,000,000 | 2,782,544 |
| Bank of America Corp. | | |
| 2.087%, due 6/14/29 (c) | 1,895,000 | 1,594,631 |
| 2.687%, due 4/22/32 (c) | 2,520,000 | 2,016,968 |
| 3.384%, due 4/2/26 (c) | 2,185,000 | 2,086,760 |
| 3.705%, due 4/24/28 (c) | 1,695,000 | 1,568,542 |
| | Principal
Amount | Value |
| |
| Banks (continued) |
| Bank of America Corp. (continued) | | |
| Series MM | | |
| 4.30%, due 1/28/25 (c)(d) | $ 2,476,000 | $ 2,141,832 |
| Series DD | | |
| 6.30%, due 3/10/26 (c)(d) | 1,810,000 | 1,796,558 |
| 8.57%, due 11/15/24 | 455,000 | 480,885 |
| Barclays plc | | |
| 4.375% (5 Year Treasury Constant Maturity Rate + 3.41%), due 3/15/28 (b)(d) | 3,750,000 | 2,859,375 |
| 5.20%, due 5/12/26 | 1,725,000 | 1,677,555 |
| 8.00% (5 Year Treasury Constant Maturity Rate + 5.431%), due 3/15/29 (b)(d) | 1,000,000 | 935,000 |
| BNP Paribas SA (a) | | |
| 3.052%, due 1/13/31 (c) | 1,750,000 | 1,434,201 |
| 4.625% (5 Year Treasury Constant Maturity Rate + 3.196%), due 1/12/27 (b)(d) | 1,600,000 | 1,315,982 |
| 4.625% (5 Year Treasury Constant Maturity Rate + 3.34%), due 2/25/31 (b)(d) | 2,250,000 | 1,738,351 |
| 7.75% (5 Year Treasury Constant Maturity Rate + 4.899%), due 8/16/29 (b)(d) | 705,000 | 696,188 |
| BPCE SA | | |
| 2.045%, due 10/19/27 (a)(c) | 1,370,000 | 1,180,863 |
| Citigroup, Inc. | | |
| 2.52%, due 11/3/32 (c) | 1,465,000 | 1,139,285 |
| Series Y | | |
| 4.15% (5 Year Treasury Constant Maturity Rate + 3.00%), due 11/15/26 (b)(d) | 2,180,000 | 1,779,815 |
| 5.50%, due 9/13/25 | 2,710,000 | 2,726,587 |
| Series M | | |
| 6.30%, due 5/15/24 (c)(d) | 3,975,000 | 3,749,419 |
| Citizens Financial Group, Inc. | | |
| Series G | | |
| 4.00% (5 Year Treasury Constant Maturity Rate + 3.215%), due 10/6/26 (b)(d) | 1,620,000 | 1,300,469 |
| Credit Agricole SA | | |
| 4.75% (5 Year Treasury Constant Maturity Rate + 3.237%), due 3/23/29 (a)(b)(d) | 2,965,000 | 2,376,203 |
| Credit Suisse Group AG (a)(c) | | |
| 3.091%, due 5/14/32 | 2,195,000 | 1,516,627 |
| 6.442%, due 8/11/28 | 1,410,000 | 1,284,082 |
The notes to the financial statements are an integral part of, and should be read in conjunction with, the financial statements.
| 12 | MainStay VP MacKay Strategic Bond Portfolio |
| | Principal
Amount | Value |
| Corporate Bonds (continued) |
| Banks (continued) |
| Deutsche Bank AG | | |
| 3.035%, due 5/28/32 (c) | $ 640,000 | $ 485,077 |
| 4.875% (USISDA05 + 2.553%), due 12/1/32 (b) | 4,285,000 | 3,581,482 |
| 5.371%, due 9/9/27 | 1,660,000 | 1,663,701 |
| First Horizon Bank | | |
| 5.75%, due 5/1/30 | 1,795,000 | 1,740,078 |
| Freedom Mortgage Corp. | | |
| 7.625%, due 5/1/26 (a) | 1,205,000 | 1,005,121 |
| Goldman Sachs Group, Inc. (The) | | |
| 1.948%, due 10/21/27 (c) | 1,555,000 | 1,359,669 |
| Series V | | |
| 4.125% (5 Year Treasury Constant Maturity Rate + 2.949%), due 11/10/26 (b)(d) | 3,875,000 | 3,225,563 |
| 5.776% (3 Month LIBOR + 1.17%), due 5/15/26 (b) | 3,075,000 | 3,053,353 |
| 6.75%, due 10/1/37 | 1,828,000 | 1,950,518 |
| Huntington National Bank (The) | | |
| 3.55%, due 10/6/23 | 894,000 | 884,521 |
| Intesa Sanpaolo SpA | | |
| 4.198% (1 Year Treasury Constant Maturity Rate + 2.60%), due 6/1/32 (a)(b) | 2,515,000 | 1,847,790 |
| JPMorgan Chase & Co. (c) | | |
| 1.764%, due 11/19/31 | 1,769,000 | 1,341,023 |
| Series HH | | |
| 4.60%, due 2/1/25 (d) | 1,762,000 | 1,552,762 |
| Lloyds Banking Group plc | | |
| 4.582%, due 12/10/25 | 2,500,000 | 2,420,743 |
| 4.976% (1 Year Treasury Constant Maturity Rate + 2.30%), due 8/11/33 (b) | 1,095,000 | 1,005,418 |
| Macquarie Group Ltd. | | |
| 2.871%, due 1/14/33 (a)(c) | 2,065,000 | 1,584,232 |
| Mizuho Financial Group, Inc. | | |
| 5.414% (1 Year Treasury Constant Maturity Rate + 2.05%), due 9/13/28 (b)(e) | 1,935,000 | 1,935,354 |
| Morgan Stanley | | |
| 2.484%, due 9/16/36 (c) | 2,895,000 | 2,099,255 |
| 5.00%, due 11/24/25 | 2,190,000 | 2,183,399 |
| NatWest Group plc (b) | | |
| 3.073% (1 Year Treasury Constant Maturity Rate + 2.55%), due 5/22/28 | 2,685,000 | 2,399,449 |
| | Principal
Amount | Value |
| |
| Banks (continued) |
| NatWest Group plc (b) (continued) | | |
| 4.60% (5 Year Treasury Constant Maturity Rate + 3.10%), due 6/28/31 (d) | $ 2,740,000 | $ 1,961,643 |
| Popular, Inc. | | |
| 6.125%, due 9/14/23 | 1,953,000 | 1,935,911 |
| Societe Generale SA (a)(b)(d) | | |
| 4.75% (5 Year Treasury Constant Maturity Rate + 3.931%), due 5/26/26 | 3,455,000 | 2,928,449 |
| 5.375% (5 Year Treasury Constant Maturity Rate + 4.514%), due 11/18/30 | 3,555,000 | 2,880,036 |
| Standard Chartered plc | | |
| 4.75% (5 Year Treasury Constant Maturity Rate + 3.805%), due 1/14/31 (a)(b)(d) | 3,345,000 | 2,561,387 |
| SVB Financial Group | | |
| Series C | | |
| 4.00% (5 Year Treasury Constant Maturity Rate + 3.202%), due 5/15/26 (b)(d) | 2,070,000 | 1,366,241 |
| Synchrony Bank | | |
| 5.40%, due 8/22/25 | 1,970,000 | 1,933,459 |
| Texas Capital Bancshares, Inc. | | |
| 4.00% (5 Year Treasury Constant Maturity Rate + 3.15%), due 5/6/31 (b) | 3,010,000 | 2,671,181 |
| UBS Group AG (a)(b) | | |
| 4.375% (5 Year Treasury Constant Maturity Rate + 3.313%), due 2/10/31 (d) | 2,715,000 | 2,062,745 |
| 4.751% (1 Year Treasury Constant Maturity Rate + 1.75%), due 5/12/28 | 1,300,000 | 1,244,069 |
| Wells Fargo & Co. | | |
| 2.879%, due 10/30/30 (c) | 1,020,000 | 866,393 |
| 3.00%, due 10/23/26 | 1,640,000 | 1,515,714 |
| 4.897%, due 7/25/33 (c) | 1,510,000 | 1,433,795 |
| Series U | | |
| 5.875%, due 6/15/25 (c)(d) | 595,000 | 574,175 |
| Series S | | |
| 5.90%, due 6/15/24 (c)(d) | 2,725,000 | 2,440,537 |
| Westpac Banking Corp. | | |
| 3.02% (5 Year Treasury Constant Maturity Rate + 1.53%), due 11/18/36 (b) | 1,825,000 | 1,356,828 |
| | | 109,229,793 |
The notes to the financial statements are an integral part of, and should be read in conjunction with, the financial statements.
13
Portfolio of Investments December 31, 2022† (continued)
| | Principal
Amount | Value |
| Corporate Bonds (continued) |
| Chemicals 0.5% |
| Alpek SAB de CV | | |
| 3.25%, due 2/25/31 (a)(e) | $ 3,185,000 | $ 2,653,906 |
| Braskem Netherlands Finance BV | | |
| 4.50%, due 1/10/28 (a) | 1,015,000 | 910,161 |
| | | 3,564,067 |
| Commercial Services 0.3% |
| Ashtead Capital, Inc. | | |
| 4.25%, due 11/1/29 (a) | 1,960,000 | 1,756,814 |
| California Institute of Technology | | |
| 3.65%, due 9/1/19 | 1,144,000 | 728,658 |
| | | 2,485,472 |
| Computers 0.6% |
| Dell International LLC | | |
| 6.02%, due 6/15/26 | 625,000 | 637,597 |
| 8.10%, due 7/15/36 | 670,000 | 750,814 |
| NCR Corp. (a) | | |
| 5.00%, due 10/1/28 | 3,210,000 | 2,736,635 |
| 6.125%, due 9/1/29 | 268,000 | 250,595 |
| | | 4,375,641 |
| Diversified Financial Services 3.5% |
| AerCap Ireland Capital DAC | | |
| 3.00%, due 10/29/28 | 2,200,000 | 1,843,106 |
| Air Lease Corp. | | |
| 2.30%, due 2/1/25 | 1,820,000 | 1,694,473 |
| 2.75%, due 1/15/23 | 1,040,000 | 1,038,776 |
| Aircastle Ltd. | | |
| 5.25% (5 Year Treasury Constant Maturity Rate + 4.41%), due 6/15/26 (a)(b)(d) | 3,325,000 | 2,560,250 |
| Ally Financial, Inc. | | |
| Series C | | |
| 4.70% (7 Year Treasury Constant Maturity Rate + 3.481%), due 5/15/28 (b)(d) | 1,430,000 | 895,537 |
| 5.75%, due 11/20/25 | 3,570,000 | 3,458,430 |
| 8.00%, due 11/1/31 | 2,010,000 | 2,075,016 |
| Avolon Holdings Funding Ltd. | | |
| 3.25%, due 2/15/27 (a) | 2,340,000 | 2,002,536 |
| Banco BTG Pactual SA | | |
| 2.75%, due 1/11/26 (a) | 4,265,000 | 3,875,819 |
| Capital One Financial Corp. | | |
| 5.247%, due 7/26/30 (c) | 1,110,000 | 1,057,105 |
| Nomura Holdings, Inc. | | |
| 5.099%, due 7/3/25 | 1,985,000 | 1,963,152 |
| | Principal
Amount | Value |
| |
| Diversified Financial Services (continued) |
| OneMain Finance Corp. | | |
| 3.50%, due 1/15/27 | $ 2,715,000 | $ 2,247,938 |
| 6.125%, due 3/15/24 | 880,000 | 851,198 |
| | | 25,563,336 |
| Electric 1.9% |
| AEP Texas, Inc. | | |
| 4.70%, due 5/15/32 | 1,460,000 | 1,398,451 |
| Calpine Corp. | | |
| 5.125%, due 3/15/28 (a) | 2,520,000 | 2,248,578 |
| Dominion Energy, Inc. | | |
| Series C | | |
| 4.35% (5 Year Treasury Constant Maturity Rate + 3.195%), due 1/15/27 (b)(d) | 1,045,000 | 877,730 |
| Edison International | | |
| Series B | | |
| 5.00% (5 Year Treasury Constant Maturity Rate + 3.901%), due 12/15/26 (b)(d) | 2,685,000 | 2,244,525 |
| FirstEnergy Transmission LLC | | |
| 4.35%, due 1/15/25 (a) | 1,675,000 | 1,632,182 |
| Pacific Gas and Electric Co. | | |
| 3.50%, due 8/1/50 | 2,460,000 | 1,527,945 |
| Sempra Energy | | |
| 4.125% (5 Year Treasury Constant Maturity Rate + 2.868%), due 4/1/52 (b) | 2,935,000 | 2,272,676 |
| WEC Energy Group, Inc. | | |
| 6.719% (3 Month LIBOR + 2.113%), due 5/15/67 (b) | 1,860,340 | 1,556,249 |
| | | 13,758,336 |
| Environmental Control 0.1% |
| Covanta Holding Corp. | | |
| 4.875%, due 12/1/29 (a) | 1,025,000 | 839,752 |
| Food 0.6% |
| JBS USA LUX SA | | |
| 5.75%, due 4/1/33 (a) | 2,290,000 | 2,184,156 |
| Kraft Heinz Foods Co. | | |
| 5.00%, due 7/15/35 | 718,000 | 686,670 |
| Smithfield Foods, Inc. | | |
| 3.00%, due 10/15/30 (a) | 2,005,000 | 1,526,593 |
| | | 4,397,419 |
| Gas 0.5% |
| National Fuel Gas Co. | | |
| 2.95%, due 3/1/31 | 1,195,000 | 936,463 |
The notes to the financial statements are an integral part of, and should be read in conjunction with, the financial statements.
| 14 | MainStay VP MacKay Strategic Bond Portfolio |
| | Principal
Amount | Value |
| Corporate Bonds (continued) |
| Gas (continued) |
| Piedmont Natural Gas Co., Inc. | | |
| 5.05%, due 5/15/52 | $ 1,330,000 | $ 1,200,011 |
| Southern Co. Gas Capital Corp. | | |
| Series 21A | | |
| 3.15%, due 9/30/51 | 2,010,000 | 1,301,046 |
| | | 3,437,520 |
| Home Builders 0.6% |
| Thor Industries, Inc. | | |
| 4.00%, due 10/15/29 (a) | 1,665,000 | 1,307,331 |
| Toll Brothers Finance Corp. | | |
| 3.80%, due 11/1/29 | 1,251,000 | 1,068,024 |
| 4.35%, due 2/15/28 | 2,089,000 | 1,897,985 |
| | | 4,273,340 |
| Household Products & Wares 0.3% |
| Kronos Acquisition Holdings, Inc. | | |
| 5.00%, due 12/31/26 (a) | 2,890,000 | 2,499,850 |
| Insurance 1.7% |
| Athene Global Funding | | |
| 2.50%, due 3/24/28 (a) | 1,465,000 | 1,220,741 |
| Lincoln National Corp. | | |
| 7.007% (3 Month LIBOR + 2.358%), due 5/17/66 (b) | 6,418,000 | 4,941,860 |
| MassMutual Global Funding II | | |
| 2.95%, due 1/11/25 (a) | 2,995,000 | 2,878,490 |
| NMI Holdings, Inc. | | |
| 7.375%, due 6/1/25 (a) | 870,000 | 878,700 |
| Protective Life Corp. | | |
| 8.45%, due 10/15/39 | 1,564,000 | 1,839,224 |
| Willis North America, Inc. | | |
| 3.875%, due 9/15/49 | 840,000 | 595,957 |
| | | 12,354,972 |
| Internet 1.0% |
| Expedia Group, Inc. | | |
| 3.25%, due 2/15/30 | 1,950,000 | 1,654,176 |
| 3.80%, due 2/15/28 | 1,155,000 | 1,060,288 |
| 5.00%, due 2/15/26 | 315,000 | 310,841 |
| Match Group Holdings II LLC (a) | | |
| 3.625%, due 10/1/31 | 1,975,000 | 1,514,556 |
| 5.00%, due 12/15/27 (e) | 3,170,000 | 2,916,400 |
| | | 7,456,261 |
| | Principal
Amount | Value |
| |
| Lodging 1.9% |
| Hilton Domestic Operating Co., Inc. | | |
| 5.375%, due 5/1/25 (a) | $ 3,470,000 | $ 3,434,625 |
| Hyatt Hotels Corp. | | |
| 1.80%, due 10/1/24 | 5,450,000 | 5,106,709 |
| Marriott International, Inc. | | |
| 3.75%, due 10/1/25 | 1,860,000 | 1,783,775 |
| Series X | | |
| 4.00%, due 4/15/28 | 880,000 | 817,241 |
| MGM Resorts International | | |
| 6.00%, due 3/15/23 | 2,300,000 | 2,291,835 |
| | | 13,434,185 |
| Media 0.4% |
| DISH DBS Corp. | | |
| 5.75%, due 12/1/28 (a) | 1,445,000 | 1,153,291 |
| Grupo Televisa SAB | | |
| 5.25%, due 5/24/49 | 1,335,000 | 1,178,707 |
| Time Warner Cable Enterprises LLC | | |
| 8.375%, due 3/15/23 | 740,000 | 744,621 |
| | | 3,076,619 |
| Miscellaneous—Manufacturing 0.3% |
| Textron Financial Corp. | | |
| 6.341% (3 Month LIBOR + 1.735%), due 2/15/42 (a)(b) | 3,055,000 | 2,184,325 |
| Oil & Gas 0.8% |
| EQT Corp. | | |
| 5.678%, due 10/1/25 | 1,730,000 | 1,721,591 |
| Gazprom PJSC Via Gaz Capital SA | | |
| 7.288%, due 8/16/37 (a)(f) | 2,500,000 | 1,875,000 |
| Marathon Petroleum Corp. | | |
| 5.125%, due 12/15/26 | 2,425,000 | 2,409,940 |
| | | 6,006,531 |
| Packaging & Containers 0.2% |
| Berry Global, Inc. | | |
| 4.875%, due 7/15/26 (a) | 166,000 | 159,817 |
| Owens-Brockway Glass Container, Inc. | | |
| 6.625%, due 5/13/27 (a) | 1,093,000 | 1,060,437 |
| | | 1,220,254 |
| Pharmaceuticals 0.7% |
| Teva Pharmaceutical Finance Netherlands III BV | | |
| 3.15%, due 10/1/26 | 2,575,000 | 2,251,837 |
| 4.75%, due 5/9/27 | 2,855,000 | 2,580,634 |
| | | 4,832,471 |
The notes to the financial statements are an integral part of, and should be read in conjunction with, the financial statements.
15
Portfolio of Investments December 31, 2022† (continued)
| | Principal
Amount | Value |
| Corporate Bonds (continued) |
| Pipelines 3.8% |
| Cheniere Corpus Christi Holdings LLC | | |
| 2.742%, due 12/31/39 | $ 1,825,000 | $ 1,411,207 |
| CNX Midstream Partners LP | | |
| 4.75%, due 4/15/30 (a) | 2,715,000 | 2,228,105 |
| DCP Midstream Operating LP | | |
| 3.25%, due 2/15/32 (e) | 2,490,000 | 2,059,554 |
| DT Midstream, Inc. | | |
| 4.30%, due 4/15/32 (a) | 1,660,000 | 1,458,385 |
| Energy Transfer LP | | |
| Series H | | |
| 6.50% (5 Year Treasury Constant Maturity Rate + 5.694%), due 11/15/26 (b)(d) | 3,435,000 | 2,954,100 |
| Enterprise Products Operating LLC | | |
| 3.95%, due 1/31/60 | 1,325,000 | 956,233 |
| 4.20%, due 1/31/50 | 545,000 | 428,518 |
| Flex Intermediate Holdco LLC | | |
| 3.363%, due 6/30/31 (a) | 2,310,000 | 1,802,770 |
| Hess Midstream Operations LP | | |
| 4.25%, due 2/15/30 (a) | 3,710,000 | 3,171,757 |
| MPLX LP | | |
| 4.00%, due 3/15/28 | 2,500,000 | 2,325,275 |
| 4.125%, due 3/1/27 | 1,780,000 | 1,681,231 |
| Plains All American Pipeline LP | | |
| 3.80%, due 9/15/30 | 1,330,000 | 1,155,878 |
| Sabine Pass Liquefaction LLC | | |
| 5.75%, due 5/15/24 | 2,710,000 | 2,710,654 |
| Targa Resources Corp. | | |
| 4.20%, due 2/1/33 | 935,000 | 804,440 |
| Western Midstream Operating LP | | |
| 5.50%, due 2/1/50 (g) | 1,975,000 | 1,627,005 |
| Williams Cos., Inc. (The) | | |
| 3.50%, due 10/15/51 | 1,000,000 | 680,552 |
| | | 27,455,664 |
| Real Estate 0.1% |
| Realogy Group LLC | | |
| 5.25%, due 4/15/30 (a) | 1,425,000 | 1,039,552 |
| Real Estate Investment Trusts 1.0% |
| Iron Mountain, Inc. (a) | | |
| 4.875%, due 9/15/29 | 2,254,000 | 1,965,939 |
| 5.25%, due 7/15/30 | 465,000 | 404,085 |
| Office Properties Income Trust | | |
| 2.65%, due 6/15/26 | 2,310,000 | 1,790,246 |
| | Principal
Amount | Value |
| |
| Real Estate Investment Trusts (continued) |
| Starwood Property Trust, Inc. | | |
| 3.625%, due 7/15/26 (a) | $ 3,409,000 | $ 2,982,875 |
| | | 7,143,145 |
| Retail 1.0% |
| AutoNation, Inc. | | |
| 4.75%, due 6/1/30 | 2,060,000 | 1,837,921 |
| Nordstrom, Inc. | | |
| 4.00%, due 3/15/27 | 266,000 | 221,472 |
| 4.25%, due 8/1/31 | 3,200,000 | 2,288,320 |
| QVC, Inc. | | |
| 4.375%, due 9/1/28 | 2,810,000 | 1,678,975 |
| Victoria's Secret & Co. | | |
| 4.625%, due 7/15/29 (a) | 1,442,000 | 1,132,114 |
| | | 7,158,802 |
| Semiconductors 0.4% |
| Broadcom, Inc. (a) | | |
| 3.469%, due 4/15/34 | 2,470,000 | 1,970,399 |
| 3.75%, due 2/15/51 | 910,000 | 628,245 |
| | | 2,598,644 |
| Telecommunications 0.7% |
| Altice France SA | | |
| 5.125%, due 7/15/29 (a) | 3,495,000 | 2,620,353 |
| AT&T, Inc. | | |
| 3.65%, due 6/1/51 | 1,860,000 | 1,310,021 |
| T-Mobile US, Inc. | | |
| 2.625%, due 2/15/29 | 875,000 | 740,714 |
| | | 4,671,088 |
Total Corporate Bonds
(Cost $356,581,886) | | 306,837,623 |
| Foreign Government Bonds 2.6% |
| Brazil 0.0% ‡ |
| Brazil Government Bond | | |
| 3.75%, due 9/12/31 (e) | 565,000 | 474,471 |
| Chile 0.6% |
| Chile Government Bond | | |
| 2.55%, due 7/27/33 | 1,475,000 | 1,154,361 |
| Empresa Nacional del Petroleo | | |
| 3.45%, due 9/16/31 (a) | 4,005,000 | 3,367,150 |
| | | 4,521,511 |
The notes to the financial statements are an integral part of, and should be read in conjunction with, the financial statements.
| 16 | MainStay VP MacKay Strategic Bond Portfolio |
| | Principal
Amount | Value |
| Foreign Government Bonds (continued) |
| Colombia 0.3% |
| Colombia Government Bond | | |
| 3.25%, due 4/22/32 | $ 2,065,000 | $ 1,501,663 |
| 4.50%, due 1/28/26 | 650,000 | 610,934 |
| | | 2,112,597 |
| Mexico 1.7% |
| Comision Federal de Electricidad (a) | | |
| 3.875%, due 7/26/33 | 3,255,000 | 2,461,973 |
| 4.677%, due 2/9/51 | 2,765,000 | 1,797,887 |
| Mexico Government Bond | | |
| 3.75%, due 4/19/71 (e) | 2,230,000 | 1,384,781 |
| Petroleos Mexicanos | | |
| 6.50%, due 3/13/27 | 3,570,000 | 3,256,134 |
| 6.75%, due 9/21/47 | 4,990,000 | 3,183,613 |
| | | 12,084,388 |
Total Foreign Government Bonds
(Cost $25,603,889) | | 19,192,967 |
| Loan Assignments 0.2% |
| Diversified/Conglomerate Service 0.2% |
| TruGreen LP (b) | |
| First Lien Second Refinancing Term Loan | |
| 8.384% (1 Month LIBOR + 4.00%), due 11/2/27 | 944,087 | 830,797 |
| Second Lien Initial Term Loan | |
| 12.915% (3 Month LIBOR + 8.50%), due 11/2/28 | 645,000 | 470,850 |
| | | 1,301,647 |
Total Loan Assignments
(Cost $1,572,260) | | 1,301,647 |
| Mortgage-Backed Securities 30.5% |
| Agency (Collateralized Mortgage Obligations) 5.9% |
| FHLMC | |
| REMIC, Series 5021, Class SA | | |
| (zero coupon) (SOFR 30A + 3.55%), due 10/25/50 (b)(h) | 3,980,080 | 132,898 |
| REMIC, Series 5164, Class SA | | |
| (zero coupon) (SOFR 30A + 3.75%), due 11/25/51 (b)(h) | 9,215,248 | 313,271 |
| REMIC, Series 5200, Class SA | | |
| (zero coupon) (SOFR 30A + 3.50%), due 2/25/52 (b)(h) | 3,399,423 | 88,772 |
| REMIC, Series 4839, Class WO | | |
| (zero coupon), due 8/15/56 | 1,209,309 | 830,447 |
| | Principal
Amount | Value |
| |
| Agency (Collateralized Mortgage Obligations) (continued) |
| FHLMC (continued) | |
| REMIC, Series 5038, Class IB | | |
| 2.50%, due 10/25/50 (h) | $ 1,050,458 | $ 167,504 |
| REMIC, Series 5149, Class LI | | |
| 2.50%, due 10/25/51 (h) | 5,175,670 | 685,913 |
| REMIC, Series 5205, Class KI | | |
| 3.00%, due 12/25/48 (h) | 2,446,902 | 292,487 |
| REMIC, Series 5152, Class BI | | |
| 3.00%, due 7/25/50 (h) | 3,811,438 | 588,288 |
| REMIC, Series 5070, Class PI | | |
| 3.00%, due 8/25/50 (h) | 2,291,317 | 370,873 |
| REMIC, Series 5023, Class LI | | |
| 3.00%, due 10/25/50 (h) | 1,755,183 | 279,554 |
| REMIC, Series 5167, Class GI | | |
| 3.00%, due 11/25/51 (h) | 4,691,537 | 720,693 |
| REMIC, Series 5191 | | |
| 3.50%, due 9/25/50 (h) | 2,514,524 | 425,516 |
| REMIC, Series 5036 | | |
| 3.50%, due 11/25/50 (h) | 2,983,550 | 613,136 |
| REMIC, Series 5040 | | |
| 3.50%, due 11/25/50 (h) | 1,637,714 | 274,452 |
| REMIC, Series 5200, Class FA | | |
| 4.00% (SOFR 30A + 0.50%), due 2/25/52 (b) | 1,880,968 | 1,699,987 |
| FHLMC, Strips | |
| REMIC, Series 311 | | |
| (zero coupon), due 8/15/43 | 870,348 | 648,971 |
| REMIC, Series 311, Class S1 | | |
| 1.632% (1 Month LIBOR + 5.95%), due 8/15/43 (b)(h) | 2,578,183 | 252,539 |
| FNMA | |
| REMIC, Series 2013-110, Class CO | | |
| (zero coupon), due 12/25/39 | 1,858,772 | 1,535,808 |
| REMIC, Series 2013-105, Class QO | | |
| (zero coupon), due 5/25/40 | 513,173 | 421,645 |
| REMIC, Series 2013-105, Class KO | | |
| (zero coupon), due 10/25/43 | 578,154 | 505,060 |
| REMIC, Series 2013-110, Class DO | | |
| (zero coupon), due 11/25/43 | 786,591 | 641,807 |
| REMIC, Series 2021-81, Class SA | | |
| (zero coupon) (SOFR 30A + 2.60%), due 12/25/51 (b)(h) | 14,297,177 | 178,457 |
| REMIC, Series 2022-3, Class YS | | |
| (zero coupon) (SOFR 30A + 2.55%), due 2/25/52 (b)(h) | 11,189,453 | 132,672 |
| REMIC, Series 2022-5, Class SN | | |
| (zero coupon) (SOFR 30A + 1.80%), due 2/25/52 (b)(h) | 1,766,275 | 5,251 |
The notes to the financial statements are an integral part of, and should be read in conjunction with, the financial statements.
17
Portfolio of Investments December 31, 2022† (continued)
| | Principal
Amount | Value |
| Mortgage-Backed Securities (continued) |
| Agency (Collateralized Mortgage Obligations) (continued) |
| FNMA (continued) | |
| REMIC, Series 2021-40, Class SI | | |
| 1.561% (1 Month LIBOR + 5.95%), due 9/25/47 (b)(h) | $ 3,458,498 | $ 329,300 |
| REMIC, Series 2016-57, Class SN | | |
| 1.661% (1 Month LIBOR + 6.05%), due 6/25/46 (b)(h) | 2,640,410 | 269,741 |
| REMIC, Series 2019-32, Class SB | | |
| 1.661% (1 Month LIBOR + 6.05%), due 6/25/49 (b)(h) | 2,749,068 | 270,580 |
| REMIC, Series 2020-23, Class PS | | |
| 1.661% (1 Month LIBOR + 6.05%), due 2/25/50 (b)(h) | 2,998,742 | 310,272 |
| REMIC, Series 2022-10, Class SA | | |
| 1.822% (SOFR 30A + 5.75%), due 2/25/52 (b)(h) | 1,914,023 | 243,733 |
| REMIC, Series 2021-7, Class EI | | |
| 2.50%, due 2/25/51 (h) | 4,081,332 | 562,554 |
| REMIC, Series 2021-10, Class LI | | |
| 2.50%, due 3/25/51 (h) | 1,067,282 | 161,504 |
| REMIC, Series 2021-12, Class JI | | |
| 2.50%, due 3/25/51 (h) | 1,571,305 | 238,077 |
| REMIC, Series 2021-54, Class HI | | |
| 2.50%, due 6/25/51 (h) | 852,755 | 106,555 |
| REMIC, Series 2021-85, Class BI | | |
| 3.00%, due 12/25/51 (h) | 4,477,193 | 695,304 |
| REMIC, Series 2021-8, Class ID | | |
| 3.50%, due 3/25/51 (h) | 2,825,916 | 567,689 |
| REMIC, Series 2020-10, Class DA | | |
| 3.50%, due 3/25/60 | 1,463,125 | 1,348,815 |
| FNMA, Strips | |
| REMIC, Series 427, Class C77 | | |
| 2.50%, due 9/25/51 (h) | 6,740,727 | 1,014,634 |
| GNMA | |
| REMIC, Series 2019-136, Class YS | | |
| (zero coupon) (1 Month LIBOR + 2.83%), due 11/20/49 (b)(h) | 1,955,367 | 24,671 |
| REMIC, Series 2019-145, Class LS | | |
| (zero coupon) (1 Month LIBOR + 2.83%), due 11/20/49 (b)(h) | 2,058,383 | 23,110 |
| REMIC, Series 2020-1, Class YS | | |
| (zero coupon) (1 Month LIBOR + 2.83%), due 1/20/50 (b)(h) | 4,237,929 | 43,271 |
| REMIC, Series 2020-129, Class SB | | |
| (zero coupon) (1 Month LIBOR + 3.20%), due 9/20/50 (b)(h) | 6,173,851 | 75,199 |
| | Principal
Amount | Value |
| |
| Agency (Collateralized Mortgage Obligations) (continued) |
| GNMA (continued) | |
| REMIC, Series 2021-97, Class SD | | |
| (zero coupon) (SOFR 30A + 2.60%), due 6/20/51 (b)(h) | $ 13,904,177 | $ 163,081 |
| REMIC, Series 2021-158, Class SB | | |
| (zero coupon) (SOFR 30A + 3.70%), due 9/20/51 (b)(h) | 4,891,330 | 200,831 |
| REMIC, Series 2022-19, Class SG | | |
| (zero coupon) (SOFR 30A + 2.45%), due 1/20/52 (b)(h) | 7,930,384 | 56,773 |
| REMIC, Series 2022-6, Class AS | | |
| (zero coupon) (SOFR 30A + 3.14%), due 1/20/52 (b)(h) | 970,851 | 11,739 |
| REMIC, Series 2022-24, Class SC | | |
| (zero coupon) (SOFR 30A + 2.37%), due 2/20/52 (b)(h) | 39,645,541 | 295,177 |
| REMIC, Series 2020-115, Class YA | | |
| 1.00%, due 8/20/50 | 2,045,693 | 1,559,487 |
| REMIC, Series 2020-129, Class AG | | |
| 1.00%, due 9/20/50 | 2,932,575 | 2,226,941 |
| REMIC, Series 2020-166, Class CA | | |
| 1.00%, due 11/20/50 | 3,198,428 | 2,386,529 |
| REMIC, Series 2020-34, Class SC | | |
| 1.697% (1 Month LIBOR + 6.05%), due 3/20/50 (b)(h) | 3,423,437 | 342,457 |
| REMIC, Series 2020-183, Class HT | | |
| 1.944% (SOFR 30A + 5.77%), due 12/20/50 (b)(h) | 4,671,330 | 360,271 |
| REMIC, Series 2020-146, Class SA | | |
| 1.947% (1 Month LIBOR + 6.30%), due 10/20/50 (b)(h) | 3,258,645 | 385,401 |
| REMIC, Series 2021-179, Class SA | | |
| 1.947% (1 Month LIBOR + 6.30%), due 11/20/50 (b)(h) | 4,530,004 | 558,006 |
| REMIC, Series 2020-189, Class SU | | |
| 1.947% (1 Month LIBOR + 6.30%), due 12/20/50 (b)(h) | 1,047,252 | 126,909 |
| REMIC, Series 2021-122, Class HS | | |
| 1.947% (1 Month LIBOR + 6.30%), due 7/20/51 (b)(h) | 3,230,471 | 414,682 |
| REMIC, Series 2021-41, Class FS | | |
| 2.00% (SOFR 30A + 0.20%), due 10/20/50 (b)(h) | 4,740,696 | 514,864 |
| REMIC, Series 2020-166, Class IC | | |
| 2.00%, due 11/20/50 (h) | 2,043,966 | 216,295 |
| REMIC, Series 2020-176, Class AI | | |
| 2.00%, due 11/20/50 (h) | 12,691,617 | 1,354,069 |
The notes to the financial statements are an integral part of, and should be read in conjunction with, the financial statements.
| 18 | MainStay VP MacKay Strategic Bond Portfolio |
| | Principal
Amount | Value |
| Mortgage-Backed Securities (continued) |
| Agency (Collateralized Mortgage Obligations) (continued) |
| GNMA (continued) | |
| REMIC, Series 2020-188 | | |
| 2.00%, due 12/20/50 (h) | $ 4,469,290 | $ 474,552 |
| REMIC, Series 2021-57, Class AI | | |
| 2.00%, due 2/20/51 (h) | 4,913,997 | 512,807 |
| REMIC, Series 2021-205, Class GA | | |
| 2.00%, due 11/20/51 | 898,462 | 742,228 |
| REMIC, Series 2021-97, Class IN | | |
| 2.50%, due 8/20/49 (h) | 5,839,249 | 614,768 |
| REMIC, Series 2022-1, Class IA | | |
| 2.50%, due 6/20/50 (h) | 837,016 | 114,871 |
| REMIC, Series 2021-56, Class FE | | |
| 2.50% (SOFR 30A + 0.20%), due 10/20/50 (b)(h) | 5,299,664 | 674,962 |
| REMIC, Series 2021-1, Class PI | | |
| 2.50%, due 12/20/50 (h) | 1,520,350 | 197,590 |
| REMIC, Series 2021-25, Class LI | | |
| 2.50%, due 2/20/51 (h) | 3,785,367 | 477,564 |
| REMIC, Series 2021-57, Class IB | | |
| 2.50%, due 2/20/51 (h) | 4,544,126 | 628,711 |
| REMIC, Series 2021-149, Class CI | | |
| 2.50%, due 8/20/51 (h) | 4,253,359 | 598,758 |
| REMIC, Series 2021-162, Class KI | | |
| 2.50%, due 9/20/51 (h) | 4,148,224 | 594,958 |
| REMIC, Series 2022-83 | | |
| 2.50%, due 11/20/51 (h) | 4,684,466 | 626,332 |
| REMIC, Series 2021-44, Class IQ | | |
| 3.00%, due 3/20/51 (h) | 5,816,931 | 840,626 |
| REMIC, Series 2021-97, Class FA | | |
| 3.00% (SOFR 30A + 0.40%), due 6/20/51 (b) | 1,071,689 | 915,208 |
| REMIC, Series 2021-98, Class IN | | |
| 3.00%, due 6/20/51 (h) | 1,889,434 | 339,616 |
| REMIC, Series 2021-158, Class NI | | |
| 3.00%, due 9/20/51 (h) | 4,873,700 | 853,830 |
| REMIC, Series 2021-177, Class IM | | |
| 3.00%, due 10/20/51 (h) | 3,951,700 | 625,004 |
| REMIC, Series 2019-145, Class LF | | |
| 3.50% (1 Month LIBOR + 0.67%), due 11/20/49 (b) | 2,122,337 | 1,894,063 |
| REMIC, Series 2021-146, Class IN | | |
| 3.50%, due 8/20/51 (h) | 3,996,129 | 642,852 |
| REMIC, Series 2022-6, Class CF | | |
| 3.50% (SOFR 30A + 0.36%), due 1/20/52 (b) | 970,851 | 863,477 |
| | | 42,497,299 |
| | Principal
Amount | Value |
| |
| Commercial Mortgage Loans (Collateralized Mortgage Obligations) 12.9% |
| BAMLL Commercial Mortgage Securities Trust (a)(b) | |
| Series 2022-DKLX, Class E | | |
| 8.463% (1 Month SOFR + 4.127%), due 1/15/39 | $ 1,335,000 | $ 1,244,430 |
| Series 2022-DKLX, Class F | | |
| 9.293% (1 Month SOFR + 4.957%), due 1/15/39 | 1,850,000 | 1,702,253 |
| Bayview Commercial Asset Trust | |
| Series 2005-3A, Class A1 | | |
| 4.869% (1 Month LIBOR + 0.48%), due 11/25/35 (a)(b) | 936,389 | 852,569 |
| BOCA Commercial Mortgage Trust | |
| Series 2022-BOCA, Class A | | |
| 6.105% (1 Month SOFR + 1.77%), due 5/15/39 (a)(b) | 1,830,000 | 1,793,077 |
| BX Commercial Mortgage Trust (a) | |
| Series 2020-VIV2, Class C | | |
| 3.542%, due 3/9/44 (i) | 3,090,000 | 2,415,062 |
| Series 2020-VIV3, Class B | | |
| 3.544%, due 3/9/44 (i) | 815,000 | 655,898 |
| Series 2020-VIVA, Class D | | |
| 3.549%, due 3/11/44 (i) | 1,815,000 | 1,359,394 |
| Series 2021-XL2, Class A | | |
| 5.006% (1 Month LIBOR + 0.689%), due 10/15/38 (b) | 1,450,309 | 1,393,926 |
| Series 2021-21M, Class A | | |
| 5.048% (1 Month LIBOR + 0.73%), due 10/15/36 (b) | 819,513 | 787,396 |
| Series 2021-VOLT, Class D | | |
| 5.968% (1 Month LIBOR + 1.65%), due 9/15/36 (b) | 2,865,000 | 2,680,417 |
| Series 2021-ACNT, Class D | | |
| 6.168% (1 Month LIBOR + 1.85%), due 11/15/38 (b) | 1,535,000 | 1,450,314 |
| Series 2021-VOLT, Class E | | |
| 6.318% (1 Month LIBOR + 2.00%), due 9/15/36 (b) | 3,370,000 | 3,133,993 |
| Series 2021-ACNT, Class E | | |
| 6.515% (1 Month LIBOR + 2.197%), due 11/15/38 (b) | 3,400,000 | 3,203,901 |
| BX Trust (a) | |
| Series 2019-OC11, Class B | | |
| 3.605%, due 12/9/41 | 300,000 | 245,949 |
| Series 2019-OC11, Class C | | |
| 3.856%, due 12/9/41 | 975,000 | 803,395 |
| Series 2019-OC11, Class D | | |
| 3.944%, due 12/9/41 (i) | 1,085,000 | 864,653 |
The notes to the financial statements are an integral part of, and should be read in conjunction with, the financial statements.
19
Portfolio of Investments December 31, 2022† (continued)
| | Principal
Amount | Value |
| Mortgage-Backed Securities (continued) |
| Commercial Mortgage Loans (Collateralized Mortgage Obligations) (continued) |
| BX Trust (a) (continued) | |
| Series 2019-OC11, Class E | | |
| 3.944%, due 12/9/41 (i) | $ 5,235,000 | $ 4,049,962 |
| Series 2021-LBA, Class AJV | | |
| 5.118% (1 Month LIBOR + 0.80%), due 2/15/36 (b) | 2,210,000 | 2,100,577 |
| Series 2021-MFM1, Class C | | |
| 5.518% (1 Month LIBOR + 1.20%), due 1/15/34 (b) | 3,155,000 | 3,006,509 |
| Series 2018-GW, Class C | | |
| 5.538% (1 Month LIBOR + 1.22%), due 5/15/35 (b) | 1,145,000 | 1,101,800 |
| Series 2021-MFM1, Class D | | |
| 5.818% (1 Month LIBOR + 1.50%), due 1/15/34 (b) | 3,091,500 | 2,906,236 |
| Series 2021-LBA, Class DV | | |
| 5.918% (1 Month LIBOR + 1.60%), due 2/15/36 (b) | 2,000,000 | 1,820,799 |
| Series 2021-RISE, Class D | | |
| 6.068% (1 Month LIBOR + 1.75%), due 11/15/36 (b) | 3,095,000 | 2,907,757 |
| Series 2021-ARIA, Class E | | |
| 6.563% (1 Month LIBOR + 2.245%), due 10/15/36 (b) | 3,200,000 | 2,903,095 |
| BXHPP Trust (a)(b) | |
| Series 2021-FILM, Class C | | |
| 5.418% (1 Month LIBOR + 1.10%), due 8/15/36 | 980,000 | 881,493 |
| Series 2021-FILM, Class D | | |
| 5.818% (1 Month LIBOR + 1.50%), due 8/15/36 | 755,000 | 669,538 |
| BXSC Commercial Mortgage Trust | |
| Series 2022-WSS, Class D | | |
| 7.524% (1 Month SOFR + 3.188%), due 3/15/35 (a)(b) | 1,500,000 | 1,428,599 |
| COMM Mortgage Trust | |
| Series 2012-CR4, Class AM | | |
| 3.251%, due 10/15/45 | 1,705,000 | 1,589,334 |
| CSMC WEST Trust | |
| Series 2020-WEST, Class A | | |
| 3.04%, due 2/15/35 (a) | 2,657,500 | 2,072,742 |
| DROP Mortgage Trust | |
| Series 2021-FILE, Class A | | |
| 5.47% (1 Month LIBOR + 1.15%), due 10/15/43 (a)(b) | 2,005,000 | 1,909,407 |
| | Principal
Amount | Value |
| |
| Commercial Mortgage Loans (Collateralized Mortgage Obligations) (continued) |
| Extended Stay America Trust | |
| Series 2021-ESH, Class D | | |
| 6.568% (1 Month LIBOR + 2.25%), due 7/15/38 (a)(b) | $ 4,130,269 | $ 3,954,136 |
| FREMF Mortgage Trust (a)(i) | |
| REMIC, Series 2017-K63, Class C | | |
| 3.877%, due 2/25/50 | 1,925,000 | 1,755,523 |
| REMIC, Series 2018-K154, Class B | | |
| 4.023%, due 11/25/32 | 2,450,000 | 2,069,980 |
| REMIC, Series 2018-K78, Class B | | |
| 4.129%, due 6/25/51 | 855,000 | 785,365 |
| REMIC, Series 2018-K155, Class B | | |
| 4.166%, due 4/25/33 | 2,975,000 | 2,545,302 |
| REMIC, Series 2018-K81, Class B | | |
| 4.173%, due 9/25/51 | 140,000 | 127,778 |
| REMIC, Series 2018-K81, Class C | | |
| 4.173%, due 9/25/51 | 2,020,000 | 1,792,172 |
| REMIC, Series 2018-K84, Class C | | |
| 4.185%, due 10/25/28 | 610,000 | 549,825 |
| REMIC, Series 2018-K76, Class B | | |
| 4.208%, due 6/25/51 | 420,000 | 387,130 |
| REMIC, Series 2018-K79, Class B | | |
| 4.211%, due 7/25/51 | 455,000 | 417,062 |
| REMIC, Series 2018-K80, Class C | | |
| 4.231%, due 8/25/50 | 1,385,000 | 1,250,175 |
| REMIC, Series 2019-K88, Class C | | |
| 4.383%, due 2/25/52 | 2,185,000 | 1,937,924 |
| Hudson Yards Mortgage Trust | |
| Series 2019-30HY, Class A | | |
| 3.228%, due 7/10/39 (a) | 945,000 | 812,511 |
| J.P. Morgan Chase Commercial Mortgage Securities Trust | |
| Series 2018-AON, Class B | | |
| 4.379%, due 7/5/31 (a) | 2,795,000 | 2,568,483 |
| Manhattan West Mortgage Trust | |
| Series 2020-1MW, Class A | | |
| 2.13%, due 9/10/39 (a) | 1,120,000 | 956,266 |
| Multifamily Connecticut Avenue Securities Trust (a)(b) | |
| Series 2019-01, Class M10 | | |
| 7.639% (1 Month LIBOR + 3.25%), due 10/25/49 | 3,046,837 | 2,860,629 |
| Series 2020-01, Class M10 | | |
| 8.139% (1 Month LIBOR + 3.75%), due 3/25/50 | 975,000 | 900,455 |
| One Bryant Park Trust | |
| Series 2019-OBP, Class A | | |
| 2.516%, due 9/15/54 (a) | 1,545,000 | 1,264,835 |
The notes to the financial statements are an integral part of, and should be read in conjunction with, the financial statements.
| 20 | MainStay VP MacKay Strategic Bond Portfolio |
| | Principal
Amount | Value |
| Mortgage-Backed Securities (continued) |
| Commercial Mortgage Loans (Collateralized Mortgage Obligations) (continued) |
| SLG Office Trust | |
| Series 2021-OVA, Class D | | |
| 2.851%, due 7/15/41 (a) | $ 1,825,000 | $ 1,355,322 |
| SMRT | |
| Series 2022-MINI, Class D | | |
| 6.286% (1 Month SOFR + 1.95%), due 1/15/39 (a)(b) | 3,400,000 | 3,161,455 |
| UBS-Barclays Commercial Mortgage Trust | |
| Series 2013-C6, Class B | | |
| 3.875%, due 4/10/46 (a)(j) | 2,535,000 | 2,488,695 |
| Wells Fargo Commercial Mortgage Trust | |
| Series 2018-AUS, Class A | | |
| 4.058%, due 8/17/36 (a)(i) | 3,185,000 | 2,824,874 |
| WFRBS Commercial Mortgage Trust | |
| Series 2014-C21, Class AS | | |
| 3.891%, due 8/15/47 | 2,560,000 | 2,436,430 |
| | | 93,136,802 |
| Whole Loan (Collateralized Mortgage Obligations) 11.7% |
| Alternative Loan Trust | |
| Series 2005-31, Class 1A1 | | |
| 4.949% (1 Month LIBOR + 0.56%), due 8/25/35 (b) | 2,394,355 | 2,033,877 |
| CIM Trust | |
| Series 2021-J2, Class AIOS | | |
| 0.21%, due 4/25/51 (a)(h)(j) | 53,143,488 | 532,647 |
| Connecticut Avenue Securities Trust (a)(b) | |
| Series 2020-R02, Class 2M2 | | |
| 6.389% (1 Month LIBOR + 2.00%), due 1/25/40 | 1,597,559 | 1,573,440 |
| Series 2021-R01, Class 1B1 | | |
| 7.028% (SOFR 30A + 3.10%), due 10/25/41 | 4,575,000 | 4,299,865 |
| Series 2020-SBT1, Class 1M2 | | |
| 8.039% (1 Month LIBOR + 3.65%), due 2/25/40 | 1,700,000 | 1,678,978 |
| FHLMC STACR REMIC Trust (a)(b) | |
| Series 2020-DNA6, Class M2 | | |
| 5.928% (SOFR 30A + 2.00%), due 12/25/50 | 3,827,807 | 3,801,287 |
| Series 2021-HQA2, Class M2 | | |
| 5.978% (SOFR 30A + 2.05%), due 12/25/33 | 2,555,000 | 2,323,453 |
| Series 2021-HQA3, Class M2 | | |
| 6.028% (SOFR 30A + 2.10%), due 9/25/41 | 3,320,000 | 2,922,348 |
| | Principal
Amount | Value |
| |
| Whole Loan (Collateralized Mortgage Obligations) (continued) |
| FHLMC STACR REMIC Trust (a)(b) (continued) | |
| Series 2021-HQA1, Class M2 | | |
| 6.178% (SOFR 30A + 2.25%), due 8/25/33 | $ 3,130,000 | $ 2,947,935 |
| Series 2020-HQA1, Class B1 | | |
| 6.739% (1 Month LIBOR + 2.35%), due 1/25/50 | 2,305,000 | 2,140,826 |
| Series 2020-DNA2, Class B1 | | |
| 6.889% (1 Month LIBOR + 2.50%), due 2/25/50 | 3,860,000 | 3,605,216 |
| Series 2021-HQA1, Class B1 | | |
| 6.928% (SOFR 30A + 3.00%), due 8/25/33 | 4,045,000 | 3,417,854 |
| Series 2021-DNA5, Class B1 | | |
| 6.978% (SOFR 30A + 3.05%), due 1/25/34 | 3,615,000 | 3,301,467 |
| Series 2021-HQA2, Class B1 | | |
| 7.078% (SOFR 30A + 3.15%), due 12/25/33 | 2,500,000 | 2,140,515 |
| Series 2021-HQA3, Class B1 | | |
| 7.278% (SOFR 30A + 3.35%), due 9/25/41 | 5,030,000 | 4,296,212 |
| Series 2022-DNA1, Class B1 | | |
| 7.328% (SOFR 30A + 3.40%), due 1/25/42 | 4,835,000 | 4,288,681 |
| Series 2022-DNA2, Class M2 | | |
| 7.678% (SOFR 30A + 3.75%), due 2/25/42 | 2,065,000 | 1,942,018 |
| FHLMC STACR Trust (a)(b) | |
| Series 2019-DNA3, Class B1 | | |
| 7.639% (1 Month LIBOR + 3.25%), due 7/25/49 | 2,645,000 | 2,645,017 |
| Series 2018-DNA2, Class B1 | | |
| 8.089% (1 Month LIBOR + 3.70%), due 12/25/30 | 4,225,000 | 4,231,565 |
| Series 2019-DNA2, Class B1 | | |
| 8.739% (1 Month LIBOR + 4.35%), due 3/25/49 | 1,900,000 | 1,954,094 |
| Series 2019-DNA1, Class B1 | | |
| 9.039% (1 Month LIBOR + 4.65%), due 1/25/49 | 2,625,000 | 2,737,290 |
| FHLMC Structured Agency Credit Risk Debt Notes | |
| Series 2021-DNA2, Class B1 | | |
| 7.328% (SOFR 30A + 3.40%), due 8/25/33 (a)(b) | 1,765,000 | 1,630,119 |
The notes to the financial statements are an integral part of, and should be read in conjunction with, the financial statements.
21
Portfolio of Investments December 31, 2022† (continued)
| | Principal
Amount | Value |
| Mortgage-Backed Securities (continued) |
| Whole Loan (Collateralized Mortgage Obligations) (continued) |
| FNMA (b) | |
| Series 2021-R02, Class 2B1 | | |
| 7.228% (SOFR 30A + 3.30%), due 11/25/41 (a) | $ 1,630,000 | $ 1,504,197 |
| Series 2018-C01, Class 1B1 | | |
| 7.939% (1 Month LIBOR + 3.55%), due 7/25/30 | 3,910,000 | 3,978,353 |
| Series 2017-C05, Class 1B1 | | |
| 7.989% (1 Month LIBOR + 3.60%), due 1/25/30 | 1,070,000 | 1,082,636 |
| Series 2018-C03, Class 1B1 | | |
| 8.139% (1 Month LIBOR + 3.75%), due 10/25/30 | 850,000 | 858,462 |
| Series 2018-C06, Class 2B1 | | |
| 8.489% (1 Month LIBOR + 4.10%), due 3/25/31 | 1,100,000 | 1,125,525 |
| Series 2017-C03, Class 1B1 | | |
| 9.239% (1 Month LIBOR + 4.85%), due 10/25/29 | 770,000 | 812,889 |
| Series 2017-C01, Class 1B1 | | |
| 10.139% (1 Month LIBOR + 5.75%), due 7/25/29 | 375,000 | 408,811 |
| Galton Funding Mortgage Trust | |
| Series 2018-2, Class A51 | | |
| 4.50%, due 10/25/58 (a)(j) | 431,795 | 407,199 |
| GreenPoint Mortgage Funding Trust | |
| Series 2007-AR3, Class A1 | | |
| 4.829% (1 Month LIBOR + 0.44%), due 6/25/37 (b) | 497,628 | 427,270 |
| New Residential Mortgage Loan Trust (a) | |
| Series 2019-5A, Class B7 | | |
| 4.348%, due 8/25/59 (i) | 3,309,865 | 1,949,065 |
| Series 2019-4A, Class B6 | | |
| 4.657%, due 12/25/58 (j) | 3,075,847 | 1,840,033 |
| Series 2019-2A, Class B6 | | |
| 4.885%, due 12/25/57 (j) | 1,145,148 | 723,039 |
| NewRez Warehouse Securitization Trust | |
| Series 2021-1, Class B | | |
| 5.289% (1 Month LIBOR + 0.90%), due 5/25/55 (a)(b) | 2,665,000 | 2,610,629 |
| Sequoia Mortgage Trust | |
| Series 2018-7, Class B3 | | |
| 4.254%, due 9/25/48 (a)(j) | 1,538,409 | 1,255,131 |
| STACR Trust (a)(b) | |
| Series 2018-HRP2, Class M3 | | |
| 6.789% (1 Month LIBOR + 2.40%), due 2/25/47 | 3,017,024 | 2,933,501 |
| | Principal
Amount | Value |
| |
| Whole Loan (Collateralized Mortgage Obligations) (continued) |
| STACR Trust (a)(b) (continued) | |
| Series 2018-HRP2, Class B1 | | |
| 8.589% (1 Month LIBOR + 4.20%), due 2/25/47 | $ 2,200,000 | $ 2,195,123 |
| WaMu Mortgage Pass-Through Certificates Trust | |
| Series 2006-AR9, Class 2A | | |
| 3.096% (12 Month Monthly Treasury Average Index + 1.048%), due 8/25/46 (b) | 793,846 | 601,877 |
| | | 85,158,444 |
Total Mortgage-Backed Securities
(Cost $238,006,946) | | 220,792,545 |
| Municipal Bond 0.3% |
| California 0.3% |
Regents of the University of California Medical Center, Pooled
Revenue Bonds | | |
| Series N | | |
| 3.006%, due 5/15/50 | 3,030,000 | 2,007,459 |
Total Municipal Bond
(Cost $3,030,000) | | 2,007,459 |
| U.S. Government & Federal Agencies 7.8% |
| Federal Home Loan Mortgage Corporation (Mortgage Pass-Through Security) 0.4% |
| UMBS Pool, 30 Year | | |
| 3.50%, due 7/1/52 | 3,539,551 | 3,216,695 |
| Federal National Mortgage Association (Mortgage Pass-Through Securities) 3.2% |
| UMBS, 30 Year | | |
| 4.00%, due 6/1/52 | 12,685,447 | 11,899,457 |
| 4.00%, due 7/1/52 | 3,922,478 | 3,680,650 |
| 5.00%, due 11/1/52 | 7,429,895 | 7,327,145 |
| | | 22,907,252 |
| United States Treasury Bonds 0.9% |
| U.S. Treasury Bonds | | |
| 4.00%, due 11/15/42 (e) | 2,045,000 | 2,002,183 |
| 4.00%, due 11/15/52 | 4,580,000 | 4,586,440 |
| | | 6,588,623 |
| United States Treasury Notes 3.3% |
| U.S. Treasury Notes | | |
| 4.00%, due 10/31/29 | 5,600,000 | 5,601,750 |
The notes to the financial statements are an integral part of, and should be read in conjunction with, the financial statements.
| 22 | MainStay VP MacKay Strategic Bond Portfolio |
| | Principal
Amount | | Value |
| U.S. Government & Federal Agencies (continued) |
| United States Treasury Notes (continued) |
| U.S. Treasury Notes (continued) | | | |
| 4.125%, due 10/31/27 | $ 10,295,000 | | $ 10,332,802 |
| 4.125%, due 11/15/32 | 2,320,000 | | 2,367,487 |
| 4.375%, due 10/31/24 | 5,205,000 | | 5,190,158 |
| | | | 23,492,197 |
Total U.S. Government & Federal Agencies
(Cost $57,739,852) | | | 56,204,767 |
Total Long-Term Bonds
(Cost $796,634,871) | | | 707,458,398 |
| |
| | Shares | | |
| Short-Term Investments 1.7% |
| Affiliated Investment Company 1.1% |
| MainStay U.S. Government Liquidity Fund, 3.602% (k) | 7,729,235 | | 7,729,235 |
| Unaffiliated Investment Company 0.6% |
| Invesco Government and Agency Portfolio, 4.301% (k)(l) | 4,209,556 | | 4,209,556 |
Total Short-Term Investments
(Cost $11,938,791) | | | 11,938,791 |
Total Investments
(Cost $808,573,662) | 99.5% | | 719,397,189 |
| Other Assets, Less Liabilities | 0.5 | | 3,797,684 |
| Net Assets | 100.0% | | $ 723,194,873 |
| † | Percentages indicated are based on Portfolio net assets. |
| ‡ | Less than one-tenth of a percent. |
| (a) | May be sold to institutional investors only under Rule 144A or securities offered pursuant to Section 4(a)(2) of the Securities Act of 1933, as amended. |
| (b) | Floating rate—Rate shown was the rate in effect as of December 31, 2022. |
| (c) | Fixed to floating rate—Rate shown was the rate in effect as of December 31, 2022. |
| (d) | Security is perpetual and, thus, does not have a predetermined maturity date. The date shown, if applicable, reflects the next call date. |
| (e) | All or a portion of this security was held on loan. As of December 31, 2022, the aggregate market value of securities on loan was $5,995,141; the total market value of collateral held by the Portfolio was $6,278,408. The market value of the collateral held included non-cash collateral in the form of U.S. Treasury securities with a value of $2,068,852. The Portfolio received cash collateral with a value of $4,209,556. (See Note 2(J)) |
| (f) | Illiquid security—As of December 31, 2022, the total market value deemed illiquid under procedures approved by the Board of Trustees was $1,875,000, which represented 0.3% of the Portfolio’s net assets. (Unaudited) |
| (g) | Step coupon—Rate shown was the rate in effect as of December 31, 2022. |
| (h) | Collateralized Mortgage Obligation Interest Only Strip—Pays a fixed or variable rate of interest based on mortgage loans or mortgage pass-through securities. The principal amount of the underlying pool represents the notional amount on which the current interest was calculated. The value of these stripped securities may be particularly sensitive to changes in prevailing interest rates and are typically more sensitive to changes in prepayment rates than traditional mortgage-backed securities. |
| (i) | Collateral strip rate—A bond whose interest was based on the weighted net interest rate of the collateral. The coupon rate adjusts periodically based on a predetermined schedule. Rate shown was the rate in effect as of December 31, 2022. |
| (j) | Coupon rate may change based on changes of the underlying collateral or prepayments of principal. Rate shown was the rate in effect as of December 31, 2022. |
| (k) | Current yield as of December 31, 2022. |
| (l) | Represents a security purchased with cash collateral received for securities on loan. |
Investments in Affiliates (in 000's)
Investments in issuers considered to be affiliate(s) of the Portfolio during the year ended December 31, 2022 for purposes of Section 2(a)(3) of the Investment Company Act of 1940, as amended, were as follows:
| Affiliated Investment Companies | Value,
Beginning
of Year | Purchases
at Cost | Proceeds
from
Sales | Net
Realized
Gain/(Loss)
on Sales | Change in
Unrealized
Appreciation/
(Depreciation) | Value,
End of
Year | Dividend
Income | Other
Distributions | Shares
End of
Year |
| MainStay U.S. Government Liquidity Fund | $ 29,106 | $ 265,078 | $ (286,455) | $ — | $ — | $ 7,729 | $ 100 | $ — | 7,729 |
The notes to the financial statements are an integral part of, and should be read in conjunction with, the financial statements.
23
Portfolio of Investments December 31, 2022† (continued)
Futures Contracts
As of December 31, 2022, the Portfolio held the following futures contracts1:
| Type | Number of
Contracts | Expiration
Date | Value at
Trade Date | Current
Notional
Amount | Unrealized
Appreciation
(Depreciation)2 |
| Long Contracts | | | | | |
| U.S. Treasury 10 Year Ultra Bonds | 764 | March 2023 | $ 90,783,785 | $ 90,366,875 | $ (416,910) |
| U.S. Treasury Long Bonds | 76 | March 2023 | 9,587,785 | 9,526,125 | (61,660) |
| Total Long Contracts | | | | | (478,570) |
| Short Contracts | | | | | |
| U.S. Treasury 2 Year Notes | (178) | March 2023 | (36,447,096) | (36,503,907) | (56,811) |
| U.S. Treasury 5 Year Notes | (888) | March 2023 | (95,904,887) | (95,841,563) | 63,324 |
| U.S. Treasury 10 Year Notes | (500) | March 2023 | (56,428,552) | (56,148,437) | 280,115 |
| U.S. Treasury Ultra Bonds | (65) | March 2023 | (8,840,940) | (8,730,313) | 110,627 |
| Total Short Contracts | | | | | 397,255 |
| Net Unrealized Depreciation | | | | | $ (81,315) |
| 1. | As of December 31, 2022, cash in the amount of $1,493,217 was on deposit with a broker or futures commission merchant for futures transactions. |
| 2. | Represents the difference between the value of the contracts at the time they were opened and the value as of December 31, 2022. |
Swap Contracts
As of December 31, 2022, the Portfolio held the following centrally cleared interest swap agreements1:
Notional
Amount | Currency | Expiration
Date | Payments
made by Portfolio | Payments
Received by Portfolio | Payment Frequency
Paid/Received | Upfront
Premiums
Paid/
(Received) | | Value | | Unrealized
Appreciation/
(Depreciation) |
| $ 50,000,000 | USD | 3/16/23 | Fixed 2.793% | 3 month USD LIBOR | Semi-Annually/Quarterly | $ — | | $ 206,109 | | $ 206,109 |
| 50,000,000 | USD | 3/29/23 | Fixed 2.762% | 3 month USD LIBOR | Semi-Annually/Quarterly | — | | 243,999 | | 243,999 |
| | | | | | | $ — | | $ 450,108 | | $ 450,108 |
| 1. | As of December 31, 2022, cash in the amount of $423 was on deposit with a broker for centrally cleared swap agreements. |
| Abbreviation(s): |
| FHLMC—Federal Home Loan Mortgage Corp. |
| FNMA—Federal National Mortgage Association |
| FREMF—Freddie Mac Multifamily |
| GNMA—Government National Mortgage Association |
| LIBOR—London Interbank Offered Rate |
| REMIC—Real Estate Mortgage Investment Conduit |
| SOFR—Secured Overnight Financing Rate |
| UMBS—Uniform Mortgage Backed Securities |
| USD—United States Dollar |
| USISDA—U.S. dollar International Swaps and Derivatives Association |
The notes to the financial statements are an integral part of, and should be read in conjunction with, the financial statements.
| 24 | MainStay VP MacKay Strategic Bond Portfolio |
The following is a summary of the fair valuations according to the inputs used as of December 31, 2022, for valuing the Portfolio’s assets and liabilities:
| Description | Quoted
Prices in
Active
Markets for
Identical
Assets
(Level 1) | | Significant
Other
Observable
Inputs
(Level 2) | | Significant
Unobservable
Inputs
(Level 3) | | Total |
| Asset Valuation Inputs | | | | | | | |
| Investments in Securities (a) | | | | | | | |
| Long-Term Bonds | | | | | | | |
| Asset-Backed Securities | $ — | | $ 101,121,390 | | $ — | | $ 101,121,390 |
| Corporate Bonds | — | | 306,837,623 | | — | | 306,837,623 |
| Foreign Government Bonds | — | | 19,192,967 | | — | | 19,192,967 |
| Loan Assignments | — | | 1,301,647 | | — | | 1,301,647 |
| Mortgage-Backed Securities | — | | 220,792,545 | | — | | 220,792,545 |
| Municipal Bond | — | | 2,007,459 | | — | | 2,007,459 |
| U.S. Government & Federal Agencies | — | | 56,204,767 | | — | | 56,204,767 |
| Total Long-Term Bonds | — | | 707,458,398 | | — | | 707,458,398 |
| Short-Term Investments | | | | | | | |
| Affiliated Investment Company | 7,729,235 | | — | | — | | 7,729,235 |
| Unaffiliated Investment Company | 4,209,556 | | — | | — | | 4,209,556 |
| Total Short-Term Investments | 11,938,791 | | — | | — | | 11,938,791 |
| Total Investments in Securities | 11,938,791 | | 707,458,398 | | — | | 719,397,189 |
| Other Financial Instruments (b) | | | | | | | |
| Futures Contracts | 454,066 | | — | | — | | 454,066 |
| Interest Rate Swap Contracts | — | | 450,108 | | — | | 450,108 |
| Total Other Financial Instruments | 454,066 | | 450,108 | | — | | 904,174 |
| Total Investments in Securities and Other Financial Instruments | $ 12,392,857 | | $ 707,908,506 | | $ — | | $ 720,301,363 |
| Liability Valuation Inputs | | | | | | | |
| Other Financial Instruments | | | | | | | |
| Futures Contracts (b) | $ (535,381) | | $ — | | $ — | | $ (535,381) |
| (a) | For a complete listing of investments and their industries, see the Portfolio of Investments. |
| (b) | The value listed for these securities reflects unrealized appreciation (depreciation) as shown on the Portfolio of Investments. |
The notes to the financial statements are an integral part of, and should be read in conjunction with, the financial statements.
25
Statement of Assets and Liabilities as of December 31, 2022
| Assets |
Investment in unaffiliated securities, at value
(identified cost $800,844,427) including securities on loan of $5,995,141 | $ 711,667,954 |
Investment in affiliated investment companies, at value
(identified cost $7,729,235) | 7,729,235 |
| Cash | 1,898,595 |
Cash denominated in foreign currencies
(identified cost $435) | 435 |
| Cash collateral on deposit at broker for futures contracts | 1,493,217 |
| Cash collateral on deposit at broker for swap contracts | 423 |
| Receivables: | |
| Interest | 5,427,169 |
| Portfolio shares sold | 263,890 |
| Variation margin on futures contracts | 157,175 |
| Securities lending | 5,776 |
| Other assets | 4,783 |
| Total assets | 728,648,652 |
| Liabilities |
| Cash collateral received for securities on loan | 4,209,556 |
| Payables: | |
| Portfolio shares redeemed | 590,883 |
| Manager (See Note 3) | 362,881 |
| NYLIFE Distributors (See Note 3) | 150,633 |
| Shareholder communication | 62,926 |
| Professional fees | 42,746 |
| Custodian | 11,886 |
| Variation margin on centrally cleared swap contracts | 6,798 |
| Accrued expenses | 15,470 |
| Total liabilities | 5,453,779 |
| Net assets | $ 723,194,873 |
| Composition of Net Assets |
| Shares of beneficial interest outstanding (par value of $.001 per share) unlimited number of shares authorized | $ 79,630 |
| Additional paid-in-capital | 826,782,868 |
| | 826,862,498 |
| Total distributable earnings (loss) | (103,667,625) |
| Net assets | $ 723,194,873 |
| Initial Class | |
| Net assets applicable to outstanding shares | $ 21,924,176 |
| Shares of beneficial interest outstanding | 2,406,330 |
| Net asset value per share outstanding | $ 9.11 |
| Service Class | |
| Net assets applicable to outstanding shares | $701,270,697 |
| Shares of beneficial interest outstanding | 77,223,847 |
| Net asset value per share outstanding | $ 9.08 |
The notes to the financial statements are an integral part of, and should be read in conjunction with, the financial statements.
| 26 | MainStay VP MacKay Strategic Bond Portfolio |
Statement of Operations for the year ended December 31, 2022
| Investment Income (Loss) |
| Income | |
| Interest | $ 33,370,596 |
| Dividends-affiliated | 100,152 |
| Securities lending, net | 72,781 |
| Other | 16,914 |
| Total income | 33,560,443 |
| Expenses | |
| Manager (See Note 3) | 4,726,836 |
| Distribution/Service—Service Class (See Note 3) | 1,978,253 |
| Professional fees | 113,852 |
| Custodian | 61,098 |
| Shareholder communication | 55,798 |
| Trustees | 17,543 |
| Miscellaneous | 30,905 |
| Total expenses | 6,984,285 |
| Net investment income (loss) | 26,576,158 |
| Realized and Unrealized Gain (Loss) |
| Net realized gain (loss) on: | |
| Unaffiliated investment transactions | (16,290,338) |
| Futures transactions | 23,691,262 |
| Swap transactions | (945,090) |
| Net realized gain (loss) | 6,455,834 |
| Net change in unrealized appreciation (depreciation) on: | |
| Unaffiliated investments | (107,132,740) |
| Futures contracts | 2,259,916 |
| Swap contracts | 3,076,600 |
| Net change in unrealized appreciation (depreciation) | (101,796,224) |
| Net realized and unrealized gain (loss) | (95,340,390) |
| Net increase (decrease) in net assets resulting from operations | $ (68,764,232) |
The notes to the financial statements are an integral part of, and should be read in conjunction with, the financial statements.
27
Statements of Changes in Net Assets
for the years ended December 31, 2022 and December 31, 2021
| | 2022 | 2021 |
| Increase (Decrease) in Net Assets |
| Operations: | | |
| Net investment income (loss) | $ 26,576,158 | $ 24,999,031 |
| Net realized gain (loss) | 6,455,834 | 38,509,212 |
| Net change in unrealized appreciation (depreciation) | (101,796,224) | (46,649,225) |
| Net increase (decrease) in net assets resulting from operations | (68,764,232) | 16,859,018 |
| Distributions to shareholders: | | |
| Initial Class | (806,220) | (595,939) |
| Service Class | (25,435,101) | (21,362,833) |
| | (26,241,321) | (21,958,772) |
| Distributions to shareholders from return of capital: | | |
| Initial Class | (8,594) | — |
| Service Class | (271,136) | — |
| | (279,730) | — |
| Total distributions to shareholders | (26,521,051) | (21,958,772) |
| Capital share transactions: | | |
| Net proceeds from sales of shares | 18,852,102 | 54,269,932 |
| Net asset value of shares issued to shareholders in reinvestment of distributions | 26,521,051 | 21,958,772 |
| Cost of shares redeemed | (184,274,909) | (105,606,377) |
| Increase (decrease) in net assets derived from capital share transactions | (138,901,756) | (29,377,673) |
| Net increase (decrease) in net assets | (234,187,039) | (34,477,427) |
| Net Assets |
| Beginning of year | 957,381,912 | 991,859,339 |
| End of year | $ 723,194,873 | $ 957,381,912 |
The notes to the financial statements are an integral part of, and should be read in conjunction with, the financial statements.
| 28 | MainStay VP MacKay Strategic Bond Portfolio |
Financial Highlights selected per share data and ratios
| | Year Ended December 31, |
| Initial Class | 2022 | | 2021 | | 2020 | | 2019 | | 2018 |
| Net asset value at beginning of year | $ 10.19 | | $ 10.25 | | $ 9.92 | | $ 9.60 | | $ 10.06 |
| Net investment income (loss) (a) | 0.34 | | 0.29 | | 0.28 | | 0.29 | | 0.30 |
| Net realized and unrealized gain (loss) | (1.08) | | (0.10) | | 0.32 | | 0.38 | | (0.43) |
| Total from investment operations | (0.74) | | 0.19 | | 0.60 | | 0.67 | | (0.13) |
| Less distributions: | | | | | | | | | |
| From net investment income | (0.34) | | (0.25) | | (0.26) | | (0.35) | | (0.33) |
| Return of capital | (0.00)‡ | | — | | (0.01) | | — | | — |
| Total distributions | (0.34) | | (0.25) | | (0.27) | | (0.35) | | (0.33) |
| Net asset value at end of year | $ 9.11 | | $ 10.19 | | $ 10.25 | | $ 9.92 | | $ 9.60 |
| Total investment return (b) | (7.24)% | | 1.96% | | 6.12% | | 7.06% | | (1.21)% |
| Ratios (to average net assets)/Supplemental Data: | | | | | | | | | |
| Net investment income (loss) | 3.54% | | 2.80% | | 2.84% | | 2.96% | | 3.04% |
| Net expenses (c)(d) | 0.62% | | 0.62% | | 0.70% | | 0.76% | | 0.75% |
| Portfolio turnover rate | 60% | | 62% | | 52%(e) | | 51%(e) | | 33% |
| Net assets at end of year (in 000's) | $ 21,924 | | $ 24,820 | | $ 22,538 | | $ 49,296 | | $ 116,901 |
| ‡ | Less than one cent per share. |
| (a) | Per share data based on average shares outstanding during the year. |
| (b) | Total return does not reflect any deduction of sales charges, mortality and expense charges, contract charges or administrative charges. For periods of less than one year, total return is not annualized. |
| (c) | In addition to the fees and expenses which the Portfolio bears directly, it also indirectly bears a pro-rata share of the fees and expenses of the underlying funds in which it invests. Such indirect expenses are not included in the above expense ratios. |
| (d) | The expense ratios presented below show the impact of short sales expense: |
| Year Ended | | Net Expenses
(excluding short
sale expenses) | | Short Sales
Expenses |
| December 31, 2021 | | 0.61% | | 0.01% |
| December 31, 2020 | | 0.62% | | 0.08% |
| December 31, 2019 | | 0.61% | | 0.15% |
| December 31, 2018 | | 0.60% | | 0.15% |
| (e) | The portfolio turnover rate not including mortgage dollar rolls was 51% and 45% for the years ended December 31, 2020 and 2019, respectively. |
The notes to the financial statements are an integral part of, and should be read in conjunction with, the financial statements.
29
Financial Highlights selected per share data and ratios
| | Year Ended December 31, |
| Service Class | 2022 | | 2021 | | 2020 | | 2019 | | 2018 |
| Net asset value at beginning of year | $ 10.16 | | $ 10.21 | | $ 9.89 | | $ 9.57 | | $ 10.03 |
| Net investment income (loss) (a) | 0.31 | | 0.26 | | 0.26 | | 0.26 | | 0.28 |
| Net realized and unrealized gain (loss) | (1.07) | | (0.08) | | 0.30 | | 0.39 | | (0.43) |
| Total from investment operations | (0.76) | | 0.18 | | 0.56 | | 0.65 | | (0.15) |
| Less distributions: | | | | | | | | | |
| From net investment income | (0.32) | | (0.23) | | (0.23) | | (0.33) | | (0.31) |
| Return of capital | (0.00)‡ | | — | | (0.01) | | — | | — |
| Total distributions | (0.32) | | (0.23) | | (0.24) | | (0.33) | | (0.31) |
| Net asset value at end of year | $ 9.08 | | $ 10.16 | | $ 10.21 | | $ 9.89 | | $ 9.57 |
| Total investment return (b) | (7.47)% | | 1.71% | | 5.86% | | 6.80% | | (1.46)% |
| Ratios (to average net assets)/Supplemental Data: | | | | | | | | | |
| Net investment income (loss) | 3.26% | | 2.53% | | 2.59% | | 2.66% | | 2.79% |
| Net expenses (c)(d) | 0.87% | | 0.87% | | 0.93% | | 1.01% | | 1.00% |
| Portfolio turnover rate | 60% | | 62% | | 52%(e) | | 51%(e) | | 33% |
| Net assets at end of year (in 000's) | $ 701,271 | | $ 932,562 | | $ 969,321 | | $ 990,736 | | $ 999,100 |
| ‡ | Less than one cent per share. |
| (a) | Per share data based on average shares outstanding during the year. |
| (b) | Total return does not reflect any deduction of sales charges, mortality and expense charges, contract charges or administrative charges. For periods of less than one year, total return is not annualized. |
| (c) | In addition to the fees and expenses which the Portfolio bears directly, it also indirectly bears a pro-rata share of the fees and expenses of the underlying funds in which it invests. Such indirect expenses are not included in the above expense ratios. |
| (d) | The expense ratios presented below show the impact of short sales expense: |
| Year Ended | | Net Expenses
(excluding short
sale expenses) | | Short Sales
Expenses |
| December 31, 2021 | | 0.86% | | 0.01% |
| December 31, 2020 | | 0.86% | | 0.07% |
| December 31, 2019 | | 0.86% | | 0.15% |
| December 31, 2018 | | 0.85% | | 0.15% |
| (e) | The portfolio turnover rate not including mortgage dollar rolls was 51% and 45% for the years ended December 31, 2020 and 2019, respectively. |
The notes to the financial statements are an integral part of, and should be read in conjunction with, the financial statements.
| 30 | MainStay VP MacKay Strategic Bond Portfolio |
Notes to Financial Statements
Note 1–Organization and Business
MainStay VP Funds Trust (the “Fund”) was organized as a Delaware statutory trust on February 1, 2011. The Fund is registered under the Investment Company Act of 1940, as amended (the “1940 Act”), as an open-end management investment company. The Fund is comprised of thirty-one separate series (collectively referred to as the “Portfolios”). These financial statements and notes relate to the MainStay VP MacKay Strategic Bond Portfolio (the "Portfolio"), a "diversified” portfolio, as that term is defined in the 1940 Act, as interpreted or modified by regulatory authorities having jurisdiction, from time to time.
Shares of the Portfolio are currently offered to certain separate accounts to fund variable annuity policies and variable universal life insurance policies issued by New York Life Insurance and Annuity Corporation (“NYLIAC”), a wholly-owned subsidiary of New York Life Insurance Company (“New York Life”) and may also be offered to fund variable annuity policies and variable universal life insurance policies issued by other insurance companies. NYLIAC allocates shares of the Portfolio to, among others, certain NYLIAC separate accounts. Shares of the Portfolio are also offered to the MainStay VP Conservative Allocation Portfolio, MainStay VP Moderate Allocation Portfolio, MainStay VP Growth Allocation Portfolio and MainStay VP Equity Allocation Portfolio, which operate as “funds-of-funds," and other variable insurance funds.
The following table lists the Portfolio's share classes that have been registered and commenced operations:
| Class | Commenced Operations |
| Initial Class | April 29, 2011 |
| Service Class | April 29, 2011 |
Shares of the Portfolio are offered and are redeemed at a price equal to their respective net asset value (“NAV”) per share. No sales or redemption charge is applicable to the purchase or redemption of the Portfolio's shares. Under the terms of the Fund’s multiple class plan, adopted pursuant to Rule 18f-3 under the 1940 Act, the classes differ in that, among other things, Service Class shares of the Portfolio pay a combined distribution and service fee of 0.25% of average daily net assets attributable to Service Class shares of the Portfolio to the Distributor (as defined in Note 3(B)) pursuant to a plan adopted in accordance with Rule 12b-1 under the 1940 Act. Contract owners of variable annuity contracts purchased after June 2, 2003, are permitted to invest only in the Service Class shares.
The Portfolio's investment objective is to seek total return by investing primarily in domestic and foreign debt securities.
Note 2–Significant Accounting Policies
The Portfolio is an investment company and accordingly follows the investment company accounting and reporting guidance of the Financial Accounting Standards Board (“FASB”) Accounting Standards Codification Topic 946 Financial Services—Investment Companies. The Portfolio prepares its financial statements in accordance with generally accepted
accounting principles (“GAAP”) in the United States of America and follows the significant accounting policies described below.
(A) Securities Valuation. Investments are usually valued as of the close of regular trading on the New York Stock Exchange (the "Exchange") (usually 4:00 p.m. Eastern time) on each day the Portfolio is open for business ("valuation date").
Effective September 8, 2022, and pursuant to Rule 2a-5 under the 1940 Act, the Board of Trustees of the Fund (the "Board") designated New York Life Investment Management LLC (“New York Life Investments” or the "Manager") as its Valuation Designee (the "Valuation Designee"). The Valuation Designee is responsible for performing fair valuations relating to all investments in the Portfolio’s portfolio for which market quotations are not readily available; periodically assessing and managing material valuation risks; establishing and applying fair value methodologies; testing fair valuation methodologies; evaluating and overseeing pricing services; ensuring appropriate segregation of valuation and portfolio management functions; providing quarterly, annual and prompt reporting to the Board, as appropriate; identifying potential conflicts of interest; and maintaining appropriate records. The Valuation Designee has established a valuation committee ("Valuation Committee") to assist in carrying out the Valuation Designee’s responsibilities and establish prices of securities for which market quotations are not readily available. The Portfolio’s and the Valuation Designee's policies and procedures ("Valuation Procedures") govern the Valuation Designee’s selection and application of methodologies for determining and calculating the fair value of Portfolio investments. The Valuation Designee may value the Portfolio's portfolio securities for which market quotations are not readily available and other Portfolio assets utilizing inputs from pricing services and other third-party sources (together, “Pricing Sources”). The Valuation Committee meets (in person, via electronic mail or via teleconference) on an ad-hoc basis to determine fair valuations and on a quarterly basis to review fair value events with respect to certain securities for which market quotations are not readily available, including valuation risks and back-testing results, and preview reports to the Board.
The Valuation Committee establishes prices of securities for which market quotations are not readily available based on such methodologies and measurements on a regular basis after considering information that is reasonably available and deemed relevant by the Valuation Committee. The Board shall oversee the Valuation Designee and review fair valuation materials on a prompt, quarterly and annual basis and approve proposed revisions to the Valuation Procedures.
Investments for which market quotations are not readily available are valued at fair value as determined in good faith pursuant to the Valuation Procedures. A market quotation is readily available only when that quotation is a quoted price (unadjusted) in active markets for identical investments that the Portfolio can access at the measurement date, provided that a quotation will not be readily available if it is not reliable. "Fair value" is defined as the price the Portfolio would reasonably expect to receive upon selling an asset or liability in an orderly transaction to an independent buyer in the principal or most advantageous market for the
Notes to Financial Statements (continued)
asset or liability. Fair value measurements are determined within a framework that establishes a three-tier hierarchy that maximizes the use of observable market data and minimizes the use of unobservable inputs to establish a classification of fair value measurements for disclosure purposes. "Inputs" refer broadly to the assumptions that market participants would use in pricing the asset or liability, including assumptions about risk, such as the risk inherent in a particular valuation technique used to measure fair value using a pricing model and/or the risk inherent in the inputs for the valuation technique. Inputs may be observable or unobservable. Observable inputs reflect the assumptions market participants would use in pricing the asset or liability based on market data obtained from sources independent of the Portfolio. Unobservable inputs reflect the Portfolio’s own assumptions about the assumptions market participants would use in pricing the asset or liability based on the information available. The inputs or methodology used for valuing assets or liabilities may not be an indication of the risks associated with investing in those assets or liabilities. The three-tier hierarchy of inputs is summarized below.
| • | Level 1—quoted prices (unadjusted) in active markets for an identical asset or liability |
| • | Level 2—other significant observable inputs (including quoted prices for a similar asset or liability in active markets, interest rates and yield curves, prepayment speeds, credit risk, etc.) |
| • | Level 3—significant unobservable inputs (including the Portfolio's own assumptions about the assumptions that market participants would use in measuring fair value of an asset or liability) |
The level of an asset or liability within the fair value hierarchy is based on the lowest level of an input, both individually and in the aggregate, that is significant to the fair value measurement. The aggregate value by input level of the Portfolio’s assets and liabilities as of December 31, 2022, is included at the end of the Portfolio of Investments.
The Portfolio may use third-party vendor evaluations, whose prices may be derived from one or more of the following standard inputs, among others:
| • Benchmark yields | • Reported trades |
| • Broker/dealer quotes | • Issuer spreads |
| • Two-sided markets | • Benchmark securities |
| • Bids/offers | • Reference data (corporate actions or material event notices) |
| • Industry and economic events | • Comparable bonds |
| • Monthly payment information | |
An asset or liability for which a market quotation is not readily available is valued by methods deemed reasonable in good faith by the Valuation Committee, following the Valuation Procedures to represent fair value. Under these procedures, the Valuation Designee generally uses a market-based approach which may use related or comparable assets or liabilities, recent transactions, market multiples, book values and other relevant information. The Valuation Designee may also use an
income-based valuation approach in which the anticipated future cash flows of the asset or liability are discounted to calculate fair value. Discounts may also be applied due to the nature and/or duration of any restrictions on the disposition of the asset or liability. Fair value represents a good faith approximation of the value of a security. Fair value determinations involve the consideration of a number of subjective factors, an analysis of applicable facts and circumstances and the exercise of judgment. As a result, it is possible that the fair value for a security determined in good faith in accordance with the Valuation Procedures may differ from valuations for the same security determined for other funds using their own valuation procedures. Although the Valuation Procedures are designed to value a security at the price the Portfolio may reasonably expect to receive upon the security's sale in an orderly transaction, there can be no assurance that any fair value determination thereunder would, in fact, approximate the amount that the Portfolio would actually realize upon the sale of the security or the price at which the security would trade if a reliable market price were readily available. During the year ended December 31, 2022, there were no material changes to the fair value methodologies.
Securities which may be valued in this manner include, but are not limited to: (i) a security for which trading has been halted or suspended or otherwise does not have a readily available market quotation on a given day; (ii) a debt security that has recently gone into default and for which there is not a current market quotation; (iii) a security of an issuer that has entered into a restructuring; (iv) a security that has been delisted from a national exchange; (v) a security subject to trading collars for which no or limited trading takes place; and (vi) a security whose principal market has been temporarily closed at a time when, under normal conditions, it would be open. Securities valued in this manner are generally categorized as Level 2 or 3 in the hierarchy.
Investments in mutual funds, including money market funds, are valued at their respective NAVs at the close of business each day on the valuation date. These securities are generally categorized as Level 1 in the hierarchy.
Futures contracts are valued at the last posted settlement price on the market where such futures are primarily traded. These securities are generally categorized as Level 1 in the hierarchy.
Swaps are marked to market daily based upon quotations from pricing agents, brokers or market makers. These securities are generally categorized as Level 2 in the hierarchy.
Debt securities (other than convertible and municipal bonds) are valued at the evaluated bid prices (evaluated mean prices in the case of convertible and municipal bonds) supplied by a pricing agent or broker selected by the Valuation Designee, in consultation with the Subadvisor. The evaluations are market-based measurements processed through a pricing application and represents the pricing agent’s good faith determination as to what a holder may receive in an orderly transaction under market conditions. The rules-based logic utilizes valuation techniques that reflect participants’ assumptions and vary by asset class and per methodology, maximizing the use of relevant observable data including quoted prices
| 32 | MainStay VP MacKay Strategic Bond Portfolio |
for similar assets, benchmark yield curves and market corroborated inputs. The evaluated bid or mean prices are deemed by the Valuation Designee, in consultation with the Subadvisor, to be representative of market values at the regular close of trading of the Exchange on each valuation date. Debt securities purchased on a delayed delivery basis are marked to market daily until settlement at the forward settlement date. Debt securities, including corporate bonds, U.S. government and federal agency bonds, municipal bonds, foreign bonds, convertible bonds, asset-backed securities and mortgage-backed securities are generally categorized as Level 2 in the hierarchy.
Loan assignments, participations and commitments are valued at the average of bid quotations obtained from the engaged independent pricing service and are generally categorized as Level 2 in the hierarchy. Certain loan assignments, participations and commitments may be valued by utilizing significant unobservable inputs obtained from the pricing service and are generally categorized as Level 3 in the hierarchy. No securities held by the Portfolio as of December 31, 2022 were fair valued utilizing significant unobservable inputs obtained from the pricing service.
Temporary cash investments acquired in excess of 60 days to maturity at the time of purchase are valued using the latest bid prices or using valuations based on a matrix system (which considers such factors as security prices, yields, maturities and ratings), both as furnished by independent pricing services. Temporary cash investments that mature in 60 days or less at the time of purchase ("Short-Term Investments") are valued using the amortized cost method of valuation, unless the use of such method would be inappropriate. The amortized cost method involves valuing a security at its cost on the date of purchase and thereafter assuming a constant amortization to maturity of the difference between such cost and the value on maturity date. Amortized cost approximates the current fair value of a security. Securities valued using the amortized cost method are not valued using quoted prices in an active market and are generally categorized as Level 2 in the hierarchy.
The information above is not intended to reflect an exhaustive list of the methodologies that may be used to value portfolio investments. The Valuation Procedures permit the use of a variety of valuation methodologies in connection with valuing portfolio investments. The methodology used for a specific type of investment may vary based on the market data available or other considerations. The methodologies summarized above may not represent the specific means by which portfolio investments are valued on any particular business day.
A portfolio investment may be classified as an illiquid investment under the Portfolio's written liquidity risk management program and related procedures (“Liquidity Program”). Illiquidity of an investment might prevent the sale of such investment at a time when the Manager or the Subadvisor might wish to sell, and these investments could have the effect of decreasing the overall level of the Portfolio's liquidity. Further, the lack of an established secondary market may make it more difficult to value illiquid investments, requiring the Portfolio to rely on judgments that may be somewhat subjective in measuring value, which could vary materially from the amount that the Portfolio could realize upon
disposition. Difficulty in selling illiquid investments may result in a loss or may be costly to the Portfolio. An illiquid investment is any investment that the Manager or Subadvisor reasonably expects cannot be sold or disposed of in current market conditions in seven calendar days or less without the sale or disposition significantly changing the market value of the investment. The liquidity classification of each investment will be made using information obtained after reasonable inquiry and taking into account, among other things, relevant market, trading and investment-specific considerations in accordance with the Liquidity Program. Illiquid investments are often fair valued in accordance with the Portfolio's procedures described above. The liquidity of the Portfolio's investments was determined as of December 31, 2022, and can change at any time. Illiquid investments as of December 31, 2022, are shown in the Portfolio of Investments.
(B) Income Taxes. The Portfolio's policy is to comply with the requirements of the Internal Revenue Code of 1986, as amended (the “Internal Revenue Code”), applicable to regulated investment companies and to distribute all of its taxable income to the shareholders of the Portfolio within the allowable time limits.
The Manager evaluates the Portfolio’s tax positions to determine if the tax positions taken meet the minimum recognition threshold in connection with accounting for uncertainties in income tax positions taken or expected to be taken for the purposes of measuring and recognizing tax liabilities in the financial statements. Recognition of tax benefits of an uncertain tax position is permitted only to the extent the position is “more likely than not” to be sustained assuming examination by taxing authorities. The Manager analyzed the Portfolio's tax positions taken on federal, state and local income tax returns for all open tax years (for up to three tax years) and has concluded that no provisions for federal, state and local income tax are required in the Portfolio's financial statements. The Portfolio's federal, state and local income tax and federal excise tax returns for tax years for which the applicable statutes of limitations have not expired are subject to examination by the Internal Revenue Service and state and local departments of revenue.
(C) Dividends and Distributions to Shareholders. Dividends and distributions are recorded on the ex-dividend date. The Portfolio intends to declare and pay dividends from net investment income and distributions from net realized capital and currency gains, if any, at least annually. All dividends and distributions are reinvested at NAV in the same class of shares of the Portfolio. Dividends and distributions to shareholders are determined in accordance with federal income tax regulations and may differ from determinations using GAAP.
(D) Security Transactions and Investment Income. The Portfolio records security transactions on the trade date. Realized gains and losses on security transactions are determined using the identified cost method. Dividend income is recognized on the ex-dividend date, net of any foreign tax withheld at the source, and interest income is accrued as earned using the effective interest rate method and includes any realized gains and losses from repayments of principal on mortgage-backed securities. Distributions received from real estate investment trusts may be classified
Notes to Financial Statements (continued)
as dividends, capital gains and/or return of capital. Discounts and premiums on securities purchased for the Portfolio are accreted and amortized, respectively, on the effective interest rate method.
Investment income and realized and unrealized gains and losses on investments of the Portfolio are allocated pro rata to the separate classes of shares based upon their relative net assets on the date the income is earned or realized and unrealized gains and losses are incurred.
The Portfolio may place a debt security on non-accrual status and reduce related interest income by ceasing current accruals and writing off all or a portion of any interest receivables when the collection of all or a portion of such interest has become doubtful. A debt security is removed from non-accrual status when the issuer resumes interest payments or when collectability of interest is reasonably assured.
(E) Expenses. Expenses of the Fund are allocated to the individual Portfolios in proportion to the net assets of the respective Portfolios when the expenses are incurred, except where direct allocations of expenses can be made. Expenses (other than fees incurred under the distribution and service plans, further discussed in Note 3(B), which are charged directly to the Service Class shares) are allocated to separate classes of shares pro rata based upon their relative net assets on the date the expenses are incurred. The expenses borne by the Portfolio, including those of related parties to the Portfolio, are shown in the Statement of Operations.
Additionally, the Portfolio may invest in mutual funds, which are subject to management fees and other fees that may cause the costs of investing in mutual funds to be greater than the costs of owning the underlying securities directly. These indirect expenses of mutual funds are not included in the amounts shown as expenses in the Statement of Operations or in the expense ratios included in the Financial Highlights.
(F) Use of Estimates. In preparing financial statements in conformity with GAAP, the Manager makes estimates and assumptions that affect the reported amounts and disclosures in the financial statements. Actual results could differ from those estimates and assumptions.
(G) Futures Contracts. A futures contract is an agreement to purchase or sell a specified quantity of an underlying instrument at a specified future date and price, or to make or receive a cash payment based on the value of a financial instrument (e.g., foreign currency, interest rate, security or securities index). The Portfolio is subject to risks such as market price risk, leverage risk, liquidity risk, counterparty risk, operational risk, legal risk and/or interest rate risk in the normal course of investing in these contracts. Upon entering into a futures contract, the Portfolio is required to pledge to the broker or futures commission merchant an amount of cash and/or U.S. government securities equal to a certain percentage of the collateral amount, known as the “initial margin.” During the period the futures contract is open, changes in the value of the contract are recognized as unrealized appreciation or depreciation by marking to market such contract on a daily basis to reflect the market value of the contract at the end of each day’s trading. The Portfolio agrees to receive from or pay to the broker or futures
commission merchant an amount of cash equal to the daily fluctuation in the value of the contract. Such receipts or payments are known as “variation margin.” When the futures contract is closed, the Portfolio records a realized gain or loss equal to the difference between the proceeds from (or cost of) the closing transaction and the Portfolio's basis in the contract.
The use of futures contracts involves, to varying degrees, elements of market risk in excess of the amount recognized in the Statement of Assets and Liabilities. The contract or notional amounts and variation margin reflect the extent of the Portfolio's involvement in open futures positions. There are several risks associated with the use of futures contracts as hedging techniques. There can be no assurance that a liquid market will exist at the time when the Portfolio seeks to close out a futures contract. If no liquid market exists, the Portfolio would remain obligated to meet margin requirements until the position is closed. Futures contracts may involve a small initial investment relative to the risk assumed, which could result in losses greater than if the Portfolio did not invest in futures contracts. Futures contracts may be more volatile than direct investments in the instrument underlying the futures and may not correlate to the underlying instrument, causing a given hedge not to achieve its objectives. The Portfolio's activities in futures contracts have minimal counterparty risk as they are conducted through regulated exchanges that guarantee the futures against default by the counterparty. In the event of a bankruptcy or insolvency of a futures commission merchant that holds margin on behalf of the Portfolio, the Portfolio may not be entitled to the return of the entire margin owed to the Portfolio, potentially resulting in a loss. The Portfolio may invest in futures contracts to seek enhanced returns or to reduce the risk of loss by hedging certain of its holdings. The Portfolio's investment in futures contracts and other derivatives may increase the volatility of the Portfolio's NAVs and may result in a loss to the Portfolio. Open futures contracts as of December 31, 2022, are shown in the Portfolio of Investments.
(H) Loan Assignments, Participations and Commitments. The Portfolio may invest in loan assignments and participations ("loans"). Commitments are agreements to make money available to a borrower in a specified amount, at a specified rate and within a specified time. The Portfolio records an investment when the borrower withdraws money on a commitment or when a funded loan is purchased (trade date) and records interest as earned. These loans pay interest at rates that are periodically reset by reference to a base lending rate plus a spread. These base lending rates are generally the prime rate offered by a designated U.S. bank, the London Interbank Offered Rate ("LIBOR") or an alternative reference rate.
The loans in which the Portfolio may invest are generally readily marketable, but may be subject to some restrictions on resale. For example, the Portfolio may be contractually obligated to receive approval from the agent bank and/or borrower prior to the sale of these investments. If the Portfolio purchases an assignment from a lender, the Portfolio will generally have direct contractual rights against the borrower in favor of the lender. If the Portfolio purchases a participation interest
| 34 | MainStay VP MacKay Strategic Bond Portfolio |
either from a lender or a participant, the Portfolio typically will have established a direct contractual relationship with the seller of the participation interest, but not with the borrower. Consequently, the Portfolio is subject to the credit risk of the lender or participant who sold the participation interest to the Portfolio, in addition to the usual credit risk of the borrower. In the event that the borrower, selling participant or intermediate participants become insolvent or enter into bankruptcy, the Portfolio may incur certain costs and delays in realizing payment, or may suffer a loss of principal and/or interest.
Unfunded commitments represent the remaining obligation of the Portfolio to the borrower. At any point in time, up to the maturity date of the issue, the borrower may demand the unfunded portion. Unfunded amounts, if any, are marked to market and any unrealized gains or losses are recorded in the Statement of Assets and Liabilities. As of December 31, 2022, the Portfolio did not hold any unfunded commitments.
(I) Swap Contracts. The Portfolio may enter into credit default, interest rate, equity, index and currency exchange rate swap contracts (“swaps”). In a typical swap transaction, two parties agree to exchange the future returns (or differentials in rates of future returns) earned or realized at periodic intervals on a particular investment or instrument based on a notional principal amount. Generally, the Portfolio will enter into a swap on a net basis, which means that the two payment streams under the swap are netted, with the Portfolio receiving or paying (as the case may be) only the net amount of the two payment streams. Therefore, the Portfolio's current obligation under a swap generally will be equal to the net amount to be paid or received under the swap, based on the relative value of notional positions attributable to each counterparty to the swap. The payments may be adjusted for transaction costs, interest payments, the amount of interest paid on the investment or instrument or other factors. Collateral, in the form of cash or securities, may be required to be held in segregated accounts with the custodian bank or broker in accordance with the terms of the swap. Swap agreements are privately negotiated in the over the counter (“OTC”) market and may be executed in a multilateral or other trade facilities platform, such as a registered commodities exchange (“centrally cleared swaps”).
Certain standardized swaps, including certain credit default and interest rate swaps, are subject to mandatory clearing and exchange-trading, and more types of standardized swaps are expected to be subject to mandatory clearing and exchange-trading in the future. The counterparty risk for exchange-traded and cleared derivatives is expected to be generally lower than for uncleared derivatives, but cleared contracts are not risk-free. In a cleared derivative transaction, the Portfolio typically enters into the transaction with a financial institution counterparty, and performance of the transaction is effectively guaranteed by a central clearinghouse, thereby reducing or eliminating the Portfolio's exposure to the credit risk of its original counterparty. The Portfolio will be required to post specified levels of margin with the clearinghouse or at the instruction of the clearinghouse; the margin required by a clearinghouse may be greater than the margin the Portfolio would be required to post in an
uncleared transaction. As of December 31, 2022, all swap positions outstanding are shown in the Portfolio of Investments.
Swaps are marked to market daily based upon quotations from pricing agents, brokers, or market makers and the change in value, if any, is recorded as unrealized appreciation or depreciation. Any payments made or received upon entering into a swap would be amortized or accreted over the life of the swap and recorded as a realized gain or loss. Early termination of a swap is recorded as a realized gain or loss. Daily changes in valuation of centrally cleared swaps, if any, are recorded as a receivable or payable for the change in value as appropriate on the Statement of Assets and Liabilities.
The Portfolio bears the risk of loss of the amount expected to be received under a swap in the event of the default or bankruptcy of the swap counterparty. The Portfolio may be able to eliminate its exposure under a swap either by assignment or other disposition, or by entering into an offsetting swap with the same party or a similar credit-worthy party. Swaps are not actively traded on financial markets. Entering into swaps involves elements of credit, market, leverage, liquidity, operational, counterparty and legal/documentation risk in excess of the amounts recognized on the Statement of Assets and Liabilities. Such risks involve the possibilities that there will be no liquid market for these swaps, that the counterparty to the swaps may default on its obligation to perform or disagree as to the meaning of the contractual terms in the swaps and that there may be unfavorable changes in interest rates, the price of the index or the security underlying these transactions, among other risks.
Interest Rate Swaps : An interest rate swap is an agreement between two parties where one stream of future interest payments is exchanged for another based on a specified principal amount. Interest rate swaps often exchange a fixed payment for a floating payment that is linked to an interest rate (most often LIBOR). The Portfolio will typically use interest rate swaps to limit, or manage, its exposure to fluctuations in interest rates, or to obtain a marginally lower interest rate than it would have been able to get without the swap.
(J) Securities Lending. In order to realize additional income, the Portfolio may engage in securities lending, subject to the limitations set forth in the 1940 Act and relevant guidance by the staff of the Securities and Exchange Commission (“SEC”). If the Portfolio engages in securities lending, the Portfolio will lend through its custodian, JPMorgan Chase Bank, N.A., ("JPMorgan"), acting as securities lending agent on behalf of the Portfolio. Under the current arrangement, JPMorgan will manage the Portfolio's collateral in accordance with the securities lending agency agreement between the Portfolio and JPMorgan, and indemnify the Portfolio against counterparty risk. The loans will be collateralized by cash (which may be invested in a money market fund) and/or non-cash collateral (which may include U.S. Treasury securities and/or U.S. government agency securities issued or guaranteed by the United States government or its agencies or instrumentalities) at least equal at all times to the market value of the securities loaned. Non-cash collateral held at year end is segregated and cannot be transferred by the Portfolio. The Portfolio bears the risk of delay in recovery of, or loss of rights in, the
Notes to Financial Statements (continued)
securities loaned. The Portfolio may also record a realized gain or loss on securities deemed sold due to a borrower’s inability to return securities on loan. The Portfolio bears the risk of any loss on investment of cash collateral. The Portfolio will receive compensation for lending its securities in the form of fees or it will retain a portion of interest earned on the investment of any cash collateral. The Portfolio will also continue to receive interest and dividends on the securities loaned and any gain or loss in the market price of the securities loaned that may occur during the term of the loan will be for the account of the Portfolio. Income earned from securities lending activities, if any, is reflected in the Statement of Operations. Securities on loan as of December 31, 2022, are shown in the Portfolio of Investments.
(K) Dollar Rolls. The Portfolio may enter into dollar roll transactions in which it sells mortgage-backed securities ("MBS") from its portfolio to a counterparty from whom it simultaneously agrees to buy a similar security on a delayed delivery basis. The Portfolio generally transfers MBS where the MBS are "to be announced," therefore, the Portfolio accounts for these transactions as purchases and sales.
When accounted for as purchase and sales, the securities sold in connection with the dollar rolls are removed from the portfolio and a realized gain or loss is recognized. The securities the Portfolio has agreed to acquire are included at market value in the Portfolio of Investments and liabilities for such purchase commitments are included as payables for investments purchased. During the roll period, the Portfolio foregoes principal and interest paid on the securities. The Portfolio is compensated by the difference between the current sales price and the forward price for the future as well as by the earnings on the cash proceeds of the initial sale. Dollar rolls may be renewed without physical delivery of the securities subject to the contract. Dollar roll transactions involve certain risks, including the risk that the securities returned to the Portfolio at the end of the roll period, while substantially similar, could be inferior to what was initially sold to the counterparty.
(L) Debt and Foreign Securities Risk. The ability of issuers of debt securities held by the Portfolio to meet their obligations may be affected by, among other things, economic or political developments in a specific country, industry or region. Debt securities are also subject to the risks associated with changes in interest rates. The Portfolio primarily invests in high yield debt securities (commonly referred to as “junk bonds”), which are considered speculative because they present a greater risk of loss, including default, than higher rated debt securities. These securities pay investors a premium—a higher interest rate or yield than investment grade debt securities—because of the increased risk of loss. These securities can also be subject to greater price volatility. In times of unusual or adverse market, economic or political conditions, these securities may experience higher than normal default rates.
Investments in the Portfolio are not guaranteed, even though some of the Portfolio’s underlying investments are guaranteed by the U.S. government or its agencies or instrumentalities. The principal risk of mortgage-related and asset-backed securities is that the underlying debt may be prepaid ahead of schedule, if interest rates fall, thereby reducing the value of the
Portfolio’s investment. If interest rates rise, less of the debt may be prepaid and the Portfolio may lose money because the Portfolio may be unable to invest in higher yielding assets. The Portfolio is subject to interest-rate risk and can lose principal value when interest rates rise. Bonds are also subject to credit risk, in which the bond issuer may fail to pay interest and principal in a timely manner.
The Portfolio may invest in loans which are usually rated below investment grade and are generally considered speculative because they present a greater risk of loss, including default, than higher rated debt securities. These investments pay investors a higher interest rate than investment grade debt securities because of the increased risk of loss. Although certain loans are collateralized, there is no guarantee that the value of the collateral will be sufficient to repay the loan. In a recession or serious credit event, the value of these investments could decline significantly. As a result of these and other events, the Portfolio’s NAVs could go down and you could lose money.
In addition, loans generally are subject to the extended settlement periods that may be longer than seven days. As a result, the Portfolio may be adversely affected by selling other investments at an unfavorable time and/or under unfavorable conditions or engaging in borrowing transactions, such as borrowing against its credit facility, to raise cash to meet redemption obligations or pursue other investment opportunities.
In certain circumstances, loans may not be deemed to be securities. As a result, the Portfolio may not have the protection of anti-fraud provisions of the federal securities laws. In such cases, the Portfolio generally must rely on the contractual provisions in the loan agreement and common-law fraud protections under applicable state law.
The ability of issuers of debt securities held by the Portfolio to meet their obligations may be affected by, among other things, economic or political developments in a specific country, industry or region. Debt securities are also subject to the risks associated with changes in interest rates. The Portfolio may invest in foreign securities, which carry certain risks that are in addition to the usual risks inherent in domestic securities. These risks include those resulting from currency fluctuations, future adverse political or economic developments and possible imposition of currency exchange blockages or other foreign governmental laws or restrictions. These risks are likely to be greater in emerging markets than in developed markets. The ability of issuers of debt securities held by the Portfolio to meet their obligations may be affected by, among other things, economic or political developments in a specific country, industry or region.
(M) Counterparty Credit Risk. In order to better define its contractual rights and to secure rights that will help the Portfolio mitigate its counterparty risk, the Portfolio may enter into an International Swaps and Derivatives Association, Inc. Master Agreement (“ISDA Master Agreement”) or similar agreement with its counterparties. An ISDA Master Agreement is a bilateral agreement between the Portfolio and a counterparty that governs certain OTC derivatives and typically contains collateral posting terms and netting provisions. Under an ISDA Master Agreement, the Portfolio may, under certain circumstances, offset with
| 36 | MainStay VP MacKay Strategic Bond Portfolio |
the counterparty certain derivative financial instruments’ payables and/ or receivables with collateral held and/or posted and create one single net payment. The provisions of the ISDA Master Agreement typically permit a single net payment in the event of default including the bankruptcy or insolvency of the counterparty. Bankruptcy or insolvency laws of a particular jurisdiction may restrict or prohibit the right of offset in bankruptcy, insolvency or other events. In addition, certain ISDA Master Agreements may contain provisions for early termination of OTC derivative transactions in the event the net assets of the Portfolio decline below specific levels or if the Portfolio fails to meet the terms of its ISDA Master Agreements. The result would cause the Portfolio to accelerate payment of any net liability owed to the counterparty.
For financial reporting purposes, the Portfolio does not offset derivative assets and derivative liabilities that are subject to netting arrangements, if any, in the Statement of Assets and Liabilities.
(N) LIBOR Replacement Risk. The Portfolio may invest in certain debt securities, derivatives or other financial instruments that utilize LIBOR, as a “benchmark” or “reference rate” for various interest rate calculations. As of January 1, 2022, the United Kingdom Financial Conduct Authority, which regulates LIBOR, ceased its active encouragement of banks to provide the quotations needed to sustain most LIBOR rates due to the absence of an active market for interbank unsecured lending and other reasons. However, the United Kingdom Financial Conduct Authority, the LIBOR administrator and other regulators announced that the most widely used tenors of U.S. dollar LIBOR will continue until mid-2023. As a result, it is anticipated that the remaining LIBOR settings will be discontinued or will no longer be sufficiently robust to be representative of its underlying market around that time. Various financial industry groups will plan for that transition and certain regulators and industry groups have taken actions to establish alternative reference rates (e.g., the Secured Overnight Financing Rate, which measures the cost of overnight borrowings through repurchase agreement transactions collateralized with U.S. Treasury securities and is intended to replace U.S. dollar LIBOR with certain adjustments). However, there are challenges to converting certain contracts and transactions to a new benchmark and neither the full effects of the transition process nor its ultimate outcome is known.
The elimination of LIBOR or changes to other reference rates or any other changes or reforms to the determination or supervision of reference rates could have an adverse impact on the market for, or value of, any securities or payments linked to those reference rates, which may adversely affect the Portfolio's performance and/or net asset value. Uncertainty and risk also remain regarding the willingness and ability of issuers and lenders to include enhanced provisions in new and existing contracts or instruments. Consequently, the transition away from LIBOR to other reference rates may lead to increased volatility and illiquidity in markets that are tied to LIBOR, fluctuations in values of LIBOR-related investments or investments in issuers that utilize LIBOR, increased difficulty in borrowing or refinancing and diminished effectiveness of hedging strategies, adversely affecting the Portfolio's performance.
Furthermore, the risks associated with the expected discontinuation of LIBOR and transition may be exacerbated if the work necessary to effect an orderly transition to an alternative reference rate is not completed in a timely manner. While the transition away from LIBOR has already begun with no material adverse effect to the Portfolio's performance, the transition is expected to last through mid-2023 for some LIBOR tenors. The usefulness of LIBOR as a benchmark could deteriorate anytime during this transition period.
(O) Indemnifications. Under the Fund’s organizational documents, its officers and trustees are indemnified against certain liabilities that may arise out of performance of their duties to the Fund. Additionally, in the normal course of business, the Portfolio enters into contracts with third-party service providers that contain a variety of representations and warranties and that may provide general indemnifications. The Portfolio's maximum exposure under these arrangements is unknown, as this would involve future claims that may be made against the Portfolio that have not yet occurred. The Manager believes that the risk of loss in connection with these potential indemnification obligations is remote. However, there can be no assurance that material liabilities related to such obligations will not arise in the future, which could adversely impact the Portfolio.
(P) Quantitative Disclosure of Derivative Holdings. The following tables show additional disclosures related to the Portfolio's derivative and hedging activities, including how such activities are accounted for and their effect on the Portfolio's financial positions, performance and cash flows. These derivatives are not accounted for as hedging instruments.
The Portfolio entered into futures contracts in order to help manage the duration and yield curve of the portfolio while minimizing the exposure to wider bid/ask spreads in traditional bonds.
The Portfolio also entered into interest rate swaps to hedge the potential risk of rising short term interest rates.
Fair value of derivative instruments as of December 31, 2022:
| Asset Derivatives | Interest
Rate
Contracts
Risk | Total |
| Futures Contracts - Net Assets—Net unrealized appreciation on futures contracts (a) | $454,066 | $454,066 |
| Centrally Cleared Swap Contracts - Net Assets—Net unrealized appreciation on swap contracts (b) | 450,108 | 450,108 |
| Total Fair Value | $904,174 | $904,174 |
| (a) | Includes cumulative appreciation (depreciation) of futures contracts as reported in the Portfolio of Investments. Only current day’s variation margin is reported within the Statement of Assets and Liabilities. |
| (b) | Includes cumulative appreciation (depreciation) of centrally cleared swap agreements as reported in the Portfolio of Investments. Only the current day’s variation margin is reported within the Statement of Assets and Liabilities. |
Notes to Financial Statements (continued)
| Liability Derivatives | Interest
Rate
Contracts
Risk | Total |
| Futures Contracts - Net Assets—Net unrealized depreciation on futures contracts (a) | $(535,381) | $(535,381) |
| Total Fair Value | $(535,381) | $(535,381) |
| (a) | Includes cumulative appreciation (depreciation) of futures contracts as reported in the Portfolio of Investments. Only current day’s variation margin is reported within the Statement of Assets and Liabilities. |
The effect of derivative instruments on the Statement of Operations for the year ended December 31, 2022:
| Net Realized Gain (Loss) from: | Interest
Rate
Contracts
Risk | Total |
| Futures Contracts | $23,691,262 | $23,691,262 |
| Swap Contracts | (945,090) | (945,090) |
| Total Net Realized Gain (Loss) | $22,746,172 | $22,746,172 |
| Net Change in Unrealized Appreciation (Depreciation) | Interest
Rate
Contracts
Risk | Total |
| Futures Contracts | $2,259,916 | $2,259,916 |
| Swap Contracts | 3,076,600 | 3,076,600 |
| Total Net Change in Unrealized Appreciation (Depreciation) | $5,336,516 | $5,336,516 |
| Average Notional Amount | Total |
| Futures Contracts Long | $ 50,925,728 |
| Futures Contracts Short | $(202,625,248) |
| Swap Contracts Long | $ 100,000,000 |
Note 3–Fees and Related Party Transactions
(A) Manager and Subadvisor. New York Life Investments, a registered investment adviser and an indirect, wholly-owned subsidiary of New York Life, serves as the Portfolio's Manager, pursuant to an Amended and Restated Management Agreement ("Management Agreement"). The Manager provides offices, conducts clerical, recordkeeping and bookkeeping services and keeps most of the financial and accounting records required to be maintained by the Portfolio. Except for the portion of salaries and expenses that are the responsibility of the Portfolio, the Manager pays the salaries and expenses of all personnel affiliated with the Portfolio and certain operational expenses of the Portfolio. During a portion of the year ended December 31, 2022, the Portfolio reimbursed New York Life Investments in an amount equal to the portion of the compensation of the Chief Compliance Officer attributable to the Portfolio. MacKay Shields LLC ("MacKay Shields" or the "Subadvisor"), a registered investment adviser and an indirect, wholly-owned subsidiary of New York Life, serves as the Subadvisor to the Portfolio and is responsible for the
day-to-day portfolio management of the Portfolio. Pursuant to the terms of an Amended and Restated Subadvisory Agreement between New York Life Investments and MacKay Shields, New York Life Investments pays for the services of the Subadvisor.
Pursuant to the Management Agreement, the Fund pays the Manager, on behalf of the Portfolio, a monthly fee for the services performed and the facilities furnished at an annual rate of the Portfolio's average daily net assets as follows: 0.60% up to $500 million; 0.55% from $500 million to $1 billion; 0.50% from $1 billion to $5 billion; and 0.475% in excess of $5 billion. During the year ended December 31, 2022, the effective management fee rate was 0.58%.
During the year ended December 31, 2022, New York Life Investments earned fees from the Portfolio in the amount of $4,726,836 and paid the Subadvisor fees of $2,363,418.
JPMorgan provides sub-administration and sub-accounting services to the Portfolio pursuant to an agreement with New York Life Investments. These services include calculating the daily NAVs of the Portfolio, maintaining the general ledger and sub-ledger accounts for the calculation of the Portfolio's NAVs, and assisting New York Life Investments in conducting various aspects of the Portfolio's administrative operations. For providing these services to the Portfolio, JPMorgan is compensated by New York Life Investments.
Pursuant to an agreement between the Fund and New York Life Investments, New York Life Investments is responsible for providing or procuring certain regulatory reporting services for the Portfolio. The Portfolio will reimburse New York Life Investments for the actual costs incurred by New York Life Investments in connection with providing or procuring these services for the Portfolio.
(B) Distribution and Service Fees. The Fund, on behalf of the Portfolio, has entered into a distribution agreement with NYLIFE Distributors LLC (the “Distributor”), an affiliate of New York Life Investments. The Portfolio has adopted a distribution plan (the “Plan”) in accordance with the provisions of Rule 12b-1 under the 1940 Act. Under the Plan, the Distributor has agreed to provide, through its affiliates or independent third parties, various distribution-related, shareholder and administrative support services to the Service Class shareholders. For its services, the Distributor is entitled to a combined distribution and service fee accrued daily and paid monthly at an annual rate of 0.25% of the average daily net assets attributable to the Service Class shares of the Portfolio.
| 38 | MainStay VP MacKay Strategic Bond Portfolio |
Note 4-Federal Income Tax
As of December 31, 2022, the cost and unrealized appreciation (depreciation) of the Portfolio’s investment portfolio, including applicable derivative contracts and other financial instruments, as determined on a federal income tax basis, were as follows:
| | Federal Tax
Cost | Gross
Unrealized
Appreciation | Gross
Unrealized
(Depreciation) | Net
Unrealized
Appreciation/
(Depreciation) |
| Investments in Securities | $808,649,294 | $2,314,711 | $(91,138,925) | $(88,824,214) |
As of December 31, 2022, the components of accumulated gain (loss) on a tax basis were as follows:
Ordinary
Income | Accumulated
Capital
and Other
Gain (Loss) | Other
Temporary
Differences | Unrealized
Appreciation
(Depreciation) | Total
Accumulated
Gain (Loss) |
| $— | $(14,865,628) | $— | $(88,801,997) | $(103,667,625) |
The difference between book-basis and tax-basis unrealized appreciation (depreciation) is primarily due to cumulative bond amortization discount, straddle loss deferral, wash sale adjustments and mark to market of futures contracts.
As of December 31, 2022, for federal income tax purposes, capital loss carryforwards of $14,843,411, as shown in the table below, were available to the extent provided by the regulations to offset future realized gains of the Portfolio. Accordingly, no capital gains distributions are expected to be paid to shareholders until net gains have been realized in excess of such amounts.
Capital Loss
Available Through | Short-Term
Capital Loss
Amounts (000’s) | Long-Term
Capital Loss
Amounts (000’s) |
| Unlimited | $— | $14,843 |
The Portfolio utilized $7,057,430 of capital loss carryforwards during the year ended December 31, 2022.
During the years ended December 31, 2022 and December 31, 2021, the tax character of distributions paid as reflected in the Statements of Changes in Net Assets was as follows:
| | 2022 | 2021 |
| Distributions paid from: | | |
| Ordinary Income | $26,241,321 | $21,958,772 |
| Return of Capital | 279,730 | — |
| Total | $26,521,051 | $21,958,772 |
Note 5–Custodian
JPMorgan is the custodian of cash and securities held by the Portfolio. Custodial fees are charged to the Portfolio based on the Portfolio's net assets and/or the market value of securities held by the Portfolio and the number of certain transactions incurred by the Portfolio.
Note 6–Line of Credit
The Portfolio and certain other funds managed by New York Life Investments maintain a line of credit with a syndicate of banks in order to secure a source of funds for temporary purposes to meet unanticipated or excessive redemption requests.
Effective July 26, 2022, under the credit agreement (the “Credit Agreement”), the aggregate commitment amount is $600,000,000 with an additional uncommitted amount of $100,000,000. The commitment fee is an annual rate of 0.15% of the average commitment amount payable quarterly, regardless of usage, to JPMorgan, who serves as the agent to the syndicate. The commitment fee is allocated among the Portfolio and certain other funds managed by New York Life Investments based upon their respective net assets and other factors. Interest on any revolving credit loan is charged based upon the Federal Funds Rate, Daily Simple Secured Overnight Financing Rate ("SOFR") + 0.10%, or the Overnight Bank Funding Rate, whichever is higher. The Credit Agreement expires on July 25, 2023, although the Portfolio, certain other funds managed by New York Life Investments and the syndicate of banks may renew the Credit Agreement for an additional year on the same or different terms or enter into a credit agreement with a different syndicate of banks. Prior to July 26, 2022, the aggregate commitment amount and the commitment fee were the same as those under the current Credit Agreement. During the year ended December 31, 2022, there were no borrowings made or outstanding with respect to the Portfolio under the Credit Agreement.
Note 7–Interfund Lending Program
Pursuant to an exemptive order issued by the SEC, the Portfolio, along with certain other funds managed by New York Life Investments, may participate in an interfund lending program. The interfund lending program provides an alternative credit facility that permits the Portfolio and certain other funds managed by New York Life Investments to lend or borrow money for temporary purposes directly to or from one another, subject to the conditions of the exemptive order. During the year ended December 31, 2022, there were no interfund loans made or outstanding with respect to the Portfolio.
Note 8–Purchases and Sales of Securities (in 000’s)
During the year ended December 31, 2022, purchases and sales of U.S. government securities were $173,695 and $168,166, respectively. Purchases and sales of securities, other than U.S. government securities and short-term securities, were $302,342 and $393,491, respectively.
Notes to Financial Statements (continued)
Note 9–Capital Share Transactions
Transactions in capital shares for the years ended December 31, 2022 and December 31, 2021, were as follows:
| Initial Class | Shares | Amount |
| Year ended December 31, 2022: | | |
| Shares sold | 89,545 | $ 852,271 |
| Shares issued to shareholders in reinvestment of distributions | 88,439 | 814,814 |
| Shares redeemed | (206,737) | (1,972,794) |
| Net increase (decrease) | (28,753) | $ (305,709) |
| Year ended December 31, 2021: | | |
| Shares sold | 257,807 | $ 2,650,372 |
| Shares issued to shareholders in reinvestment of distributions | 58,257 | 595,939 |
| Shares redeemed | (80,307) | (824,780) |
| Net increase (decrease) | 235,757 | $ 2,421,531 |
| |
| Service Class | Shares | Amount |
| Year ended December 31, 2022: | | |
| Shares sold | 1,908,507 | $ 17,999,831 |
| Shares issued to shareholders in reinvestment of distributions | 2,796,524 | 25,706,237 |
| Shares redeemed | (19,275,558) | (182,302,115) |
| Net increase (decrease) | (14,570,527) | $(138,596,047) |
| Year ended December 31, 2021: | | |
| Shares sold | 5,040,050 | $ 51,619,560 |
| Shares issued to shareholders in reinvestment of distributions | 2,095,125 | 21,362,833 |
| Shares redeemed | (10,233,577) | (104,781,597) |
| Net increase (decrease) | (3,098,402) | $ (31,799,204) |
Note 10–Other Matters
As of the date of this report, interest rates in the United States and many parts of the world, including certain European countries, are ascending from historically low levels. Thus, the Portfolio currently faces a heightened level of risk associated with rising interest rates. This could be driven by a variety of factors, including but not limited to central bank monetary policies, changing inflation or real growth rates, general economic conditions, increasing bond issuances or reduced market demand for low yielding investments.
An outbreak of COVID-19, first detected in December 2019, has developed into a global pandemic and has resulted in travel restrictions, closure of international borders, certain businesses and securities markets, restrictions on securities trading activities, prolonged quarantines, supply chain disruptions, and lower consumer demand, as well as general concern and uncertainty. In 2022, many countries lifted some or all restrictions related to COVID-19. However, the continued impact of COVID-19 and related variants is uncertain and could further adversely affect the global economy, national economies, individual issuers and capital markets in unforeseeable ways and result in a
substantial and extended economic downturn. Developments that disrupt global economies and financial markets, such as COVID-19, may magnify factors that affect the Portfolio's performance.
Note 11–Subsequent Events
In connection with the preparation of the financial statements of the Portfolio as of and for the year ended December 31, 2022, events and transactions subsequent to December 31, 2022, through the date the financial statements were issued have been evaluated by the Manager for possible adjustment and/or disclosure. No subsequent events requiring financial statement adjustment or disclosure have been identified.
| 40 | MainStay VP MacKay Strategic Bond Portfolio |
Report of Independent Registered Public Accounting Firm
To the Board of Trustees of MainStay VP Funds Trust and Shareholders of
MainStay VP MacKay Strategic Bond Portfolio
Opinion on the Financial Statements
We have audited the accompanying statement of assets and liabilities, including the portfolio of investments, of MainStay VP MacKay Strategic Bond Portfolio (one of the portfolios constituting MainStay VP Funds Trust, referred to hereafter as the “Portfolio”) as of December 31, 2022, the related statement of operations for the year ended December 31, 2022, the statements of changes in net assets for each of the two years in the period ended December 31, 2022, including the related notes, and the financial highlights for each of the five years in the period ended December 31, 2022 (collectively referred to as the “financial statements”). In our opinion, the financial statements present fairly, in all material respects, the financial position of the Portfolio as of December 31, 2022, the results of its operations for the year then ended, the changes in its net assets for each of the two years in the period ended December 31, 2022 and the financial highlights for each of the five years in the period ended December 31, 2022 in conformity with accounting principles generally accepted in the United States of America.
Basis for Opinion
These financial statements are the responsibility of the Portfolio’s management. Our responsibility is to express an opinion on the Portfolio’s financial statements based on our audits. We are a public accounting firm registered with the Public Company Accounting Oversight Board (United States) (PCAOB) and are required to be independent with respect to the Portfolio in accordance with the U.S. federal securities laws and the applicable rules and regulations of the Securities and Exchange Commission and the PCAOB.
We conducted our audits of these financial statements in accordance with the standards of the PCAOB. Those standards require that we plan and perform the audit to obtain reasonable assurance about whether the financial statements are free of material misstatement, whether due to error or fraud.
Our audits included performing procedures to assess the risks of material misstatement of the financial statements, whether due to error or fraud, and performing procedures that respond to those risks. Such procedures included examining, on a test basis, evidence regarding the amounts and disclosures in the financial statements. Our audits also included evaluating the accounting principles used and significant estimates made by management, as well as evaluating the overall presentation of the financial statements. Our procedures included confirmation of securities owned as of December 31, 2022 by correspondence with the custodian, transfer agents, agent banks and brokers. We believe that our audits provide a reasonable basis for our opinion.
/s/PricewaterhouseCoopers LLP
New York, New York
February 24, 2023
We have served as the auditor of one or more investment companies in the MainStay group of funds since 1984.
Board Consideration and Approval of Management Agreement and Subadvisory Agreement (Unaudited)
The continuation of the Management Agreement with respect to the MainStay VP MacKay Strategic Bond Portfolio (“Portfolio”) and New York Life Investment Management LLC (“New York Life Investments”) and the Subadvisory Agreement between New York Life Investments and MacKay Shields LLC (“MacKay”) with respect to the Portfolio (together, “Advisory Agreements”) is subject to annual review and approval by the Board of Trustees of MainStay VP Funds Trust (“Board” of the “Trust”) in accordance with Section 15 of the Investment Company Act of 1940, as amended (“1940 Act”). At its December 6–7, 2022 meeting, the Board, which is comprised solely of Trustees who are not an “interested person” (as such term is defined in the 1940 Act) of the Trust (“Independent Trustees”), unanimously approved the continuation of each of the Advisory Agreements for a one-year period.
In reaching the decision to approve the continuation of each of the Advisory Agreements, the Board considered information and materials furnished by New York Life Investments and MacKay in connection with an annual contract review process undertaken by the Board that took place at meetings of the Board and its Contracts Committee during October 2022 through December 2022, including information and materials furnished by New York Life Investments and MacKay in response to requests prepared on behalf of the Board, and in consultation with the Board, by independent legal counsel to the Independent Trustees, which encompassed a variety of topics, including those summarized below. Information and materials requested by and furnished to the Board for consideration in connection with the contract review process included, among other items, reports on the Portfolio and “peer funds” prepared by Institutional Shareholder Services Inc. (“ISS”), an independent third-party service provider engaged by the Board to report objectively on the Portfolio’s investment performance, management fee and total expenses. The Board also considered information on the fees charged to other investment advisory clients of New York Life Investments and/or MacKay that follow investment strategies similar to those of the Portfolio, if any, and, when applicable, the rationale for any differences in the Portfolio’s management and subadvisory fees and the fees charged to those other investment advisory clients. In addition, the Board considered information regarding the legal standards and fiduciary obligations applicable to its consideration of the continuation of each of the Advisory Agreements. The contract review process, including the structure and format for information and materials provided to the Board, has been developed in consultation with the Board. The Independent Trustees also met in executive sessions with their independent legal counsel and, for portions thereof, with senior management of New York Life Investments.
The Board’s deliberations with respect to the continuation of each of the Advisory Agreements reflect a year-long process, and the Board also took into account information furnished to the Board and its Committees throughout the year, as deemed relevant and appropriate by the Trustees, including, among other items, reports on investment performance of the Portfolio and investment-related matters for the Portfolio as well as presentations from New York Life Investments and, generally annually, MacKay personnel. In addition, the Board took into account other information received from New York Life Investments throughout the year,
including, among other items, periodic reports on legal and compliance matters, risk management, portfolio turnover, brokerage commissions and non-advisory services provided to the Portfolio by New York Life Investments, as deemed relevant and appropriate by the Trustees.
In addition to information provided to the Board throughout the year, the Board received information in connection with its June 2022 meeting provided specifically in response to requests prepared on behalf of the Board, and in consultation with the Board, by independent legal counsel to the Independent Trustees regarding the Portfolio’s distribution arrangements. In addition, the Board received information regarding the Portfolio’s asset levels, share purchase and redemption activity and the payment of Rule 12b-1 and/or other fees by the applicable share classes of the Portfolio, among other information.
In considering the continuation of each of the Advisory Agreements, the Trustees reviewed and evaluated the information and factors they believed to reasonably be necessary and appropriate in light of legal advice furnished to them by independent legal counsel to the Independent Trustees and through the exercise of their own business judgment. Although individual Trustees may have weighed certain factors or information differently and the Board did not consider any single factor or information controlling in reaching its decision, the factors considered by the Board are summarized in more detail below and include, among other factors: (i) the nature, extent and quality of the services provided to the Portfolio by New York Life Investments and MacKay; (ii) the qualifications of the portfolio managers of the Portfolio and the historical investment performance of the Portfolio, New York Life Investments and MacKay; (iii) the costs of the services provided, and profits realized, by New York Life Investments and MacKay with respect to their relationships with the Portfolio; (iv) the extent to which economies of scale have been realized or may be realized if the Portfolio grows and the extent to which any economies of scale have been shared, have benefited or may benefit the Portfolio’s shareholders; and (v) the reasonableness of the Portfolio’s management and subadvisory fees and total ordinary operating expenses. Although the Board recognized that comparisons between the Portfolio’s fees and expenses and those of other funds are imprecise given different terms of agreements, variations in fund strategies and other factors, the Board considered the reasonableness of the Portfolio’s management fee and total ordinary operating expenses as compared to the peer funds identified by ISS. Throughout their considerations, the Trustees acknowledged the commitment of New York Life Investments and its affiliates to serve the MainStay Group of Funds, as well as their capacity, experience, resources, financial stability and reputations. The Trustees also acknowledged the entrepreneurial and other risks assumed by New York Life Investments in sponsoring and managing the Portfolio. With respect to the Subadvisory Agreement, the Board took into account New York Life Investments’ recommendation to approve the continuation of the Subadvisory Agreement.
The Trustees noted that, throughout the year, the Trustees are afforded an opportunity to ask questions of, and request additional information or materials from, New York Life Investments and MacKay. The Board’s decision with respect to each of the Advisory Agreements may have also
| 42 | MainStay VP MacKay Strategic Bond Portfolio |
been based, in part, on the Board’s knowledge of New York Life Investments and MacKay resulting from, among other things, the Board’s consideration of each of the Advisory Agreements in prior years, the advisory agreements for other funds in the MainStay Group of Funds, the Board’s review throughout the year of the performance and operations of other funds in the MainStay Group of Funds and each Trustee’s business judgment and industry experience. In addition to considering the above-referenced factors, the Board observed that in the marketplace, notably under variable life insurance policies and variable annuity contracts for which the Portfolio serves as an investment option, there are a range of investment options available to investors and that the Portfolio’s shareholders, having had the opportunity to consider other investment options, have chosen to invest in the Portfolio.
The factors that figured prominently in the Board’s decision to approve the continuation of each of the Advisory Agreements during its December 6–7, 2022 meeting are summarized in more detail below.
Nature, Extent and Quality of Services Provided by New York Life Investments and MacKay
The Board examined the nature, extent and quality of the services that New York Life Investments provides to the Portfolio. The Board evaluated New York Life Investments’ experience and capabilities in serving as manager of the Portfolio and considered that the Portfolio operates in a “manager-of-managers” structure. The Board also considered New York Life Investments’ responsibilities and services provided pursuant to this structure, including overseeing the services provided by MacKay, evaluating the performance of MacKay, making recommendations to the Board as to whether the Subadvisory Agreement should be renewed, modified or terminated and periodically reporting to the Board regarding the results of New York Life Investments’ evaluation and monitoring functions. The Board noted that New York Life Investments manages other mutual funds, serves a variety of other investment advisory clients, including other pooled investment vehicles, and has experience overseeing mutual fund service providers, including subadvisors. The Board considered the experience of senior personnel at New York Life Investments providing management and administrative and other non-advisory services to the Portfolio. The Board observed that New York Life Investments devotes significant resources and time to providing management and administrative and other non-advisory services to the Portfolio, including New York Life Investments’ oversight and due diligence reviews of MacKay and ongoing analysis of, and interactions with, MacKay with respect to, among other things, the Portfolio’s investment performance and risks as well as MacKay’s investment capabilities and subadvisory services with respect to the Portfolio.
The Board also considered the range of services that New York Life Investments provides to the Portfolio under the terms of the Management Agreement, including: (i) fund accounting and ongoing supervisory services provided by New York Life Investments’ Fund Administration and Accounting Group; (ii) investment supervisory and analytical services provided by New York Life Investments’ Investment Consulting Group; (iii) compliance services provided by the Trust’s Chief Compliance Officer as
well as New York Life Investments’ compliance department, including supervision and implementation of the Portfolio’s compliance program; (iv) legal services provided by New York Life Investments’ Office of the General Counsel; and (v) risk management monitoring and analysis by compliance and investment personnel. In addition, the Board considered New York Life Investments’ willingness to invest in personnel and other resources, such as cyber security, information security and business continuity planning, designed to benefit the Portfolio and noted that New York Life Investments is responsible for compensating the Trust’s officers, except for a portion of the salary of the Trust’s Chief Compliance Officer. The Board recognized that New York Life Investments provides certain other non-advisory services to the Portfolio and has provided an increasingly broad array of non-advisory services to the MainStay Group of Funds as a result of regulatory and other developments, including in connection with the implementation of the MainStay Group of Funds’ derivatives risk management program and policies and procedures adopted pursuant to Rule 18f-4 under the 1940 Act.
The Board also examined the range, and the nature, extent and quality, of the investment advisory services that MacKay provides to the Portfolio and considered the terms of each of the Advisory Agreements. The Board evaluated MacKay’s experience and performance in serving as subadvisor to the Portfolio and advising other portfolios and MacKay’s track record and experience in providing investment advisory services, the experience of investment advisory, senior management and administrative personnel at MacKay. The Board considered New York Life Investments’ and MacKay’s overall resources, legal and compliance environment, capabilities, reputation, financial condition and history. In addition to information provided in connection with quarterly meetings with the Trust’s Chief Compliance Officer, the Board considered information regarding the compliance policies and procedures of New York Life Investments and MacKay and acknowledged their commitment to further developing and strengthening compliance programs relating to the Portfolio. The Board also considered MacKay’s ability to recruit and retain qualified investment professionals and willingness to invest in personnel and other resources to service and support the Portfolio. In this regard, the Board considered the qualifications and experience of the Portfolio’s portfolio managers, the number of accounts managed by the portfolio managers and the method for compensating the portfolio managers.
In addition, the Board considered information provided by New York Life Investments and MacKay regarding the operations of their respective business continuity plans in response to the COVID-19 pandemic and the continued remote work environment.
Based on these considerations, among others, the Board concluded that the Portfolio would likely continue to benefit from the nature, extent and quality of these services.
Investment Performance
In evaluating the Portfolio’s investment performance, the Board considered investment performance results over various periods in light of the Portfolio’s investment objective, strategies and risks. The Board
Board Consideration and Approval of Management Agreement and Subadvisory Agreement (Unaudited) (continued)
considered investment reports on, and analysis of, the Portfolio’s performance provided to the Board throughout the year. These reports include, among other items, information on the Portfolio’s gross and net returns, the Portfolio’s investment performance compared to a relevant investment category and the Portfolio’s benchmarks, the Portfolio’s risk-adjusted investment performance and the Portfolio’s investment performance as compared to peer funds, as appropriate, as well as portfolio attribution information and commentary on the effect of market conditions. The Board also considered information provided by ISS showing the investment performance of the Portfolio as compared to peer funds. In addition, the Board reviewed the methodology used by ISS to construct the group of peer funds for comparative purposes.
The Board also took into account its discussions with senior management at New York Life Investments concerning the Portfolio’s investment performance over various periods as well as discussions between the Portfolio’s portfolio management team and the members of the Board’s Investment Committee, which generally occur on an annual basis. In addition, the Board considered any specific actions that New York Life Investments or MacKay had taken, or had agreed to take, to seek to enhance Portfolio investment performance and the results of those actions.
Based on these considerations, among others, the Board concluded that its review of the Portfolio’s investment performance and related information supported a determination to approve the continuation of each of the Advisory Agreements.
Costs of the Services Provided, and Profits and Other Benefits Realized, by New York Life Investments and MacKay
The Board considered the costs of the services provided under each of the Advisory Agreements. The Board also considered the profits realized by New York Life Investments and its affiliates, including MacKay, due to their relationships with the Portfolio as well as the MainStay Group of Funds. Because MacKay is an affiliate of New York Life Investments whose subadvisory fee is paid by New York Life Investments, not the Portfolio, the Board considered cost and profitability information for New York Life Investments and MacKay in the aggregate.
In addition, the Board acknowledged the difficulty in obtaining reliable comparative data about mutual fund managers’ profitability because such information generally is not publicly available and may be impacted by numerous factors, including the structure of a fund manager’s organization, the types of funds it manages, the methodology used to allocate certain fixed costs to specific funds and the manager’s capital structure and costs of capital.
In evaluating the costs of the services provided by New York Life Investments and MacKay and profits realized by New York Life Investments and its affiliates, including MacKay, the Board considered, among other factors, New York Life Investments’ and its affiliates’, including MacKay’s, continuing investments in, or willingness to invest in, personnel and other resources to support and further enhance the management of the Portfolio, and that New York Life Investments is
responsible for paying the subadvisory fee for the Portfolio. The Board also considered the financial resources of New York Life Investments and MacKay and acknowledged that New York Life Investments and MacKay must be in a position to recruit and retain experienced professional personnel and to maintain a strong financial position for New York Life Investments and MacKay to continue to provide high-quality services to the Portfolio. The Board recognized that the Portfolio benefits from the allocation of certain fixed costs among the funds in the MainStay Group of Funds, among other expected benefits resulting from its relationship with New York Life Investments.
The Board considered information regarding New York Life Investments’ methodology for calculating profitability and allocating costs provided by New York Life Investments in connection with the fund profitability analysis presented to the Board. The Board noted it had previously engaged an independent consultant to review the methods used to allocate costs among the funds in the MainStay Group of Funds. The Board also noted that the independent consultant had concluded that New York Life Investments’ methods for allocating costs and procedures for estimating overall profitability of the relationship with the funds in the MainStay Group of Funds are reasonable and that New York Life Investments continued to use the same method of calculating profit and allocating costs since the independent consultant’s review. The Board recognized the difficulty in calculating and evaluating a manager’s profitability with respect to the Portfolio and considered that other profitability methodologies may also be reasonable.
The Board also considered certain fall-out benefits that may be realized by New York Life Investments and its affiliates due to their relationships with the Portfolio, including reputational and other indirect benefits. The Board recognized, for example, the benefits to MacKay from legally permitted “soft-dollar” arrangements by which brokers provide research and other services to MacKay in exchange for commissions paid by the Portfolio with respect to trades in the Portfolio’s portfolio securities. In addition, the Board considered its review of the management agreement for a money market fund advised by New York Life Investments and an affiliated subadvisor that serves as an investment option for the Portfolio, including the potential rationale for and costs associated with investments in this money market fund by the Portfolio, if any, and considered information from New York Life Investments that the nature and type of specific investment advisory services provided to this money market fund are distinct from, or in addition to, the investment advisory services provided to the Portfolio. In addition, the Board considered the potential dividend received tax deduction for insurance company affiliates of New York Life Investments from the Portfolio’s securities lending activity.
The Board noted that the Portfolio serves as an investment option primarily under variable contracts issued by affiliates of New York Life Investments that would receive fees under those contracts. The Board observed that, in addition to fees earned by New York Life Investments under the Management Agreement for managing the Portfolio, New York Life Investments’ affiliates also earn revenues from serving the Portfolio in various other capacities, including as the Portfolio’s distributor. The Board considered information about these other revenues and their impact on
| 44 | MainStay VP MacKay Strategic Bond Portfolio |
the profitability of the relationship with the Portfolio to New York Life Investments and its affiliates. The Board noted that, although it assessed the overall profitability of the relationship with the Portfolio to New York Life Investments and its affiliates as part of the contract review process, when considering the reasonableness of the fee paid to New York Life Investments under the Management Agreement, the Board considered the profitability of New York Life Investments’ relationship with the Portfolio on a pre-tax basis and without regard to distribution expenses incurred by New York Life Investments from its own resources.
After evaluating the information deemed relevant by the Trustees, the Board concluded that any profits realized by New York Life Investments and its affiliates, including MacKay, due to their relationships with the Portfolio were not excessive and other benefits that may accrue to New York Life Investments and its affiliates, including MacKay, are reasonable.
Management and Subadvisory Fees and Total Ordinary Operating Expenses
The Board evaluated the reasonableness of the fee paid under each of the Advisory Agreements and the Portfolio’s total ordinary operating expenses. The Board primarily considered the reasonableness of the management fee paid by the Portfolio to New York Life Investments because the subadvisory fee paid to MacKay is paid by New York Life Investments, not the Portfolio. The Board also considered the reasonableness of the subadvisory fee paid by New York Life Investments and the amount of the management fee retained by New York Life Investments.
In assessing the reasonableness of the Portfolio’s fees and expenses, the Board primarily considered comparative data provided by ISS on the fees and expenses charged by similar mutual funds managed by other investment advisers. The Board reviewed the methodology used by ISS to construct the group of peer funds for comparative purposes. In addition, the Board considered information provided by New York Life Investments and MacKay on fees charged to other investment advisory clients, including institutional separate accounts and/or other funds that follow investment strategies similar to those of the Portfolio, if any. The Board considered the contractual management fee schedules of the Portfolio as compared to those of such other investment advisory clients, taking into account the rationale for any differences in fee schedules. The Board also took into account information provided by New York Life Investments about the more extensive scope of services provided to registered investment companies, such as the Portfolio, as compared with other investment advisory clients. Additionally, the Board considered the impact of contractual breakpoints on the Portfolio’s net management fee and expenses. The Board also considered that in proposing fees for the Portfolio, New York Life Investments considers the competitive marketplace for mutual funds.
Based on the factors outlined above, among other considerations, the Board concluded that the Portfolio’s management fee and total ordinary operating expenses are within a range that is competitive and support a conclusion that these fees and expenses are reasonable.
Economies of Scale
The Board considered information regarding economies of scale, including whether economies of scale may exist for the Portfolio and whether the Portfolio’s expense structure permits any economies of scale to be appropriately shared with the Portfolio’s beneficial shareholders. The Board also considered a report from New York Life Investments, previously prepared at the request of the Board, that addressed economies of scale, including with respect to the mutual fund business generally, and the various ways in which the benefits of economies of scale may be shared with the funds in the MainStay Group of Funds. Although the Board recognized the difficulty of determining economies of scale with precision, the Board acknowledged that economies of scale may be shared with the Portfolio in a number of ways, including, for example, through the imposition of fee breakpoints, initially setting management fee rates at scale or making additional investments to enhance the services provided to the Portfolio. The Board reviewed information from New York Life Investments showing how the Portfolio’s management fee schedule compared to fee schedules of other funds and accounts managed by New York Life Investments. The Board also reviewed information from ISS showing how the Portfolio’s management fee schedule compared with fees paid for similar services by peer funds at varying asset levels.
Based on this information, the Board concluded that economies of scale are appropriately reflected for the benefit of the Portfolio’s beneficial shareholders through the Portfolio’s expense structure and other methods to share benefits from economies of scale.
Conclusion
On the basis of the information and factors summarized above, among other information and factors deemed relevant by the Trustees, and the evaluation thereof, the Board unanimously voted to approve the continuation of each of the Advisory Agreements.
Proxy Voting Policies and Procedures and Proxy Voting Record
The Portfolio is required to file with the SEC its proxy voting record for the 12-month period ending June 30 on Form N-PX. A description of the policies and procedures that are used to vote proxies relating to portfolio securities of the Portfolio is available free of charge upon request by calling 800-598-2019 or visiting the SEC's website at www.sec.gov. The most recent Form N-PX or proxy voting record is available free of charge upon request by calling 800-598-2019; visiting https://www.newyorklifeinvestments.com/investment-products/vp; or visiting the SEC’s website at www.sec.gov.
Shareholder Reports and Quarterly Portfolio Disclosure
The Portfolio is required to file its complete schedule of portfolio holdings with the SEC 60 days after its first and third fiscal quarter on Form N-PORT. The Portfolio's holdings report is available free of charge upon request by calling 800-598-2019 or by visiting the SEC’s website at www.sec.gov.
| 46 | MainStay VP MacKay Strategic Bond Portfolio |
Board of Trustees and Officers (Unaudited)
The Trustees and officers of the Portfolio are listed below. The Board oversees the MainStay Group of Funds (which consists of MainStay Funds and MainStay Funds Trust), MainStay VP Funds Trust, MainStay MacKay DefinedTerm Municipal Opportunities Fund, MainStay CBRE Global Infrastructure Megatrends Fund, the Manager and the Subadvisors, and elects the officers of the Portfolios who are responsible for the day-to-day operations of the Portfolio. Information pertaining to the Trustees and officers is set forth below. Each Trustee serves until his or her successor
is elected and qualified or until his or her resignation, death or removal. Under the Board’s retirement policy, unless an exception is made, a Trustee must tender his or her resignation by the end of the calendar year during which he or she reaches the age of 75. The business address of each Trustee and officer listed below is 51 Madison Avenue, New York, New York 10010. None of the Trustees are “interested persons” (as defined by the 1940 Act and rules adopted by the SEC thereunder) of the Portfolio (“Independent Trustees”).
| | Name and
Year of Birth | Term of Office,
Position(s) Held and
Length of Service | Principal Occupation(s)
During Past Five Years | Number of
Portfolios in
Fund Complex
Overseen by
Trustee | Other Directorships
Held by Trustee |
| | | | | | |
| | David H. Chow
1957 | MainStay VP Funds Trust: Trustee since January 2016, Advisory Board Member (June 2015 to December 2015) | Founder and CEO, DanCourt Management, LLC since 1999 | 78 | MainStay Funds: Trustee since January 2016, Advisory Board Member (June 2015 to December 2015) (12 Funds);
MainStay Funds Trust: Trustee since January 2016, Advisory Board Member (June 2015 to December 2015) (33 Funds);
MainStay MacKay DefinedTerm Municipal Opportunities Fund: Trustee since January 2016, Advisory Board Member (June 2015 to December 2015);
MainStay CBRE Global Infrastructure Megatrends Fund: Trustee since June 2021;VanEck Vectors Group of Exchange-Traded Funds: Independent Chairman of the Board of Trustees since 2008 and Trustee since 2006 (57 portfolios); and Berea College of Kentucky: Trustee since 2009, Chair of the Committee since 2018 |
| | Susan B. Kerley
1951 | MainStay VP Funds Trust: Chairman since 2017 and Trustee since 2007* | President, Strategic Management Advisors LLC since 1990 | 78 | MainStay Funds: Chairman since 2017 and Trustee since 2007 (12 Funds); MainStay Funds Trust: Chairman since 2017 and Trustee since 1990 (33 Funds)**;
MainStay MacKay DefinedTerm Municipal Opportunities Fund: Chairman since 2017 and Trustee since 2011; MainStay CBRE Global Infrastructure Megatrends Fund: Trustee since June 2021; and Legg Mason Partners Funds: Trustee since 1991 (45 portfolios) |
| | Alan R. Latshaw
1951 | MainStay VP Funds Trust: Trustee since 2007* | Retired; Partner, Ernst & Young LLP (2002 to 2003); Partner, Arthur Andersen LLP (1989 to 2002); Consultant to the MainStay Funds Audit and Compliance Committee (2004 to 2006) | 78 | MainStay Funds: Trustee since 2006 (12 Funds);
MainStay Funds Trust: Trustee since 2007 (33 Funds)**;
MainStay MacKay DefinedTerm Municipal Opportunities Fund: Trustee since 2011; and
MainStay CBRE Global Infrastructure Megatrends Fund: Trustee since June 2021 |
Board of Trustees and Officers (Unaudited) (continued)
| | Name and
Year of Birth | Term of Office,
Position(s) Held and
Length of Service | Principal Occupation(s)
During Past Five Years | Number of
Portfolios in
Fund Complex
Overseen by
Trustee | Other Directorships
Held by Trustee |
| | | | | | |
| | Karen Hammond
1956 | MainStay VP Funds Trust: Trustee since December 2021, Advisory Board Member (June 2021 to December 2021)
| Retired, Managing Director, Devonshire Investors (2007 to 2013); Senior Vice President, Fidelity Management & Research Co. (2005 to 2007); Senior Vice President and Corporate Treasurer, FMR Corp. (2003 to 2005); Chief Operating Officer, Fidelity Investments Japan (2001 to 2003) | 78 | MainStay Funds: Trustee since December 2021, Advisory Board Member (June 2021 to December 2021) (12 Funds);
MainStay Funds Trust: Trustee since December 2021, Advisory Board Member (June 2021 to December 2021) (33 Funds);
MainStay MacKay DefinedTerm Municipal Opportunities Fund: Trustee since December 2021, Advisory Board Member (June 2021 to December 2021);
MainStay CBRE Global Infrastructure Megatrends Fund: Trustee since December 2021, Advisory Board Member (June 2021 to December 2021);
Two Harbors Investment Corp.: Director since 2018; Rhode Island State Investment Commission: Member since 2017; and Blue Cross Blue Shield of Rhode Island: Director since 2019
|
| | Jacques P. Perold
1958 | MainStay VP Funds Trust: Trustee since January 2016, Advisory Board Member (June 2015 to December 2015) | Founder and Chief Executive Officer, CapShift Advisors LLC (since 2018); President, Fidelity Management & Research Company (2009 to 2014); President and Chief Investment Officer, Geode Capital Management, LLC (2001 to 2009) | 78 | MainStay Funds: Trustee since January 2016, Advisory Board Member (June 2015 to December 2015) (12 Funds);
MainStay Funds Trust: Trustee since January 2016, Advisory Board Member (June 2015 to December 2015) (33 Funds); MainStay MacKay DefinedTerm Municipal Opportunities Fund: Trustee since January 2016, Advisory Board Member (June 2015 to December 2015);
MainStay CBRE Global Infrastructure Megatrends Fund: Trustee since June 2021; Allstate Corporation: Director since 2015;
Partners in Health: Trustee since 2019; and
MSCI Inc.: Director since 2017 |
| | Richard S. Trutanic
1952 | MainStay VP Funds Trust: Trustee since 2007* | Chairman and Chief Executive Officer, Somerset & Company (financial advisory firm) since 2004; Managing Director, The Carlyle Group (private investment firm) (2002 to 2004); Senior Managing Director, Partner and Board Member, Groupe Arnault S.A. (private investment firm) (1999 to 2002)
| 78 | MainStay Funds: Trustee since 1994 (12 Funds);
MainStay Funds Trust: Trustee since 2007 (33 Funds)**;
MainStay MacKay DefinedTerm Municipal Opportunities Fund: Trustee since 2011; and
MainStay CBRE Global Infrastructure Megatrends Fund: Trustee since June 2021 |
| * | Includes prior service as a Director of MainStay VP Series Fund, Inc., the predecessor to MainStay VP Funds Trust. |
| ** | Includes prior service as a Director/Trustee of certain predecessor entities to MainStay Funds Trust. |
| 48 | MainStay VP MacKay Strategic Bond Portfolio |
| | Name and
Year of Birth | Position(s) Held and
Length of Service | Principal Occupation(s)
During Past Five Years | |
| | | | | |
| | Kirk C. Lehneis
1974 | President, MainStay VP Funds Trust (since 2017) | Chief Operating Officer and Senior Managing Director (since 2016), New York Life Investment Management LLC and New York Life Investment Management Holdings LLC; Member of the Board of Managers (since 2017) and Senior Managing Director (since 2018), NYLIFE Distributors LLC; Chairman of the Board and Senior Managing Director, NYLIM Service Company LLC (since 2017); Trustee, President and Principal Executive Officer of IndexIQ Trust, IndexIQ ETF Trust and IndexIQ Active ETF Trust (since January 2018); President, MainStay CBRE Global Infrastructure Megatrends Fund (since 2021), MainStay MacKay DefinedTerm Municipal Opportunities Fund, MainStay Funds and MainStay Funds Trust (since 2017); Senior Managing Director, Global Product Development (from 2015-2016); Managing Director, Product Development (from 2010-2015), New York Life Investment Management LLC | |
| | Jack R. Benintende
1964 | Treasurer and Principal Financial and Accounting Officer, MainStay VP Funds Trust (since 2007)** | Managing Director, New York Life Investment Management LLC (since 2007); Treasurer and Principal Financial and Accounting Officer, MainStay CBRE Global Infrastructure Megatrends Fund (since 2021), MainStay MacKay DefinedTerm Municipal Opportunities Fund (since 2011), MainStay Funds Trust (since 2009) and MainStay Funds (since 2007); and Assistant Treasurer, New York Life Investment Management Holdings LLC (2008 to 2012) | |
| | J. Kevin Gao
1967 | Secretary and Chief Legal Officer, MainStay VP Funds Trust (since 2010)** | Managing Director and Associate General Counsel, New York Life Investment Management LLC (since 2010); Secretary and Chief Legal Officer, MainStay CBRE Global Infrastructure Megatrends Fund (since 2021), MainStay MacKay DefinedTerm Municipal Opportunities Fund (since 2011), MainStay Funds and MainStay Funds Trust (since 2010) | |
| | Scott T. Harrington
1959 | Vice President— Administration, MainStay VP Funds Trust (since 2005)** | Managing Director, New York Life Investment Management LLC (including predecessor advisory organizations) (since 2000); Member of the Board of Directors, New York Life Trust Company (since 2009); Vice President—Administration, MainStay CBRE Global Infrastructure Megatrends Fund (since 2021), MainStay MacKay DefinedTerm Municipal Opportunities Fund (since 2011), MainStay Funds Trust and MainStay Funds (since 2009) | |
| | Kevin M. Gleason
1967 | Vice President and Chief Compliance Officer, MainStay VP Funds Trust (since June 2022) | Vice President and Chief Compliance Officer, IndexIQ, IndexIQ ETF Trust and Index IQ Active ETF Trust (since June 2022); Vice President and Chief Compliance Officer, MainStay CBRE Global Infrastructure Megatrends Fund, MainStay MacKay DefinedTerm Municipal Opportunities Fund (since June 2022); MainStay Funds Trust and MainStay Funds (since June 2022); Senior Vice President, Voya Investment Management and Chief Compliance Officer, Voya Family of Funds (2012-2022) | |
| * | The officers listed above are considered to be “interested persons” of the MainStay Group of Funds, MainStay VP Funds Trust, MainStay CBRE Global Infrastructure Megatrends Fund and MainStay MacKay DefinedTerm Municipal Opportunities Fund within the meaning of the 1940 Act because of their affiliation with the MainStay Group of Funds, New York Life Insurance Company and/or its affiliates, including New York Life Investment Management LLC, NYLIM Service Company LLC, NYLIFE Securities LLC and/or NYLIFE Distributors LLC, as described in detail in the column captioned “Principal Occupation(s) During Past Five Years.” Officers are elected annually by the Board. |
| ** | Includes prior service as an Officer of MainStay VP Series Fund, Inc., the predecessor to MainStay VP Funds Trust. |
Officers of the Trust (Who are not Trustees)*
This page intentionally left blank.
MainStay VP Portfolios
MainStay VP offers a wide range of Portfolios. The full array of MainStay VP offerings is listed here, with information about the manager, subadvisors, legal counsel, and independent registered public accounting firm.
Equity
MainStay VP American Century Sustainable Equity Portfolio1
MainStay VP Candriam Emerging Markets Equity Portfolio
MainStay VP Epoch U.S. Equity Yield Portfolio
MainStay VP Fidelity Institutional AM® Utilities Portfolio†
MainStay VP MacKay International Equity Portfolio
MainStay VP Natural Resources Portfolio
MainStay VP S&P 500 Index Portfolio2
MainStay VP Small Cap Growth Portfolio
MainStay VP Wellington Growth Portfolio
MainStay VP Wellington Mid Cap Portfolio
MainStay VP Wellington Small Cap Portfolio
MainStay VP Wellington U.S. Equity Portfolio
MainStay VP Winslow Large Cap Growth Portfolio
Mixed Asset
MainStay VP Balanced Portfolio
MainStay VP Income Builder Portfolio
MainStay VP Janus Henderson Balanced Portfolio
MainStay VP MacKay Convertible Portfolio
Income
MainStay VP Bond Portfolio
MainStay VP Floating Rate Portfolio
MainStay VP Indexed Bond Portfolio
MainStay VP MacKay Government Portfolio
MainStay VP MacKay High Yield Corporate Bond Portfolio
MainStay VP MacKay Strategic Bond Portfolio
MainStay VP PIMCO Real Return Portfolio
Money Market
MainStay VP U.S. Government Money Market Portfolio
Alternative
MainStay VP CBRE Global Infrastructure Portfolio
MainStay VP IQ Hedge Multi-Strategy Portfolio
Asset Allocation
MainStay VP Conservative Allocation Portfolio
MainStay VP Equity Allocation Portfolio
MainStay VP Growth Allocation Portfolio
MainStay VP Moderate Allocation Portfolio
Manager
New York Life Investment Management LLC
New York, New York
Subadvisors
American Century Investment Management, Inc.
Kansas City, Missouri
Brown Advisory LLC
Baltimore, Maryland
Candriam*
Strassen, Luxembourg
CBRE Investment Management Listed Real Assets LLC
Radnor, Pennsylvania
Epoch Investment Partners, Inc.
New York, New York
FIAM LLC
Smithfield, Rhode Island
IndexIQ Advisors LLC*
New York, New York
Janus Henderson Investors US LLC
Denver, Colorado
MacKay Shields LLC*
New York, New York
Newton Investment Management North America, LLC
Boston, Massachusetts
NYL Investors LLC*
New York, New York
Pacific Investment Management Company LLC
Newport Beach, California
Segall Bryant & Hamill, LLC
Chicago, Illinois
Wellington Management Company LLP
Boston, Massachusetts
Winslow Capital Management, LLC
Minneapolis, Minnesota
Legal Counsel
Dechert LLP
Washington, District of Columbia
Independent Registered Public Accounting Firm
PricewaterhouseCoopers LLP
New York, New York
Distributor
NYLIFE Distributors LLC*
Jersey City, New Jersey
Custodian
JPMorgan Chase Bank, N.A.
New York, New York
Some Portfolios may not be available in all products.
† Fidelity Institutional AM is a registered trade mark of FMR LLC. Used with permission.
* An affiliate of New York Life Investment Management LLC.
| 1. | Prior to May 1, 2022, the Portfolio's name was MainStay VP T. Rowe Price Equity Income Portfolio. |
| 2. | Prior to May 1, 2022, the Portfolio's name was MainStay VP MacKay S&P 500 Index Portfolio. |
Not part of the Annual Report
2022 Annual Report
This report is for the general information of New York Life Variable Annuities and NYLIAC Variable Universal Life Insurance Products policyowners. It must be preceded or accompanied by the appropriate product(s) and funds prospectuses if it is given to anyone who is not an owner of a New York Life variable annuity policy or a NYLIAC Variable Universal Life Insurance Product. This report does not offer for sale or solicit orders to purchase securities.
The performance data quoted in this report represents past performance. Past performance is no guarantee of future results. Due to market volatility and other factors, current performance may be lower or higher than the figures shown. The most recent month-end performance summary for your variable annuity or variable life policy is available by calling 800-598-2019 and is updated periodically on newyorklife.com.
The New York Life Variable Annuities and NYLIAC Variable Universal Life Insurance Products are issued by New York Life Insurance and Annuity Corporation (a Delaware Corporation) and distributed by NYLIFE Distributors LLC (Member FINRA/SIPC).
New York Life Insurance Company
New York Life Insurance and Annuity
Corporation (NYLIAC) (A Delaware Corporation)
51 Madison Avenue, Room 551
New York, NY 10010
newyorklife.com
newyorklifeinvestments.com
NYLIFE Distributors LLC, 30 Hudson Street, Jersey City, NJ 07302
New York Life Investment Management LLC is the investment manager to the MainStay VP Funds Trust
©2023 by NYLIFE Distributors LLC. All rights reserved.
You may obtain copies of the Prospectus and the Statement of Additional Information free of charge, upon request, by calling toll-free 800-598-2019 or writing to New York Life Insurance and Annuity Corporation, 51 Madison Avenue, New York, NY 10010.
| Not FDIC Insured | No Bank Guarantee | May Lose Value |
(NYLIAC) NI532
MainStay VP Allocation Portfolios
Message from the President and Annual Report
December 31, 2022
| MainStay VP Conservative Allocation Portfolio |
| MainStay VP Moderate Allocation Portfolio |
| MainStay VP Growth Allocation Portfolio |
| MainStay VP Equity Allocation Portfolio |
Sign up for e-delivery of your shareholder reports. For full details on e-delivery, including who can participate and what you can receive via e-delivery,
please log in to newyorklifeinvestments.com/accounts.
| Not FDIC/NCUA Insured | Not a Deposit | May Lose Value | No Bank Guarantee | Not Insured by Any Government Agency |
This page intentionally left blank
Message from the President
The 12-month reporting period ended December 31, 2022, proved exceptionally challenging for investors as both stock and bond markets suffered steep declines. A variety of economic and geopolitical forces drove the market’s losses, all centered around rising inflation and monetary efforts to rein it in.
Inflationary alarms began to sound well before the reporting period began. In late 2021, after nearly two years of accommodative policies designed to encourage economic growth in the face of the COVID-19 pandemic, the U.S. Federal Reserve (the “Fed”) warned of the increasing need to tighten monetary policy. Nevertheless, the pace and persistence of inflation in early 2022 caught most market participants—the Fed included—off guard. Russia’s invasion of Ukraine in February exacerbated global inflationary pressures while increasing investor uncertainty. Domestic supply shortages, international trade imbalances and rising inflation caused U.S. GDP (gross domestic product) to contract in the first and second quarters of the year, although employment and consumer spending proved resilient. Prices for petroleum surged to multi-year highs, while many key agricultural chemicals and industrial metals soared as well. Accelerating inflationary forces prompted the Fed to implement its most aggressive series of interest rate hikes since the 1980s, with a 0.25% increase in March followed by six further rate increases totaling 4.25%. International central banks generally followed suit and raised rates by varying degrees in efforts to curb local inflation, although most increases remained significantly more modest than those in the United States. Relatively high U.S. interest rates and an international risk averse sentiment pushed U.S. dollar values higher compared to most other currencies, with negative impacts on global prices for food, fuel and other key U.S.-dollar-denominated products.
The effects of these interrelated challenges were felt throughout U.S. and international financial markets. The S&P 500® Index, a widely regarded benchmark of market performance, declined by more than 18% during the reporting period. Although the energy sector generated strong gains, bolstered by elevated oil and gas prices, most other industry segments recorded losses. The more cyclical and growth-oriented sectors of consumer discretionary, information technology and real estate delivered the weakest returns, while the traditionally defensive and value-oriented
consumer staples, utilities and health care sectors outperformed. On average, international developed-country equity markets mildly outperformed their U.S. counterparts, while emerging markets lagged slightly. Fixed-income markets proved unusually volatile, with bond prices trending sharply lower as yields rose along with interest rates. Short-term yields rose faster than long-term yields, producing a yield curve inversion from July through the end of the reporting period as long-term rates remained below short-term rates. While floating-rate instruments, which feature variable interest rates that allow investors to benefit from a rising rate environment, provided a degree of insulation from inflation-driven trends, they were not immune to the market’s widespread declines.
Although, according to the most recent estimates, the annualized inflation rate in the United States has declined from a peak of 9.1% in July 2022 to 6.5% in December, the Fed remains focused on achieving more substantial and lasting reductions, aiming for a target rate of 2%. As a result, further rate hikes and additional market volatility are potential headwinds in the coming months. The question remains as to whether the Fed and other central banks will manage a so-called “soft landing,” curbing inflation while avoiding a persistent economic slowdown. If they prove successful, we believe that the increasingly attractive valuations we have observed in both equity and bond markets should eventually translate into sustainable improvements in the investment environment.
Whatever actions the Fed takes and however financial markets react, as a MainStay VP investor you can depend on us to continue managing our portfolios with the insight, expertise and level of service that have long defined New York Life Investments. Thank you for trusting us to help you meet your investment needs.
Sincerely,
Kirk C. Lehneis
President
The opinions expressed are as of the date of this report and are subject to change. There is no guarantee that any forecast made will come to pass. This material does not constitute investment advice and is not intended as an endorsement of any specific investment. Past performance is no guarantee of future results.
Not part of the Annual Report
Investors should refer to the Portfolio’s Summary Prospectus and/or Prospectus and consider the Portfolio’s investment objectives, strategies, risks, charges and expenses carefully before investing. The Summary Prospectus and/or Prospectus contain this and other information about the Portfolio. You may obtain copies of the Portfolio’s Summary Prospectus, Prospectus and Statement of Additional Information, which includes information about the MainStay VP Funds Trust's Trustees, free of charge, upon request, by calling toll-free 800-598-2019, by writing to New York Life Insurance and Annuity Corporation, 51 Madison Avenue, Room 251, New York, New York 10010 or by sending an email to MainStayShareholdersServices@nylim.com. These documents are also available at newyorklifeinvestments.com/investment-products/vp. Please read the Portfolio's Summary Prospectus and/or Prospectus carefully before investing. MainStay VP Funds Trust portfolios are separate account options which are purchased through a variable insurance or variable annuity contract.
MainStay VP Conservative Allocation Portfolio
Investment and Performance Comparison (Unaudited)
Performance data quoted represents past performance. Past performance is no guarantee of future results. Because of market volatility and other factors, current performance may be lower or higher than the figures shown. Investment return and principal value will fluctuate, and as a result, when shares are redeemed, they may be worth more or less than their original cost. The performance table and graph do not reflect any deduction of sales charges, mortality and expense charges, contract charges or administrative charges. Please refer to the Performance Summary appropriate for your policy. For performance information current to the most recent month-end, please call 800-598-2019 or visit www.newyorklife.com.
Performance figures may reflect certain fee waivers and/or expense limitations, without which total returns may have been different. For information on current fee waivers and/or expense limitations (if any), please refer to the Notes to Financial Statements.
| Average Annual Total Returns for the Year-Ended December 31, 2022 |
| Class | Inception
Date | One
Year | Five
Years | Ten
Years | Gross
Expense
Ratio1 |
| Initial Class Shares | 2/13/2006 | -12.05% | 2.22% | 4.33% | 0.48% |
| Service Class Shares | 2/13/2006 | -12.27 | 1.97 | 4.08 | 0.73 |
| 1. | The gross expense ratios presented reflect the Portfolio’s “Total Annual Portfolio Operating Expenses” from the most recent Prospectus and may differ from other expense ratios disclosed in this report. |
The footnotes on the next page are an integral part of the table and graph and should be carefully read in conjunction with them.
| Benchmark Performance* | One
Year | Five
Years | Ten
Years |
| S&P 500® Index1 | -18.11% | 9.42% | 12.56% |
| MSCI EAFE® Index (Net)2 | -14.45 | 1.54 | 4.67 |
| Bloomberg U.S. Aggregate Bond Index3 | -13.01 | 0.02 | 1.06 |
| Conservative Allocation Composite Index4 | -14.40 | 3.29 | 5.06 |
| Morningstar Allocation - 30% to 50% Equity Category Average5 | -13.34 | 2.10 | 3.49 |
| * | Returns for indices reflect no deductions for fees, expenses or taxes, except for foreign withholding taxes where applicable. Results assume reinvestment of all dividends and capital gains. An investment cannot be made directly in an index. |
| 1. | The S&P 500® Index is the Portfolio's primary benchmark. S&P 500® is a trademark of The McGraw-Hill Companies, Inc. The S&P 500® Index is widely regarded as the standard index for measuring large-cap U.S. stock market performance. |
| 2. | The MSCI EAFE® Index (Net) is the Portfolio's secondary benchmark. The MSCI EAFE® Index (Net) consists of international stocks representing the developed world outside of North America. |
| 3. | The Portfolio has selected the Bloomberg U.S. Aggregate Bond Index as an additional benchmark. The Bloomberg U.S. Aggregate Bond Index is a broad-based benchmark that measures the performance of the investment grade, U.S. dollar-denominated, fixed-rate taxable bond market, including Treasurys, government-related and corporate securities, mortgage-backed securities (agency fixed-rate and hybrid adjustable rate mortgage pass-throughs), asset-backed securities, and commercial mortgage-backed securities. |
| 4. | The Portfolio has selected the Conservative Allocation Composite Index as an additional benchmark. The Conservative Allocation Composite Index consists of the S&P 500® Index, the MSCI EAFE® Index (Net) and the Bloomberg U.S. Aggregate Bond Index weighted 30%, 10% and 60%, respectively. |
| 5. | The Morningstar Allocation – 30% to 50% Equity Category Average is representative of funds that seek to provide both income and capital appreciation by investing in multiple asset classes, including stocks, bonds, and cash. These funds are dominated by domestic holdings and have equity exposures between 30% to 50%. Results are based on average total returns of similar funds with all dividends and capital gain distributions reinvested. |
The footnotes on the preceding page are an integral part of the table and graph and should be carefully read in conjunction with them.
| 6 | MainStay VP Conservative Allocation Portfolio |
Cost in Dollars of a $1,000 Investment in MainStay VP Conservative Allocation Portfolio (Unaudited)
The example below is intended to describe the fees and expenses borne by shareholders during the six-month period from July 1, 2022 to December 31, 2022, and the impact of those costs on your investment.
Example
As a shareholder of the Portfolio you incur two types of costs: (1) transaction costs, including exchange fees and sales charges (loads) on purchases (as applicable), and (2) ongoing costs, including management fees, distribution and/or service (12b-1) fees and other Portfolio expenses (as applicable). This example is intended to help you understand your ongoing costs (in dollars) of investing in the Portfolio and to compare these costs with the ongoing costs of investing in other mutual funds. The example is based on an investment of $1,000 made at the beginning of the six-month period and held for the entire period from July 1, 2022 to December 31, 2022. Shares are only sold in connection with variable life and annuity contracts and the example does not reflect any contract level or transactional fees or expenses. If these costs had been included, your costs would have been higher.
This example illustrates your Portfolio’s ongoing costs in two ways:
Actual Expenses
The second and third data columns in the table below provide information about actual account values and actual expenses. You may use the information in these columns, together with the amount you invested, to estimate the expenses that you paid during the six months ended
December 31, 2022. Simply divide your account value by $1,000 (for example, an $8,600 account value divided by $1,000 = 8.6), then multiply the result by the number under the heading entitled “Expenses Paid During Period” to estimate the expenses you paid on your account during this period.
Hypothetical Example for Comparison Purposes
The fourth and fifth data columns in the table below provide information about hypothetical account values and hypothetical expenses based on the Portfolio’s actual expense ratio and an assumed rate of return of 5% per year before expenses, which is not the Portfolio’s actual return. The hypothetical account values and expenses may not be used to estimate the actual ending account balances or expenses you paid for the six-month period shown. You may use this information to compare the ongoing costs of investing in the Portfolio with the ongoing costs of investing in other mutual funds. To do so, compare this 5% hypothetical example with the 5% hypothetical examples that appear in the shareholder reports of the other mutual funds.
Please note that the expenses shown in the table are meant to highlight your ongoing costs only and do not reflect any transactional costs, such as exchange fees or sales charges (loads). Therefore, the fourth and fifth data columns of the table are useful in comparing ongoing costs only and will not help you determine the relative total costs of owning different funds. In addition, if these transactional costs were included, your costs would have been higher.
| Share Class | Beginning
Account
Value
7/1/22 | Ending Account
Value (Based
on Actual
Returns and
Expenses)
12/31/22 | Expenses
Paid
During
Period1 | Ending Account
Value (Based
on Hypothetical
5% Annualized
Return and
Actual Expenses)
12/31/22 | Expenses
Paid
During
Period1 | Net Expense
Ratio
During
Period2 |
| Initial Class Shares | $1,000.00 | $1,014.40 | $0.10 | $1,025.10 | $0.10 | 0.02% |
| Service Class Shares | $1,000.00 | $1,013.10 | $1.37 | $1,023.84 | $1.38 | 0.27% |
| 1. | Expenses are equal to the Portfolio’s annualized expense ratio of each class multiplied by the average account value over the period, divided by 365 and multiplied by 184 (to reflect the six-month period). The table above represents the actual expenses incurred during the six-month period. In addition to the fees and expenses which the Portfolio bears directly, it also indirectly bears a pro rata share of the fees and expenses of the underlying Portfolios/Funds in which it invests. Such indirect expenses are not included in the above-reported expense figures. |
| 2. | Expenses are equal to the Portfolio's annualized expense ratio to reflect the six-month period. |
Asset Diversification as of December 31, 2022 (Unaudited)
| Equity Funds | 36.3% |
| Fixed Income Funds | 53.5 |
| Short-Term Investment | 9.9 |
| Other Assets, Less Liabilities | 0.3 |
See Portfolio of Investments beginning on page 12 for specific holdings within these categories. The Portfolio’s holdings are subject to change.
| 8 | MainStay VP Conservative Allocation Portfolio |
Portfolio Management Discussion and Analysis (Unaudited)
Answers to the questions reflect the views of Jae S. Yoon, CFA, Jonathan Swaney, Poul Kristensen, CFA, and Amit Soni, CFA, of New York Life Investments,1 the Portfolio’s Manager.
How did MainStay VP Conservative Allocation Portfolio perform relative to its benchmarks and peers during the 12 months ended December 31, 2022?
For the 12 months ended December 31, 2022, MainStay VP Conservative Allocation Portfolio returned −12.05% for Initial Class shares and −12.27% for Service Class shares. Over the same period, both share classes outperformed the −18.11% return of the S&P 500® Index, which is the Portfolio’s primary benchmark, and the −14.45% return of the MSCI EAFE® Index (Net), which is a secondary benchmark of the Portfolio. For the 12 months ended December 31, 2022, both share classes outperformed the −13.01% return of the Bloomberg U.S. Aggregate Bond Index and the −14.40% return of the Conservative Allocation Composite Index, which are additional benchmarks of the Portfolio. Over the same period, both share classes also outperformed the −13.34% return of the Morningstar Allocation—30% to 50% Equity Category Average.2
What factors affected the Portfolio’s relative performance during the reporting period?
The Portfolio is a “fund of funds,” meaning that it seeks to achieve its investment objective by investing primarily in mutual funds and exchange-traded funds (“ETFs”) managed by New York Life Investments or its affiliates (the “Underlying Portfolios/Funds”). The Underlying Portfolios/Funds may invest in U.S. equities, international equities and fixed-income instruments, making comparisons to any single index generally less suitable than a weighted combination of indices, which is a more useful yardstick by which to measure performance. The Portfolio’s management internally maintains a blend of indices that are taken into consideration when managing the Portfolio. During the reporting period, the Portfolio outperformed this internally maintained blend of indices, primarily due to active positioning at the asset class level.
The Portfolio’s outperformance was driven by the following factors:
| • | Management of the stock/bond blend: The Portfolio’s management of its stock/bond blend proved generally successful, reflecting tactical adjustments made throughout the reporting period. With both investment-grade bonds and U.S. stocks posting declines in the mid-teens, there was little cost or benefit to being persistently overweight or underweight to equities, although adjusting that exposure over time (buying dips and selling rallies) added material value. |
| • | Value created within asset classes: The equity portion of the Portfolio emphasized value over growth, with a specific focus on |
energy companies and defensive sectors that the market rewarded. Conditions also marginally favored the Portfolio’s skew toward profitable small-cap companies.
| • | Gold and energy exposure: The equity portion of the Portfolio modestly benefited from tactical exposure to stocks of gold miners and energy producers. |
| • | Shorter duration:3 The fixed income portion of the Portfolio shortened its average duration by holding cash and emphasizing exposure to MainStay MacKay Short Duration High Yield Fund over MainStay VP MacKay High Yield Corporate Bond Portfolio; these moves lifted relative returns. |
Conversely, performance was undermined by management of the Portfolio’s exposure to non-U.S. markets. Following Russia’s invasion of Ukraine, the Portfolio shifted from overweight to underweight exposure to developed international markets in anticipation of an impending recession. However, European economic activity held up better than anticipated, and shying away from those markets detracted from returns. Similarly, but in reverse, our expectation that emerging markets were likely to benefit from fiscal stimulus in China ahead of the party congress in November proved ill-founded. Emerging markets fared poorly as the anticipated stimulus failed to materialize, and the Portfolio’s emerging-markets holdings dragged on performance. In addition, the underperformance of some of the Underlying Funds/Portfolios relative to their benchmarks detracted modestly from the Portfolio’s relative performance.
During the reporting period, how was the Portfolio’s performance materially affected by investments in derivatives?
Total return swaps were used to express most of the Portfolio’s tactical asset class policy views. Therefore, the swaps can be seen as enhancing the Portfolio’s relative performance over the course of the reporting period.
How did you allocate the Portfolio’s assets during the reporting period and why?
Stock/bond blend: On average, the Portfolio held moderately overweight exposure to equities during the reporting period, with the magnitude of that bias managed tactically in response to swings in pricing (adding on drawdowns and trimming on rallies). We are generally reluctant to position the Portfolio with underweight exposure to equities, as stocks have tended to perform well over time and anticipating drawdowns is challenging. Conversely, we’re happy to position the Portfolio with a bias toward equities when we believe stocks are well supported
| 1. | “New York Life Investments” is a service mark used by New York Life Investment Management Holdings LLC and its subsidiary New York Life Investment Management LLC. |
| 2. | See page 6 for more information on benchmark and peer group returns. |
| 3. | Duration is a measure of the price sensitivity of a fixed-income investment to changes in interest rates. Duration is expressed as a number of years and is considered a more accurate sensitivity gauge than average maturity. |
fundamentally or when a correction has run further than we believe appropriate. This approach paid off during the reporting period. Despite stocks declining by double digits, meaningful extra return was generated by tactically adjusting the degree to which the Portfolio held overweight exposure to equities.
Duration: Believing inflationary pressures to be partially structural in nature and likely to persist at elevated levels for the foreseeable future, we skewed the fixed-income portion of the Portfolio to favor shorter-maturity and lower-quality instruments that would be less sensitive to rising bond yields, although duration was added as yields rose. As of the end of the reporting period, the Portfolio’s duration was only slightly shorter than that of the Bloomberg U.S. Aggregate Bond Index. Maintaining a short duration posture improved returns.
Equity style: We viewed inflation, which undermines the value of more distant cash flows, as threatening to growth equities with high prices relative to current earnings. Accordingly, the Portfolio emphasized value stocks offering more attractive near-term cash flows. We placed a particular focus on the relatively defensive sectors of real estate, utilities, consumer staples and, most of all, health care. This emphasis on value over growth made a positive contribution to performance. (Contributions take weightings and total returns into account.)
Equity size: The Portfolio maintained a significant exposure to U.S. small-cap stocks. The thesis behind this positioning was based on the U.S. small-cap universe’s relatively attractive valuations, insulation from economic weakness abroad, less sensitivity to dollar strength and disproportionate exposure to domestic demand, which remained robust. Despite these presumed advantages, however, the Portfolio’s small-cap positions provided only modestly positive contributions to relative performance.
Geographic exposure: Prior to Russia’s invasion of Ukraine, the Portfolio’s geographic exposure reflected our positive expectations for non-U.S. developed markets generally, and Europe in particular, based on attractive valuations and the post-COVID-19 cyclical recovery we expected. War, sanctions, soaring local energy prices and looming recession changed the underlying picture. We responded by unwinding the Portfolio’s position and then reversing it, shifting to an underweight position in non-U.S. developed market equities. This move ultimately detracted from relative returns as non-U.S. economies fared better than expected, with developed international equity markets outperforming U.S. markets.
Gold miners: The Portfolio maintained a varying degree of exposure to gold miners as a hedge against inflation and/or a monetary policy mistake. The position proved volatile, making a modestly positive contribution to relative returns when viewed over the course of the full year.
Energy: As with gold miners, the Portfolio maintained exposure to upstream energy producers as a commodity play to provide an
additional inflation hedge. These holdings also positioned the Fund to take advantage of opportunities for domestic producers to benefit as Western nations revisited energy policy in order to source supplies from stable and friendly jurisdictions, rather than autocratic petrostates that present national security risks. While the Portfolio’s position was small, it had a disproportionately positive impact on performance as oil and gas prices soared.
How did the Portfolio’s allocations change over the course of the reporting period?
The Portfolio’s positioning is most often implemented using derivatives, specifically total return swaps. The use of swaps to reduce exposure to non-U.S. developed markets and increase exposure to mid- and small-cap companies during the reporting period, as discussed above, stand as good examples. Similarly, exposure to defensive sectors and energy producers was realized by swapping into the return stream on specific ETFs, including Invesco S&P Low Volatility ETF, SPDR S&P Oil & Gas Exploration & Production ETF and VanEck Oil Services ETF. We also added duration to the Portfolio’s bond holdings after yields had already risen considerably by entering into a swap in which the Portfolio received the return on iShares 20+ Year Treasury Bond ETF.
The largest adjustment made to actual Portfolio holdings involved a partial shift out of MainStay VP Indexed Bond Portfolio and into IQ MacKay ESG Core Plus Bond ETF. The latter, a recently launched product, provides active management that introduces some additional criteria to the selection of individual issues. We anticipate that diversifying the Portfolio’s assets across both products will prove helpful over time.
Another change involved sales of positions in MainStay MacKay Short Duration High Yield Fund and MainStay VP MacKay High Yield Corporate Bond Portfolio; this reduced the Portfolio’s high yield bond exposure to neutral in anticipation of a potential recession and the likely resulting damage to credit spreads.
During the reporting period, which Underlying Equity Funds had the highest total returns and which had the lowest total returns?
The holdings providing the highest total returns involved swaps that were in place for only part of the reporting period. Generally, exposure to energy companies generated the only gains for the reporting period, while exposure to the health care sector and low volatility stocks produced the smallest losses. Among Underlying Equity Funds held for the entire reporting period, the smallest losses came from MainStay VP Epoch U.S. Equity Yield Portfolio, MainStay WMC Value Fund, and MainStay VP American Century Sustainable Equity Portfolio. At the other end of the spectrum, the Underlying Equity Funds with the lowest returns were MainStay VP Wellington Growth Portfolio, MainStay VP Winslow Large Cap Growth Portfolio and MainStay VP Candriam Emerging Markets Equity Portfolio.
| 10 | MainStay VP Conservative Allocation Portfolio |
Which Underlying Equity Funds were the strongest positive contributors to the Portfolio’s performance and which Underlying Equity Funds were particularly weak?
SPDR S&P Oil & Gas Exploration ETF and VanEck Oil Services ETF, both accessed via derivatives, provided the strongest positive contributions to Portfolio performance. While no other Underlying Equity Funds contributed positively to the Portfolio’s absolute returns, those detracting the least included MainStay VP Epoch U.S. Equity Yield Portfolio, IQ Chaikin U.S. Small Cap ETF and MainStay WMC Value Fund. The most significant losses were attributable to MainStay VP Wellington Growth Portfolio, MainStay VP Winslow Large Cap Growth Portfolio, and IQ Candriam ESG U.S. Large Cap Equity ETF.
What factors and risks affected the Portfolio’s Underlying Fixed-Income Portfolio/Fund investments during the reporting period?
Sustained, elevated inflation readings and the corresponding rise in federal funds rate expectations largely drove bond returns during the reporting period. A modest widening in credit spreads4 as economic growth slowed, and fears of a potential recession increased, was offset by the higher yields and shorter duration of comparable maturity corporate bonds across the quality spectrum.
During the reporting period, which fixed-income market segments were the strongest positive contributors to the Portfolio’s performance and which segments were particularly weak?
Broadly speaking, short-duration instruments experienced more modestly negative returns than longer-duration instruments. Speculative-grade bonds performed similarly to higher-quality bonds, as their richer yields and shorter duration were balanced by spread widening.
Which Underlying Fixed-Income Portfolios/Funds made the strongest positive contributions to the Portfolio’s performance, and which Underlying Fixed-Income Portfolios/Funds were the greatest detractors?
Cash, generating a small, positive return, was the only holding that did not contribute negatively to return. The Underlying Fixed-Income Funds detracting the least from performance were MainStay VP Floating Rate Bond Portfolio, MainStay VP PIMCO Real Return Portfolio, and iShares 20+ Year Treasury Bond ETF (the latter two due to small position sizing). The most significant
detractors included MainStay VP Indexed Bond Portfolio, MainStay VP Bond Portfolio and MainStay VP MacKay High Yield Corporate Bond Portfolio.
| 4. | The terms “spread” and “yield spread” may refer to the difference in yield between a security or type of security and comparable U.S. Treasury issues. The terms may also refer to the difference in yield between two specific securities or types of securities at a given time. |
The opinions expressed are those of the portfolio managers as of the date of this report and are subject to change. There is no guarantee that any forecasts will come to pass. This material does not constitute investment advice and is not intended as an endorsement of any specific investment.
Not all MainStay VP Portfolios and/or share classes are available under all policies.
Portfolio of Investments December 31, 2022†
| | Shares | Value |
| Affiliated Investment Companies 89.8% |
| Equity Funds 36.3% |
| IQ 500 International ETF | 306,353 | $ 8,664,031 |
| IQ Candriam ESG International Equity ETF | 348,014 | 8,630,747 |
| IQ Candriam ESG U.S. Large Cap Equity ETF | 420,915 | 13,462,124 |
| IQ Chaikin U.S. Large Cap ETF | 335,807 | 10,544,441 |
| IQ Chaikin U.S. Small Cap ETF | 179,792 | 5,732,272 |
| IQ FTSE International Equity Currency Neutral ETF | 473,632 | 10,112,043 |
| MainStay Epoch Capital Growth Fund Class I | 166,062 | 1,797,807 |
| MainStay Epoch International Choice Fund Class I | 151,918 | 5,146,484 |
| MainStay VP American Century Sustainable Equity Portfolio Initial Class | 1,075,949 | 11,907,845 |
| MainStay VP Candriam Emerging Markets Equity Portfolio Initial Class | 1,174,247 | 7,755,550 |
| MainStay VP Epoch U.S. Equity Yield Portfolio Initial Class | 648,144 | 10,918,110 |
| MainStay VP MacKay International Equity Portfolio Initial Class | 498,058 | 5,124,469 |
| MainStay VP S&P 500 Index Portfolio Initial Class | 110,740 | 7,717,966 |
| MainStay VP Small Cap Growth Portfolio Initial Class | 824,750 | 7,725,845 |
| MainStay VP Wellington Growth Portfolio Initial Class | 761,015 | 13,421,028 |
| MainStay VP Wellington Mid Cap Portfolio Initial Class | 1,161,448 | 8,618,871 |
| MainStay VP Wellington Small Cap Portfolio Initial Class | 868,990 | 6,680,272 |
| MainStay VP Wellington U.S. Equity Portfolio Initial Class | 294,321 | 6,274,372 |
| MainStay VP Winslow Large Cap Growth Portfolio Initial Class | 689,896 | 13,076,090 |
| MainStay WMC Enduring Capital Fund Class R6 | 206,340 | 6,120,044 |
| MainStay WMC International Research Equity Fund Class I | 801,603 | 5,237,271 |
| MainStay WMC Value Fund Class R6 | 358,041 | 10,305,989 |
Total Equity Funds
(Cost $210,971,769) | | 184,973,671 |
| Fixed Income Funds 53.5% |
| IQ MacKay ESG Core Plus Bond ETF (a) | 1,458,338 | 30,114,680 |
| MainStay MacKay Short Duration High Yield Fund Class I | 2,407,339 | 21,988,152 |
| | Shares | | Value |
| |
| Fixed Income Funds (continued) |
| MainStay VP Bond Portfolio Initial Class (a) | 2,360,369 | | $ 28,504,284 |
| MainStay VP Floating Rate Portfolio Initial Class (a) | 4,729,605 | | 39,426,930 |
| MainStay VP Indexed Bond Portfolio Initial Class (a) | 15,358,204 | | 130,713,678 |
| MainStay VP MacKay High Yield Corporate Bond Portfolio Initial Class | 1,998,339 | | 17,221,483 |
| MainStay VP PIMCO Real Return Portfolio Initial Class | 600,911 | | 4,942,133 |
Total Fixed Income Funds
(Cost $314,556,720) | | | 272,911,340 |
Total Affiliated Investment Companies
(Cost $525,528,489) | | | 457,885,011 |
| Short-Term Investment 9.9% |
| Affiliated Investment Company 9.9% |
| MainStay U.S. Government Liquidity Fund, 3.602% (b) | 50,553,611 | | 50,553,611 |
Total Short-Term Investment
(Cost $50,553,611) | 9.9% | | 50,553,611 |
Total Investments
(Cost $576,082,100) | 99.7% | | 508,438,622 |
| Other Assets, Less Liabilities | 0.3 | | 1,352,040 |
| Net Assets | 100.0% | | $ 509,790,662 |
| † | Percentages indicated are based on Portfolio net assets. |
| (a) | As of December 31, 2022, the Portfolio's ownership exceeds 5% of the outstanding shares of the Underlying Portfolio's/Fund's share class. |
| (b) | Current yield as of December 31, 2022. |
The notes to the financial statements are an integral part of, and should be read in conjunction with, the financial statements.
| 12 | MainStay VP Conservative Allocation Portfolio |
Investments in Affiliates (in 000's)
Investments in issuers considered to be affiliate(s) of the Portfolio during the year ended December 31, 2022 for purposes of Section 2(a)(3) of the Investment Company Act of 1940, as amended, were as follows:
| Affiliated Investment Companies | Value,
Beginning
of Year | Purchases
at Cost | Proceeds
from
Sales | Net
Realized
Gain/(Loss)
on Sales | Change in
Unrealized
Appreciation/
(Depreciation) | Value,
End of
Year | Dividend
Income | Other
Distributions | Shares
End of
Year |
| IQ 500 International ETF | $ 11,476 | $ 1,379 | $ (2,910) | $ 188 | $ (1,469) | $ 8,664 | $ 314 | $ — | 306 |
| IQ Candriam ESG International Equity ETF | 11,604 | 1,498 | (2,598) | 511 | (2,384) | 8,631 | 268 | — | 348 |
| IQ Candriam ESG U.S. Large Cap Equity ETF (a) | 20,570 | 1,899 | (4,595) | 1,135 | (5,547) | 13,462 | 212 | — | 421 |
| IQ Chaikin U.S. Large Cap ETF | 14,606 | 366 | (2,616) | 727 | (2,539) | 10,544 | 153 | — | 336 |
| IQ Chaikin U.S. Small Cap ETF | 4,613 | 2,436 | (762) | 224 | (779) | 5,732 | 64 | — | 180 |
| IQ FTSE International Equity Currency Neutral ETF (b) | 13,789 | 1,004 | (2,794) | 287 | (2,174) | 10,112 | 302 | 191 | 474 |
| IQ MacKay ESG Core Plus Bond ETF | — | 36,012 | (2,853) | (345) | (2,699) | 30,115 | 767 | — | 1,458 |
| MainStay Epoch Capital Growth Fund Class I | 2,554 | 223 | (479) | (88) | (412) | 1,798 | 8 | 18 | 166 |
| MainStay Epoch International Choice Fund Class I | 7,040 | 933 | (1,718) | (19) | (1,090) | 5,146 | 69 | — | 152 |
| MainStay MacKay Short Duration High Yield Fund Class I | 41,539 | 7,738 | (24,482) | (1,369) | (1,438) | 21,988 | 1,426 | — | 2,407 |
| MainStay U.S. Government Liquidity Fund | 56,348 | 135,036 | (140,830) | — | — | 50,554 | 732 | — | 50,554 |
| MainStay VP American Century Sustainable Equity Portfolio Initial Class (c) | 14,445 | 2,868 | (2,841) | 176 | (2,740) | 11,908 | 227 | 1,446 | 1,076 |
| MainStay VP Bond Portfolio Initial Class | 37,645 | 4,775 | (8,457) | (426) | (5,033) | 28,504 | 567 | — | 2,360 |
| MainStay VP Candriam Emerging Markets Equity Portfolio Initial Class | 10,230 | 2,106 | (389) | 24 | (4,215) | 7,756 | 84 | 1,168 | 1,174 |
| MainStay VP Epoch U.S. Equity Yield Portfolio Initial Class | 15,406 | 628 | (4,244) | 618 | (1,490) | 10,918 | 247 | 265 | 648 |
| MainStay VP Floating Rate Portfolio Initial Class | 51,854 | 2,708 | (12,369) | (617) | (2,149) | 39,427 | 2,046 | — | 4,730 |
| MainStay VP Indexed Bond Portfolio Initial Class | 212,609 | 18,085 | (71,087) | (2,246) | (26,647) | 130,714 | 3,942 | 1,769 | 15,358 |
| MainStay VP MacKay High Yield Corporate Bond Portfolio Initial Class | 27,741 | 13,967 | (21,101) | (2,831) | (554) | 17,222 | 954 | — | 1,998 |
| MainStay VP MacKay International Equity Portfolio Initial Class | 6,870 | 2,374 | (1,229) | (212) | (2,678) | 5,125 | 15 | 1,078 | 498 |
| MainStay VP PIMCO Real Return Portfolio Initial Class | 6,957 | 415 | (1,379) | 121 | (1,172) | 4,942 | 330 | — | 601 |
| MainStay VP S&P 500 Index Portfolio Initial Class (d) | 10,620 | 856 | (1,585) | 333 | (2,506) | 7,718 | 121 | 263 | 111 |
| MainStay VP Small Cap Growth Portfolio Initial Class | 8,925 | 3,924 | (778) | 5 | (4,350) | 7,726 | — | 1,917 | 825 |
| MainStay VP Wellington Growth Portfolio Initial Class | 19,594 | 8,811 | (3,737) | 370 | (11,617) | 13,421 | — | 4,528 | 761 |
| MainStay VP Wellington Mid Cap Portfolio Initial Class | 9,900 | 4,558 | (399) | (25) | (5,415) | 8,619 | — | 3,411 | 1,161 |
| MainStay VP Wellington Small Cap Portfolio Initial Class | 7,130 | 3,663 | (828) | 55 | (3,340) | 6,680 | 77 | 1,763 | 869 |
| MainStay VP Wellington U.S. Equity Portfolio Initial Class | 10,397 | 2,245 | (2,954) | (385) | (3,029) | 6,274 | 47 | 1,348 | 294 |
| MainStay VP Winslow Large Cap Growth Portfolio Initial Class | 20,477 | 7,977 | (5,316) | 306 | (10,368) | 13,076 | — | 3,582 | 690 |
| MainStay WMC Enduring Capital Fund Class R6 | 8,738 | 784 | (2,102) | (431) | (869) | 6,120 | 36 | 220 | 206 |
| MainStay WMC International Research Equity Fund Class I | 6,860 | 907 | (1,389) | (375) | (766) | 5,237 | 107 | — | 802 |
| MainStay WMC Value Fund Class R6 | 14,820 | 572 | (3,963) | (1,261) | 138 | 10,306 | 174 | 394 | 358 |
| | $ 685,357 | $270,747 | $(332,784) | $(5,550) | $(109,331) | $508,439 | $13,289 | $23,361 | |
| | |
| (a) | Prior to August 31, 2022, known as IQ Candriam ESG U.S. Equity ETF. |
| (b) | Prior to August 31, 2022, known as IQ 50 Percent Hedged FTSE International ETF. |
The notes to the financial statements are an integral part of, and should be read in conjunction with, the financial statements.
13
Portfolio of Investments December 31, 2022† (continued)
| (c) | Prior to May 1, 2022, known as MainStay VP T. Rowe Price Equity Income Portfolio Initial Class. |
| (d) | Prior to May 1, 2022, known as MainStay VP MacKay S&P 500 Index Portfolio Initial Class. |
Swap Contracts
Open OTC total return equity swap contracts as of December 31, 2022 were as follows1:
Swap
Counterparty | Reference Obligation | Floating Rate2 | Termination
Date(s) | Payment
Frequency
Paid/
Received | Notional
Amount
Long/
(Short)
(000)3 | Unrealized
Appreciation/
(Depreciation)4 |
| Citibank NA | Invesco S&P 500 Low Volatility ETF | 1 day FEDF plus 0.45% | 12/4/23 | Daily | 7,792 | $ — |
| Citibank NA | iShares 20+ Year Treasury Bond ETF | 1 day FEDF plus 0.35% | 12/4/23 | Daily | 2,367 | — |
| Citibank NA | iShares MSCI EAFE ETF | 1 day FEDF minus 1.25% | 12/4/23 | Daily | (13,908) | — |
| Citibank NA | iShares MSCI Emerging Markets ETF | 1 day FEDF minus 0.46% | 12/4/23 | Daily | (8,198) | — |
| Citibank NA | Russell 1000 Growth Total Return Index | 1 day FEDF minus 0.20% | 12/4/23 | Daily | (7,669) | — |
| Citibank NA | S&P 400 Total Return | 1 day FEDF plus 0.30% | 12/4/23 | Daily | 13,745 | — |
| Citibank NA | S&P 500 Health Care Sector | 1 day FEDF plus 0.45% | 12/4/23 | Daily | 7,750 | — |
| Citibank NA | S&P 500 Total Return Index | 1 day FEDF plus 0.14% | 12/4/23 | Daily | (9,397) | — |
| Citibank NA | S&P 600 Total Return | 1 day FEDF plus 0.40% | 12/4/23 | Daily | 28,880 | — |
| Citibank NA | SPDR S&P Oil & Gas Exploration & Production ETF | 1 day FEDF plus 0.40% | 12/4/23 | Daily | 2,641 | — |
| Citibank NA | VanEck Gold Miners ETF | 1 day FEDF plus 0.55% | 12/4/23 | Daily | 2,548 | — |
| Citibank NA | VanEck Oil Services ETF | 1 day FEDF plus 0.40% | 12/4/23 | Daily | 2,839 | — |
| Citibank NA | Vanguard FTSE Europe ETF | 1 day FEDF minus 5.00% | 12/4/23 | Daily | (5,153) | — |
| | | | | | | $ — |
| 1. | As of December 31, 2022, cash in the amount $3,000,001 was pledged to brokers for OTC swap contracts. |
| 2. | Portfolio pays the floating rate and receives the total return of the reference entity. |
| 3. | Notional amounts reflected as a positive value indicate a long position held by the Portfolio or Index and a negative value indicates a short position. |
| 4. | Reflects the value at reset date as of December 31, 2022. |
| Abbreviation(s): |
| EAFE—Europe, Australasia and Far East |
| ETF—Exchange-Traded Fund |
| FEDF—Federal Funds Rate |
| FTSE—Financial Times Stock Exchange |
| MSCI—Morgan Stanley Capital International |
| SPDR—Standard & Poor’s Depositary Receipt |
The notes to the financial statements are an integral part of, and should be read in conjunction with, the financial statements.
| 14 | MainStay VP Conservative Allocation Portfolio |
The following is a summary of the fair valuations according to the inputs used as of December 31, 2022, for valuing the Portfolio’s assets:
| Description | Quoted
Prices in
Active
Markets for
Identical
Assets
(Level 1) | | Significant
Other
Observable
Inputs
(Level 2) | | Significant
Unobservable
Inputs
(Level 3) | | Total |
| Asset Valuation Inputs | | | | | | | |
| Investments in Securities (a) | | | | | | | |
| Affiliated Investment Companies | | | | | | | |
| Equity Funds | $ 184,973,671 | | $ — | | $ — | | $ 184,973,671 |
| Fixed Income Funds | 272,911,340 | | — | | — | | 272,911,340 |
| Total Affiliated Investment Companies | 457,885,011 | | — | | — | | 457,885,011 |
| Short-Term Investment | | | | | | | |
| Affiliated Investment Company | 50,553,611 | | — | | — | | 50,553,611 |
| Total Investments in Securities | $ 508,438,622 | | $ — | | $ — | | $ 508,438,622 |
| (a) | For a complete listing of investments, see the Portfolio of Investments. |
The notes to the financial statements are an integral part of, and should be read in conjunction with, the financial statements.
15
Statement of Assets and Liabilities as of December 31, 2022
| Assets |
Investment in affiliated investment companies, at value
(identified cost $576,082,100) | $508,438,622 |
| Cash collateral on deposit at broker for swap contracts | 3,000,001 |
| Receivables: | |
| Dividends | 681,447 |
| Portfolio shares sold | 44,892 |
| Other assets | 3,305 |
| Total assets | 512,168,267 |
| Liabilities |
| Payables: | |
| Dividends and interest on OTC swaps contracts | 1,771,929 |
| Investment securities purchased | 244,037 |
| Portfolio shares redeemed | 183,861 |
| NYLIFE Distributors (See Note 3) | 107,699 |
| Shareholder communication | 36,789 |
| Professional fees | 21,819 |
| Custodian | 6,059 |
| Accrued expenses | 5,412 |
| Total liabilities | 2,377,605 |
| Net assets | $509,790,662 |
| Composition of Net Assets |
| Shares of beneficial interest outstanding (par value of $.001 per share) unlimited number of shares authorized | $ 53,515 |
| Additional paid-in-capital | 576,166,543 |
| | 576,220,058 |
| Total distributable earnings (loss) | (66,429,396) |
| Net assets | $509,790,662 |
| Initial Class | |
| Net assets applicable to outstanding shares | $ 13,486,984 |
| Shares of beneficial interest outstanding | 1,398,969 |
| Net asset value per share outstanding | $ 9.64 |
| Service Class | |
| Net assets applicable to outstanding shares | $496,303,678 |
| Shares of beneficial interest outstanding | 52,116,208 |
| Net asset value per share outstanding | $ 9.52 |
The notes to the financial statements are an integral part of, and should be read in conjunction with, the financial statements.
| 16 | MainStay VP Conservative Allocation Portfolio |
Statement of Operations for the year ended December 31, 2022
| Investment Income (Loss) |
| Income | |
| Dividend distributions from affiliated investment companies | $ 13,288,929 |
| Expenses | |
| Distribution/Service—Service Class (See Note 3) | 1,403,961 |
| Professional fees | 63,761 |
| Shareholder communication | 35,267 |
| Custodian | 31,538 |
| Trustees | 12,319 |
| Miscellaneous | 16,092 |
| Total expenses | 1,562,938 |
| Net investment income (loss) | 11,725,991 |
| Realized and Unrealized Gain (Loss) |
| Net realized gain (loss) on: | |
| Affiliated investment company transactions | (5,550,451) |
| Realized capital gain distributions from affiliated investment companies | 23,360,650 |
| Swap transactions | (1,818,295) |
| Net realized gain (loss) | 15,991,904 |
Net change in unrealized appreciation (depreciation) on:
Affiliated investments companies | (109,330,812) |
| Net realized and unrealized gain (loss) | (93,338,908) |
| Net increase (decrease) in net assets resulting from operations | $ (81,612,917) |
The notes to the financial statements are an integral part of, and should be read in conjunction with, the financial statements.
17
Statements of Changes in Net Assets
for the years ended December 31, 2022 and December 31, 2021
| | 2022 | 2021 |
| Increase (Decrease) in Net Assets |
| Operations: | | |
| Net investment income (loss) | $ 11,725,991 | $ 12,840,420 |
| Net realized gain (loss) | 15,991,904 | 62,070,773 |
| Net change in unrealized appreciation (depreciation) | (109,330,812) | (28,483,081) |
| Net increase (decrease) in net assets resulting from operations | (81,612,917) | 46,428,112 |
| Distributions to shareholders: | | |
| Initial Class | (1,966,692) | (531,222) |
| Service Class | (74,201,160) | (19,279,410) |
| Total distributions to shareholders | (76,167,852) | (19,810,632) |
| Capital share transactions: | | |
| Net proceeds from sales of shares | 36,820,287 | 58,685,105 |
| Net asset value of shares issued to shareholders in reinvestment of distributions | 76,167,852 | 19,810,632 |
| Cost of shares redeemed | (133,464,320) | (120,116,541) |
| Increase (decrease) in net assets derived from capital share transactions | (20,476,181) | (41,620,804) |
| Net increase (decrease) in net assets | (178,256,950) | (15,003,324) |
| Net Assets |
| Beginning of year | 688,047,612 | 703,050,936 |
| End of year | $ 509,790,662 | $ 688,047,612 |
The notes to the financial statements are an integral part of, and should be read in conjunction with, the financial statements.
| 18 | MainStay VP Conservative Allocation Portfolio |
Financial Highlights selected per share data and ratios
| | Year Ended December 31, |
| Initial Class | 2022 | | 2021 | | 2020 | | 2019 | | 2018 |
| Net asset value at beginning of year | $ 12.91 | | $ 12.44 | | $ 11.70 | | $ 10.77 | | $ 11.80 |
| Net investment income (loss) (a) | 0.26 | | 0.27 | | 0.21 | | 0.20 | | 0.23 |
| Net realized and unrealized gain (loss) | (1.89) | | 0.61 | | 0.97 | | 1.38 | | (0.98) |
| Total from investment operations | (1.63) | | 0.88 | | 1.18 | | 1.58 | | (0.75) |
| Less distributions: | | | | | | | | | |
| From net investment income | (0.53) | | (0.25) | | (0.25) | | (0.34) | | (0.28) |
| From net realized gain on investments | (1.11) | | (0.16) | | (0.19) | | (0.31) | | — |
| Total distributions | (1.64) | | (0.41) | | (0.44) | | (0.65) | | (0.28) |
| Net asset value at end of year | $ 9.64 | | $ 12.91 | | $ 12.44 | | $ 11.70 | | $ 10.77 |
| Total investment return (b) | (12.05)% | | 7.13% | | 10.28% | | 14.83% | | (6.47)% |
| Ratios (to average net assets)/Supplemental Data: | | | | | | | | | |
| Net investment income (loss) | 2.31% | | 2.12% | | 1.76% | | 1.75% | | 2.02% |
| Net expenses (c) | 0.03% | | 0.03% | | 0.04% | | 0.03% | | 0.03% |
| Portfolio turnover rate | 26% | | 25% | | 29% | | 42% | | 58% |
| Net assets at end of year (in 000's) | $ 13,487 | | $ 17,168 | | $ 16,707 | | $ 16,327 | | $ 14,616 |
| (a) | Per share data based on average shares outstanding during the year. |
| (b) | Total return does not reflect any deduction of sales charges, mortality and expense charges, contract charges or administrative charges. For periods of less than one year, total return is not annualized. |
| (c) | In addition to the fees and expenses which the Portfolio bears directly, it also indirectly bears a pro-rata share of the fees and expenses of the underlying funds in which it invests. Such indirect expenses are not included in the above expense ratios. |
| | Year Ended December 31, |
| Service Class | 2022 | | 2021 | | 2020 | | 2019 | | 2018 |
| Net asset value at beginning of year | $ 12.77 | | $ 12.30 | | $ 11.57 | | $ 10.66 | | $ 11.67 |
| Net investment income (loss) (a) | 0.23 | | 0.23 | | 0.17 | | 0.17 | | 0.20 |
| Net realized and unrealized gain (loss) | (1.88) | | 0.61 | | 0.97 | | 1.35 | | (0.96) |
| Total from investment operations | (1.65) | | 0.84 | | 1.14 | | 1.52 | | (0.76) |
| Less distributions: | | | | | | | | | |
| From net investment income | (0.49) | | (0.21) | | (0.22) | | (0.30) | | (0.25) |
| From net realized gain on investments | (1.11) | | (0.16) | | (0.19) | | (0.31) | | — |
| Total distributions | (1.60) | | (0.37) | | (0.41) | | (0.61) | | (0.25) |
| Net asset value at end of year | $ 9.52 | | $ 12.77 | | $ 12.30 | | $ 11.57 | | $ 10.66 |
| Total investment return (b) | (12.27)% | | 6.86% | | 10.01% | | 14.55% | | (6.68)% |
| Ratios (to average net assets)/Supplemental Data: | | | | | | | | | |
| Net investment income (loss) | 2.03% | | 1.83% | | 1.50% | | 1.47% | | 1.70% |
| Net expenses (c) | 0.28% | | 0.28% | | 0.29% | | 0.28% | | 0.28% |
| Portfolio turnover rate | 26% | | 25% | | 29% | | 42% | | 58% |
| Net assets at end of year (in 000's) | $ 496,304 | | $ 670,879 | | $ 686,344 | | $ 716,077 | | $ 714,720 |
| (a) | Per share data based on average shares outstanding during the year. |
| (b) | Total return does not reflect any deduction of sales charges, mortality and expense charges, contract charges or administrative charges. For periods of less than one year, total return is not annualized. |
| (c) | In addition to the fees and expenses which the Portfolio bears directly, it also indirectly bears a pro-rata share of the fees and expenses of the underlying funds in which it invests. Such indirect expenses are not included in the above expense ratios. |
The notes to the financial statements are an integral part of, and should be read in conjunction with, the financial statements.
19
MainStay VP Moderate Allocation Portfolio
Investment and Performance Comparison (Unaudited)
Performance data quoted represents past performance. Past performance is no guarantee of future results. Because of market volatility and other factors, current performance may be lower or higher than the figures shown. Investment return and principal value will fluctuate, and as a result, when shares are redeemed, they may be worth more or less than their original cost. The performance table and graph do not reflect any deduction of sales charges, mortality and expense charges, contract charges or administrative charges. Please refer to the Performance Summary appropriate for your policy. For performance information current to the most recent month-end, please call 800-598-2019 or visit www.newyorklife.com.
Performance figures may reflect certain fee waivers and/or expense limitations, without which total returns may have been different. For information on current fee waivers and/or expense limitations (if any), please refer to the Notes to Financial Statements.
| Average Annual Total Returns for the Year-Ended December 31, 2022 |
| Class | Inception
Date | One
Year | Five
Years | Ten
Years | Gross
Expense
Ratio1 |
| Initial Class Shares | 2/13/2006 | -13.69% | 3.05% | 5.71% | 0.51% |
| Service Class Shares | 2/13/2006 | -13.91 | 2.79 | 5.45 | 0.76 |
| 1. | The gross expense ratios presented reflect the Portfolio’s “Total Annual Portfolio Operating Expenses” from the most recent Prospectus and may differ from other expense ratios disclosed in this report. |
The footnotes on the next page are an integral part of the table and graph and should be carefully read in conjunction with them.
| 20 | MainStay VP Moderate Allocation Portfolio |
| Benchmark Performance* | One
Year | Five
Years | Ten
Years |
| S&P 500® Index1 | -18.11% | 9.42% | 12.56% |
| MSCI EAFE® Index (Net)2 | -14.45 | 1.54 | 4.67 |
| Bloomberg U.S. Aggregate Bond Index3 | -13.01 | 0.02 | 1.06 |
| Moderate Allocation Composite Index4 | -15.23 | 4.79 | 6.97 |
| Morningstar Allocation - 50% to 70% Equity Category Average5 | -13.84 | 4.13 | 6.01 |
| * | Returns for indices reflect no deductions for fees, expenses or taxes, except for foreign withholding taxes where applicable. Results assume reinvestment of all dividends and capital gains. An investment cannot be made directly in an index. |
| 1. | The S&P 500® Index is the Portfolio's primary benchmark. S&P 500® is a trademark of The McGraw-Hill Companies, Inc. The S&P 500® Index is widely regarded as the standard index for measuring large-cap U.S. stock market performance. |
| 2. | The MSCI EAFE® Index (Net) is the Portfolio's secondary benchmark. The MSCI EAFE® Index (Net) consists of international stocks representing the developed world outside of North America. |
| 3. | The Portfolio has selected the Bloomberg U.S. Aggregate Bond Index as an additional benchmark. The Bloomberg U.S. Aggregate Bond Index is a broad-based benchmark that measures the performance of the investment grade, U.S. dollar-denominated, fixed-rate taxable bond market, including Treasurys, government-related and corporate securities, mortgage-backed securities (agency fixed-rate and hybrid adjustable rate mortgage pass-throughs), asset-backed securities, and commercial mortgage-backed securities. |
| 4. | The Portfolio has selected the Moderate Allocation Composite Index as an additional benchmark. The Moderate Allocation Composite Index consists of the S&P 500® Index, the MSCI EAFE® Index (Net) and the Bloomberg U.S. Aggregate Bond Index weighted 45%, 15% and 40%, respectively. |
| 5. | The Morningstar Allocation – 50% to 70% Equity Category Average is representative of funds that seek to provide both income and capital appreciation by investing in multiple asset classes, including stocks, bonds, and cash. These funds are dominated by domestic holdings and have equity exposures between 50% and 70%. Results are based on average total returns of similar funds with all dividends and capital gain distributions reinvested. |
The footnotes on the preceding page are an integral part of the table and graph and should be carefully read in conjunction with them.
Cost in Dollars of a $1,000 Investment in MainStay VP Moderate Allocation Portfolio (Unaudited)
The example below is intended to describe the fees and expenses borne by shareholders during the six-month period from July 1, 2022 to December 31, 2022, and the impact of those costs on your investment.
Example
As a shareholder of the Portfolio you incur two types of costs: (1) transaction costs, including exchange fees and sales charges (loads) on purchases (as applicable), and (2) ongoing costs, including management fees, distribution and/or service (12b-1) fees and other Portfolio expenses (as applicable). This example is intended to help you understand your ongoing costs (in dollars) of investing in the Portfolio and to compare these costs with the ongoing costs of investing in other mutual funds. The example is based on an investment of $1,000 made at the beginning of the six-month period and held for the entire period from July 1, 2022 to December 31, 2022. Shares are only sold in connection with variable life and annuity contracts and the example does not reflect any contract level or transactional fees or expenses. If these costs had been included, your costs would have been higher.
This example illustrates your Portfolio’s ongoing costs in two ways:
Actual Expenses
The second and third data columns in the table below provide information about actual account values and actual expenses. You may use the information in these columns, together with the amount you invested, to estimate the expenses that you paid during the six months ended
December 31, 2022. Simply divide your account value by $1,000 (for example, an $8,600 account value divided by $1,000 = 8.6), then multiply the result by the number under the heading entitled “Expenses Paid During Period” to estimate the expenses you paid on your account during this period.
Hypothetical Example for Comparison Purposes
The fourth and fifth data columns in the table below provide information about hypothetical account values and hypothetical expenses based on the Portfolio’s actual expense ratio and an assumed rate of return of 5% per year before expenses, which is not the Portfolio’s actual return. The hypothetical account values and expenses may not be used to estimate the actual ending account balances or expenses you paid for the six-month period shown. You may use this information to compare the ongoing costs of investing in the Portfolio with the ongoing costs of investing in other mutual funds. To do so, compare this 5% hypothetical example with the 5% hypothetical examples that appear in the shareholder reports of the other mutual funds.
Please note that the expenses shown in the table are meant to highlight your ongoing costs only and do not reflect any transactional costs, such as exchange fees or sales charges (loads). Therefore, the fourth and fifth data columns of the table are useful in comparing ongoing costs only and will not help you determine the relative total costs of owning different funds. In addition, if these transactional costs were included, your costs would have been higher.
| Share Class | Beginning
Account
Value
7/1/22 | Ending Account
Value (Based
on Actual
Returns and
Expenses)
12/31/22 | Expenses
Paid
During
Period1 | Ending Account
Value (Based
on Hypothetical
5% Annualized
Return and
Actual Expenses)
12/31/22 | Expenses
Paid
During
Period1 | Net Expense
Ratio
During
Period2 |
| Initial Class Shares | $1,000.00 | $1,023.20 | $0.10 | $1,025.10 | $0.10 | 0.02% |
| Service Class Shares | $1,000.00 | $1,021.90 | $1.38 | $1,023.84 | $1.38 | 0.27% |
| 1. | Expenses are equal to the Portfolio’s annualized expense ratio of each class multiplied by the average account value over the period, divided by 365 and multiplied by 184 (to reflect the six-month period). The table above represents the actual expenses incurred during the six-month period. In addition to the fees and expenses which the Portfolio bears directly, it also indirectly bears a pro rata share of the fees and expenses of the underlying Portfolios/Funds in which it invests. Such indirect expenses are not included in the above-reported expense figures. |
| 2. | Expenses are equal to the Portfolio's annualized expense ratio to reflect the six-month period. |
| 22 | MainStay VP Moderate Allocation Portfolio |
Asset Diversification as of December 31, 2022 (Unaudited)
| Equity Funds | 56.4% |
| Fixed Income Funds | 33.3 |
| Short-Term Investment | 10.0 |
| Other Assets, Less Liabilities | 0.3 |
See Portfolio of Investments beginning on page 27 for specific holdings within these categories. The Portfolio’s holdings are subject to change.
Portfolio Management Discussion and Analysis (Unaudited)
Answers to the questions reflect the views of portfolio managers Jae S. Yoon, CFA, Jonathan Swaney, Poul Kristensen, CFA, and Amit Soni, CFA, of New York Life Investments,1 the Portfolio’s Manager.
How did MainStay VP Moderate Allocation Portfolio perform relative to its benchmarks and peers during the 12 months ended December 31, 2022?
For the 12 months ended December 31, 2022, MainStay VP Moderate Allocation Portfolio returned −13.69% for Initial Class shares and −13.91% for Service Class shares. Over the same period, both share classes outperformed the −18.11% return of the S&P 500® Index, which is the Portfolio’s primary benchmark, and the −14.45% return of the MSCI EAFE® Index (Net), which is a secondary benchmark of the Portfolio. For the 12 months ended December 31, 2022, both share classes underperformed the −13.01% return of the Bloomberg U.S. Aggregate Bond Index and outperformed the −15.23% return of the Moderate Allocation Composite Index, which are additional benchmarks of the Portfolio. Over the same period, Initial Class shares outperformed and Service Class shares underperformed the −13.84% return of the Morningstar Allocation—50% to 70% Equity Category Average.2
What factors affected the Portfolio’s relative performance during the reporting period?
The Portfolio is a “fund of funds,” meaning that it seeks to achieve its investment objective by investing primarily in mutual funds and exchange-traded funds (“ETFs”) managed by New York Life Investments or its affiliates (the “Underlying Portfolios/Funds”). The Underlying Portfolios/Funds may invest in U.S. equities, international equities and fixed-income instruments, making comparisons to any single index generally less suitable than a weighted combination of indices, which is a more useful yardstick by which to measure performance. The Portfolio’s management internally maintains a blend of indices that are taken into consideration when managing the Portfolio. During the reporting period, the Portfolio outperformed this internally maintained blend of indices, primarily due to active positioning at the asset class level.
The Portfolio’s outperformance was driven by the following factors:
| • | Management of the stock/bond blend: The Portfolio’s management of its stock/bond blend proved generally successful, reflecting tactical adjustments made throughout the reporting period. With both investment-grade bonds and U.S. stocks posting declines in the mid-teens, there was little cost or benefit to being persistently overweight or underweight to equities, although adjusting that exposure over time (buying dips and selling rallies) added material value. |
| • | Value created within asset classes: The equity portion of the Portfolio emphasized value over growth, with a specific focus on energy companies and defensive sectors that the market rewarded. Conditions also marginally favored the Portfolio’s skew toward profitable small-cap companies. |
| • | Gold and energy exposure: The equity portion of the Portfolio modestly benefited from tactical exposure to stocks of gold miners and energy producers. |
| • | Shorter duration:3 The fixed income portion of the Portfolio shortened its average duration by holding cash and emphasizing exposure to MainStay MacKay Short Duration High Yield Fund over MainStay MacKay VP High Yield Corporate Bond Portfolio; these moves lifted relative returns. |
Conversely, performance was undermined by management of the Portfolio’s exposure to non-U.S. markets. Following Russia’s invasion of Ukraine, the Portfolio shifted from overweight to underweight exposure to developed international markets in anticipation of an impending recession. However, European economic activity held up better than expected, and shying away from those markets detracted from returns. Similarly, but in reverse, our expectation that emerging markets were likely to benefit from fiscal stimulus in China ahead of the party congress in November proved ill-founded. Emerging markets fared poorly as the anticipated stimulus failed to materialize, and the Portfolio’s emerging-markets holdings dragged on performance. In addition, the underperformance of some of the Underlying Funds relative to their benchmarks detracted modestly from the Portfolio’s relative performance.
During the reporting period, how was the Portfolio’s performance materially affected by investments in derivatives?
Total return swaps were used to express most of the Portfolio’s tactical asset class policy views. Therefore, the swaps can be seen as enhancing the Portfolio’s relative performance over the course of the reporting period.
How did you allocate the Portfolio’s assets during the reporting period and why?
Stock/bond blend: On average, the Portfolio held moderately overweight exposure to equities during the reporting period, with the magnitude of that bias managed tactically in response to swings in pricing (adding on drawdowns and trimming on rallies). We are generally reluctant to position the Portfolio with underweight exposure to equities, as stocks have tended to perform well over time and anticipating drawdowns is challenging.
| 1. | “New York Life Investments” is a service mark used by New York Life Investment Management Holdings LLC and its subsidiary New York Life Investment Management LLC. |
| 2. | See page 21 for more information on benchmark and peer group returns. |
| 3. | Duration is a measure of the price sensitivity of a fixed-income investment to changes in interest rates. Duration is expressed as a number of years and is considered a more accurate sensitivity gauge than average maturity. |
| 24 | MainStay VP Moderate Allocation Portfolio |
Conversely, we’re happy to position the Portfolio with a bias toward equities when we believe stocks are well supported fundamentally or when a correction has run further than we believe appropriate. This approach paid off during the reporting period. Despite stocks declining by double digits, meaningful extra return was generated by tactically adjusting the degree to which the Portfolio held overweight exposure to equities.
Duration: Believing inflationary pressures to be partially structural in nature and likely to persist at elevated levels for the foreseeable future, we skewed the fixed-income portion of the Portfolio to favor shorter-maturity and lower-quality instruments that would be less sensitive to rising bond yields, although duration was added as yields rose. As of the end of the reporting period, the Portfolio’s duration was only slightly shorter than that of the Bloomberg U.S. Aggregate Bond Index. Maintaining a short duration posture improved returns.
Equity style: We viewed inflation, which undermines the value of more distant cash flows, as threatening to growth equities with high prices relative to current earnings. Accordingly, the Portfolio emphasized value stocks offering more attractive near-term cash flows. We placed a particular focus on the relatively defensive sectors of real estate, utilities, consumer staples and, most of all, health care. This emphasis on value over growth made a positive contribution to performance. (Contributions take weightings and total returns into account.)
Equity size: The Portfolio maintained a significant exposure to U.S. small-cap stocks. The thesis behind this positioning was based on the U.S. small-cap universe’s relatively attractive valuations, insulation from economic weakness abroad, less sensitivity to dollar strength and disproportionate exposure to domestic demand, which remained robust. Despite these presumed advantages, however, the Portfolio’s small-cap positions provided only modestly positive contributions to relative performance.
Geographic exposure: Prior to Russia’s invasion of Ukraine, the Portfolio’s geographic exposure reflected our positive expectations for non-U.S. developed markets generally, and Europe in particular, based on attractive valuations and the post-COVID-19 cyclical recovery we expected. War, sanctions, soaring local energy prices and looming recession changed the underlying picture. We responded by unwinding the Portfolio’s position and then reversing it, shifting to an underweight position in non-U.S. developed market equities. This move ultimately detracted from relative returns as non-U.S. economies fared better than expected, with developed international equity markets outperforming U.S. markets.
Gold miners: The Portfolio maintained a varying degree of exposure to gold miners as a hedge against inflation and/or a monetary policy mistake. The position proved volatile, making a modestly positive contribution to relative returns when viewed over the course of the full year.
Energy: As with gold miners, the Portfolio maintained exposure to upstream energy producers as a commodity play to provide an additional inflation hedge. These holdings also positioned the Portfolio to take advantage of opportunities for domestic producers to benefit as Western nations revisited energy policy in order to source supplies from stable and friendly jurisdictions rather than autocratic petrostates that present national security risks. While the Portfolio’s position was small, it had a disproportionately positive impact on performance as oil and gas prices soared.
How did the Portfolio’s allocations change over the course of the reporting period?
The Portfolio’s positioning is most often implemented using derivatives, specifically total return swaps. The use of swaps to reduce exposure to non-U.S. developed markets and increase exposure to mid- and small-cap companies during the reporting period, as discussed above, stand as good examples. Similarly, exposure to defensive sectors and energy producers was realized during the period by swapping into the return stream on specific ETFs, including Invesco S&P Low Volatility ETF, SPDR S&P Oil & Gas Exploration & Production ETF and VanEck Oil Services ETF. We also added duration to the Portfolio’s bond holdings after yields had already risen considerably by entering into a swap in which the Portfolio received the return on iShares 20+ Year Treasury Bond ETF.
The largest adjustment made to actual Portfolio holdings involved a partial shift out of MainStay VP Indexed Bond Portfolio and into IQ MacKay ESG Core Plus Bond ETF. The latter, a recently launched product, provides active management that introduces some additional criteria to the selection of individual issues. We anticipate that diversifying the Portfolio’s assets across both products will prove helpful over time.
Another change involved sales of positions in MainStay MacKay Short Duration High Yield Fund and MainStay VP MacKay High Yield Corporate Bond Portfolio; this reduced the Portfolio’s high yield bond exposure to neutral in anticipation of a potential recession and the likely resulting damage to credit spreads.
During the reporting period, which Underlying Equity Funds had the highest total returns and which had the lowest total returns?
The holdings providing the highest total returns involved swaps that were in place for only part of the reporting period. Generally, exposure to energy companies generated the only gains for the reporting period, while exposure to the health care sector and low volatility stocks produced the smallest losses. Among Underlying Equity Funds held for the entire reporting period, the smallest losses came from MainStay VP Epoch U.S. Equity Yield Portfolio, MainStay WMC Value Fund, and MainStay VP American Century Sustainable Equity Portfolio. At the other end of the spectrum, the
Underlying Equity Funds with the lowest returns were MainStay VP Wellington Growth Portfolio, MainStay VP Winslow Large Cap Growth Portfolio and MainStay VP Candriam Emerging Markets Equity Portfolio.
Which Underlying Equity Funds were the strongest positive contributors to the Portfolio’s performance and which Underlying Equity Funds were particularly weak?
SPDR S&P Oil & Gas Exploration ETF and VanEck Oil Services ETF, both accessed via derivatives, provided the strongest positive contributions to Portfolio performance. While no other Underlying Equity Funds contributed positively to the Portfolio’s absolute returns, those detracting the least included MainStay VP Epoch U.S. Equity Yield Portfolio, MainStay Epoch Capital Growth Fund and IQ Chaikin U.S. Small Cap ETF. The most significant losses were attributable to MainStay VP Wellington Growth Portfolio, MainStay VP Winslow Large Cap Growth Portfolio, and IQ Candriam ESG U.S. Large Cap Equity ETF.
What factors and risks affected the Portfolio’s Underlying Fixed-Income Portfolio/Fund investments during the reporting period?
Sustained, elevated inflation readings and the corresponding rise in federal funds rate expectations largely drove bond returns during the reporting period. A modest widening in credit spreads4 as economic growth slowed, and fears of a potential recession increased, was offset by the higher yields and shorter duration of comparable maturity corporate bonds across the quality spectrum.
During the reporting period, which fixed-income market segments were the strongest positive contributors to the Portfolio’s performance and which segments were particularly weak?
Broadly speaking, short-duration instruments experienced more modestly negative returns than longer-duration instruments. Speculative-grade bonds performed similarly to higher-quality bonds, as their richer yield and shorter duration was balanced by spread widening.
Which Underlying Fixed-Income Portfolios/Funds made the strongest positive contributions to the Portfolio’s performance, and which Underlying Fixed-Income Portfolios/Funds were the greatest detractors?
Cash, generating a small, positive return, was the only holding that did not contribute negatively to return. The Underlying Fixed-Income Funds detracting the least from performance were MainStay VP Floating Rate Bond Portfolio, MainStay VP PIMCO Real Return Portfolio, and MainStay MacKay Short Duration High Yield Fund. The most significant detractors included MainStay VP Indexed Bond Portfolio, MainStay VP Bond Portfolio and MainStay VP MacKay High Yield Corporate Bond Portfolio.
| 4. | The terms “spread” and “yield spread” may refer to the difference in yield between a security or type of security and comparable U.S. Treasury issues. The terms may also refer to the difference in yield between two specific securities or types of securities at a given time. |
The opinions expressed are those of the portfolio managers as of the date of this report and are subject to change. There is no guarantee that any forecasts will come to pass. This material does not constitute investment advice and is not intended as an endorsement of any specific investment.
Not all MainStay VP Portfolios and/or share classes are available under all policies.
| 26 | MainStay VP Moderate Allocation Portfolio |
Portfolio of Investments December 31, 2022†
| | Shares | Value |
| Affiliated Investment Companies 89.7% |
| Equity Funds 56.4% |
| IQ 500 International ETF (a) | 728,518 | $ 20,603,363 |
| IQ Candriam ESG International Equity ETF (a) | 827,588 | 20,524,183 |
| IQ Candriam ESG U.S. Large Cap Equity ETF (a) | 1,135,164 | 36,305,950 |
| IQ Chaikin U.S. Large Cap ETF (a) | 924,959 | 29,043,990 |
| IQ Chaikin U.S. Small Cap ETF | 320,310 | 10,212,380 |
| IQ FTSE International Equity Currency Neutral ETF (a) | 760,763 | 16,242,290 |
| MainStay Epoch Capital Growth Fund Class I (a) | 266,729 | 2,887,638 |
| MainStay Epoch International Choice Fund Class I (a) | 439,991 | 14,905,483 |
| MainStay VP American Century Sustainable Equity Portfolio Initial Class (a) | 3,049,409 | 33,748,725 |
| MainStay VP Candriam Emerging Markets Equity Portfolio Initial Class (a) | 3,143,560 | 20,762,269 |
| MainStay VP Epoch U.S. Equity Yield Portfolio Initial Class (a) | 1,793,459 | 30,211,173 |
| MainStay VP MacKay International Equity Portfolio Initial Class (a) | 1,443,850 | 14,855,633 |
| MainStay VP S&P 500 Index Portfolio Initial Class | 177,480 | 12,369,368 |
| MainStay VP Small Cap Growth Portfolio Initial Class (a) | 1,772,565 | 16,604,499 |
| MainStay VP Wellington Growth Portfolio Initial Class (a) | 2,050,172 | 36,156,223 |
| MainStay VP Wellington Mid Cap Portfolio Initial Class (a) | 2,640,975 | 19,598,147 |
| MainStay VP Wellington Small Cap Portfolio Initial Class (a) | 1,735,574 | 13,342,054 |
| MainStay VP Wellington U.S. Equity Portfolio Initial Class | 907,630 | 19,348,943 |
| MainStay VP Winslow Large Cap Growth Portfolio Initial Class (a) | 1,849,467 | 35,054,244 |
| MainStay WMC Enduring Capital Fund Class R6 (a) | 538,479 | 15,971,273 |
| MainStay WMC International Research Equity Fund Class I (a) | 2,318,383 | 15,147,154 |
| | Shares | | Value |
| |
| Equity Funds (continued) |
| MainStay WMC Value Fund Class R6 (a) | 981,626 | | $ 28,255,528 |
Total Equity Funds
(Cost $534,038,931) | | | 462,150,510 |
| Fixed Income Funds 33.3% |
| IQ MacKay ESG Core Plus Bond ETF (a) | 1,392,840 | | 28,762,146 |
| MainStay MacKay Short Duration High Yield Fund Class I | 2,487,633 | | 22,721,543 |
| MainStay VP Bond Portfolio Initial Class (a) | 2,246,989 | | 27,135,085 |
| MainStay VP Floating Rate Portfolio Initial Class (a) | 5,064,635 | | 42,219,811 |
| MainStay VP Indexed Bond Portfolio Initial Class (a) | 14,668,496 | | 124,843,568 |
| MainStay VP MacKay High Yield Corporate Bond Portfolio Initial Class | 2,237,146 | | 19,279,497 |
| MainStay VP PIMCO Real Return Portfolio Initial Class (a) | 1,006,815 | | 8,280,451 |
Total Fixed Income Funds
(Cost $315,252,211) | | | 273,242,101 |
Total Affiliated Investment Companies
(Cost $849,291,142) | | | 735,392,611 |
| Short-Term Investment 10.0% |
| Affiliated Investment Company 10.0% |
| MainStay U.S. Government Liquidity Fund, 3.602% (a)(b) | 82,309,614 | | 82,309,614 |
Total Short-Term Investment
(Cost $82,309,614) | 10.0% | | 82,309,614 |
Total Investments
(Cost $931,600,756) | 99.7% | | 817,702,225 |
| Other Assets, Less Liabilities | 0.3 | | 2,098,077 |
| Net Assets | 100.0% | | $ 819,800,302 |
| † | Percentages indicated are based on Portfolio net assets. |
| (a) | As of December 31, 2022, the Portfolio's ownership exceeds 5% of the outstanding shares of the Underlying Portfolio's/Fund's share class. |
| (b) | Current yield as of December 31, 2022. |
The notes to the financial statements are an integral part of, and should be read in conjunction with, the financial statements.
27
Portfolio of Investments December 31, 2022† (continued)
Investments in Affiliates (in 000's)
Investments in issuers considered to be affiliate(s) of the Portfolio during the year ended December 31, 2022 for purposes of Section 2(a)(3) of the Investment Company Act of 1940, as amended, were as follows:
| Affiliated Investment Companies | Value,
Beginning
of Year | Purchases
at Cost | Proceeds
from
Sales | Net
Realized
Gain/(Loss)
on Sales | Change in
Unrealized
Appreciation/
(Depreciation) | Value,
End of
Year | Dividend
Income | Other
Distributions | Shares
End of
Year |
| IQ 500 International ETF | $ 28,063 | $ 2,168 | $ (6,541) | $ 488 | $ (3,575) | $ 20,603 | $ 735 | $ — | 729 |
| IQ Candriam ESG International Equity ETF | 27,143 | 2,240 | (4,395) | 967 | (5,431) | 20,524 | 625 | — | 828 |
| IQ Candriam ESG U.S. Large Cap Equity ETF (a) | 55,928 | 2,953 | (10,659) | 2,796 | (14,712) | 36,306 | 560 | — | 1,135 |
| IQ Chaikin U.S. Large Cap ETF | 36,677 | 863 | (3,676) | 941 | (5,761) | 29,044 | 411 | — | 925 |
| IQ Chaikin U.S. Small Cap ETF | 12,681 | 5,268 | (6,399) | 1,136 | (2,474) | 10,212 | 125 | — | 320 |
| IQ FTSE International Equity Currency Neutral ETF (b) | 21,614 | 1,088 | (3,431) | 165 | (3,194) | 16,242 | 477 | 307 | 761 |
| IQ MacKay ESG Core Plus Bond ETF | — | 35,103 | (3,452) | (406) | (2,483) | 28,762 | 725 | — | 1,393 |
| MainStay Epoch Capital Growth Fund Class I | 4,555 | 191 | (976) | (162) | (720) | 2,888 | 13 | 30 | 267 |
| MainStay Epoch International Choice Fund Class I | 20,087 | 1,741 | (3,667) | (104) | (3,152) | 14,905 | 199 | — | 440 |
| MainStay MacKay Short Duration High Yield Fund Class I | 37,772 | 11,859 | (24,065) | (1,263) | (1,581) | 22,722 | 1,445 | — | 2,488 |
| MainStay U.S. Government Liquidity Fund | 86,595 | 204,898 | (209,183) | — | — | 82,310 | 1,167 | — | 82,310 |
| MainStay VP American Century Sustainable Equity Portfolio Initial Class (c) | 29,670 | 15,291 | (4,142) | 297 | (7,367) | 33,749 | 631 | 4,026 | 3,049 |
| MainStay VP Bond Portfolio Initial Class | 34,562 | 7,602 | (10,197) | (750) | (4,082) | 27,135 | 520 | — | 2,247 |
| MainStay VP Candriam Emerging Markets Equity Portfolio Initial Class | 25,243 | 6,874 | (469) | 7 | (10,893) | 20,762 | 225 | 3,124 | 3,144 |
| MainStay VP Epoch U.S. Equity Yield Portfolio Initial Class | 35,110 | 3,687 | (6,192) | 571 | (2,965) | 30,211 | 677 | 725 | 1,793 |
| MainStay VP Floating Rate Portfolio Initial Class | 53,882 | 3,267 | (12,003) | (466) | (2,460) | 42,220 | 2,156 | — | 5,065 |
| MainStay VP Indexed Bond Portfolio Initial Class | 195,192 | 28,583 | (73,568) | (8,449) | (16,914) | 124,844 | 3,627 | 1,628 | 14,668 |
| MainStay VP MacKay High Yield Corporate Bond Portfolio Initial Class | 43,239 | 14,316 | (33,418) | (4,482) | (375) | 19,280 | 1,067 | — | 2,237 |
| MainStay VP MacKay International Equity Portfolio Initial Class | 18,252 | 7,226 | (2,638) | (754) | (7,230) | 14,856 | 44 | 3,116 | 1,444 |
| MainStay VP PIMCO Real Return Portfolio Initial Class | 10,844 | 986 | (1,892) | 219 | (1,876) | 8,281 | 529 | — | 1,007 |
| MainStay VP S&P 500 Index Portfolio Initial Class (d) | 24,164 | 899 | (8,746) | 2,506 | (6,454) | 12,369 | 194 | 422 | 177 |
| MainStay VP Small Cap Growth Portfolio Initial Class | 25,875 | 7,558 | (6,290) | 723 | (11,262) | 16,604 | — | 4,293 | 1,773 |
| MainStay VP Wellington Growth Portfolio Initial Class | 32,678 | 36,508 | (6,074) | 350 | (27,306) | 36,156 | — | 12,008 | 2,050 |
| MainStay VP Wellington Mid Cap Portfolio Initial Class | 27,421 | 9,823 | (4,528) | (64) | (13,054) | 19,598 | — | 7,949 | 2,641 |
| MainStay VP Wellington Small Cap Portfolio Initial Class | 19,779 | 6,688 | (5,783) | (325) | (7,017) | 13,342 | 161 | 3,715 | 1,736 |
| MainStay VP Wellington U.S. Equity Portfolio Initial Class | 15,868 | 17,304 | (5,086) | (743) | (7,994) | 19,349 | 139 | 4,020 | 908 |
| MainStay VP Winslow Large Cap Growth Portfolio Initial Class | 58,676 | 16,623 | (13,173) | 2,090 | (29,162) | 35,054 | — | 9,468 | 1,849 |
| MainStay WMC Enduring Capital Fund Class R6 | 29,710 | 815 | (10,584) | (3,195) | (775) | 15,971 | 93 | 573 | 538 |
| MainStay WMC International Research Equity Fund Class I | 19,107 | 2,018 | (2,725) | (1,057) | (2,196) | 15,147 | 310 | — | 2,318 |
| MainStay WMC Value Fund Class R6 | 39,755 | 1,648 | (9,978) | (2,619) | (550) | 28,256 | 476 | 1,076 | 982 |
| | $1,070,142 | $456,088 | $(493,930) | $(11,583) | $(203,015) | $ 817,702 | $17,331 | $56,480 | |
| | |
| (a) | Prior to August 31, 2022, known as IQ Candriam ESG U.S. Equity ETF. |
| (b) | Prior to August 31, 2022, known as IQ 50 Percent Hedged FTSE International ETF. |
| (c) | Prior to May 1, 2022, known as MainStay VP T. Rowe Price Equity Income Portfolio Initial Class. |
| (d) | Prior to May 1, 2022, known as MainStay VP MacKay S&P 500 Index Portfolio Initial Class. |
The notes to the financial statements are an integral part of, and should be read in conjunction with, the financial statements.
| 28 | MainStay VP Moderate Allocation Portfolio |
Swap Contracts
Open OTC total return equity swap contracts as of December 31, 2022 were as follows1:
Swap
Counterparty | Reference Obligation | Floating Rate2 | Termination
Date(s) | Payment
Frequency
Paid/
Received | Notional
Amount
Long/
(Short)
(000)3 | Unrealized
Appreciation/
(Depreciation)4 |
| Citibank NA | Invesco S&P 500 Low Volatility ETF | 1 day FEDF plus 0.45% | 12/4/23 | Daily | 12,515 | $ — |
| Citibank NA | iShares 20+ Year Treasury Bond ETF | 1 day FEDF plus 0.35% | 12/4/23 | Daily | 3,804 | — |
| Citibank NA | iShares MSCI EAFE ETF | 1 day FEDF minus 1.25% | 12/4/23 | Daily | (18,101) | — |
| Citibank NA | iShares MSCI Emerging Markets ETF | 1 day FEDF minus 0.50% | 12/4/23 | Daily | (17,158) | — |
| Citibank NA | Russell 1000 Growth Total Return Index | 1 day FEDF minus 0.20% | 12/4/23 | Daily | (12,289) | — |
| Citibank NA | S&P 400 Total Return | 1 day FEDF plus 0.30% | 12/4/23 | Daily | 23,923 | — |
| Citibank NA | S&P 500 Health Care Sector | 1 day FEDF plus 0.45% | 12/4/23 | Daily | 12,446 | — |
| Citibank NA | S&P 500 Total Return Index | 1 day FEDF plus 0.14% | 12/4/23 | Daily | (15,097) | — |
| Citibank NA | S&P 600 Total Return | 1 day FEDF plus 0.40% | 12/4/23 | Daily | 44,570 | — |
| Citibank NA | SPDR S&P Oil & Gas Exploration & Production ETF | 1 day FEDF plus 0.40% | 12/4/23 | Daily | 4,243 | — |
| Citibank NA | VanEck Gold Miners ETF | 1 day FEDF plus 0.55% | 12/4/23 | Daily | 4,098 | — |
| Citibank NA | VanEck Oil Services ETF | 1 day FEDF plus 0.40% | 12/4/23 | Daily | 4,560 | — |
| Citibank NA | Vanguard FTSE Europe ETF | 1 day FEDF minus 5.00% | 12/4/23 | Daily | (8,276) | — |
| | | | | | | $ — |
| 1. | As of December 31, 2022, cash in the amount $4,500,000 was pledged to brokers for OTC swap contracts. |
| 2. | Portfolio pays the floating rate and receives the total return of the reference entity. |
| 3. | Notional amounts reflected as a positive value indicate a long position held by the Portfolio or Index and a negative value indicates a short position. |
| 4. | Reflects the value at reset date as of December 31, 2022. |
| Abbreviation(s): |
| EAFE—Europe, Australasia and Far East |
| ETF—Exchange-Traded Fund |
| FEDF—Federal Funds Rate |
| FTSE—Financial Times Stock Exchange |
| MSCI—Morgan Stanley Capital International |
| SPDR—Standard & Poor’s Depositary Receipt |
The notes to the financial statements are an integral part of, and should be read in conjunction with, the financial statements.
29
Portfolio of Investments December 31, 2022† (continued)
The following is a summary of the fair valuations according to the inputs used as of December 31, 2022, for valuing the Portfolio’s assets:
| Description | Quoted
Prices in
Active
Markets for
Identical
Assets
(Level 1) | | Significant
Other
Observable
Inputs
(Level 2) | | Significant
Unobservable
Inputs
(Level 3) | | Total |
| Asset Valuation Inputs | | | | | | | |
| Investments in Securities (a) | | | | | | | |
| Affiliated Investment Companies | | | | | | | |
| Equity Funds | $ 462,150,510 | | $ — | | $ — | | $ 462,150,510 |
| Fixed Income Funds | 273,242,101 | | — | | — | | 273,242,101 |
| Total Affiliated Investment Companies | 735,392,611 | | — | | — | | 735,392,611 |
| Short-Term Investment | | | | | | | |
| Affiliated Investment Company | 82,309,614 | | — | | — | | 82,309,614 |
| Total Investments in Securities | $ 817,702,225 | | $ — | | $ — | | $ 817,702,225 |
| (a) | For a complete listing of investments, see the Portfolio of Investments. |
The notes to the financial statements are an integral part of, and should be read in conjunction with, the financial statements.
| 30 | MainStay VP Moderate Allocation Portfolio |
Statement of Assets and Liabilities as of December 31, 2022
| Assets |
Investment in affiliated investment companies, at value
(identified cost $931,600,756) | $ 817,702,225 |
| Cash collateral on deposit at broker for swap contracts | 4,500,000 |
| Receivables: | |
| Dividends | 1,020,735 |
| Portfolio shares sold | 264,313 |
| Other assets | 5,089 |
| Total assets | 823,492,362 |
| Liabilities |
| Payables: | |
| Dividends and interest on OTC swaps contracts | 2,818,006 |
| Portfolio shares redeemed | 352,250 |
| Investment securities purchased | 261,075 |
| NYLIFE Distributors (See Note 3) | 168,553 |
| Shareholder communication | 54,856 |
| Professional fees | 24,078 |
| Custodian | 7,357 |
| Accrued expenses | 5,885 |
| Total liabilities | 3,692,060 |
| Net assets | $ 819,800,302 |
| Composition of Net Assets |
| Shares of beneficial interest outstanding (par value of $.001 per share) unlimited number of shares authorized | $ 89,824 |
| Additional paid-in-capital | 924,248,806 |
| | 924,338,630 |
| Total distributable earnings (loss) | (104,538,328) |
| Net assets | $ 819,800,302 |
| Initial Class | |
| Net assets applicable to outstanding shares | $ 43,783,309 |
| Shares of beneficial interest outstanding | 4,749,756 |
| Net asset value per share outstanding | $ 9.22 |
| Service Class | |
| Net assets applicable to outstanding shares | $776,016,993 |
| Shares of beneficial interest outstanding | 85,074,516 |
| Net asset value per share outstanding | $ 9.12 |
The notes to the financial statements are an integral part of, and should be read in conjunction with, the financial statements.
31
Statement of Operations for the year ended December 31, 2022
| Investment Income (Loss) |
| Income | |
| Dividend distributions from affiliated investment companies | $ 17,330,871 |
| Expenses | |
| Distribution/Service—Service Class (See Note 3) | 2,152,153 |
| Professional fees | 78,410 |
| Shareholder communication | 54,082 |
| Custodian | 37,087 |
| Trustees | 19,346 |
| Miscellaneous | 23,851 |
| Total expenses | 2,364,929 |
| Net investment income (loss) | 14,965,942 |
| Realized and Unrealized Gain (Loss) |
| Net realized gain (loss) on: | |
| Affiliated investment company transactions | (11,583,155) |
| Realized capital gain distributions from affiliated investment companies | 56,479,529 |
| Swap transactions | (2,999,451) |
| Net realized gain (loss) | 41,896,923 |
Net change in unrealized appreciation (depreciation) on:
Affiliated investments companies | (203,014,624) |
| Net realized and unrealized gain (loss) | (161,117,701) |
| Net increase (decrease) in net assets resulting from operations | $(146,151,759) |
The notes to the financial statements are an integral part of, and should be read in conjunction with, the financial statements.
| 32 | MainStay VP Moderate Allocation Portfolio |
Statements of Changes in Net Assets
for the years ended December 31, 2022 and December 31, 2021
| | 2022 | 2021 |
| Increase (Decrease) in Net Assets |
| Operations: | | |
| Net investment income (loss) | $ 14,965,942 | $ 16,534,971 |
| Net realized gain (loss) | 41,896,923 | 118,204,773 |
| Net change in unrealized appreciation (depreciation) | (203,014,624) | (20,277,086) |
| Net increase (decrease) in net assets resulting from operations | (146,151,759) | 114,462,658 |
| Distributions to shareholders: | | |
| Initial Class | (7,194,477) | (1,998,108) |
| Service Class | (127,271,222) | (36,451,506) |
| Total distributions to shareholders | (134,465,699) | (38,449,614) |
| Capital share transactions: | | |
| Net proceeds from sales of shares | 44,680,512 | 49,533,268 |
| Net asset value of shares issued to shareholders in reinvestment of distributions | 134,465,699 | 38,449,614 |
| Cost of shares redeemed | (153,174,796) | (175,474,825) |
| Increase (decrease) in net assets derived from capital share transactions | 25,971,415 | (87,491,943) |
| Net increase (decrease) in net assets | (254,646,043) | (11,478,899) |
| Net Assets |
| Beginning of year | 1,074,446,345 | 1,085,925,244 |
| End of year | $ 819,800,302 | $1,074,446,345 |
The notes to the financial statements are an integral part of, and should be read in conjunction with, the financial statements.
33
Financial Highlights selected per share data and ratios
| | Year Ended December 31, |
| Initial Class | 2022 | | 2021 | | 2020 | | 2019 | | 2018 |
| Net asset value at beginning of year | $ 12.84 | | $ 11.99 | | $ 11.32 | | $ 10.33 | | $ 11.89 |
| Net investment income (loss) (a) | 0.21 | | 0.23 | | 0.20 | | 0.23 | | 0.23 |
| Net realized and unrealized gain (loss) | (2.06) | | 1.11 | | 1.07 | | 1.60 | | (1.16) |
| Total from investment operations | (1.85) | | 1.34 | | 1.27 | | 1.83 | | (0.93) |
| Less distributions: | | | | | | | | | |
| From net investment income | (0.43) | | (0.15) | | (0.29) | | (0.36) | | (0.27) |
| From net realized gain on investments | (1.34) | | (0.34) | | (0.31) | | (0.48) | | (0.36) |
| Total distributions | (1.77) | | (0.49) | | (0.60) | | (0.84) | | (0.63) |
| Net asset value at end of year | $ 9.22 | | $ 12.84 | | $ 11.99 | | $ 11.32 | | $ 10.33 |
| Total investment return (b) | (13.69)% | | 11.37% | | 11.57% | | 18.29% | | (8.40)% |
| Ratios (to average net assets)/Supplemental Data: | | | | | | | | | |
| Net investment income (loss) | 1.91% | | 1.81% | | 1.83% | | 2.04% | | 1.99% |
| Net expenses (c) | 0.02% | | 0.02% | | 0.03% | | 0.03% | | 0.02% |
| Portfolio turnover rate | 31% | | 27% | | 31% | | 40% | | 52% |
| Net assets at end of year (in 000's) | $ 43,783 | | $ 53,604 | | $ 48,025 | | $ 45,283 | | $ 43,161 |
| (a) | Per share data based on average shares outstanding during the year. |
| (b) | Total return does not reflect any deduction of sales charges, mortality and expense charges, contract charges or administrative charges. For periods of less than one year, total return is not annualized. |
| (c) | In addition to the fees and expenses which the Portfolio bears directly, it also indirectly bears a pro-rata share of the fees and expenses of the underlying funds in which it invests. Such indirect expenses are not included in the above expense ratios. |
| | Year Ended December 31, |
| Service Class | 2022 | | 2021 | | 2020 | | 2019 | | 2018 |
| Net asset value at beginning of year | $ 12.72 | | $ 11.88 | | $ 11.22 | | $ 10.23 | | $ 11.79 |
| Net investment income (loss) (a) | 0.18 | | 0.19 | | 0.17 | | 0.20 | | 0.20 |
| Net realized and unrealized gain (loss) | (2.05) | | 1.11 | | 1.06 | | 1.60 | | (1.16) |
| Total from investment operations | (1.87) | | 1.30 | | 1.23 | | 1.80 | | (0.96) |
| Less distributions: | | | | | | | | | |
| From net investment income | (0.39) | | (0.12) | | (0.26) | | (0.33) | | (0.24) |
| From net realized gain on investments | (1.34) | | (0.34) | | (0.31) | | (0.48) | | (0.36) |
| Total distributions | (1.73) | | (0.46) | | (0.57) | | (0.81) | | (0.60) |
| Net asset value at end of year | $ 9.12 | | $ 12.72 | | $ 11.88 | | $ 11.22 | | $ 10.23 |
| Total investment return (b) | (13.91)% | | 11.10% | | 11.29% | | 18.00% | | (8.63)% |
| Ratios (to average net assets)/Supplemental Data: | | | | | | | | | |
| Net investment income (loss) | 1.63% | | 1.51% | | 1.52% | | 1.76% | | 1.73% |
| Net expenses (c) | 0.27% | | 0.27% | | 0.28% | | 0.27% | | 0.27% |
| Portfolio turnover rate | 31% | | 27% | | 31% | | 40% | | 52% |
| Net assets at end of year (in 000's) | $ 776,017 | | $ 1,020,842 | | $ 1,037,900 | | $ 1,102,149 | | $ 1,103,235 |
| (a) | Per share data based on average shares outstanding during the year. |
| (b) | Total return does not reflect any deduction of sales charges, mortality and expense charges, contract charges or administrative charges. For periods of less than one year, total return is not annualized. |
| (c) | In addition to the fees and expenses which the Portfolio bears directly, it also indirectly bears a pro-rata share of the fees and expenses of the underlying funds in which it invests. Such indirect expenses are not included in the above expense ratios. |
The notes to the financial statements are an integral part of, and should be read in conjunction with, the financial statements.
| 34 | MainStay VP Moderate Allocation Portfolio |
MainStay VP Growth Allocation Portfolio
Investment and Performance Comparison (Unaudited)
Performance data quoted represents past performance. Past performance is no guarantee of future results. Because of market volatility and other factors, current performance may be lower or higher than the figures shown. Investment return and principal value will fluctuate, and as a result, when shares are redeemed, they may be worth more or less than their original cost. The performance table and graph do not reflect any deduction of sales charges, mortality and expense charges, contract charges or administrative charges. Please refer to the Performance Summary appropriate for your policy. For performance information current to the most recent month-end, please call 800-598-2019 or visit www.newyorklife.com.
Performance figures may reflect certain fee waivers and/or expense limitations, without which total returns may have been different. For information on current fee waivers and/or expense limitations (if any), please refer to the Notes to Financial Statements.
| Average Annual Total Returns for the Year-Ended December 31, 2022 |
| Class | Inception
Date | One
Year | Five
Years | Ten
Years | Gross
Expense
Ratio1 |
| Initial Class Shares | 2/13/2006 | -14.43% | 3.98% | 7.15% | 0.58% |
| Service Class Shares | 2/13/2006 | -14.64 | 3.72 | 6.88 | 0.83 |
| 1. | The gross expense ratios presented reflect the Portfolio’s “Total Annual Portfolio Operating Expenses” from the most recent Prospectus and may differ from other expense ratios disclosed in this report. |
The footnotes on the next page are an integral part of the table and graph and should be carefully read in conjunction with them.
| Benchmark Performance* | One
Year | Five
Years | Ten
Years |
| S&P 500® Index1 | -18.11% | 9.42% | 12.56% |
| MSCI EAFE® Index (Net)2 | -14.45 | 1.54 | 4.67 |
| Bloomberg U.S. Aggregate Bond Index3 | -13.01 | 0.02 | 1.06 |
| Growth Allocation Composite Index4 | -16.14 | 6.18 | 8.83 |
| Morningstar Allocation - 70% to 85% Equity Category Average5 | -15.20 | 4.09 | 6.63 |
| * | Returns for indices reflect no deductions for fees, expenses or taxes, except for foreign withholding taxes where applicable. Results assume reinvestment of all dividends and capital gains. An investment cannot be made directly in an index. |
| 1. | The S&P 500® Index is the Portfolio's primary benchmark. S&P 500® is a trademark of The McGraw-Hill Companies, Inc. The S&P 500® Index is widely regarded as the standard index for measuring large-cap U.S. stock market performance. |
| 2. | The MSCI EAFE® Index (Net) is the Portfolio's secondary benchmark. The MSCI EAFE® Index (Net) consists of international stocks representing the developed world outside of North America. |
| 3. | The Portfolio has selected the Bloomberg U.S. Aggregate Bond Index as an additional benchmark. The Bloomberg U.S. Aggregate Bond Index is a broad-based benchmark that measures the performance of the investment grade, U.S. dollar-denominated, fixed-rate taxable bond market, including Treasurys, government-related and corporate securities, mortgage-backed securities (agency fixed-rate and hybrid adjustable rate mortgage pass-throughs), asset-backed securities, and commercial mortgage-backed securities. |
| 4. | The Portfolio has selected the Growth Allocation Composite Index as an additional benchmark. The Growth Allocation Composite Index consists of the S&P 500® Index, the MSCI EAFE® Index (Net) and the Bloomberg U.S. Aggregate Bond Index weighted 60%, 20% and 20%, respectively. |
| 5. | The Morningstar Allocation—70% to 85% Equity Category Average is representative of funds that seek to provide both income and capital appreciation by investing in multiple asset classes, including stocks, bonds, and cash. These funds are dominated by domestic holdings and have equity exposures between 70% and 85%. Results are based on average total returns of similar funds with all dividends and capital gain distributions reinvested. |
The footnotes on the preceding page are an integral part of the table and graph and should be carefully read in conjunction with them.
| 36 | MainStay VP Growth Allocation Portfolio |
Cost in Dollars of a $1,000 Investment in MainStay VP Growth Allocation Portfolio (Unaudited)
The example below is intended to describe the fees and expenses borne by shareholders during the six-month period from July 1, 2022 to December 31, 2022, and the impact of those costs on your investment.
Example
As a shareholder of the Portfolio you incur two types of costs: (1) transaction costs, including exchange fees and sales charges (loads) on purchases (as applicable), and (2) ongoing costs, including management fees, distribution and/or service (12b-1) fees and other Portfolio expenses (as applicable). This example is intended to help you understand your ongoing costs (in dollars) of investing in the Portfolio and to compare these costs with the ongoing costs of investing in other mutual funds. The example is based on an investment of $1,000 made at the beginning of the six-month period and held for the entire period from July 1, 2022 to December 31, 2022. Shares are only sold in connection with variable life and annuity contracts and the example does not reflect any contract level or transactional fees or expenses. If these costs had been included, your costs would have been higher.
This example illustrates your Portfolio’s ongoing costs in two ways:
Actual Expenses
The second and third data columns in the table below provide information about actual account values and actual expenses. You may use the information in these columns, together with the amount you invested, to estimate the expenses that you paid during the six months ended
December 31, 2022. Simply divide your account value by $1,000 (for example, an $8,600 account value divided by $1,000 = 8.6), then multiply the result by the number under the heading entitled “Expenses Paid During Period” to estimate the expenses you paid on your account during this period.
Hypothetical Example for Comparison Purposes
The fourth and fifth data columns in the table below provide information about hypothetical account values and hypothetical expenses based on the Portfolio’s actual expense ratio and an assumed rate of return of 5% per year before expenses, which is not the Portfolio’s actual return. The hypothetical account values and expenses may not be used to estimate the actual ending account balances or expenses you paid for the six-month period shown. You may use this information to compare the ongoing costs of investing in the Portfolio with the ongoing costs of investing in other mutual funds. To do so, compare this 5% hypothetical example with the 5% hypothetical examples that appear in the shareholder reports of the other mutual funds.
Please note that the expenses shown in the table are meant to highlight your ongoing costs only and do not reflect any transactional costs, such as exchange fees or sales charges (loads). Therefore, the fourth and fifth data columns of the table are useful in comparing ongoing costs only and will not help you determine the relative total costs of owning different funds. In addition, if these transactional costs were included, your costs would have been higher.
| Share Class | Beginning
Account
Value
7/1/22 | Ending Account
Value (Based
on Actual
Returns and
Expenses)
12/31/22 | Expenses
Paid
During
Period1 | Ending Account
Value (Based
on Hypothetical
5% Annualized
Return and
Actual Expenses)
12/31/22 | Expenses
Paid
During
Period1 | Net Expense
Ratio
During
Period2 |
| Initial Class Shares | $1,000.00 | $1,038.10 | $0.10 | $1,025.10 | $0.10 | 0.02% |
| Service Class Shares | $1,000.00 | $1,036.80 | $1.39 | $1,023.84 | $1.38 | 0.27% |
| 1. | Expenses are equal to the Portfolio’s annualized expense ratio of each class multiplied by the average account value over the period, divided by 365 and multiplied by 184 (to reflect the six-month period). The table above represents the actual expenses incurred during the six-month period. In addition to the fees and expenses which the Portfolio bears directly, it also indirectly bears a pro rata share of the fees and expenses of the underlying Portfolios/Funds in which it invests. Such indirect expenses are not included in the above-reported expense figures. |
| 2. | Expenses are equal to the Portfolio's annualized expense ratio to reflect the six-month period. |
Asset Diversification as of December 31, 2022 (Unaudited)
| Equity Funds | 76.8% |
| Fixed Income Funds | 13.2 |
| Short-Term Investment | 9.8 |
| Other Assets, Less Liabilities | 0.2 |
See Portfolio of Investments beginning on page 42 for specific holdings within these categories. The Portfolio’s holdings are subject to change.
| 38 | MainStay VP Growth Allocation Portfolio |
Portfolio Management Discussion and Analysis (Unaudited)
Answers to the questions reflect the views of portfolio managers Jae S. Yoon, CFA, Jonathan Swaney, Poul Kristensen, CFA, and Amit Soni, CFA, of New York Life Investments,1 the Portfolio’s Manager.
How did MainStay VP Growth Allocation Portfolio perform relative to its benchmarks and peers during the 12 months ended December 31, 2022?
For the 12 months ended December 31, 2022, MainStay VP Growth Allocation Portfolio returned −14.43% for Initial Class shares and −14.64% for Service Class shares. Over the same period, both share classes outperformed the −18.11% return of the S&P 500® Index, which is the Portfolio’s primary benchmark, while Initial Class shares outperformed and Service Class shares underperformed the −14.45% return of the MSCI EAFE® Index (Net), which is a secondary benchmark of the Portfolio. For the 12 months ended December 31, 2022, both share classes underperformed the −13.01% return of the Bloomberg U.S. Aggregate Bond Index and outperformed the −16.14% return of the Growth Allocation Composite Index, which are additional benchmarks of the Portfolio. Over the same period, both share classes outperformed the −15.20% return of the Morningstar Allocation—70% to 85% Equity Category Average.2
What factors affected the Portfolio’s relative performance during the reporting period?
The Portfolio is a “fund of funds,” meaning that it seeks to achieve its investment objective by investing primarily in mutual funds and exchange-traded funds (“ETFs”) managed by New York Life Investments or its affiliates (the “Underlying Portfolios/Funds”). The Underlying Portfolios/Funds may invest in U.S. equities, international equities and fixed-income instruments, making comparisons to any single index generally less suitable than a weighted combination of indices, which is a more useful yardstick by which to measure performance. The Portfolio’s management internally maintains a blend of indices that are taken into consideration when managing the Portfolio. During the reporting period, the Portfolio outperformed this internally maintained blend of indices, primarily due to active positioning at the asset class level.
The Portfolio’s outperformance was driven by the following factors:
| • | Management of the stock/bond blend: The Portfolio’s management of its stock/bond blend proved generally successful, reflecting tactical adjustments made throughout the reporting period. With both investment-grade bonds and U.S. stocks posting declines in the mid-teens, there was little cost or benefit to being persistently overweight or underweight to equities, although adjusting that exposure over time (buying dips and selling rallies) added material value. |
| • | Value created within asset classes: The equity portion of the Portfolio emphasized value over growth, with a specific focus on energy companies and defensive sectors that the market rewarded. Conditions also marginally favored the Portfolio’s skew toward profitable small-cap companies. |
| • | Gold and energy exposure: The equity portion of the Portfolio modestly benefited from tactical exposure to stocks of gold miners and energy producers. |
| • | Shorter duration:3 The fixed income portion of the Portfolio shortened its average duration by holding cash and emphasizing exposure to MainStay MacKay Short Duration High Yield Fund over MainStay VP MacKay High Yield Corporate Bond Portfolio; these moves lifted relative returns. |
Conversely, performance was undermined by management of the Portfolio’s exposure to non-U.S. markets. Following Russia’s invasion of Ukraine, the Portfolio shifted from overweight to underweight exposure to developed international markets in anticipation of an impending recession. However, European economic activity held up better than expected, and shying away from those markets detracted from returns. Similarly, but in reverse, our expectation that emerging markets were likely to benefit from fiscal stimulus in China ahead of the party congress in November proved ill-founded. Emerging markets fared poorly as the anticipated stimulus failed to materialize, and the Portfolio’s emerging-markets holdings dragged on performance. In addition, the underperformance of some of the Underlying Funds relative to their benchmarks detracted modestly from the Portfolio’s relative performance.
During the reporting period, how was the Portfolio’s performance materially affected by investments in derivatives?
Total return swaps were used to express most of the Portfolio’s tactical asset class policy views. Therefore, the swaps can be seen as enhancing the Portfolio’s relative performance over the course of the reporting period.
How did you allocate the Portfolio’s assets during the reporting period and why?
Stock/bond blend: On average, the Portfolio held moderately overweight exposure to equities during the reporting period, with the magnitude of that bias managed tactically in response to swings in pricing (adding on drawdowns and trimming on rallies). We are generally reluctant to position the Portfolio with underweight exposure to equities, as stocks have tended to perform well over time and anticipating drawdowns is challenging.
| 1. | “New York Life Investments” is a service mark used by New York Life Investment Management Holdings LLC and its subsidiary New York Life Investment Management LLC. |
| 2. | See page 36 for more information on benchmark and peer group returns. |
| 3. | Duration is a measure of the price sensitivity of a fixed-income investment to changes in interest rates. Duration is expressed as a number of years and is considered a more accurate sensitivity gauge than average maturity. |
Conversely, we’re happy to position the Portfolio with a bias toward equities when we believe stocks are well supported fundamentally or when a correction has run further than we believe appropriate. This approach paid off during the reporting period. Despite stocks declining by double digits, meaningful extra return was generated by tactically adjusting the degree to which the Portfolio held overweight exposure to equities.
Duration: Believing inflationary pressures to be partially structural in nature and likely to persist at elevated levels for the foreseeable future, we skewed the fixed-income portion of the Portfolio to favor shorter-maturity and lower-quality instruments that would be less sensitive to rising bond yields, although duration was added as yields rose. As of the end of the reporting period, the Portfolio’s duration was only slightly shorter than that of the Bloomberg U.S. Aggregate Bond Index. Maintaining a short duration posture improved returns.
Equity style: We viewed inflation, which undermines the value of more distant cash flows, as threatening to growth equities with high prices relative to current earnings. Accordingly, the Portfolio emphasized value stocks offering more attractive near-term cash flows. We placed a particular focus on the relatively defensive sectors of real estate, utilities, consumer staples and, most of all, health care. This emphasis on value over growth made a positive contribution to performance. (Contributions take weightings and total returns into account.)
Equity size: The Portfolio maintained a significant exposure to U.S. small-cap stocks. The thesis behind this positioning was based on the U.S. small-cap universe’s relatively attractive valuations, insulation from economic weakness abroad, less sensitivity to dollar strength and disproportionate exposure to domestic demand, which remained robust. Despite these presumed advantages, however, the Portfolio’s small-cap positions provided only modestly positive contributions to relative performance.
Geographic exposure: Prior to Russia’s invasion of Ukraine, the Portfolio’s geographic exposure reflected our positive expectations for non-U.S. developed markets generally, and Europe in particular, based on attractive valuations and the post-COVID-19 cyclical recovery we expected. War, sanctions, soaring local energy prices and looming recession changed the underlying picture. We responded by unwinding the Portfolio’s position and then reversing it, shifting to an underweight position in non-U.S. developed market equities. This move ultimately detracted from relative returns as non-U.S. economies fared better than expected, with developed international equity markets outperforming U.S. markets.
Gold miners: The Portfolio maintained a varying degree of exposure to gold miners as a hedge against inflation and/or a monetary policy mistake. The position proved volatile, making a modestly positive contribution to relative returns when viewed over the course of the full year.
Energy: As with gold miners, the Portfolio maintained exposure to upstream energy producers as a commodity play to provide an additional inflation hedge. These holdings also positioned the Fund to take advantage of opportunities for domestic producers to benefit as Western nations revisited energy policy in order to source supplies from stable and friendly jurisdictions rather than autocratic petrostates that present national security risks. While the Fund’s position was small, it had a disproportionately positive impact on performance as oil and gas prices soared.
How did the Portfolio’s allocations change over the course of the reporting period?
The Portfolio’s positioning is most often implemented using derivatives, specifically total return swaps. The use of swaps to reduce exposure to non-U.S. developed markets and increase exposure to mid- and small-cap companies during the reporting period, as discussed above, stand as good examples. Similarly, exposure to defensive sectors and energy producers was realized by swapping into the return stream on specific ETFs, including Invesco S&P Low Volatility ETF, SPDR S&P Oil & Gas Exploration & Production ETF and VanEck Oil Services ETF. We also added duration to the Portfolio’s bond holdings after yields had already risen considerably by entering into a swap in which the Portfolio received the return on iShares 20+ Year Treasury Bond ETF.
The largest adjustment made to actual Portfolio holdings involved a partial shift out of MainStay VP Indexed Bond Portfolio and into IQ MacKay ESG Core Plus Bond ETF. The latter, a recently launched product, provides active management that introduces some additional criteria to the selection of individual issues. We anticipate that diversifying the Portfolio’s assets across both products will prove helpful over time.
Another change involved sales of positions in MainStay MacKay Short Duration High Yield Fund and MainStay VP MacKay High Yield Corporate Bond Portfolio; this reduced the Portfolio’s high yield bond exposure to neutral in anticipation of a potential recession and the likely resulting negative impact to credit spreads.
During the reporting period, which Underlying Equity Funds had the highest total returns and which had the lowest total returns?
The holdings providing the highest total returns involved swaps that were in place for only part of the reporting period. Generally, exposure to energy companies generated the only gains for the reporting period, while exposure to the health care sector and low volatility stocks produced the smallest losses. Among Underlying Equity Funds held for the entire reporting period, the smallest losses came from MainStay VP Epoch U.S. Equity Yield Portfolio, MainStay WMC Value Fund, and MainStay VP American Century Sustainable Equity Portfolio. At the other end of the spectrum, the Underlying Equity Funds with the lowest returns were MainStay VP
| 40 | MainStay VP Growth Allocation Portfolio |
Wellington Growth Portfolio, MainStay VP Winslow Large Cap Growth Portfolio and MainStay VP Candriam Emerging Markets Equity Portfolio.
Which Underlying Equity Funds were the strongest positive contributors to the Portfolio’s performance and which Underlying Equity Funds were particularly weak?
SPDR S&P Oil & Gas Exploration ETF and VanEck Oil Services ETF, both accessed via derivatives, provided the strongest positive contributions to Portfolio performance. While no other Underlying Equity Funds contributed positively to the Portfolio’s absolute returns, those detracting the least included MainStay VP Epoch U.S. Equity Yield Portfolio, MainStay Epoch Capital Growth Fund and IQ Chaikin U.S. Small Cap ETF. The most significant losses were attributable to MainStay VP Wellington Growth Portfolio, MainStay VP Winslow Large Cap Growth Portfolio, and IQ Candriam ESG U.S. Large Cap Equity ETF.
What factors and risks affected the Portfolio’s Underlying Fixed-Income Portfolio/Fund investments during the reporting period?
Sustained, elevated inflation readings and the corresponding rise in federal funds rate expectations largely drove bond returns during the reporting period. A modest widening in credit spreads4 as economic growth slowed, and fears of a potential recession increased, was offset by the higher yields and shorter duration of comparable maturity corporate bonds across the quality spectrum.
During the reporting period, which fixed-income market segments were the strongest positive contributors to the Portfolio’s performance and which segments were particularly weak?
Broadly speaking, short-duration instruments experienced more modestly negative returns than longer-duration instruments. Speculative-grade bonds performed similarly to higher-quality bonds, as their richer yields and shorter duration were balanced by spread widening.
Which Underlying Fixed-Income Portfolios/Funds made the strongest positive contributions to the Portfolio’s performance, and which Underlying Fixed-Income Portfolios/Funds were the greatest detractors?
Cash, generating a small, positive return, was the only holding that did not contribute negatively to return. The Underlying
Fixed-Income Funds detracting the least from performance were MainStay VP Floating Rate Bond Portfolio, MainStay VP PIMCO Real Return Portfolio, and MainStay MacKay Short Duration High Yield Fund. The most significant detractors included MainStay VP Indexed Bond Portfolio, MainStay VP Bond Portfolio and MainStay VP MacKay High Yield Corporate Bond Portfolio.
| 4. | The terms “spread” and “yield spread” may refer to the difference in yield between a security or type of security and comparable U.S. Treasury issues. The terms may also refer to the difference in yield between two specific securities or types of securities at a given time. |
The opinions expressed are those of the portfolio managers as of the date of this report and are subject to change. There is no guarantee that any forecasts will come to pass. This material does not constitute investment advice and is not intended as an endorsement of any specific investment.
Not all MainStay VP Portfolios and/or share classes are available under all policies.
Portfolio of Investments December 31, 2022†
| | Shares | Value |
| Affiliated Investment Companies 90.0% |
| Equity Funds 76.8% |
| IQ 500 International ETF (a) | 1,518,526 | $ 42,945,738 |
| IQ Candriam ESG International Equity ETF (a) | 1,725,048 | 42,781,190 |
| IQ Candriam ESG U.S. Large Cap Equity ETF (a) | 2,108,677 | 67,441,816 |
| IQ Chaikin U.S. Large Cap ETF (a) | 1,901,200 | 59,698,250 |
| IQ Chaikin U.S. Small Cap ETF (a) | 1,385,468 | 44,172,599 |
| IQ FTSE International Equity Currency Neutral ETF (a) | 1,197,228 | 25,560,818 |
| MainStay Epoch Capital Growth Fund Class I (a) | 419,773 | 4,544,506 |
| MainStay Epoch International Choice Fund Class I (a) | 1,000,840 | 33,905,246 |
| MainStay VP American Century Sustainable Equity Portfolio Initial Class (a) | 5,758,882 | 63,735,279 |
| MainStay VP Candriam Emerging Markets Equity Portfolio Initial Class (a) | 6,925,725 | 45,742,333 |
| MainStay VP Epoch U.S. Equity Yield Portfolio Initial Class (a) | 3,633,574 | 61,208,281 |
| MainStay VP MacKay International Equity Portfolio Initial Class (a) | 3,285,593 | 33,805,141 |
| MainStay VP S&P 500 Index Portfolio Initial Class | 279,202 | 19,458,825 |
| MainStay VP Small Cap Growth Portfolio Initial Class (a) | 5,358,759 | 50,198,179 |
| MainStay VP Wellington Growth Portfolio Initial Class (a) | 3,828,013 | 67,509,693 |
| MainStay VP Wellington Mid Cap Portfolio Initial Class (a) | 7,165,864 | 53,176,443 |
| MainStay VP Wellington Small Cap Portfolio Initial Class (a) | 6,106,797 | 46,945,388 |
| MainStay VP Wellington U.S. Equity Portfolio Initial Class (a) | 1,564,394 | 33,349,900 |
| MainStay VP Winslow Large Cap Growth Portfolio Initial Class (a) | 3,495,085 | 66,244,799 |
| MainStay WMC Enduring Capital Fund Class R6 (a) | 1,079,726 | 32,024,664 |
| MainStay WMC International Research Equity Fund Class I (a) | 5,270,719 | 34,436,243 |
| | Shares | | Value |
| |
| Equity Funds (continued) |
| MainStay WMC Value Fund Class R6 (a) | 2,057,834 | | $ 59,233,506 |
Total Equity Funds
(Cost $1,137,604,241) | | | 988,118,837 |
| Fixed Income Funds 13.2% |
| IQ MacKay ESG Core Plus Bond ETF | 199,237 | | 4,114,244 |
| MainStay MacKay Short Duration High Yield Fund Class I | 3,786,033 | | 34,580,872 |
| MainStay VP Bond Portfolio Initial Class | 323,018 | | 3,900,834 |
| MainStay VP Floating Rate Portfolio Initial Class (a) | 7,969,991 | | 66,439,438 |
| MainStay VP Indexed Bond Portfolio Initial Class (a) | 2,098,029 | | 17,856,321 |
| MainStay VP MacKay High Yield Corporate Bond Portfolio Initial Class (a) | 3,658,315 | | 31,526,989 |
| MainStay VP PIMCO Real Return Portfolio Initial Class | 1,462,869 | | 12,031,219 |
Total Fixed Income Funds
(Cost $178,518,667) | | | 170,449,917 |
Total Affiliated Investment Companies
(Cost $1,316,122,908) | | | 1,158,568,754 |
| Short-Term Investment 9.8% |
| Affiliated Investment Company 9.8% |
| MainStay U.S. Government Liquidity Fund, 3.602% (a)(b) | 126,767,297 | | 126,767,297 |
Total Short-Term Investment
(Cost $126,767,297) | 9.8% | | 126,767,297 |
Total Investments
(Cost $1,442,890,205) | 99.8% | | 1,285,336,051 |
| Other Assets, Less Liabilities | 0.2 | | 2,036,656 |
| Net Assets | 100.0% | | $ 1,287,372,707 |
| † | Percentages indicated are based on Portfolio net assets. |
| (a) | As of December 31, 2022, the Portfolio's ownership exceeds 5% of the outstanding shares of the Underlying Portfolio's/Fund's share class. |
| (b) | Current yield as of December 31, 2022. |
The notes to the financial statements are an integral part of, and should be read in conjunction with, the financial statements.
| 42 | MainStay VP Growth Allocation Portfolio |
Investments in Affiliates (in 000's)
Investments in issuers considered to be affiliate(s) of the Portfolio during the year ended December 31, 2022 for purposes of Section 2(a)(3) of the Investment Company Act of 1940, as amended, were as follows:
| Affiliated Investment Companies | Value,
Beginning
of Year | Purchases
at Cost | Proceeds
from
Sales | Net
Realized
Gain/(Loss)
on Sales | Change in
Unrealized
Appreciation/
(Depreciation) | Value,
End of
Year | Dividend
Income | Other
Distributions | Shares
End of
Year |
| IQ 500 International ETF | $ 66,165 | $ 1,961 | $ (18,045) | $ 1,875 | $ (9,010) | $ 42,946 | $ 1,595 | $ — | 1,519 |
| IQ Candriam ESG International Equity ETF | 42,174 | 13,051 | (5,128) | 1,043 | (8,359) | 42,781 | 1,246 | — | 1,725 |
| IQ Candriam ESG U.S. Large Cap Equity ETF (a) | 111,442 | 3,427 | (24,107) | 4,287 | (27,607) | 67,442 | 1,058 | — | 2,109 |
| IQ Chaikin U.S. Large Cap ETF | 86,938 | 280 | (16,085) | 3,980 | (15,415) | 59,698 | 890 | — | 1,901 |
| IQ Chaikin U.S. Small Cap ETF | 26,437 | 24,999 | (3,614) | 454 | (4,103) | 44,173 | 512 | — | 1,385 |
| IQ FTSE International Equity Currency Neutral ETF (b) | 41,646 | 129 | (10,601) | 581 | (6,194) | 25,561 | 800 | 482 | 1,197 |
| IQ MacKay ESG Core Plus Bond ETF | — | 6,064 | (2,022) | (34) | 106 | 4,114 | 54 | — | 199 |
| MainStay Epoch Capital Growth Fund Class I | 7,557 | 105 | (1,590) | (323) | (1,204) | 4,545 | 21 | 47 | 420 |
| MainStay Epoch International Choice Fund Class I | 53,037 | 1,213 | (11,736) | 604 | (9,213) | 33,905 | 455 | — | 1,001 |
| MainStay MacKay Short Duration High Yield Fund Class I | 62,004 | 28,291 | (51,177) | (2,322) | (2,215) | 34,581 | 2,219 | — | 3,786 |
| MainStay U.S. Government Liquidity Fund | 134,290 | 359,022 | (366,545) | — | — | 126,767 | 1,853 | — | 126,767 |
| MainStay VP American Century Sustainable Equity Portfolio Initial Class (c) | 72,140 | 11,628 | (6,112) | 671 | (14,592) | 63,735 | 1,178 | 7,512 | 5,759 |
| MainStay VP Bond Portfolio Initial Class | 3,956 | 6,449 | (6,511) | (229) | 236 | 3,901 | 40 | — | 323 |
| MainStay VP Candriam Emerging Markets Equity Portfolio Initial Class | 62,683 | 10,579 | (2,629) | (114) | (24,777) | 45,742 | 490 | 6,808 | 6,926 |
| MainStay VP Epoch U.S. Equity Yield Portfolio Initial Class | 86,516 | 2,831 | (22,718) | 2,049 | (7,470) | 61,208 | 1,367 | 1,464 | 3,634 |
| MainStay VP Floating Rate Portfolio Initial Class | 88,449 | 5,968 | (23,198) | (945) | (3,835) | 66,439 | 3,434 | — | 7,970 |
| MainStay VP Indexed Bond Portfolio Initial Class | 22,418 | 31,735 | (35,947) | (2,779) | 2,429 | 17,856 | 364 | 164 | 2,098 |
| MainStay VP MacKay High Yield Corporate Bond Portfolio Initial Class | 70,979 | 23,570 | (55,211) | (7,338) | (473) | 31,527 | 1,618 | — | 3,658 |
| MainStay VP MacKay International Equity Portfolio Initial Class | 33,156 | 18,709 | (1,766) | (524) | (15,770) | 33,805 | 100 | 7,005 | 3,286 |
| MainStay VP PIMCO Real Return Portfolio Initial Class | 17,802 | 30,696 | (36,244) | 1,972 | (2,195) | 12,031 | — | — | 1,463 |
| MainStay VP S&P 500 Index Portfolio Initial Class (d) | 70,532 | 960 | (42,809) | 9,846 | (19,070) | 19,459 | 302 | 657 | 279 |
| MainStay VP Small Cap Growth Portfolio Initial Class | 76,327 | 16,966 | (10,597) | 968 | (33,466) | 50,198 | — | 12,849 | 5,359 |
| MainStay VP Wellington Growth Portfolio Initial Class | 54,628 | 63,239 | (4,581) | (1,006) | (44,770) | 67,510 | — | 22,136 | 3,828 |
| MainStay VP Wellington Mid Cap Portfolio Initial Class | 63,656 | 25,729 | (1,491) | (727) | (33,990) | 53,177 | — | 21,487 | 7,166 |
| MainStay VP Wellington Small Cap Portfolio Initial Class | 56,636 | 19,144 | (3,589) | (1,111) | (24,135) | 46,945 | 557 | 12,839 | 6,107 |
| MainStay VP Wellington U.S. Equity Portfolio Initial Class | 15,711 | 36,972 | (6,321) | (1,003) | (12,009) | 33,350 | 237 | 6,855 | 1,564 |
| MainStay VP Winslow Large Cap Growth Portfolio Initial Class | 119,146 | 24,402 | (23,896) | 3,282 | (56,689) | 66,245 | — | 17,645 | 3,495 |
| MainStay WMC Enduring Capital Fund Class R6 | 62,934 | 1,999 | (24,004) | (7,442) | (1,462) | 32,025 | 188 | 1,162 | 1,080 |
| MainStay WMC International Research Equity Fund Class I | 51,468 | 1,079 | (9,455) | (3,868) | (4,788) | 34,436 | 709 | — | 5,271 |
| MainStay WMC Value Fund Class R6 | 94,895 | 3,273 | (31,560) | (10,028) | 2,654 | 59,234 | 1,003 | 2,270 | 2,058 |
| | $1,755,722 | $774,470 | $ (859,289) | $ (8,181) | $(377,386) | $1,285,336 | $ 22,290 | $121,382 | |
| | |
| (a) | Prior to August 31, 2022, known as IQ Candriam ESG U.S. Equity ETF. |
| (b) | Prior to August 31, 2022, known as IQ 50 Percent Hedged FTSE International ETF. |
The notes to the financial statements are an integral part of, and should be read in conjunction with, the financial statements.
43
Portfolio of Investments December 31, 2022† (continued)
| (c) | Prior to May 1, 2022, known as MainStay VP T. Rowe Price Equity Income Portfolio Initial Class. |
| (d) | Prior to May 1, 2022, known as MainStay VP MacKay S&P 500 Index Portfolio Initial Class. |
Swap Contracts
Open OTC total return equity swap contracts as of December 31, 2022 were as follows1:
Swap
Counterparty | Reference Obligation | Floating Rate2 | Termination
Date(s) | Payment
Frequency
Paid/
Received | Notional
Amount
Long/
(Short)
(000)3 | Unrealized
Appreciation/
(Depreciation)4 |
| Citibank NA | Invesco S&P 500 Low Volatility ETF | 1 day FEDF plus 0.45% | 12/4/23 | Daily | 19,695 | $ — |
| Citibank NA | iShares 20+ Year Treasury Bond ETF | 1 day FEDF plus 0.35% | 12/4/23 | Daily | 5,983 | — |
| Citibank NA | iShares MSCI EAFE ETF | 1 day FEDF minus 1.25% | 12/4/23 | Daily | (28,727) | — |
| Citibank NA | iShares MSCI Emerging Markets ETF | 1 day FEDF minus 0.50% | 12/4/23 | Daily | (27,029) | — |
| Citibank NA | Russell 1000 Growth Total Return Index | 1 day FEDF minus 0.20% | 12/4/23 | Daily | (19,459) | — |
| Citibank NA | S&P 400 Total Return | 1 day FEDF plus 0.30% | 12/4/23 | Daily | 39,092 | — |
| Citibank NA | S&P 500 Communication Services | 1 day FEDF plus 0.50% | 12/4/23 | Daily | 2,706 | — |
| Citibank NA | S&P 500 Energy Total | 1 day FEDF plus 0.50% | 12/4/23 | Daily | 1,368 | — |
| Citibank NA | S&P 500 Health Care Sector | 1 day FEDF plus 0.45% | 12/4/23 | Daily | 19,587 | — |
| Citibank NA | S&P 500 Total Return Index | 1 day FEDF plus 0.14% | 12/4/23 | Daily | (28,157) | — |
| Citibank NA | S&P 600 Total Return | 1 day FEDF plus 0.40% | 12/4/23 | Daily | 69,124 | — |
| Citibank NA | SPDR S&P Oil & Gas Exploration & Production ETF | 1 day FEDF plus 0.40% | 12/4/23 | Daily | 6,676 | — |
| Citibank NA | VanEck Gold Miners ETF | 1 day FEDF plus 0.55% | 12/4/23 | Daily | 6,442 | — |
| Citibank NA | VanEck Oil Services ETF | 1 day FEDF plus 0.40% | 12/4/23 | Daily | 7,174 | — |
| Citibank NA | Vanguard FTSE Europe ETF | 1 day FEDF minus 5.00% | 12/4/23 | Daily | (13,024) | — |
| | | | | | | $ — |
| 1. | As of December 31, 2022, cash in the amount $6,000,000 was pledged to brokers for OTC swap contracts. |
| 2. | Portfolio pays the floating rate and receives the total return of the reference entity. |
| 3. | Notional amounts reflected as a positive value indicate a long position held by the Portfolio or Index and a negative value indicates a short position. |
| 4. | Reflects the value at reset date as of December 31, 2022. |
| Abbreviation(s): |
| EAFE—Europe, Australasia and Far East |
| ETF—Exchange-Traded Fund |
| FEDF—Federal Funds Rate |
| FTSE—Financial Times Stock Exchange |
| MSCI—Morgan Stanley Capital International |
| SPDR—Standard & Poor’s Depositary Receipt |
The notes to the financial statements are an integral part of, and should be read in conjunction with, the financial statements.
| 44 | MainStay VP Growth Allocation Portfolio |
The following is a summary of the fair valuations according to the inputs used as of December 31, 2022, for valuing the Portfolio’s assets:
| Description | Quoted
Prices in
Active
Markets for
Identical
Assets
(Level 1) | | Significant
Other
Observable
Inputs
(Level 2) | | Significant
Unobservable
Inputs
(Level 3) | | Total |
| Asset Valuation Inputs | | | | | | | |
| Investments in Securities (a) | | | | | | | |
| Affiliated Investment Companies | | | | | | | |
| Equity Funds | $ 988,118,837 | | $ — | | $ — | | $ 988,118,837 |
| Fixed Income Funds | 170,449,917 | | — | | — | | 170,449,917 |
| Total Affiliated Investment Companies | 1,158,568,754 | | — | | — | | 1,158,568,754 |
| Short-Term Investment | | | | | | | |
| Affiliated Investment Company | 126,767,297 | | — | | — | | 126,767,297 |
| Total Investments in Securities | $ 1,285,336,051 | | $ — | | $ — | | $ 1,285,336,051 |
| (a) | For a complete listing of investments, see the Portfolio of Investments. |
The notes to the financial statements are an integral part of, and should be read in conjunction with, the financial statements.
45
Statement of Assets and Liabilities as of December 31, 2022
| Assets |
Investment in affiliated investment companies, at value
(identified cost $1,442,890,205) | $1,285,336,051 |
| Cash collateral on deposit at broker for swap contracts | 6,000,000 |
| Receivables: | |
| Dividends | 1,746,753 |
| Portfolio shares sold | 333,320 |
| Other assets | 8,337 |
| Total assets | 1,293,424,461 |
| Liabilities |
| Payables: | |
| Dividends and interest on OTC swaps contracts | 4,239,113 |
| Portfolio shares redeemed | 993,902 |
| Investment securities purchased | 411,839 |
| NYLIFE Distributors (See Note 3) | 261,174 |
| Shareholder communication | 91,610 |
| Professional fees | 32,482 |
| Custodian | 12,334 |
| Accrued expenses | 9,300 |
| Total liabilities | 6,051,754 |
| Net assets | $1,287,372,707 |
| Composition of Net Assets |
| Shares of beneficial interest outstanding (par value of $.001 per share) unlimited number of shares authorized | $ 137,117 |
| Additional paid-in-capital | 1,393,564,131 |
| | 1,393,701,248 |
| Total distributable earnings (loss) | (106,328,541) |
| Net assets | $1,287,372,707 |
| Initial Class | |
| Net assets applicable to outstanding shares | $ 88,025,555 |
| Shares of beneficial interest outstanding | 9,263,974 |
| Net asset value per share outstanding | $ 9.50 |
| Service Class | |
| Net assets applicable to outstanding shares | $1,199,347,152 |
| Shares of beneficial interest outstanding | 127,852,942 |
| Net asset value per share outstanding | $ 9.38 |
The notes to the financial statements are an integral part of, and should be read in conjunction with, the financial statements.
| 46 | MainStay VP Growth Allocation Portfolio |
Statement of Operations for the year ended December 31, 2022
| Investment Income (Loss) |
| Income | |
| Dividend distributions from affiliated investment companies | $ 22,290,164 |
| Expenses | |
| Distribution/Service—Service Class (See Note 3) | 3,394,984 |
| Professional fees | 104,454 |
| Shareholder communication | 88,196 |
| Custodian | 49,501 |
| Trustees | 30,601 |
| Miscellaneous | 37,683 |
| Total expenses | 3,705,419 |
| Net investment income (loss) | 18,584,745 |
| Realized and Unrealized Gain (Loss) |
| Net realized gain (loss) on: | |
| Affiliated investment company transactions | (8,181,135) |
| Realized capital gain distributions from affiliated investment companies | 121,382,166 |
| Swap transactions | (5,231,937) |
| Net realized gain (loss) | 107,969,094 |
Net change in unrealized appreciation (depreciation) on:
Affiliated investments companies | (377,385,911) |
| Net realized and unrealized gain (loss) | (269,416,817) |
| Net increase (decrease) in net assets resulting from operations | $(250,832,072) |
The notes to the financial statements are an integral part of, and should be read in conjunction with, the financial statements.
47
Statements of Changes in Net Assets
for the years ended December 31, 2022 and December 31, 2021
| | 2022 | 2021 |
| Increase (Decrease) in Net Assets |
| Operations: | | |
| Net investment income (loss) | $ 18,584,745 | $ 22,620,537 |
| Net realized gain (loss) | 107,969,094 | 206,163,637 |
| Net change in unrealized appreciation (depreciation) | (377,385,911) | 36,054,571 |
| Net increase (decrease) in net assets resulting from operations | (250,832,072) | 264,838,745 |
| Distributions to shareholders: | | |
| Initial Class | (15,428,348) | (3,856,100) |
| Service Class | (216,661,264) | (57,164,920) |
| Total distributions to shareholders | (232,089,612) | (61,021,020) |
| Capital share transactions: | | |
| Net proceeds from sales of shares | 26,427,493 | 28,269,029 |
| Net asset value of shares issued to shareholders in reinvestment of distributions | 232,089,612 | 61,021,020 |
| Cost of shares redeemed | (251,331,929) | (339,935,149) |
| Increase (decrease) in net assets derived from capital share transactions | 7,185,176 | (250,645,100) |
| Net increase (decrease) in net assets | (475,736,508) | (46,827,375) |
| Net Assets |
| Beginning of year | 1,763,109,215 | 1,809,936,590 |
| End of year | $1,287,372,707 | $1,763,109,215 |
The notes to the financial statements are an integral part of, and should be read in conjunction with, the financial statements.
| 48 | MainStay VP Growth Allocation Portfolio |
Financial Highlights selected per share data and ratios
| | Year Ended December 31, |
| Initial Class | 2022 | | 2021 | | 2020 | | 2019 | | 2018 |
| Net asset value at beginning of year | $ 13.62 | | $ 12.19 | | $ 11.51 | | $ 10.57 | | $ 12.61 |
| Net investment income (loss) (a) | 0.18 | | 0.20 | | 0.21 | | 0.26 | | 0.21 |
| Net realized and unrealized gain (loss) | (2.28) | | 1.72 | | 1.21 | | 1.91 | | (1.47) |
| Total from investment operations | (2.10) | | 1.92 | | 1.42 | | 2.17 | | (1.26) |
| Less distributions: | | | | | | | | | |
| From net investment income | (0.42) | | (0.33) | | (0.34) | | (0.39) | | (0.24) |
| From net realized gain on investments | (1.60) | | (0.16) | | (0.40) | | (0.84) | | (0.54) |
| Total distributions | (2.02) | | (0.49) | | (0.74) | | (1.23) | | (0.78) |
| Net asset value at end of year | $ 9.50 | | $ 13.62 | | $ 12.19 | | $ 11.51 | | $ 10.57 |
| Total investment return (b) | (14.43)% | | 16.01% | | 12.94% | | 21.42% | | (10.73)% |
| Ratios (to average net assets)/Supplemental Data: | | | | | | | | | |
| Net investment income (loss) | 1.55% | | 1.53% | | 1.87% | | 2.22% | | 1.71% |
| Net expenses (c) | 0.02% | | 0.02% | | 0.03% | | 0.02% | | 0.02% |
| Portfolio turnover rate | 32% | | 24% | | 32% | | 41% | | 44% |
| Net assets at end of year (in 000's) | $ 88,026 | | $ 108,059 | | $ 98,314 | | $ 91,615 | | $ 80,133 |
| (a) | Per share data based on average shares outstanding during the year. |
| (b) | Total return does not reflect any deduction of sales charges, mortality and expense charges, contract charges or administrative charges. For periods of less than one year, total return is not annualized. |
| (c) | In addition to the fees and expenses which the Portfolio bears directly, it also indirectly bears a pro-rata share of the fees and expenses of the underlying funds in which it invests. Such indirect expenses are not included in the above expense ratios. |
| | Year Ended December 31, |
| Service Class | 2022 | | 2021 | | 2020 | | 2019 | | 2018 |
| Net asset value at beginning of year | $ 13.46 | | $ 12.05 | | $ 11.38 | | $ 10.47 | | $ 12.49 |
| Net investment income (loss) (a) | 0.14 | | 0.16 | | 0.17 | | 0.22 | | 0.17 |
| Net realized and unrealized gain (loss) | (2.24) | | 1.71 | | 1.21 | | 1.88 | | (1.44) |
| Total from investment operations | (2.10) | | 1.87 | | 1.38 | | 2.10 | | (1.27) |
| Less distributions: | | | | | | | | | |
| From net investment income | (0.38) | | (0.30) | | (0.31) | | (0.35) | | (0.21) |
| From net realized gain on investments | (1.60) | | (0.16) | | (0.40) | | (0.84) | | (0.54) |
| Total distributions | (1.98) | | (0.46) | | (0.71) | | (1.19) | | (0.75) |
| Net asset value at end of year | $ 9.38 | | $ 13.46 | | $ 12.05 | | $ 11.38 | | $ 10.47 |
| Total investment return (b) | (14.64)% | | 15.72% | | 12.65% | | 21.12% | | (10.95)% |
| Ratios (to average net assets)/Supplemental Data: | | | | | | | | | |
| Net investment income (loss) | 1.26% | | 1.24% | | 1.55% | | 1.90% | | 1.42% |
| Net expenses (c) | 0.27% | | 0.27% | | 0.28% | | 0.27% | | 0.27% |
| Portfolio turnover rate | 32% | | 24% | | 32% | | 41% | | 44% |
| Net assets at end of year (in 000's) | $ 1,199,347 | | $ 1,655,050 | | $ 1,711,623 | | $ 1,868,634 | | $ 1,849,974 |
| (a) | Per share data based on average shares outstanding during the year. |
| (b) | Total return does not reflect any deduction of sales charges, mortality and expense charges, contract charges or administrative charges. For periods of less than one year, total return is not annualized. |
| (c) | In addition to the fees and expenses which the Portfolio bears directly, it also indirectly bears a pro-rata share of the fees and expenses of the underlying funds in which it invests. Such indirect expenses are not included in the above expense ratios. |
The notes to the financial statements are an integral part of, and should be read in conjunction with, the financial statements.
49
MainStay VP Equity Allocation Portfolio
Investment and Performance Comparison (Unaudited)
Performance data quoted represents past performance. Past performance is no guarantee of future results. Because of market volatility and other factors, current performance may be lower or higher than the figures shown. Investment return and principal value will fluctuate, and as a result, when shares are redeemed, they may be worth more or less than their original cost. The performance table and graph do not reflect any deduction of sales charges, mortality and expense charges, contract charges or administrative charges. Please refer to the Performance Summary appropriate for your policy. For performance information current to the most recent month-end, please call 800-598-2019 or visit www.newyorklife.com.
Performance figures may reflect certain fee waivers and/or expense limitations, without which total returns may have been different. For information on current fee waivers and/or expense limitations (if any), please refer to the Notes to Financial Statements.
| Average Annual Total Returns for the Year-Ended December 31, 2022 |
| Class | Inception
Date | One
Year | Five
Years | Ten
Years | Gross
Expense
Ratio1 |
| Initial Class Shares | 2/13/2006 | -17.64% | 4.34% | 8.06% | 0.60% |
| Service Class Shares | 2/13/2006 | -17.85 | 4.08 | 7.79 | 0.85 |
| 1. | The gross expense ratios presented reflect the Portfolio’s “Total Annual Portfolio Operating Expenses” from the most recent Prospectus and may differ from other expense ratios disclosed in this report. |
| Benchmark Performance* | One
Year | Five
Years | Ten
Years |
| S&P 500® Index1 | -18.11% | 9.42% | 12.56% |
| MSCI EAFE® Index (Net)2 | -14.45 | 1.54 | 4.67 |
| Equity Allocation Composite Index3 | -17.13 | 7.47 | 10.64 |
| Morningstar Allocation - 85%+ Equity Category Average4 | -19.02 | 4.11 | 7.57 |
| * | Returns for indices reflect no deductions for fees, expenses or taxes, except for foreign withholding taxes where applicable. Results assume reinvestment of all dividends and capital gains. An investment cannot be made directly in an index. |
| 1. | The S&P 500® Index is the Portfolio's primary benchmark. S&P 500® is a trademark of The McGraw-Hill Companies, Inc. The S&P 500® Index is widely regarded as the standard index for measuring large-cap U.S. stock market performance. |
| 2. | The MSCI EAFE® Index (Net) is the Portfolio's secondary benchmark. The MSCI EAFE® Index (Net) consists of international stocks representing the developed world outside of North America. |
| 3. | The Portfolio has selected the Equity Allocation Composite Index as an additional benchmark. The Equity Allocation Composite Index consists of the S&P 500® Index and the MSCI EAFE® Index (Net) weighted 75% and 25%, respectively. Prior to February 28, 2014, the Equity Allocation Composite Index consisted of the S&P 500® Index and the MSCI EAFE® Index (Net) weighted 80% and 20%, respectively. |
| 4. | The Morningstar Allocation—85%+ Equity Category Average is representative of funds that seek to provide both income and capital appreciation by investing in multiple asset classes, including stocks, bonds, and cash. These funds are dominated by domestic holdings and have equity exposures of over 85%. These funds typically allocate at least 10% to equities of foreign companies and do not exclusively allocate between cash and equities. Results are based on average total returns of similar funds with all dividends and capital gain distributions reinvested. |
| 50 | MainStay VP Equity Allocation Portfolio |
Cost in Dollars of a $1,000 Investment in MainStay VP Equity Allocation Portfolio (Unaudited)
The example below is intended to describe the fees and expenses borne by shareholders during the six-month period from July 1, 2022 to December 31, 2022, and the impact of those costs on your investment.
Example
As a shareholder of the Portfolio you incur two types of costs: (1) transaction costs, including exchange fees and sales charges (loads) on purchases (as applicable), and (2) ongoing costs, including management fees, distribution and/or service (12b-1) fees and other Portfolio expenses (as applicable). This example is intended to help you understand your ongoing costs (in dollars) of investing in the Portfolio and to compare these costs with the ongoing costs of investing in other mutual funds. The example is based on an investment of $1,000 made at the beginning of the six-month period and held for the entire period from July 1, 2022 to December 31, 2022. Shares are only sold in connection with variable life and annuity contracts and the example does not reflect any contract level or transactional fees or expenses. If these costs had been included, your costs would have been higher.
This example illustrates your Portfolio’s ongoing costs in two ways:
Actual Expenses
The second and third data columns in the table below provide information about actual account values and actual expenses. You may use the information in these columns, together with the amount you invested, to estimate the expenses that you paid during the six months ended
December 31, 2022. Simply divide your account value by $1,000 (for example, an $8,600 account value divided by $1,000 = 8.6), then multiply the result by the number under the heading entitled “Expenses Paid During Period” to estimate the expenses you paid on your account during this period.
Hypothetical Example for Comparison Purposes
The fourth and fifth data columns in the table below provide information about hypothetical account values and hypothetical expenses based on the Portfolio’s actual expense ratio and an assumed rate of return of 5% per year before expenses, which is not the Portfolio’s actual return. The hypothetical account values and expenses may not be used to estimate the actual ending account balances or expenses you paid for the six-month period shown. You may use this information to compare the ongoing costs of investing in the Portfolio with the ongoing costs of investing in other mutual funds. To do so, compare this 5% hypothetical example with the 5% hypothetical examples that appear in the shareholder reports of the other mutual funds.
Please note that the expenses shown in the table are meant to highlight your ongoing costs only and do not reflect any transactional costs, such as exchange fees or sales charges (loads). Therefore, the fourth and fifth data columns of the table are useful in comparing ongoing costs only and will not help you determine the relative total costs of owning different funds. In addition, if these transactional costs were included, your costs would have been higher.
| Share Class | Beginning
Account
Value
7/1/22 | Ending Account
Value (Based
on Actual
Returns and
Expenses)
12/31/22 | Expenses
Paid
During
Period1 | Ending Account
Value (Based
on Hypothetical
5% Annualized
Return and
Actual Expenses)
12/31/22 | Expenses
Paid
During
Period1 | Net Expense
Ratio
During
Period2 |
| Initial Class Shares | $1,000.00 | $1,035.40 | $0.10 | $1,025.10 | $0.10 | 0.02% |
| Service Class Shares | $1,000.00 | $1,034.10 | $1.38 | $1,023.84 | $1.38 | 0.27% |
| 1. | Expenses are equal to the Portfolio’s annualized expense ratio of each class multiplied by the average account value over the period, divided by 365 and multiplied by 184 (to reflect the six-month period). The table above represents the actual expenses incurred during the six-month period. In addition to the fees and expenses which the Portfolio bears directly, it also indirectly bears a pro rata share of the fees and expenses of the underlying Portfolios/Funds in which it invests. Such indirect expenses are not included in the above-reported expense figures. |
| 2. | Expenses are equal to the Portfolio's annualized expense ratio to reflect the six-month period. |
Asset Diversification as of December 31, 2022 (Unaudited)
| Equity Funds | 96.4% |
| Short-Term Investment | 3.3 |
| Other Assets, Less Liabilities | 0.3 |
See Portfolio of Investments beginning on page 55 for specific holdings within these categories. The Portfolio’s holdings are subject to change.
| 52 | MainStay VP Equity Allocation Portfolio |
Portfolio Management Discussion and Analysis (Unaudited)
Answers to the questions reflect the views of portfolio managers Jae S. Yoon, CFA, Jonathan Swaney, Poul Kristensen, CFA, and Amit Soni, CFA, of New York Life Investments1, the Portfolio’s Manager.
How did MainStay VP Equity Allocation Portfolio perform relative to its benchmarks and peers during the 12 months ended December 31, 2022?
For the 12 months ended December 31, 2022, MainStay VP Equity Allocation Portfolio returned −17.64% for Initial Class shares and −17.85% for Service Class shares. Over the same period, both share classes outperformed the −18.11% return of the S&P 500® Index, which is the Portfolio’s primary benchmark, and underperformed the −14.45% return of the MSCI EAFE® Index (Net), which is a secondary benchmark of the Portfolio. For the 12 months ended December 31, 2022, both share classes underperformed the −17.13% return of the Equity Allocation Composite Index and outperformed the −19.02% return of Morningstar Allocation—85%+ Equity Category Average.2
What factors affected the Portfolio’s relative performance during the reporting period?
The Portfolio is a “fund of funds,” meaning that it seeks to achieve its investment objective by investing primarily in mutual funds and exchange-traded funds (“ETFs”) managed by New York Life Investments or its affiliates (the “Underlying Portfolios/Funds”). The Underlying Portfolios/Funds may invest in U.S. equities and international equities, making comparisons to any single index generally less suitable than a weighted combination of indices, which is a more useful yardstick by which to measure performance. The Portfolio’s management internally maintains a blend of indices that are taken into consideration when managing the Portfolio. During the reporting period, the Portfolio underperformed this internally maintained blend of indices, primarily due to active positioning at the asset class level.
The Portfolio’s performance was driven primarily by an emphasis on value stocks over growth stocks, with a specific focus on energy companies and defensive sectors that the market rewarded. Conditions also marginally favored the Portfolio’s skew toward profitable small-cap companies. Tactical exposure to stocks of gold miners and energy producers made a modest, additional, positive contribution to relative returns. (Contributions take weightings and total returns into account.)
Conversely, performance was undermined by management of the Portfolio’s exposure to non-U.S. markets. Following Russia’s invasion of Ukraine, the Portfolio shifted from overweight to underweight exposure to developed international markets in anticipation of an impending recession. However, European economic activity held up better than anticipated, and shying away from those markets detracted from returns. Similarly, but in reverse, our expectation that emerging markets were likely to benefit from fiscal stimulus in China ahead of the party congress in November proved ill-founded. Emerging markets fared poorly as
the anticipated stimulus failed to materialize, and the Portfolio’s emerging-markets holdings dragged on performance. In addition, the underperformance of some of the Underlying Equity Funds relative to their benchmarks detracted modestly from the Portfolio’s relative performance.
During the reporting period, how was the Portfolio’s performance materially affected by investments in derivatives?
Total return swaps were used to express most of the Portfolio’s tactical asset class policy views. Therefore, the swaps can be seen as enhancing the Portfolio’s relative performance over the course of the reporting period.
How did you allocate the Portfolio’s assets during the reporting period and why?
Equity style: We viewed inflation, which undermines the value of more distant cash flows, as threatening to growth equities with high prices relative to current earnings. Accordingly, the Portfolio emphasized value stocks offering more attractive near-term cash flows. We placed a particular focus on the relatively defensive sectors of real estate, utilities, consumer staples and, most of all, health care. This emphasis on value over growth made a positive contribution to performance.
Equity size: The Portfolio maintained a significant exposure to U.S. small-cap stocks. The thesis behind this positioning was based on the U.S. small-cap universe’s relatively attractive valuations, insulation from economic weakness abroad, less sensitivity to dollar strength and disproportionate exposure to domestic demand, which remained robust. Despite these presumed advantages, however, the Portfolio’s small-cap positions provided only modestly positive contributions to relative performance.
Geographic exposure: Prior to Russia’s invasion of Ukraine, the Portfolio’s geographic exposure reflected our positive expectations for non-U.S. developed markets generally, and Europe in particular, based on attractive valuations and the post-COVID-19 cyclical recovery we expected. War, sanctions, soaring local energy prices and looming recession changed the underlying picture. We responded by unwinding the Portfolio’s position and then reversing it, shifting to an underweight position in non-U.S. developed market equities. This move ultimately detracted from relative returns as non-U.S. economies fared better than expected, with developed international equity markets outperforming U.S. markets.
Gold miners: The Portfolio maintained a varying degree of exposure to gold miners as a hedge against inflation and/or a monetary policy mistake. The position proved volatile, making a
| 1. | “New York Life Investments” is a service mark used by New York Life Investment Management Holdings LLC and its subsidiary New York Life Investment Management LLC. |
| 2. | See page 50 for more information on benchmark and peer group returns. |
modestly positive contribution to relative returns when viewed over the course of the full year.
Energy: As with gold miners, the Portfolio maintained exposure to upstream energy producers as a commodity play to provide an additional inflation hedge. These holdings also positioned the Portfolio to take advantage of opportunities for domestic producers to benefit as Western nations revisited energy policy in order to source supplies from stable and friendly jurisdictions rather than autocratic petrostates that present national security risks. While the Portfolio’s position was small, it had a disproportionately positive impact on performance as oil and gas prices soared.
How did the Portfolio’s allocations change over the course of the reporting period?
The Portfolio’s positioning is most often implemented using derivatives, specifically total return swaps. The use of swaps to reduce exposure to non-U.S. developed markets and increase exposure to mid- and small-cap companies during the reporting period, as discussed above, stand as good examples. Similarly, exposure to defensive sectors and energy producers was realized during the reporting period by swapping into the return stream on specific ETFs, including Invesco S&P Low Volatility ETF, SPDR S&P Oil & Gas Exploration & Production ETF and VanEck Oil Services ETF.
Most adjustments made to Underlying Equity Fund holdings were the byproduct of changes in the characteristics of those funds or how they interact with one another. Underlying Funds to which the Portfolio increased its allocations included IQ Chaikin U.S. Small Cap ETF, MainStay VP Wellington Small Cap Portfolio and MainStay VP Wellington Mid Cap Blend Portfolio. Underlying Equity Funds to which the Portfolio reduced its allocations included MainStay VP S&P 500 Index Portfolio, MainStay VP Winslow Large Cap Growth Portfolio, and IQ Candriam ESG U.S. Large Cap Equity ETF.
During the reporting period, which Underlying Equity Funds had the highest total returns and which had the lowest total returns?
The holdings providing the highest total returns involved swaps that were in place for only part of the reporting period. Generally, exposure to energy companies generated the only gains for the reporting period, while exposure to the health care sector and low volatility stocks produced the smallest losses. Among Underlying Equity Funds held for the entire reporting period, the smallest losses came from MainStay VP Epoch U.S. Equity Yield Portfolio, MainStay WMC Value Fund, and MainStay VP American Century
Sustainable Equity Portfolio. At the other end of the spectrum, the Underlying Equity Funds with the lowest returns were MainStay VP Wellington Growth Portfolio, MainStay VP Winslow Large Cap Growth Portfolio and MainStay VP Candriam Emerging Markets Equity Portfolio.
Which Underlying Equity Funds were the strongest positive contributors to the Portfolio’s performance and which Underlying Equity Funds were particularly weak?
SPDR S&P Oil & Gas Exploration ETF and VanEck Oil Services ETF, both accessed via derivatives, provided the strongest positive contributions to Portfolio performance. While no other Underlying Equity Funds contributed positively to the Portfolio’s absolute returns, those detracting the least included MainStay VP Epoch U.S. Equity Yield Portfolio, MainStay Epoch Capital Growth Fund and MainStay WMC Value Fund. The most significant losses were attributable to MainStay VP Wellington Growth Portfolio, MainStay VP Winslow Large Cap Growth Portfolio and MainStay VP Candriam Emerging Markets Equity Portfolio.
The opinions expressed are those of the portfolio managers as of the date of this report and are subject to change. There is no guarantee that any forecasts will come to pass. This material does not constitute investment advice and is not intended as an endorsement of any specific investment.
Not all MainStay VP Portfolios and/or share classes are available under all policies.
| 54 | MainStay VP Equity Allocation Portfolio |
Portfolio of Investments December 31, 2022†
| | Shares | Value |
| Affiliated Investment Companies 96.4% |
| Equity Funds 96.4% |
| IQ 500 International ETF (a) | 1,228,037 | $ 34,730,360 |
| IQ Candriam ESG International Equity ETF (a) | 1,395,075 | 34,597,860 |
| IQ Candriam ESG U.S. Large Cap Equity ETF (a) | 1,762,020 | 56,354,686 |
| IQ Chaikin U.S. Large Cap ETF (a) | 1,620,475 | 50,883,401 |
| IQ Chaikin U.S. Small Cap ETF (a) | 1,211,698 | 38,632,325 |
| IQ FTSE International Equity Currency Neutral ETF (a) | 797,387 | 17,024,212 |
| MainStay Epoch Capital Growth Fund Class I (a) | 279,961 | 3,030,890 |
| MainStay Epoch International Choice Fund Class I (a) | 846,256 | 28,668,442 |
| MainStay VP American Century Sustainable Equity Portfolio Initial Class (a) | 4,875,179 | 53,955,063 |
| MainStay VP Candriam Emerging Markets Equity Portfolio Initial Class (a) | 6,584,004 | 43,485,371 |
| MainStay VP Epoch U.S. Equity Yield Portfolio Initial Class (a) | 3,093,625 | 52,112,736 |
| MainStay VP MacKay International Equity Portfolio Initial Class (a) | 2,777,559 | 28,578,029 |
| MainStay VP S&P 500 Index Portfolio Initial Class | 185,785 | 12,948,198 |
| MainStay VP Small Cap Growth Portfolio Initial Class (a) | 4,607,933 | 43,164,813 |
| MainStay VP Wellington Growth Portfolio Initial Class (a) | 3,200,347 | 56,440,352 |
| MainStay VP Wellington Mid Cap Portfolio Initial Class (a) | 6,130,090 | 45,490,174 |
| | Shares | | Value |
| |
| Equity Funds (continued) |
| MainStay VP Wellington Small Cap Portfolio Initial Class (a) | 5,301,834 | | $ 40,757,315 |
| MainStay VP Wellington U.S. Equity Portfolio Initial Class | 1,328,353 | | 28,317,954 |
| MainStay VP Winslow Large Cap Growth Portfolio Initial Class (a) | 2,924,844 | | 55,436,610 |
| MainStay WMC Enduring Capital Fund Class R6 (a) | 907,339 | | 26,911,681 |
| MainStay WMC International Research Equity Fund Class I (a) | 4,455,368 | | 29,109,148 |
| MainStay WMC Value Fund Class R6 (a) | 1,756,558 | | 50,561,457 |
Total Affiliated Investment Companies
(Cost $985,761,285) | | | 831,191,077 |
| Short-Term Investment 3.3% |
| Affiliated Investment Company 3.3% |
| MainStay U.S. Government Liquidity Fund, 3.602% (b) | 28,276,356 | | 28,276,356 |
Total Short-Term Investment
(Cost $28,276,356) | 3.3% | | 28,276,356 |
Total Investments
(Cost $1,014,037,641) | 99.7% | | 859,467,433 |
| Other Assets, Less Liabilities | 0.3 | | 2,340,367 |
| Net Assets | 100.0% | | $ 861,807,800 |
| † | Percentages indicated are based on Portfolio net assets. |
| (a) | As of December 31, 2022, the Portfolio's ownership exceeds 5% of the outstanding shares of the Underlying Portfolio's/Fund's share class. |
| (b) | Current yield as of December 31, 2022. |
The notes to the financial statements are an integral part of, and should be read in conjunction with, the financial statements.
55
Portfolio of Investments December 31, 2022† (continued)
Investments in Affiliates (in 000's)
Investments in issuers considered to be affiliate(s) of the Portfolio during the year ended December 31, 2022 for purposes of Section 2(a)(3) of the Investment Company Act of 1940, as amended, were as follows:
| Affiliated Investment Companies | Value,
Beginning
of Year | Purchases
at Cost | Proceeds
from
Sales | Net
Realized
Gain/(Loss)
on Sales | Change in
Unrealized
Appreciation/
(Depreciation) | Value,
End of
Year | Dividend
Income | Other
Distributions | Shares
End of
Year |
| IQ 500 International ETF | $ 49,260 | $ 2,476 | $ (11,676) | $ 1,519 | $ (6,849) | $ 34,730 | $ 1,240 | $ — | 1,228 |
| IQ Candriam ESG International Equity ETF | 41,675 | 5,623 | (5,401) | 1,107 | (8,406) | 34,598 | 1,053 | — | 1,395 |
| IQ Candriam ESG U.S. Large Cap Equity ETF (a) | 84,809 | 3,724 | (13,587) | 3,762 | (22,353) | 56,355 | 866 | — | 1,762 |
| IQ Chaikin U.S. Large Cap ETF | 59,579 | 1,989 | (2,566) | 682 | (8,800) | 50,884 | 703 | — | 1,620 |
| IQ Chaikin U.S. Small Cap ETF | 30,456 | 15,549 | (2,825) | (264) | (4,284) | 38,632 | 469 | — | 1,212 |
| IQ FTSE International Equity Currency Neutral ETF (b) | 25,047 | 227 | (4,875) | 305 | (3,680) | 17,024 | 501 | 321 | 797 |
| MainStay Epoch Capital Growth Fund Class I | 4,676 | 90 | (841) | (110) | (784) | 3,031 | 14 | 32 | 280 |
| MainStay Epoch International Choice Fund Class I | 41,150 | 1,882 | (7,848) | 1,394 | (7,910) | 28,668 | 385 | — | 846 |
| MainStay U.S. Government Liquidity Fund | 34,922 | 127,664 | (134,310) | — | — | 28,276 | 407 | — | 28,276 |
| MainStay VP American Century Sustainable Equity Portfolio Initial Class (c) | 66,970 | 7,678 | (8,876) | 1,166 | (12,983) | 53,955 | 989 | 6,308 | 4,875 |
| MainStay VP Candriam Emerging Markets Equity Portfolio Initial Class | 55,179 | 13,770 | (2,346) | 65 | (23,183) | 43,485 | 463 | 6,425 | 6,584 |
| MainStay VP Epoch U.S. Equity Yield Portfolio Initial Class | 72,748 | 2,657 | (18,980) | 1,977 | (6,289) | 52,113 | 1,154 | 1,236 | 3,094 |
| MainStay VP MacKay International Equity Portfolio Initial Class | 36,545 | 11,031 | (3,247) | (653) | (15,098) | 28,578 | 83 | 5,876 | 2,778 |
| MainStay VP S&P 500 Index Portfolio Initial Class (d) | 104,750 | 642 | (79,643) | 15,688 | (28,489) | 12,948 | 200 | 434 | 186 |
| MainStay VP Small Cap Growth Portfolio Initial Class | 44,619 | 23,842 | (1,586) | 73 | (23,783) | 43,165 | — | 10,949 | 4,608 |
| MainStay VP Wellington Growth Portfolio Initial Class | 69,585 | 37,240 | (6,172) | (890) | (43,323) | 56,440 | — | 18,372 | 3,200 |
| MainStay VP Wellington Mid Cap Portfolio Initial Class | 47,819 | 27,568 | (1,370) | (154) | (28,373) | 45,490 | — | 18,223 | 6,130 |
| MainStay VP Wellington Small Cap Portfolio Initial Class | 36,586 | 26,065 | (1,625) | (235) | (20,034) | 40,757 | 478 | 11,001 | 5,302 |
| MainStay VP Wellington U.S. Equity Portfolio Initial Class | 33,774 | 12,134 | (4,065) | (504) | (13,021) | 28,318 | 200 | 5,776 | 1,328 |
| MainStay VP Winslow Large Cap Growth Portfolio Initial Class | 83,712 | 21,947 | (9,383) | 550 | (41,389) | 55,437 | — | 14,676 | 2,925 |
| MainStay WMC Enduring Capital Fund Class R6 | 26,657 | 6,781 | (1,808) | (45) | (4,673) | 26,912 | 158 | 974 | 907 |
| MainStay WMC International Research Equity Fund Class I | 40,548 | 1,336 | (6,151) | (1,923) | (4,701) | 29,109 | 602 | — | 4,455 |
| MainStay WMC Value Fund Class R6 | 71,682 | 2,814 | (18,147) | (5,386) | (401) | 50,562 | 861 | 1,949 | 1,757 |
| | $1,162,748 | $354,729 | $ (347,328) | $ 18,124 | $(328,806) | $ 859,467 | $ 10,826 | $102,552 | |
| | |
| (a) | Prior to August 31, 2022, known as IQ Candriam ESG U.S. Equity ETF. |
| (b) | Prior to August 31, 2022, known as IQ 50 Percent Hedged FTSE International ETF. |
| (c) | Prior to May 1, 2022, known as MainStay VP T. Rowe Price Equity Income Portfolio Initial Class. |
| (d) | Prior to May 1, 2022, known as MainStay VP MacKay S&P 500 Index Portfolio Initial Class. |
The notes to the financial statements are an integral part of, and should be read in conjunction with, the financial statements.
| 56 | MainStay VP Equity Allocation Portfolio |
Swap Contracts
Open OTC total return equity swap contracts as of December 31, 2022 were as follows1:
Swap
Counterparty | Reference Obligation | Floating Rate2 | Termination
Date(s) | Payment
Frequency
Paid/
Received | Notional
Amount
Long/
(Short)
(000)3 | Unrealized
Appreciation/
(Depreciation)4 |
| Citibank NA | Invesco S&P 500 Low Volatility ETF | 1 day FEDF plus 0.45% | 12/4/23 | Daily | 13,114 | $ — |
| Citibank NA | iShares MSCI EAFE ETF | 1 day FEDF minus 1.25% | 12/4/23 | Daily | (19,094) | — |
| Citibank NA | iShares MSCI Emerging Markets ETF | 1 day FEDF minus 0.50% | 12/4/23 | Daily | (17,926) | — |
| Citibank NA | Russell 1000 Growth Total Return Index | 1 day FEDF minus 0.20% | 12/4/23 | Daily | (12,950) | — |
| Citibank NA | S&P 400 Total Return | 1 day FEDF plus 0.30% | 12/4/23 | Daily | 24,293 | — |
| Citibank NA | S&P 500 Communication Services | 1 day FEDF plus 0.42% | 12/4/23 | Daily | 4,726 | — |
| Citibank NA | S&P 500 Energy Total | 1 day FEDF plus 0.41% | 12/4/23 | Daily | 12,043 | — |
| Citibank NA | S&P 500 Health Care Sector | 1 day FEDF plus 0.45% | 12/4/23 | Daily | 13,043 | — |
| Citibank NA | S&P 500 Total Return Index | 1 day FEDF plus 0.03% | 12/4/23 | Daily | (27,928) | — |
| Citibank NA | S&P 600 Total Return | 1 day FEDF plus 0.40% | 12/4/23 | Daily | 39,298 | — |
| Citibank NA | SPDR S&P Oil & Gas Exploration & Production ETF | 1 day FEDF plus 0.40% | 12/4/23 | Daily | 4,445 | — |
| Citibank NA | VanEck Gold Miners ETF | 1 day FEDF plus 0.55% | 12/4/23 | Daily | 4,294 | — |
| Citibank NA | VanEck Oil Services ETF | 1 day FEDF plus 0.40% | 12/4/23 | Daily | 4,777 | — |
| Citibank NA | Vanguard FTSE Europe ETF | 1 day FEDF minus 5.00% | 12/4/23 | Daily | (8,672) | — |
| | | | | | | $ — |
| 1. | As of December 31, 2022, cash in the amount $4,000,000 was pledged to brokers for OTC swap contracts. |
| 2. | Portfolio pays the floating rate and receives the total return of the reference entity. |
| 3. | Notional amounts reflected as a positive value indicate a long position held by the Portfolio or Index and a negative value indicates a short position. |
| 4. | Reflects the value at reset date as of December 31, 2022. |
| Abbreviation(s): |
| EAFE—Europe, Australasia and Far East |
| ETF—Exchange-Traded Fund |
| FEDF—Federal Funds Rate |
| FTSE—Financial Times Stock Exchange |
| MSCI—Morgan Stanley Capital International |
| SPDR—Standard & Poor’s Depositary Receipt |
The following is a summary of the fair valuations according to the inputs used as of December 31, 2022, for valuing the Portfolio’s assets:
| Description | Quoted
Prices in
Active
Markets for
Identical
Assets
(Level 1) | | Significant
Other
Observable
Inputs
(Level 2) | | Significant
Unobservable
Inputs
(Level 3) | | Total |
| Asset Valuation Inputs | | | | | | | |
| Investments in Securities (a) | | | | | | | |
| Affiliated Investment Companies | | | | | | | |
| Equity Funds | $ 831,191,077 | | $ — | | $ — | | $ 831,191,077 |
| Short-Term Investment | | | | | | | |
| Affiliated Investment Company | 28,276,356 | | — | | — | | 28,276,356 |
| Total Investments in Securities | $ 859,467,433 | | $ — | | $ — | | $ 859,467,433 |
| (a) | For a complete listing of investments, see the Portfolio of Investments. |
The notes to the financial statements are an integral part of, and should be read in conjunction with, the financial statements.
57
Statement of Assets and Liabilities as of December 31, 2022
| Assets |
Investment in affiliated investment companies, at value
(identified cost $1,014,037,641) | $859,467,433 |
| Cash collateral on deposit at broker for swap contracts | 4,000,000 |
| Receivables: | |
| Dividends | 846,043 |
| Portfolio shares sold | 94,053 |
| Other assets | 5,326 |
| Total assets | 864,412,855 |
| Liabilities |
| Payables: | |
| Dividends and interest on OTC swaps contracts | 2,056,937 |
| Portfolio shares redeemed | 296,744 |
| NYLIFE Distributors (See Note 3) | 168,763 |
| Shareholder communication | 45,158 |
| Professional fees | 25,467 |
| Custodian | 7,559 |
| Accrued expenses | 4,427 |
| Total liabilities | 2,605,055 |
| Net assets | $861,807,800 |
| Composition of Net Assets |
| Shares of beneficial interest outstanding (par value of $.001 per share) unlimited number of shares authorized | $ 92,560 |
| Additional paid-in-capital | 935,136,714 |
| | 935,229,274 |
| Total distributable earnings (loss) | (73,421,474) |
| Net assets | $861,807,800 |
| Initial Class | |
| Net assets applicable to outstanding shares | $ 86,162,297 |
| Shares of beneficial interest outstanding | 9,135,439 |
| Net asset value per share outstanding | $ 9.43 |
| Service Class | |
| Net assets applicable to outstanding shares | $775,645,503 |
| Shares of beneficial interest outstanding | 83,424,637 |
| Net asset value per share outstanding | $ 9.30 |
The notes to the financial statements are an integral part of, and should be read in conjunction with, the financial statements.
| 58 | MainStay VP Equity Allocation Portfolio |
Statement of Operations for the year ended December 31, 2022
| Investment Income (Loss) |
| Income | |
| Dividend distributions from affiliated investment companies | $ 10,826,446 |
| Expenses | |
| Distribution/Service—Service Class (See Note 3) | 2,157,952 |
| Professional fees | 80,873 |
| Shareholder communication | 52,121 |
| Custodian | 32,902 |
| Trustees | 20,267 |
| Miscellaneous | 24,148 |
| Total expenses | 2,368,263 |
| Net investment income (loss) | 8,458,183 |
| Realized and Unrealized Gain (Loss) |
| Net realized gain (loss) on: | |
| Affiliated investment company transactions | 18,124,116 |
| Realized capital gain distributions from affiliated investment companies | 102,552,268 |
| Swap transactions | (3,157,883) |
| Net realized gain (loss) | 117,518,501 |
Net change in unrealized appreciation (depreciation) on:
Affiliated investments companies | (328,806,143) |
| Net realized and unrealized gain (loss) | (211,287,642) |
| Net increase (decrease) in net assets resulting from operations | $(202,829,459) |
The notes to the financial statements are an integral part of, and should be read in conjunction with, the financial statements.
59
Statements of Changes in Net Assets
for the years ended December 31, 2022 and December 31, 2021
| | 2022 | 2021 |
| Increase (Decrease) in Net Assets |
| Operations: | | |
| Net investment income (loss) | $ 8,458,183 | $ 11,571,415 |
| Net realized gain (loss) | 117,518,501 | 155,500,479 |
| Net change in unrealized appreciation (depreciation) | (328,806,143) | 42,945,671 |
| Net increase (decrease) in net assets resulting from operations | (202,829,459) | 210,017,565 |
| Distributions to shareholders: | | |
| Initial Class | (16,509,845) | (5,190,094) |
| Service Class | (152,373,206) | (51,434,070) |
| Total distributions to shareholders | (168,883,051) | (56,624,164) |
| Capital share transactions: | | |
| Net proceeds from sales of shares | 19,615,742 | 14,094,934 |
| Net asset value of shares issued to shareholders in reinvestment of distributions | 168,883,051 | 56,624,164 |
| Cost of shares redeemed | (120,792,336) | (192,763,382) |
| Increase (decrease) in net assets derived from capital share transactions | 67,706,457 | (122,044,284) |
| Net increase (decrease) in net assets | (304,006,053) | 31,349,117 |
| Net Assets |
| Beginning of year | 1,165,813,853 | 1,134,464,736 |
| End of year | $ 861,807,800 | $1,165,813,853 |
The notes to the financial statements are an integral part of, and should be read in conjunction with, the financial statements.
| 60 | MainStay VP Equity Allocation Portfolio |
Financial Highlights selected per share data and ratios
| | Year Ended December 31, |
| Initial Class | 2022 | | 2021 | | 2020 | | 2019 | | 2018 |
| Net asset value at beginning of year | $ 14.39 | | $ 12.62 | | $ 11.80 | | $ 10.50 | | $ 12.65 |
| Net investment income (loss) (a) | 0.13 | | 0.18 | | 0.18 | | 0.21 | | 0.18 |
| Net realized and unrealized gain (loss) | (2.83) | | 2.33 | | 1.49 | | 2.25 | | (1.67) |
| Total from investment operations | (2.70) | | 2.51 | | 1.67 | | 2.46 | | (1.49) |
| Less distributions: | | | | | | | | | |
| From net investment income | (0.40) | | (0.27) | | (0.27) | | (0.36) | | (0.19) |
| From net realized gain on investments | (1.86) | | (0.47) | | (0.58) | | (0.80) | | (0.47) |
| Total distributions | (2.26) | | (0.74) | | (0.85) | | (1.16) | | (0.66) |
| Net asset value at end of year | $ 9.43 | | $ 14.39 | | $ 12.62 | | $ 11.80 | | $ 10.50 |
| Total investment return (b) | (17.64)% | | 20.16% | | 15.02% | | 24.58% | | (12.78)% |
| Ratios (to average net assets)/Supplemental Data: | | | | | | | | | |
| Net investment income (loss) | 1.14% | | 1.26% | | 1.64% | | 1.80% | | 1.42% |
| Net expenses (c) | 0.02% | | 0.02% | | 0.03% | | 0.03% | | 0.02% |
| Portfolio turnover rate | 23% | | 22% | | 26% | | 38% | | 28% |
| Net assets at end of year (in 000's) | $ 86,162 | | $ 107,062 | | $ 92,647 | | $ 83,143 | | $ 66,326 |
| (a) | Per share data based on average shares outstanding during the year. |
| (b) | Total return does not reflect any deduction of sales charges, mortality and expense charges, contract charges or administrative charges. For periods of less than one year, total return is not annualized. |
| (c) | In addition to the fees and expenses which the Portfolio bears directly, it also indirectly bears a pro-rata share of the fees and expenses of the underlying funds in which it invests. Such indirect expenses are not included in the above expense ratios. |
| | Year Ended December 31, |
| Service Class | 2022 | | 2021 | | 2020 | | 2019 | | 2018 |
| Net asset value at beginning of year | $ 14.21 | | $ 12.47 | | $ 11.67 | | $ 10.39 | | $ 12.53 |
| Net investment income (loss) (a) | 0.10 | | 0.13 | | 0.15 | | 0.17 | | 0.14 |
| Net realized and unrealized gain (loss) | (2.79) | | 2.32 | | 1.47 | | 2.24 | | (1.65) |
| Total from investment operations | (2.69) | | 2.45 | | 1.62 | | 2.41 | | (1.51) |
| Less distributions: | | | | | | | | | |
| From net investment income | (0.36) | | (0.24) | | (0.24) | | (0.33) | | (0.16) |
| From net realized gain on investments | (1.86) | | (0.47) | | (0.58) | | (0.80) | | (0.47) |
| Total distributions | (2.22) | | (0.71) | | (0.82) | | (1.13) | | (0.63) |
| Net asset value at end of year | $ 9.30 | | $ 14.21 | | $ 12.47 | | $ 11.67 | | $ 10.39 |
| Total investment return (b) | (17.85)% | | 19.86% | | 14.74% | | 24.27% | | (12.99)% |
| Ratios (to average net assets)/Supplemental Data: | | | | | | | | | |
| Net investment income (loss) | 0.86% | | 0.97% | | 1.34% | | 1.49% | | 1.16% |
| Net expenses (c) | 0.27% | | 0.27% | | 0.28% | | 0.28% | | 0.27% |
| Portfolio turnover rate | 23% | | 22% | | 26% | | 38% | | 28% |
| Net assets at end of year (in 000's) | $ 775,646 | | $ 1,058,752 | | $ 1,041,818 | | $ 1,033,813 | | $ 929,230 |
| (a) | Per share data based on average shares outstanding during the year. |
| (b) | Total return does not reflect any deduction of sales charges, mortality and expense charges, contract charges or administrative charges. For periods of less than one year, total return is not annualized. |
| (c) | In addition to the fees and expenses which the Portfolio bears directly, it also indirectly bears a pro-rata share of the fees and expenses of the underlying funds in which it invests. Such indirect expenses are not included in the above expense ratios. |
The notes to the financial statements are an integral part of, and should be read in conjunction with, the financial statements.
61
Notes to Financial Statements
Note 1–Organization and Business
MainStay VP Funds Trust (the “Fund”) was organized as a Delaware statutory trust on February 1, 2011. The Fund is registered under the Investment Company Act of 1940, as amended (the “1940 Act”), as an open-end management investment company. The Fund is comprised of thirty-one separate series (collectively referred to as the “Portfolios” and each individually, referred to as a "Portfolio"). These financial statements and notes relate to the MainStay VP Conservative Allocation Portfolio, MainStay VP Moderate Allocation Portfolio, MainStay VP Growth Allocation Portfolio and MainStay VP Equity Allocation Portfolio (collectively referred to as the “Allocation Portfolios” and each individually referred to as an “Allocation Portfolio”). Each is a "diversified” portfolio, as that term is defined in the 1940 Act, as interpreted or modified by regulatory authorities having jurisdiction, from time to time.
Shares of the Allocation Portfolios are currently offered to certain separate accounts to fund variable annuity policies and variable universal life insurance policies issued by New York Life Insurance and Annuity Corporation (“NYLIAC”), a wholly-owned subsidiary of New York Life Insurance Company (“New York Life”) and may also be offered to fund variable annuity policies and variable universal life insurance policies issued by other insurance companies. NYLIAC allocates shares of the Allocation Portfolios to, among others, certain NYLIAC separate accounts. The separate accounts are used to fund flexible premium deferred variable annuity contracts and variable life insurance policies.
The following table lists each Portfolio's share classes that have been registered and commenced operations:
| Fund | Share Classes Commenced Operations1 |
| MainStay VP Conservative Allocation Portfolio | Initial Class, Service Class |
| MainStay VP Moderate Allocation Portfolio | Initial Class, Service Class |
| MainStay VP Growth Allocation Portfolio | Initial Class, Service Class |
| MainStay VP Equity Allocation Portfolio | Initial Class, Service Class |
| 1. | For each VP Allocation Portfolio, Initial Class and Service Class shares were registered for sale as of February 13, 2006. |
Shares of the Allocation Portfolios are offered and are redeemed at a price equal to their respective net asset value (“NAV”) per share. No sales or redemption charge is applicable to the purchase or redemption of the Allocation Portfolios' shares. Under the terms of the Fund’s multiple class plan, adopted pursuant to Rule 18f-3 under the 1940 Act, the classes differ in that, among other things, Service Class shares of the Allocation Portfolios pay a combined distribution and service fee of 0.25% of average daily net assets attributable to Service Class shares of the Allocation Portfolios to the Distributor (as defined in Note 3(B)) pursuant to a plan adopted in accordance with Rule 12b-1 under the 1940 Act. Contract owners of variable annuity contracts purchased after June 2, 2003, are permitted to invest only in the Service Class shares.
The investment objective for each of the Allocation Portfolios is as follows:
The MainStay VP Conservative Allocation Portfolio seeks current income and, secondarily, long-term growth of capital.
The MainStay VP Moderate Allocation Portfolio seeks long-term growth of capital and, secondarily, current income.
The MainStay VP Growth Allocation Portfolio seeks long-term growth of capital and, secondarily, current income.
The MainStay VP Equity Allocation Portfolio seeks long-term growth of capital.
The Allocation Portfolios are "fund-of-funds" that seek to achieve their investment objectives by investing in mutual funds and exchange-traded funds ("ETFs") managed by New York Life Investment Management LLC ("New York Life Investments" or "Manager") or its affiliates (the “Underlying Portfolios/Funds”).
Note 2–Significant Accounting Policies
The Allocation Portfolios are investment companies and accordingly follow the investment company accounting and reporting guidance of the Financial Accounting Standards Board (“FASB”) Accounting Standards Codification Topic 946 Financial Services—Investment Companies. The Allocation Portfolios prepare their financial statements in accordance with generally accepted accounting principles (“GAAP”) in the United States of America and follow the significant accounting policies described below.
(A) Securities Valuation. Investments are usually valued as of the close of regular trading on the New York Stock Exchange (the "Exchange") (usually 4:00 p.m. Eastern time) on each day the Allocation Portfolios are open for business ("valuation date").
Effective September 8, 2022, and pursuant to Rule 2a-5 under the 1940 Act, the Board of Trustees of the Fund (the "Board") designated New York Life Investment Management LLC (“New York Life Investments” or the "Manager") as its Valuation Designee (the "Valuation Designee"). The Valuation Designee is responsible for performing fair valuations relating to all investments in each Allocation Portfolio’s portfolio for which market quotations are not readily available; periodically assessing and managing material valuation risks; establishing and applying fair value methodologies; testing fair valuation methodologies; evaluating and overseeing pricing services; ensuring appropriate segregation of valuation and portfolio management functions; providing quarterly, annual and prompt reporting to the Board, as appropriate; identifying potential conflicts of interest; and maintaining appropriate records. The Valuation Designee has established a valuation committee ("Valuation Committee") to assist in carrying out the Valuation Designee’s responsibilities and establish prices of securities for which market quotations are not readily available. The Allocation Portfolio’s and the Valuation Designee's policies and procedures ("Valuation Procedures") govern the Valuation Designee’s selection and application of methodologies for determining and calculating the fair value of Allocation Portfolio investments. The Valuation Designee may value the Allocation Portfolio's portfolio securities for which
| 62 | MainStay VP Asset Allocation Funds |
market quotations are not readily available and other Allocation Portfolio assets utilizing inputs from pricing services and other third-party sources (together, “Pricing Sources”). The Valuation Committee meets (in person, via electronic mail or via teleconference) on an ad-hoc basis to determine fair valuations and on a quarterly basis to review fair value events with respect to certain securities for which market quotations are not readily available, including valuation risks and back-testing results, and preview reports to the Board.
The Valuation Committee establishes prices of securities for which market quotations are not readily available based on such methodologies and measurements on a regular basis after considering information that is reasonably available and deemed relevant by the Valuation Committee. The Board shall oversee the Valuation Designee and review fair valuation materials on a prompt, quarterly and annual basis and approve proposed revisions to the Valuation Procedures.
Investments for which market quotations are not readily available are valued at fair value as determined in good faith pursuant to the Valuation Procedures. A market quotation is readily available only when that quotation is a quoted price (unadjusted) in active markets for identical investments that each Allocation Portfolio can access at the measurement date, provided that a quotation will not be readily available if it is not reliable. "Fair value" is defined as the price the Allocation Portfolio would reasonably expect to receive upon selling an asset or liability in an orderly transaction to an independent buyer in the principal or most advantageous market for the asset or liability. Fair value measurements are determined within a framework that establishes a three-tier hierarchy that maximizes the use of observable market data and minimizes the use of unobservable inputs to establish a classification of fair value measurements for disclosure purposes. "Inputs" refer broadly to the assumptions that market participants would use in pricing the asset or liability, including assumptions about risk, such as the risk inherent in a particular valuation technique used to measure fair value using a pricing model and/or the risk inherent in the inputs for the valuation technique. Inputs may be observable or unobservable. Observable inputs reflect the assumptions market participants would use in pricing the asset or liability based on market data obtained from sources independent of each Allocation Portfolio. Unobservable inputs reflect each Allocation Portfolio’s own assumptions about the assumptions market participants would use in pricing the asset or liability based on the information available. The inputs or methodology used for valuing assets or liabilities may not be an indication of the risks associated with investing in those assets or liabilities. The three-tier hierarchy of inputs is summarized below.
| • | Level 1—quoted prices (unadjusted) in active markets for an identical asset or liability |
| • | Level 2—other significant observable inputs (including quoted prices for a similar asset or liability in active markets, interest rates and yield curves, prepayment speeds, credit risk, etc.) |
| • | Level 3—significant unobservable inputs (including each Allocation Portfolio's own assumptions about the assumptions that market participants would use in measuring fair value of an asset or liability) |
The level of an asset or liability within the fair value hierarchy is based on the lowest level of an input, both individually and in the aggregate, that is significant to the fair value measurement. The aggregate value by input level of each Allocation Portfolio’s assets and liabilities as of December 31, 2022, is included at the end of the Portfolio of Investments.
Investments in Underlying Portfolios/Funds are valued at their respective NAVs at the close of business each day, except for investment in ETFs. Investments in ETFs are valued at the last quoted sales price as of the close of regular trading on the relevant exchange on each valuation date. These securities are generally categorized as Level 1 in the hierarchy.
Securities held by the Underlying Portfolios/Funds are valued using policies consistent with those used by the Underlying Portfolios/Funds. Equity securities, including shares of ETFs, are generally valued at the last quoted sales price as of the close of regular trading on the relevant exchange on each valuation date.
Total return swap contracts, which are arrangements to exchange a market-linked return for a periodic payment, are based on a notional principal amount. To the extent that the total return of the security, index or other financial measure underlying the transaction exceeds or falls short of the offsetting interest rate obligation, the Allocation Portfolios will receive a payment from or make a payment to the counterparty. Total return swap contracts are marked to market daily based upon quotations from market makers and these securities are generally categorized as Level 2 in the hierarchy.
Temporary cash investments acquired in excess of 60 days to maturity at the time of purchase are valued using the latest bid prices or using valuations based on a matrix system (which considers such factors as security prices, yields, maturities and ratings), both as furnished by independent pricing services. Temporary cash investments that mature in 60 days or less at the time of purchase ("Short-Term Investments") are valued using the amortized cost method of valuation, unless the use of such method would be inappropriate. The amortized cost method involves valuing a security at its cost on the date of purchase and thereafter assuming a constant amortization to maturity of the difference between such cost and the value on maturity date. Amortized cost approximates the current fair value of a security. Securities valued using the amortized cost method are not valued using quoted prices in an active market and are generally categorized as Level 2 in the hierarchy.
The information above is not intended to reflect an exhaustive list of the methodologies that may be used to value portfolio investments. The Valuation Procedures permit the use of a variety of valuation methodologies in connection with valuing portfolio investments. The methodology used for a specific type of investment may vary based on the market data available or other considerations. The methodologies summarized above may not represent the specific means by which portfolio investments are valued on any particular business day.
(B) Income Taxes. The Allocation Portfolios' policy is to comply with the requirements of the Internal Revenue Code of 1986, as amended (the “Internal Revenue Code”), applicable to regulated investment companies
Notes to Financial Statements (continued)
and to distribute all of its taxable income to the shareholders of each Allocation Portfolio within the allowable time limits.
The Manager evaluates each Allocation Portfolio’s tax positions to determine if the tax positions taken meet the minimum recognition threshold in connection with accounting for uncertainties in income tax positions taken or expected to be taken for the purposes of measuring and recognizing tax liabilities in the financial statements. Recognition of tax benefits of an uncertain tax position is permitted only to the extent the position is “more likely than not” to be sustained assuming examination by taxing authorities. The Manager analyzed the Allocation Portfolios' tax positions taken on federal, state and local income tax returns for all open tax years (for up to three tax years) and has concluded that no provisions for federal, state and local income tax are required in the Allocation Portfolios' financial statements. The Allocation Portfolios' federal, state and local income tax and federal excise tax returns for tax years for which the applicable statutes of limitations have not expired are subject to examination by the Internal Revenue Service and state and local departments of revenue.
(C) Dividends and Distributions to Shareholders. Dividends and distributions are recorded on the ex-dividend date. The Allocation Portfolios intend to declare and pay dividends from net investment income and distributions from net realized capital and currency gains, if any, at least annually. All dividends and distributions are reinvested at NAV in the same class of shares of the respective Allocation Portfolio. Dividends and distributions to shareholders are determined in accordance with federal income tax regulations and may differ from determinations using GAAP.
(D) Security Transactions and Investment Income. The Allocation Portfolios record security transactions on the trade date. Realized gains and losses on security transactions are determined using the identified cost method. Dividends and distributions received by the Allocation Portfolios from the Underlying Portfolios are recorded on the ex-dividend date. Distributions received from real estate investment trusts may be classified as dividends, capital gains and/or return of capital.
Investment income and realized and unrealized gains and losses on investments of the Allocation Portfolios are allocated pro rata to the separate classes of shares based upon their relative net assets on the date the income is earned or realized and unrealized gains and losses are incurred.
(E) Expenses. Expenses of the Fund are allocated to the individual Portfolios in proportion to the net assets of the respective Allocation Portfolios when the expenses are incurred, except where direct allocations of expenses can be made. Expenses (other than fees incurred under the distribution and service plans, further discussed in Note 3(B), which are charged directly to the Service Class shares) are allocated to separate classes of shares pro rata based upon their relative net assets on the date the expenses are incurred. The expenses borne by the Allocation Portfolios, including those of related parties to the Allocation Portfolios, are shown in the Statement of Operations.
Additionally, the Allocation Portfolios may invest in ETFs and mutual funds, which are subject to management fees and other fees that may cause the costs of investing in ETFs and mutual funds to be greater than the costs of owning the underlying securities directly. These indirect expenses of ETFs and mutual funds are not included in the amounts shown as expenses in the Statement of Operations or in the expense ratios included in the Financial Highlights. In addition, the Allocation Portfolios bear a pro rata share of the fees and expenses of the Underlying Portfolios/Funds in which they invest. Because the Underlying Portfolios/Funds have varied expense and fee levels and the Allocation Portfolios may own different pro-portions of the Underlying Portfolios/Funds at different times, the amount of fees and expenses incurred indirectly by each Allocation Portfolio may vary.
(F) Use of Estimates. In preparing financial statements in conformity with GAAP, the Manager makes estimates and assumptions that affect the reported amounts and disclosures in the financial statements. Actual results could differ from those estimates and assumptions.
(G) Swap Contracts. The Allocation Portfolios may enter into credit default, interest rate, equity, index and currency exchange rate swap contracts (“swaps”). In a typical swap transaction, two parties agree to exchange the future returns (or differentials in rates of future returns) earned or realized at periodic intervals on a particular investment or instrument based on a notional principal amount. Generally, the Allocation Portfolios will enter into a swap on a net basis, which means that the two payment streams under the swap are netted, with the Allocation Portfolios receiving or paying (as the case may be) only the net amount of the two payment streams. Therefore, the Allocation Portfolios' current obligation under a swap generally will be equal to the net amount to be paid or received under the swap, based on the relative value of notional positions attributable to each counterparty to the swap. The payments may be adjusted for transaction costs, interest payments, the amount of interest paid on the investment or instrument or other factors. Collateral, in the form of cash or securities, may be required to be held in segregated accounts with the custodian bank or broker in accordance with the terms of the swap. Swap agreements are privately negotiated in the over the counter (“OTC”) market and may be executed in a multilateral or other trade facilities platform, such as a registered commodities exchange (“centrally cleared swaps”).
Certain standardized swaps, including certain credit default and interest rate swaps, are subject to mandatory clearing and exchange-trading, and more types of standardized swaps are expected to be subject to mandatory clearing and exchange-trading in the future. The counterparty risk for exchange-traded and cleared derivatives is expected to be generally lower than for uncleared derivatives, but cleared contracts are not risk-free. In a cleared derivative transaction, the Allocation Portfolios typically enters into the transaction with a financial institution counterparty, and performance of the transaction is effectively guaranteed by a central clearinghouse, thereby reducing or eliminating the Allocation Portfolios' exposure to the credit risk of its original counterparty. The Allocation Portfolios will be required to post specified levels of margin
| 64 | MainStay VP Asset Allocation Funds |
with the clearinghouse or at the instruction of the clearinghouse; the margin required by a clearinghouse may be greater than the margin the Allocation Portfolios would be required to post in an uncleared transaction. As of December 31, 2022, all swap positions outstanding are shown in the Portfolio of Investments.
Swaps are marked to market daily based upon quotations from pricing agents, brokers, or market makers and the change in value, if any, is recorded as unrealized appreciation or depreciation. Any payments made or received upon entering into a swap would be amortized or accreted over the life of the swap and recorded as a realized gain or loss. Early termination of a swap is recorded as a realized gain or loss. Daily changes in valuation of centrally cleared swaps, if any, are recorded as a receivable or payable for the change in value as appropriate on the Statement of Assets and Liabilities.
The Allocation Portfolios bears the risk of loss of the amount expected to be received under a swap in the event of the default or bankruptcy of the swap counterparty. The Allocation Portfolios may be able to eliminate its exposure under a swap either by assignment or other disposition, or by entering into an offsetting swap with the same party or a similar credit-worthy party. Swaps are not actively traded on financial markets. Entering into swaps involves elements of credit, market, leverage, liquidity, operational, counterparty and legal/documentation risk in excess of the amounts recognized on the Statement of Assets and Liabilities. Such risks involve the possibilities that there will be no liquid market for these swaps, that the counterparty to the swaps may default on its obligation to perform or disagree as to the meaning of the contractual terms in the swaps and that there may be unfavorable changes in interest rates, the price of the index or the security underlying these transactions, among other risks.
Equity Swaps (Total Return Swaps). Total return swap contracts are agreements between counterparties to exchange cash flow, one based on a market-linked return of an individual asset or group of assets (such as an index), and the other on a fixed or floating rate. As a total return swap, an equity swap may be structured in different ways. For example, when the Allocation Portfolios enter into a “long” equity swap, the counterparty may agree to pay the Allocation Portfolios the amount, if any, by which the notional amount of the equity swap would have increased in value had it been invested in a particular referenced security or securities, plus the dividends that would have been received on those securities. In return, the Allocation Portfolios will generally agree to pay the counterparty interest on the notional amount of the equity swap plus the amount, if any, by which that notional amount would have decreased in value had it been invested in such referenced security or securities, plus, in certain instances, commissions or trading spreads on the notional amounts. Therefore, the Allocation Portfolios' return on the equity swap generally should equal the gain or loss on the notional amount, plus dividends on the referenced security or securities less the interest paid by the Allocation Portfolios on the notional amount. Alternatively, when the Allocation Portfolios enter into a “short” equity swap, the counterparty will generally agree to pay the Allocation Portfolios the amount, if any, by which the notional amount of the equity swap would have decreased in
value had the Allocation Portfolios sold a particular referenced security or securities short, less the dividend expense that the Allocation Portfolios would have incurred on the referenced security or securities, as adjusted for interest payments or other economic factors. In this situation, the Allocation Portfolios will generally be obligated to pay the amount, if any, by which the notional amount of the swap would have increased in value had it been invested directly in the referenced security or securities.
Equity swaps generally do not involve the delivery of securities or other referenced assets. Accordingly, the risk of loss with respect to equity swaps is normally limited to the net amount of payments that the Allocation Portfolios are contractually obligated to make. If the other party to an equity swap defaults, the Allocation Portfolios' risk of loss consists of the net amount of payments that the Allocation Portfolios are contractually entitled to receive, if any. The Allocation Portfolios will segregate cash or liquid assets, enter into offsetting transactions or use other measures permitted by applicable law to “cover” the Allocation Portfolios' current obligations. The Allocation Portfolios and New York Life Investments, however, believe these transactions do not constitute senior securities under the 1940 Act and, accordingly, will not treat them as being subject to the Allocation Portfolios' borrowing restrictions.
Equity swaps are derivatives and their value can be very volatile. The Allocation Portfolios may engage in total return swaps to gain exposure to emerging markets securities, along with offsetting long total return swap positions to maintain appropriate currency balances and risk exposures across all swap positions. To the extent that the Manager does not accurately analyze and predict future market trends, the values or assets or economic factors, the Allocation Portfolios may suffer a loss, which may be substantial. As of December 31, 2022, open swap agreements are shown in the Portfolio of Investments.
(H) LIBOR Replacement Risk. The Allocation Portfolios may invest in certain debt securities, derivatives or other financial instruments that utilize the London Interbank Offered Rate ("LIBOR"), as a ��benchmark” or “reference rate” for various interest rate calculations. As of January 1, 2022, the United Kingdom Financial Conduct Authority, which regulates LIBOR, ceased its active encouragement of banks to provide the quotations needed to sustain most LIBOR rates due to the absence of an active market for interbank unsecured lending and other reasons. However, the United Kingdom Financial Conduct Authority, the LIBOR administrator and other regulators announced that the most widely used tenors of U.S. dollar LIBOR will continue until mid-2023. As a result, it is anticipated that the remaining LIBOR settings will be discontinued or will no longer be sufficiently robust to be representative of its underlying market around that time. Various financial industry groups will plan for that transition and certain regulators and industry groups have taken actions to establish alternative reference rates (e.g., the Secured Overnight Financing Rate, which measures the cost of overnight borrowings through repurchase agreement transactions collateralized with U.S. Treasury securities and is intended to replace U.S. dollar LIBOR with certain adjustments). However, there are challenges to converting
Notes to Financial Statements (continued)
certain contracts and transactions to a new benchmark and neither the full effects of the transition process nor its ultimate outcome is known.
The elimination of LIBOR or changes to other reference rates or any other changes or reforms to the determination or supervision of reference rates could have an adverse impact on the market for, or value of, any securities or payments linked to those reference rates, which may adversely affect the Allocation Portfolios' performance and/or net asset value. Uncertainty and risk also remain regarding the willingness and ability of issuers and lenders to include enhanced provisions in new and existing contracts or instruments. Consequently, the transition away from LIBOR to other reference rates may lead to increased volatility and illiquidity in markets that are tied to LIBOR, fluctuations in values of LIBOR-related investments or investments in issuers that utilize LIBOR, increased difficulty in borrowing or refinancing and diminished effectiveness of hedging strategies, adversely affecting the Allocation Portfolios' performance. Furthermore, the risks associated with the expected discontinuation of LIBOR and transition may be exacerbated if the work necessary to effect an orderly transition to an alternative reference rate is not completed in a timely manner. While the transition away from LIBOR has already begun with no material adverse effect to the Allocation Portfolios' performance, the transition is expected to last through mid-2023 for some LIBOR tenors. The usefulness of LIBOR as a benchmark could deteriorate anytime during this transition period.
(I) Indemnifications. Under the Fund’s organizational documents, its officers and trustees are indemnified against certain liabilities that may arise out of performance of their duties to the Fund. Additionally, in the normal course of business, the Allocation Portfolios enter into contracts with third-party service providers that contain a variety of representations and warranties and that may provide general indemnifications. The Allocation Portfolios' maximum exposure under these arrangements is unknown, as this would involve future claims that may be made against the Allocation Portfolios that have not yet occurred. The Manager believes that the risk of loss in connection with these potential indemnification obligations is remote. However, there can be no assurance that material liabilities related to such obligations will not arise in the future, which could adversely impact the Allocation Portfolios.
(J) Quantitative Disclosure of Derivative Holdings. The following tables show additional disclosures related to the Allocation Portfolios' derivative and hedging activities, including how such activities are accounted for and their effect on the Allocation Portfolios' financial positions, performance and cash flows.
The Allocation Portfolios entered into total return swap contracts to seek to enhance returns or reduce the risk of loss by hedging certain of the Allocation Portfolios' holdings.
MainStay VP Conservative Allocation Portfolio
The effect of derivative instruments on the Statement of Operations for the year ended December 31, 2022:
| Net Realized Gain (Loss) from: | Equity
Contracts
Risk | Total |
| Swap Contracts | $(1,818,295) | $(1,818,295) |
| Total Net Realized Gain (Loss) | $(1,818,295) | $(1,818,295) |
| Average Notional Amount | Total |
| Swap Contracts Long | $ 86,425,574 |
| Swap Contracts Short | $(40,315,779) |
MainStay VP Moderate Allocation Portfolio
The effect of derivative instruments on the Statement of Operations for the year ended December 31, 2022:
| Net Realized Gain (Loss) from: | Equity
Contracts
Risk | Total |
| Swap Contracts | $(2,999,451) | $(2,999,451) |
| Total Net Realized Gain (Loss) | $(2,999,451) | $(2,999,451) |
| Average Notional Amount | Total |
| Swap Contracts Long | $136,189,303 |
| Swap Contracts Short | $ (64,495,096) |
MainStay VP Growth Allocation Portfolio
The effect of derivative instruments on the Statement of Operations for the year ended December 31, 2022:
| Net Realized Gain (Loss) from: | Equity
Contracts
Risk | Total |
| Swap Contracts | $(5,231,937) | $(5,231,937) |
| Total Net Realized Gain (Loss) | $(5,231,937) | $(5,231,937) |
| Average Notional Amount | Total |
| Swap Contracts Long | $ 217,700,713 |
| Swap Contracts Short | $(105,414,809) |
MainStay VP Equity Allocation Portfolio
The effect of derivative instruments on the Statement of Operations for the year ended December 31, 2022:
| Net Realized Gain (Loss) from: | Equity
Contracts
Risk | Total |
| Swap Contracts | $(3,157,883) | $(3,157,883) |
| Total Net Realized Gain (Loss) | $(3,157,883) | $(3,157,883) |
| 66 | MainStay VP Asset Allocation Funds |
| Average Notional Amount | Total |
| Swap Contracts Long | $105,162,222 |
| Swap Contracts Short | $ (65,966,434) |
Note 3–Fees and Related Party Transactions
(A) Manager. New York Life Investments, a registered investment adviser and an indirect, wholly-owned subsidiary of New York Life, serves as the Allocation Portfolios' Manager pursuant to an Amended and Restated Management Agreement (“Management Agreement”) and is responsible for the day-to-day portfolio management of the Allocation Portfolios. The Manager provides offices, conducts clerical, recordkeeping and bookkeeping services, and keeps most of the financial and accounting records required to be maintained by the Allocation Portfolios. Except for the portion of salaries and expenses that are the responsibility of the Allocation Portfolios, the Manager pays the salaries and expenses of all personnel affiliated with the Allocation Portfolios and certain operational expenses of the Allocation Portfolios. During a portion of the year ended December 31, 2022, the Allocation Portfolios reimbursed New York Life Investments in an amount equal to the portion of the compensation of the Chief Compliance Officer attributable to the Allocation Portfolios.
The Allocation Portfolios do not pay any fees to the Manager in return for the services performed under the Management Agreement. The Allocation Portfolios do, however, indirectly pay a proportionate share of the management fees paid to the managers of the Underlying Funds in which the Allocation Portfolios invest.
JPMorgan Chase Bank, N.A. ("JPMorgan") provides sub-administration and sub-accounting services to the Allocation Portfolios pursuant to an agreement with New York Life Investments. These services include calculating the daily NAVs of the Allocation Portfolios, maintaining the general ledger and sub-ledger accounts for the calculation of the Allocation Portfolios' respective NAVs, and assisting New York Life Investments in conducting various aspects of the Allocation Portfolios' administrative operations. For providing these services to the Allocation Portfolios, JPMorgan is compensated by New York Life Investments.
Pursuant to an agreement between the Fund and New York Life Investments, New York Life Investments is responsible for providing or procuring certain regulatory reporting services for the Allocation Portfolios. The Allocation Portfolios will reimburse New York Life Investments for the actual costs incurred by New York Life Investments in connection with providing or procuring these services for the Allocation Portfolios.
(B) Distribution and Service Fees. The Fund, on behalf of the Allocation Portfolios, has entered into a distribution agreement with NYLIFE Distributors LLC (the “Distributor”), an affiliate of New York Life Investments. The Allocation Portfolios have adopted a distribution plan
(the “Plan”) in accordance with the provisions of Rule 12b-1 under the 1940 Act. Under the Plan, the Distributor has agreed to provide, through its affiliates or independent third parties, various distribution-related, shareholder and administrative support services to the Service Class shareholders. For its services, the Distributor is entitled to a combined distribution and service fee accrued daily and paid monthly at an annual rate of 0.25% of the average daily net assets attributable to the Service Class shares of the respective Allocation Portfolio.
Note 4-Federal Income Tax
As of December 31, 2022, the cost and unrealized appreciation (depreciation) of each Allocation Portfolio’s investment portfolio, including applicable derivative contracts and other financial instruments, as determined on a federal income tax basis, were as follows:
| MainStay VP Conservative Allocation Portfolio |
| | Federal Tax
Cost | Gross
Unrealized
Appreciation | Gross
Unrealized
(Depreciation) | Net
Unrealized
Appreciation/
(Depreciation) |
| Investments in Securities | $579,812,053 | $6,018,019 | $(77,723,084) | $(71,705,065) |
| MainStay VP Moderate Allocation Portfolio |
| | Federal Tax
Cost | Gross
Unrealized
Appreciation | Gross
Unrealized
(Depreciation) | Net
Unrealized
Appreciation/
(Depreciation) |
| Investments in Securities | $938,724,231 | $12,703,459 | $(134,567,010) | $(121,863,551) |
| MainStay VP Growth Allocation Portfolio |
| | Federal Tax
Cost | Gross
Unrealized
Appreciation | Gross
Unrealized
(Depreciation) | Net
Unrealized
Appreciation/
(Depreciation) |
| Investments in Securities | $1,464,294,295 | $24,491,071 | $(203,779,712) | $(179,288,641) |
| MainStay VP Equity Allocation Portfolio |
| | Federal Tax
Cost | Gross
Unrealized
Appreciation | Gross
Unrealized
(Depreciation) | Net
Unrealized
Appreciation/
(Depreciation) |
| Investments in Securities | $1,023,072,518 | $17,656,638 | $(181,294,331) | $(163,637,693) |
Notes to Financial Statements (continued)
As of December 31, 2022, the components of accumulated gain (loss) on a tax basis were as follows:
| Fund | Ordinary
Income | Accumulated
Capital
and Other
Gain (Loss) | Other
Temporary
Differences | Unrealized
Appreciation
(Depreciation) | Total
Accumulated
Gain (Loss) |
| MainStay VP Conservative Allocation Portfolio | $16,565,582 | $10,960,586 | $(22,582,133) | $ (71,373,431) | $ (66,429,396) |
| MainStay VP Moderate Allocation Portfolio | 31,672,897 | 25,739,226 | (40,928,445) | (121,022,006) | (104,538,328) |
| MainStay VP Growth Allocation Portfolio | 62,031,494 | 65,047,279 | (54,449,070) | (178,958,244) | (106,328,541) |
| MainStay VP Equity Allocation Portfolio | 54,897,010 | 68,447,602 | (33,161,001) | (163,605,085) | (73,421,474) |
The difference between book-basis and tax-basis unrealized appreciation (depreciation) is primarily due to wash sale adjustments and straddle loss deferral. The other temporary differences are primarily due to loss deferrals from related party transactions.
During the years ended December 31, 2022 and December 31, 2021, the tax character of distributions paid as reflected in the Statements of Changes in Net Assets was as follows:
| | 2022 | | 2021 |
| | Ordinary
Income | Long-Term
Capital Gains | Total | | Ordinary
Income | Long-Term
Capital Gains | Total |
| MainStay VP Conservative Allocation Portfolio | $38,778,554 | $ 37,389,298 | $ 76,167,852 | | $11,965,362 | $ 7,845,270 | $19,810,632 |
| MainStay VP Moderate Allocation Portfolio | 60,632,330 | 73,833,369 | 134,465,699 | | 13,534,930 | 24,914,684 | 38,449,614 |
| MainStay VP Growth Allocation Portfolio | 90,433,602 | 141,656,010 | 232,089,612 | | 39,542,625 | 21,478,395 | 61,021,020 |
| MainStay VP Equity Allocation Portfolio | 54,259,646 | 114,623,405 | 168,883,051 | | 24,489,536 | 32,134,628 | 56,624,164 |
Note 5–Custodian
JPMorgan is the custodian of cash and securities held by the Allocation Portfolios. Custodial fees are charged to each Allocation Portfolio based on each Allocation Portfolio's net assets and/or the market value of securities held by each Allocation Portfolio and the number of certain transactions incurred by each Allocation Portfolio.
Note 6–Line of Credit
The Allocation Portfolios and certain other funds managed by New York Life Investments maintain a line of credit with a syndicate of banks in order to secure a source of funds for temporary purposes to meet unanticipated or excessive redemption requests.
Effective July 26, 2022, under the credit agreement (the “Credit Agreement”), the aggregate commitment amount is $600,000,000 with an additional uncommitted amount of $100,000,000. The commitment fee is an annual rate of 0.15% of the average commitment amount payable quarterly, regardless of usage, to JPMorgan, who serves as the agent to the syndicate. The commitment fee is allocated among the Allocation Portfolios and certain other funds managed by New York Life Investments based upon their respective net assets and other factors. Interest on any revolving credit loan is charged based upon the Federal Funds Rate, Daily Simple Secured Overnight Financing Rate ("SOFR") + 0.10%, or the Overnight Bank Funding Rate, whichever is higher. The Credit Agreement expires on July 25, 2023, although the Allocation Portfolios, certain other funds managed by New York Life Investments and
the syndicate of banks may renew the Credit Agreement for an additional year on the same or different terms or enter into a credit agreement with a different syndicate of banks. Prior to July 26, 2022, the aggregate commitment amount and the commitment fee were the same as those under the current Credit Agreement. During the year ended December 31, 2022, there were no borrowings made or outstanding with respect to the Allocation Portfolios under the Credit Agreement.
Note 7–Interfund Lending Program
Pursuant to an exemptive order issued by the SEC, the Allocation Portfolios, along with certain other funds managed by New York Life Investments, may participate in an interfund lending program. The interfund lending program provides an alternative credit facility that permits the Allocation Portfolios and certain other funds managed by New York Life Investments to lend or borrow money for temporary purposes directly to or from one another, subject to the conditions of the exemptive order. During the year ended December 31, 2022, there were no interfund loans made or outstanding with respect to the Allocation Portfolios.
| 68 | MainStay VP Asset Allocation Funds |
Note 8–Purchases and Sales of Securities (in 000’s)
During the year ended December 31, 2022, purchases and sales of securities were as follows:
| Fund | Purchases | Sales |
| MainStay VP Conservative Allocation Portfolio | $135,709 | $191,952 |
| MainStay VP Moderate Allocation Portfolio | 251,191 | 284,748 |
| MainStay VP Growth Allocation Portfolio | 415,448 | 492,744 |
| MainStay VP Equity Allocation Portfolio | 227,064 | 213,017 |
Note 9–Capital Share Transactions
Transactions in capital shares for the years ended December 31, 2022 and December 31, 2021, were as follows:
MainStay VP Conservative Allocation Portfolio
| Initial Class | Shares | Amount |
| Year ended December 31, 2022: | | |
| Shares sold | 66,953 | $ 761,710 |
| Shares issued to shareholders in reinvestment of distributions | 213,286 | 1,966,692 |
| Shares redeemed | (210,688) | (2,472,033) |
| Net increase (decrease) | 69,551 | $ 256,369 |
| Year ended December 31, 2021: | | |
| Shares sold | 69,728 | $ 893,700 |
| Shares issued to shareholders in reinvestment of distributions | 41,966 | 531,222 |
| Shares redeemed | (125,379) | (1,600,275) |
| Net increase (decrease) | (13,685) | $ (175,353) |
| |
| Service Class | Shares | Amount |
| Year ended December 31, 2022: | | |
| Shares sold | 3,229,695 | $ 36,058,577 |
| Shares issued to shareholders in reinvestment of distributions | 8,142,074 | 74,201,160 |
| Shares redeemed | (11,801,655) | (130,992,287) |
| Net increase (decrease) | (429,886) | $ (20,732,550) |
| Year ended December 31, 2021: | | |
| Shares sold | 4,557,876 | $ 57,791,405 |
| Shares issued to shareholders in reinvestment of distributions | 1,539,656 | 19,279,410 |
| Shares redeemed | (9,342,412) | (118,516,266) |
| Net increase (decrease) | (3,244,880) | $ (41,445,451) |
MainStay VP Moderate Allocation Portfolio
| Initial Class | Shares | Amount |
| Year ended December 31, 2022: | | |
| Shares sold | 177,636 | $ 2,077,596 |
| Shares issued to shareholders in reinvestment of distributions | 823,223 | 7,194,477 |
| Shares redeemed | (424,835) | (4,547,952) |
| Net increase (decrease) | 576,024 | $ 4,724,121 |
| Year ended December 31, 2021: | | |
| Shares sold | 260,832 | $ 3,313,474 |
| Shares issued to shareholders in reinvestment of distributions | 160,287 | 1,998,108 |
| Shares redeemed | (253,872) | (3,226,170) |
| Net increase (decrease) | 167,247 | $ 2,085,412 |
| |
| Service Class | Shares | Amount |
| Year ended December 31, 2022: | | |
| Shares sold | 3,891,896 | $ 42,602,916 |
| Shares issued to shareholders in reinvestment of distributions | 14,708,845 | 127,271,222 |
| Shares redeemed | (13,786,867) | (148,626,844) |
| Net increase (decrease) | 4,813,874 | $ 21,247,294 |
| Year ended December 31, 2021: | | |
| Shares sold | 3,678,709 | $ 46,219,794 |
| Shares issued to shareholders in reinvestment of distributions | 2,950,942 | 36,451,506 |
| Shares redeemed | (13,770,387) | (172,248,655) |
| Net increase (decrease) | (7,140,736) | $ (89,577,355) |
MainStay VP Growth Allocation Portfolio
| Initial Class | Shares | Amount |
| Year ended December 31, 2022: | | |
| Shares sold | 306,566 | $ 3,636,507 |
| Shares issued to shareholders in reinvestment of distributions | 1,729,015 | 15,428,348 |
| Shares redeemed | (704,896) | (8,497,093) |
| Net increase (decrease) | 1,330,685 | $ 10,567,762 |
| Year ended December 31, 2021: | | |
| Shares sold | 234,827 | $ 3,096,018 |
| Shares issued to shareholders in reinvestment of distributions | 294,278 | 3,856,100 |
| Shares redeemed | (662,806) | (8,743,863) |
| Net increase (decrease) | (133,701) | $ (1,791,745) |
| |
Notes to Financial Statements (continued)
| Service Class | Shares | Amount |
| Year ended December 31, 2022: | | |
| Shares sold | 2,009,708 | $ 22,790,986 |
| Shares issued to shareholders in reinvestment of distributions | 24,581,213 | 216,661,264 |
| Shares redeemed | (21,669,058) | (242,834,836) |
| Net increase (decrease) | 4,921,863 | $ (3,382,586) |
| Year ended December 31, 2021: | | |
| Shares sold | 1,920,433 | $ 25,173,011 |
| Shares issued to shareholders in reinvestment of distributions | 4,411,078 | 57,164,920 |
| Shares redeemed | (25,432,281) | (331,191,286) |
| Net increase (decrease) | (19,100,770) | $(248,853,355) |
MainStay VP Equity Allocation Portfolio
| Initial Class | Shares | Amount |
| Year ended December 31, 2022: | | |
| Shares sold | 217,177 | $ 2,501,367 |
| Shares issued to shareholders in reinvestment of distributions | 1,875,309 | 16,509,845 |
| Shares redeemed | (396,277) | (4,648,111) |
| Net increase (decrease) | 1,696,209 | $ 14,363,101 |
| Year ended December 31, 2021: | | |
| Shares sold | 176,557 | $ 2,498,448 |
| Shares issued to shareholders in reinvestment of distributions | 377,511 | 5,190,094 |
| Shares redeemed | (456,837) | (6,287,813) |
| Net increase (decrease) | 97,231 | $ 1,400,729 |
| |
| Service Class | Shares | Amount |
| Year ended December 31, 2022: | | |
| Shares sold | 1,506,192 | $ 17,114,375 |
| Shares issued to shareholders in reinvestment of distributions | 17,547,845 | 152,373,206 |
| Shares redeemed | (10,123,962) | (116,144,225) |
| Net increase (decrease) | 8,930,075 | $ 53,343,356 |
| Year ended December 31, 2021: | | |
| Shares sold | 835,871 | $ 11,596,486 |
| Shares issued to shareholders in reinvestment of distributions | 3,786,093 | 51,434,070 |
| Shares redeemed | (13,659,563) | (186,475,569) |
| Net increase (decrease) | (9,037,599) | $(123,445,013) |
Note 10–Other Matters
As of the date of this report, interest rates in the United States and many parts of the world, including certain European countries, are ascending from historically low levels. Thus, the Allocation Portfolios currently face a heightened level of risk associated with rising interest rates. This could be driven by a variety of factors, including but not limited to central bank monetary policies, changing inflation or real growth rates, general economic conditions, increasing bond issuances or reduced market demand for low yielding investments.
An outbreak of COVID-19, first detected in December 2019, has developed into a global pandemic and has resulted in travel restrictions, closure of international borders, certain businesses and securities markets, restrictions on securities trading activities, prolonged quarantines, supply chain disruptions, and lower consumer demand, as well as general concern and uncertainty. In 2022, many countries lifted some or all restrictions related to COVID-19. However, the continued impact of COVID-19 and related variants is uncertain and could further adversely affect the global economy, national economies, individual issuers and capital markets in unforeseeable ways and result in a substantial and extended economic downturn. Developments that disrupt global economies and financial markets, such as COVID-19, may magnify factors that affect the Allocation Portfolios' performance.
Note 11–Subsequent Events
In connection with the preparation of the financial statements of the Allocation Portfolios as of and for the year ended December 31, 2022, events and transactions subsequent to December 31, 2022, through the date the financial statements were issued have been evaluated by the Manager for possible adjustment and/or disclosure. No subsequent events requiring financial statement adjustment or disclosure have been identified.
| 70 | MainStay VP Asset Allocation Funds |
Report of Independent Registered Public Accounting Firm
To the Board of Trustees of MainStay VP Funds Trust and Shareholders of
MainStay VP Conservative Allocation Portfolio, MainStay VP Moderate Allocation Portfolio, MainStay VP Growth Allocation Portfolio and MainStay VP Equity Allocation Portfolio
Opinions on the Financial Statements
We have audited the accompanying statements of assets and liabilities, including the portfolios of investments, of MainStay VP Conservative Allocation Portfolio, MainStay VP Moderate Allocation Portfolio, MainStay VP Growth Allocation Portfolio and MainStay VP Equity Allocation Portfolio (four of the portfolios constituting MainStay VP Funds Trust, hereafter collectively referred to as the "Portfolios") as of December 31, 2022, the related statements of operations for the year ended December 31, 2022, the statements of changes in net assets for each of the two years in the period ended December 31, 2022, including the related notes, and the financial highlights for each of the five years in the period ended December 31, 2022 (collectively referred to as the “financial statements”). In our opinion, the financial statements present fairly, in all material respects, the financial position of each of the Portfolios as of December 31, 2022, the results of each of their operations for the year then ended, the changes in each of their net assets for each of the two years in the period ended December 31, 2022 and each of the financial highlights for each of the five years in the period ended December 31, 2022 in conformity with accounting principles generally accepted in the United States of America.
Basis for Opinions
These financial statements are the responsibility of the Portfolios’ management. Our responsibility is to express an opinion on the Portfolios’ financial statements based on our audits. We are a public accounting firm registered with the Public Company Accounting Oversight Board (United States) (PCAOB) and are required to be independent with respect to the Portfolios in accordance with the U.S. federal securities laws and the applicable rules and regulations of the Securities and Exchange Commission and the PCAOB.
We conducted our audits of these financial statements in accordance with the standards of the PCAOB. Those standards require that we plan and perform the audit to obtain reasonable assurance about whether the financial statements are free of material misstatement, whether due to error or fraud.
Our audits included performing procedures to assess the risks of material misstatement of the financial statements, whether due to error or fraud, and performing procedures that respond to those risks. Such procedures included examining, on a test basis, evidence regarding the amounts and disclosures in the financial statements. Our audits also included evaluating the accounting principles used and significant estimates made by management, as well as evaluating the overall presentation of the financial statements. Our procedures included confirmation of securities owned as of December 31, 2022 by correspondence with the custodian, transfer agents, and broker. We believe that our audits provide a reasonable basis for our opinions.
/s/PricewaterhouseCoopers LLP
New York, New York
February 24, 2023
We have served as the auditor of one or more investment companies in the MainStay group of funds since 1984.
Board Consideration and Approval of Management Agreement (Unaudited)
The continuation of the Management Agreement with respect to the MainStay VP Conservative Allocation Portfolio, MainStay VP Moderate Allocation Portfolio, MainStay VP Growth Allocation Portfolio and MainStay VP Equity Allocation Portfolio (“Portfolios”) and New York Life Investment Management LLC (“New York Life Investments”) is subject to annual review and approval by the Board of Trustees of MainStay VP Funds Trust (“Board” of the “Trust”) in accordance with Section 15 of the Investment Company Act of 1940, as amended (“1940 Act”). At its December 6–7, 2022 meeting, the Board, which is comprised solely of Trustees who are not an “interested person” (as such term is defined in the 1940 Act) of the Trust (“Independent Trustees”), unanimously approved the continuation of the Management Agreement for a one-year period.
In reaching the decision to approve the continuation of the Management Agreement, the Board considered information and materials furnished by New York Life Investments in connection with an annual contract review process undertaken by the Board that took place at meetings of the Board and its Contracts Committee during October 2022 through December 2022, including information and materials furnished by New York Life Investments in response to requests prepared on behalf of the Board, and in consultation with the Board, by independent legal counsel to the Independent Trustees, which encompassed a variety of topics, including those summarized below. Information and materials requested by and furnished to the Board for consideration in connection with the contract review process included, among other items, reports on each Portfolio and “peer funds” prepared by Institutional Shareholder Services Inc. (“ISS”), an independent third-party service provider engaged by the Board to report objectively on each Portfolio’s investment performance, management fee and total expenses. The Board also considered information on the fees charged to other investment advisory clients of New York Life Investments that follow investment strategies similar to those of each Portfolio, if any, and, when applicable, the rationale for any differences in a Portfolio’s management fee and the fees charged to those other investment advisory clients. In addition, the Board considered information regarding the legal standards and fiduciary obligations applicable to its consideration of the continuation of the Management Agreement. The contract review process, including the structure and format for information and materials provided to the Board, has been developed in consultation with the Board. The Independent Trustees also met in executive sessions with their independent legal counsel and, for portions thereof, with senior management of New York Life Investments.
The Board’s deliberations with respect to the continuation of the Management Agreement reflect a year-long process, and the Board also took into account information furnished to the Board and its Committees throughout the year, as deemed relevant and appropriate by the Trustees, including, among other items, reports on investment performance of each Portfolio and investment-related matters for each Portfolio as well as presentations from New York Life Investments personnel. In addition, the Board took into account other information received from New York Life Investments throughout the year, including, among other items, periodic reports on legal and compliance matters, risk management, portfolio
turnover, brokerage commissions and non-advisory services provided to each Portfolio by New York Life Investments, as deemed relevant and appropriate by the Trustees.
In addition to information provided to the Board throughout the year, the Board received information in connection with its June 2022 meeting provided specifically in response to requests prepared on behalf of the Board, and in consultation with the Board, by independent legal counsel to the Independent Trustees regarding each Portfolio’s distribution arrangements. In addition, the Board received information regarding each Portfolio’s asset levels, share purchase and redemption activity and the payment of Rule 12b-1 and/or other fees by applicable share classes of each Portfolio, among other information.
In considering the continuation of the Management Agreement, the Trustees reviewed and evaluated the information and factors they believed to reasonably be necessary and appropriate in light of legal advice furnished to them by independent legal counsel to the Independent Trustees and through the exercise of their own business judgment. Although individual Trustees may have weighed certain factors or information differently and the Board did not consider any single factor or information controlling in reaching its decision, the factors considered by the Board are summarized in more detail below and include, among other factors: (i) the nature, extent and quality of the services provided to each Portfolio by New York Life Investments; (ii) the qualifications of the portfolio managers of each Portfolio and the historical investment performance of each Portfolio and New York Life Investments; (iii) the costs of the services provided, and profits realized, by New York Life Investments with respect to its relationship with each Portfolio; (iv) the extent to which economies of scale have been realized or may be realized if each Portfolio grows and the extent to which any economies of scale have been shared, have benefited or may benefit each Portfolio’s shareholders; and (v) the reasonableness of each Portfolio’s management fee and total ordinary operating expenses. Although the Board recognized that comparisons between each Portfolio’s fees and expenses and those of other funds are imprecise given different terms of agreements, variations in fund strategies and other factors, the Board considered the reasonableness of each Portfolio’s management fee and total ordinary operating expenses as compared to the peer funds identified by ISS. Throughout their considerations, the Trustees acknowledged the commitment of New York Life Investments and its affiliates to serve the MainStay Group of Funds, as well as their capacity, experience, resources, financial stability and reputations. The Trustees also acknowledged the entrepreneurial and other risks assumed by New York Life Investments in sponsoring and managing each Portfolio.
The Trustees noted that, throughout the year, the Trustees are afforded an opportunity to ask questions of, and request additional information or materials from, New York Life Investments. The Board’s decision with respect to the Management Agreement may have also been based, in part, on the Board’s knowledge of New York Life Investments resulting from, among other things, the Board’s consideration of the Management Agreement in prior years, the advisory agreements for other funds in the MainStay Group of Funds, the Board’s review throughout the year of the
| 72 | MainStay VP Asset Allocation Funds |
performance and operations of other funds in the MainStay Group of Funds and each Trustee’s business judgment and industry experience. In addition to considering the above-referenced factors, the Board observed that in the marketplace, notably under variable life insurance policies and variable annuity contracts for which each Portfolio serves as an investment option, there are a range of investment options available to investors and that each Portfolio’s shareholders, having had the opportunity to consider other investment options, have chosen to invest in the Portfolio.
The factors that figured prominently in the Board’s decision to approve the continuation of the Management Agreement during its December 6–7, 2022 meeting are summarized in more detail below. The Board considered on a Portfolio-by-Portfolio basis the factors and information deemed relevant and appropriate by the Trustees to evaluate the continuation of the Management Agreement, and the Board’s decision was made separately with respect to each Portfolio.
Nature, Extent and Quality of Services Provided by New York Life Investments
The Board examined the nature, extent and quality of the services that New York Life Investments provides to each Portfolio. The Board evaluated New York Life Investments’ experience and capabilities in serving as manager of each Portfolio. The Board noted that New York Life Investments manages other mutual funds, serves a variety of other investment advisory clients, including other pooled investment vehicles, and has experience overseeing mutual fund service providers. The Board considered the experience of senior personnel at New York Life Investments providing management and administrative and other non-advisory services to the Portfolios. The Board observed that New York Life Investments devotes significant resources and time to providing management and administrative and other non-advisory services to the Portfolios.
The Board also considered the range of services that New York Life Investments provides to the Portfolios under the terms of the Management Agreement, including: (i) fund accounting and ongoing supervisory services provided by New York Life Investments’ Fund Administration and Accounting Group; (ii) investment supervisory and analytical services provided by New York Life Investments’ Investment Consulting Group; (iii) compliance services provided by the Trust’s Chief Compliance Officer as well as New York Life Investments’ compliance department, including supervision and implementation of the Portfolios’ compliance program; (iv) legal services provided by New York Life Investments’ Office of the General Counsel; and (v) risk management monitoring and analysis by compliance and investment personnel. In addition, the Board considered New York Life Investments’ willingness to invest in personnel and other resources, such as cyber security, information security and business continuity planning, designed to benefit the Portfolios and noted that New York Life Investments is responsible for compensating the Trust’s officers, except for a portion of the salary of the Trust’s Chief Compliance Officer. The Board recognized that New York Life Investments provides certain other non-advisory services to the Portfolios
and has provided an increasingly broad array of non-advisory services to the MainStay Group of Funds as a result of regulatory and other developments, including in connection with the implementation of the MainStay Group of Funds’ derivatives risk management program and policies and procedures adopted pursuant to Rule 18f-4 under the 1940 Act.
The Board also examined the range, and the nature, extent and quality, of the investment advisory services that New York Life Investments provides to the Portfolios and considered the terms of the Management Agreement. The Board evaluated New York Life Investments’ experience and performance in serving as investment adviser to the Portfolios and advising other portfolios and New York Life Investments’ track record and experience in providing investment advisory services, the experience of investment advisory, senior management and administrative personnel at New York Life Investments. The Board considered New York Life Investments’ overall resources, legal and compliance environment, capabilities, reputation, financial condition and history. In addition to information provided in connection with quarterly meetings with the Trust’s Chief Compliance Officer, the Board considered information regarding the compliance policies and procedures of New York Life Investments and acknowledged New York Life Investments’ commitment to further developing and strengthening compliance programs relating to the Portfolios. The Board also considered New York Life Investments’ ability to recruit and retain qualified investment professionals and willingness to invest in personnel and other resources to service and support each Portfolio. In this regard, the Board considered the qualifications and experience of the Portfolios’ portfolio managers, the number of accounts managed by the portfolio managers and the method for compensating the portfolio managers.
Because the Portfolios invest substantially all their assets in other funds advised by New York Life Investments or its affiliates, the Board considered information from New York Life Investments regarding the investment rationale and process for the allocation among and selection of the underlying funds in which the Portfolios invest.
In addition, the Board considered information provided by New York Life Investments regarding the operations of its business continuity plans in response to the COVID-19 pandemic and the continued remote work environment.
Based on these considerations, among others, the Board concluded that the Portfolios would likely continue to benefit from the nature, extent and quality of these services.
Investment Performance
In evaluating each Portfolio’s investment performance, the Board considered investment performance results over various periods in light of each Portfolio’s investment objective, strategies and risks. The Board considered investment reports on, and analysis of, each Portfolio’s performance provided to the Board throughout the year. These reports include, among other items, information on each Portfolio’s gross and net returns, each Portfolio’s investment performance compared to a relevant
Board Consideration and Approval of Management Agreement (Unaudited) (continued)
investment category and each Portfolio’s benchmarks, each Portfolio’s risk-adjusted investment performance and each Portfolio’s investment performance as compared to peer funds, as appropriate, as well as portfolio attribution information and commentary on the effect of market conditions. The Board also considered information provided by ISS showing the investment performance of each Portfolio as compared to peer funds. In addition, the Board reviewed the methodology used by ISS to construct the group of peer funds for comparative purposes.
The Board also took into account its discussions with senior management at New York Life Investments concerning each Portfolio’s investment performance over various periods as well as discussions between each Portfolio’s portfolio management team and the members of the Board’s Investment Committee, which generally occur on an annual basis. In addition, the Board considered any specific actions that New York Life Investments had taken, or had agreed to take, to seek to enhance Portfolio investment performance and the results of those actions.
Based on these considerations, among others, the Board concluded that its review of each Portfolio’s investment performance and related information supported a determination to approve the continuation of the Management Agreement.
Costs of the Services Provided, and Profits and Other Benefits Realized, by New York Life Investments
The Board considered the costs of the services provided under the Management Agreement. The Board also considered the profits realized by New York Life Investments and its affiliates due to their relationships with the Portfolios as well as the MainStay Group of Funds.
The Board noted that the Portfolios do not pay a management fee for the allocation and other management services provided by New York Life Investments under the Management Agreement but that shareholders of the Portfolios indirectly pay their pro rata share of the fees and expenses of the underlying funds in which the Portfolios invest. The Board considered that the Portfolios’ investments in underlying funds managed by New York Life Investments or its affiliates indirectly benefit New York Life Investments or its affiliates. The Board noted that it considers the profits realized by New York Life Investments and its affiliates with respect to the underlying MainStay Funds as part of the annual contract review process for those funds.
In addition, the Board acknowledged the difficulty in obtaining reliable comparative data about mutual fund managers’ profitability because such information generally is not publicly available and may be impacted by numerous factors, including the structure of a fund manager’s organization, the types of funds it manages, the methodology used to allocate certain fixed costs to specific funds and the manager’s capital structure and costs of capital.
In evaluating the costs of the services provided by New York Life Investments and profits realized by New York Life Investments and its affiliates, the Board considered, among other factors, New York Life Investments’ and its affiliates’ continuing investments in, or willingness to
invest in, personnel and other resources to support and further enhance the management of the Portfolios. The Board also considered the financial resources of New York Life Investments and acknowledged that New York Life Investments must be in a position to recruit and retain experienced professional personnel and to maintain a strong financial position for New York Life Investments to continue to provide high-quality services to the Portfolios. The Board recognized that the Portfolios benefit from the allocation of certain fixed costs among the funds in the MainStay Group of Funds, among other expected benefits resulting from its relationship with New York Life Investments.
The Board considered information regarding New York Life Investments’ methodology for calculating profitability and allocating costs provided by New York Life Investments in connection with the fund profitability analysis presented to the Board. The Board noted it had previously engaged an independent consultant to review the methods used to allocate costs among the funds in the MainStay Group of Funds. The Board also noted that the independent consultant had concluded that New York Life Investments’ methods for allocating costs and procedures for estimating overall profitability of the relationship with the funds in the MainStay Group of Funds are reasonable and that New York Life Investments continued to use the same method of calculating profit and allocating costs since the independent consultant’s review. The Board recognized the difficulty in calculating and evaluating a manager’s profitability with respect to the Portfolios and considered that other profitability methodologies may also be reasonable.
The Board also considered certain fall-out benefits that may be realized by New York Life Investments and its affiliates due to their relationships with the Portfolios, including reputational and other indirect benefits. In addition, the Board considered its review of the management agreement for a money market fund advised by New York Life Investments and an affiliated subadvisor that serves as an investment option for the Portfolios, including the potential rationale for and costs associated with investments in this money market fund by the Portfolios, if any, and considered information from New York Life Investments that the nature and type of specific investment advisory services provided to this money market fund are distinct from, or in addition to, the investment advisory services provided to the Portfolios. In addition, the Board considered the potential dividend received tax deduction for insurance company affiliates of New York Life Investments from each Portfolio’s securities lending activity.
The Board noted that the Portfolios serve as investment options primarily under variable contracts issued by affiliates of New York Life Investments that would receive fees under those contracts. The Board observed that, in addition to fees earned by New York Life Investments under the Management Agreement for managing the Portfolios, New York Life Investments’ affiliates also earn revenues from serving the Portfolios in various other capacities, including as the Portfolios’ distributor. The Board considered information about these other revenues and their impact on the profitability of the relationship with the Portfolios to New York Life Investments and its affiliates. The Board noted that, although it assessed the overall profitability of the relationship with the Portfolios to New York Life Investments and its affiliates as part of the contract review process,
| 74 | MainStay VP Asset Allocation Funds |
when considering the reasonableness of the fee paid to New York Life Investments under the Management Agreement, the Board considered the profitability of New York Life Investments’ relationship with the Portfolios on a pre-tax basis and without regard to distribution expenses incurred by New York Life Investments from its own resources.
After evaluating the information deemed relevant by the Trustees, the Board concluded that any profits realized by New York Life Investments and its affiliates due to their relationships with the Portfolios were not excessive.
Management Fees and Total Ordinary Operating Expenses
The Board evaluated the reasonableness of the fees paid under the Management Agreement and each Portfolio’s total ordinary operating expenses.
In assessing the reasonableness of each Portfolio’s fees and expenses, the Board primarily considered comparative data provided by ISS on the fees and expenses charged by similar mutual funds managed by other investment advisers. The Board reviewed the methodology used by ISS to construct each group of peer funds for comparative purposes. Because the Portfolios do not pay a management fee to New York Life Investments, the Board considered the reasonableness of fees and expenses the Portfolios indirectly pay by investing in underlying funds that charge a management fee. The Board considered New York Life Investments’ process for monitoring and addressing potential conflicts of interest in the selection of underlying funds. In addition, the Board considered information provided by New York Life Investments on fees charged to other investment advisory clients, including institutional separate accounts and/or other funds that follow investment strategies similar to those of each Portfolio, if any. The Board considered the contractual management fee schedules of the Portfolios as compared to those of such other investment advisory clients, taking into account the rationale for any differences in fee schedules. The Board also took into account information provided by New York Life Investments about the more extensive scope of services provided to registered investment companies, such as the Portfolios, as compared with other investment advisory clients. The Board also considered that in proposing fees for each Portfolio, New York Life Investments considers the competitive marketplace for mutual funds.
Because the Portfolios invest substantially all their assets in other funds advised by New York Life Investments or its affiliates, the Board also considered information provided by New York Life Investments regarding the fees and expenses associated with the Portfolios’ investments in other funds, including New York Life Investments’ finding that the applicable Portfolio’s fees and expenses do not duplicate the fees and expenses of the corresponding acquired fund (when required by Rule 12d1-4 under the 1940 Act).
Based on the factors outlined above, among other considerations, the Board concluded that each Portfolio’s management fee and total ordinary operating expenses are within a range that is competitive and support a conclusion that these fees and expenses are reasonable.
Economies of Scale
The Board considered information regarding economies of scale, including whether economies of scale may exist for each Portfolio and whether each Portfolio’s expense structure permits any economies of scale to be appropriately shared with the Portfolio’s beneficial shareholders. The Board also considered a report from New York Life Investments, previously prepared at the request of the Board, that addressed economies of scale, including with respect to the mutual fund business generally, and the various ways in which the benefits of economies of scale may be shared with the funds in the MainStay Group of Funds. Although the Board recognized the difficulty of determining economies of scale with precision, the Board acknowledged that economies of scale may be shared with each Portfolio in a number of ways, including, for example, through the imposition of fee breakpoints, initially setting management fee rates at scale or making additional investments to enhance the services provided to the Portfolio. The Board reviewed information from New York Life Investments showing how each Portfolio’s management fee schedule compared to fee schedules of other funds and accounts managed by New York Life Investments. The Board also reviewed information from ISS showing how each Portfolio’s management fee schedule compared with fees paid for similar services by peer funds at varying asset levels. The Board noted that the Portfolios do not pay a management fee and that the Board separately considers economies of scale as part of its review of the management agreements of underlying MainStay Funds in which the Portfolios invest and the benefit of any breakpoints in the management fee schedules for the underlying MainStay Funds would pass through to shareholders of the Portfolios at the specified levels of underlying MainStay Fund assets.
Based on this information, the Board concluded that economies of scale are appropriately reflected for the benefit of each Portfolio’s beneficial shareholders through each Portfolio’s expense structure and other methods to share benefits from economies of scale.
Conclusion
On the basis of the information and factors summarized above, among other information and factors deemed relevant by the Trustees, and the evaluation thereof, the Board unanimously voted to approve the continuation of the Management Agreement.
Proxy Voting Policies and Procedures and Proxy Voting Record
Each VP Allocation Fund is required to file with the SEC its proxy voting record for the 12-month period ending June 30 on Form N-PX. A description of the policies and procedures that are used to vote proxies relating to portfolio securities of the Fund is available free of charge upon request by calling 800-624-6782 or visiting the SEC's website at www.sec.gov. The most recent Form N-PX or proxy voting record is available free of charge upon request by calling 800-598-2019; visiting https://www.newyorklifeinvestments.com/investment-products/vp; or visiting the SEC’s website at www.sec.gov.
Shareholder Reports and Quarterly Portfolio Disclosure
Each VP Allocation Fund is required to file its complete schedule of portfolio holdings with the SEC 60 days after its first and third fiscal quarter on Form N-PORT. The Allocation Portfolios' holdings report is available free of charge upon request by calling 800-624-6782 or by visiting the SEC’s website at www.sec.gov.
| 76 | MainStay VP Asset Allocation Funds |
Board of Trustees and Officers (Unaudited)
The Trustees and officers of the Portfolio are listed below. The Board oversees the MainStay Group of Funds (which consists of MainStay Funds and MainStay Funds Trust), MainStay VP Funds Trust, MainStay MacKay DefinedTerm Municipal Opportunities Fund, MainStay CBRE Global Infrastructure Megatrends Fund, the Manager and the Subadvisors, and elects the officers of the Portfolios who are responsible for the day-to-day operations of the Portfolio. Information pertaining to the Trustees and officers is set forth below. Each Trustee serves until his or her successor
is elected and qualified or until his or her resignation, death or removal. Under the Board’s retirement policy, unless an exception is made, a Trustee must tender his or her resignation by the end of the calendar year during which he or she reaches the age of 75. The business address of each Trustee and officer listed below is 51 Madison Avenue, New York, New York 10010. None of the Trustees are “interested persons” (as defined by the 1940 Act and rules adopted by the SEC thereunder) of the Portfolio (“Independent Trustees”).
| | Name and
Year of Birth | Term of Office,
Position(s) Held and
Length of Service | Principal Occupation(s)
During Past Five Years | Number of
Portfolios in
Fund Complex
Overseen by
Trustee | Other Directorships
Held by Trustee |
| | | | | | |
| | David H. Chow
1957 | MainStay VP Funds Trust: Trustee since January 2016, Advisory Board Member (June 2015 to December 2015) | Founder and CEO, DanCourt Management, LLC since 1999 | 78 | MainStay Funds: Trustee since January 2016, Advisory Board Member (June 2015 to December 2015) (12 Funds);
MainStay Funds Trust: Trustee since January 2016, Advisory Board Member (June 2015 to December 2015) (33 Funds);
MainStay MacKay DefinedTerm Municipal Opportunities Fund: Trustee since January 2016, Advisory Board Member (June 2015 to December 2015);
MainStay CBRE Global Infrastructure Megatrends Fund: Trustee since June 2021;VanEck Vectors Group of Exchange-Traded Funds: Independent Chairman of the Board of Trustees since 2008 and Trustee since 2006 (57 portfolios); and Berea College of Kentucky: Trustee since 2009, Chair of the Committee since 2018 |
| | Susan B. Kerley
1951 | MainStay VP Funds Trust: Chairman since 2017 and Trustee since 2007* | President, Strategic Management Advisors LLC since 1990 | 78 | MainStay Funds: Chairman since 2017 and Trustee since 2007 (12 Funds); MainStay Funds Trust: Chairman since 2017 and Trustee since 1990 (33 Funds)**;
MainStay MacKay DefinedTerm Municipal Opportunities Fund: Chairman since 2017 and Trustee since 2011; MainStay CBRE Global Infrastructure Megatrends Fund: Trustee since June 2021; and Legg Mason Partners Funds: Trustee since 1991 (45 portfolios) |
| | Alan R. Latshaw
1951 | MainStay VP Funds Trust: Trustee since 2007* | Retired; Partner, Ernst & Young LLP (2002 to 2003); Partner, Arthur Andersen LLP (1989 to 2002); Consultant to the MainStay Funds Audit and Compliance Committee (2004 to 2006) | 78 | MainStay Funds: Trustee since 2006 (12 Funds);
MainStay Funds Trust: Trustee since 2007 (33 Funds)**;
MainStay MacKay DefinedTerm Municipal Opportunities Fund: Trustee since 2011; and
MainStay CBRE Global Infrastructure Megatrends Fund: Trustee since June 2021 |
Board of Trustees and Officers (Unaudited) (continued)
| | Name and
Year of Birth | Term of Office,
Position(s) Held and
Length of Service | Principal Occupation(s)
During Past Five Years | Number of
Portfolios in
Fund Complex
Overseen by
Trustee | Other Directorships
Held by Trustee |
| | | | | | |
| | Karen Hammond
1956 | MainStay VP Funds Trust: Trustee since December 2021, Advisory Board Member (June 2021 to December 2021)
| Retired, Managing Director, Devonshire Investors (2007 to 2013); Senior Vice President, Fidelity Management & Research Co. (2005 to 2007); Senior Vice President and Corporate Treasurer, FMR Corp. (2003 to 2005); Chief Operating Officer, Fidelity Investments Japan (2001 to 2003) | 78 | MainStay Funds: Trustee since December 2021, Advisory Board Member (June 2021 to December 2021) (12 Funds);
MainStay Funds Trust: Trustee since December 2021, Advisory Board Member (June 2021 to December 2021) (33 Funds);
MainStay MacKay DefinedTerm Municipal Opportunities Fund: Trustee since December 2021, Advisory Board Member (June 2021 to December 2021);
MainStay CBRE Global Infrastructure Megatrends Fund: Trustee since December 2021, Advisory Board Member (June 2021 to December 2021);
Two Harbors Investment Corp.: Director since 2018; Rhode Island State Investment Commission: Member since 2017; and Blue Cross Blue Shield of Rhode Island: Director since 2019
|
| | Jacques P. Perold
1958 | MainStay VP Funds Trust: Trustee since January 2016, Advisory Board Member (June 2015 to December 2015) | Founder and Chief Executive Officer, CapShift Advisors LLC (since 2018); President, Fidelity Management & Research Company (2009 to 2014); President and Chief Investment Officer, Geode Capital Management, LLC (2001 to 2009) | 78 | MainStay Funds: Trustee since January 2016, Advisory Board Member (June 2015 to December 2015) (12 Funds);
MainStay Funds Trust: Trustee since January 2016, Advisory Board Member (June 2015 to December 2015) (33 Funds); MainStay MacKay DefinedTerm Municipal Opportunities Fund: Trustee since January 2016, Advisory Board Member (June 2015 to December 2015);
MainStay CBRE Global Infrastructure Megatrends Fund: Trustee since June 2021; Allstate Corporation: Director since 2015;
Partners in Health: Trustee since 2019; and
MSCI Inc.: Director since 2017 |
| | Richard S. Trutanic
1952 | MainStay VP Funds Trust: Trustee since 2007* | Chairman and Chief Executive Officer, Somerset & Company (financial advisory firm) since 2004; Managing Director, The Carlyle Group (private investment firm) (2002 to 2004); Senior Managing Director, Partner and Board Member, Groupe Arnault S.A. (private investment firm) (1999 to 2002)
| 78 | MainStay Funds: Trustee since 1994 (12 Funds);
MainStay Funds Trust: Trustee since 2007 (33 Funds)**;
MainStay MacKay DefinedTerm Municipal Opportunities Fund: Trustee since 2011; and
MainStay CBRE Global Infrastructure Megatrends Fund: Trustee since June 2021 |
| * | Includes prior service as a Director of MainStay VP Series Fund, Inc., the predecessor to MainStay VP Funds Trust. |
| ** | Includes prior service as a Director/Trustee of certain predecessor entities to MainStay Funds Trust. |
| 78 | MainStay VP Asset Allocation Funds |
| | Name and
Year of Birth | Position(s) Held and
Length of Service | Principal Occupation(s)
During Past Five Years | |
| | | | | |
| | Kirk C. Lehneis
1974 | President, MainStay VP Funds Trust (since 2017) | Chief Operating Officer and Senior Managing Director (since 2016), New York Life Investment Management LLC and New York Life Investment Management Holdings LLC; Member of the Board of Managers (since 2017) and Senior Managing Director (since 2018), NYLIFE Distributors LLC; Chairman of the Board and Senior Managing Director, NYLIM Service Company LLC (since 2017); Trustee, President and Principal Executive Officer of IndexIQ Trust, IndexIQ ETF Trust and IndexIQ Active ETF Trust (since January 2018); President, MainStay CBRE Global Infrastructure Megatrends Fund (since 2021), MainStay MacKay DefinedTerm Municipal Opportunities Fund, MainStay Funds and MainStay Funds Trust (since 2017); Senior Managing Director, Global Product Development (from 2015-2016); Managing Director, Product Development (from 2010-2015), New York Life Investment Management LLC | |
| | Jack R. Benintende
1964 | Treasurer and Principal Financial and Accounting Officer, MainStay VP Funds Trust (since 2007)** | Managing Director, New York Life Investment Management LLC (since 2007); Treasurer and Principal Financial and Accounting Officer, MainStay CBRE Global Infrastructure Megatrends Fund (since 2021), MainStay MacKay DefinedTerm Municipal Opportunities Fund (since 2011), MainStay Funds Trust (since 2009) and MainStay Funds (since 2007); and Assistant Treasurer, New York Life Investment Management Holdings LLC (2008 to 2012) | |
| | J. Kevin Gao
1967 | Secretary and Chief Legal Officer, MainStay VP Funds Trust (since 2010)** | Managing Director and Associate General Counsel, New York Life Investment Management LLC (since 2010); Secretary and Chief Legal Officer, MainStay CBRE Global Infrastructure Megatrends Fund (since 2021), MainStay MacKay DefinedTerm Municipal Opportunities Fund (since 2011), MainStay Funds and MainStay Funds Trust (since 2010) | |
| | Scott T. Harrington
1959 | Vice President— Administration, MainStay VP Funds Trust (since 2005)** | Managing Director, New York Life Investment Management LLC (including predecessor advisory organizations) (since 2000); Member of the Board of Directors, New York Life Trust Company (since 2009); Vice President—Administration, MainStay CBRE Global Infrastructure Megatrends Fund (since 2021), MainStay MacKay DefinedTerm Municipal Opportunities Fund (since 2011), MainStay Funds Trust and MainStay Funds (since 2009) | |
| | Kevin M. Gleason
1967 | Vice President and Chief Compliance Officer, MainStay VP Funds Trust (since June 2022) | Vice President and Chief Compliance Officer, IndexIQ, IndexIQ ETF Trust and Index IQ Active ETF Trust (since June 2022); Vice President and Chief Compliance Officer, MainStay CBRE Global Infrastructure Megatrends Fund, MainStay MacKay DefinedTerm Municipal Opportunities Fund (since June 2022); MainStay Funds Trust and MainStay Funds (since June 2022); Senior Vice President, Voya Investment Management and Chief Compliance Officer, Voya Family of Funds (2012-2022) | |
| * | The officers listed above are considered to be “interested persons” of the MainStay Group of Funds, MainStay VP Funds Trust, MainStay CBRE Global Infrastructure Megatrends Fund and MainStay MacKay DefinedTerm Municipal Opportunities Fund within the meaning of the 1940 Act because of their affiliation with the MainStay Group of Funds, New York Life Insurance Company and/or its affiliates, including New York Life Investment Management LLC, NYLIM Service Company LLC, NYLIFE Securities LLC and/or NYLIFE Distributors LLC, as described in detail in the column captioned “Principal Occupation(s) During Past Five Years.” Officers are elected annually by the Board. |
| ** | Includes prior service as an Officer of MainStay VP Series Fund, Inc., the predecessor to MainStay VP Funds Trust. |
Officers of the Trust (Who are not Trustees)*
This page intentionally left blank.
This page intentionally left blank.
This page intentionally left blank.
MainStay VP Portfolios
MainStay VP offers a wide range of Portfolios. The full array of MainStay VP offerings is listed here, with information about the manager, subadvisors, legal counsel, and independent registered public accounting firm.
Equity
MainStay VP American Century Sustainable Equity Portfolio1
MainStay VP Candriam Emerging Markets Equity Portfolio
MainStay VP Epoch U.S. Equity Yield Portfolio
MainStay VP Fidelity Institutional AM® Utilities Portfolio†
MainStay VP MacKay International Equity Portfolio
MainStay VP Natural Resources Portfolio
MainStay VP S&P 500 Index Portfolio2
MainStay VP Small Cap Growth Portfolio
MainStay VP Wellington Growth Portfolio
MainStay VP Wellington Mid Cap Portfolio
MainStay VP Wellington Small Cap Portfolio
MainStay VP Wellington U.S. Equity Portfolio
MainStay VP Winslow Large Cap Growth Portfolio
Mixed Asset
MainStay VP Balanced Portfolio
MainStay VP Income Builder Portfolio
MainStay VP Janus Henderson Balanced Portfolio
MainStay VP MacKay Convertible Portfolio
Income
MainStay VP Bond Portfolio
MainStay VP Floating Rate Portfolio
MainStay VP Indexed Bond Portfolio
MainStay VP MacKay Government Portfolio
MainStay VP MacKay High Yield Corporate Bond Portfolio
MainStay VP MacKay Strategic Bond Portfolio
MainStay VP PIMCO Real Return Portfolio
Money Market
MainStay VP U.S. Government Money Market Portfolio
Alternative
MainStay VP CBRE Global Infrastructure Portfolio
MainStay VP IQ Hedge Multi-Strategy Portfolio
Asset Allocation
MainStay VP Conservative Allocation Portfolio
MainStay VP Equity Allocation Portfolio
MainStay VP Growth Allocation Portfolio
MainStay VP Moderate Allocation Portfolio
Manager
New York Life Investment Management LLC
New York, New York
Subadvisors
American Century Investment Management, Inc.
Kansas City, Missouri
Brown Advisory LLC
Baltimore, Maryland
Candriam*
Strassen, Luxembourg
CBRE Investment Management Listed Real Assets LLC
Radnor, Pennsylvania
Epoch Investment Partners, Inc.
New York, New York
FIAM LLC
Smithfield, Rhode Island
IndexIQ Advisors LLC*
New York, New York
Janus Henderson Investors US LLC
Denver, Colorado
MacKay Shields LLC*
New York, New York
Newton Investment Management North America, LLC
Boston, Massachusetts
NYL Investors LLC*
New York, New York
Pacific Investment Management Company LLC
Newport Beach, California
Segall Bryant & Hamill, LLC
Chicago, Illinois
Wellington Management Company LLP
Boston, Massachusetts
Winslow Capital Management, LLC
Minneapolis, Minnesota
Legal Counsel
Dechert LLP
Washington, District of Columbia
Independent Registered Public Accounting Firm
PricewaterhouseCoopers LLP
New York, New York
Distributor
NYLIFE Distributors LLC*
Jersey City, New Jersey
Custodian
JPMorgan Chase Bank, N.A.
New York, New York
Some Portfolios may not be available in all products.
† Fidelity Institutional AM is a registered trade mark of FMR LLC. Used with permission.
* An affiliate of New York Life Investment Management LLC.
| 1. | Prior to May 1, 2022, the Portfolio's name was MainStay VP T. Rowe Price Equity Income Portfolio. |
| 2. | Prior to May 1, 2022, the Portfolio's name was MainStay VP MacKay S&P 500 Index Portfolio. |
Not part of the Annual Report
2022 Annual Report
This report is for the general information of New York Life Variable Annuities and NYLIAC Variable Universal Life Insurance Products policyowners. It must be preceded or accompanied by the appropriate product(s) and funds prospectuses if it is given to anyone who is not an owner of a New York Life variable annuity policy or a NYLIAC Variable Universal Life Insurance Product. This report does not offer for sale or solicit orders to purchase securities.
The performance data quoted in this report represents past performance. Past performance is no guarantee of future results. Due to market volatility and other factors, current performance may be lower or higher than the figures shown. The most recent month-end performance summary for your variable annuity or variable life policy is available by calling 800-598-2019 and is updated periodically on newyorklife.com.
The New York Life Variable Annuities and NYLIAC Variable Universal Life Insurance Products are issued by New York Life Insurance and Annuity Corporation (a Delaware Corporation) and distributed by NYLIFE Distributors LLC (Member FINRA/SIPC).
New York Life Insurance Company
New York Life Insurance and Annuity
Corporation (NYLIAC) (A Delaware Corporation)
51 Madison Avenue, Room 551
New York, NY 10010
newyorklife.com
newyorklifeinvestments.com
NYLIFE Distributors LLC, 30 Hudson Street, Jersey City, NJ 07302
New York Life Investment Management LLC is the investment manager to the MainStay VP Funds Trust
©2023 by NYLIFE Distributors LLC. All rights reserved.
You may obtain copies of the Prospectus and the Statement of Additional Information free of charge, upon request, by calling toll-free 800-598-2019 or writing to New York Life Insurance and Annuity Corporation, 51 Madison Avenue, New York, NY 10010.
| Not FDIC Insured | No Bank Guarantee | May Lose Value |
(NYLIAC) NI507
MainStay VP PIMCO Real Return Portfolio
Message from the President and Annual Report
December 31, 2022
Sign up for e-delivery of your shareholder reports. For full details on e-delivery, including who can participate and what you can receive via e-delivery,
please log in to newyorklifeinvestments.com/accounts.
| Not FDIC/NCUA Insured | Not a Deposit | May Lose Value | No Bank Guarantee | Not Insured by Any Government Agency |
This page intentionally left blank
Message from the President
The 12-month reporting period ended December 31, 2022, proved exceptionally challenging for investors as both stock and bond markets suffered steep declines. A variety of economic and geopolitical forces drove the market’s losses, all centered around rising inflation and monetary efforts to rein it in.
Inflationary alarms began to sound well before the reporting period began. In late 2021, after nearly two years of accommodative policies designed to encourage economic growth in the face of the COVID-19 pandemic, the U.S. Federal Reserve (the “Fed”) warned of the increasing need to tighten monetary policy. Nevertheless, the pace and persistence of inflation in early 2022 caught most market participants—the Fed included—off guard. Russia’s invasion of Ukraine in February exacerbated global inflationary pressures while increasing investor uncertainty. Domestic supply shortages, international trade imbalances and rising inflation caused U.S. GDP (gross domestic product) to contract in the first and second quarters of the year, although employment and consumer spending proved resilient. Prices for petroleum surged to multi-year highs, while many key agricultural chemicals and industrial metals soared as well. Accelerating inflationary forces prompted the Fed to implement its most aggressive series of interest rate hikes since the 1980s, with a 0.25% increase in March followed by six further rate increases totaling 4.25%. International central banks generally followed suit and raised rates by varying degrees in efforts to curb local inflation, although most increases remained significantly more modest than those in the United States. Relatively high U.S. interest rates and an international risk averse sentiment pushed U.S. dollar values higher compared to most other currencies, with negative impacts on global prices for food, fuel and other key U.S.-dollar-denominated products.
The effects of these interrelated challenges were felt throughout U.S. and international financial markets. The S&P 500® Index, a widely regarded benchmark of market performance, declined by more than 18% during the reporting period. Although the energy sector generated strong gains, bolstered by elevated oil and gas prices, most other industry segments recorded losses. The more cyclical and growth-oriented sectors of consumer discretionary, information technology and real estate delivered the weakest returns, while the traditionally defensive and value-oriented
consumer staples, utilities and health care sectors outperformed. On average, international developed-country equity markets mildly outperformed their U.S. counterparts, while emerging markets lagged slightly. Fixed-income markets proved unusually volatile, with bond prices trending sharply lower as yields rose along with interest rates. Short-term yields rose faster than long-term yields, producing a yield curve inversion from July through the end of the reporting period as long-term rates remained below short-term rates. While floating-rate instruments, which feature variable interest rates that allow investors to benefit from a rising rate environment, provided a degree of insulation from inflation-driven trends, they were not immune to the market’s widespread declines.
Although, according to the most recent estimates, the annualized inflation rate in the United States has declined from a peak of 9.1% in July 2022 to 6.5% in December, the Fed remains focused on achieving more substantial and lasting reductions, aiming for a target rate of 2%. As a result, further rate hikes and additional market volatility are potential headwinds in the coming months. The question remains as to whether the Fed and other central banks will manage a so-called “soft landing,” curbing inflation while avoiding a persistent economic slowdown. If they prove successful, we believe that the increasingly attractive valuations we have observed in both equity and bond markets should eventually translate into sustainable improvements in the investment environment.
Whatever actions the Fed takes and however financial markets react, as a MainStay VP investor you can depend on us to continue managing our portfolios with the insight, expertise and level of service that have long defined New York Life Investments. Thank you for trusting us to help you meet your investment needs.
Sincerely,
Kirk C. Lehneis
President
The opinions expressed are as of the date of this report and are subject to change. There is no guarantee that any forecast made will come to pass. This material does not constitute investment advice and is not intended as an endorsement of any specific investment. Past performance is no guarantee of future results.
Not part of the Annual Report
Investors should refer to the Portfolio’s Summary Prospectus and/or Prospectus and consider the Portfolio’s investment objectives, strategies, risks, charges and expenses carefully before investing. The Summary Prospectus and/or Prospectus contain this and other information about the Portfolio. You may obtain copies of the Portfolio’s Summary Prospectus, Prospectus and Statement of Additional Information, which includes information about the MainStay VP Funds Trust's Trustees, free of charge, upon request, by calling toll-free 800-598-2019, by writing to New York Life Insurance and Annuity Corporation, 51 Madison Avenue, Room 251, New York, New York 10010 or by sending an email to MainStayShareholdersServices@nylim.com. These documents are also available at newyorklifeinvestments.com/investment-products/vp. Please read the Portfolio's Summary Prospectus and/or Prospectus carefully before investing. MainStay VP Funds Trust portfolios are separate account options which are purchased through a variable insurance or variable annuity contract.
Investment and Performance Comparison (Unaudited)
Performance data quoted represents past performance. Past performance is no guarantee of future results. Because of market volatility and other factors, current performance may be lower or higher than the figures shown. Investment return and principal value will fluctuate, and as a result, when shares are redeemed, they may be worth more or less than their original cost. The performance table and graph do not reflect any deduction of sales charges, mortality and expense charges, contract charges or administrative charges. Please refer to the Performance Summary appropriate for your policy. For performance information current to the most recent month-end, please call 800-598-2019 or visit www.newyorklife.com.
Performance figures may reflect certain fee waivers and/or expense limitations, without which total returns may have been different. For information on current fee waivers and/or expense limitations (if any), please refer to the Notes to Financial Statements.
| Average Annual Total Returns for the Year-Ended December 31, 2022 |
| Class | Inception
Date | One
Year | Five
Years | Ten
Years | Gross
Expense
Ratio1 |
| Initial Class Shares | 2/17/2012 | -11.45% | 2.05% | 0.93% | 0.59% |
| Service Class Shares | 2/17/2012 | -11.68 | 1.80 | 0.68 | 0.84 |
| 1. | The gross expense ratios presented reflect the Portfolio’s “Total Annual Portfolio Operating Expenses” from the most recent Prospectus and may differ from other expense ratios disclosed in this report. |
| Benchmark Performance* | One
Year | Five
Years | Ten
Years |
| Bloomberg U.S. TIPS Index1 | -11.85% | 2.11% | 1.12% |
| Morningstar Inflation-Protected Bond Category Average2 | -9.51 | 2.19 | 0.92 |
| * | Returns for indices reflect no deductions for fees, expenses or taxes, except for foreign withholding taxes where applicable. Results assume reinvestment of all dividends and capital gains. An investment cannot be made directly in an index. |
| 1. | The Bloomberg U.S. TIPS Index is the primary benchmark. The Bloomberg U.S. TIPS Index includes all publicly issued U.S. Treasury Inflation-Protected Securities (“TIPS”) that have at least one year remaining to maturity and are rated investment grade. |
| 2. | The Morningstar Inflation-Protected Bond Category Average is representative of funds that invest primarily in debt securities that adjust their principal values in line with the rate of inflation. These bonds can be issued by any organization, but the U.S. Treasury is currently the largest issuer for these types of securities. Results are based on average total returns of similar funds with all dividends and capital gain distributions reinvested. |
Cost in Dollars of a $1,000 Investment in MainStay VP PIMCO Real Return Portfolio (Unaudited)
The example below is intended to describe the fees and expenses borne by shareholders during the six-month period from July 1, 2022 to December 31, 2022, and the impact of those costs on your investment.
Example
As a shareholder of the Portfolio you incur two types of costs: (1) transaction costs, including exchange fees and sales charges (loads) on purchases (as applicable), and (2) ongoing costs, including management fees, distribution and/or service (12b-1) fees and other Portfolio expenses (as applicable). This example is intended to help you understand your ongoing costs (in dollars) of investing in the Portfolio and to compare these costs with the ongoing costs of investing in other mutual funds. The example is based on an investment of $1,000 made at the beginning of the six-month period and held for the entire period from July 1, 2022 to December 31, 2022. Shares are only sold in connection with variable life and annuity contracts and the example does not reflect any contract level or transactional fees or expenses. If these costs had been included, your costs would have been higher.
This example illustrates your Portfolio’s ongoing costs in two ways:
Actual Expenses
The second and third data columns in the table below provide information about actual account values and actual expenses. You may use the information in these columns, together with the amount you invested, to estimate the expenses that you paid during the six months ended
December 31, 2022. Simply divide your account value by $1,000 (for example, an $8,600 account value divided by $1,000 = 8.6), then multiply the result by the number under the heading entitled “Expenses Paid During Period” to estimate the expenses you paid on your account during this period.
Hypothetical Example for Comparison Purposes
The fourth and fifth data columns in the table below provide information about hypothetical account values and hypothetical expenses based on the Portfolio’s actual expense ratio and an assumed rate of return of 5% per year before expenses, which is not the Portfolio’s actual return. The hypothetical account values and expenses may not be used to estimate the actual ending account balances or expenses you paid for the six-month period shown. You may use this information to compare the ongoing costs of investing in the Portfolio with the ongoing costs of investing in other mutual funds. To do so, compare this 5% hypothetical example with the 5% hypothetical examples that appear in the shareholder reports of the other mutual funds.
Please note that the expenses shown in the table are meant to highlight your ongoing costs only and do not reflect any transactional costs, such as exchange fees or sales charges (loads). Therefore, the fourth and fifth data columns of the table are useful in comparing ongoing costs only and will not help you determine the relative total costs of owning different funds. In addition, if these transactional costs were included, your costs would have been higher.
| Share Class | Beginning
Account
Value
7/1/22 | Ending Account
Value (Based
on Actual
Returns and
Expenses)
12/31/22 | Expenses
Paid
During
Period1 | Ending Account
Value (Based
on Hypothetical
5% Annualized
Return and
Actual Expenses)
12/31/22 | Expenses
Paid
During
Period1 | Net Expense
Ratio
During
Period2, 3 |
| Initial Class Shares | $1,000.00 | $971.40 | $3.98 | $1,021.17 | $4.08 | 0.80% |
| Service Class Shares | $1,000.00 | $970.20 | $5.21 | $1,019.91 | $5.35 | 1.05% |
| 1. | Expenses are equal to the Portfolio’s annualized expense ratio of each class multiplied by the average account value over the period, divided by 365 and multiplied by 184 (to reflect the six-month period). The table above represents the actual expenses incurred during the six-month period. In addition to the fees and expenses which the Portfolio bears directly, it also indirectly bears a pro rata share of the fees and expenses of the underlying funds in which it invests. Such indirect expenses are not included in the above-reported expense figures. |
| 2. | Expenses are equal to the Portfolio's annualized expense ratio to reflect the six-month period. |
| 3. | Expenses are inclusive of dividends and interest on investments sold short. |
| 6 | MainStay VP PIMCO Real Return Portfolio |
Portfolio Composition as of December 31, 2022 (Unaudited)
‡ Less than one-tenth of a percent.
See Portfolio of Investments beginning on page 10 for specific holdings within these categories. The Portfolio's holdings are subject to change.
Top Ten Holdings and/or Issuers Held as of December 31, 2022 (excluding short-term investments) (Unaudited)
| 1. | U.S. Treasury Inflation Linked Notes, 0.125%-1.625%, due 4/15/23–7/15/32 |
| 2. | U.S. Treasury Inflation Linked Bonds, 0.125%-3.375%, due 1/15/25–2/15/52 |
| 3. | Italy Buoni Poliennali Del Tesoro, 0.40%-1.40%, due 5/26/25–5/15/30 |
| 4. | UMBS, Single Family, 30 Year, 3.00%-4.00%, due 1/25/53 |
| 5. | Japan Government CPI Linked Bond, (zero coupon)-0.10%, due 3/10/28–3/10/31 |
| 6. | France Government Bond, 0.10%-0.25%, due 7/25/24–7/25/38 |
| 7. | United Kingdom Gilt Inflation Linked, 0.125%-1.25%, due 3/22/24–8/10/41 |
| 8. | Nykredit Realkredit A/S, 0.50%-2.50%, due 10/1/43–10/1/53 |
| 9. | Jyske Realkredit A/S, 0.50%-2.50%, due 10/1/43–10/1/53 |
| 10. | Nordea Kredit Realkreditaktieselskab, 0.50%-2.50%, due 10/1/43–10/1/53 |
Portfolio Management Discussion and Analysis (Unaudited)
Answers to the questions reflect the views of portfolio managers Stephen A. Rodosky and Daniel He of Pacific Investment Management Company LLC, the Portfolio’s Subadvisor.
How did MainStay VP PIMCO Real Return Portfolio perform relative to its benchmark and peers during the 12 months ended December 31, 2022?
For the 12 months ended December 31, 2022, MainStay VP PIMCO Real Return Portfolio returned −11.45% for Initial Class shares and −11.68% for Service Class shares. Over the same period, both share classes outperformed the −11.85% return of the Bloomberg U.S. TIPS Index (“the Index”), which is the Portfolio’s benchmark. For the 12 months ended December 31, 2022, both share classes underperformed the −9.51% return of the Morningstar Inflation-Protected Bond Category Average.1
What factors affected the Portfolio’s relative performance during the reporting period?
The following strategies made positive contributions to the Portfolio’s relative performance during the reporting period (Contributions take weightings and total returns into account.):
• Out-of-Index Eurozone breakeven inflation positioning, as inflation expectations in the region rose,
• Tactical U.S. duration2 positioning, and
• Overweight U.S. breakeven inflation positioning, as inflation expectations rose in the United States.
The following strategies detracted from the Portfolio’s relative performance during the same period:
• Out-of-Index holdings of non-agency mortgage positions, as mortgage spreads3 widened,
• Out-of-Index holdings of U.S. agency mortgage positions, as mortgage spreads widened, and
• Modest yield curve4 steepening positions within Eurozone interest rates, as yield curves flattened.
During the reporting period, how was the Portfolio’s performance materially affected by investments in derivatives?
Derivatives are used in the Portfolio to gain or decrease exposure to securities, markets or sectors; as a substitute for exposure that may not otherwise be accessible using cash bonds; for purposes of liquidity; or to take advantage of anticipated changes in market volatility.
U.S. and Eurozone breakeven inflation positioning, which was in part achieved using swaps, options and futures, contributed positively to the Portfolio’s performance relative to the Index. Exposure to U.S. nominal duration, partially facilitated using futures and options, added to performance. Finally, exposure to
Eurozone nominal duration, also partially facilitated using futures and options, detracted from performance.
What was the Portfolio’s duration strategy during the reporting period?
Relative to the Index, the Portfolio reduced the size of its underweight duration position during the reporting period, still maintaining a slight underweight at the end of the year. More specifically, the Portfolio maintained overweight exposure to real duration (nominal interest rates minus the inflation rate) in the United States. The Portfolio maintained overweight exposure to U.S. breakeven inflation during the reporting period, which contributed positively to relative performance as inflation expectations increased. The Portfolio held underweight exposure to U.K. breakeven inflation throughout the reporting period. The Portfolio’s overall duration decreased over the reporting period, standing at 6.38 years as of December 31, 2022.
What specific factors, risks or market forces prompted significant decisions for the Portfolio during the reporting period?
While not significant, our tendency has been to reduce broader macro risks in the Portfolio given the increase in market volatility experienced throughout 2022. Most key strategies remain intact.
The Portfolio held an underweight duration position overall—mainly sourced in Eurozone and Japanese rates, given their rich levels—and continued to be selective within yield curves and securities depending on prevailing valuations and market dislocations. The Portfolio maintained overweight exposure to U.S. breakevens, given valuations below long-term fair value. The Portfolio held modestly overweight exposure to Italian and Japanese inflation-linked bonds, as they lagged the global recovery and offered asymmetric payoffs.
During the reporting period, which market segments were the strongest positive contributors to the Portfolio’s absolute performance and which market segments were particularly weak?
U.S. currency exposure made the strongest positive contribution to the Portfolio’s absolute performance, as the U.S. dollar strengthened relative to other currencies. Other positive contributors included modest yield curve steepening positions within Eurozone interest rates, as yield curves flattened, and positions in U.S. inflation-linked bonds. Conversely, the most significant detractors from the Portfolio’s absolute performance
| 1. | See page 5 for more information on benchmark and peer group returns. |
| 2. | Duration is a measure of the price sensitivity of a fixed-income investment to changes in interest rates. Duration is expressed as a number of years and is considered a more accurate sensitivity gauge than average maturity. |
| 3. | The terms “spread” and “yield spread” may refer to the difference in yield between a security or type of security and comparable U.S. Treasury issues. The terms may also refer to the difference in yield between two specific securities or types of securities at a given time. |
| 4. | The yield curve is a line that plots the yields of various securities of similar quality—typically U.S. Treasury issues—across a range of maturities. The U.S. Treasury yield curve serves as a benchmark for other debt and is used in economic forecasting. |
| 8 | MainStay VP PIMCO Real Return Portfolio |
included exposure to Danish interest rates, as yields rose, and U.K. breakeven inflation positions, as a result of volatility from pension selling.
Did the Portfolio make any significant purchases or sales during the reporting period?
The Portfolio reduced its overall duration underweight exposure relative to the Index. More specifically, the Portfolio maintained overweight exposure to real duration (nominal interest rates minus the inflation rate) in the United States. The Portfolio maintained overweight exposure to U.S. breakeven inflation, which bolstered relative performance as inflation expectations increased. The Portfolio held underweight exposure to U.K. breakeven inflation for the majority of the reporting period, reducing the extent of its underweight position in the fourth quarter of 2022 as a result of volatility from pension selling.
How was the Portfolio positioned at the end of the reporting period?
As of December 31, 2022, the Portfolio continued to maintain overweight exposure to U.S. breakeven inflation. The Portfolio held underweight exposure to duration overall, and favored U.S. rates over other developed markets. The Portfolio continued to hold out-of-Index exposure to mortgage-backed securities, corporate securities, bonds of non-U.S. developed nations and dollar-denominated, emerging-markets securities.
The opinions expressed are those of the portfolio managers as of the date of this report and are subject to change. There is no guarantee that any forecasts will come to pass. This material does not constitute investment advice and is not intended as an endorsement of any specific investment.
Not all MainStay VP Portfolios and/or share classes are available under all policies.
Portfolio of Investments December 31, 2022†
| | Principal
Amount | Value |
| Long-Term Bonds 109.0% |
| Asset-Backed Securities 9.0% |
| Home Equity Asset-Backed Securities 1.5% |
| Argent Securities Trust | |
| Series 2006-W4, Class A2C | | |
| 4.709% (1 Month LIBOR + 0.32%), due 5/25/36 (a) | $ 287,751 | $ 70,802 |
| Credit Suisse First Boston Mortgage Securities Corp. | |
| Series 2001-HE17, Class A1 | | |
| 4.598% (1 Month LIBOR + 0.62%), due 1/25/32 (a) | 459,202 | 434,045 |
| Credit-Based Asset Servicing and Securitization LLC | |
| Series 2007-CB6, Class A3 | | |
| 4.264% (1 Month LIBOR + 0.22%), due 7/25/37 (a)(b) | 820,633 | 542,323 |
| CWABS Asset-Backed Certificates Trust | |
| Series 2007-8, Class 1A1 | | |
| 4.579% (1 Month LIBOR + 0.19%), due 11/25/37 (a) | 1,349,156 | 1,226,013 |
| First Franklin Mortgage Loan Trust | |
| Series 2006-FF17, Class A2 | | |
| 4.509% (1 Month LIBOR + 0.12%), due 12/25/36 (a) | 407,225 | 337,587 |
| GSAA Home Equity Trust | |
| Series 2006-17, Class A3A | | |
| 4.869% (1 Month LIBOR + 0.48%), due 11/25/36 (a) | 1,000,402 | 365,669 |
| Home Equity Asset Trust | |
| Series 2005-8, Class M2 | | |
| 3.826% (1 Month LIBOR + 0.675%), due 2/25/36 (a) | 220,775 | 211,568 |
| Lehman XS Trust | |
| Series 2007-20N, Class A1 | | |
| 6.689% (1 Month LIBOR + 2.30%), due 12/25/37 (a) | 27,144 | 26,618 |
| Long Beach Mortgage Loan Trust | |
| Series 2006-7, Class 2A2 | | |
| 4.629% (1 Month LIBOR + 0.24%), due 8/25/36 (a) | 226,015 | 94,601 |
| Mastr Asset-Backed Securities Trust | |
| Series 2006-WMC4, Class A5 | | |
| 4.539% (1 Month LIBOR + 0.15%), due 10/25/36 (a) | 112,930 | 36,210 |
| Morgan Stanley ABS Capital I, Inc. Trust | |
| Series 2005-WMC1, Class M3 | | |
| 5.169% (1 Month LIBOR + 0.78%), due 1/25/35 (a) | 121,926 | 116,813 |
| | Principal
Amount | Value |
| |
| Home Equity Asset-Backed Securities (continued) |
| New Century Home Equity Loan Trust | |
| Series 2004-4, Class M1 | | |
| 5.154% (1 Month LIBOR + 0.765%), due 2/25/35 (a) | $ 51,857 | $ 49,397 |
| Option One Mortgage Loan Trust | |
| Series 2006-1, Class M1 | | |
| 4.929% (1 Month LIBOR + 0.54%), due 1/25/36 (a) | 1,200,000 | 1,056,913 |
| Popular ABS Mortgage Pass-Through Trust | |
| Series 2006-A, Class M2 | | |
| 5.259% (1 Month LIBOR + 0.87%), due 2/25/36 (a) | 1,238,000 | 1,107,015 |
| RASC Trust (a) | |
| Series 2006-EMX4, Class A4 | | |
| 4.849% (1 Month LIBOR + 0.23%), due 6/25/36 | 430,637 | 408,677 |
| Series 2005-KS8, Class M4 | | |
| 5.274% (1 Month LIBOR + 0.59%), due 8/25/35 | 11,565 | 11,547 |
| Series 2005-EMX1, Class M2 | | |
| 5.484% (1 Month LIBOR + 1.095%), due 3/25/35 | 631,322 | 609,529 |
| Saxon Asset Securities Trust | |
| Series 2007-3, Class 1A | | |
| 4.699% (1 Month LIBOR + 0.31%), due 9/25/37 (a) | 95,393 | 89,284 |
| Securitized Asset-Backed Receivables LLC Trust (a) | |
| Series 2006-HE2, Class A2C | | |
| 4.689% (1 Month LIBOR + 0.30%), due 7/25/36 | 337,743 | 138,812 |
| Series 2006-HE1, Class A2C | | |
| 4.709% (1 Month LIBOR + 0.32%), due 7/25/36 | 544,519 | 189,997 |
| Soundview Home Loan Trust (a) | |
| Series 2007-OPT2, Class 2A3 | | |
| 4.569% (1 Month LIBOR + 0.18%), due 7/25/37 | 161,964 | 145,379 |
| Series 2007-OPT1, Class 1A1 | | |
| 4.589% (1 Month LIBOR + 0.20%), due 6/25/37 | 265,677 | 190,114 |
| | | 7,458,913 |
| Other Asset-Backed Securities 7.5% |
| ACAS CLO Ltd. | |
| Series 2015-1A, Class AR3 | | |
| 5.084% (3 Month LIBOR + 0.89%), due 10/18/28 (a)(b) | 461,937 | 453,107 |
The notes to the financial statements are an integral part of, and should be read in conjunction with, the financial statements.
| 10 | MainStay VP PIMCO Real Return Portfolio |
| | Principal
Amount | Value |
| Asset-Backed Securities (continued) |
| Other Asset-Backed Securities (continued) |
| Anchorage Capital CLO 6 Ltd. | |
| Series 2015-6A, Class ARR | | |
| 5.129% (3 Month LIBOR + 1.05%), due 7/15/30 (a)(b) | $ 499,970 | $ 493,595 |
| Anchorage Capital CLO 9 Ltd. | |
| Series 2016-9A, Class AR2 | | |
| 5.219% (3 Month LIBOR + 1.14%), due 7/15/32 (a)(b) | 300,000 | 293,453 |
| Anchorage Capital CLO 11 Ltd. | |
| Series 2019-11A, Class AR | | |
| 5.465% (3 Month LIBOR + 1.14%), due 7/22/32 (a)(b) | 300,000 | 293,347 |
| Apidos CLO XXVI | |
| Series 2017-26A, Class A1AR | | |
| 5.094% (3 Month LIBOR + 0.90%), due 7/18/29 (a)(b) | 800,000 | 790,675 |
| ARES European CLO VI DAC | |
| Series 2013-6A, Class ARR | | |
| 1.988% (3 Month EURIBOR + 0.61%), due 4/15/30 (a)(b) | EUR 593,016 | 616,095 |
| ARES European CLO X DAC | |
| Series 10A, Class AR | | |
| 2.158% (3 Month EURIBOR + 0.78%), due 10/15/31 (a)(b) | 1,100,000 | 1,139,487 |
| ARES XL CLO Ltd. | |
| Series 2016-40A, Class A1RR | | |
| 4.949% (3 Month LIBOR + 0.87%), due 1/15/29 (a)(b) | $ 1,050,261 | 1,037,083 |
| Atlas Senior Loan Fund Ltd. | |
| Series 2017-8A, Class A | | |
| 5.229% (3 Month LIBOR + 1.15%), due 1/16/30 (a)(b) | 1,142,800 | 1,125,763 |
| Atlas Static Senior Loan Fund I Ltd. | |
| Series 2022-1A, Class A | | |
| 5.10% (3 Month SOFR + 2.60%), due 7/15/30 (a)(b) | 500,000 | 492,998 |
| Bain Capital Euro CLO DAC | |
| Series 2020-1A, Class A | | |
| 2.602% (3 Month EURIBOR + 1.10%), due 1/24/33 (a)(b) | EUR 500,000 | 521,368 |
| Benefit Street Partners CLO XII Ltd. | |
| Series 2017-12A, Class A1R | | |
| 5.029% (3 Month LIBOR + 0.95%), due 10/15/30 (a)(b) | $ 500,000 | 493,872 |
| | Principal
Amount | Value |
| |
| Other Asset-Backed Securities (continued) |
| Benefit Street Partners CLO XVI Ltd. | |
| Series 2018-16A, Class A1R | | |
| 5.109% (3 Month LIBOR + 1.03%), due 1/17/32 (a)(b) | $ 300,000 | $ 293,699 |
| Black Diamond CLO DAC (a)(b) | |
| Series 2015-1A, Class A1R | | |
| 1.81% (3 Month EURIBOR + 0.65%), due 10/3/29 | EUR 7,433 | 7,938 |
| Series 2017-2A, Class A1 | | |
| 2.316% (3 Month EURIBOR + 0.86%), due 1/20/32 | 964,326 | 1,015,273 |
| BlueMountain Fuji EUR CLO V DAC | |
| Series 5A, Class A | | |
| 0.91% (3 Month EURIBOR + 0.91%), due 1/15/33 (a)(b) | 1,100,000 | 1,131,069 |
| Carlyle Global Market Strategies CLO Ltd. | |
| Series 2013-1A, Class A1RR | | |
| 5.60% (3 Month LIBOR + 0.95%), due 8/14/30 (a)(b) | $ 593,215 | 585,405 |
| Carlyle Global Market Strategies Euro CLO Ltd. | |
| Series 2014-2A, Class AR1 | | |
| 2.548% (3 Month EURIBOR + 0.75%), due 11/15/31 (a)(b) | EUR 1,000,000 | 1,032,332 |
| Carlyle US CLO Ltd. | |
| Series 2017-1A, Class A1R | | |
| 5.243% (3 Month LIBOR + 1.00%), due 4/20/31 (a)(b) | $ 700,000 | 686,690 |
| CIFC Funding Ltd. (a)(b) | |
| Series 2017-4A, Class A1R | | |
| 5.275% (3 Month LIBOR + 0.95%), due 10/24/30 | 400,000 | 394,976 |
| Series 2018-3A, Class A | | |
| 5.294% (3 Month LIBOR + 1.10%), due 7/18/31 | 500,000 | 491,946 |
| Crestline Denali CLO XV Ltd. | |
| Series 2017-1A, Class AR | | |
| 5.273% (3 Month LIBOR + 1.03%), due 4/20/30 (a)(b) | 270,951 | 267,083 |
| Dryden 52 Euro CLO DAC | |
| Series 2017-52A, Class AR | | |
| 1.181% (3 Month EURIBOR + 0.86%), due 5/15/34 (a)(b) | EUR 500,000 | 518,783 |
| Gallatin CLO VIII Ltd. | |
| Series 2017-1A, Class A1R | | |
| 5.169% (3 Month LIBOR + 1.09%), due 7/15/31 (a)(b) | $ 400,000 | 391,890 |
The notes to the financial statements are an integral part of, and should be read in conjunction with, the financial statements.
11
Portfolio of Investments December 31, 2022† (continued)
| | Principal
Amount | Value |
| Asset-Backed Securities (continued) |
| Other Asset-Backed Securities (continued) |
| HalseyPoint CLO 3 Ltd. | |
| Series 2020-3A, Class A1A | | |
| 5.865% (3 Month LIBOR + 1.45%), due 11/30/32 (a)(b) | $ 500,000 | $ 493,326 |
| Invesco Euro CLO I DAC | |
| Series 1A, Class A1R | | |
| 2.028% (3 Month EURIBOR + 0.65%), due 7/15/31 (a)(b) | EUR 500,000 | 518,347 |
| Jubilee CLO DAC | |
| Series 2015-16A, Class A1R | | |
| 2.846% (3 Month EURIBOR + 0.80%), due 12/15/29 (a)(b) | 1,033,926 | 1,093,913 |
| LCM 30 Ltd. | |
| Series 30A, Class AR | | |
| 5.323% (3 Month LIBOR + 1.08%), due 4/20/31 (a)(b) | $ 1,350,000 | 1,318,591 |
| LCM XIII LP | |
| Series 13A, Class AR3 | | |
| 5.097% (3 Month LIBOR + 0.87%), due 7/19/27 (a)(b) | 1,195,637 | 1,182,337 |
| LCM XV LP | |
| Series 15A, Class AR2 | | |
| 5.243% (3 Month LIBOR + 1.00%), due 7/20/30 (a)(b) | 385,265 | 379,426 |
| LCM XXV Ltd. | |
| Series 25A, Class AR | | |
| 5.063% (3 Month SOFR + 1.10%), due 7/20/30 (a)(b) | 1,483,935 | 1,454,149 |
| Madison Park Euro Funding IX DAC | |
| Series 9A, Class AR | | |
| 0.88% (3 Month EURIBOR + 0.88%), due 7/15/35 (a)(b) | EUR 500,000 | 509,380 |
| Madison Park Funding XLI Ltd. | |
| Series 12A, Class AR | | |
| 5.155% (3 Month LIBOR + 0.83%), due 4/22/27 (a)(b) | $ 250,947 | 248,233 |
| Magnetite XVIII Ltd. | |
| Series 2016-18A, Class AR2 | | |
| 5.486% (3 Month LIBOR + 0.88%), due 11/15/28 (a)(b) | 385,903 | 381,101 |
| Man GLG Euro CLO II DAC | |
| Series 2A, Class A1R | | |
| 2.248% (3 Month EURIBOR + 0.87%), due 1/15/30 (a)(b) | EUR 142,909 | 149,971 |
| | Principal
Amount | Value |
| |
| Other Asset-Backed Securities (continued) |
| Marathon CLO V Ltd. | |
| Series 2013-5A, Class A1R | | |
| 5.545% (3 Month LIBOR + 0.87%), due 11/21/27 (a)(b) | $ 27,557 | $ 27,497 |
| MidOcean Credit CLO II | |
| Series 2013-2A, Class ARR | | |
| 5.445% (3 Month LIBOR + 1.03%), due 1/29/30 (a)(b) | 240,516 | 237,277 |
| OCP Euro CLO DAC | |
| Series 2017-2A, Class A | | |
| 2.198% (3 Month EURIBOR + 0.82%), due 1/15/32 (a)(b) | EUR 987,999 | 1,034,283 |
| OSD CLO Ltd. | |
| Series 2021-23A, Class A | | |
| 4.949% (3 Month LIBOR + 0.87%), due 4/17/31 (a)(b) | $ 1,295,133 | 1,269,137 |
| OZLM VIII Ltd. | |
| Series 2014-8A, Class A1R3 | | |
| 5.059% (3 Month LIBOR + 0.98%), due 10/17/29 (a)(b) | 358,625 | 353,097 |
| OZLM XI Ltd. | |
| Series 2015-11A, Class A1R | | |
| 5.665% (3 Month LIBOR + 1.25%), due 10/30/30 (a)(b) | 989,187 | 974,753 |
| OZLM XXIV Ltd. | |
| Series 2019-24A, Class A1AR | | |
| 5.403% (3 Month LIBOR + 1.16%), due 7/20/32 (a)(b) | 200,000 | 194,975 |
| Palmer Square Loan Funding Ltd. (a)(b) | |
| Series 2021-4A, Class A1 | | |
| 4.879% (3 Month LIBOR + 0.80%), due 10/15/29 | 421,565 | 416,149 |
| Series 2021-3A, Class A1 | | |
| 5.043% (3 Month LIBOR + 0.80%), due 7/20/29 | 1,062,624 | 1,047,723 |
| Rad CLO 5 Ltd. | |
| Series 2019-5A, Class AR | | |
| 5.445% (3 Month LIBOR + 1.12%), due 7/24/32 (a)(b) | 1,700,000 | 1,665,538 |
| Romark CLO Ltd. | |
| Series 2017-1A, Class A1R | | |
| 5.355% (3 Month LIBOR + 1.03%), due 10/23/30 (a)(b) | 400,000 | 392,039 |
| Saranac CLO VI Ltd. | |
| Series 2018-6A, Class A1R | | |
| 5.873% (3 Month LIBOR + 1.14%), due 8/13/31 (a)(b) | 300,000 | 293,456 |
The notes to the financial statements are an integral part of, and should be read in conjunction with, the financial statements.
| 12 | MainStay VP PIMCO Real Return Portfolio |
| | Principal
Amount | Value |
| Asset-Backed Securities (continued) |
| Other Asset-Backed Securities (continued) |
| SLM Student Loan Trust | |
| Series 2004-3A, Class A6B | | |
| 4.908% (3 Month LIBOR + 0.55%), due 10/25/64 (a)(b) | $ 338,027 | $ 324,347 |
| Sound Point CLO IX Ltd. | |
| Series 2015-2A, Class ARRR | | |
| 5.453% (3 Month LIBOR + 1.21%), due 7/20/32 (a)(b) | 500,000 | 486,134 |
| Sound Point CLO XIV Ltd. | |
| Series 2016-3A, Class AR2 | | |
| 5.315% (3 Month LIBOR + 0.99%), due 1/23/29 (a)(b) | 623,695 | 618,689 |
| Sound Point CLO XV Ltd. | |
| Series 2017-1A, Class ARR | | |
| 5.225% (3 Month LIBOR + 0.90%), due 1/23/29 (a)(b) | 821,393 | 810,876 |
| Symphony CLO XIV Ltd. | |
| Series 2014-14A, Class AR | | |
| 4.961% (3 Month LIBOR + 0.95%), due 7/14/26 (a)(b) | 11,340 | 11,335 |
| THL Credit Wind River CLO Ltd. | |
| Series 2019-3A, Class AR | | |
| 5.159% (3 Month LIBOR + 1.08%), due 4/15/31 (a)(b) | 300,000 | 291,967 |
| Toro European CLO DAC (a)(b) | |
| Series 5A, Class A | | |
| 2.118% (3 Month EURIBOR + 0.74%), due 10/15/30 | EUR 499,729 | 521,064 |
| Series 5A, Class ANV | | |
| 2.118% (3 Month EURIBOR + 0.74%), due 10/15/30 | 699,621 | 729,489 |
| Venture 36 CLO Ltd. | |
| Series 2019-36A, Class A1AR | | |
| 5.373% (3 Month LIBOR + 1.13%), due 4/20/32 (a)(b) | $ 600,000 | 581,365 |
| Venture XXI CLO Ltd. | |
| Series 2015-21A, Class AR | | |
| 4.959% (3 Month LIBOR + 0.88%), due 7/15/27 (a)(b) | 84,708 | 84,645 |
| Venture XXIV CLO Ltd. | |
| Series 2016-24A, Class ARR | | |
| 5.143% (3 Month LIBOR + 0.90%), due 10/20/28 (a)(b) | 335,515 | 330,841 |
| Venture XXV CLO Ltd. | |
| Series 2016-25A, Class ARR | | |
| 5.263% (3 Month LIBOR + 1.02%), due 4/20/29 (a)(b) | 323,400 | 319,761 |
| | Principal
Amount | Value |
| |
| Other Asset-Backed Securities (continued) |
| Vibrant CLO VI Ltd. | |
| Series 2017-6A, Class AR | | |
| 5.696% (3 Month LIBOR + 0.95%), due 6/20/29 (a)(b) | $ 600,383 | $ 592,258 |
| Vibrant CLO XI Ltd. | |
| Series 2019-11A, Class A1R1 | | |
| 5.363% (3 Month LIBOR + 1.12%), due 7/20/32 (a)(b) | 400,000 | 389,335 |
| Voya CLO | |
| Series 2017-2A, Class A1R | | |
| 5.059% (3 Month LIBOR + 0.98%), due 6/7/30 (a)(b) | 288,273 | 284,484 |
| Wellfleet CLO Ltd. | |
| Series 2015-1A, Class AR4 | | |
| 5.133% (3 Month LIBOR + 0.89%), due 7/20/29 (a)(b) | 436,877 | 431,301 |
| | | 37,010,516 |
Total Asset-Backed Securities
(Cost $46,544,150) | | 44,469,429 |
| Corporate Bonds 3.5% |
| Banks 1.9% |
| Banco Bilbao Vizcaya Argentaria SA | | |
| Series Reg S | | |
| 5.875% (EUR 5 Year Interest Swap Rate + 5.66%), due 9/24/23 (a)(c) | EUR 400,000 | 410,838 |
| Bank of America Corp. | | |
| Series FF | | |
| 5.875%, due 3/15/28 (c)(d) | $ 190,000 | 167,325 |
| Lloyds Banking Group plc | | |
| Series Reg S | | |
| 4.947% (5 Year EURIBOR ICE Swap Rate + 5.29%), due 6/27/25 (a)(c) | EUR 200,000 | 204,491 |
| NatWest Group plc | | |
| 4.519%, due 6/25/24 (d) | $ 200,000 | 198,141 |
| 6.274% (3 Month LIBOR + 1.55%), due 6/25/24 (a) | 300,000 | 300,076 |
| Nykredit Realkredit A/S | | |
| Series Reg S | | |
| 0.50%, due 10/1/43 | DKK 12,192,722 | 1,324,705 |
| Series Reg S | | |
| 1.00%, due 10/1/50 | 33,061,167 | 3,500,387 |
| Series Reg S | | |
| 1.00%, due 10/1/53 | 497,710 | 48,791 |
The notes to the financial statements are an integral part of, and should be read in conjunction with, the financial statements.
13
Portfolio of Investments December 31, 2022† (continued)
| | Principal
Amount | Value |
| Corporate Bonds (continued) |
| Banks (continued) |
| Nykredit Realkredit A/S (continued) | | |
| Series Reg S | | |
| 1.00%, due 10/1/53 | DKK 2,033,038 | $ 212,689 |
| Series Reg S | | |
| 1.50%, due 10/1/53 | 321,669 | 33,710 |
| Series Reg S | | |
| 1.50%, due 10/1/53 | 10,612,802 | 1,174,439 |
| Series Reg S | | |
| 1.50%, due 10/1/53 | 99,824 | 9,890 |
| Series Reg S | | |
| 2.00%, due 10/1/53 | 299,540 | 32,717 |
| Series Reg S | | |
| 2.00%, due 10/1/53 | 496,929 | 56,672 |
| Series Reg S | | |
| 2.50%, due 10/1/47 | 1,660 | 212 |
| UniCredit SpA | | |
| 7.83%, due 12/4/23 (b) | $ 1,800,000 | 1,808,438 |
| | | 9,483,521 |
| Commercial Services 0.0% ‡ |
| RELX Capital, Inc. | | |
| 3.50%, due 3/16/23 | 100,000 | 99,596 |
| Distribution & Wholesale 0.1% |
| Toyota Tsusho Corp. | | |
| Series Reg S | | |
| 3.625%, due 9/13/23 | 200,000 | 197,628 |
| Diversified Financial Services 1.5% |
| Avolon Holdings Funding Ltd. | | |
| 2.528%, due 11/18/27 (b) | 66,000 | 52,753 |
| Jyske Realkredit A/S | | |
| Series CCE | | |
| 0.50%, due 10/1/43 | DKK 2,387,004 | 260,372 |
| Series Reg S | | |
| 1.00%, due 10/1/50 | 15,823,835 | 1,675,366 |
| Series CCE | | |
| 1.00%, due 10/1/53 | 3,916,546 | 384,291 |
| Series CCE | | |
| 1.50%, due 10/1/53 | 1,658,705 | 183,855 |
| Series CCE | | |
| 1.50%, due 10/1/53 | 1,987,944 | 207,542 |
| Series 111E | | |
| 2.50%, due 10/1/47 | 4,344 | 554 |
| | Principal
Amount | Value |
| |
| Diversified Financial Services (continued) |
| Nordea Kredit Realkreditaktieselskab | | |
| Series CC2 | | |
| 0.50%, due 10/1/43 | DKK 912,743 | $ 100,343 |
| Series Reg S | | |
| 1.00%, due 10/1/50 | 10,992,739 | 1,165,767 |
| Series CC2 | | |
| 1.00%, due 10/1/53 | 193,793 | 20,309 |
| 1.50%, due 10/1/53 | 10,599,525 | 1,106,597 |
| Series CC2 | | |
| 1.50%, due 10/1/53 | 35,157 | 3,894 |
| 1.50%, due 10/1/53 | 500,000 | 49,573 |
| Series Reg S | | |
| 2.00%, due 10/1/53 (b) | 399,803 | 45,826 |
| Series CC2 | | |
| 2.50%, due 10/1/47 | 1,916 | 244 |
| Realkredit Danmark A/S | | |
| Series Reg S | | |
| 1.00%, due 10/1/50 | 15,856,157 | 1,676,505 |
| Series Reg S | | |
| 1.00%, due 10/1/53 | 5,968 | 585 |
| Series Reg S | | |
| 1.00%, due 10/1/53 | 1,453,029 | 152,168 |
| Series Reg S | | |
| 1.50%, due 10/1/53 | 821,573 | 90,947 |
| Series Reg S | | |
| 1.50%, due 10/1/53 | 1,493,926 | 155,967 |
| Series Reg S | | |
| 2.00%, due 10/1/53 | 1,695,958 | 185,482 |
| Series Reg S | | |
| 2.50%, due 4/1/47 | 8,770 | 1,122 |
| | | 7,520,062 |
| Home Builders 0.0% ‡ |
| DR Horton, Inc. | | |
| 5.75%, due 8/15/23 | $ 100,000 | 100,320 |
| Pharmaceuticals 0.0% ‡ |
| Cigna Corp. | | |
| 3.75%, due 7/15/23 | 73,000 | 72,518 |
Total Corporate Bonds
(Cost $23,488,069) | | 17,473,645 |
| Foreign Government Bonds 8.9% |
| Australia 0.3% |
| Australia Government Bond | | |
| Series Reg S | | |
| 3.00%, due 9/20/25 (e) | AUD 1,998,100 | 1,457,100 |
The notes to the financial statements are an integral part of, and should be read in conjunction with, the financial statements.
| 14 | MainStay VP PIMCO Real Return Portfolio |
| | Principal
Amount | Value |
| Foreign Government Bonds (continued) |
| Canada 0.2% |
| Canadian Government Real Return Bond | | |
| 4.25%, due 12/1/26 (e) | CAD 1,050,720 | $ 855,879 |
| France 1.6% |
| France Government Bond (e) | | |
| Series Reg S | | |
| 0.10%, due 3/1/26 (b) | EUR 3,561,776 | 3,778,023 |
| Series Reg S | | |
| 0.10%, due 7/25/31 (b) | 805,518 | 828,331 |
| Series Reg S | | |
| 0.10%, due 7/25/38 (b) | 1,581,804 | 1,531,355 |
| Series Reg S | | |
| 0.25%, due 7/25/24 | 1,592,071 | 1,717,576 |
| | | 7,855,285 |
| Italy 3.0% |
| Italy Buoni Poliennali Del Tesoro (b)(e) | | |
| Series Reg S | | |
| 0.40%, due 5/15/30 | 2,683,571 | 2,513,952 |
| Series Reg S | | |
| 1.40%, due 5/26/25 | 11,855,925 | 12,539,668 |
| | | 15,053,620 |
| Japan 1.7% |
| Japan Government CPI Linked Bond (e) | | |
| (zero coupon), due 3/10/31 | JPY 81,749,600 | 646,883 |
| 0.10%, due 3/10/28 | 203,484,600 | 1,608,620 |
| 0.10%, due 3/10/28 | 239,454,100 | 1,892,972 |
| 0.10%, due 3/10/29 | 172,432,390 | 1,364,455 |
| 0.10%, due 3/10/29 | 369,352,220 | 2,922,678 |
| | | 8,435,608 |
| New Zealand 0.4% |
| New Zealand Government Inflation Linked Bond (e) | | |
| Series Reg S | | |
| 2.00%, due 9/20/25 | NZD 1,735,720 | 1,114,180 |
| Series Reg S | | |
| 2.50%, due 9/20/35 | 968,080 | 626,181 |
| Series Reg S | | |
| 3.00%, due 9/20/30 | 614,500 | 415,696 |
| | | 2,156,057 |
| | Principal
Amount | Value |
| |
| Peru 0.2% |
| Peru Government Bond | | |
| 5.94%, due 2/12/29 | PEN 1,300,000 | $ 313,590 |
| 6.15%, due 8/12/32 | 2,100,000 | 485,338 |
| | | 798,928 |
| Qatar 0.1% |
| Qatar Government Bond | | |
| Series Reg S | | |
| 3.875%, due 4/23/23 | $ 300,000 | 298,350 |
| United Kingdom 1.4% |
| United Kingdom Gilt Inflation Linked (e) | | |
| Series Reg S | | |
| 0.125%, due 3/22/24 | GBP 3,820,310 | 4,689,228 |
| Series Reg S | | |
| 0.125%, due 8/10/41 | 1,271,890 | 1,440,576 |
| Series Reg S | | |
| 1.25%, due 11/22/27 | 578,167 | 737,194 |
| | | 6,866,998 |
Total Foreign Government Bonds
(Cost $48,594,824) | | 43,777,825 |
| Mortgage-Backed Securities 4.8% |
| Agency (Collateralized Mortgage Obligations) 3.3% |
| FHLMC (a) | |
| REMIC, Series 4779, Class WF | | |
| 3.206% (1 Month LIBOR + 0.35%), due 7/15/44 | $ 156,488 | 154,188 |
| REMIC, Series 4694, Class FA | | |
| 4.718% (1 Month LIBOR + 0.40%), due 6/15/47 | 883,843 | 848,444 |
| FHLMC, Strips | |
| REMIC, Series 278, Class F1 | | |
| 4.768% (1 Month LIBOR + 0.45%), due 9/15/42 (a) | 156,670 | 153,850 |
| GNMA (a) | |
| REMIC, Series 2017-H10, Class FB | | |
| 1.968% (12 Month LIBOR + 0.75%), due 4/20/67 | 208,134 | 205,972 |
| REMIC, Series 2018-H15, Class FG | | |
| 3.858% (12 Month LIBOR + 0.15%), due 8/20/68 | 342,773 | 333,006 |
| UMBS, Single Family, 30 Year (f) | |
| 3.00%, due 1/25/53 TBA | 6,000,000 | 5,264,216 |
| 4.00%, due 1/25/53 TBA | 10,000,000 | 9,376,599 |
| | | 16,336,275 |
The notes to the financial statements are an integral part of, and should be read in conjunction with, the financial statements.
15
Portfolio of Investments December 31, 2022† (continued)
| | Principal
Amount | Value |
| Mortgage-Backed Securities (continued) |
| Collateralized Debt Obligations (Commercial Real Estate Collateralized Debt Obligations) 0.4% |
| Arbor Realty Commercial Real Estate Notes Ltd. | |
| Series 2022-FL1, Class A | | |
| 5.257% (SOFR 30A + 1.45%), due 1/15/37 (a)(b) | $ 1,400,000 | $ 1,355,242 |
| LoanCore Issuer Ltd. | |
| Series 2022-CRE7, Class A | | |
| 5.358% (SOFR 30A + 1.55%), due 1/17/37 (a)(b) | 600,000 | 578,222 |
| | | 1,933,464 |
| Commercial Mortgage Loans (Collateralized Mortgage Obligation) 0.3% |
| GS Mortgage Securities Corp. II | |
| Series 2022-GTWY, Class A | | |
| 7.736% (1 Month SOFR + 3.40%), due 8/15/39 (a)(b) | 1,300,000 | 1,307,911 |
| Whole Loan (Collateralized Mortgage Obligations) 0.8% |
| Alternative Loan Trust | |
| Series 2005-29CB, Class A4 | | |
| 5.00%, due 7/25/35 | 28,050 | 16,946 |
| Series 2007-1T1, Class 1A1 | | |
| 6.00%, due 3/25/37 | 525,904 | 207,209 |
| CHL Mortgage Pass-Through Trust | |
| Series 2007-1, Class A1 | | |
| 6.00%, due 3/25/37 | 25,558 | 12,814 |
| Citigroup Mortgage Loan Trust, Inc. | |
| Series 2007-AR4, Class 1A1A | | |
| 3.463%, due 3/25/37 (g) | 168,353 | 146,197 |
| Series 2004-NCM2, Class 1CB1 | | |
| 5.50%, due 8/25/34 | 137,383 | 125,942 |
| Eurosail-UK plc (a) | |
| Series 2007-3A, Class A3C | | |
| 4.502% (SONIA3M IR + 1.069%), due 6/13/45 (b) | GBP 24,967 | 29,838 |
| Series 2007-3X, Class A3A | | |
| 4.502% (SONIA3M IR + 1.069%), due 6/13/45 | 93,640 | 111,916 |
| Series 2007-3X, Class A3C | | |
| 4.502% (SONIA3M IR + 1.069%), due 6/13/45 | 24,967 | 29,838 |
| GreenPoint Mortgage Funding Trust | |
| Series 2006-AR4, Class A6A | | |
| 4.749% (1 Month LIBOR + 0.36%), due 9/25/46 (a) | $ 62,457 | 54,305 |
| | Principal
Amount | Value |
| |
| Whole Loan (Collateralized Mortgage Obligations) (continued) |
| IndyMac INDX Mortgage Loan Trust (a) | |
| Series 2005-AR12, Class 2A1A | | |
| 4.869% (1 Month LIBOR + 0.48%), due 7/25/35 | $ 94,191 | $ 86,463 |
| Series 2005-AR14, Class 1A1A | | |
| 4.949% (1 Month LIBOR + 0.56%), due 7/25/35 | 688,987 | 495,927 |
| Merrill Lynch Mortgage Investors Trust | |
| Series 2005-A4, Class 1A | | |
| 3.54%, due 7/25/35 (g) | 143,392 | 76,858 |
| New Residential Mortgage Loan Trust (b)(h) | |
| Series 2019-RPL3, Class A1 | | |
| 2.75%, due 7/25/59 | 202,867 | 188,489 |
| Series 2018-3A, Class A1 | | |
| 4.50%, due 5/25/58 | 117,034 | 109,826 |
| OBX Trust | |
| Series 2018-1, Class A2 | | |
| 5.039% (1 Month LIBOR + 0.65%), due 6/25/57 (a)(b) | 26,217 | 24,656 |
| Opteum Mortgage Acceptance Corp. Asset-Backed Pass-Through Certificates | |
| Series 2005-2, Class M7 | | |
| 6.189% (1 Month LIBOR + 1.80%), due 4/25/35 (a) | 100,000 | 93,997 |
| RALI Trust | |
| Series 2006-QH1, Class A1 | | |
| 4.769% (1 Month LIBOR + 0.38%), due 12/25/36 (a) | 776,494 | 655,947 |
| Residential Asset Securitization Trust | |
| Series 2006-A10, Class A5 | | |
| 6.50%, due 9/25/36 | 218,201 | 83,156 |
| Residential Mortgage Securities 32 plc | |
| Series 32A, Class A | | |
| 4.681% (SONIA3M IR + 1.25%), due 6/20/70 (a)(b) | GBP 131,534 | 157,985 |
| Thornburg Mortgage Securities Trust | |
| Series 2004-2, Class A1 | | |
| 5.009% (1 Month LIBOR + 0.62%), due 6/25/44 (a) | $ 434,332 | 388,248 |
| Towd Point Mortgage Funding Granite 4 plc | |
| Series 2019-GR4A, Class A1 | | |
| 4.59% (SONIA3M IR + 1.144%), due 10/20/51 (a)(b) | GBP 587,347 | 707,860 |
| Washington Mutual Mortgage Pass-Through Certificates WMALT Trust | |
| Series 2007-HY1, Class A2A | | |
| 4.709% (1 Month LIBOR + 0.32%), due 2/25/37 (a) | $ 380,185 | 310,521 |
The notes to the financial statements are an integral part of, and should be read in conjunction with, the financial statements.
| 16 | MainStay VP PIMCO Real Return Portfolio |
| | Principal
Amount | Value |
| Mortgage-Backed Securities (continued) |
| Whole Loan (Collateralized Mortgage Obligations) (continued) |
| Washington Mutual Mortgage Pass-Through Certificates WMALT Trust (continued) | |
| Series 2006-5, Class 2CB1 | | |
| 6.00%, due 7/25/36 | $ 33,259 | $ 22,623 |
| | | 4,137,561 |
Total Mortgage-Backed Securities
(Cost $24,783,387) | | 23,715,211 |
| U.S. Government & Federal Agencies 82.8% |
| Federal Home Loan Mortgage Corporation (Mortgage Pass-Through Securities) 0.1% |
| UMBS Pool, 30 Year | | |
| 2.00%, due 3/1/52 | 191,760 | 156,139 |
| 3.00%, due 1/1/52 | 395,137 | 347,108 |
| | | 503,247 |
| Federal National Mortgage Association (Mortgage Pass-Through Securities) 0.3% |
| FNMA (a) | | |
| 3.248% (12 Month Monthly Treasury Average Index + 1.199%), due 6/1/43 | 121,125 | 115,231 |
| 4.018% (11th District Cost of Funds Index + 1.929%), due 12/1/36 | 67,146 | 67,007 |
| 4.379% (1 Year Treasury Constant Maturity Rate + 2.36%), due 11/1/34 | 146,323 | 149,624 |
| UMBS, 30 Year | | |
| 3.50%, due 7/1/52 | 294,178 | 267,382 |
| 4.00%, due 8/1/52 | 469,539 | 440,446 |
| 4.50%, due 7/1/52 | 595,300 | 573,055 |
| | | 1,612,745 |
| United States Treasury Inflation - Indexed Notes 82.4% |
| U.S. Treasury Inflation Linked Bonds (e) | | |
| 0.125%, due 2/15/51 | 5,620,232 | 3,615,223 |
| 0.125%, due 2/15/52 (i) | 1,926,972 | 1,246,377 |
| 0.25%, due 2/15/50 (i) | 3,454,267 | 2,326,711 |
| 0.625%, due 2/15/43 (i) | 2,307,254 | 1,860,073 |
| 0.75%, due 2/15/42 | 6,897,690 | 5,769,274 |
| 0.75%, due 2/15/45 | 9,795,280 | 7,914,888 |
| 0.875%, due 2/15/47 | 14,620,776 | 11,974,810 |
| 1.00%, due 2/15/46 | 7,533,803 | 6,392,761 |
| 1.00%, due 2/15/48 | 3,030,918 | 2,548,541 |
| 1.00%, due 2/15/49 | 3,612,115 | 3,016,089 |
| | Principal
Amount | Value |
| |
| United States Treasury Inflation - Indexed Notes (continued) |
U.S. Treasury Inflation Linked Bonds (e)
(continued) | | |
| 1.375%, due 2/15/44 | $ 14,820,133 | $ 13,752,386 |
| 1.75%, due 1/15/28 | 16,535,372 | 16,523,926 |
| 2.00%, due 1/15/26 | 6,963,911 | 6,955,132 |
| 2.125%, due 2/15/40 | 4,770,613 | 5,046,698 |
| 2.125%, due 2/15/41 | 7,525,445 | 7,966,723 |
| 2.375%, due 1/15/25 | 14,371,199 | 14,382,734 |
| 2.375%, due 1/15/27 (i) | 29,555 | 30,146 |
| 2.50%, due 1/15/29 | 7,259,449 | 7,568,629 |
| 3.375%, due 4/15/32 (i) | 549,013 | 628,383 |
| U.S. Treasury Inflation Linked Notes (e) | | |
| 0.125%, due 10/15/24 | 8,363,160 | 8,053,715 |
| 0.125%, due 4/15/25 | 3,230,472 | 3,078,620 |
| 0.125%, due 10/15/25 (i) | 9,992,298 | 9,496,061 |
| 0.125%, due 4/15/26 (i) | 4,829,530 | 4,540,306 |
| 0.125%, due 7/15/26 | 10,704,469 | 10,086,539 |
| 0.125%, due 10/15/26 (j) | 2,508,357 | 2,351,112 |
| 0.125%, due 4/15/27 | 4,327,468 | 4,032,771 |
| 0.125%, due 1/15/30 | 19,992,258 | 17,957,484 |
| 0.125%, due 7/15/30 | 17,458,197 | 15,630,986 |
| 0.125%, due 1/15/31 | 20,194,448 | 17,933,887 |
| 0.125%, due 7/15/31 | 11,007,810 | 9,726,091 |
| 0.125%, due 1/15/32 | 25,156,638 | 22,034,008 |
| 0.25%, due 1/15/25 | 7,045,976 | 6,758,626 |
| 0.25%, due 7/15/29 | 19,852,452 | 18,173,890 |
| 0.375%, due 7/15/23 | 3,498,517 | 3,456,972 |
| 0.375%, due 1/15/27 | 4,169,906 | 3,932,096 |
| 0.375%, due 7/15/27 (i) | 2,582,732 | 2,434,035 |
| 0.50%, due 4/15/24 (j) | 25,073,764 | 24,382,562 |
| 0.50%, due 1/15/28 | 18,861,794 | 17,736,355 |
| 0.625%, due 4/15/23 | 18,164,518 | 17,978,970 |
| 0.625%, due 1/15/24 | 12,166,702 | 11,908,220 |
| 0.625%, due 1/15/26 | 5,305,266 | 5,092,425 |
| 0.625%, due 7/15/32 (j) | 15,282,781 | 13,997,754 |
| 0.75%, due 7/15/28 | 19,007,392 | 18,105,318 |
| 0.875%, due 1/15/29 | 13,560,823 | 12,918,773 |
| 1.625%, due 10/15/27 (i) | 5,734,314 | 5,727,590 |
| | | 407,044,670 |
Total U.S. Government & Federal Agencies
(Cost $455,564,090) | | 409,160,662 |
Total Long-Term Bonds
(Cost $598,974,520) | | 538,596,772 |
| |
The notes to the financial statements are an integral part of, and should be read in conjunction with, the financial statements.
17
Portfolio of Investments December 31, 2022† (continued)
| | Shares | | Value |
| Short-Term Investment 0.9% |
| Affiliated Investment Company 0.9% |
| MainStay U.S. Government Liquidity Fund, 3.602% (k) | ��4,225,813 | | $ 4,225,813 |
Total Short-Term Investment
(Cost $4,225,813) | | | 4,225,813 |
Total Investments Excluding Purchased Options
(Cost $603,200,333) | 109.9% | | 542,822,585 |
Total Purchased Options
(Cost $236,357) | 0.0%‡ | | 17,701 |
Total Investments
(Cost $603,436,690) | 109.9% | | 542,840,286 |
| Other Assets, Less Liabilities | (9.9) | | (48,947,843) |
| Net Assets | 100.0% | | $ 493,892,443 |
| † | Percentages indicated are based on Portfolio net assets. |
| ‡ | Less than one-tenth of a percent. |
| (a) | Floating rate—Rate shown was the rate in effect as of December 31, 2022. |
| (b) | May be sold to institutional investors only under Rule 144A or securities offered pursuant to Section 4(a)(2) of the Securities Act of 1933, as amended. |
| (c) | Security is perpetual and, thus, does not have a predetermined maturity date. The date shown, if applicable, reflects the next call date. |
| (d) | Fixed to floating rate—Rate shown was the rate in effect as of December 31, 2022. |
| (e) | Treasury Inflation Protected Security—Pays a fixed rate of interest on a principal amount that is continuously adjusted for inflation based on the Consumer Price Index-Urban Consumers. |
| (f) | TBA—Security purchased on a forward commitment basis with an approximate principal amount and maturity date. The actual principal amount and maturity date will be determined upon settlement. As of December 31, 2022, the total net market value was $14,640,815, which represented 3% of the Portfolio’s net assets. All or a portion of this security is a part of a mortgage dollar roll agreement. |
| (g) | Collateral strip rate—A bond whose interest was based on the weighted net interest rate of the collateral. The coupon rate adjusts periodically based on a predetermined schedule. Rate shown was the rate in effect as of December 31, 2022. |
| (h) | Coupon rate may change based on changes of the underlying collateral or prepayments of principal. Rate shown was the rate in effect as of December 31, 2022. |
| (i) | Security, or a portion thereof, was maintained in a segregated account at the Portfolio’s custodian as collateral for future, swap and foreign currency forward contracts. |
| (j) | Delayed delivery security. |
| (k) | Current yield as of December 31, 2022. |
Investments in Affiliates (in 000's)
Investments in issuers considered to be affiliate(s) of the Portfolio during the year ended December 31, 2022 for purposes of Section 2(a)(3) of the Investment Company Act of 1940, as amended, were as follows:
| Affiliated Investment Companies | Value,
Beginning
of Year | Purchases
at Cost | Proceeds
from
Sales | Net
Realized
Gain/(Loss)
on Sales | Change in
Unrealized
Appreciation/
(Depreciation) | Value,
End of
Year | Dividend
Income | Other
Distributions | Shares
End of
Year |
| MainStay U.S. Government Liquidity Fund | $ 715 | $ 191,343 | $ (187,832) | $ — | $ — | $ 4,226 | $ 25 | $ — | 4,226 |
The notes to the financial statements are an integral part of, and should be read in conjunction with, the financial statements.
| 18 | MainStay VP PIMCO Real Return Portfolio |
Foreign Currency Forward Contracts
As of December 31, 2022, the Portfolio held the following foreign currency forward contracts1:
| Currency Purchased | Currency Sold | Counterparty | Settlement
Date | Unrealized
Appreciation
(Depreciation) |
| EUR | 731,000 | USD | 765,439 | Bank of America N.A. | 1/10/23 | $ 17,394 |
| EUR | 367,000 | USD | 389,925 | Bank of America N.A. | 1/10/23 | 3,098 |
| EUR | 434,000 | USD | 461,423 | Bank of America N.A. | 1/10/23 | 3,350 |
| EUR | 287,000 | USD | 305,751 | Barclays Capital | 1/10/23 | 1,598 |
| EUR | 692,000 | USD | 737,213 | Barclays Capital | 1/10/23 | 3,854 |
| EUR | 619,000 | USD | 659,947 | JPMorgan Chase Bank N.A. | 1/10/23 | 2,944 |
| PEN | 87,726 | USD | 21,931 | Barclays Capital* | 1/25/23 | 1,119 |
| USD | 141,666 | AUD | 208,000 | Barclays Capital | 1/10/23 | 14 |
| USD | 859,520 | CAD | 1,153,000 | BNP Paribas S.A. | 1/10/23 | 7,944 |
| USD | 2,114,644 | NZD | 3,326,000 | JPMorgan Chase Bank N.A. | 1/10/23 | 2,795 |
| Total Unrealized Appreciation | 44,110 |
| USD | 1,275,819 | AUD | 1,899,818 | Morgan Stanley & Co. International | 1/10/23 | (17,991) |
| USD | 13,841,034 | DKK | 98,990,000 | JPMorgan Chase Bank N.A. | 1/10/23 | (415,379) |
| USD | 34,991,239 | EUR | 33,650,000 | JPMorgan Chase Bank N.A. | 1/10/23 | (1,044,748) |
| USD | 8,244,988 | GBP | 6,828,000 | JPMorgan Chase Bank N.A. | 1/10/23 | (11,034) |
| USD | 360,613 | JPY | 49,700,000 | Barclays Capital | 1/10/23 | (18,392) |
| USD | 3,746,076 | JPY | 513,169,332 | Morgan Stanley & Co. International | 1/10/23 | (167,276) |
| USD | 4,381,874 | JPY | 593,700,000 | Morgan Stanley & Co. International | 1/10/23 | (145,593) |
| USD | 988,687 | PEN | 3,844,017 | BNP Paribas S.A.* | 3/15/23 | (16,982) |
| Total Unrealized Depreciation | (1,837,395) |
| Net Unrealized Depreciation | $ (1,793,285) |
| * | Non-deliverable forward. |
| 1. | Foreign Currency Forward Contracts are subject to limitations such that they cannot be “sold or repurchased,” although the Portfolio would be able to exit the transaction through other means, such as through the execution of an offsetting transaction. |
Futures Contracts
As of December 31, 2022, the Portfolio held the following futures contracts1:
| Type | Number of
Contracts | Expiration
Date | Value at
Trade Date | Current
Notional
Amount | Unrealized
Appreciation
(Depreciation)2 |
| Long Contracts | | | | | |
| 3 Month Euro Euribor | 205 | March 2023 | $ 54,983,611 | $ 53,209,260 | $ (1,774,351) |
| Euro-Bund | 82 | March 2023 | 12,415,240 | 11,668,183 | (747,057) |
| Long Gilt | 1 | March 2023 | 128,731 | 120,774 | (7,957) |
| U.S. Treasury 2 Year Notes | 59 | March 2023 | 12,100,145 | 12,099,609 | (536) |
| U.S. Treasury 5 Year Notes | 551 | March 2023 | 59,691,129 | 59,469,258 | (221,871) |
| Total Long Contracts | | | | | (2,751,772) |
| Short Contracts | | | | | |
| Australia 3 Year Bond | (13) | March 2023 | (957,637) | (945,263) | 12,374 |
| Australia 10 Year Bonds | (7) | March 2023 | (582,170) | (551,332) | 30,838 |
| Euro-Bobl | (43) | March 2023 | (5,495,251) | (5,327,897) | 167,354 |
| Euro-BTP | (56) | March 2023 | (6,398,215) | (6,300,840) | 97,375 |
| Euro-BTP | (102) | March 2023 | (12,763,601) | (11,892,528) | 871,073 |
| Euro-Buxl 30 Year Bonds | (54) | March 2023 | (9,137,218) | (7,817,453) | 1,319,765 |
| Euro-OAT | (28) | March 2023 | (4,078,903) | (3,815,512) | 263,391 |
| Euro-Schatz | (632) | March 2023 | (72,222,895) | (71,319,202) | 903,693 |
| Japan 10 Year Bonds | (22) | March 2023 | (24,823,257) | (24,383,724) | 439,533 |
| U.S. Treasury 10 Year Notes | (296) | March 2023 | (33,329,657) | (33,239,875) | 89,782 |
| U.S. Treasury 10 Year Ultra Bonds | (59) | March 2023 | (7,068,977) | (6,978,594) | 90,383 |
| U.S. Treasury Long Bonds | (101) | March 2023 | (12,805,539) | (12,659,718) | 145,821 |
The notes to the financial statements are an integral part of, and should be read in conjunction with, the financial statements.
19
Portfolio of Investments December 31, 2022† (continued)
| Type | Number of
Contracts | Expiration
Date | Value at
Trade Date | Current
Notional
Amount | Unrealized
Appreciation
(Depreciation)2 |
| U.S. Treasury Ultra Bonds | (21) | March 2023 | $ (3,008,178) | $ (2,820,563) | $ 187,615 |
| Total Short Contracts | | | | | 4,618,997 |
| Net Unrealized Appreciation | | | | | $ 1,867,225 |
| 1. | As of December 31, 2022, cash in the amount of $2,288,000 was on deposit with a broker or futures commission merchant for futures transactions. |
| 2. | Represents the difference between the value of the contracts at the time they were opened and the value as of December 31, 2022. |
Purchased Swaptions
| Description | Counterparty | Strike
Price | Expiration
Date | Number of
Contracts | Notional
Amount | Premiums Paid
(Received) | | Market
Value |
| Put-2-Year Interest Rate Swap | Morgan Stanley & Co., LLC | $ 1.43 | 1/31/23 | 11,500,000 | $ 11,500,000 | $ 58,757 | | $ — |
| Put-5-Year Interest Rate Swap | Morgan Stanley Capital Services LLC | 2.20 | 5/31/23 | 14,800,000 | 14,800,000 | 177,600 | | 17,701 |
| | | | | | | $ 236,357 | | $17,701 |
Written Inflation-Capped Options
| Description | Counterparty | Initial
Index | Floating Rate | Expiration
Date | Number of
Contracts | Notional
Amount | Premiums Paid
(Received) | | Market
Value |
| Call-Cap-OTC USA Non-Revised Consumer Price Index- Urban (CPI-U), American Style -Call | JPMorgan Chase Bank N.A. | $ 238.643 | Maximum of [0, Final Index/Initial Index - (1 + 4.00%10)] | 5/16/24 | 300,000 | $ (300,000) | $ (286) | | $ (80,240) |
Written Options on Futures Contracts
| Description | Counterparty | Strike
Price | Expiration
Date | Number of
Contracts | Notional
Amount | Premiums Paid
(Received) | | Market
Value |
| Put-Euro-Bund | Barclays Capital, Inc. | $ 138.50 | 1/27/23 | (6) | EUR (600,000) | $ (6,125) | | $ (36,674) |
| Description | Counterparty | Strike
Price | Expiration
Date | Number of
Contracts | Notional
Amount | Premiums Paid
(Received) | | Market
Value |
| Call-Euro-Bund | Barclays Capital, Inc. | $ 146.00 | 1/27/23 | (6) | EUR (600,000) | $ (4,824) | | $ (64) |
Written Swaptions
| Description | Counterparty | Strike
Price | Expiration
Date | Number of
Contracts | Notional
Amount | Premiums Paid
(Received) | | Market
Value |
| Call-10-Year Interest Rate Swap | Morgan Stanley & Co., LLC | $ 1.58 | 1/31/23 | (2,500,000) | $ (2,500,000) | $ (58,437) | | $ — |
| Call-10-Year Interest Rate Swap | Morgan Stanley Capital Services LLC | 2.35 | 5/31/23 | (8,200,000) | (8,200,000) | (178,659) | | (24,226) |
| | | | | | | $ (237,096) | | $(24,226) |
Swap Contracts
As of December 31, 2022, the Portfolio held the following centrally cleared interest swap agreements1:
Notional
Amount | Currency | Expiration
Date | Payments
made by Portfolio | Payments
Received by Portfolio | Payment Frequency
Paid/Received | Upfront
Premiums
Paid/
(Received) | Value | Unrealized
Appreciation/
(Depreciation) |
| $ 14,000,000 | JPY | 9/20/27 | Fixed 0.30% | 1 day TONAR + 0.06% | Semi-Annually/Semi-Annually | $ (2,101) | $ 1,643 | $ 3,744 |
The notes to the financial statements are an integral part of, and should be read in conjunction with, the financial statements.
| 20 | MainStay VP PIMCO Real Return Portfolio |
Notional
Amount | Currency | Expiration
Date | Payments
made by Portfolio | Payments
Received by Portfolio | Payment Frequency
Paid/Received | Upfront
Premiums
Paid/
(Received) | | Value | | Unrealized
Appreciation/
(Depreciation) |
| $ 50,000,000 | JPY | 3/20/28 | Fixed 0.30% | 1 day TONAR + 0.06% | Semi-Annually/Semi-Annually | $ (8,084) | | $ 7,339 | | $ 15,423 |
| 1,600,000 | NZD | 3/21/28 | Fixed 3.25% | 3 month Australian BBR | Semi-Annually/Quarterly | (92,668) | | 74,468 | | 167,136 |
| 106,980,000 | JPY | 3/20/29 | Fixed 0.45% | 1 day TONAR + 0.06% | Semi-Annually/Semi-Annually | (29,175) | | 15,072 | | 44,247 |
| 4,200,000 | EUR | 11/4/32 | 6 month EURIBOR | Fixed 0.00% | Semi-Annually/Annually | — | | (1,204,233) | | (1,204,233) |
| 2,200,000 | GBP | 3/16/42 | Fixed 0.50% | 1 day SONIA | Annually/Annually | 1,102,499 | | 1,118,588 | | 16,089 |
| 1,400,000 | EUR | 11/4/52 | Fixed 0.19% | 6 month EURIBOR | Annually/Semi-Annually | — | | 704,931 | | 704,931 |
| 2,500,000 | EUR | 12/9/52 | Fixed 0.83% | 6 month EURIBOR | Annually/Semi-Annually | 5,312 | | 79,315 | | 74,003 |
| | | | | | | $ 975,783 | | $ 797,123 | | $ (178,660) |
As of December 31, 2022, the Portfolio held the following centrally cleared inflation swap agreements1:
Notional
Amount | Currency | Expiration
Date | Payments
Made by Portfolio | Payments
Received by Portfolio | Payment
Frequency
Paid/
Received | Upfront
Premiums
Paid/
(Received) | Value | Unrealized
Appreciation/
(Depreciation) |
| $ 3,600,000 | USD | 3/8/23 | 1 Month USD-CPI | Fixed 5.033% | At Maturity | $ — | $ (45,816) | $ (45,816) |
| 6,300,000 | USD | 3/21/23 | 1 Month USD-CPI | Fixed 5.47% | At Maturity | — | (42,718) | (42,718) |
| 1,100,000 | USD | 4/27/23 | Fixed 2.263% | 1 Month USD-CPI | At Maturity | 2,884 | 90,555 | 87,671 |
| 510,000 | USD | 5/9/23 | Fixed 2.263% | 1 Month USD-CPI | At Maturity | 1,513 | 42,153 | 40,640 |
| 780,000 | USD | 5/10/23 | Fixed 2.281% | 1 Month USD-CPI | At Maturity | 2,188 | 63,730 | 61,542 |
| 2,600,000 | USD | 5/24/23 | 1 Month USD-CPI | Fixed 5.185% | At Maturity | — | 11,125 | 11,125 |
| 2,800,000 | EUR | 3/15/24 | Fixed 1.03% | 1 month FRCPI | At Maturity | (8,640) | 275,115 | 283,755 |
| 1,400,000 | GBP | 3/15/24 | Fixed 6.29% | 1 Month UK RPI | At Maturity | — | 105,132 | 105,132 |
| 800,000 | GBP | 5/15/24 | Fixed 6.6% | 1 Month UK RPI | At Maturity | 487 | 43,459 | 42,972 |
| 2,200,000 | GBP | 9/15/24 | 1 Month UK RPI | Fixed 3.85% | At Maturity | 65,547 | (336,014) | (401,561) |
| 200,000 | EUR | 9/15/24 | 1-Month EUR-CPI | Fixed 3.52% | At Maturity | (436) | (3,363) | (2,927) |
| 1,200,000 | EUR | 9/15/24 | 1-Month EUR-CPI | Fixed 3.72% | At Maturity | (2,220) | (15,137) | (12,917) |
| 1,000,000 | GBP | 1/15/25 | 1 Month UK RPI | Fixed 3.33% | At Maturity | 766 | (191,964) | (192,730) |
| 3,100,000 | GBP | 8/15/25 | 1 Month UK RPI | Fixed 3.473% | At Maturity | (36,981) | (640,824) | (603,843) |
| 5,400,000 | USD | 2/26/26 | Fixed 2.314% | 1 Month USD-CPI | At Maturity | 123,530 | 524,973 | 401,443 |
| 2,700,000 | USD | 3/5/26 | Fixed 2.419% | 1 Month USD-CPI | At Maturity | 51,015 | 247,973 | 196,958 |
| 2,200,000 | USD | 5/13/26 | Fixed 2.768% | 1 Month USD-CPI | At Maturity | 8,139 | 156,233 | 148,094 |
| 1,000,000 | USD | 5/14/26 | Fixed 2.813% | 1 Month USD-CPI | At Maturity | 1,918 | 68,706 | 66,788 |
| 1,250,000 | USD | 5/25/26 | Fixed 2.703% | 1 Month USD-CPI | At Maturity | 6,719 | 91,383 | 84,664 |
| 500,000 | USD | 6/1/26 | Fixed 2.69% | 1 Month USD-CPI | At Maturity | 2,714 | 36,571 | 33,857 |
| 900,000 | GBP | 12/15/26 | Fixed 4.735% | 1 Month UK RPI | At Maturity | (9,838) | 87,365 | 97,203 |
| 1,800,000 | GBP | 2/15/27 | Fixed 4.626% | 1 Month UK RPI | At Maturity | — | 160,559 | 160,559 |
| 1,600,000 | GBP | 2/15/27 | Fixed 4.615% | 1 Month UK RPI | At Maturity | — | 143,795 | 143,795 |
| 100,000 | GBP | 2/15/27 | Fixed 4.626% | 1 Month UK RPI | At Maturity | 869 | 8,920 | 8,051 |
| 500,000 | EUR | 5/15/27 | Fixed 3.13% | 1-Month EUR-CPI | At Maturity | — | 13,532 | 13,532 |
| 800,000 | EUR | 6/15/27 | 1-Month EUR-CPI | Fixed 1.36% | At Maturity | 2,680 | (134,457) | (137,137) |
| 1,000,000 | EUR | 3/15/28 | 1-Month EUR-CPI | Fixed 1.535% | At Maturity | 20,493 | (154,443) | (174,936) |
| 770,000 | USD | 5/9/28 | 1 Month USD-CPI | Fixed 2.36% | At Maturity | (7,194) | (65,276) | (58,082) |
| 510,000 | USD | 5/9/28 | 1 Month USD-CPI | Fixed 2.353% | At Maturity | (5,114) | (43,622) | (38,508) |
| 300,000 | USD | 8/26/28 | Fixed 2.573% | 1 Month USD-CPI | At Maturity | — | 18,270 | 18,270 |
| 500,000 | USD | 9/10/28 | Fixed 2.645% | 1 Month USD-CPI | At Maturity | — | 26,778 | 26,778 |
| 2,600,000 | USD | 11/4/29 | 1 Month USD-CPI | Fixed 1.76% | At Maturity | (183,530) | (387,223) | (203,693) |
| 1,390,000 | GBP | 1/15/30 | 1 Month UK RPI | Fixed 3.39% | At Maturity | (31,316) | (299,298) | (267,982) |
| 2,200,000 | USD | 5/19/30 | 1 Month USD-CPI | Fixed 1.28% | At Maturity | (254,288) | (425,979) | (171,691) |
| 1,860,000 | GBP | 6/15/30 | 1 Month UK RPI | Fixed 3.4% | At Maturity | 51,177 | (370,103) | (421,280) |
| 4,500,000 | EUR | 3/15/31 | 1-Month EUR-CPI | Fixed 1.38% | At Maturity | (127,567) | (953,027) | (825,460) |
| 2,090,000 | GBP | 4/15/31 | 1 Month UK RPI | Fixed 3.75% | At Maturity | (21,816) | (418,637) | (396,821) |
| 700,000 | GBP | 9/15/31 | 1 Month UK RPI | Fixed 4.066% | At Maturity | — | (94,303) | (94,303) |
| 800,000 | EUR | 5/15/32 | Fixed 2.6% | 1-Month EUR-CPI | At Maturity | 7,315 | 31,909 | 24,594 |
| 800,000 | EUR | 5/15/32 | Fixed 2.6% | 1-Month EUR-CPI | At Maturity | 441 | 31,909 | 31,468 |
| 800,000 | EUR | 6/15/32 | Fixed 2.72% | 1-Month EUR-CPI | At Maturity | 1,473 | 9,727 | 8,254 |
The notes to the financial statements are an integral part of, and should be read in conjunction with, the financial statements.
21
Portfolio of Investments December 31, 2022† (continued)
Notional
Amount | Currency | Expiration
Date | Payments
Made by Portfolio | Payments
Received by Portfolio | Payment
Frequency
Paid/
Received | Upfront
Premiums
Paid/
(Received) | | Value | | Unrealized
Appreciation/
(Depreciation) |
| $ 1,000,000 | EUR | 6/15/32 | Fixed 2.72% | 1-Month EUR-CPI | At Maturity | $ (9,116) | | $ 12,159 | | $ 21,275 |
| 700,000 | EUR | 6/15/32 | Fixed 2.57% | 1-Month EUR-CPI | At Maturity | — | | 19,306 | | 19,306 |
| 800,000 | EUR | 7/15/32 | Fixed 2.47% | 1-Month EUR-CPI | At Maturity | — | | 29,745 | | 29,745 |
| 3,000,000 | GBP | 9/15/32 | Fixed 4.13% | 1 Month UK RPI | At Maturity | 257 | | 31,325 | | 31,068 |
| 1,500,000 | GBP | 10/15/32 | Fixed 4.143% | 1 Month UK RPI | At Maturity | — | | 13,422 | | 13,422 |
| 200,000 | EUR | 3/15/33 | Fixed 1.71% | 1-Month EUR-CPI | At Maturity | (10,394) | | 33,240 | | 43,634 |
| 800,000 | GBP | 3/15/36 | 1 Month UK RPI | Fixed 3.58% | At Maturity | (21,796) | | (160,164) | | (138,368) |
| 600,000 | GBP | 3/15/36 | 1 Month UK RPI | Fixed 3.566% | At Maturity | (18,662) | | (121,674) | | (103,012) |
| 1,680,000 | EUR | 5/15/37 | 1-Month EUR-CPI | Fixed 2.488% | At Maturity | — | | (96,099) | | (96,099) |
| 400,000 | EUR | 3/15/52 | 1-Month EUR-CPI | Fixed 2.59% | At Maturity | (10,190) | | (31,274) | | (21,084) |
| 100,000 | EUR | 3/15/52 | 1-Month EUR-CPI | Fixed 2.58% | At Maturity | — | | (8,155) | | (8,155) |
| 100,000 | EUR | 3/15/52 | 1-Month EUR-CPI | Fixed 2.58% | At Maturity | 117 | | (8,155) | | (8,272) |
| 100,000 | EUR | 4/15/52 | 1-Month EUR-CPI | Fixed 2.55% | At Maturity | 125 | | (7,722) | | (7,847) |
| | | | | | | $ (406,731) | | $ (2,626,378) | | $ (2,219,647) |
As of December 31, 2022, the Portfolio held the following centrally cleared credit default swap contracts1:
| Reference Entity | Termination
Date | Buy/Sell
Protection2 | Notional
Amount
(000)3 | (Pay)/
Receive
Fixed
Rate4 | Payment
Frequency
Paid/
Received | Upfront
Premiums
Paid/
(Received) | | Value | | Unrealized
Appreciation/
(Depreciation)5 |
| General Electric Co. 2.70%, 10/09/22 | 12/20/2023 | Sell | $ 100 | 1.00% | Quarterly | $ 606 | | $ 553 | | $ (53) |
Open OTC Debt total return swap contracts as of December 31, 2022 were as follows:
Swap
Counterparty | Reference Obligation | Floating Rate6 | Termination
Date(s) | Payment
Frequency
Paid/
Received | Notional
Amount
Long/
(Short)
(000)7 | Unrealized
Appreciation/
(Depreciation) |
| Morgan Stanley Capital Services LLC | U.S. Treasury Inflation Linked Notes, 0.125%, 04/15/2025 | 1 day SOFR | 1/20/23 | Daily | $ 5,000 | $ (16,814) |
| Morgan Stanley Capital Services LLC | U.S. Treasury Inflation Linked Notes, 0.125%, 07/15/2031 | 1 day SOFR + 0.07% | 1/20/23 | Daily | 10,000 | (601,838) |
| Morgan Stanley Capital Services LLC | U.S. Treasury Inflation Linked Notes, 0.125%, 10/15/2024 | 1 day SOFR + 0.07% | 1/20/23 | Daily | 5,000 | (194,611) |
| Morgan Stanley Capital Services LLC | U.S. Treasury Inflation Linked Notes, 0.125%, 10/15/2026 | 1 day SOFR | 1/20/23 | Daily | 25,000 | 49,613 |
| Morgan Stanley Capital Services LLC | U.S. Treasury Inflation Linked Notes, 0.25%, 01/15/2025 | 1 day SOFR | 1/20/23 | Daily | 5,000 | (23,232) |
| Morgan Stanley Capital Services LLC | U.S. Treasury Inflation Linked Notes, 0.375%, 01/15/2027 | 1 day SOFR | 1/20/23 | Daily | 10,000 | 54,529 |
| Morgan Stanley Capital Services LLC | U.S. Treasury Inflation Linked Notes, 0.375%, 07/15/2023 | 1 day SOFR + 0.12% | 2/6/23 | Daily | 3,000 | (8,489) |
| Morgan Stanley Capital Services LLC | U.S. Treasury Inflation Linked Notes, 0.375%, 07/15/2027 | 1 day SOFR | 1/20/23 | Daily | 10,000 | 67,658 |
| Morgan Stanley Capital Services LLC | U.S. Treasury Inflation Linked Notes, 0.625%, 01/15/2024 | 1 day SOFR + 0.12% | 2/6/23 | Daily | 10,000 | (51,020) |
| Morgan Stanley Capital Services LLC | U.S. Treasury Inflation Linked Notes, 0.625%, 01/15/2026 | 1 day SOFR + 0.12% | 2/6/23 | Daily | 5,000 | (9,638) |
| Morgan Stanley Capital Services LLC | U.S. Treasury Inflation Linked Notes, 0.625%, 04/15/2023 | 1 day SOFR | 1/20/23 | Daily | 10,000 | (44,558) |
| | | | | | | $ (778,400) |
The notes to the financial statements are an integral part of, and should be read in conjunction with, the financial statements.
| 22 | MainStay VP PIMCO Real Return Portfolio |
| 1. | As of December 31, 2022, cash in the amount of $291,000 was on deposit with a broker for centrally cleared swap agreements. |
| 2. | Sell—Portfolio receives premium and sells credit protection. If a credit event occurs, as defined under the terms of that particular swap agreement, the Portfolio will either (i) pay to the buyer of protection an amount equal to the notional amount of the swap and take delivery of the referenced obligation or underlying securities comprising the referenced index or (ii) pay a net settlement amount in the form of cash or securities equal to the notional amount of the swap less the recovery value of the referenced obligation or underlying securities comprising the referenced index. |
| 3. | The maximum potential amount the Portfolio could be required to pay as a seller of credit protection or receive as a buyer of credit protection if a credit event occurs as defined under the terms of that particular swap contract. |
| 4. | The annual fixed rate represents the interest received by the Portfolio (as a seller of protection) or paid by the Portfolio (as a buyer of protection) annually on the notional amount of the credit default swap contract. |
| 5. | Represents the difference between the value of the credit default swap contracts at the time they were opened and the value at December 31, 2022. |
| 6. | Portfolio pays or receives the floating rate and receives or pays the total return of the referenced entity. |
| 7. | Notional amounts reflected as a positive value indicate a long position held by the Portfolio or Index and a negative value indicates a short position. |
| Abbreviation(s): |
| AUD—Australia Dollar |
| BBR—Bank of England Base Rate |
| BTP—Buoni del Tesoro Poliennali (Eurex Exchange index) |
| CAD—Canada Dollar |
| DKK—Denmark Krone |
| EUR—Euro |
| EURIBOR—Euro Interbank Offered Rate |
| FHLMC—Federal Home Loan Mortgage Corp. |
| FNMA—Federal National Mortgage Association |
| GBP—British Pound Sterling |
| GNMA—Government National Mortgage Association |
| JPY—Japanese Yen |
| LIBOR—London Interbank Offered Rate |
| NZD—New Zealand Dollar |
| PEN—Peru Nuevo Sol |
| REMIC—Real Estate Mortgage Investment Conduit |
| SOFR—Secured Overnight Financing Rate |
| SONIA—Sterling Overnight Interbank Average Rate |
| TBA—To Be Announced |
| TONAR—Tokyo Overnight Average Rate |
| UMBS—Uniform Mortgage Backed Securities |
| USD—United States Dollar |
The notes to the financial statements are an integral part of, and should be read in conjunction with, the financial statements.
23
Portfolio of Investments December 31, 2022† (continued)
The following is a summary of the fair valuations according to the inputs used as of December 31, 2022, for valuing the Portfolio’s assets and liabilities:
| Description | Quoted
Prices in
Active
Markets for
Identical
Assets
(Level 1) | | Significant
Other
Observable
Inputs
(Level 2) | | Significant
Unobservable
Inputs
(Level 3) | | Total |
| Asset Valuation Inputs | | | | | | | |
| Investments in Securities (a) | | | | | | | |
| Long-Term Bonds | | | | | | | |
| Asset-Backed Securities | $ — | | $ 44,469,429 | | $ — | | $ 44,469,429 |
| Corporate Bonds | — | | 17,473,645 | | — | | 17,473,645 |
| Foreign Government Bonds | — | | 43,777,825 | | — | | 43,777,825 |
| Mortgage-Backed Securities | — | | 23,715,211 | | — | | 23,715,211 |
| U.S. Government & Federal Agencies | — | | 409,160,662 | | — | | 409,160,662 |
| Total Long-Term Bonds | — | | 538,596,772 | | — | | 538,596,772 |
| Short-Term Investment | | | | | | | |
| Affiliated Investment Company | 4,225,813 | | — | | — | | 4,225,813 |
| Total Investments in Securities | 4,225,813 | | 538,596,772 | | — | | 542,822,585 |
| Other Financial Instruments | | | | | | | |
| Foreign Currency Forward Contracts (b) | — | | 44,110 | | — | | 44,110 |
| Futures Contracts (b) | 4,618,997 | | — | | — | | 4,618,997 |
| Purchased Options | — | | 17,701 | | — | | 17,701 |
| Interest Rate Swap Contracts (b) | — | | 1,025,573 | | — | | 1,025,573 |
| Inflation Swap Contracts (b) | — | | 2,255,595 | | — | | 2,255,595 |
| OTC Debt Total Return Swap Contracts (b) | — | | 171,800 | | — | | 171,800 |
| Total Other Financial Instruments | 4,618,997 | | 3,514,779 | | — | | 8,133,776 |
| Total Investments in Securities and Other Financial Instruments | $ 8,844,810 | | $ 542,111,551 | | $ — | | $ 550,956,361 |
| Liability Valuation Inputs | | | | | | | |
| Other Financial Instruments | | | | | | | |
| Foreign Currency Forward Contracts (b) | $ — | | $ (1,837,395) | | $ — | | $ (1,837,395) |
| Futures Contracts (b) | (2,751,772) | | — | | — | | (2,751,772) |
| Written Options | — | | (141,204) | | — | | (141,204) |
| Interest Rate Swap Contracts (b) | — | | (1,204,233) | | — | | (1,204,233) |
| Inflation Swap Contracts (b) | — | | (4,475,242) | | — | | (4,475,242) |
| Credit Default Swap Contracts (b) | — | | (53) | | — | | (53) |
| OTC Debt Total Return Swap Contracts (b) | — | | (950,200) | | — | | (950,200) |
| Total Other Financial Instruments | $ (2,751,772) | | $ (8,608,327) | | $ — | | $ (11,360,099) |
| (a) | For a complete listing of investments and their industries, see the Portfolio of Investments. |
| (b) | The value listed for these securities reflects unrealized appreciation (depreciation) as shown on the Portfolio of Investments. |
The notes to the financial statements are an integral part of, and should be read in conjunction with, the financial statements.
| 24 | MainStay VP PIMCO Real Return Portfolio |
Sale-Buyback Transactions:(a)
| Counterparty | Borrowing
Rate (b) | Borrowing
Date | Maturity
Date | Amount
Borrowed (b) | | Payable for
Sale-Buyback
Transactions (c) |
| BofA Securities, Inc. | 4.21% | 11/9/2022 | 1/9/2023 | $ 4,026,830 | | $ 4,027,306 |
| BofA Securities, Inc. | 4.43 | 12/12/2022 | 1/5/2023 | 3,769,056 | | 3,768,993 |
| BofA Securities, Inc. | 4.43 | 12/12/2022 | 1/5/2023 | 8,914,865 | | 8,915,036 |
| BofA Securities, Inc. | 4.46 | 12/13/2022 | 1/10/2023 | 4,470,746 | | 4,469,819 |
| BNP Paribas S.A. | 4.48 | 12/20/2022 | 1/4/2023 | 14,598,985 | | 14,597,637 |
| BNP Paribas S.A. | 4.48 | 12/20/2022 | 1/4/2023 | 16,790,378 | | 16,788,606 |
| BNP Paribas S.A. | 4.48 | 12/20/2022 | 1/4/2023 | 8,191,582 | | 8,190,774 |
| BNP Paribas S.A. | 4.48 | 12/20/2022 | 1/4/2023 | 14,157,969 | | 14,156,295 |
| BNP Paribas S.A. | 4.48 | 12/20/2022 | 1/4/2023 | 8,161,791 | | 8,160,664 |
| BNP Paribas S.A. | 4.48 | 12/20/2022 | 1/4/2023 | 12,413,451 | | 12,411,779 |
| BNP Paribas S.A. | 4.48 | 12/20/2022 | 1/4/2023 | 17,904,883 | | 17,902,285 |
| BNP Paribas S.A. | 4.48 | 12/20/2022 | 1/4/2023 | 18,003,187 | | 18,000,653 |
| BNP Paribas S.A. | 4.48 | 12/20/2022 | 1/4/2023 | 13,071,930 | | 13,070,164 |
| BNP Paribas S.A. | 4.48 | 12/20/2022 | 1/4/2023 | 12,329,181 | | 12,327,392 |
| BNP Paribas S.A. | 4.48 | 12/20/2022 | 1/4/2023 | 18,325,698 | | 18,322,871 |
| BNP Paribas S.A. | 4.48 | 12/20/2022 | 1/4/2023 | 11,944,439 | | 11,942,682 |
| BNP Paribas S.A. | 4.48 | 12/20/2022 | 1/4/2023 | 10,139,312 | | 10,137,742 |
| BNP Paribas S.A. | 4.48 | 12/20/2022 | 1/4/2023 | 18,291,010 | | 18,288,479 |
| BNP Paribas S.A. | 4.48 | 12/20/2022 | 1/4/2023 | 18,118,329 | | 18,115,451 |
| BNP Paribas S.A. | 4.48 | 12/20/2022 | 1/4/2023 | 15,794,515 | | 15,792,008 |
| BNP Paribas S.A. | 4.48 | 12/20/2022 | 1/4/2023 | 8,662,532 | | 8,661,169 |
| BNP Paribas S.A. | 4.48 | 12/20/2022 | 1/4/2023 | 18,118,372 | | 18,115,657 |
| BNP Paribas S.A. | 4.48 | 12/20/2022 | 1/4/2023 | 9,821,186 | | 9,819,605 |
| BNP Paribas S.A. | 4.48 | 12/20/2022 | 1/4/2023 | 18,586,025 | | 18,583,003 |
| BofA Securities, Inc. | 4.45 | 12/20/2022 | 1/11/2023 | 12,091,166 | | 12,084,468 |
| BofA Securities, Inc. | 4.45 | 12/20/2022 | 1/11/2023 | 2,370,590 | | 2,369,068 |
| BofA Securities, Inc. | 4.45 | 12/20/2022 | 1/11/2023 | 1,050,370 | | 1,049,860 |
| | | | | $320,118,378 | | $320,069,466 |
(a) As of December 31, 2022, cash in the amount of $270,000 was on deposit with a broker for sale-buyback transactions.
(b) During the period ended December 31, 2022, the Portfolio’s average amount of borrowing was $106,065,358 at a weighted average interest rate of 0.89%.
(c) Payable for sale-buyback transactions includes $(48,912) of deferred price drop.
The notes to the financial statements are an integral part of, and should be read in conjunction with, the financial statements.
25
Statement of Assets and Liabilities as of December 31, 2022
| Assets |
Investment in unaffiliated securities, at value
(identified cost $599,210,877) | $538,614,473 |
Investment in affiliated investment companies, at value
(identified cost $4,225,813) | 4,225,813 |
| Cash | 38,705 |
Cash denominated in foreign currencies
(identified cost $1,938,093) | 1,844,945 |
| Cash collateral on deposit at broker for futures contracts | 2,288,000 |
| Cash collateral on deposit at broker for swap contracts | 291,000 |
| Cash collateral on deposit at broker for sale-buyback transactions | 270,000 |
| Receivables: | |
| Investment securities sold | 282,556,229 |
| Interest | 1,665,726 |
| Variation margin on centrally cleared swap contracts | 285,926 |
| Portfolio shares sold | 52,521 |
| Securities lending | 141 |
| Unrealized appreciation on OTC swap contracts | 171,800 |
| Unrealized appreciation on foreign currency forward contracts | 44,110 |
| Other assets | 7,028 |
| Total assets | 832,356,417 |
| Liabilities |
| Written options, at value (premiums received $248,331) | 141,204 |
| Payables: | |
| Sale buyback transactions | 320,069,466 |
| Investment securities purchased | 13,969,935 |
| Variation margin on futures contracts | 1,009,998 |
| Manager (See Note 3) | 183,724 |
| Portfolio shares redeemed | 109,951 |
| NYLIFE Distributors (See Note 3) | 80,296 |
| Professional fees | 44,426 |
| Custodian | 31,965 |
| Shareholder communication | 26,555 |
| Accrued expenses | 8,859 |
| Unrealized depreciation on OTC swap contracts | 950,200 |
| Unrealized depreciation on foreign currency forward contracts | 1,837,395 |
| Total liabilities | 338,463,974 |
| Net assets | $493,892,443 |
| Composition of Net Assets |
| Shares of beneficial interest outstanding (par value of $.001 per share) unlimited number of shares authorized | $ 60,181 |
| Additional paid-in-capital | 588,254,901 |
| | 588,315,082 |
| Total distributable earnings (loss) | (94,422,639) |
| Net assets | $493,892,443 |
| Initial Class | |
| Net assets applicable to outstanding shares | $119,312,595 |
| Shares of beneficial interest outstanding | 14,505,809 |
| Net asset value per share outstanding | $ 8.23 |
| Service Class | |
| Net assets applicable to outstanding shares | $374,579,848 |
| Shares of beneficial interest outstanding | 45,675,020 |
| Net asset value per share outstanding | $ 8.20 |
The notes to the financial statements are an integral part of, and should be read in conjunction with, the financial statements.
| 26 | MainStay VP PIMCO Real Return Portfolio |
Statement of Operations for the year ended December 31, 2022
| Investment Income (Loss) |
| Income | |
| Interest (net of foreign tax withholding of $628) | $ 42,573,213 |
| Dividends-affiliated | 24,887 |
| Securities lending, net | 555 |
| Other | 30,001 |
| Total income | 42,628,656 |
| Expenses | |
| Manager (See Note 3) | 2,594,771 |
| Distribution/Service—Service Class (See Note 3) | 1,010,802 |
| Interest expense | 956,451 |
| Custodian | 220,918 |
| Professional fees | 158,634 |
| Shareholder communication | 29,096 |
| Trustees | 11,807 |
| Miscellaneous | 17,650 |
| Total expenses before waiver/reimbursement | 5,000,129 |
| Expense waiver/reimbursement from Manager (See Note 3) | (282,415) |
| Net expenses | 4,717,714 |
| Net investment income (loss) | 37,910,942 |
| Realized and Unrealized Gain (Loss) |
| Net realized gain (loss) on: | |
| Unaffiliated investment transactions | (11,859,062) |
| Futures transactions | 15,333,109 |
| Swap transactions | (5,081,331) |
| Foreign currency transactions | (2,865,665) |
| Foreign currency forward transactions | 8,663,860 |
| Written option transactions | 223,304 |
| Net realized gain (loss) | 4,414,215 |
| Net change in unrealized appreciation (depreciation) on: | |
| Unaffiliated investments | (105,637,528) |
| Futures contracts | 1,186,064 |
| Swap contracts | (655,483) |
| Foreign currency forward contracts | (2,186,785) |
| Translation of other assets and liabilities in foreign currencies | (77,166) |
| Written option contracts | 232,842 |
| Net change in unrealized appreciation (depreciation) | (107,138,056) |
| Net realized and unrealized gain (loss) | (102,723,841) |
| Net increase (decrease) in net assets resulting from operations | $ (64,812,899) |
The notes to the financial statements are an integral part of, and should be read in conjunction with, the financial statements.
27
Statements of Changes in Net Assets
for the years ended December 31, 2022 and December 31, 2021
| | 2022 | 2021 |
| Increase (Decrease) in Net Assets |
| Operations: | | |
| Net investment income (loss) | $ 37,910,942 | $ 24,946,685 |
| Net realized gain (loss) | 4,414,215 | 6,102,470 |
| Net change in unrealized appreciation (depreciation) | (107,138,056) | (3,456,778) |
| Net increase (decrease) in net assets resulting from operations | (64,812,899) | 27,592,377 |
| Distributions to shareholders: | | |
| Initial Class | (6,510,777) | (649,528) |
| Service Class | (22,747,983) | (1,422,855) |
| Total distributions to shareholders | (29,258,760) | (2,072,383) |
| Capital share transactions: | | |
| Net proceeds from sales of shares | 102,583,407 | 161,478,620 |
| Net asset value of shares issued to shareholders in reinvestment of distributions | 29,258,760 | 2,072,383 |
| Cost of shares redeemed | (135,760,697) | (79,334,973) |
| Increase (decrease) in net assets derived from capital share transactions | (3,918,530) | 84,216,030 |
| Net increase (decrease) in net assets | (97,990,189) | 109,736,024 |
| Net Assets |
| Beginning of year | 591,882,632 | 482,146,608 |
| End of year | $ 493,892,443 | $591,882,632 |
The notes to the financial statements are an integral part of, and should be read in conjunction with, the financial statements.
| 28 | MainStay VP PIMCO Real Return Portfolio |
Statement of Cash Flows
for the year ended December 31, 2022
| Cash Flows From (Used in) Operating Activities: |
| Net decrease in net assets resulting from operations | $ (64,812,899) |
| Adjustments to reconcile net increase in net assets resulting from operations to net cash used in operating activities: | |
| Long term investments purchased | (411,967,495) |
| Long term investments sold | 495,379,376 |
| Sale of short term investments, net | 23,060,032 |
| Purchase of affiliated investments, net | (3,511,127) |
| Amortization (accretion) of discount and premium, net | 19,113,030 |
| Decrease in investment securities sold receivable | 129,731,263 |
| Increase in interest receivable | (181,597) |
| Increase in securities lending | (117) |
| Increase in other assets | (4,649) |
| Decrease in unrealized appreciation for open forward foreign currency contracts | 1,107,286 |
| Increase in premiums from written options | 111,669 |
| Decrease in investment securities purchased payable | (34,674,237) |
| Decrease in cash collateral due to broker for foreign currency forward contracts | (340,000) |
| Decrease in cash collateral due to broker for reverse repurchase agreements | (317,000) |
| Decrease in cash collateral received for securities on loan | (92,925) |
| Decrease in due to NYLIFE Distributors | (14,692) |
| Decrease in professional fees payable | (9,797) |
| Decrease in custodian payable | (16,036) |
| Decrease in shareholder communication payable | (3,526) |
| Decrease in due to Trustees | (199) |
| Decrease in due to manager | (37,321) |
| Increase in variation margin on centrally cleared swap contracts | (620,900) |
| Increase in variation margin on futures contracts | 1,224,184 |
| Increase in unrealized depreciation for open forward foreign currency contracts | 1,079,499 |
| Decrease in accrued expenses | (673) |
| Increase in unrealized appreciation on OTC swap contracts | (171,800) |
| Increase in unrealized depreciation on OTC swap contracts | 950,200 |
| Net realized loss from investments | 11,859,062 |
| Net change in unrealized (appreciation) depreciation on unaffiliated investments | 105,637,528 |
| Net change in unrealized (appreciation) depreciation on written options | (232,842) |
| Net cash from operating activities | 272,243,297 |
| Cash Flows From (Used in) Financing Activities: |
| Proceeds from shares sold | 102,582,617 |
| Payment on shares redeemed | (135,831,194) |
| Payments on reverse repurchase agreements | (80,607,250) |
| Proceeds from reverse repurchase agreements | 29,321,000 |
| Proceeds on sale-buyback transactions | 7,244,717,038 |
| Payments from sale-buyback transactions | (7,432,363,806) |
| Net cash from financing activities | (272,181,595) |
| Effect of exchange rate changes on cash | (163,160) |
| Net decrease in cash | (101,458) |
| Cash, restricted cash and foreign currency at beginning of year | 4,834,108 |
| Cash, restricted cash and foreign currency at end of year | $ 4,732,650 |
| Non-cash financing activities not included herein consist of all reinvestment of dividends and distributions of $29,258,760. |
| Supplemental disclosure of cash flow information: |
| The following tables provide a reconciliation of cash and restricted cash reported within the Statement of Assets and Liabilities that sums to the total of the such amounts shown on the Statement of Cash Flows: |
| Cash and restricted cash at beginning of year | |
| Cash | $ 659,192 |
| Cash denominated in foreign currencies | 2,518,916 |
| Cash collateral on deposit at broker for futures contracts | 1,285,000 |
| Cash collateral on deposit at broker for swap contracts | 371,000 |
| Total cash and restricted cash shown in the Statement of Cash Flows | $4,834,108 |
| Cash and restricted cash at end of year | |
| Cash | $ 38,705 |
| Cash denominated in foreign currencies | 1,844,945 |
| Cash collateral on deposit at broker for futures contracts | 2,288,000 |
| Cash collateral on deposit at broker for swap contracts | 291,000 |
| Cash collateral on deposit at broker for sale-buyback transactions | 270,000 |
| Total cash and restricted cash shown in the Statement of Cash Flows | $4,732,650 |
| Restricted cash consists of cash that has been segregated to cover the Portfolio’s collateral or margin obligations under derivative contracts. It is separately reported on the Statement of Assets and Liabilities as cash collateral on deposit at brokers. |
The notes to the financial statements are an integral part of, and should be read in conjunction with, the financial statements.
29
Financial Highlights selected per share data and ratios
| | Year Ended December 31, |
| Initial Class | 2022 | | 2021 | | 2020 | | 2019 | | 2018 |
| Net asset value at beginning of year | $ 9.92 | | $ 9.47 | | $ 8.63 | | $ 8.20 | | $ 8.54 |
| Net investment income (loss) (a) | 0.68 | | 0.50 | | 0.12 | | 0.20 | | 0.23 |
| Net realized and unrealized gain (loss) | (1.82) | | — | | 0.91 | | 0.51 | | (0.43) |
| Total from investment operations | (1.14) | | 0.50 | | 1.03 | | 0.71 | | (0.20) |
| Less distributions: | | | | | | | | | |
| From net investment income | (0.55) | | (0.05) | | (0.19) | | (0.28) | | (0.14) |
| Net asset value at end of year | $ 8.23 | | $ 9.92 | | $ 9.47 | | $ 8.63 | | $ 8.20 |
| Total investment return (b) | (11.45)% | | 5.36%(c) | | 11.93%(c) | | 8.56%(c) | | (2.38)%(c) |
| Ratios (to average net assets)/Supplemental Data: | | | | | | | | | |
| Net investment income (loss) | 7.42% | | 5.20% | | 1.27% | | 2.35% | | 2.78% |
| Net expenses (d) | 0.71% | | 0.55% | | 0.78% | | 1.65% | | 1.43% |
| Expenses (before waiver/reimbursement) (d) | 0.76% | | 0.59% | | 0.83% | | 1.71% | | 1.43% |
| Interest expense and fees | 0.18% | | 0.02% | | 0.25% | | 1.09% | | 0.81% |
| Portfolio turnover rate | 71% | | 125%(e) | | 199%(e) | | 187%(e) | | 157%(e) |
| Net assets at end of year (in 000's) | $ 119,313 | | $ 139,038 | | $ 48,479 | | $ 48,707 | | $ 44,523 |
| (a) | Per share data based on average shares outstanding during the year. |
| (b) | Total return does not reflect any deduction of sales charges, mortality and expense charges, contract charges or administrative charges. For periods of less than one year, total return is not annualized. |
| (c) | Total investment return may reflect adjustments to conform to generally accepted accounting principles. |
| (d) | In addition to the fees and expenses which the Portfolio bears directly, it also indirectly bears a pro-rata share of the fees and expenses of the underlying funds in which it invests. Such indirect expenses are not included in the above expense ratios. |
| (e) | The portfolio turnover rates not including mortgage dollar rolls were 42%, 128%, 139% and 48% for the years ended December 31, 2021, 2020, 2019 and 2018, respectively. |
| | Year Ended December 31, |
| Service Class | 2022 | | 2021 | | 2020 | | 2019 | | 2018 |
| Net asset value at beginning of year | $ 9.89 | | $ 9.44 | | $ 8.61 | | $ 8.19 | | $ 8.53 |
| Net investment income (loss) (a) | 0.66 | | 0.44 | | 0.09 | | 0.18 | | 0.21 |
| Net realized and unrealized gain (loss) | (1.82) | | 0.04 | | 0.91 | | 0.50 | | (0.44) |
| Total from investment operations | (1.16) | | 0.48 | | 1.00 | | 0.68 | | (0.23) |
| Less distributions: | | | | | | | | | |
| From net investment income | (0.53) | | (0.03) | | (0.17) | | (0.26) | | (0.11) |
| Net asset value at end of year | $ 8.20 | | $ 9.89 | | $ 9.44 | | $ 8.61 | | $ 8.19 |
| Total investment return (b) | (11.68)% | | 5.12% | | 11.61%(c) | | 8.30%(c) | | (2.63)%(c) |
| Ratios (to average net assets)/Supplemental Data: | | | | | | | | | |
| Net investment income (loss) | 7.27% | | 4.58% | | 1.04% | | 2.14% | | 2.53% |
| Net expenses (d) | 0.96% | | 0.80% | | 1.03% | | 1.89% | | 1.68% |
| Expenses (before waiver/reimbursement) (d) | 1.01% | | 0.84% | | 1.08% | | 1.96% | | 1.68% |
| Interest expense and fees | 0.18% | | 0.02% | | 0.25% | | 1.09% | | 0.81% |
| Portfolio turnover rate | 71% | | 125%(e) | | 199%(e) | | 187%(e) | | 157%(e) |
| Net assets at end of year (in 000's) | $ 374,580 | | $ 452,844 | | $ 433,668 | | $ 343,332 | | $ 282,052 |
| (a) | Per share data based on average shares outstanding during the year. |
| (b) | Total return does not reflect any deduction of sales charges, mortality and expense charges, contract charges or administrative charges. For periods of less than one year, total return is not annualized. |
| (c) | Total investment return may reflect adjustments to conform to generally accepted accounting principles. |
| (d) | In addition to the fees and expenses which the Portfolio bears directly, it also indirectly bears a pro-rata share of the fees and expenses of the underlying funds in which it invests. Such indirect expenses are not included in the above expense ratios. |
| (e) | The portfolio turnover rates not including mortgage dollar rolls were 42%, 128%, 139% and 48% for the years ended December 31, 2021, 2020, 2019 and 2018, respectively. |
The notes to the financial statements are an integral part of, and should be read in conjunction with, the financial statements.
| 30 | MainStay VP PIMCO Real Return Portfolio |
Notes to Financial Statements
Note 1–Organization and Business
MainStay VP Funds Trust (the “Fund”) was organized as a Delaware statutory trust on February 1, 2011. The Fund is registered under the Investment Company Act of 1940, as amended (the “1940 Act”), as an open-end management investment company. The Fund is comprised of thirty-one separate series (collectively referred to as the “Portfolios”). These financial statements and notes relate to the MainStay VP PIMCO Real Return Portfolio (the "Portfolio"), a "non-diversified” portfolio, as that term is defined in the 1940 Act, as interpreted or modified by regulatory authorities having jurisdiction, from time to time. However, due to its principal investment strategies and investment processes, the Portfolio has historically operated as a "diversified" portfolio. Therefore, the Portfolio will not operate as "non-diversified" portfolio without first obtaining shareholder approval.
Shares of the Portfolio are currently offered to certain separate accounts to fund variable annuity policies and variable universal life insurance policies issued by New York Life Insurance and Annuity Corporation (“NYLIAC”), a wholly-owned subsidiary of New York Life Insurance Company (“New York Life”) and may also be offered to fund variable annuity policies and variable universal life insurance policies issued by other insurance companies. NYLIAC allocates shares of the Portfolio to, among others, certain NYLIAC separate accounts. Shares of the Portfolio are also offered to the MainStay VP Conservative Allocation Portfolio, MainStay VP Moderate Allocation Portfolio, MainStay VP Growth Allocation Portfolio and MainStay VP Equity Allocation Portfolio, which operate as “funds-of-funds," and other variable insurance funds.
The following table lists the Portfolio's share classes that have been registered and commenced operations:
| Class | Commenced Operations |
| Initial Class | February 17, 2012 |
| Service Class | February 17, 2012 |
Shares of the Portfolio are offered and are redeemed at a price equal to their respective net asset value (“NAV”) per share. No sales or redemption charge is applicable to the purchase or redemption of the Portfolio's shares. Under the terms of the Fund’s multiple class plan, adopted pursuant to Rule 18f-3 under the 1940 Act, the classes differ in that, among other things, Service Class shares of the Portfolio pay a combined distribution and service fee of 0.25% of average daily net assets attributable to Service Class shares of the Portfolio to the Distributor (as defined in Note 3(B)) pursuant to a plan adopted in accordance with Rule 12b-1 under the 1940 Act. Contract owners of variable annuity contracts purchased after June 2, 2003, are permitted to invest only in the Service Class shares.
The Portfolio's investment objective is to seek maximum real return, consistent with preservation of real capital and prudent investment management.
Note 2–Significant Accounting Policies
The Portfolio is an investment company and accordingly follows the investment company accounting and reporting guidance of the Financial Accounting Standards Board (“FASB”) Accounting Standards Codification Topic 946 Financial Services—Investment Companies. The Portfolio prepares its financial statements in accordance with generally accepted accounting principles (“GAAP”) in the United States of America and follows the significant accounting policies described below.
(A) Securities Valuation. Investments are usually valued as of the close of regular trading on the New York Stock Exchange (the "Exchange") (usually 4:00 p.m. Eastern time) on each day the Portfolio is open for business ("valuation date").
Effective September 8, 2022, and pursuant to Rule 2a-5 under the 1940 Act, the Board of Trustees of the Fund (the "Board") designated New York Life Investment Management LLC (“New York Life Investments” or the "Manager") as its Valuation Designee (the "Valuation Designee"). The Valuation Designee is responsible for performing fair valuations relating to all investments in the Portfolio’s portfolio for which market quotations are not readily available; periodically assessing and managing material valuation risks; establishing and applying fair value methodologies; testing fair valuation methodologies; evaluating and overseeing pricing services; ensuring appropriate segregation of valuation and portfolio management functions; providing quarterly, annual and prompt reporting to the Board, as appropriate; identifying potential conflicts of interest; and maintaining appropriate records. The Valuation Designee has established a valuation committee ("Valuation Committee") to assist in carrying out the Valuation Designee’s responsibilities and establish prices of securities for which market quotations are not readily available. The Portfolio’s and the Valuation Designee's policies and procedures ("Valuation Procedures") govern the Valuation Designee’s selection and application of methodologies for determining and calculating the fair value of Portfolio investments. The Valuation Designee may value the Portfolio's portfolio securities for which market quotations are not readily available and other Portfolio assets utilizing inputs from pricing services and other third-party sources (together, “Pricing Sources”). The Valuation Committee meets (in person, via electronic mail or via teleconference) on an ad-hoc basis to determine fair valuations and on a quarterly basis to review fair value events with respect to certain securities for which market quotations are not readily available, including valuation risks and back-testing results, and preview reports to the Board.
The Valuation Committee establishes prices of securities for which market quotations are not readily available based on such methodologies and measurements on a regular basis after considering information that is reasonably available and deemed relevant by the Valuation Committee. The Board shall oversee the Valuation Designee and review fair valuation materials on a prompt, quarterly and annual basis and approve proposed revisions to the Valuation Procedures.
Investments for which market quotations are not readily available are valued at fair value as determined in good faith pursuant to the Valuation
Notes to Financial Statements (continued)
Procedures. A market quotation is readily available only when that quotation is a quoted price (unadjusted) in active markets for identical investments that the Portfolio can access at the measurement date, provided that a quotation will not be readily available if it is not reliable. "Fair value" is defined as the price the Portfolio would reasonably expect to receive upon selling an asset or liability in an orderly transaction to an independent buyer in the principal or most advantageous market for the asset or liability. Fair value measurements are determined within a framework that establishes a three-tier hierarchy that maximizes the use of observable market data and minimizes the use of unobservable inputs to establish a classification of fair value measurements for disclosure purposes. "Inputs" refer broadly to the assumptions that market participants would use in pricing the asset or liability, including assumptions about risk, such as the risk inherent in a particular valuation technique used to measure fair value using a pricing model and/or the risk inherent in the inputs for the valuation technique. Inputs may be observable or unobservable. Observable inputs reflect the assumptions market participants would use in pricing the asset or liability based on market data obtained from sources independent of the Portfolio. Unobservable inputs reflect the Portfolio’s own assumptions about the assumptions market participants would use in pricing the asset or liability based on the information available. The inputs or methodology used for valuing assets or liabilities may not be an indication of the risks associated with investing in those assets or liabilities. The three-tier hierarchy of inputs is summarized below.
| • | Level 1—quoted prices (unadjusted) in active markets for an identical asset or liability |
| • | Level 2—other significant observable inputs (including quoted prices for a similar asset or liability in active markets, interest rates and yield curves, prepayment speeds, credit risk, etc.) |
| • | Level 3—significant unobservable inputs (including the Portfolio's own assumptions about the assumptions that market participants would use in measuring fair value of an asset or liability) |
The level of an asset or liability within the fair value hierarchy is based on the lowest level of an input, both individually and in the aggregate, that is significant to the fair value measurement. The aggregate value by input level of the Portfolio’s assets and liabilities as of December 31, 2022, is included at the end of the Portfolio of Investments.
The Portfolio may use third-party vendor evaluations, whose prices may be derived from one or more of the following standard inputs, among others:
| • Benchmark yields | • Reported trades |
| • Broker/dealer quotes | • Issuer spreads |
| • Two-sided markets | • Benchmark securities |
| • Bids/offers | • Reference data (corporate actions or material event notices) |
| • Industry and economic events | • Comparable bonds |
| • Equity and credit default swap curves | • Monthly payment information |
An asset or liability for which a market quotation is not readily available is valued by methods deemed reasonable in good faith by the Valuation Committee, following the Valuation Procedures to represent fair value. Under these procedures, the Valuation Designee generally uses a market-based approach which may use related or comparable assets or liabilities, recent transactions, market multiples, book values and other relevant information. The Valuation Designee may also use an income-based valuation approach in which the anticipated future cash flows of the asset or liability are discounted to calculate fair value. Discounts may also be applied due to the nature and/or duration of any restrictions on the disposition of the asset or liability. Fair value represents a good faith approximation of the value of a security. Fair value determinations involve the consideration of a number of subjective factors, an analysis of applicable facts and circumstances and the exercise of judgment. As a result, it is possible that the fair value for a security determined in good faith in accordance with the Valuation Procedures may differ from valuations for the same security determined for other funds using their own valuation procedures. Although the Valuation Procedures are designed to value a security at the price the Portfolio may reasonably expect to receive upon the security's sale in an orderly transaction, there can be no assurance that any fair value determination thereunder would, in fact, approximate the amount that the Portfolio would actually realize upon the sale of the security or the price at which the security would trade if a reliable market price were readily available. During the year ended December 31, 2022, there were no material changes to the fair value methodologies.
Securities which may be valued in this manner include, but are not limited to: (i) a security for which trading has been halted or suspended or otherwise does not have a readily available market quotation on a given day; (ii) a debt security that has recently gone into default and for which there is not a current market quotation; (iii) a security of an issuer that has entered into a restructuring; (iv) a security that has been delisted from a national exchange; (v) a security subject to trading collars for which no or limited trading takes place; and (vi) a security whose principal market has been temporarily closed at a time when, under normal conditions, it would be open. Securities valued in this manner are generally categorized as Level 2 or 3 in the hierarchy.
Investments in mutual funds, including money market funds, are valued at their respective NAVs at the close of business each day on the valuation date. These securities are generally categorized as Level 1 in the hierarchy.
Futures contracts are valued at the last posted settlement price on the market where such futures are primarily traded. These securities are generally categorized as Level 1 in the hierarchy.
Options contracts are valued at the last posted settlement price on the market where such options are primarily traded.
Swaps are marked to market daily based upon quotations from pricing agents, brokers or market makers. These securities are generally categorized as Level 2 in the hierarchy.
| 32 | MainStay VP PIMCO Real Return Portfolio |
Debt securities (other than convertible and municipal bonds) are valued at the evaluated bid prices (evaluated mean prices in the case of convertible and municipal bonds) supplied by a pricing agent or broker selected by the Valuation Designee, in consultation with the Subadvisor. The evaluations are market-based measurements processed through a pricing application and represents the pricing agent’s good faith determination as to what a holder may receive in an orderly transaction under market conditions. The rules-based logic utilizes valuation techniques that reflect participants’ assumptions and vary by asset class and per methodology, maximizing the use of relevant observable data including quoted prices for similar assets, benchmark yield curves and market corroborated inputs. The evaluated bid or mean prices are deemed by the Valuation Designee, in consultation with the Subadvisor, to be representative of market values at the regular close of trading of the Exchange on each valuation date. Debt securities purchased on a delayed delivery basis are marked to market daily until settlement at the forward settlement date. Debt securities, including corporate bonds, U.S. government and federal agency bonds, municipal bonds, foreign bonds, convertible bonds, asset-backed securities and mortgage-backed securities are generally categorized as Level 2 in the hierarchy.
Foreign currency forward contracts are valued at their fair market values measured on the basis of the mean between the last current bid and ask prices based on dealer or exchange quotations and are generally categorized as Level 2 in the hierarchy.
Temporary cash investments acquired in excess of 60 days to maturity at the time of purchase are valued using the latest bid prices or using valuations based on a matrix system (which considers such factors as security prices, yields, maturities and ratings), both as furnished by independent pricing services. Temporary cash investments that mature in 60 days or less at the time of purchase ("Short-Term Investments") are valued using the amortized cost method of valuation, unless the use of such method would be inappropriate. The amortized cost method involves valuing a security at its cost on the date of purchase and thereafter assuming a constant amortization to maturity of the difference between such cost and the value on maturity date. Amortized cost approximates the current fair value of a security. Securities valued using the amortized cost method are not valued using quoted prices in an active market and are generally categorized as Level 2 in the hierarchy.
The information above is not intended to reflect an exhaustive list of the methodologies that may be used to value portfolio investments. The Valuation Procedures permit the use of a variety of valuation methodologies in connection with valuing portfolio investments. The methodology used for a specific type of investment may vary based on the market data available or other considerations. The methodologies summarized above may not represent the specific means by which portfolio investments are valued on any particular business day.
(B) Income Taxes. The Portfolio's policy is to comply with the requirements of the Internal Revenue Code of 1986, as amended (the “Internal Revenue Code”), applicable to regulated investment companies
and to distribute all of its taxable income to the shareholders of the Portfolio within the allowable time limits.
The Manager evaluates the Portfolio’s tax positions to determine if the tax positions taken meet the minimum recognition threshold in connection with accounting for uncertainties in income tax positions taken or expected to be taken for the purposes of measuring and recognizing tax liabilities in the financial statements. Recognition of tax benefits of an uncertain tax position is permitted only to the extent the position is “more likely than not” to be sustained assuming examination by taxing authorities. The Manager analyzed the Portfolio's tax positions taken on federal, state and local income tax returns for all open tax years (for up to three tax years) and has concluded that no provisions for federal, state and local income tax are required in the Portfolio's financial statements. The Portfolio's federal, state and local income tax and federal excise tax returns for tax years for which the applicable statutes of limitations have not expired are subject to examination by the Internal Revenue Service and state and local departments of revenue.
(C) Foreign Taxes. The Portfolio may be subject to foreign taxes on income and other transaction-based taxes imposed by certain countries in which it invests. A portion of the taxes on gains on investments or currency purchases/repatriation may be reclaimable. The Portfolio will accrue such taxes and reclaims as applicable, based upon its current interpretation of tax rules and regulations that exist in the markets in which it invests.
The Portfolio may be subject to taxation on realized capital gains, repatriation proceeds and other transaction-based taxes imposed by certain countries in which it invests. The Portfolio will accrue such taxes as applicable based upon its current interpretation of tax rules and regulations that exist in the market in which it invests. Capital gains taxes relating to positions still held are reflected as a liability in the Statement of Assets and Liabilities, as well as an adjustment to the Portfolio's net unrealized appreciation (depreciation). Taxes related to capital gains realized, if any, are reflected as part of net realized gain (loss) in the Statement of Operations. Changes in tax liabilities related to capital gains taxes on unrealized investment gains, if any, are reflected as part of the change in net unrealized appreciation (depreciation) on investments in the Statement of Operations. Transaction-based charges are generally assessed as a percentage of the transaction amount.
(D) Dividends and Distributions to Shareholders. Dividends and distributions are recorded on the ex-dividend date. The Portfolio intends to declare and pay dividends from net investment income and distributions from net realized capital and currency gains, if any, at least annually. All dividends and distributions are reinvested at NAV in the same class of shares of the Portfolio. Dividends and distributions to shareholders are determined in accordance with federal income tax regulations and may differ from determinations using GAAP.
(E) Security Transactions and Investment Income. The Portfolio records security transactions on the trade date. Realized gains and losses on security transactions are determined using the identified cost method.
Notes to Financial Statements (continued)
Dividend income is recognized on the ex-dividend date, net of any foreign tax withheld at the source, and interest income is accrued as earned using the effective interest rate method. Distributions received from real estate investment trusts may be classified as dividends, capital gains and/or return of capital. Discounts and premiums on securities purchased for the Portfolio are accreted and amortized, respectively, on the effective interest rate method.
Investment income and realized and unrealized gains and losses on investments of the Portfolio are allocated pro rata to the separate classes of shares based upon their relative net assets on the date the income is earned or realized and unrealized gains and losses are incurred.
The Portfolio may place a debt security on non-accrual status and reduce related interest income by ceasing current accruals and writing off all or a portion of any interest receivables when the collection of all or a portion of such interest has become doubtful. A debt security is removed from non-accrual status when the issuer resumes interest payments or when collectability of interest is reasonably assured.
(F) Expenses. Expenses of the Fund are allocated to the individual Portfolios in proportion to the net assets of the respective Portfolios when the expenses are incurred, except where direct allocations of expenses can be made. Expenses (other than fees incurred under the distribution and service plans, further discussed in Note 3(B), which are charged directly to the Service Class shares) are allocated to separate classes of shares pro rata based upon their relative net assets on the date the expenses are incurred. The expenses borne by the Portfolio, including those of related parties to the Portfolio, are shown in the Statement of Operations.
Additionally, the Portfolio may invest in mutual funds, which are subject to management fees and other fees that may cause the costs of investing in mutual funds to be greater than the costs of owning the underlying securities directly. These indirect expenses of mutual funds are not included in the amounts shown as expenses in the Statement of Operations or in the expense ratios included in the Financial Highlights.
(G) Use of Estimates. In preparing financial statements in conformity with GAAP, the Manager makes estimates and assumptions that affect the reported amounts and disclosures in the financial statements. Actual results could differ from those estimates and assumptions.
(H) Futures Contracts. A futures contract is an agreement to purchase or sell a specified quantity of an underlying instrument at a specified future date and price, or to make or receive a cash payment based on the value of a financial instrument (e.g., foreign currency, interest rate, security or securities index). The Portfolio is subject to risks such as market price risk, leverage risk, liquidity risk, counterparty risk, operational risk, legal risk and/or interest rate risk in the normal course of investing in these contracts. Upon entering into a futures contract, the Portfolio is required to pledge to the broker or futures commission merchant an amount of cash and/or U.S. government securities equal to a certain percentage of the collateral amount, known as the “initial margin.” During the period the futures contract is open, changes in the
value of the contract are recognized as unrealized appreciation or depreciation by marking to market such contract on a daily basis to reflect the market value of the contract at the end of each day’s trading. The Portfolio agrees to receive from or pay to the broker or futures commission merchant an amount of cash equal to the daily fluctuation in the value of the contract. Such receipts or payments are known as “variation margin.” When the futures contract is closed, the Portfolio records a realized gain or loss equal to the difference between the proceeds from (or cost of) the closing transaction and the Portfolio's basis in the contract.
The use of futures contracts involves, to varying degrees, elements of market risk in excess of the amount recognized in the Statement of Assets and Liabilities. The contract or notional amounts and variation margin reflect the extent of the Portfolio's involvement in open futures positions. There are several risks associated with the use of futures contracts as hedging techniques. There can be no assurance that a liquid market will exist at the time when the Portfolio seeks to close out a futures contract. If no liquid market exists, the Portfolio would remain obligated to meet margin requirements until the position is closed. Futures contracts may involve a small initial investment relative to the risk assumed, which could result in losses greater than if the Portfolio did not invest in futures contracts. Futures contracts may be more volatile than direct investments in the instrument underlying the futures and may not correlate to the underlying instrument, causing a given hedge not to achieve its objectives. The Portfolio's activities in futures contracts have minimal counterparty risk as they are conducted through regulated exchanges that guarantee the futures against default by the counterparty. In the event of a bankruptcy or insolvency of a futures commission merchant that holds margin on behalf of the Portfolio, the Portfolio may not be entitled to the return of the entire margin owed to the Portfolio, potentially resulting in a loss. The Portfolio may invest in futures contracts to seek enhanced returns or to reduce the risk of loss by hedging certain of its holdings. The Portfolio's investment in futures contracts and other derivatives may increase the volatility of the Portfolio's NAVs and may result in a loss to the Portfolio. Open futures contracts as of December 31, 2022, are shown in the Portfolio of Investments.
(I) Swap Contracts. The Portfolio may enter into credit default, interest rate, equity, index and currency exchange rate swap contracts (“swaps”). In a typical swap transaction, two parties agree to exchange the future returns (or differentials in rates of future returns) earned or realized at periodic intervals on a particular investment or instrument based on a notional principal amount. Generally, the Portfolio will enter into a swap on a net basis, which means that the two payment streams under the swap are netted, with the Portfolio receiving or paying (as the case may be) only the net amount of the two payment streams. Therefore, the Portfolio's current obligation under a swap generally will be equal to the net amount to be paid or received under the swap, based on the relative value of notional positions attributable to each counterparty to the swap. The payments may be adjusted for transaction costs, interest payments, the amount of interest paid on the investment or instrument or other factors. Collateral, in the form of cash or securities, may be required to be held in
| 34 | MainStay VP PIMCO Real Return Portfolio |
segregated accounts with the custodian bank or broker in accordance with the terms of the swap. Swap agreements are privately negotiated in the over the counter (“OTC”) market and may be executed in a multilateral or other trade facilities platform, such as a registered commodities exchange (“centrally cleared swaps”).
Certain standardized swaps, including certain credit default and interest rate swaps, are subject to mandatory clearing and exchange-trading, and more types of standardized swaps are expected to be subject to mandatory clearing and exchange-trading in the future. The counterparty risk for exchange-traded and cleared derivatives is expected to be generally lower than for uncleared derivatives, but cleared contracts are not risk-free. In a cleared derivative transaction, the Portfolio typically enters into the transaction with a financial institution counterparty, and performance of the transaction is effectively guaranteed by a central clearinghouse, thereby reducing or eliminating the Portfolio's exposure to the credit risk of its original counterparty. The Portfolio will be required to post specified levels of margin with the clearinghouse or at the instruction of the clearinghouse; the margin required by a clearinghouse may be greater than the margin the Portfolio would be required to post in an uncleared transaction. As of December 31, 2022, all swap positions outstanding are shown in the Portfolio of Investments.
Swaps are marked to market daily based upon quotations from pricing agents, brokers, or market makers and the change in value, if any, is recorded as unrealized appreciation or depreciation. Any payments made or received upon entering into a swap would be amortized or accreted over the life of the swap and recorded as a realized gain or loss. Early termination of a swap is recorded as a realized gain or loss. Daily changes in valuation of centrally cleared swaps, if any, are recorded as a receivable or payable for the change in value as appropriate on the Statement of Assets and Liabilities.
The Portfolio bears the risk of loss of the amount expected to be received under a swap in the event of the default or bankruptcy of the swap counterparty. The Portfolio may be able to eliminate its exposure under a swap either by assignment or other disposition, or by entering into an offsetting swap with the same party or a similar credit-worthy party. Swaps are not actively traded on financial markets. Entering into swaps involves elements of credit, market, leverage, liquidity, operational, counterparty and legal/documentation risk in excess of the amounts recognized on the Statement of Assets and Liabilities. Such risks involve the possibilities that there will be no liquid market for these swaps, that the counterparty to the swaps may default on its obligation to perform or disagree as to the meaning of the contractual terms in the swaps and that there may be unfavorable changes in interest rates, the price of the index or the security underlying these transactions, among other risks.
Total Return Swap Agreements are entered into to gain or mitigate exposure to the underlying reference asset. Total return swap agreements involve commitments where single or multiple cash flows are exchanged based on the price of an underlying reference asset and on a fixed or variable interest rate. Total return swap agreements may involve commitments to pay interest in exchange for a market-linked return. One
counterparty pays out the total return of a specific underlying reference asset, which may include a single security, a basket of securities, or an index, and in return receives a fixed or variable rate. At the maturity date, a net cash flow is exchanged where the total return is equivalent to the return of the underlying reference asset less a financing rate, if any. As a receiver, the Portfolio would receive payments based on any net positive total return and would owe payments in the event of a net negative total return. As the payer, the Portfolio would owe payments on any net positive total return, and would receive payments in the event of a net negative total return.
Inflation Swaps: Inflation swap agreements are contracts in which one party agrees to pay the cumulative percentage increase in a price index (the Consumer Price Index with respect to CPI swaps) over the term of the swap (with some lag on the inflation index), and the other pays a compounded fixed rate. Inflation swaps may be used to protect the net asset value, or NAV, of a Fund against an unexpected change in the rate of inflation measured by an inflation index since the value of these agreements is expected to increase if there are unexpected inflation increases.
Interest Rate Swaps : An interest rate swap is an agreement between two parties where one stream of future interest payments is exchanged for another based on a specified principal amount. Interest rate swaps often exchange a fixed payment for a floating payment that is linked to an interest rate (most often LIBOR). The Portfolio will typically use interest rate swaps to limit, or manage, its exposure to fluctuations in interest rates, or to obtain a marginally lower interest rate than it would have been able to get without the swap.
Credit Default Swaps : The Portfolio may enter into credit default swaps to simulate long and short bond positions or to take an active long or short position with respect to the likelihood of a default or credit event by the issuer of the underlying reference obligation. The types of reference obligations underlying the swaps that may be entered into by the Portfolio include debt obligations of a single issuer of corporate or sovereign debt, a basket of obligations of different issuers or a credit index. A credit index is an equally-weighted credit default swap index that is designed to track a representative segment of the credit default swap market (e.g., investment grade, high volatility, below investment grade or emerging markets) and provides an investor with exposure to specific "baskets" of issuers of certain debt instruments. Index credit default swaps have standardized terms including a fixed spread and standard maturity dates. The composition of the obligations within a particular index changes periodically. Credit default swaps involve one party, the protection buyer, making a stream of payments to another party, the protection seller, in exchange for the right to receive a contingent payment if there is a credit event related to the underlying reference obligation. In the event that the reference obligation matures prior to the termination date of the contract, a similar security will be substituted for the duration of the contract term. Credit events are defined under individual swap agreements and generally include bankruptcy, failure to pay, restructuring, repudiation/moratorium, obligation acceleration and obligation default. Selling protection effectively adds leverage to a portfolio up to the notional
Notes to Financial Statements (continued)
amount of the swap agreement. Potential liabilities under these contracts may be reduced by: the auction rates of the underlying reference obligations; upfront payments received at the inception of a swap; and net amounts received from credit default swaps purchased with the identical reference obligation. Open swap agreements as of December 31, 2022, are shown in the Portfolio of Investments.
(J) Foreign Currency Forward Contracts. The Portfolio may enter into foreign currency forward contracts, which are agreements to buy or sell foreign currencies on a specified future date at a specified rate. The Portfolio is subject to foreign currency exchange rate risk in the normal course of investing in these transactions. During the period the forward contract is open, changes in the value of the contract are recognized as unrealized appreciation or depreciation by marking to market such contract on a daily basis to reflect the market value of the contract at the end of each day’s trading. Cash movement occurs on the settlement date. When the forward contract is closed, the Portfolio records a realized gain or loss equal to the difference between the proceeds from (or cost of) the closing transaction and the Portfolio's basis in the contract. The Portfolio may purchase and sell foreign currency forward contracts for purposes of seeking to enhance portfolio returns and manage portfolio risk more efficiently. Foreign currency forward contracts may also be used to gain exposure to a particular currency or to hedge against the risk of loss due to changing currency exchange rates. Foreign currency forward contracts to purchase or sell a foreign currency may also be used in anticipation of future purchases or sales of securities denominated in foreign currency, even if the specific investments have not yet been selected.
The use of foreign currency forward contracts involves, to varying degrees, elements of risk in excess of the amount recognized in the Statement of Assets and Liabilities, including counterparty risk, market risk, leverage risk, operational risk, legal risk and liquidity risk. Counterparty risk is heightened for these instruments because foreign currency forward contracts are not exchange-traded and therefore no clearinghouse or exchange stands ready to meet the obligations under such contracts. Thus, the Portfolio faces the risk that its counterparties under such contracts may not perform their obligations. Market risk is the risk that the value of a foreign currency forward contract will depreciate due to unfavorable changes in exchange rates. Liquidity risk arises because the secondary market for foreign currency forward contracts may have less liquidity relative to markets for other securities and financial instruments. Liquidity risk also can arise when forward currency contracts create margin or settlement payment obligations for the Fund. Leverage risk is the risk that a foreign currency forward contract can magnify the Portfolio's gains and losses. Operational risk refers to risk related to potential operational issues (including documentation issues, settlement issues, systems failures, inadequate controls and human error), and legal risk refers to insufficient documentation, insufficient capacity or authority of the counterparty, or legality or enforceability of a foreign currency forward contract. Risks also arise from the possible movements in the foreign exchange rates underlying these instruments. While the Portfolio may enter into forward contracts to reduce currency exchange risks, changes in currency exchange rates may result in poorer
overall performance for the Portfolio than if it had not engaged in such transactions. Exchange rate movements can be large, depending on the currency, and can last for extended periods of time, affecting the value of the Portfolio's assets. Moreover, there may be an imperfect correlation between the Portfolio's holdings of securities denominated in a particular currency and forward contracts entered into by the Portfolio. Such imperfect correlation may prevent the Portfolio from achieving the intended hedge or expose the Portfolio to the risk of currency exchange loss. The unrealized appreciation (depreciation) on forward contracts also reflects the Portfolio's exposure at the valuation date to credit loss in the event of a counterparty’s failure to perform its obligations. Open foreign currency forward contracts as of December 31, 2022, are shown in the Portfolio of Investments.
(K) Foreign Currency Transactions. The Portfolio's books and records are maintained in U.S. dollars. Prices of securities denominated in foreign currency amounts are translated into U.S. dollars at the mean between the buying and selling rates last quoted by any major U.S. bank at the following dates:
(i) market value of investment securities, other assets and liabilities— at the valuation date; and
(ii) purchases and sales of investment securities, income and expenses—at the date of such transactions.
The assets and liabilities that are denominated in foreign currency amounts are presented at the exchange rates and market values at the close of the period. The realized and unrealized changes in net assets arising from fluctuations in exchange rates and market prices of securities are not separately presented.
Net realized gain (loss) on foreign currency transactions represents net currency gains or losses realized as a result of differences between the amounts of securities sale proceeds or purchase cost, dividends, interest and withholding taxes as recorded on the Portfolio's books, and the U.S. dollar equivalent amount actually received or paid. Net currency gains or losses from valuing such foreign currency denominated assets and liabilities, other than investments at valuation date exchange rates, are reflected in unrealized foreign exchange gains or losses.
(L) Securities Sold Short. During the year ended December 31, 2022, the Portfolio engaged in sales of securities it did not own ("short sales") as part of its investment strategies. During the period a short position is open, depending on the nature and type of security, a short position is reflected as a liability and is marked to market in accordance with the valuation methodologies previously detailed (See Note 2(A)). Liabilities for securities sold short are closed out by purchasing the applicable securities for delivery to the counterparty broker. A gain, limited to the price at which the Portfolio sold the security short, or a loss, unlimited as to dollar amount, will be recognized upon termination of a short sale if the market price on the date the short position is closed out is less or greater, respectively, than the proceeds originally received. Any such gain or loss may be offset, completely or in part, by the change in the value of the hedged investments. Interest on short positions held is
| 36 | MainStay VP PIMCO Real Return Portfolio |
accrued daily, while dividends declared on short positions existing on the record date are recorded on the ex-dividend date as a dividend expense in the Statement of Operations. Broker fees and other expenses related to securities sold short are disclosed in the Statement of Operations. Short sales involve risk of loss in excess of the related amounts reflected in the Statement of Assets and Liabilities. As of December 31, 2022, the Portfolio did not enter into any securities sold short.
(M) Securities Lending. In order to realize additional income, the Portfolio may engage in securities lending, subject to the limitations set forth in the 1940 Act and relevant guidance by the staff of the Securities and Exchange Commission (“SEC”). If the Portfolio engages in securities lending, the Portfolio will lend through its custodian, JPMorgan Chase Bank, N.A., ("JPMorgan"), acting as securities lending agent on behalf of the Portfolio. Under the current arrangement, JPMorgan will manage the Portfolio's collateral in accordance with the securities lending agency agreement between the Portfolio and JPMorgan, and indemnify the Portfolio against counterparty risk. The loans will be collateralized by cash (which may be invested in a money market fund) and/or non-cash collateral (which may include U.S. Treasury securities and/or U.S. government agency securities issued or guaranteed by the United States government or its agencies or instrumentalities) at least equal at all times to the market value of the securities loaned. Non-cash collateral held at year end is segregated and cannot be transferred by the Portfolio. The Portfolio bears the risk of delay in recovery of, or loss of rights in, the securities loaned. The Portfolio may also record a realized gain or loss on securities deemed sold due to a borrower’s inability to return securities on loan. The Portfolio bears the risk of any loss on investment of cash collateral. The Portfolio will receive compensation for lending its securities in the form of fees or it will retain a portion of interest earned on the investment of any cash collateral. The Portfolio will also continue to receive interest and dividends on the securities loaned and any gain or loss in the market price of the securities loaned that may occur during the term of the loan will be for the account of the Portfolio. Income earned from securities lending activities, if any, is reflected in the Statement of Operations. As of December 31, 2022, the Portfolio did not have any portfolio securities on loan.
(N) Dollar Rolls. The Portfolio may enter into dollar roll transactions in which it sells mortgage-backed securities ("MBS") from its portfolio to a counterparty from whom it simultaneously agrees to buy a similar security on a delayed delivery basis. The Portfolio generally transfers MBS where the MBS are "to be announced," therefore, the Portfolio accounts for these transactions as purchases and sales.
When accounted for as purchase and sales, the securities sold in connection with the dollar rolls are removed from the portfolio and a realized gain or loss is recognized. The securities the Portfolio has agreed to acquire are included at market value in the Portfolio of Investments and liabilities for such purchase commitments are included as payables for investments purchased. During the roll period, the Portfolio foregoes principal and interest paid on the securities. The Portfolio is compensated by the difference between the current sales price and the forward price
for the future as well as by the earnings on the cash proceeds of the initial sale. Dollar rolls may be renewed without physical delivery of the securities subject to the contract. Dollar roll transactions involve certain risks, including the risk that the securities returned to the Portfolio at the end of the roll period, while substantially similar, could be inferior to what was initially sold to the counterparty.
(O) Options Contracts. The Portfolio may write call and put options on securities and financial derivative instruments it owns or in which it may invest. Writing put options tends to increase the Portfolio’s exposure to the underlying instrument. Writing call options tends to decrease the Portfolio’s exposure to the underlying instrument. When the Portfolio writes a call or put, an amount equal to the premium received is recorded as a liability and subsequently marked to market to reflect the current value of the option written. These liabilities are reflected as written options outstanding on the Statement of Assets and Liabilities. Premiums received from writing options which expire are treated as realized gains. Premiums received from writing options which are exercised or closed are added to the proceeds or offset against amounts paid on the underlying futures, swaps, security or currency transaction to determine the realized gain or loss. Certain options may be written with premiums to be determined on a future date. Entering into options contracts involves leverage risk, liquidity risk, counterparty risk, market risk, operational risk and legal risk. The Portfolio, as a writer of an option, has no control over whether the underlying instrument may be sold (call) or purchased (put) and as a result bears the market risk of an unfavorable change in the price of the instrument underlying the written option. There is the risk the Portfolio may not be able to enter into a closing transaction because of an illiquid market. Writing call options involves risk of loss in excess of the related amounts reflected in the Statement of Assets and Liabilities.
The Portfolio may also purchase put and call options. Purchasing call options tends to increase the Portfolio’s exposure to the underlying instrument. Alternatively, purchasing put options tends to decrease the Portfolio’s exposure to the underlying instrument. The Portfolio pays a premium which is included on the Portfolio’s Statement of Assets and Liabilities as an investment and subsequently marked to market to reflect the current value of the option. Premiums paid for purchasing options which expire are treated as realized losses. Certain options may be purchased with premiums to be determined on a future date. The premiums for these options are based upon implied volatility parameters at specified terms. The risk associated with purchasing put and call options is limited to the premium paid. Premiums paid for purchasing options which are exercised or closed are added to the amounts paid or offset against the proceeds on the underlying investment transaction to determine the realized gain or loss when the underlying transaction is sold.
The Portfolio may purchase or write foreign currency options. Purchasing a foreign currency option gives the Portfolio the right, but not the obligation, to buy or sell a specified amount of the currency at a specified rate of exchange that may be exercised on or before the option’s expiration date. Writing a foreign currency option obligates the Portfolio to
Notes to Financial Statements (continued)
buy or sell a specified amount of foreign currency at a specified rate of exchange, and such option may be exercised on or before the option’s expiration date in exchange for an option premium. These options may be used as a short or long hedge against possible variations in foreign exchange rates or to gain exposure to foreign currencies. The risks associated with writing a foreign currency put option include the risk that the Portfolio may incur a loss if the value of the referenced foreign currency decreases and the option is exercised. The risks associated with writing a foreign currency call option include the risk that if the value of the referenced foreign currency increases, and if the option is exercised, the Portfolio must either acquire the referenced foreign currency at the then higher price for delivery or, if the Portfolio already owns the referenced foreign currency, forego the opportunity for profit with respect to such foreign currency.
The Portfolio may purchase or write option on exchanged-traded futures contracts (“Futures Option”) to hedge an existing position or futures investment, for speculative purposes or to manage exposure to market movements. A Futures Option is an option contract in which the underlying instrument is a single futures contract.
The Portfolio may purchase or write inflation-capped options to enhance returns or for hedging opportunities. An inflation-capped option pays out if inflation exceeds a certain level over a specified period of time. The purpose of purchasing inflation-capped options is to protect the Portfolio from inflation erosion above a certain rate on a given notional exposure. When the Portfolio writes an inflation-capped option, an amount equal to the premium received is recorded as a liability and subsequently marked to market to reflect the current value of the option written. Open options as of December 31, 2022, are shown in the Portfolio of Investments.
(P) Reverse Repurchase Agreements. The Portfolio may enter into reverse repurchase agreements with banks or broker/dealers, which involve the sale of a security by a Portfolio and its agreement to repurchase the instrument at a specified time and price. Under a reverse repurchase agreement, the Portfolio continues to receive any principal and interest payments on the underlying security during the term of the agreement. These agreements involve the sale of debt securities, or obligations, held by a Portfolio, with an agreement to repurchase the obligations at an agreed-upon price, date and interest payment. The proceeds will be used to purchase other debt securities either maturing, or under an agreement to resell, at a date simultaneous with or prior to the expiration of the reverse repurchase agreement. Reverse repurchase agreements will be utilized, when permitted by law, only when the interest income to be earned from the investment of the proceeds from the transaction is greater than the interest expense of the reverse repurchase transaction.
The Portfolio will invest in reverse repurchase agreements in accordance with Rule 18f-4 under the 1940 Act. The use of reverse repurchase agreements by the Portfolio creates leverage that increases the Portfolio’s investment risk. If the income and gains on securities purchased with the proceeds of reverse repurchase agreements exceed the cost of the agreements, the Portfolio’s earnings or NAV will increase faster than
otherwise would be the case; conversely, if the income and gains fail to exceed the costs, earnings or NAV would decline faster than otherwise would be the case. If the buyer of the obligation subject to the reverse repurchase agreement becomes bankrupt, realization upon the underlying securities may be delayed and there is a risk of loss due to any decline in their value. During the year ended December 31, 2022, the Portfolio’s average amount of borrowings was $35,910,575 at a weighted average interest rate of 0.01%. As of December 31, 2022, the Portfolio did not enter into any reverse repurchase agreements.
(Q) Sale-Buybacks. The Portfolio may enter into financing transactions referred to as ‘sale-buybacks’ in accordance with Rule 18f-4 under the 1940 Act. A sale-buyback transaction consists of a sale of a security by the Portfolio to a financial institution, the counterparty, with a simultaneous agreement to repurchase the same or substantially the same security at an agreed-upon price and date. The Portfolio is not entitled to receive principal and interest payments, if any, made on the security sold to the counterparty during the term of the agreement. The agreed-upon proceeds for securities to be repurchased by the Portfolio are reflected as a liability on the Statement of Assets and Liabilities. The Portfolio will recognize net income represented by the price differential between the price received for the transferred security and the agreed-upon repurchase price. This is commonly referred to as the “price drop”. A price drop consists of (i) the foregone interest and inflationary income adjustments, if any, the Portfolio would have otherwise received had the security not been sold and (ii) the negotiated financing terms between the Portfolio and counterparty. Foregone interest and inflationary income adjustments, if any, are recorded as components of interest income on the Statement of Operations. Interest payments based upon negotiated financing terms made by the Portfolio to counterparties are recorded as a component of interest expense on the Statement of Operations. In periods of increased demand for the security, the Portfolio may receive a fee for use of the security by the counterparty, which may result in interest income to the Portfolio. Sale-buybacks as of December 31, 2022 are shown in the Portfolio of Investments.
(R) Delayed Delivery Transactions. The Portfolio may purchase or sell securities on a delayed delivery basis. These transactions involve a commitment by the Portfolio to purchase or sell securities for a predetermined price or yield, with payment and delivery taking place beyond the customary settlement period. When delayed delivery purchases are outstanding, the Portfolio will designate liquid assets in an amount sufficient to meet the purchase price. When purchasing a security on a delayed delivery basis, the Portfolio assumes the rights and risks of ownership of the security, including the risk of price and yield fluctuations, and takes such fluctuations into account when determining its NAV. The Portfolio may dispose of or renegotiate a delayed delivery transaction after it is entered into, and may sell delayed delivery securities before they are delivered, which may result in a realized gain or loss. When the Portfolio has sold a security it owns on a delayed delivery basis, the Portfolio does not participate in future gains and losses with respect to the security. Delayed delivery transactions as of December 31, 2022, are shown in the Portfolio of Investments.
| 38 | MainStay VP PIMCO Real Return Portfolio |
(S) Treasury Inflation-Protected Securities. The Portfolio invests in Treasury Inflation-Protected Securities (“TIPS”) which are specially structured bonds in which the principal amount is adjusted to keep pace with inflation. The inflation (deflation) adjustment is applied to the principal of each bond on a monthly basis and is accounted for as interest income on the Statement of Operations. TIPS are subject to interest rate risk. TIPS as of December 31, 2022, are shown in the Portfolio of Investments.
(T) Debt Securities Risk. The ability of issuers of debt securities held by the Portfolio to meet their obligations may be affected by, among other things, economic or political developments in a specific country, industry or region. Debt securities are also subject to the risks associated with changes in interest rates.
The Portfolio primarily invests in high yield debt securities (commonly referred to as “junk bonds”), which are considered speculative because they present a greater risk of loss, including default, than higher rated debt securities. These securities pay investors a premium—a higher interest rate or yield than investment grade debt securities—because of the increased risk of loss. These securities can also be subject to greater price volatility. In times of unusual or adverse market, economic or political conditions, these securities may experience higher than normal default rates.
Investments in the Portfolio are not guaranteed, even though some of the Portfolio’s underlying investments are guaranteed by the U.S. government or its agencies or instrumentalities. The principal risk of mortgage-related and asset-backed securities is that the underlying debt may be prepaid ahead of schedule, if interest rates fall, thereby reducing the value of the Portfolio’s investment. If interest rates rise, less of the debt may be prepaid and the Portfolio may lose money because the Portfolio may be unable to invest in higher yielding assets. The Portfolio is subject to interest-rate risk and can lose principal value when interest rates rise. Bonds are also subject to credit risk, in which the bond issuer may fail to pay interest and principal in a timely manner.
The Portfolio may invest in foreign debt securities, which carry certain risks that are in addition to the usual risks inherent in domestic debt securities. These risks include those resulting from currency fluctuations, future adverse political or economic developments and possible imposition of currency exchange blockages or other foreign governmental laws or restrictions. These risks are likely to be greater in emerging markets than in developed markets. The ability of issuers of debt securities held by the Portfolio to meet their obligations may be affected by, among other things, economic or political developments in a specific country, industry or region.
(U) Counterparty Credit Risk. In order to better define its contractual rights and to secure rights that will help the Portfolio mitigate its counterparty risk, the Portfolio may enter into an International Swaps and Derivatives Association, Inc. Master Agreement (“ISDA Master Agreement”) or similar agreement with its counterparties. An ISDA Master Agreement is a bilateral agreement between the Portfolio and a
counterparty that governs certain OTC derivatives and typically contains collateral posting terms and netting provisions. Under an ISDA Master Agreement, the Portfolio may, under certain circumstances, offset with the counterparty certain derivative financial instruments’ payables and/ or receivables with collateral held and/or posted and create one single net payment. The provisions of the ISDA Master Agreement typically permit a single net payment in the event of default including the bankruptcy or insolvency of the counterparty. Bankruptcy or insolvency laws of a particular jurisdiction may restrict or prohibit the right of offset in bankruptcy, insolvency or other events. In addition, certain ISDA Master Agreements may contain provisions for early termination of OTC derivative transactions in the event the net assets of the Portfolio decline below specific levels or if the Portfolio fails to meet the terms of its ISDA Master Agreements. The result would cause the Portfolio to accelerate payment of any net liability owed to the counterparty.
For financial reporting purposes, the Portfolio does not offset derivative assets and derivative liabilities that are subject to netting arrangements, if any, in the Statement of Assets and Liabilities.
(V) LIBOR Replacement Risk. The Portfolio may invest in certain debt securities, derivatives or other financial instruments that utilize the London Interbank Offered Rate ("LIBOR"), as a “benchmark” or “reference rate” for various interest rate calculations. As of January 1, 2022, the United Kingdom Financial Conduct Authority, which regulates LIBOR, ceased its active encouragement of banks to provide the quotations needed to sustain most LIBOR rates due to the absence of an active market for interbank unsecured lending and other reasons. However, the United Kingdom Financial Conduct Authority, the LIBOR administrator and other regulators announced that the most widely used tenors of U.S. dollar LIBOR will continue until mid-2023. As a result, it is anticipated that the remaining LIBOR settings will be discontinued or will no longer be sufficiently robust to be representative of its underlying market around that time. Various financial industry groups will plan for that transition and certain regulators and industry groups have taken actions to establish alternative reference rates (e.g., the Secured Overnight Financing Rate, which measures the cost of overnight borrowings through repurchase agreement transactions collateralized with U.S. Treasury securities and is intended to replace U.S. dollar LIBOR with certain adjustments). However, there are challenges to converting certain contracts and transactions to a new benchmark and neither the full effects of the transition process nor its ultimate outcome is known.
The elimination of LIBOR or changes to other reference rates or any other changes or reforms to the determination or supervision of reference rates could have an adverse impact on the market for, or value of, any securities or payments linked to those reference rates, which may adversely affect the Portfolio's performance and/or net asset value. Uncertainty and risk also remain regarding the willingness and ability of issuers and lenders to include enhanced provisions in new and existing contracts or instruments. Consequently, the transition away from LIBOR to other reference rates may lead to increased volatility and illiquidity in markets that are tied to LIBOR, fluctuations in values of LIBOR-related
Notes to Financial Statements (continued)
investments or investments in issuers that utilize LIBOR, increased difficulty in borrowing or refinancing and diminished effectiveness of hedging strategies, adversely affecting the Portfolio's performance. Furthermore, the risks associated with the expected discontinuation of LIBOR and transition may be exacerbated if the work necessary to effect an orderly transition to an alternative reference rate is not completed in a timely manner. While the transition away from LIBOR has already begun with no material adverse effect to the Portfolio's performance, the transition is expected to last through mid-2023 for some LIBOR tenors. The usefulness of LIBOR as a benchmark could deteriorate anytime during this transition period.
(W) Indemnifications. Under the Fund’s organizational documents, its officers and trustees are indemnified against certain liabilities that may arise out of performance of their duties to the Fund. Additionally, in the normal course of business, the Portfolio enters into contracts with third-party service providers that contain a variety of representations and warranties and that may provide general indemnifications. The Portfolio's maximum exposure under these arrangements is unknown, as this would involve future claims that may be made against the Portfolio that have not yet occurred. The Manager believes that the risk of loss in connection
with these potential indemnification obligations is remote. However, there can be no assurance that material liabilities related to such obligations will not arise in the future, which could adversely impact the Portfolio.
(X) Quantitative Disclosure of Derivative Holdings. The following tables show additional disclosures related to the Portfolio's derivative and hedging activities, including how such activities are accounted for and their effect on the Portfolio's financial positions, performance and cash flows.
The Portfolio wrote or purchased options to enhance returns or to hedge an existing position or future investment.
The Portfolio entered into futures contracts to manage its exposure to the securities markets or to movements in interest rates and currency values.
The Portfolio utilizes credit default, interest rate and inflation swap agreements to manage its exposure to credit, interest rate and inflation risk.
The Portfolio entered into foreign currency forward contracts to to hedge the currency exposure associated with some or all of the Portfolio's securities or as a part of an investment strategy.
Fair value of derivative instruments as of December 31, 2022:
| Asset Derivatives | Foreign
Exchange
Contracts
Risk | Interest
Rate
Contracts
Risk | Total |
| Purchased Options - Investments in securities, at value | $ — | $ 17,701 | $ 17,701 |
| Futures Contracts - Net Assets—Net unrealized appreciation on futures contracts (a) | — | 4,618,997 | 4,618,997 |
| OTC Swap Contracts - Unrealized appreciation on OTC swap contracts | — | 171,800 | 171,800 |
| Centrally Cleared Swap Contracts - Net Assets—Net unrealized appreciation on swap contracts (b) | — | 3,281,168 | 3,281,168 |
| Forward Contracts - Unrealized appreciation on foreign currency forward contracts | 44,110 | — | 44,110 |
| Total Fair Value | $44,110 | $8,089,666 | $8,133,776 |
| (a) | Includes cumulative appreciation (depreciation) of futures contracts as reported in the Portfolio of Investments. Only current day’s variation margin is reported within the Statement of Assets and Liabilities. |
| (b) | Includes cumulative appreciation (depreciation) of centrally cleared swap agreements as reported in the Portfolio of Investments. Only the current day’s variation margin is reported within the Statement of Assets and Liabilities. |
| Liability Derivatives | Foreign
Exchange
Contracts
Risk | Credit
Contracts
Risk | Interest
Rate
Contracts
Risk | Total |
| Written Options - Investments in written options, at value | $ — | $ — | $ (141,204) | $ (141,204) |
| Futures Contracts - Net Assets—Net unrealized depreciation on futures contracts (a) | — | — | (2,751,772) | (2,751,772) |
| OTC Swap Contracts - Unrealized depreciation on OTC swap contracts | — | — | (950,200) | (950,200) |
| Centrally Cleared Swap Contracts - Net Assets—Net unrealized depreciation on swap contracts (b) | — | (53) | (5,679,475) | (5,679,528) |
| Forward Contracts - Unrealized depreciation on foreign currency forward contracts | (1,837,395) | — | — | (1,837,395) |
| Total Fair Value | $(1,837,395) | $(53) | $(9,522,651) | $(11,360,099) |
| (a) | Includes cumulative appreciation (depreciation) of futures contracts as reported in the Portfolio of Investments. Only current day’s variation margin is reported within the Statement of Assets and Liabilities. |
| (b) | Includes cumulative appreciation (depreciation) of centrally cleared swap agreements as reported in the Portfolio of Investments. Only the current day’s variation margin is reported within the Statement of Assets and Liabilities. |
| 40 | MainStay VP PIMCO Real Return Portfolio |
The effect of derivative instruments on the Statement of Operations for the year ended December 31, 2022:
| Net Realized Gain (Loss) from: | Foreign
Exchange
Contracts
Risk | Credit
Contracts
Risk | Interest
Rate
Contracts
Risk | Total |
| Purchased Options | $ — | $ — | $ (77,002) | $ (77,002) |
| Written Options | — | 56,176 | 167,128 | 223,304 |
| Futures Contracts | — | — | 15,333,109 | 15,333,109 |
| Swap Contracts | — | 1,349 | (5,082,680) | (5,081,331) |
| Forward Contracts | 8,663,860 | — | — | 8,663,860 |
| Total Net Realized Gain (Loss) | $8,663,860 | $57,525 | $10,340,555 | $19,061,940 |
| Net Change in Unrealized Appreciation (Depreciation) | Foreign
Exchange
Contracts
Risk | Credit
Contracts
Risk | Interest
Rate
Contracts
Risk | Total |
| Purchased Options | $ — | $ — | $ (318,219) | $ (318,219) |
| Written Options | — | (15,720) | 248,562 | 232,842 |
| Futures Contracts | — | — | 1,186,064 | 1,186,064 |
| Swap Contracts | — | (609) | (654,874) | (655,483) |
| Forward Contracts | (2,186,785) | — | — | (2,186,785) |
| Total Net Change in Unrealized Appreciation (Depreciation) | $(2,186,785) | $(16,329) | $ 461,533 | $(1,741,581) |
| Average Notional Amount | Total |
| Written Options (a) | $ (2,237,500) |
| Purchased Swaptions | $ 21,635,982 |
| Written Swaptions | $ (20,830,855) |
| Written Inflation—Capped Options | $ (300,000) |
| Options on Futures Contracts | $ 49,606 |
| Futures Contracts Long | $ 113,905,480 |
| Futures Contracts Short | $(201,735,836) |
| Swap Contracts Long | $ 139,735,082 |
| Forward Contracts Long | $ 14,601,184 |
| Forward Contracts Short | $(117,798,189) |
| (a) | Positions were open for eight months during the reporting period. |
(Y) Borrowings and other financing transactions summary
The following is a summary by counterparty of the market value of Borrowings and Other Financing Transactions and collateral (received)/pledged as of December 31, 2022:
| Counterparty | Payable for
Sale-Buyback
Transactions | Total
Borrowings and
Other Financing
Transactions | Collateral
(Received)/
Pledged | Net
Exposure (a) |
| Master Securities Forward Transaction Agreement | | | | |
| BNP Paribas S.A. | $(283,384,916) | $(283,384,916) | $283,424,755 | $39,839 |
| BofA Securities, Inc. | (36,684,550) | (36,684,550) | 36,693,623 | 9,073 |
| Total Borrowings and Other Financing Transactions | $(320,069,466) | $(320,069,466) | $320,118,378 | $48,912 |
| (a) | Net Exposure represents the net receivable/(payable) that would be due from/to the counterparty in the event of default. Exposure from borrowings and other financing transactions can only be netted across transactions governed under the same master agreement with the same legal entity. |
Notes to Financial Statements (continued)
Certain Transfers Accounted for as Secured Borrowings
Remaining Contractual Maturity of the Agreements
| | Overnight and
Continuous | Up to 30 days | 31-90 days | Greater than
90 days | Total |
| Sale-Buyback Transactions | | | | | |
| US Treasury Obligations | $— | $320,069,466 | $— | $— | $320,069,466 |
| Total Borrowings | $— | $320,069,466 | $— | $— | $320,069,466 |
| Payable for reverse repurchase agreements and sale-buyback financing transactions | | | | $320,069,466 |
Note 3–Fees and Related Party Transactions
(A) Manager and Subadvisor. New York Life Investments, a registered investment adviser and an indirect, wholly-owned subsidiary of New York Life, serves as the Portfolio’s Manager pursuant to an Amended and Restated Management Agreement (“Management Agreement”). The Manager provides offices, conducts clerical, recordkeeping and bookkeeping services, and keeps most of the financial and accounting records required to be maintained by the Portfolio. Except for the portion of salaries and expenses that are the responsibility of the Portfolio, the Manager pays the salaries and expenses of all personnel affiliated with the Portfolio and certain operational expenses of the Portfolio. During a portion of the year ended December 31, 2022, the Portfolio reimbursed New York Life Investments in an amount equal to the portion of the compensation of the Chief Compliance Officer attributable to the Portfolio. Pacific Investment Management Company LLC (“ PIMCO” or the “Subadvisor”), a registered investment adviser, serves as Subadvisor to the Portfolio and is responsible for the day-to-day portfolio management of the Portfolio. Pursuant to the terms of a Subadvisory Agreement between New York Life Investments and PIMCO, New York Life Investments pays for the services of the Subadvisor.
Pursuant to the Management Agreement, the Fund pays the Manager, on behalf of the Portfolio, a monthly fee for the services performed and the facilities furnished at an annual percentage of the Portfolio’s average daily net assets of 0.50% on all assets. During the year ended December 31, 2022, the effective management fee rate (exclusive of any applicable waivers/reimbursements) was 0.50%.
New York Life Investments has contractually agreed to waive fees and/or reimburse expenses so that the Total Annual Portfolio Operating Expenses (excluding taxes, interest, litigation, extraordinary expenses, brokerage and other transaction expenses relating to the purchase or sale of portfolio investments, and acquired (underlying) portfolio/fund fees and expenses) of Initial Class shares and Service Class shares do not exceed 0.53% and 0.78%, respectively, of the Portfolio's average daily net assets. This agreement will remain in effect until May 1, 2023, and shall renew automatically for one-year terms unless New York Life Investments provides written notice of termination prior to the start of the next term or upon approval of the Board.
During the year ended December 31, 2022, New York Life Investments earned fees from the Portfolio in the amount of $2,594,771 and waived
fees and/or reimbursed expenses in the amount of $282,415 and paid the Subadvisor fees of $1,297,385.
JPMorgan provides sub-administration and sub-accounting services to the Portfolio pursuant to an agreement with New York Life Investments. These services include calculating the daily NAVs of the Portfolio, maintaining the general ledger and sub-ledger accounts for the calculation of the Portfolio's NAVs, and assisting New York Life Investments in conducting various aspects of the Portfolio's administrative operations. For providing these services to the Portfolio, JPMorgan is compensated by New York Life Investments.
Pursuant to an agreement between the Fund and New York Life Investments, New York Life Investments is responsible for providing or procuring certain regulatory reporting services for the Portfolio. The Portfolio will reimburse New York Life Investments for the actual costs incurred by New York Life Investments in connection with providing or procuring these services for the Portfolio.
(B) Distribution and Service Fees. The Fund, on behalf of the Portfolio, has entered into a distribution agreement with NYLIFE Distributors LLC (the “Distributor”), an affiliate of New York Life Investments. The Portfolio has adopted a distribution plan (the “Plan”) in accordance with the provisions of Rule 12b-1 under the 1940 Act. Under the Plan, the Distributor has agreed to provide, through its affiliates or independent third parties, various distribution-related, shareholder and administrative support services to the Service Class shareholders. For its services, the Distributor is entitled to a combined distribution and service fee accrued daily and paid monthly at an annual rate of 0.25% of the average daily net assets attributable to the Service Class shares of the Portfolio.
| 42 | MainStay VP PIMCO Real Return Portfolio |
Note 4-Federal Income Tax
As of December 31, 2022, the cost and unrealized appreciation (depreciation) of the Portfolio’s investment portfolio, including applicable derivative contracts and other financial instruments, as determined on a federal income tax basis, were as follows:
| | Federal Tax
Cost | Gross
Unrealized
Appreciation | Gross
Unrealized
(Depreciation) | Net
Unrealized
Appreciation/
(Depreciation) |
| Investments in Securities | $671,715,781 | $253,304 | $(132,422,794) | $(132,169,490) |
As of December 31, 2022, the components of accumulated gain (loss) on a tax basis were as follows:
Ordinary
Income | Accumulated
Capital
and Other
Gain (Loss) | Other
Temporary
Differences | Unrealized
Appreciation
(Depreciation) | Total
Accumulated
Gain (Loss) |
| $40,994,026 | $(3,710,643) | $(1) | $(131,706,021) | $(94,422,639) |
The difference between book-basis and tax-basis unrealized appreciation (depreciation) is primarily due to wash sale adjustments, cumulative bond amortization, cumulative mark to market of swaps, cumulative treasury inflation-protected securities, mark to market of forwards contract, mark to market of futures contracts, and straddle loss deferral.
As of December 31, 2022, for federal income tax purposes, capital loss carryforwards of $3,426,685, as shown in the table below, were available to the extent provided by the regulations to offset future realized gains of the Portfolio. Accordingly, no capital gains distributions are expected to be paid to shareholders until net gains have been realized in excess of such amounts.
Capital Loss
Available Through | Short-Term
Capital Loss
Amounts (000’s) | Long-Term
Capital Loss
Amounts (000’s) |
| Unlimited | $— | $3,427 |
The Portfolio utilized $54,632,984 of capital loss carryforwards during the year ended December 31, 2022.
During the years ended December 31, 2022 and December 31, 2021, the tax character of distributions paid as reflected in the Statements of Changes in Net Assets was as follows:
| | 2022 | 2021 |
| Distributions paid from: | | |
| Ordinary Income | $29,258,760 | $2,072,383 |
Note 5–Custodian
JPMorgan is the custodian of cash and securities held by the Portfolio. Custodial fees are charged to the Portfolio based on the Portfolio's net assets and/or the market value of securities held by the Portfolio and the number of certain transactions incurred by the Portfolio.
Note 6–Line of Credit
The Portfolio and certain other funds managed by New York Life Investments maintain a line of credit with a syndicate of banks in order to secure a source of funds for temporary purposes to meet unanticipated or excessive redemption requests.
Effective July 26, 2022, under the credit agreement (the “Credit Agreement”), the aggregate commitment amount is $600,000,000 with an additional uncommitted amount of $100,000,000. The commitment fee is an annual rate of 0.15% of the average commitment amount payable quarterly, regardless of usage, to JPMorgan, who serves as the agent to the syndicate. The commitment fee is allocated among the Portfolio and certain other funds managed by New York Life Investments based upon their respective net assets and other factors. Interest on any revolving credit loan is charged based upon the Federal Funds Rate, Daily Simple Secured Overnight Financing Rate ("SOFR") + 0.10%, or the Overnight Bank Funding Rate, whichever is higher. The Credit Agreement expires on July 25, 2023, although the Portfolio, certain other funds managed by New York Life Investments and the syndicate of banks may renew the Credit Agreement for an additional year on the same or different terms or enter into a credit agreement with a different syndicate of banks. Prior to July 26, 2022, the aggregate commitment amount and the commitment fee were the same as those under the current Credit Agreement. During the year ended December 31, 2022, there were no borrowings made or outstanding with respect to the Portfolio under the Credit Agreement.
Note 7–Interfund Lending Program
Pursuant to an exemptive order issued by the SEC, the Portfolio, along with certain other funds managed by New York Life Investments, may participate in an interfund lending program. The interfund lending program provides an alternative credit facility that permits the Portfolio and certain other funds managed by New York Life Investments to lend or borrow money for temporary purposes directly to or from one another, subject to the conditions of the exemptive order. During the year ended December 31, 2022, there were no interfund loans made or outstanding with respect to the Portfolio.
Note 8–Purchases and Sales of Securities (in 000’s)
During the year ended December 31, 2022, purchases and sales of U.S. government securities were $0 and $1,654, respectively. Purchases and sales of securities, other than U.S. government securities and short-term securities, were $411,967 and $493,726, respectively.
Note 9–Capital Share Transactions
Transactions in capital shares for the years ended December 31, 2022 and December 31, 2021, were as follows:
Notes to Financial Statements (continued)
| Initial Class | Shares | Amount |
| Year ended December 31, 2022: | | |
| Shares sold | 6,286,978 | $ 56,587,286 |
| Shares issued to shareholders in reinvestment of distributions | 806,908 | 6,510,777 |
| Shares redeemed | (6,598,491) | (62,522,654) |
| Net increase (decrease) | 495,395 | $ 575,409 |
| Year ended December 31, 2021: | | |
| Shares sold | 9,407,567 | $ 90,548,340 |
| Shares issued to shareholders in reinvestment of distributions | 66,579 | 649,528 |
| Shares redeemed | (585,627) | (5,698,986) |
| Net increase (decrease) | 8,888,519 | $ 85,498,882 |
| |
| Service Class | Shares | Amount |
| Year ended December 31, 2022: | | |
| Shares sold | 5,046,128 | $ 45,996,121 |
| Shares issued to shareholders in reinvestment of distributions | 2,826,082 | 22,747,983 |
| Shares redeemed | (7,970,053) | (73,238,043) |
| Net increase (decrease) | (97,843) | $ (4,493,939) |
| Year ended December 31, 2021: | | |
| Shares sold | 7,393,521 | $ 70,930,280 |
| Shares issued to shareholders in reinvestment of distributions | 146,207 | 1,422,855 |
| Shares redeemed | (7,696,114) | (73,635,987) |
| Net increase (decrease) | (156,386) | $ (1,282,852) |
Note 10–Other Matters
As of the date of this report, interest rates in the United States and many parts of the world, including certain European countries, are ascending from historically low levels. Thus, the Portfolio currently faces a heightened level of risk associated with rising interest rates. This could be driven by a variety of factors, including but not limited to central bank monetary policies, changing inflation or real growth rates, general economic conditions, increasing bond issuances or reduced market demand for low yielding investments.
An outbreak of COVID-19, first detected in December 2019, has developed into a global pandemic and has resulted in travel restrictions, closure of international borders, certain businesses and securities markets, restrictions on securities trading activities, prolonged quarantines, supply chain disruptions, and lower consumer demand, as well as general concern and uncertainty. In 2022, many countries lifted some or all restrictions related to COVID-19. However, the continued impact of COVID-19 and related variants is uncertain and could further adversely affect the global economy, national economies, individual issuers and capital markets in unforeseeable ways and result in a substantial and extended economic downturn. Developments that disrupt global economies and financial markets, such as COVID-19, may magnify factors that affect the Portfolio's performance.
Note 11–Subsequent Events
In connection with the preparation of the financial statements of the Portfolio as of and for the year ended December 31, 2022, events and transactions subsequent to December 31, 2022, through the date the financial statements were issued have been evaluated by the Manager for possible adjustment and/or disclosure. No subsequent events requiring financial statement adjustment or disclosure have been identified.
| 44 | MainStay VP PIMCO Real Return Portfolio |
Report of Independent Registered Public Accounting Firm
To the Board of Trustees of MainStay VP Funds Trust and Shareholders of
MainStay VP PIMCO Real Return Portfolio
Opinion on the Financial Statements
We have audited the accompanying statement of assets and liabilities, including the portfolio of investments, of MainStay VP PIMCO Real Return Portfolio (one of the portfolios constituting MainStay VP Funds Trust, referred to hereafter as the “Portfolio”) as of December 31, 2022, the related statements of operations and cash flows for the year ended December 31, 2022, the statements of changes in net assets for each of the two years in the period ended December 31, 2022, including the related notes, and the financial highlights for each of the five years in the period ended December 31, 2022 (collectively referred to as the “financial statements”). In our opinion, the financial statements present fairly, in all material respects, the financial position of the Portfolio as of December 31, 2022, the results of its operations and its cash flows for the year then ended, the changes in its net assets for each of the two years in the period ended December 31, 2022 and the financial highlights for each of the five years in the period ended December 31, 2022 in conformity with accounting principles generally accepted in the United States of America.
Basis for Opinion
These financial statements are the responsibility of the Portfolio’s management. Our responsibility is to express an opinion on the Portfolio’s financial statements based on our audits. We are a public accounting firm registered with the Public Company Accounting Oversight Board (United States) (PCAOB) and are required to be independent with respect to the Portfolio in accordance with the U.S. federal securities laws and the applicable rules and regulations of the Securities and Exchange Commission and the PCAOB.
We conducted our audits of these financial statements in accordance with the standards of the PCAOB. Those standards require that we plan and perform the audit to obtain reasonable assurance about whether the financial statements are free of material misstatement, whether due to error or fraud.
Our audits included performing procedures to assess the risks of material misstatement of the financial statements, whether due to error or fraud, and performing procedures that respond to those risks. Such procedures included examining, on a test basis, evidence regarding the amounts and disclosures in the financial statements. Our audits also included evaluating the accounting principles used and significant estimates made by management, as well as evaluating the overall presentation of the financial statements. Our procedures included confirmation of securities owned as of December 31, 2022 by correspondence with the custodian, transfer agent and brokers; when replies were not received from brokers, we performed other auditing procedures. We believe that our audits provide a reasonable basis for our opinion.
/s/PricewaterhouseCoopers LLP
New York, New York
February 24, 2023
We have served as the auditor of one or more investment companies in the MainStay group of funds since 1984.
Board Consideration and Approval of Management Agreement and Subadvisory Agreement (Unaudited)
The continuation of the Management Agreement with respect to the MainStay VP PIMCO Real Return Portfolio (“Portfolio”) and New York Life Investment Management LLC (“New York Life Investments”) and the Subadvisory Agreement between New York Life Investments and Pacific Investment Management Company LLC (“PIMCO”) with respect to the Portfolio (together, “Advisory Agreements”) is subject to annual review and approval by the Board of Trustees of MainStay VP Funds Trust (“Board” of the “Trust”) in accordance with Section 15 of the Investment Company Act of 1940, as amended (“1940 Act”). At its December 6–7, 2022 meeting, the Board, which is comprised solely of Trustees who are not an “interested person” (as such term is defined in the 1940 Act) of the Trust (“Independent Trustees”), unanimously approved the continuation of each of the Advisory Agreements for a one-year period.
In reaching the decision to approve the continuation of each of the Advisory Agreements, the Board considered information and materials furnished by New York Life Investments and PIMCO in connection with an annual contract review process undertaken by the Board that took place at meetings of the Board and its Contracts Committee during October 2022 through December 2022, including information and materials furnished by New York Life Investments and PIMCO in response to requests prepared on behalf of the Board, and in consultation with the Board, by independent legal counsel to the Independent Trustees, which encompassed a variety of topics, including those summarized below. Information and materials requested by and furnished to the Board for consideration in connection with the contract review process included, among other items, reports on the Portfolio and “peer funds” prepared by Institutional Shareholder Services Inc. (“ISS”), an independent third-party service provider engaged by the Board to report objectively on the Portfolio’s investment performance, management fee and total expenses. The Board also considered information on the fees charged to other investment advisory clients of New York Life Investments and/or PIMCO that follow investment strategies similar to those of the Portfolio, if any, and, when applicable, the rationale for any differences in the Portfolio’s management and subadvisory fees and the fees charged to those other investment advisory clients. In addition, the Board considered information regarding the legal standards and fiduciary obligations applicable to its consideration of the continuation of each of the Advisory Agreements. The contract review process, including the structure and format for information and materials provided to the Board, has been developed in consultation with the Board. The Independent Trustees also met in executive sessions with their independent legal counsel and, for portions thereof, with senior management of New York Life Investments.
The Board’s deliberations with respect to the continuation of each of the Advisory Agreements reflect a year-long process, and the Board also took into account information furnished to the Board and its Committees throughout the year, as deemed relevant and appropriate by the Trustees, including, among other items, reports on investment performance of the Portfolio and investment-related matters for the Portfolio as well as presentations from New York Life Investments and, generally annually, PIMCO personnel. In addition, the Board took into account other information received from New York Life Investments throughout the year,
including, among other items, periodic reports on legal and compliance matters, risk management, portfolio turnover, brokerage commissions and non-advisory services provided to the Portfolio by New York Life Investments, as deemed relevant and appropriate by the Trustees.
In addition to information provided to the Board throughout the year, the Board received information in connection with its June 2022 meeting provided specifically in response to requests prepared on behalf of the Board, and in consultation with the Board, by independent legal counsel to the Independent Trustees regarding the Portfolio’s distribution arrangements. In addition, the Board received information regarding the Portfolio’s asset levels, share purchase and redemption activity and the payment of Rule 12b-1 and/or other fees by applicable share classes of the Portfolio, among other information.
In considering the continuation of each of the Advisory Agreements, the Trustees reviewed and evaluated the information and factors they believed to reasonably be necessary and appropriate in light of legal advice furnished to them by independent legal counsel to the Independent Trustees and through the exercise of their own business judgment. Although individual Trustees may have weighed certain factors or information differently and the Board did not consider any single factor or information controlling in reaching its decision, the factors considered by the Board are summarized in more detail below and include, among other factors: (i) the nature, extent and quality of the services provided to the Portfolio by New York Life Investments and PIMCO; (ii) the qualifications of the portfolio managers of the Portfolio and the historical investment performance of the Portfolio, New York Life Investments and PIMCO; (iii) the costs of the services provided, and profits realized, by New York Life Investments and PIMCO with respect to their relationships with the Portfolio; (iv) the extent to which economies of scale have been realized or may be realized if the Portfolio grows and the extent to which any economies of scale have been shared, have benefited or may benefit the Portfolio’s shareholders; and (v) the reasonableness of the Portfolio’s management and subadvisory fees and total ordinary operating expenses. Although the Board recognized that comparisons between the Portfolio’s fees and expenses and those of other funds are imprecise given different terms of agreements, variations in fund strategies and other factors, the Board considered the reasonableness of the Portfolio’s management fee and total ordinary operating expenses as compared to the peer funds identified by ISS. Throughout their considerations, the Trustees acknowledged the commitment of New York Life Investments and its affiliates to serve the MainStay Group of Funds, as well as their capacity, experience, resources, financial stability and reputations. The Trustees also acknowledged the entrepreneurial and other risks assumed by New York Life Investments in sponsoring and managing the Portfolio. With respect to the Subadvisory Agreement, the Board took into account New York Life Investments’ recommendation to approve the continuation of the Subadvisory Agreement.
The Trustees noted that, throughout the year, the Trustees are afforded an opportunity to ask questions of, and request additional information or materials from, New York Life Investments and PIMCO. The Board’s decision with respect to each of the Advisory Agreements may have also
| 46 | MainStay VP PIMCO Real Return Portfolio |
been based, in part, on the Board’s knowledge of New York Life Investments and PIMCO resulting from, among other things, the Board’s consideration of each of the Advisory Agreements in prior years, the advisory agreements for other funds in the MainStay Group of Funds, the Board’s review throughout the year of the performance and operations of other funds in the MainStay Group of Funds and each Trustee’s business judgment and industry experience. In addition to considering the above-referenced factors, the Board observed that in the marketplace, notably under variable life insurance policies and variable annuity contracts for which the Portfolio serves as an investment option, there are a range of investment options available to investors and that the Portfolio’s shareholders, having had the opportunity to consider other investment options, have chosen to invest in the Portfolio.
The factors that figured prominently in the Board’s decision to approve the continuation of each of the Advisory Agreements during its December 6–7, 2022 meeting are summarized in more detail below.
Nature, Extent and Quality of Services Provided by New York Life Investments and PIMCO
The Board examined the nature, extent and quality of the services that New York Life Investments provides to the Portfolio. The Board evaluated New York Life Investments’ experience and capabilities in serving as manager of the Portfolio and considered that the Portfolio operates in a “manager-of-managers” structure. The Board also considered New York Life Investments’ responsibilities and services provided pursuant to this structure, including overseeing the services provided by PIMCO, evaluating the performance of PIMCO, making recommendations to the Board as to whether the Subadvisory Agreement should be renewed, modified or terminated and periodically reporting to the Board regarding the results of New York Life Investments’ evaluation and monitoring functions. The Board noted that New York Life Investments manages other mutual funds, serves a variety of other investment advisory clients, including other pooled investment vehicles, and has experience overseeing mutual fund service providers, including subadvisors. The Board considered the experience of senior personnel at New York Life Investments providing management and administrative and other non-advisory services to the Portfolio. The Board observed that New York Life Investments devotes significant resources and time to providing management and administrative and other non-advisory services to the Portfolio, including New York Life Investments’ oversight and due diligence reviews of PIMCO and ongoing analysis of, and interactions with, PIMCO with respect to, among other things, the Portfolio’s investment performance and risks as well as PIMCO’s investment capabilities and subadvisory services with respect to the Portfolio.
The Board also considered the range of services that New York Life Investments provides to the Portfolio under the terms of the Management Agreement, including: (i) fund accounting and ongoing supervisory services provided by New York Life Investments’ Fund Administration and Accounting Group; (ii) investment supervisory and analytical services provided by New York Life Investments’ Investment Consulting Group; (iii) compliance services provided by the Trust’s Chief Compliance Officer as
well as New York Life Investments’ compliance department, including supervision and implementation of the Portfolio’s compliance program; (iv) legal services provided by New York Life Investments’ Office of the General Counsel; and (v) risk management monitoring and analysis by compliance and investment personnel. In addition, the Board considered New York Life Investments’ willingness to invest in personnel and other resources, such as cyber security, information security and business continuity planning, designed to benefit the Portfolio and noted that New York Life Investments is responsible for compensating the Trust’s officers, except for a portion of the salary of the Trust’s Chief Compliance Officer. The Board recognized that New York Life Investments provides certain other non-advisory services to the Portfolio and has provided an increasingly broad array of non-advisory services to the MainStay Group of Funds as a result of regulatory and other developments, including in connection with the implementation of the MainStay Group of Funds’ derivatives risk management program and policies and procedures adopted pursuant to Rule 18f-4 under the 1940 Act.
The Board also examined the range, and the nature, extent and quality, of the investment advisory services that PIMCO provides to the Portfolio and considered the terms of each of the Advisory Agreements. The Board evaluated PIMCO’s experience and performance in serving as subadvisor to the Portfolio and advising other portfolios and PIMCO’s track record and experience in providing investment advisory services, the experience of investment advisory, senior management and administrative personnel at PIMCO. The Board considered New York Life Investments’ and PIMCO’s overall resources, legal and compliance environment, capabilities, reputation, financial condition and history. In addition to information provided in connection with quarterly meetings with the Trust’s Chief Compliance Officer, the Board considered information regarding the compliance policies and procedures of New York Life Investments and PIMCO and acknowledged their commitment to further developing and strengthening compliance programs relating to the Portfolio. The Board also considered PIMCO’s ability to recruit and retain qualified investment professionals and willingness to invest in personnel and other resources to service and support the Portfolio. In this regard, the Board considered the qualifications and experience of the Portfolio’s portfolio managers, the number of accounts managed by the portfolio managers and the method for compensating the portfolio managers.
In addition, the Board considered information provided by New York Life Investments and PIMCO regarding the operations of their respective business continuity plans in response to the COVID-19 pandemic and the continued remote work environment.
Based on these considerations, among others, the Board concluded that the Portfolio would likely continue to benefit from the nature, extent and quality of these services.
Investment Performance
In evaluating the Portfolio’s investment performance, the Board considered investment performance results over various periods in light of the Portfolio’s investment objective, strategies and risks. The Board
Board Consideration and Approval of Management Agreement and Subadvisory Agreement (Unaudited) (continued)
considered investment reports on, and analysis of, the Portfolio’s performance provided to the Board throughout the year. These reports include, among other items, information on the Portfolio’s gross and net returns, the Portfolio’s investment performance compared to a relevant investment category and the Portfolio’s benchmarks, the Portfolio’s risk-adjusted investment performance and the Portfolio’s investment performance as compared to peer funds, as appropriate, as well as portfolio attribution information and commentary on the effect of market conditions. The Board also considered information provided by ISS showing the investment performance of the Portfolio as compared to peer funds. In addition, the Board reviewed the methodology used by ISS to construct the group of peer funds for comparative purposes.
The Board also took into account its discussions with senior management at New York Life Investments concerning the Portfolio’s investment performance over various periods as well as discussions between the Portfolio’s portfolio management team and the members of the Board’s Investment Committee, which generally occur on an annual basis. In addition, the Board considered any specific actions that New York Life Investments or PIMCO had taken, or had agreed to take, to seek to enhance Portfolio investment performance and the results of those actions.
Based on these considerations, among others, the Board concluded that its review of the Portfolio’s investment performance and related information supported a determination to approve the continuation of each of the Advisory Agreements.
Costs of the Services Provided, and Profits and Other Benefits Realized, by New York Life Investments and PIMCO
The Board considered the costs of the services provided under each of the Advisory Agreements. The Board also considered the profits realized by New York Life Investments and its affiliates and PIMCO due to their relationships with the Portfolio as well as by New York Life Investments and its affiliates due to their relationships with the MainStay Group of Funds. The Board considered information from New York Life Investments that PIMCO’s subadvisory fee reflected an arm’s-length negotiation and that this fee is paid by New York Life Investments, not the Portfolio, and the relevance of PIMCO’s profitability was considered by the Trustees in that context. On this basis, the Board primarily considered the costs and profitability for New York Life Investments and its affiliates with respect to the Portfolio.
In addition, the Board acknowledged the difficulty in obtaining reliable comparative data about mutual fund managers’ profitability because such information generally is not publicly available and may be impacted by numerous factors, including the structure of a fund manager’s organization, the types of funds it manages, the methodology used to allocate certain fixed costs to specific funds and the manager’s capital structure and costs of capital.
In evaluating the costs of the services provided by New York Life Investments and PIMCO and profits realized by New York Life Investments and its affiliates and PIMCO, the Board considered, among other factors,
New York Life Investments’ and its affiliates’ and PIMCO’s continuing investments in, or willingness to invest in, personnel and other resources to support and further enhance the management of the Portfolio, and that New York Life Investments is responsible for paying the subadvisory fee for the Portfolio. The Board also considered the financial resources of New York Life Investments and PIMCO and acknowledged that New York Life Investments and PIMCO must be in a position to recruit and retain experienced professional personnel and to maintain a strong financial position for New York Life Investments and PIMCO to continue to provide high-quality services to the Portfolio. The Board recognized that the Portfolio benefits from the allocation of certain fixed costs among the funds in the MainStay Group of Funds, among other expected benefits resulting from its relationship with New York Life Investments.
The Board considered information regarding New York Life Investments’ methodology for calculating profitability and allocating costs provided by New York Life Investments in connection with the fund profitability analysis presented to the Board. The Board noted it had previously engaged an independent consultant to review the methods used to allocate costs among the funds in the MainStay Group of Funds. The Board also noted that the independent consultant had concluded that New York Life Investments’ methods for allocating costs and procedures for estimating overall profitability of the relationship with the funds in the MainStay Group of Funds are reasonable and that New York Life Investments continued to use the same method of calculating profit and allocating costs since the independent consultant’s review. The Board recognized the difficulty in calculating and evaluating a manager’s profitability with respect to the Portfolio and considered that other profitability methodologies may also be reasonable.
The Board also considered certain fall-out benefits that may be realized by New York Life Investments and its affiliates due to their relationships with the Portfolio, including reputational and other indirect benefits. In this regard, the Board also requested and considered information from New York Life Investments concerning other material business relationships between PIMCO and its affiliates and New York Life Investments and its affiliates. In addition, the Board considered its review of the management agreement for a money market fund advised by New York Life Investments and an affiliated subadvisor that serves as an investment option for the Portfolio, including the potential rationale for and costs associated with investments in this money market fund by the Portfolio, if any, and considered information from New York Life Investments that the nature and type of specific investment advisory services provided to this money market fund are distinct from, or in addition to, the investment advisory services provided to the Portfolio. In addition, the Board considered the potential dividend received tax deduction for insurance company affiliates of New York Life Investments from the Portfolio’s securities lending activity.
The Board noted that the Portfolio serves as an investment option primarily under variable contracts issued by affiliates of New York Life Investments that would receive fees under those contracts. The Board observed that, in addition to fees earned by New York Life Investments under the Management Agreement for managing the Portfolio, New York
| 48 | MainStay VP PIMCO Real Return Portfolio |
Life Investments’ affiliates also earn revenues from serving the Portfolio in various other capacities, including as the Portfolio’s distributor. The Board considered information about these other revenues and their impact on the profitability of the relationship with the Portfolio to New York Life Investments and its affiliates. The Board noted that, although it assessed the overall profitability of the relationship with the Portfolio to New York Life Investments and its affiliates as part of the contract review process, when considering the reasonableness of the fee paid to New York Life Investments under the Management Agreement, the Board considered the profitability of New York Life Investments’ relationship with the Portfolio on a pre-tax basis and without regard to distribution expenses incurred by New York Life Investments from its own resources.
After evaluating the information deemed relevant by the Trustees, the Board concluded that any profits realized by New York Life Investments and its affiliates due to their relationships with the Portfolio were not excessive, other benefits that may accrue to New York Life Investments and its affiliates are reasonable and benefits that may accrue to PIMCO and its affiliates are consistent with those expected for a subadvisor to a mutual fund. With respect to PIMCO, the Board considered that any profits realized by PIMCO due to its relationship with the Portfolio are the result of arm’s-length negotiations between New York Life Investments and PIMCO, acknowledging that any such profits are based on the subadvisory fee paid to PIMCO by New York Life Investments, not the Portfolio.
Management and Subadvisory Fees and Total Ordinary Operating Expenses
The Board evaluated the reasonableness of the fee paid under each of the Advisory Agreements and the Portfolio’s total ordinary operating expenses. The Board primarily considered the reasonableness of the management fee paid by the Portfolio to New York Life Investments because the subadvisory fee paid to PIMCO is paid by New York Life Investments, not the Portfolio. The Board also considered the reasonableness of the subadvisory fee paid by New York Life Investments and the amount of the management fee retained by New York Life Investments.
In assessing the reasonableness of the Portfolio’s fees and expenses, the Board primarily considered comparative data provided by ISS on the fees and expenses charged by similar mutual funds managed by other investment advisers. The Board reviewed the methodology used by ISS to construct the group of peer funds for comparative purposes. In addition, the Board considered information provided by New York Life Investments and PIMCO on fees charged to other investment advisory clients, including institutional separate accounts and/or other funds that follow investment strategies similar to those of the Portfolio, if any. The Board considered the contractual management fee schedules of the Portfolio as compared to those of such other investment advisory clients, taking into account the rationale for any differences in fee schedules. The Board also took into account information provided by New York Life Investments about the more extensive scope of services provided to registered investment companies, such as the Portfolio, as compared with other
investment advisory clients. Additionally, the Board considered the impact of expense limitation arrangements on the Portfolio’s net management fee and expenses. The Board also considered that in proposing fees for the Portfolio, New York Life Investments considers the competitive marketplace for mutual funds.
Based on the factors outlined above, among other considerations, the Board concluded that the Portfolio’s management fee and total ordinary operating expenses are within a range that is competitive and support a conclusion that these fees and expenses are reasonable.
Economies of Scale
The Board considered information regarding economies of scale, including whether economies of scale may exist for the Portfolio and whether the Portfolio’s expense structure permits any economies of scale to be appropriately shared with the Portfolio’s beneficial shareholders. The Board also considered a report from New York Life Investments, previously prepared at the request of the Board, that addressed economies of scale, including with respect to the mutual fund business generally, and the various ways in which the benefits of economies of scale may be shared with the funds in the MainStay Group of Funds. Although the Board recognized the difficulty of determining economies of scale with precision, the Board acknowledged that economies of scale may be shared with the Portfolio in a number of ways, including, for example, through the imposition of fee breakpoints, initially setting management fee rates at scale or making additional investments to enhance the services provided to the Portfolio. The Board reviewed information from New York Life Investments showing how the Portfolio’s management fee schedule compared to fee schedules of other funds and accounts managed by New York Life Investments. The Board also reviewed information from ISS showing how the Portfolio’s management fee schedule compared with fees paid for similar services by peer funds at varying asset levels.
Based on this information, the Board concluded that economies of scale are appropriately reflected for the benefit of the Portfolio’s beneficial shareholders through the Portfolio’s expense structure and other methods to share benefits from economies of scale.
Conclusion
On the basis of the information and factors summarized above, among other information and factors deemed relevant by the Trustees, and the evaluation thereof, the Board unanimously voted to approve the continuation of each of the Advisory Agreements.
Proxy Voting Policies and Procedures and Proxy Voting Record
The Portfolio is required to file with the SEC its proxy voting record for the 12-month period ending June 30 on Form N-PX. A description of the policies and procedures that are used to vote proxies relating to portfolio securities of the Portfolio is available free of charge upon request by calling 800-598-2019 or visiting the SEC's website at www.sec.gov. The most recent Form N-PX or proxy voting record is available free of charge upon request by calling 800-598-2019; visiting https://www.newyorklifeinvestments.com/investment-products/vp; or visiting the SEC’s website at www.sec.gov.
Shareholder Reports and Quarterly Portfolio Disclosure
The Portfolio is required to file its complete schedule of portfolio holdings with the SEC 60 days after its first and third fiscal quarter on Form N-PORT. The Portfolio's holdings report is available free of charge upon request by calling 800-598-2019 or by visiting the SEC’s website at www.sec.gov.
| 50 | MainStay VP PIMCO Real Return Portfolio |
Board of Trustees and Officers (Unaudited)
The Trustees and officers of the Portfolio are listed below. The Board oversees the MainStay Group of Funds (which consists of MainStay Funds and MainStay Funds Trust), MainStay VP Funds Trust, MainStay MacKay DefinedTerm Municipal Opportunities Fund, MainStay CBRE Global Infrastructure Megatrends Fund, the Manager and the Subadvisors, and elects the officers of the Portfolios who are responsible for the day-to-day operations of the Portfolio. Information pertaining to the Trustees and officers is set forth below. Each Trustee serves until his or her successor
is elected and qualified or until his or her resignation, death or removal. Under the Board’s retirement policy, unless an exception is made, a Trustee must tender his or her resignation by the end of the calendar year during which he or she reaches the age of 75. The business address of each Trustee and officer listed below is 51 Madison Avenue, New York, New York 10010. None of the Trustees are “interested persons” (as defined by the 1940 Act and rules adopted by the SEC thereunder) of the Portfolio (“Independent Trustees”).
| | Name and
Year of Birth | Term of Office,
Position(s) Held and
Length of Service | Principal Occupation(s)
During Past Five Years | Number of
Portfolios in
Fund Complex
Overseen by
Trustee | Other Directorships
Held by Trustee |
| | | | | | |
| | David H. Chow
1957 | MainStay VP Funds Trust: Trustee since January 2016, Advisory Board Member (June 2015 to December 2015) | Founder and CEO, DanCourt Management, LLC since 1999 | 78 | MainStay Funds: Trustee since January 2016, Advisory Board Member (June 2015 to December 2015) (12 Funds);
MainStay Funds Trust: Trustee since January 2016, Advisory Board Member (June 2015 to December 2015) (33 Funds);
MainStay MacKay DefinedTerm Municipal Opportunities Fund: Trustee since January 2016, Advisory Board Member (June 2015 to December 2015);
MainStay CBRE Global Infrastructure Megatrends Fund: Trustee since June 2021;VanEck Vectors Group of Exchange-Traded Funds: Independent Chairman of the Board of Trustees since 2008 and Trustee since 2006 (57 portfolios); and Berea College of Kentucky: Trustee since 2009, Chair of the Committee since 2018 |
| | Susan B. Kerley
1951 | MainStay VP Funds Trust: Chairman since 2017 and Trustee since 2007* | President, Strategic Management Advisors LLC since 1990 | 78 | MainStay Funds: Chairman since 2017 and Trustee since 2007 (12 Funds); MainStay Funds Trust: Chairman since 2017 and Trustee since 1990 (33 Funds)**;
MainStay MacKay DefinedTerm Municipal Opportunities Fund: Chairman since 2017 and Trustee since 2011; MainStay CBRE Global Infrastructure Megatrends Fund: Trustee since June 2021; and Legg Mason Partners Funds: Trustee since 1991 (45 portfolios) |
| | Alan R. Latshaw
1951 | MainStay VP Funds Trust: Trustee since 2007* | Retired; Partner, Ernst & Young LLP (2002 to 2003); Partner, Arthur Andersen LLP (1989 to 2002); Consultant to the MainStay Funds Audit and Compliance Committee (2004 to 2006) | 78 | MainStay Funds: Trustee since 2006 (12 Funds);
MainStay Funds Trust: Trustee since 2007 (33 Funds)**;
MainStay MacKay DefinedTerm Municipal Opportunities Fund: Trustee since 2011; and
MainStay CBRE Global Infrastructure Megatrends Fund: Trustee since June 2021 |
Board of Trustees and Officers (Unaudited) (continued)
| | Name and
Year of Birth | Term of Office,
Position(s) Held and
Length of Service | Principal Occupation(s)
During Past Five Years | Number of
Portfolios in
Fund Complex
Overseen by
Trustee | Other Directorships
Held by Trustee |
| | | | | | |
| | Karen Hammond
1956 | MainStay VP Funds Trust: Trustee since December 2021, Advisory Board Member (June 2021 to December 2021)
| Retired, Managing Director, Devonshire Investors (2007 to 2013); Senior Vice President, Fidelity Management & Research Co. (2005 to 2007); Senior Vice President and Corporate Treasurer, FMR Corp. (2003 to 2005); Chief Operating Officer, Fidelity Investments Japan (2001 to 2003) | 78 | MainStay Funds: Trustee since December 2021, Advisory Board Member (June 2021 to December 2021) (12 Funds);
MainStay Funds Trust: Trustee since December 2021, Advisory Board Member (June 2021 to December 2021) (33 Funds);
MainStay MacKay DefinedTerm Municipal Opportunities Fund: Trustee since December 2021, Advisory Board Member (June 2021 to December 2021);
MainStay CBRE Global Infrastructure Megatrends Fund: Trustee since December 2021, Advisory Board Member (June 2021 to December 2021);
Two Harbors Investment Corp.: Director since 2018; Rhode Island State Investment Commission: Member since 2017; and Blue Cross Blue Shield of Rhode Island: Director since 2019
|
| | Jacques P. Perold
1958 | MainStay VP Funds Trust: Trustee since January 2016, Advisory Board Member (June 2015 to December 2015) | Founder and Chief Executive Officer, CapShift Advisors LLC (since 2018); President, Fidelity Management & Research Company (2009 to 2014); President and Chief Investment Officer, Geode Capital Management, LLC (2001 to 2009) | 78 | MainStay Funds: Trustee since January 2016, Advisory Board Member (June 2015 to December 2015) (12 Funds);
MainStay Funds Trust: Trustee since January 2016, Advisory Board Member (June 2015 to December 2015) (33 Funds); MainStay MacKay DefinedTerm Municipal Opportunities Fund: Trustee since January 2016, Advisory Board Member (June 2015 to December 2015);
MainStay CBRE Global Infrastructure Megatrends Fund: Trustee since June 2021; Allstate Corporation: Director since 2015;
Partners in Health: Trustee since 2019; and
MSCI Inc.: Director since 2017 |
| | Richard S. Trutanic
1952 | MainStay VP Funds Trust: Trustee since 2007* | Chairman and Chief Executive Officer, Somerset & Company (financial advisory firm) since 2004; Managing Director, The Carlyle Group (private investment firm) (2002 to 2004); Senior Managing Director, Partner and Board Member, Groupe Arnault S.A. (private investment firm) (1999 to 2002)
| 78 | MainStay Funds: Trustee since 1994 (12 Funds);
MainStay Funds Trust: Trustee since 2007 (33 Funds)**;
MainStay MacKay DefinedTerm Municipal Opportunities Fund: Trustee since 2011; and
MainStay CBRE Global Infrastructure Megatrends Fund: Trustee since June 2021 |
| * | Includes prior service as a Director of MainStay VP Series Fund, Inc., the predecessor to MainStay VP Funds Trust. |
| ** | Includes prior service as a Director/Trustee of certain predecessor entities to MainStay Funds Trust. |
| 52 | MainStay VP PIMCO Real Return Portfolio |
| | Name and
Year of Birth | Position(s) Held and
Length of Service | Principal Occupation(s)
During Past Five Years | |
| | | | | |
| | Kirk C. Lehneis
1974 | President, MainStay VP Funds Trust (since 2017) | Chief Operating Officer and Senior Managing Director (since 2016), New York Life Investment Management LLC and New York Life Investment Management Holdings LLC; Member of the Board of Managers (since 2017) and Senior Managing Director (since 2018), NYLIFE Distributors LLC; Chairman of the Board and Senior Managing Director, NYLIM Service Company LLC (since 2017); Trustee, President and Principal Executive Officer of IndexIQ Trust, IndexIQ ETF Trust and IndexIQ Active ETF Trust (since January 2018); President, MainStay CBRE Global Infrastructure Megatrends Fund (since 2021), MainStay MacKay DefinedTerm Municipal Opportunities Fund, MainStay Funds and MainStay Funds Trust (since 2017); Senior Managing Director, Global Product Development (from 2015-2016); Managing Director, Product Development (from 2010-2015), New York Life Investment Management LLC | |
| | Jack R. Benintende
1964 | Treasurer and Principal Financial and Accounting Officer, MainStay VP Funds Trust (since 2007)** | Managing Director, New York Life Investment Management LLC (since 2007); Treasurer and Principal Financial and Accounting Officer, MainStay CBRE Global Infrastructure Megatrends Fund (since 2021), MainStay MacKay DefinedTerm Municipal Opportunities Fund (since 2011), MainStay Funds Trust (since 2009) and MainStay Funds (since 2007); and Assistant Treasurer, New York Life Investment Management Holdings LLC (2008 to 2012) | |
| | J. Kevin Gao
1967 | Secretary and Chief Legal Officer, MainStay VP Funds Trust (since 2010)** | Managing Director and Associate General Counsel, New York Life Investment Management LLC (since 2010); Secretary and Chief Legal Officer, MainStay CBRE Global Infrastructure Megatrends Fund (since 2021), MainStay MacKay DefinedTerm Municipal Opportunities Fund (since 2011), MainStay Funds and MainStay Funds Trust (since 2010) | |
| | Scott T. Harrington
1959 | Vice President— Administration, MainStay VP Funds Trust (since 2005)** | Managing Director, New York Life Investment Management LLC (including predecessor advisory organizations) (since 2000); Member of the Board of Directors, New York Life Trust Company (since 2009); Vice President—Administration, MainStay CBRE Global Infrastructure Megatrends Fund (since 2021), MainStay MacKay DefinedTerm Municipal Opportunities Fund (since 2011), MainStay Funds Trust and MainStay Funds (since 2009) | |
| | Kevin M. Gleason
1967 | Vice President and Chief Compliance Officer, MainStay VP Funds Trust (since June 2022) | Vice President and Chief Compliance Officer, IndexIQ, IndexIQ ETF Trust and Index IQ Active ETF Trust (since June 2022); Vice President and Chief Compliance Officer, MainStay CBRE Global Infrastructure Megatrends Fund, MainStay MacKay DefinedTerm Municipal Opportunities Fund (since June 2022); MainStay Funds Trust and MainStay Funds (since June 2022); Senior Vice President, Voya Investment Management and Chief Compliance Officer, Voya Family of Funds (2012-2022) | |
| * | The officers listed above are considered to be “interested persons” of the MainStay Group of Funds, MainStay VP Funds Trust, MainStay CBRE Global Infrastructure Megatrends Fund and MainStay MacKay DefinedTerm Municipal Opportunities Fund within the meaning of the 1940 Act because of their affiliation with the MainStay Group of Funds, New York Life Insurance Company and/or its affiliates, including New York Life Investment Management LLC, NYLIM Service Company LLC, NYLIFE Securities LLC and/or NYLIFE Distributors LLC, as described in detail in the column captioned “Principal Occupation(s) During Past Five Years.” Officers are elected annually by the Board. |
| ** | Includes prior service as an Officer of MainStay VP Series Fund, Inc., the predecessor to MainStay VP Funds Trust. |
Officers of the Trust (Who are not Trustees)*
This page intentionally left blank.
MainStay VP Portfolios
MainStay VP offers a wide range of Portfolios. The full array of MainStay VP offerings is listed here, with information about the manager, subadvisors, legal counsel, and independent registered public accounting firm.
Equity
MainStay VP American Century Sustainable Equity Portfolio1
MainStay VP Candriam Emerging Markets Equity Portfolio
MainStay VP Epoch U.S. Equity Yield Portfolio
MainStay VP Fidelity Institutional AM® Utilities Portfolio†
MainStay VP MacKay International Equity Portfolio
MainStay VP Natural Resources Portfolio
MainStay VP S&P 500 Index Portfolio2
MainStay VP Small Cap Growth Portfolio
MainStay VP Wellington Growth Portfolio
MainStay VP Wellington Mid Cap Portfolio
MainStay VP Wellington Small Cap Portfolio
MainStay VP Wellington U.S. Equity Portfolio
MainStay VP Winslow Large Cap Growth Portfolio
Mixed Asset
MainStay VP Balanced Portfolio
MainStay VP Income Builder Portfolio
MainStay VP Janus Henderson Balanced Portfolio
MainStay VP MacKay Convertible Portfolio
Income
MainStay VP Bond Portfolio
MainStay VP Floating Rate Portfolio
MainStay VP Indexed Bond Portfolio
MainStay VP MacKay Government Portfolio
MainStay VP MacKay High Yield Corporate Bond Portfolio
MainStay VP MacKay Strategic Bond Portfolio
MainStay VP PIMCO Real Return Portfolio
Money Market
MainStay VP U.S. Government Money Market Portfolio
Alternative
MainStay VP CBRE Global Infrastructure Portfolio
MainStay VP IQ Hedge Multi-Strategy Portfolio
Asset Allocation
MainStay VP Conservative Allocation Portfolio
MainStay VP Equity Allocation Portfolio
MainStay VP Growth Allocation Portfolio
MainStay VP Moderate Allocation Portfolio
Manager
New York Life Investment Management LLC
New York, New York
Subadvisors
American Century Investment Management, Inc.
Kansas City, Missouri
Brown Advisory LLC
Baltimore, Maryland
Candriam*
Strassen, Luxembourg
CBRE Investment Management Listed Real Assets LLC
Radnor, Pennsylvania
Epoch Investment Partners, Inc.
New York, New York
FIAM LLC
Smithfield, Rhode Island
IndexIQ Advisors LLC*
New York, New York
Janus Henderson Investors US LLC
Denver, Colorado
MacKay Shields LLC*
New York, New York
Newton Investment Management North America, LLC
Boston, Massachusetts
NYL Investors LLC*
New York, New York
Pacific Investment Management Company LLC
Newport Beach, California
Segall Bryant & Hamill, LLC
Chicago, Illinois
Wellington Management Company LLP
Boston, Massachusetts
Winslow Capital Management, LLC
Minneapolis, Minnesota
Legal Counsel
Dechert LLP
Washington, District of Columbia
Independent Registered Public Accounting Firm
PricewaterhouseCoopers LLP
New York, New York
Distributor
NYLIFE Distributors LLC*
Jersey City, New Jersey
Custodian
JPMorgan Chase Bank, N.A.
New York, New York
Some Portfolios may not be available in all products.
† Fidelity Institutional AM is a registered trade mark of FMR LLC. Used with permission.
* An affiliate of New York Life Investment Management LLC.
| 1. | Prior to May 1, 2022, the Portfolio's name was MainStay VP T. Rowe Price Equity Income Portfolio. |
| 2. | Prior to May 1, 2022, the Portfolio's name was MainStay VP MacKay S&P 500 Index Portfolio. |
Not part of the Annual Report
2022 Annual Report
This report is for the general information of New York Life Variable Annuities and NYLIAC Variable Universal Life Insurance Products policyowners. It must be preceded or accompanied by the appropriate product(s) and funds prospectuses if it is given to anyone who is not an owner of a New York Life variable annuity policy or a NYLIAC Variable Universal Life Insurance Product. This report does not offer for sale or solicit orders to purchase securities.
The performance data quoted in this report represents past performance. Past performance is no guarantee of future results. Due to market volatility and other factors, current performance may be lower or higher than the figures shown. The most recent month-end performance summary for your variable annuity or variable life policy is available by calling 800-598-2019 and is updated periodically on newyorklife.com.
The New York Life Variable Annuities and NYLIAC Variable Universal Life Insurance Products are issued by New York Life Insurance and Annuity Corporation (a Delaware Corporation) and distributed by NYLIFE Distributors LLC (Member FINRA/SIPC).
New York Life Insurance Company
New York Life Insurance and Annuity
Corporation (NYLIAC) (A Delaware Corporation)
51 Madison Avenue, Room 551
New York, NY 10010
newyorklife.com
newyorklifeinvestments.com
NYLIFE Distributors LLC, 30 Hudson Street, Jersey City, NJ 07302
New York Life Investment Management LLC is the investment manager to the MainStay VP Funds Trust
©2023 by NYLIFE Distributors LLC. All rights reserved.
You may obtain copies of the Prospectus and the Statement of Additional Information free of charge, upon request, by calling toll-free 800-598-2019 or writing to New York Life Insurance and Annuity Corporation, 51 Madison Avenue, New York, NY 10010.
| Not FDIC Insured | No Bank Guarantee | May Lose Value |
(NYLIAC) NI528
As of the end of the period covered by this report, the Registrant has adopted a code of ethics (the “Code”) that applies to the Registrant’s principal executive officer (“PEO”) and principal financial officer (“PFO”). A copy of the Code is filed herewith. The Registrant did not grant any waivers, including implicit waivers, from any provisions of the Code to the PEO or PFO during the period covered by this report.
| Item 3. | Audit Committee Financial Expert. |
The Board of Trustees has determined that the Registrant has three audit committee financial experts serving on its Audit Committee. The Audit Committee financial experts are Alan R. Latshaw, Karen Hammond and Susan B. Kerley. Mr. Latshaw, Ms. Hammond and Ms. Kerley are “independent” as defined by Item 3 of Form N-CSR.
| Item 4. | Principal Accountant Fees and Services. |
(a) Audit Fees
The aggregate fees billed for the fiscal year ended December 31, 2022 for professional services rendered by PricewaterhouseCoopers LLP (“PwC”) for the audit of the Registrant’s annual financial statements or services that are normally provided by PwC in connection with statutory and regulatory filings or engagements for that fiscal year were $1,949,250.
The aggregate fees billed for the fiscal year ended December 31, 2021 for professional services rendered by PwC for the audit of the Registrant’s annual financial statements or services that are normally provided by PwC in connection with statutory and regulatory filings or engagements for that fiscal year were $1,793,970.
(b) Audit-Related Fees
The aggregate fees billed for assurance and related services by PwC that are reasonably related to the performance of the audit of the Registrant’s financial statements and are not reported under paragraph (a) of this Item were: (i) $0 for the fiscal year ended December 31, 2022, and (ii) $0 for the fiscal year ended December 31, 2021.
(c) Tax Fees
The aggregate fees billed for professional services rendered by PwC for tax compliance, tax advice, and tax planning were: (i) $0 during the fiscal year ended December 31, 2022; and (ii) $0 during the fiscal year ended December 31, 2021. These services primarily included preparation of federal, state and local income tax returns and excise tax returns, as well as services relating to excise tax distribution requirements.
(d) All Other Fees
The aggregate fees billed for products and services provided by PwC, other than the services reported in paragraphs (a) through (c) of this Item were: (i) $0 during the fiscal year ended December 31, 2022; and (ii) $0 during the fiscal year ended December 31, 2021.
(e) Pre-Approval Policies and Procedures
| | (1) | The Registrant’s Audit Committee has adopted pre-approval policies and procedures (the “Procedures”) to govern the Committee’s pre-approval of (i) all audit services and permissible non-audit services to be provided to the Registrant by its independent accountant, and (ii) all permissible non-audit services to be provided by such independent accountant to the Registrant’s investment adviser and to any entity controlling, controlled by or under common control with the investment adviser that provides ongoing services to the Registrant (collectively, the “Service Affiliates”) if the services directly relate to the Registrant’s operations and financial reporting. In accordance with the Procedures, the Audit Committee is responsible for the engagement of the independent accountant to certify the Registrant’s financial statements for each fiscal year. With respect to the pre-approval of non-audit services provided to the Registrant and its Service Affiliates, the Procedures provide that the Audit Committee may annually pre-approve a list of the types of services that may be provided to the Registrant or its Service Affiliates, or the Audit Committee may pre-approve such services on a project-by-project basis as they arise. Unless a type of service has received general pre-approval, it will require specific pre-approval by the Audit Committee if it is to be provided by the independent accountant. The Procedures also permit the Audit Committee to delegate authority to one or more of its members to pre-approve any proposed non-audit services that have not been previously pre-approved by the Audit Committee, subject to the ratification by the full Audit Committee no later than its next scheduled meeting. To date, the Audit Committee has not delegated such authority. |
| | (2) | With respect to the services described in paragraphs (b) through (d) of this Item 4, no amount was approved by the Audit Committee pursuant to paragraph (c)(7)(i)(C) of Rule 2-01 of Regulation S-X. |
(f) There were no hours expended on PwC’s engagement to audit the Registrant’s financial statements for the most recent fiscal year was attributable to work performed by persons other than PwC’s full-time, permanent employees.
(g) All non-audit fees billed by PwC for services rendered to the Registrant for the fiscal years ended December 31, 2022 and December 31, 2021 are disclosed in 4(b)-(d) above.
The aggregate non-audit fees billed by PwC for services rendered to the Registrant’s investment adviser (not including any sub-adviser whose role is primarily portfolio management and is subcontracted with or overseen by another investment adviser), and any entity controlling, controlled by, or under common
control with the adviser that provides ongoing services to the Registrant were approximately: (i) $13,219,000 for the fiscal year ended December 31, 2022; and (ii) $12,492,000 for the fiscal year ended December 31, 2021.
(h) The Registrant’s Audit Committee has determined that the non-audit services rendered by PwC for the fiscal year ended December 31, 2022 to the Registrant’s investment adviser and any entity controlling, controlled by, or under common control with the Registrant’s investment adviser that provides ongoing services to the Registrant that were not required to be pre-approved by the Audit Committee because they did not relate directly to the operations and financial reporting of the registrant were compatible with maintaining the respective independence of PwC during the relevant time period.
| Item 5. | Audit Committee of Listed Registrants |
Not applicable.
The Schedule of Investments is included as part of Item 1 of this report.
| Item 7. | Disclosure of Proxy Voting Policies and Procedures for Closed-End Management Investment Companies. |
Not applicable.
| Item 8. | Portfolio Managers of Closed-End Management Investment Companies. |
Not applicable.
| Item 9. | Purchases of Equity Securities by Closed-End Management Investment Company and Affiliated Purchasers. |
Not applicable.
| Item 10. | Submission of Matters to a Vote of Security Holders. |
Since the Registrant’s last response to this Item, there have been no material changes to the procedures by which shareholders may recommend nominees to the Registrant’s Board of Trustees.
| Item 11. | Controls and Procedures. |
(a) Based on an evaluation of the Registrant’s Disclosure Controls and Procedures (as defined in Rule 30a-3(c) under the Investment Company Act of 1940) (the “Disclosure Controls”), as of a date within 90 days prior to the filing date (the “Filing Date”) of this Form N-CSR (the “Report”), the Registrant’s principal executive officer and principal financial officer have concluded that the Disclosure Controls are reasonably designed to ensure that information required to be disclosed by the Registrant in the Report is recorded, processed, summarized and reported by the Filing Date, including ensuring that information required to be disclosed in the Report is accumulated and communicated to the Registrant’s management, including the Registrant’s principal executive officer and principal financial officer, as appropriate to allow timely decisions regarding required disclosure.
(b) There were no changes in the Registrant’s internal control over financial reporting (as defined in Rule 30a-3(d)) under the Investment Company Act of 1940 that occurred during the period covered by this report that has materially affected, or is reasonably likely to materially affect, the Registrant’s internal control over financial reporting.
| Item 12. | Disclosure of Securities Lending Activities for Closed-End Management Investment Companies. |
Not applicable.
SIGNATURES
Pursuant to the requirements of the Securities Exchange Act of 1934 and the Investment Company Act of 1940, the Registrant has duly caused this Report to be signed on its behalf by the undersigned, thereunto duly authorized.
MAINSTAY VP FUNDS TRUST
| | |
| By: | | /s/ Kirk C. Lehneis |
| | Kirk C. Lehneis |
| | President and Principal Executive Officer |
| |
| Date: | | March 3, 2023 |
Pursuant to the requirements of the Securities Exchange Act of 1934 and the Investment Company Act of 1940, this Report has been signed below by the following persons on behalf of the Registrant and in the capacities and on the dates indicated.
| | |
| By: | | /s/ Kirk C. Lehneis |
| | Kirk C. Lehneis |
| | President and Principal Executive Officer |
| |
| Date: | | March 3, 2023 |
| |
| By: | | /s/ Jack R. Benintende |
| | Jack R. Benintende |
| | Treasurer and Principal Financial and Accounting Officer |
| |
| Date: | | March 3, 2023 |